serum concentrations of amino acids, fatty acids, lipoproteins, vitamins a and e, and minerals in...
TRANSCRIPT
Zoo Biology 26:13–25 (2007)
Research Article
Serum Concentrations of Amino Acids,Fatty Acids, Lipoproteins, Vitamins Aand E, and Minerals in ApparentlyHealthy, Free-Ranging Southern Giraffe(Giraffa camelopardalis giraffe)Debra A. Schmidt,1� Ray L. Ball,2 Douw Grobler,3 Mark R. Ellersieck,4
Mark E. Griffin,5 Scott B. Citino,6 and Mitchell Bush7
1Lincoln Park Zoo, Chicago, Illinois2Busch Gardens, Tampa, Florida3Catcho Africa, Silver Lakes, Pretoria, South Africa4University of Missouri, Experiment Station Statistics, Columbia, Missouri5Purina Mills, LLC, Saint Louis, Missouri6White Oak Conservation Center, Yulee, Florida7National Zoological Park, Smithsonian Institution, Conservation and Research Center,Front Royal, Virginia
This pilot project began establishing a nutritional profile for free-ranging giraffe.The results will be used as a tool to begin assessing the nutritional status ofcaptive giraffe. In October 2004 serum samples were collected opportunisticallyfrom seven adult and 17 sub-adult giraffe being anesthetized for different studies.Seventeen animals were from Double Drift Game Reserve and seven animals werefrom Kariega Private Game Reserve. The serum samples were analyzed forcirculating concentrations of amino acids, fatty acids, lipoproteins, vitamins, andminerals. Information from 15 serum samples collected from anesthetized giraffein Kruger National Park during April and August 2003 was included in thecalcium and phosphorus concentration data. No significant differences wereidentified between genders. Significant differences between locations wereidentified for concentrations of certain amino acids, fatty acids, and lipoproteins.
Published online 19 December 2006 in Wiley InterScience (www.interscience.wiley.com).
DOI 10.1002/zoo.20114
Received 15 December 2005; Accepted 23 September 2006
Debra Schmidt’s current address is the Zoological Society of San Diego, San Diego, California.�Correspondence to: D.A. Schmidt, Zoological Society of San Diego, 15500 San Pasqual Valley Road,
Escondido, CA 92027. E-mail: [email protected]
rr 2006 Wiley-Liss, Inc.
Differences between locations are likely due to different nutrient concentrationsof foods and possibly the result of different animal densities forcing different foodchoices among locations. This pilot project may expand to include changesin circulating nutrient concentrations for free-ranging giraffe as is influencedby other locations, seasonal food availability, and different giraffe subspecies.Zoo Biol 26:13–25, 2007. �c 2006 Wiley-Liss, Inc.
Keywords: protein; cholesterol; ruminant
INTRODUCTION
Dietary requirements for optimal health in exotic animals are not known.Because invasive studies used to determine dietary requirements in domestic animalsare not appropriate for zoo or endangered animals, domestic animal concentrationsare often used as the standard for evaluating nutrient concentrations in exoticanimals. Although domestic animal nutrient concentrations are helpful, they maynot be a good standard for identifying nutrient needs of exotic animals.
This problem was recognized and an initiative was established to beginanalyzing serum samples from animals housed at five United States zoos,establishing the Nutritional Status Databank for captive exotic species[Crissey et al., unpublished data, 1999, 2000, 2003]. This information compilesaverage amino acid, lipoprotein, fatty acid, vitamin, and mineral concentrationsmeasured in serum collected opportunistically from captive, exotic animals. To date,samples have been collected from captive canids, felids, primates, ursids, andpiscivorous birds.
Although circulating nutrient concentrations from captive, exotic animals arehelpful, free-living animal nutrient concentrations are a better standard for assessingcaptive animal health and dietary appropriateness. If the values measured in captiveanimals are dramatically different from values detected in free-ranging animals, itmay be an indication that animals are being fed incorrectly, which could lead tohealth-related problems.
Captive giraffe have a specific set of maladies that may be related to basicnutritional inadequacies. Peracute mortality [Fowler, 1978; Fowler and Boever,1986; Junge and Bradley, 1993], chronic wasting [Flach, 1997], energy malnutrition[Ball et al., 2002], mortality related to cold stress [Clauss et al., 1999; Potter andClauss, 2005], pancreatic disease [Lechowski et al., 1991], urolithiasis [Wolfe et al.,2000; Wolfe, 2003], neonatal health concerns [Miller et al., 1999], and intestinalparasitism [Eid and Rawhia, 1996] may have their source from or be exacerbated bytraditional zoo diets. Hoof disease and laminitis are also suspected to have a strongassociation with nutritional imbalances as seen in domestic ruminants [Nocek, 1997;Krajcarski-Hunt et al., 2002].
This study is a pilot project to begin establishing a nutritional profiledocumenting circulating concentrations of amino acids, fatty acids, lipoproteins,vitamins, and minerals in free-ranging giraffe; this nutritional information does notexist for either free-ranging or captive giraffe. Profiling circulating concentrationsof these nutrients in free-ranging giraffe will create the foundation for evaluatingthe nutritional needs of the captive giraffe population. The results will serve as areference tool for zoo nutritionists, veterinarians, and feed manufacturers. These
14 Schmidt et al.
Zoo Biology DOI 10.1002/zoo

results may also begin to establish more extensive profiles, which can be measuredover time of year, locations, and climate changes, to determine if the free-livinggiraffe populations are experiencing nutritional pressures due to man-made habitatchanges.
MATERIALS AND METHODS
Serum Collection From Double Drift Game Reserve and Kariega GameReserve Animals
Giraffe from Double Drift (DD) Game Reserve and Kariega Private GameReserve in Eastern Cape, South Africa were being relocated in October 2004. Serumsamples were collected opportunistically from 24 total giraffe [DD, 11 male (1 adult;10 sub-adult) and 6 female (4 adult; 2 sub-adult); Kariega, 4 male (1 adult; 3 sub-adult) and 3 female (1 adult; 2 sub-adult)]. Selection of animals on a specific day wasbased on their size and gender ratios as predetermined by prospective new owners.All animals were in good physical condition based on visual examination during theshort monitoring period and their pelage and muscle mass was judged to be good forthe season and available native vegetation. No obvious signs of disease were seen inthe animals. All animals seemed to be normal in their free-ranging surroundings andseemed to be relatively calm before commencing the study.
The anesthetics used in this study were thiafentanil (10mg/ml; WildlifePharmaceuticals, South Africa), a synthetic opiate, medetomidine (20mg/ml;Wildlife Pharmaceuticals), and ketamine hydrochloride (200mg/ml; Kyron Labora-tories, South Africa); dosages were adjusted based on a visual evaluation of eachanimal’s shoulder height and success of previous anesthetic procedures. The drugswere delivered by a CO2-powered remote injection device (Pneu-Dart, Inc.,Williamsport, PA) delivering a 3-ml plastic air pressurized dart (Pneu-Dart, Inc.)with a 60� 2-mm smooth needle. All giraffe were darted from land vehicles at rangesup to 40m. The study was completed over a 10-day period during daylight hours.
Blood samples were collected from each animal by inserting a 20 ga, 1.5-inchneedle (BD, Franklin Lakes, NJ) into the jugular vein and collected into two 10-mlplain glass tubes (BD). The collected samples were chilled using ice packs in aninsulated cooler. After centrifugation the serum was collected and stored in plasticvials (Fisher Scientific, Hampton, NH) at �181C. Time from sample collection toprocessing was 2–4 hr.
Serum Collection From Kruger National Park Animals
The study was conducted in April and August 2003 in the Satara Camp area ofKruger National Park. Herds were selected from this area for a relocation project toMozambique and blood sampling was done opportunistically. Fifteen adult and sub-adult animals (7 male [4 adult; 3 sub-adult] and 8 sub-adult females) judged to be ingood condition by visual assessment were selected for relocation. Anesthetics used inthis capture included various combinations of thiafentanil (10mg/ml; WildlifePharmaceuticals) and etorphine (9.8mg/ml; Wildlife Pharmaceuticals) with eachanimal’s dose based on a visual evaluation of the age class and weight. The drugswere delivered by a CO2-powered remote injection device, which was designed andbuilt by the staff at Kruger National Park. It delivered a metal dart, pressurized with
15Free-Ranging Giraffe Nutritional Profiles
Zoo Biology DOI 10.1002/zoo
sodium bicarbonate and acetic acid, with a 60� 2-mm barbed needle. All giraffewere darted from a helicopter at a range of up to 40m. Blood samples were collectedfrom each animal with a 35-ml syringe (BD) and 18 ga needle (BD) into the jugularvein. The blood was transferred into 10-ml plain glass tubes (BD). The collectedsamples were chilled using ice packs in an insulated cooler and were processed asdescribed earlier.
Laboratory Analyses
Samples from DD and Kariega were submitted to laboratories in South Africafor analyses. Samples from Kruger giraffe were analyzed for calcium andphosphorus in the laboratory at the Veterinary Services Facility of the KrugerNational Park.
Amino acids.
Amino acids were identified and quantified by reverse phase liquidchromatography (Waters 1500 Series HPLC; Milford, MA) with UV detection at254 nm [Cohen et al., 1988] at South African Grain Laboratory in Pretoria.
Fatty acids.
Fatty acids were quantified using gas liquid chromatography (Varian Model3300; Palo Alto, CA) [Folch et al., 1957] at Medical Research Council in Capetown.
Lipoproteins.
Total cholesterol, HDL cholesterol, and triglyceride concentrations weredetermined using a Beckman Coulter Synchron LX system (Beckman Coulter, Inc.;Fullerton, CA) [Beckman Coulter, 2000, 2003] at National Health LaboratoryService in Pretoria. The laboratory also calculated LDL cholesterol concentrations[Friedewald et al., 1972].
Vitamins.
Vitamin analyses were completed using high pressure liquid chromatography(Waters 1500 Series HPLC) at South African Grain Laboratory in Pretoria.
Minerals.
Calcium, iron, magnesium, potassium and sodium concentrations from the DDand Kareiga giraffe were quantified using a Beckman Coulter Synchron LX system(Beckman Coulter, Inc.) [Beckman Coulter, 2000; 2003]. Copper concentrations weredetermined using an atomic absorption spectrophotometer (Shimadzu AA 6300;Columbia, MD). Mineral analyses were completed at National Health LaboratoryService in Pretoria.
Phosphorous concentrations from the DD and Kareiga giraffe were quantifiedas part of a serum chemistry panel completed by Golden VetLab in Johannesburg.Calcium and phosphorus concentrations from Kruger giraffe were analyzed in housewith a Vitros DT60 II Chemistry System (Ortho-Clinical Diagnostics, Rochester, NY).
Statistical Analyses
The ANOVA was a 2� 2 factorial arrangement of treatments in which therewere two locations and two genders. For calcium and phosphorus parameters a third
16 Schmidt et al.
Zoo Biology DOI 10.1002/zoo
location was included to make the design a 3� 2 factorial. Mean differences weredetermined using Fisher’s least significant difference with a5 0.05 [SAS, 2004].
RESULTS
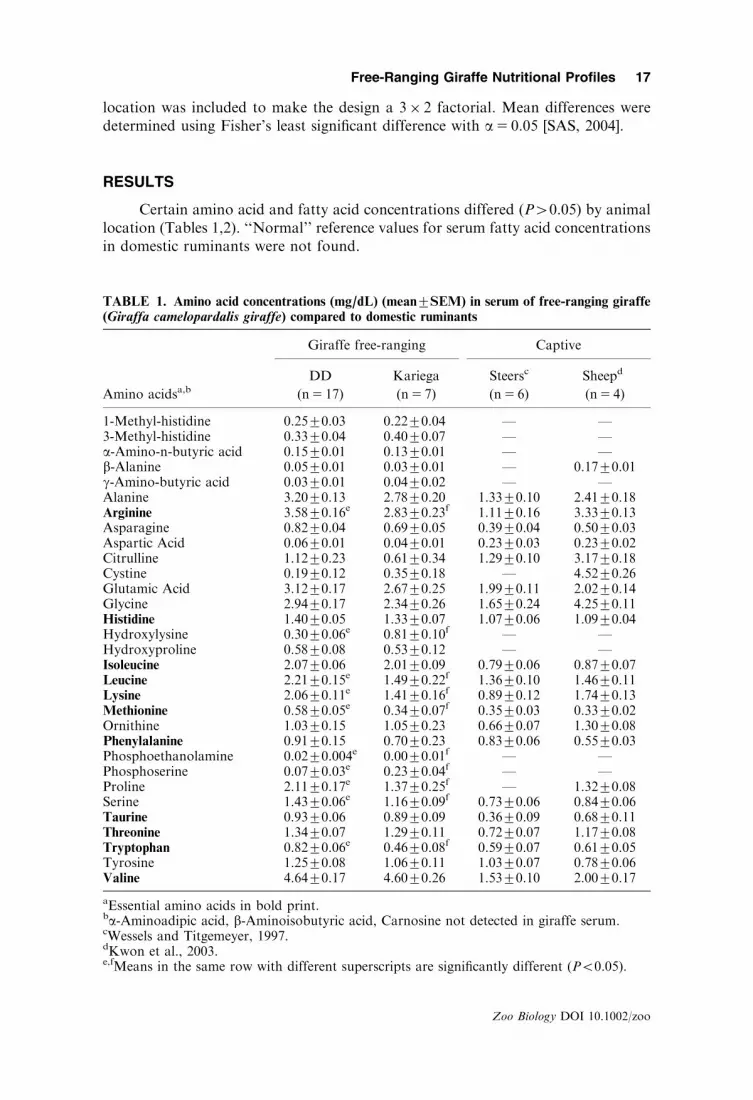
Certain amino acid and fatty acid concentrations differed (P40.05) by animallocation (Tables 1,2). ‘‘Normal’’ reference values for serum fatty acid concentrationsin domestic ruminants were not found.
TABLE 1. Amino acid concentrations (mg/dL) (mean7SEM) in serum of free-ranging giraffe
(Giraffa camelopardalis giraffe) compared to domestic ruminants
Amino acidsa,b
Giraffe free-ranging Captive
DD Kariega Steersc Sheepd
(n5 17) (n5 7) (n5 6) (n5 4)
1-Methyl-histidine 0.2570.03 0.2270.04 — —3-Methyl-histidine 0.3370.04 0.4070.07 — —a-Amino-n-butyric acid 0.1570.01 0.1370.01 — —b-Alanine 0.0570.01 0.0370.01 — 0.1770.01g-Amino-butyric acid 0.0370.01 0.0470.02 — —Alanine 3.2070.13 2.7870.20 1.3370.10 2.4170.18Arginine 3.5870.16e 2.8370.23f 1.1170.16 3.3370.13Asparagine 0.8270.04 0.6970.05 0.3970.04 0.5070.03Aspartic Acid 0.0670.01 0.0470.01 0.2370.03 0.2370.02Citrulline 1.1270.23 0.6170.34 1.2970.10 3.1770.18Cystine 0.1970.12 0.3570.18 — 4.5270.26Glutamic Acid 3.1270.17 2.6770.25 1.9970.11 2.0270.14Glycine 2.9470.17 2.3470.26 1.6570.24 4.2570.11Histidine 1.4070.05 1.3370.07 1.0770.06 1.0970.04Hydroxylysine 0.3070.06e 0.8170.10f — —Hydroxyproline 0.5870.08 0.5370.12 — —Isoleucine 2.0770.06 2.0170.09 0.7970.06 0.8770.07Leucine 2.2170.15e 1.4970.22f 1.3670.10 1.4670.11Lysine 2.0670.11e 1.4170.16f 0.8970.12 1.7470.13Methionine 0.5870.05e 0.3470.07f 0.3570.03 0.3370.02Ornithine 1.0370.15 1.0570.23 0.6670.07 1.3070.08Phenylalanine 0.9170.15 0.7070.23 0.8370.06 0.5570.03Phosphoethanolamine 0.0270.004e 0.0070.01f — —Phosphoserine 0.0770.03e 0.2370.04f — —Proline 2.1170.17e 1.3770.25f — 1.3270.08Serine 1.4370.06e 1.1670.09f 0.7370.06 0.8470.06Taurine 0.9370.06 0.8970.09 0.3670.09 0.6870.11Threonine 1.3470.07 1.2970.11 0.7270.07 1.1770.08Tryptophan 0.8270.06e 0.4670.08f 0.5970.07 0.6170.05Tyrosine 1.2570.08 1.0670.11 1.0370.07 0.7870.06Valine 4.6470.17 4.6070.26 1.5370.10 2.0070.17
aEssential amino acids in bold print.ba-Aminoadipic acid, b-Aminoisobutyric acid, Carnosine not detected in giraffe serum.cWessels and Titgemeyer, 1997.dKwon et al., 2003.e,fMeans in the same row with different superscripts are significantly different (Po0.05).
17Free-Ranging Giraffe Nutritional Profiles
Zoo Biology DOI 10.1002/zoo
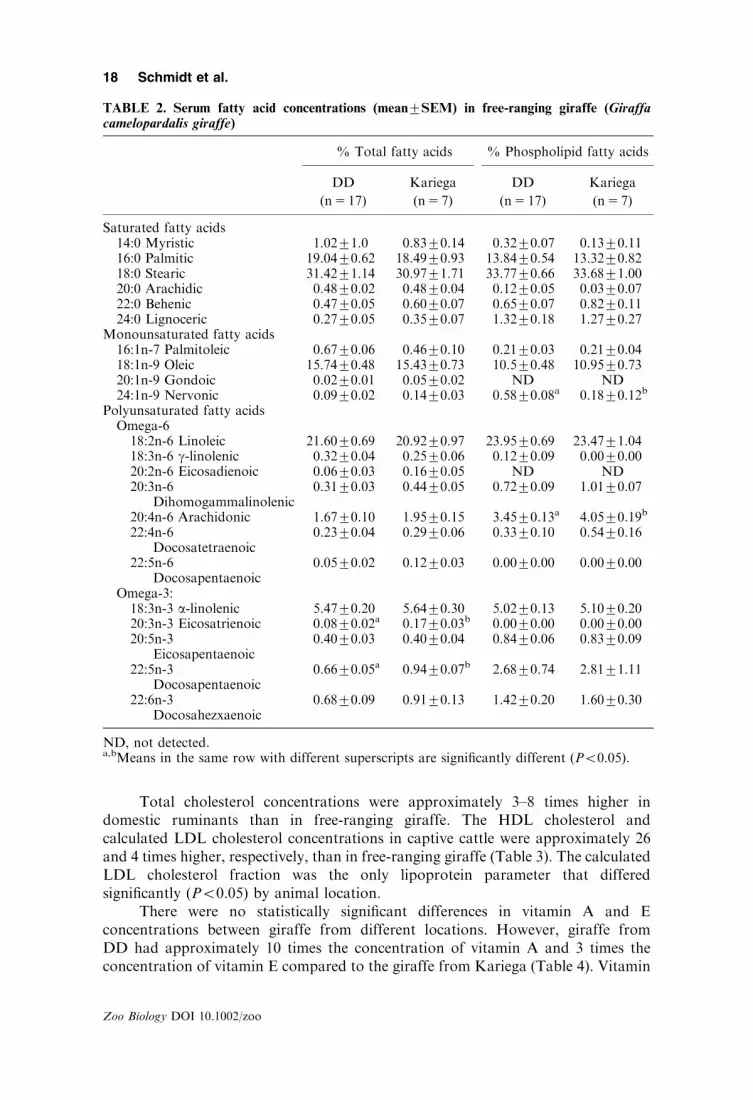
Total cholesterol concentrations were approximately 3–8 times higher indomestic ruminants than in free-ranging giraffe. The HDL cholesterol andcalculated LDL cholesterol concentrations in captive cattle were approximately 26and 4 times higher, respectively, than in free-ranging giraffe (Table 3). The calculatedLDL cholesterol fraction was the only lipoprotein parameter that differedsignificantly (Po0.05) by animal location.
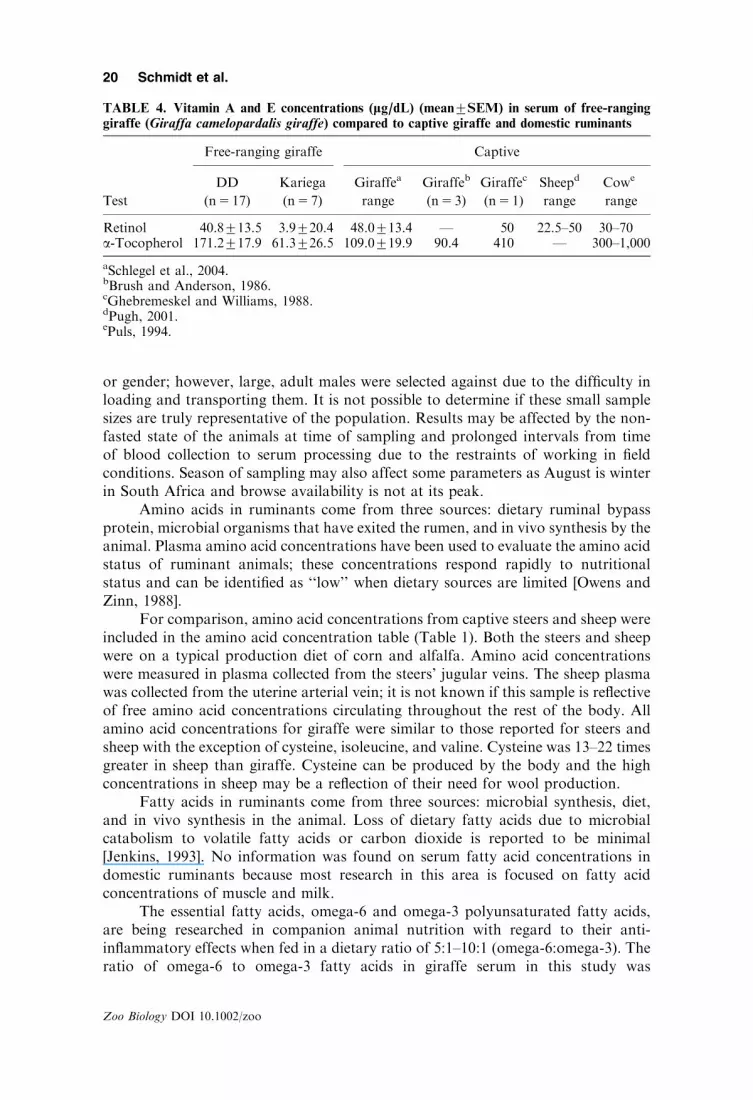
There were no statistically significant differences in vitamin A and Econcentrations between giraffe from different locations. However, giraffe fromDD had approximately 10 times the concentration of vitamin A and 3 times theconcentration of vitamin E compared to the giraffe from Kariega (Table 4). Vitamin
TABLE 2. Serum fatty acid concentrations (mean7SEM) in free-ranging giraffe (Giraffacamelopardalis giraffe)
% Total fatty acids % Phospholipid fatty acids
DD Kariega DD Kariega
(n5 17) (n5 7) (n5 17) (n5 7)
Saturated fatty acids14:0 Myristic 1.0271.0 0.8370.14 0.3270.07 0.1370.1116:0 Palmitic 19.0470.62 18.4970.93 13.8470.54 13.3270.8218:0 Stearic 31.4271.14 30.9771.71 33.7770.66 33.6871.0020:0 Arachidic 0.4870.02 0.4870.04 0.1270.05 0.0370.0722:0 Behenic 0.4770.05 0.6070.07 0.6570.07 0.8270.1124:0 Lignoceric 0.2770.05 0.3570.07 1.3270.18 1.2770.27
Monounsaturated fatty acids16:1n-7 Palmitoleic 0.6770.06 0.4670.10 0.2170.03 0.2170.0418:1n-9 Oleic 15.7470.48 15.4370.73 10.570.48 10.9570.7320:1n-9 Gondoic 0.0270.01 0.0570.02 ND ND24:1n-9 Nervonic 0.0970.02 0.1470.03 0.5870.08a 0.1870.12b
Polyunsaturated fatty acidsOmega-618:2n-6 Linoleic 21.6070.69 20.9270.97 23.9570.69 23.4771.0418:3n-6 g-linolenic 0.3270.04 0.2570.06 0.1270.09 0.0070.0020:2n-6 Eicosadienoic 0.0670.03 0.1670.05 ND ND20:3n-6
Dihomogammalinolenic0.3170.03 0.4470.05 0.7270.09 1.0170.07
20:4n-6 Arachidonic 1.6770.10 1.9570.15 3.4570.13a 4.0570.19b
22:4n-6Docosatetraenoic
0.2370.04 0.2970.06 0.3370.10 0.5470.16
22:5n-6Docosapentaenoic
0.0570.02 0.1270.03 0.0070.00 0.0070.00
Omega-3:18:3n-3 a-linolenic 5.4770.20 5.6470.30 5.0270.13 5.1070.2020:3n-3 Eicosatrienoic 0.0870.02a 0.1770.03b 0.0070.00 0.0070.0020:5n-3
Eicosapentaenoic0.4070.03 0.4070.04 0.8470.06 0.8370.09
22:5n-3Docosapentaenoic
0.6670.05a 0.9470.07b 2.6870.74 2.8171.11
22:6n-3Docosahezxaenoic
0.6870.09 0.9170.13 1.4270.20 1.6070.30
ND, not detected.a,bMeans in the same row with different superscripts are significantly different (Po0.05).
18 Schmidt et al.
Zoo Biology DOI 10.1002/zoo

A and E concentrations for both groups of free-ranging giraffe were similar to thosereported in captive giraffe. Vitamin A concentrations in Kariega animals andvitamins E concentrations in both DD and Kariega animals were below theconcentrations reported in domestic ruminants.
No significant differences were found in mineral concentrations between DD,Kariega, and Kruger giraffe. The mineral concentrations in free-ranging giraffe seemsimilar to those measured in free-ranging and captive giraffe and domestic ruminants(Table 5).
There were no significant differences between genders, though a few gender �location interactions were found to be significantly different (Po0.05). The listincluded g-amino-butyric acid, palmitoleic acid as a percent of the phospholipidfraction, and calculated LDL concentrations; there is no obvious interpretation forthese differences.
DISCUSSION
Reference values for circulating concentrations of amino acids, fatty acids,lipoproteins, vitamins A and E, and minerals in serum from 24–39 free-ranginggiraffe are presented. These values were obtained for use as a reference tool toevaluate the nutritional health status of the captive giraffe population. Serumsamples from captive giraffe were recently collected currently for comparison.
When available, domestic ruminant reference ranges are included forcomparison. Giraffe are typically classified as browsers and may be more similarto goats than sheep or cattle. However, due to the limited information on goats,reference ranges for sheep and cattle are also listed. Reference values for fatty acidsin domestic ruminants were not located, but concentrations are included for aminoacids, lipoprotein, vitamin A and E, and mineral concentrations.
Samples for this study were collected opportunistically when animals werebeing transferred to another location. Animals were not intentionally selected for age
TABLE 3. Serum total cholesterol and lipoprotein cholesterol concentrations (mg/dL)
(mean7SEM) in free-ranging giraffe (Giraffa camelopardalis giraffe) compared to captive
giraffe and domestic ruminants
Test
Free-ranging giraffe Captive
DD Kariega Giraffea Goatb Sheepc Cowc Cowd
(n5 17) (n5 7) (n5 24) (n5 5) range range (n5 12)
Total cholesterol 17.871.3 21.971.9 31.071.08 98.4716.4 52–76 80–120 150.179.30Triglyceride 34.272.4 39.173.6 40.071.60 51.173.35 — — 25.771.01HDL cholesterole 4.470.5 3.070.7 18.073.54 — — — 97.974.26LDL cholesterolf 6.770.9g 11.371.4h 20.074.04 — — — 39.377.05
aInternational Species Information System, 2002; all ages combined.bSolaiman et al., 2006.cKaneko, 1989.dSevinc- et al., 2003.eHigh density lipoprotein cholesterol.fCalculated low density lipoprotein cholesterol.g,hMeans in the same row with different superscripts are significantly different (Po0.05).
19Free-Ranging Giraffe Nutritional Profiles
Zoo Biology DOI 10.1002/zoo
or gender; however, large, adult males were selected against due to the difficulty inloading and transporting them. It is not possible to determine if these small samplesizes are truly representative of the population. Results may be affected by the non-fasted state of the animals at time of sampling and prolonged intervals from timeof blood collection to serum processing due to the restraints of working in fieldconditions. Season of sampling may also affect some parameters as August is winterin South Africa and browse availability is not at its peak.
Amino acids in ruminants come from three sources: dietary ruminal bypassprotein, microbial organisms that have exited the rumen, and in vivo synthesis by theanimal. Plasma amino acid concentrations have been used to evaluate the amino acidstatus of ruminant animals; these concentrations respond rapidly to nutritionalstatus and can be identified as ‘‘low’’ when dietary sources are limited [Owens andZinn, 1988].
For comparison, amino acid concentrations from captive steers and sheep wereincluded in the amino acid concentration table (Table 1). Both the steers and sheepwere on a typical production diet of corn and alfalfa. Amino acid concentrationswere measured in plasma collected from the steers’ jugular veins. The sheep plasmawas collected from the uterine arterial vein; it is not known if this sample is reflectiveof free amino acid concentrations circulating throughout the rest of the body. Allamino acid concentrations for giraffe were similar to those reported for steers andsheep with the exception of cysteine, isoleucine, and valine. Cysteine was 13–22 timesgreater in sheep than giraffe. Cysteine can be produced by the body and the highconcentrations in sheep may be a reflection of their need for wool production.
Fatty acids in ruminants come from three sources: microbial synthesis, diet,and in vivo synthesis in the animal. Loss of dietary fatty acids due to microbialcatabolism to volatile fatty acids or carbon dioxide is reported to be minimal[Jenkins, 1993]. No information was found on serum fatty acid concentrations indomestic ruminants because most research in this area is focused on fatty acidconcentrations of muscle and milk.
The essential fatty acids, omega-6 and omega-3 polyunsaturated fatty acids,are being researched in companion animal nutrition with regard to their anti-inflammatory effects when fed in a dietary ratio of 5:1–10:1 (omega-6:omega-3). Theratio of omega-6 to omega-3 fatty acids in giraffe serum in this study was
TABLE 4. Vitamin A and E concentrations (lg/dL) (mean7SEM) in serum of free-ranging
giraffe (Giraffa camelopardalis giraffe) compared to captive giraffe and domestic ruminants
Test
Free-ranging giraffe Captive
DD Kariega Giraffea Giraffeb Giraffec Sheepd Cowe
(n5 17) (n5 7) range (n5 3) (n5 1) range range
Retinol 40.8713.5 3.9720.4 48.0713.4 — 50 22.5–50 30–70a-Tocopherol 171.2717.9 61.3726.5 109.0719.9 90.4 410 — 300–1,000
aSchlegel et al., 2004.bBrush and Anderson, 1986.cGhebremeskel and Williams, 1988.dPugh, 2001.ePuls, 1994.
20 Schmidt et al.
Zoo Biology DOI 10.1002/zoo
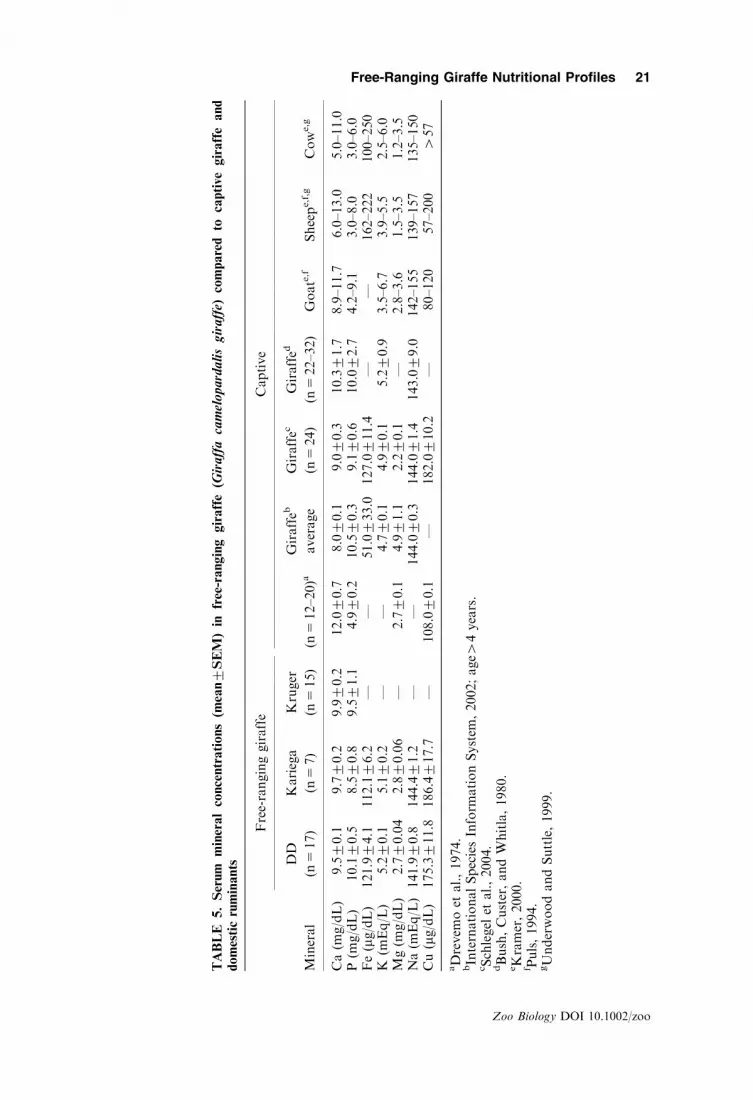
TABLE
5.Serum
mineralconcentrations(m
ean7SEM)in
free-ranging
giraffe(G
iraffa
camelopardalisgiraffe)
compared
tocaptive
giraffeand
domesticruminants
Mineral
Free-ranginggiraffe
Captive
DD
Kariega
Kruger
(n512–20)a
Giraffeb
Giraffec
Giraffed
Goate,f
Sheepe,f,g
Cowe,g
(n517)
(n57)
(n515)
average
(n524)
(n522–32)
Ca(m
g/dL)
9.570.1
9.770.2
9.970.2
12.070.7
8.070.1
9.070.3
10.371.7
8.9–11.7
6.0–13.0
5.0–11.0
P(m
g/dL)
10.170.5
8.570.8
9.571.1
4.970.2
10.570.3
9.170.6
10.072.7
4.2–9.1
3.0–8.0
3.0–6.0
Fe(mg/dL)
121.974.1
112.176.2
——
51.0733.0
127.0711.4
——
162–222
100–250
K(m
Eq/L)
5.270.1
5.170.2
——
4.770.1
4.970.1
5.270.9
3.5–6.7
3.9–5.5
2.5–6.0
Mg(m
g/dL)
2.770.04
2.870.06
—2.770.1
4.971.1
2.270.1
—2.8–3.6
1.5–3.5
1.2–3.5
Na(m
Eq/L)
141.970.8
144.471.2
——
144.070.3
144.071.4
143.079.0
142–155
139–157
135–150
Cu(mg/dL)
175.3711.8
186.4717.7
—108.070.1
—182.0710.2
—80–120
57–200
457
aDrevem
oet
al.,1974.
bInternationalSpeciesInform
ationSystem
,2002;age4
4years.
cSchlegel
etal.,2004.
dBush,Custer,andWhitla,1980.
eKramer,2000.
f Puls,1994.
gUnderwoodandSuttle,1999.
21Free-Ranging Giraffe Nutritional Profiles
Zoo Biology DOI 10.1002/zoo
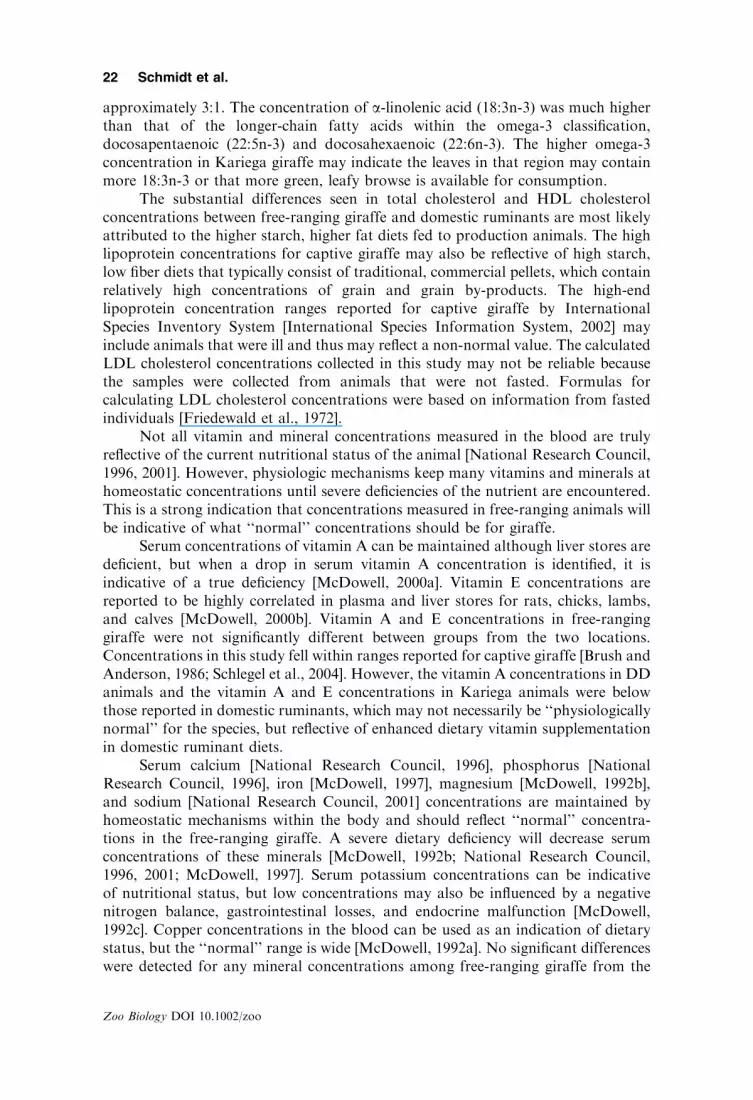
approximately 3:1. The concentration of a-linolenic acid (18:3n-3) was much higherthan that of the longer-chain fatty acids within the omega-3 classification,docosapentaenoic (22:5n-3) and docosahexaenoic (22:6n-3). The higher omega-3concentration in Kariega giraffe may indicate the leaves in that region may containmore 18:3n-3 or that more green, leafy browse is available for consumption.
The substantial differences seen in total cholesterol and HDL cholesterolconcentrations between free-ranging giraffe and domestic ruminants are most likelyattributed to the higher starch, higher fat diets fed to production animals. The highlipoprotein concentrations for captive giraffe may also be reflective of high starch,low fiber diets that typically consist of traditional, commercial pellets, which containrelatively high concentrations of grain and grain by-products. The high-endlipoprotein concentration ranges reported for captive giraffe by InternationalSpecies Inventory System [International Species Information System, 2002] mayinclude animals that were ill and thus may reflect a non-normal value. The calculatedLDL cholesterol concentrations collected in this study may not be reliable becausethe samples were collected from animals that were not fasted. Formulas forcalculating LDL cholesterol concentrations were based on information from fastedindividuals [Friedewald et al., 1972].
Not all vitamin and mineral concentrations measured in the blood are trulyreflective of the current nutritional status of the animal [National Research Council,1996, 2001]. However, physiologic mechanisms keep many vitamins and minerals athomeostatic concentrations until severe deficiencies of the nutrient are encountered.This is a strong indication that concentrations measured in free-ranging animals willbe indicative of what ‘‘normal’’ concentrations should be for giraffe.
Serum concentrations of vitamin A can be maintained although liver stores aredeficient, but when a drop in serum vitamin A concentration is identified, it isindicative of a true deficiency [McDowell, 2000a]. Vitamin E concentrations arereported to be highly correlated in plasma and liver stores for rats, chicks, lambs,and calves [McDowell, 2000b]. Vitamin A and E concentrations in free-ranginggiraffe were not significantly different between groups from the two locations.Concentrations in this study fell within ranges reported for captive giraffe [Brush andAnderson, 1986; Schlegel et al., 2004]. However, the vitamin A concentrations in DDanimals and the vitamin A and E concentrations in Kariega animals were belowthose reported in domestic ruminants, which may not necessarily be ‘‘physiologicallynormal’’ for the species, but reflective of enhanced dietary vitamin supplementationin domestic ruminant diets.
Serum calcium [National Research Council, 1996], phosphorus [NationalResearch Council, 1996], iron [McDowell, 1997], magnesium [McDowell, 1992b],and sodium [National Research Council, 2001] concentrations are maintained byhomeostatic mechanisms within the body and should reflect ‘‘normal’’ concentra-tions in the free-ranging giraffe. A severe dietary deficiency will decrease serumconcentrations of these minerals [McDowell, 1992b; National Research Council,1996, 2001; McDowell, 1997]. Serum potassium concentrations can be indicativeof nutritional status, but low concentrations may also be influenced by a negativenitrogen balance, gastrointestinal losses, and endocrine malfunction [McDowell,1992c]. Copper concentrations in the blood can be used as an indication of dietarystatus, but the ‘‘normal’’ range is wide [McDowell, 1992a]. No significant differenceswere detected for any mineral concentrations among free-ranging giraffe from the
22 Schmidt et al.
Zoo Biology DOI 10.1002/zoo

three locations. The concentrations also seemed numerically similar to thosereported for domestic ruminants and captive giraffe, although there are reports thatsome captive giraffe have hyperphosphatemia [Ball et al., 2000; Miller et al., 2003;Kearney, 2005]. It has been theorized that the hyperphosphatemia may be due tochronic rumenitis/rumen acidosis and the subsequent effect it has on calciumphosphorus balance [Miller et al., 2003].
CONCLUSIONS
No significant differences were detected between genders for any of the nutrientconcentrations. However, there were some significant differences in amino acid, fattyacid, and LDL cholesterol concentrations. No differences were found in vitamin andmineral concentrations. The differences that were identified are likely due to differentnutrient concentrations of the foods selected and possibly the result of differentanimal densities forcing different food choices among locations. This pilot projectmay also expand to include changes in circulating nutrient concentrations for free-ranging giraffe as is influenced by other locations, seasonal food availability, anddifferent giraffe subspecies.
ACKNOWLEDGMENTS
We thank Purina Mills, LLC, Saint Louis, Missouri for funding the analysesand Morris Animal Foundation, Englewood, Colorado for funding transportation,L.-A. Small, A. Krige, Dr. M. Smuts, A. de Jager, C. Buitendag, M. Kerley, PhD,R. Barbiers, DVM, and D. Armstrong, DVM for their assistance, advice, andpatience with this project. We also thank the Daniel F. and Ada L. Rice Foundationfor initiating the nutrition program at Lincoln Park Zoo.
REFERENCES
Ball RL, Kearney C, Burton M, Dumonceux G,Olson J. 2002. Morbidity and mortalityrelated to hypoglycemia and chronic energymalnutrition in captive giraffe. In: AmericanAssociation of Zoological VeterinariansAnnual Proceedings. Milwaukee, WI:p 181–5.
Ball RL, Miot J, Dumonceux G, Burton M. 2000.Hematology, serum chemistry, blood coagulationprofiles, and serology of physically restrainedcaptive reticulated giraffe (Giraffa cameloparda-lis). In: American Association of ZoologicalVeterinarians Annual Proceedings. New Orleans,LA: p 453–6.
Beckman Coulter. 2000. Synchron LX systemschemistry information manual. Brea, CA: Beck-man Coulter, Inc.
Beckman Coulter. 2003. Synchron LX systemschemistry information manual. Brea, CA: Beck-man Coulter, Inc.
Brush PJ, Anderson PH. 1986. Levels of plasmaalpha-tocopherol (vitamin E) in zoo animals. IntZoo Yb 24/25:316–21.
Bush M, Custer RS, Whitla JC. 1980. Hematologyand serum chemistry profiles for giraffes (Giraffacamelopardalis): variations with sex, age, andrestraint. J Zoo Wildl Med 11:122–9.
Clauss M, Suedmeyer K, Flach E. 1999. Suscept-ibility to cold in captive giraffe (Giraffa camelo-pardalis). In: American Association of Zoo-logical Veterinarians Annual Proceedings.Columbus, OH. p 183–6.
Cohen SA, Meys A, Tarvin TL. 1988. The pico-tagmethod: a manual of advanced techniques foramino acid analysis. Milford, MA: WatersChromatography Division.
Crissey SD, Barr JE, Slifka KA, Bowen PE,Stacewicz-Sapuntzakis M, Langman C, WardA, Ange K. Unpublished data. Zoo NutritionNetwork Nutritional Status Databank.
Crissey SD, Barr JE, Slifka KA, Bowen PE,Stacewicz-Sapuntzakis M, Langman C, WardA, Ange K. 1999. Serum concentrations of lipids,vitamins A and E, vitamin D metabolites, andcarotenoids in nine primate species at four zoos.Zoo Biol 18:551–64.
23Free-Ranging Giraffe Nutritional Profiles
Zoo Biology DOI 10.1002/zoo

Crissey SD, Slifka KA, Barr JE, Bowen PE,Stacewicz-Sapuntzakis M, Langman C, WardA, Meerdink G, Ange K. 2000. Circulatingnutrition parameters in captive apes at four zoos.In: The Apes: Challenges for the 21st CenturyProceedings. Brookfield, IL. p 180–5.
Crissey SD, Ange KD, Jacobsen KL, Slifka KA,Bowen PE, Stacewicz-Sapuntzakis M, LangmanCB, Sadler W, Kahn S, Ward A. 2003. Serumconcentrations of lipids, vitamin D metabolites,retinol, retinyl esters, tocopherols and selectedcarotenoids in twelve captive wild felid species atfour zoos. J Nutr 133:160–6.
Drevemo S, Grootenhuis JG, Karstad L. 1974.Blood parameters in wild ruminants in Kenya.J Wildl Dis 10:327–34.
Eid RAA, Rawhia MAO. 1996. Some studies onthe enteric parasites of giraffes (Camelopardalisangolensis) in Giza Zoo, Egypt. Egyptian J CompPath Clin Path 9:80–8.
Flach EJ. 1997. Chronic loss of condition withpersistent neutrophilia in a reticulated giraffe(Giraffa camelopardalis). In: British VeterinaryZoological Society Proceedings. p 33–6.
Folch J, Lees M, Sloane-Stanley GH. 1957. Asimple method for the isolation and purificationof total lipids from animal tissues. J Biol Chem 226:497–509.
Fowler ME. 1978. Peracute mortality in captivegiraffe. J Am Vet Med Assoc 173:1088–93.
Fowler ME, Boever WJ. 1986. Giraffidae (Giraffeand okapi). In: Fowler ME, editor. Zoo and wildanimal medicine, 2nd ed. Philadelphia, PA: WBSaunders. p 986–8.
Friedewald WT, Levy RI, Frederickson DS. 1972.Estimation of the concentration of low densitylipoprotein cholesterol in plasma without the useof the centrifuge. Clin Chem 18:449–502.
Ghebremeskel K, Williams G. 1988. Plasma retinoland alpha-tocopherol levels in captive wildanimals. Comp Biochem Physiol 89:279–83.
International Species Information System. 2002.Giraffa camelopardalis. Reference ranges forphysiological values in captive wildlife (CD-ROM). www.isis.org.
Jenkins TC. 1993. Lipid metabolism in the rumen.J Dairy Sci 76:3851–63.
Junge RE, Bradley TA. 1993. Peracute mortalitysyndrome of giraffe. In: Fowler ME, editor. Zooand wild animal medicine, 3rd ed. Philadelphia,PA: WB Saunders. p 547–9.
Kaneko JJ. 1989. Normal blood analyte values inlarge animals. In: Kaneko JJ, editor. Clinicalbiochemistry of domestic animals, 4th ed. SanDiego, CA: Academic Press. p 886–91.
Kearney CC. 2005. Effects of dietary physical formand carbohydrate profile on captive giraffe. [MSthesis]. Gainesville, FL: University of Florida.
Krajcarski-Hunt H, Plaizier JC, Walton J-P,Spratt R, McBride BW. 2002. Short commu-nication: effect of subacute ruminal acidosis onin situ fiber digestion in lactating dairy cows.J Dairy Sci 85:570–3.
Kramer JW. 2000. Normal hematology of cattle,sheep, and goats. In: Feldman BF, Zinkl JG, JainNC, editors. Schalm’s veterinary hematology,5th ed. Philadelphia, PA: Williams & Wilkins.
Kwon H, Spencer TE, Bazer FW, Wu G. 2003.Developmental changes of amino acids in ovinefetal fluids. Biol Reprod 68:1813–20.
Lechowski R, Pisarski J, Goslawski J, Lenarcik M.1991. Exocrine pancreatic insufficiency-like syn-drome in giraffe. J Wildl Dis 27:728–30.
McDowell LR. 1992a. Copper and molybdenum.In: Cunha TJ, editor. Minerals in animal andhuman nutrition. Ames, IA: Iowa State Uni-versity Press. p 176–204.
McDowell LR. 1992b. Magnesium. In: Cunha TJ,editor. Minerals in animal and human nutrition.Ames, IA: Iowa State University Press.p 115–36.
McDowell LR. 1992c. Potassium. In: Cunha TJ,editor. Minerals in animal and human nutrition.Ames, IA: Iowa State University Press.p 98–114.
McDowell LR. 1997. Incidence of mineral defi-ciencies and toxicities. In: Minerals for grazingruminants in tropical regions, 3rd ed. Gaines-ville, FL: University of Florida. p 10–41.
McDowell LR. 2000a. Vitamin A. In: Vitamins inanimal and human nutrition, 2nd ed. Ames, IA:Iowa State University Press. p 15–90.
McDowell LR. 2000b. Vitamin E. In: Vitamins inanimal and human nutrition, 2nd ed. Ames, IA:Iowa State University Press. p 155–226.
Miller M, Coville B, Abou-Madi N, Olson J. 1999.Comparison of in vitro tests for evaluation ofpassive transfer of immunoglobulins in giraffe(Giraffa camelopardalis). J Zoo Wildl Med 30:85–93.
Miller M, Weber M, Valdes E, Fontenot D,Neiffer D, Robbins PK, Terrell S, Stetter M.2003. Hypomagnesemia, hypocalcemia, and ru-menitis in ungulates: an under-recognized syn-drome? In: American Association of ZoologicalVeterinarians Annual Proceedings. Minneapolis,MN: p 15–20.
National Research Council. 1996. Minerals. In:Nutrient requirements of beef cattle, 7th ed.Washington DC: National Academy Press.p 54–76.
National Research Council. 2001. Minerals. In:Nutrient requirements of dairy cattle, 7th ed.Washington DC: National Academy Press.p 105–61.
Nocek JE. 1997. Bovine acidosis: implications onlaminitis. J Dairy Sci 80:1005–28.
Owens FN, Zinn R. 1988. Protein metabolismof ruminant animals. In: Church DC, editor. Theruminant animal: digestive physiology and nutri-tion. Englewood Cliffs, NJ: Prentice Hall.p 227–49.
Potter JS, Clauss M. 2005. Mortality of captivegiraffe (Giraffa camelopardalis) associated withserous fat atrophy: a review of five cases atAuckland Zoo. J Zoo Wildl Med 36:301–7.
24 Schmidt et al.
Zoo Biology DOI 10.1002/zoo

Pugh DG. 2001. Normal values andconversions. In: Pugh DG, editor. Sheep andgoat medicine. Philadelphia, PA: WB Saunders.p 451–5.
Puls R. 1994. Mineral levels in animal healthdiagnostic data. British Columbia: Sherpa Inter-national.
SAS. 2004. SAS/STAT 9.1 user’s guide. Gary, NC:SAS Institute Incorporated.
Schlegel ML, Edwards MS, Miller M, Valdes EV.2004. Mineral, vitamin A, and vitamin Econcentrations in serum, plasma and tissue ofcaptive giraffe (Giraffa camelopardalis). In:Comparative Nutrition Society Proceedings.Hickory Corners, MI: p 156–62.
Sevinc- M, Bas-oglu A, Guzelbektas- H. 2003.Lipid and lipoprotein levels in dairy cowswith fatty liver. Turk J Vet Anim Sci 27:295–9.
Solaiman SG, Shoemaker CE, Jones WR, KerthCR. 2006. The effects of high levels of supple-mental copper on the serum lipid profile, carcasstraits, and carcass composition of goat kids.J Anim Sci 84:171–7.
Wessels RH, Titgemeyer EC. 1997. Protein re-quirements of growing steers limit-fed corn-based diets. J Anim Sci 75:3278–86.
Wolfe BA. 2003. Urolithiasis in captive giraffe(Giraffa camelopardalis). In: Crissey ZoologicalNutrition Symposium Proceedings. Raleigh, NC:p 45–6.
Wolfe BA, Sladky KK, Loomis MR. 2000.Obstructive urolithiasis in a reticulated giraffe(Giraffa camelopardalils reticulate). Vet Rec146:260–1.
Underwood EJ, Suttle NF. 1999. The mineralnutrition of livestock, 3rd ed. Wallingford, UK:CABI Publishing.
25Free-Ranging Giraffe Nutritional Profiles
Zoo Biology DOI 10.1002/zoo