serbia national report - sufisa
TRANSCRIPT
1
Serbia
National report (WP 2 - Deliverable 2.2)
Authors: Žaklina STOJANOVIĆ, Emilija MANIĆ, Radmila DRAGUTINOVIĆ-MITROVIĆ, Saša
RANĐELOVIĆ, Irena JANKOVIĆ, Svetlana POPOVIĆ, Tatjana RAKONJAC-ANTIĆ, Bojan
RISTIĆ, Marija JOVOVIĆ
Faculty of economics, University of Belgrade
April 2018
H2020-SFS-2014-2
SUFISA This project has received funds from the EU’s Horizon 2020 research and innovation programme under
Grant Agreement No 635577. Responsibility for the information and views set out in this report lies entirely
with the authors.
2
Contents
1 THE EXECUTIVE SUMMARY .................................................................................................. 9
2 INTRODUCTION ................................................................................................................. 21
3 MEDIA CONTENT ANALYSIS - A SHORT REVIEW .................................................................. 21
4 RURAL POPULATION AND ITS STRUCTURE AS A PARTICULAR PROBLEM ............................. 24
5 THE AGRICULTURAL AND RURAL DEVELOPMENT POLICY ................................................... 26
5.1 AGRICULTURAL AND RURAL DEVELOPMENT POLICY IN SERBIA: INSTITUTIONAL
FRAMEWORK ................................................................................................................................... 26
5.2 AGRICULTURAL POLICY IN SERBIA: IMPACT OF THE EU ACCESSION PROCESS ...................... 32 5.3 DETERMINANTS OF FINANCIAL POSITION OF FARMS IN SERBIA – ECONOMETRIC ANALYSIS BY
SECTORS .......................................................................................................................................... 34
6 SERBIA CASE STUDY A: WHEAT PRODUCTION IN VOJVODINA REGION ............................... 38
6.1 CASE STUDY INTRODUCTION ................................................................................................ 38
6.2 POLICY AND REGULATORY CONDITIONS ............................................................................... 45 6.2.1 Agricultural policy ....................................................................................................... 45
6.2.1.1 Basic subsidies for crop production ...................................................................... 45 6.2.1.2 Investment support ................................................................................................ 46
6.2.2 Support to the public warehouse system ...................................................................... 47 6.2.3 Advisory and technical services improvements in agriculture .................................... 48
6.3 MARKET CONDITIONS ........................................................................................................... 50 6.3.1 Access to markets ......................................................................................................... 50 6.3.2 Land leasing ................................................................................................................. 51
6.3.3 Land policy, natural hazards and insurance ............................................................... 52
6.3.4 Food safety and food quality ........................................................................................ 54 6.4 KEY CONDITIONS FACED BY WHEAT PRODUCERS .................................................................. 55 6.5 KEY STRATEGIES ADOPTED BY WHEAT PRODUCERS AND THEIR IMPACT ON PERFORMANCE . 56
6.6 THE KEY STRATEGIES AND THE WHEAT SECTOR PERFORMANCE - SWOT ANALYSIS ............. 58 6.7 THE RESULTS OF FOCUS GROUPS DISCUSSION AND WORKSHOP .......................................... 59
6.7.1 Introduction .................................................................................................................. 59
6.7.2 The starting point - The meaning of sustainability ...................................................... 60 6.7.3 Policy and regulatory conditions ................................................................................. 61
6.7.3.1 Prioritization in state land leasing ......................................................................... 61 6.7.3.2 Wheat producers between tradition and modern production ................................ 62 6.7.3.3 Agricultural policy measures ................................................................................ 65
6.7.4 Market conditions ........................................................................................................ 67 6.7.4.1 Uncertainty and price volatility ............................................................................ 67
6.7.4.2 The chain structure, institutional arrangements and financing ............................. 68 6.7.5 How do sector stakeholders perceive their strategies? ............................................... 70
6.7.5.1 Technology improvements and increasing farm ownership ................................. 70 6.7.5.2 Product reorientation - start with the new combination of crops or leave the
business 72
6.7.5.3 Risk control and institutional improvements ........................................................ 73 6.7.6 JUST IMAGINE YOUR BUSINESS IN 2027 ............................................................... 73
6.8 THE WHEAT SECTOR - SURVEY RESULTS ................................................................. 74 6.8.1 Introduction .................................................................................................................. 74 6.8.2 Sales channels: reporting the results of section B of the questionnaire ...................... 77 6.8.3 Characteristics of sale agreements: results of section C ............................................. 78
3
6.8.4 Sustainability: results of section C1............................................................................. 85 6.8.5 Strategies and drivers of farming: results of section D ............................................... 88
6.9 REFERENCES......................................................................................................................... 92
7 SERBIAN CASE STUDY B: SMALL FAMILY OWNED RASPBERRY FARMS IN THE REGION OF SUMADIJA AND WESTERN SERBIA ............................................................................................ 94
7.1 CASE STUDY INTRODUCTION ................................................................................................ 94 7.2 POLICY AND REGULATORY CONDITIONS ............................................................................. 100
7.2.1 Agriculture policy programmes targeted at raspberry production ........................... 100 7.2.1.1 Organic production growth ................................................................................. 102
7.2.1.2 Improving Market Efficiency and Implementing Community Standards .......... 104 7.3 MARKET CONDITIONS ......................................................................................................... 105
7.3.1 Access to markets ....................................................................................................... 106 7.3.1.1 Export promotion ................................................................................................ 106 7.3.1.2 Cooperatives and support to the producers groups ............................................. 107
7.3.1.3 "Ariljska malina" - product with designation of origin ...................................... 107 7.3.2 Internationally supported programmes ..................................................................... 108
7.4 KEY CONDITIONS FACED BY SMALL FAMILY RASPBERRY PRODUCERS ................................ 109 7.5 KEY STRATEGIES ADOPTED BY SMALL RASPBERRY PRODUCERS AND THEIR IMPACT ON
PERFORMANCE ............................................................................................................................... 110 7.6 THE KEY STRATEGIES AND THE RASPBERRY SECTOR PERFORMANCE - SWOT ANALYSIS.... 111
7.7 THE RESULTS OF FOCUS GROUPS DISCUSSIONS AND WORKSHOPS .................................... 112 7.7.1 Introduction ................................................................................................................ 112
7.7.2 The starting point - "Do we talk about the same concepts?" ..................................... 113 7.7.3 Policy and regulatory conditions ............................................................................... 115
7.7.3.1 State land tenure ................................................................................................. 115
7.7.3.2 Environmental sustainability and regulations ..................................................... 116 7.7.3.3 Agricultural policy .............................................................................................. 119
7.7.4 Market conditions ...................................................................................................... 120 7.7.4.1 Price .................................................................................................................... 120
7.7.4.2 Market structure and institutional arrangements ................................................ 122 7.7.4.3 Financing ............................................................................................................ 123
7.7.5 Strategies mentioned by interviewees ........................................................................ 124 7.7.5.1 Production alternatives ....................................................................................... 124
7.7.5.2 Cooperation ......................................................................................................... 126 7.7.6 JUST IMAGINE YOUR BUSINESS IN 2027 ............................................................. 127
7.8 THE RASPBERRY SECTOR - SURVEY RESULTS ...................................................... 128 7.8.1 Introduction ................................................................................................................ 128 7.8.2 Sales channels: reporting the results of section B of the questionnaire .................... 130
7.8.3 Characteristics of sales agreements: results of section C ......................................... 132 7.8.4 Sustainability: results of section C1........................................................................... 141
7.8.5 Strategies and drivers of farming: results of section D ............................................. 145 7.9 REFERENCES....................................................................................................................... 149
8 ANNEX 1 - THE QUALITATIVE RESEARCH GUIDELINES (FGD IN SERBIAN) ........................... 151
9 ANNEX 2 - QUANTITATIVE RESEARCH GUIDELINES (IN SERBIAN) ...................................... 157
10 ANNEX 3 -THE SURVEY DESIGN AND SAMPLE ............................................................... 158
11 ANNEX 4 -THE CSP INVENTORY - THE MAIN INPUTS ...................................................... 163
4
List of tables
Table 1: The list of discussion topics in the focus and strategic goals in the wheat sector/ Vojvodina ......... 11
Table 2: Farmers’ strategies ............................................................................................................................ 12
Table 3: The strong institutional support is requested ................................................................................... 13
Table 4: Conditions, state support and strategies for Raspberry CS in Serbia ................................................ 17
Table 5: IPARD programme for Serbia, 2014-2020 (EUR million)................................................................... 33
Table 6: Structure of farm samples in Serbia by sectors, 2014-2015 ............................................................. 34
Table 7: Correlation analysis........................................................................................................................... 35
Table 8: Testing results ................................................................................................................................... 35
Table 9: Fixed effects specifications - estimation results ................................................................................ 36
Table 10: Correlation analysis......................................................................................................................... 36
Table 11: Testing results .................................................................................................................................. 37
Table 12: Fixed effects specifications - estimation results .............................................................................. 37
Table 13: Agricultural land, arable land and irrigation area (1,000 ha) ......................................................... 39
Table 15: Wheat import in the period 2009-2012 .......................................................................................... 42
Table 16: Milling industry production in the period 2010-2012 in tons ........................................................ 43
Table 17: Average wheat prices in the period 2002 – 2012 in RSD/kg ........................................................... 44
Table 18: Wheat export (group 041) in the period 2009 to 2012 ................................................................... 44
Table 19: The advantages of the Public Warehouse System .......................................................................... 47
Table 20: Basic information about FGD Participants in the Region of Vojvodina ........................................... 60
Table 21: The interviewed farms characteristics based on farm size ............................................................. 79
Table 22: The interviewed farms characteristics based on age structure ...................................................... 79
Table 23: The Interviewed farms characteristics based on education ............................................................ 80
Table 24: The characteristics of interviewed farms based on sale channels .................................................. 80
Table 25: Different farmers groups and the factors influence on the farm sustainability in the future ....... 88
Table 26. Domestic use and export as (%) of total consumption of Serbian raspberry ................................. 97
Table 27: Implementation of standards in Serbia and neighboring countries ............................................. 104
Table 28: Basic information about FGD Participants ..................................................................................... 113
5
Table 29: The interviewed farms characteristics based on farms size (total area) ...................................... 132
Table 30: The interviewed farms characteristics based on farms size (raspberry area) .............................. 132
Table 31: The interviewed farms characteristics based on age structure .................................................... 133
Table 32: The Interviewed farms characteristics based on education .......................................................... 133
Table 33: The interviewed farms characteristics based on sale channels .................................................... 134
Table 34: Different farmers groups and the factors influence on the farmers sustainability in the future . 145
List of figures
Figure 1. Rural population growth in Serbia by districts, 1991-2011 ............................................................. 24
Figure 2. Educational structure of rural population in Serbia by regions, 2013 ............................................. 26
Figure 3. Agricultural budget in Serbia (2004-2016) ...................................................................................... 27
Figure 4. Breakdown by budgetary support to agriculture by pillars in Serbia (2005-2013), mill EUR .......... 28
Figure 5. The distribution of incentives in agriculture and rural development in the year 2016 .................. 29
Figure 6. Outstanding liabilities 2015 and support in 2016. .......................................................................... 30
Figure 7. Public Spending on Agri-Sector, EUR/Ha of utilized agriculture area ............................................. 31
Figure 8. Wheat production in the period 2006-2016 .................................................................................... 40
Figure 9. Agricultural holdings by the utilized agricultural area, 2015 ........................................................... 41
Figure 10. Production trends of (a) wheat and (b) corn in Serbia in the period 1973-2013 .......................... 42
Figure 11. Market and direct support measures in Serbia .............................................................................. 45
Figure 12. The number of interviewed farms by a) farm size, b) age, c) gender and d) education. ............... 75
Figure 13. Self-reported income and efficiency of surveyed farms (no. of farms) ........................................ 76
Figure 14: Collective and individual sale channels in the wheat sector ......................................................... 77
Figure 15. The characteristics of collective and individual sale arrangements .............................................. 77
Figure 16. Collective sale characteristics – What do collective organisations do on behalf of their members?
......................................................................................................................................................................... 78
Figure 17. Type of agreements ....................................................................................................................... 81
6
Figure 18. Duration of agreement ................................................................................................................... 81
Figure 19. Price and delivery settlement: (a) how is the price defined? (b) when are the payments made? 82
Figure 20. Price determination collective/individual sales channels ............................................................. 83
Figure 21. Payments and collective/individual sale channels ........................................................................ 83
Figure 22. Standards involved in two types of arrangements ........................................................................ 84
Figure 23. Level of farmers’ satisfaction with contract arrangement ............................................................ 84
Figure 24. Farmers’ perception of overall quality of sale arrangement .......................................................... 85
Figure 25. The perception of farms sustainability ........................................................................................... 85
Figure 26. Perception of farms sustainability according to the producer’s age and education structure ..... 86
Figure 27. Perception of farms sustainability according to the farm size ....................................................... 87
Figure 28. Different factors influence the farms sustainability in the future .................................................. 88
Figure 29. Strategies in the coming 5 years .................................................................................................... 89
Figure 30. Succession of the farm ................................................................................................................... 89
Figure 31. Future actions regarding production plans by farm size ................................................................ 90
Figure 32. Future actions regarding market plans by farm size ...................................................................... 90
Figure 33. Raspberry production in Serbia (in 000 tons) ................................................................................. 95
Figure 34. Planted area (in ha) ........................................................................................................................ 96
Figure 35. Total supply of raspberry in Serbia (in 000 tons) ........................................................................... 96
Figure 36. Total consumption of raspberry in Serbia (in 000 tons) ................................................................. 97
Figure 37 Domestic consumption vs export of raspberry from Serbia .......................................................... 98
Figure 38. Serbia: Raspberries – Export, frozen, without sugar (2010-2014) ................................................ 98
Figure 39 Export - categories of raspberries, average 2005-2011 ................................................................. 99
Figure 40. Raspberries: quantity of sale and purchase, 2005-2012 ................................................................ 99
Figure 41. Raspberries: value of sale and purchase, 2005-2012 ................................................................... 100
Figure 42. Organic sector: land under crop production - in conversion and certified, 2015 (ha) ................ 102
Figure 43. Land under crop organic production - total (ha) and share in the total land, 2015 ................... 103
Figure 44. Price of raspberries paid to producers in Serbia (RSD per kg) ..................................................... 105
Figure 45. The number of interviewed farms by a) farm size, b) age, c) gender and d) education. ........... 129
Figure 46. Self-reported income and efficiency of surveyed farms ............................................................ 129
7
Figure 47. Collective and individual sale channels in the raspberry sector .................................................. 130
Figure 48 The characteristics of collective and individual sale arrangements ............................................. 131
Figure 49. Collective sale characteristics –What do collective organisations do on behalf of their members?
....................................................................................................................................................................... 131
Figure 50. Type of agreement ....................................................................................................................... 134
Figure 51. Type of agreement – collective vs. individual ............................................................................. 135
Figure 52. Duration of agreement ................................................................................................................. 135
Figure 53. Duration of agreement – collective vs. individual ........................................................................ 136
Figure 54. Price and delivery settlement: (a) how is the price defined? (b) when are the payments made?
Source: SUFISA farms survey (RS – raspberry) .............................................................................................. 136
Figure 55. Price formation - collective vs. individual arrangement ............................................................... 137
Figure 56. Payments - collective vs. individual sales channels ..................................................................... 137
Figure 57. Average price for selling raspberry .............................................................................................. 138
Figure 58. Cost structure of surveyed farms ................................................................................................. 138
Figure 59. Cost structure - collective vs. individual sales arrangements ...................................................... 139
Figure 60- Standards implemented in sales agreements .............................................................................. 139
Figure 61. Satisfaction with sales agreement ................................................................................................ 140
Figure 62. Farmers’ perception of overall quality of sale arrangement (median mark) .............................. 140
Figure 63. The perception of the overall arrangement influence on farms sustainability ............................ 141
Figure 64. Perception of overall arrangement influence on farms sustainability according to the producer’s
age and education structure ......................................................................................................................... 142
Figure 65. Perception on overall arrangement influence on farms sustainability according to the farm size
....................................................................................................................................................................... 143
Figure 66. Different factors influence on the farms sustainability in the future .......................................... 144
Figure 67. Strategies in the coming five years .............................................................................................. 145
Figure 68. Succession of the farm ................................................................................................................. 146
Figure 69. Future actions in production reported by farm size .................................................................... 146
Figure 70. Future actions regarding market plans reported by farm size ..................................................... 147
8
List of abbreviations
CAP – COMMON AGRICULTURAL POLICY
CEFTA – CENTRAL EUROPEAN FREE TRADE AGREEMENT
CS – CASE STUDY
EBRD - European Bank for Reconstruction and Development
EU – EUROPEAN UNION
FAO - UN Food and Agriculture Organization
FGD – FOCUS GROUP DISCUSSION
FYR – FORMER YUGOSLAV REPUBLIC
GDP – GROSS DOMESTIC PRODUCT
GIS – GEOGRAPHICAL INFORMATION SYSTEM
GM – GENETICALY MODIFIED
ISAA - INSTITUTE FOR SCIENCE APPLICATION IN AGRICULTURE
ITC – INFORMATION AND COMMUNICATION TECHNOLOGY
LAG – LOCAL ACTION GROUP
MAEP – MINISTRY OF AGRICULTURE AND ENVIRONMENT PROTECTION
MAFWM – MINISTRY OF AGRICULTURE, FORESTRY AND WATERMANAGEMENT
PDO – PRODUCT DESIGNATION OF ORIGIN
PW – PARTICIPATORY WORKSHOP
R&D – RESEARCH AND DEVELOPMENT
RAS – DEVELOPMENT AGENCY OF SERBIA
RS – REPUBLIC OF SERBIA
SIEPA – SERBIAN AGENCY FOR EXPORT PROMOTION
SORS – STATISTICAL OFFICE OF REPUBIC OF SERBIA
UAA – UTILIZED AGRICULTURAL AREA
9
1 The executive summary
Serbia belongs to the group of small open economies, and agricultural sector risks and strategies are
influenced by the global factors. However, the performed analysis clearly shows that concepts and
strategies applied in practice are generally based on low risk awareness of agricultural producers and less
developed individual risk control strategies. Instead, producers are trying to "share the risk with the
state/government" or to address the main issues of risk control and sustainability to "the responsible policy
maker" (both at the local and national level) and agricultural and rural policy measures applied in practice.
According to the media analysis, the following approaches are applied in practice: (1) traditional approach
comprising of measures directly applied in the farm practices - diversification on the farm, and rural
economy diversification - implementation of complementary activities of rural economy at the local level,
such as tourism, trade and processing; (2) "the old story" - producers are still waiting for the strong state
support, both in direct and indirect ways; (3) agricultural and rural development policy measures applied at
the local level are oriented toward improvement of management quality and farmers skills (training,
education and innovations).
The year by year the policy instruments are exposed to significant changes. From 2000 to the present, four
characteristic stages have emerged: the first (2001-2003), with policy oriented towards price support for
specifying agricultural crop (soybean, sunflower, sugar beet, wheat); the second (2004-2006), that
abolishes price support and introduces support for investment; the third (2007-2008) that brings numerous
non-market measures and puts more interest in rural development; the fourth (2008 forward), governed in
the economic crisis conditions with absolute marginalization of specific measures aimed at quality
improvement and support to areas with difficulties. A particularly important issue in agriculture is the
labour force and its characteristics. Serbia rural areas are generally characterized by depopulation process
and very pronounced emigration process. These two components virtually leave Serbian villages "empty".
The relative amount of public spending on agriculture in Serbia is not low, due to difference in relative
prices and the size of GDP. However, the absolute amount of public spending on agri-sector per hectare of
utilized agriculture in Serbia (69 EUR/Ha) is considerably lower than the EU-27 average (476 EUR/Ha).
However, it is comparable in terms of size and development to some other countries such as Croatia (379
EUR/Ha) and FYR of Macedonia (148 EUR/Ha). At the same time, public spending on agri-sector in Serbia,
per hectare of utilized land is considerably higher than in Bosnia and Herzegovina and Albania, being close
to the amount in Montenegro. This suggests that public spending for support to agri-sector in Serbia is
sufficient to maintain competitiveness of Serbian farmers in the CEFTA region1. However, the level of public
spending to agri-sector in Serbia is lower than in the EU. Relatively lower state aid available to Serbian farmers,
together with implementation of the Stabilization and Association Agreement, which provides for large scale
liberalization of agri-sector market in Serbia with regards to the EU market players, put Serbian farmers under
substantial pressure.
The share of input subsidies has continuously increased over the analysed period. Since 2007 input
subsidies have become a dominant scheme of budgetary support to agriculture, with their share of total
agricultural budget exceeding 45 percent (in 2010 even reached 72 percent). However, the structure of
input subsidies has changed dynamically, with a tendency to concentrate on diesel fuel and mineral
fertilizers in the last few years. The subsidies on interest rates or insurance premiums should be also added
as well as the warehouse system implementation. The last enables agricultural producer to keep his
produce in a warehouse which provides guarantees that the produce will be safe, and that its quality and
quantity will be preserved. At the same time, the warehouse system gives a producer the freedom to
10
choose when and at what price he is going to sell his produce. Agricultural producer is not forced to sell the
goods in order to obtain money, since as long as the goods are stored in a public warehouse, he can obtain
a short-term loan on the basis of warehouse receipts issued on the account of stored goods. This system
could be also implemented in the fruit sector (cold storages).
Two cases were selected for in-depth analysis at the national level: Wheat sector in Vojvodina and
Raspberry sector in Sumadija and West Serbia Region. Behind this choice stands a crucial effort to isolate
the essential problems of commercially-oriented and market-integrated producers of wheat in Vojvodina.
Additionally, our efforts were also put on the analysis of the main issues faced by the system of family
farming in central Serbia (Raspberry CS). Both sectors have specific challenges and inherent. In the first
phase an analysis of various sources (policy documents and strategies, scientific articles, as well as public
media and blogs) was performed. This analysis provided a general overview of both conditions and
limitations that agricultural producers are exposed to. The insights from the stakeholders’ point of view
were obtained by focus groups discussion and participatory workshop.
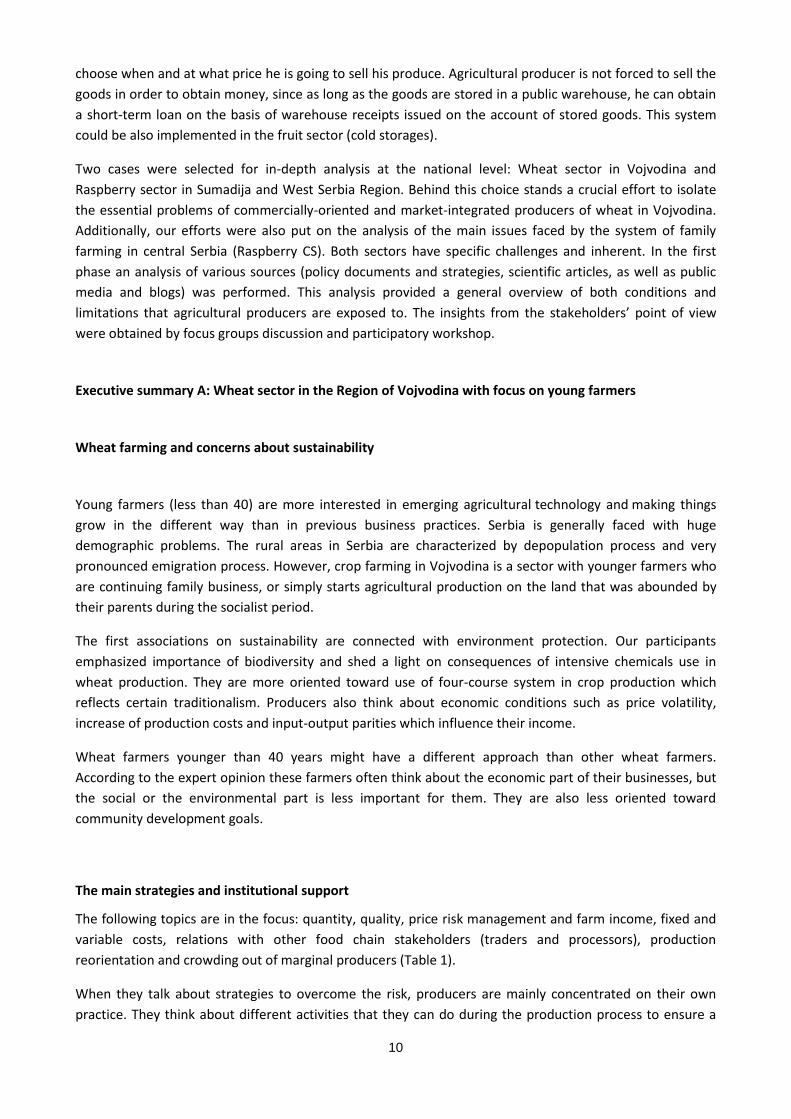
Executive summary A: Wheat sector in the Region of Vojvodina with focus on young farmers
Wheat farming and concerns about sustainability
Young farmers (less than 40) are more interested in emerging agricultural technology and making things
grow in the different way than in previous business practices. Serbia is generally faced with huge
demographic problems. The rural areas in Serbia are characterized by depopulation process and very
pronounced emigration process. However, crop farming in Vojvodina is a sector with younger farmers who
are continuing family business, or simply starts agricultural production on the land that was abounded by
their parents during the socialist period.
The first associations on sustainability are connected with environment protection. Our participants
emphasized importance of biodiversity and shed a light on consequences of intensive chemicals use in
wheat production. They are more oriented toward use of four-course system in crop production which
reflects certain traditionalism. Producers also think about economic conditions such as price volatility,
increase of production costs and input-output parities which influence their income.
Wheat farmers younger than 40 years might have a different approach than other wheat farmers.
According to the expert opinion these farmers often think about the economic part of their businesses, but
the social or the environmental part is less important for them. They are also less oriented toward
community development goals.
The main strategies and institutional support
The following topics are in the focus: quantity, quality, price risk management and farm income, fixed and
variable costs, relations with other food chain stakeholders (traders and processors), production
reorientation and crowding out of marginal producers (Table 1).
When they talk about strategies to overcome the risk, producers are mainly concentrated on their own
practice. They think about different activities that they can do during the production process to ensure a
11
better market position. As they cannot affect the price, they are considering ways in which they could
affect cost reduction (total and per unit of production). They want to be recognized as the modern
producers, but they use wheat as the only winter crop that plays a significant role in the sowing structure
for crop rotation purposes. Crop rotation can help to control of pests and diseases to maintain soil quality,
and ensure enough nutrients are available to different crops each year.
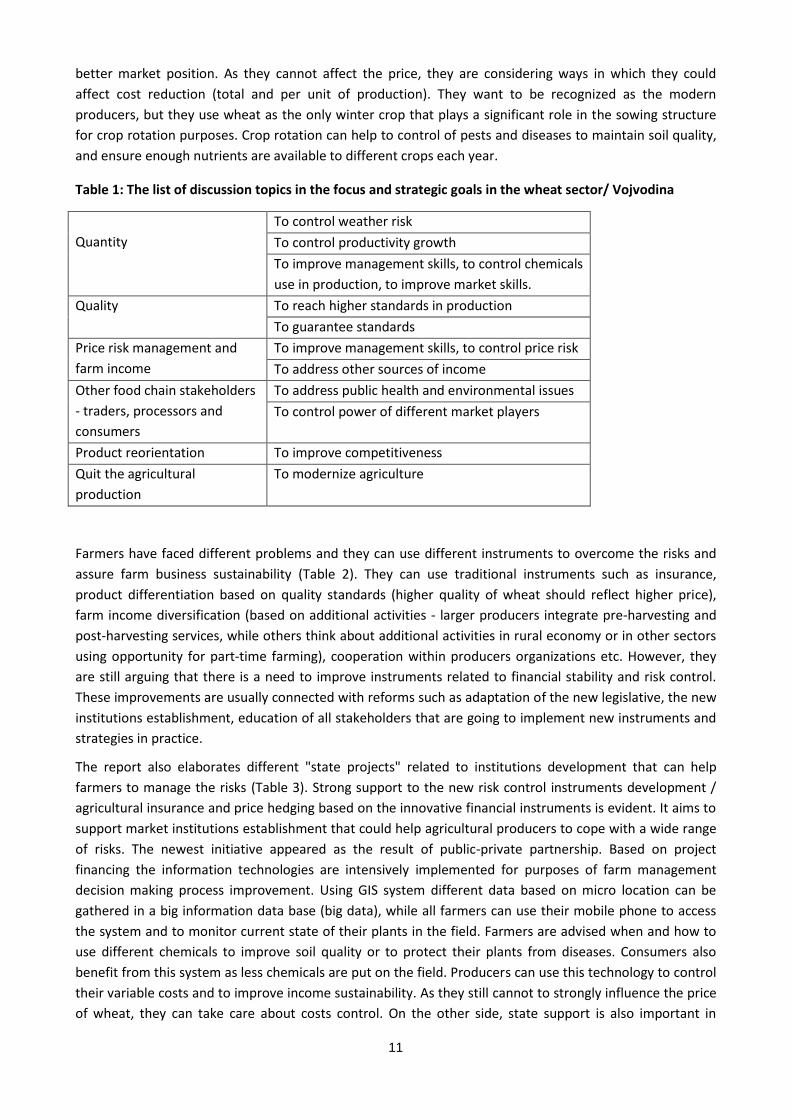
Table 1: The list of discussion topics in the focus and strategic goals in the wheat sector/ Vojvodina
Quantity
To control weather risk
To control productivity growth
To improve management skills, to control chemicals
use in production, to improve market skills.
Quality To reach higher standards in production
To guarantee standards
Price risk management and
farm income
To improve management skills, to control price risk
To address other sources of income
Other food chain stakeholders
- traders, processors and
consumers
To address public health and environmental issues
To control power of different market players
Product reorientation To improve competitiveness
Quit the agricultural
production
To modernize agriculture
Farmers have faced different problems and they can use different instruments to overcome the risks and
assure farm business sustainability (Table 2). They can use traditional instruments such as insurance,
product differentiation based on quality standards (higher quality of wheat should reflect higher price),
farm income diversification (based on additional activities - larger producers integrate pre-harvesting and
post-harvesting services, while others think about additional activities in rural economy or in other sectors
using opportunity for part-time farming), cooperation within producers organizations etc. However, they
are still arguing that there is a need to improve instruments related to financial stability and risk control.
These improvements are usually connected with reforms such as adaptation of the new legislative, the new
institutions establishment, education of all stakeholders that are going to implement new instruments and
strategies in practice.
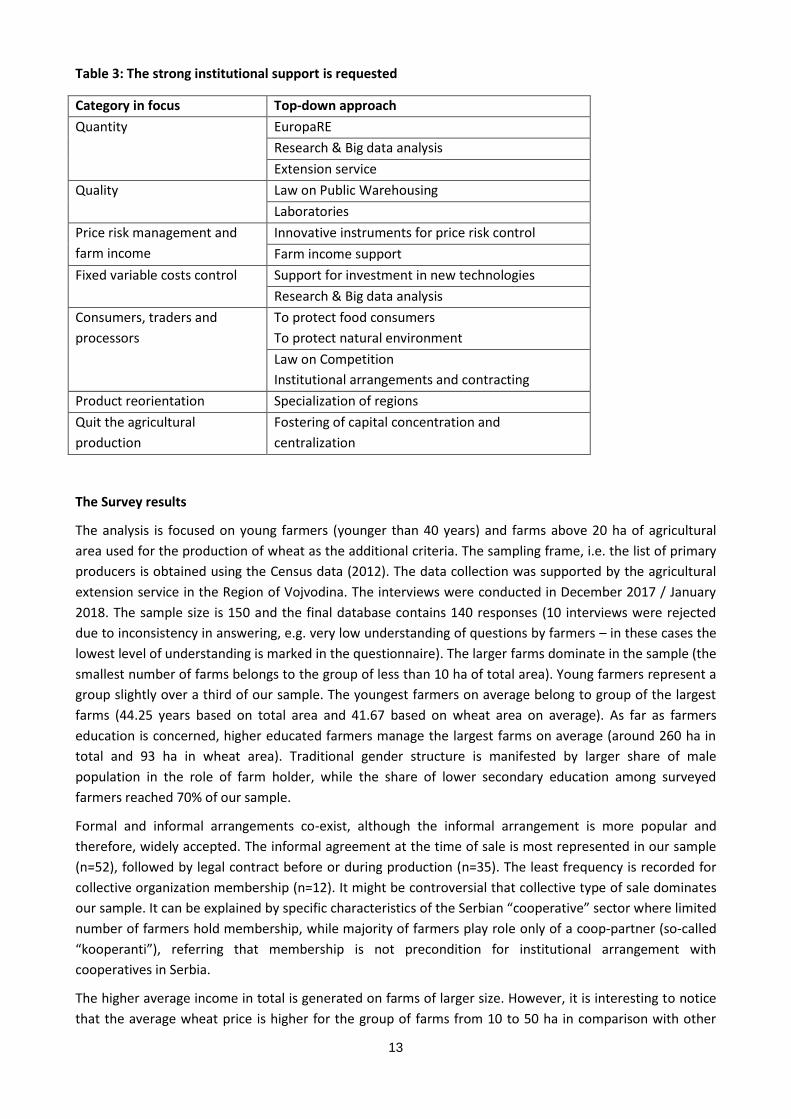
The report also elaborates different "state projects" related to institutions development that can help
farmers to manage the risks (Table 3). Strong support to the new risk control instruments development /
agricultural insurance and price hedging based on the innovative financial instruments is evident. It aims to
support market institutions establishment that could help agricultural producers to cope with a wide range
of risks. The newest initiative appeared as the result of public-private partnership. Based on project
financing the information technologies are intensively implemented for purposes of farm management
decision making process improvement. Using GIS system different data based on micro location can be
gathered in a big information data base (big data), while all farmers can use their mobile phone to access
the system and to monitor current state of their plants in the field. Farmers are advised when and how to
use different chemicals to improve soil quality or to protect their plants from diseases. Consumers also
benefit from this system as less chemicals are put on the field. Producers can use this technology to control
their variable costs and to improve income sustainability. As they still cannot to strongly influence the price
of wheat, they can take care about costs control. On the other side, state support is also important in
12
different institutions development related to warehousing, warehouse receipts and pre-harvesting
financing.
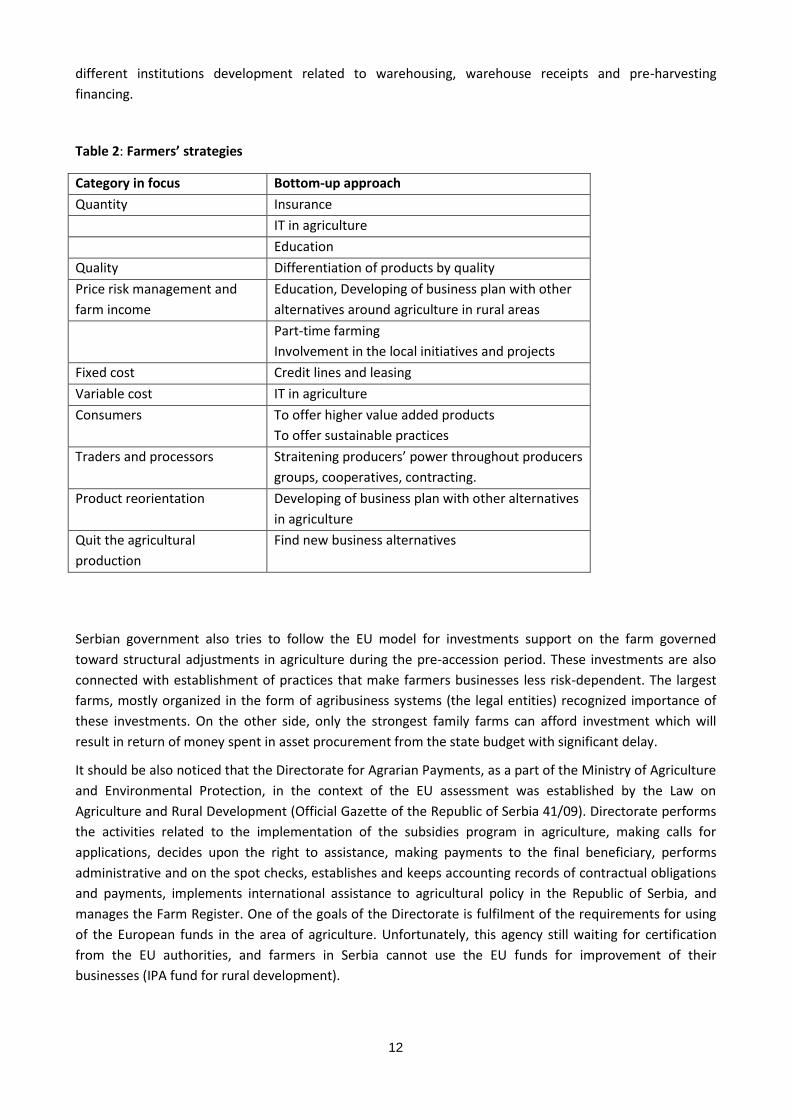
Table 2: Farmers’ strategies
Category in focus Bottom-up approach
Quantity Insurance
IT in agriculture
Education
Quality Differentiation of products by quality
Price risk management and
farm income
Education, Developing of business plan with other
alternatives around agriculture in rural areas
Part-time farming
Involvement in the local initiatives and projects
Fixed cost Credit lines and leasing
Variable cost IT in agriculture
Consumers To offer higher value added products
To offer sustainable practices
Traders and processors Straitening producers’ power throughout producers
groups, cooperatives, contracting.
Product reorientation Developing of business plan with other alternatives
in agriculture
Quit the agricultural
production
Find new business alternatives
Serbian government also tries to follow the EU model for investments support on the farm governed
toward structural adjustments in agriculture during the pre-accession period. These investments are also
connected with establishment of practices that make farmers businesses less risk-dependent. The largest
farms, mostly organized in the form of agribusiness systems (the legal entities) recognized importance of
these investments. On the other side, only the strongest family farms can afford investment which will
result in return of money spent in asset procurement from the state budget with significant delay.
It should be also noticed that the Directorate for Agrarian Payments, as a part of the Ministry of Agriculture
and Environmental Protection, in the context of the EU assessment was established by the Law on
Agriculture and Rural Development (Official Gazette of the Republic of Serbia 41/09). Directorate performs
the activities related to the implementation of the subsidies program in agriculture, making calls for
applications, decides upon the right to assistance, making payments to the final beneficiary, performs
administrative and on the spot checks, establishes and keeps accounting records of contractual obligations
and payments, implements international assistance to agricultural policy in the Republic of Serbia, and
manages the Farm Register. One of the goals of the Directorate is fulfilment of the requirements for using
of the European funds in the area of agriculture. Unfortunately, this agency still waiting for certification
from the EU authorities, and farmers in Serbia cannot use the EU funds for improvement of their
businesses (IPA fund for rural development).
13
Table 3: The strong institutional support is requested
Category in focus Top-down approach
Quantity EuropaRE
Research & Big data analysis
Extension service
Quality Law on Public Warehousing
Laboratories
Price risk management and
farm income
Innovative instruments for price risk control
Farm income support
Fixed variable costs control Support for investment in new technologies
Research & Big data analysis
Consumers, traders and
processors
To protect food consumers
To protect natural environment
Law on Competition
Institutional arrangements and contracting
Product reorientation Specialization of regions
Quit the agricultural
production
Fostering of capital concentration and
centralization
The Survey results
The analysis is focused on young farmers (younger than 40 years) and farms above 20 ha of agricultural
area used for the production of wheat as the additional criteria. The sampling frame, i.e. the list of primary
producers is obtained using the Census data (2012). The data collection was supported by the agricultural
extension service in the Region of Vojvodina. The interviews were conducted in December 2017 / January
2018. The sample size is 150 and the final database contains 140 responses (10 interviews were rejected
due to inconsistency in answering, e.g. very low understanding of questions by farmers – in these cases the
lowest level of understanding is marked in the questionnaire). The larger farms dominate in the sample (the
smallest number of farms belongs to the group of less than 10 ha of total area). Young farmers represent a
group slightly over a third of our sample. The youngest farmers on average belong to group of the largest
farms (44.25 years based on total area and 41.67 based on wheat area on average). As far as farmers
education is concerned, higher educated farmers manage the largest farms on average (around 260 ha in
total and 93 ha in wheat area). Traditional gender structure is manifested by larger share of male
population in the role of farm holder, while the share of lower secondary education among surveyed
farmers reached 70% of our sample.
Formal and informal arrangements co-exist, although the informal arrangement is more popular and
therefore, widely accepted. The informal agreement at the time of sale is most represented in our sample
(n=52), followed by legal contract before or during production (n=35). The least frequency is recorded for
collective organization membership (n=12). It might be controversial that collective type of sale dominates
our sample. It can be explained by specific characteristics of the Serbian “cooperative” sector where limited
number of farmers hold membership, while majority of farmers play role only of a coop-partner (so-called
“kooperanti”), referring that membership is not precondition for institutional arrangement with
cooperatives in Serbia.
The higher average income in total is generated on farms of larger size. However, it is interesting to notice
that the average wheat price is higher for the group of farms from 10 to 50 ha in comparison with other
14
firm size groups (both in total and wheat area). Average price reported by all farmers for the year 2016-17
is 0.15 EUR/kg. However, farmers who are involved in individual sale channels managed to reach higher
commodity price of EUR 0.166 in comparison to the collective price of EUR 0.143, on average. In the total
sample of farms production costs as share of selling price vary between 40-100%, being on average 76.69%.
Most sales agreements are made either for particular sale (n=55), or they last between 7 months and 1 year
(n=42). Surveyed farms reported limited number of medium (n=21) or long run contracts (n=3). Without
stable price arrangements (in medium and long run), it is hard to run the farm business successfully. Most
of the payments in this sample belong to the category “at delivery” of the product or even “before” that,
which implies standard form of price formation. At delivery payments are more common to the individual
sales channels, but payments before are more common to the “collective” ones. The price of wheat is in
most cases defined based on the market supply and demand conditions.
Among the relevant standards, quality and food safety are dominantly imposed to both collective and
individual sales channels, while animal welfare standards are not mentioned at all. The law on animal
welfare is still not adopted in Serbia, although the Law on Food advocates for this issue specific regulation.
On the other side, producers in Serbia are obliged to implement GM free practices.
The predominant opinion among wheat producers is that only some social and economic factors are more
important in the farm/production sustainability, while the environmental factors do not have so much
influence. However, the older group of farmers gave higher ponders to the soil quality and animal welfare.
The linkages among farmers and stakeholders are the most important aspect of social sustainability. It is
interesting that the older and less educated producers pay more attention to the social recognition of their
farming activities (probably the influence of the tradition), while less educated producers still have very
high opinion about arable land value when it comes to succession. On the economic side, the profitability
maintenance and investment opportunities are generally the highest scored (even higher than wheat prices
and other market conditions).
The level of satisfaction in both subsamples (individual and collective arrangements) indicates that wheat
farmers are generally satisfied with the sale agreements. The overall opinion of the wheat producers in
Serbia is that climate change and market prices are the two most important factors that will shape some
future strategies. The factor - "Market prices" is singled out as one of the most important factors of the
future sustainability by almost all groups of producers, although that some groups, like older or less
educated producers, “don’t know well what this factor really means”.
The surveyed farmers reported what their strategies for the development of wheat within the context of
farm business in the coming five years are. The larger wheat farmers (above 50 ha) report that they want to
expand production (it is more important for this group than in other groups), while the highest share of
response “to abandon” farming was reported in the group of 10 to 50 ha. When it comes to age structure,
younger farmers (below 40 years) are more prone to expand farm activity, while abandonment or reducing
of farm activity is more present when it comes to older farmers. It is also important to notice that among
farmers from 50 to 250 ha the group of older is overrepresented, and many of the interviewed farmers in
this group have no expectations regarding successors (the strong demographic problem is present).
Insurance and investments dominate among selected strategies related to improvement of wheat farmers’
production in the Region of Vojvodina, while market plans dominantly include diversification and new forms of
partnership. The specific food chain structure requests better coordination and cooperation both among farmers
and between farmers and other food chain stakeholders in Serbia. Additionally, the active role of farmers is
recognized in the area of sales channels innovation and income insurance as the strategic response to price
fluctuations.
15
Executive summary B: Raspberry sector in the Region of Sumadija and West Serbia with focus on small
family farms
How the current situation can be described in brief?
The description of the current state in the sector is based on the obtained results of literature review
related to the market and regulatory conditions and stakeholders’ insights obtained by the focus groups
discussions and participatory workshop.
The rural areas of intensive raspberry production have similar problems as other rural areas in Serbia in
general. The most important problems are: low productivity, small farm size, insufficient state support,
inadequate and insufficient infrastructure, lack of equipment and machinery, limited economic activity, lack
of investment, low level of education and lack of initiatives, lack of marketing and limited membership in
cooperatives or associations, and inadequate planning by local policy makers.
Recently, the negative trends in raspberry production have appeared due to the unfavourable structure of
the farms (small holdings, aggravation of the aging structure of farmers) and high raspberry price volatility.
Price volatility is caused by uncertainty and unpredictability and that discourages investment in production,
storage and processing. This is also the result of the unfavourable market structure, where buyers /
distributors of raspberries have a stronger position than the primary producers. The strong state support
programs for the procurement and construction of cold storages for raspberry sector and establishment of
new forms of cooperatives are needed, so that primary producers can be more flexible in terms of the time
of sales of their products.
Problem 1: Unpredictability of price. Due to the lack of strong institutional arrangements in the production
chain, agricultural producers depend on the price determined by cold storages (traders). Producers of
raspberries do not have an agreed price for their product. In addition, they are forced to buy inputs for
production using unusual contracts - the input price is set, but not the future raspberry price in which they
will make the final payment.
Problem 2: Great dependence on export companies and the lack of producer organizations. Small and
medium-sized cold storages work for a few big market players / exporters. The weakest position in the
Serbian food chain belongs to farmers. They are unorganized, divided and without adequate representation
in the various governing bodies. There is a limited number of organizations (cooperatives) that can help
farmers to sell their raspberries to wholesalers and processors. Producers' organizations should play a key
role in the development of the sector. The strict implementation of The Competition Law is requested.
However, there are no instruments that will allow forward contracting - the trade in advance, for the
known customer and at a predetermined price.
Problem 3: Infected planting material. The infected planting material was imported 14 years ago. They are
still in use influencing the appearance of fungi in the rainy years. It is a huge problem as raspberry
producers don't know how to deal with it. It significantly reduces yields, although the planted surface is
larger, and the root of the plant is dried.
Problem 4: Excessive and uncontrolled use of chemicals. There is a huge, uncontrolled activity of agro-
technical lobby. Their goal is to sell as many inputs (pesticides, herbicides, fertilizers) as they can. This can
also cause problems in the European market in the future. There is a need for strict control of the use of
chemicals in production. The appropriate experts-advisors (the extension service) can give advice on the
ground, rather than traders.
16
Problem 5: Lack of laboratories. Laboratories are needed to test the presence of heavy metals and
pesticides in fruits. The purchase of all necessary equipment is covered by international funds and projects,
but these laboratories are still not operative or active in Serbia. In addition, there is no effective and
modern state advisory service.
Problem 6: Better organization in case of weather accidents. The state subsidizes insurance premiums for
agriculture, while the municipality has the system of protection against heavy rains. Although awareness of
the necessity of insurance is growing in recent years, the supply of insurance services is inconsistent. In
many municipalities, the organization of the protection against heavy rains service is inadequate or doesn't
even exist. A better organization is needed, the state does not support meteo-stations with adequate
payments (often there are not enough missiles). In the practice better results are given by local initiatives in
this area.
Problem 7: Lack of adequate scientific research that would support and allow dissemination among
farmers. Primary raspberry producers are forced to experiment by themselves. They buy new varieties of
raspberries and raise new experimental plantations under greenhouses, apply different technologies,
monitor differences in yields and product quality. There is a lack of a common scientific approach to the
advisory service that should help agricultural producers to overcome various barriers. There is also a lack of
link between technological research and the needs of the sector.
Problem 8: Uncontrolled import of raspberries from Bosnia and Herzegovina, Kosovo, Albania and
Macedonia, which is of poor quality. It is usually mixed with domestic raspberry as traders cannot deliver
the contracted quantity. Due to poor quality raspberries are often returned from export.
Problem 9: Financing production. The Ministry of Agriculture has introduced short-term and long-term
lending programs, under more favourable terms than bank loans give, but these conditions can hardly be
met by small producers.
Problem 10: Inconsistent agricultural policy and inadequate state support. Policy is often changed without a
clear goal, it does not deal with rural development at all. The agricultural budget is constantly changing, but
its structure deviates from the EU model. There is a trend to reduce budget expenditures for the food and
rural development sector over the past five years.
Problem 11: A very fragmented ownership. Serbian raspberry farms are small, usually organized as a
seasonal family business. The average area of the raspberry farms is between 0.5 and 1 ha, making it
difficult to take advantage of the economies of scale and production costs are usually high. The farms are
poor technology equipped.
Problem 12: Lease of agricultural land. Family farms do not meet the requirements of the Law on
Agricultural Land for long-term lease. Therefore, state land that could be used to increase the production of
raspberries is simply unused / out of production. It is necessary to change the conditions for leasing the
land to 20-30 years so that they can satisfy family farm needs.
Problem 13: Very small share of processed raspberry products in export. The bulk of the raspberry
production is for export. Almost 90% of raspberry production is frozen, while only 10% is used for
processing or fresh retail sale. Exports are fairly variable and dependent on several markets (almost 60% of
exports go to 2 countries and more than 80% of exports to 6 countries in the World).
Problem 14: Declining competitiveness in the international market. The low presence of market-oriented
producers is evident, with intensive production and modern technology applied in their practices. It is
17
necessary to innovate and improve technology. Production systems must be significantly improved in the
future. Educational programs supported by the government or municipalities in the region of Sumadija and
Western Serbia should play a key role. Particular attention should be paid to the implementation of food
quality standards.
Problem 15: Excessive expectations and reliance on the state. The food chain stakeholders are used to be
directed by others. They have not adapted to the new conditions seen in "the invisible hand of the market".
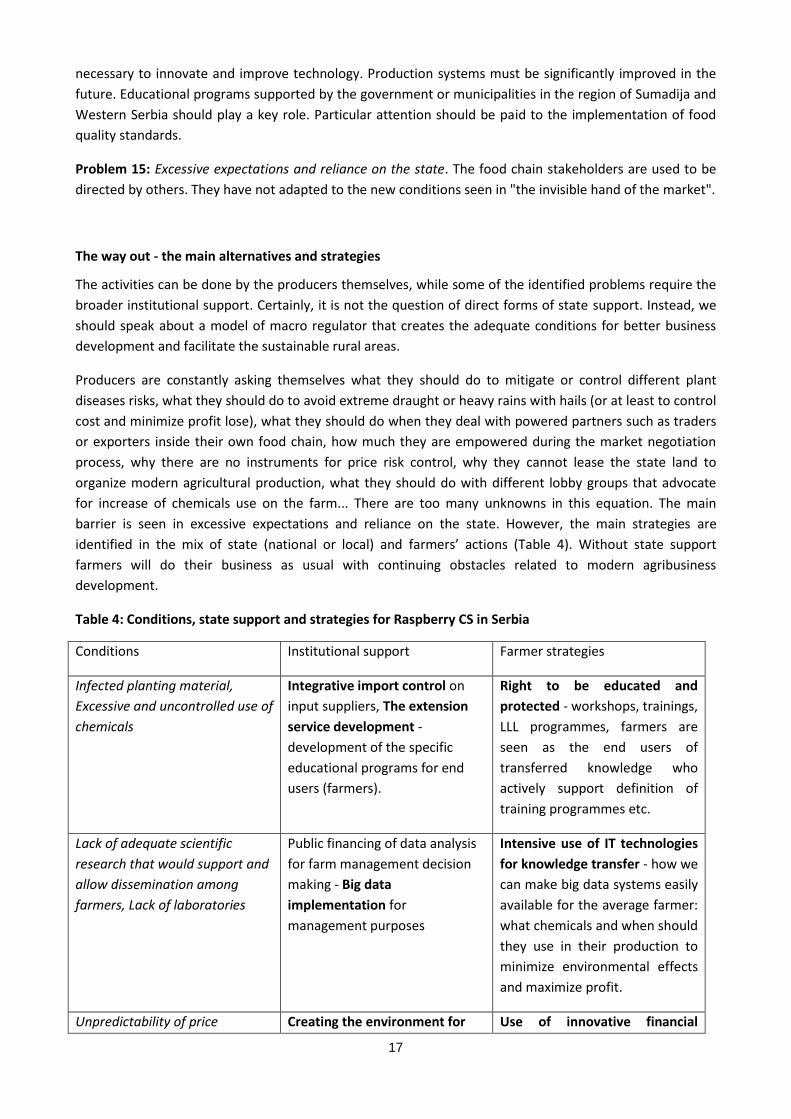
The way out - the main alternatives and strategies
The activities can be done by the producers themselves, while some of the identified problems require the
broader institutional support. Certainly, it is not the question of direct forms of state support. Instead, we
should speak about a model of macro regulator that creates the adequate conditions for better business
development and facilitate the sustainable rural areas.
Producers are constantly asking themselves what they should do to mitigate or control different plant
diseases risks, what they should do to avoid extreme draught or heavy rains with hails (or at least to control
cost and minimize profit lose), what they should do when they deal with powered partners such as traders
or exporters inside their own food chain, how much they are empowered during the market negotiation
process, why there are no instruments for price risk control, why they cannot lease the state land to
organize modern agricultural production, what they should do with different lobby groups that advocate
for increase of chemicals use on the farm... There are too many unknowns in this equation. The main
barrier is seen in excessive expectations and reliance on the state. However, the main strategies are
identified in the mix of state (national or local) and farmers’ actions (Table 4). Without state support
farmers will do their business as usual with continuing obstacles related to modern agribusiness
development.
Table 4: Conditions, state support and strategies for Raspberry CS in Serbia
Conditions Institutional support Farmer strategies
Infected planting material,
Excessive and uncontrolled use of
chemicals
Integrative import control on
input suppliers, The extension
service development -
development of the specific
educational programs for end
users (farmers).
Right to be educated and
protected - workshops, trainings,
LLL programmes, farmers are
seen as the end users of
transferred knowledge who
actively support definition of
training programmes etc.
Lack of adequate scientific
research that would support and
allow dissemination among
farmers, Lack of laboratories
Public financing of data analysis
for farm management decision
making - Big data
implementation for
management purposes
Intensive use of IT technologies
for knowledge transfer - how we
can make big data systems easily
available for the average farmer:
what chemicals and when should
they use in their production to
minimize environmental effects
and maximize profit.
Unpredictability of price Creating the environment for Use of innovative financial
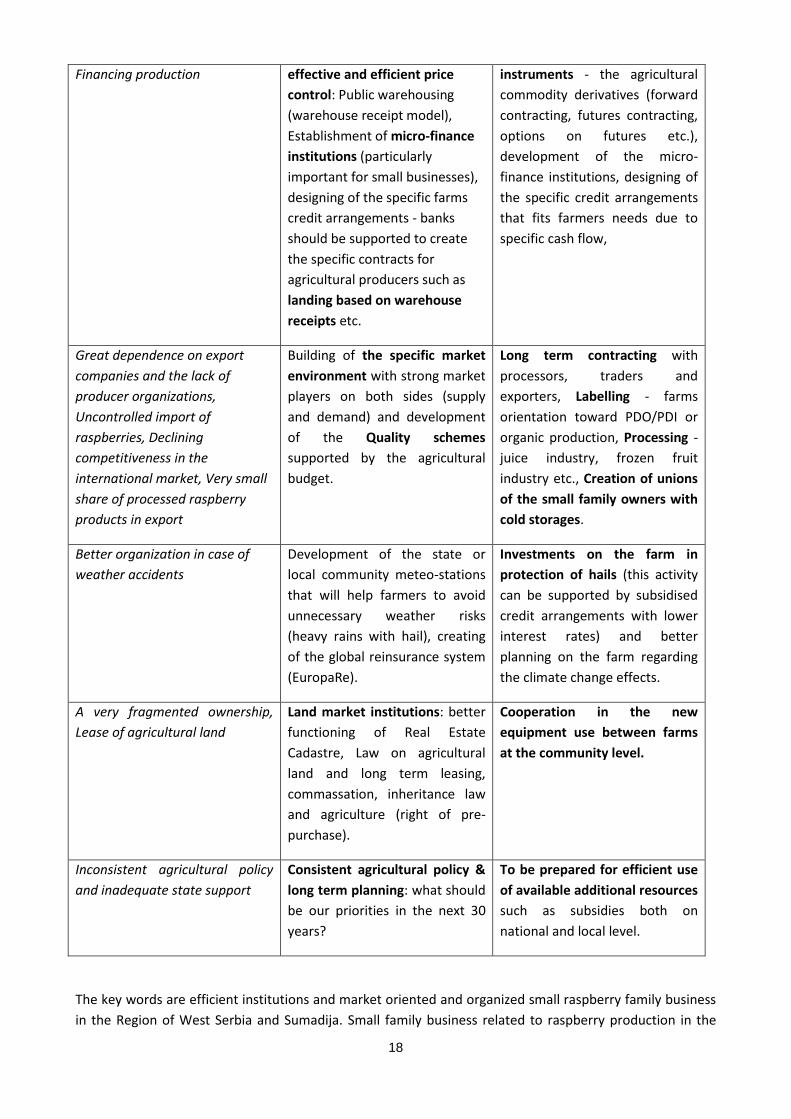
18
Financing production effective and efficient price
control: Public warehousing
(warehouse receipt model),
Establishment of micro-finance
institutions (particularly
important for small businesses),
designing of the specific farms
credit arrangements - banks
should be supported to create
the specific contracts for
agricultural producers such as
landing based on warehouse
receipts etc.
instruments - the agricultural
commodity derivatives (forward
contracting, futures contracting,
options on futures etc.),
development of the micro-
finance institutions, designing of
the specific credit arrangements
that fits farmers needs due to
specific cash flow,
Great dependence on export
companies and the lack of
producer organizations,
Uncontrolled import of
raspberries, Declining
competitiveness in the
international market, Very small
share of processed raspberry
products in export
Building of the specific market
environment with strong market
players on both sides (supply
and demand) and development
of the Quality schemes
supported by the agricultural
budget.
Long term contracting with
processors, traders and
exporters, Labelling - farms
orientation toward PDO/PDI or
organic production, Processing -
juice industry, frozen fruit
industry etc., Creation of unions
of the small family owners with
cold storages.
Better organization in case of
weather accidents
Development of the state or
local community meteo-stations
that will help farmers to avoid
unnecessary weather risks
(heavy rains with hail), creating
of the global reinsurance system
(EuropaRe).
Investments on the farm in
protection of hails (this activity
can be supported by subsidised
credit arrangements with lower
interest rates) and better
planning on the farm regarding
the climate change effects.
A very fragmented ownership,
Lease of agricultural land
Land market institutions: better
functioning of Real Estate
Cadastre, Law on agricultural
land and long term leasing,
commassation, inheritance law
and agriculture (right of pre-
purchase).
Cooperation in the new
equipment use between farms
at the community level.
Inconsistent agricultural policy
and inadequate state support
Consistent agricultural policy &
long term planning: what should
be our priorities in the next 30
years?
To be prepared for efficient use
of available additional resources
such as subsidies both on
national and local level.
The key words are efficient institutions and market oriented and organized small raspberry family business
in the Region of West Serbia and Sumadija. Small family business related to raspberry production in the
19
region is often organized in the form of part-time farming. This additionally aggravates the situation related
to traditional system transformation to a modern agribusiness. However, the transition process has
influenced the position of the Region of West Serbia and Sumadija inhabitants. Without permanent job
opportunity (many industrial capacities were closed due to its inefficiency, while the establishment of new
companies cannot absorb high unemployment rate), they turned more intensely on agricultural production,
production in which they have a long tradition. All stakeholders can benefit from the better organized food
chain, while agricultural producers can organize better functioning business on the farm if they use modern
risk management instruments. These instruments can help risk avoidance, minimizing of risk exposure and
cost on the farm, maximising input-output ratio both in terms of quality and quantity and securing the
better product price.
The survey results
The data collection was supported by the Municipality of Arilje. The face to face interviews were conducted
in December 2017 / January 2018. The sample size is 150 and the final database contains 131 responses (19
interviews were rejected due to extremely low level of understanding by respondents).
Based on total area, farms above 1 ha dominate in our sample. However, observing only area under
raspberry production, small family farms are more represented in the sample than others. Young farmers
represent a group slightly over a third of our sample. Traditional gender structure is manifested by larger
share of male population, while the share of lower secondary education level among farmers is almost 60%.
The average income per farm is 11,180 euro. The information about the cost of raspberry production is
collected as well, and the average share of cost in total income collected in raspberry production is 64.85%.
Average price was EUR 1.29 in the total sample of farms. Collective sale channels managed to reach higher
raspberry price of EUR 1.31 in comparison to individual ones price of EUR 1.29, on average. Most farmers
indicated (n=123) that the commodity price is variable and linked to market price at the time of delivery,
while a significant number of farms bases price on the quality of raspberry delivered (n=80).
Individual sale channel dominates the collective one. Collective arrangements are mainly used by larger,
commercial raspberry farms (2.84 ha with 1.24 ha for raspberries, on average). However, it is also
emphasized that collective arrangements are associated with more detailed and structured contracts in
favour of primary producers.
Our respondents highly agree with two statements – that there are no other alternatives to sell their
products and that the payments are made with significant delay. Farmers emphasize that traders are fully
in charge of price definition and contract specifications. Even farmers that use collective arrangements
report lower level of agreement with statements related to higher price achievement, stabile price and fair
negotiation. Generally, the level of satisfaction in both subsamples indicates that farmers are neither
satisfied / not unsatisfied with sale agreements. This also provides opportunities for further improvements
in the future.
Concerning the type of sale agreement, a legal contract before or during production is present in 49 cases,
followed by legal contract at the time of sale (n=3), and significant number of informal contracts, 47 before
or during the production and 23 at the time of sale. Most sales agreements are made either for particular
sale (n=49), or they last between 7 months and 1 year (n=51). Very short (up to 3 months) and very long
(above 5 years) contracts are rather limited in this sample.
20
Quality and food safety standards are dominantly imposed to both collective and individual sale channels.
Animal welfare is not mentioned at all, while standards related to preservation of nature and environment,
as well as standards related to mitigation and adaptation to climate change are recognized as relatively less
important.
Farmers perceived knowledge about overall production sustainability is very low. The lowest knowledge is
about the ecological aspects. The issues considering soil quality is the best known to producers, while the
biodiversity and the water quality maintenance are considered to be not so important. On the other side,
the farmers highly appreciate influence of the social network developing with other stakeholders and
farmers in the sector, and this influence is reported as the most important aspect of the social
sustainability. Younger producers perceive the most of the social, economic and environmental conditions
of the sales agreement sustainability more important than older producers, and more educated producers
are more conscious about ecological and environment conditions of the sustainability.
The most important factors that will influence farms business in the future, and consequently their
sustainability, are related to climate change and market conditions, while the least influence on the future
farms sustainability will have institutional regulations. The surveyed farmers reported the dominant
intention to maintain production. The majority of farmers don’t have specific expectations regarding farm
succession. The rural areas in Serbia are depopulation areas and the rural population is continuously
shrinking. Consequently, because of the bad age structure the demographic perspective of the rural areas is
not bright (low or even negative natural increase rate). In such situation, the farmers do not have any clear
future plans. If we take into account the answers “don’t know” within the analysis, there are more than 4/5
of the sample that are not willing to think about the future plans at all. However, farmers don’t consider
selling of property as the valid solution.
21
2 Introduction
Two cases were selected for in-depth analysis at the national level: Wheat sector in Vojvodina and
Raspberry sector in Sumadija and West Serbia Region. Behind this choice stands a crucial effort to isolate
the essential problems of commercially-oriented and market-integrated producers of wheat in Vojvodina.
Additionally, our efforts were also put on the analysis of the main issues faced by the system of family
farming in central Serbia (Raspberry Case Study - CS). Both sectors have specific challenges and inherent
characteristics. Both sectors have specific challenges and inherent characteristics that may be useful in
further generalization of the conclusions regarding available strategies related to avoiding and control of
different forms of financial risks in agriculture today.
In the first phase an analysis of various sources (policy documents and strategies, scientific articles, as well
as public media and blogs) was performed. This analysis provides a general overview of both conditions and
limitations that agricultural producers are exposed to, and gives the first indication of applied strategies
aiming to control different sources of risks in agricultural practice. The aim of this document is to show the
state regulation and policy towards the agricultural sector in general and to analyse the extent to which
public policy creates more favourable conditions for agribusiness development in a changing environment.
3 Media Content Analysis - a short review
Transition to the market economy and improvement of business strategies are generally based on the
harmonization with the EU legislation and practice. Serbia is a small open economy, and agricultural sector
risks and strategies are influenced by the broader conditions present at the global level.
The performed analysis clearly shows that concepts and strategies applied in the practice are generally
based on low risk awareness of agricultural producers and less developed individual risk control strategies
based on the self-controlling practices. Instead, producers are trying to "share the risk with the
state/government" or to address the main issues of risk control and sustainability to "the responsible policy
maker" (both at the local and national level) and agricultural and rural policy measures applied in the
practice. According to the media analysis, following approaches are applied in the practice:
(1) Traditional approach comprising of measures directly applied in the farm practices:
Diversification on the farm- definition of wider scope of products produced at the farm. Recently,
the strategy took in importance particularly if we have in mind environmental protecting policy
context: Steady planting of wheat and other winter crops occurred since winter crops suffered
almost no damage from the extreme drought of the previous years and even experienced higher
yields;
Rural economy diversification - implementation of complementary activities of rural economy at
the local level, such as tourism, trade and processing.
(2) "The old story" - producers are still waiting for the strong state support, both in direct and indirect ways
(role of the agricultural subsidies and market institutions):
The agricultural policy in Serbia is not governed properly as the policy measures are changing from
the period to period, mainly depending on the policy decision makers.
22
However, strong support to the development of the new risk control instruments / agricultural
insurance and price hedging based on the derivative instruments is evident aiming at building of
market institutions that could help agricultural producers to cope with wide range of risks.
(3) Agricultural and rural development policy measures applied at the local level are oriented toward
improvement of management quality and skills (training, education and innovations).
The main findings directly related to the agricultural policy and regulatory environment, as well as to the
market conditions, connected with selected sectors and products, are listed below.
Regulation and Policy: Basic subsidies for plant production - the minimum subsidy for plant production is
around 50 Euro per ha. According to the rulebook, this type of subsidy could be claimed once a year and it
applied to all plant species. Subsidies for investments in agriculture, including the subsidies for new
perennial fruit with a view to improving competitiveness and achieving quality standards - the aim of
this subsidy was to improve the competitiveness of agricultural producers in primary production and
processing. The subsidies amounted to 30 % of the investment value, 45 % in areas with difficult farming
conditions. The maximum amount a beneficiary could receive was 2 million RSD, with defined
minimum amounts relative to cost (soil preparation and planting, chemical and mechanical analysis of soil).
The subsidies for investments in primary agricultural production covered the following: procuring
new mechanisation and equipment for primary agricultural production and investing in raising the
yield and the quality of crops. Investments in fruit sector included subsidies on the programmes
focusing on new intensive plantations using contemporary fruit growing technology with trellises,
and soil preparation for new plantations. In addition to the costs, subsidised land areas were also
limited. Berry fruit of 0.3-5 ha were subsidised. The maximum amount per subsidy was 2 million RSD,
except the case of building cold storages (5 million RSD).
Inputs: The input subsidy on fuel granted producers purchasing for production inputs, calculated per litre of
purchased fuel. Registered farms were entitled to 120 litres of fuel per hectare, at 50 RSD per litre of
fuel (provided if they had met legal requirements).
Finance and risk management: Input subsidy on the crop production insurance premiums - the total input
subsidy was 40 % of the paid insurance premium. Subsidies for investments in agriculture with a view to
improving competitiveness and achieving quality standards - the aim of this subsidy was to improve
the competitiveness of agricultural producers in primary production and processing. Investments -
analyses show unfavourable agricultural credit conditions, which are not in accordance with its role and its
importance for the sector development. Main obstacles to a higher use of loans are seen as follows: the
instability and uncertainty of the agricultural and food production, unsafe placement of unknown prices of
agricultural crops in the torque delivery and inconsistent agricultural policy measures. Other factors add to
the limiting factor for greater investments in agriculture and a low rate of return of agricultural production,
which is limited by low yields, low productivity, and price disparity. It is necessary to introduce coordinated
activities of all state authorities, which would allow the reduction of the political, institutional and financial
risks. Therefore, existing mechanisms for micro and macro agricultural finance in Serbia are not adequate
and should be changed.
Socio-demographic: Coping with farming decline: ageing and farmer's renewal and position of the young
farmers.
Ecological: Subsidies for sustainable rural development are achieved through subsidies for organic
production and on plant and animal genetic resource preservation. The subsidies for organic production are
paid for organic plant production and input subsidies on fuel for organic production. These subsidies are
23
40 % higher than those for conventional production. They were intended for producers whose
production was undergoing conversion, for producers who have finalised conversion and were in the
process of certification. The relevance of climate change is also important topic discussed at scientific,
public and policy level.
Socio-Institutional: Input subsidies on the cost of storage in public warehouses were introduced to allow for
the full implementation of the Law on Public Warehouses for Agricultural Products and to allow
producers to sell their products at the most convenient moment while incurring the lowest possible
costs. The right to input subsidies on the cost of storage in public warehouses was granted for the
entire month as of the date of the stock record, or for maximum six months. The input was 40 % of
storage costs for up to 2,000 tons of stored wheat and/or maize (corn). Advisory and technical
services improvements in agriculture (scientific research, development and innovative projects in
agriculture through agricultural measures and actions, advanced professional training and upgrading
human resources).
Technological: The subsidies for improvement of the rural economy through introduction and
certification of systems for food safety and food quality, organic products and products with
geographical indication. The subsidies are envisaged as partial reimbursement of the cost of
introduction of and certification for internationally accepted standards such as ISO 22000, FSSC
22000, BRC, IFS and GOST-R. The cost of introduction and certification in accordance with the
GLOBAL G.A.P. standard and specific standards such as HALAL and KOSHER was also reimbursed.
Regarding creating added value for products, the aim was to encourage the certification of food
and agricultural products with geographical indication and certification of organic products.
Demand: Bakery companies at national level strongly support the sector development. They absorb more
than 50 % of total production and produce higher value added products both for the national and
international markets. Changes present in the area of health food production (whole grain products) might
influence the production structure in the future related to crop varieties. On the other side, raspberry is
high value added product with potential health improvement properties (good structure of antioxidance).
Broader context of media analysis was presented in a separate document (WP1 - TASK 1.1 - Subtask 1.1.3:
MEDIA CONTENT ANALYSIS). Market strategies of farmers are highly influenced by agricultural policy
measures aiming to create the adequate business environment and help farmers to avoid/control different
risks. The framework of policy applied in the practice in the chosen sectors in Serbia is analysed below. In
addition to the specific characteristics of the policy pursued in selected sectors, the general policy
framework was analysed first, giving the overview of the most important measures of agricultural support
applied in our practice. The period 2000-2015 is covered with a specific emphasize on current state support
to the agricultural sector development in Serbia.
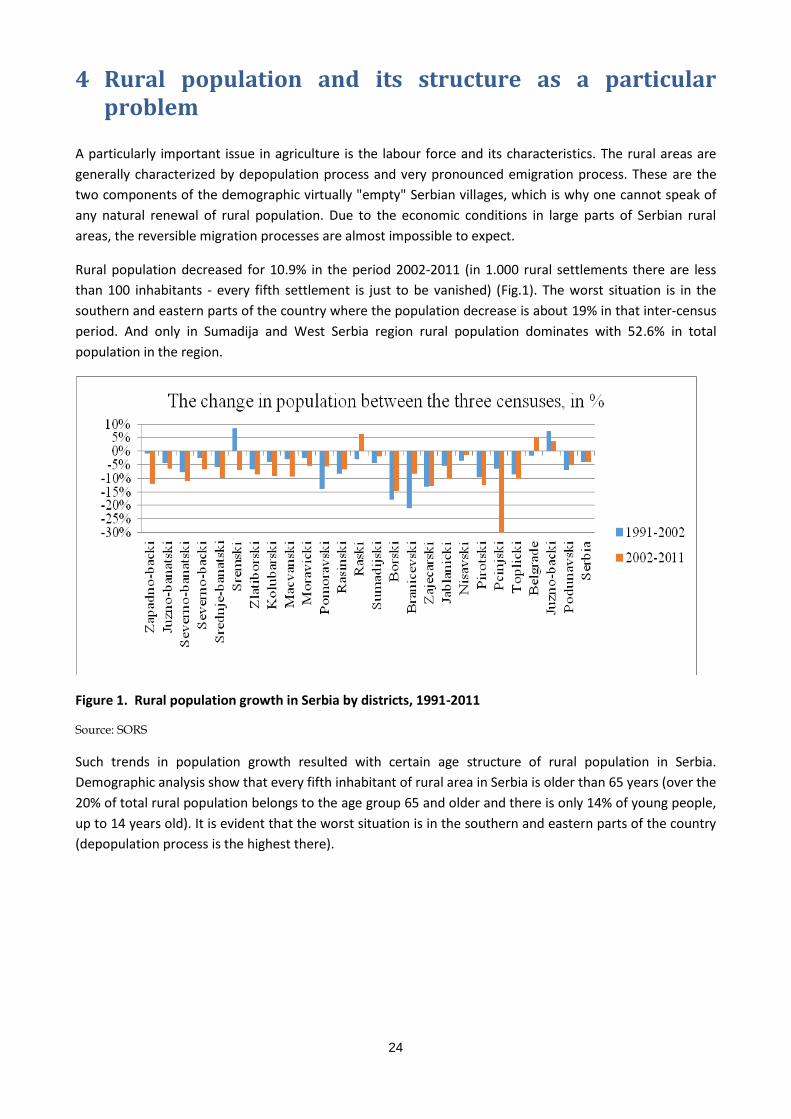
24
4 Rural population and its structure as a particular problem
A particularly important issue in agriculture is the labour force and its characteristics. The rural areas are
generally characterized by depopulation process and very pronounced emigration process. These are the
two components of the demographic virtually "empty" Serbian villages, which is why one cannot speak of
any natural renewal of rural population. Due to the economic conditions in large parts of Serbian rural
areas, the reversible migration processes are almost impossible to expect.
Rural population decreased for 10.9% in the period 2002-2011 (in 1.000 rural settlements there are less
than 100 inhabitants - every fifth settlement is just to be vanished) (Fig.1). The worst situation is in the
southern and eastern parts of the country where the population decrease is about 19% in that inter-census
period. And only in Sumadija and West Serbia region rural population dominates with 52.6% in total
population in the region.
Figure 1. Rural population growth in Serbia by districts, 1991-2011
Source: SORS
Such trends in population growth resulted with certain age structure of rural population in Serbia.
Demographic analysis show that every fifth inhabitant of rural area in Serbia is older than 65 years (over the
20% of total rural population belongs to the age group 65 and older and there is only 14% of young people,
up to 14 years old). It is evident that the worst situation is in the southern and eastern parts of the country
(depopulation process is the highest there).
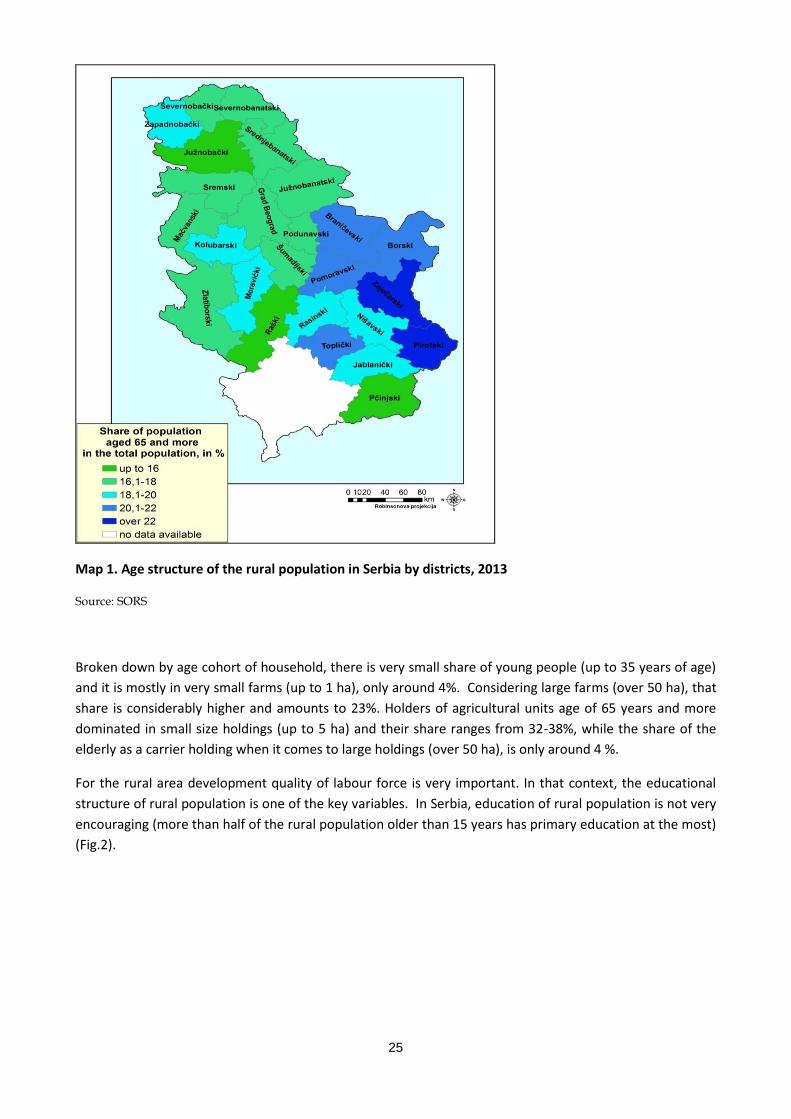
25
Map 1. Age structure of the rural population in Serbia by districts, 2013
Source: SORS
Broken down by age cohort of household, there is very small share of young people (up to 35 years of age)
and it is mostly in very small farms (up to 1 ha), only around 4%. Considering large farms (over 50 ha), that
share is considerably higher and amounts to 23%. Holders of agricultural units age of 65 years and more
dominated in small size holdings (up to 5 ha) and their share ranges from 32-38%, while the share of the
elderly as a carrier holding when it comes to large holdings (over 50 ha), is only around 4 %.
For the rural area development quality of labour force is very important. In that context, the educational
structure of rural population is one of the key variables. In Serbia, education of rural population is not very
encouraging (more than half of the rural population older than 15 years has primary education at the most)
(Fig.2).
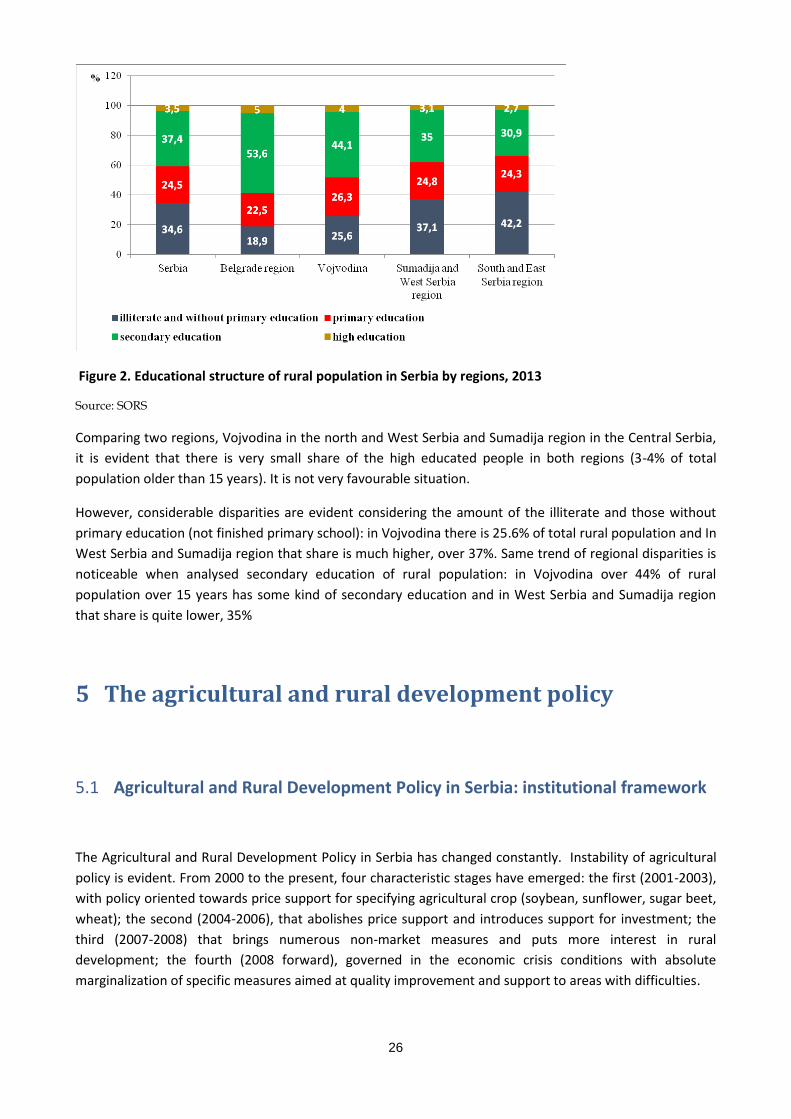
26
Figure 2. Educational structure of rural population in Serbia by regions, 2013
Source: SORS
Comparing two regions, Vojvodina in the north and West Serbia and Sumadija region in the Central Serbia,
it is evident that there is very small share of the high educated people in both regions (3-4% of total
population older than 15 years). It is not very favourable situation.
However, considerable disparities are evident considering the amount of the illiterate and those without
primary education (not finished primary school): in Vojvodina there is 25.6% of total rural population and In
West Serbia and Sumadija region that share is much higher, over 37%. Same trend of regional disparities is
noticeable when analysed secondary education of rural population: in Vojvodina over 44% of rural
population over 15 years has some kind of secondary education and in West Serbia and Sumadija region
that share is quite lower, 35%
5 The agricultural and rural development policy
5.1 Agricultural and Rural Development Policy in Serbia: institutional framework
The Agricultural and Rural Development Policy in Serbia has changed constantly. Instability of agricultural
policy is evident. From 2000 to the present, four characteristic stages have emerged: the first (2001-2003),
with policy oriented towards price support for specifying agricultural crop (soybean, sunflower, sugar beet,
wheat); the second (2004-2006), that abolishes price support and introduces support for investment; the
third (2007-2008) that brings numerous non-market measures and puts more interest in rural
development; the fourth (2008 forward), governed in the economic crisis conditions with absolute
marginalization of specific measures aimed at quality improvement and support to areas with difficulties.
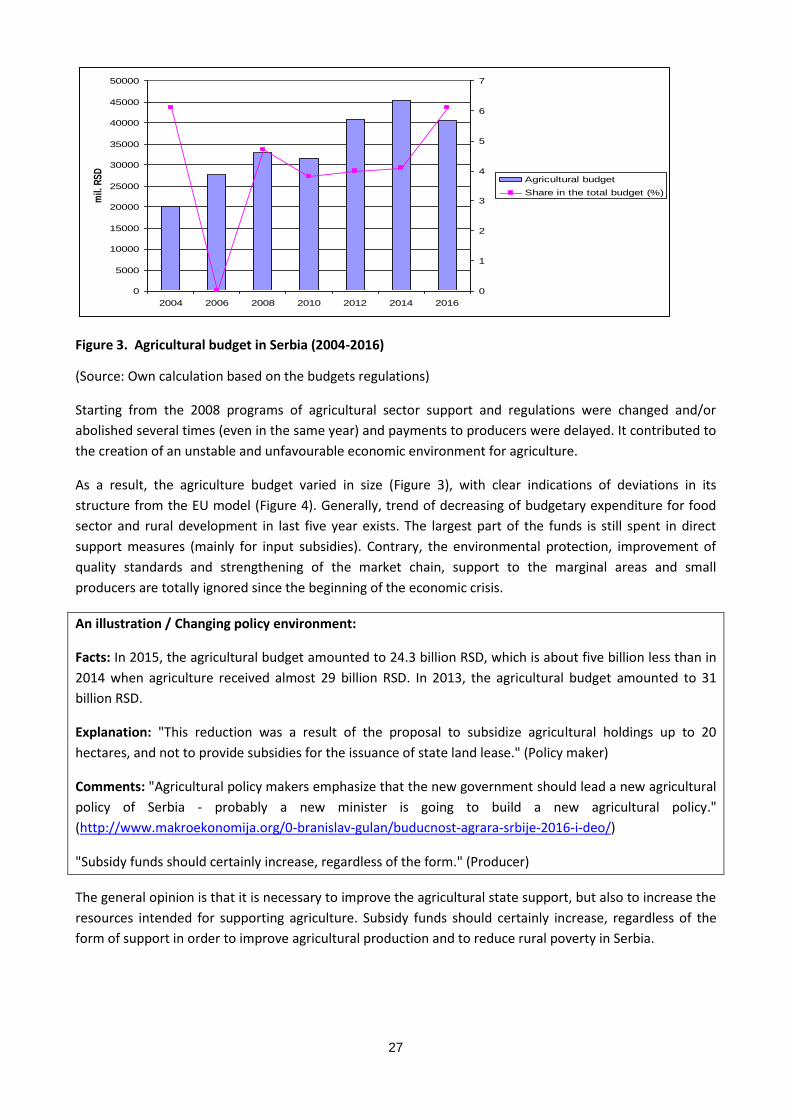
27
0
5000
10000
15000
20000
25000
30000
35000
40000
45000
50000
2004 2006 2008 2010 2012 2014 2016
mil.
RS
D
0
1
2
3
4
5
6
7
Agricultural budget
Share in the total budget (%)
Figure 3. Agricultural budget in Serbia (2004-2016)
(Source: Own calculation based on the budgets regulations)
Starting from the 2008 programs of agricultural sector support and regulations were changed and/or
abolished several times (even in the same year) and payments to producers were delayed. It contributed to
the creation of an unstable and unfavourable economic environment for agriculture.
As a result, the agriculture budget varied in size (Figure 3), with clear indications of deviations in its
structure from the EU model (Figure 4). Generally, trend of decreasing of budgetary expenditure for food
sector and rural development in last five year exists. The largest part of the funds is still spent in direct
support measures (mainly for input subsidies). Contrary, the environmental protection, improvement of
quality standards and strengthening of the market chain, support to the marginal areas and small
producers are totally ignored since the beginning of the economic crisis.
An illustration / Changing policy environment:
Facts: In 2015, the agricultural budget amounted to 24.3 billion RSD, which is about five billion less than in
2014 when agriculture received almost 29 billion RSD. In 2013, the agricultural budget amounted to 31
billion RSD.
Explanation: "This reduction was a result of the proposal to subsidize agricultural holdings up to 20
hectares, and not to provide subsidies for the issuance of state land lease." (Policy maker)
Comments: "Agricultural policy makers emphasize that the new government should lead a new agricultural
policy of Serbia - probably a new minister is going to build a new agricultural policy."
(http://www.makroekonomija.org/0-branislav-gulan/buducnost-agrara-srbije-2016-i-deo/)
"Subsidy funds should certainly increase, regardless of the form." (Producer)
The general opinion is that it is necessary to improve the agricultural state support, but also to increase the
resources intended for supporting agriculture. Subsidy funds should certainly increase, regardless of the
form of support in order to improve agricultural production and to reduce rural poverty in Serbia.
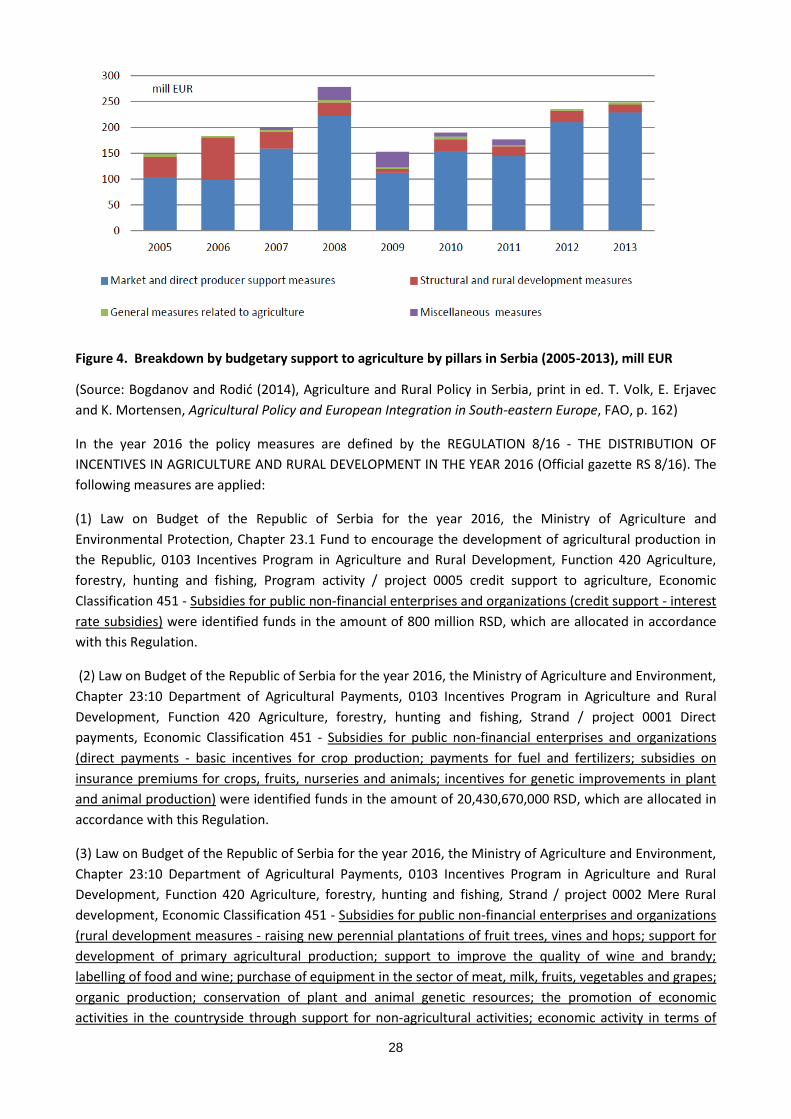
28
Figure 4. Breakdown by budgetary support to agriculture by pillars in Serbia (2005-2013), mill EUR
(Source: Bogdanov and Rodić (2014), Agriculture and Rural Policy in Serbia, print in ed. T. Volk, E. Erjavec
and K. Mortensen, Agricultural Policy and European Integration in South-eastern Europe, FAO, p. 162)
In the year 2016 the policy measures are defined by the REGULATION 8/16 - THE DISTRIBUTION OF
INCENTIVES IN AGRICULTURE AND RURAL DEVELOPMENT IN THE YEAR 2016 (Official gazette RS 8/16). The
following measures are applied:
(1) Law on Budget of the Republic of Serbia for the year 2016, the Ministry of Agriculture and
Environmental Protection, Chapter 23.1 Fund to encourage the development of agricultural production in
the Republic, 0103 Incentives Program in Agriculture and Rural Development, Function 420 Agriculture,
forestry, hunting and fishing, Program activity / project 0005 credit support to agriculture, Economic
Classification 451 - Subsidies for public non-financial enterprises and organizations (credit support - interest
rate subsidies) were identified funds in the amount of 800 million RSD, which are allocated in accordance
with this Regulation.
(2) Law on Budget of the Republic of Serbia for the year 2016, the Ministry of Agriculture and Environment,
Chapter 23:10 Department of Agricultural Payments, 0103 Incentives Program in Agriculture and Rural
Development, Function 420 Agriculture, forestry, hunting and fishing, Strand / project 0001 Direct
payments, Economic Classification 451 - Subsidies for public non-financial enterprises and organizations
(direct payments - basic incentives for crop production; payments for fuel and fertilizers; subsidies on
insurance premiums for crops, fruits, nurseries and animals; incentives for genetic improvements in plant
and animal production) were identified funds in the amount of 20,430,670,000 RSD, which are allocated in
accordance with this Regulation.
(3) Law on Budget of the Republic of Serbia for the year 2016, the Ministry of Agriculture and Environment,
Chapter 23:10 Department of Agricultural Payments, 0103 Incentives Program in Agriculture and Rural
Development, Function 420 Agriculture, forestry, hunting and fishing, Strand / project 0002 Mere Rural
development, Economic Classification 451 - Subsidies for public non-financial enterprises and organizations
(rural development measures - raising new perennial plantations of fruit trees, vines and hops; support for
development of primary agricultural production; support to improve the quality of wine and brandy;
labelling of food and wine; purchase of equipment in the sector of meat, milk, fruits, vegetables and grapes;
organic production; conservation of plant and animal genetic resources; the promotion of economic
activities in the countryside through support for non-agricultural activities; economic activity in terms of
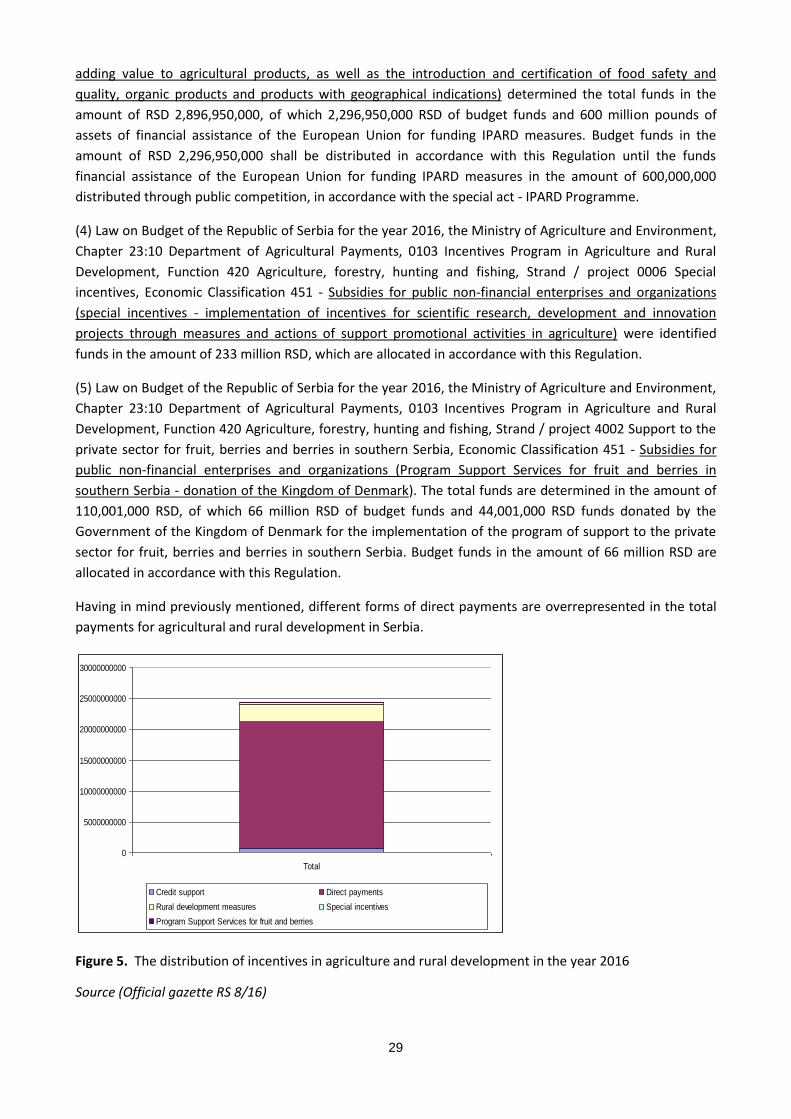
29
adding value to agricultural products, as well as the introduction and certification of food safety and
quality, organic products and products with geographical indications) determined the total funds in the
amount of RSD 2,896,950,000, of which 2,296,950,000 RSD of budget funds and 600 million pounds of
assets of financial assistance of the European Union for funding IPARD measures. Budget funds in the
amount of RSD 2,296,950,000 shall be distributed in accordance with this Regulation until the funds
financial assistance of the European Union for funding IPARD measures in the amount of 600,000,000
distributed through public competition, in accordance with the special act - IPARD Programme.
(4) Law on Budget of the Republic of Serbia for the year 2016, the Ministry of Agriculture and Environment,
Chapter 23:10 Department of Agricultural Payments, 0103 Incentives Program in Agriculture and Rural
Development, Function 420 Agriculture, forestry, hunting and fishing, Strand / project 0006 Special
incentives, Economic Classification 451 - Subsidies for public non-financial enterprises and organizations
(special incentives - implementation of incentives for scientific research, development and innovation
projects through measures and actions of support promotional activities in agriculture) were identified
funds in the amount of 233 million RSD, which are allocated in accordance with this Regulation.
(5) Law on Budget of the Republic of Serbia for the year 2016, the Ministry of Agriculture and Environment,
Chapter 23:10 Department of Agricultural Payments, 0103 Incentives Program in Agriculture and Rural
Development, Function 420 Agriculture, forestry, hunting and fishing, Strand / project 4002 Support to the
private sector for fruit, berries and berries in southern Serbia, Economic Classification 451 - Subsidies for
public non-financial enterprises and organizations (Program Support Services for fruit and berries in
southern Serbia - donation of the Kingdom of Denmark). The total funds are determined in the amount of
110,001,000 RSD, of which 66 million RSD of budget funds and 44,001,000 RSD funds donated by the
Government of the Kingdom of Denmark for the implementation of the program of support to the private
sector for fruit, berries and berries in southern Serbia. Budget funds in the amount of 66 million RSD are
allocated in accordance with this Regulation.
Having in mind previously mentioned, different forms of direct payments are overrepresented in the total
payments for agricultural and rural development in Serbia.
0
5000000000
10000000000
15000000000
20000000000
25000000000
30000000000
Total
Credit support Direct payments
Rural development measures Special incentives
Program Support Services for fruit and berries
Figure 5. The distribution of incentives in agriculture and rural development in the year 2016
Source (Official gazette RS 8/16)
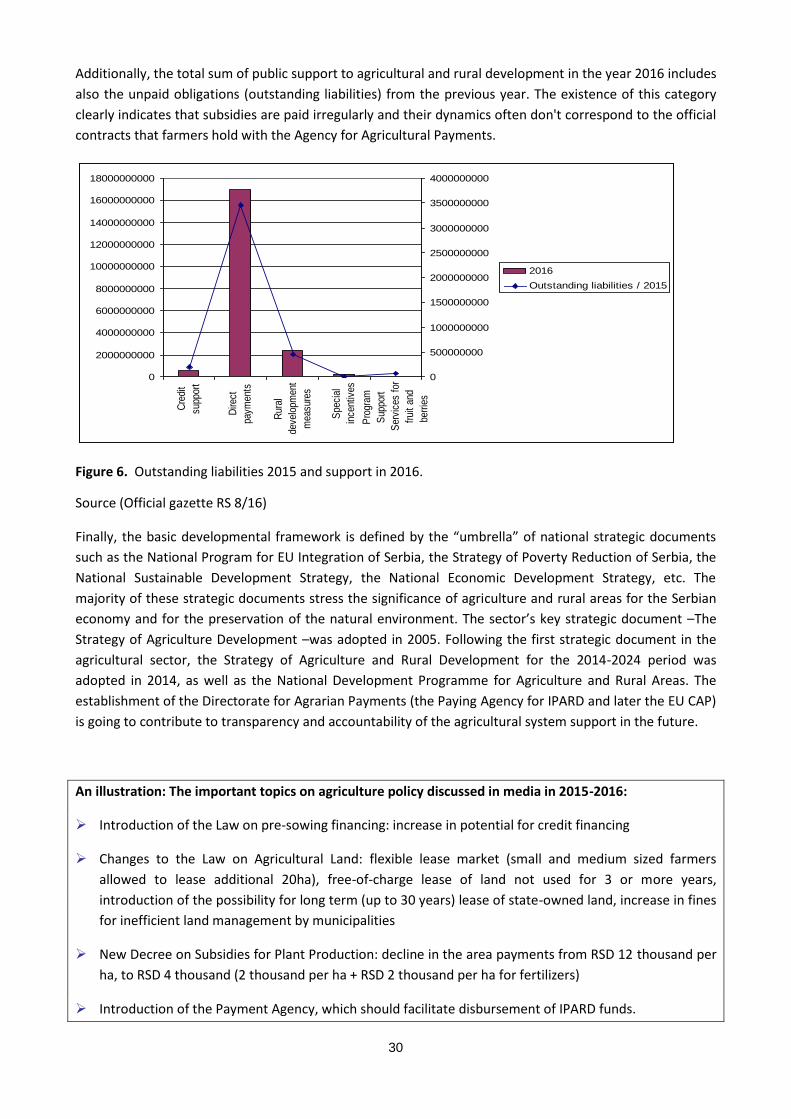
30
Additionally, the total sum of public support to agricultural and rural development in the year 2016 includes
also the unpaid obligations (outstanding liabilities) from the previous year. The existence of this category
clearly indicates that subsidies are paid irregularly and their dynamics often don't correspond to the official
contracts that farmers hold with the Agency for Agricultural Payments.
0
2000000000
4000000000
6000000000
8000000000
10000000000
12000000000
14000000000
16000000000
18000000000C
redi
t
supp
ort
Dire
ct
paym
ents
Rur
al
deve
lopm
ent
mea
sure
s
Spe
cial
ince
ntiv
es
Pro
gram
Sup
port
Ser
vice
s fo
r
frui
t an
d
berr
ies
0
500000000
1000000000
1500000000
2000000000
2500000000
3000000000
3500000000
4000000000
2016
Outstanding liabilities / 2015
Figure 6. Outstanding liabilities 2015 and support in 2016.
Source (Official gazette RS 8/16)
Finally, the basic developmental framework is defined by the “umbrella” of national strategic documents
such as the National Program for EU Integration of Serbia, the Strategy of Poverty Reduction of Serbia, the
National Sustainable Development Strategy, the National Economic Development Strategy, etc. The
majority of these strategic documents stress the significance of agriculture and rural areas for the Serbian
economy and for the preservation of the natural environment. The sector’s key strategic document –The
Strategy of Agriculture Development –was adopted in 2005. Following the first strategic document in the
agricultural sector, the Strategy of Agriculture and Rural Development for the 2014-2024 period was
adopted in 2014, as well as the National Development Programme for Agriculture and Rural Areas. The
establishment of the Directorate for Agrarian Payments (the Paying Agency for IPARD and later the EU CAP)
is going to contribute to transparency and accountability of the agricultural system support in the future.
An illustration: The important topics on agriculture policy discussed in media in 2015-2016:
Introduction of the Law on pre-sowing financing: increase in potential for credit financing
Changes to the Law on Agricultural Land: flexible lease market (small and medium sized farmers
allowed to lease additional 20ha), free-of-charge lease of land not used for 3 or more years,
introduction of the possibility for long term (up to 30 years) lease of state-owned land, increase in fines
for inefficient land management by municipalities
New Decree on Subsidies for Plant Production: decline in the area payments from RSD 12 thousand per
ha, to RSD 4 thousand (2 thousand per ha + RSD 2 thousand per ha for fertilizers)
Introduction of the Payment Agency, which should facilitate disbursement of IPARD funds.
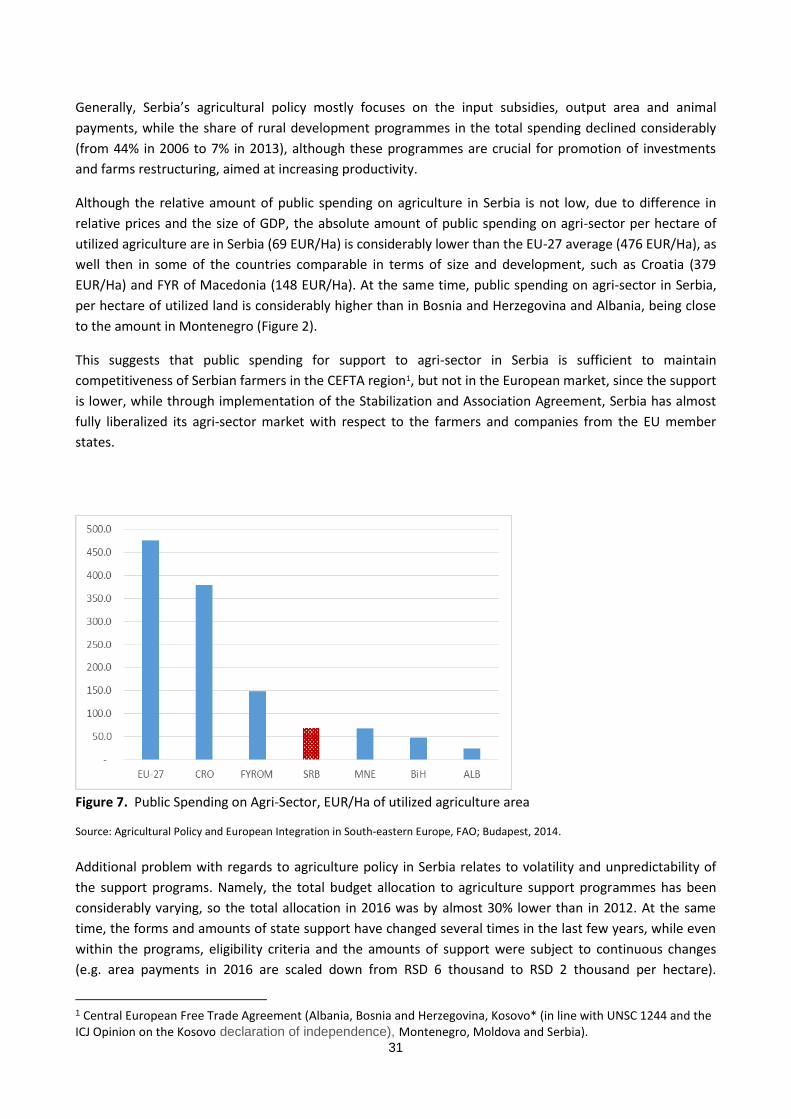
31
Generally, Serbia’s agricultural policy mostly focuses on the input subsidies, output area and animal
payments, while the share of rural development programmes in the total spending declined considerably
(from 44% in 2006 to 7% in 2013), although these programmes are crucial for promotion of investments
and farms restructuring, aimed at increasing productivity.
Although the relative amount of public spending on agriculture in Serbia is not low, due to difference in
relative prices and the size of GDP, the absolute amount of public spending on agri-sector per hectare of
utilized agriculture are in Serbia (69 EUR/Ha) is considerably lower than the EU-27 average (476 EUR/Ha), as
well then in some of the countries comparable in terms of size and development, such as Croatia (379
EUR/Ha) and FYR of Macedonia (148 EUR/Ha). At the same time, public spending on agri-sector in Serbia,
per hectare of utilized land is considerably higher than in Bosnia and Herzegovina and Albania, being close
to the amount in Montenegro (Figure 2).
This suggests that public spending for support to agri-sector in Serbia is sufficient to maintain
competitiveness of Serbian farmers in the CEFTA region1, but not in the European market, since the support
is lower, while through implementation of the Stabilization and Association Agreement, Serbia has almost
fully liberalized its agri-sector market with respect to the farmers and companies from the EU member
states.
Figure 7. Public Spending on Agri-Sector, EUR/Ha of utilized agriculture area
Source: Agricultural Policy and European Integration in South-eastern Europe, FAO; Budapest, 2014.
Additional problem with regards to agriculture policy in Serbia relates to volatility and unpredictability of
the support programs. Namely, the total budget allocation to agriculture support programmes has been
considerably varying, so the total allocation in 2016 was by almost 30% lower than in 2012. At the same
time, the forms and amounts of state support have changed several times in the last few years, while even
within the programs, eligibility criteria and the amounts of support were subject to continuous changes
(e.g. area payments in 2016 are scaled down from RSD 6 thousand to RSD 2 thousand per hectare).
1 Central European Free Trade Agreement (Albania, Bosnia and Herzegovina, Kosovo* (in line with UNSC 1244 and the ICJ Opinion on the Kosovo declaration of independence), Montenegro, Moldova and Serbia).
32
Frequent changes to the agri-sector support programmes have negative implications on long-term planning
and investments in farms and food processing.
In addition to the issue with the total amount of support and its volatility, Serbia’s state support scheme to
agriculture features has unfavourable structure. Namely, the area and animal payments account for 60% of
total spending, input subsidies take 20%, producer subsidies - 15%, while the spending on general services
related to extensions, research, animal breeding, plant and animal health, soil fertility control and border
control, account for only 1-2% of the total spending. This suggests that the structure of the agri-sector
support scheme is not designed in productivity-enhancing manner, since almost 80% of the support (area
and animal payments and input subsidies) “reward” extensive use of inputs, instead of promoting their
productive use.
Performances of state support schemes for agri-sector in Serbia are also affected by the design and
efficiency of the administrative process related to application for funds and their allocation. For instance,
the Farm Payment Agency (FPA) is still lacking the capacities for efficient registration and processing of
large number of applications. In addition, some households are crowded out by the eligibility criteria for
registration with the FPA (which have been changed several times in the past) – e.g. access to rural
households is available only to farmers with the age below 65, at the same time being conditional on full
payment of contributions to the Pension Fund, although many farmers do not participate in the pension
insurance scheme.
5.2 Agricultural policy in Serbia: impact of the EU accession process
Approximately 40% of the Acquis Communitaire relates to agriculture, rural development and related
topics, which is why the related programmes account for the large share of the EU budget. Therefore, EU
accession process has a considerable impact on the agriculture policy of the country striving to join the EU.
In that respect, negotiations on the Chapter 11 (Agriculture and rural development), Chapter 12 (Fishery)
and Chapter 13 (Food safety), shall trigger substantial reforms in terms of: i) legal reform aimed at
harmonization with the Common Agriculture Policy (CAP), especially with regards to direct payments,
common market, rural development and financial rules; ii) Development of implementation capacities,
which implies reform of the institutions in charge for implementation, and in some cases formation of the
new institutions; iii) Economic reforms aimed at improving competitiveness of the agriculture and food
processing chain, and improving the capacities of rural households to earn alternative income.
Through the EU accession process the future member state is preparing to be able to implement all the CAP
elements after joining the EU, which means that the country may opt/negotiate on the speed of
harmonization before the formal accession occurs.
In order to facilitate the reform of agriculture policies and its harmonization with the CAP, the EU provides
Instruments for Pre-Accession Rural Development (IPARD) funds to the pre-accession countries, which is a
direct way of influence of the EU accession process on the agriculture sector in Serbia. Country’s
performance in terms of implementation of the IPARD program is at the same time perceived as the test
for its capabilities to undertake all obligations and comply with the CAP. Main objectives of the IPARD
programmes are:
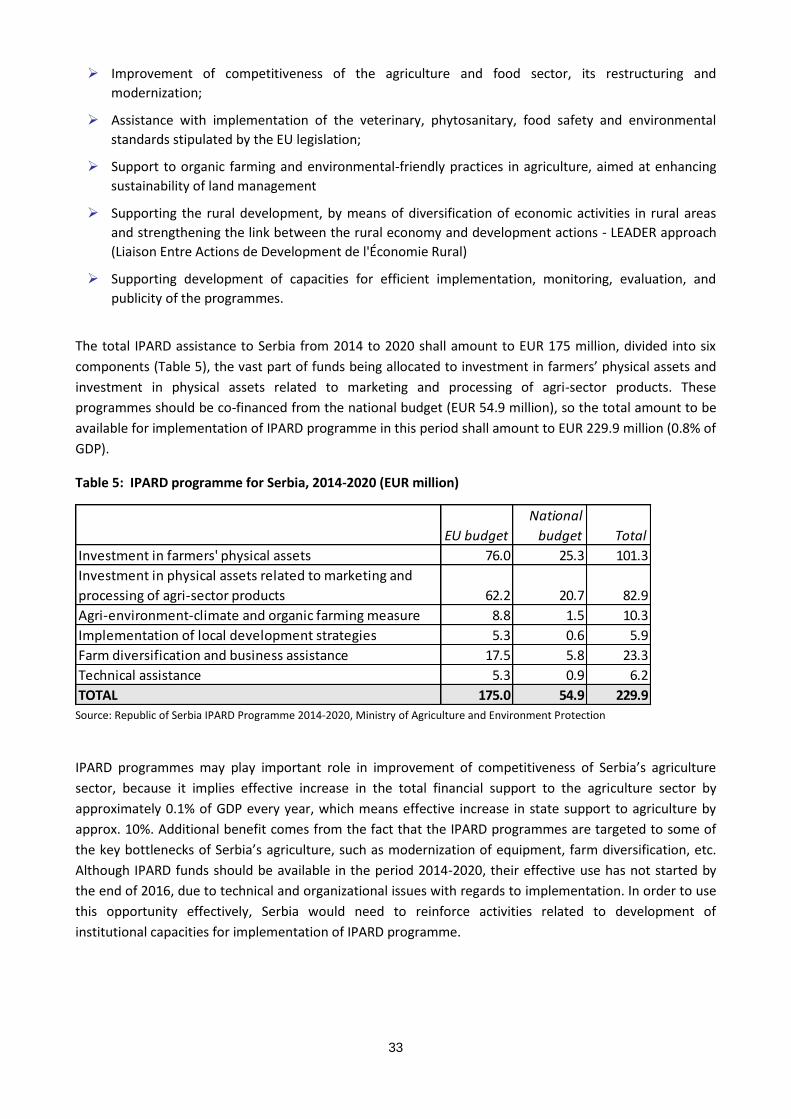
33
Improvement of competitiveness of the agriculture and food sector, its restructuring and
modernization;
Assistance with implementation of the veterinary, phytosanitary, food safety and environmental
standards stipulated by the EU legislation;
Support to organic farming and environmental-friendly practices in agriculture, aimed at enhancing
sustainability of land management
Supporting the rural development, by means of diversification of economic activities in rural areas
and strengthening the link between the rural economy and development actions - LEADER approach
(Liaison Entre Actions de Development de l'Économie Rural)
Supporting development of capacities for efficient implementation, monitoring, evaluation, and
publicity of the programmes.
The total IPARD assistance to Serbia from 2014 to 2020 shall amount to EUR 175 million, divided into six
components (Table 5), the vast part of funds being allocated to investment in farmers’ physical assets and
investment in physical assets related to marketing and processing of agri-sector products. These
programmes should be co-financed from the national budget (EUR 54.9 million), so the total amount to be
available for implementation of IPARD programme in this period shall amount to EUR 229.9 million (0.8% of
GDP).
Table 5: IPARD programme for Serbia, 2014-2020 (EUR million)
EU budget
National
budget Total
Investment in farmers' physical assets 76.0 25.3 101.3
Investment in physical assets related to marketing and
processing of agri-sector products 62.2 20.7 82.9
Agri-environment-climate and organic farming measure 8.8 1.5 10.3
Implementation of local development strategies 5.3 0.6 5.9
Farm diversification and business assistance 17.5 5.8 23.3
Technical assistance 5.3 0.9 6.2
TOTAL 175.0 54.9 229.9 Source: Republic of Serbia IPARD Programme 2014-2020, Ministry of Agriculture and Environment Protection
IPARD programmes may play important role in improvement of competitiveness of Serbia’s agriculture
sector, because it implies effective increase in the total financial support to the agriculture sector by
approximately 0.1% of GDP every year, which means effective increase in state support to agriculture by
approx. 10%. Additional benefit comes from the fact that the IPARD programmes are targeted to some of
the key bottlenecks of Serbia’s agriculture, such as modernization of equipment, farm diversification, etc.
Although IPARD funds should be available in the period 2014-2020, their effective use has not started by
the end of 2016, due to technical and organizational issues with regards to implementation. In order to use
this opportunity effectively, Serbia would need to reinforce activities related to development of
institutional capacities for implementation of IPARD programme.
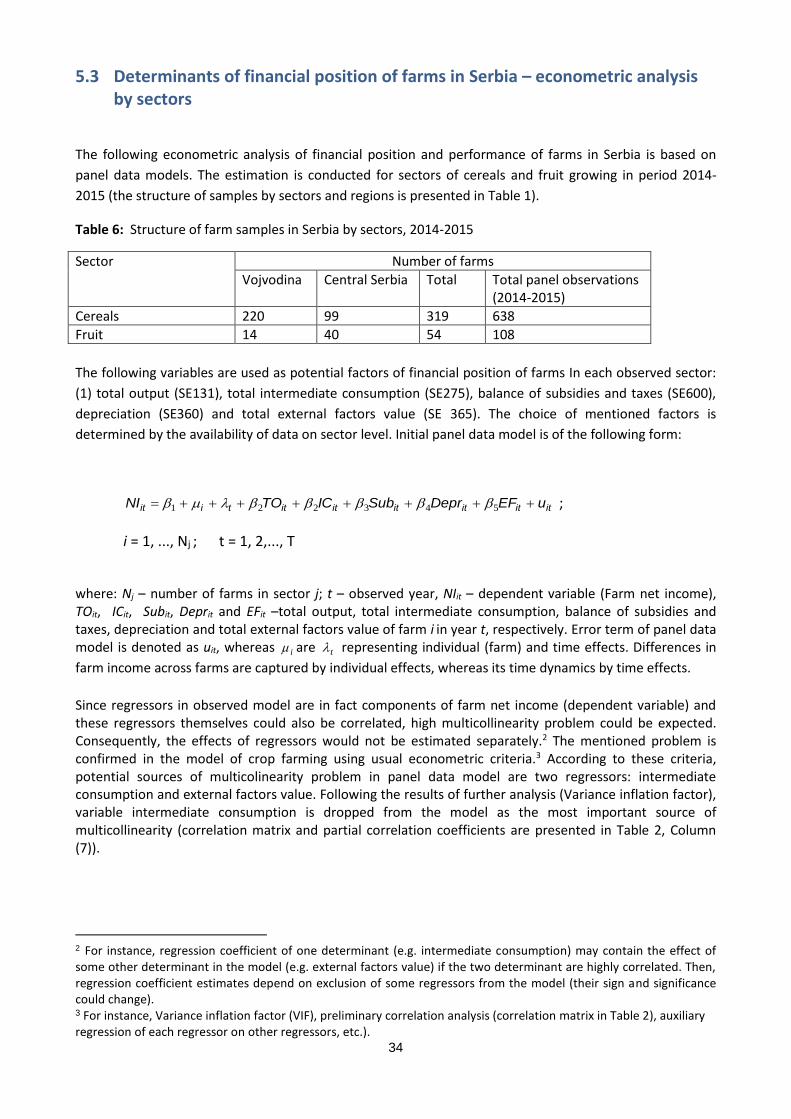
34
5.3 Determinants of financial position of farms in Serbia – econometric analysis by sectors
The following econometric analysis of financial position and performance of farms in Serbia is based on
panel data models. The estimation is conducted for sectors of cereals and fruit growing in period 2014-
2015 (the structure of samples by sectors and regions is presented in Table 1).
Table 6: Structure of farm samples in Serbia by sectors, 2014-2015
Sector Number of farms
Vojvodina Central Serbia Total Total panel observations (2014-2015)
Cereals 220 99 319 638
Fruit 14 40 54 108
The following variables are used as potential factors of financial position of farms In each observed sector:
(1) total output (SE131), total intermediate consumption (SE275), balance of subsidies and taxes (SE600),
depreciation (SE360) and total external factors value (SE 365). The choice of mentioned factors is
determined by the availability of data on sector level. Initial panel data model is of the following form:
itititititittiit uEFDeprSubICTONI 543221 ;
i = 1, ..., Nј ; t = 1, 2,..., T
where: Nј – number of farms in sector ј; t – observed year, NIit – dependent variable (Farm net income), TOit, ICit, Subit, Deprit and EFit –total output, total intermediate consumption, balance of subsidies and taxes, depreciation and total external factors value of farm i in year t, respectively. Error term of panel data model is denoted as uit, whereas i are t representing individual (farm) and time effects. Differences in
farm income across farms are captured by individual effects, whereas its time dynamics by time effects.
Since regressors in observed model are in fact components of farm net income (dependent variable) and these regressors themselves could also be correlated, high multicollinearity problem could be expected. Consequently, the effects of regressors would not be estimated separately.2 The mentioned problem is confirmed in the model of crop farming using usual econometric criteria.3 According to these criteria, potential sources of multicolinearity problem in panel data model are two regressors: intermediate consumption and external factors value. Following the results of further analysis (Variance inflation factor), variable intermediate consumption is dropped from the model as the most important source of multicollinearity (correlation matrix and partial correlation coefficients are presented in Table 2, Column (7)).
2 For instance, regression coefficient of one determinant (e.g. intermediate consumption) may contain the effect of some other determinant in the model (e.g. external factors value) if the two determinant are highly correlated. Then, regression coefficient estimates depend on exclusion of some regressors from the model (their sign and significance could change). 3 For instance, Variance inflation factor (VIF), preliminary correlation analysis (correlation matrix in Table 2), auxiliary regression of each regressor on other regressors, etc.).
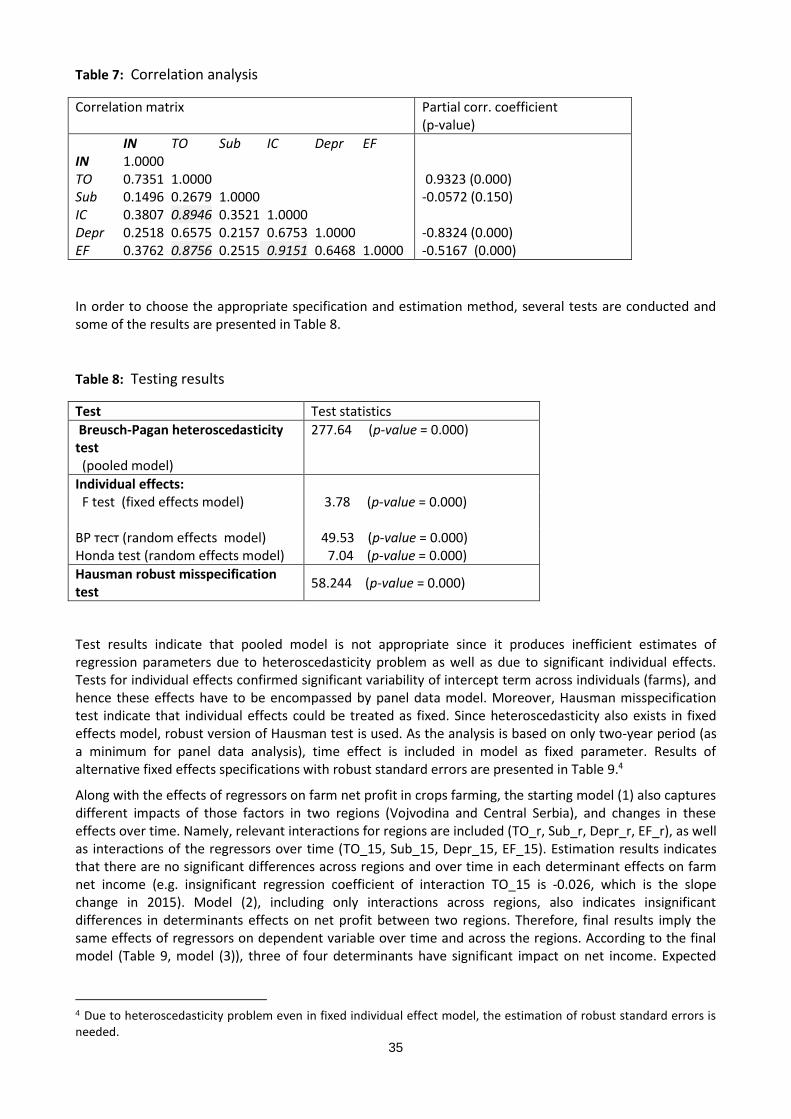
35
Table 7: Correlation analysis
Correlation matrix Partial corr. coefficient (p-value)
IN TO Sub IC Depr EF IN 1.0000 TO 0.7351 1.0000 Sub 0.1496 0.2679 1.0000 IC 0.3807 0.8946 0.3521 1.0000 Depr 0.2518 0.6575 0.2157 0.6753 1.0000 EF 0.3762 0.8756 0.2515 0.9151 0.6468 1.0000
0.9323 (0.000) -0.0572 (0.150) -0.8324 (0.000) -0.5167 (0.000)
In order to choose the appropriate specification and estimation method, several tests are conducted and some of the results are presented in Table 8.
Table 8: Testing results
Test Test statistics
Breusch-Pagan heteroscedasticity test (pooled model)
277.64 (p-value = 0.000)
Individual effects: F test (fixed effects model)
3.78 (p-value = 0.000)
BP тест (random effects model) Honda test (random effects model)
49.53 (p-value = 0.000) 7.04 (p-value = 0.000)
Hausman robust misspecification test
58.244 (p-value = 0.000)
Test results indicate that pooled model is not appropriate since it produces inefficient estimates of regression parameters due to heteroscedasticity problem as well as due to significant individual effects. Tests for individual effects confirmed significant variability of intercept term across individuals (farms), and hence these effects have to be encompassed by panel data model. Moreover, Hausman misspecification test indicate that individual effects could be treated as fixed. Since heteroscedasticity also exists in fixed effects model, robust version of Hausman test is used. As the analysis is based on only two-year period (as a minimum for panel data analysis), time effect is included in model as fixed parameter. Results of alternative fixed effects specifications with robust standard errors are presented in Table 9.4
Along with the effects of regressors on farm net profit in crops farming, the starting model (1) also captures different impacts of those factors in two regions (Vojvodina and Central Serbia), and changes in these effects over time. Namely, relevant interactions for regions are included (TO_r, Sub_r, Depr_r, EF_r), as well as interactions of the regressors over time (TO_15, Sub_15, Depr_15, EF_15). Estimation results indicates that there are no significant differences across regions and over time in each determinant effects on farm net income (e.g. insignificant regression coefficient of interaction TO_15 is -0.026, which is the slope change in 2015). Model (2), including only interactions across regions, also indicates insignificant differences in determinants effects on net profit between two regions. Therefore, final results imply the same effects of regressors on dependent variable over time and across the regions. According to the final model (Table 9, model (3)), three of four determinants have significant impact on net income. Expected
4 Due to heteroscedasticity problem even in fixed individual effect model, the estimation of robust standard errors is needed.
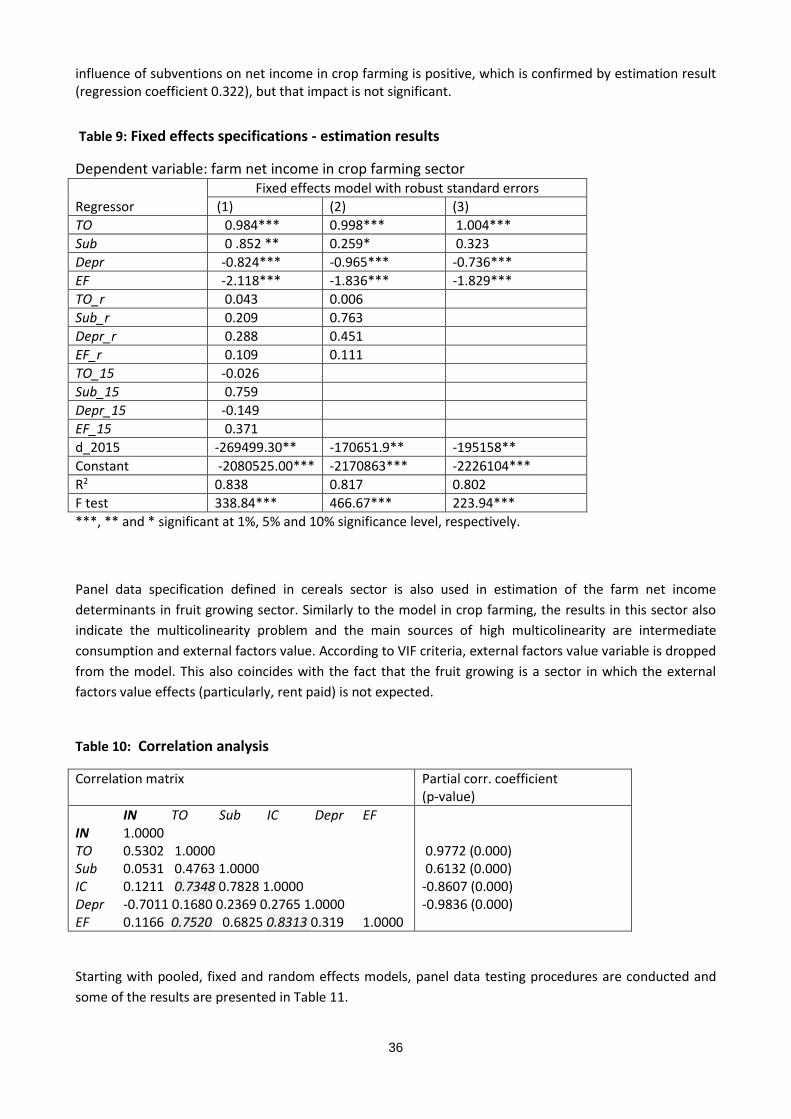
36
influence of subventions on net income in crop farming is positive, which is confirmed by estimation result (regression coefficient 0.322), but that impact is not significant.
Table 9: Fixed effects specifications - estimation results
Dependent variable: farm net income in crop farming sector Fixed effects model with robust standard errors
Regressor (1) (2) (3)
TO 0.984*** 0.998*** 1.004***
Sub 0 .852 ** 0.259* 0.323
Depr -0.824*** -0.965*** -0.736***
EF -2.118*** -1.836*** -1.829***
TO_r 0.043 0.006
Sub_r 0.209 0.763
Depr_r 0.288 0.451
EF_r 0.109 0.111
TO_15 -0.026
Sub_15 0.759
Depr_15 -0.149
EF_15 0.371
d_2015 -269499.30** -170651.9** -195158**
Constant -2080525.00*** -2170863*** -2226104***
R2 0.838 0.817 0.802
F test 338.84*** 466.67*** 223.94***
***, ** and * significant at 1%, 5% and 10% significance level, respectively.
Panel data specification defined in cereals sector is also used in estimation of the farm net income
determinants in fruit growing sector. Similarly to the model in crop farming, the results in this sector also
indicate the multicolinearity problem and the main sources of high multicolinearity are intermediate
consumption and external factors value. According to VIF criteria, external factors value variable is dropped
from the model. This also coincides with the fact that the fruit growing is a sector in which the external
factors value effects (particularly, rent paid) is not expected.
Table 10: Correlation analysis
Correlation matrix Partial corr. coefficient (p-value)
IN TO Sub IC Depr EF IN 1.0000 TO 0.5302 1.0000 Sub 0.0531 0.4763 1.0000 IC 0.1211 0.7348 0.7828 1.0000 Depr -0.7011 0.1680 0.2369 0.2765 1.0000 EF 0.1166 0.7520 0.6825 0.8313 0.319 1.0000
0.9772 (0.000) 0.6132 (0.000) -0.8607 (0.000) -0.9836 (0.000)
Starting with pooled, fixed and random effects models, panel data testing procedures are conducted and
some of the results are presented in Table 11.
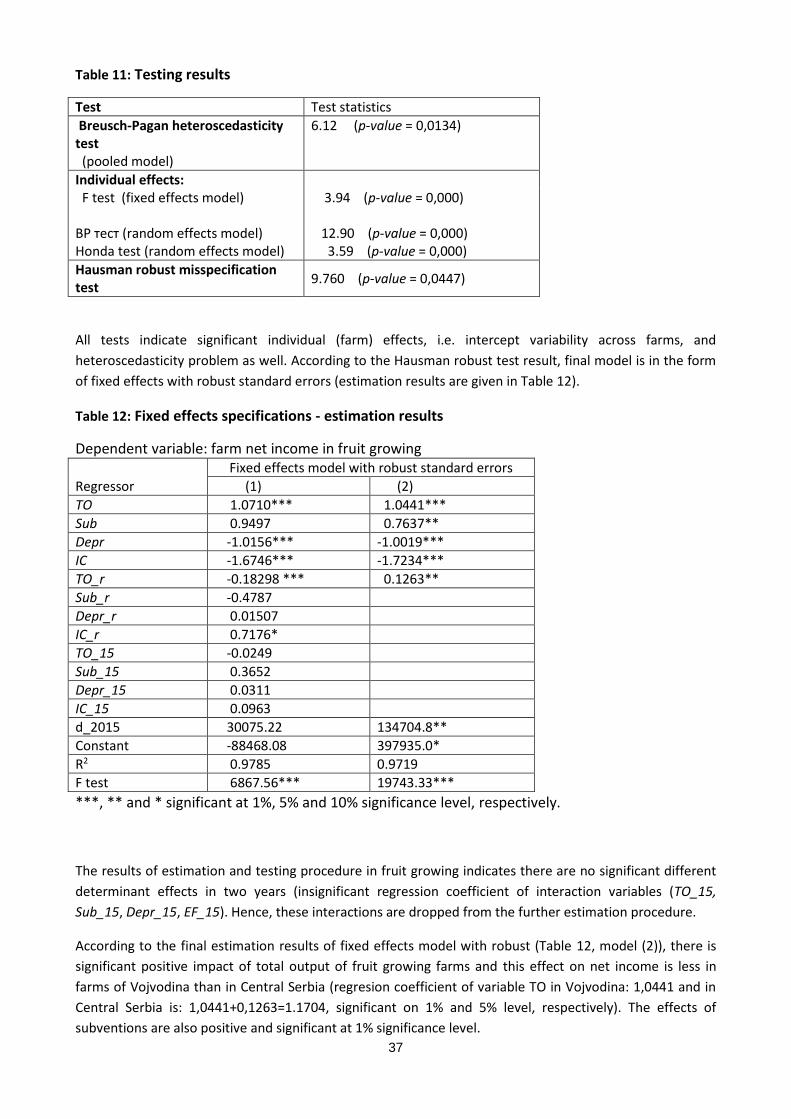
37
Table 11: Testing results
Test Test statistics
Breusch-Pagan heteroscedasticity test (pooled model)
6.12 (p-value = 0,0134)
Individual effects: F test (fixed effects model)
3.94 (p-value = 0,000)
BP тест (random effects model) Honda test (random effects model)
12.90 (p-value = 0,000) 3.59 (p-value = 0,000)
Hausman robust misspecification test
9.760 (p-value = 0,0447)
All tests indicate significant individual (farm) effects, i.e. intercept variability across farms, and
heteroscedasticity problem as well. According to the Hausman robust test result, final model is in the form
of fixed effects with robust standard errors (estimation results are given in Table 12).
Table 12: Fixed effects specifications - estimation results
Dependent variable: farm net income in fruit growing Fixed effects model with robust standard errors
Regressor (1) (2)
TO 1.0710*** 1.0441***
Sub 0.9497 0.7637**
Depr -1.0156*** -1.0019***
IC -1.6746*** -1.7234***
TO_r -0.18298 *** 0.1263**
Sub_r -0.4787
Depr_r 0.01507
IC_r 0.7176*
TO_15 -0.0249
Sub_15 0.3652
Depr_15 0.0311
IC_15 0.0963
d_2015 30075.22 134704.8**
Constant -88468.08 397935.0*
R2 0.9785 0.9719
F test 6867.56*** 19743.33***
***, ** and * significant at 1%, 5% and 10% significance level, respectively.
The results of estimation and testing procedure in fruit growing indicates there are no significant different
determinant effects in two years (insignificant regression coefficient of interaction variables (TO_15,
Sub_15, Depr_15, EF_15). Hence, these interactions are dropped from the further estimation procedure.
According to the final estimation results of fixed effects model with robust (Table 12, model (2)), there is
significant positive impact of total output of fruit growing farms and this effect on net income is less in
farms of Vojvodina than in Central Serbia (regresion coefficient of variable TO in Vojvodina: 1,0441 and in
Central Serbia is: 1,0441+0,1263=1.1704, significant on 1% and 5% level, respectively). The effects of
subventions are also positive and significant at 1% significance level.
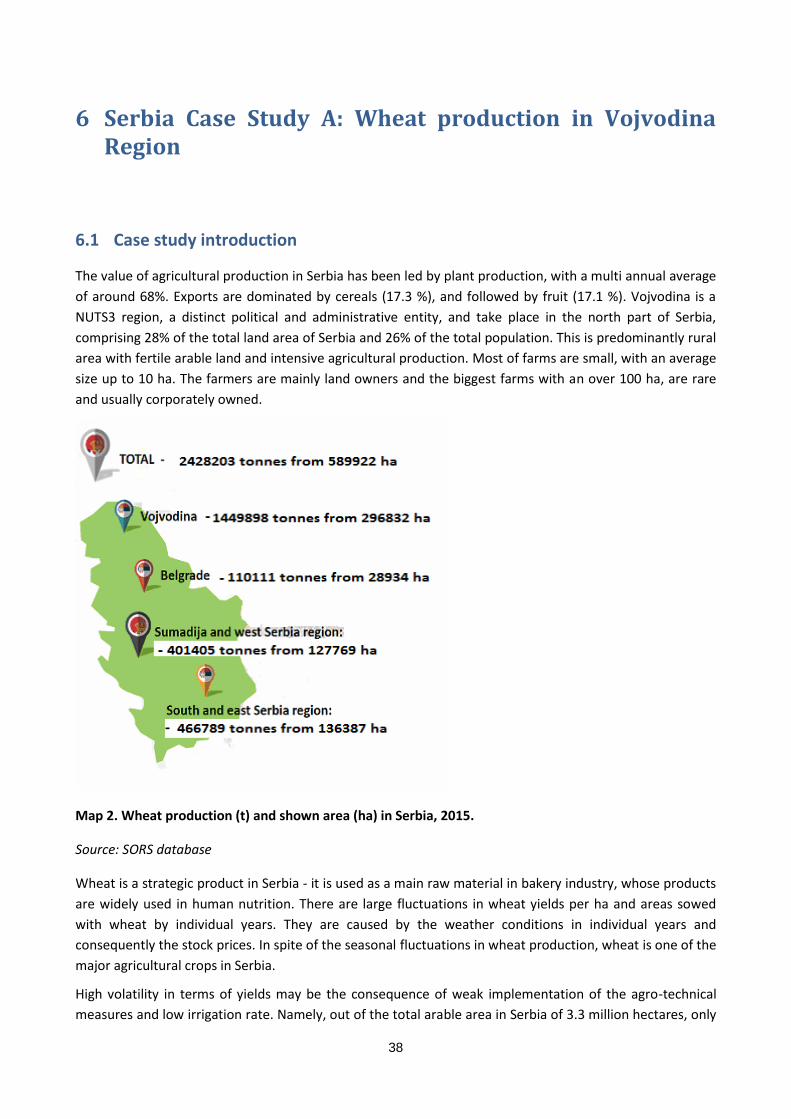
38
6 Serbia Case Study A: Wheat production in Vojvodina Region
6.1 Case study introduction
The value of agricultural production in Serbia has been led by plant production, with a multi annual average
of around 68%. Exports are dominated by cereals (17.3 %), and followed by fruit (17.1 %). Vojvodina is a
NUTS3 region, a distinct political and administrative entity, and take place in the north part of Serbia,
comprising 28% of the total land area of Serbia and 26% of the total population. This is predominantly rural
area with fertile arable land and intensive agricultural production. Most of farms are small, with an average
size up to 10 ha. The farmers are mainly land owners and the biggest farms with an over 100 ha, are rare
and usually corporately owned.
Map 2. Wheat production (t) and shown area (ha) in Serbia, 2015.
Source: SORS database
Wheat is a strategic product in Serbia - it is used as a main raw material in bakery industry, whose products
are widely used in human nutrition. There are large fluctuations in wheat yields per ha and areas sowed
with wheat by individual years. They are caused by the weather conditions in individual years and
consequently the stock prices. In spite of the seasonal fluctuations in wheat production, wheat is one of the
major agricultural crops in Serbia.
High volatility in terms of yields may be the consequence of weak implementation of the agro-technical
measures and low irrigation rate. Namely, out of the total arable area in Serbia of 3.3 million hectares, only
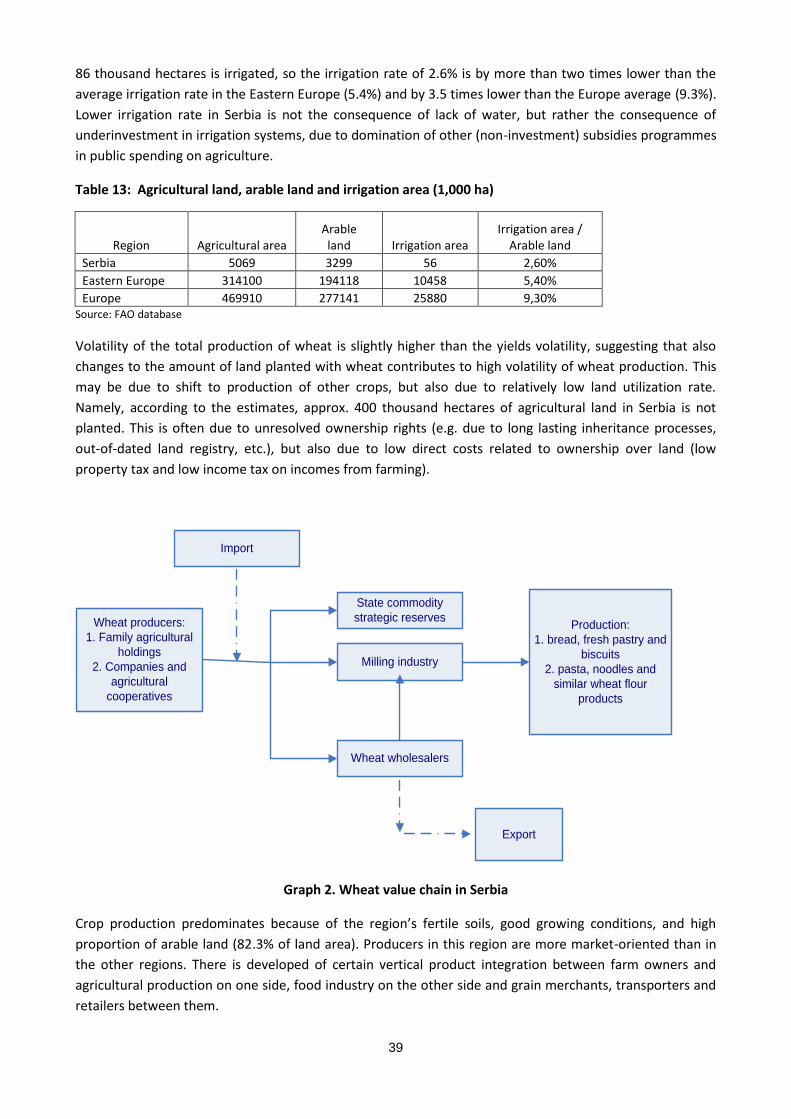
39
86 thousand hectares is irrigated, so the irrigation rate of 2.6% is by more than two times lower than the
average irrigation rate in the Eastern Europe (5.4%) and by 3.5 times lower than the Europe average (9.3%).
Lower irrigation rate in Serbia is not the consequence of lack of water, but rather the consequence of
underinvestment in irrigation systems, due to domination of other (non-investment) subsidies programmes
in public spending on agriculture.
Table 13: Agricultural land, arable land and irrigation area (1,000 ha)
Region Agricultural area Arable land Irrigation area
Irrigation area / Arable land
Serbia 5069 3299 56 2,60%
Eastern Europe 314100 194118 10458 5,40%
Europe 469910 277141 25880 9,30% Source: FAO database
Volatility of the total production of wheat is slightly higher than the yields volatility, suggesting that also
changes to the amount of land planted with wheat contributes to high volatility of wheat production. This
may be due to shift to production of other crops, but also due to relatively low land utilization rate.
Namely, according to the estimates, approx. 400 thousand hectares of agricultural land in Serbia is not
planted. This is often due to unresolved ownership rights (e.g. due to long lasting inheritance processes,
out-of-dated land registry, etc.), but also due to low direct costs related to ownership over land (low
property tax and low income tax on incomes from farming).
Wheat producers:
1. Family agricultural
holdings
2. Companies and
agricultural
cooperatives
State commodity
strategic reserves
Milling industry
Wheat wholesalers
Production:
1. bread, fresh pastry and
biscuits
2. pasta, noodles and
similar wheat flour
products
Import
Export
Graph 2. Wheat value chain in Serbia
Crop production predominates because of the region’s fertile soils, good growing conditions, and high
proportion of arable land (82.3% of land area). Producers in this region are more market-oriented than in
the other regions. There is developed of certain vertical product integration between farm owners and
agricultural production on one side, food industry on the other side and grain merchants, transporters and
retailers between them.
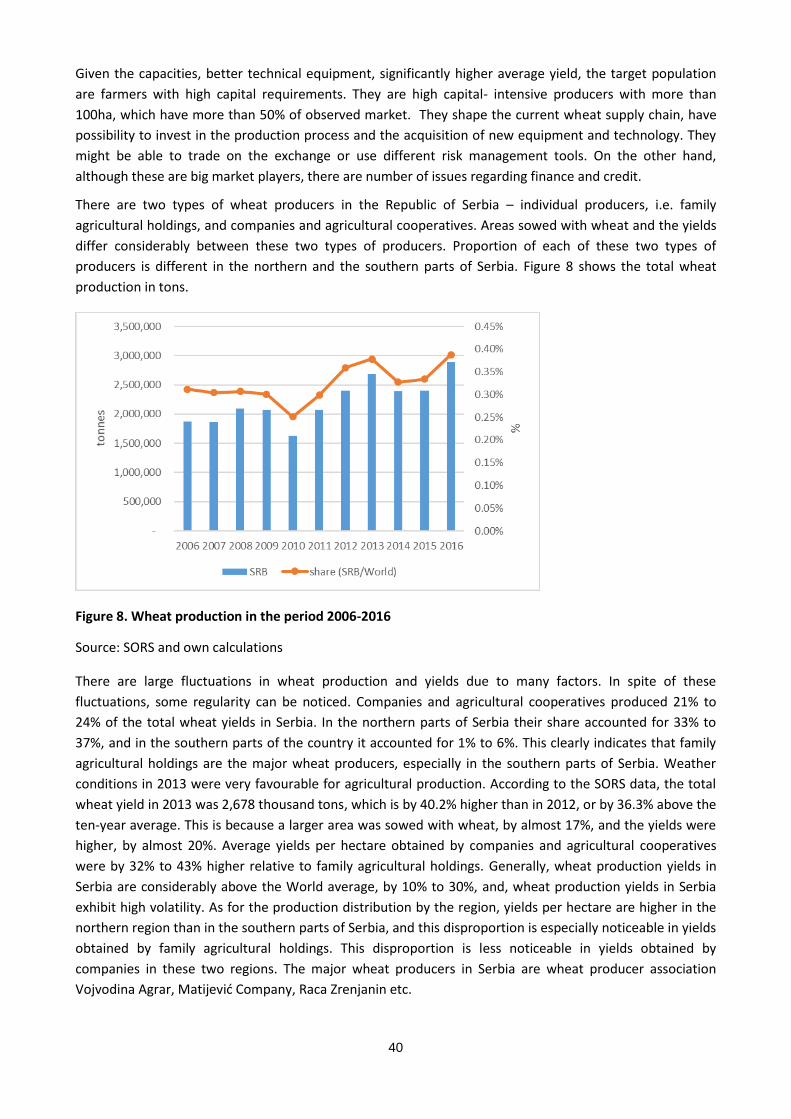
40
Given the capacities, better technical equipment, significantly higher average yield, the target population
are farmers with high capital requirements. They are high capital- intensive producers with more than
100ha, which have more than 50% of observed market. They shape the current wheat supply chain, have
possibility to invest in the production process and the acquisition of new equipment and technology. They
might be able to trade on the exchange or use different risk management tools. On the other hand,
although these are big market players, there are number of issues regarding finance and credit.
There are two types of wheat producers in the Republic of Serbia – individual producers, i.e. family
agricultural holdings, and companies and agricultural cooperatives. Areas sowed with wheat and the yields
differ considerably between these two types of producers. Proportion of each of these two types of
producers is different in the northern and the southern parts of Serbia. Figure 8 shows the total wheat
production in tons.
Figure 8. Wheat production in the period 2006-2016
Source: SORS and own calculations
There are large fluctuations in wheat production and yields due to many factors. In spite of these
fluctuations, some regularity can be noticed. Companies and agricultural cooperatives produced 21% to
24% of the total wheat yields in Serbia. In the northern parts of Serbia their share accounted for 33% to
37%, and in the southern parts of the country it accounted for 1% to 6%. This clearly indicates that family
agricultural holdings are the major wheat producers, especially in the southern parts of Serbia. Weather
conditions in 2013 were very favourable for agricultural production. According to the SORS data, the total
wheat yield in 2013 was 2,678 thousand tons, which is by 40.2% higher than in 2012, or by 36.3% above the
ten-year average. This is because a larger area was sowed with wheat, by almost 17%, and the yields were
higher, by almost 20%. Average yields per hectare obtained by companies and agricultural cooperatives
were by 32% to 43% higher relative to family agricultural holdings. Generally, wheat production yields in
Serbia are considerably above the World average, by 10% to 30%, and, wheat production yields in Serbia
exhibit high volatility. As for the production distribution by the region, yields per hectare are higher in the
northern region than in the southern parts of Serbia, and this disproportion is especially noticeable in yields
obtained by family agricultural holdings. This disproportion is less noticeable in yields obtained by
companies in these two regions. The major wheat producers in Serbia are wheat producer association
Vojvodina Agrar, Matijević Company, Raca Zrenjanin etc.
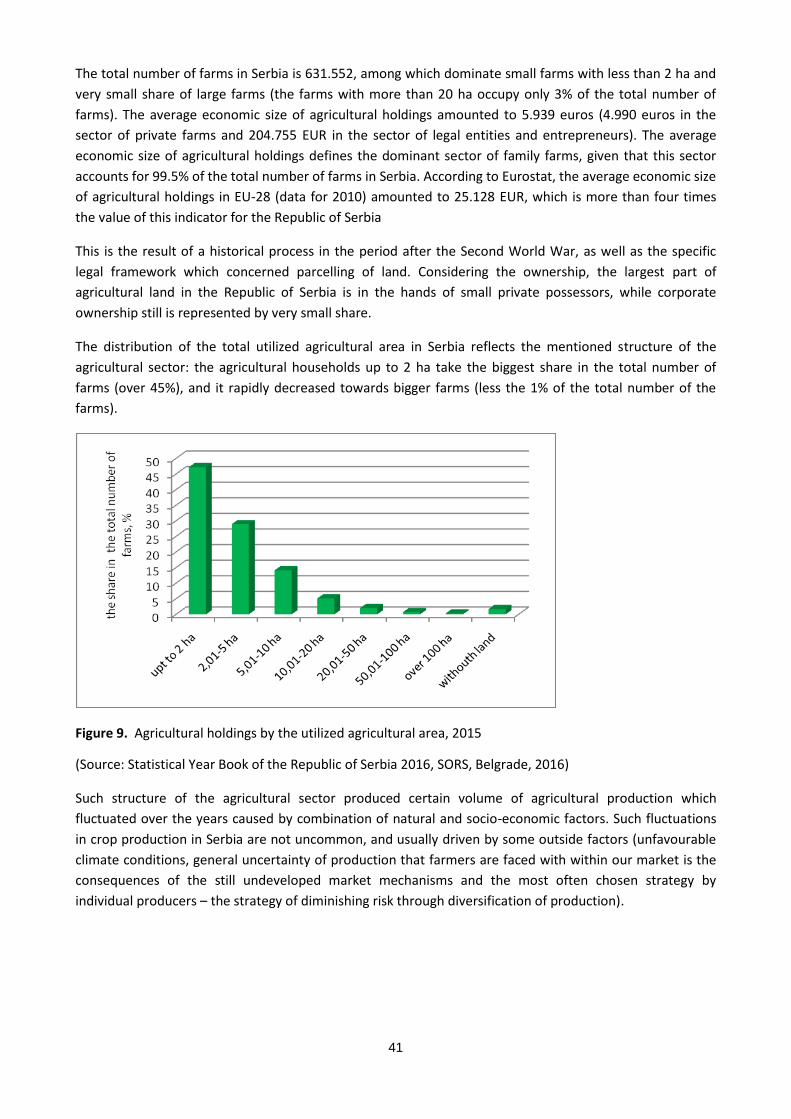
41
The total number of farms in Serbia is 631.552, among which dominate small farms with less than 2 ha and
very small share of large farms (the farms with more than 20 ha occupy only 3% of the total number of
farms). The average economic size of agricultural holdings amounted to 5.939 euros (4.990 euros in the
sector of private farms and 204.755 EUR in the sector of legal entities and entrepreneurs). The average
economic size of agricultural holdings defines the dominant sector of family farms, given that this sector
accounts for 99.5% of the total number of farms in Serbia. According to Eurostat, the average economic size
of agricultural holdings in EU-28 (data for 2010) amounted to 25.128 EUR, which is more than four times
the value of this indicator for the Republic of Serbia
This is the result of a historical process in the period after the Second World War, as well as the specific
legal framework which concerned parcelling of land. Considering the ownership, the largest part of
agricultural land in the Republic of Serbia is in the hands of small private possessors, while corporate
ownership still is represented by very small share.
The distribution of the total utilized agricultural area in Serbia reflects the mentioned structure of the
agricultural sector: the agricultural households up to 2 ha take the biggest share in the total number of
farms (over 45%), and it rapidly decreased towards bigger farms (less the 1% of the total number of the
farms).
Figure 9. Agricultural holdings by the utilized agricultural area, 2015
(Source: Statistical Year Book of the Republic of Serbia 2016, SORS, Belgrade, 2016)
Such structure of the agricultural sector produced certain volume of agricultural production which
fluctuated over the years caused by combination of natural and socio-economic factors. Such fluctuations
in crop production in Serbia are not uncommon, and usually driven by some outside factors (unfavourable
climate conditions, general uncertainty of production that farmers are faced with within our market is the
consequences of the still undeveloped market mechanisms and the most often chosen strategy by
individual producers – the strategy of diminishing risk through diversification of production).
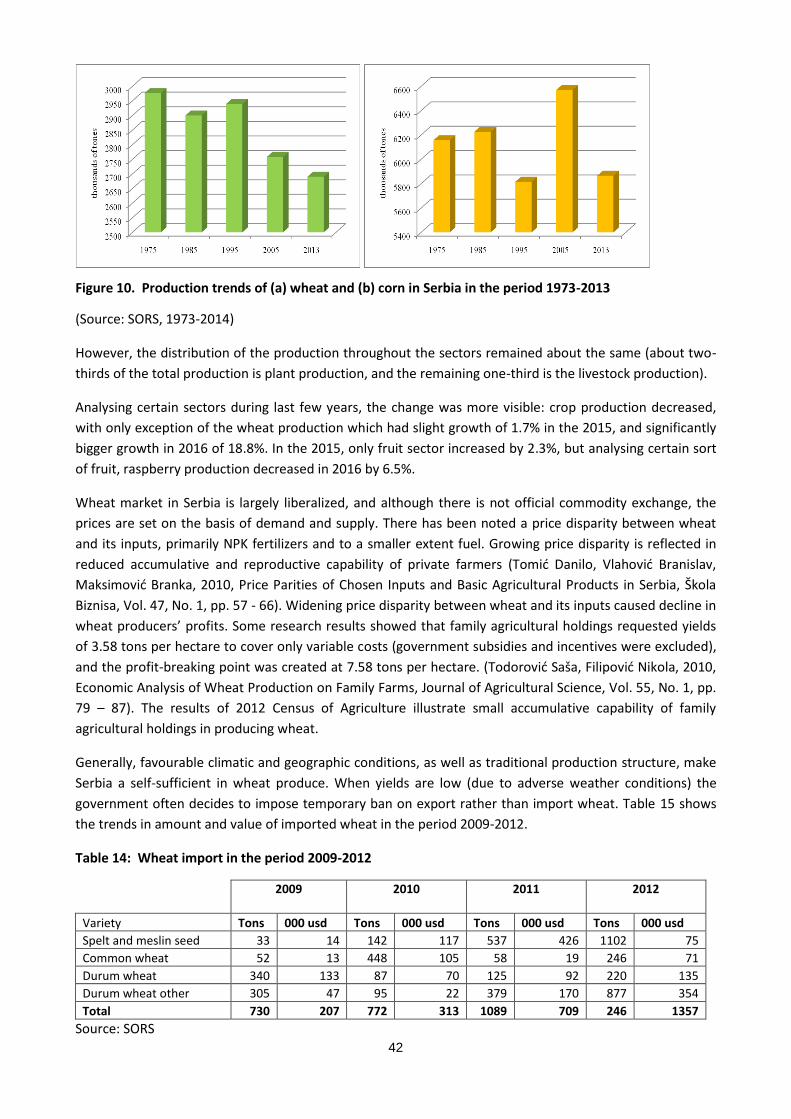
42
Figure 10. Production trends of (a) wheat and (b) corn in Serbia in the period 1973-2013
(Source: SORS, 1973-2014)
However, the distribution of the production throughout the sectors remained about the same (about two-
thirds of the total production is plant production, and the remaining one-third is the livestock production).
Analysing certain sectors during last few years, the change was more visible: crop production decreased,
with only exception of the wheat production which had slight growth of 1.7% in the 2015, and significantly
bigger growth in 2016 of 18.8%. In the 2015, only fruit sector increased by 2.3%, but analysing certain sort
of fruit, raspberry production decreased in 2016 by 6.5%.
Wheat market in Serbia is largely liberalized, and although there is not official commodity exchange, the
prices are set on the basis of demand and supply. There has been noted a price disparity between wheat
and its inputs, primarily NPK fertilizers and to a smaller extent fuel. Growing price disparity is reflected in
reduced accumulative and reproductive capability of private farmers (Tomić Danilo, Vlahović Branislav,
Maksimović Branka, 2010, Price Parities of Chosen Inputs and Basic Agricultural Products in Serbia, Škola
Biznisa, Vol. 47, No. 1, pp. 57 - 66). Widening price disparity between wheat and its inputs caused decline in
wheat producers’ profits. Some research results showed that family agricultural holdings requested yields
of 3.58 tons per hectare to cover only variable costs (government subsidies and incentives were excluded),
and the profit-breaking point was created at 7.58 tons per hectare. (Todorović Saša, Filipović Nikola, 2010,
Economic Analysis of Wheat Production on Family Farms, Journal of Agricultural Science, Vol. 55, No. 1, pp.
79 – 87). The results of 2012 Census of Agriculture illustrate small accumulative capability of family
agricultural holdings in producing wheat.
Generally, favourable climatic and geographic conditions, as well as traditional production structure, make
Serbia a self-sufficient in wheat produce. When yields are low (due to adverse weather conditions) the
government often decides to impose temporary ban on export rather than import wheat. Table 15 shows
the trends in amount and value of imported wheat in the period 2009-2012.
Table 14: Wheat import in the period 2009-2012
2009
2010
2011
2012
Variety Tons 000 usd Tons 000 usd Tons 000 usd Tons 000 usd
Spelt and meslin seed 33 14 142 117 537 426 1102 75
Common wheat 52 13 448 105 58 19 246 71
Durum wheat 340 133 87 70 125 92 220 135
Durum wheat other 305 47 95 22 379 170 877 354
Total 730 207 772 313 1089 709 246 1357
Source: SORS
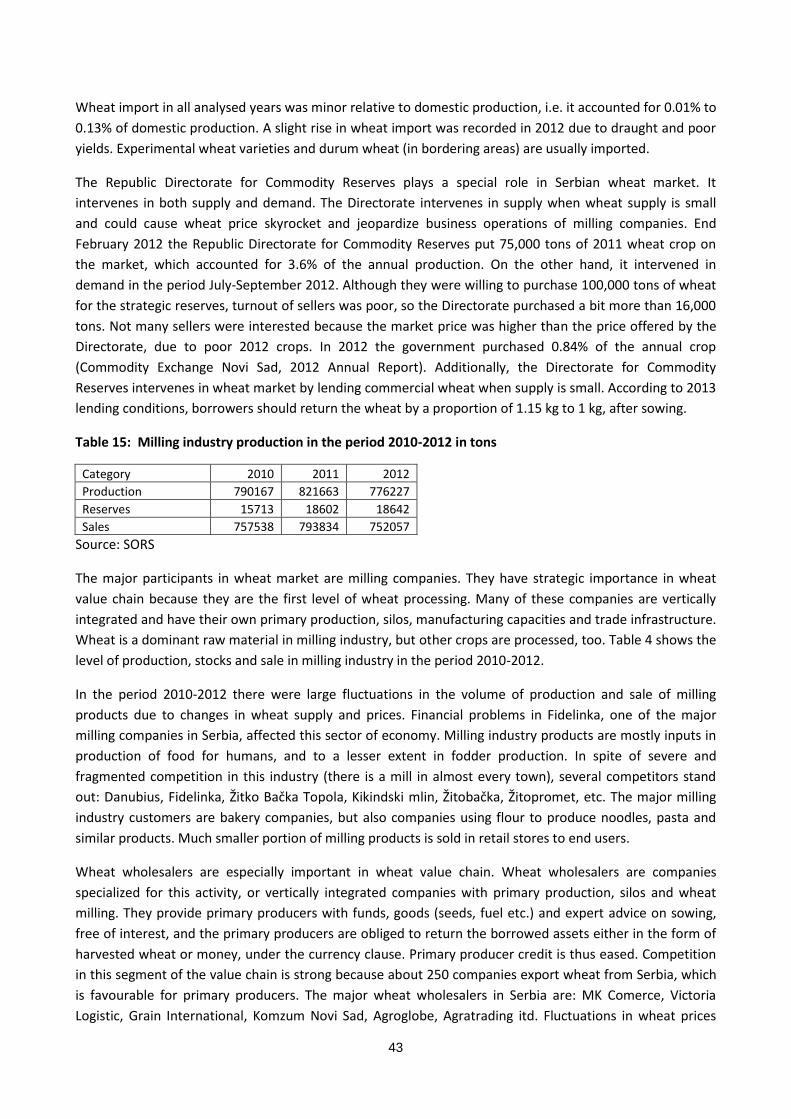
43
Wheat import in all analysed years was minor relative to domestic production, i.e. it accounted for 0.01% to
0.13% of domestic production. A slight rise in wheat import was recorded in 2012 due to draught and poor
yields. Experimental wheat varieties and durum wheat (in bordering areas) are usually imported.
The Republic Directorate for Commodity Reserves plays a special role in Serbian wheat market. It
intervenes in both supply and demand. The Directorate intervenes in supply when wheat supply is small
and could cause wheat price skyrocket and jeopardize business operations of milling companies. End
February 2012 the Republic Directorate for Commodity Reserves put 75,000 tons of 2011 wheat crop on
the market, which accounted for 3.6% of the annual production. On the other hand, it intervened in
demand in the period July-September 2012. Although they were willing to purchase 100,000 tons of wheat
for the strategic reserves, turnout of sellers was poor, so the Directorate purchased a bit more than 16,000
tons. Not many sellers were interested because the market price was higher than the price offered by the
Directorate, due to poor 2012 crops. In 2012 the government purchased 0.84% of the annual crop
(Commodity Exchange Novi Sad, 2012 Annual Report). Additionally, the Directorate for Commodity
Reserves intervenes in wheat market by lending commercial wheat when supply is small. According to 2013
lending conditions, borrowers should return the wheat by a proportion of 1.15 kg to 1 kg, after sowing.
Table 15: Milling industry production in the period 2010-2012 in tons
Category 2010 2011 2012
Production 790167 821663 776227
Reserves 15713 18602 18642
Sales 757538 793834 752057
Source: SORS
The major participants in wheat market are milling companies. They have strategic importance in wheat
value chain because they are the first level of wheat processing. Many of these companies are vertically
integrated and have their own primary production, silos, manufacturing capacities and trade infrastructure.
Wheat is a dominant raw material in milling industry, but other crops are processed, too. Table 4 shows the
level of production, stocks and sale in milling industry in the period 2010-2012.
In the period 2010-2012 there were large fluctuations in the volume of production and sale of milling
products due to changes in wheat supply and prices. Financial problems in Fidelinka, one of the major
milling companies in Serbia, affected this sector of economy. Milling industry products are mostly inputs in
production of food for humans, and to a lesser extent in fodder production. In spite of severe and
fragmented competition in this industry (there is a mill in almost every town), several competitors stand
out: Danubius, Fidelinka, Žitko Bačka Topola, Kikindski mlin, Žitobačka, Žitopromet, etc. The major milling
industry customers are bakery companies, but also companies using flour to produce noodles, pasta and
similar products. Much smaller portion of milling products is sold in retail stores to end users.
Wheat wholesalers are especially important in wheat value chain. Wheat wholesalers are companies
specialized for this activity, or vertically integrated companies with primary production, silos and wheat
milling. They provide primary producers with funds, goods (seeds, fuel etc.) and expert advice on sowing,
free of interest, and the primary producers are obliged to return the borrowed assets either in the form of
harvested wheat or money, under the currency clause. Primary producer credit is thus eased. Competition
in this segment of the value chain is strong because about 250 companies export wheat from Serbia, which
is favourable for primary producers. The major wheat wholesalers in Serbia are: MK Comerce, Victoria
Logistic, Grain International, Komzum Novi Sad, Agroglobe, Agratrading itd. Fluctuations in wheat prices
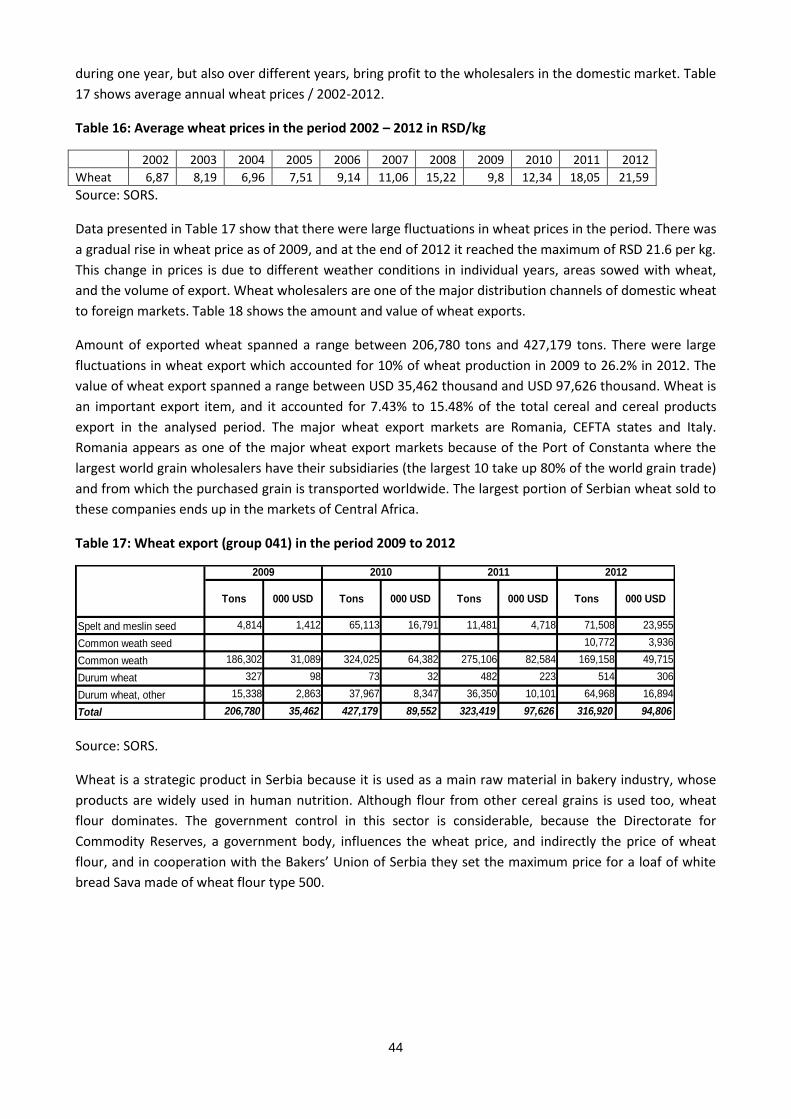
44
during one year, but also over different years, bring profit to the wholesalers in the domestic market. Table
17 shows average annual wheat prices / 2002-2012.
Table 16: Average wheat prices in the period 2002 – 2012 in RSD/kg
2002 2003 2004 2005 2006 2007 2008 2009 2010 2011 2012
Wheat 6,87 8,19 6,96 7,51 9,14 11,06 15,22 9,8 12,34 18,05 21,59
Source: SORS.
Data presented in Table 17 show that there were large fluctuations in wheat prices in the period. There was
a gradual rise in wheat price as of 2009, and at the end of 2012 it reached the maximum of RSD 21.6 per kg.
This change in prices is due to different weather conditions in individual years, areas sowed with wheat,
and the volume of export. Wheat wholesalers are one of the major distribution channels of domestic wheat
to foreign markets. Table 18 shows the amount and value of wheat exports.
Amount of exported wheat spanned a range between 206,780 tons and 427,179 tons. There were large
fluctuations in wheat export which accounted for 10% of wheat production in 2009 to 26.2% in 2012. The
value of wheat export spanned a range between USD 35,462 thousand and USD 97,626 thousand. Wheat is
an important export item, and it accounted for 7.43% to 15.48% of the total cereal and cereal products
export in the analysed period. The major wheat export markets are Romania, CEFTA states and Italy.
Romania appears as one of the major wheat export markets because of the Port of Constanta where the
largest world grain wholesalers have their subsidiaries (the largest 10 take up 80% of the world grain trade)
and from which the purchased grain is transported worldwide. The largest portion of Serbian wheat sold to
these companies ends up in the markets of Central Africa.
Table 17: Wheat export (group 041) in the period 2009 to 2012
Tons 000 USD Tons 000 USD Tons 000 USD Tons 000 USD
4,814 1,412 65,113 16,791 11,481 4,718 71,508 23,955
10,772 3,936
186,302 31,089 324,025 64,382 275,106 82,584 169,158 49,715
327 98 73 32 482 223 514 306
15,338 2,863 37,967 8,347 36,350 10,101 64,968 16,894
206,780 35,462 427,179 89,552 323,419 97,626 316,920 94,806
Common weath
Durum wheat
Durum wheat, other
Total
Common weath seed
Spelt and meslin seed
2009 2010 2011 2012
Source: SORS.
Wheat is a strategic product in Serbia because it is used as a main raw material in bakery industry, whose
products are widely used in human nutrition. Although flour from other cereal grains is used too, wheat
flour dominates. The government control in this sector is considerable, because the Directorate for
Commodity Reserves, a government body, influences the wheat price, and indirectly the price of wheat
flour, and in cooperation with the Bakers’ Union of Serbia they set the maximum price for a loaf of white
bread Sava made of wheat flour type 500.
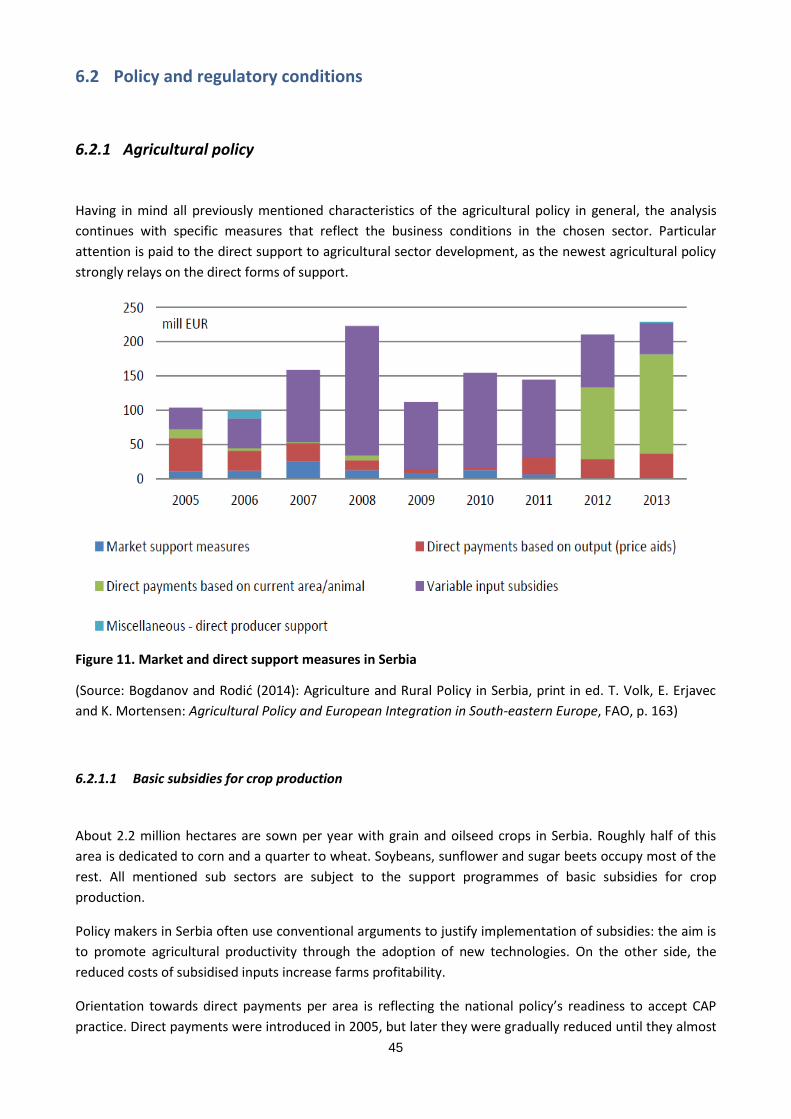
45
6.2 Policy and regulatory conditions
6.2.1 Agricultural policy
Having in mind all previously mentioned characteristics of the agricultural policy in general, the analysis
continues with specific measures that reflect the business conditions in the chosen sector. Particular
attention is paid to the direct support to agricultural sector development, as the newest agricultural policy
strongly relays on the direct forms of support.
Figure 11. Market and direct support measures in Serbia
(Source: Bogdanov and Rodić (2014): Agriculture and Rural Policy in Serbia, print in ed. T. Volk, E. Erjavec
and K. Mortensen: Agricultural Policy and European Integration in South-eastern Europe, FAO, p. 163)
6.2.1.1 Basic subsidies for crop production
About 2.2 million hectares are sown per year with grain and oilseed crops in Serbia. Roughly half of this
area is dedicated to corn and a quarter to wheat. Soybeans, sunflower and sugar beets occupy most of the
rest. All mentioned sub sectors are subject to the support programmes of basic subsidies for crop
production.
Policy makers in Serbia often use conventional arguments to justify implementation of subsidies: the aim is
to promote agricultural productivity through the adoption of new technologies. On the other side, the
reduced costs of subsidised inputs increase farms profitability.
Orientation towards direct payments per area is reflecting the national policy’s readiness to accept CAP
practice. Direct payments were introduced in 2005, but later they were gradually reduced until they almost
46
disappeared. In 2012 and 2013 these measures were applied again, mainly in crop production (except for
vegetables and fodder). The direct payments are not linked to compliance with basic standards concerning
the environment, food safety, natural resource management and animal welfare. To some extent this
reflects the incapability of policy makers to take radical steps and introduce measures which would be
neither popular nor willingly accepted by producers.
The share of input subsidies has continuously increased over the analysed period. Since 2007 input
subsidies have become a dominant scheme of budgetary support to agriculture, with their share of total
agricultural budget exceeding 45% (in 2010 even reached 72 percent). However, the structure of input
subsidies has changed dynamically, with a tendency to concentrate on diesel fuel and mineral fertilizers in
the last few years. Frequent changes in the way these measures were implemented are what characterised
this practice. For instance, early in the period, subsidies for diesel fuel were in the form of a flat rate
payment per litre, while later they were calculated as the percentage of costs of purchased fuel up to the
maximum number of litres per hectare. The modes of payment are also dependent on whether a farm is
under or above 10 ha. Similar implementation models were applied in subsidizing fertilizers.
Together with credit and extension services, input subsidies were supposed to help farmers implement,
benefit from and then, with the withdrawal of the subsidy, themselves fully fund economically and
technically efficient input purchases and use: rapid learning with subsidies about input use and its benefits
should mean that subsidies would be needed for only a short time and could be rapidly phased out.
However, the systemic approach the agricultural policy in Serbia does not exist - year by year the policy
instruments are exposed to significant changing. The subsidies on interest rates should be also added as a
form of direct support.
6.2.1.2 Investment support
The bank decisions on lending are based on the banks’ risk assessments and their estimate of the clients
“ability and willingness” to repay. Bankers make their credit decisions on the basis of the borrower’s
creditworthiness, taking into account the potential clients’ business performance, historical data, market
prospects and plans for the future. The problem often arises when family farms apply for credit. They are
not obliged to keep business records and to make the financial reports at the end of the year. This
significantly complicates the process of the credit analysis, and largely influences the final bank decision. In
order to support mechanisms of lending a new model of credit support by the Ministry of Agriculture was
introduced in 2010. The interest-rate subsides are provided in order to encourage banks to lend to the
sector. The Ministry of Agriculture facilitates very low interest rates to individuals, agricultural households
and SMEs via a number of partner commercial banks. This model has been implemented since 2010.
Serbian commercial banks are by far the largest formal lenders to agriculture, accounting for over 55% of
the official sum of lending to the agricultural sector. This includes corporate and agribusiness SMEs lending,
loans to registered farmers, as well as retail-type individual loans for agricultural purposes. Generally, banks
offer a wide-range of loan products to the agricultural sector. All banks interviewed have a large number of
agricultural loan products available that include, among other features, grace periods, trade contract
collateralization, equipment finance and input credit.
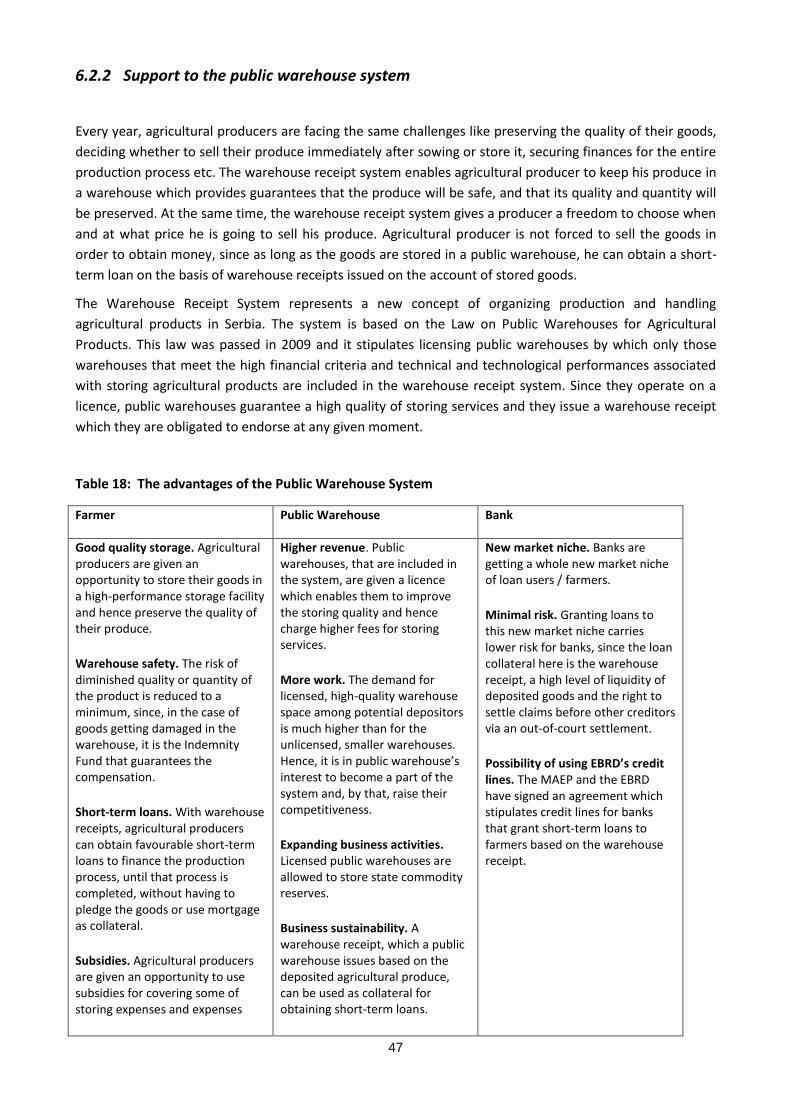
47
6.2.2 Support to the public warehouse system
Every year, agricultural producers are facing the same challenges like preserving the quality of their goods,
deciding whether to sell their produce immediately after sowing or store it, securing finances for the entire
production process etc. The warehouse receipt system enables agricultural producer to keep his produce in
a warehouse which provides guarantees that the produce will be safe, and that its quality and quantity will
be preserved. At the same time, the warehouse receipt system gives a producer a freedom to choose when
and at what price he is going to sell his produce. Agricultural producer is not forced to sell the goods in
order to obtain money, since as long as the goods are stored in a public warehouse, he can obtain a short-
term loan on the basis of warehouse receipts issued on the account of stored goods.
The Warehouse Receipt System represents a new concept of organizing production and handling
agricultural products in Serbia. The system is based on the Law on Public Warehouses for Agricultural
Products. This law was passed in 2009 and it stipulates licensing public warehouses by which only those
warehouses that meet the high financial criteria and technical and technological performances associated
with storing agricultural products are included in the warehouse receipt system. Since they operate on a
licence, public warehouses guarantee a high quality of storing services and they issue a warehouse receipt
which they are obligated to endorse at any given moment.
Table 18: The advantages of the Public Warehouse System
Farmer Public Warehouse Bank
Good quality storage. Agricultural producers are given an opportunity to store their goods in a high-performance storage facility and hence preserve the quality of their produce.
Warehouse safety. The risk of diminished quality or quantity of the product is reduced to a minimum, since, in the case of goods getting damaged in the warehouse, it is the Indemnity Fund that guarantees the compensation.
Short-term loans. With warehouse receipts, agricultural producers can obtain favourable short-term loans to finance the production process, until that process is completed, without having to pledge the goods or use mortgage as collateral.
Subsidies. Agricultural producers are given an opportunity to use subsidies for covering some of storing expenses and expenses
Higher revenue. Public warehouses, that are included in the system, are given a licence which enables them to improve the storing quality and hence charge higher fees for storing services.
More work. The demand for licensed, high-quality warehouse space among potential depositors is much higher than for the unlicensed, smaller warehouses. Hence, it is in public warehouse’s interest to become a part of the system and, by that, raise their competitiveness.
Expanding business activities. Licensed public warehouses are allowed to store state commodity reserves.
Business sustainability. A warehouse receipt, which a public warehouse issues based on the deposited agricultural produce, can be used as collateral for obtaining short-term loans.
New market niche. Banks are getting a whole new market niche of loan users / farmers.
Minimal risk. Granting loans to this new market niche carries lower risk for banks, since the loan collateral here is the warehouse receipt, a high level of liquidity of deposited goods and the right to settle claims before other creditors via an out-of-court settlement.
Possibility of using EBRD’s credit lines. The MAEP and the EBRD have signed an agreement which stipulates credit lines for banks that grant short-term loans to farmers based on the warehouse receipt.
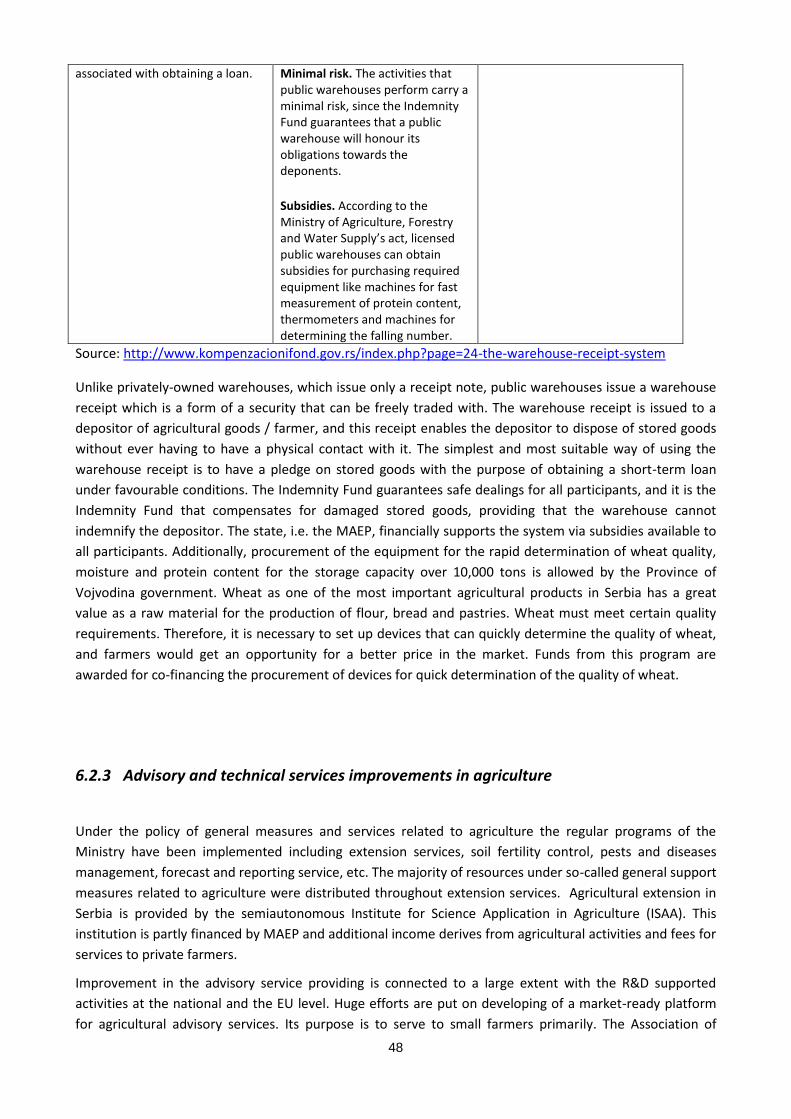
48
associated with obtaining a loan.
Minimal risk. The activities that public warehouses perform carry a minimal risk, since the Indemnity Fund guarantees that a public warehouse will honour its obligations towards the deponents.
Subsidies. According to the Ministry of Agriculture, Forestry and Water Supply’s act, licensed public warehouses can obtain subsidies for purchasing required equipment like machines for fast measurement of protein content, thermometers and machines for determining the falling number.
Source: http://www.kompenzacionifond.gov.rs/index.php?page=24-the-warehouse-receipt-system
Unlike privately-owned warehouses, which issue only a receipt note, public warehouses issue a warehouse
receipt which is a form of a security that can be freely traded with. The warehouse receipt is issued to a
depositor of agricultural goods / farmer, and this receipt enables the depositor to dispose of stored goods
without ever having to have a physical contact with it. The simplest and most suitable way of using the
warehouse receipt is to have a pledge on stored goods with the purpose of obtaining a short-term loan
under favourable conditions. The Indemnity Fund guarantees safe dealings for all participants, and it is the
Indemnity Fund that compensates for damaged stored goods, providing that the warehouse cannot
indemnify the depositor. The state, i.e. the MAEP, financially supports the system via subsidies available to
all participants. Additionally, procurement of the equipment for the rapid determination of wheat quality,
moisture and protein content for the storage capacity over 10,000 tons is allowed by the Province of
Vojvodina government. Wheat as one of the most important agricultural products in Serbia has a great
value as a raw material for the production of flour, bread and pastries. Wheat must meet certain quality
requirements. Therefore, it is necessary to set up devices that can quickly determine the quality of wheat,
and farmers would get an opportunity for a better price in the market. Funds from this program are
awarded for co-financing the procurement of devices for quick determination of the quality of wheat.
6.2.3 Advisory and technical services improvements in agriculture
Under the policy of general measures and services related to agriculture the regular programs of the
Ministry have been implemented including extension services, soil fertility control, pests and diseases
management, forecast and reporting service, etc. The majority of resources under so-called general support
measures related to agriculture were distributed throughout extension services. Agricultural extension in
Serbia is provided by the semiautonomous Institute for Science Application in Agriculture (ISAA). This
institution is partly financed by MAEP and additional income derives from agricultural activities and fees for
services to private farmers.
Improvement in the advisory service providing is connected to a large extent with the R&D supported
activities at the national and the EU level. Huge efforts are put on developing of a market-ready platform
for agricultural advisory services. Its purpose is to serve to small farmers primarily. The Association of
49
Farmers of the Municipality of Ruma in Serbia (Region of Vojvodina) is included in the pilot project. The
average UAA per holding in Ruma is 33 ha which corresponds to above average family agricultural holding
size in Vojvodina. Totally 330 farmers are willing to improve their agricultural practices and adopt new
technologies. The pilot case covers the entire crop production and the relative area of the crops (sowing
structure) on the covered territory is: 50% maize, 20% wheat, 8% Soya, 6% vegetables, 5% fodder crops, 3%
sunflower, 2.6% sugar beet, 2% permanent crops, 1% tobacco and 1% barley.
Other related activities supported at the national level have been connected with the advisory system
improvement in the mentioned field and financed from the national budget for R&D: (1) Developing the
software system for adjustment and analyses geodetic networks in surveying, Serbian Ministry of Science
and Technical Development, 2008-2010, Project No: TR 16015; (2) Preparation of the methodology
proposal for preliminary flood risk mapping in accordance to the Directive 2007/60/EC of the European
Parliament and of the Council of 23 October 2007 on the assessment and management of flood risks;
Serbian Ministry of Science and Technical Development, 2009-2011, Project No: TR 22202; (3) Spatial,
ecological, energetic and social aspects of settlement development and climate changes 4 mutual
influence; Serbian Ministry of Science, 2011-2016, Project No: TR36035; (4) METEO package
4methodological/software solution for automated mapping of climatic variables , funded by the Ministry of
Education and Science of the Republic of Serbia, 2014-2015.
An illustration: the expert opinion regarding the implementation of new tech solutions and its limitations in
Serbia. The interview was conducted with the product/solution manager from GDi Solutions.
Is there an example of using GIS in Serbian agriculture, primarily in management of state agricultural land?
GIS for the annual program preparation of the state agricultural land management was made for the needs
of the Ministry of Agriculture and Environment of the Republic of Serbia. It is the system that covers the
whole territory of Serbia, primarily for the needs of the state agricultural land management for which each
municipality in the Republic is ought to create annual management program. The GIS enable the efficient
overview of the state agricultural land which has been leased on various grounds in accordance with the
law. In such a way, the Agricultural land management of the Ministry has the precise evidence about the
resource that is under their jurisdiction (state agricultural land) as well as the information about the
tenants and the way in which they dispose of the land.
What are the benefits of GIS usage for the state agricultural land management and what are the untapped potentials in general?
The main benefit of GIS usage in this context is the possibility of comprehensive understanding of the
important resource such as agricultural land. At one point, it is possible to overview which land is at
disposal, which has been already leased and which is not used. It enables better land management to the
owner, the state.
On the other hand, the untapped potential is the upgrading the system with the LPIS (Land Parcel
Information System) which provides precise information about each parcel which is in the production
system and on which basis all the other land management data has been processed. For example, it is
possible to identify the exact area of the agricultural land which one producer in Vojvodina owned and
from which he reap wheat yields or the exact area of raspberry parcels in the West Serbia region. Using GIS
and remote sensing, it is possible to monitor all those areas considering the quality and the state of the
crops or yields predictions, which is the first step towards precision agricultural system creation.
Is it possible to introduce the precise agriculture in Serbia?

50
There are huge possibilities for introduction the precision agriculture in Serbia, no matter which product we
are talking about. Modern technology and sensors connected through Internet of Things and put in the
spatial context provide exact data for the exact location in real time. In such way the producers are able to
manage their production in real time (they can see in which parts of their parcels there is lower humidity, in
which part of soil the chemical composition is different or changed, where the plants are damaged so that
certain treatment is needed, and etc. the information could be classify in different levels: parcel level, or
even on the level of individual perennial plant.
What are the main obstacles in GIS introducing in the agriculture sector in Serbia?
Practically, there are no obstacles. Agriculture is one of the economic activities which is the biggest space
consumer and everything in agriculture depends of the space and spatial characteristics. So, almost all date
and information are able to be spatially visualized. The only limit in GIS introducing in agriculture considers
the size of agriculture holding – there is real objective concern if GIS is too expensive technology for small
holdings?
6.3 Market conditions
6.3.1 Access to markets
Serbia exports high volumes of wheat and flour. Part of Serbia’s wheat trade is shipped by truck to
neighbouring Bosnia and Herzegovina, Montenegro, Macedonia and Albania, while the largest quantities of
wheat are shipped by barge to Port Constanza, Romania. Serbian wheat is mostly sold to foreign
international companies FOB at the Port on the Danube in Serbia. Serbian (higher quality) wheat is sold to
Spain, Germany, Italy and France. Serbian wheat flour is mostly sold to Montenegro, Bosnia and
Herzegovina, Kosovo, Macedonia and Albania. Serbian wheat shipped to the Black Sea is mostly stored in
the Port of Constanza silos and shipped by sea vessels to North African countries (Tunisia, Allegers and
Libya).
Serbia’s wheat production is not competitive regarding quality and price with major export countries in the
region such as Hungary and Ukraine, but it is very competitive in countries of former Yugoslavia such as the
FYR Macedonia, Bosnia and Herzegovina and Montenegro (WORLD BANK, 2006). These countries have
huge structural cereal deficits and they prefer Serbia as trading partner due to low trade costs and good
political relations. Therefore, CEFTA1 members are Serbia’s main trading partners. However, in the extreme
situations (wheat price increase on the world market) policy maker reaction often causes direct export ban,
which is harmful not only to farmers but also consumers in Serbia.
Story about the wheat export ban from Serbia
During world economic crisis (2008-2011) Serbian government restricted exports of wheat to world
agricultural market aiming at countering the rise in food price inflation and protecting consumers from
51
higher food expenses.5 Academic literature and public debates have criticized export restrictions as
instruments for protection against high world market prices, notably because of their additional price-
increasing effects on already high world market prices. And what did happen? The bread price in Serbia
rather increased disproportionately during the export ban (> 50 %) which apparently cannot be traced to
increased wheat or flour prices. Who are the winners and who are the losers? Profits generated during the
anti-crisis policy by the milling industry were apparently much higher than profits attainable under free
trade conditions. The bakery industry managed to increase bread prices and improve its profits. End
consumers, in contrast, are the losers of this policy.
Source: Linde Götz, Ivan Djuric and Thomas Glauben: Are export restrictions an effective instrument to
dampen food price inflation?, IAMO Policy Brief No. 10, March 2013.
In spite of the problems that are significantly impeding the process of integration of agri-food value added
chains in the region, cooperation (both, bilateral and multilateral) in the sphere of agriculture continues its
development due to its high potential and interest from all participants. The Black Sea Economic
Cooperation includes 12 countries in the region.6 This region is very important in the context of the wheat
sector development in Serbia. One of the organization’s major, strategic development projects is the joint
transportation system. This project is very important in forming an international agri-food space. It will
allow the creation of a single transport system in the Black Sea region. The creation of logistics and
transport infrastructure will significantly simplify physical access to joint agri-food value-added chains and
improve their effectiveness. (Borodina, 2014)
6.3.2 Land leasing
The land-lease market in Serbia is currently more important than the land-sales market due to lacks of the
proper legislative framework for the latter. The land market functioning is under the supervision and
control of different mutually independent institutions: (1) The Government Geodetic Authority (GGA)
manages the land cadastre. The cadastre, covering 88,167 km2, includes nearly 55 million cadastral parcels
of private, social and state property. It is out-of-date and needs to be harmonised with the systems in the
municipal courts; (2) The legal real property registration system, which complements the cadastre, is
maintained by the municipal courts and supervised by the Ministry of Justice and Local Administration; (3)
Rural and forestry spatial planning and land management policy is co-ordinated by the MAEP; (4) Property
tax administration is the responsibility of the Ministry of Finance.
The lease market is characterised by insecure property rights and a relatively high lease tax that result in
many lease transactions not being officially reported. Most of these transactions take place in the Region of
Vojvodina with high quality soil. Due to unstable conditions, the land-lease contracts are often short-term
5 Nine countries around the world, including Serbia, restricted their wheat exports between which affected 14 per cent in world wheat trade (Cf. Giordani, P., Rocha, N., Ruta, M. (2012): Food Prices and the Multiplier Effect of Export Policy, CESIFO Working Paper No. 3783). 6 The Organization of the Black Sea Economic Cooperation was founded on 1 May 1999 based on the Agreement for Black Sea economic cooperation of 25 June 1992. The BSEC Headquarters are located in Istanbul. The members of the organization are Azerbaijan, Albania, Armenia, Bulgaria, Greece, Georgia, Moldova, Russian Federation, Romania, Serbia, Turkey and Ukraine.
52
and do not encourage medium-term investment in the land or in the development of the farm
infrastructure.
With the aim to improve land leasing, the amendments to the Law on Agricultural Land which came into
force in December 2015 were adapted. These amendments significantly change the rules regulating lease
of agricultural land owned by the Republic of Serbia. According to rules established by the Privatization
Law, The Republic of Serbia has remained the owner of vast areas of arable agricultural land. The land
owned by the Republic of Serbia is leased out to natural or legal persons after conducting the relevant
leasing procedures before the authorities of local municipalities. Every agricultural producer (farmer), due
to limited character of land as a fixed asset, has been interested in leasing as large an area of state-owned
agricultural land as possible. However, the land market in Serbia still remains not functional; due to poor
tended proprietary registers (institutional prerequisite for a good functioning land market is updated land
registry which is not the case in our country). Additionally, in Vojvodina farmers have even resorted to
physical altercations, blocking roads and similar methods in order to achieve the goal of leasing as much
land as they can (derived from the public media sources and blogs). For example, the farmers often claim
that they have been negatively affected by the actions in land leasing by municipalities which are denying
them the right to purchase state-owned land under the same terms as big companies.
Additionally, for the purposes of the Provincial Department of Agriculture Vojvodina a geographic
information system has been created and implemented. Originally, it was designed for monitoring and
management of the state owned arable agricultural land. A geodatabase of the entire state owned land to
the level of the cadastral parcel has been created. Beside the basic information about the land, the
database also contains information about the status of the renting land, the history of the land use, yields,
soil type, the use of grants and loans for a given parcel, etc. all this was initial for implementing next phases
of the geographic information system in agriculture.
6.3.3 Land policy, natural hazards and insurance
The territory of Serbia is vulnerable to various types of natural hazards and the agricultural risk is not equal
across the entire territory; it varies depending on the type of hazard and the expected potential for
damage. Due to the geographical position of Serbia, with territory situated along the southern part of the
Pannonian plain and the Balkan Peninsula, and also due to the complex influences of various abiotic and
biotic factors, diverse natural hazards are present.
An illustration (the expert interview with an Associate Professor at the Geographical faculty of University of
Belgrade): "The most vulnerable area from the flooding aspect is northern part of Serbia (Vojvodina),
where, in the coastal part of the Danube River (specifically, the Tisa, the Tamis and the Sava), there are
about 12900 km2 of potentially floodable land. Also, some parts of Vojvodina (north-eastern Bačka with
northern Banat) are at the highest risk of drought. During the period from 1948–2007, 258 fires were
registered just in the Deliblato sand (south-eastern part of Vojvodina), affecting 11921 ha. Although the
2014 floods were natural occurrences, the human factor also significantly contributed to the disasters."
Floods and torrential floods, as the most frequent phenomena among the “natural risks” in Serbia, need
serious treatment. This treatment is accomplished through the following activities: (1) identification of the
flood zones (whole watersheds or particular sections of rivers); (2) monitoring in real time (the water level
53
in the river bed and the amount of precipitation), along with a forecast and warning system; (3) short-term
protection; (4) long-term protection; (5) land use; (6) risk management; (7) public participation, education
and media.
According to the Law on Waters of the Republic of Serbia, each municipality is obliged to adopt two basic
documents on flood control: the Plan of Identifying Erosion Regions and the Plan of Torrential Flood
Control. The Plan of Identifying Erosion Regions identifies the areas with soil erosion hazard, present and
future. Proper management is to be adopted by landowners. The plan also defines action for torrential
flood control.
The Plan for Torrential Flood Control defines four stages of defence: Phase I – Preparation for torrential
floods control (the most important stage as only a short time is available to react to torrential rainfall);
Phase II – Extraordinary (emergency) flood control; Phase III – State of emergency; Phase IV – Clearing the
detrimental impacts (Kostadinov et al. 2012).
For effective coordination and cooperation (important principles of natural hazard mitigation) public
participation is required. Informing the local inhabitants on potential risks, timely information in the case of
emergency, as well as active public participation in the defence or rescue actions are vital tasks, covered by
Phase III.
The following measures of flood control and mitigation seem appropriate: (1) the implementation of a
Decision Support System (DSS) for the optimal coordination of all flood prevention or mitigation activities
and a telecommunication system to enable rapid response in the case of flood emergency; (2) the
preparation of an inventory on risks for spatial and urban planning which identifies acceptable levels of risk;
(3) The compilation of a new erosion map of Serbia based on the scientific analyses of rates of erosion; (4)
Regular and continuous torrent erosion and complex of erosion control measures in watersheds.
(Kostadinov 2007; 2010); (4) the preparation of Plans of Identifying Erosion Regions for each municipality in
Serbia; (5) the preparation of Plans of Torrential Flood Control; (6) the compilation of an inventory of
torrents for each watershed of Serbia; (7) the documentation of performed erosion and torrential flood
control activities performed; (8) Real-time monitoring of rainfall and river discharge and to establish
forecasting and early warning systems.
Along with the flood prevention system insurance is recognized as the traditional system for hazards
control. Insurance of crop production in Serbia is voluntary. The basic risk is the hail risk, followed by the
fire and thunder risks. Additional risks are the storm risk, frost risk and flood risk. Even though the
agricultural sector as a sector of the Serbian economy vital for the social, ecological and economic
development, the coverage of agricultural land by insurance, and the agricultural development generally, is
extremely low.
The reasons behind such low percentage of insured arable land are the following: (1) ignorance of farmers
about the benefits provided by insurance; (2) under developed agricultural production - low investments
lead to lower income, which results in less households being insured and, consequently, with insurance
relied on higher premiums.
The illustrations - importance of insurance and problems in the practice:
"Serbia has 3 437 232 ha of arable land, of which 2 536 882 ha is arable land, 187 300 hails under
plantations and 713 342 ha consists of pastures and meadows. Since pastures and meadows are not
insured by default, the important areas for insurers are the ones under arable fields and plantations - 2 724
182 ha. Approximately, only 9% of the above-mentioned surface is insured. Taking into consideration the
annual production value is 3 to 3.5 billion EUR, we can see that there is a high risk, not only for the
54
producers, but for the budget of Serbia as well. If we take a look at the two most common crops in Serbia,
wheat and raspberry, we can notice that in the last 5 years, only 25% to 30% of the territory planted with
wheat and 4% to 10% of territory planted with raspberry was insured" (Insurance company expert)
"We only think about insurance when a large-scale natural disaster happened, which is a serious problem
that needs to be discussed." (Insurance company expert)
Serbia has introduced subsidies for insurance premiums with the Regulation on insurance of animals, crops,
fruits and young nursery perennial plants, which is a great stimulus. This regulation made registered
farmers eligible for 40% reimbursements of the insurance premium. However, the results of these
measures haven’t been as successful as it was planned and did not increase the number of insurers. Based
on all above mentioned, it is quite clear that the problem of agricultural development in Serbia needs to be
approached in a serious manner, in order to stimulate farmers to insure their products. The obligation of
the insurer is to offer an adequate product (covering more risks), with as simply defined insurance
conditions and tariffs as possible, which will be beneficial to all, including farmers, government and
insurance industry. It is clear that the second part of this work should be led by the country, through
appropriate system of subsidies, models of public-private partnerships and the adoption of appropriate
legislation in this area. There is room to introduce some of the elements of obligatory agricultural
insurance.
6.3.4 Food safety and food quality
Competencies in the field of food safety in Serbia have been divided between MAEP and the Ministry of
Health (MH). MAEP is responsible for veterinary, phytosanitary and food safety policies (the safety of food
of animal origin, composite food, food of plant origin and feed). The ministry supervises the legality of work
through its four directorates: Veterinary Directorate; Plant Protection Directorate; General Inspectorate
and Directorate for National Reference Laboratories (DNRL). MAEP is central competent authority
responsible for the organizations of official control and for ensuring efficient and effective coordination
among all authorities and their directorates. Veterinary, phytosanitary and agricultural inspections are
managed centrally but distributed territorially. In the Autonomous Province of Vojvodina (APV), the tasks
related to food safety that fall under the competency of the MH have been conferred to the Secretary of
the Health of the Province.
According to the Food Safety Law as from 2009 food business operators should implement Hazard Analysis
and Critical Control Points (HACCP) principles in all establishments involved in the production of animal and
non-animal food.
The issue of wheat quality and safety is debated from the technological point of view usually. For example,
in the study Improvement of Wheat Quality in Cultivars Released in Serbia during the 20th Century twenty
varieties of wheat were analysed, and the decreases in the protein and wet gluten contents were
compensated for by an improvement in protein quality of wheat. Additionally, the increase in gluten
structure stability and appropriate combinations of high molecular weight glutenin subunits have
contributed to the improvement of other quality indicators. (N. Hristov, et al, 2010). However, the
indicators of wheat quality are largely dependent on environmental factors.
The food safety issues and food quality are investigated and analyse separately from the agro-
environmental issues. Agricultural practices show the significant soil contamination because of improper
55
use of manure while the erosion problem exists in many regions of Serbia. The agri-environmental policy
advocates for the comprehensive evaluation of food safety issues in the context of protection of the
environment from the so-called dirty technologies. However, due to lack of interest in the practice food
safety issues and environmental protection have hardly taken place at all in Serbia up until now. Influence
of food safety on the public health is a different topic which gains in importance. Particular attention is paid
to mycotoxins in grains. Management practices to maximize plant performance and decrease plant stress
can decrease mycotoxin contamination substantially. This includes planting adapted varieties, proper
fertilization, weed control, necessary irrigation, and proper crop rotation. For post-harvest mycotoxin
control, prevention of conditions that favour fungal growth and subsequent toxin production needs to be
considered, i.e. factors such as water activity of stored products, temperature, and grain condition, gas
composition of the intergranular air, microbial interactions, and presence of chemical or biological
preservatives. Contamination of crops (either in production or post-harvest process) can influence also on
the food safety in the down-stream industry (Milićević et al., 2010). Additional problems are related to lack
of instruments and knowledge for food quality control and standards implementation. Instruments are
often considered as expensive, while their cost is not assessed in relation to the value of testing the
commodities or materials for the analysis of which the instrument has been purchased. (Pojić, et al, 2010)..
The first attempts to separate the wheat quality and to adequately evaluate producers’ intentions to
improve technology at the farm were conducted in the framework of The Warehouse Public Storage
project implementation. The Ministry has prescribed and specific quality standards on the basis of which it
had intended to subsidize farmers, depending on the technology and quality of the yield. Unfortunately,
these attempts have remained unapplied in practice. Serbian wheat is usually produced and sold as the less
quality product according to the international standards.
6.4 Key conditions faced by wheat producers
The key conditions are derived from the literature review and going to be discussed with the focus groups
participants for the Wheat CS in Serbia.7 The importance of selected conditions is already confirmed in the
discussion with the experts selected for interviewing.8 The key conditions faced by wheat producers are
summarized in the table below:
Key condition Explanation
1 The unstable (constantly changing)
institutional environment
The agriculture budget varied in size with clear
indications of deviations in its structure from the EU
model. Generally, trend of decreasing of budgetary
expenditure for food sector and rural development in
last five year exists. The largest part of the funds is still
spent in direct support measures (mainly for input
subsidies).
7 The first conclusions are described. 8 Totally five interviews with sector representatives were conducted.
56
2 Climate change Climate change affects agriculture worldwide. Almost all
countries in the region were significantly affected by the
natural disasters such as floods, earthquakes, landslides,
forest fires, droughts, heat waves, prolonged winter etc.
Serbia has been especially exposed to floods.
3 Price fluctuation and market
structure
The prevailing commodity groups in Serbian exports are
cereals, fruits, beverages, fat and oils and sugar and
related products. Crop prices have actually been
permanently growing and influencing by high prices
recorded in the international markets. Additionally, due
the poorly organized privatization process disintegration
of the value chain in Serbian agribusiness occurred,
which has inevitably had adverse effects on the sector
development. The traders and the food industry are
highly protected from imports.
4 Demand - food security and food
quality
‘Sensory appeal’, ‘purchase convenience’ and ‘health and
natural content’ are rated as most important factors and
‘familiarity and ethical concerns’ are perceived as least
critical in the region. There will be a further
segmentation of the food market due to attention paid
to diet and health. Generally, wheat for human
consumption is estimated at 1 million MT annually with
per capita consumption at 180 kg, which is significantly
higher than consumption levels in most European
countries. However, different issues occurred in the
practice regarding the quality of wheat produced and
traded both within the country and in the foreign
markets.
6.5 Key strategies adopted by wheat producers and their impact on performance
In the following table the most commonly used/preferred strategies in risk control and mitigation in the
Serbian wheat sector are summarized9:
Key strategies Explanation
1 Straightening of agricultural
producers organizations
The weakest position in the Serbian food chain belongs
to the farmers. They are unorganized, fragmented and
left without adequate representation in different bodies
responsible for governance. Even wheat producers who
are larger than other agricultural producers on average
9 The first conclusions are described.
57
have faced with problems during harvest when the price
of their product is underestimated. The role of LAGs and
producers groups in bottom-up approach of decision
making could be of crucial importance for the
straightening of agricultural producers’ position within
the food chain.
2 Innovative insurance instruments
and specialization
It is rare to find a farmer in Serbia who does not grow
multiple types of crops, as land diversification is one of
the most important risk-management strategies. To
avoid the traditional approach towards farm
sustainability, modern technology should be implied
along with straightening of farms specialization. In these
conditions different insurance instruments can be used.
It is necessary to provide adequate incentives for farmers
and at the same time to strengthen technical and
financial capacities of insurers to take risks into their own
coverage. Insurers are expected to offer appropriate and
various products, tailored to the needs of the insured,
with the widest possible coverage of risks, precise and as
simple as possible defined conditions of insurance and
accessible insurance tariffs. The new instruments could
be related to the parametric index-based weather
insurance.
3 The public warehouse system and
innovative financial instruments
Agricultural producers are given an opportunity to store
their goods in a high-performance storage facility and
hence preserve the quality of their produce. The risk of
diminished quality or quantity of the product is reduced
to a minimum, since, in the case of goods getting
damaged in the warehouse, it is the Indemnity Fund that
guarantees the compensation. With warehouse receipts,
agricultural producers can obtain favourable short-term
loans to finance the production process, until that
process is completed, without having to pledge the
goods or use mortgage as collateral. Agricultural
producers are given an opportunity to use subsidies for
covering some of storing expenses and expenses
associated with obtaining a loan. Additionally, based on
the warehouse receipts, different commodity derivatives
can be designed. The important role in the system
implementation belongs to the exchange and knowledge
transfer.
4 Innovation and technology
improvement
The system of innovation must be oriented toward final
implementation and associated with the practice. A
pragmatic approach in the design of R&D activity
involves the active participation of producers in the
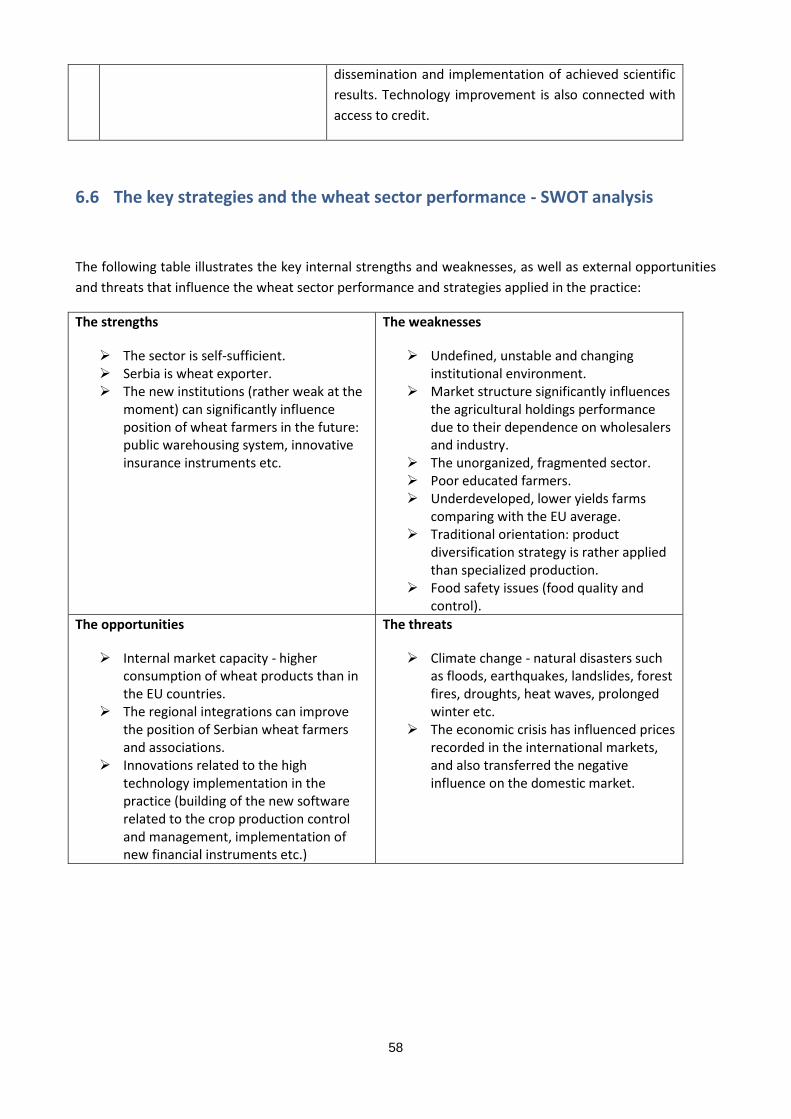
58
dissemination and implementation of achieved scientific
results. Technology improvement is also connected with
access to credit.
6.6 The key strategies and the wheat sector performance - SWOT analysis
The following table illustrates the key internal strengths and weaknesses, as well as external opportunities
and threats that influence the wheat sector performance and strategies applied in the practice:
The strengths
The sector is self-sufficient. Serbia is wheat exporter. The new institutions (rather weak at the
moment) can significantly influence position of wheat farmers in the future: public warehousing system, innovative insurance instruments etc.
The weaknesses
Undefined, unstable and changing institutional environment.
Market structure significantly influences the agricultural holdings performance due to their dependence on wholesalers and industry.
The unorganized, fragmented sector. Poor educated farmers. Underdeveloped, lower yields farms
comparing with the EU average. Traditional orientation: product
diversification strategy is rather applied than specialized production.
Food safety issues (food quality and control).
The opportunities
Internal market capacity - higher consumption of wheat products than in the EU countries.
The regional integrations can improve the position of Serbian wheat farmers and associations.
Innovations related to the high technology implementation in the practice (building of the new software related to the crop production control and management, implementation of new financial instruments etc.)
The threats
Climate change - natural disasters such as floods, earthquakes, landslides, forest fires, droughts, heat waves, prolonged winter etc.
The economic crisis has influenced prices recorded in the international markets, and also transferred the negative influence on the domestic market.
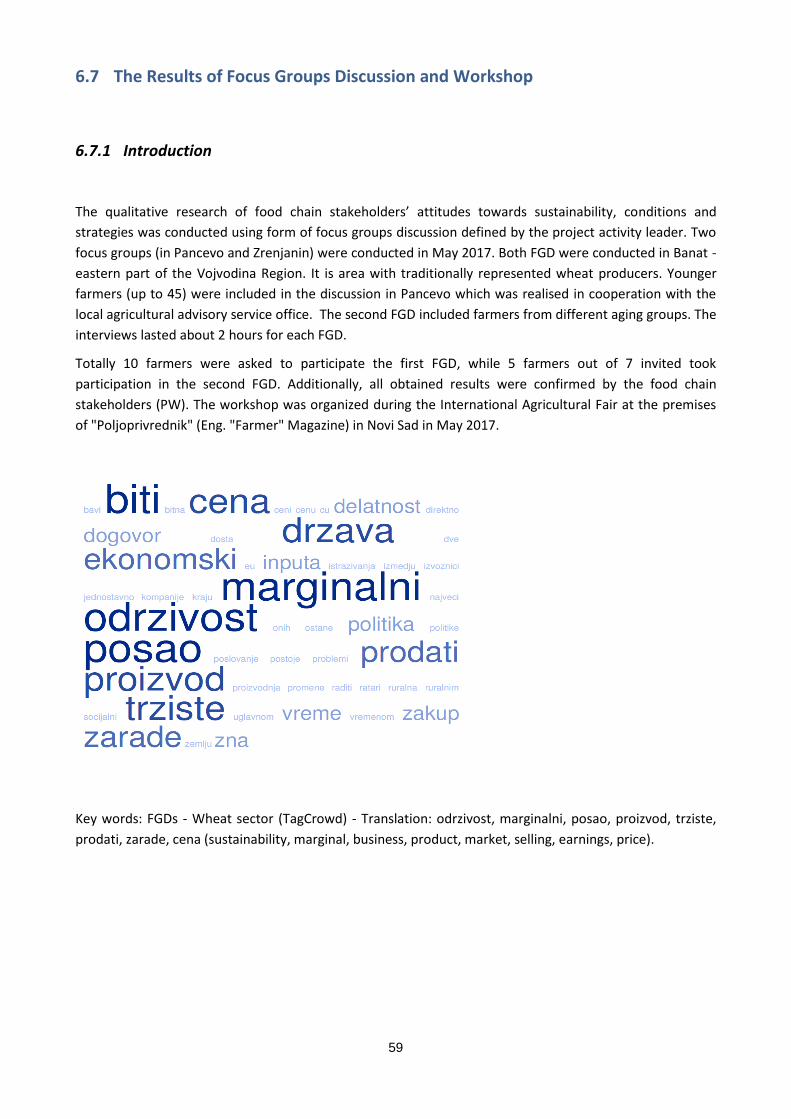
59
6.7 The Results of Focus Groups Discussion and Workshop
6.7.1 Introduction
The qualitative research of food chain stakeholders’ attitudes towards sustainability, conditions and
strategies was conducted using form of focus groups discussion defined by the project activity leader. Two
focus groups (in Pancevo and Zrenjanin) were conducted in May 2017. Both FGD were conducted in Banat -
eastern part of the Vojvodina Region. It is area with traditionally represented wheat producers. Younger
farmers (up to 45) were included in the discussion in Pancevo which was realised in cooperation with the
local agricultural advisory service office. The second FGD included farmers from different aging groups. The
interviews lasted about 2 hours for each FGD.
Totally 10 farmers were asked to participate the first FGD, while 5 farmers out of 7 invited took
participation in the second FGD. Additionally, all obtained results were confirmed by the food chain
stakeholders (PW). The workshop was organized during the International Agricultural Fair at the premises
of "Poljoprivrednik" (Eng. "Farmer" Magazine) in Novi Sad in May 2017.
Key words: FGDs - Wheat sector (TagCrowd) - Translation: odrzivost, marginalni, posao, proizvod, trziste,
prodati, zarade, cena (sustainability, marginal, business, product, market, selling, earnings, price).
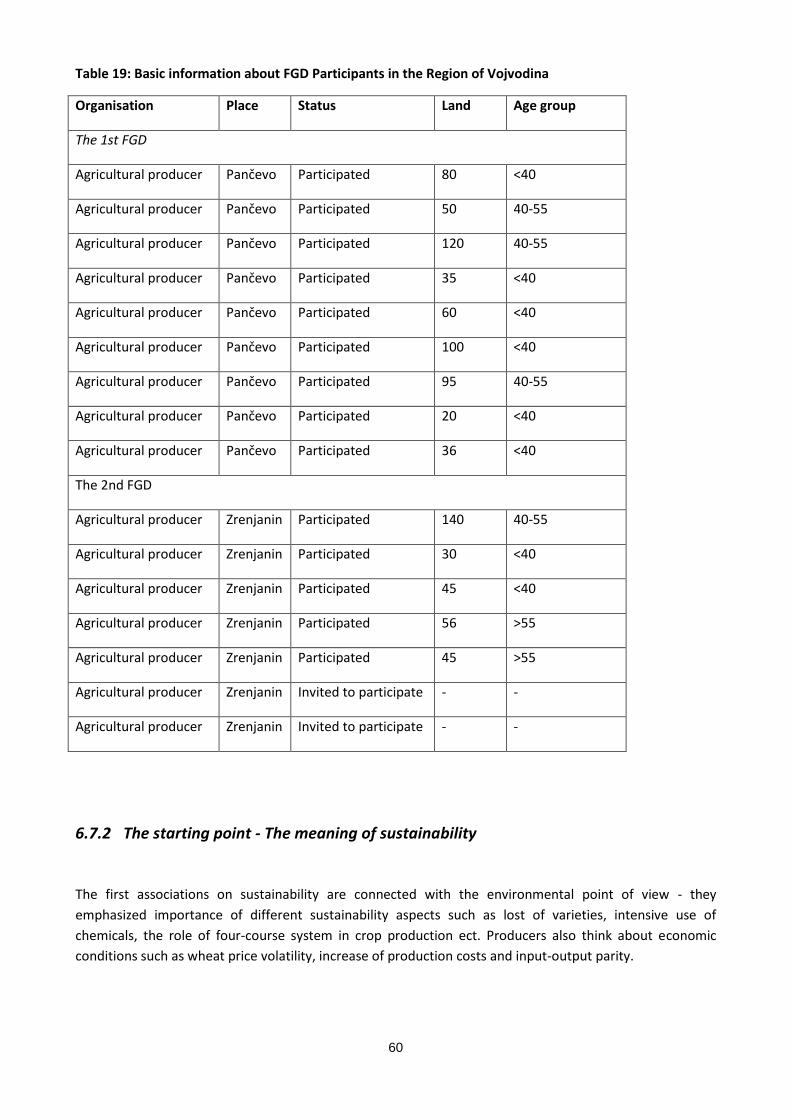
60
Table 19: Basic information about FGD Participants in the Region of Vojvodina
Organisation Place Status Land Age group
The 1st FGD
Agricultural producer Pančevo Participated 80 <40
Agricultural producer Pančevo Participated 50 40-55
Agricultural producer Pančevo Participated 120 40-55
Agricultural producer Pančevo Participated 35 <40
Agricultural producer Pančevo Participated 60 <40
Agricultural producer Pančevo Participated 100 <40
Agricultural producer Pančevo Participated 95 40-55
Agricultural producer Pančevo Participated 20 <40
Agricultural producer Pančevo Participated 36 <40
The 2nd FGD
Agricultural producer Zrenjanin Participated 140 40-55
Agricultural producer Zrenjanin Participated 30 <40
Agricultural producer Zrenjanin Participated 45 <40
Agricultural producer Zrenjanin Participated 56 >55
Agricultural producer Zrenjanin Participated 45 >55
Agricultural producer Zrenjanin Invited to participate - -
Agricultural producer Zrenjanin Invited to participate - -
6.7.2 The starting point - The meaning of sustainability
The first associations on sustainability are connected with the environmental point of view - they
emphasized importance of different sustainability aspects such as lost of varieties, intensive use of
chemicals, the role of four-course system in crop production ect. Producers also think about economic
conditions such as wheat price volatility, increase of production costs and input-output parity.
61
The statements:
- Environmental aspects
"We have lost varieties, quantity is only important, everything is determined by price." (<40, up to 50ha)
"Well, sustainability, what do I know ...wheat is not so interesting, but we have to plant it...
(Interviewer: Why (though not interesting)?)... Every second year it must be sown so that the soil can be
cleared of sorghum and other grasses." (>55, up to 50 ha)
"Sustainability (besides price) implies the fact that we cannot apply the same culture each year at each field.
If we want to be efficient, we must reduce costs." (40-55, more than 100 ha)
- Economic aspects
"We have to invest a lot, and after production storage capacities take care only on quantity, quality is on
the second place, price is not determined in advance." (>55, up to 50 ha)
"We care only about quantities, we cannot change price, so in our interest is to be more productive." (<40,
up to 50 ha)
"The price is very low. I remember (...when there was another minister...) for 60kg of wheat I got 100kg of
fertilizer, and now you have to give 250kg of wheat for 100kg of KAN. I do not know if anyone takes care
about it (thought on ministry)." (>55, up to 50 ha)
This approach reflects certain "traditionalism". However, the awareness about environmental protection is
present as well. Our interviewees are located in the region of intensive wheat production. Based on their
practices, they use wheat as the culture important for soil quality improvement and control of chemicals
use. It consequently influences production costs, and having in mind the price of wheat, it is not as much as
important alternative as other crops. Farmers less than 40 years might have a different approach.
According to the expert opinion (agricultural advisor) farmers think about economic part of their business
mostly, social or environmental part is less important for them. They are also less oriented toward
community development. "When group of younger farmers think about sustainability they increase area
under crops and start additional business such as trade with seeds and other inputs (they often act as local
suppliers to other producers on the behalf of large traders - importers and exporters)."(Expert - agricultural
advisor)
6.7.3 Policy and regulatory conditions
6.7.3.1 Prioritization in state land leasing
The lease market is characterised by insecure property rights and a relatively high lease tax (20 % of the
lease value) that result in many lease transactions not being officially reported particularly in the Region of
Vojvodina. As a consequence, land-lease contracts are often short-term and do not encourage medium-
term investment in the land or in the development of the farm infrastructure. State land leasing was
introduced recently to improve land market functioning in Serbia. Our discussions were dedicated both to
price of leasing and a huge public discourse about the right to lease state land with positive discrimination
on the behalf of livestock producers.
62
The agricultural advisor stress attention on this issue: "Livestock owners have the right to lease. The other
producers (crop farms) must then be oriented to the land leasing from small farmers and that makes a lot
of troubles. The price goes up, the price of the land leasing is even higher when a new supply of state land
appeared. This is a problem in all cereal regions of Serbia." Additionally, producer (<40, less than 50 ha)
emphasized following: "Livestock farmers receive land at their initial prices and afterwards they give it to
third parties at a higher price and thus earn a profit. For example, one can paid 100 EUR per hectare, and
offer me the same land for 200 EUR per hectare. By doing nothing, he earns 100 EUR per hectare".
The positive discrimination is also foreseen for investments in vertically integrated food processing,
producing energy from renewable energy resources, using agricultural products or by-products as the raw
material, enhancement of the genetic potential in livestock breeding ect. Besides mentioned aggravating
circumstances (seen from the specialized wheat farms only - without own livestock production and no-
alternative production systems connected with bio fuels or energy), the participants pointed out that even
when they managed to lease state land, they have faced with numerous problems in the practice - short
period, administrative issues and increase of overall costs.
The statements:
"I cultivate my own land and state land. I have to add something... The auction commission (thinks of
organizers at the local level) has no idea about anything. We were in this auction, we got a land, and we
haven't received a contract yet... From the legal point we cannot "enter the property" until we get this
contract. What could we do? We cultivated, and somebody can sue us that we entered illegally." (40-55,
more than 100 ha)
"Minimum 5 years. We have to prepare the land in the first year, when you will not get anything ... so you
will only get some yields in the second and third year." (>55, up to 50 ha)
"When these subsidies weren't available, the land leasing was favourable, and after subsidies had
introduced - price of land increased. Again, when the huge private owners start to lease state land, price
increased even more." (40-55, more than 100 ha)
Our participants also pointed out positive discrimination of members of the national minority in Vojvodina -
subsidies are granted for land purchase in Serbia by foreign governments. This type of activity is especially
present in the Bačka region (North Vojvodina).
A statement: "The national minority in Vojvodina is supported by other funds - their country gives them
money to buy land here. I would take their citizenship, if I only could." (40-55, more than 100 ha)
6.7.3.2 Wheat producers between tradition and modern production
Wheat is practically the only winter crop grown in Serbia and therefore plays a significant role in the sowing
structure for crop rotation purposes. Crop rotation can help to control of pests and diseases to maintain
soil quality, and ensure enough nutrients are available to different crops each year. Wheat farmers in the
63
Region of Vojvodina plan their production based on crop rotation. On the other side, research institutes ask
for better understanding of information economy and management system that is governed by informed
choices.
The illustration: Implementation of the ITC in the wheat sector in the Vojvodina Region
The regional government (Vojvodina) - The Agricultural Service advices agricultural producers how to use
their resources in the most efficient and productive way. They use ITC system to communicate and to have
on-line connection (system of prompt replay).
http://5.189.140.16/~svetodavstvo/sites/default/files/dl/smsznanje.pdf
"The proposed agro-meteo-pheno network of sensors distributed throughout an area will generate big sets
of extremely valuable real-time data, which were so far absolutely unavailable. This data will be fused with
data coming from the Collaborative SENTINEL ground station (also foreseen at BioSense), and then
processed to generate useful information for farmers, farms, extension services, companies and finally
government and decision makers. The final information will be tailored to the needs of the end-user and
range from e.g. instructions for optimal fertigation or planning of crops (for farmers), to national and local
yield and price estimates, or indices for subsidies (for the government)."
http://biosens.rs/?page_id=7743&lang=en
Our discussions confirmed usefulness of these information systems particularly to young farmers.
"They can get anything they want from phone. They apply as users of information system in Vojvodina and
they can get any information about their land under crops, quality of plants, perspective yields, meteo
conditions etc." (Expert/agricultural advisor)
The government is improving the growing technology; therefore yields are increasing as more land is
cultivated by professional producers who are better informed about new technologies and modern
production equipment. Serbian wheat farmers use less than half the amount of chemical fertilizers than
farmers in developed countries. Having in mind overall conditions, they aren't guided by promotion of
environmental sustainability - that is a consequence of limited resources at the farm level foremost. As a
result of the limited use of mineral fertilizers and certified planted seeds, crop yields in Serbia are much
lower than in most EU countries. Additionally, about 40% of wheat seeds used by small Serbian farmers
with limited financial resources to buy certified seeds come from the previous crop (they use their own
seeds in production).
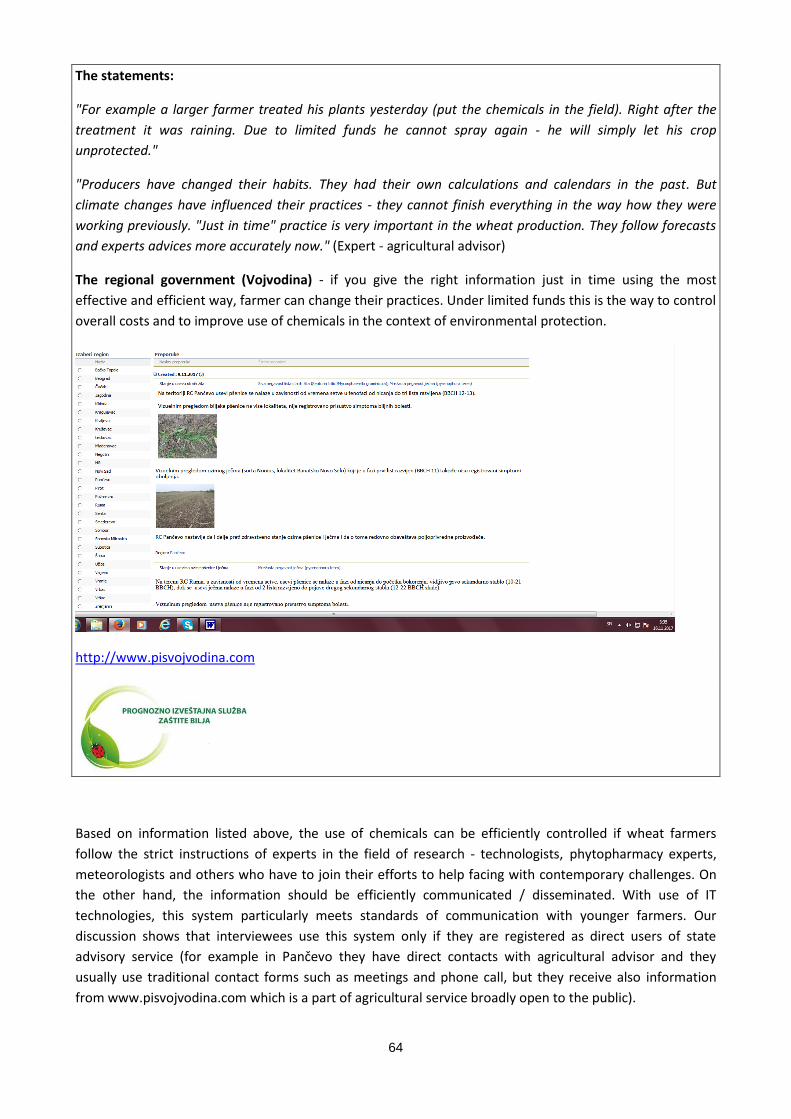
64
The statements:
"For example a larger farmer treated his plants yesterday (put the chemicals in the field). Right after the
treatment it was raining. Due to limited funds he cannot spray again - he will simply let his crop
unprotected."
"Producers have changed their habits. They had their own calculations and calendars in the past. But
climate changes have influenced their practices - they cannot finish everything in the way how they were
working previously. "Just in time" practice is very important in the wheat production. They follow forecasts
and experts advices more accurately now." (Expert - agricultural advisor)
The regional government (Vojvodina) - if you give the right information just in time using the most
effective and efficient way, farmer can change their practices. Under limited funds this is the way to control
overall costs and to improve use of chemicals in the context of environmental protection.
http://www.pisvojvodina.com
Based on information listed above, the use of chemicals can be efficiently controlled if wheat farmers
follow the strict instructions of experts in the field of research - technologists, phytopharmacy experts,
meteorologists and others who have to join their efforts to help facing with contemporary challenges. On
the other hand, the information should be efficiently communicated / disseminated. With use of IT
technologies, this system particularly meets standards of communication with younger farmers. Our
discussion shows that interviewees use this system only if they are registered as direct users of state
advisory service (for example in Pančevo they have direct contacts with agricultural advisor and they
usually use traditional contact forms such as meetings and phone call, but they receive also information
from www.pisvojvodina.com which is a part of agricultural service broadly open to the public).
65
6.7.3.3 Agricultural policy measures
Since 2015, The Ministry of Agriculture and Environmental Protection limited payment of incentives to
smaller farms by reducing the maximum farm size eligible to use subsidies - the farm size limit was reduced
from 100 ha to 20 ha. Approximately 94 percent of registered farmers have up to 20 ha of arable land,
while the remaining 6 percent are big farmers with arable land over 20 ha. According to the new Rulebook
on Allocation of Subsidies for Agriculture Production and Rural Development (adopted in 2017) planting
subsidies for crop production in Serbia are 4,000 RSD/ha (half been earmarked to purchase seeds and the
other half to purchase mineral fertilizers).
The statements:
"All farmers use subsidies for fuel and fertilizers - fuel and mineral fertilizer bills are normally completed.
There are no problems with it." (40-55, up to 50 ha)
"Machinery is bought mostly with commercial loans. There are good credit lines, small interest rates - for
example, there are three years loans paid in two-year instalments with low interest rates. And all
documentation for reimbursement is usually prepared by suppliers, so the buyer can obtain a refund from
the Ministry easily. They do it for their clients (farmers). It is simply part of the service." (<40, more than 100
ha)
"They (subsidies) are primarily significant for medium and large producers. Farmers also use specific
arrangements with input suppliers and pay in kind (with commodity). If the price is 20 RSD/kg at the market,
it doesn't mean that the same price will be if farmer pays in wheat, it can be 18 or even 17 RSD/kg." (>55,
up to 50 ha)
Wheat production has undergone a transformation from a highly profitable subsidized culture, to a more
vulnerable commodity recently. Our research also shows that the policy measures have no significant
impact on farm income in the wheat sector in Serbia. Price fluctuations still play a vital role in farms income
uncertainty. The main idea was to manage the sector development by building efficient infrastructure and
institutions which will enable more market oriented production. However, the new institutions didn't give
the instant improvements - without complementary development of farms sector capacity to use new
forms of contracting, the results in the practice are still negligible. On the other side, the new institutions,
such as public warehouses for crops, aren't as efficient as they could be. Only six public warehouses took
participation in the pilot project for warehouse system development for crops in Serbia (Žitko a.d.,
Žitopromet a.d., Žitoprodukt ad, ZZ Zadrugarka, Jedinstvo a.d., Silos Jakovo a.d. and AD Ratar, source
http://www.kompenzacionifond.gov.rs). It is still not recognized as the alternative by our participants.
The statements:
"The conditions are defined by private warehouses, and the state doesn't want to intervene when it comes
to analysing of our products quality. It can be even of a higher quality, but it is accepted at the same price as
the wheat of the lowest quality." (<40, up to 50ha)
"And what do they do with wheat, we do not know that. It's likely that they separate different qualities
according to standards and sell it at different prices." (40-55, more than 100 ha)
66
High exposure to unforeseen weather conditions caused the widespread need for insurance in the sector.
The government supports agricultural insurance - the agricultural insurance premium subsidies aims on
increasing the number of insurance contracts concluded, in order to reduce potential losses resulting from
risk occurrence. The holder of a commercial family farm are entitle to recourse, amounting to 40% of the
amount of insurance premiums. For example, Montenegro offers subsidies as well, 50% of insurance
premium and in Macedonia, 60% of insurance premium. Slovenia offers 40% subsidies for crops and fruits
insurance premium, while local authorities are allowed to provide additional 10%. Insurance policies
against specific risks are mostly held by professional farmers and agricultural companies. A large number of
small farmers do not hold any insurance policy. In 2014, there were 19,768 insurance policies concluded for
insurance of crops and fruits with total premium of 1,603,900,000 RSD. There were 8,015 claims, out of
which 1,713 were denied. Total accrued damages amounted to 1,062,003,000 RSD (NBS, 2004/2014). In
general, 78.44% of agricultural insurance policies are those related to insurance of crops and fruits. In 2014,
insurance premium for crops and fruits and insurance for animals had a total share of 2.31% in the total
premium in the insurance market in Serbia, which indicated that agricultural insurance was
underdeveloped.
The statements:
"We cannot influence climate change, and the insurance conditions are not suitable for our market. In order
to act against the risks we need to introduce irrigation on the farm, even hails protection system, and for all
of it we need the additional investment." (<40, up to 50 ha)
"We expect too much from farmers. And when he invests in insurance, the question is how much one can
get after damage assessment performed by the insurance company." (>55, from 50-100 ha)
"Storm, hails and drought. I don't think drought is covered by these insurance policies. The state should
declare a weather disaster and only then we can count on extra money." (40-55. up to 50 ha)
"Last year, the hail destroyed the whole production and we didn't have insurance. We submitted a request
to the municipality, but we didn't receive anything. Instead, we had to pay more taxes for water
management and plus regular taxes on land." (40-55, up to 50 ha)
"It could work ... although insurance companies are looking to pay less; they say that we don't read letters
in small caps somewhere in the contract." (<40, from 50-100 ha)
"I've been thinking about it, but since it requires the big procedure I wasn't ready to take the action, I think
that it is disadvantageous for us ... just one more thing to pay on our list." (>55, up to 50 ha)
The potential agricultural insurance market in Serbia depends also on the agricultural households’
specialization. The legal entities and entrepreneurs sector (agribusiness from the theoretical point of view)
is found to be more specialized than the family farms sector in Serbia (Stojanović, Popović-Petrović,
Rakonjac, 2014). Specialized farms are more prompt to use out-of-farm methods of risk control, including
the agricultural insurance, while farms with the mixed production structure keep the track of traditional
risk diversification using the on-the-farm methods. However, the total sector capacity to use the
agricultural insurance is determined both by family and legal and entrepreneurs sector specialization.
Finally, our interviewees in Vojvodina also emphasized importance of rural development measures for
multifunctional development. Our agricultural expert pointed on this issue: "Agrarian is not same as rural
policy. They differ in approaches whether agriculture plays vital or complementary role in economic and
social development. In our case, rural policy is important for rural infrastructure development. In rural
67
areas, we have other activities of public importance, e.g. small processing capacities that are not even tied
to agriculture. Rural policy supports overall quality of living conditions in the countryside." Rural areas in
Serbia are significantly different in social, economic and demographic characteristics. Basic problems and
trends faced by almost all rural areas are migration, agriculture as the dominant economic activity, high
unemployment rate, lack of employment opportunities, poor and underdeveloped infrastructure and low
GDP per capita compared with urban regions. Most of sub-regions in Vojvodina are defined as areas with
highly productive agricultural and integrated economy. In these areas a highly productive agriculture is
present with better structure of farms (larger farms with higher productivity of land) and vertical
integration with agricultural and food sector. Compared to the level of the Republic of Serbia, services and
industrial sector are better developed in these areas as well.
6.7.4 Market conditions
6.7.4.1 Uncertainty and price volatility
Farmers are very concerned about wheat price. Other field crops (corn, sunflower, barley, soy) for the past
few years have been more profitable than wheat in Serbia. Additionally, a particular problem appears
during harvest season when price reaches minimum. Due to the lack of stable institutional arrangements
agricultural producers simply depend on price which is completely defined in accordance with interests of
large traders or exporters.
The statements:
"The biggest problem is the price - it must be guaranteed, it must be known in advance, and then I will know
what to sow I even don't want to go in the field without knowing the price of the cereal, to whom I will sell it
... When I put my wheat on storage, trader takes 1% of the goods on a monthly basis. In Melenci (small
village in Vojvodina) there are 7 traders (with small capacity) and everyone is paying differently. The price of
grain cannot go up in two days, down in the next five days during the harvest season." (>55, less than 50 ha)
"Now it's being advocated that everyone should make its own warehouse, to keep his goods after the
harvest, and small producers cannot do it." (<40, from 50-100 ha)
Farmers are also concerned about the price of inputs. For example, total planting costs of wheat have
increased 10-15 percent in 2016, mostly due to the increased costs of diesel fuel. The current price of diesel
fuel is 143 RSD/lit for spring planting, compared to 128 RSD/lit in March 2016. Farmers usually think in
terms of input-output parity. Generally, producers apply strategy related to large scale crop production -
they are primarily oriented toward productivity growth - they want to produce as much as they can with
limited input use.
The statements:
"Price of product is the first problem. We don't know it in advance, and that is also connected with price of
inputs - seeds, fertilizers and other chemicals." (<40, from 50-100 ha)
68
"Every year the price of fertilizers is higher, and we do not know the price of our final products in advance...I
would like to know what will be my income. We all work for money; everyone wants to have as much
income as possible. And wheat price is constantly goes down." (40-55, more than 100 ha)
"Trader usually sells inputs for wheat production - and he tells you the price: if you want to pay immediately
you have one price, and the other is the price if you pay later, in two or three months. There are 3-4 types of
prices (payment by July, payment by autumn ... ) The worst problem is that we don't have money and time
to go from one place to another to find more favourable conditions, and you are simply forced to take a
deferred payment from a local trader - which is the worst option ever." (>55, up to 50 ha)
"The debt for the raw material is calculated in EUR. The worst is if you have to pay it in the grain, but you do
not know the price of the grain at the moment of contracting." (40-55, from 50-100 ha)
"There are no decisions about varieties, it has no influence or at most, it has very limited influence on our
decision making process. We only care about price. Price dictates what will be sowed. At the end, nobody
ask us about the wheat quality." (<40, up to 50 ha)
The overall impression is that farmers don't have sufficient knowledge to manage the market position.
Strategies related to the use of modern instruments in the financial market (contracting using commodity
derivatives) aren’t option mentioned by participants. They even don't think about warehouse receipts and
commercial loans. Instead of price risk control, they usually take position of price takers and decide about
production based on current prices and sowing structure in crop rotation.
6.7.4.2 The chain structure, institutional arrangements and financing
Family farms usually sell their crops to traders and milling companies’ immediately after the harvest. The
milling companies take advantage of their large storage capacity to negotiate competitive prices from the
farmers. However, for the past couple of years, the government has started to intervene by providing
storage subsidies in order to allow smaller farmers to store their wheat and then sell it later when wheat
prices are more advantageous (The Public Warehousing System). Nevertheless, large trade companies also
act as the input suppliers and take double advantage over farmers - as input trader and buyer of the
commodity for export at the same time.
The statements:
"After the harvest wheat goes to warehouses. We are charged for storage (services) until sell supplies to
large traders - mostly exporters." (<40, from 50 - 100 ha)
"Exporters of wheat are often input importers. They are large players, they have their own production. Ten
of us can gather and we will have only 1000 t of wheat. Where can we export it? It does not go that way, it
goes through other organizations." (40-55, more than 100 ha)
"The organization is very important. The advanced producer can have another company who deals with the
supply of inputs and the sale of raw materials. It usually integrates different stages from production to sale,
including procurement of inputs to other farmers, their partners." (Agricultural advisor)
69
Having in mind very limited implementation of public warehousing system in the practice, the
complementary law on Pre-Harvest Financing of Agricultural Production was introduced in June, 2016.
Adoption of this law arose from the need to increase the volume of primary agricultural production by
improving existing financing. The law allows the use of future production (crops, fruits, vegetables, etc.) to
be used as a form of collateral to secure a loan. The law also envisages that the contract relating to the
financing be entered into a registry, so it will be possible to check whether a parcel of farmland is
encumbered with a loan. The whole project was financed by the European Bank for Reconstruction and
Development (EBRD) who helped the Serbian Ministry of Agriculture and Environmental Protection draft
the law and the software for the registration of contracts, along with the UN Food and Agriculture
Organization (FAO). This law wasn't even mentioned by our participants during discussions. The so-called
"green" sales become common in our practice. This mainly involves the sale of products that have not yet
been finalized or harvested from the field. In the sale in green, however, it is also possible to include the
raw materials in the natural exchange. In this way a part of the produce is sold in advance.
When it comes to financing of farm business, particular problem is connected with financing of new
technologies and inputs. The continuing request to modernize production exists. Wheat producers cannot
compete at the market if they don't apply new technologies. They have to buy new equipment which is
very expensive. Our farmer emphasized: "I care most for input-output parities. If I want to invest in
mechanization, I have to save on fertilizers and seeds." In Serbia, 95% of all tractors are older than 10 years.
Serbian farmers also use harvesters with an obsolete technology, and the agricultural equipment seen on
Serbian fields can be still seen only in undeveloped countries. “Despite this under-utilization, Serbian
agricultural sectors still manages to produce more than domestic demand and has been recording surplus
in external trade. Outdated agricultural machinery and equipment is one of the reasons why our
agricultural potential hasn’t been fully utilized.” (Expert)
A particular problem is the lack of cooperation or various forms of associations in the sector. Agricultural
producers take the role of individual actors in the market and thus reduce the chance to impact on price
formation. Cooperatives in Serbia are faced with numerous problems: management system is complicated
and sometimes insufficiently professional and does not match the needs of modern agricultural production,
cooperative members who are able to bear the risk are not motivated due to possible risk/benefit
asymmetry, cooperatives either do not have property (new ones) or the property is treated as socially
owned and the disposal of which requires consent of the Privatization Agency through a long and uncertain
process. Cooperatives have a great number of advantages, such as: a) trust of cooperative members in
collective work, particularly strengthened through the system of collective decision-making and entrusting
enforcement of the decisions and reporting on their implementation to one of their members (director); b)
non-profit nature of the cooperative – which assures the participants in the collective operation that only
most necessary costs will be collected; c) social functions of the cooperative – for which it is easier to
accept than it is for a company, due to its non-profit nature, the financing of social activities in the village.
Cooperatives, in Serbian economy, are moving in the right direction, but slowly and often in back and forth
manner.
The illustration of positive aspects and problems based on FGD participants statements
"I remember as a child that everything went through the cooperative." (>55, less than 50 ha)
70
"5-6 farmers can cooperate in a village; it's already a sort of safety net for peasants." (<40, less than 50 ha)
"When we buy machinery, we could buy one instead of five machines using a cooperative. We could make
our own silo, as an association you can simply compete on the market." (40-55, from 50 to 100 ha)
but...
"We had cooperatives in the past, it was a good thing - you had to give your products to the organization
and people were satisfied. For example, Agrovet bought Zemproz (the agricultural cooperative in Melenci,
small rural place near Zrenjanin where FGD took place). And I am asking myself - how was someone able to
buy something that is a village property?" (>55, from 50-100 ha)
"The problem is that the cooperative ownership somehow passed into the hands of a private person. People
once had a negative experience in cooperative business ... to entrust someone with my property, machines,
etc. it is hard to believe." (<40, from 50-100 ha)
"The state destroyed co-operatives ten years ago and now they want cooperatives on the market scene."
(40-55,more than 100 ha)
6.7.5 How do sector stakeholders perceive their strategies?
Wheat is winter crop grown in Serbia that plays a vital role in the sowing structure for crop rotation
purposes. Parallel, the Serbian agrarian policy of subsidies per hectare for the past two years has been less
favourable to wheat farmers. Competition from other field crops (corn, sunflower, barley, soy) is high - for
the past few years they have been more profitable than wheat. As the individuals cannot influence the
price directly due to low market power, the main idea was to build up infrastructure for price control based
on warehouse system and related financial instruments. This form of institutional innovation has faced
numerous problems in the practice due to identified inconsistencies and lack of knowledge for new
strategies implementation.
An alternative could be connected with structural shifts to large family farms with improving the growing
technology, better informed choices on inputs, production and trade. This alternative is particularly
emphasized from the policy makers’ point of view. Farmers included in interviewing recognized the
production related options only - technology improvements based on modern inputs or product
reorientation.
6.7.5.1 Technology improvements and increasing farm ownership
Winter wheat production accounts for one third of the entire field crops production in Serbia, which can be
explained as a need for optimizing sowing structure and following a crop rotation on farms. Our farmers
take wheat production as the second best alternative - they use this crop culture to assure land quality and
preserve environment. So, they don't use it for profit itself, but for traditional reasons (intensive, but more
environmentally oriented production). Although they are forced to use wheat in their sowing structure, this
doesn't mean that they aren't interested in different risk insurance methods for increase of yields and to
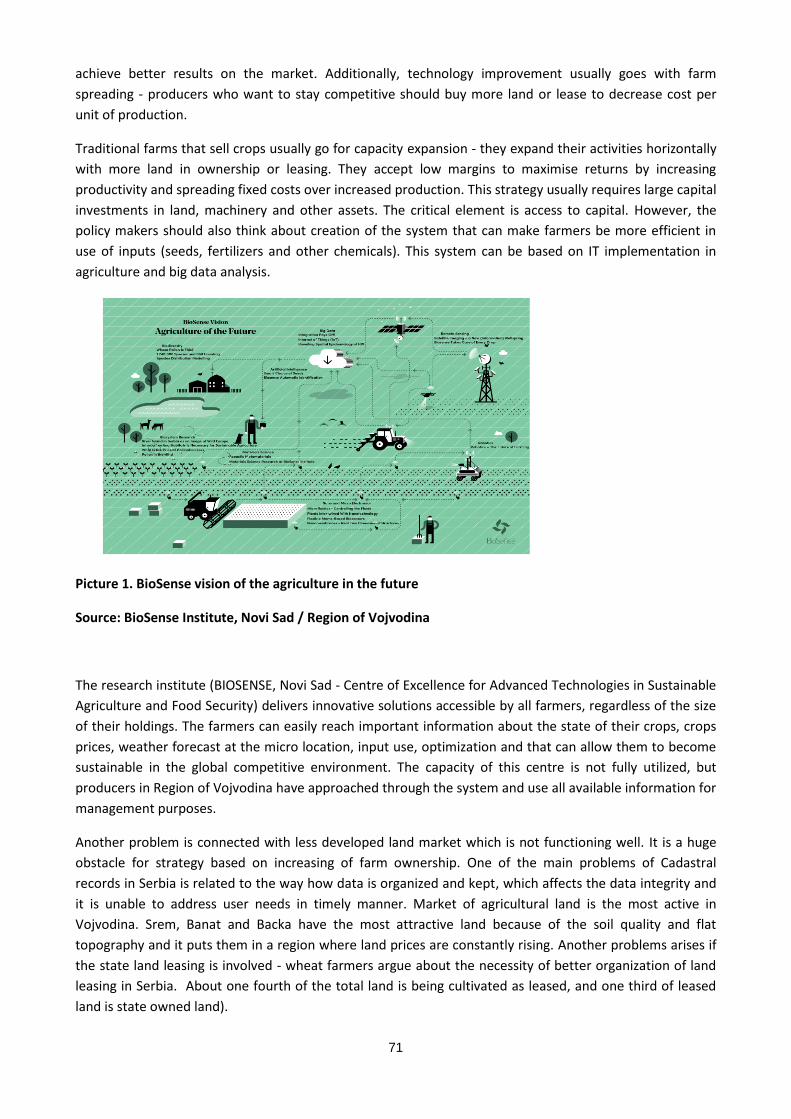
71
achieve better results on the market. Additionally, technology improvement usually goes with farm
spreading - producers who want to stay competitive should buy more land or lease to decrease cost per
unit of production.
Traditional farms that sell crops usually go for capacity expansion - they expand their activities horizontally
with more land in ownership or leasing. They accept low margins to maximise returns by increasing
productivity and spreading fixed costs over increased production. This strategy usually requires large capital
investments in land, machinery and other assets. The critical element is access to capital. However, the
policy makers should also think about creation of the system that can make farmers be more efficient in
use of inputs (seeds, fertilizers and other chemicals). This system can be based on IT implementation in
agriculture and big data analysis.
Picture 1. BioSense vision of the agriculture in the future
Source: BioSense Institute, Novi Sad / Region of Vojvodina
The research institute (BIOSENSE, Novi Sad - Centre of Excellence for Advanced Technologies in Sustainable
Agriculture and Food Security) delivers innovative solutions accessible by all farmers, regardless of the size
of their holdings. The farmers can easily reach important information about the state of their crops, crops
prices, weather forecast at the micro location, input use, optimization and that can allow them to become
sustainable in the global competitive environment. The capacity of this centre is not fully utilized, but
producers in Region of Vojvodina have approached through the system and use all available information for
management purposes.
Another problem is connected with less developed land market which is not functioning well. It is a huge
obstacle for strategy based on increasing of farm ownership. One of the main problems of Cadastral
records in Serbia is related to the way how data is organized and kept, which affects the data integrity and
it is unable to address user needs in timely manner. Market of agricultural land is the most active in
Vojvodina. Srem, Banat and Backa have the most attractive land because of the soil quality and flat
topography and it puts them in a region where land prices are constantly rising. Another problems arises if
the state land leasing is involved - wheat farmers argue about the necessity of better organization of land
leasing in Serbia. About one fourth of the total land is being cultivated as leased, and one third of leased
land is state owned land).
72
6.7.5.2 Product reorientation - start with the new combination of crops or leave the business
Prompt to address the possibility for production reorientation, younger farmers set out a strategy for
combining production of wheat and vegetable crops (cabbage). The main crops have the longest
vegetation, and for this reason the longest period of time remains on the production areas, while the
previous and subsequent crops of a significantly shorter vegetative period and session are planted before
or after the main crops. What are the main benefits? First, taking into account the economic aspect of
growing subsequent crops, it comes to the conclusion that this kind of production is a good way to make a
greater profit. Namely, an economic index of this type of production is 1.5, which means that the annual
revenue per unit area is increased by a minimum of 1.5 times. Second, by cultivating post-crops, the
available land is used more rationally, which, after harvest, generally remains unsalted and without green
cover, the soil loses moisture which makes the cultivating of such a land more difficult. Third, unprotected
soil is a subject to erosion. It can be prevent by subsequent sowing. Fourth, the land without crops is
rapidly wrapped up and the weeds are vectors of transmitters of certain pathogens of plant diseases and
pests that are potentially dangerous for neighbouring crops, suggesting that it is better to have crop on the
plot throughout the year. Although positive examples of cultivation of post-cultures have been proven
through practice, in our country this production technology is represented in a small percentage. In
addition to the aforementioned positive effects, subsequent sowing has also limiting factors - temperatures
and rainfall.
The statement:
"Marginal producers will disappear from the scene. Those who are on the border to survive from agriculture
can change their production, turn from wheat to vegetables growing with the desire to sell their products on
a green market. Once again, when prices of wheat are rising, producers will again sow wheat. When a price
of wheat goes down, they sow vegetables." (Policy maker)
"The producer decides on the basis of the price - he makes changes in the production structure. He can
produce sunflower and corn; he doesn't take care if it is bad as many pathogens might occur on corn, for
example. If the price of wheat is too low in September/October, he might decide to produce another culture.
He can also combine potatoes." (Agricultural adviser)
The purchase and use of irrigation systems in our country is not so frequent and the irrigation capacities are
still small and insufficient, but in recent years they have been increasing through the competitions
announced by the Ministry of Agriculture and Environmental Protection and the Provincial Secretariat for
Agriculture, Water Management and Forestry. Sometimes good production results can be achieved even
without irrigation, if the weather conditions are favourable and if, after the harvest of the main crop, the
appropriate agro-technology is quickly and correctly applied (timely processing of soil immediately after
removal of crops, as this influences the preservation of the soil moisture necessary for next crop).
The other alternative might be to quit the business, sell the property (land and other assets) and have
business out of agriculture. Having in mind traditional orientation of producers in Serbia ("land of
grandfathers is not on the sell"), it is not a real opportunity. However, continuing existence in rural areas
with inefficient agricultural production is not a solution both from producer and policy makers’ perspective.
73
6.7.5.3 Risk control and institutional improvements
Wheat is an open pollinating crop and hence not very attractive for investments. Serbia belongs to low
wheat yields regions highly dependent on weather conditions. Therefore financial risk management tools
should have more importance in the practice. Wheat is generally delivered into warehouse with grain
handling companies. If stored on farm then it is usually sold into the domestic market. The warehouse
companies / traders usually sell wheat to domestic industry or at the foreign markets. The new trade
arrangements are highly recommended such as credit based on warehouse receipt, pre-financing models
for wheat producers, new forms of contracting between farmers and traders, including the hedging
strategies with commodity derivatives. However, this system is still in its infancy in Serbia. Our respondents
argue about necessity of integrative approach - new legislation, new institutions, new instruments cannot
be efficiently implemented in the practice without good education programmes for targeted groups of
farmers that are able to use new financial instruments in price risk control.
Finally, all strategies combine bottom-up with top-down approach aiming on different risks control
(weather, productivity growth, control of chemicals use, quality improvement, standardization, price
volatility, income diversification, new technologies implementation and control of costs of fixed and
variable inputs).
6.7.6 JUST IMAGINE YOUR BUSINESS IN 2027
At the end of conversation we asked our participants to address the vision of their business in the line of
the next 10 years. The box below includes their visions from qualifications such as I don't care about the
future at all, to listing of different problems that are seen as the main obstacles for the sector development
in the future. Farmers argue about necessity to give the fair chance to family business development such as
the companies organized as agribusiness industry have in Serbia. Elderly also might think about retirement
scheme which will allow generation change with better opportunity to develop modern farms businesses.
The statements:
"You are asking me what will be in the next ten years, I do not know what will happen tomorrow." (>55, less
than 50 ha)
"My neighbour worked on 100 acres, has three tractors and a combine. Now, his land is leased, and the he
wants to sell his machines ... He says it's no longer worth doing." (<40, from 50-100 ha)
"I hope it will be better. I have children and I hope that it will be better, but it is difficult to achieve. We are
going to have very big problems with the use of chemicals; the land will be contaminated "... The livestock
fund has decreased, there is less and less organic fertilization, we use chemicals, it will bring our land to be
of poor quality." (<40, less than 50 ha)
"The younger should think about it, and we, elderly, should think about retirement. In the 1980s, we still had
good livelihoods from agriculture, and from 1990 to 2000 we were completely destroyed, we were doing our
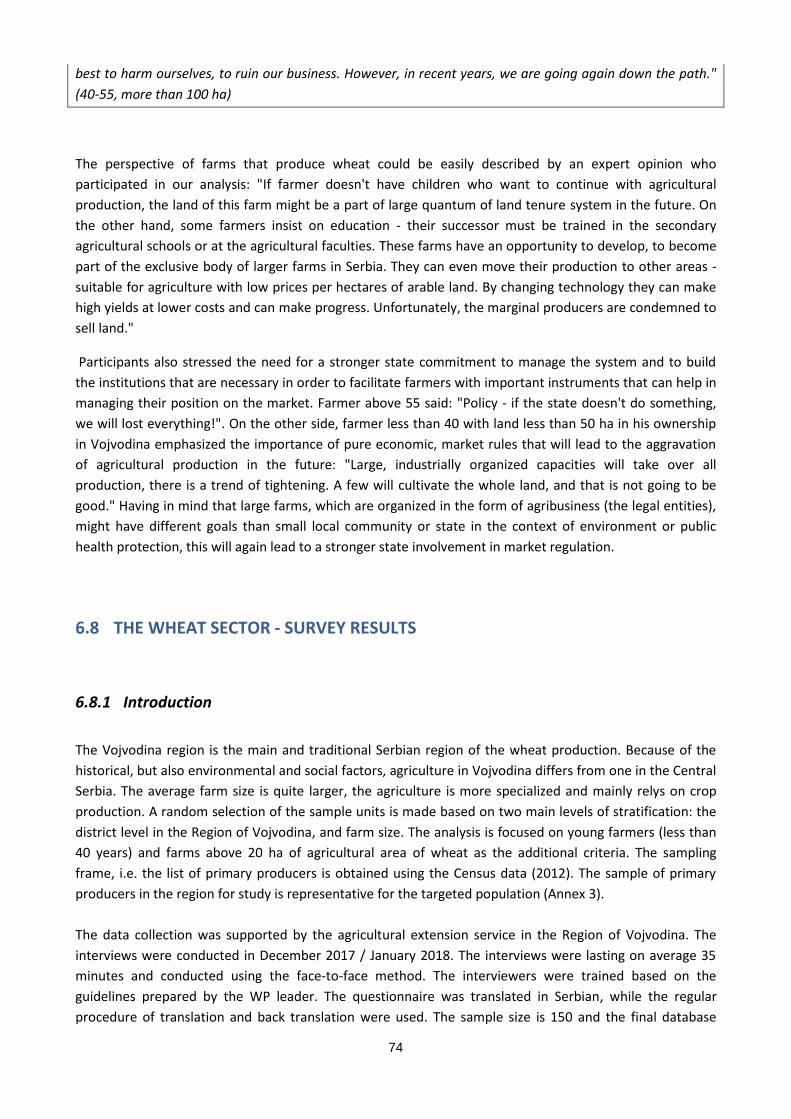
74
best to harm ourselves, to ruin our business. However, in recent years, we are going again down the path."
(40-55, more than 100 ha)
The perspective of farms that produce wheat could be easily described by an expert opinion who
participated in our analysis: "If farmer doesn't have children who want to continue with agricultural
production, the land of this farm might be a part of large quantum of land tenure system in the future. On
the other hand, some farmers insist on education - their successor must be trained in the secondary
agricultural schools or at the agricultural faculties. These farms have an opportunity to develop, to become
part of the exclusive body of larger farms in Serbia. They can even move their production to other areas -
suitable for agriculture with low prices per hectares of arable land. By changing technology they can make
high yields at lower costs and can make progress. Unfortunately, the marginal producers are condemned to
sell land."
Participants also stressed the need for a stronger state commitment to manage the system and to build
the institutions that are necessary in order to facilitate farmers with important instruments that can help in
managing their position on the market. Farmer above 55 said: "Policy - if the state doesn't do something,
we will lost everything!". On the other side, farmer less than 40 with land less than 50 ha in his ownership
in Vojvodina emphasized the importance of pure economic, market rules that will lead to the aggravation
of agricultural production in the future: "Large, industrially organized capacities will take over all
production, there is a trend of tightening. A few will cultivate the whole land, and that is not going to be
good." Having in mind that large farms, which are organized in the form of agribusiness (the legal entities),
might have different goals than small local community or state in the context of environment or public
health protection, this will again lead to a stronger state involvement in market regulation.
6.8 THE WHEAT SECTOR - SURVEY RESULTS
6.8.1 Introduction
The Vojvodina region is the main and traditional Serbian region of the wheat production. Because of the
historical, but also environmental and social factors, agriculture in Vojvodina differs from one in the Central
Serbia. The average farm size is quite larger, the agriculture is more specialized and mainly relys on crop
production. A random selection of the sample units is made based on two main levels of stratification: the
district level in the Region of Vojvodina, and farm size. The analysis is focused on young farmers (less than
40 years) and farms above 20 ha of agricultural area of wheat as the additional criteria. The sampling
frame, i.e. the list of primary producers is obtained using the Census data (2012). The sample of primary
producers in the region for study is representative for the targeted population (Annex 3).
The data collection was supported by the agricultural extension service in the Region of Vojvodina. The
interviews were conducted in December 2017 / January 2018. The interviews were lasting on average 35
minutes and conducted using the face-to-face method. The interviewers were trained based on the
guidelines prepared by the WP leader. The questionnaire was translated in Serbian, while the regular
procedure of translation and back translation were used. The sample size is 150 and the final database
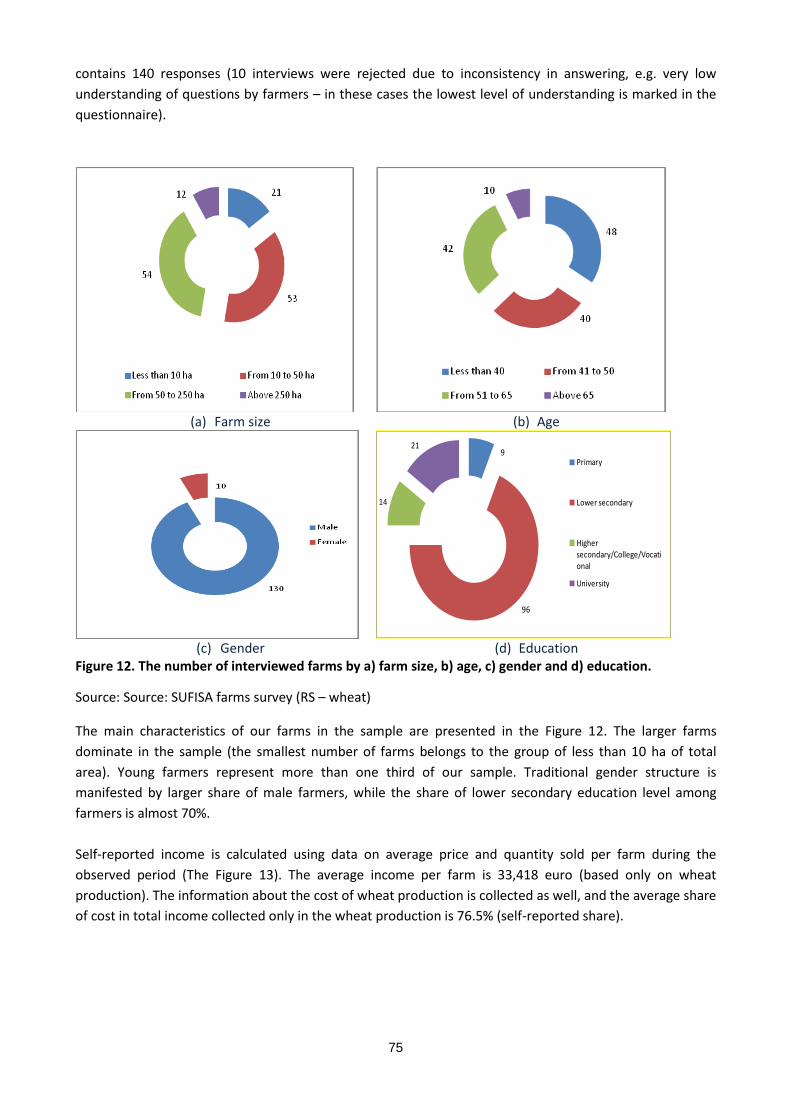
75
contains 140 responses (10 interviews were rejected due to inconsistency in answering, e.g. very low
understanding of questions by farmers – in these cases the lowest level of understanding is marked in the
questionnaire).
(a) Farm size (b) Age
9
96
14
21
Primary
Lower secondary
Higher secondary/College/Vocational
University
(c) Gender (d) Education
Figure 12. The number of interviewed farms by a) farm size, b) age, c) gender and d) education.
Source: Source: SUFISA farms survey (RS – wheat)
The main characteristics of our farms in the sample are presented in the Figure 12. The larger farms
dominate in the sample (the smallest number of farms belongs to the group of less than 10 ha of total
area). Young farmers represent more than one third of our sample. Traditional gender structure is
manifested by larger share of male farmers, while the share of lower secondary education level among
farmers is almost 70%.
Self-reported income is calculated using data on average price and quantity sold per farm during the
observed period (The Figure 13). The average income per farm is 33,418 euro (based only on wheat
production). The information about the cost of wheat production is collected as well, and the average share
of cost in total income collected only in the wheat production is 76.5% (self-reported share).
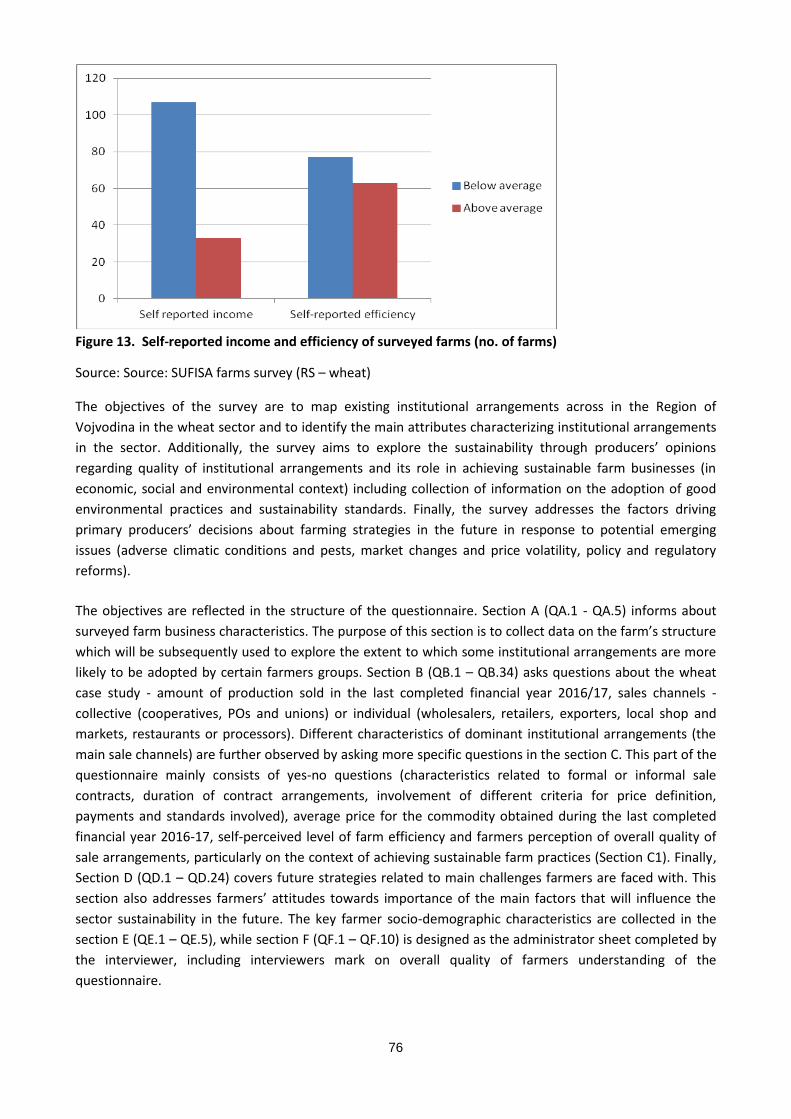
76
Figure 13. Self-reported income and efficiency of surveyed farms (no. of farms)
Source: Source: SUFISA farms survey (RS – wheat)
The objectives of the survey are to map existing institutional arrangements across in the Region of
Vojvodina in the wheat sector and to identify the main attributes characterizing institutional arrangements
in the sector. Additionally, the survey aims to explore the sustainability through producers’ opinions
regarding quality of institutional arrangements and its role in achieving sustainable farm businesses (in
economic, social and environmental context) including collection of information on the adoption of good
environmental practices and sustainability standards. Finally, the survey addresses the factors driving
primary producers’ decisions about farming strategies in the future in response to potential emerging
issues (adverse climatic conditions and pests, market changes and price volatility, policy and regulatory
reforms).
The objectives are reflected in the structure of the questionnaire. Section A (QA.1 - QA.5) informs about
surveyed farm business characteristics. The purpose of this section is to collect data on the farm’s structure
which will be subsequently used to explore the extent to which some institutional arrangements are more
likely to be adopted by certain farmers groups. Section B (QB.1 – QB.34) asks questions about the wheat
case study - amount of production sold in the last completed financial year 2016/17, sales channels -
collective (cooperatives, POs and unions) or individual (wholesalers, retailers, exporters, local shop and
markets, restaurants or processors). Different characteristics of dominant institutional arrangements (the
main sale channels) are further observed by asking more specific questions in the section C. This part of the
questionnaire mainly consists of yes-no questions (characteristics related to formal or informal sale
contracts, duration of contract arrangements, involvement of different criteria for price definition,
payments and standards involved), average price for the commodity obtained during the last completed
financial year 2016-17, self-perceived level of farm efficiency and farmers perception of overall quality of
sale arrangements, particularly on the context of achieving sustainable farm practices (Section C1). Finally,
Section D (QD.1 – QD.24) covers future strategies related to main challenges farmers are faced with. This
section also addresses farmers’ attitudes towards importance of the main factors that will influence the
sector sustainability in the future. The key farmer socio-demographic characteristics are collected in the
section E (QE.1 – QE.5), while section F (QF.1 – QF.10) is designed as the administrator sheet completed by
the interviewer, including interviewers mark on overall quality of farmers understanding of the
questionnaire.
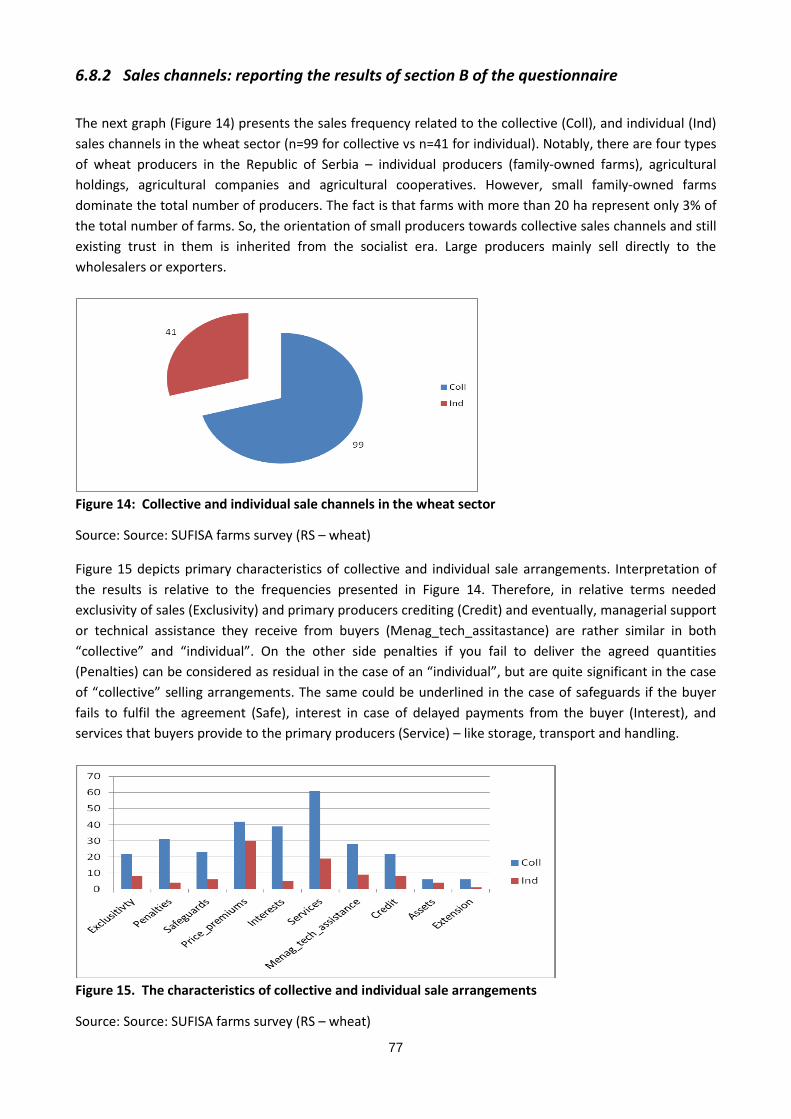
77
6.8.2 Sales channels: reporting the results of section B of the questionnaire
The next graph (Figure 14) presents the sales frequency related to the collective (Coll), and individual (Ind)
sales channels in the wheat sector (n=99 for collective vs n=41 for individual). Notably, there are four types
of wheat producers in the Republic of Serbia – individual producers (family-owned farms), agricultural
holdings, agricultural companies and agricultural cooperatives. However, small family-owned farms
dominate the total number of producers. The fact is that farms with more than 20 ha represent only 3% of
the total number of farms. So, the orientation of small producers towards collective sales channels and still
existing trust in them is inherited from the socialist era. Large producers mainly sell directly to the
wholesalers or exporters.
Figure 14: Collective and individual sale channels in the wheat sector
Source: Source: SUFISA farms survey (RS – wheat)
Figure 15 depicts primary characteristics of collective and individual sale arrangements. Interpretation of
the results is relative to the frequencies presented in Figure 14. Therefore, in relative terms needed
exclusivity of sales (Exclusivity) and primary producers crediting (Credit) and eventually, managerial support
or technical assistance they receive from buyers (Menag_tech_assitastance) are rather similar in both
“collective” and “individual”. On the other side penalties if you fail to deliver the agreed quantities
(Penalties) can be considered as residual in the case of an “individual”, but are quite significant in the case
of “collective” selling arrangements. The same could be underlined in the case of safeguards if the buyer
fails to fulfil the agreement (Safe), interest in case of delayed payments from the buyer (Interest), and
services that buyers provide to the primary producers (Service) – like storage, transport and handling.
Figure 15. The characteristics of collective and individual sale arrangements
Source: Source: SUFISA farms survey (RS – wheat)
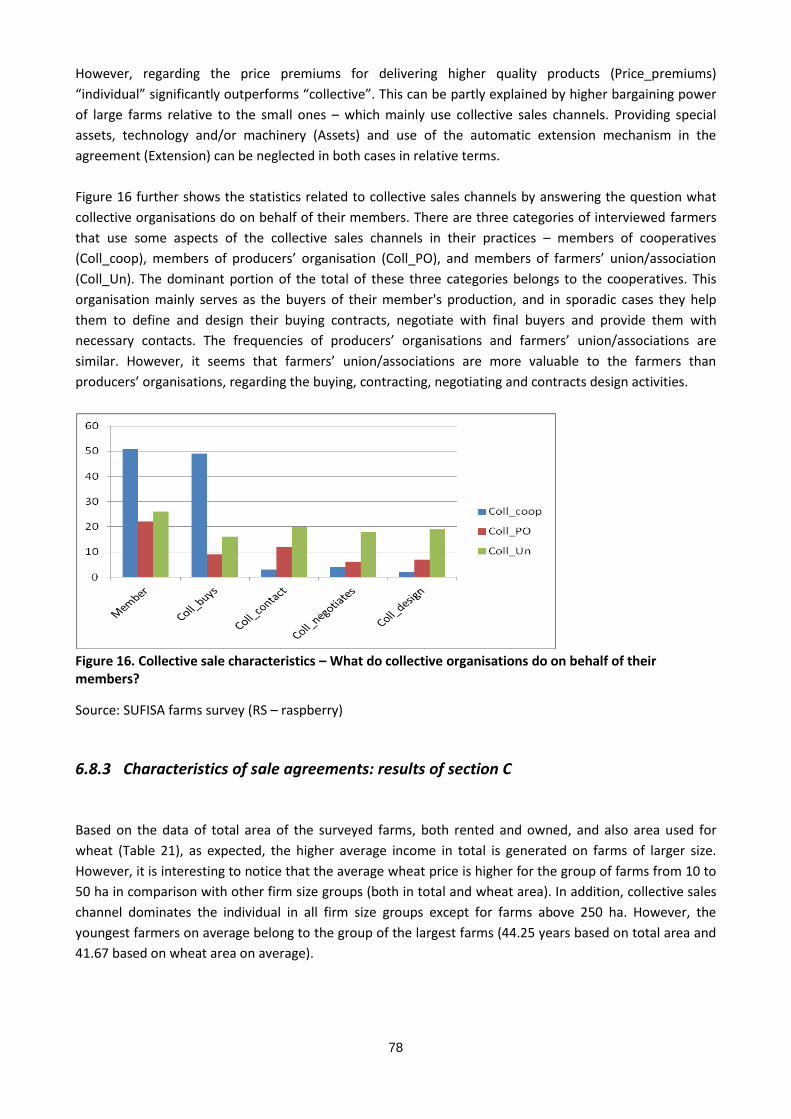
78
However, regarding the price premiums for delivering higher quality products (Price_premiums)
“individual” significantly outperforms “collective”. This can be partly explained by higher bargaining power
of large farms relative to the small ones – which mainly use collective sales channels. Providing special
assets, technology and/or machinery (Assets) and use of the automatic extension mechanism in the
agreement (Extension) can be neglected in both cases in relative terms.
Figure 16 further shows the statistics related to collective sales channels by answering the question what
collective organisations do on behalf of their members. There are three categories of interviewed farmers
that use some aspects of the collective sales channels in their practices – members of cooperatives
(Coll_coop), members of producers’ organisation (Coll_PO), and members of farmers’ union/association
(Coll_Un). The dominant portion of the total of these three categories belongs to the cooperatives. This
organisation mainly serves as the buyers of their member's production, and in sporadic cases they help
them to define and design their buying contracts, negotiate with final buyers and provide them with
necessary contacts. The frequencies of producers’ organisations and farmers’ union/associations are
similar. However, it seems that farmers’ union/associations are more valuable to the farmers than
producers’ organisations, regarding the buying, contracting, negotiating and contracts design activities.
Figure 16. Collective sale characteristics – What do collective organisations do on behalf of their members?
Source: SUFISA farms survey (RS – raspberry)
6.8.3 Characteristics of sale agreements: results of section C
Based on the data of total area of the surveyed farms, both rented and owned, and also area used for
wheat (Table 21), as expected, the higher average income in total is generated on farms of larger size.
However, it is interesting to notice that the average wheat price is higher for the group of farms from 10 to
50 ha in comparison with other firm size groups (both in total and wheat area). In addition, collective sales
channel dominates the individual in all firm size groups except for farms above 250 ha. However, the
youngest farmers on average belong to the group of the largest farms (44.25 years based on total area and
41.67 based on wheat area on average).
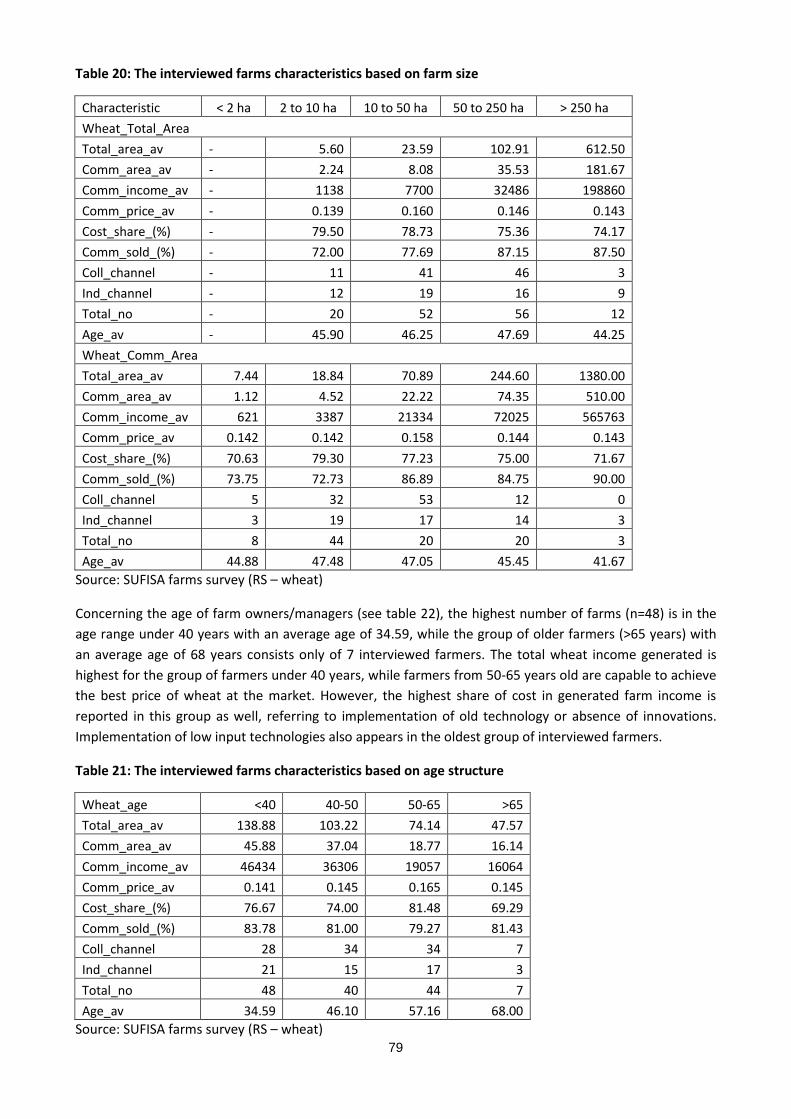
79
Table 20: The interviewed farms characteristics based on farm size
Characteristic < 2 ha 2 to 10 ha 10 to 50 ha 50 to 250 ha > 250 ha
Wheat_Total_Area
Total_area_av - 5.60 23.59 102.91 612.50
Comm_area_av - 2.24 8.08 35.53 181.67
Comm_income_av - 1138 7700 32486 198860
Comm_price_av - 0.139 0.160 0.146 0.143
Cost_share_(%) - 79.50 78.73 75.36 74.17
Comm_sold_(%) - 72.00 77.69 87.15 87.50
Coll_channel - 11 41 46 3
Ind_channel - 12 19 16 9
Total_no - 20 52 56 12
Age_av - 45.90 46.25 47.69 44.25
Wheat_Comm_Area
Total_area_av 7.44 18.84 70.89 244.60 1380.00
Comm_area_av 1.12 4.52 22.22 74.35 510.00
Comm_income_av 621 3387 21334 72025 565763
Comm_price_av 0.142 0.142 0.158 0.144 0.143
Cost_share_(%) 70.63 79.30 77.23 75.00 71.67
Comm_sold_(%) 73.75 72.73 86.89 84.75 90.00
Coll_channel 5 32 53 12 0
Ind_channel 3 19 17 14 3
Total_no 8 44 20 20 3
Age_av 44.88 47.48 47.05 45.45 41.67
Source: SUFISA farms survey (RS – wheat)
Concerning the age of farm owners/managers (see table 22), the highest number of farms (n=48) is in the
age range under 40 years with an average age of 34.59, while the group of older farmers (>65 years) with
an average age of 68 years consists only of 7 interviewed farmers. The total wheat income generated is
highest for the group of farmers under 40 years, while farmers from 50-65 years old are capable to achieve
the best price of wheat at the market. However, the highest share of cost in generated farm income is
reported in this group as well, referring to implementation of old technology or absence of innovations.
Implementation of low input technologies also appears in the oldest group of interviewed farmers.
Table 21: The interviewed farms characteristics based on age structure
Wheat_age <40 40-50 50-65 >65
Total_area_av 138.88 103.22 74.14 47.57
Comm_area_av 45.88 37.04 18.77 16.14
Comm_income_av 46434 36306 19057 16064
Comm_price_av 0.141 0.145 0.165 0.145
Cost_share_(%) 76.67 74.00 81.48 69.29
Comm_sold_(%) 83.78 81.00 79.27 81.43
Coll_channel 28 34 34 7
Ind_channel 21 15 17 3
Total_no 48 40 44 7
Age_av 34.59 46.10 57.16 68.00
Source: SUFISA farms survey (RS – wheat)
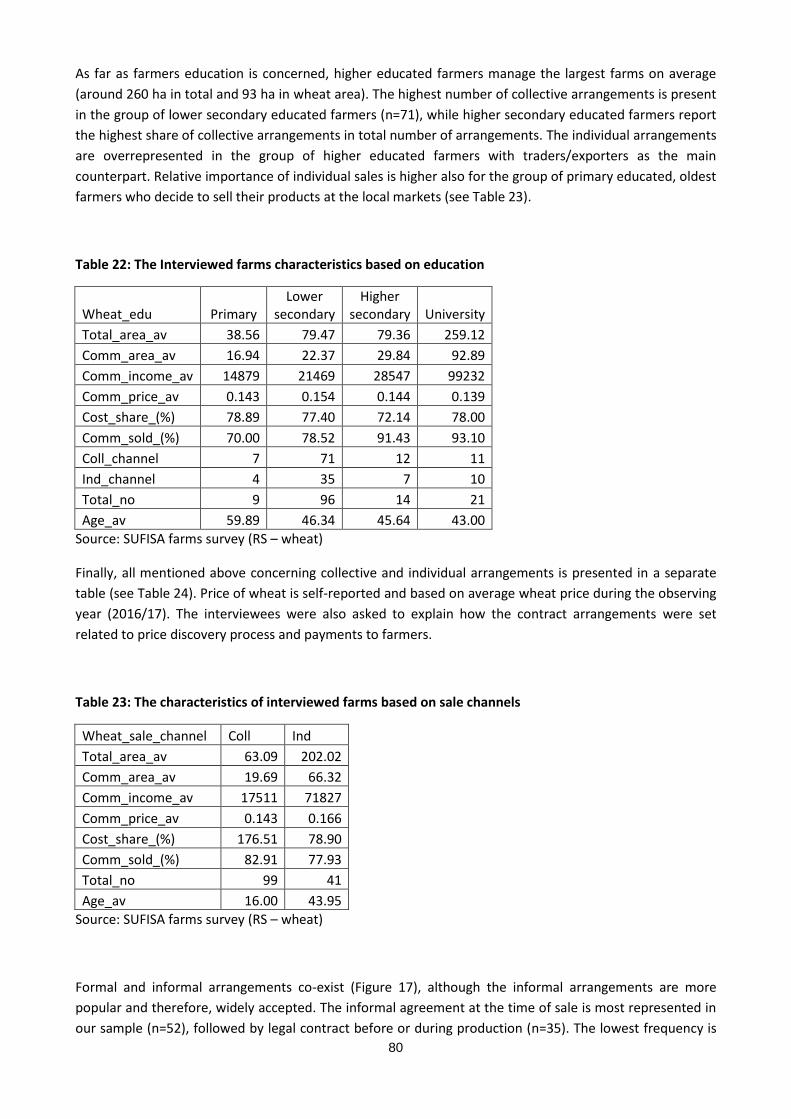
80
As far as farmers education is concerned, higher educated farmers manage the largest farms on average
(around 260 ha in total and 93 ha in wheat area). The highest number of collective arrangements is present
in the group of lower secondary educated farmers (n=71), while higher secondary educated farmers report
the highest share of collective arrangements in total number of arrangements. The individual arrangements
are overrepresented in the group of higher educated farmers with traders/exporters as the main
counterpart. Relative importance of individual sales is higher also for the group of primary educated, oldest
farmers who decide to sell their products at the local markets (see Table 23).
Table 22: The Interviewed farms characteristics based on education
Wheat_edu Primary Lower
secondary Higher
secondary University
Total_area_av 38.56 79.47 79.36 259.12
Comm_area_av 16.94 22.37 29.84 92.89
Comm_income_av 14879 21469 28547 99232
Comm_price_av 0.143 0.154 0.144 0.139
Cost_share_(%) 78.89 77.40 72.14 78.00
Comm_sold_(%) 70.00 78.52 91.43 93.10
Coll_channel 7 71 12 11
Ind_channel 4 35 7 10
Total_no 9 96 14 21
Age_av 59.89 46.34 45.64 43.00
Source: SUFISA farms survey (RS – wheat)
Finally, all mentioned above concerning collective and individual arrangements is presented in a separate
table (see Table 24). Price of wheat is self-reported and based on average wheat price during the observing
year (2016/17). The interviewees were also asked to explain how the contract arrangements were set
related to price discovery process and payments to farmers.
Table 23: The characteristics of interviewed farms based on sale channels
Wheat_sale_channel Coll Ind
Total_area_av 63.09 202.02
Comm_area_av 19.69 66.32
Comm_income_av 17511 71827
Comm_price_av 0.143 0.166
Cost_share_(%) 176.51 78.90
Comm_sold_(%) 82.91 77.93
Total_no 99 41
Age_av 16.00 43.95
Source: SUFISA farms survey (RS – wheat)
Formal and informal arrangements co-exist (Figure 17), although the informal arrangements are more
popular and therefore, widely accepted. The informal agreement at the time of sale is most represented in
our sample (n=52), followed by legal contract before or during production (n=35). The lowest frequency is
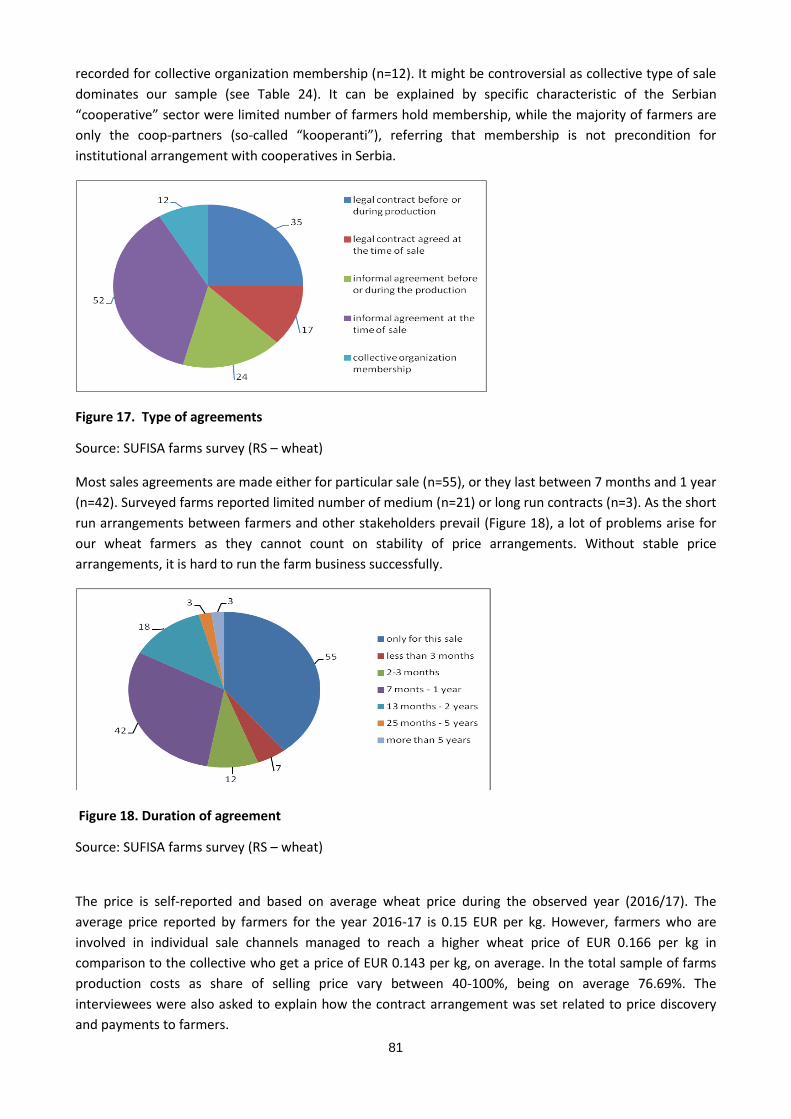
81
recorded for collective organization membership (n=12). It might be controversial as collective type of sale
dominates our sample (see Table 24). It can be explained by specific characteristic of the Serbian
“cooperative” sector were limited number of farmers hold membership, while the majority of farmers are
only the coop-partners (so-called “kooperanti”), referring that membership is not precondition for
institutional arrangement with cooperatives in Serbia.
Figure 17. Type of agreements
Source: SUFISA farms survey (RS – wheat)
Most sales agreements are made either for particular sale (n=55), or they last between 7 months and 1 year
(n=42). Surveyed farms reported limited number of medium (n=21) or long run contracts (n=3). As the short
run arrangements between farmers and other stakeholders prevail (Figure 18), a lot of problems arise for
our wheat farmers as they cannot count on stability of price arrangements. Without stable price
arrangements, it is hard to run the farm business successfully.
Figure 18. Duration of agreement
Source: SUFISA farms survey (RS – wheat)
The price is self-reported and based on average wheat price during the observed year (2016/17). The
average price reported by farmers for the year 2016-17 is 0.15 EUR per kg. However, farmers who are
involved in individual sale channels managed to reach a higher wheat price of EUR 0.166 per kg in
comparison to the collective who get a price of EUR 0.143 per kg, on average. In the total sample of farms
production costs as share of selling price vary between 40-100%, being on average 76.69%. The
interviewees were also asked to explain how the contract arrangement was set related to price discovery
and payments to farmers.
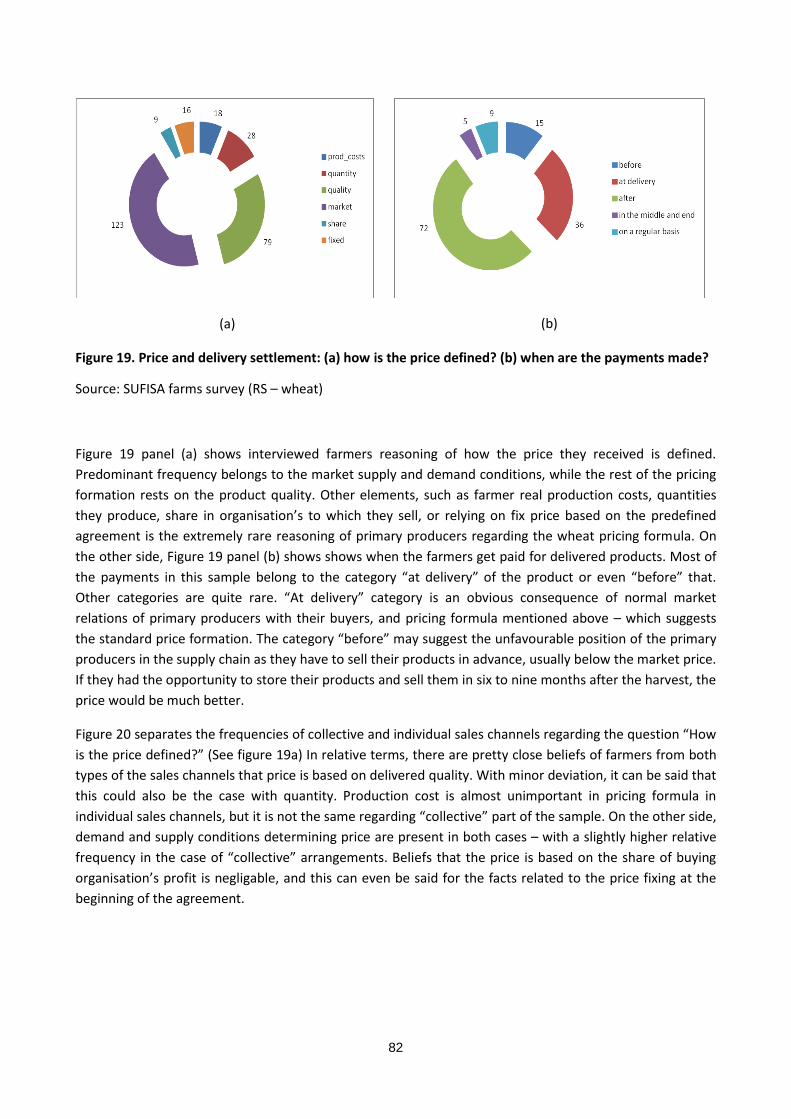
82
(a)
(b)
Figure 19. Price and delivery settlement: (a) how is the price defined? (b) when are the payments made?
Source: SUFISA farms survey (RS – wheat)
Figure 19 panel (a) shows interviewed farmers reasoning of how the price they received is defined.
Predominant frequency belongs to the market supply and demand conditions, while the rest of the pricing
formation rests on the product quality. Other elements, such as farmer real production costs, quantities
they produce, share in organisation’s to which they sell, or relying on fix price based on the predefined
agreement is the extremely rare reasoning of primary producers regarding the wheat pricing formula. On
the other side, Figure 19 panel (b) shows shows when the farmers get paid for delivered products. Most of
the payments in this sample belong to the category “at delivery” of the product or even “before” that.
Other categories are quite rare. “At delivery” category is an obvious consequence of normal market
relations of primary producers with their buyers, and pricing formula mentioned above – which suggests
the standard price formation. The category “before” may suggest the unfavourable position of the primary
producers in the supply chain as they have to sell their products in advance, usually below the market price.
If they had the opportunity to store their products and sell them in six to nine months after the harvest, the
price would be much better.
Figure 20 separates the frequencies of collective and individual sales channels regarding the question “How
is the price defined?” (See figure 19a) In relative terms, there are pretty close beliefs of farmers from both
types of the sales channels that price is based on delivered quality. With minor deviation, it can be said that
this could also be the case with quantity. Production cost is almost unimportant in pricing formula in
individual sales channels, but it is not the same regarding “collective” part of the sample. On the other side,
demand and supply conditions determining price are present in both cases – with a slightly higher relative
frequency in the case of “collective” arrangements. Beliefs that the price is based on the share of buying
organisation’s profit is negligable, and this can even be said for the facts related to the price fixing at the
beginning of the agreement.
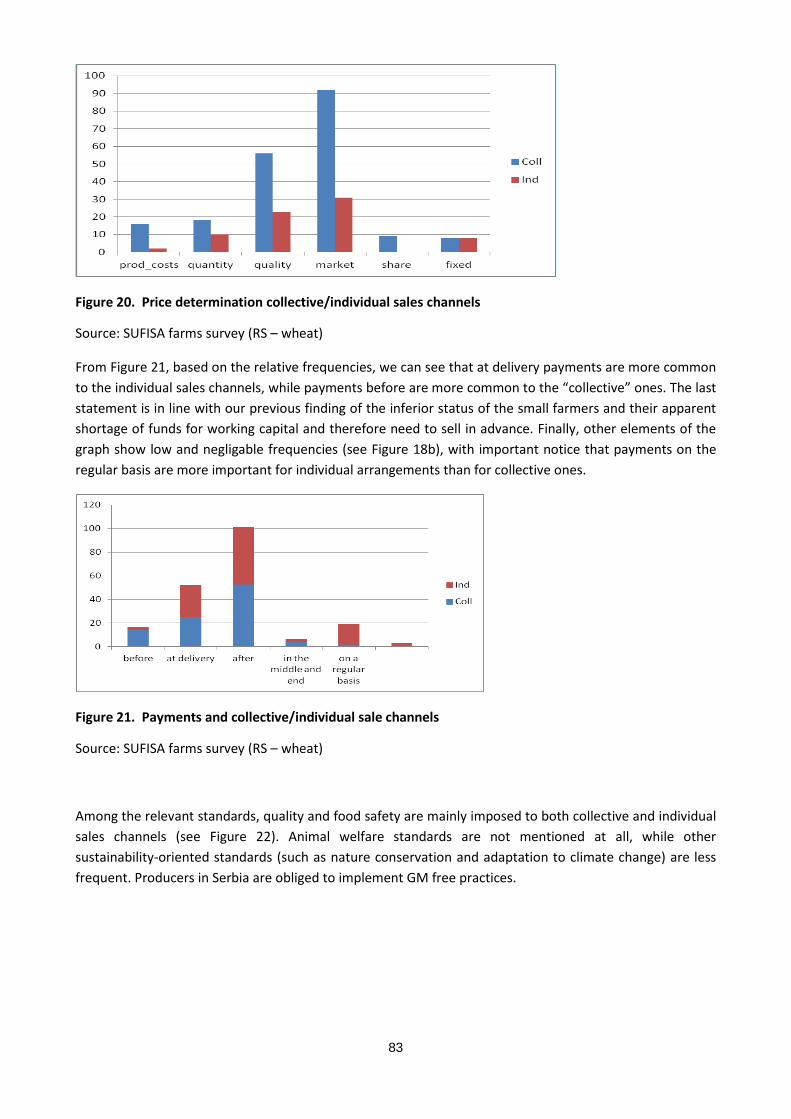
83
Figure 20. Price determination collective/individual sales channels
Source: SUFISA farms survey (RS – wheat)
From Figure 21, based on the relative frequencies, we can see that at delivery payments are more common
to the individual sales channels, while payments before are more common to the “collective” ones. The last
statement is in line with our previous finding of the inferior status of the small farmers and their apparent
shortage of funds for working capital and therefore need to sell in advance. Finally, other elements of the
graph show low and negligable frequencies (see Figure 18b), with important notice that payments on the
regular basis are more important for individual arrangements than for collective ones.
Figure 21. Payments and collective/individual sale channels
Source: SUFISA farms survey (RS – wheat)
Among the relevant standards, quality and food safety are mainly imposed to both collective and individual
sales channels (see Figure 22). Animal welfare standards are not mentioned at all, while other
sustainability-oriented standards (such as nature conservation and adaptation to climate change) are less
frequent. Producers in Serbia are obliged to implement GM free practices.
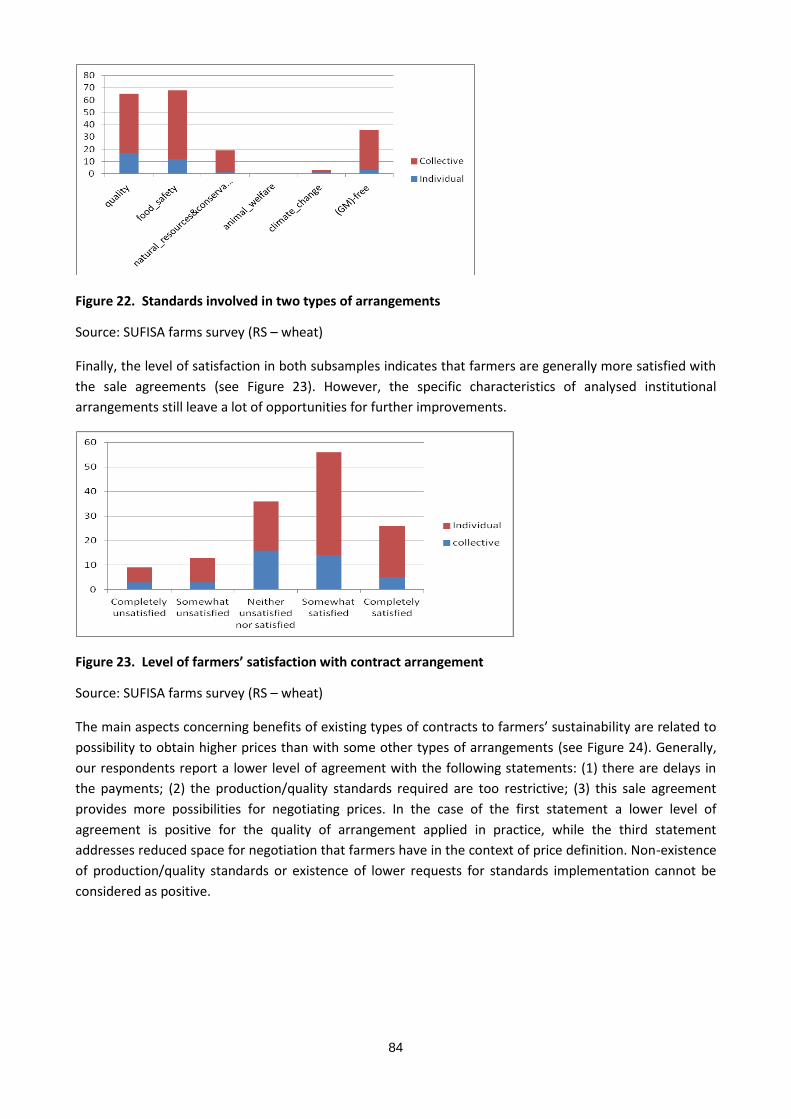
84
Figure 22. Standards involved in two types of arrangements
Source: SUFISA farms survey (RS – wheat)
Finally, the level of satisfaction in both subsamples indicates that farmers are generally more satisfied with
the sale agreements (see Figure 23). However, the specific characteristics of analysed institutional
arrangements still leave a lot of opportunities for further improvements.
Figure 23. Level of farmers’ satisfaction with contract arrangement
Source: SUFISA farms survey (RS – wheat)
The main aspects concerning benefits of existing types of contracts to farmers’ sustainability are related to
possibility to obtain higher prices than with some other types of arrangements (see Figure 24). Generally,
our respondents report a lower level of agreement with the following statements: (1) there are delays in
the payments; (2) the production/quality standards required are too restrictive; (3) this sale agreement
provides more possibilities for negotiating prices. In the case of the first statement a lower level of
agreement is positive for the quality of arrangement applied in practice, while the third statement
addresses reduced space for negotiation that farmers have in the context of price definition. Non-existence
of production/quality standards or existence of lower requests for standards implementation cannot be
considered as positive.
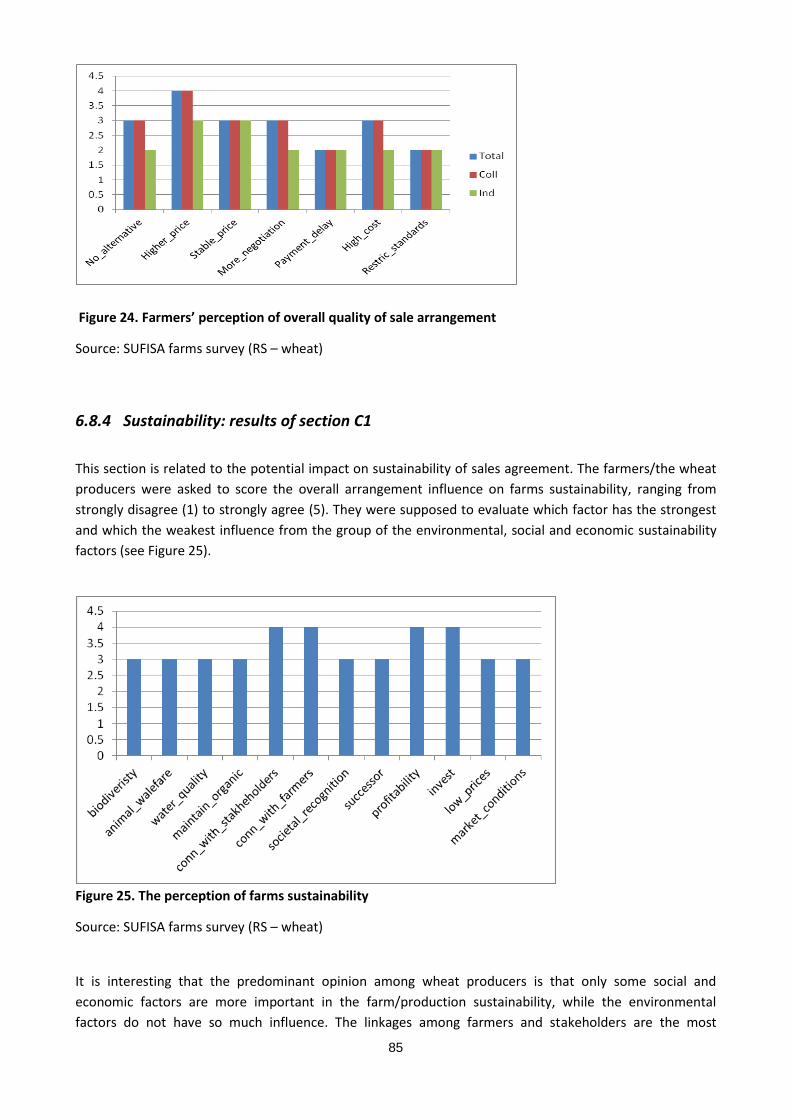
85
Figure 24. Farmers’ perception of overall quality of sale arrangement
Source: SUFISA farms survey (RS – wheat)
6.8.4 Sustainability: results of section C1
This section is related to the potential impact on sustainability of sales agreement. The farmers/the wheat
producers were asked to score the overall arrangement influence on farms sustainability, ranging from
strongly disagree (1) to strongly agree (5). They were supposed to evaluate which factor has the strongest
and which the weakest influence from the group of the environmental, social and economic sustainability
factors (see Figure 25).
Figure 25. The perception of farms sustainability
Source: SUFISA farms survey (RS – wheat)
It is interesting that the predominant opinion among wheat producers is that only some social and
economic factors are more important in the farm/production sustainability, while the environmental
factors do not have so much influence. The linkages among farmers and stakeholders are the most
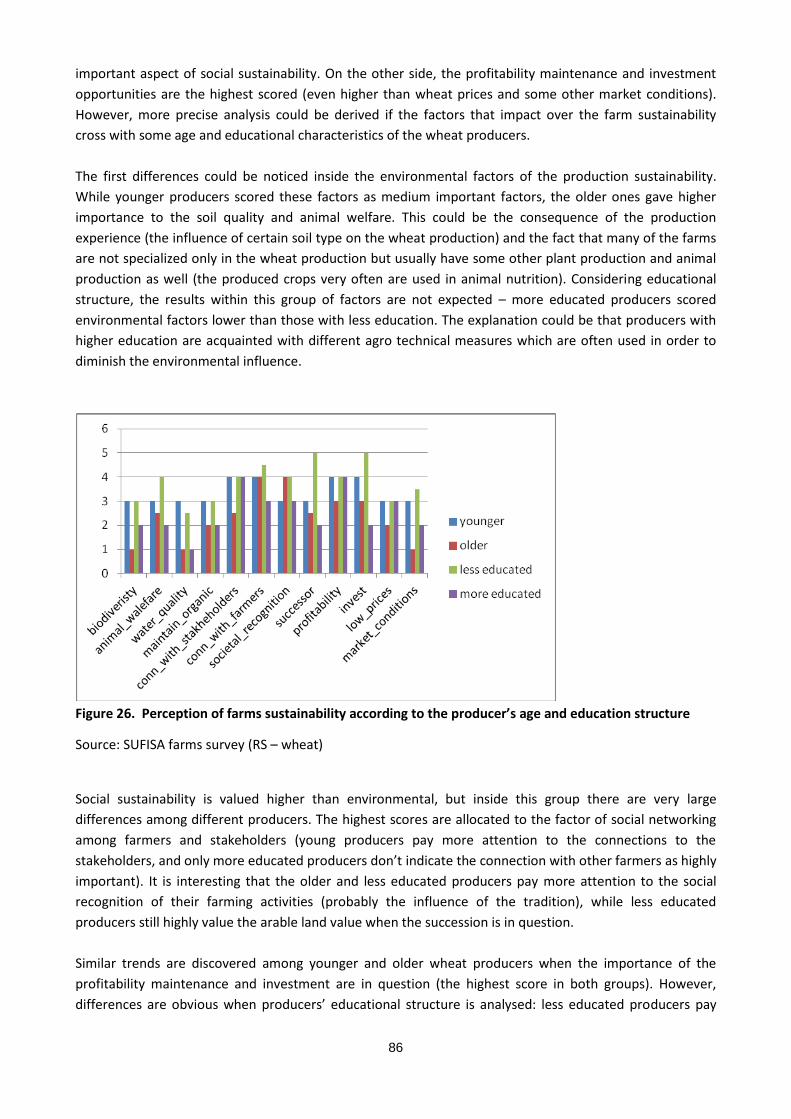
86
important aspect of social sustainability. On the other side, the profitability maintenance and investment
opportunities are the highest scored (even higher than wheat prices and some other market conditions).
However, more precise analysis could be derived if the factors that impact over the farm sustainability
cross with some age and educational characteristics of the wheat producers.
The first differences could be noticed inside the environmental factors of the production sustainability.
While younger producers scored these factors as medium important factors, the older ones gave higher
importance to the soil quality and animal welfare. This could be the consequence of the production
experience (the influence of certain soil type on the wheat production) and the fact that many of the farms
are not specialized only in the wheat production but usually have some other plant production and animal
production as well (the produced crops very often are used in animal nutrition). Considering educational
structure, the results within this group of factors are not expected – more educated producers scored
environmental factors lower than those with less education. The explanation could be that producers with
higher education are acquainted with different agro technical measures which are often used in order to
diminish the environmental influence.
Figure 26. Perception of farms sustainability according to the producer’s age and education structure
Source: SUFISA farms survey (RS – wheat)
Social sustainability is valued higher than environmental, but inside this group there are very large
differences among different producers. The highest scores are allocated to the factor of social networking
among farmers and stakeholders (young producers pay more attention to the connections to the
stakeholders, and only more educated producers don’t indicate the connection with other farmers as highly
important). It is interesting that the older and less educated producers pay more attention to the social
recognition of their farming activities (probably the influence of the tradition), while less educated
producers still highly value the arable land value when the succession is in question.
Similar trends are discovered among younger and older wheat producers when the importance of the
profitability maintenance and investment are in question (the highest score in both groups). However,
differences are obvious when producers’ educational structure is analysed: less educated producers pay
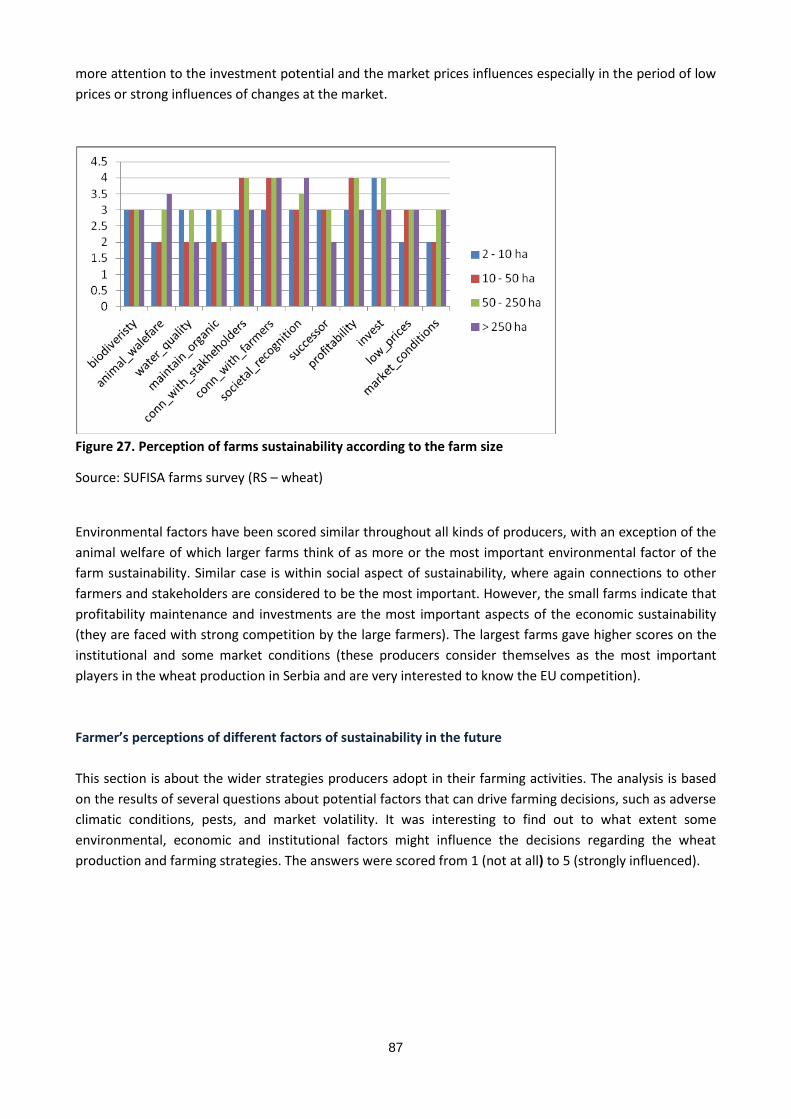
87
more attention to the investment potential and the market prices influences especially in the period of low
prices or strong influences of changes at the market.
Figure 27. Perception of farms sustainability according to the farm size
Source: SUFISA farms survey (RS – wheat)
Environmental factors have been scored similar throughout all kinds of producers, with an exception of the
animal welfare of which larger farms think of as more or the most important environmental factor of the
farm sustainability. Similar case is within social aspect of sustainability, where again connections to other
farmers and stakeholders are considered to be the most important. However, the small farms indicate that
profitability maintenance and investments are the most important aspects of the economic sustainability
(they are faced with strong competition by the large farmers). The largest farms gave higher scores on the
institutional and some market conditions (these producers consider themselves as the most important
players in the wheat production in Serbia and are very interested to know the EU competition).
Farmer’s perceptions of different factors of sustainability in the future
This section is about the wider strategies producers adopt in their farming activities. The analysis is based
on the results of several questions about potential factors that can drive farming decisions, such as adverse
climatic conditions, pests, and market volatility. It was interesting to find out to what extent some
environmental, economic and institutional factors might influence the decisions regarding the wheat
production and farming strategies. The answers were scored from 1 (not at all) to 5 (strongly influenced).
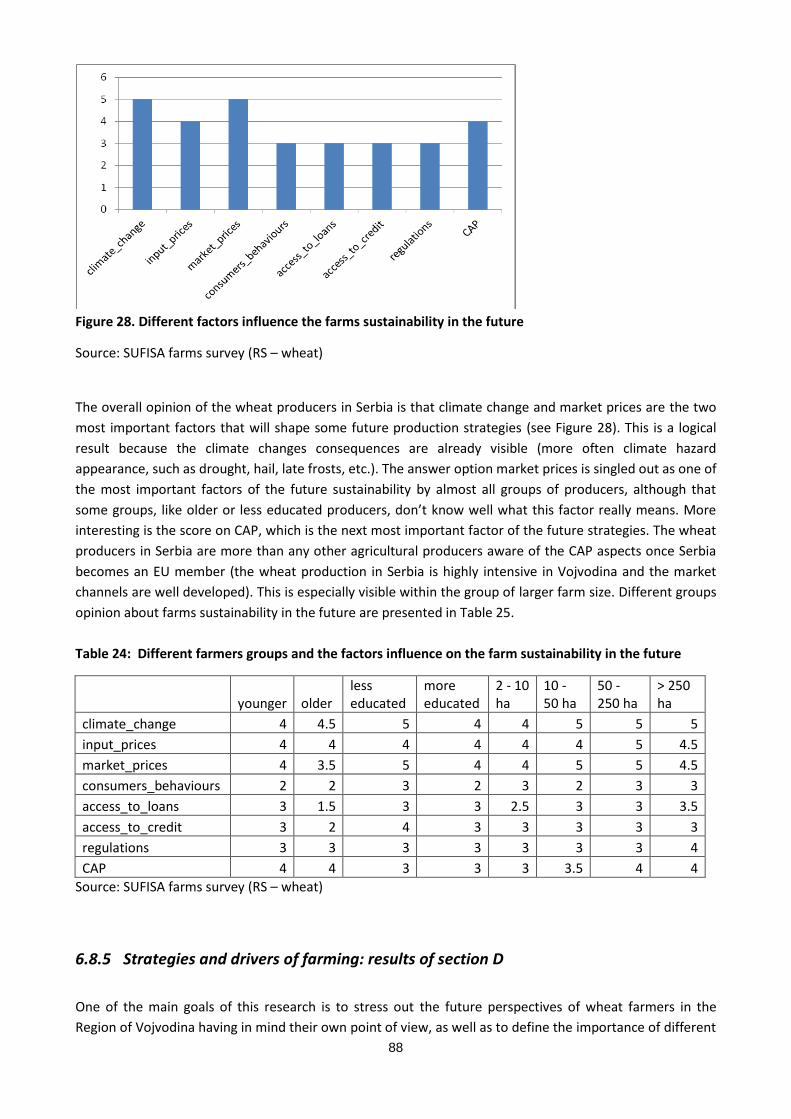
88
Figure 28. Different factors influence the farms sustainability in the future
Source: SUFISA farms survey (RS – wheat)
The overall opinion of the wheat producers in Serbia is that climate change and market prices are the two
most important factors that will shape some future production strategies (see Figure 28). This is a logical
result because the climate changes consequences are already visible (more often climate hazard
appearance, such as drought, hail, late frosts, etc.). The answer option market prices is singled out as one of
the most important factors of the future sustainability by almost all groups of producers, although that
some groups, like older or less educated producers, don’t know well what this factor really means. More
interesting is the score on CAP, which is the next most important factor of the future strategies. The wheat
producers in Serbia are more than any other agricultural producers aware of the CAP aspects once Serbia
becomes an EU member (the wheat production in Serbia is highly intensive in Vojvodina and the market
channels are well developed). This is especially visible within the group of larger farm size. Different groups
opinion about farms sustainability in the future are presented in Table 25.
Table 24: Different farmers groups and the factors influence on the farm sustainability in the future
younger older less educated
more educated
2 - 10 ha
10 - 50 ha
50 - 250 ha
> 250 ha
climate_change 4 4.5 5 4 4 5 5 5
input_prices 4 4 4 4 4 4 5 4.5
market_prices 4 3.5 5 4 4 5 5 4.5
consumers_behaviours 2 2 3 2 3 2 3 3
access_to_loans 3 1.5 3 3 2.5 3 3 3.5
access_to_credit 3 2 4 3 3 3 3 3
regulations 3 3 3 3 3 3 3 4
CAP 4 4 3 3 3 3.5 4 4
Source: SUFISA farms survey (RS – wheat)
6.8.5 Strategies and drivers of farming: results of section D
One of the main goals of this research is to stress out the future perspectives of wheat farmers in the
Region of Vojvodina having in mind their own point of view, as well as to define the importance of different
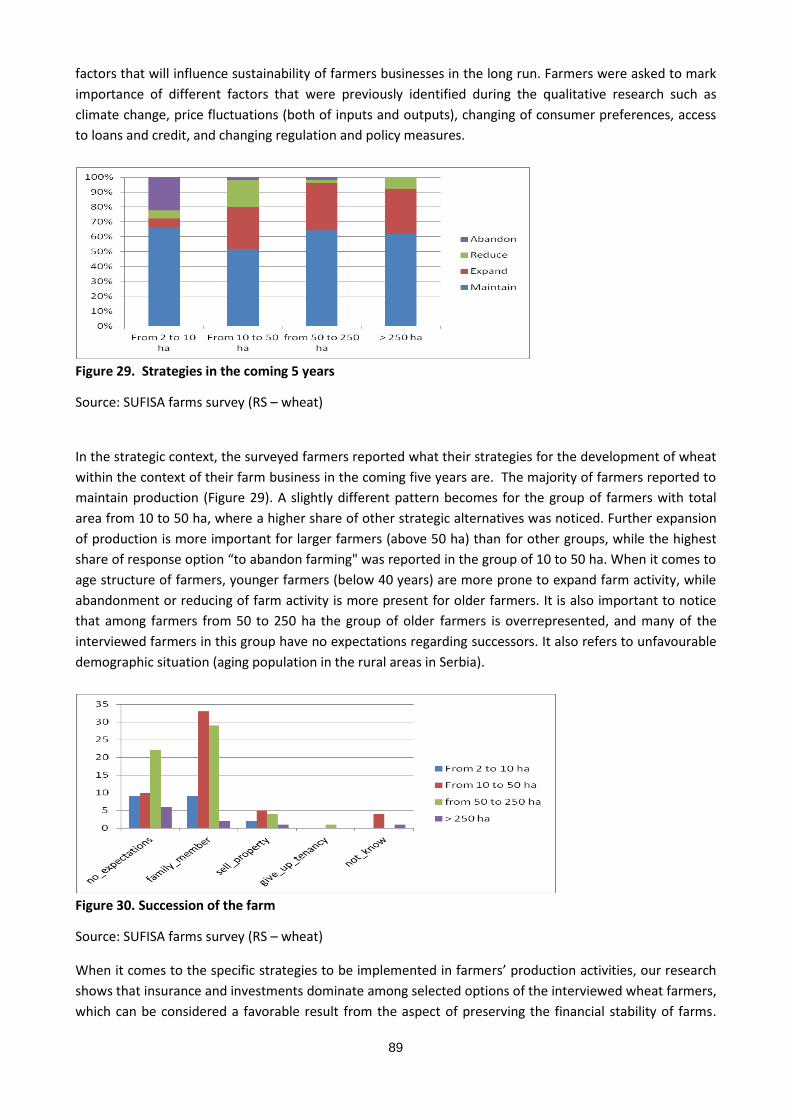
89
factors that will influence sustainability of farmers businesses in the long run. Farmers were asked to mark
importance of different factors that were previously identified during the qualitative research such as
climate change, price fluctuations (both of inputs and outputs), changing of consumer preferences, access
to loans and credit, and changing regulation and policy measures.
Figure 29. Strategies in the coming 5 years
Source: SUFISA farms survey (RS – wheat)
In the strategic context, the surveyed farmers reported what their strategies for the development of wheat
within the context of their farm business in the coming five years are. The majority of farmers reported to
maintain production (Figure 29). A slightly different pattern becomes for the group of farmers with total
area from 10 to 50 ha, where a higher share of other strategic alternatives was noticed. Further expansion
of production is more important for larger farmers (above 50 ha) than for other groups, while the highest
share of response option “to abandon farming" was reported in the group of 10 to 50 ha. When it comes to
age structure of farmers, younger farmers (below 40 years) are more prone to expand farm activity, while
abandonment or reducing of farm activity is more present for older farmers. It is also important to notice
that among farmers from 50 to 250 ha the group of older farmers is overrepresented, and many of the
interviewed farmers in this group have no expectations regarding successors. It also refers to unfavourable
demographic situation (aging population in the rural areas in Serbia).
Figure 30. Succession of the farm
Source: SUFISA farms survey (RS – wheat)
When it comes to the specific strategies to be implemented in farmers’ production activities, our research
shows that insurance and investments dominate among selected options of the interviewed wheat farmers,
which can be considered a favorable result from the aspect of preserving the financial stability of farms.
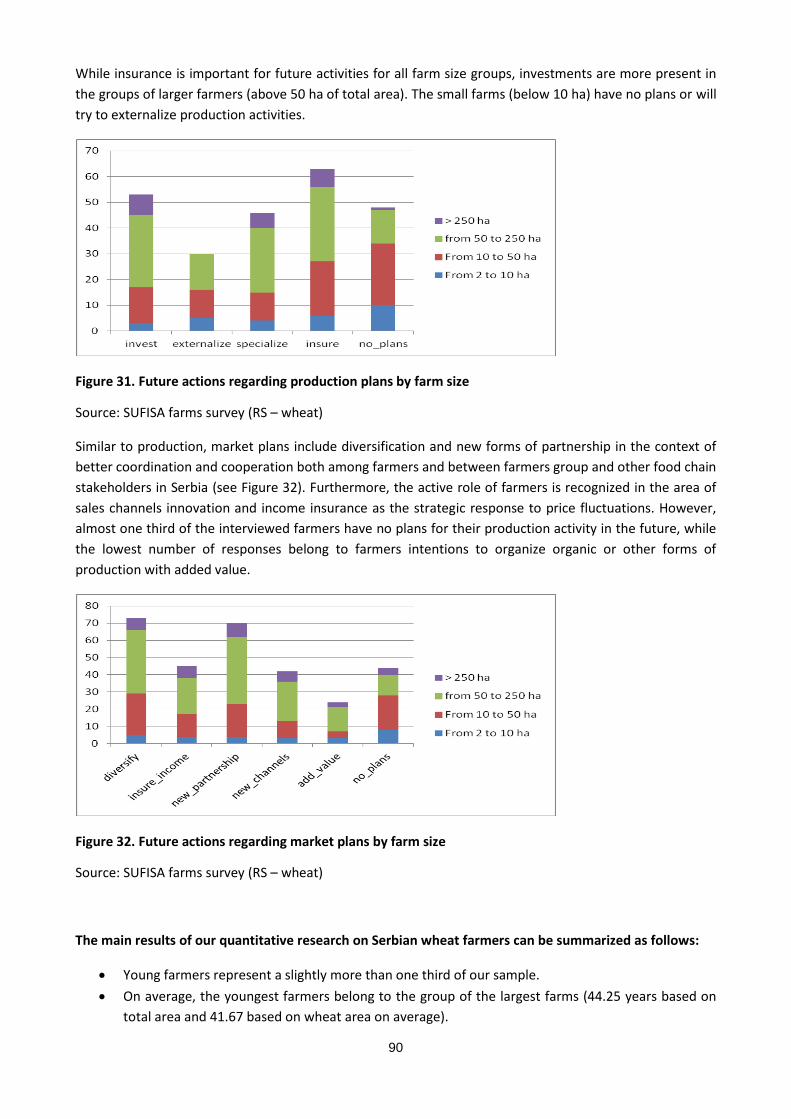
90
While insurance is important for future activities for all farm size groups, investments are more present in
the groups of larger farmers (above 50 ha of total area). The small farms (below 10 ha) have no plans or will
try to externalize production activities.
Figure 31. Future actions regarding production plans by farm size
Source: SUFISA farms survey (RS – wheat)
Similar to production, market plans include diversification and new forms of partnership in the context of
better coordination and cooperation both among farmers and between farmers group and other food chain
stakeholders in Serbia (see Figure 32). Furthermore, the active role of farmers is recognized in the area of
sales channels innovation and income insurance as the strategic response to price fluctuations. However,
almost one third of the interviewed farmers have no plans for their production activity in the future, while
the lowest number of responses belong to farmers intentions to organize organic or other forms of
production with added value.
Figure 32. Future actions regarding market plans by farm size
Source: SUFISA farms survey (RS – wheat)
The main results of our quantitative research on Serbian wheat farmers can be summarized as follows:
Young farmers represent a slightly more than one third of our sample.
On average, the youngest farmers belong to the group of the largest farms (44.25 years based on
total area and 41.67 based on wheat area on average).
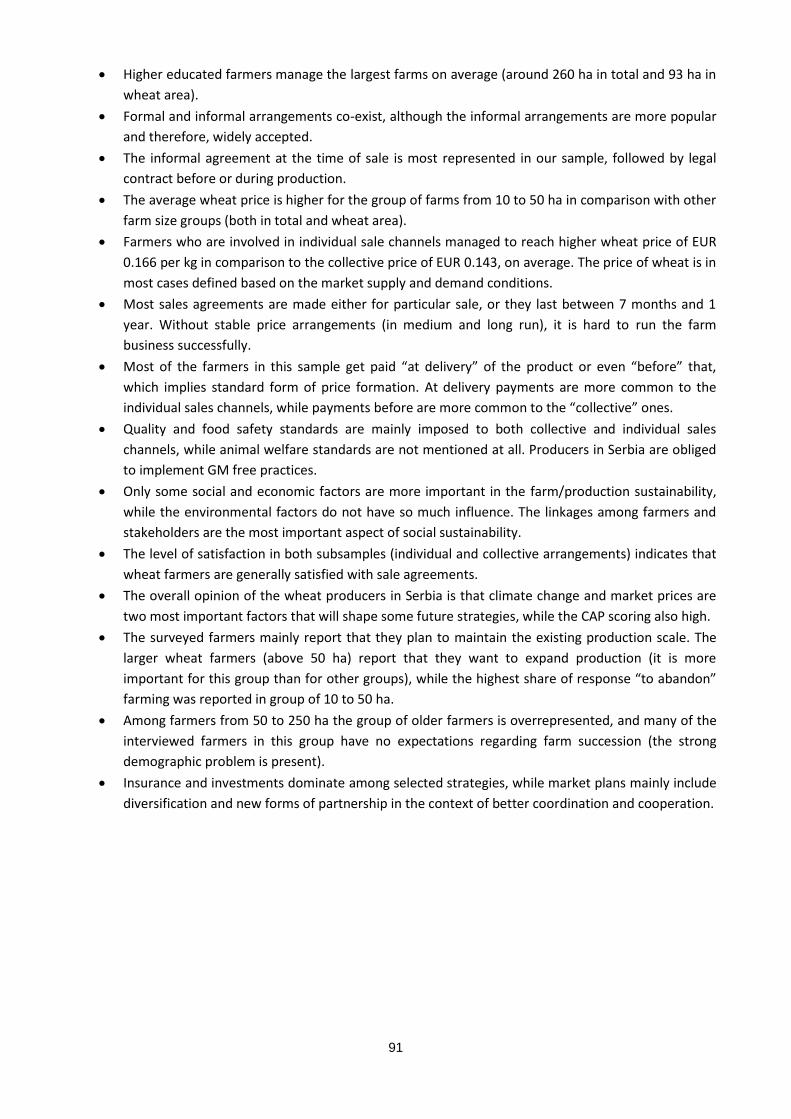
91
Higher educated farmers manage the largest farms on average (around 260 ha in total and 93 ha in
wheat area).
Formal and informal arrangements co-exist, although the informal arrangements are more popular
and therefore, widely accepted.
The informal agreement at the time of sale is most represented in our sample, followed by legal
contract before or during production.
The average wheat price is higher for the group of farms from 10 to 50 ha in comparison with other
farm size groups (both in total and wheat area).
Farmers who are involved in individual sale channels managed to reach higher wheat price of EUR
0.166 per kg in comparison to the collective price of EUR 0.143, on average. The price of wheat is in
most cases defined based on the market supply and demand conditions.
Most sales agreements are made either for particular sale, or they last between 7 months and 1
year. Without stable price arrangements (in medium and long run), it is hard to run the farm
business successfully.
Most of the farmers in this sample get paid “at delivery” of the product or even “before” that,
which implies standard form of price formation. At delivery payments are more common to the
individual sales channels, while payments before are more common to the “collective” ones.
Quality and food safety standards are mainly imposed to both collective and individual sales
channels, while animal welfare standards are not mentioned at all. Producers in Serbia are obliged
to implement GM free practices.
Only some social and economic factors are more important in the farm/production sustainability,
while the environmental factors do not have so much influence. The linkages among farmers and
stakeholders are the most important aspect of social sustainability.
The level of satisfaction in both subsamples (individual and collective arrangements) indicates that
wheat farmers are generally satisfied with sale agreements.
The overall opinion of the wheat producers in Serbia is that climate change and market prices are
two most important factors that will shape some future strategies, while the CAP scoring also high.
The surveyed farmers mainly report that they plan to maintain the existing production scale. The
larger wheat farmers (above 50 ha) report that they want to expand production (it is more
important for this group than for other groups), while the highest share of response “to abandon”
farming was reported in group of 10 to 50 ha.
Among farmers from 50 to 250 ha the group of older farmers is overrepresented, and many of the
interviewed farmers in this group have no expectations regarding farm succession (the strong
demographic problem is present).
Insurance and investments dominate among selected strategies, while market plans mainly include
diversification and new forms of partnership in the context of better coordination and cooperation.
92
6.9 References
Anufrijev, Ana D., Goran Dašić (2013). Komparativne prednosti poljoprivrede Srbije i održivi
razvoj (Comparative advantages of Serbian agriculture and sustainable development), AKROASIS.
Atanasijević, Jasna, Marko Danon (2014). Financing Agricultural Development in Serbia: Opportunities and
Challenges, Ekonomika preduzeća.
Babić, Violeta, Božidar Milošević, Goran Maksimović (2015). Economic subsidies in agriculture, Economics of
Agriculture 3/2015, pp. 693-704
Bogdanov and Rodić (2014): Agriculture and Rural Policy in Serbia, print in ed. T. Volk, E. Erjavec and
K.Mortensen: Agricultural Policy and European Integration in South-eastern Europe, FAO
Borodina, Olena (2014). Challenges and priorities for involvement of private sector in agri-food chain
development of the BSEC region, BSEC & FAO 2014
Božić Dragica, Petar Munćan (2015). Regional aspects of family holdings structure in the republic of Serbia,
Economics of Agriculture 1/2015.
Erjavec et. al (2014). Agricultural Policy and European Integration in South-eastern Europe, FAO
FP7 Focus-Balkans Project, WP6 Report (www.focuc-balkans.org)
GAIN Report Number: RB1503.
Giordani, P., Rocha, N., Ruta, M. (2012). Food Prices and the Multiplier Effect of Export Policy, CESIFO
Working Paper No. 3783
Hristov, N., N. Mladenov, V. Djuric, A. Kondic-Spika and A. Marjanovic-Jeromela (2010). Improvement of
Wheat Quality in Cultivars Released in Serbia during the 20 th Century, Cereal Research Communications
Vol. 38, No. 1 (March 2010), pp. 111-121
Jovana Čikić Jovana, Živojin Petrović (2013). Diffusion of knowledge and innovations in Serbian agriculture,
print in ed. Dragan Škorić, Danilo Tomić and Vesna Popović AGRI-FOOD SECTOR IN SERBIA STATE AND
CHALLENGES, DAES.
Kalanović-Bulatović, Branka, Bojan Dimitrijević, Dušan Milić, Zoran Milovančević (2015). Organization and
costs of repurchasing, transportation, warehousing and storage of raspberry fruit, Economics of Agriculture
4/2015, pp. 1017-1030
Kočović, J., Ranđelović, S., Paunović, B. (2015). Catastrophe risk management models and sustainable
development, print in Scientific monograph Catastrophic risks and sustainable development, Belgrade:
University of Belgrade, Faculty of Economics.
Linde Götz, Linde, Ivan Djuric, Ivan and Thomas, Glauben Thomas (2013). Are export restrictions an
effective instrument to dampen food price inflation?, IAMO Policy Brief No. 10, March 2013
MAEP (2014). Strategy of Agriculture and Rural Development in Serbia: 2014-2024.
MAEP Policy paper (2015). Future challenges and strategies for smallholders in Serbia.
93
Milićević, Dragan, Ksenija Nešiž, Sandra Jakšić (2013). Mycotoxin contamination of the food supply chain -
Implications for One Health programme, International 58th Meat Industry Conference “Meat Safety and
Quality: Where it goes?”
MILJKOVIC, Marina, Hamid EL BILALI, Sinisa BERJAN (2010). Rural economy diversification in Serbia,
Research Journal of Agricultural Science, 42 (3), pp. 684-691
Mizik, T. (2011). Western Balkans: State of Agriculture and its Opportunities on the Eve of EU Accession – I.
Acta Universitatis Danubius No. 1/2011
NBS (2004/2014). "An overview of the number of insurance policies, number of the insured and premiums
by types and insurance tariffs for Serbia (2004-2014.)", (20/04/2015)
Petrovic-Randjelovic M. & V. Marjanovic (2010). The main trends and prospects of the agricultural
development in Serbia FACTA UNIVERSITATIS Series: Economics and Organization Vol. 7, No 4, pp. 373 –
384
Petrovic-Randjelovic M. & V. Marjanovic (2010). The main trends and prospects of the agricultural
development in Serbia FACTA UNIVERSITATIS Series: Economics and Organization Vol. 7, No 4, pp. 373 - 384
Pojić Milica, Jasna Mastilović, Mladenka Pestorić, Tanja Radusin (2010): The ensuring of measurements for
cereal quality determination, Food and Feed Research, Institute for Food Technologies, Novi Sad, Volume
35, Issue 1, pp. 11-18
Stojanović, Ž, Dragutinović-Mitrović, R.. (2017). Determinants of financial performance of commercial farms
in Serbia: the FADN data analysis based on crop production, The International conference The international
conference “Economic policy for smart, inclusive and sustainable growth”, Faculty of Economics, University
of Belgrade, June 15-17 2017.
Stojanović, Ž., Gligorijević, M., Rakonjac-Antić, T. (2012). The role of the marketing mix in the improvement
of agricultural insurance”, Agricultural Economics ISSN 0352-3462, Balkan Scientific Association of Agrarian
Economists and Institute of Agricultural Economics, Belgrade, 2012.
USAID BEP (2013). Agricultural finance in Serbia – status and recommendations
World Bank (2015). Towards a Sustainable and Efficient Fiscal Policy in Serbia.
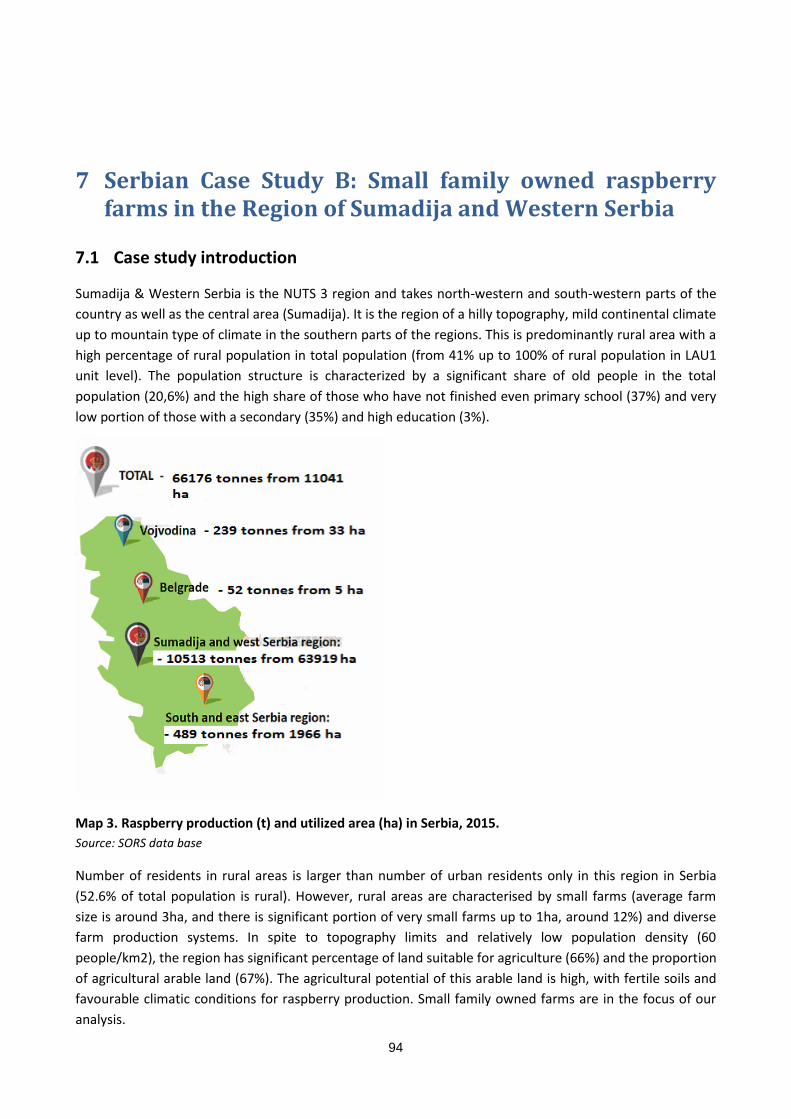
94
7 Serbian Case Study B: Small family owned raspberry farms in the Region of Sumadija and Western Serbia
7.1 Case study introduction
Sumadija & Western Serbia is the NUTS 3 region and takes north-western and south-western parts of the
country as well as the central area (Sumadija). It is the region of a hilly topography, mild continental climate
up to mountain type of climate in the southern parts of the regions. This is predominantly rural area with a
high percentage of rural population in total population (from 41% up to 100% of rural population in LAU1
unit level). The population structure is characterized by a significant share of old people in the total
population (20,6%) and the high share of those who have not finished even primary school (37%) and very
low portion of those with a secondary (35%) and high education (3%).
Map 3. Raspberry production (t) and utilized area (ha) in Serbia, 2015.
Source: SORS data base
Number of residents in rural areas is larger than number of urban residents only in this region in Serbia
(52.6% of total population is rural). However, rural areas are characterised by small farms (average farm
size is around 3ha, and there is significant portion of very small farms up to 1ha, around 12%) and diverse
farm production systems. In spite to topography limits and relatively low population density (60
people/km2), the region has significant percentage of land suitable for agriculture (66%) and the proportion
of agricultural arable land (67%). The agricultural potential of this arable land is high, with fertile soils and
favourable climatic conditions for raspberry production. Small family owned farms are in the focus of our
analysis.
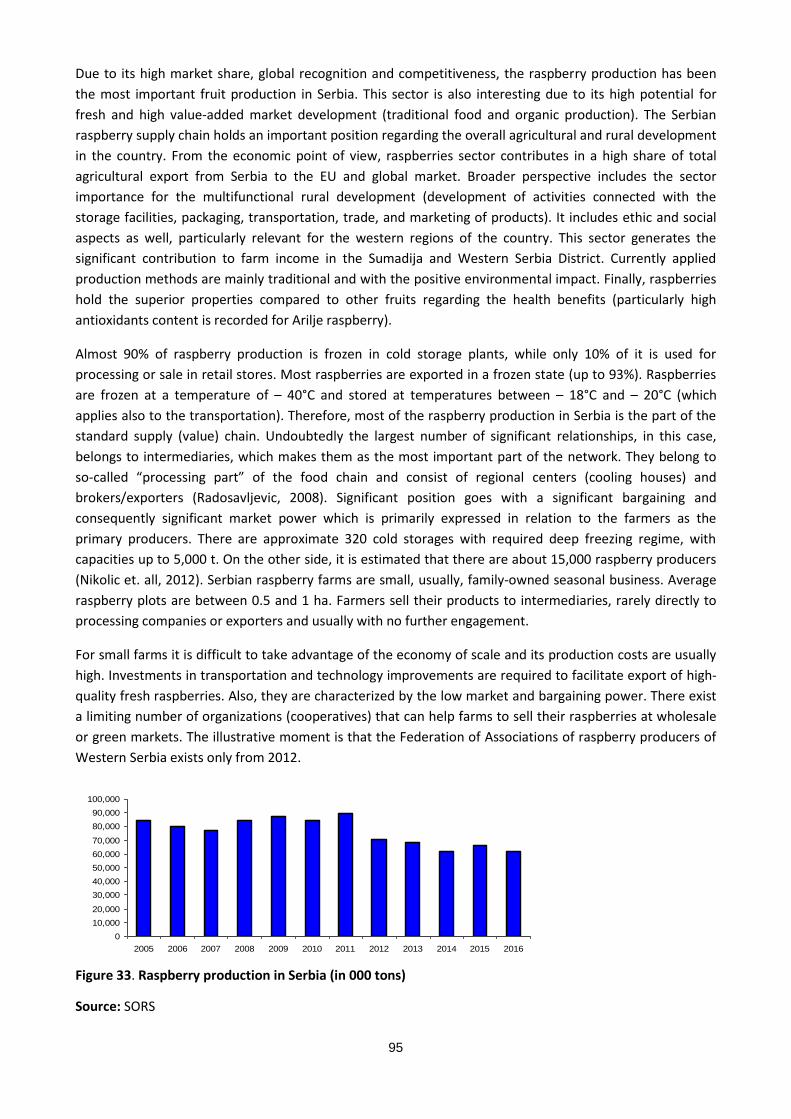
95
Due to its high market share, global recognition and competitiveness, the raspberry production has been
the most important fruit production in Serbia. This sector is also interesting due to its high potential for
fresh and high value-added market development (traditional food and organic production). The Serbian
raspberry supply chain holds an important position regarding the overall agricultural and rural development
in the country. From the economic point of view, raspberries sector contributes in a high share of total
agricultural export from Serbia to the EU and global market. Broader perspective includes the sector
importance for the multifunctional rural development (development of activities connected with the
storage facilities, packaging, transportation, trade, and marketing of products). It includes ethic and social
aspects as well, particularly relevant for the western regions of the country. This sector generates the
significant contribution to farm income in the Sumadija and Western Serbia District. Currently applied
production methods are mainly traditional and with the positive environmental impact. Finally, raspberries
hold the superior properties compared to other fruits regarding the health benefits (particularly high
antioxidants content is recorded for Arilje raspberry).
Almost 90% of raspberry production is frozen in cold storage plants, while only 10% of it is used for
processing or sale in retail stores. Most raspberries are exported in a frozen state (up to 93%). Raspberries
are frozen at a temperature of – 40°C and stored at temperatures between – 18°C and – 20°C (which
applies also to the transportation). Therefore, most of the raspberry production in Serbia is the part of the
standard supply (value) chain. Undoubtedly the largest number of significant relationships, in this case,
belongs to intermediaries, which makes them as the most important part of the network. They belong to
so-called “processing part” of the food chain and consist of regional centers (cooling houses) and
brokers/exporters (Radosavljevic, 2008). Significant position goes with a significant bargaining and
consequently significant market power which is primarily expressed in relation to the farmers as the
primary producers. There are approximate 320 cold storages with required deep freezing regime, with
capacities up to 5,000 t. On the other side, it is estimated that there are about 15,000 raspberry producers
(Nikolic et. all, 2012). Serbian raspberry farms are small, usually, family-owned seasonal business. Average
raspberry plots are between 0.5 and 1 ha. Farmers sell their products to intermediaries, rarely directly to
processing companies or exporters and usually with no further engagement.
For small farms it is difficult to take advantage of the economy of scale and its production costs are usually
high. Investments in transportation and technology improvements are required to facilitate export of high-
quality fresh raspberries. Also, they are characterized by the low market and bargaining power. There exist
a limiting number of organizations (cooperatives) that can help farms to sell their raspberries at wholesale
or green markets. The illustrative moment is that the Federation of Associations of raspberry producers of
Western Serbia exists only from 2012.
0
10,000
20,000
30,000
40,000
50,000
60,000
70,000
80,000
90,000
100,000
2005 2006 2007 2008 2009 2010 2011 2012 2013 2014 2015 2016
Figure 33. Raspberry production in Serbia (in 000 tons)
Source: SORS
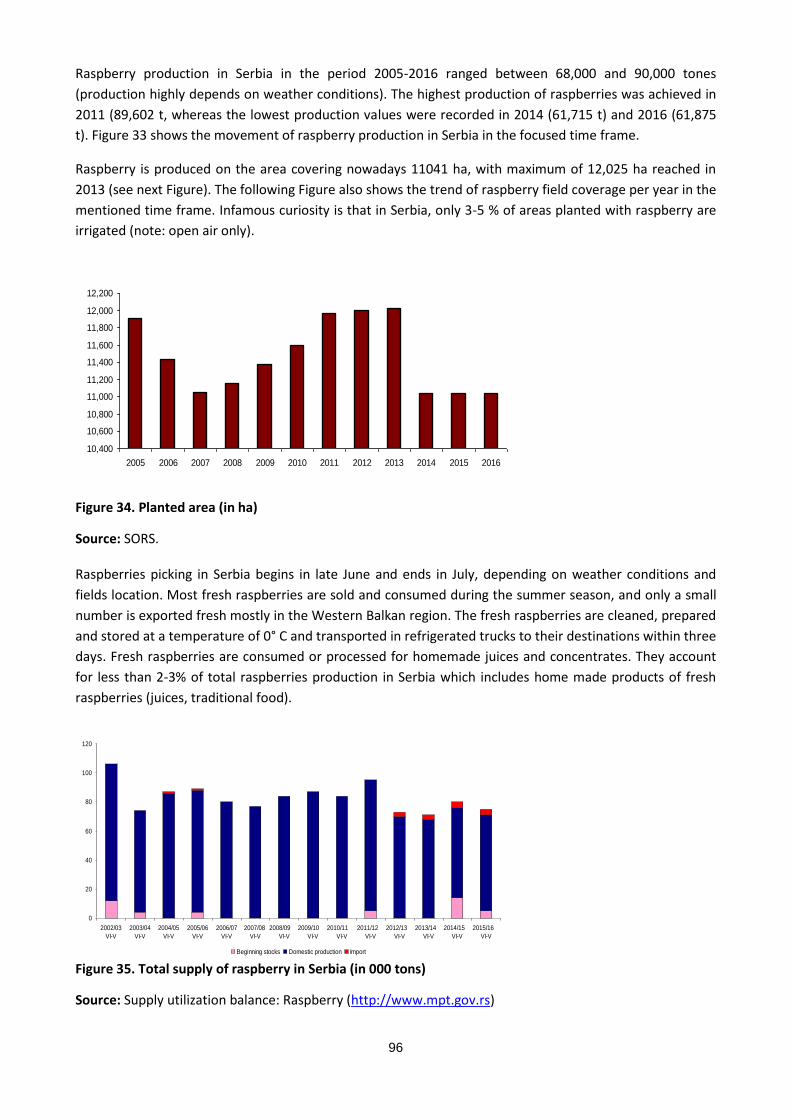
96
Raspberry production in Serbia in the period 2005-2016 ranged between 68,000 and 90,000 tones
(production highly depends on weather conditions). The highest production of raspberries was achieved in
2011 (89,602 t, whereas the lowest production values were recorded in 2014 (61,715 t) and 2016 (61,875
t). Figure 33 shows the movement of raspberry production in Serbia in the focused time frame.
Raspberry is produced on the area covering nowadays 11041 ha, with maximum of 12,025 ha reached in
2013 (see next Figure). The following Figure also shows the trend of raspberry field coverage per year in the
mentioned time frame. Infamous curiosity is that in Serbia, only 3-5 % of areas planted with raspberry are
irrigated (note: open air only).
10,400
10,600
10,800
11,000
11,200
11,400
11,600
11,800
12,000
12,200
2005 2006 2007 2008 2009 2010 2011 2012 2013 2014 2015 2016
Figure 34. Planted area (in ha)
Source: SORS. Raspberries picking in Serbia begins in late June and ends in July, depending on weather conditions and
fields location. Most fresh raspberries are sold and consumed during the summer season, and only a small
number is exported fresh mostly in the Western Balkan region. The fresh raspberries are cleaned, prepared
and stored at a temperature of 0° C and transported in refrigerated trucks to their destinations within three
days. Fresh raspberries are consumed or processed for homemade juices and concentrates. They account
for less than 2-3% of total raspberries production in Serbia which includes home made products of fresh
raspberries (juices, traditional food).
0
20
40
60
80
100
120
2002/03
VI-V
2003/04
VI-V
2004/05
VI-V
2005/06
VI-V
2006/07
VI-V
2007/08
VI-V
2008/09
VI-V
2009/10
VI-V
2010/11
VI-V
2011/12
VI-V
2012/13
VI-V
2013/14
VI-V
2014/15
VI-V
2015/16
VI-V
Beginning stocks Domestic production Import Figure 35. Total supply of raspberry in Serbia (in 000 tons)
Source: Supply utilization balance: Raspberry (http://www.mpt.gov.rs)
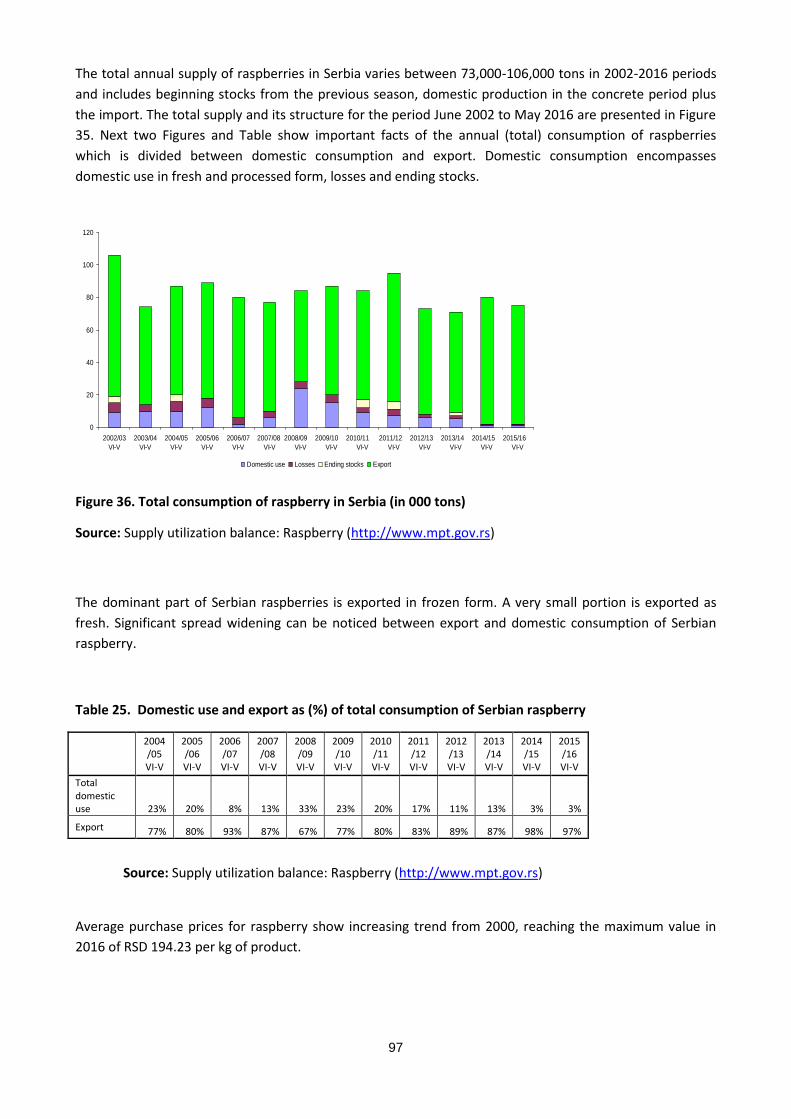
97
The total annual supply of raspberries in Serbia varies between 73,000-106,000 tons in 2002-2016 periods
and includes beginning stocks from the previous season, domestic production in the concrete period plus
the import. The total supply and its structure for the period June 2002 to May 2016 are presented in Figure
35. Next two Figures and Table show important facts of the annual (total) consumption of raspberries
which is divided between domestic consumption and export. Domestic consumption encompasses
domestic use in fresh and processed form, losses and ending stocks.
0
20
40
60
80
100
120
2002/03
VI-V
2003/04
VI-V
2004/05
VI-V
2005/06
VI-V
2006/07
VI-V
2007/08
VI-V
2008/09
VI-V
2009/10
VI-V
2010/11
VI-V
2011/12
VI-V
2012/13
VI-V
2013/14
VI-V
2014/15
VI-V
2015/16
VI-V
Domestic use Losses Ending stocks Export
Figure 36. Total consumption of raspberry in Serbia (in 000 tons)
Source: Supply utilization balance: Raspberry (http://www.mpt.gov.rs)
The dominant part of Serbian raspberries is exported in frozen form. A very small portion is exported as
fresh. Significant spread widening can be noticed between export and domestic consumption of Serbian
raspberry.
Table 25. Domestic use and export as (%) of total consumption of Serbian raspberry
2004/05 VI-V
2005/06 VI-V
2006/07 VI-V
2007/08 VI-V
2008/09 VI-V
2009/10 VI-V
2010/11 VI-V
2011/12 VI-V
2012/13 VI-V
2013/14 VI-V
2014/15 VI-V
2015/16 VI-V
Total domestic use 23% 20% 8% 13% 33% 23% 20% 17% 11% 13% 3% 3%
Export 77% 80% 93% 87% 67% 77% 80% 83% 89% 87% 98% 97%
Source: Supply utilization balance: Raspberry (http://www.mpt.gov.rs) Average purchase prices for raspberry show increasing trend from 2000, reaching the maximum value in
2016 of RSD 194.23 per kg of product.
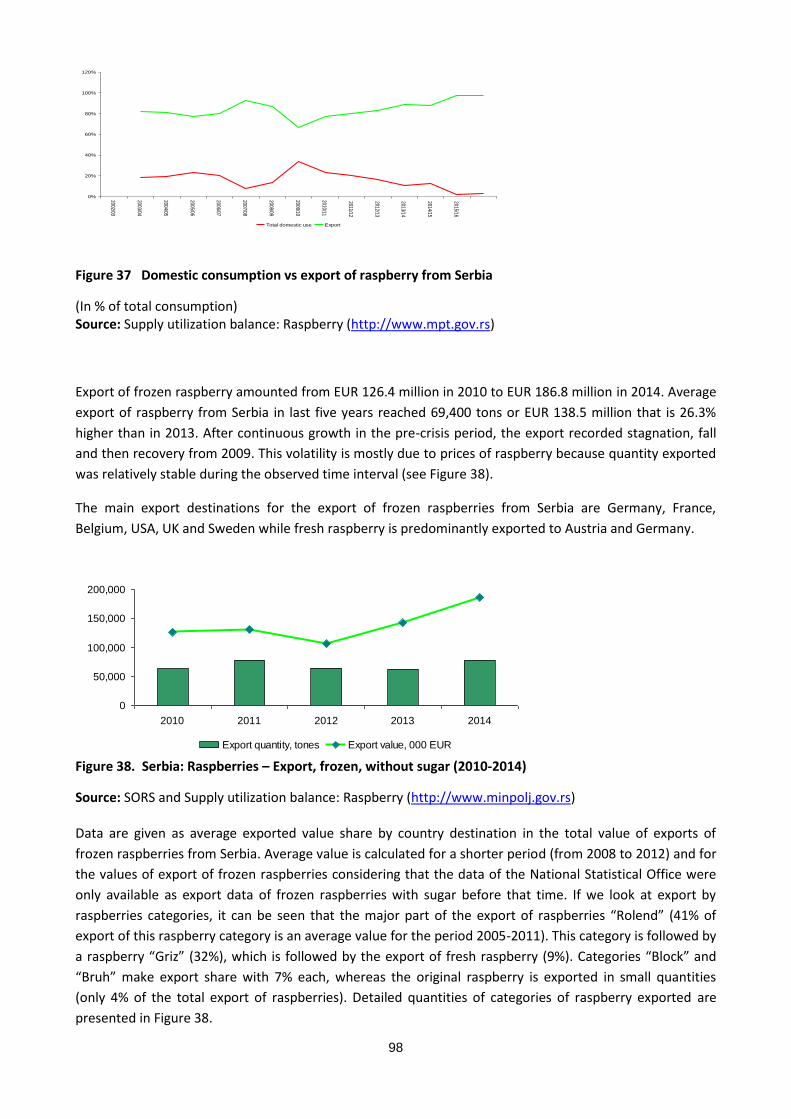
98
0%
20%
40%
60%
80%
100%
120%
2002/03
2003/04
2004/05
2005/06
2006/07
2007/08
2008/09
2009/10
2010/11
2011/12
2012/13
2013/14
2014/15
2015/16
Total domestic use Export Figure 37 Domestic consumption vs export of raspberry from Serbia
(In % of total consumption) Source: Supply utilization balance: Raspberry (http://www.mpt.gov.rs)
Export of frozen raspberry amounted from EUR 126.4 million in 2010 to EUR 186.8 million in 2014. Average
export of raspberry from Serbia in last five years reached 69,400 tons or EUR 138.5 million that is 26.3%
higher than in 2013. After continuous growth in the pre-crisis period, the export recorded stagnation, fall
and then recovery from 2009. This volatility is mostly due to prices of raspberry because quantity exported
was relatively stable during the observed time interval (see Figure 38).
The main export destinations for the export of frozen raspberries from Serbia are Germany, France,
Belgium, USA, UK and Sweden while fresh raspberry is predominantly exported to Austria and Germany.
0
50,000
100,000
150,000
200,000
2010 2011 2012 2013 2014
Export quantity, tones Export value, 000 EUR
Figure 38. Serbia: Raspberries – Export, frozen, without sugar (2010-2014)
Source: SORS and Supply utilization balance: Raspberry (http://www.minpolj.gov.rs) Data are given as average exported value share by country destination in the total value of exports of
frozen raspberries from Serbia. Average value is calculated for a shorter period (from 2008 to 2012) and for
the values of export of frozen raspberries considering that the data of the National Statistical Office were
only available as export data of frozen raspberries with sugar before that time. If we look at export by
raspberries categories, it can be seen that the major part of the export of raspberries “Rolend” (41% of
export of this raspberry category is an average value for the period 2005-2011). This category is followed by
a raspberry “Griz” (32%), which is followed by the export of fresh raspberry (9%). Categories “Block” and
“Bruh” make export share with 7% each, whereas the original raspberry is exported in small quantities
(only 4% of the total export of raspberries). Detailed quantities of categories of raspberry exported are
presented in Figure 38.
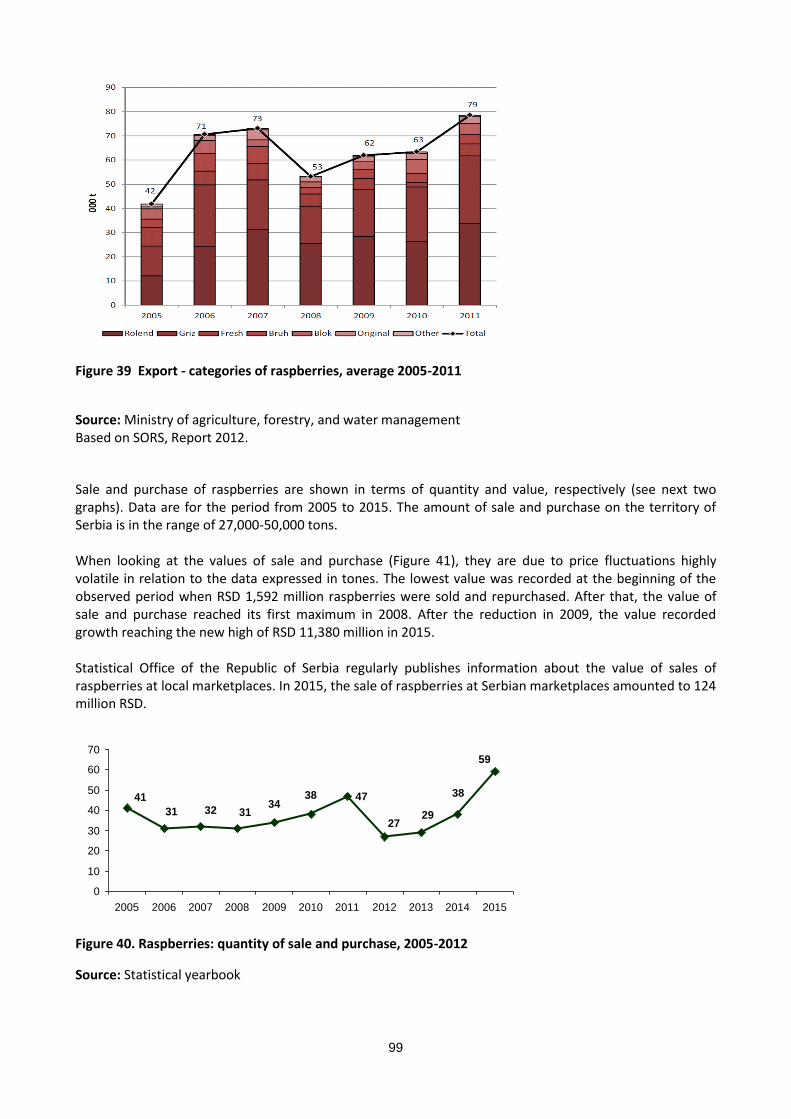
99
Figure 39 Export - categories of raspberries, average 2005-2011
Source: Ministry of agriculture, forestry, and water management Based on SORS, Report 2012.
Sale and purchase of raspberries are shown in terms of quantity and value, respectively (see next two graphs). Data are for the period from 2005 to 2015. The amount of sale and purchase on the territory of Serbia is in the range of 27,000-50,000 tons. When looking at the values of sale and purchase (Figure 41), they are due to price fluctuations highly volatile in relation to the data expressed in tones. The lowest value was recorded at the beginning of the observed period when RSD 1,592 million raspberries were sold and repurchased. After that, the value of sale and purchase reached its first maximum in 2008. After the reduction in 2009, the value recorded growth reaching the new high of RSD 11,380 million in 2015. Statistical Office of the Republic of Serbia regularly publishes information about the value of sales of raspberries at local marketplaces. In 2015, the sale of raspberries at Serbian marketplaces amounted to 124 million RSD.
47
59
38
2927
3834
3132
41
31
0
10
20
30
40
50
60
70
2005 2006 2007 2008 2009 2010 2011 2012 2013 2014 2015
Figure 40. Raspberries: quantity of sale and purchase, 2005-2012
Source: Statistical yearbook
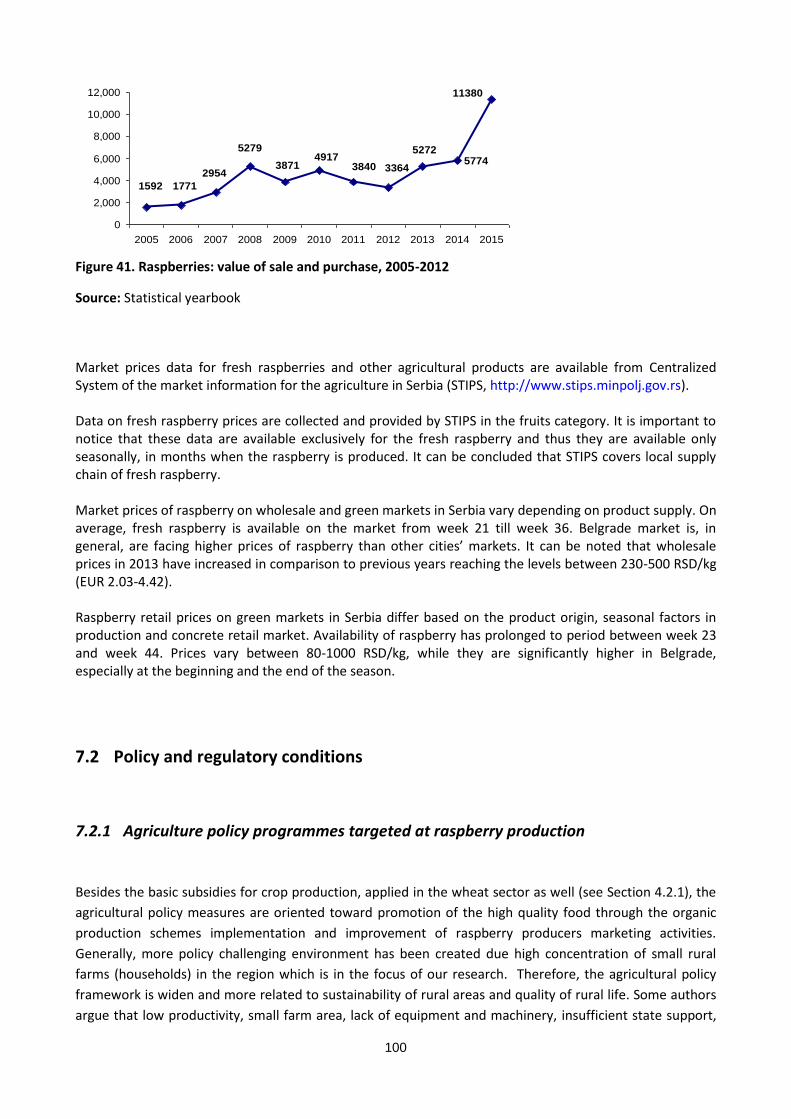
100
5774
11380
5272
336438404917
3871
5279
2954
17711592
0
2,000
4,000
6,000
8,000
10,000
12,000
2005 2006 2007 2008 2009 2010 2011 2012 2013 2014 2015
Figure 41. Raspberries: value of sale and purchase, 2005-2012
Source: Statistical yearbook
Market prices data for fresh raspberries and other agricultural products are available from Centralized System of the market information for the agriculture in Serbia (STIPS, http://www.stips.minpolj.gov.rs). Data on fresh raspberry prices are collected and provided by STIPS in the fruits category. It is important to notice that these data are available exclusively for the fresh raspberry and thus they are available only seasonally, in months when the raspberry is produced. It can be concluded that STIPS covers local supply chain of fresh raspberry. Market prices of raspberry on wholesale and green markets in Serbia vary depending on product supply. On average, fresh raspberry is available on the market from week 21 till week 36. Belgrade market is, in general, are facing higher prices of raspberry than other cities’ markets. It can be noted that wholesale prices in 2013 have increased in comparison to previous years reaching the levels between 230-500 RSD/kg (EUR 2.03-4.42). Raspberry retail prices on green markets in Serbia differ based on the product origin, seasonal factors in production and concrete retail market. Availability of raspberry has prolonged to period between week 23 and week 44. Prices vary between 80-1000 RSD/kg, while they are significantly higher in Belgrade, especially at the beginning and the end of the season.
7.2 Policy and regulatory conditions
7.2.1 Agriculture policy programmes targeted at raspberry production
Besides the basic subsidies for crop production, applied in the wheat sector as well (see Section 4.2.1), the
agricultural policy measures are oriented toward promotion of the high quality food through the organic
production schemes implementation and improvement of raspberry producers marketing activities.
Generally, more policy challenging environment has been created due high concentration of small rural
farms (households) in the region which is in the focus of our research. Therefore, the agricultural policy
framework is widen and more related to sustainability of rural areas and quality of rural life. Some authors
argue that low productivity, small farm area, lack of equipment and machinery, insufficient state support,
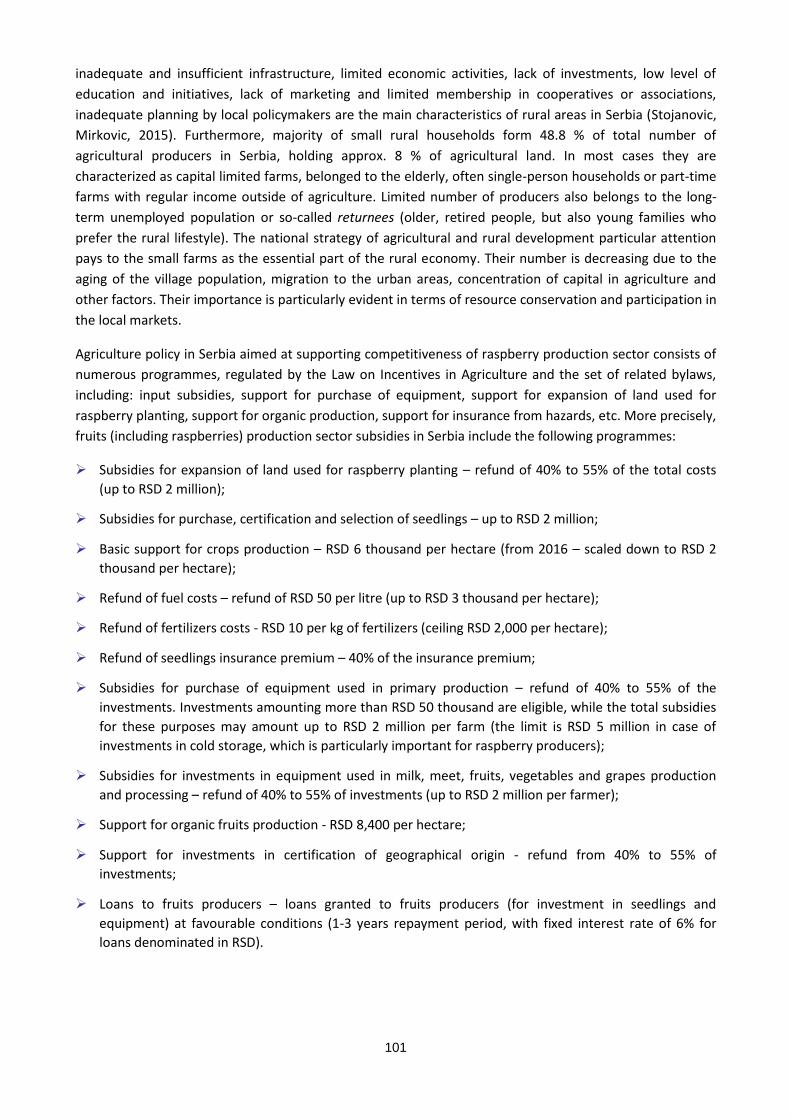
101
inadequate and insufficient infrastructure, limited economic activities, lack of investments, low level of
education and initiatives, lack of marketing and limited membership in cooperatives or associations,
inadequate planning by local policymakers are the main characteristics of rural areas in Serbia (Stojanovic,
Mirkovic, 2015). Furthermore, majority of small rural households form 48.8 % of total number of
agricultural producers in Serbia, holding approx. 8 % of agricultural land. In most cases they are
characterized as capital limited farms, belonged to the elderly, often single-person households or part-time
farms with regular income outside of agriculture. Limited number of producers also belongs to the long-
term unemployed population or so-called returnees (older, retired people, but also young families who
prefer the rural lifestyle). The national strategy of agricultural and rural development particular attention
pays to the small farms as the essential part of the rural economy. Their number is decreasing due to the
aging of the village population, migration to the urban areas, concentration of capital in agriculture and
other factors. Their importance is particularly evident in terms of resource conservation and participation in
the local markets.
Agriculture policy in Serbia aimed at supporting competitiveness of raspberry production sector consists of
numerous programmes, regulated by the Law on Incentives in Agriculture and the set of related bylaws,
including: input subsidies, support for purchase of equipment, support for expansion of land used for
raspberry planting, support for organic production, support for insurance from hazards, etc. More precisely,
fruits (including raspberries) production sector subsidies in Serbia include the following programmes:
Subsidies for expansion of land used for raspberry planting – refund of 40% to 55% of the total costs
(up to RSD 2 million);
Subsidies for purchase, certification and selection of seedlings – up to RSD 2 million;
Basic support for crops production – RSD 6 thousand per hectare (from 2016 – scaled down to RSD 2
thousand per hectare);
Refund of fuel costs – refund of RSD 50 per litre (up to RSD 3 thousand per hectare);
Refund of fertilizers costs - RSD 10 per kg of fertilizers (ceiling RSD 2,000 per hectare);
Refund of seedlings insurance premium – 40% of the insurance premium;
Subsidies for purchase of equipment used in primary production – refund of 40% to 55% of the
investments. Investments amounting more than RSD 50 thousand are eligible, while the total subsidies
for these purposes may amount up to RSD 2 million per farm (the limit is RSD 5 million in case of
investments in cold storage, which is particularly important for raspberry producers);
Subsidies for investments in equipment used in milk, meet, fruits, vegetables and grapes production
and processing – refund of 40% to 55% of investments (up to RSD 2 million per farmer);
Support for organic fruits production - RSD 8,400 per hectare;
Support for investments in certification of geographical origin - refund from 40% to 55% of
investments;
Loans to fruits producers – loans granted to fruits producers (for investment in seedlings and
equipment) at favourable conditions (1-3 years repayment period, with fixed interest rate of 6% for
loans denominated in RSD).
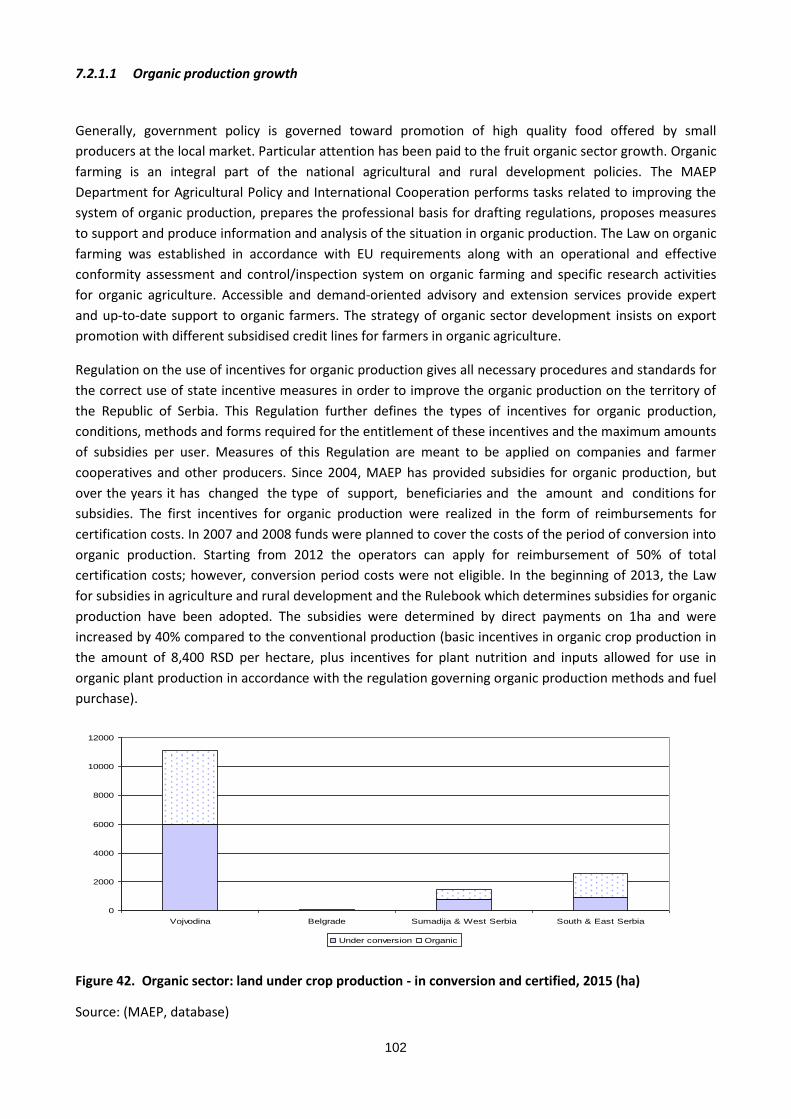
102
7.2.1.1 Organic production growth
Generally, government policy is governed toward promotion of high quality food offered by small
producers at the local market. Particular attention has been paid to the fruit organic sector growth. Organic
farming is an integral part of the national agricultural and rural development policies. The MAEP
Department for Agricultural Policy and International Cooperation performs tasks related to improving the
system of organic production, prepares the professional basis for drafting regulations, proposes measures
to support and produce information and analysis of the situation in organic production. The Law on organic
farming was established in accordance with EU requirements along with an operational and effective
conformity assessment and control/inspection system on organic farming and specific research activities
for organic agriculture. Accessible and demand-oriented advisory and extension services provide expert
and up-to-date support to organic farmers. The strategy of organic sector development insists on export
promotion with different subsidised credit lines for farmers in organic agriculture.
Regulation on the use of incentives for organic production gives all necessary procedures and standards for
the correct use of state incentive measures in order to improve the organic production on the territory of
the Republic of Serbia. This Regulation further defines the types of incentives for organic production,
conditions, methods and forms required for the entitlement of these incentives and the maximum amounts
of subsidies per user. Measures of this Regulation are meant to be applied on companies and farmer
cooperatives and other producers. Since 2004, MAEP has provided subsidies for organic production, but
over the years it has changed the type of support, beneficiaries and the amount and conditions for
subsidies. The first incentives for organic production were realized in the form of reimbursements for
certification costs. In 2007 and 2008 funds were planned to cover the costs of the period of conversion into
organic production. Starting from 2012 the operators can apply for reimbursement of 50% of total
certification costs; however, conversion period costs were not eligible. In the beginning of 2013, the Law
for subsidies in agriculture and rural development and the Rulebook which determines subsidies for organic
production have been adopted. The subsidies were determined by direct payments on 1ha and were
increased by 40% compared to the conventional production (basic incentives in organic crop production in
the amount of 8,400 RSD per hectare, plus incentives for plant nutrition and inputs allowed for use in
organic plant production in accordance with the regulation governing organic production methods and fuel
purchase).
0
2000
4000
6000
8000
10000
12000
Vojvodina Belgrade Sumadija & West Serbia South & East Serbia
Under conversion Organic
Figure 42. Organic sector: land under crop production - in conversion and certified, 2015 (ha)
Source: (MAEP, database)
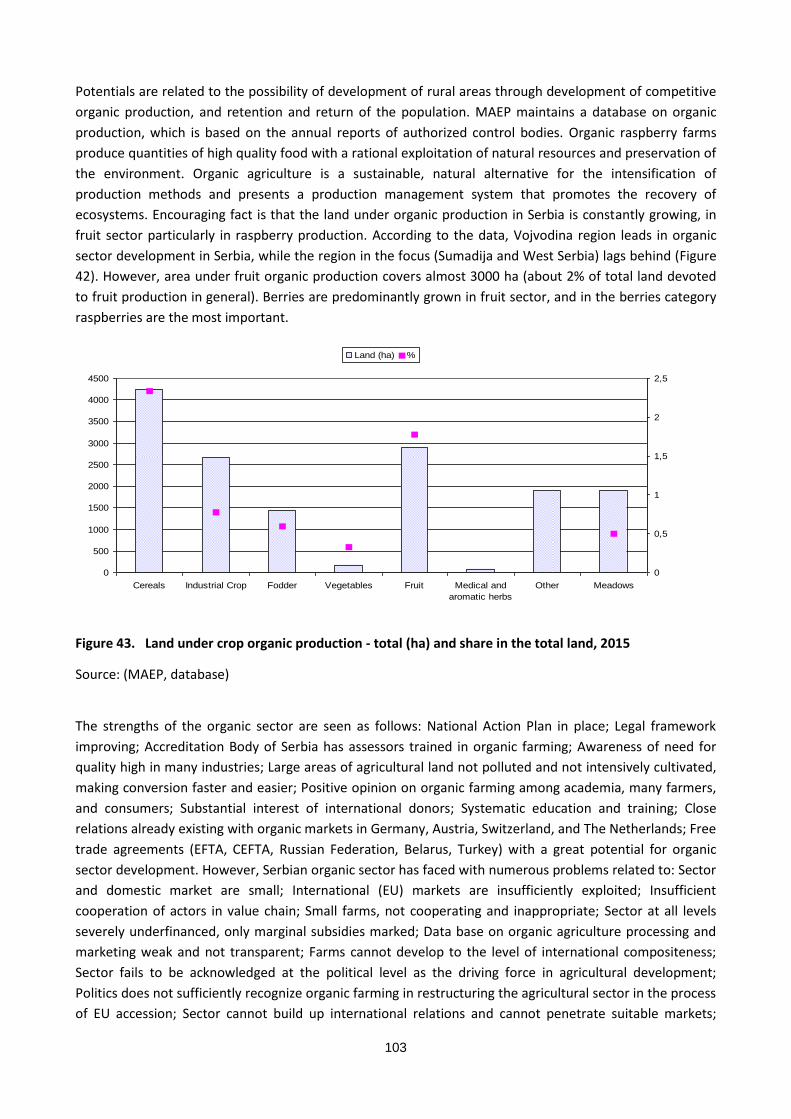
103
Potentials are related to the possibility of development of rural areas through development of competitive
organic production, and retention and return of the population. MAEP maintains a database on organic
production, which is based on the annual reports of authorized control bodies. Organic raspberry farms
produce quantities of high quality food with a rational exploitation of natural resources and preservation of
the environment. Organic agriculture is a sustainable, natural alternative for the intensification of
production methods and presents a production management system that promotes the recovery of
ecosystems. Encouraging fact is that the land under organic production in Serbia is constantly growing, in
fruit sector particularly in raspberry production. According to the data, Vojvodina region leads in organic
sector development in Serbia, while the region in the focus (Sumadija and West Serbia) lags behind (Figure
42). However, area under fruit organic production covers almost 3000 ha (about 2% of total land devoted
to fruit production in general). Berries are predominantly grown in fruit sector, and in the berries category
raspberries are the most important.
0
500
1000
1500
2000
2500
3000
3500
4000
4500
Cereals Industrial Crop Fodder Vegetables Fruit Medical and
aromatic herbs
Other Meadows
0
0,5
1
1,5
2
2,5
Land (ha) %
Figure 43. Land under crop organic production - total (ha) and share in the total land, 2015
Source: (MAEP, database)
The strengths of the organic sector are seen as follows: National Action Plan in place; Legal framework
improving; Accreditation Body of Serbia has assessors trained in organic farming; Awareness of need for
quality high in many industries; Large areas of agricultural land not polluted and not intensively cultivated,
making conversion faster and easier; Positive opinion on organic farming among academia, many farmers,
and consumers; Substantial interest of international donors; Systematic education and training; Close
relations already existing with organic markets in Germany, Austria, Switzerland, and The Netherlands; Free
trade agreements (EFTA, CEFTA, Russian Federation, Belarus, Turkey) with a great potential for organic
sector development. However, Serbian organic sector has faced with numerous problems related to: Sector
and domestic market are small; International (EU) markets are insufficiently exploited; Insufficient
cooperation of actors in value chain; Small farms, not cooperating and inappropriate; Sector at all levels
severely underfinanced, only marginal subsidies marked; Data base on organic agriculture processing and
marketing weak and not transparent; Farms cannot develop to the level of international compositeness;
Sector fails to be acknowledged at the political level as the driving force in agricultural development;
Politics does not sufficiently recognize organic farming in restructuring the agricultural sector in the process
of EU accession; Sector cannot build up international relations and cannot penetrate suitable markets;
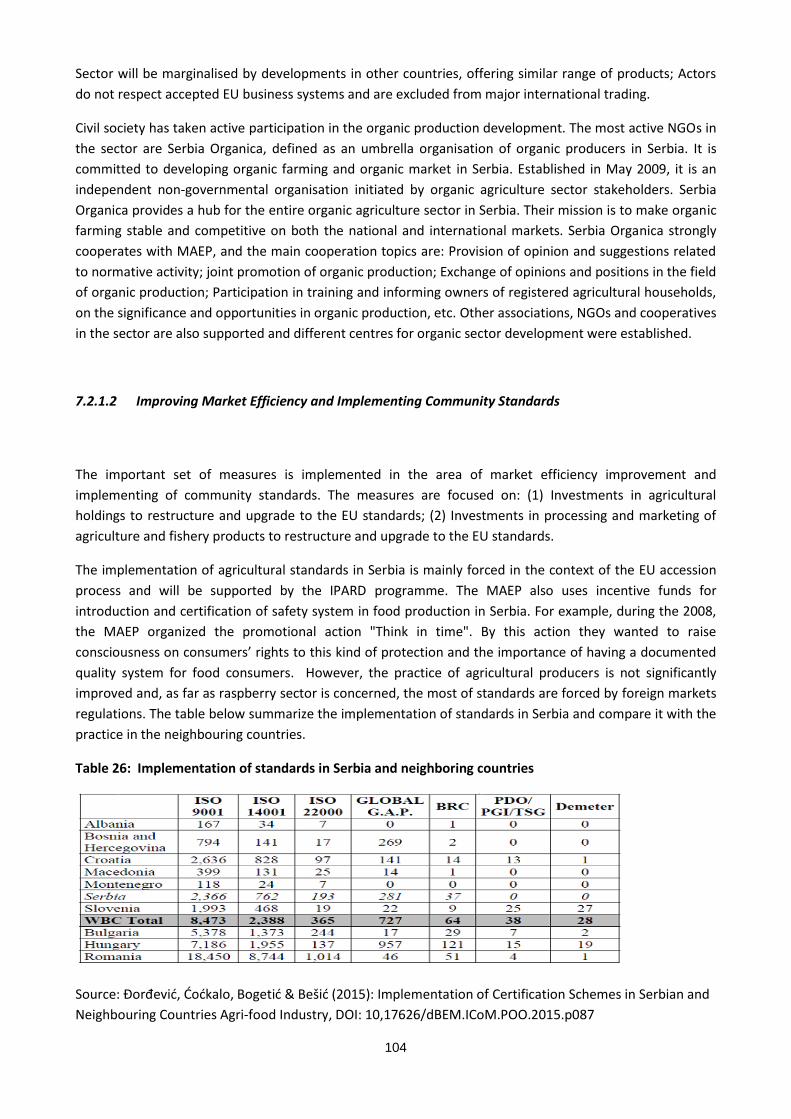
104
Sector will be marginalised by developments in other countries, offering similar range of products; Actors
do not respect accepted EU business systems and are excluded from major international trading.
Civil society has taken active participation in the organic production development. The most active NGOs in
the sector are Serbia Organica, defined as an umbrella organisation of organic producers in Serbia. It is
committed to developing organic farming and organic market in Serbia. Established in May 2009, it is an
independent non-governmental organisation initiated by organic agriculture sector stakeholders. Serbia
Organica provides a hub for the entire organic agriculture sector in Serbia. Their mission is to make organic
farming stable and competitive on both the national and international markets. Serbia Organica strongly
cooperates with MAEP, and the main cooperation topics are: Provision of opinion and suggestions related
to normative activity; joint promotion of organic production; Exchange of opinions and positions in the field
of organic production; Participation in training and informing owners of registered agricultural households,
on the significance and opportunities in organic production, etc. Other associations, NGOs and cooperatives
in the sector are also supported and different centres for organic sector development were established.
7.2.1.2 Improving Market Efficiency and Implementing Community Standards
The important set of measures is implemented in the area of market efficiency improvement and
implementing of community standards. The measures are focused on: (1) Investments in agricultural
holdings to restructure and upgrade to the EU standards; (2) Investments in processing and marketing of
agriculture and fishery products to restructure and upgrade to the EU standards.
The implementation of agricultural standards in Serbia is mainly forced in the context of the EU accession
process and will be supported by the IPARD programme. The MAEP also uses incentive funds for
introduction and certification of safety system in food production in Serbia. For example, during the 2008,
the MAEP organized the promotional action "Think in time". By this action they wanted to raise
consciousness on consumers’ rights to this kind of protection and the importance of having a documented
quality system for food consumers. However, the practice of agricultural producers is not significantly
improved and, as far as raspberry sector is concerned, the most of standards are forced by foreign markets
regulations. The table below summarize the implementation of standards in Serbia and compare it with the
practice in the neighbouring countries.
Table 26: Implementation of standards in Serbia and neighboring countries
Source: Đorđević, Ćoćkalo, Bogetić & Bešić (2015): Implementation of Certification Schemes in Serbian and
Neighbouring Countries Agri-food Industry, DOI: 10,17626/dBEM.ICoM.POO.2015.p087
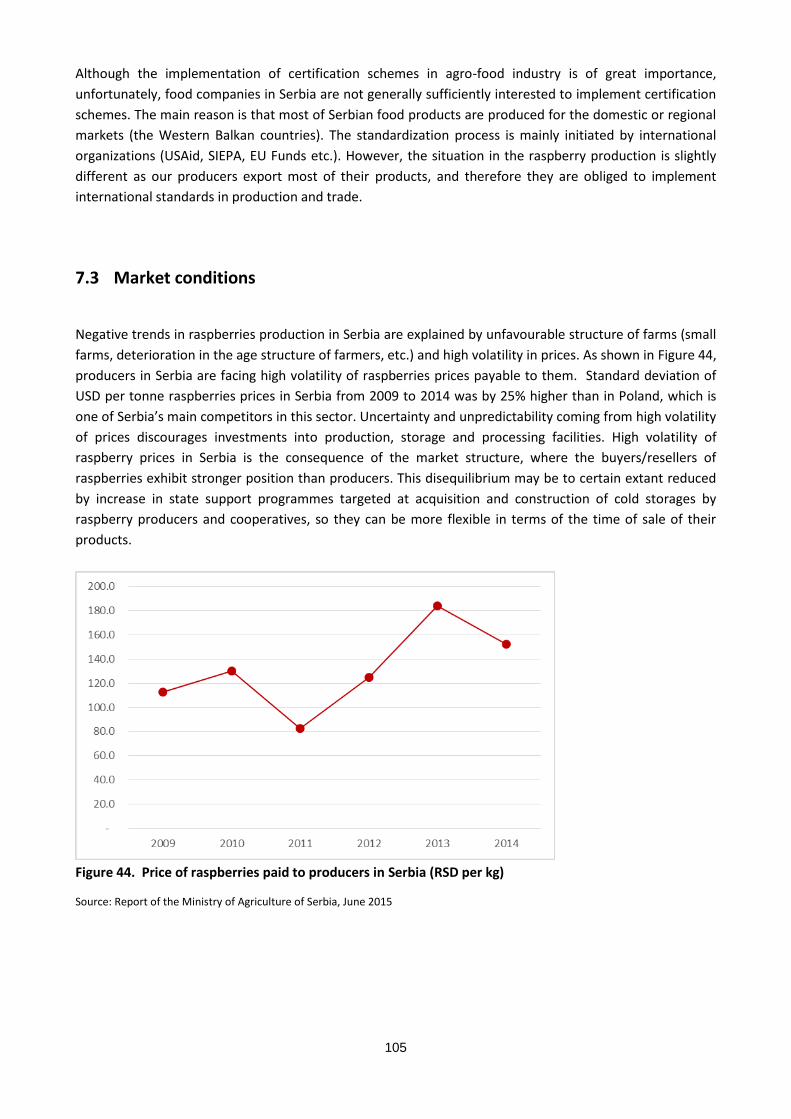
105
Although the implementation of certification schemes in agro-food industry is of great importance,
unfortunately, food companies in Serbia are not generally sufficiently interested to implement certification
schemes. The main reason is that most of Serbian food products are produced for the domestic or regional
markets (the Western Balkan countries). The standardization process is mainly initiated by international
organizations (USAid, SIEPA, EU Funds etc.). However, the situation in the raspberry production is slightly
different as our producers export most of their products, and therefore they are obliged to implement
international standards in production and trade.
7.3 Market conditions
Negative trends in raspberries production in Serbia are explained by unfavourable structure of farms (small
farms, deterioration in the age structure of farmers, etc.) and high volatility in prices. As shown in Figure 44,
producers in Serbia are facing high volatility of raspberries prices payable to them. Standard deviation of
USD per tonne raspberries prices in Serbia from 2009 to 2014 was by 25% higher than in Poland, which is
one of Serbia’s main competitors in this sector. Uncertainty and unpredictability coming from high volatility
of prices discourages investments into production, storage and processing facilities. High volatility of
raspberry prices in Serbia is the consequence of the market structure, where the buyers/resellers of
raspberries exhibit stronger position than producers. This disequilibrium may be to certain extant reduced
by increase in state support programmes targeted at acquisition and construction of cold storages by
raspberry producers and cooperatives, so they can be more flexible in terms of the time of sale of their
products.
Figure 44. Price of raspberries paid to producers in Serbia (RSD per kg)
Source: Report of the Ministry of Agriculture of Serbia, June 2015
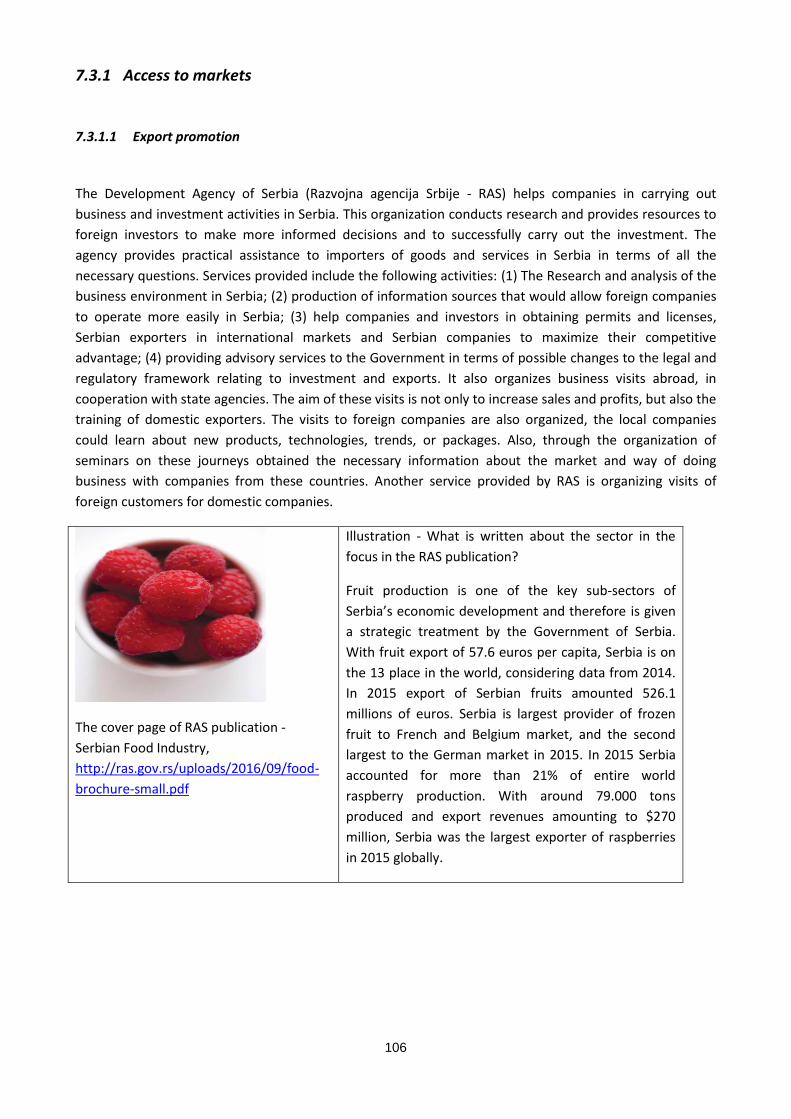
106
7.3.1 Access to markets
7.3.1.1 Export promotion
The Development Agency of Serbia (Razvojna agencija Srbije - RAS) helps companies in carrying out
business and investment activities in Serbia. This organization conducts research and provides resources to
foreign investors to make more informed decisions and to successfully carry out the investment. The
agency provides practical assistance to importers of goods and services in Serbia in terms of all the
necessary questions. Services provided include the following activities: (1) The Research and analysis of the
business environment in Serbia; (2) production of information sources that would allow foreign companies
to operate more easily in Serbia; (3) help companies and investors in obtaining permits and licenses,
Serbian exporters in international markets and Serbian companies to maximize their competitive
advantage; (4) providing advisory services to the Government in terms of possible changes to the legal and
regulatory framework relating to investment and exports. It also organizes business visits abroad, in
cooperation with state agencies. The aim of these visits is not only to increase sales and profits, but also the
training of domestic exporters. The visits to foreign companies are also organized, the local companies
could learn about new products, technologies, trends, or packages. Also, through the organization of
seminars on these journeys obtained the necessary information about the market and way of doing
business with companies from these countries. Another service provided by RAS is organizing visits of
foreign customers for domestic companies.
The cover page of RAS publication -
Serbian Food Industry,
http://ras.gov.rs/uploads/2016/09/food-
brochure-small.pdf
Illustration - What is written about the sector in the
focus in the RAS publication?
Fruit production is one of the key sub-sectors of
Serbia’s economic development and therefore is given
a strategic treatment by the Government of Serbia.
With fruit export of 57.6 euros per capita, Serbia is on
the 13 place in the world, considering data from 2014.
In 2015 export of Serbian fruits amounted 526.1
millions of euros. Serbia is largest provider of frozen
fruit to French and Belgium market, and the second
largest to the German market in 2015. In 2015 Serbia
accounted for more than 21% of entire world
raspberry production. With around 79.000 tons
produced and export revenues amounting to $270
million, Serbia was the largest exporter of raspberries
in 2015 globally.
107
7.3.1.2 Cooperatives and support to the producers groups
Cooperatives in Serbia have long history, evolving from big traditional families in XIX century to the
contemporary social networked organizations (second half of XX century) and even private companies
acting like coops (newly established cooperatives in XXI century) (Krasavac and Petković, 2015). Although
cooperatives have a long history, some authors argue that the cooperatives registered under the
Cooperatives Act and listed in the commercial register as Cooperatives in the Western Balkans Area can be
divided into two big groups. The first group are pseudo-cooperatives, and the second are true cooperatives.
“Pseudo-cooperatives” can also be divided into two groups. The one is the so-called “old cooperatives”
where farmers do not have the right to administer, but instead the employees do this, and the other, the
“private cooperatives” are registered as cooperatives but are really private companies owned by one or
several individuals (Živkov, 2013).
Market chains are underdeveloped and in the most cases they are short and do not include small-scale
farmers. Due to the specific model of agrarian question solving (so-called the cooperative model)
implemented in the socialist era, cooperative sector in Serbia is constantly faced with numerous problems.
The cooperatives of the new generation have been established mainly by fruit-growers, to whom
association was the next necessary, logical, economically inevitable step towards better access to the
market. However, the activity of producers groups (nor necessarily organized in the form of cooperative) is
seen as an alternative for better performance and organization of fruit producers.
7.3.1.3 "Ariljska malina" - product with designation of origin
In the course of 2009, one name of origin was registered as “Ariljska malina”(Raspberry from the Village of
Arilje). The origin of food products marks a higher quality and guarantees that the specificity and quality of
the product is result of climate, soil, special breed, variety, etc. Tradition, knowledge and skills in Raspberry
from the Village of Arilje are passed down through generations. Serbian Red Raspberries are prized for their
colour, flavour and firmness. Due to content of carbohydrates, vitamin c, antioxidants, organic acids,
anthocyanins and elagic acid, this fruit is often advertised as with the specific nutritional and health
properties. Generally, raspberries from Serbia have a good reputation. Producers and other stakeholders
are considering promoting this Geographical indication (GI) produce outside of Serbia with the
neighbouring countries as the targeted markets. However, the willingness to pay is slightly higher for
organic raspberries than for GI labelled raspberries. This could imply that a combination of strategies,
rather than focusing on GI labelling only, may be more beneficial for Serbian producers (Ivana Radich &
Maurizio Canavari, 2014). The export of fresh raspberry is just in the initial phase in general, and protecting
geographical indication of raspberry from Arilje also in the EU is seen as a good opportunity for the whole
western area of the country.
The project „Arilje raspberry“ was funded by European Union, within Regional Socio-Economic
Development Programme 2 (2009-2011). Project partners were municipalities of Arilje, Lucani, Ivanjica and
Pozega, Regional Development Agency „Zlatibor“ Uzice, Innovation Centre for Agriculture Arilje, General
Association of Entrepreneurs Arilje and Bioagicoop Bologna, Italy. The aim of the project was to increase
competitiveness of SMEs active in the production and processing of raspberries in Western Serbia and
108
achieved results can be presented as follows: (1) totally 200 farmers in the region of the Arilje Raspberry
were certified in GLOBALG.A.P standard; the mechanism for monitoring and control in safe food production
was established (GLOBALG.A.P. standard for a mandatory analysis of water, soil and fruit); (3) commercial
links for fresh fruit markets in 5 countries were created. The main programmes in the foreign aid support to
the berry sector development in Serbia are analysed below.
7.3.2 Internationally supported programmes
Investigation of international programmes implemented in fruit (berry) sector in Serbia showed that foreign
aid was generally governed toward institutional development and private sector straightening. One of the
first internationally supported programmes was related to “Improvement of work organisation of farmer’s
cooperatives in Serbia based on Norwegian model“ (Norwegian support to Serbia, started in 2001 covered
the issue of cooperation in Serbian agriculture - EUR 1 million). The purpose of the project was to improve
the work of new and existing cooperatives and farmer’s associations according to the Western European -
Norwegian model. Key results were the following: 1) Achieved strengthening of agricultural production in
Serbia through revitalization of eight agriculture cooperatives and creation of new modern organizations of
agricultural producers according to the European principles; 2) Realized trainings on: establishment and
operation of modern agricultural cooperatives; marketing and trade; knowledge transfer to advisory service
and agriculture cooperatives and their strategy; 3) Hand books and manuals for establishment of
cooperatives developed; 4) Baseline analysis on agriculture cooperatives in Serbia prepared; and 5)
Strategy on agriculture cooperatives in Serbia prepared.
Project of a particular interest in the context of fruit sector analysis is related Support to the Fruits and
Berries Sector in Southern Serbia (Denmark donation). This programme has supported five fruit value
chains for domestic and export markets. This has been a very relevant project as Serbia has particular
competitive advantages in the fruit sector. The project started at the end 2010 and ended in 2014. It
provided technical assistance (EUR 4 million) and grants (EUR 5.3 million) through two calls for applications
per year.
Currently, the USAID’s Business Enabling Project helps the Serbian government to increase the
competitiveness of the Serbian economy and its private sector by streamlining the business enabling
environment, improving public financial management, and strengthening financial markets. It is a seven-
year initiative launched in January 2011. The Project activities are based on priorities identified by the
private sector. Particular attention has been paid to the financial sector development as a precondition for
sustainable economic activity. The project aims at:
(1) Improving access to finance for small and medium-sized enterprises and sole proprietors (SMEs) -
Empower service providers to support lending by providing, support for improving the profession of real
estate appraisers. Assist the Ministry of Economy in establishing the SME Council and implementing the
SME Development Strategy, in particular in terms of improvements to access to finance and business
regulation. Public outreach on the development of financial markets and their role in economic growth and
poverty reduction. Assistance in improving the dissemination of all information on SME financing. Support
the enhancement and proper use of accounting for micro-enterprises and SMEs.
(2) Developing a regulatory framework for non-bank financial institutions (NBFIs): Assist the Government,
National Bank, and financial sector to develop a regulatory and supervisory framework for non-bank
109
financial institutions. Provide expertise and facilitate dialogue on NBFI legislation. Assist in drafting
legislation to improve leasing as an alternative source of financing for SMEs.
(3) Improve the efficiency, monitoring and transparency of state aid: Assist the Ministry of Economy and
Ministry of Finance in reforming financial support mechanisms for SMEs. Prepare recommendations for the
design of new state aid programs or improvement of existing ones, as well as recommendations for the
management of state aid programs.
(3) Developing a legal framework for Commodity Exchanges: Technical assistance in finalizing a regulatory
framework for commodity exchanges.
(4) Strengthen In-Court and Out-of-Court Credit Enforcement: Advocate for and assist with improvements
to laws and regulations that will improve the regulatory framework for collateral enforcement, particularly
out-of court enforcement. Assist in continued improvements to implementation of in-court enforcement.
Continuing collaboration with other donors (such as GIZ) in providing support to the Enforcement Officer
profession and assisting their Chamber in additional capacity-building efforts.
Previously, the agribusiness sector in Serbia was supported under the USAID Agribusiness Project (2007-
2012). Particular attention was paid to the berry fruit sub-sector. Project identified berry sector as a rare
source of steady income for growers and the processing industry in western Serbia, where the berry
industry is a driving force for agriculture and regional economic growth (USAID Serbia Agribusiness Project
– Project Completion Report, 2012). The majority of the berries grown in Serbia are old varieties which are
usually suitable only for processing and not for the fresh markets. These varieties are grown in open fields,
with outdated technology, and as a result the farms have poor yields and low quality fruit. About 90% of all
berry fruit produced in Serbia is exported. Although the global demand for fresh fruit grows continually,
due to consumer interest in a healthy diet, the exports of raspberries, blackberries, currants and
blueberries for the fresh market were non-existent for Serbia at that time. Early efforts to move raspberry
production to lowlands, production consolidation and/or vertical integration, and the supermarkets’
growing share of total berry sales were other major characteristics of the sector. Project supported the
development of the Fresh Berry Fruit Value Chain in Serbia. The significant assistance was given to
improvement of planting material – nursery development, through linking local nurseries with international
breeders and licensees, and support for the testing of new varieties. The development of berry fruit
industry associations was also strongly supported and several international trade missions and trade show
exhibits were organized. The processor/exporter marketing capabilities and export market linkages were in
the focus of the project activities as well. The processors were assisted to adopt, and become certified in,
relevant international quality and food safety standards and traceability requirements.
7.4 Key conditions faced by small family raspberry producers
The key conditions are derived from the literature review and going to be discussed with the focus groups
participants for the Raspberry CS in Serbia.10 The importance of selected conditions is already confirmed in
the discussion with the experts selected for interviewing.11 The key conditions faced by raspberry
producers are summarized in the table below:
10 Only the first conclusions are described in the draft report. 11 Totally five interviews with sector representatives were conducted.
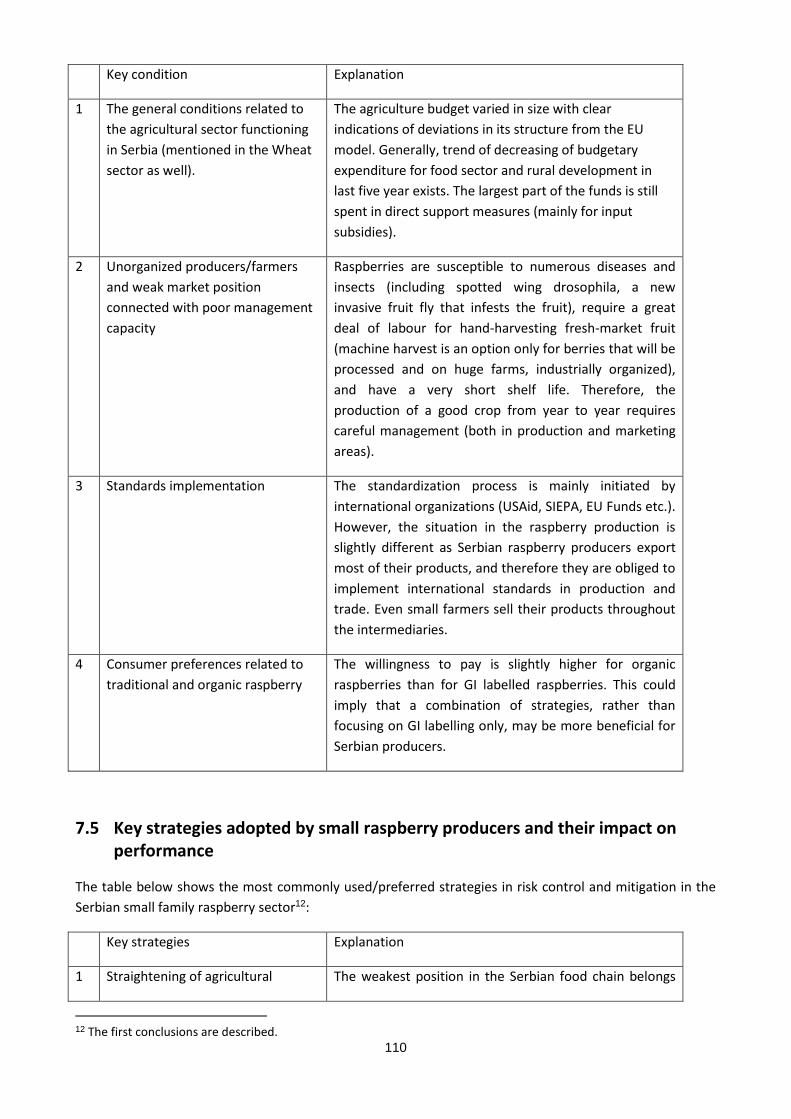
110
Key condition Explanation
1 The general conditions related to
the agricultural sector functioning
in Serbia (mentioned in the Wheat
sector as well).
The agriculture budget varied in size with clear
indications of deviations in its structure from the EU
model. Generally, trend of decreasing of budgetary
expenditure for food sector and rural development in
last five year exists. The largest part of the funds is still
spent in direct support measures (mainly for input
subsidies).
2 Unorganized producers/farmers
and weak market position
connected with poor management
capacity
Raspberries are susceptible to numerous diseases and
insects (including spotted wing drosophila, a new
invasive fruit fly that infests the fruit), require a great
deal of labour for hand-harvesting fresh-market fruit
(machine harvest is an option only for berries that will be
processed and on huge farms, industrially organized),
and have a very short shelf life. Therefore, the
production of a good crop from year to year requires
careful management (both in production and marketing
areas).
3 Standards implementation The standardization process is mainly initiated by
international organizations (USAid, SIEPA, EU Funds etc.).
However, the situation in the raspberry production is
slightly different as Serbian raspberry producers export
most of their products, and therefore they are obliged to
implement international standards in production and
trade. Even small farmers sell their products throughout
the intermediaries.
4 Consumer preferences related to
traditional and organic raspberry
The willingness to pay is slightly higher for organic
raspberries than for GI labelled raspberries. This could
imply that a combination of strategies, rather than
focusing on GI labelling only, may be more beneficial for
Serbian producers.
7.5 Key strategies adopted by small raspberry producers and their impact on performance
The table below shows the most commonly used/preferred strategies in risk control and mitigation in the
Serbian small family raspberry sector12:
Key strategies Explanation
1 Straightening of agricultural The weakest position in the Serbian food chain belongs
12 The first conclusions are described.
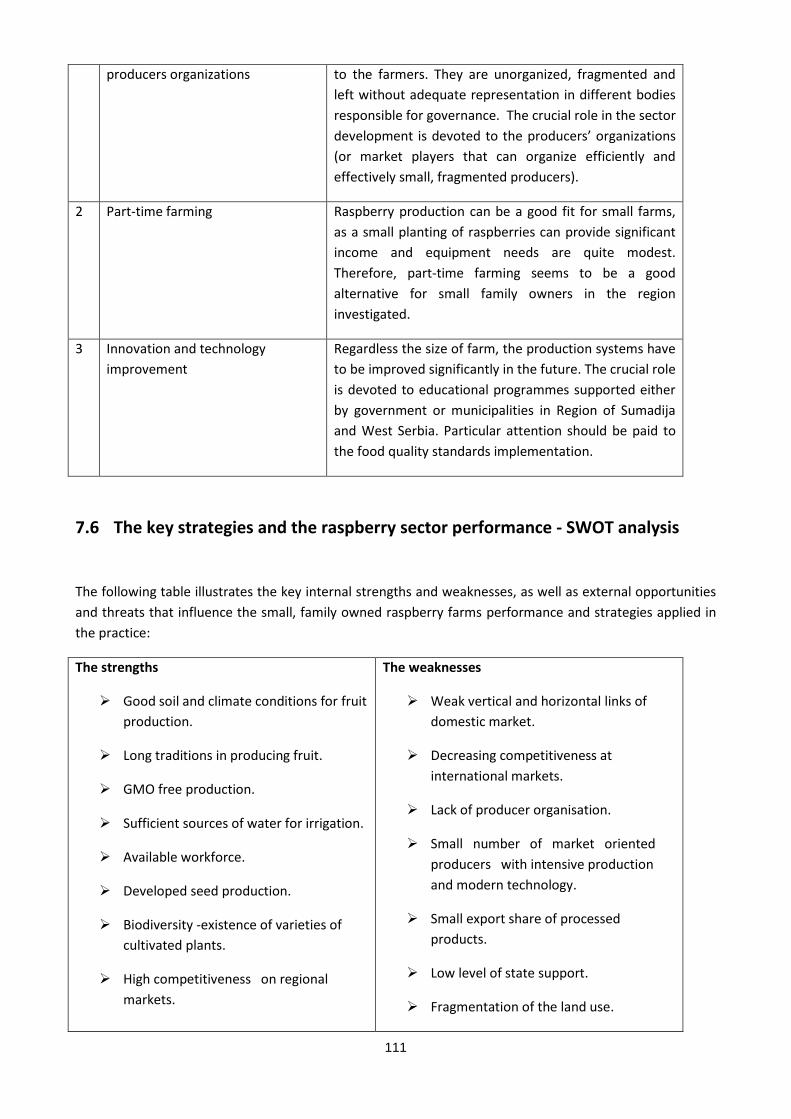
111
producers organizations to the farmers. They are unorganized, fragmented and
left without adequate representation in different bodies
responsible for governance. The crucial role in the sector
development is devoted to the producers’ organizations
(or market players that can organize efficiently and
effectively small, fragmented producers).
2 Part-time farming Raspberry production can be a good fit for small farms,
as a small planting of raspberries can provide significant
income and equipment needs are quite modest.
Therefore, part-time farming seems to be a good
alternative for small family owners in the region
investigated.
3 Innovation and technology
improvement
Regardless the size of farm, the production systems have
to be improved significantly in the future. The crucial role
is devoted to educational programmes supported either
by government or municipalities in Region of Sumadija
and West Serbia. Particular attention should be paid to
the food quality standards implementation.
7.6 The key strategies and the raspberry sector performance - SWOT analysis
The following table illustrates the key internal strengths and weaknesses, as well as external opportunities
and threats that influence the small, family owned raspberry farms performance and strategies applied in
the practice:
The strengths
Good soil and climate conditions for fruit
production.
Long traditions in producing fruit.
GMO free production.
Sufficient sources of water for irrigation.
Available workforce.
Developed seed production.
Biodiversity -existence of varieties of
cultivated plants.
High competitiveness on regional
markets.
The weaknesses
Weak vertical and horizontal links of
domestic market.
Decreasing competitiveness at
international markets.
Lack of producer organisation.
Small number of market oriented
producers with intensive production
and modern technology.
Small export share of processed
products.
Low level of state support.
Fragmentation of the land use.
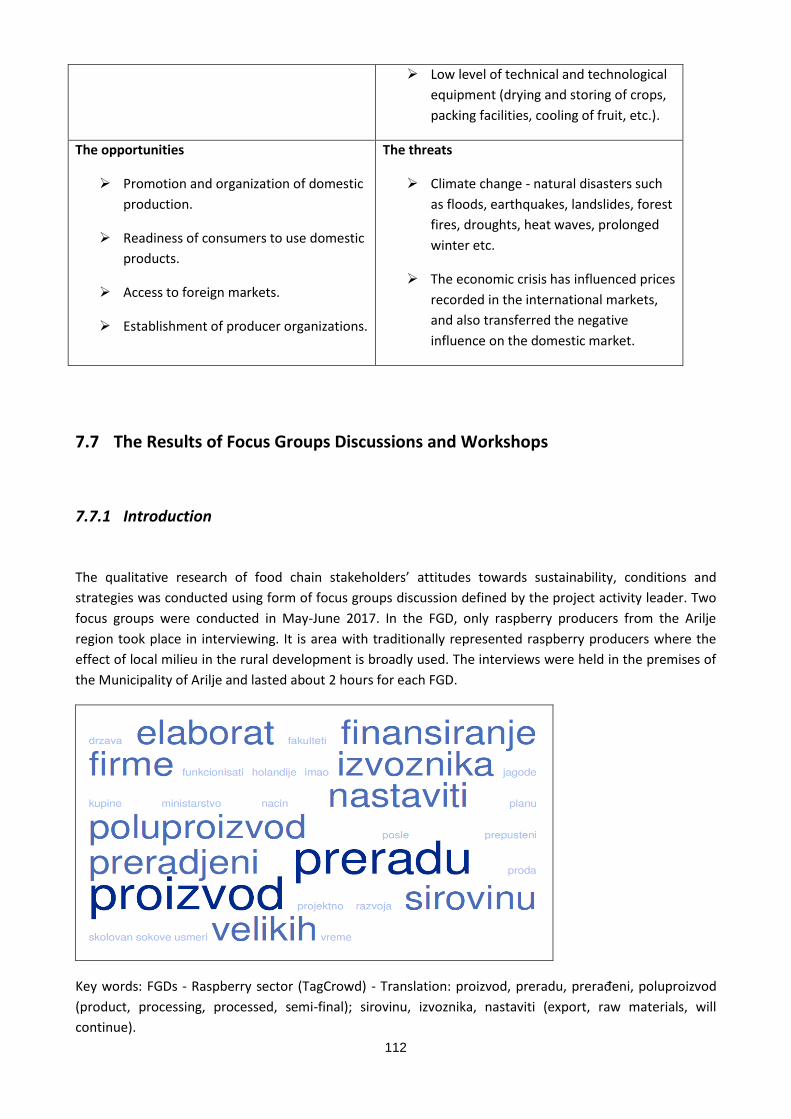
112
Low level of technical and technological
equipment (drying and storing of crops,
packing facilities, cooling of fruit, etc.).
The opportunities
Promotion and organization of domestic
production.
Readiness of consumers to use domestic
products.
Access to foreign markets.
Establishment of producer organizations.
The threats
Climate change - natural disasters such
as floods, earthquakes, landslides, forest
fires, droughts, heat waves, prolonged
winter etc.
The economic crisis has influenced prices
recorded in the international markets,
and also transferred the negative
influence on the domestic market.
7.7 The Results of Focus Groups Discussions and Workshops
7.7.1 Introduction
The qualitative research of food chain stakeholders’ attitudes towards sustainability, conditions and
strategies was conducted using form of focus groups discussion defined by the project activity leader. Two
focus groups were conducted in May-June 2017. In the FGD, only raspberry producers from the Arilje
region took place in interviewing. It is area with traditionally represented raspberry producers where the
effect of local milieu in the rural development is broadly used. The interviews were held in the premises of
the Municipality of Arilje and lasted about 2 hours for each FGD.
Key words: FGDs - Raspberry sector (TagCrowd) - Translation: proizvod, preradu, prerađeni, poluproizvod
(product, processing, processed, semi-final); sirovinu, izvoznika, nastaviti (export, raw materials, will
continue).
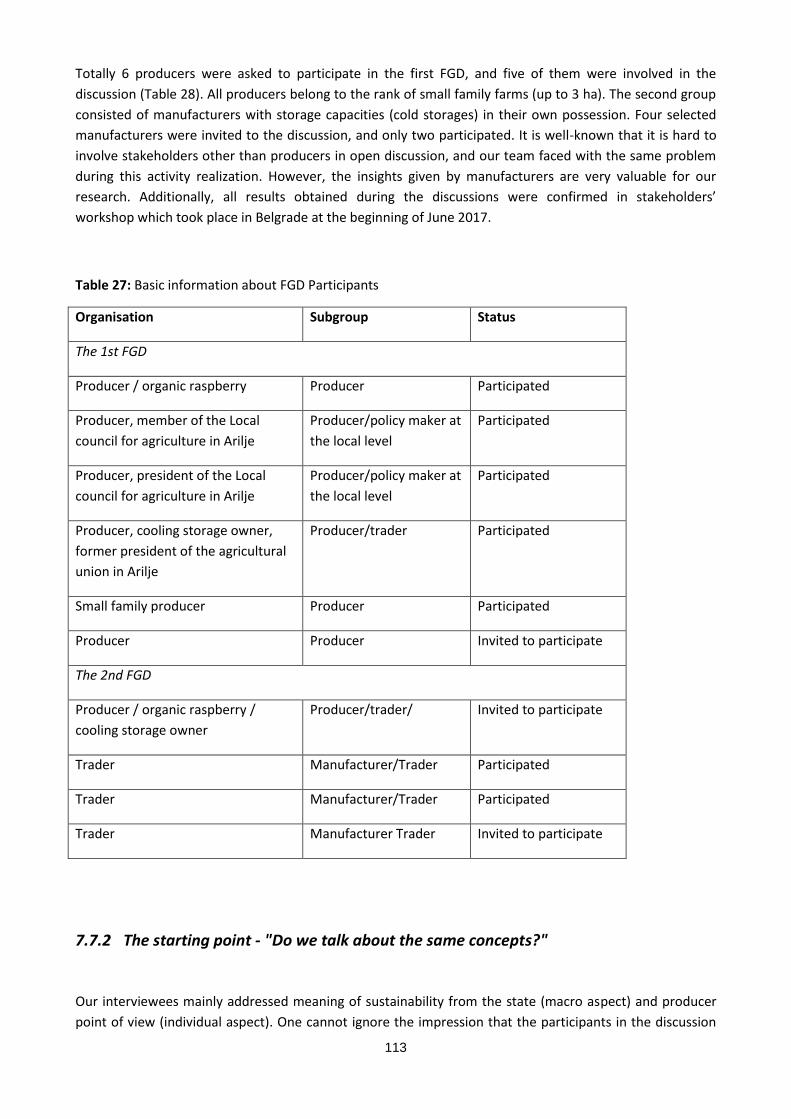
113
Totally 6 producers were asked to participate in the first FGD, and five of them were involved in the
discussion (Table 28). All producers belong to the rank of small family farms (up to 3 ha). The second group
consisted of manufacturers with storage capacities (cold storages) in their own possession. Four selected
manufacturers were invited to the discussion, and only two participated. It is well-known that it is hard to
involve stakeholders other than producers in open discussion, and our team faced with the same problem
during this activity realization. However, the insights given by manufacturers are very valuable for our
research. Additionally, all results obtained during the discussions were confirmed in stakeholders’
workshop which took place in Belgrade at the beginning of June 2017.
Table 27: Basic information about FGD Participants
Organisation Subgroup Status
The 1st FGD
Producer / organic raspberry Producer Participated
Producer, member of the Local
council for agriculture in Arilje
Producer/policy maker at
the local level
Participated
Producer, president of the Local
council for agriculture in Arilje
Producer/policy maker at
the local level
Participated
Producer, cooling storage owner,
former president of the agricultural
union in Arilje
Producer/trader Participated
Small family producer Producer Participated
Producer Producer Invited to participate
The 2nd FGD
Producer / organic raspberry /
cooling storage owner
Producer/trader/ Invited to participate
Trader Manufacturer/Trader Participated
Trader Manufacturer/Trader Participated
Trader Manufacturer Trader Invited to participate
7.7.2 The starting point - "Do we talk about the same concepts?"
Our interviewees mainly addressed meaning of sustainability from the state (macro aspect) and producer
point of view (individual aspect). One cannot ignore the impression that the participants in the discussion
114
were faced with blindness of the long-lasting approach applied in the period of socialism (before the year
2000). State was responsible for everything, ministry was asked to define strategy and what was
sustainable - to define the best concepts for the sector survival both in the terms of internal conditions (the
role of agriculture in the development) and international competition (role of agriculture in foreign trade).
A statement: "But we need to get some guidelines, someone must be standing behind it, so if the state
stands behind it's like the development plan. Let somebody do an economic study and say in which direction
we should go." (Manufacturer/Trader)
At the same time, this can be a clear indication of the lack of coordination. In the Serbian Agriculture
Strategy drafted in 2004 (the first strategy that was not defined in the context of the socialist plan - what,
how much and for whom to produce) it is clearly stated that producers are responsible for their decisions
and no one will make decisions in their name any more. This obviously turned to the opposite. Despite
numerous attempts to establish an agricultural market information system, to exploit research related to
the development of market conditions and make it publicly available to producers, producers are still left
on their own, unwilling to compete in the new circumstances governed by "the invisible market hand".
Some of the participants recognized importance of the coordination between local/regional and national
level, but all off them generally put too much attention to the role of principal decision maker - minister (it
is expected more than it is written in the description of his job). Due to the sector importance for the
overall economy, the impact of the lobby groups is very strong.
The statements:
"We are very interested in this topic, we started the establishment of a Working Group and we had a
meeting 10 days ago with the Minister." (Producer/trader)
"It is important to create a good Working Group that will address these problems. It should start from
producers; it should include all stakeholders’ representatives in the chain. We cannot discuss even without
cold storages companies or exporters." (Producer)
"The Minister came from local level (municipality), he knows what is going on." (Producer/policy maker at
the local level)
When it comes to individual perspective, sustainability is simply interpreted as family farm business or
trade company economic goal (including recognition of other stakeholders’ involvement). However, having
in mind very long tradition in raspberry production in the region, it also includes different perspectives of
environmental sustainability.
The Statements:
"Sustainability means sustainable for all stakeholders in the chain, from farmers to cold storages and
exporters. For me it means that I can have profit." (Manufacturer/Trader)
"Small producers only look to earn salaries for their family." (Producer)
"Organic producers still suffer due to lack of planting material, lack of widespread organic inputs and non-
adjusted regulation. If you want to make income, you have to start with good planting material and inputs."
(Producer)
Finally, there are some common misunderstandings related to meaning of sustainability. Some of the
interpretations are to narrow, basically driven from the project management point of view.
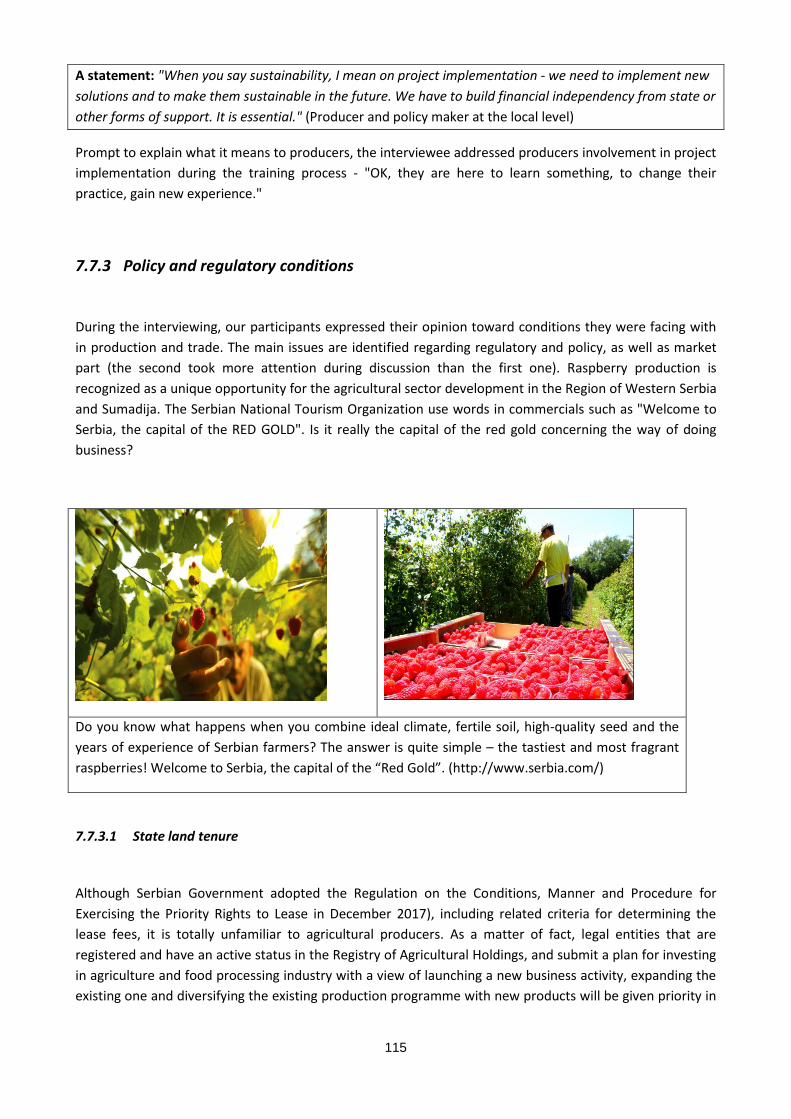
115
A statement: "When you say sustainability, I mean on project implementation - we need to implement new
solutions and to make them sustainable in the future. We have to build financial independency from state or
other forms of support. It is essential." (Producer and policy maker at the local level)
Prompt to explain what it means to producers, the interviewee addressed producers involvement in project
implementation during the training process - "OK, they are here to learn something, to change their
practice, gain new experience."
7.7.3 Policy and regulatory conditions
During the interviewing, our participants expressed their opinion toward conditions they were facing with
in production and trade. The main issues are identified regarding regulatory and policy, as well as market
part (the second took more attention during discussion than the first one). Raspberry production is
recognized as a unique opportunity for the agricultural sector development in the Region of Western Serbia
and Sumadija. The Serbian National Tourism Organization use words in commercials such as "Welcome to
Serbia, the capital of the RED GOLD". Is it really the capital of the red gold concerning the way of doing
business?
Do you know what happens when you combine ideal climate, fertile soil, high-quality seed and the
years of experience of Serbian farmers? The answer is quite simple – the tastiest and most fragrant
raspberries! Welcome to Serbia, the capital of the “Red Gold”. (http://www.serbia.com/)
7.7.3.1 State land tenure
Although Serbian Government adopted the Regulation on the Conditions, Manner and Procedure for
Exercising the Priority Rights to Lease in December 2017), including related criteria for determining the
lease fees, it is totally unfamiliar to agricultural producers. As a matter of fact, legal entities that are
registered and have an active status in the Registry of Agricultural Holdings, and submit a plan for investing
in agriculture and food processing industry with a view of launching a new business activity, expanding the
existing one and diversifying the existing production programme with new products will be given priority in
116
leasing state-owned land to the period of 30 years. The general criteria for assessing the quality of
investment plans are the following:
the investment money will have to be spent on acquiring new fixed assets, and this is not limited only to crop growing;
the investment should be at least 3,000 EUR per hectare of land, out of which at least 500 EUR per hectare should be invested in processing capacities;
the total investment, over the three year period starting with the day when the investment has been made, should be at least 500,000 EUR;
in the first year, at least 30% of the amount should be invested with the exception of the investments in those municipalities that dispose of less than 1,000 hectares of agricultural land, and in which the total investment amount could be less than 500,000 EUR.
The Law on Agricultural Land also states that only up to 30% of the state-owned agricultural land in a
particular municipality can be leased in this way. Family farm isn't usually registered as a legal entity.
Therefore, family farm is not eligible for such arrangements. Instead, they are still kept in a short leasing
position, which is not favourable in general.
The statements:
"There are 800 hectares of state agricultural land in Arilje. It is leased for one year, but what can be done
during the one year when the raspberry production is concerned. There are people who would land if a long-
term lease exists (if the land would be landed for 20-30 years)." (Producer)
"I am a member of the Land Commission at the local level and I am very dissatisfied with the meetings.
Each year, the same story, there is no progress. We prayed that someone excluded our area because of its
specificity. This is a land that cannot be given for just one year." (Producer and policy maker at the local
level)
7.7.3.2 Environmental sustainability and regulations
There was a huge discourse related to planting materials (nursery stock/canes), environmental
sustainability and trading. The problem is essentially connected with necessity to shift sales from frozen to
fresh raspberries. Based on different experts opinion import and planting of new varieties, particularly
those varieties most appropriate for the fresh markets in Europe and North America, is a key element of
the strategy for the sector.
The introduction – The experts’ suggestions and practice
"2008 - Companies on the Trade Mission imported nearly 100,000 raspberry seedlings, and these seedlings
were used to plant 10 hectares of new fields of berries for the fresh market. Half of these new plantings
are the “Polka” cultivar, which is considered to be the best raspberry variety for the fresh fruit market, and
which was imported into Serbia for the first time." (USAID Agribusiness Project)
“Most raspberry plantings in our country were unfortunately set up by nursery stock (canes) from existing
plantings. This is one of the most important reasons for low yields, bad quality of fruit and short duration of
117
many plantings. Although it is forbidden pursuant to the Law on Seeds and Planting Material, this practice
still continues.”
(Source: The state and prospects of raspberry production in Serbia. Available from:
https://www.researchgate.net/publication/284707670_The_state_and_prospects_of_raspberry_productio
n_in_Serbia) [accessed Aug 10 2017].
Plant material is infected with a fungus Phytophthora fragariae var.rubi. According to our respondents, the
disputed planting material is imported into Serbia through the action of renewing stem plantations
supported by the Ministry of Agriculture, Forestry and Water management of Republic of Serbia. This
action was suggested by the experts, scientists in the field of research (see box above as the illustration).
Unfortunately, the poor standards in import procedures were implemented, and resulted in huge problems
that raspberry producers have faced within the practice.
With increased soil moisture or high groundwater levels, along with the presence of infected plants, we can
expect a more massive occurrence of fungus disease. It is important to know that this fungus is
permanently found in the soil, but for its activation is necessary to create the appropriate conditions such
as a large amount of water in the soil, i.e. fields where water is poorly migrated (pseudogley and similar
poorly permeable soils). Most of the areas where raspberry plantations are grown are in the hilly surface
with good natural environment including the quality of soil. It is particularly important for region of Arilje. It
can be concluded that we still miss common scientific approach to advisory service that should help
agricultural producers to overcome different barriers.
The statements:
About the problem:
“We are struggling a lot. We do not have adequate seedlings. And that's first and foremost. We could make
a yield of 10kg per 100m² or 20t per hectare. But we cannot do this when we got infected planting
material.” (Producer)
“We tried to raise public awareness. In 1998, infected planting material from France, native plant, was
introduced. Over a million infected seedlings were spread throughout Serbia. Also, samples of plant material
from Valjevo and Arilje region were taken, sent to Scotland in a laboratory where the presence of fungus on
planting materials was confirmed. Nothing has been done in this matter for 14 years… Raspberry growers
still buy it all over Serbia, receive state support in the form of subsidies for so-called high-quality planting
materials, but it is also infected.” (Producer/policy maker at the local level)
"And the chemical inputs are problem. Lot of people in Serbia live from income earned on raspberries.
Something is happening (or we can blame climate change in general). But something's happening. There
were no diseases we have now." (Manufacturer/Trader)
What are the consequences?
“We are destroying our production. Serbia had 100,000t raspberry production at 11,000 ha in 2002. Now,
with 20,000ha, we have 70,000t. We have a smaller yield, on a larger surface, the raspberries are simply
dried.”(Producer/Trader)
118
What might be other reasons? Climate changes – high humidity or drought:
“The fungus works in high humidity conditions. Last year many roots dried up. A problem has appeared
recently. When it is a dry season, the raspberry plantations can survive.” (Producer)
What can we do?
"The raspberry production is a science. Somebody should take care about the scientific research, we
(agricultural producers) should work based on the experts suggestions and advices." (Producer)
If we analyse sustainability in the context of chemicals use at the farm level, our producers advocate for
strict control of chemical strategy implementation in production and stress a huge, uncontrolled activity of
so-called agro-input lobby. They are faced with various chemicals providers. Producers have the ultimate
goals - to preserve productivity growth, lower costs and higher income. They are also aware of the chemical
approach limitations and traditionally oriented toward strict low use of inputs.
The statements:
"We have an important problem with commercial, agro technical lobbies. Their goal is to sell as many inputs
as possible (pesticides, herbicides, fertilizers). They come with their experts and lobby for a certain input.
They advocate for 12, even 16 times treatments per year. I spray only 4 times." (Producer)
"We will probably face with problem at the European market. The impact of agro technical lobby must be
suppressed. The scientific and professional services providers (experts, advisers) can go on the ground and
give advice, not traders." (Producer/policy maker at the local level)
"Unfortunately, all traders, processors and cold storages have included agricultural pharmacies in the
business, so they will agitate for the chemicals any way." (Producer)
"In the case of chemicals, it is incomprehensible: if you need to get the medicals you need a prescription
from a doctor, and in order to buy any agricultural input (poison), you can do it without any instructions and
as much as you want." (Trader)
"This year, the person is acting on the behalf of one firm, and what offers is the best. The following year, he
represents another company and instantly changes the story - something else is best - you should forget the
last year story." (Manufacturer/Trader)
"More spraying - more problems with various diseases." (Producer / policy maker at the local level).
Our interviewees also put attention on importance of the existence of laboratories for testing the presence
of heavy metals and pesticides in fruits. Purchase of all necessary equipment was covered by international
funds/projects, but these laboratories are still not in the use. They also suffer from existence of non-
efficient and old fashion state advisory service.
119
7.7.3.3 Agricultural policy
The policy measures governed at the national (and local) level have significant impact on farm income in
the fruit sector in Serbia in general. It is expected that the participants positively evaluate the efforts of the
decision-makers to help raspberry producers to develop their own businesses. The participants mainly
commented on the investment support and the changes related to establishment of transparent
procedures for funds allocation from the agricultural budget. Although simplified, these procedures are
more adjusted to younger farmers (older farmers are still facing problems with application).
The Statements:
"I am delighted that this year producers will be able to make a 50% return on the purchased machinery,
which is very positive. If you introduce an irrigation system, you will get receipt immediately."
(Manufacturer/Trader)
"It's important that everything goes for purpose. During The Green Plan implementation (farm support
during 1970s in former Yugoslavia) people made a house instead of a stable, bought a car instead of an
agricultural machine, now - it's impossible." (Producer/policy maker at the local level)
"Young people are much better at work. They know everything" (Producer).
There is a positive trend in development of young farmers’ activity in the Arilje region. During the last 5-6
years more people started with the agricultural (raspberry) business. It is evident that younger families are
going back to rural areas and do farming. For very long time, farmers in their 50s dominated in the
structure of agricultural population. Younger farmers are more oriented toward farm expansion, they buy
land and plant new plantations. The price of land varies from 100 to 500 euro/a. They invest in their own
business.
A statement: "Here's my case. When my son graduated from college we established our own business - cold
storage. I didn't even take any additional money from the state. He didn't "wait the state for a job" (relay on
opportunity to be employed by other private or state entity), he started his own business (created self-
employment)." (Manufacturer/Trader)
Participants at the local level announce that the Working Group will have the task to access the effects of
applied agricultural measures in order to maximize benefits for producers and all stakeholders in the
raspberry food chain. Such an initiative would force establishment of budgetary spending mechanism in the
agricultural sector of Serbia based on measurement of budget spending effects in the sector development
(there is no systematic control of effects in budgetary spending in agriculture - do we force development of
modern agriculture, productive farming, younger farmers, what is happening at the sectors level...).
Particular attention was paid to the insurance scheme. High exposure to unforeseen weather conditions
caused the widespread need for insurance in the sector. However, insurance premiums are usually paid by
larger producers individually, while small producers make agricultural insurance through trade companies
(cold storages). According to our respondents, the insurance companies act inconsistently. The government
120
supports agricultural insurance with subsidised premiums, while the municipality takes care about
systematic protection from hails.
The statements:
The way how insurance works
"Insurance Company provided the most of insurance in 2015 ... the greatest damage was paid, but in the
following years they gave not so favourable conditions. And they should have given more premium to
attract more farmers." (Producer)
"Each cold storage has at least 100 producers in their portfolio. For insurance companies it easier to arrange
specific agreements with cold storages, giving 10% of premium to convince producers to buy insurance."
(Manufacturer/Trader)
The parallel activities (role of the municipality)
"Our municipality recognized problem of hails, we got 100 missiles, and we launched all the stations and
stimulated our shooters because they were very poorly paid by the state - only 4.000 RSD. We stimulate
them with the additional 8.000 RSD per month. And that gave the effect. Only negligible damage was
recorded in Arilje, while everything was destroyed in Kosjeric and Bajina Basta, Pozega and Guca (the
neighbouring municipalities)." (Producer/policy maker at the local level)
The way how innovations are disseminated is quite unusual. Farmers lost the trust in agricultural advisers
who act as "input traders". They even started to experiment on a small size of their land property. They buy
new varieties of raspberries (for example polka and polana), and rise new experimental plantations under
green houses, apply different technologies, evident differences in the yields and quality of products. They
do it completely independently from scientific research institutions. The clear links between technological
research and the needs of the sector are missing. In the interview they noted that the last PhD dissertation
defended at some of the faculties of agriculture in the country related to technology of raspberry
production dates back before 2000.
7.7.4 Market conditions
7.7.4.1 Price
Farmers are very concerned about the raspberry price at the domestic market. The price is unpredictable,
and a special problem arises when the harvest comes. Due to the lack of stable institutional arrangements
in the food chain, agricultural producers are faced with numerous problems - they simply depend on price
determinate by cold storages (traders). The interviewed producer gave following evidence: “The biggest
problem, year after year, is an enormous oscillation of price. The differences go up to 100% (for example,
from 100 RSD to 200 RSD per kg of raspberries).” (Producer)
Better price can be obtained for organic raspberry (3.95 euro/kg compared to 1.66 euro/kg for
conventional production). Producers in the region (in Bosnia and Herzegovina and Kosovo) are starting with
raspberry business. This is what our producer from the first focus group said about this issue: "Our
121
neighbours from Bosnia and Herzegovina worked during season at our farms as seasonal workers. Now
they have their own seedlings, good quality planting material, they have a good opportunity to start
successful business. Their land is "cleaner". I visited several farms. Through the process of cross-border
cooperation, we are in a position to learn now from them which one couldn’t imagine earlier." The yields
are still far away from yields in Serbia, and quality of raspberry produced is at lower level. This situation
didn't prevent Serbian traders from importing certain quantities from the region. The Serbian market is
currently in the stage of hyper production. This year all storage capacities are fully loaded - what will
happen if they face with barriers in selling current stock at the foreign markets?
The reminder- Story from BLIC daily magazine, 02/16/2017 Title: In the last few months, Serbia has been recording a constant decline in export of raspberry compared to previous years, while cold storage units in Western Serbia have huge quantities of frozen raspberry on stock. The interest shown for Serbian raspberry abroad has been at its lowest in the last ten years – the exporters claim. They also say that the purchase price of frozen raspberry is lower than the one of the fresh which was in the region of around 230 RSD per kg. Last year, this fruit was sold for upwards of 320 RSD per kg. The exporters say that the reason for that is the fact that Poland had a record-breaking year in 2016 when it comes to raspberry yield. Also, the drop in export sales is due to the fact that Serbian exporters mixed the raspberry of lower quality with the top quality sorts like Vilamet and Miker which make over 90% of the overall raspberry production in Serbia. Buyers abroad were unhappy with this decision and some of them even returned entire contingents back. The agricultural experts claim that the bad situation with the export of this fruit will be resolved soon, adding that the exporters should not mix the two qualities together and be purely driven by profit. In 2015, Serbia was at the very top in the world when it comes to raspberry export with 105,000 tons. In 2014, the country generated 248 million EUR from exporting this fruit. The advantage that our country has is that the two prevalent sorts in Serbia – Vilamet and Miker – are extremely tasty and that almost no country in the world can compete with that. Furthermore, Serbia is well-known all over the world for these two sorts so the winning formula should not be changed.
Source:
http://www.blic.rs/vesti/ekonomija/kako-su-domaci-izvoznici-unistili-rod-maline-i-sada-ne-mogu-da-je-
prodaju/438gb02
Raspberry producers don't have contract price for their product. Furthermore, they are forced to buy
inputs for own production using unusual forward agreements - the price of inputs is set and they make
forward agreements without any information about the future price of commodity in which they are going
to make final payment. It shed light on related issues: the sector structure - raspberry price - the
institutional arrangements.
The statements:
"We have a sort of "blind agreement" - there is no statement about raspberry price, but it has the price of
all inputs we take from them. And everything is in euro. Traders they do not know what raspberry prices
will be at the moment of realization. There is a lot of raspberry import from Bosnia, Kosovo, Albania and
Macedonia, and all commodities is sold as "Serbian". The imported is at far lower quality. The cold storages
had signed contracts with customers from abroad, but they didn't have quantities due to drought, so they
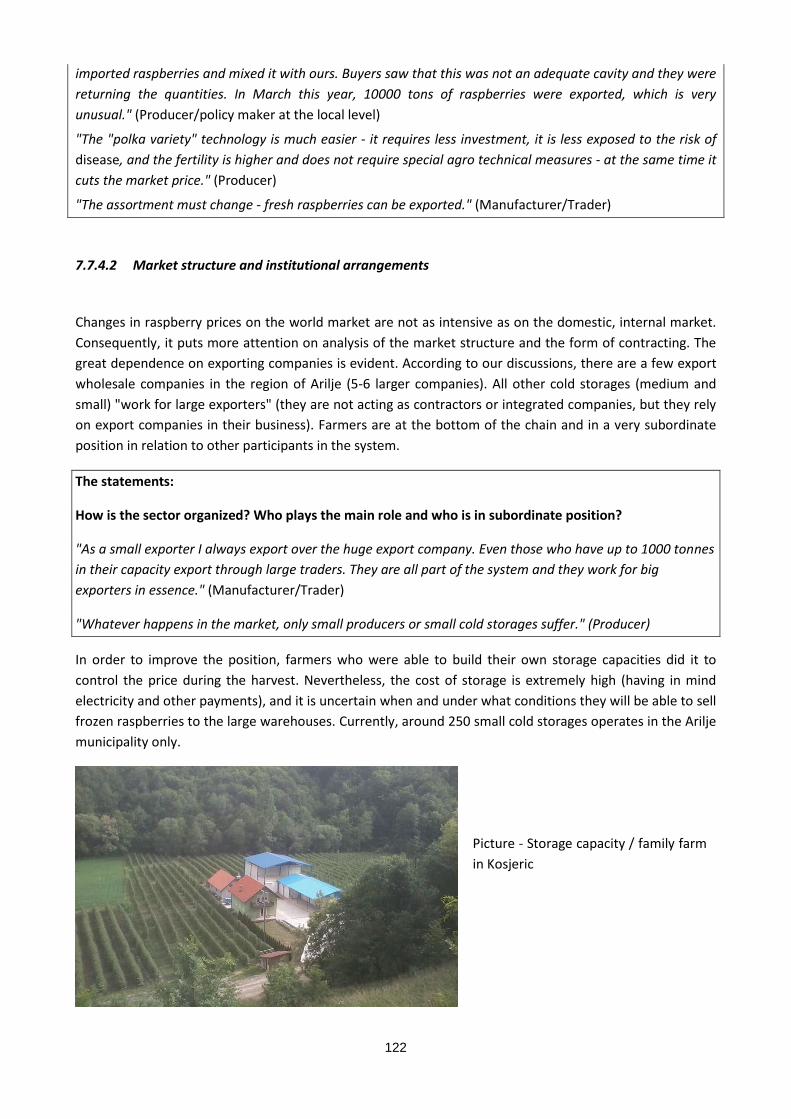
122
imported raspberries and mixed it with ours. Buyers saw that this was not an adequate cavity and they were
returning the quantities. In March this year, 10000 tons of raspberries were exported, which is very
unusual." (Producer/policy maker at the local level)
"The "polka variety" technology is much easier - it requires less investment, it is less exposed to the risk of
disease, and the fertility is higher and does not require special agro technical measures - at the same time it
cuts the market price." (Producer)
"The assortment must change - fresh raspberries can be exported." (Manufacturer/Trader)
7.7.4.2 Market structure and institutional arrangements
Changes in raspberry prices on the world market are not as intensive as on the domestic, internal market.
Consequently, it puts more attention on analysis of the market structure and the form of contracting. The
great dependence on exporting companies is evident. According to our discussions, there are a few export
wholesale companies in the region of Arilje (5-6 larger companies). All other cold storages (medium and
small) "work for large exporters" (they are not acting as contractors or integrated companies, but they rely
on export companies in their business). Farmers are at the bottom of the chain and in a very subordinate
position in relation to other participants in the system.
The statements:
How is the sector organized? Who plays the main role and who is in subordinate position?
"As a small exporter I always export over the huge export company. Even those who have up to 1000 tonnes
in their capacity export through large traders. They are all part of the system and they work for big
exporters in essence." (Manufacturer/Trader)
"Whatever happens in the market, only small producers or small cold storages suffer." (Producer)
In order to improve the position, farmers who were able to build their own storage capacities did it to
control the price during the harvest. Nevertheless, the cost of storage is extremely high (having in mind
electricity and other payments), and it is uncertain when and under what conditions they will be able to sell
frozen raspberries to the large warehouses. Currently, around 250 small cold storages operates in the Arilje
municipality only.
Picture - Storage capacity / family farm
in Kosjeric
123
Having in mind the market structure, strict compliance with the Competition protection law is necessary. At
the same time, it is obvious that there are no instruments for which production will be negotiated in
advance, for the known buyer and the pre-defined price. The current situation is unfavourable regarding
position of farmers and it is certainly unsustainable in the long run.
The statements:
"The state should take care about prevention from monopoly on the market, it must create an adequate
environment. Let me say - the cake must be fairly divided." (Manufacturer/Trader)
"Raspberry producer signs a contract with cold storage. Producer takes a lot of obligations, but trader
doesn’t have any obligation to producer. This contract is not fair, this contract is a fraud. The contract
obliges you to give a certain amount of raspberries (kg/a in 1st class), in turn you can take chemicals,
fertilizers, bind to the existence of certain hygienic measures, the workers can be educated how to harvest
raspberries, but there is no evidence of the final price." (Producer)
"You should know the price below which you cannot go. Also, if the price is 2 euro / kg, 60% should belong
to the producer, and 40% to the dealer / processor." (Producer/policy maker at the local level)
7.7.4.3 Financing
Farmers in Serbia are very cautious. If they borrow, they belong to the best clients in terms of loan
repayment. Family farmers usually use their own resources combined with subsidies to develop or
technologically improve their production.
The first formal model of a short-and long-term lending program for agriculture was established in
2004 by the Ministry of Agriculture. The system allowed more favourable conditions than credits available
from banks. The loans can be given to eligible producers - they have to be registered in the Register of
Agricultural Holdings governed by the Ministry of Finance. The loans were exclusively provided to the
natural persons. The interest rate of short-term loans was 5% with a repayment period of 12 months. Long-
term loans were disbursed by commercial banks. Loans were given for specific purposes: building and
purchasing of irrigation systems and equipment, purchasing of agricultural machinery, establishing
plantations, establishing greenhouses, as well as investing in livestock production. Under this system, banks
contributed 10-30% of the capital, and the Ministry of Agriculture provided 70-90% of the capital (USAID
BEP, 2013). In 2010 a new model of credit support by the Ministry of Agriculture was introduced - interest-
rate subsides are provided in order to encourage banks to lend to the sector. The Ministry of
Agriculture facilitates very low interest rates to individuals, agricultural households and SMEs via a
number of partner commercial banks. This model has been implemented since 2010.
A statement: "It's not all about subsidies. We need a healthy system that young agricultural producers can
get affordable loans that these young people, who have remained on the property of their forefathers,
remain on them to work and prosper, not to go to urban areas. Maybe someone from the city, seeing how
beautiful life in the village is, may wish to return to new, modern village in the future. (Expert)
124
Smaller producers, as a rule, have limited access to these resources. Very often they are in less
unfavourable position because they purchase all inputs through the "blind agreements”, which have
already been discussed. It recalls to some earlier systems of exchange with parities that were defined
against the primary producers.
7.7.5 Strategies mentioned by interviewees
What can be derived from our interviews - how our stakeholders see their position and strategies? The
main focus is on overall importance of the sector for the Serbian agriculture and economy. However, they
are aware of the fact that the food chain, even overwhelmed with numerous problems, gives as much as
possible support to the local community development. During the transition, many factories were closed
down, unemployment increased and overall economic situation was very bad. The only opportunity to
ensure fair living standards for a family was to use local knowledge and tradition, evidently present in the
cultivation of raspberry. The system still doesn't work properly, it is faced with numerous barriers, but
there are also opportunities and solutions for better response to the contemporary challenges. Our
respondents pointed out the following options:
1. The new production alternatives such as
technology improvements and new varieties,
labelling using quality food schemes,
development of fruit processing.
2. Cooperation between the food chain stakeholders
less formal forms (trainings, education, coordination etc.),
formal cooperation within cooperatives/producers groups,
cooperation between small cold storages.
The main focus
"Listen, all Serbia is under raspberry production. I have worked for projects, agricultural producers in the
south of Serbia and Vojvodina started to do "our" business." (Producer/policy maker at the local level)
"Based on their export importance, raspberries are the forth product in Serbia. But we did absolutely
nothing to double or multiply our income. It is sold as bulk commodity. We didn't make our brand or
commodity mark..." (Producer)
7.7.5.1 Production alternatives
Technology improvements
The conducted research shows the need to change to the new types of raspberries that are sold as fresh
produce. The current varieties (Vilamet and Miker) are sold in the form of frozen product. Price of the
125
frozen products is less than for the good quality fresh produce. Simultaneously, it requires a new form of
food chain organization starting from the producers, through development of systems for packaging
specifically designed to cover all requirements in fresh produce transport and storage, to completely new
marketing logistics (transport and retail).
Quality schemes
Recognition of the originality of products has become increasingly important in recent years. It is important
in terms of diversity, recognition of traditions, as well as in terms of prevention of counterfeiting
(misleading). Protecting autochthonous products for each country means, at the same time, the
contribution to the protection of a particular area and encouraging rural people to produce high quality
products in accordance with international food safety standards. The quality of food products is also a
strategic requirement in the context of international integration. As far as raspberry is concerned, our
interviewees put attention on labels such as Made in Serbia, PDO and Organic.
The label Made in Serbia is important due to the fact that other producers from the region already started
to produce raspberry (it wasn't their alternative in the past) and there is a need to capitalize on tradition
and to mark strategic product that is recognized at the international level. On the other hand, producers
should also think about the regional capacity to cover world demand for this specific product. It is also
evident that the frozen raspberries are sold in packages that are defined by the end customer without any
sign of geographical origin.
In Serbia up to now 24 agricultural food products have been protected by a geographical indication, of
which 12 are promoted through printed and web material: eight are registered names of origin and Ariljska
malina belongs to this group. In raspberry production, Serbia has a PDO standard - a product name
identified as a geographical indication, closely linked to a specific production area. Additionally, the
importance of organic raspberry production is constantly growing. This alternative is supported by different
pubic programmes and growing market demand. Our interviewees emphasized that foreign companies ask
for share of organic products in total quantity set by agreement. Even more, they ask for supply of mix of
berry fruits (large buyers are looking for raspberries, blackberry, cherry, and blueberries).
A statement: "We have good conditions for the production of organic raspberries. Every year there is a
congestion of raspberry exports, as it happens that cold storages have a surplus of goods, and therefore the
price goes down. Producers suffer from all the burdens, and we want to avoid this." (Producer)
Fruit processing
The other alternative in adding value is connected with fruit processing. The current situation can be
described as follow: (1) small amount of raspberries is consumed directly and traded as fresh commodities
both at domestic and foreign markets; (2) although it can be processed into a multitude of food products -
preserved fruits (jams, marmalades and dried) or juices, raspberries are generally sold as frozen fruit (bulk
market). We asked our interviewees to explain were there any other solutions regarding this issue? The
positive response appeared only during the second discussion (with stakeholders who deals with storage
and trading).
The statements
"We thought about building of processing capacity in Arilje devoted to the first stage of processing -
classification of products by quality and retail packaging. Everyone could work for their own cold storages".
(Manufacture/Trader)
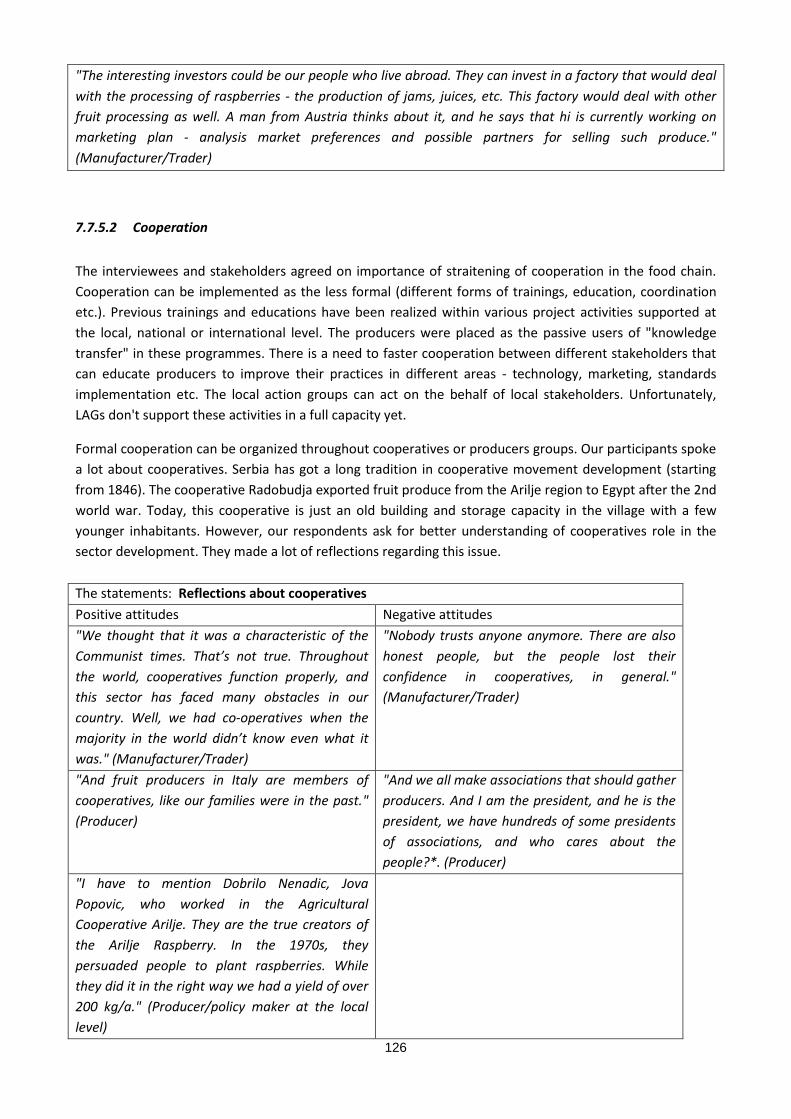
126
"The interesting investors could be our people who live abroad. They can invest in a factory that would deal
with the processing of raspberries - the production of jams, juices, etc. This factory would deal with other
fruit processing as well. A man from Austria thinks about it, and he says that hi is currently working on
marketing plan - analysis market preferences and possible partners for selling such produce."
(Manufacturer/Trader)
7.7.5.2 Cooperation
The interviewees and stakeholders agreed on importance of straitening of cooperation in the food chain.
Cooperation can be implemented as the less formal (different forms of trainings, education, coordination
etc.). Previous trainings and educations have been realized within various project activities supported at
the local, national or international level. The producers were placed as the passive users of "knowledge
transfer" in these programmes. There is a need to faster cooperation between different stakeholders that
can educate producers to improve their practices in different areas - technology, marketing, standards
implementation etc. The local action groups can act on the behalf of local stakeholders. Unfortunately,
LAGs don't support these activities in a full capacity yet.
Formal cooperation can be organized throughout cooperatives or producers groups. Our participants spoke
a lot about cooperatives. Serbia has got a long tradition in cooperative movement development (starting
from 1846). The cooperative Radobudja exported fruit produce from the Arilje region to Egypt after the 2nd
world war. Today, this cooperative is just an old building and storage capacity in the village with a few
younger inhabitants. However, our respondents ask for better understanding of cooperatives role in the
sector development. They made a lot of reflections regarding this issue.
The statements: Reflections about cooperatives
Positive attitudes Negative attitudes
"We thought that it was a characteristic of the
Communist times. That’s not true. Throughout
the world, cooperatives function properly, and
this sector has faced many obstacles in our
country. Well, we had co-operatives when the
majority in the world didn’t know even what it
was." (Manufacturer/Trader)
"Nobody trusts anyone anymore. There are also
honest people, but the people lost their
confidence in cooperatives, in general."
(Manufacturer/Trader)
"And fruit producers in Italy are members of
cooperatives, like our families were in the past."
(Producer)
"And we all make associations that should gather
producers. And I am the president, and he is the
president, we have hundreds of some presidents
of associations, and who cares about the
people?*. (Producer)
"I have to mention Dobrilo Nenadic, Jova
Popovic, who worked in the Agricultural
Cooperative Arilje. They are the true creators of
the Arilje Raspberry. In the 1970s, they
persuaded people to plant raspberries. While
they did it in the right way we had a yield of over
200 kg/a." (Producer/policy maker at the local
level)
127
It is also clear that a large number of small scaling capacities of cold storages belong to the family farms
sector. They can play a vital role in the market if they increase their power. They can do this by joining a
cooperative.
A statement: "As cold storage with small capacity I am not interesting for anybody at the market. And 200
of us are in the same position. What can we do, to close the business? And small cold storages have built a
price for producers. They are those who help and can even more contribute in building of a more rightful
system of created value distribution among food chain stakeholders." (Manufacturer/Trader)
7.7.6 JUST IMAGINE YOUR BUSINESS IN 2027
At the end of conversation we asked our participants to address the vision of their business in the next 10
years prospect. Surprisingly, only one vision appeared.
The statements:
"It's only necessary to copy the calendar from the 1970s or 1980s, as it was then."
(Interviewer: What do you mean?)
"Easy, during that time producers didn’t use chemicals us as they are using today, 2-3 times a year they
implemented chemicals under strict control of engineers, the plant material was not infected, we had a
cooperative in which the engineers were doing the experiments, they never wanted to recommend the
preparation until they checked everything. We had a yield of 30 kg/a by the river, and now the river is
flooding productive area; there was no "nursery" lobby. We could have decent living standard from the
raspberries, we our houses and bought land, no one else in the region dealt with raspberries, and now we
have raspberry producers all over the Serbia and region as well." (Producer)
Or
"If we don't change anything, we will stop dealing with raspberries." (Manufacturer/Trader)
Farmers need to face with all problems and use the existing knowledge and experience they have. With
publicly available complex analyses of the market conditions in the country, region, Europe and the
worldwide (Economic Research Unite, the Ministry of Agriculture), they can improve their business.
Otherwise, the only way out is the abandonment of raspberry production, which in the case of Arilje
raspberry, given the tradition of dealing with this activity, will not happen.
Parallel, it is necessary to move from traditionally oriented to entrepreneurial-oriented farming integrated
within a larger food supply system as a part of national, regional and international flows. This type of
reform requires both macro and micro approach (using bottom-up and top-down approach). The region we
have observed is specific. They have a very long tradition in raspberry production as far as Serbia is
concerned. Local milieu can be combined with exogenous factors which can improve local communities and
regional perspectives in different aspects of sustainability (economic, social and environmental).
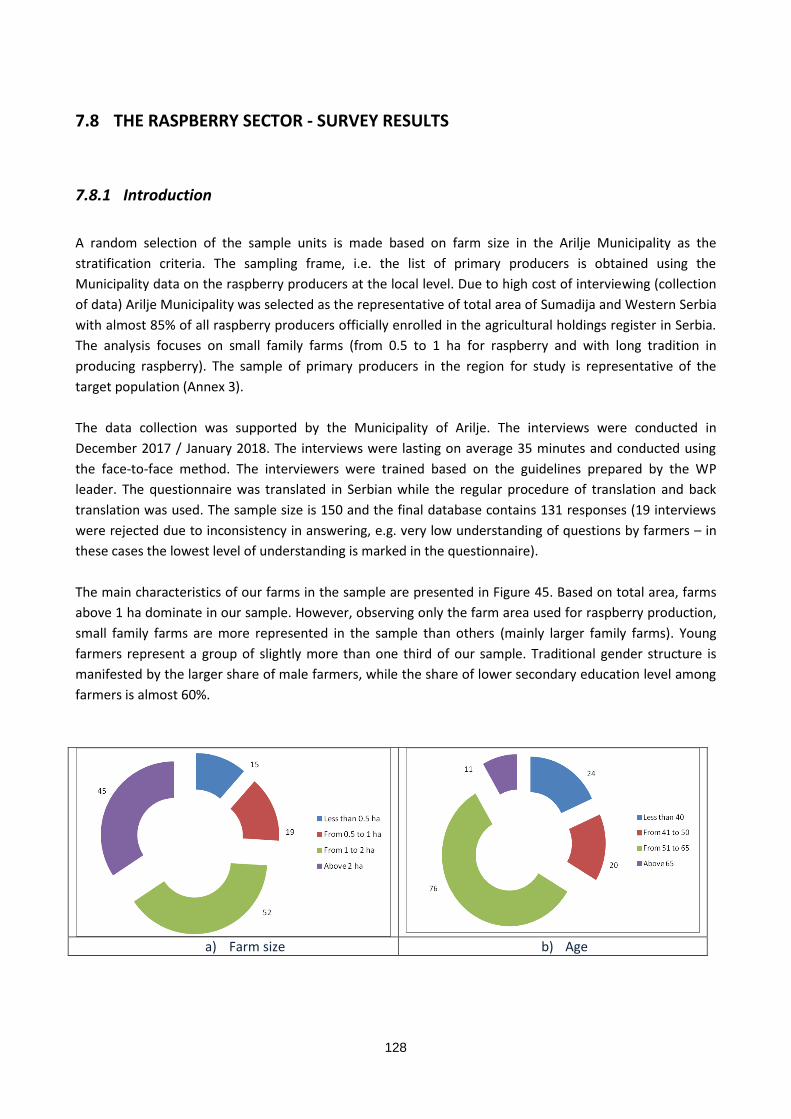
128
7.8 THE RASPBERRY SECTOR - SURVEY RESULTS
7.8.1 Introduction
A random selection of the sample units is made based on farm size in the Arilje Municipality as the
stratification criteria. The sampling frame, i.e. the list of primary producers is obtained using the
Municipality data on the raspberry producers at the local level. Due to high cost of interviewing (collection
of data) Arilje Municipality was selected as the representative of total area of Sumadija and Western Serbia
with almost 85% of all raspberry producers officially enrolled in the agricultural holdings register in Serbia.
The analysis focuses on small family farms (from 0.5 to 1 ha for raspberry and with long tradition in
producing raspberry). The sample of primary producers in the region for study is representative of the
target population (Annex 3).
The data collection was supported by the Municipality of Arilje. The interviews were conducted in
December 2017 / January 2018. The interviews were lasting on average 35 minutes and conducted using
the face-to-face method. The interviewers were trained based on the guidelines prepared by the WP
leader. The questionnaire was translated in Serbian while the regular procedure of translation and back
translation was used. The sample size is 150 and the final database contains 131 responses (19 interviews
were rejected due to inconsistency in answering, e.g. very low understanding of questions by farmers – in
these cases the lowest level of understanding is marked in the questionnaire).
The main characteristics of our farms in the sample are presented in Figure 45. Based on total area, farms
above 1 ha dominate in our sample. However, observing only the farm area used for raspberry production,
small family farms are more represented in the sample than others (mainly larger family farms). Young
farmers represent a group of slightly more than one third of our sample. Traditional gender structure is
manifested by the larger share of male farmers, while the share of lower secondary education level among
farmers is almost 60%.
a) Farm size b) Age
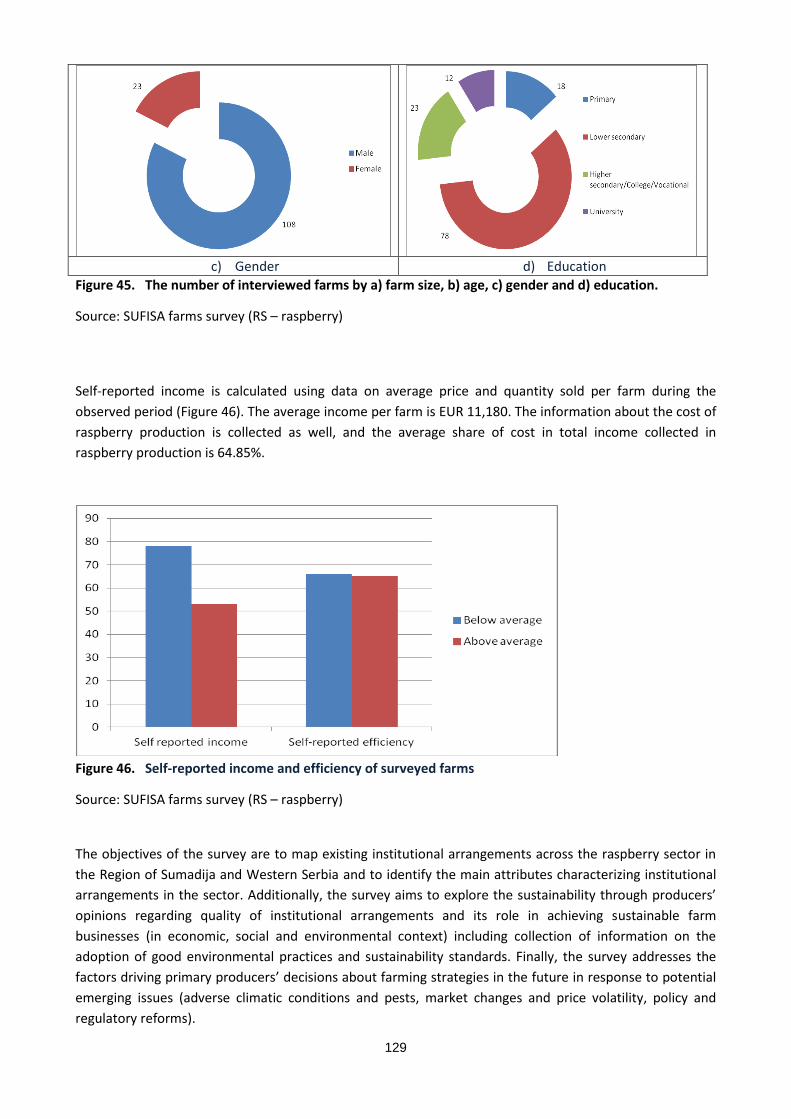
129
c) Gender d) Education
Figure 45. The number of interviewed farms by a) farm size, b) age, c) gender and d) education.
Source: SUFISA farms survey (RS – raspberry)
Self-reported income is calculated using data on average price and quantity sold per farm during the
observed period (Figure 46). The average income per farm is EUR 11,180. The information about the cost of
raspberry production is collected as well, and the average share of cost in total income collected in
raspberry production is 64.85%.
Figure 46. Self-reported income and efficiency of surveyed farms
Source: SUFISA farms survey (RS – raspberry)
The objectives of the survey are to map existing institutional arrangements across the raspberry sector in
the Region of Sumadija and Western Serbia and to identify the main attributes characterizing institutional
arrangements in the sector. Additionally, the survey aims to explore the sustainability through producers’
opinions regarding quality of institutional arrangements and its role in achieving sustainable farm
businesses (in economic, social and environmental context) including collection of information on the
adoption of good environmental practices and sustainability standards. Finally, the survey addresses the
factors driving primary producers’ decisions about farming strategies in the future in response to potential
emerging issues (adverse climatic conditions and pests, market changes and price volatility, policy and
regulatory reforms).
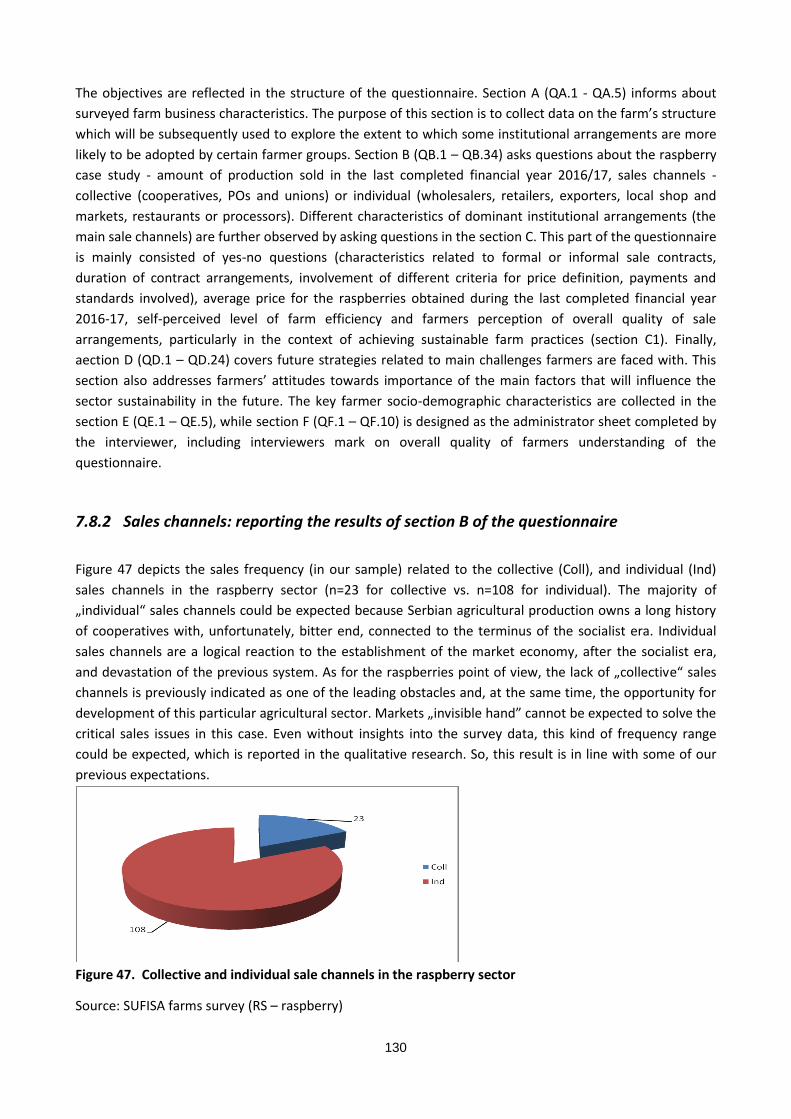
130
The objectives are reflected in the structure of the questionnaire. Section A (QA.1 - QA.5) informs about
surveyed farm business characteristics. The purpose of this section is to collect data on the farm’s structure
which will be subsequently used to explore the extent to which some institutional arrangements are more
likely to be adopted by certain farmer groups. Section B (QB.1 – QB.34) asks questions about the raspberry
case study - amount of production sold in the last completed financial year 2016/17, sales channels -
collective (cooperatives, POs and unions) or individual (wholesalers, retailers, exporters, local shop and
markets, restaurants or processors). Different characteristics of dominant institutional arrangements (the
main sale channels) are further observed by asking questions in the section C. This part of the questionnaire
is mainly consisted of yes-no questions (characteristics related to formal or informal sale contracts,
duration of contract arrangements, involvement of different criteria for price definition, payments and
standards involved), average price for the raspberries obtained during the last completed financial year
2016-17, self-perceived level of farm efficiency and farmers perception of overall quality of sale
arrangements, particularly in the context of achieving sustainable farm practices (section C1). Finally,
aection D (QD.1 – QD.24) covers future strategies related to main challenges farmers are faced with. This
section also addresses farmers’ attitudes towards importance of the main factors that will influence the
sector sustainability in the future. The key farmer socio-demographic characteristics are collected in the
section E (QE.1 – QE.5), while section F (QF.1 – QF.10) is designed as the administrator sheet completed by
the interviewer, including interviewers mark on overall quality of farmers understanding of the
questionnaire.
7.8.2 Sales channels: reporting the results of section B of the questionnaire
Figure 47 depicts the sales frequency (in our sample) related to the collective (Coll), and individual (Ind)
sales channels in the raspberry sector (n=23 for collective vs. n=108 for individual). The majority of
„individual“ sales channels could be expected because Serbian agricultural production owns a long history
of cooperatives with, unfortunately, bitter end, connected to the terminus of the socialist era. Individual
sales channels are a logical reaction to the establishment of the market economy, after the socialist era,
and devastation of the previous system. As for the raspberries point of view, the lack of „collective“ sales
channels is previously indicated as one of the leading obstacles and, at the same time, the opportunity for
development of this particular agricultural sector. Markets „invisible hand” cannot be expected to solve the
critical sales issues in this case. Even without insights into the survey data, this kind of frequency range
could be expected, which is reported in the qualitative research. So, this result is in line with some of our
previous expectations.
Figure 47. Collective and individual sale channels in the raspberry sector
Source: SUFISA farms survey (RS – raspberry)
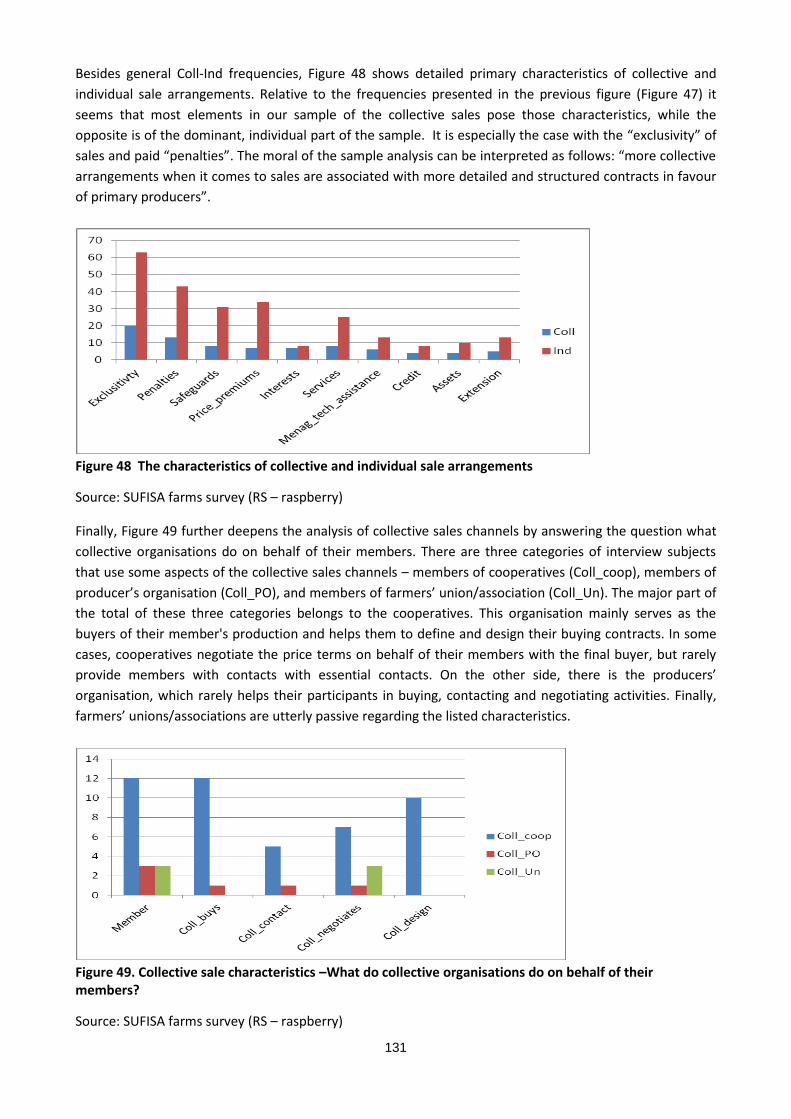
131
Besides general Coll-Ind frequencies, Figure 48 shows detailed primary characteristics of collective and
individual sale arrangements. Relative to the frequencies presented in the previous figure (Figure 47) it
seems that most elements in our sample of the collective sales pose those characteristics, while the
opposite is of the dominant, individual part of the sample. It is especially the case with the “exclusivity” of
sales and paid “penalties”. The moral of the sample analysis can be interpreted as follows: “more collective
arrangements when it comes to sales are associated with more detailed and structured contracts in favour
of primary producers”.
Figure 48 The characteristics of collective and individual sale arrangements
Source: SUFISA farms survey (RS – raspberry)
Finally, Figure 49 further deepens the analysis of collective sales channels by answering the question what
collective organisations do on behalf of their members. There are three categories of interview subjects
that use some aspects of the collective sales channels – members of cooperatives (Coll_coop), members of
producer’s organisation (Coll_PO), and members of farmers’ union/association (Coll_Un). The major part of
the total of these three categories belongs to the cooperatives. This organisation mainly serves as the
buyers of their member's production and helps them to define and design their buying contracts. In some
cases, cooperatives negotiate the price terms on behalf of their members with the final buyer, but rarely
provide members with contacts with essential contacts. On the other side, there is the producers’
organisation, which rarely helps their participants in buying, contacting and negotiating activities. Finally,
farmers’ unions/associations are utterly passive regarding the listed characteristics.
Figure 49. Collective sale characteristics –What do collective organisations do on behalf of their members?
Source: SUFISA farms survey (RS – raspberry)
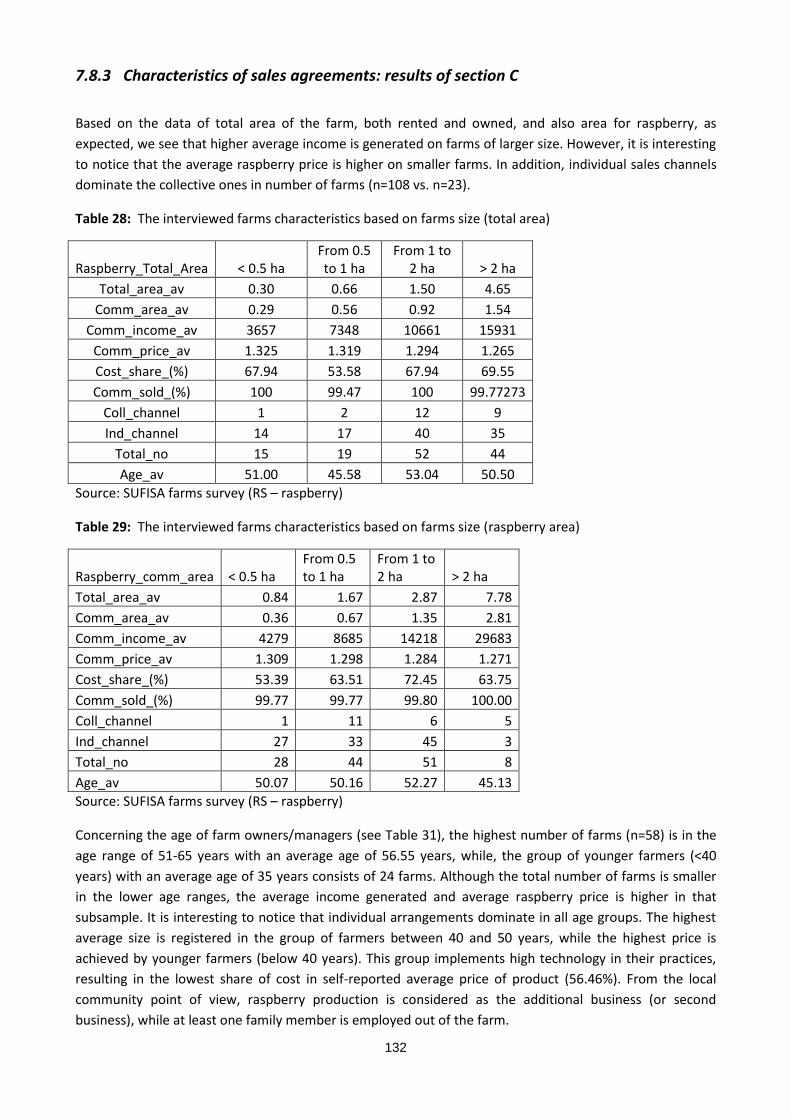
132
7.8.3 Characteristics of sales agreements: results of section C
Based on the data of total area of the farm, both rented and owned, and also area for raspberry, as
expected, we see that higher average income is generated on farms of larger size. However, it is interesting
to notice that the average raspberry price is higher on smaller farms. In addition, individual sales channels
dominate the collective ones in number of farms (n=108 vs. n=23).
Table 28: The interviewed farms characteristics based on farms size (total area)
Raspberry_Total_Area < 0.5 ha From 0.5 to 1 ha
From 1 to 2 ha > 2 ha
Total_area_av 0.30 0.66 1.50 4.65
Comm_area_av 0.29 0.56 0.92 1.54
Comm_income_av 3657 7348 10661 15931
Comm_price_av 1.325 1.319 1.294 1.265
Cost_share_(%) 67.94 53.58 67.94 69.55
Comm_sold_(%) 100 99.47 100 99.77273
Coll_channel 1 2 12 9
Ind_channel 14 17 40 35
Total_no 15 19 52 44
Age_av 51.00 45.58 53.04 50.50
Source: SUFISA farms survey (RS – raspberry)
Table 29: The interviewed farms characteristics based on farms size (raspberry area)
Raspberry_comm_area < 0.5 ha From 0.5 to 1 ha
From 1 to 2 ha > 2 ha
Total_area_av 0.84 1.67 2.87 7.78
Comm_area_av 0.36 0.67 1.35 2.81
Comm_income_av 4279 8685 14218 29683
Comm_price_av 1.309 1.298 1.284 1.271
Cost_share_(%) 53.39 63.51 72.45 63.75
Comm_sold_(%) 99.77 99.77 99.80 100.00
Coll_channel 1 11 6 5
Ind_channel 27 33 45 3
Total_no 28 44 51 8
Age_av 50.07 50.16 52.27 45.13
Source: SUFISA farms survey (RS – raspberry)
Concerning the age of farm owners/managers (see Table 31), the highest number of farms (n=58) is in the
age range of 51-65 years with an average age of 56.55 years, while, the group of younger farmers (<40
years) with an average age of 35 years consists of 24 farms. Although the total number of farms is smaller
in the lower age ranges, the average income generated and average raspberry price is higher in that
subsample. It is interesting to notice that individual arrangements dominate in all age groups. The highest
average size is registered in the group of farmers between 40 and 50 years, while the highest price is
achieved by younger farmers (below 40 years). This group implements high technology in their practices,
resulting in the lowest share of cost in self-reported average price of product (56.46%). From the local
community point of view, raspberry production is considered as the additional business (or second
business), while at least one family member is employed out of the farm.
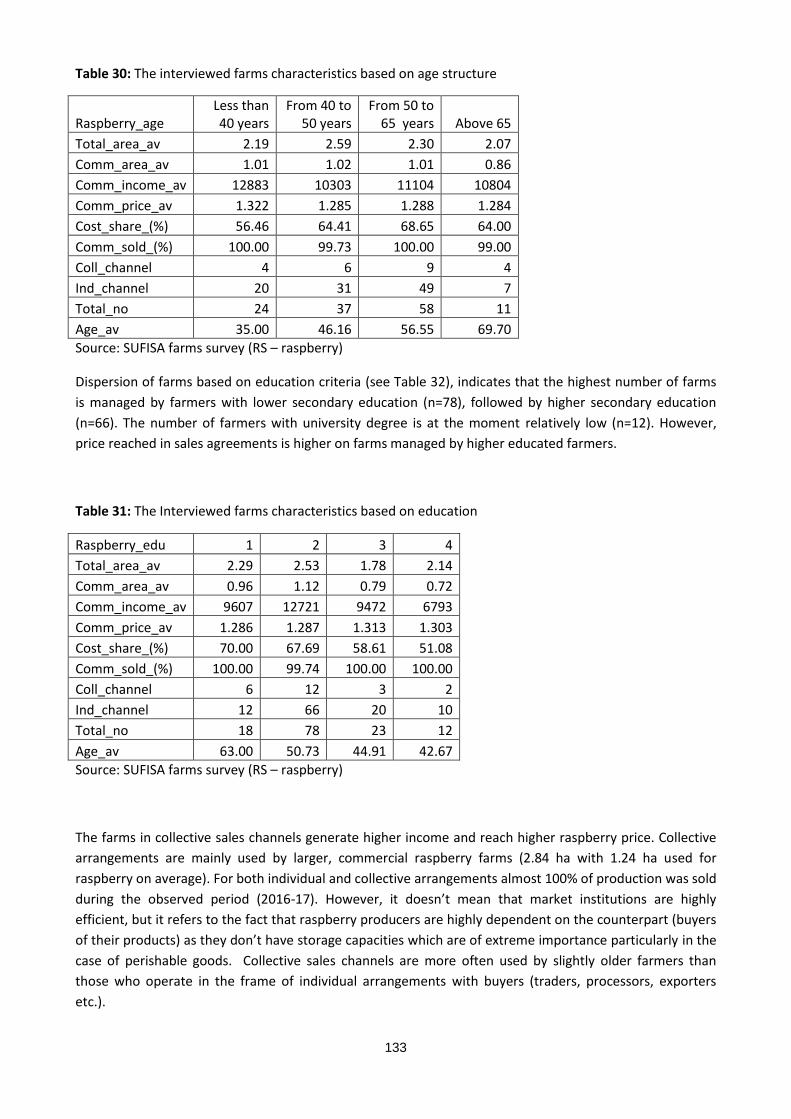
133
Table 30: The interviewed farms characteristics based on age structure
Raspberry_age Less than 40 years
From 40 to 50 years
From 50 to 65 years Above 65
Total_area_av 2.19 2.59 2.30 2.07
Comm_area_av 1.01 1.02 1.01 0.86
Comm_income_av 12883 10303 11104 10804
Comm_price_av 1.322 1.285 1.288 1.284
Cost_share_(%) 56.46 64.41 68.65 64.00
Comm_sold_(%) 100.00 99.73 100.00 99.00
Coll_channel 4 6 9 4
Ind_channel 20 31 49 7
Total_no 24 37 58 11
Age_av 35.00 46.16 56.55 69.70
Source: SUFISA farms survey (RS – raspberry)
Dispersion of farms based on education criteria (see Table 32), indicates that the highest number of farms
is managed by farmers with lower secondary education (n=78), followed by higher secondary education
(n=66). The number of farmers with university degree is at the moment relatively low (n=12). However,
price reached in sales agreements is higher on farms managed by higher educated farmers.
Table 31: The Interviewed farms characteristics based on education
Raspberry_edu 1 2 3 4
Total_area_av 2.29 2.53 1.78 2.14
Comm_area_av 0.96 1.12 0.79 0.72
Comm_income_av 9607 12721 9472 6793
Comm_price_av 1.286 1.287 1.313 1.303
Cost_share_(%) 70.00 67.69 58.61 51.08
Comm_sold_(%) 100.00 99.74 100.00 100.00
Coll_channel 6 12 3 2
Ind_channel 12 66 20 10
Total_no 18 78 23 12
Age_av 63.00 50.73 44.91 42.67
Source: SUFISA farms survey (RS – raspberry)
The farms in collective sales channels generate higher income and reach higher raspberry price. Collective
arrangements are mainly used by larger, commercial raspberry farms (2.84 ha with 1.24 ha used for
raspberry on average). For both individual and collective arrangements almost 100% of production was sold
during the observed period (2016-17). However, it doesn’t mean that market institutions are highly
efficient, but it refers to the fact that raspberry producers are highly dependent on the counterpart (buyers
of their products) as they don’t have storage capacities which are of extreme importance particularly in the
case of perishable goods. Collective sales channels are more often used by slightly older farmers than
those who operate in the frame of individual arrangements with buyers (traders, processors, exporters
etc.).
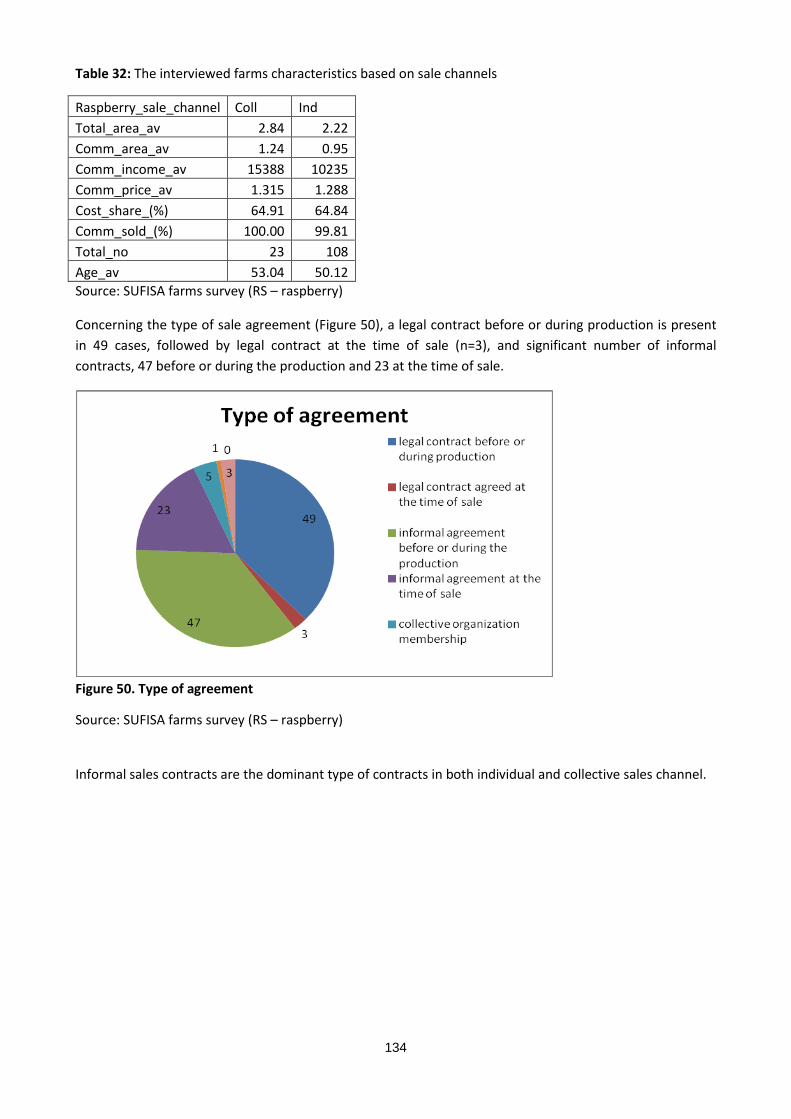
134
Table 32: The interviewed farms characteristics based on sale channels
Raspberry_sale_channel Coll Ind
Total_area_av 2.84 2.22
Comm_area_av 1.24 0.95
Comm_income_av 15388 10235
Comm_price_av 1.315 1.288
Cost_share_(%) 64.91 64.84
Comm_sold_(%) 100.00 99.81
Total_no 23 108
Age_av 53.04 50.12
Source: SUFISA farms survey (RS – raspberry)
Concerning the type of sale agreement (Figure 50), a legal contract before or during production is present
in 49 cases, followed by legal contract at the time of sale (n=3), and significant number of informal
contracts, 47 before or during the production and 23 at the time of sale.
Figure 50. Type of agreement
Source: SUFISA farms survey (RS – raspberry)
Informal sales contracts are the dominant type of contracts in both individual and collective sales channel.
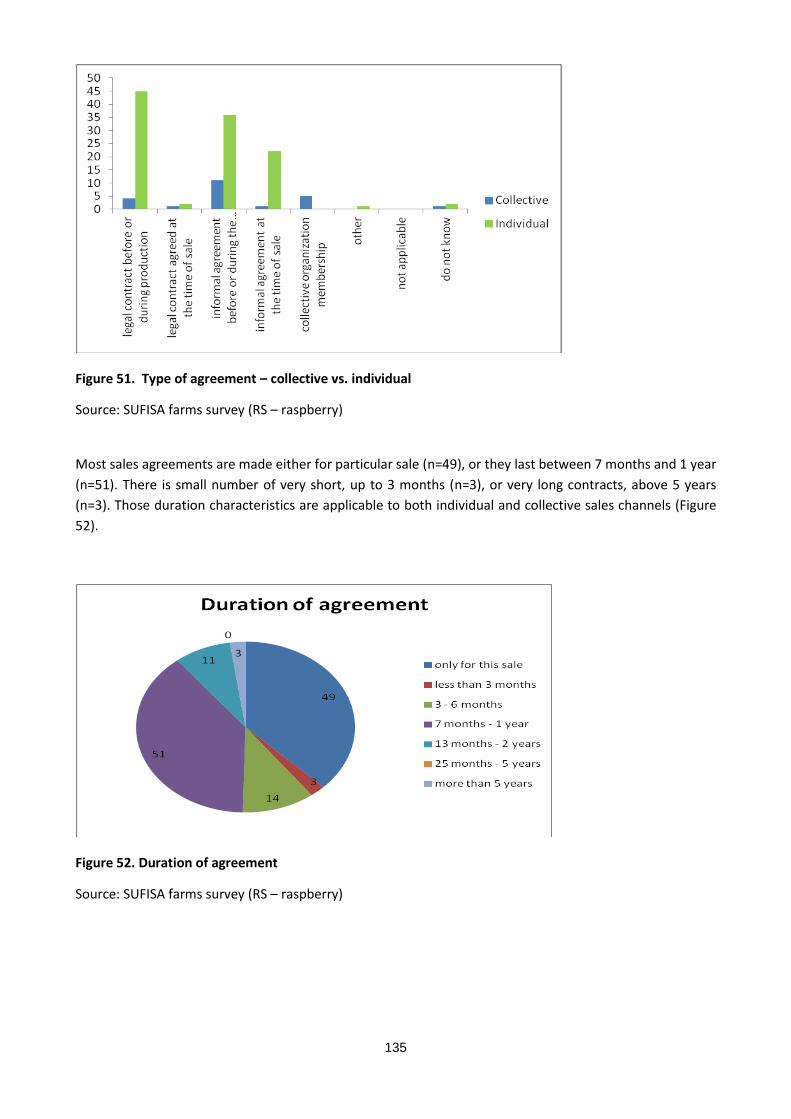
135
Figure 51. Type of agreement – collective vs. individual
Source: SUFISA farms survey (RS – raspberry)
Most sales agreements are made either for particular sale (n=49), or they last between 7 months and 1 year
(n=51). There is small number of very short, up to 3 months (n=3), or very long contracts, above 5 years
(n=3). Those duration characteristics are applicable to both individual and collective sales channels (Figure
52).
Figure 52. Duration of agreement
Source: SUFISA farms survey (RS – raspberry)
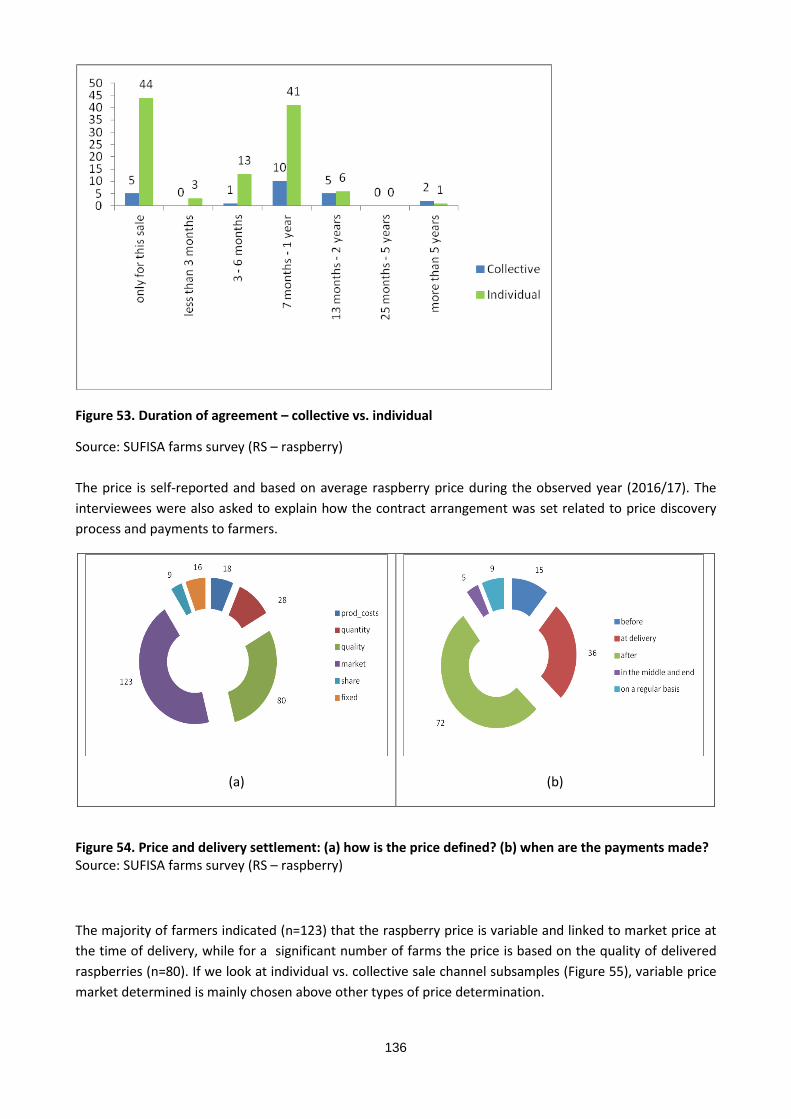
136
Figure 53. Duration of agreement – collective vs. individual
Source: SUFISA farms survey (RS – raspberry)
The price is self-reported and based on average raspberry price during the observed year (2016/17). The
interviewees were also asked to explain how the contract arrangement was set related to price discovery
process and payments to farmers.
(a)
(b)
Figure 54. Price and delivery settlement: (a) how is the price defined? (b) when are the payments made? Source: SUFISA farms survey (RS – raspberry)
The majority of farmers indicated (n=123) that the raspberry price is variable and linked to market price at
the time of delivery, while for a significant number of farms the price is based on the quality of delivered
raspberries (n=80). If we look at individual vs. collective sale channel subsamples (Figure 55), variable price
market determined is mainly chosen above other types of price determination.
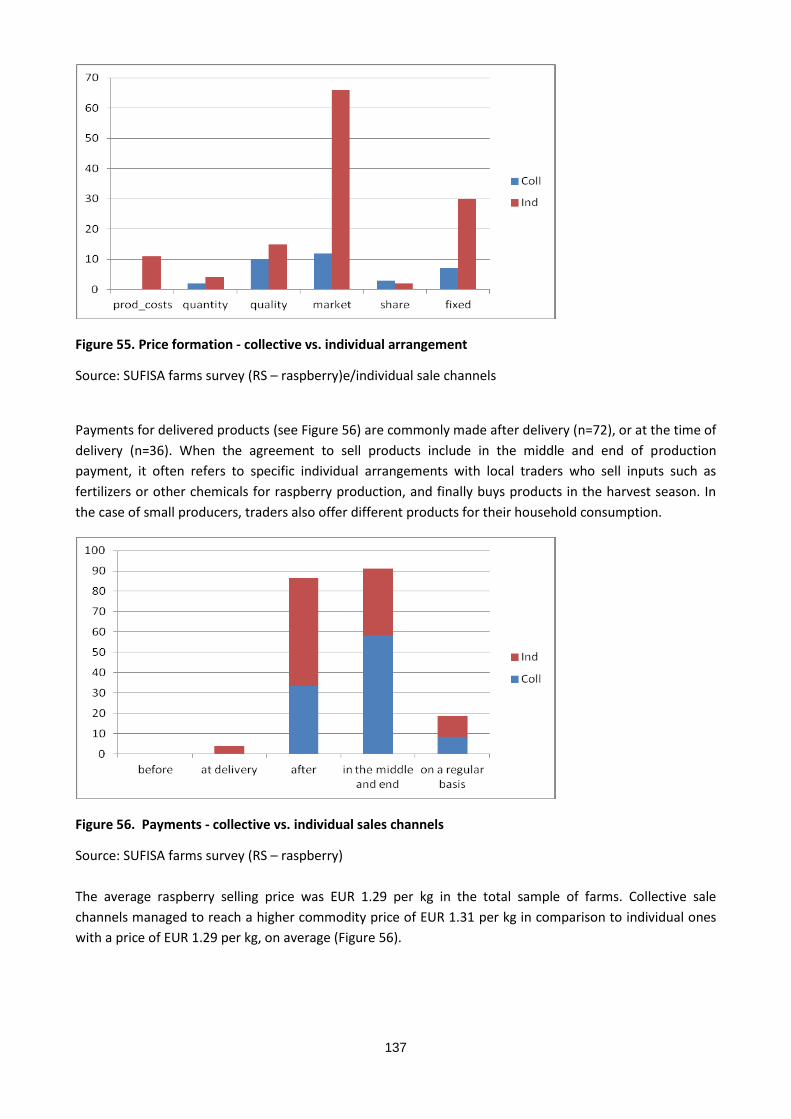
137
Figure 55. Price formation - collective vs. individual arrangement
Source: SUFISA farms survey (RS – raspberry)e/individual sale channels
Payments for delivered products (see Figure 56) are commonly made after delivery (n=72), or at the time of
delivery (n=36). When the agreement to sell products include in the middle and end of production
payment, it often refers to specific individual arrangements with local traders who sell inputs such as
fertilizers or other chemicals for raspberry production, and finally buys products in the harvest season. In
the case of small producers, traders also offer different products for their household consumption.
Figure 56. Payments - collective vs. individual sales channels
Source: SUFISA farms survey (RS – raspberry)
The average raspberry selling price was EUR 1.29 per kg in the total sample of farms. Collective sale
channels managed to reach a higher commodity price of EUR 1.31 per kg in comparison to individual ones
with a price of EUR 1.29 per kg, on average (Figure 56).
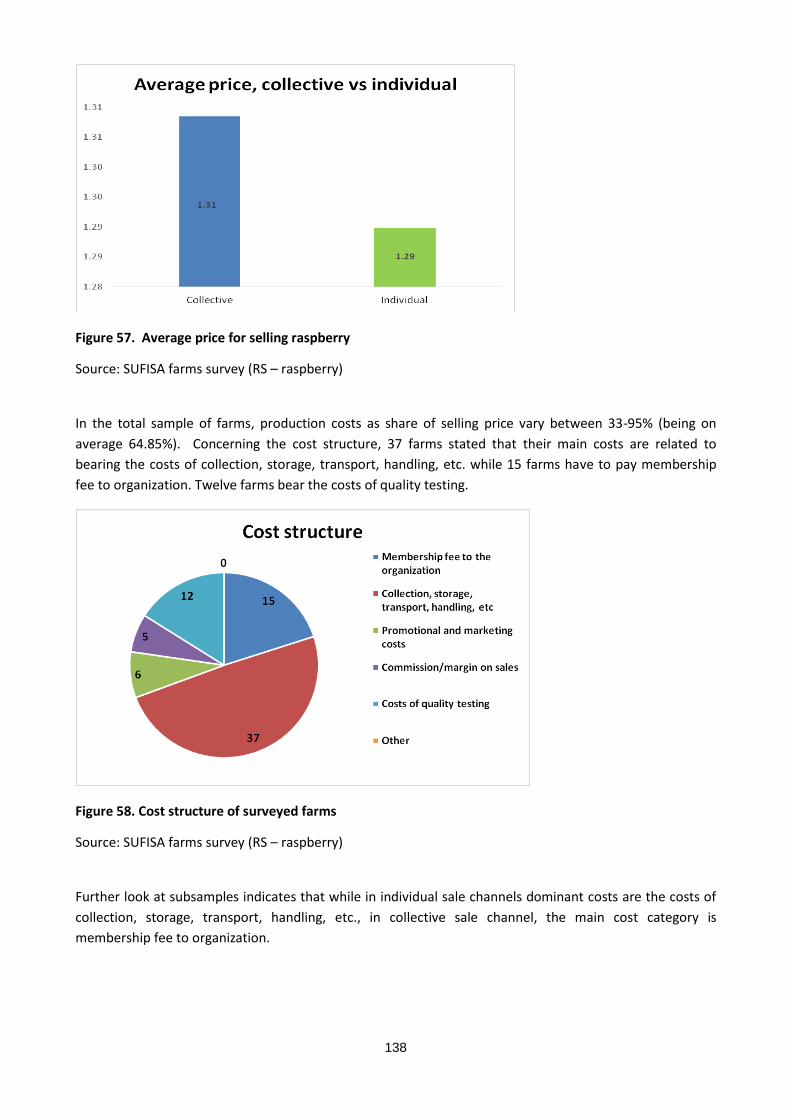
138
Figure 57. Average price for selling raspberry
Source: SUFISA farms survey (RS – raspberry)
In the total sample of farms, production costs as share of selling price vary between 33-95% (being on
average 64.85%). Concerning the cost structure, 37 farms stated that their main costs are related to
bearing the costs of collection, storage, transport, handling, etc. while 15 farms have to pay membership
fee to organization. Twelve farms bear the costs of quality testing.
Figure 58. Cost structure of surveyed farms
Source: SUFISA farms survey (RS – raspberry)
Further look at subsamples indicates that while in individual sale channels dominant costs are the costs of
collection, storage, transport, handling, etc., in collective sale channel, the main cost category is
membership fee to organization.
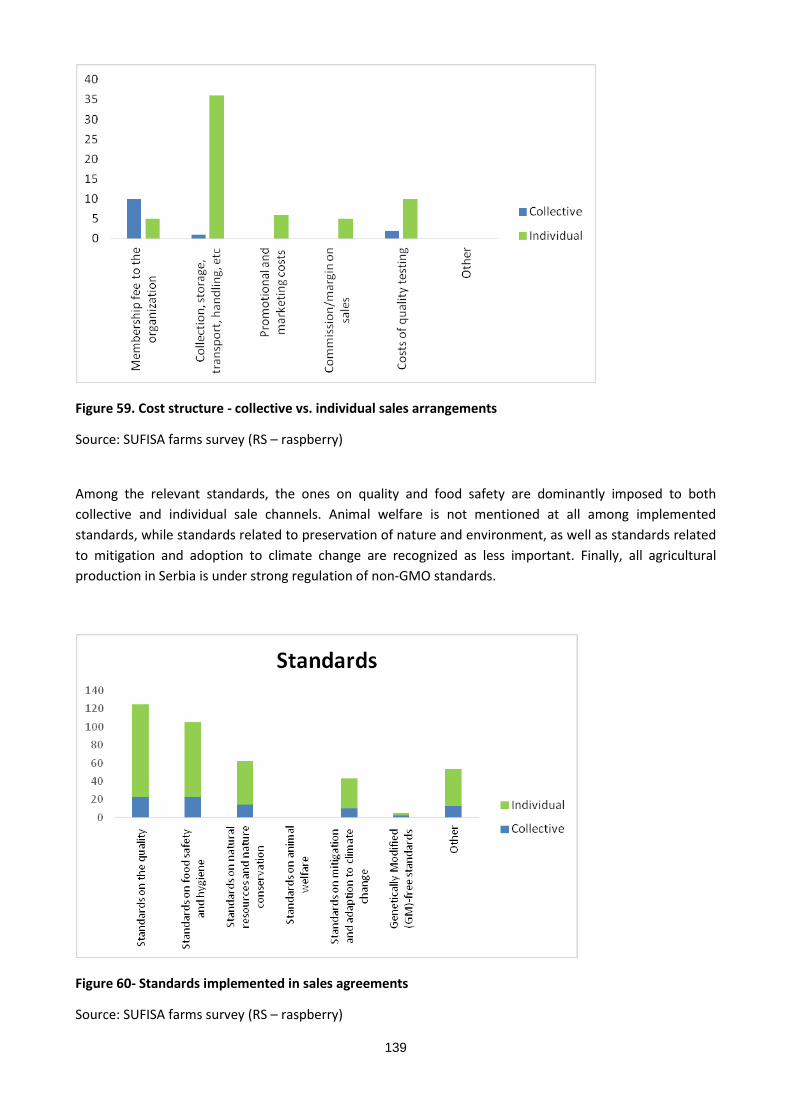
139
Figure 59. Cost structure - collective vs. individual sales arrangements
Source: SUFISA farms survey (RS – raspberry)
Among the relevant standards, the ones on quality and food safety are dominantly imposed to both
collective and individual sale channels. Animal welfare is not mentioned at all among implemented
standards, while standards related to preservation of nature and environment, as well as standards related
to mitigation and adoption to climate change are recognized as less important. Finally, all agricultural
production in Serbia is under strong regulation of non-GMO standards.
Figure 60- Standards implemented in sales agreements
Source: SUFISA farms survey (RS – raspberry)
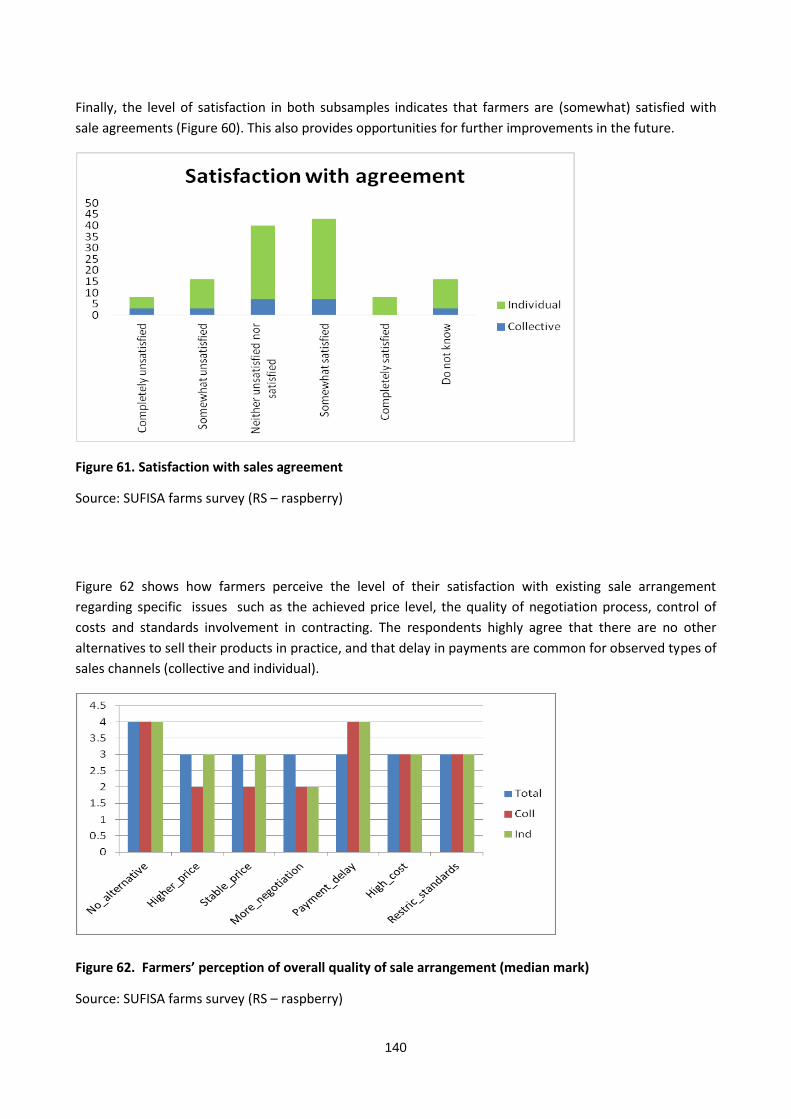
140
Finally, the level of satisfaction in both subsamples indicates that farmers are (somewhat) satisfied with
sale agreements (Figure 60). This also provides opportunities for further improvements in the future.
Figure 61. Satisfaction with sales agreement
Source: SUFISA farms survey (RS – raspberry)
Figure 62 shows how farmers perceive the level of their satisfaction with existing sale arrangement
regarding specific issues such as the achieved price level, the quality of negotiation process, control of
costs and standards involvement in contracting. The respondents highly agree that there are no other
alternatives to sell their products in practice, and that delay in payments are common for observed types of
sales channels (collective and individual).
Figure 62. Farmers’ perception of overall quality of sale arrangement (median mark)
Source: SUFISA farms survey (RS – raspberry)
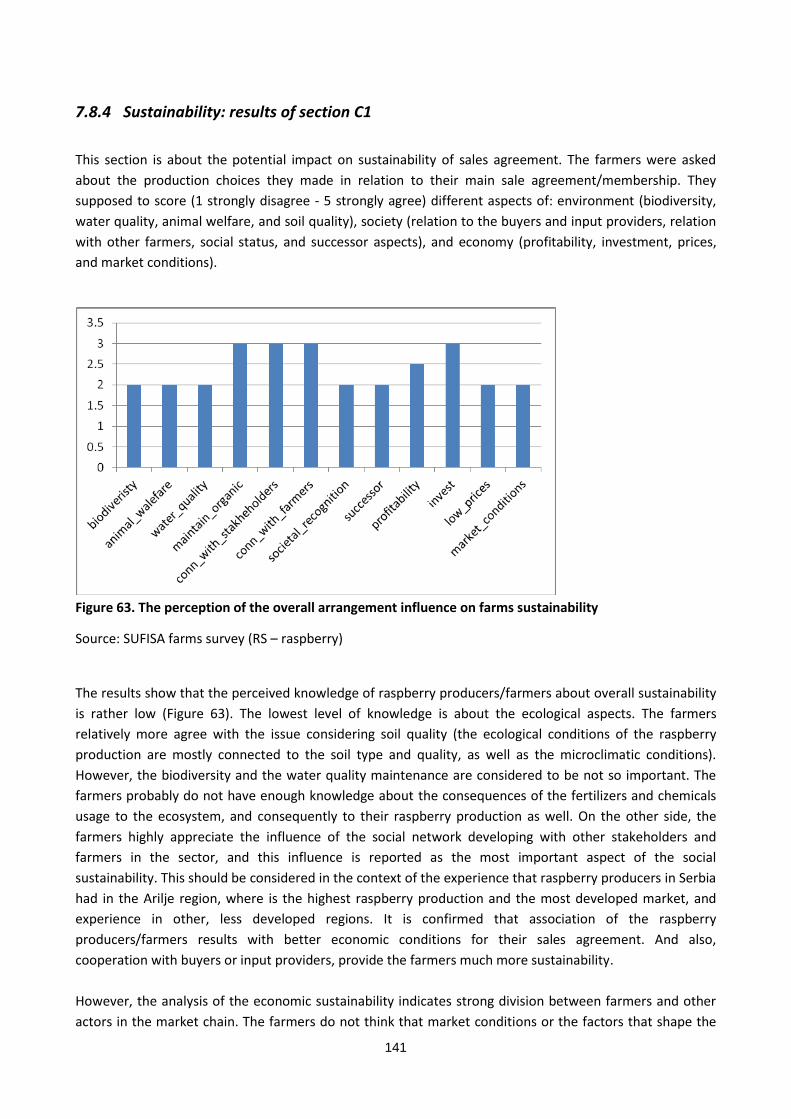
141
7.8.4 Sustainability: results of section C1
This section is about the potential impact on sustainability of sales agreement. The farmers were asked
about the production choices they made in relation to their main sale agreement/membership. They
supposed to score (1 strongly disagree - 5 strongly agree) different aspects of: environment (biodiversity,
water quality, animal welfare, and soil quality), society (relation to the buyers and input providers, relation
with other farmers, social status, and successor aspects), and economy (profitability, investment, prices,
and market conditions).
Figure 63. The perception of the overall arrangement influence on farms sustainability
Source: SUFISA farms survey (RS – raspberry)
The results show that the perceived knowledge of raspberry producers/farmers about overall sustainability
is rather low (Figure 63). The lowest level of knowledge is about the ecological aspects. The farmers
relatively more agree with the issue considering soil quality (the ecological conditions of the raspberry
production are mostly connected to the soil type and quality, as well as the microclimatic conditions).
However, the biodiversity and the water quality maintenance are considered to be not so important. The
farmers probably do not have enough knowledge about the consequences of the fertilizers and chemicals
usage to the ecosystem, and consequently to their raspberry production as well. On the other side, the
farmers highly appreciate the influence of the social network developing with other stakeholders and
farmers in the sector, and this influence is reported as the most important aspect of the social
sustainability. This should be considered in the context of the experience that raspberry producers in Serbia
had in the Arilje region, where is the highest raspberry production and the most developed market, and
experience in other, less developed regions. It is confirmed that association of the raspberry
producers/farmers results with better economic conditions for their sales agreement. And also,
cooperation with buyers or input providers, provide the farmers much more sustainability.
However, the analysis of the economic sustainability indicates strong division between farmers and other
actors in the market chain. The farmers do not think that market conditions or the factors that shape the
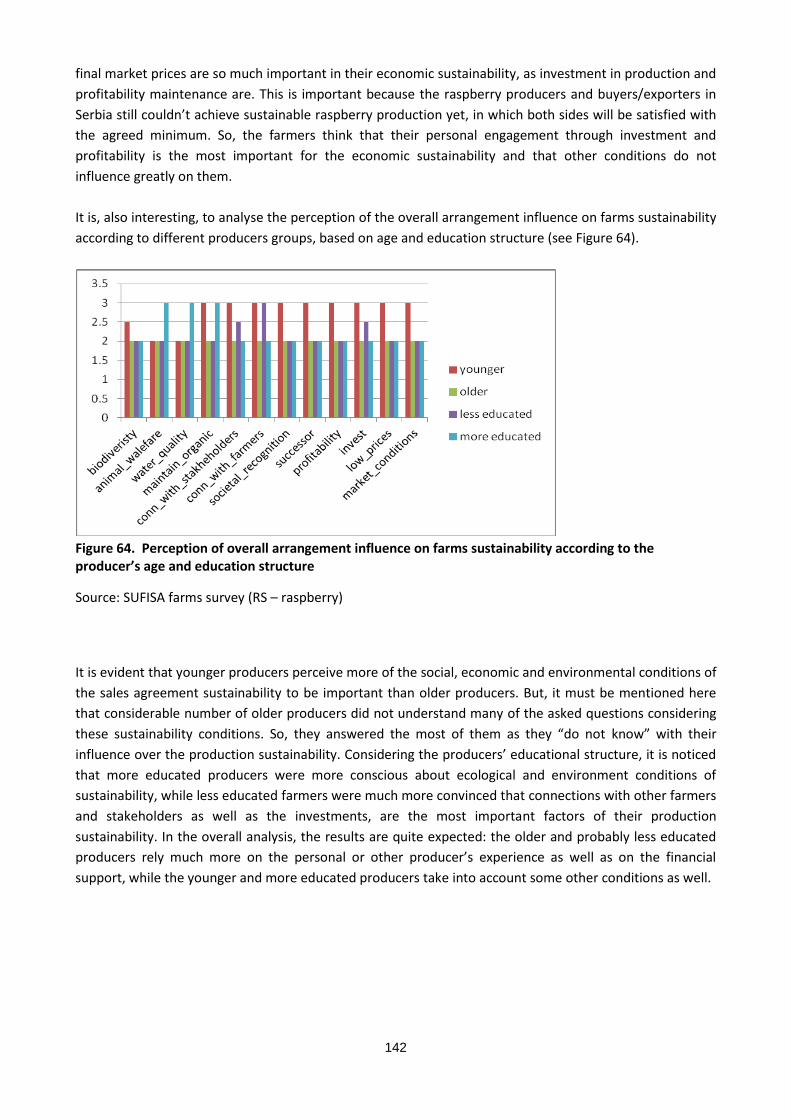
142
final market prices are so much important in their economic sustainability, as investment in production and
profitability maintenance are. This is important because the raspberry producers and buyers/exporters in
Serbia still couldn’t achieve sustainable raspberry production yet, in which both sides will be satisfied with
the agreed minimum. So, the farmers think that their personal engagement through investment and
profitability is the most important for the economic sustainability and that other conditions do not
influence greatly on them.
It is, also interesting, to analyse the perception of the overall arrangement influence on farms sustainability
according to different producers groups, based on age and education structure (see Figure 64).
Figure 64. Perception of overall arrangement influence on farms sustainability according to the producer’s age and education structure
Source: SUFISA farms survey (RS – raspberry)
It is evident that younger producers perceive more of the social, economic and environmental conditions of
the sales agreement sustainability to be important than older producers. But, it must be mentioned here
that considerable number of older producers did not understand many of the asked questions considering
these sustainability conditions. So, they answered the most of them as they “do not know” with their
influence over the production sustainability. Considering the producers’ educational structure, it is noticed
that more educated producers were more conscious about ecological and environment conditions of
sustainability, while less educated farmers were much more convinced that connections with other farmers
and stakeholders as well as the investments, are the most important factors of their production
sustainability. In the overall analysis, the results are quite expected: the older and probably less educated
producers rely much more on the personal or other producer’s experience as well as on the financial
support, while the younger and more educated producers take into account some other conditions as well.
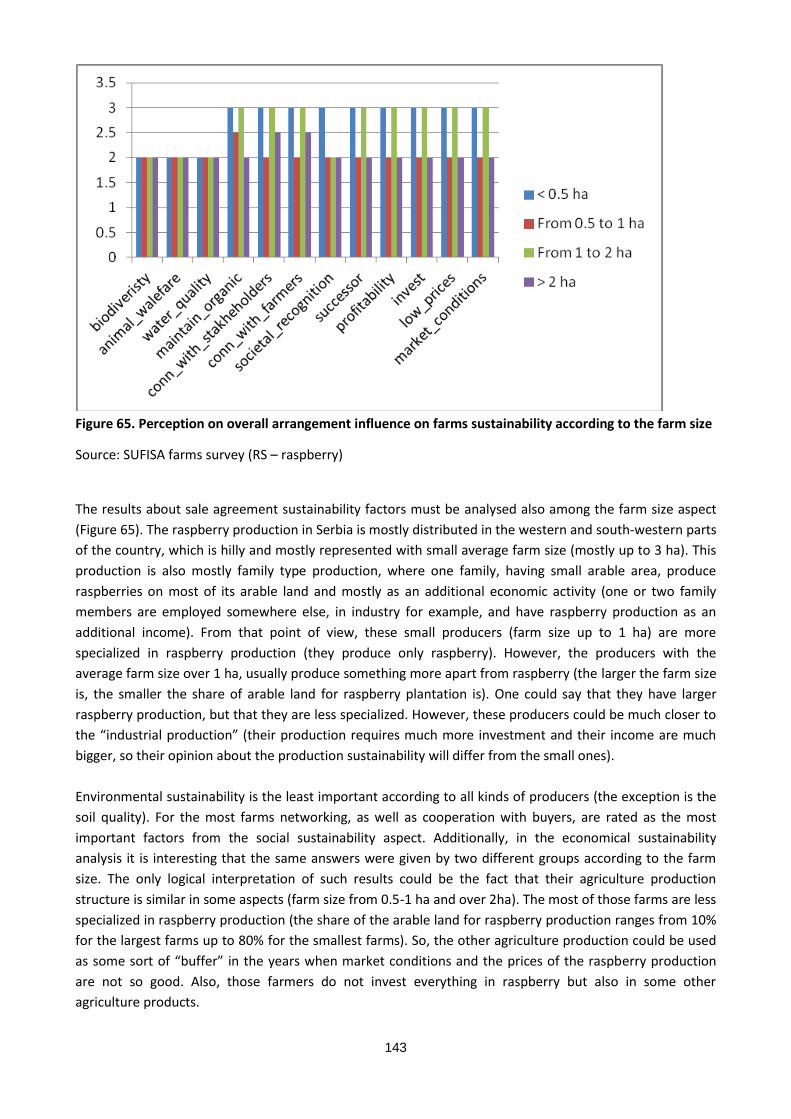
143
Figure 65. Perception on overall arrangement influence on farms sustainability according to the farm size
Source: SUFISA farms survey (RS – raspberry)
The results about sale agreement sustainability factors must be analysed also among the farm size aspect
(Figure 65). The raspberry production in Serbia is mostly distributed in the western and south-western parts
of the country, which is hilly and mostly represented with small average farm size (mostly up to 3 ha). This
production is also mostly family type production, where one family, having small arable area, produce
raspberries on most of its arable land and mostly as an additional economic activity (one or two family
members are employed somewhere else, in industry for example, and have raspberry production as an
additional income). From that point of view, these small producers (farm size up to 1 ha) are more
specialized in raspberry production (they produce only raspberry). However, the producers with the
average farm size over 1 ha, usually produce something more apart from raspberry (the larger the farm size
is, the smaller the share of arable land for raspberry plantation is). One could say that they have larger
raspberry production, but that they are less specialized. However, these producers could be much closer to
the “industrial production” (their production requires much more investment and their income are much
bigger, so their opinion about the production sustainability will differ from the small ones).
Environmental sustainability is the least important according to all kinds of producers (the exception is the
soil quality). For the most farms networking, as well as cooperation with buyers, are rated as the most
important factors from the social sustainability aspect. Additionally, in the economical sustainability
analysis it is interesting that the same answers were given by two different groups according to the farm
size. The only logical interpretation of such results could be the fact that their agriculture production
structure is similar in some aspects (farm size from 0.5-1 ha and over 2ha). The most of those farms are less
specialized in raspberry production (the share of the arable land for raspberry production ranges from 10%
for the largest farms up to 80% for the smallest farms). So, the other agriculture production could be used
as some sort of “buffer” in the years when market conditions and the prices of the raspberry production
are not so good. Also, those farmers do not invest everything in raspberry but also in some other
agriculture products.
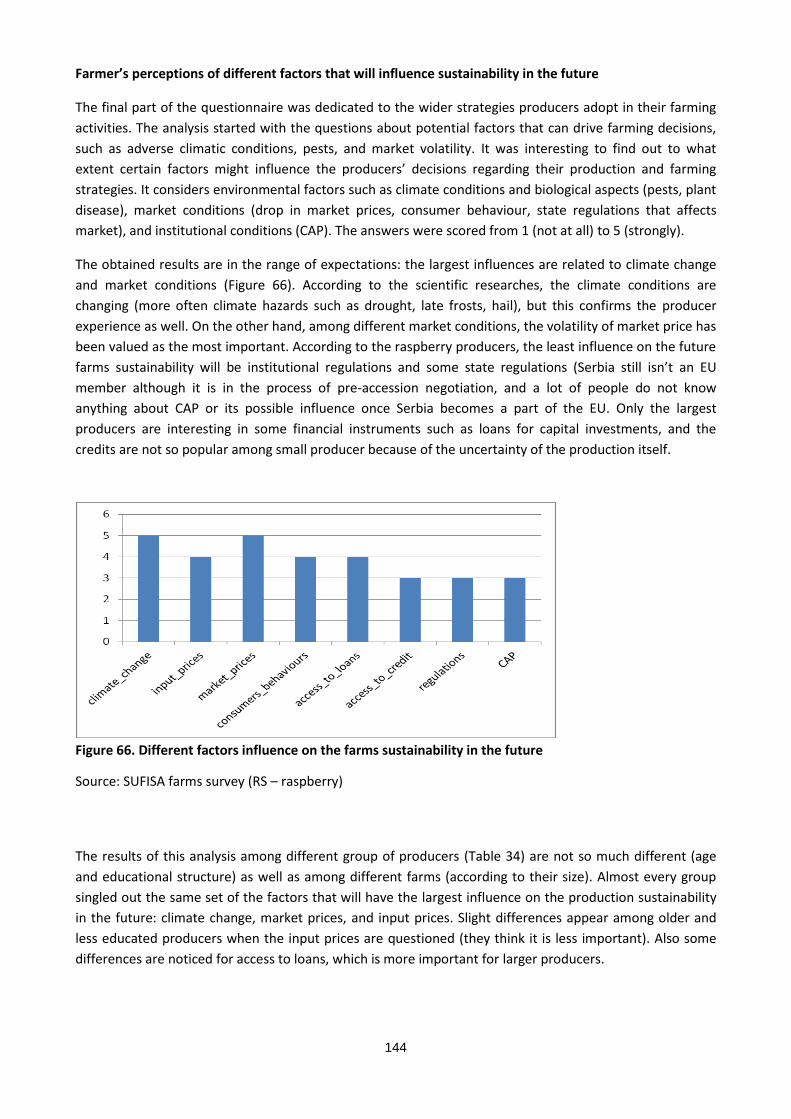
144
Farmer’s perceptions of different factors that will influence sustainability in the future
The final part of the questionnaire was dedicated to the wider strategies producers adopt in their farming
activities. The analysis started with the questions about potential factors that can drive farming decisions,
such as adverse climatic conditions, pests, and market volatility. It was interesting to find out to what
extent certain factors might influence the producers’ decisions regarding their production and farming
strategies. It considers environmental factors such as climate conditions and biological aspects (pests, plant
disease), market conditions (drop in market prices, consumer behaviour, state regulations that affects
market), and institutional conditions (CAP). The answers were scored from 1 (not at all) to 5 (strongly).
The obtained results are in the range of expectations: the largest influences are related to climate change
and market conditions (Figure 66). According to the scientific researches, the climate conditions are
changing (more often climate hazards such as drought, late frosts, hail), but this confirms the producer
experience as well. On the other hand, among different market conditions, the volatility of market price has
been valued as the most important. According to the raspberry producers, the least influence on the future
farms sustainability will be institutional regulations and some state regulations (Serbia still isn’t an EU
member although it is in the process of pre-accession negotiation, and a lot of people do not know
anything about CAP or its possible influence once Serbia becomes a part of the EU. Only the largest
producers are interesting in some financial instruments such as loans for capital investments, and the
credits are not so popular among small producer because of the uncertainty of the production itself.
Figure 66. Different factors influence on the farms sustainability in the future
Source: SUFISA farms survey (RS – raspberry)
The results of this analysis among different group of producers (Table 34) are not so much different (age
and educational structure) as well as among different farms (according to their size). Almost every group
singled out the same set of the factors that will have the largest influence on the production sustainability
in the future: climate change, market prices, and input prices. Slight differences appear among older and
less educated producers when the input prices are questioned (they think it is less important). Also some
differences are noticed for access to loans, which is more important for larger producers.
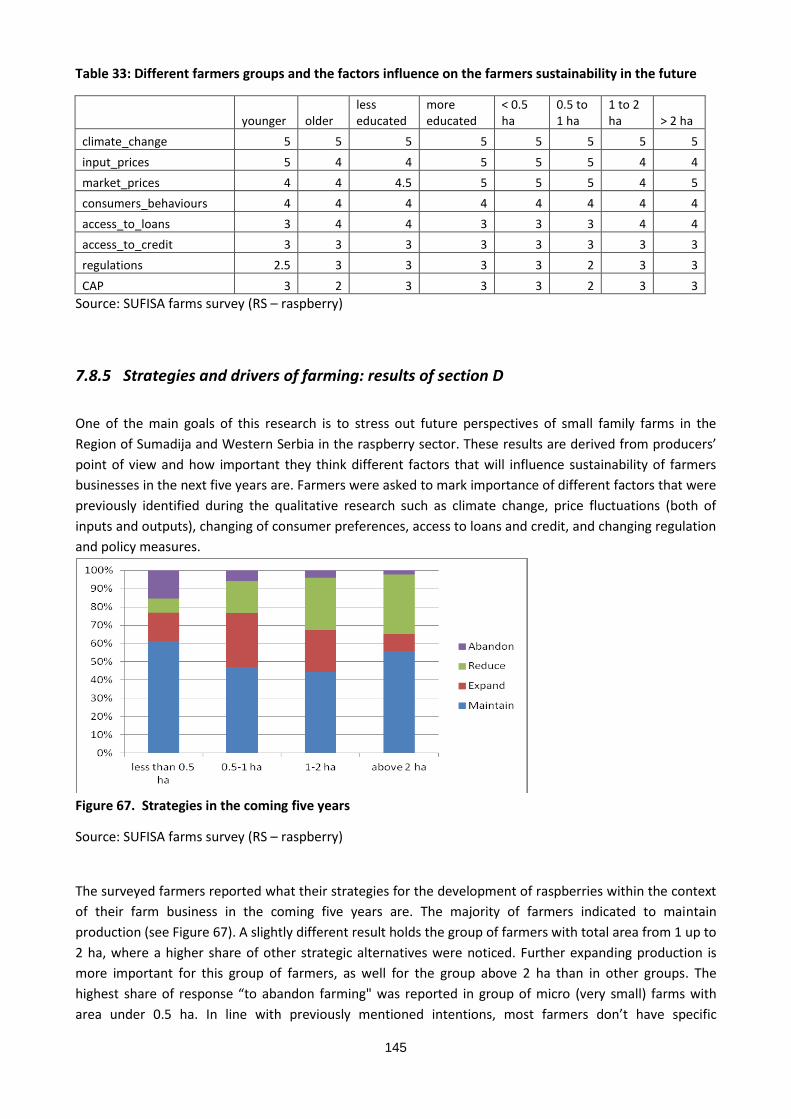
145
Table 33: Different farmers groups and the factors influence on the farmers sustainability in the future
younger older less educated
more educated
< 0.5 ha
0.5 to 1 ha
1 to 2 ha > 2 ha
climate_change 5 5 5 5 5 5 5 5
input_prices 5 4 4 5 5 5 4 4
market_prices 4 4 4.5 5 5 5 4 5
consumers_behaviours 4 4 4 4 4 4 4 4
access_to_loans 3 4 4 3 3 3 4 4
access_to_credit 3 3 3 3 3 3 3 3
regulations 2.5 3 3 3 3 2 3 3
CAP 3 2 3 3 3 2 3 3
Source: SUFISA farms survey (RS – raspberry)
7.8.5 Strategies and drivers of farming: results of section D
One of the main goals of this research is to stress out future perspectives of small family farms in the
Region of Sumadija and Western Serbia in the raspberry sector. These results are derived from producers’
point of view and how important they think different factors that will influence sustainability of farmers
businesses in the next five years are. Farmers were asked to mark importance of different factors that were
previously identified during the qualitative research such as climate change, price fluctuations (both of
inputs and outputs), changing of consumer preferences, access to loans and credit, and changing regulation
and policy measures.
Figure 67. Strategies in the coming five years
Source: SUFISA farms survey (RS – raspberry)
The surveyed farmers reported what their strategies for the development of raspberries within the context
of their farm business in the coming five years are. The majority of farmers indicated to maintain
production (see Figure 67). A slightly different result holds the group of farmers with total area from 1 up to
2 ha, where a higher share of other strategic alternatives were noticed. Further expanding production is
more important for this group of farmers, as well for the group above 2 ha than in other groups. The
highest share of response “to abandon farming" was reported in group of micro (very small) farms with
area under 0.5 ha. In line with previously mentioned intentions, most farmers don’t have specific
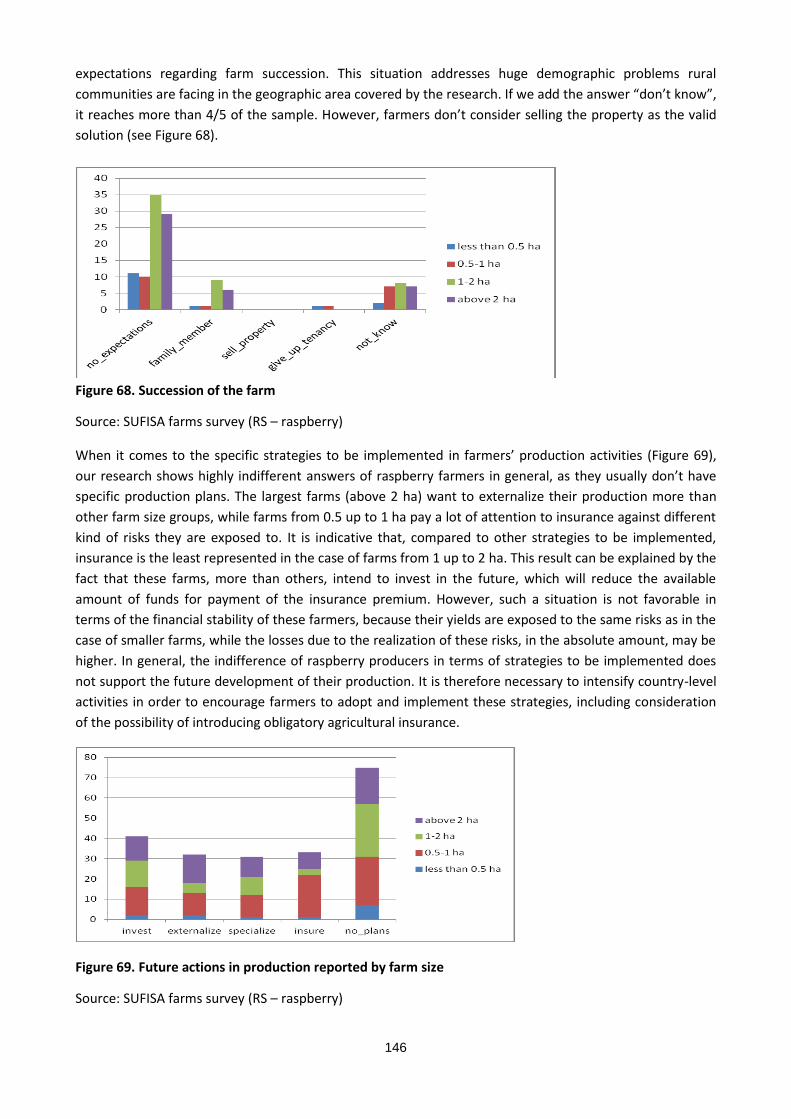
146
expectations regarding farm succession. This situation addresses huge demographic problems rural
communities are facing in the geographic area covered by the research. If we add the answer “don’t know”,
it reaches more than 4/5 of the sample. However, farmers don’t consider selling the property as the valid
solution (see Figure 68).
Figure 68. Succession of the farm
Source: SUFISA farms survey (RS – raspberry)
When it comes to the specific strategies to be implemented in farmers’ production activities (Figure 69),
our research shows highly indifferent answers of raspberry farmers in general, as they usually don’t have
specific production plans. The largest farms (above 2 ha) want to externalize their production more than
other farm size groups, while farms from 0.5 up to 1 ha pay a lot of attention to insurance against different
kind of risks they are exposed to. It is indicative that, compared to other strategies to be implemented,
insurance is the least represented in the case of farms from 1 up to 2 ha. This result can be explained by the
fact that these farms, more than others, intend to invest in the future, which will reduce the available
amount of funds for payment of the insurance premium. However, such a situation is not favorable in
terms of the financial stability of these farmers, because their yields are exposed to the same risks as in the
case of smaller farms, while the losses due to the realization of these risks, in the absolute amount, may be
higher. In general, the indifference of raspberry producers in terms of strategies to be implemented does
not support the future development of their production. It is therefore necessary to intensify country-level
activities in order to encourage farmers to adopt and implement these strategies, including consideration
of the possibility of introducing obligatory agricultural insurance.
Figure 69. Future actions in production reported by farm size
Source: SUFISA farms survey (RS – raspberry)
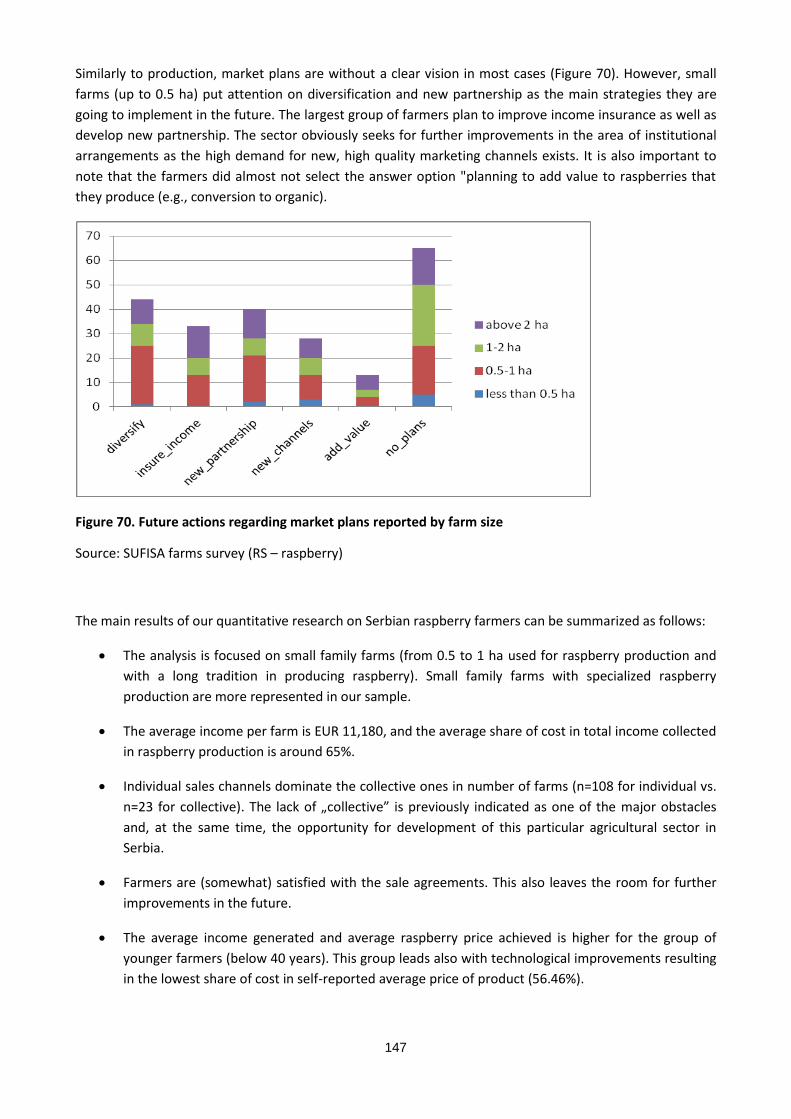
147
Similarly to production, market plans are without a clear vision in most cases (Figure 70). However, small
farms (up to 0.5 ha) put attention on diversification and new partnership as the main strategies they are
going to implement in the future. The largest group of farmers plan to improve income insurance as well as
develop new partnership. The sector obviously seeks for further improvements in the area of institutional
arrangements as the high demand for new, high quality marketing channels exists. It is also important to
note that the farmers did almost not select the answer option "planning to add value to raspberries that
they produce (e.g., conversion to organic).
Figure 70. Future actions regarding market plans reported by farm size
Source: SUFISA farms survey (RS – raspberry)
The main results of our quantitative research on Serbian raspberry farmers can be summarized as follows:
The analysis is focused on small family farms (from 0.5 to 1 ha used for raspberry production and
with a long tradition in producing raspberry). Small family farms with specialized raspberry
production are more represented in our sample.
The average income per farm is EUR 11,180, and the average share of cost in total income collected
in raspberry production is around 65%.
Individual sales channels dominate the collective ones in number of farms (n=108 for individual vs.
n=23 for collective). The lack of „collective” is previously indicated as one of the major obstacles
and, at the same time, the opportunity for development of this particular agricultural sector in
Serbia.
Farmers are (somewhat) satisfied with the sale agreements. This also leaves the room for further
improvements in the future.
The average income generated and average raspberry price achieved is higher for the group of
younger farmers (below 40 years). This group leads also with technological improvements resulting
in the lowest share of cost in self-reported average price of product (56.46%).
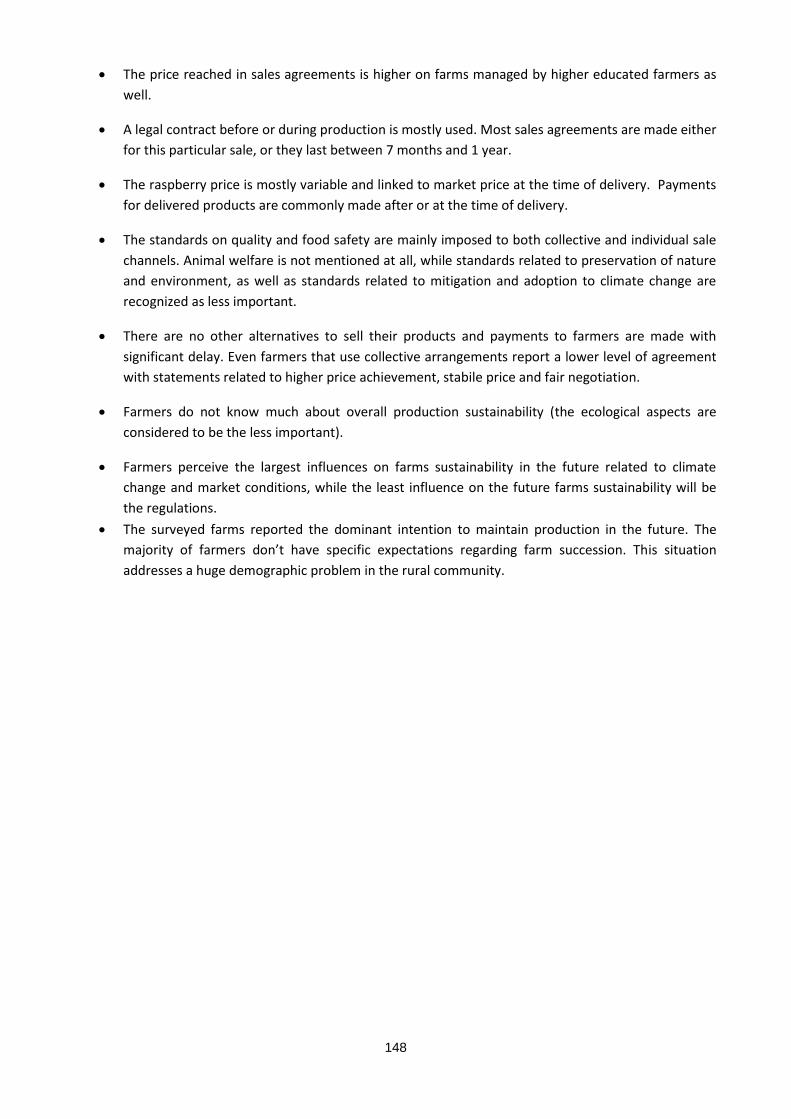
148
The price reached in sales agreements is higher on farms managed by higher educated farmers as
well.
A legal contract before or during production is mostly used. Most sales agreements are made either
for this particular sale, or they last between 7 months and 1 year.
The raspberry price is mostly variable and linked to market price at the time of delivery. Payments
for delivered products are commonly made after or at the time of delivery.
The standards on quality and food safety are mainly imposed to both collective and individual sale
channels. Animal welfare is not mentioned at all, while standards related to preservation of nature
and environment, as well as standards related to mitigation and adoption to climate change are
recognized as less important.
There are no other alternatives to sell their products and payments to farmers are made with
significant delay. Even farmers that use collective arrangements report a lower level of agreement
with statements related to higher price achievement, stabile price and fair negotiation.
Farmers do not know much about overall production sustainability (the ecological aspects are
considered to be the less important).
Farmers perceive the largest influences on farms sustainability in the future related to climate
change and market conditions, while the least influence on the future farms sustainability will be
the regulations.
The surveyed farms reported the dominant intention to maintain production in the future. The
majority of farmers don’t have specific expectations regarding farm succession. This situation
addresses a huge demographic problem in the rural community.
149
7.9 References
Agricultural database, Statistical Office of Serbia –
http://webrzs.stat.gov.rs/WebSite/public/ReportView.aspx
Berkum S., Bogdanov, N. (2012). Serbia on the Road to EU Accession Consequences for Agricultural Policy
and the Agri-food Chain, CAB International.
Blagojevic, R., Božić, V. (2012). Tehnologija proizvodnje maline, Fruits & Berries, Niš (www.fb.org.rs).
Chroneos Krasavac Biljana, Goran Petković (2015): Cooperatives in Serbia - Evolution and Current Issues,
Economics of Agriculture 3/2015, EP 2015 (62) 3, pp. 723-735.
Dejan Đorđević Dejan, Dragan Živko Ćoćkalo, Srđan Bogetić & Cariša Bešić (2015): Implementation of
Certificaton Schemes in Serbian and Neighbouring Countries Agrifood Industry, DOI:
10,17626/dBEM.ICoM.POO.2015.p087
Djurkovic M. (2012): SWOT analysis of Serbia's raspberry sector in the competitive
marketplace, Norwegian University of Life Sciences.
Đorđević, Ćoćkalo, Bogetić & Bešić (2015): Implementation of Certification Schemes in Serbian and
Neighbouring Countries Agri-food Industry, DOI: 10,17626/dBEM.ICoM.POO.2015.p087
Economic Institute Report (2012): Raspberry from Arilje.
Kljajić, N., Vuković, P., Arsić, S. (2013). Tendencies related to the production of raspberries in the Republic
of Serbia, Economics of Agriculture 2013 (60), pp. 39-48.
Lukač Bulatović, M., Rajić, Z., Ljubanović Ralević, I. (2012): Economic features of processed fruit production
in Serbia, Ekonomika poljoprivrede, (59) 4 (715-725).
Nikolić I. et al. (2013): Potentials for export of fresh raspberries from Serbia to EU fresh markets, Industrija,
Vol.40, No.3, pp. 63-88.
Radosavljevic K. (2008). The market chain of fruit production in Serbia: A case study of raspberry
and sour cherry cultivation, Economic Annals, 2008, vol. 53, br. 177, pp. 103-121.
RAS (2015): Serbian Food Industry, http://ras.gov.rs/uploads/2016/09/food-brochure-small.pdf
Rikalović, G., Stojanović, Ž., Zakić, Z. (2012): The new pattern of economic development and
emplyment: The Creative Model of Rural Industrialization (In Serbian / Novi obrazac privrednog
razvoja i zapošljavanja - model kreativne ruralne industrijalizacije), Zbornik Matice srpske za
društvene nauke 141, str. 565-582.
Simović, T., Nesović, D., Dabić, R. (2010). Market analysis of the fruit sector in Zlatibor County,
Serbia, Regional Development Agency, Zlatibor.
Sredojević, Z., Kljajić, N., Popović, N. (2013). Investing in raspberry production as an opportunity of
sustainable development of rural areas in Western Serbia, Economic Insights – Trends and Challenges,
Vol. II (LXV), No. 1/2013, pp. 63-72.
150
Statistical Office of Serbia (2014), Statistical Yearbook 2013.
Statistical Office of Serbia (2014): Agricultural Census data.
Stojanovic, Z., Mirkovic, D. (2015): FUTURE CHALLENGES AND STRATEGIES FOR SMALLHOLDERS IN SERBIA,
http://www.fao.org/fileadmin/user_upload/reu/europe/documents/Events2015/fcss/Ser_en.pdf
Stojanović, Ž., Ognjanov, G. (2012): Strategic orientation of rural development in Serbia – production and
marketing of traditional food, Ekonomske teme, No. XLIX/1, pp. 19-31. Stojanović, Ž., Radosavljević, K.
(2013). Food chain, agricultural competitiveness and industrial policy: a case study of the Serbian
raspberry production and export, Serbian Association of Economists Journal - Ekonomika preduzeća, Issue
3-4, pp. 174-182.
Swiss Agency for Development and Cooperation (2011): Market analysis of the fruit sector in Zlatibor
County.
The National Sustainable Development Strategy of the Republic of Serbia (Official Gazette of the
Republic of Serbia, no. 57/08).
The Food Safety Law (Official Gazette of RS,. No. 41/09)
The Strategy on Agricultural and Rural Development (Official Gazette of. RS, No.
Urlich M. (2013). Organic Agriculture in Serbia - At a Glance 2013, GIZ & Serbia Organica, 2012.
USAID (2008), Cultivated berry value chain assessment, USAID Agribusiness project, Serbia.
USAID BEP: AGRICULTURAL FINANCE IN SERBIA –STATUS AND RECOMMENDATIONS, 2013
http://www.bep.rs/baza_znanja/documents/commodity-
exchange/Agricultural%20Finance%20in%20Serbia.pdf
Volk Tina ed. (2010): Agriculture in the Western Balkan Countries, Studies on the Agricultural and Food
Sector in Central and Eastern Europe, Leibniz-institut für AgrArentwickLung in MitteL- und OsteurOpAS
- IAMO, Halle.
Zarić, V., Vasiljević, Z., Vlahović, B., Andrić, J. (2012). Basic characteristics of the raspberry marketing
chain and position of the small farmers in Serbia, print in 135 EAAE Seminar Book of Proceedings -
Challenges for the Global Agricultural Trade Regime after Doha, pp. 359-368.
Živkov Goran (2013): Association of farmers in the Western Balkan countries, FAO Regional Office for
Europe and Central Asia, Policy Studies on Rural Transition No. 2013-1.
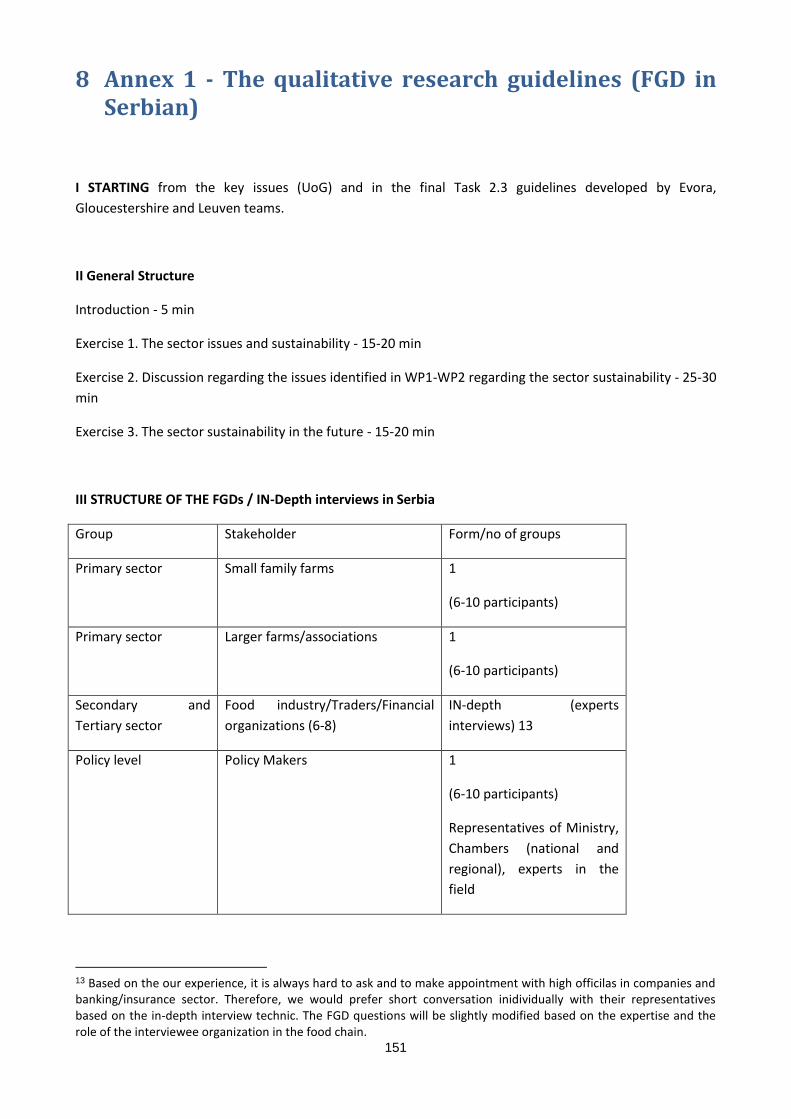
151
8 Annex 1 - The qualitative research guidelines (FGD in Serbian)
I STARTING from the key issues (UoG) and in the final Task 2.3 guidelines developed by Evora,
Gloucestershire and Leuven teams.
II General Structure
Introduction - 5 min
Exercise 1. The sector issues and sustainability - 15-20 min
Exercise 2. Discussion regarding the issues identified in WP1-WP2 regarding the sector sustainability - 25-30
min
Exercise 3. The sector sustainability in the future - 15-20 min
III STRUCTURE OF THE FGDs / IN-Depth interviews in Serbia
Group Stakeholder Form/no of groups
Primary sector Small family farms 1
(6-10 participants)
Primary sector Larger farms/associations 1
(6-10 participants)
Secondary and
Tertiary sector
Food industry/Traders/Financial
organizations (6-8)
IN-depth (experts
interviews) 13
Policy level Policy Makers 1
(6-10 participants)
Representatives of Ministry,
Chambers (national and
regional), experts in the
field
13 Based on the our experience, it is always hard to ask and to make appointment with high officilas in companies and banking/insurance sector. Therefore, we would prefer short conversation inidividually with their representatives based on the in-depth interview technic. The FGD questions will be slightly modified based on the expertise and the role of the interviewee organization in the food chain.
152
Part 2 - FGD Wheat sector (in Serbian)
UVOD
Cilj je da zajednički pričamo o problemima, poslovanju i strategijama svih učesnika u sistemu snabdevanja
pšenicom.
Vežba 1. Problemi i održivost.
1a. Kada kažem ODRŽIVOST, koje su vaše prve misli / razmišljanja na ovu temu? Objasnite.
- Napredni proizvođač:
- Srednji proizvođač:
- Marginalni proizvođač:
Koje aktivnosti preduzimate kako bi obezbedili održivost vaših aktivnosti / poslovanja?
- Napredni proizvođač:
- Srednji proizvođač:
- Marginalni proizvođač:
1b. Molim Vas da identifikujete tri najvažnija problema sa kojima se susreće sektor malinarstva u proteklih
pet godina.
- Napredni proizvođač:
- Srednji proizvođač:
- Marginalni proizvođač:
Zašto ste izdvojili baš te probleme?
Koji je problem po vašem mišljenju najvažniji od izdvojenih?
Koja su moguća rešenja?
Kako se borite protiv ovih problema, koje su vaše strategije?
Vežba 2. Šta su naša istraživanja pokazala? Koji su najvažniji problemi?
Analizirali smo regulatorne uslove poslovanja, mere agrarne i ruralne politike i tržište u okviru našeg
istraživanja i idektifikovali četiri bitna problema sa kojima se suočavaju poljoprivredni proizvođači (ne samo
u sektoru malinarstva). To su:
1. Organizacija sistema snabdevanja hranom / odredjenim proizvodom (položaj pojedinih aktera unutar
sistema, ko kreira netododatu vrednost, horizontalna i vertikalna integracija, forme ugovora...) -
Da li saradjujete sa ostalim proizvodjacima ili akterima unutar sistema?
- Napredni proizvođač:
153
- Srednji proizvođač:
- Marginalni proizvođač:
Kako to funkcioniše? Da li je bilo problema?
- Napredni proizvođač:
- Srednji proizvođač:
- Marginalni proizvođač:
2. Promene na tržištu (cene, tržišni rizici, finanijski problemi - mogućnost dobijanja kredita, investicije i nove
tehnologije...) -
Koja su vaša najvažnija tržišta?
Kako se promene na ovim tržištima odražavaju na vaše poslovanje?
- Napredni proizvođač:
- Srednji proizvođač:
- Marginalni proizvođač:
Da li promene preferencija potrošača imaju uticaja na Vašu poziciju?
- Napredni proizvođač:
- Srednji proizvođač:
- Marginalni proizvođač:
Da li razmišljate o certifikaciji proizvoda i kako to da iskoristite najbolje (organska)?
- Napredni proizvođač:
- Srednji proizvođač:
- Marginalni proizvođač:
Kako finansirate svoju aktivnost?
- Napredni proizvođač:
- Srednji proizvođač:
- Marginalni proizvođač:
3. Zemljište i okruženje - vlaništvo, lizink, državno zemljište i odnos prema okruženju (korišćenjehemikalija,
degraacija zemljišta, klimatske promene i efekti i dr.).
Šta bi ste rekli o zakupu zemljišta?
- Napredni proizvođač:
- Srednji proizvođač:
154
- Marginalni proizvođač:
Da li odgovarate adekvatno na izazove vezane za zaštitu životne sredine?
- Napredni proizvođač:
- Srednji proizvođač:
- Marginalni proizvođač:
Da li vodite računa o socijalnim ciljevima (zaposlenje, lokalni razvoj...)?
- Napredni proizvođač:
- Srednji proizvođač:
- Marginalni proizvođač:
4. Okvir za vođenje politike - mere ruralne i agrarne politike -
Da li postojeći okvir pomaže da unapredite svoje poslovanje?
Da li možete da utičete na donošenje odluka?
- Napredni proizvođač:
- Srednji proizvođač:
- Marginalni proizvođač:
Šta mislite o ovim grupama problema?
Koje bi probleme izdvojili kao posebno važne iz vaše perspektive?
Kako ovi problemi utiču na održivost?
Šta možete da učinite da bi se ovi problemi rešili?
- Napredni proizvođač:
- Srednji proizvođač:
- Marginalni proizvođač:
NAPOMENA: Sa sličnim problemima se suočavaju i poljoprivredni proizvođači u drugim zemljama Evrope
(mi istražujemo poziciju u više zemalja - Srbija je jedina kandidat za članstvo, sve ostale su članice EU, jedna
izašla iz EU - VB, uključeni Nemačka, Italija, Portugalija, Francuska, Poljska, Holandija, Danska, Španija). Naš
je cilj da u narednoj godini istraživanja sistematizujemo probleme i tražimo moguće solucije po ugledu na
najuspešnije zemlje.
Vežba 3. Održivost sistema u budućnosti
Zamislite Vaše poslovanje u 2027. godini (za deset godina). Opišite svoj položaj na tržištu. Koji će faktori
uticati najviše na poslovanje poljoprivredih proizvođača?
Koje ćete strategije primenjivati kako bi poslovali uspešno?
155
Koja bi strategija dovela do najboljih rezultata u ekonomskom smislu? Da li razmišljate i na koji način o
efektima na socijalno i životno okruženje?
- Napredni proizvođač:
- Srednji proizvođač:
- Marginalni proizvođač:
Kraj.
Part 3 - FGD Raspberry sector (in Serbian)
UVOD
O SUFISA projektu, uloga nacionalnih partnera (Ekonomski fakultet Beograd, Opština Arilje)
Cilj je da zajednički pričamo o problemima, poslovanju i strategijama svih učesnika u sistemu snabdevanja
malinom koje mogu dovesti do poželjnog rezultata u razvoju sektora malinarstva u Srbiji.
Vežba 1. Problemi i održivost.
1a. Kada kažem održivost, koje su vaše prve misli / razmišljanja na ovu temu?
Koje aktivnosti preduzimate kako bi obezbedili održivost vaših aktivnosti / poslovanja?
1b. Molim Vas da identifikujete tri najvažnija problema sa kojima se susreće sektor malinarstva u proteklih
pet godina.
Zašto ste izdvojili baš te probleme?
Koji je problem po vašem mišljenju najvažniji od izdvojenih?
Koja su moguća rešenja?
Kako se borite protiv ovih problema, koje su vaše strategije?
Vežba 2. Šta su naša istraživanja pokazala? Koji su najvažniji problemi?
Analizirali smo regulatorne uslove poslovanja, mere agrarne i ruralne politike i tržište u okviru našeg
istraživanja i idektifikovali četiri bitna problema sa kojima se suočavaju poljoprivredni proizvođači (ne samo
u sektoru malinarstva). To su:
1. Organizacija sistema snabdevanja hranom / odredjenim proizvodom (položaj pojedinih aktera unutar
sistema, ko kreira netododatu vrednost, horizontalna i vertikalna integracija, forme ugovora...) -
Da li saradjujete sa ostalim proizvodjacima ili akterima unutar sistema?
Kako to funkcioniše? Da li je bilo problema?
2. Promene na tržištu (cene, tržišni rizici, finanijski problemi - mogućnost dobijanja kredita, investicije i nove
tehnologije...) -
156
Koja su vaša najvažnija tržišta?
Kako se promene na ovim tržištima odražavaju na vaše poslovanje?
Da li promene preferencija potrošača imaju uticaja na Vašu poziciju?
Da li razmišljate o certifikaciji proizvoda (organska, ariljska...) i kako to da iskoristite najbolje?
Kako finansirate svoju aktivnost?
3. Zemljište i okruženje - vlaništvo, lizink, državno zemljište i odnos prema okruženju (korišćenjehemikalija,
degraacija zemljišta, klimatske promene i efekti i dr.).
Da li odgovarate adekvatno na izazove vezane za zaštitu životne sredine?
Da li vodite računa o socijalnim ciljevima (zaposlenje, lokalni razvoj...)?
4. Okvir za vođenje politike - mere ruralne i agrarne politike -
Da li postojeći okvir pomaže da unapredite svoje poslovanje?
Da li možete da utičete na donošenje odluka?
Šta mislite o ovim grupama problema?
Koje bi probleme izdvojili kao posebno važne iz vaše perspektive?
Kako ovi problemi utiču na održivost?
Šta možete da učinite da bi se ovi problemi rešili?
NAPOMENA: Sa sličnim problemima se suočavaju i poljoprivredni proizvođači u drugim zemljama Evrope
(mi istražujemo poziciju u više zemalja - Srbija je jedina kandidat za članstvo, sve ostale su članice EU, jedna
izašla iz EU - VB, uključeni Nemačka, Italija, Portugalija, Francuska, Poljska, Holandija, Danska, Španija). Naš
je cilj da u narednoj godini istraživanja sistematizujemo probleme i tražimo moguće solucije po ugledu na
najuspešnije zemlje.
Vežba 3. Održivost sistema u budućnosti
Zamislite Vaše poslovanje u 2027. godini (za deset godina). Opišite svoj položaj na tržištu. Koji će faktori
uticati najviše na poslovanje poljoprivredih proizvođača?
Koje ćete strategije primenjivati kako bi poslovali uspešno?
Koja bi strategija dovela do najboljih rezultata u ekonomskom smislu? Da li razmišljate i na koji način o
efektima na socijalno i životno okruženje?
Kraj.
157
9 Annex 2 - Quantitative research guidelines (in Serbian)
UPUTSTVO ZA SPROVODJENJE UPITNIKA
Poslednji odeljak upitnika (Odeljak E) se popunjava na kraju. Za identifikaciju upitnika se koristi broj RS-SZS-
1 do 100 (odnosno do poslednjeg broja upitnika koji je popunjen). Ukupno ima 100 odstampanih upitnika
podeljenih u 10 delova buduci da na deset mesta po 10 upitnika treba podeliti i sačekati da proizvođači
popune iste. Nije dozvoljen razgovor sa više lica iz jednog gazdinstva.
Ispitanik treba da bude vlasnik ili menadžer gazdinstva. Po pravilu, budući da su u pitanju privatna lica, u
našem slučaju ispitanici će biti vlasnici gazdinstava. Ukoliko je ispitanik menadžer neke veće poljoprivredne
organizacije, onda je reč o pravnom licu (kompaniji).
Ispitivanje se vrši za ekonomsku 2016/17. godinu koja je završena, odnosno o kojoj poljoprivrednik ima
kompletne informacije.
Na većinu pitanja ispitanik odgovara izborom jedne od ponudjenih alternativa, tj. davanjem odgovora
DA/NE, ili izražavanjem stepena slaganja sa iznetim tvrdnjama od 1-5. U nekoliko pitanja se traži navod
tačnog broja, kao što su pitanja vezana za veličinu poljoprivrednog poseda, sertifikovane površine pod
organskom proizvodnjom (ukoliko ih poljoprivrednih ima), procenat prodaje preko različitih kanala
marketinga (vodite računa da ukupan zbir treba da bude 100 i da se odnosi na prisutnu prodaju kroz
kolektivne kanale prodaje ili individualne).
Kod nekih pitanja je jasno naznačeno da li se vrši preskakanje ukoliko je negativan odgovor dobijen na
osnovno (početno pitanje). Pratite uputstva. Takva su pitanja, na primer, QB.17, QB.23 i QB.29.
Kod pitanja QC.1 ubacite pretežni način prodaje (preko kog kanala marketinga – kolektivnog ili
individualnog) na osnovu prethodno datog odgovora u pitanju QB.8 i QB.16. Ovim pitanjem fokusirate
ispitanika na dalja pitanja i tražite potvrdu da mislite na isti kanal prodaje, jer se dalje ispituju forme
ugovora i institucionalnog povezivanja u agraru.
Trudite se da odgovor ne znam bude što manje zastupljen. Ukoliko primetite da postoje problemi u
realizaciji upitnika i imate dodatna pitanja, slobodno pozovite na dati broj telefona radi daljih razjašnjenja.
Od Vas se očekuje da kompletirate upitnike zaključno sa 7. januarom 2018. godine i da iste predate
najkasnije u periodu izmedju 8-10. januara 2018. godine. Nije potrebno da unosite upitnike u bazu.
Unapred hvala na saradnji,
Ekonomski fakultet Beograd
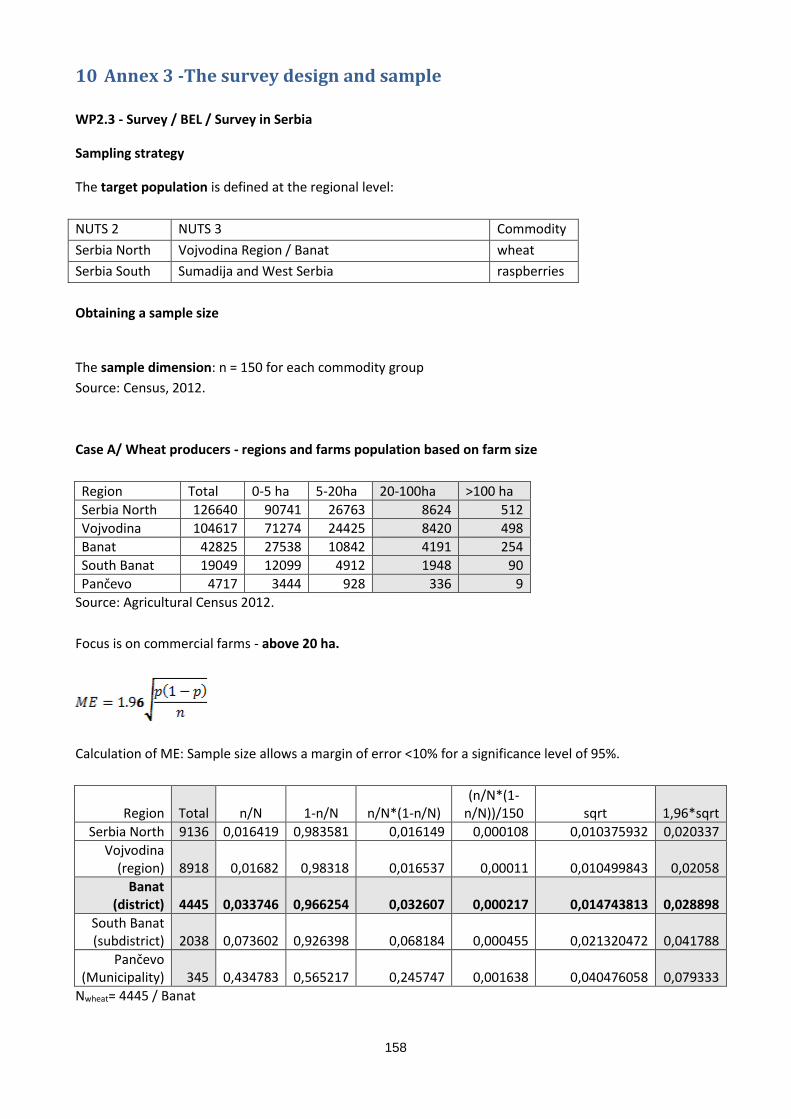
158
10 Annex 3 -The survey design and sample
WP2.3 - Survey / BEL / Survey in Serbia
Sampling strategy
The target population is defined at the regional level:
NUTS 2 NUTS 3 Commodity
Serbia North Vojvodina Region / Banat wheat
Serbia South Sumadija and West Serbia raspberries
Obtaining a sample size
The sample dimension: n = 150 for each commodity group
Source: Census, 2012.
Case A/ Wheat producers - regions and farms population based on farm size
Region Total 0-5 ha 5-20ha 20-100ha >100 ha
Serbia North 126640 90741 26763 8624 512
Vojvodina 104617 71274 24425 8420 498
Banat 42825 27538 10842 4191 254
South Banat 19049 12099 4912 1948 90
Pančevo 4717 3444 928 336 9
Source: Agricultural Census 2012.
Focus is on commercial farms - above 20 ha.
Calculation of ME: Sample size allows a margin of error <10% for a significance level of 95%.
Region Total n/N 1-n/N n/N*(1-n/N) (n/N*(1-
n/N))/150 sqrt 1,96*sqrt
Serbia North 9136 0,016419 0,983581 0,016149 0,000108 0,010375932 0,020337
Vojvodina (region) 8918 0,01682 0,98318 0,016537 0,00011 0,010499843 0,02058
Banat (district) 4445 0,033746 0,966254 0,032607 0,000217 0,014743813 0,028898
South Banat (subdistrict) 2038 0,073602 0,926398 0,068184 0,000455 0,021320472 0,041788
Pančevo (Municipality) 345 0,434783 0,565217 0,245747 0,001638 0,040476058 0,079333
Nwheat= 4445 / Banat
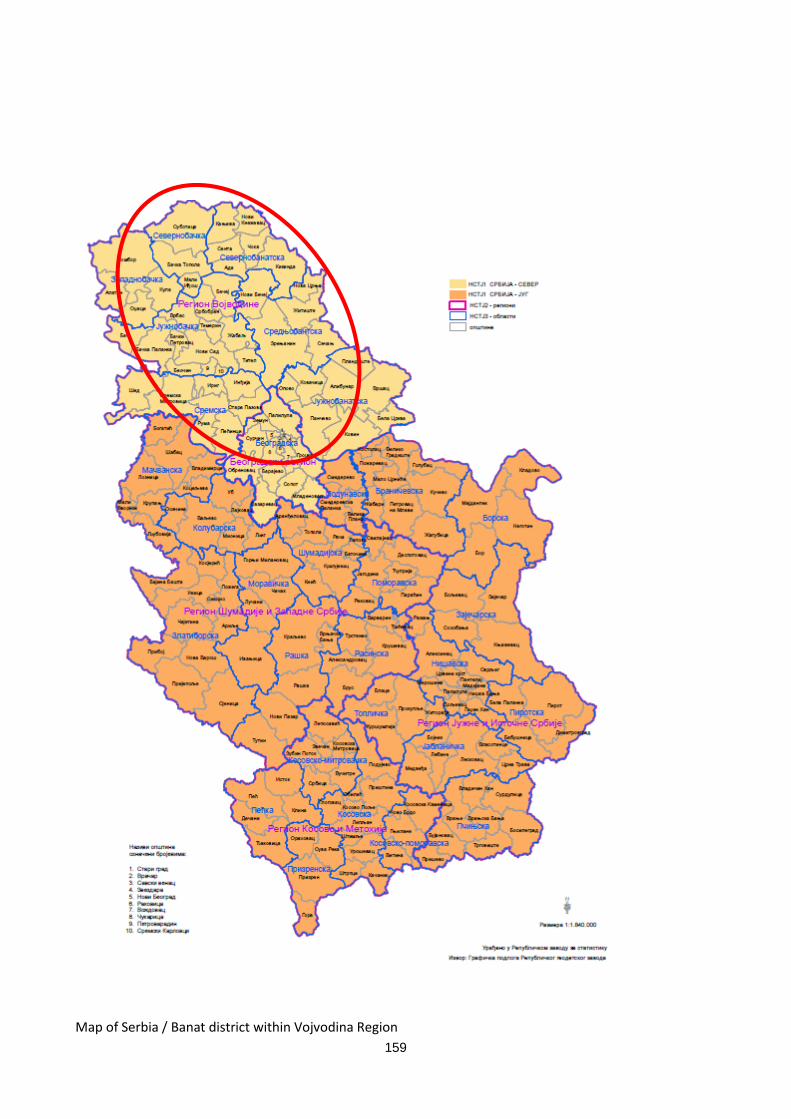
159
Map of Serbia / Banat district within Vojvodina Region
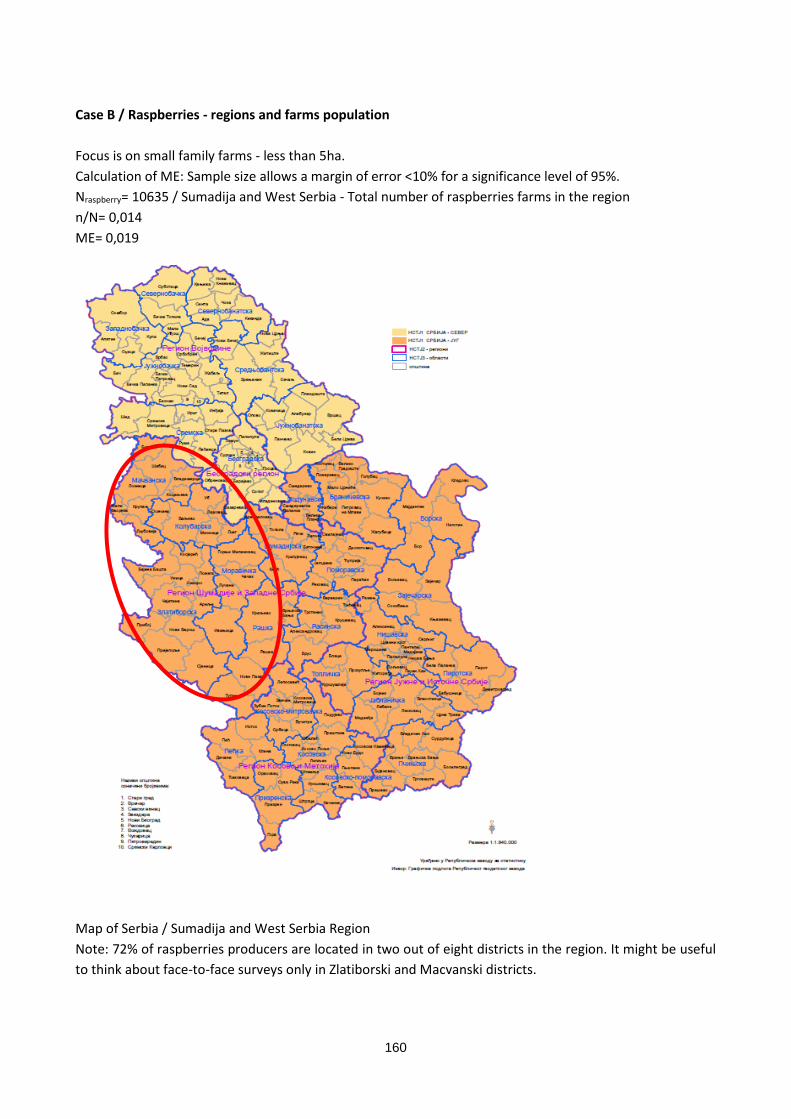
160
Case B / Raspberries - regions and farms population
Focus is on small family farms - less than 5ha.
Calculation of ME: Sample size allows a margin of error <10% for a significance level of 95%.
Nraspberry= 10635 / Sumadija and West Serbia - Total number of raspberries farms in the region
n/N= 0,014
ME= 0,019
Map of Serbia / Sumadija and West Serbia Region
Note: 72% of raspberries producers are located in two out of eight districts in the region. It might be useful
to think about face-to-face surveys only in Zlatiborski and Macvanski districts.
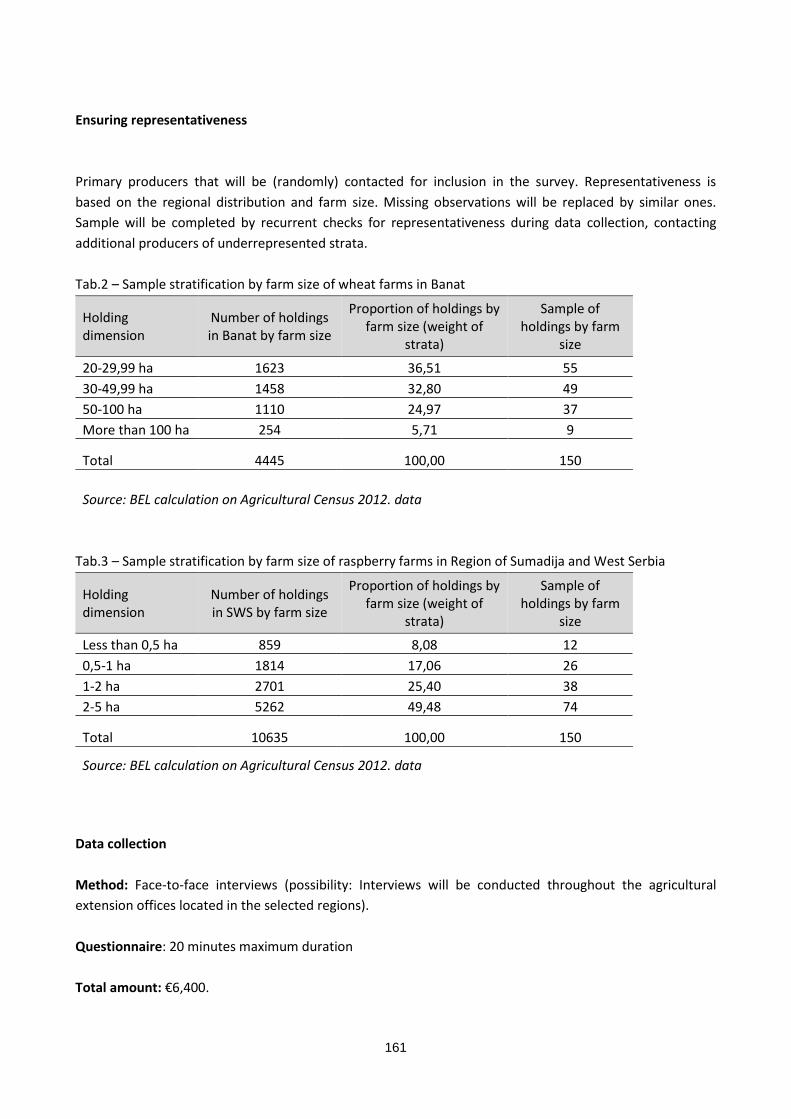
161
Ensuring representativeness
Primary producers that will be (randomly) contacted for inclusion in the survey. Representativeness is
based on the regional distribution and farm size. Missing observations will be replaced by similar ones.
Sample will be completed by recurrent checks for representativeness during data collection, contacting
additional producers of underrepresented strata.
Tab.2 – Sample stratification by farm size of wheat farms in Banat
Holding dimension
Number of holdings in Banat by farm size
Proportion of holdings by farm size (weight of
strata)
Sample of holdings by farm
size
20-29,99 ha 1623 36,51 55
30-49,99 ha 1458 32,80 49
50-100 ha 1110 24,97 37
More than 100 ha 254 5,71 9
Total 4445 100,00 150
Source: BEL calculation on Agricultural Census 2012. data
Tab.3 – Sample stratification by farm size of raspberry farms in Region of Sumadija and West Serbia
Holding dimension
Number of holdings in SWS by farm size
Proportion of holdings by farm size (weight of
strata)
Sample of holdings by farm
size
Less than 0,5 ha 859 8,08 12
0,5-1 ha 1814 17,06 26
1-2 ha 2701 25,40 38
2-5 ha 5262 49,48 74
Total 10635 100,00 150
Source: BEL calculation on Agricultural Census 2012. data
Data collection
Method: Face-to-face interviews (possibility: Interviews will be conducted throughout the agricultural
extension offices located in the selected regions).
Questionnaire: 20 minutes maximum duration
Total amount: €6,400.
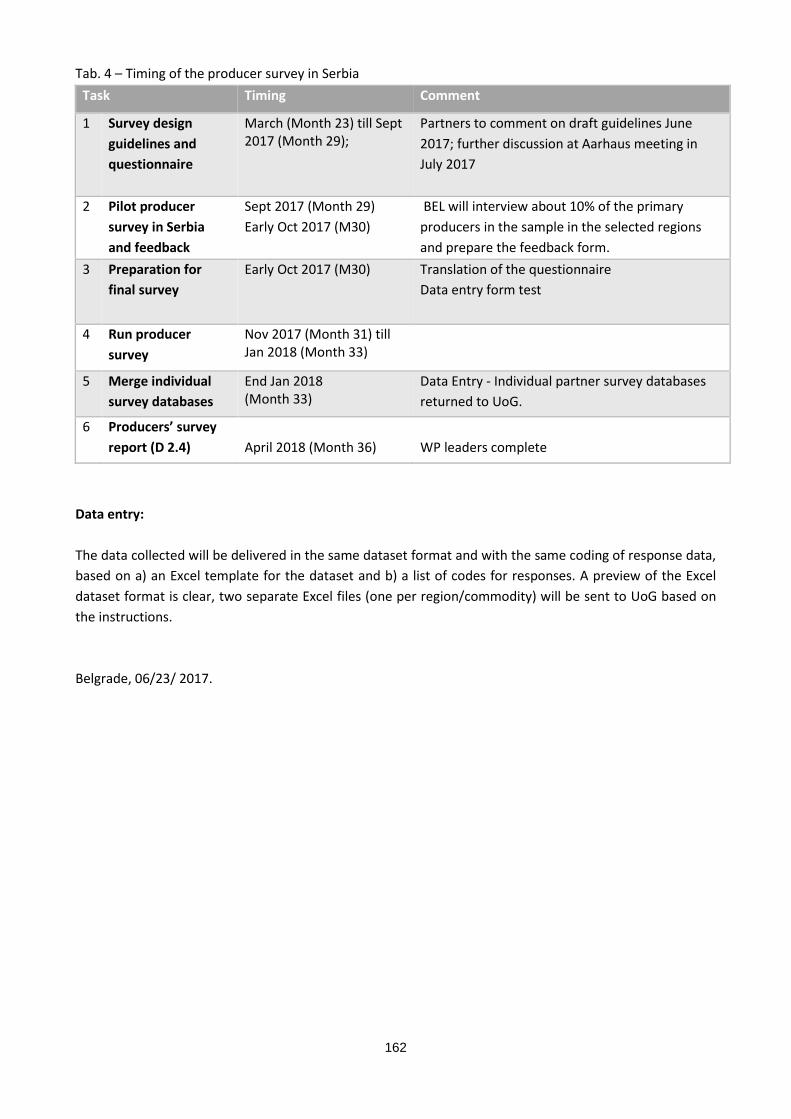
162
Tab. 4 – Timing of the producer survey in Serbia
Task Timing Comment
1 Survey design
guidelines and
questionnaire
March (Month 23) till Sept 2017 (Month 29);
Partners to comment on draft guidelines June
2017; further discussion at Aarhaus meeting in
July 2017
2 Pilot producer
survey in Serbia
and feedback
Sept 2017 (Month 29)
Early Oct 2017 (M30)
BEL will interview about 10% of the primary
producers in the sample in the selected regions
and prepare the feedback form.
3 Preparation for
final survey
Early Oct 2017 (M30) Translation of the questionnaire
Data entry form test
4 Run producer
survey
Nov 2017 (Month 31) till Jan 2018 (Month 33)
5 Merge individual
survey databases
End Jan 2018 (Month 33)
Data Entry - Individual partner survey databases
returned to UoG.
6 Producers’ survey
report (D 2.4)
April 2018 (Month 36)
WP leaders complete
Data entry:
The data collected will be delivered in the same dataset format and with the same coding of response data,
based on a) an Excel template for the dataset and b) a list of codes for responses. A preview of the Excel
dataset format is clear, two separate Excel files (one per region/commodity) will be sent to UoG based on
the instructions.
Belgrade, 06/23/ 2017.
163
11 Annex 4 -The CSP inventory - the main inputs
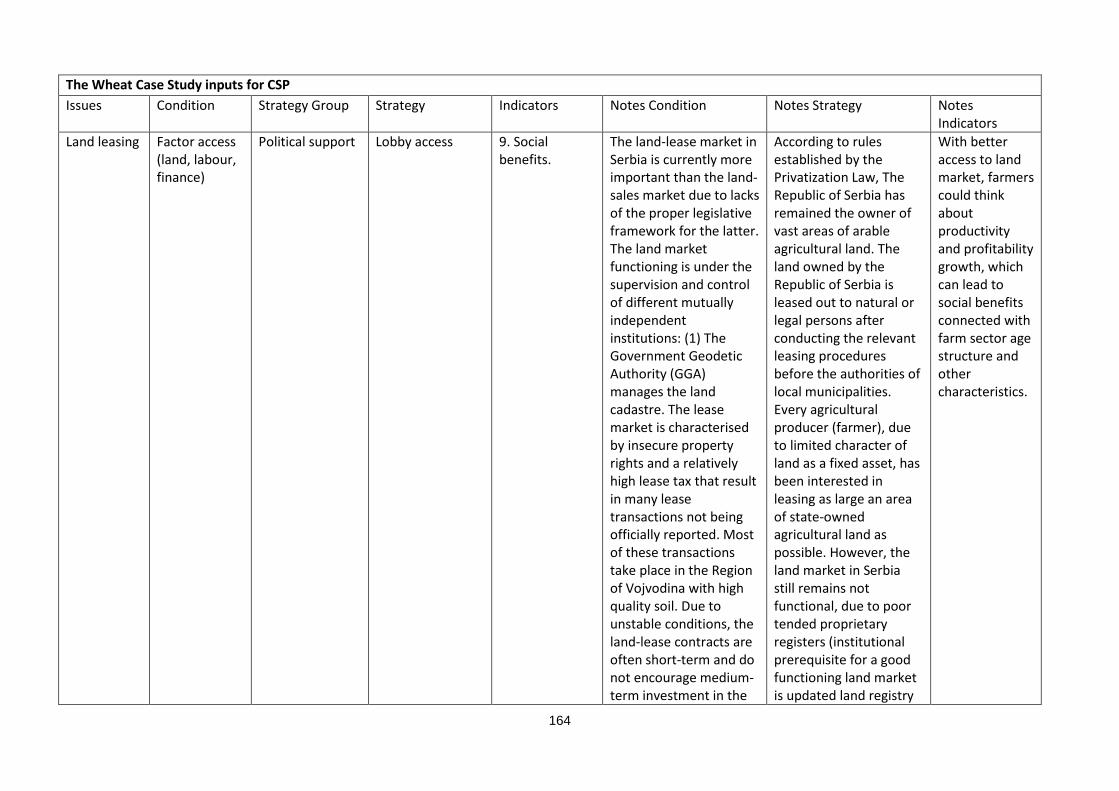
164
The Wheat Case Study inputs for CSP
Issues Condition Strategy Group Strategy Indicators Notes Condition Notes Strategy Notes Indicators
Land leasing Factor access (land, labour, finance)
Political support Lobby access 9. Social benefits.
The land-lease market in Serbia is currently more important than the land-sales market due to lacks of the proper legislative framework for the latter. The land market functioning is under the supervision and control of different mutually independent institutions: (1) The Government Geodetic Authority (GGA) manages the land cadastre. The lease market is characterised by insecure property rights and a relatively high lease tax that result in many lease transactions not being officially reported. Most of these transactions take place in the Region of Vojvodina with high quality soil. Due to unstable conditions, the land-lease contracts are often short-term and do not encourage medium-term investment in the
According to rules established by the Privatization Law, The Republic of Serbia has remained the owner of vast areas of arable agricultural land. The land owned by the Republic of Serbia is leased out to natural or legal persons after conducting the relevant leasing procedures before the authorities of local municipalities. Every agricultural producer (farmer), due to limited character of land as a fixed asset, has been interested in leasing as large an area of state-owned agricultural land as possible. However, the land market in Serbia still remains not functional, due to poor tended proprietary registers (institutional prerequisite for a good functioning land market is updated land registry
With better access to land market, farmers could think about productivity and profitability growth, which can lead to social benefits connected with farm sector age structure and other characteristics.
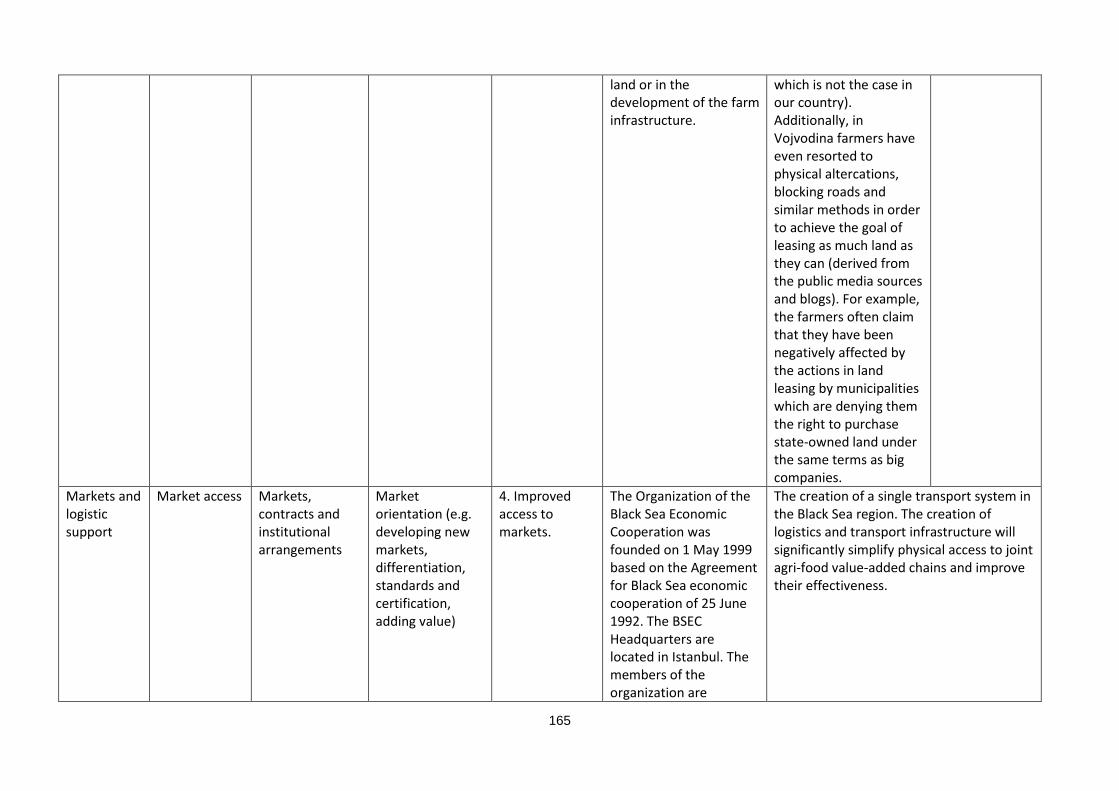
165
land or in the development of the farm infrastructure.
which is not the case in our country). Additionally, in Vojvodina farmers have even resorted to physical altercations, blocking roads and similar methods in order to achieve the goal of leasing as much land as they can (derived from the public media sources and blogs). For example, the farmers often claim that they have been negatively affected by the actions in land leasing by municipalities which are denying them the right to purchase state-owned land under the same terms as big companies.
Markets and logistic support
Market access Markets, contracts and institutional arrangements
Market orientation (e.g. developing new markets, differentiation, standards and certification, adding value)
4. Improved access to markets.
The Organization of the Black Sea Economic Cooperation was founded on 1 May 1999 based on the Agreement for Black Sea economic cooperation of 25 June 1992. The BSEC Headquarters are located in Istanbul. The members of the organization are
The creation of a single transport system in the Black Sea region. The creation of logistics and transport infrastructure will significantly simplify physical access to joint agri-food value-added chains and improve their effectiveness.
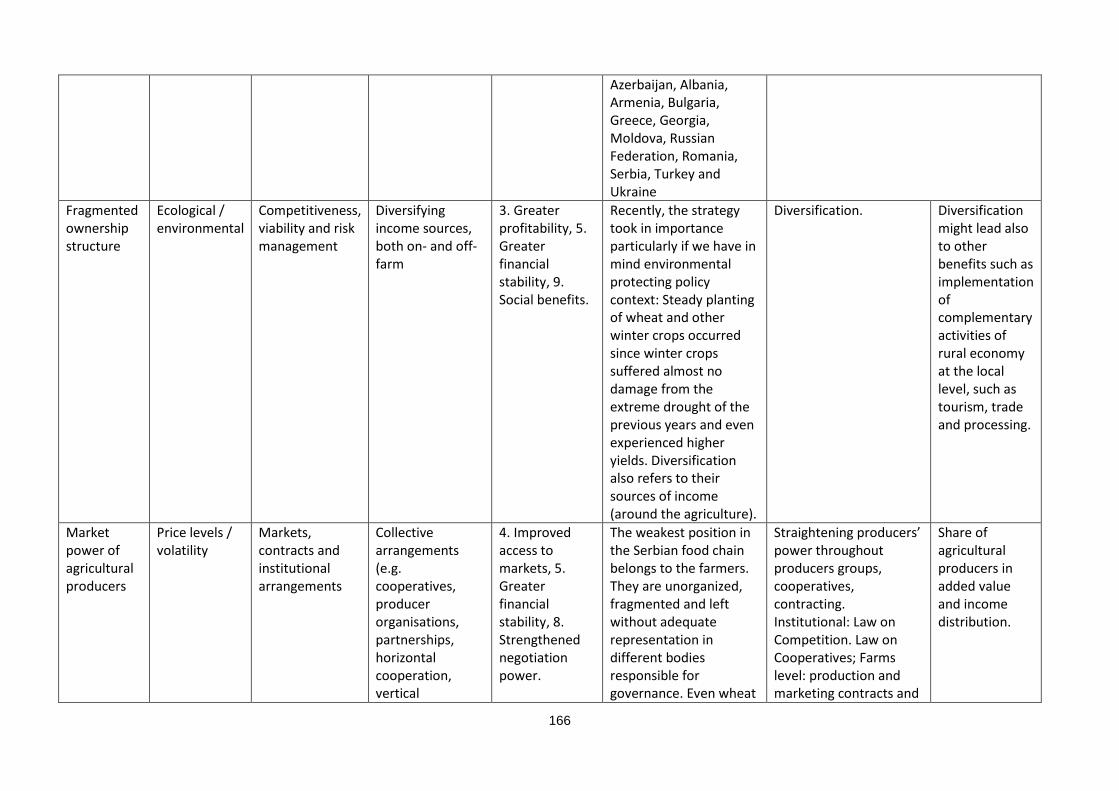
166
Azerbaijan, Albania, Armenia, Bulgaria, Greece, Georgia, Moldova, Russian Federation, Romania, Serbia, Turkey and Ukraine
Fragmented ownership structure
Ecological / environmental
Competitiveness, viability and risk management
Diversifying income sources, both on- and off-farm
3. Greater profitability, 5. Greater financial stability, 9. Social benefits.
Recently, the strategy took in importance particularly if we have in mind environmental protecting policy context: Steady planting of wheat and other winter crops occurred since winter crops suffered almost no damage from the extreme drought of the previous years and even experienced higher yields. Diversification also refers to their sources of income (around the agriculture).
Diversification. Diversification might lead also to other benefits such as implementation of complementary activities of rural economy at the local level, such as tourism, trade and processing.
Market power of agricultural producers
Price levels / volatility
Markets, contracts and institutional arrangements
Collective arrangements (e.g. cooperatives, producer organisations, partnerships, horizontal cooperation, vertical
4. Improved access to markets, 5. Greater financial stability, 8. Strengthened negotiation power.
The weakest position in the Serbian food chain belongs to the farmers. They are unorganized, fragmented and left without adequate representation in different bodies responsible for governance. Even wheat
Straightening producers’ power throughout producers groups, cooperatives, contracting. Institutional: Law on Competition. Law on Cooperatives; Farms level: production and marketing contracts and
Share of agricultural producers in added value and income distribution.
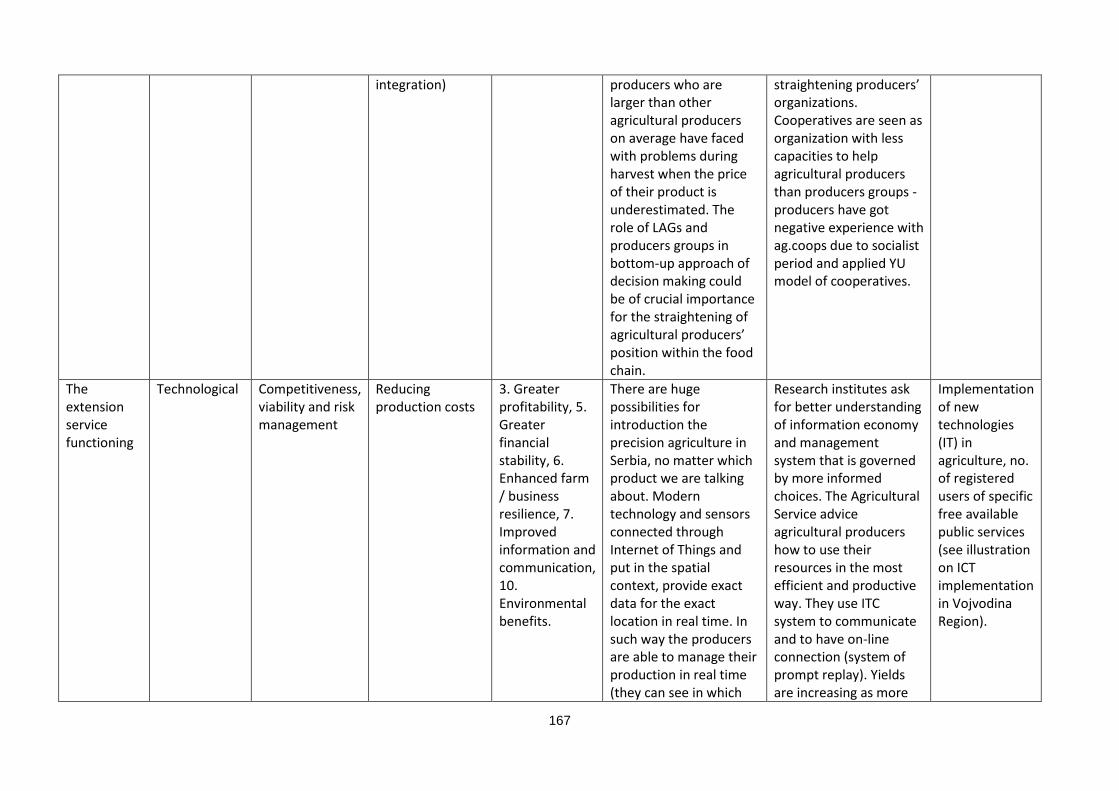
167
integration) producers who are larger than other agricultural producers on average have faced with problems during harvest when the price of their product is underestimated. The role of LAGs and producers groups in bottom-up approach of decision making could be of crucial importance for the straightening of agricultural producers’ position within the food chain.
straightening producers’ organizations. Cooperatives are seen as organization with less capacities to help agricultural producers than producers groups - producers have got negative experience with ag.coops due to socialist period and applied YU model of cooperatives.
The extension service functioning
Technological Competitiveness, viability and risk management
Reducing production costs
3. Greater profitability, 5. Greater financial stability, 6. Enhanced farm / business resilience, 7. Improved information and communication, 10. Environmental benefits.
There are huge possibilities for introduction the precision agriculture in Serbia, no matter which product we are talking about. Modern technology and sensors connected through Internet of Things and put in the spatial context, provide exact data for the exact location in real time. In such way the producers are able to manage their production in real time (they can see in which
Research institutes ask for better understanding of information economy and management system that is governed by more informed choices. The Agricultural Service advice agricultural producers how to use their resources in the most efficient and productive way. They use ITC system to communicate and to have on-line connection (system of prompt replay). Yields are increasing as more
Implementation of new technologies (IT) in agriculture, no. of registered users of specific free available public services (see illustration on ICT implementation in Vojvodina Region).
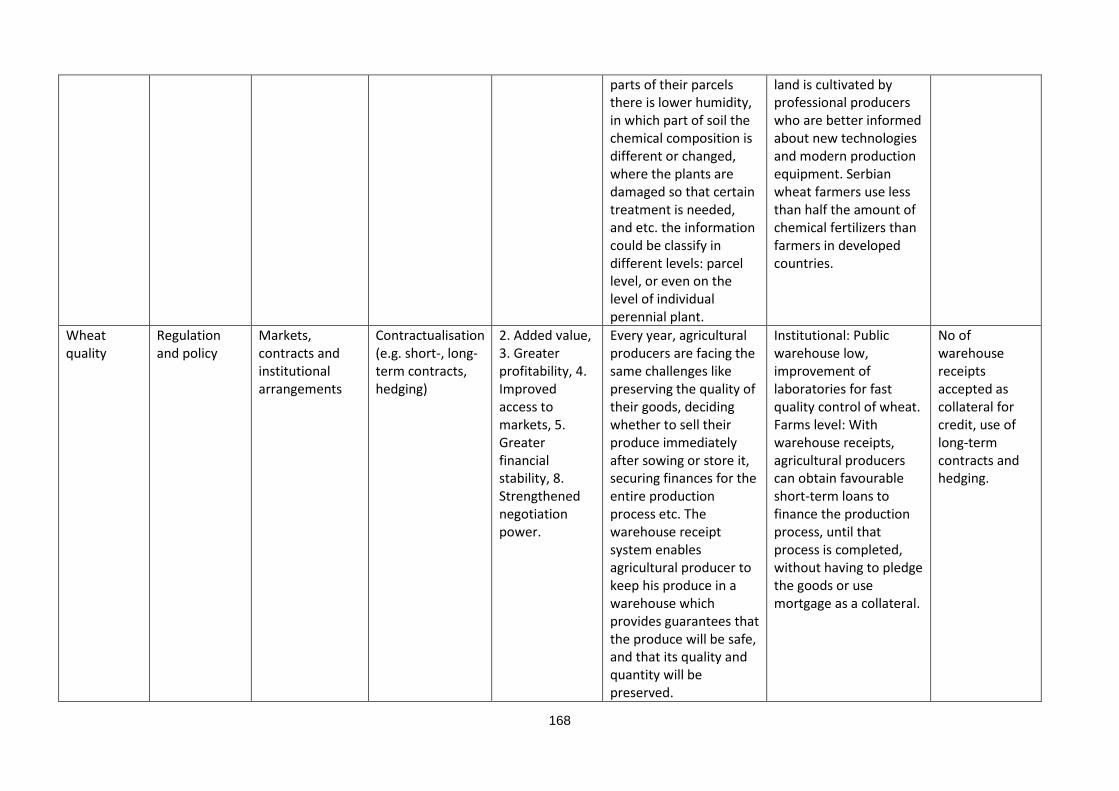
168
parts of their parcels there is lower humidity, in which part of soil the chemical composition is different or changed, where the plants are damaged so that certain treatment is needed, and etc. the information could be classify in different levels: parcel level, or even on the level of individual perennial plant.
land is cultivated by professional producers who are better informed about new technologies and modern production equipment. Serbian wheat farmers use less than half the amount of chemical fertilizers than farmers in developed countries.
Wheat quality
Regulation and policy
Markets, contracts and institutional arrangements
Contractualisation (e.g. short-, long-term contracts, hedging)
2. Added value, 3. Greater profitability, 4. Improved access to markets, 5. Greater financial stability, 8. Strengthened negotiation power.
Every year, agricultural producers are facing the same challenges like preserving the quality of their goods, deciding whether to sell their produce immediately after sowing or store it, securing finances for the entire production process etc. The warehouse receipt system enables agricultural producer to keep his produce in a warehouse which provides guarantees that the produce will be safe, and that its quality and quantity will be preserved.
Institutional: Public warehouse low, improvement of laboratories for fast quality control of wheat. Farms level: With warehouse receipts, agricultural producers can obtain favourable short-term loans to finance the production process, until that process is completed, without having to pledge the goods or use mortgage as a collateral.
No of warehouse receipts accepted as collateral for credit, use of long-term contracts and hedging.
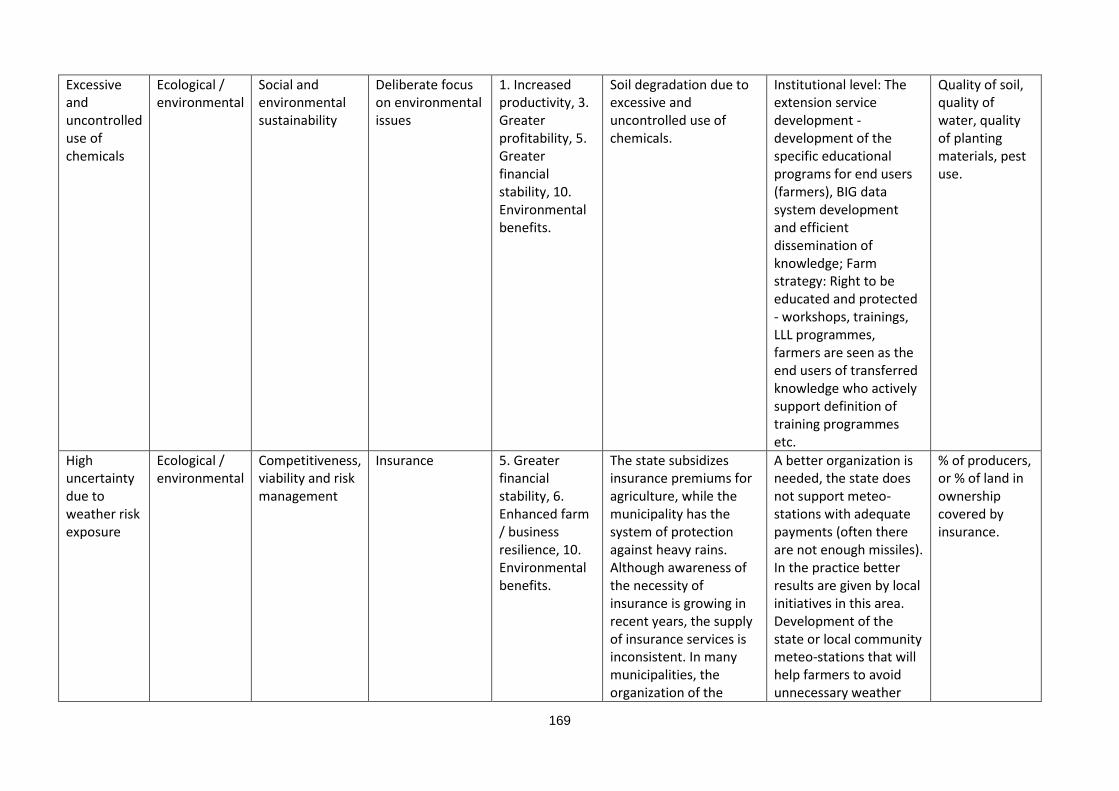
169
Excessive and uncontrolled use of chemicals
Ecological / environmental
Social and environmental sustainability
Deliberate focus on environmental issues
1. Increased productivity, 3. Greater profitability, 5. Greater financial stability, 10. Environmental benefits.
Soil degradation due to excessive and uncontrolled use of chemicals.
Institutional level: The extension service development - development of the specific educational programs for end users (farmers), BIG data system development and efficient dissemination of knowledge; Farm strategy: Right to be educated and protected - workshops, trainings, LLL programmes, farmers are seen as the end users of transferred knowledge who actively support definition of training programmes etc.
Quality of soil, quality of water, quality of planting materials, pest use.
High uncertainty due to weather risk exposure
Ecological / environmental
Competitiveness, viability and risk management
Insurance 5. Greater financial stability, 6. Enhanced farm / business resilience, 10. Environmental benefits.
The state subsidizes insurance premiums for agriculture, while the municipality has the system of protection against heavy rains. Although awareness of the necessity of insurance is growing in recent years, the supply of insurance services is inconsistent. In many municipalities, the organization of the
A better organization is needed, the state does not support meteo-stations with adequate payments (often there are not enough missiles). In the practice better results are given by local initiatives in this area. Development of the state or local community meteo-stations that will help farmers to avoid unnecessary weather
% of producers, or % of land in ownership covered by insurance.
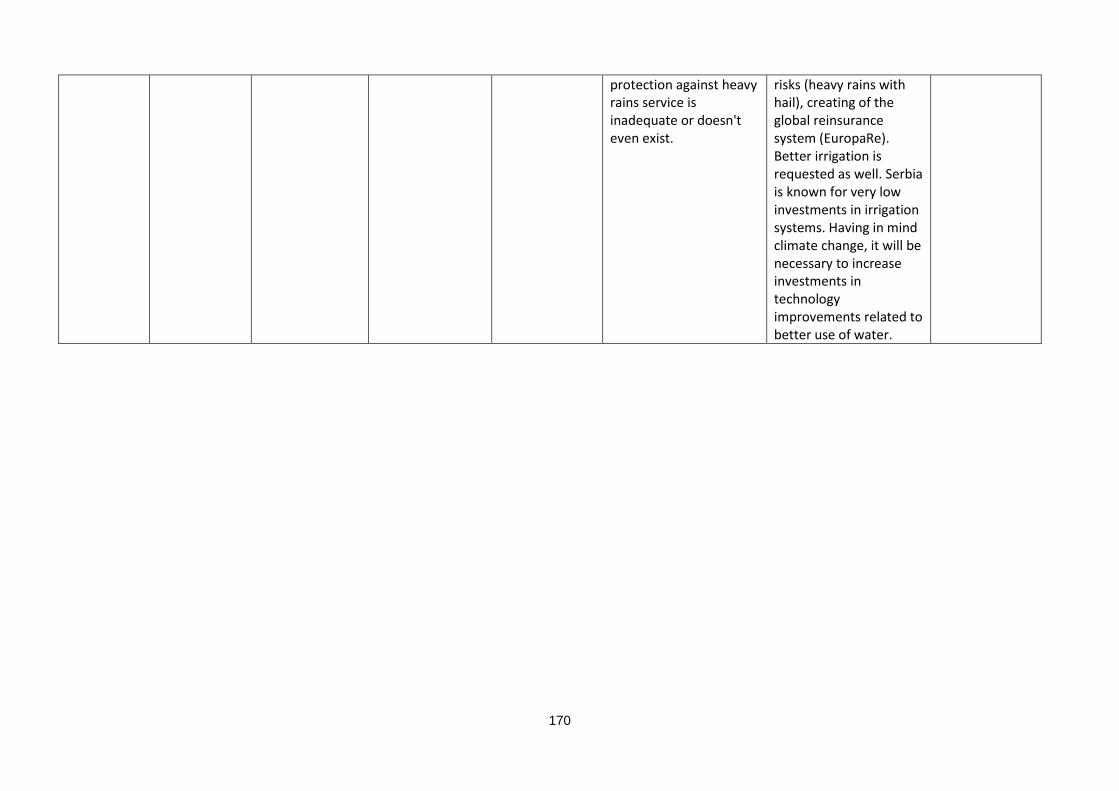
170
protection against heavy rains service is inadequate or doesn't even exist.
risks (heavy rains with hail), creating of the global reinsurance system (EuropaRe). Better irrigation is requested as well. Serbia is known for very low investments in irrigation systems. Having in mind climate change, it will be necessary to increase investments in technology improvements related to better use of water.
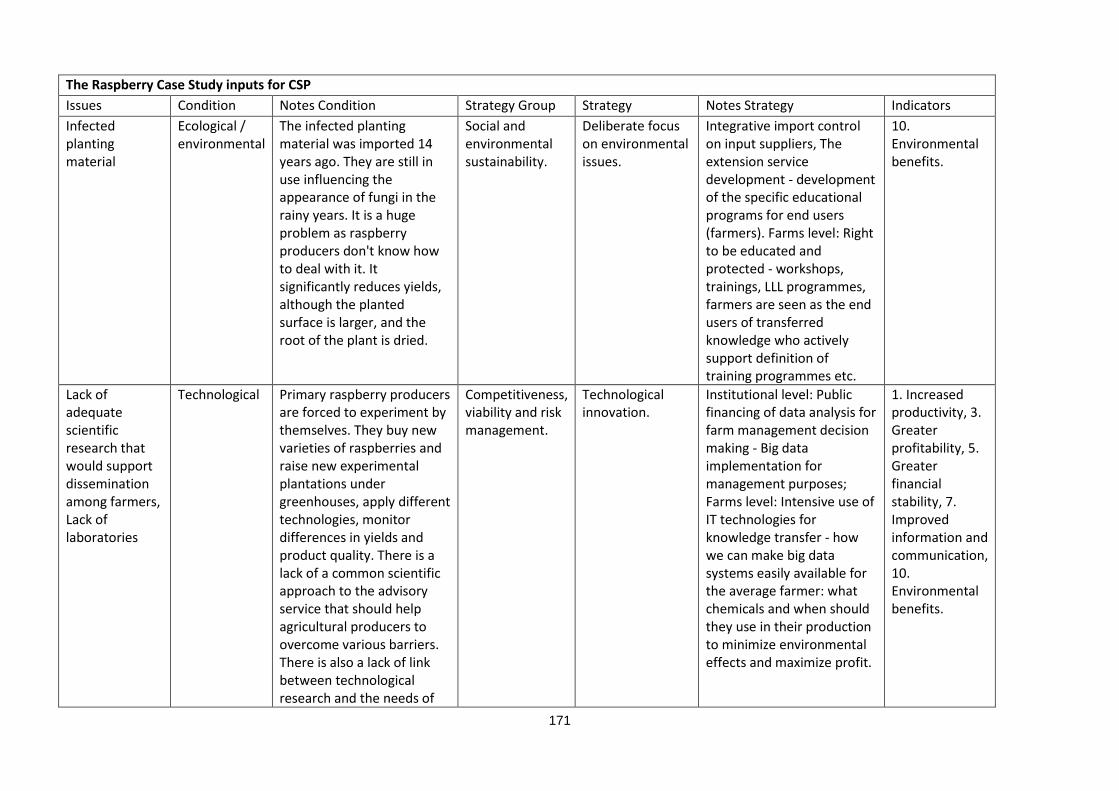
171
The Raspberry Case Study inputs for CSP
Issues Condition Notes Condition Strategy Group Strategy Notes Strategy Indicators
Infected planting material
Ecological / environmental
The infected planting material was imported 14 years ago. They are still in use influencing the appearance of fungi in the rainy years. It is a huge problem as raspberry producers don't know how to deal with it. It significantly reduces yields, although the planted surface is larger, and the root of the plant is dried.
Social and environmental sustainability.
Deliberate focus on environmental issues.
Integrative import control on input suppliers, The extension service development - development of the specific educational programs for end users (farmers). Farms level: Right to be educated and protected - workshops, trainings, LLL programmes, farmers are seen as the end users of transferred knowledge who actively support definition of training programmes etc.
10. Environmental benefits.
Lack of adequate scientific research that would support dissemination among farmers, Lack of laboratories
Technological Primary raspberry producers are forced to experiment by themselves. They buy new varieties of raspberries and raise new experimental plantations under greenhouses, apply different technologies, monitor differences in yields and product quality. There is a lack of a common scientific approach to the advisory service that should help agricultural producers to overcome various barriers. There is also a lack of link between technological research and the needs of
Competitiveness, viability and risk management.
Technological innovation.
Institutional level: Public financing of data analysis for farm management decision making - Big data implementation for management purposes; Farms level: Intensive use of IT technologies for knowledge transfer - how we can make big data systems easily available for the average farmer: what chemicals and when should they use in their production to minimize environmental effects and maximize profit.
1. Increased productivity, 3. Greater profitability, 5. Greater financial stability, 7. Improved information and communication, 10. Environmental benefits.
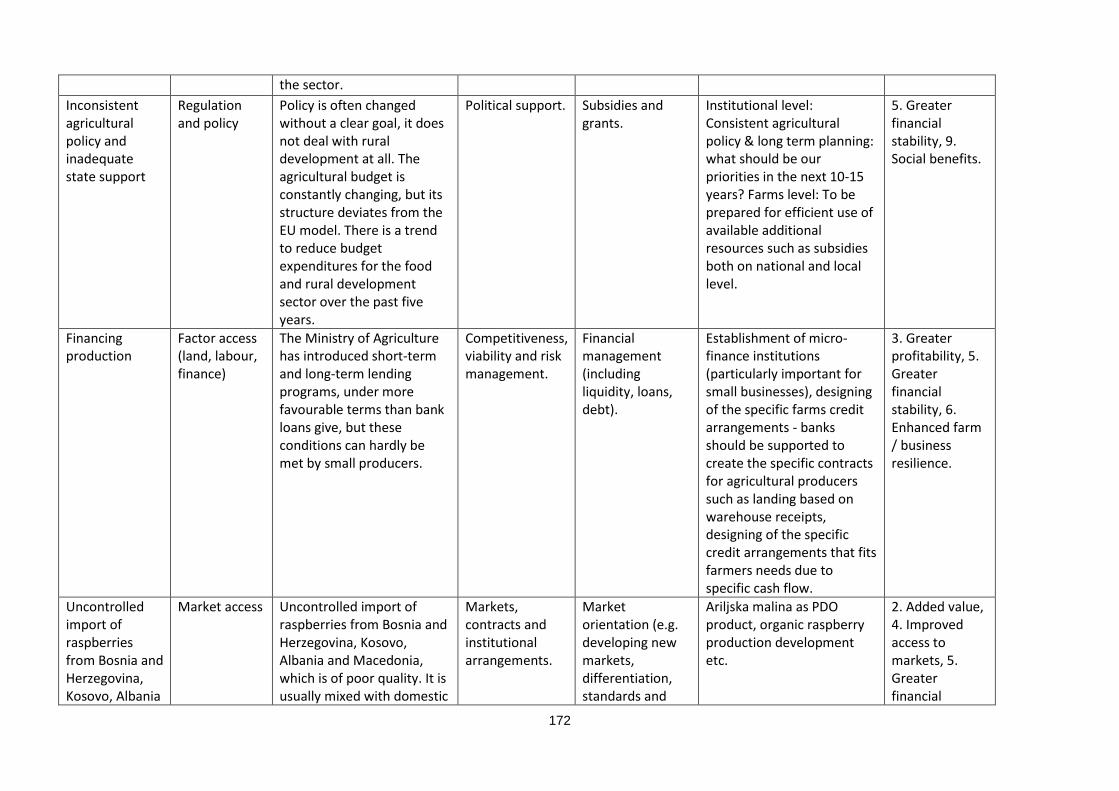
172
the sector.
Inconsistent agricultural policy and inadequate state support
Regulation and policy
Policy is often changed without a clear goal, it does not deal with rural development at all. The agricultural budget is constantly changing, but its structure deviates from the EU model. There is a trend to reduce budget expenditures for the food and rural development sector over the past five years.
Political support. Subsidies and grants.
Institutional level: Consistent agricultural policy & long term planning: what should be our priorities in the next 10-15 years? Farms level: To be prepared for efficient use of available additional resources such as subsidies both on national and local level.
5. Greater financial stability, 9. Social benefits.
Financing production
Factor access (land, labour, finance)
The Ministry of Agriculture has introduced short-term and long-term lending programs, under more favourable terms than bank loans give, but these conditions can hardly be met by small producers.
Competitiveness, viability and risk management.
Financial management (including liquidity, loans, debt).
Establishment of micro-finance institutions (particularly important for small businesses), designing of the specific farms credit arrangements - banks should be supported to create the specific contracts for agricultural producers such as landing based on warehouse receipts, designing of the specific credit arrangements that fits farmers needs due to specific cash flow.
3. Greater profitability, 5. Greater financial stability, 6. Enhanced farm / business resilience.
Uncontrolled import of raspberries from Bosnia and Herzegovina, Kosovo, Albania
Market access Uncontrolled import of raspberries from Bosnia and Herzegovina, Kosovo, Albania and Macedonia, which is of poor quality. It is usually mixed with domestic
Markets, contracts and institutional arrangements.
Market orientation (e.g. developing new markets, differentiation, standards and
Ariljska malina as PDO product, organic raspberry production development etc.
2. Added value, 4. Improved access to markets, 5. Greater financial
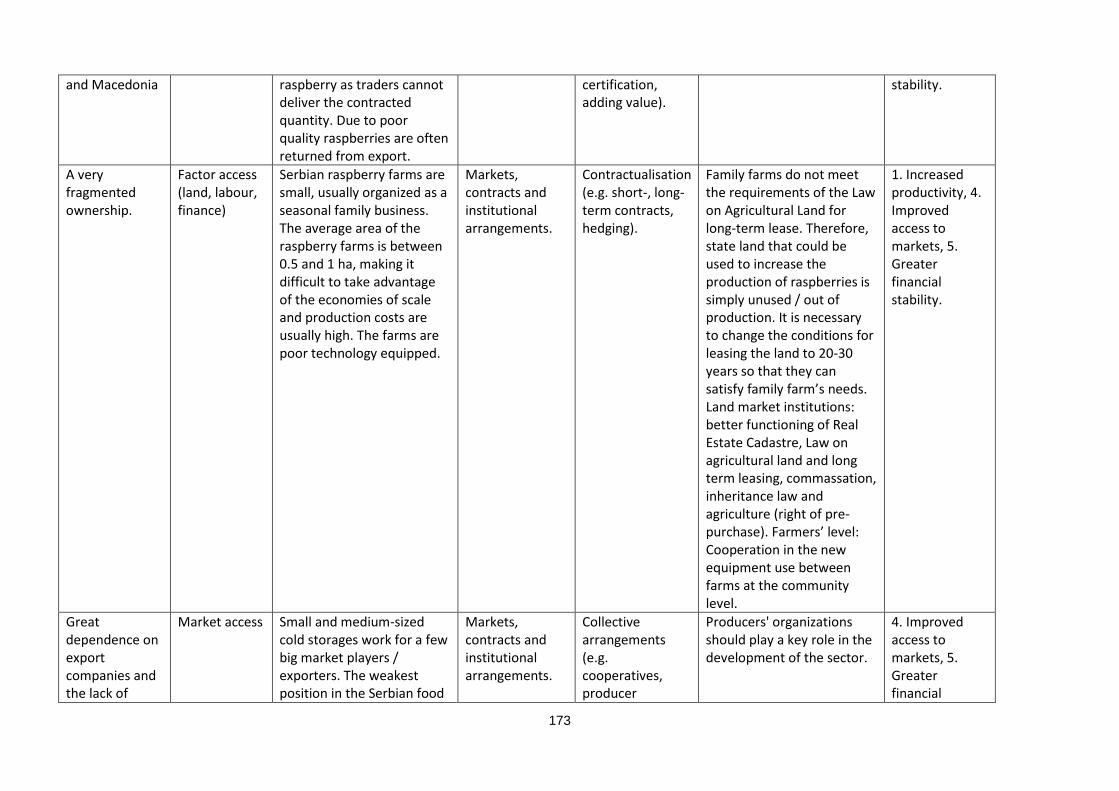
173
and Macedonia raspberry as traders cannot deliver the contracted quantity. Due to poor quality raspberries are often returned from export.
certification, adding value).
stability.
A very fragmented ownership.
Factor access (land, labour, finance)
Serbian raspberry farms are small, usually organized as a seasonal family business. The average area of the raspberry farms is between 0.5 and 1 ha, making it difficult to take advantage of the economies of scale and production costs are usually high. The farms are poor technology equipped.
Markets, contracts and institutional arrangements.
Contractualisation (e.g. short-, long-term contracts, hedging).
Family farms do not meet the requirements of the Law on Agricultural Land for long-term lease. Therefore, state land that could be used to increase the production of raspberries is simply unused / out of production. It is necessary to change the conditions for leasing the land to 20-30 years so that they can satisfy family farm’s needs. Land market institutions: better functioning of Real Estate Cadastre, Law on agricultural land and long term leasing, commassation, inheritance law and agriculture (right of pre-purchase). Farmers’ level: Cooperation in the new equipment use between farms at the community level.
1. Increased productivity, 4. Improved access to markets, 5. Greater financial stability.
Great dependence on export companies and the lack of
Market access Small and medium-sized cold storages work for a few big market players / exporters. The weakest position in the Serbian food
Markets, contracts and institutional arrangements.
Collective arrangements (e.g. cooperatives, producer
Producers' organizations should play a key role in the development of the sector.
4. Improved access to markets, 5. Greater financial
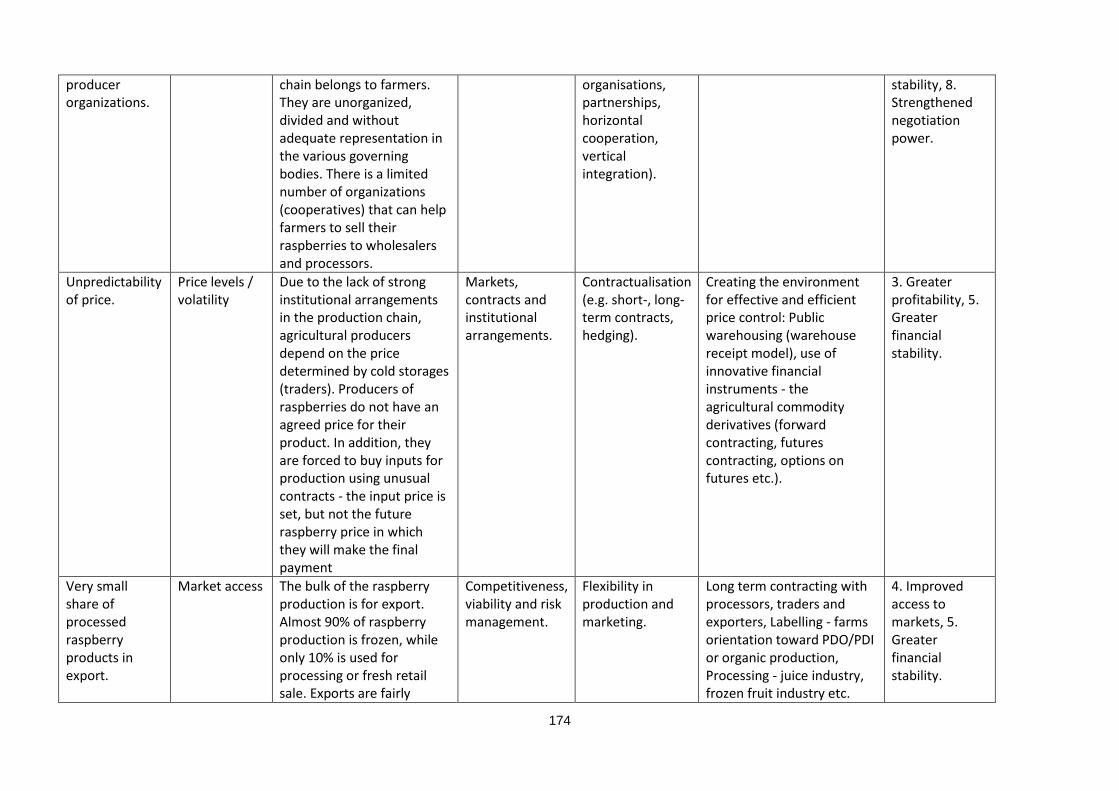
174
producer organizations.
chain belongs to farmers. They are unorganized, divided and without adequate representation in the various governing bodies. There is a limited number of organizations (cooperatives) that can help farmers to sell their raspberries to wholesalers and processors.
organisations, partnerships, horizontal cooperation, vertical integration).
stability, 8. Strengthened negotiation power.
Unpredictability of price.
Price levels / volatility
Due to the lack of strong institutional arrangements in the production chain, agricultural producers depend on the price determined by cold storages (traders). Producers of raspberries do not have an agreed price for their product. In addition, they are forced to buy inputs for production using unusual contracts - the input price is set, but not the future raspberry price in which they will make the final payment
Markets, contracts and institutional arrangements.
Contractualisation (e.g. short-, long-term contracts, hedging).
Creating the environment for effective and efficient price control: Public warehousing (warehouse receipt model), use of innovative financial instruments - the agricultural commodity derivatives (forward contracting, futures contracting, options on futures etc.).
3. Greater profitability, 5. Greater financial stability.
Very small share of processed raspberry products in export.
Market access The bulk of the raspberry production is for export. Almost 90% of raspberry production is frozen, while only 10% is used for processing or fresh retail sale. Exports are fairly
Competitiveness, viability and risk management.
Flexibility in production and marketing.
Long term contracting with processors, traders and exporters, Labelling - farms orientation toward PDO/PDI or organic production, Processing - juice industry, frozen fruit industry etc.
4. Improved access to markets, 5. Greater financial stability.
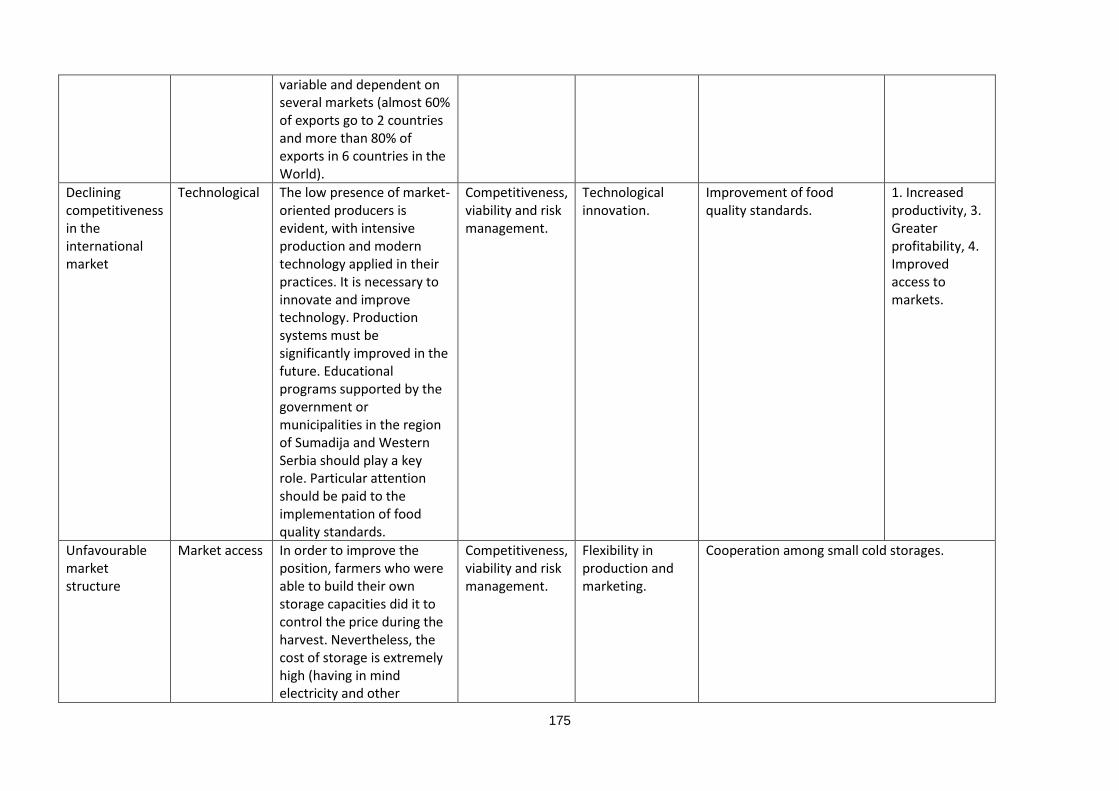
175
variable and dependent on several markets (almost 60% of exports go to 2 countries and more than 80% of exports in 6 countries in the World).
Declining competitiveness in the international market
Technological The low presence of market-oriented producers is evident, with intensive production and modern technology applied in their practices. It is necessary to innovate and improve technology. Production systems must be significantly improved in the future. Educational programs supported by the government or municipalities in the region of Sumadija and Western Serbia should play a key role. Particular attention should be paid to the implementation of food quality standards.
Competitiveness, viability and risk management.
Technological innovation.
Improvement of food quality standards.
1. Increased productivity, 3. Greater profitability, 4. Improved access to markets.
Unfavourable market structure
Market access In order to improve the position, farmers who were able to build their own storage capacities did it to control the price during the harvest. Nevertheless, the cost of storage is extremely high (having in mind electricity and other
Competitiveness, viability and risk management.
Flexibility in production and marketing.
Cooperation among small cold storages.
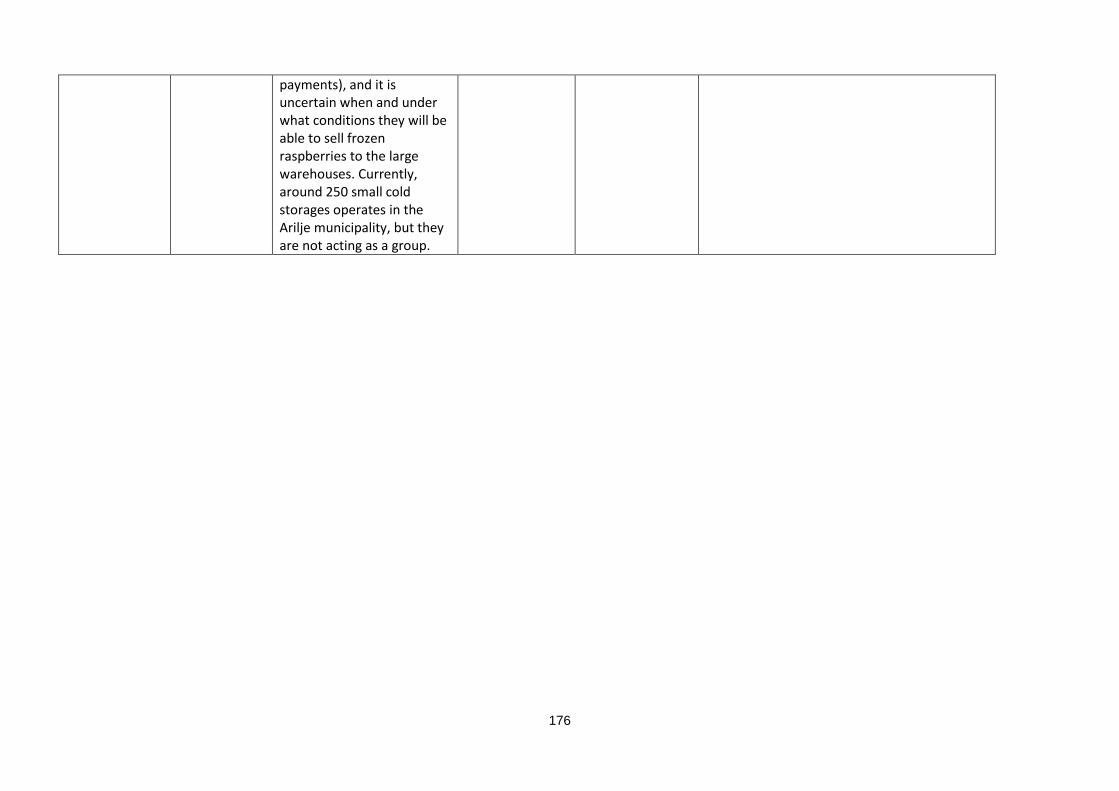
176
payments), and it is uncertain when and under what conditions they will be able to sell frozen raspberries to the large warehouses. Currently, around 250 small cold storages operates in the Arilje municipality, but they are not acting as a group.