sequencing, analysis, and annotation of expressed sequence tags for camelus dromedarius
TRANSCRIPT
Sequencing, Analysis, and Annotation of ExpressedSequence Tags for Camelus dromedariusAbdulaziz M. Al-Swailem1, Maher M. Shehata1, Faisel M. Abu-Duhier1, Essam J. Al-Yamani1, Khalid A.
Al-Busadah2, Mohammed S. Al-Arawi1, Ali Y. Al-Khider1, Abdullah N. Al-Muhaimeed1, Fahad H.
Al-Qahtani1, Manee M. Manee1, Badr M. Al-Shomrani1, Saad M. Al-Qhtani1, Amer S. Al-Harthi1, Kadir C.
Akdemir3, Mehmet S. Inan1{, Hasan H. Otu1,3*
1 Biotechnology Research Center, Natural Resources and Environment Research Institute, King Abdulaziz City for Science and Technology, Riyadh, Saudi Arabia, 2 Faculty
of Veterinary Medicine and Animal Resources, King Faisal University, Al-Hassa, Saudi Arabia, 3 Department of Medicine, BIDMC Genomics Center, Harvard Medical School,
Boston, Massachusetts, United States of America
Abstract
Despite its economical, cultural, and biological importance, there has not been a large scale sequencing project to date forCamelus dromedarius. With the goal of sequencing complete DNA of the organism, we first established and sequencedcamel EST libraries, generating 70,272 reads. Following trimming, chimera check, repeat masking, cluster and assembly, weobtained 23,602 putative gene sequences, out of which over 4,500 potentially novel or fast evolving gene sequences do notcarry any homology to other available genomes. Functional annotation of sequences with similarities in nucleotide andprotein databases has been obtained using Gene Ontology classification. Comparison to available full length cDNAsequences and Open Reading Frame (ORF) analysis of camel sequences that exhibit homology to known genes show morethan 80% of the contigs with an ORF.300 bp and ,40% hits extending to the start codons of full length cDNAs suggestingsuccessful characterization of camel genes. Similarity analyses are done separately for different organisms including human,mouse, bovine, and rat. Accompanying web portal, CAGBASE (http://camel.kacst.edu.sa/), hosts a relational databasecontaining annotated EST sequences and analysis tools with possibility to add sequences from public domain. We anticipateour results to provide a home base for genomic studies of camel and other comparative studies enabling a starting point forwhole genome sequencing of the organism.
Citation: Al-Swailem AM, Shehata MM, Abu-Duhier FM, Al-Yamani EJ, Al-Busadah KA, et al. (2010) Sequencing, Analysis, and Annotation of Expressed SequenceTags for Camelus dromedarius. PLoS ONE 5(5): e10720. doi:10.1371/journal.pone.0010720
Editor: Jason E. Stajich, University of California Riverside, United States of America
Received December 7, 2009; Accepted April 29, 2010; Published May 19, 2010
Copyright: � 2010 Al-Swailem et al. This is an open-access article distributed under the terms of the Creative Commons Attribution License, which permitsunrestricted use, distribution, and reproduction in any medium, provided the original author and source are credited.
Funding: This project was supported by a grant from King Abdulaziz City for Science and Technology (KACST), Natural Resources and Environment ResearchInstitute (NRERI), Riyadh, Saudi Arabia (http://www.kacst.edu.sa). HHO is partially supported by Dubai-Harvard Foundation for Medical Research (http://www.dhfmr.hms.harvard.edu). The funders had no role in study design, data collection and analysis, decision to publish, or preparation of the manuscript.
Competing Interests: The authors have declared that no competing interests exist.
* E-mail: [email protected]
{ Deceased.
Introduction
Camelus dromedarius, often referred to as the Arabian camel, is
probably the most famous member of the camel family. Other
members of the camel family include the llama and the alpaca in
South America. The Dromedary has one hump on its back, in
contrast to the Bactrian camel which has two. The Dromedary is
more numerous than the Bactrian camel and represents almost
90% of the genus Camelus. Camel has historically and
economically been an important species worldwide and especially
in Arab Peninsula. Saudi camels comprise 16% of the animal
biomass. Despite their differences, camels do have their shape in
common. These differences are among breeds or within breeds.
No clear classification for camels exists but generally they can be
classified according to habitat, color and function. Camel breeds
vary in size, body conformation and color. Color is the most
common character used for classification of camel breeds. Some
are dark black and others have white or brown colors. Based on
their colors, three main breeds of Saudi camels were distinguished,
namely black (Magaheem), white (Magateer) and brown (Al Homr
and Al Sofr) [1]. Camels are multipurpose animals with females
used primarily as milk producers, the males for transport or
draught and both sexes providing meat as tertiary product. Camel
stores its energy reserves in the form of fat in different depots in
their body of which the hump and abdomen depots comprise a
considerable amount of the adult body weight; therefore camels
can survive long periods without feed. Hump and abdomen fats
contain mixtures of fatty acids [2] and most of these are esterified
as triglycerides or phospholipids and vary according to their
anatomical location in the body [3]. The demand for camel meat
appears to be increasing especially in arid regions. Camel meat is
healthier as they produce carcasses with less fat as well as having
less levels of cholesterol in fat than other meat animals [4]. Camel
offers interesting biological perspectives such as heavy-chain
antibody based humoral immune system [5], existence of naturally
occurring domain antibodies (dAbs) (smallest known antigen-
binding fragments) [6], and alternative insights in reproductive
biology [7]. Moreover, camel’s characteristic ability to adapt its
desert lifestyle with remarkable traits such as fluctuating its body
temperature from 34 degrees Celsius to 41.7 degrees Celsius
PLoS ONE | www.plosone.org 1 May 2010 | Volume 5 | Issue 5 | e10720
throughout the day, tolerating a water loss greater than 30%, and
capability of drinking 100 liters of water in as little as ten minutes
[8] demands further biological investigation. Camels are usually
raised in the harsh conditions of the desert, where water is scarce.
These animals are well adapted to dehydration for relatively long
periods [9]. Basal plasma glucose levels are significantly higher in
monogastrics than in adult ruminants, but not in camels [10].
Camels are exceptional with regard to their carbohydrate
metabolism. On the one hand, plasma glucose levels in camels
are in the range or of those of monogastrics or even higher [11],
although camels ferment carbohydrates to short-chain fatty acids
on the same scale as sheep and lactating cows [12] and like
ruminants, they also meet their glucose demands by endogenous
gluconeogenesis [13]. On the other hand, the whole body insulin
sensitivity of camels is even lower than that of adult ruminants
[14]. High basal plasma glucose levels and simultaneously low
insulin sensitivities also occur in humans suffering from non-
insulin-dependent diabetes mellitus (NIDDM) [15], so the insulin
sensitivity of camels may be similar to that of NIDDM patients.
Despite its economical, cultural, and biological importance,
there has not been a large scale sequencing project targeting camel
genome. We initiated Camel Genome Project with the goal of
sequencing complete DNA of the organism. Since there is not
much available information about the camel genome, we first
established and sequenced camel EST libraries, to increase
efficiency and accuracy of whole genome sequencing. A
successfully completed EST library project can supply wealthy
genetic information for a species, often considerably shortening the
time-consuming and laborious gene isolation and characterization
procedures. Large scale EST projects do not only provide direct
information on the transcriptome and indirect information on
correlation of genome and phenotype but also most often are very
crucial to whole genome research in a given species as we have
witnessed in most of mammalian genome projects. EST libraries
are also very useful for molecular marker development in linkage
mapping, comparative genome analysis, and estimation of gene
duplication [16]. This project supplies the building backbone for
comparative genomics providing a reference point from which we
can compare camel with other organisms. The project helps us
begin to understand the molecular basis for differences in
phenotypes between camel breeds, correlation of SNPs among
different camels in health and disease, disease-susceptibility
prediction based on gene sequence variation, mapping and
identifying genes involved in complex biological traits and
multigene diseases, obtain camel specific genes to develop vaccines
and/or treatments for common diseases. It can also help in the
production of useful protein products for use in bioremediation
and pharmaceutical industries, protein replacement (e.g. factor
VIII, TPA, streptokinase, insulin, interferon), and ‘‘Pharm’’
animals.
In this study, we have sequenced 70,272 ESTs from three camel
cDNA libraries and established a publicly available database for
data mining and visualization. In order to obtain a catalogue of
gene sequences found in camel irrespective of phenotype or
abundance, we used normalized cDNA libraries from different
age, breed, and tissue samples. Following data cleanup, clustering
and assembly steps, we generated 23,602 non-redundant gene
indices. We compared our findings in particular to the following
nine species: Homo sapiens, Mus musculus, Rattus norvegicus, Bos Taurus,
Sus scrofa, Pan troglodytes, Macaca mulatta, Canis familiaris, and Equus
caballus. We chose human, mouse, and rat as model organisms that
have been heavily worked on and have well annotated genomic
data. Horse, bovine, and boar were chosen as these species are
ungulates (like camel) with substantial sequence data and share
many physiological properties with camel. Finally, we included
monkey, chimpanzee and dog in order to lead way for
comparative genomics regarding mammalian species that have
found significant attention by research community in a variety of
ways including sequence and genomic studies. To our knowledge
data presented here represent first EST sequencing in camel and
we believe accompanying web portal will become an essential tool
for the annotation and assembly of camel’s whole genome. Our
work may have significant impact on mammalian functional
genomic research since we have described over 4,500 sequences,
which do not carry any homology to any other genome that is
available.
Materials and Methods
Ethics StatementInternational rules on Experimentation on Living Animals have
been strictly implemented and consent has been obtained from the
Saudi National Commission for Experimentation on Live Animals
to carry out the relevant procedures on camels prior to the
commencement of experimental work. Certification for this
project has been obtained from the Saudi National Committee
of Bio and Medical Ethics (Reference No: 229/131).
Tissue CollectionNine inbred camels of three age groups (young (0–6 months),
adult (2–3 years), and aged (4–6 years)) and three different breeds
(white, black, and brown coat color; determined by expert
breeding techniques and visual inspection) have been used.
Camels were housed in the Camel Facility at King Faisal
University at Hassa, KSA. Camels were fed on alfa alfa (Medicago
sativa) and standard concentrate diet with free access to water. All
camels were humanely sacrificed by a high barbiturate dose
(thiopentone sodium) for collection of tissues. We collected and
pooled 11 tissues (Brain, Liver, Kidney, Heart, Muscle, Lung,
Spleen, Pancreas, Stomach, Genitals, and Colon) from each of the
nine camels. Pieces of dissected tissues were placed into the
RNAlater solution (Ambion, USA) at room temperature. The
solution permeates the cells, stabilizing the RNA. The samples
were then stored at 4uC for two hours and then stored at 280uCuntil analyzed. In addition, blood samples were collected into
Paxegen (Qiagen) tubes for RNA isolation. Since the goal of this
study is not to interrogate gene expression in camel based on age,
breed, tissue, or disease state but rather obtain a catalogue of gene
sequences found in camel, we chose to pool different age, breed,
and tissue groups to generate a collective gene expression data set
in camel. This strategy attempts to capture genes expressed based
on phenotypic differences. In order to obtain a most representative
cDNA library for camel by trying to capture both low and high
abundant transcripts expressed in different age, breed, and tissue
types, we adapted a normalized cDNA library construction
approach. In brief, this approach makes use of biotinylated
nucleotides during in vitro transcription off of linearized cDNA,
which are subsequently removed using streptavadin beads and
phenol-chloroform, resulting in 100–200 fold reduction in highly
abundant clones.
RNA Extraction100 mg of each tissue were homogenized in a vial containing
350 ml lyses buffer and ceramic beads using a Magnalyzer
instrument (Roche Diagnostics) at 6,500 rpm. Following homog-
enization, the lysates were further extracted and purified by
QIAamp RNA Mini Kit (Qiagen). Purified RNA samples were
then analyzed by Nanodrop 1000 and Agilent 2100 Bioanalyzer
EST Sequencing of Camel
PLoS ONE | www.plosone.org 2 May 2010 | Volume 5 | Issue 5 | e10720
RNA Nano Kit for the determination of the quantity and integrity
of RNA. RNA pooling system was generated for each library.
Total of 3 libraries were generated based on animal’s age. Total of
2 mg of RNA for each library were used for establishing and
sequencing EST libraries.
cDNA Library ConstructionFirst strand synthesis of the cDNA was generated by using a
clamped dT primer, which is designed to attach to the poly-A
junction of the mRNA. This ensures a more efficient first-strand
synthesis and a shorter poly-A region at the 39 end of the insert.
cDNA fragments were size selected by running on an agarose gel.
Following size selection, cDNA ends are polished and the cDNAs
were digested using a rare cutting enzyme and were directionally
cloned into pAGEN-1 vector.
Single stranded DNA was made from a portion of the primary
library by phagemid production and to ensure elimination of the
double stranded DNA contamination from the single stranded
DNA preb; the reactions were then digested with DNAse I. A
second portion of the primary library was linearized and
transcribed into anti-sense RNA with biotinylated dNTPs. oligo
dT and primer extension were used to pre-block the poly-A region
prior to hybridization. This prevents hybridization of the poly-A
clone and the poly-U of the RNA. The anti-sense RNA and single
stranded circular DNA were then hybridized and abundant clones
were removed using streptavidin. To prevent any empty vectors, A
Not1 oligo and Taq polymerase were used to synthesize double
stranded DNA from the single stranded normalized library.
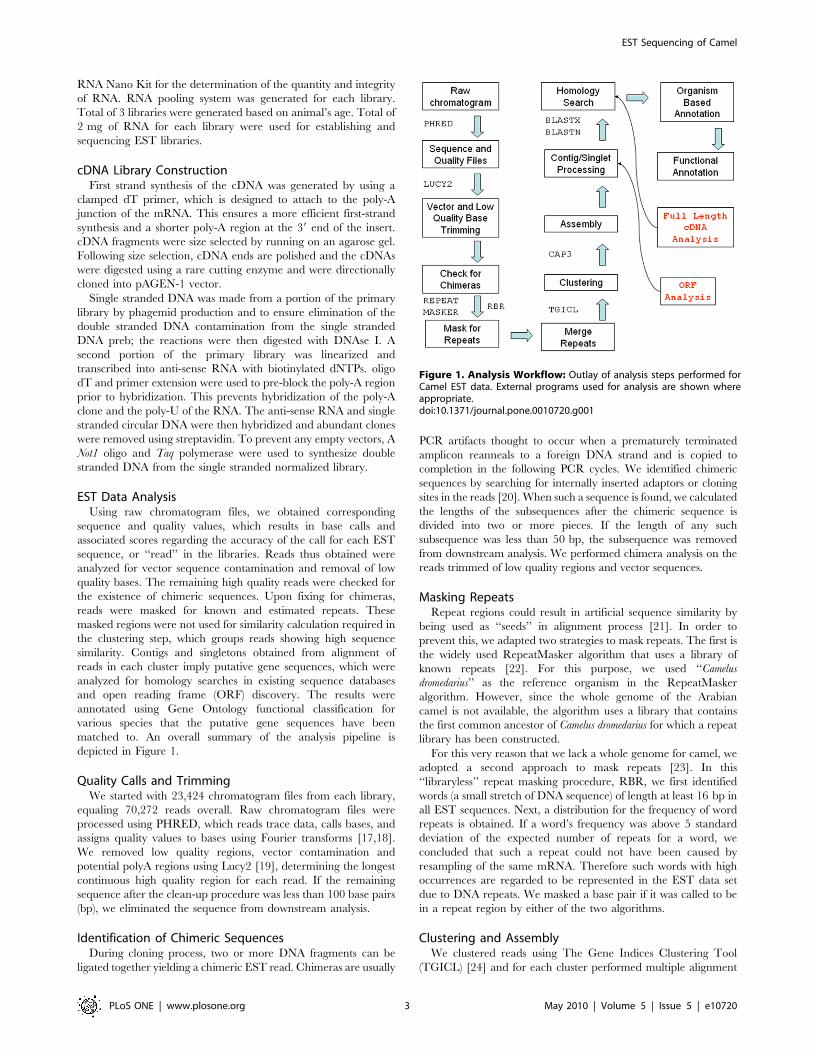
EST Data AnalysisUsing raw chromatogram files, we obtained corresponding
sequence and quality values, which results in base calls and
associated scores regarding the accuracy of the call for each EST
sequence, or ‘‘read’’ in the libraries. Reads thus obtained were
analyzed for vector sequence contamination and removal of low
quality bases. The remaining high quality reads were checked for
the existence of chimeric sequences. Upon fixing for chimeras,
reads were masked for known and estimated repeats. These
masked regions were not used for similarity calculation required in
the clustering step, which groups reads showing high sequence
similarity. Contigs and singletons obtained from alignment of
reads in each cluster imply putative gene sequences, which were
analyzed for homology searches in existing sequence databases
and open reading frame (ORF) discovery. The results were
annotated using Gene Ontology functional classification for
various species that the putative gene sequences have been
matched to. An overall summary of the analysis pipeline is
depicted in Figure 1.
Quality Calls and TrimmingWe started with 23,424 chromatogram files from each library,
equaling 70,272 reads overall. Raw chromatogram files were
processed using PHRED, which reads trace data, calls bases, and
assigns quality values to bases using Fourier transforms [17,18].
We removed low quality regions, vector contamination and
potential polyA regions using Lucy2 [19], determining the longest
continuous high quality region for each read. If the remaining
sequence after the clean-up procedure was less than 100 base pairs
(bp), we eliminated the sequence from downstream analysis.
Identification of Chimeric SequencesDuring cloning process, two or more DNA fragments can be
ligated together yielding a chimeric EST read. Chimeras are usually
PCR artifacts thought to occur when a prematurely terminated
amplicon reanneals to a foreign DNA strand and is copied to
completion in the following PCR cycles. We identified chimeric
sequences by searching for internally inserted adaptors or cloning
sites in the reads [20]. When such a sequence is found, we calculated
the lengths of the subsequences after the chimeric sequence is
divided into two or more pieces. If the length of any such
subsequence was less than 50 bp, the subsequence was removed
from downstream analysis. We performed chimera analysis on the
reads trimmed of low quality regions and vector sequences.
Masking RepeatsRepeat regions could result in artificial sequence similarity by
being used as ‘‘seeds’’ in alignment process [21]. In order to
prevent this, we adapted two strategies to mask repeats. The first is
the widely used RepeatMasker algorithm that uses a library of
known repeats [22]. For this purpose, we used ‘‘Camelus
dromedarius’’ as the reference organism in the RepeatMasker
algorithm. However, since the whole genome of the Arabian
camel is not available, the algorithm uses a library that contains
the first common ancestor of Camelus dromedarius for which a repeat
library has been constructed.
For this very reason that we lack a whole genome for camel, we
adopted a second approach to mask repeats [23]. In this
‘‘libraryless’’ repeat masking procedure, RBR, we first identified
words (a small stretch of DNA sequence) of length at least 16 bp in
all EST sequences. Next, a distribution for the frequency of word
repeats is obtained. If a word’s frequency was above 5 standard
deviation of the expected number of repeats for a word, we
concluded that such a repeat could not have been caused by
resampling of the same mRNA. Therefore such words with high
occurrences are regarded to be represented in the EST data set
due to DNA repeats. We masked a base pair if it was called to be
in a repeat region by either of the two algorithms.
Clustering and AssemblyWe clustered reads using The Gene Indices Clustering Tool
(TGICL) [24] and for each cluster performed multiple alignment
Figure 1. Analysis Workflow: Outlay of analysis steps performed forCamel EST data. External programs used for analysis are shown whereappropriate.doi:10.1371/journal.pone.0010720.g001
EST Sequencing of Camel
PLoS ONE | www.plosone.org 3 May 2010 | Volume 5 | Issue 5 | e10720
of its members using CAP3 (Huang and Madan, 1999). The
consensus sequence thus obtained for each cluster approximates
the target mRNA sequence represented by the reads in the cluster.
When performing assembly for a group of reads in a given cluster,
reads that do not fit well in the overall alignment are dropped out
and not included in the final formation of the ‘‘contigs’’, the
consensus sequence representing a cluster. Such dropped out reads
combined with reads that are placed in self-contained clusters are
referred to as ‘‘singletons’’.
Homology Search and Functional AnnotationWe calculated the longest ORF for each contig and singleton
sequence using NCBI’s standard genetic code to relate homology
searches to the availability of ORFs in the input set. We then
compared each contig and singleton to NCBI’s nucleotide (nt;
containing 6,944,581 sequences) and non-redundant protein (nr;
containing 6,655,203 sequences) databases using BLASTN (E-
value cut-off 10230) and BLASTX (E-value cut-off 1025)
algorithms, respectively [25]. Resulting ‘‘hits’’ were analyzed
separately for nine species. We also searched for hits in the NIH
Mammalian Gene Collection Project (http://mgc.nci.nih.gov) to
identify matches to full-length cDNA sequences for the following
species: Homo sapiens, Mus musculus, Rattus norvegicus, and Bos Taurus
[26]. This search was conducted using BLASTX and results were
analyzed to identify coverage of match regions over start and/or
stop codons of full-length cDNA sequences. A hit was identified if
the alignment between query and hit sequences was over 30 amino
acids (aa) with at least 96% identity.
Functional annotation of reads that are mapped to homologous
sequences using BLAST is done by identifying the Gene Ontology
(GO) categories for the hits [27]. We identified Biological Process,
Cellular Component, and Molecular Function categories seen in
our matched sequences using NCBI’s GENE database mapping to
GO terms. Our sequence and functional annotation strategy was
NCBI’s gi number centric: for every contig or singleton, the
sequence’s hits’ gi numbers were pooled and matched to unique
GeneIDs to remove redundancy. Hence match results presented
always refer to unique number of genes found in NCBI’s GENE
database. These GeneIDs were then mapped to GO terms.
In an attempt to perform comparative genomic analysis, we
compared genes mapped from our EST database to human,
mouse, rat, and bovine using NCBI’s HomoloGene database. We
found genes shared by all four organisms and analyzed them with
Ingenuity Pathway Analysis (IPA) software (IngenuityH Systems,
www.ingenuity.com). IPA generates networks based on the
connectivity of genes in the data set using Ingenuity Knowledge
Base, which is mostly dependent on scientific literature. IPA
performs functional analysis by identifying biological functions
and/or diseases that are most significant to the data set using right
tailed Fisher’s exact test. This functional analysis is similarly
applied to molecules in a given network generated by IPA for the
data set. IPA also projects molecules in the data set to known
biological pathways (referred to as ‘‘canonical pathways’’) and
finds significantly associated canonical pathways by calculating the
ratio of molecules in the data set mapped to canonical pathway
divided by total number of molecules in the canonical pathway
and by using Fisher’s exact test to assign significance to observed
association.
Results
cDNA library created from 11 tissues of three different inbred
camels of different ages produced enough material to sequence
around 80,000 clones. 23,424 EST sequences were determined
from each library by single pass 59 sequencing yielding a total of
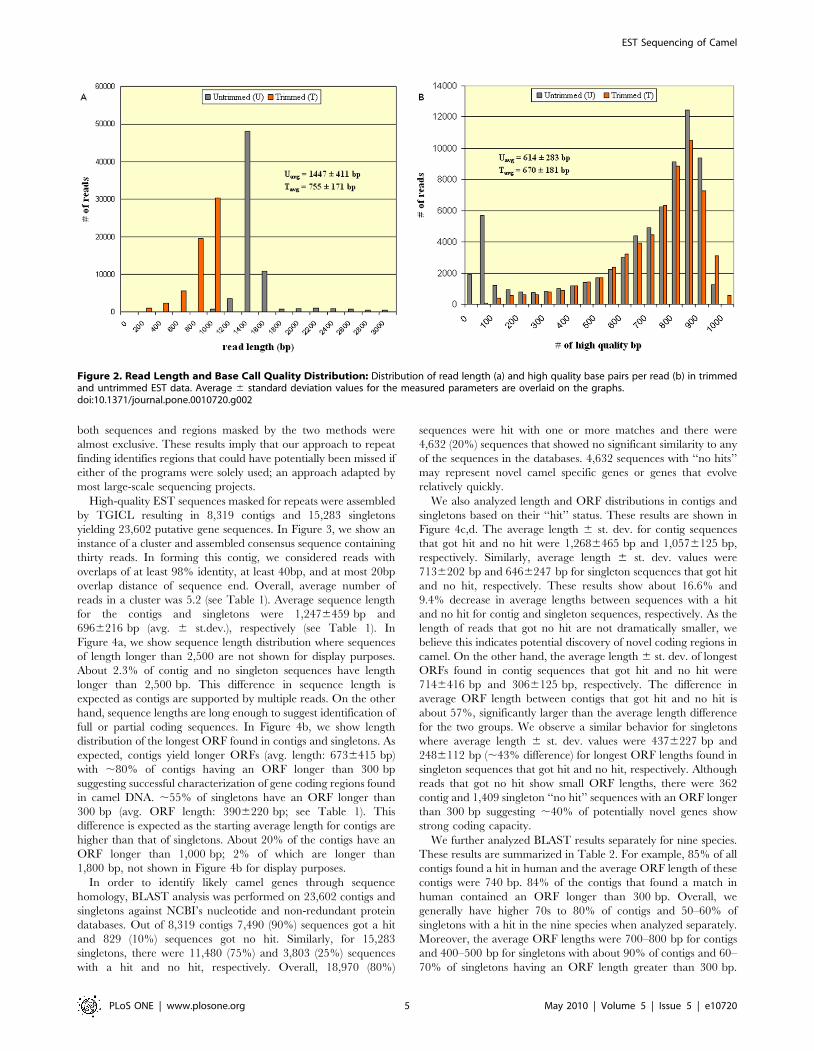
70,272 EST sequences, with an average read length of 14476411
(avg. 6 st.dev.) bp and an average high quality (Phrap score .20)
per read of 6146283 bp. After trimming vector contamination,
low quality bases, and eliminating trimmed sequences with length
less than 100 bp, three libraries resulted in 58,842 high-quality
EST sequences with an average read length of 7556171 bp and
an average high quality base pairs per read of 6706181. These
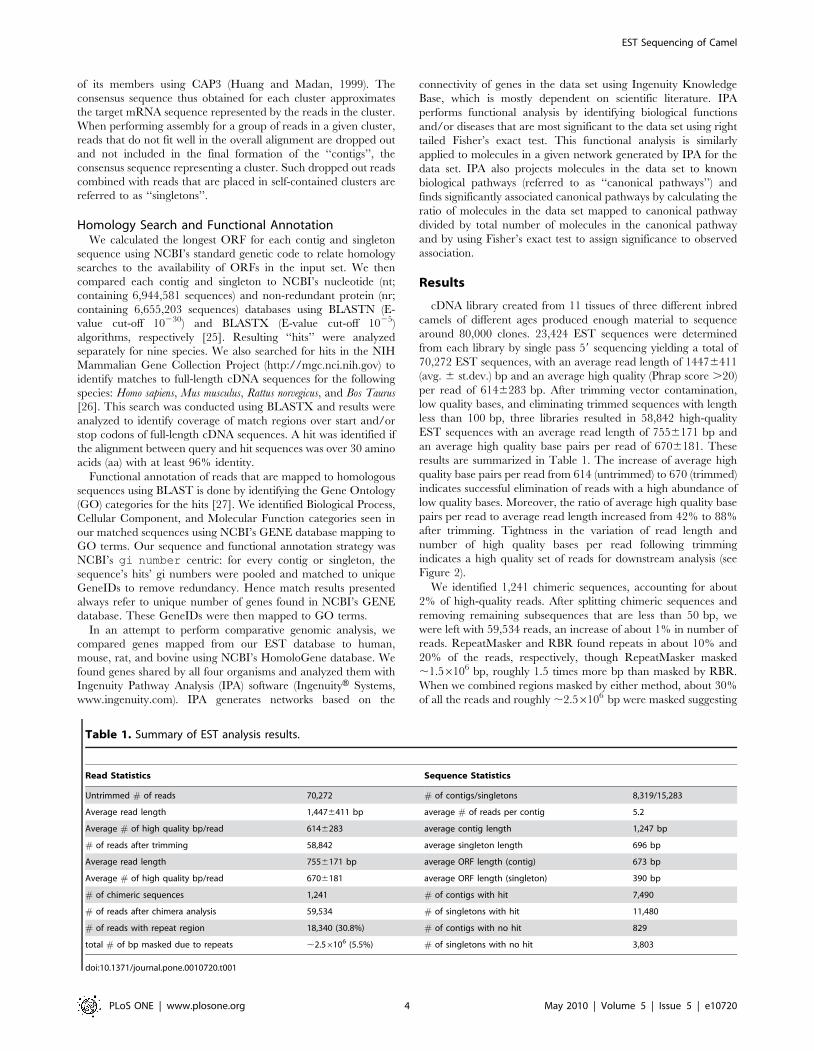
results are summarized in Table 1. The increase of average high
quality base pairs per read from 614 (untrimmed) to 670 (trimmed)
indicates successful elimination of reads with a high abundance of
low quality bases. Moreover, the ratio of average high quality base
pairs per read to average read length increased from 42% to 88%
after trimming. Tightness in the variation of read length and
number of high quality bases per read following trimming
indicates a high quality set of reads for downstream analysis (see
Figure 2).
We identified 1,241 chimeric sequences, accounting for about
2% of high-quality reads. After splitting chimeric sequences and
removing remaining subsequences that are less than 50 bp, we
were left with 59,534 reads, an increase of about 1% in number of
reads. RepeatMasker and RBR found repeats in about 10% and
20% of the reads, respectively, though RepeatMasker masked
,1.56106 bp, roughly 1.5 times more bp than masked by RBR.
When we combined regions masked by either method, about 30%
of all the reads and roughly ,2.56106 bp were masked suggesting
Table 1. Summary of EST analysis results.
Read Statistics Sequence Statistics
Untrimmed # of reads 70,272 # of contigs/singletons 8,319/15,283
Average read length 1,4476411 bp average # of reads per contig 5.2
Average # of high quality bp/read 6146283 average contig length 1,247 bp
# of reads after trimming 58,842 average singleton length 696 bp
Average read length 7556171 bp average ORF length (contig) 673 bp
Average # of high quality bp/read 6706181 average ORF length (singleton) 390 bp
# of chimeric sequences 1,241 # of contigs with hit 7,490
# of reads after chimera analysis 59,534 # of singletons with hit 11,480
# of reads with repeat region 18,340 (30.8%) # of contigs with no hit 829
total # of bp masked due to repeats ,2.56106 (5.5%) # of singletons with no hit 3,803
doi:10.1371/journal.pone.0010720.t001
EST Sequencing of Camel
PLoS ONE | www.plosone.org 4 May 2010 | Volume 5 | Issue 5 | e10720
both sequences and regions masked by the two methods were
almost exclusive. These results imply that our approach to repeat
finding identifies regions that could have potentially been missed if
either of the programs were solely used; an approach adapted by
most large-scale sequencing projects.
High-quality EST sequences masked for repeats were assembled
by TGICL resulting in 8,319 contigs and 15,283 singletons
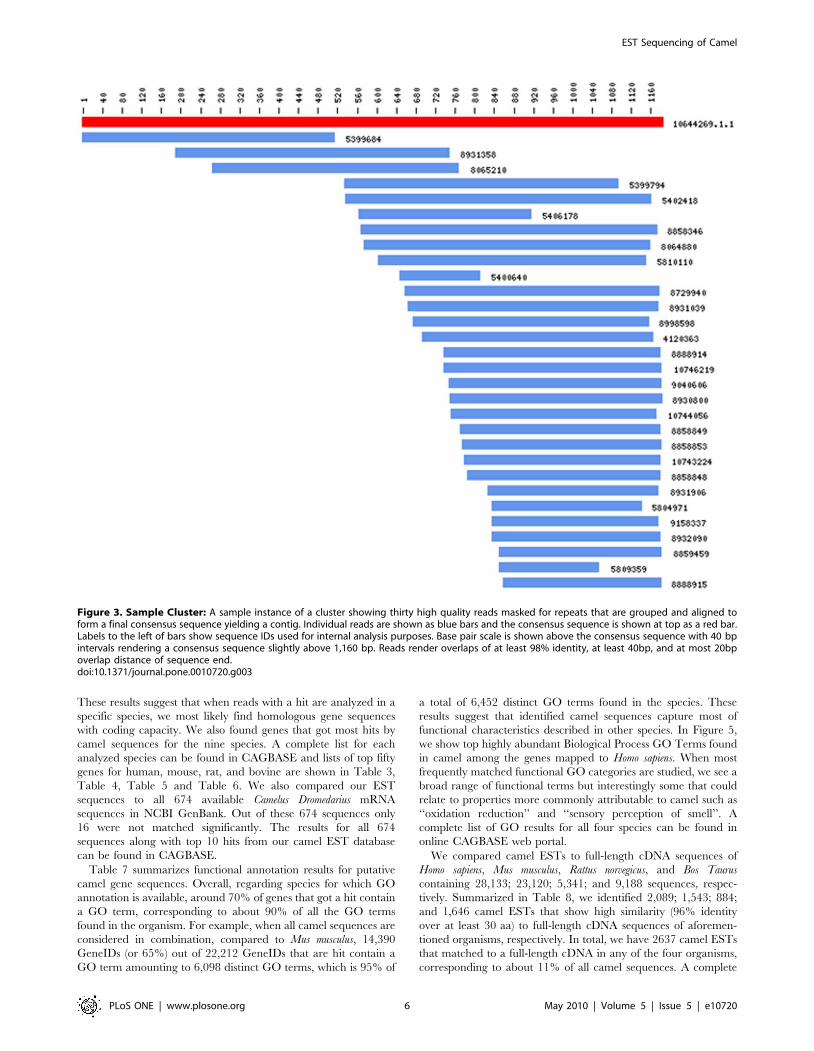
yielding 23,602 putative gene sequences. In Figure 3, we show an
instance of a cluster and assembled consensus sequence containing
thirty reads. In forming this contig, we considered reads with
overlaps of at least 98% identity, at least 40bp, and at most 20bp
overlap distance of sequence end. Overall, average number of
reads in a cluster was 5.2 (see Table 1). Average sequence length
for the contigs and singletons were 1,2476459 bp and
6966216 bp (avg. 6 st.dev.), respectively (see Table 1). In
Figure 4a, we show sequence length distribution where sequences
of length longer than 2,500 are not shown for display purposes.
About 2.3% of contig and no singleton sequences have length
longer than 2,500 bp. This difference in sequence length is
expected as contigs are supported by multiple reads. On the other
hand, sequence lengths are long enough to suggest identification of
full or partial coding sequences. In Figure 4b, we show length
distribution of the longest ORF found in contigs and singletons. As
expected, contigs yield longer ORFs (avg. length: 6736415 bp)
with ,80% of contigs having an ORF longer than 300 bp
suggesting successful characterization of gene coding regions found
in camel DNA. ,55% of singletons have an ORF longer than
300 bp (avg. ORF length: 3906220 bp; see Table 1). This
difference is expected as the starting average length for contigs are
higher than that of singletons. About 20% of the contigs have an
ORF longer than 1,000 bp; 2% of which are longer than
1,800 bp, not shown in Figure 4b for display purposes.
In order to identify likely camel genes through sequence
homology, BLAST analysis was performed on 23,602 contigs and
singletons against NCBI’s nucleotide and non-redundant protein
databases. Out of 8,319 contigs 7,490 (90%) sequences got a hit
and 829 (10%) sequences got no hit. Similarly, for 15,283
singletons, there were 11,480 (75%) and 3,803 (25%) sequences
with a hit and no hit, respectively. Overall, 18,970 (80%)
sequences were hit with one or more matches and there were
4,632 (20%) sequences that showed no significant similarity to any
of the sequences in the databases. 4,632 sequences with ‘‘no hits’’
may represent novel camel specific genes or genes that evolve
relatively quickly.
We also analyzed length and ORF distributions in contigs and
singletons based on their ‘‘hit’’ status. These results are shown in
Figure 4c,d. The average length 6 st. dev. for contig sequences
that got hit and no hit were 1,2686465 bp and 1,0576125 bp,
respectively. Similarly, average length 6 st. dev. values were
7136202 bp and 6466247 bp for singleton sequences that got hit
and no hit, respectively. These results show about 16.6% and
9.4% decrease in average lengths between sequences with a hit
and no hit for contig and singleton sequences, respectively. As the
length of reads that got no hit are not dramatically smaller, we
believe this indicates potential discovery of novel coding regions in
camel. On the other hand, the average length 6 st. dev. of longest
ORFs found in contig sequences that got hit and no hit were
7146416 bp and 3066125 bp, respectively. The difference in
average ORF length between contigs that got hit and no hit is
about 57%, significantly larger than the average length difference
for the two groups. We observe a similar behavior for singletons
where average length 6 st. dev. values were 4376227 bp and
2486112 bp (,43% difference) for longest ORF lengths found in
singleton sequences that got hit and no hit, respectively. Although
reads that got no hit show small ORF lengths, there were 362
contig and 1,409 singleton ‘‘no hit’’ sequences with an ORF longer
than 300 bp suggesting ,40% of potentially novel genes show
strong coding capacity.
We further analyzed BLAST results separately for nine species.
These results are summarized in Table 2. For example, 85% of all
contigs found a hit in human and the average ORF length of these
contigs were 740 bp. 84% of the contigs that found a match in
human contained an ORF longer than 300 bp. Overall, we
generally have higher 70s to 80% of contigs and 50–60% of
singletons with a hit in the nine species when analyzed separately.
Moreover, the average ORF lengths were 700–800 bp for contigs
and 400–500 bp for singletons with about 90% of contigs and 60–
70% of singletons having an ORF length greater than 300 bp.
Figure 2. Read Length and Base Call Quality Distribution: Distribution of read length (a) and high quality base pairs per read (b) in trimmedand untrimmed EST data. Average 6 standard deviation values for the measured parameters are overlaid on the graphs.doi:10.1371/journal.pone.0010720.g002
EST Sequencing of Camel
PLoS ONE | www.plosone.org 5 May 2010 | Volume 5 | Issue 5 | e10720
These results suggest that when reads with a hit are analyzed in a
specific species, we most likely find homologous gene sequences
with coding capacity. We also found genes that got most hits by
camel sequences for the nine species. A complete list for each
analyzed species can be found in CAGBASE and lists of top fifty
genes for human, mouse, rat, and bovine are shown in Table 3,
Table 4, Table 5 and Table 6. We also compared our EST
sequences to all 674 available Camelus Dromedarius mRNA
sequences in NCBI GenBank. Out of these 674 sequences only
16 were not matched significantly. The results for all 674
sequences along with top 10 hits from our camel EST database
can be found in CAGBASE.
Table 7 summarizes functional annotation results for putative
camel gene sequences. Overall, regarding species for which GO
annotation is available, around 70% of genes that got a hit contain
a GO term, corresponding to about 90% of all the GO terms
found in the organism. For example, when all camel sequences are
considered in combination, compared to Mus musculus, 14,390
GeneIDs (or 65%) out of 22,212 GeneIDs that are hit contain a
GO term amounting to 6,098 distinct GO terms, which is 95% of
a total of 6,452 distinct GO terms found in the species. These
results suggest that identified camel sequences capture most of
functional characteristics described in other species. In Figure 5,
we show top highly abundant Biological Process GO Terms found
in camel among the genes mapped to Homo sapiens. When most
frequently matched functional GO categories are studied, we see a
broad range of functional terms but interestingly some that could
relate to properties more commonly attributable to camel such as
‘‘oxidation reduction’’ and ‘‘sensory perception of smell’’. A
complete list of GO results for all four species can be found in
online CAGBASE web portal.
We compared camel ESTs to full-length cDNA sequences of
Homo sapiens, Mus musculus, Rattus norvegicus, and Bos Taurus
containing 28,133; 23,120; 5,341; and 9,188 sequences, respec-
tively. Summarized in Table 8, we identified 2,089; 1,543; 884;
and 1,646 camel ESTs that show high similarity (96% identity
over at least 30 aa) to full-length cDNA sequences of aforemen-
tioned organisms, respectively. In total, we have 2637 camel ESTs
that matched to a full-length cDNA in any of the four organisms,
corresponding to about 11% of all camel sequences. A complete
Figure 3. Sample Cluster: A sample instance of a cluster showing thirty high quality reads masked for repeats that are grouped and aligned toform a final consensus sequence yielding a contig. Individual reads are shown as blue bars and the consensus sequence is shown at top as a red bar.Labels to the left of bars show sequence IDs used for internal analysis purposes. Base pair scale is shown above the consensus sequence with 40 bpintervals rendering a consensus sequence slightly above 1,160 bp. Reads render overlaps of at least 98% identity, at least 40bp, and at most 20bpoverlap distance of sequence end.doi:10.1371/journal.pone.0010720.g003
EST Sequencing of Camel
PLoS ONE | www.plosone.org 6 May 2010 | Volume 5 | Issue 5 | e10720
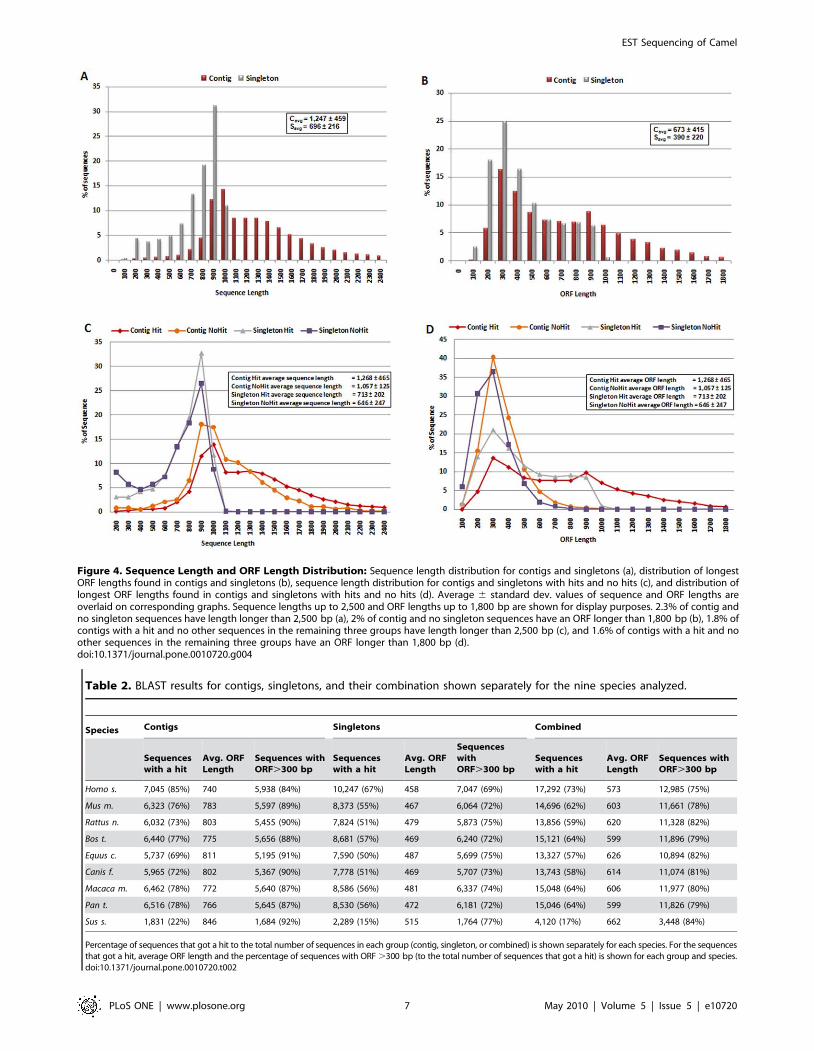
Figure 4. Sequence Length and ORF Length Distribution: Sequence length distribution for contigs and singletons (a), distribution of longestORF lengths found in contigs and singletons (b), sequence length distribution for contigs and singletons with hits and no hits (c), and distribution oflongest ORF lengths found in contigs and singletons with hits and no hits (d). Average 6 standard dev. values of sequence and ORF lengths areoverlaid on corresponding graphs. Sequence lengths up to 2,500 and ORF lengths up to 1,800 bp are shown for display purposes. 2.3% of contig andno singleton sequences have length longer than 2,500 bp (a), 2% of contig and no singleton sequences have an ORF longer than 1,800 bp (b), 1.8% ofcontigs with a hit and no other sequences in the remaining three groups have length longer than 2,500 bp (c), and 1.6% of contigs with a hit and noother sequences in the remaining three groups have an ORF longer than 1,800 bp (d).doi:10.1371/journal.pone.0010720.g004
Table 2. BLAST results for contigs, singletons, and their combination shown separately for the nine species analyzed.
Species Contigs Singletons Combined
Sequenceswith a hit
Avg. ORFLength
Sequences withORF.300 bp
Sequenceswith a hit
Avg. ORFLength
SequenceswithORF.300 bp
Sequenceswith a hit
Avg. ORFLength
Sequences withORF.300 bp
Homo s. 7,045 (85%) 740 5,938 (84%) 10,247 (67%) 458 7,047 (69%) 17,292 (73%) 573 12,985 (75%)
Mus m. 6,323 (76%) 783 5,597 (89%) 8,373 (55%) 467 6,064 (72%) 14,696 (62%) 603 11,661 (78%)
Rattus n. 6,032 (73%) 803 5,455 (90%) 7,824 (51%) 479 5,873 (75%) 13,856 (59%) 620 11,328 (82%)
Bos t. 6,440 (77%) 775 5,656 (88%) 8,681 (57%) 469 6,240 (72%) 15,121 (64%) 599 11,896 (79%)
Equus c. 5,737 (69%) 811 5,195 (91%) 7,590 (50%) 487 5,699 (75%) 13,327 (57%) 626 10,894 (82%)
Canis f. 5,965 (72%) 802 5,367 (90%) 7,778 (51%) 469 5,707 (73%) 13,743 (58%) 614 11,074 (81%)
Macaca m. 6,462 (78%) 772 5,640 (87%) 8,586 (56%) 481 6,337 (74%) 15,048 (64%) 606 11,977 (80%)
Pan t. 6,516 (78%) 766 5,645 (87%) 8,530 (56%) 472 6,181 (72%) 15,046 (64%) 599 11,826 (79%)
Sus s. 1,831 (22%) 846 1,684 (92%) 2,289 (15%) 515 1,764 (77%) 4,120 (17%) 662 3,448 (84%)
Percentage of sequences that got a hit to the total number of sequences in each group (contig, singleton, or combined) is shown separately for each species. For the sequencesthat got a hit, average ORF length and the percentage of sequences with ORF .300 bp (to the total number of sequences that got a hit) is shown for each group and species.doi:10.1371/journal.pone.0010720.t002
EST Sequencing of Camel
PLoS ONE | www.plosone.org 7 May 2010 | Volume 5 | Issue 5 | e10720
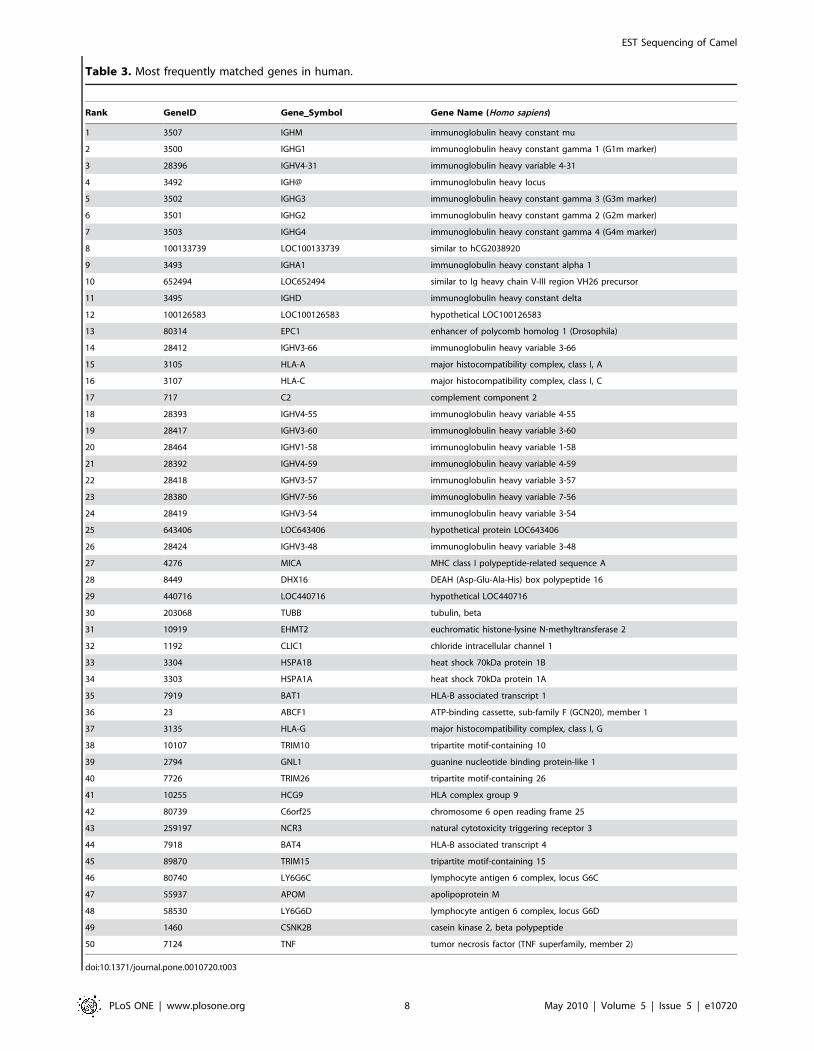
Table 3. Most frequently matched genes in human.
Rank GeneID Gene__Symbol Gene Name (Homo sapiens)
1 3507 IGHM immunoglobulin heavy constant mu
2 3500 IGHG1 immunoglobulin heavy constant gamma 1 (G1m marker)
3 28396 IGHV4-31 immunoglobulin heavy variable 4-31
4 3492 IGH@ immunoglobulin heavy locus
5 3502 IGHG3 immunoglobulin heavy constant gamma 3 (G3m marker)
6 3501 IGHG2 immunoglobulin heavy constant gamma 2 (G2m marker)
7 3503 IGHG4 immunoglobulin heavy constant gamma 4 (G4m marker)
8 100133739 LOC100133739 similar to hCG2038920
9 3493 IGHA1 immunoglobulin heavy constant alpha 1
10 652494 LOC652494 similar to Ig heavy chain V-III region VH26 precursor
11 3495 IGHD immunoglobulin heavy constant delta
12 100126583 LOC100126583 hypothetical LOC100126583
13 80314 EPC1 enhancer of polycomb homolog 1 (Drosophila)
14 28412 IGHV3-66 immunoglobulin heavy variable 3-66
15 3105 HLA-A major histocompatibility complex, class I, A
16 3107 HLA-C major histocompatibility complex, class I, C
17 717 C2 complement component 2
18 28393 IGHV4-55 immunoglobulin heavy variable 4-55
19 28417 IGHV3-60 immunoglobulin heavy variable 3-60
20 28464 IGHV1-58 immunoglobulin heavy variable 1-58
21 28392 IGHV4-59 immunoglobulin heavy variable 4-59
22 28418 IGHV3-57 immunoglobulin heavy variable 3-57
23 28380 IGHV7-56 immunoglobulin heavy variable 7-56
24 28419 IGHV3-54 immunoglobulin heavy variable 3-54
25 643406 LOC643406 hypothetical protein LOC643406
26 28424 IGHV3-48 immunoglobulin heavy variable 3-48
27 4276 MICA MHC class I polypeptide-related sequence A
28 8449 DHX16 DEAH (Asp-Glu-Ala-His) box polypeptide 16
29 440716 LOC440716 hypothetical LOC440716
30 203068 TUBB tubulin, beta
31 10919 EHMT2 euchromatic histone-lysine N-methyltransferase 2
32 1192 CLIC1 chloride intracellular channel 1
33 3304 HSPA1B heat shock 70kDa protein 1B
34 3303 HSPA1A heat shock 70kDa protein 1A
35 7919 BAT1 HLA-B associated transcript 1
36 23 ABCF1 ATP-binding cassette, sub-family F (GCN20), member 1
37 3135 HLA-G major histocompatibility complex, class I, G
38 10107 TRIM10 tripartite motif-containing 10
39 2794 GNL1 guanine nucleotide binding protein-like 1
40 7726 TRIM26 tripartite motif-containing 26
41 10255 HCG9 HLA complex group 9
42 80739 C6orf25 chromosome 6 open reading frame 25
43 259197 NCR3 natural cytotoxicity triggering receptor 3
44 7918 BAT4 HLA-B associated transcript 4
45 89870 TRIM15 tripartite motif-containing 15
46 80740 LY6G6C lymphocyte antigen 6 complex, locus G6C
47 55937 APOM apolipoprotein M
48 58530 LY6G6D lymphocyte antigen 6 complex, locus G6D
49 1460 CSNK2B casein kinase 2, beta polypeptide
50 7124 TNF tumor necrosis factor (TNF superfamily, member 2)
doi:10.1371/journal.pone.0010720.t003
EST Sequencing of Camel
PLoS ONE | www.plosone.org 8 May 2010 | Volume 5 | Issue 5 | e10720
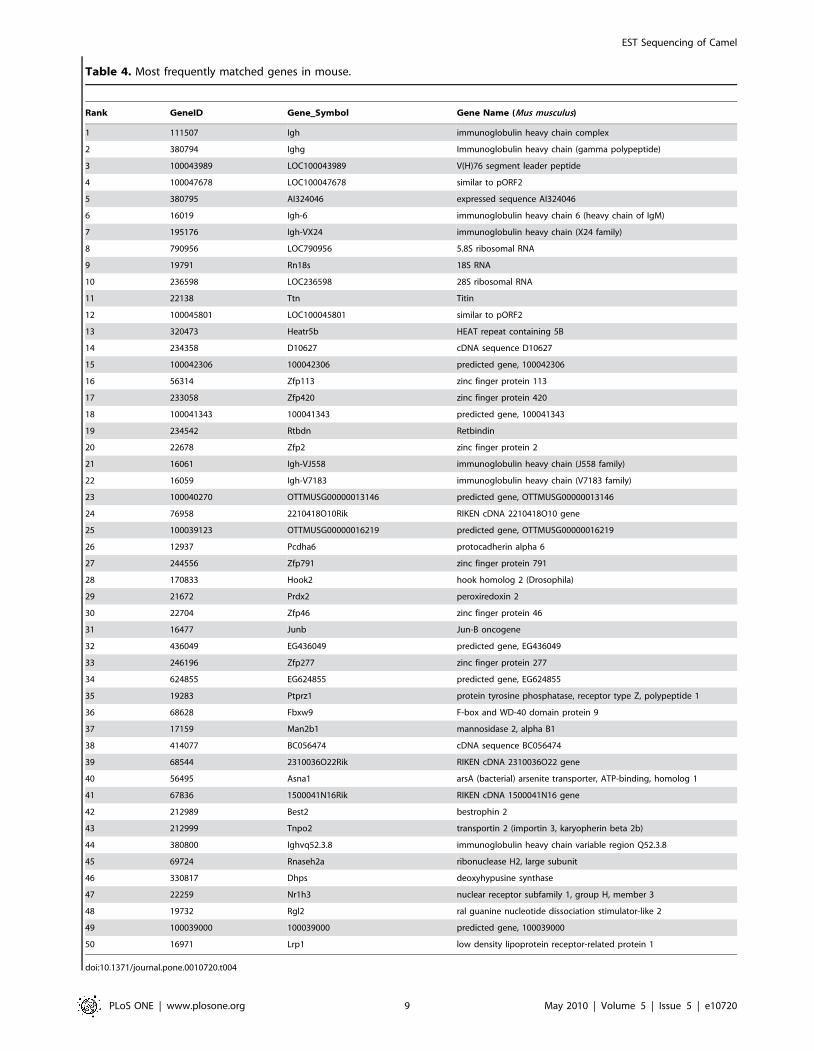
Table 4. Most frequently matched genes in mouse.
Rank GeneID Gene__Symbol Gene Name (Mus musculus)
1 111507 Igh immunoglobulin heavy chain complex
2 380794 Ighg Immunoglobulin heavy chain (gamma polypeptide)
3 100043989 LOC100043989 V(H)76 segment leader peptide
4 100047678 LOC100047678 similar to pORF2
5 380795 AI324046 expressed sequence AI324046
6 16019 Igh-6 immunoglobulin heavy chain 6 (heavy chain of IgM)
7 195176 Igh-VX24 immunoglobulin heavy chain (X24 family)
8 790956 LOC790956 5.8S ribosomal RNA
9 19791 Rn18s 18S RNA
10 236598 LOC236598 28S ribosomal RNA
11 22138 Ttn Titin
12 100045801 LOC100045801 similar to pORF2
13 320473 Heatr5b HEAT repeat containing 5B
14 234358 D10627 cDNA sequence D10627
15 100042306 100042306 predicted gene, 100042306
16 56314 Zfp113 zinc finger protein 113
17 233058 Zfp420 zinc finger protein 420
18 100041343 100041343 predicted gene, 100041343
19 234542 Rtbdn Retbindin
20 22678 Zfp2 zinc finger protein 2
21 16061 Igh-VJ558 immunoglobulin heavy chain (J558 family)
22 16059 Igh-V7183 immunoglobulin heavy chain (V7183 family)
23 100040270 OTTMUSG00000013146 predicted gene, OTTMUSG00000013146
24 76958 2210418O10Rik RIKEN cDNA 2210418O10 gene
25 100039123 OTTMUSG00000016219 predicted gene, OTTMUSG00000016219
26 12937 Pcdha6 protocadherin alpha 6
27 244556 Zfp791 zinc finger protein 791
28 170833 Hook2 hook homolog 2 (Drosophila)
29 21672 Prdx2 peroxiredoxin 2
30 22704 Zfp46 zinc finger protein 46
31 16477 Junb Jun-B oncogene
32 436049 EG436049 predicted gene, EG436049
33 246196 Zfp277 zinc finger protein 277
34 624855 EG624855 predicted gene, EG624855
35 19283 Ptprz1 protein tyrosine phosphatase, receptor type Z, polypeptide 1
36 68628 Fbxw9 F-box and WD-40 domain protein 9
37 17159 Man2b1 mannosidase 2, alpha B1
38 414077 BC056474 cDNA sequence BC056474
39 68544 2310036O22Rik RIKEN cDNA 2310036O22 gene
40 56495 Asna1 arsA (bacterial) arsenite transporter, ATP-binding, homolog 1
41 67836 1500041N16Rik RIKEN cDNA 1500041N16 gene
42 212989 Best2 bestrophin 2
43 212999 Tnpo2 transportin 2 (importin 3, karyopherin beta 2b)
44 380800 Ighvq52.3.8 immunoglobulin heavy chain variable region Q52.3.8
45 69724 Rnaseh2a ribonuclease H2, large subunit
46 330817 Dhps deoxyhypusine synthase
47 22259 Nr1h3 nuclear receptor subfamily 1, group H, member 3
48 19732 Rgl2 ral guanine nucleotide dissociation stimulator-like 2
49 100039000 100039000 predicted gene, 100039000
50 16971 Lrp1 low density lipoprotein receptor-related protein 1
doi:10.1371/journal.pone.0010720.t004
EST Sequencing of Camel
PLoS ONE | www.plosone.org 9 May 2010 | Volume 5 | Issue 5 | e10720
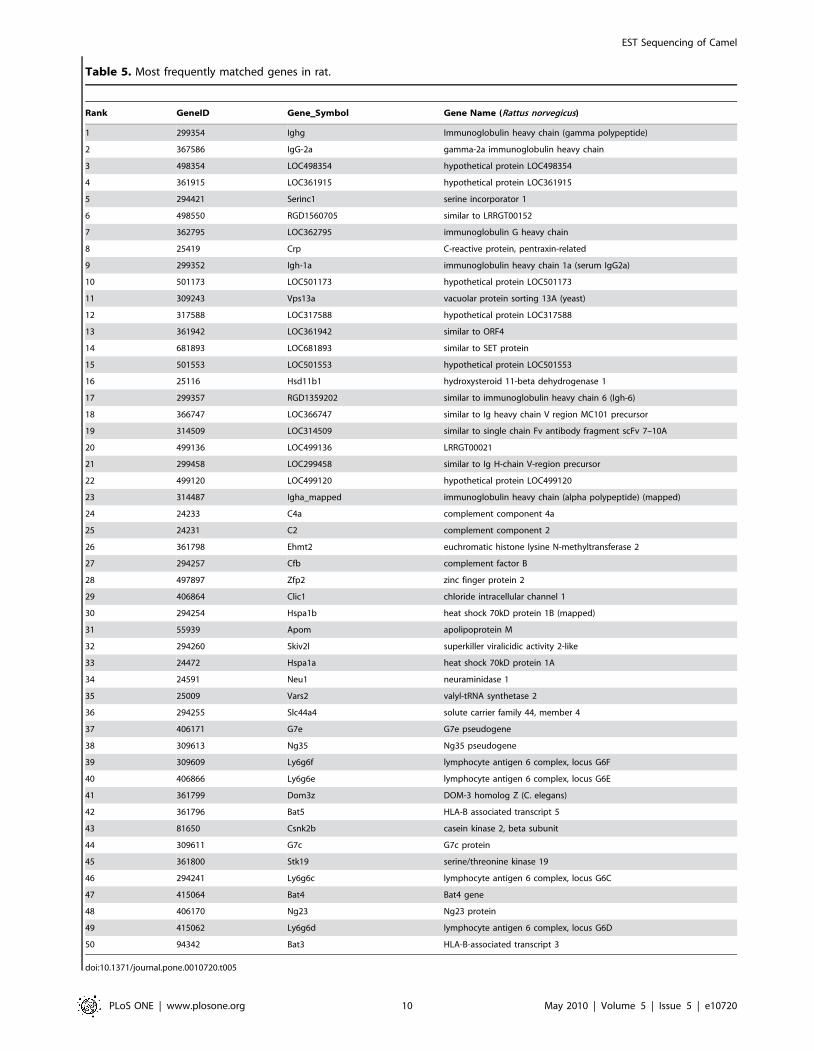
Table 5. Most frequently matched genes in rat.
Rank GeneID Gene__Symbol Gene Name (Rattus norvegicus)
1 299354 Ighg Immunoglobulin heavy chain (gamma polypeptide)
2 367586 IgG-2a gamma-2a immunoglobulin heavy chain
3 498354 LOC498354 hypothetical protein LOC498354
4 361915 LOC361915 hypothetical protein LOC361915
5 294421 Serinc1 serine incorporator 1
6 498550 RGD1560705 similar to LRRGT00152
7 362795 LOC362795 immunoglobulin G heavy chain
8 25419 Crp C-reactive protein, pentraxin-related
9 299352 Igh-1a immunoglobulin heavy chain 1a (serum IgG2a)
10 501173 LOC501173 hypothetical protein LOC501173
11 309243 Vps13a vacuolar protein sorting 13A (yeast)
12 317588 LOC317588 hypothetical protein LOC317588
13 361942 LOC361942 similar to ORF4
14 681893 LOC681893 similar to SET protein
15 501553 LOC501553 hypothetical protein LOC501553
16 25116 Hsd11b1 hydroxysteroid 11-beta dehydrogenase 1
17 299357 RGD1359202 similar to immunoglobulin heavy chain 6 (Igh-6)
18 366747 LOC366747 similar to Ig heavy chain V region MC101 precursor
19 314509 LOC314509 similar to single chain Fv antibody fragment scFv 7–10A
20 499136 LOC499136 LRRGT00021
21 299458 LOC299458 similar to Ig H-chain V-region precursor
22 499120 LOC499120 hypothetical protein LOC499120
23 314487 Igha_mapped immunoglobulin heavy chain (alpha polypeptide) (mapped)
24 24233 C4a complement component 4a
25 24231 C2 complement component 2
26 361798 Ehmt2 euchromatic histone lysine N-methyltransferase 2
27 294257 Cfb complement factor B
28 497897 Zfp2 zinc finger protein 2
29 406864 Clic1 chloride intracellular channel 1
30 294254 Hspa1b heat shock 70kD protein 1B (mapped)
31 55939 Apom apolipoprotein M
32 294260 Skiv2l superkiller viralicidic activity 2-like
33 24472 Hspa1a heat shock 70kD protein 1A
34 24591 Neu1 neuraminidase 1
35 25009 Vars2 valyl-tRNA synthetase 2
36 294255 Slc44a4 solute carrier family 44, member 4
37 406171 G7e G7e pseudogene
38 309613 Ng35 Ng35 pseudogene
39 309609 Ly6g6f lymphocyte antigen 6 complex, locus G6F
40 406866 Ly6g6e lymphocyte antigen 6 complex, locus G6E
41 361799 Dom3z DOM-3 homolog Z (C. elegans)
42 361796 Bat5 HLA-B associated transcript 5
43 81650 Csnk2b casein kinase 2, beta subunit
44 309611 G7c G7c protein
45 361800 Stk19 serine/threonine kinase 19
46 294241 Ly6g6c lymphocyte antigen 6 complex, locus G6C
47 415064 Bat4 Bat4 gene
48 406170 Ng23 Ng23 protein
49 415062 Ly6g6d lymphocyte antigen 6 complex, locus G6D
50 94342 Bat3 HLA-B-associated transcript 3
doi:10.1371/journal.pone.0010720.t005
EST Sequencing of Camel
PLoS ONE | www.plosone.org 10 May 2010 | Volume 5 | Issue 5 | e10720
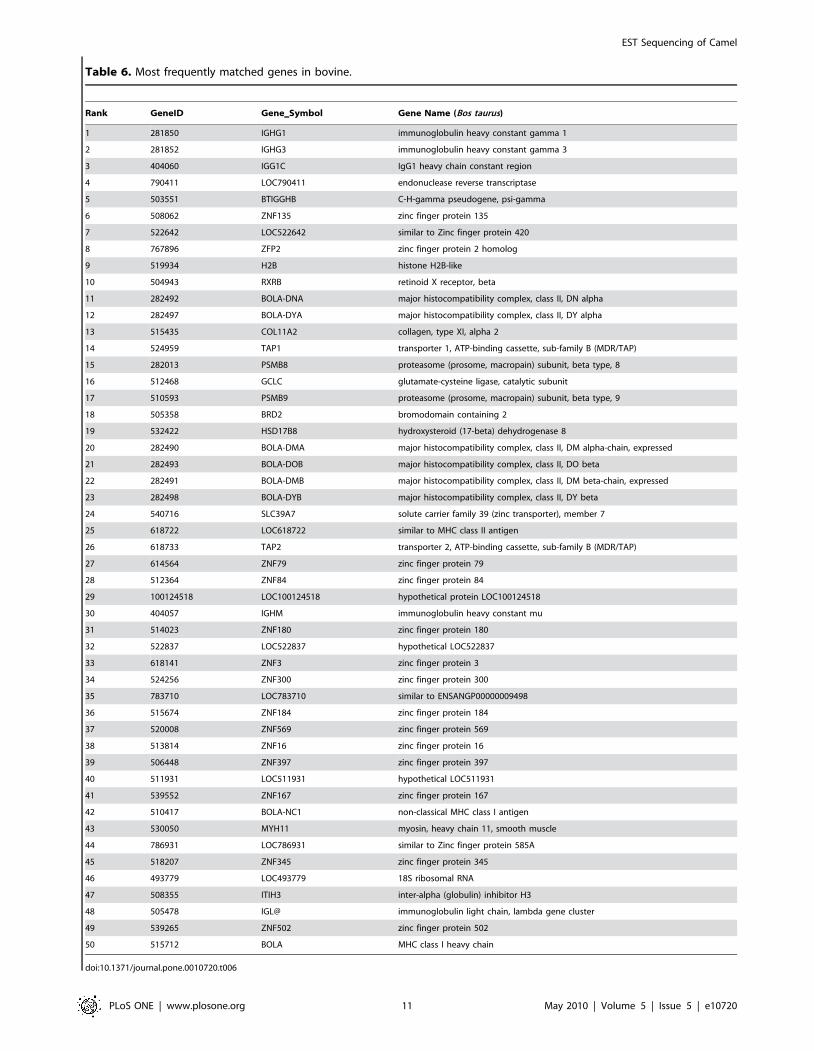
Table 6. Most frequently matched genes in bovine.
Rank GeneID Gene__Symbol Gene Name (Bos taurus)
1 281850 IGHG1 immunoglobulin heavy constant gamma 1
2 281852 IGHG3 immunoglobulin heavy constant gamma 3
3 404060 IGG1C IgG1 heavy chain constant region
4 790411 LOC790411 endonuclease reverse transcriptase
5 503551 BTIGGHB C-H-gamma pseudogene, psi-gamma
6 508062 ZNF135 zinc finger protein 135
7 522642 LOC522642 similar to Zinc finger protein 420
8 767896 ZFP2 zinc finger protein 2 homolog
9 519934 H2B histone H2B-like
10 504943 RXRB retinoid X receptor, beta
11 282492 BOLA-DNA major histocompatibility complex, class II, DN alpha
12 282497 BOLA-DYA major histocompatibility complex, class II, DY alpha
13 515435 COL11A2 collagen, type XI, alpha 2
14 524959 TAP1 transporter 1, ATP-binding cassette, sub-family B (MDR/TAP)
15 282013 PSMB8 proteasome (prosome, macropain) subunit, beta type, 8
16 512468 GCLC glutamate-cysteine ligase, catalytic subunit
17 510593 PSMB9 proteasome (prosome, macropain) subunit, beta type, 9
18 505358 BRD2 bromodomain containing 2
19 532422 HSD17B8 hydroxysteroid (17-beta) dehydrogenase 8
20 282490 BOLA-DMA major histocompatibility complex, class II, DM alpha-chain, expressed
21 282493 BOLA-DOB major histocompatibility complex, class II, DO beta
22 282491 BOLA-DMB major histocompatibility complex, class II, DM beta-chain, expressed
23 282498 BOLA-DYB major histocompatibility complex, class II, DY beta
24 540716 SLC39A7 solute carrier family 39 (zinc transporter), member 7
25 618722 LOC618722 similar to MHC class II antigen
26 618733 TAP2 transporter 2, ATP-binding cassette, sub-family B (MDR/TAP)
27 614564 ZNF79 zinc finger protein 79
28 512364 ZNF84 zinc finger protein 84
29 100124518 LOC100124518 hypothetical protein LOC100124518
30 404057 IGHM immunoglobulin heavy constant mu
31 514023 ZNF180 zinc finger protein 180
32 522837 LOC522837 hypothetical LOC522837
33 618141 ZNF3 zinc finger protein 3
34 524256 ZNF300 zinc finger protein 300
35 783710 LOC783710 similar to ENSANGP00000009498
36 515674 ZNF184 zinc finger protein 184
37 520008 ZNF569 zinc finger protein 569
38 513814 ZNF16 zinc finger protein 16
39 506448 ZNF397 zinc finger protein 397
40 511931 LOC511931 hypothetical LOC511931
41 539552 ZNF167 zinc finger protein 167
42 510417 BOLA-NC1 non-classical MHC class I antigen
43 530050 MYH11 myosin, heavy chain 11, smooth muscle
44 786931 LOC786931 similar to Zinc finger protein 585A
45 518207 ZNF345 zinc finger protein 345
46 493779 LOC493779 18S ribosomal RNA
47 508355 ITIH3 inter-alpha (globulin) inhibitor H3
48 505478 IGL@ immunoglobulin light chain, lambda gene cluster
49 539265 ZNF502 zinc finger protein 502
50 515712 BOLA MHC class I heavy chain
doi:10.1371/journal.pone.0010720.t006
EST Sequencing of Camel
PLoS ONE | www.plosone.org 11 May 2010 | Volume 5 | Issue 5 | e10720
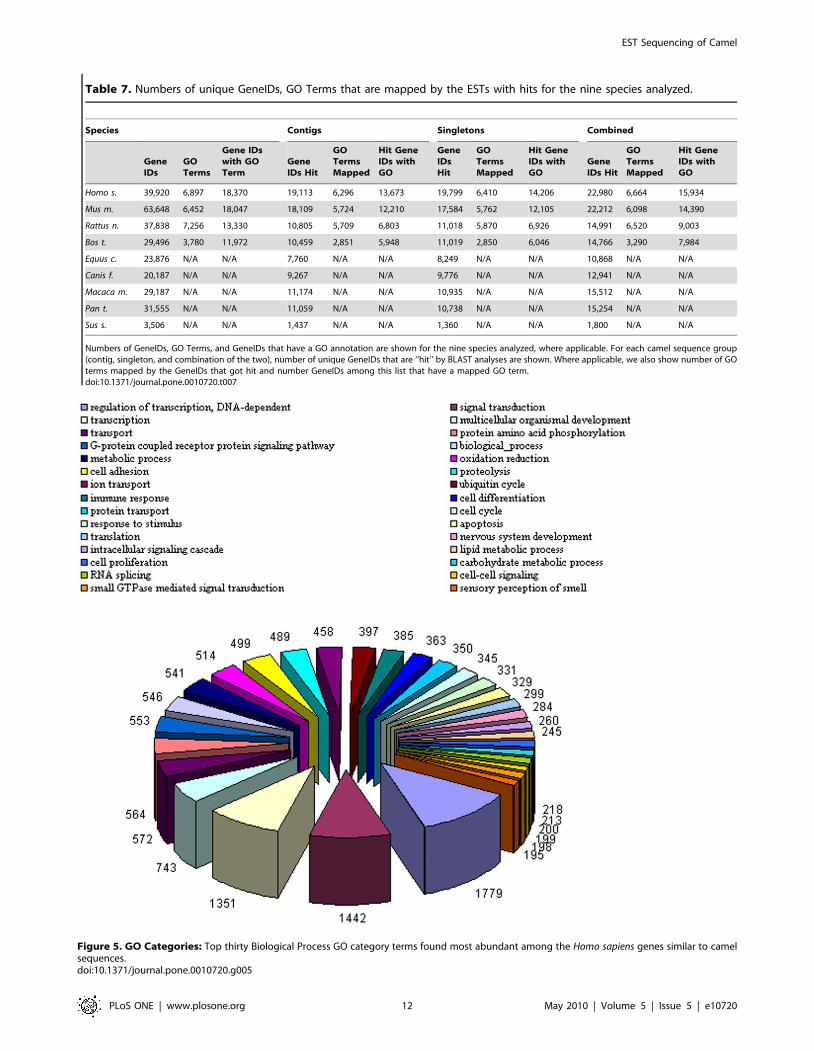
Figure 5. GO Categories: Top thirty Biological Process GO category terms found most abundant among the Homo sapiens genes similar to camelsequences.doi:10.1371/journal.pone.0010720.g005
Table 7. Numbers of unique GeneIDs, GO Terms that are mapped by the ESTs with hits for the nine species analyzed.
Species Contigs Singletons Combined
GeneIDs
GOTerms
Gene IDswith GOTerm
GeneIDs Hit
GOTermsMapped
Hit GeneIDs withGO
GeneIDsHit
GOTermsMapped
Hit GeneIDs withGO
GeneIDs Hit
GOTermsMapped
Hit GeneIDs withGO
Homo s. 39,920 6,897 18,370 19,113 6,296 13,673 19,799 6,410 14,206 22,980 6,664 15,934
Mus m. 63,648 6,452 18,047 18,109 5,724 12,210 17,584 5,762 12,105 22,212 6,098 14,390
Rattus n. 37,838 7,256 13,330 10,805 5,709 6,803 11,018 5,870 6,926 14,991 6,520 9,003
Bos t. 29,496 3,780 11,972 10,459 2,851 5,948 11,019 2,850 6,046 14,766 3,290 7,984
Equus c. 23,876 N/A N/A 7,760 N/A N/A 8,249 N/A N/A 10,868 N/A N/A
Canis f. 20,187 N/A N/A 9,267 N/A N/A 9,776 N/A N/A 12,941 N/A N/A
Macaca m. 29,187 N/A N/A 11,174 N/A N/A 10,935 N/A N/A 15,512 N/A N/A
Pan t. 31,555 N/A N/A 11,059 N/A N/A 10,738 N/A N/A 15,254 N/A N/A
Sus s. 3,506 N/A N/A 1,437 N/A N/A 1,360 N/A N/A 1,800 N/A N/A
Numbers of GeneIDs, GO Terms, and GeneIDs that have a GO annotation are shown for the nine species analyzed, where applicable. For each camel sequence group(contig, singleton, and combination of the two), number of unique GeneIDs that are ‘‘hit’’ by BLAST analyses are shown. Where applicable, we also show number of GOterms mapped by the GeneIDs that got hit and number GeneIDs among this list that have a mapped GO term.doi:10.1371/journal.pone.0010720.t007
EST Sequencing of Camel
PLoS ONE | www.plosone.org 12 May 2010 | Volume 5 | Issue 5 | e10720
list of full length cDNA analysis is hosted at CAGBASE web
portal. We found that in 35–50% of matching contigs, the
alignment was within 5 aa of the start codon, suggesting that near-
complete coding sequences have been obtained for these genes.
Lack of a similar database for camel unfortunately prevents these
results to be processed to better estimate sequences representing
full length cDNAs and total number of genes in camel.
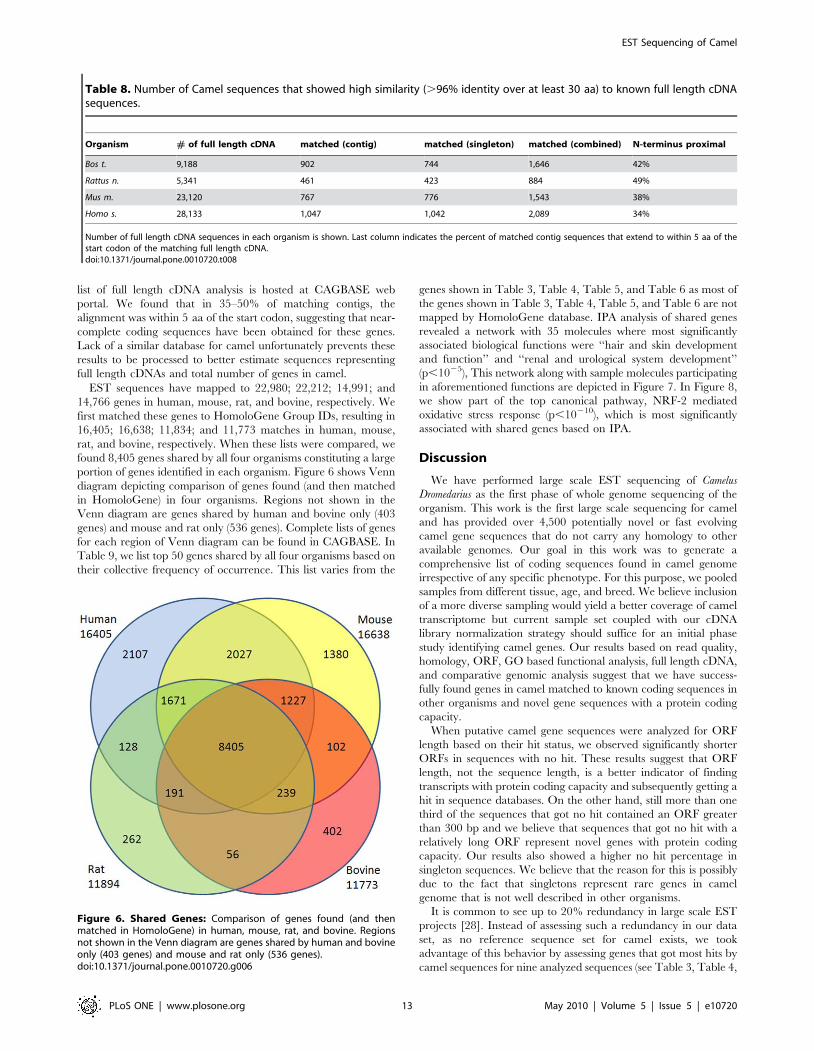
EST sequences have mapped to 22,980; 22,212; 14,991; and
14,766 genes in human, mouse, rat, and bovine, respectively. We
first matched these genes to HomoloGene Group IDs, resulting in
16,405; 16,638; 11,834; and 11,773 matches in human, mouse,
rat, and bovine, respectively. When these lists were compared, we
found 8,405 genes shared by all four organisms constituting a large
portion of genes identified in each organism. Figure 6 shows Venn
diagram depicting comparison of genes found (and then matched
in HomoloGene) in four organisms. Regions not shown in the
Venn diagram are genes shared by human and bovine only (403
genes) and mouse and rat only (536 genes). Complete lists of genes
for each region of Venn diagram can be found in CAGBASE. In
Table 9, we list top 50 genes shared by all four organisms based on
their collective frequency of occurrence. This list varies from the
genes shown in Table 3, Table 4, Table 5, and Table 6 as most of
the genes shown in Table 3, Table 4, Table 5, and Table 6 are not
mapped by HomoloGene database. IPA analysis of shared genes
revealed a network with 35 molecules where most significantly
associated biological functions were ‘‘hair and skin development
and function’’ and ‘‘renal and urological system development’’
(p,1025), This network along with sample molecules participating
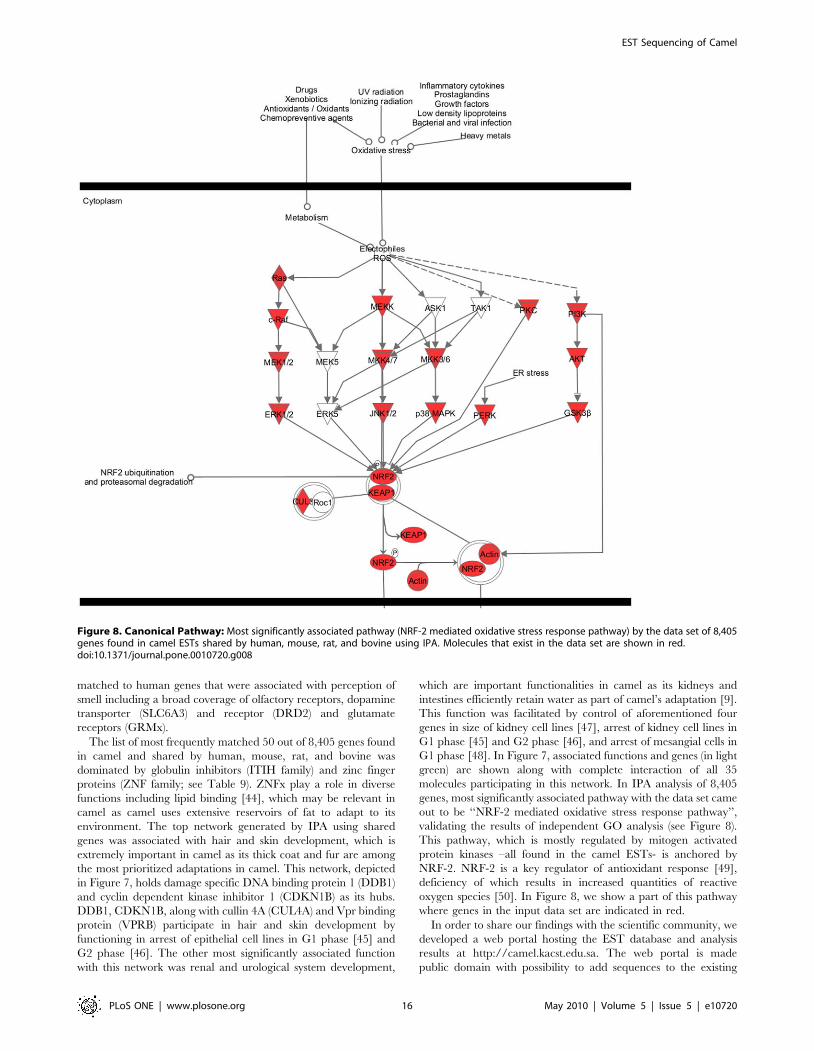
in aforementioned functions are depicted in Figure 7. In Figure 8,
we show part of the top canonical pathway, NRF-2 mediated
oxidative stress response (p,10210), which is most significantly
associated with shared genes based on IPA.
Discussion
We have performed large scale EST sequencing of Camelus
Dromedarius as the first phase of whole genome sequencing of the
organism. This work is the first large scale sequencing for camel
and has provided over 4,500 potentially novel or fast evolving
camel gene sequences that do not carry any homology to other
available genomes. Our goal in this work was to generate a
comprehensive list of coding sequences found in camel genome
irrespective of any specific phenotype. For this purpose, we pooled
samples from different tissue, age, and breed. We believe inclusion
of a more diverse sampling would yield a better coverage of camel
transcriptome but current sample set coupled with our cDNA
library normalization strategy should suffice for an initial phase
study identifying camel genes. Our results based on read quality,
homology, ORF, GO based functional analysis, full length cDNA,
and comparative genomic analysis suggest that we have success-
fully found genes in camel matched to known coding sequences in
other organisms and novel gene sequences with a protein coding
capacity.
When putative camel gene sequences were analyzed for ORF
length based on their hit status, we observed significantly shorter
ORFs in sequences with no hit. These results suggest that ORF
length, not the sequence length, is a better indicator of finding
transcripts with protein coding capacity and subsequently getting a
hit in sequence databases. On the other hand, still more than one
third of the sequences that got no hit contained an ORF greater
than 300 bp and we believe that sequences that got no hit with a
relatively long ORF represent novel genes with protein coding
capacity. Our results also showed a higher no hit percentage in
singleton sequences. We believe that the reason for this is possibly
due to the fact that singletons represent rare genes in camel
genome that is not well described in other organisms.
It is common to see up to 20% redundancy in large scale EST
projects [28]. Instead of assessing such a redundancy in our data
set, as no reference sequence set for camel exists, we took
advantage of this behavior by assessing genes that got most hits by
camel sequences for nine analyzed sequences (see Table 3, Table 4,
Table 8. Number of Camel sequences that showed high similarity (.96% identity over at least 30 aa) to known full length cDNAsequences.
Organism # of full length cDNA matched (contig) matched (singleton) matched (combined) N-terminus proximal
Bos t. 9,188 902 744 1,646 42%
Rattus n. 5,341 461 423 884 49%
Mus m. 23,120 767 776 1,543 38%
Homo s. 28,133 1,047 1,042 2,089 34%
Number of full length cDNA sequences in each organism is shown. Last column indicates the percent of matched contig sequences that extend to within 5 aa of thestart codon of the matching full length cDNA.doi:10.1371/journal.pone.0010720.t008
Figure 6. Shared Genes: Comparison of genes found (and thenmatched in HomoloGene) in human, mouse, rat, and bovine. Regionsnot shown in the Venn diagram are genes shared by human and bovineonly (403 genes) and mouse and rat only (536 genes).doi:10.1371/journal.pone.0010720.g006
EST Sequencing of Camel
PLoS ONE | www.plosone.org 13 May 2010 | Volume 5 | Issue 5 | e10720
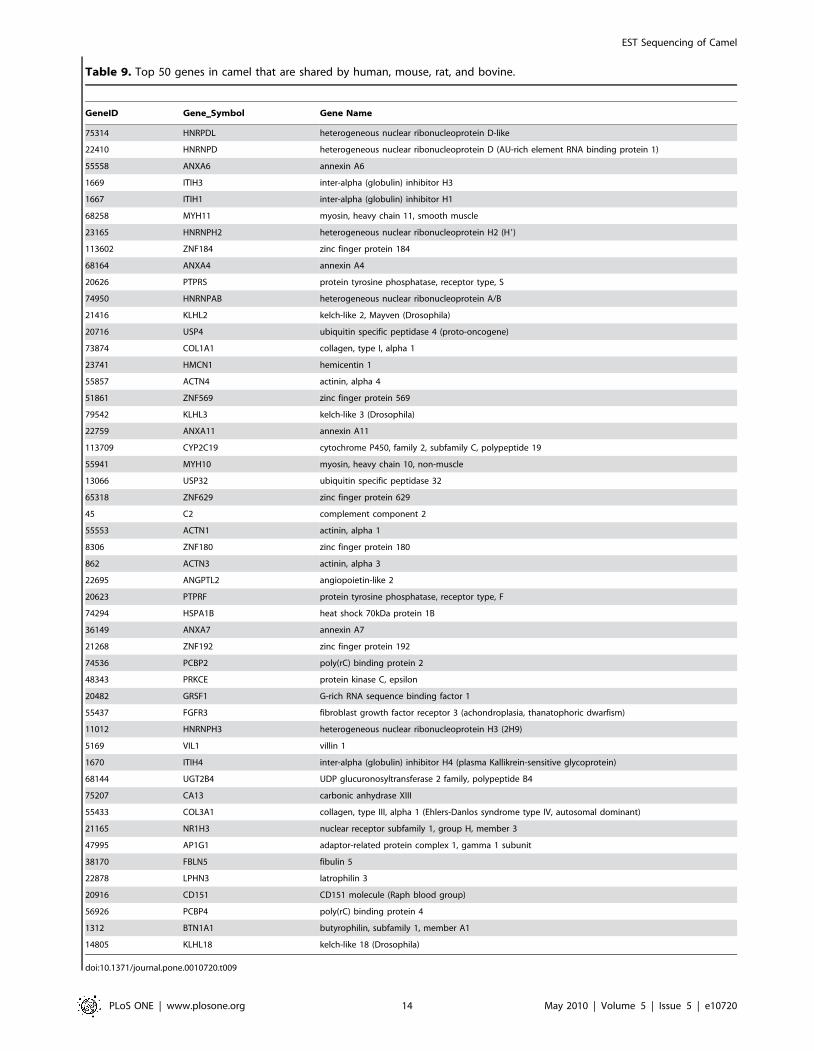
Table 9. Top 50 genes in camel that are shared by human, mouse, rat, and bovine.
GeneID Gene__Symbol Gene Name
75314 HNRPDL heterogeneous nuclear ribonucleoprotein D-like
22410 HNRNPD heterogeneous nuclear ribonucleoprotein D (AU-rich element RNA binding protein 1)
55558 ANXA6 annexin A6
1669 ITIH3 inter-alpha (globulin) inhibitor H3
1667 ITIH1 inter-alpha (globulin) inhibitor H1
68258 MYH11 myosin, heavy chain 11, smooth muscle
23165 HNRNPH2 heterogeneous nuclear ribonucleoprotein H2 (H9)
113602 ZNF184 zinc finger protein 184
68164 ANXA4 annexin A4
20626 PTPRS protein tyrosine phosphatase, receptor type, S
74950 HNRNPAB heterogeneous nuclear ribonucleoprotein A/B
21416 KLHL2 kelch-like 2, Mayven (Drosophila)
20716 USP4 ubiquitin specific peptidase 4 (proto-oncogene)
73874 COL1A1 collagen, type I, alpha 1
23741 HMCN1 hemicentin 1
55857 ACTN4 actinin, alpha 4
51861 ZNF569 zinc finger protein 569
79542 KLHL3 kelch-like 3 (Drosophila)
22759 ANXA11 annexin A11
113709 CYP2C19 cytochrome P450, family 2, subfamily C, polypeptide 19
55941 MYH10 myosin, heavy chain 10, non-muscle
13066 USP32 ubiquitin specific peptidase 32
65318 ZNF629 zinc finger protein 629
45 C2 complement component 2
55553 ACTN1 actinin, alpha 1
8306 ZNF180 zinc finger protein 180
862 ACTN3 actinin, alpha 3
22695 ANGPTL2 angiopoietin-like 2
20623 PTPRF protein tyrosine phosphatase, receptor type, F
74294 HSPA1B heat shock 70kDa protein 1B
36149 ANXA7 annexin A7
21268 ZNF192 zinc finger protein 192
74536 PCBP2 poly(rC) binding protein 2
48343 PRKCE protein kinase C, epsilon
20482 GRSF1 G-rich RNA sequence binding factor 1
55437 FGFR3 fibroblast growth factor receptor 3 (achondroplasia, thanatophoric dwarfism)
11012 HNRNPH3 heterogeneous nuclear ribonucleoprotein H3 (2H9)
5169 VIL1 villin 1
1670 ITIH4 inter-alpha (globulin) inhibitor H4 (plasma Kallikrein-sensitive glycoprotein)
68144 UGT2B4 UDP glucuronosyltransferase 2 family, polypeptide B4
75207 CA13 carbonic anhydrase XIII
55433 COL3A1 collagen, type III, alpha 1 (Ehlers-Danlos syndrome type IV, autosomal dominant)
21165 NR1H3 nuclear receptor subfamily 1, group H, member 3
47995 AP1G1 adaptor-related protein complex 1, gamma 1 subunit
38170 FBLN5 fibulin 5
22878 LPHN3 latrophilin 3
20916 CD151 CD151 molecule (Raph blood group)
56926 PCBP4 poly(rC) binding protein 4
1312 BTN1A1 butyrophilin, subfamily 1, member A1
14805 KLHL18 kelch-like 18 (Drosophila)
doi:10.1371/journal.pone.0010720.t009
EST Sequencing of Camel
PLoS ONE | www.plosone.org 14 May 2010 | Volume 5 | Issue 5 | e10720
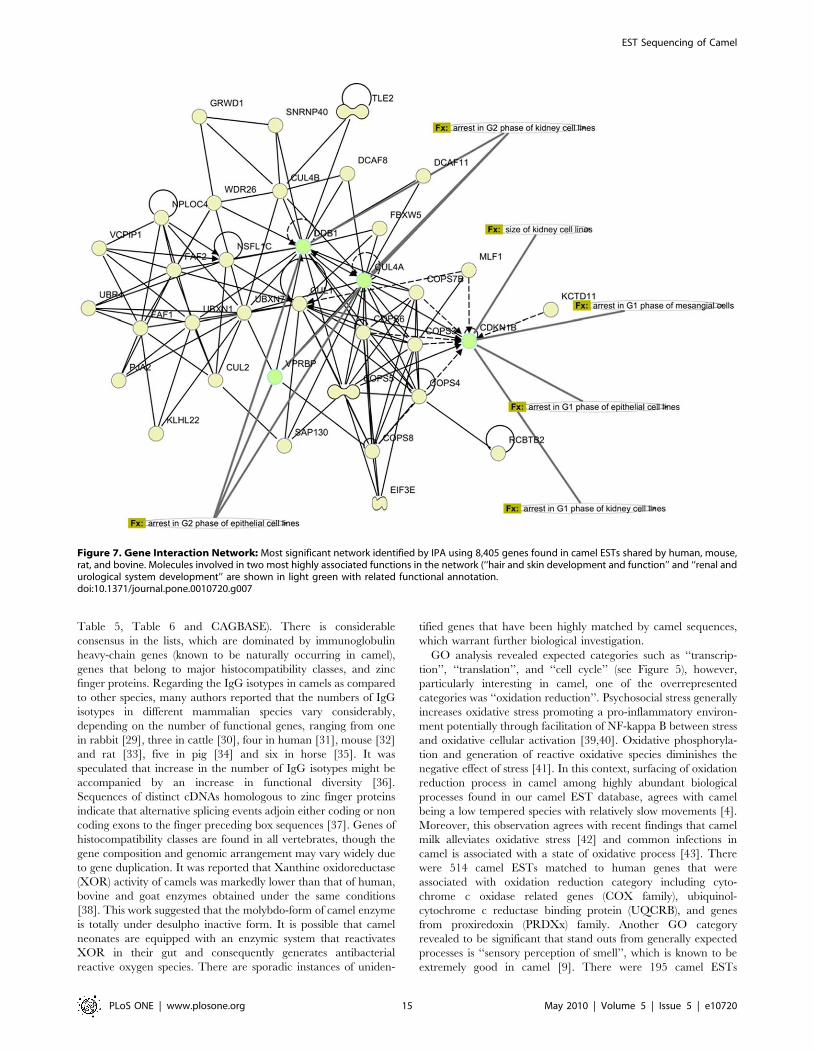
Table 5, Table 6 and CAGBASE). There is considerable
consensus in the lists, which are dominated by immunoglobulin
heavy-chain genes (known to be naturally occurring in camel),
genes that belong to major histocompatibility classes, and zinc
finger proteins. Regarding the IgG isotypes in camels as compared
to other species, many authors reported that the numbers of IgG
isotypes in different mammalian species vary considerably,
depending on the number of functional genes, ranging from one
in rabbit [29], three in cattle [30], four in human [31], mouse [32]
and rat [33], five in pig [34] and six in horse [35]. It was
speculated that increase in the number of IgG isotypes might be
accompanied by an increase in functional diversity [36].
Sequences of distinct cDNAs homologous to zinc finger proteins
indicate that alternative splicing events adjoin either coding or non
coding exons to the finger preceding box sequences [37]. Genes of
histocompatibility classes are found in all vertebrates, though the
gene composition and genomic arrangement may vary widely due
to gene duplication. It was reported that Xanthine oxidoreductase
(XOR) activity of camels was markedly lower than that of human,
bovine and goat enzymes obtained under the same conditions
[38]. This work suggested that the molybdo-form of camel enzyme
is totally under desulpho inactive form. It is possible that camel
neonates are equipped with an enzymic system that reactivates
XOR in their gut and consequently generates antibacterial
reactive oxygen species. There are sporadic instances of uniden-
tified genes that have been highly matched by camel sequences,
which warrant further biological investigation.
GO analysis revealed expected categories such as ‘‘transcrip-
tion’’, ‘‘translation’’, and ‘‘cell cycle’’ (see Figure 5), however,
particularly interesting in camel, one of the overrepresented
categories was ‘‘oxidation reduction’’. Psychosocial stress generally
increases oxidative stress promoting a pro-inflammatory environ-
ment potentially through facilitation of NF-kappa B between stress
and oxidative cellular activation [39,40]. Oxidative phosphoryla-
tion and generation of reactive oxidative species diminishes the
negative effect of stress [41]. In this context, surfacing of oxidation
reduction process in camel among highly abundant biological
processes found in our camel EST database, agrees with camel
being a low tempered species with relatively slow movements [4].
Moreover, this observation agrees with recent findings that camel
milk alleviates oxidative stress [42] and common infections in
camel is associated with a state of oxidative process [43]. There
were 514 camel ESTs matched to human genes that were
associated with oxidation reduction category including cyto-
chrome c oxidase related genes (COX family), ubiquinol-
cytochrome c reductase binding protein (UQCRB), and genes
from proxiredoxin (PRDXx) family. Another GO category
revealed to be significant that stand outs from generally expected
processes is ‘‘sensory perception of smell’’, which is known to be
extremely good in camel [9]. There were 195 camel ESTs
Figure 7. Gene Interaction Network: Most significant network identified by IPA using 8,405 genes found in camel ESTs shared by human, mouse,rat, and bovine. Molecules involved in two most highly associated functions in the network (‘‘hair and skin development and function’’ and ‘‘renal andurological system development’’ are shown in light green with related functional annotation.doi:10.1371/journal.pone.0010720.g007
EST Sequencing of Camel
PLoS ONE | www.plosone.org 15 May 2010 | Volume 5 | Issue 5 | e10720
matched to human genes that were associated with perception of
smell including a broad coverage of olfactory receptors, dopamine
transporter (SLC6A3) and receptor (DRD2) and glutamate
receptors (GRMx).
The list of most frequently matched 50 out of 8,405 genes found
in camel and shared by human, mouse, rat, and bovine was
dominated by globulin inhibitors (ITIH family) and zinc finger
proteins (ZNF family; see Table 9). ZNFx play a role in diverse
functions including lipid binding [44], which may be relevant in
camel as camel uses extensive reservoirs of fat to adapt to its
environment. The top network generated by IPA using shared
genes was associated with hair and skin development, which is
extremely important in camel as its thick coat and fur are among
the most prioritized adaptations in camel. This network, depicted
in Figure 7, holds damage specific DNA binding protein 1 (DDB1)
and cyclin dependent kinase inhibitor 1 (CDKN1B) as its hubs.
DDB1, CDKN1B, along with cullin 4A (CUL4A) and Vpr binding
protein (VPRB) participate in hair and skin development by
functioning in arrest of epithelial cell lines in G1 phase [45] and
G2 phase [46]. The other most significantly associated function
with this network was renal and urological system development,
which are important functionalities in camel as its kidneys and
intestines efficiently retain water as part of camel’s adaptation [9].
This function was facilitated by control of aforementioned four
genes in size of kidney cell lines [47], arrest of kidney cell lines in
G1 phase [45] and G2 phase [46], and arrest of mesangial cells in
G1 phase [48]. In Figure 7, associated functions and genes (in light
green) are shown along with complete interaction of all 35
molecules participating in this network. In IPA analysis of 8,405
genes, most significantly associated pathway with the data set came
out to be ‘‘NRF-2 mediated oxidative stress response pathway’’,
validating the results of independent GO analysis (see Figure 8).
This pathway, which is mostly regulated by mitogen activated
protein kinases –all found in the camel ESTs- is anchored by
NRF-2. NRF-2 is a key regulator of antioxidant response [49],
deficiency of which results in increased quantities of reactive
oxygen species [50]. In Figure 8, we show a part of this pathway
where genes in the input data set are indicated in red.
In order to share our findings with the scientific community, we
developed a web portal hosting the EST database and analysis
results at http://camel.kacst.edu.sa. The web portal is made
public domain with possibility to add sequences to the existing
Figure 8. Canonical Pathway: Most significantly associated pathway (NRF-2 mediated oxidative stress response pathway) by the data set of 8,405genes found in camel ESTs shared by human, mouse, rat, and bovine using IPA. Molecules that exist in the data set are shown in red.doi:10.1371/journal.pone.0010720.g008
EST Sequencing of Camel
PLoS ONE | www.plosone.org 16 May 2010 | Volume 5 | Issue 5 | e10720
database. A number of tools are also made available such as the
ability to BLAST against our EST sequences. The database has
been named CAGBASE, after Camel Genome Database. Through this
web portal, we present a relational database showing all camel
sequences along with corresponding genes and GO terms found
for different species. The web portal accepts queries with GeneID,
gene symbol, gene name, or GO ID to find camel sequences
associated with any one of the query terms. We hope that this web
portal provides a home base for genetic studies regarding Camelus
Dromedarius.
Acknowledgments
Mehmet Inan listed as the fifteenth author of this paper, died before its
publication. The corresponding author, Hasan H. Otu, has therefore
supplied the information regarding his contribution to the manuscript and
his competing interests and it is correct to the best of his knowledge.
Author Contributions
Conceived and designed the experiments: AMAS MMS FMAD EJAY
KAAB MSAA AYAK ANAM FHAQ MMM BMAS SMAQ ASAH MSI
HHO. Performed the experiments: AMAS MMS EJAY MSAA AYAK
MSI. Analyzed the data: MSAA ANAM FHAQ MMM BMAS SMAQ
ASAH KCA HHO. Contributed reagents/materials/analysis tools: AMAS
MMS EJAY ANAM FHAQ MMM BMAS SMAQ ASAH KCA MSI.
Wrote the paper: AMAS MMS FMAD EJAY KAAB AYAK KCA MSI
HHO.
References
1. Al-Swailem AM, Al-Busadah KA, Shehata MM, Al-Anazi IO, Askari E (2007)
Classification of Saudi Arabian camel (Camelus dromedarius) subtypes based onRAPD technique. Journal of Food, Agriculture & Environment 5: 143–148.
2. Emmanuel B, Nahapetian A (1980) Fatty acid composition of depot fats and
rumen wall of the camel (Camelus dromedarius). Comparative Biochemistry
Physiology Part B: Biochemistry and Molecular Biology 67: 701–704.
3. Duncan WRH, Garton GA (1967) The fatty acid composition and intermolec-ular structure of triglycerides derived from different sites in the body of the
sheep. Journal of the Science of Food and Agriculture 18: 99–102.
4. Al-Ani FK (2004) Camel management and diseases. Amman, Jordan: Al-ShraqPrinting Press & Dar Ammar Book Publishing.
5. Muyldermans S (2001) Single domain camel antibodies: current status.
J Biotechnol 74: 277–302.
6. Holt LJ, Herring C, Jespers LS, Woolven BP, Tomlinson IM (2003) Domainantibodies: proteins for therapy. Trends Biotechnol 21: 484–490.
7. Tibary A, Anouassi A, Sghiri A, Khatir H (2007) Current knowledge and future
challenges in camelid reproduction. Soc Reprod Fertil Suppl 64: 297–313.
8. Schmidt-Nielsen K (1979) Desert Animals, Physiological Problems of Heat andWater. New York: Dover Publications Inc.
9. Yagil R (1985) The Desert Camel: Comparative Physiological Adaptation
(Comparative Animal Nutrition). Switzerland: S. Karger AG.
10. Elmahdi B, Sallmann HP, Fuhrmann H, von Engelhardt W, Kaske M (1997)Comparative aspects of glucose tolerance in camels, sheep, and ponies. Comp
Biochem Physiol A Physiol 118: 147–151.
11. Abdel-Fattah M, Amer H, Ghoneim MA, Warda M, Megahed Y (1999)Response of one-humped camel (Camelus dromedarius) to intravenous glucagon
injection and to infusion of glucose and volatile fatty acids, and the kinetics of
glucagon disappearance from the blood. Zentralbl Veterinarmed A 46: 473–481.12. Holler H, Breves G, Lechner-Doll M, Schulze E (1989) Concentrations of
volatile fatty acids and acetate production rates in the forestomachs of grazing
camels. Comp Biochem Physiol B 93: 413–416.
13. Shirazi-Beechy SP, Wood IS, Dyer J, Scott D, King TP () Ruminant Physiology:Digestion, Metabolism, Growth Physiology and Reproduction: Proceedings of
the Eighth International Symposium on Ruminant Physiology; 1994.
14. Kaske M, Elmahdi B, von Engelhardt W, Sallmann HP (2001) Insulinresponsiveness of sheep, ponies, miniature pigs and camels: results of
hyperinsulinemic clamps using porcine insulin. J Comp Physiol B 171: 549–556.
15. Zierath JR, Krook A, Wallberg-Henriksson H (1998) Insulin action in skeletalmuscle from patients with NIDDM. Mol Cell Biochem 182: 153–160.
16. Parkinson J, Blaxter M (2009) Expressed sequence tags: an overview. Methods
Mol Biol 533: 1–12.
17. Ewing B, Green P (1998) Base-calling of automated sequencer traces usingphred. II. Error probabilities. Genome Res 8: 186–194.
18. Ewing B, Hillier L, Wendl MC, Green P (1998) Base-calling of automated
sequencer traces using phred. I. Accuracy assessment. Genome Res 8: 175–185.
19. Li S, Chou HH (2004) LUCY2: an interactive DNA sequence quality trimmingand vector removal tool. Bioinformatics 20: 2865–2866.
20. Mao C, Cushman JC, May GD, Weller JW (2003) ESTAP–an automated
system for the analysis of EST data. Bioinformatics 19: 1720–1722.
21. Edgar RC, Batzoglou S (2006) Multiple sequence alignment. Curr Opin StructBiol 16: 368–373.
22. Smit AF (1999) Interspersed repeats and other mementos of transposable
elements in mammalian genomes. Curr Opin Genet Dev 9: 657–663.
23. Malde K, Schneeberger K, Coward E, Jonassen I (2006) RBR: library-lessrepeat detection for ESTs. Bioinformatics 22: 2232–2236.
24. Pertea G, Huang X, Liang F, Antonescu V, Sultana R, et al. (2003) TIGR Gene
Indices clustering tools (TGICL): a software system for fast clustering of largeEST datasets. Bioinformatics 19: 651–652.
25. Altschul SF, Gish W, Miller W, Myers EW, Lipman DJ (1990) Basic local
alignment search tool. J Mol Biol 215: 403–410.
26. Strausberg RL, Feingold EA, Klausner RD, Collins FS (1999) The mammalian
gene collection. Science 286: 455–457.
27. Ashburner M, Ball CA, Blake JA, Botstein D, Butler H, et al. (2000) Gene
ontology: tool for the unification of biology. The Gene Ontology Consortium.
Nat Genet 25: 25–29.
28. Kawai J, Shinagawa A, Shibata K, Yoshino M, Itoh M, et al. (2001) Functionalannotation of a full-length mouse cDNA collection. Nature 409: 685–690.
29. Knight KL, Burnett RC, McNicholas JM (1985) Organization and polymor-
phism of rabbit immunoglobulin heavy chain genes. J Immunol 134: 1245–1250.
30. Knight KL, Suter M, Becker RS (1988) Genetic engineering of bovine Ig.Construction and characterization of hapten-binding bovine/murine chimeric
IgE, IgA, IgG1, IgG2, and IgG3 molecules. J Immunol 140: 3654–3659.
31. Flanagan JG, Rabbitts TH (1982) Arrangement of human immunoglobulinheavy chain constant region genes implies evolutionary duplication of a segment
containing gamma, epsilon and alpha genes. Nature 300: 709–713.
32. Shimizu A, Takahashi N, Yaoita Y, Honjo T (1982) Organization of the
constant-region gene family of the mouse immunoglobulin heavy chain. Cell 28:499–506.
33. Bruggemann M, Free J, Diamond A, Howard J, Cobbold S, et al. (1986)
Immunoglobulin heavy chain locus of the rat: striking homology to mouseantibody genes. Proc Natl Acad Sci U S A 83: 6075–6079.
34. Butler JE, Brown WR (1994) The immunoglobulins and immunoglobulin genes
of swine. Vet Immunol Immunopathol 43: 5–12.
35. Wagner B, Overesch G, Sheoran AS, Holmes MA, Richards C, et al. (1998)
Organization of the equine immunoglobulin heavy chain constant region genes;III. Alignment of c mu, c gamma, c epsilon and c alpha genes. Immunobiology
199: 105–118.
36. Wagner B, Greiser-Wilke I, Wege AK, Radbruch A, Leibold W (2002)Evolution of the six horse IGHG genes and corresponding immunoglobulin
gamma heavy chains. Immunogenetics 54: 353–364.
37. Rosati M, Marino M, Franze A, Tramontano A, Grimaldi G (1991) Members of
the zinc finger protein gene family sharing a conserved N-terminal module.Nucleic Acids Res 19: 5661–5667.
38. Baghiani A, Harrison R, Benboubetra M (2003) Purification and partial
characterisation of camel milk xanthine oxidoreductase. Arch Physiol Biochem111: 407–414.
39. Bierhaus A, Wolf J, Andrassy M, Rohleder N, Humpert PM, et al. (2003) A
mechanism converting psychosocial stress into mononuclear cell activation. ProcNatl Acad Sci U S A 100: 1920–1925.
40. Morita K, Saito T, Ohta M, Ohmori T, Kawai K, et al. (2005) Expression
analysis of psychological stress-associated genes in peripheral blood leukocytes.
Neurosci Lett 381: 57–62.
41. Dusek JA, Otu HH, Wohlhueter AL, Bhasin M, Zerbini LF, et al. (2008)Genomic counter-stress changes induced by the relaxation response. PLoS One
3: e2576.
42. Al-Hashem FH (2009) Camel’s milk alleviates oxidative stress and lipidperoxidation induced by chronic aluminum chloride exposure in rat’s testes.
American Journal of Applied Sciences 6: 1868–1875.
43. Saleh MA, Al-Salahy MB, Sanousi SA (2009) Oxidative stress in blood of camels
(Camelus dromedaries) naturally infected with Trypanosoma evansi. VetParasitol 162: 192–199.
44. Laity JH, Lee BM, Wright PE (2001) Zinc finger proteins: new insights into
structural and functional diversity. Curr Opin Struct Biol 11: 39–46.
45. Morishita D, Katayama R, Sekimizu K, Tsuruo T, Fujita N (2008) Pim kinasespromote cell cycle progression by phosphorylating and down-regulating
p27Kip1 at the transcriptional and posttranscriptional levels. Cancer Res 68:
5076–5085.
46. Wen X, Duus KM, Friedrich TD, de Noronha CM (2007) The HIV1 proteinVpr acts to promote G2 cell cycle arrest by engaging a DDB1 and Cullin4A-
containing ubiquitin ligase complex using VprBP/DCAF1 as an adaptor. J BiolChem 282: 27046–27057.
47. Terada Y, Inoshita S, Nakashima O, Tamamori M, Ito H, et al. (1999) Cell
cycle inhibitors (p27Kip1 and p21CIP1) cause hypertrophy in LLC-PK1 cells.Kidney Int 56: 494–501.
EST Sequencing of Camel
PLoS ONE | www.plosone.org 17 May 2010 | Volume 5 | Issue 5 | e10720
48. Wolf G, Schroeder R, Zahner G, Stahl RA, Shankland SJ (2001) High glucose-
induced hypertrophy of mesangial cells requires p27(Kip1), an inhibitor ofcyclin-dependent kinases. Am J Pathol 158: 1091–1100.
49. Nguyen T, Huang HC, Pickett CB (2000) Transcriptional regulation of the
antioxidant response element. Activation by Nrf2 and repression by MafK. J BiolChem 275: 15466–15473.
50. Kobayashi M, Yamamoto M (2005) Molecular mechanisms activating the Nrf2-
Keap1 pathway of antioxidant gene regulation. Antioxid Redox Signal 7:
385–394.
EST Sequencing of Camel
PLoS ONE | www.plosone.org 18 May 2010 | Volume 5 | Issue 5 | e10720