(semi) automatic extraction from airborne laser scan data of roads and paths in forested areas
TRANSCRIPT
1
(Semi) automatic extraction from Airborne Laser Scan data of roads and paths in forested areas
Willem. F. Vletter*a,
aVienna Institute of Archaeological Science, Univ. of Vienna, A-1190 Vienna, Franz-Klein Gasse 1, Austria +43-1-4277-404 75.
ABSTRACT
The possibilities of airborne laser scanning as a tool for visualisation and reconstruction of micro topography have been known for some decades. Indeed, in the archaeological field a lot of new features have been detected or reconfirmed. However, the task to map manually the enormous amount of features is time consuming and costly. Therefore, there is a need for automation. In this paper four workflows of visualisation and (semi) automatic extraction of (historical) roads and paths are compared. It proved that the concept of openness is preferred over the break line concept for visualisation. Regarding the extraction the software plug in Feature Analyst showed the best results. Openness and Feature Analyst stand also out when costs and processing time were considered. Therefore, we suggest the workflow which combines openness, for visualisation, and Feature Analyst for extraction. The results of this study contribute to the development of automatic extraction techniques in general. In this regard software packages like eCognition look promising to improve extraction methods.
Keywords: Archaeology, ALS, roads, forest, extraction, break lines, openness, intensity.
1. INTRODUCTION Until recently, the application of prospection techniques in heavily vegetated or forested areas has been very problematic. This has had a negative impact on research of historical roads and paths, especially as they tend to be better preserved in this kind of areas. Over the last decade, Airborne Laser Scanning (ALS) has changed the situation. With this remote sensing technique it is possible to visualise on a large scale the micro topography of landscapes. Moreover, it can also be applied in heavily vegetated or forested areas. Therefore, it is now possible to conduct research on road networks on a large scale in these areas. This is exactly the case in the case study area of the Leitha Hills in Austria, because next to the great amount of archaeological features, there is also a huge quantity of linear features like road, paths and creeks. For the sake of time and money saving, (semi)- automatic extraction of these linear features would be fruitful. On ALS data roads and paths appear as longitudinal components and it is a challenge to separate that kind of components from others components that are detected. Already interesting research to the possibility of extraction of road features has been carried out. Nevertheless, the extraction of road information from LiDAR data on a broad scale is still in its infancy.[7] As a result, work still has to be done for automatic extraction of linear features. [1][2] In this paper an attempt is made to develop a workflow for the extraction of roads and paths in forested areas. Four workflows are tested (see table 1). Each workflow exists out of visualization step and an extraction step. Regarding the visualization we wanted to apply a concept that was able to detect even the subtlest paths. The reason for this is that we are most interested in historical roads and paths. A lot of them are no longer in use. Consequently, over time erosion or human interference could have weakened their outline or even completely faded them away. Therefore, we opted for available visualization techniques which are able to show even subtle changes in micro topology. In the end both the break line and openness concept were selected. Both break lines and openness have been proved to be a good visualization technique [4][12], but none of them have been utilized specific for road extraction in forested areas. Another visualization technique, Local Relief Model developed by Ralf Hesse, was considered. However, a recent study proved it less suitable for the study area and therefore it is not taken into account.[12] *[email protected]; phone +43-1-4277-404 75; fax +43-1-422-9-404; http://ic-archpro.univie.ac.at/
Second International Conference on Remote Sensing and Geoinformation of the Environment (RSCy2014),edited by Diofantos G. Hadjimitsis, Kyriacos Themistocleous, Silas Michaelides, Giorgos Papadavid,
Proc. of SPIE Vol. 9229, 92291D · © 2014 SPIE · CCC code: 0277-786X/14/$18 · doi: 10.1117/12.2069709
Proc. of SPIE Vol. 9229 92291D-1
Downloaded From: http://proceedings.spiedigitallibrary.org/ on 08/20/2014 Terms of Use: http://spiedl.org/terms
1
Further, the intensity characteristic of the LiDAR data was investigated at its usability for visualization, as full waveform data was provided by Technical University of Vienna. Intensity is considered one of the most interesting features of ALS. However because of its complexity, it has been little used. Nevertheless, in this paper it has been tested. Regarding the extraction, we applied the following software packages; STREX, Feature Analyst and eCognition. STREX is built for the break line concept and the only software known for this concept. eCognition has a proven applicability for archaeological features visualized with ALS data.[16] Based on the information provided, Feature Analyst looked promising for feature extraction. The paper has the following outline. First, in chapter two the data used for this paper are dealt with. Then, in chapter three and four, the mentioned visualization concept and extraction software are explained in more detail. In chapter five the results of the four work flows will presented and discussed. Finally, the paper will finish with a conclusion.
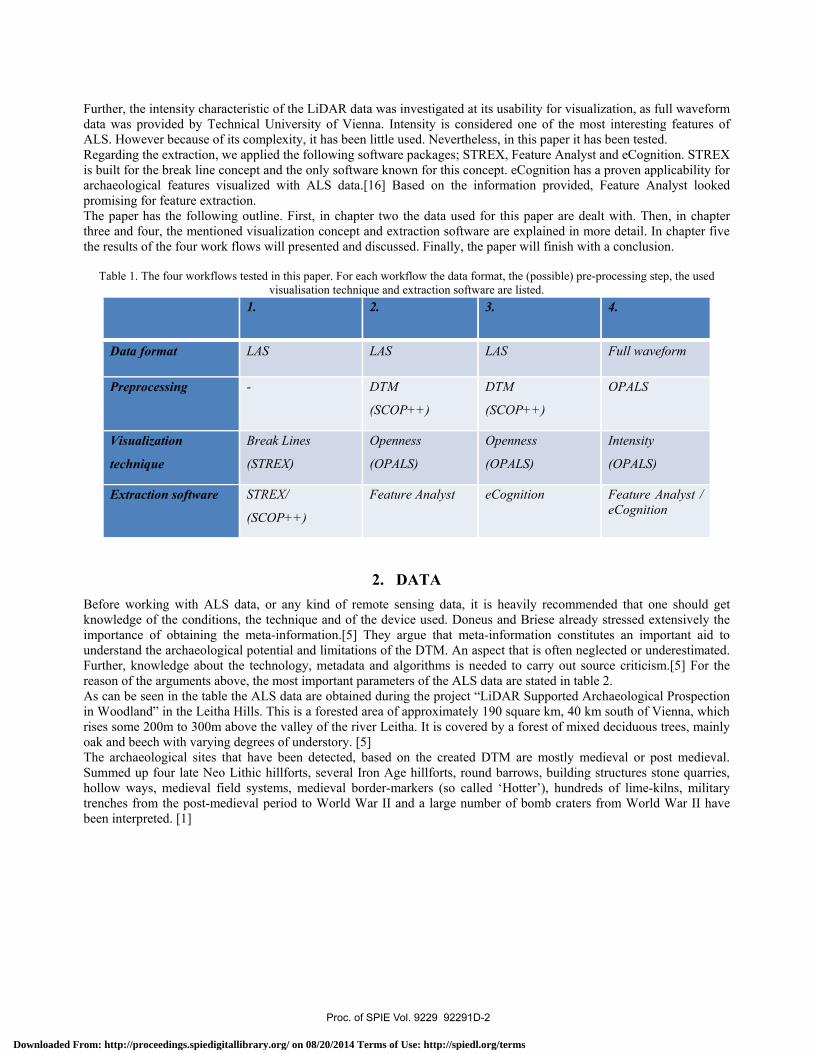
Table 1. The four workflows tested in this paper. For each workflow the data format, the (possible) pre-processing step, the used visualisation technique and extraction software are listed.
1. 2. 3. 4.
Data format LAS LAS LAS Full waveform
Preprocessing - DTM
(SCOP++)
DTM
(SCOP++)
OPALS
Visualization
technique
Break Lines
(STREX)
Openness
(OPALS)
Openness
(OPALS)
Intensity
(OPALS)
Extraction software STREX/
(SCOP++)
Feature Analyst eCognition Feature Analyst / eCognition
2. DATA Before working with ALS data, or any kind of remote sensing data, it is heavily recommended that one should get knowledge of the conditions, the technique and of the device used. Doneus and Briese already stressed extensively the importance of obtaining the meta-information.[5] They argue that meta-information constitutes an important aid to understand the archaeological potential and limitations of the DTM. An aspect that is often neglected or underestimated. Further, knowledge about the technology, metadata and algorithms is needed to carry out source criticism.[5] For the reason of the arguments above, the most important parameters of the ALS data are stated in table 2. As can be seen in the table the ALS data are obtained during the project “LiDAR Supported Archaeological Prospection in Woodland” in the Leitha Hills. This is a forested area of approximately 190 square km, 40 km south of Vienna, which rises some 200m to 300m above the valley of the river Leitha. It is covered by a forest of mixed deciduous trees, mainly oak and beech with varying degrees of understory. [5] The archaeological sites that have been detected, based on the created DTM are mostly medieval or post medieval. Summed up four late Neo Lithic hillforts, several Iron Age hillforts, round barrows, building structures stone quarries, hollow ways, medieval field systems, medieval border-markers (so called ‘Hotter’), hundreds of lime-kilns, military trenches from the post-medieval period to World War II and a large number of bomb craters from World War II have been interpreted. [1]
Proc. of SPIE Vol. 9229 92291D-2
Downloaded From: http://proceedings.spiedigitallibrary.org/ on 08/20/2014 Terms of Use: http://spiedl.org/terms
1
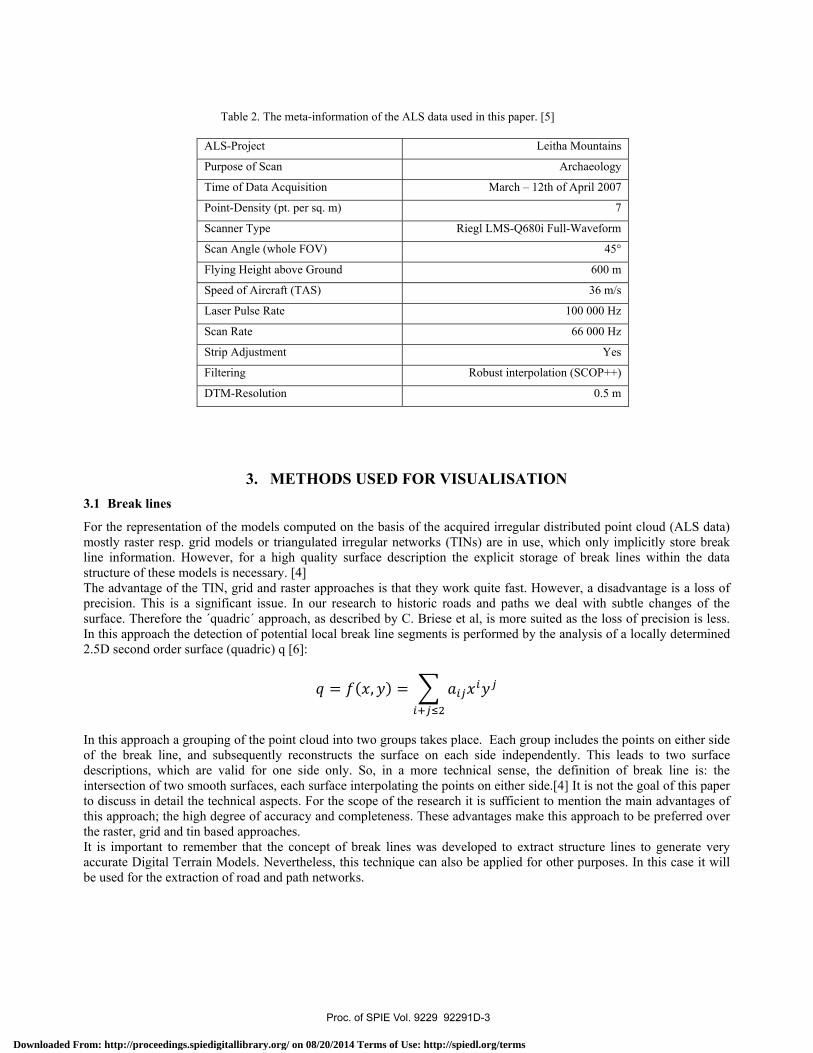
Table 2. The meta-information of the ALS data used in this paper. [5]
3. METHODS USED FOR VISUALISATION 3.1 Break lines
For the representation of the models computed on the basis of the acquired irregular distributed point cloud (ALS data) mostly raster resp. grid models or triangulated irregular networks (TINs) are in use, which only implicitly store break line information. However, for a high quality surface description the explicit storage of break lines within the data structure of these models is necessary. [4] The advantage of the TIN, grid and raster approaches is that they work quite fast. However, a disadvantage is a loss of precision. This is a significant issue. In our research to historic roads and paths we deal with subtle changes of the surface. Therefore the ´quadric´ approach, as described by C. Briese et al, is more suited as the loss of precision is less. In this approach the detection of potential local break line segments is performed by the analysis of a locally determined 2.5D second order surface (quadric) q [6]: = , =
In this approach a grouping of the point cloud into two groups takes place. Each group includes the points on either side of the break line, and subsequently reconstructs the surface on each side independently. This leads to two surface descriptions, which are valid for one side only. So, in a more technical sense, the definition of break line is: the intersection of two smooth surfaces, each surface interpolating the points on either side.[4] It is not the goal of this paper to discuss in detail the technical aspects. For the scope of the research it is sufficient to mention the main advantages of this approach; the high degree of accuracy and completeness. These advantages make this approach to be preferred over the raster, grid and tin based approaches. It is important to remember that the concept of break lines was developed to extract structure lines to generate very accurate Digital Terrain Models. Nevertheless, this technique can also be applied for other purposes. In this case it will be used for the extraction of road and path networks.
ALS-Project Leitha Mountains
Purpose of Scan Archaeology
Time of Data Acquisition March – 12th of April 2007
Point-Density (pt. per sq. m) 7
Scanner Type Riegl LMS-Q680i Full-Waveform
Scan Angle (whole FOV) 45°
Flying Height above Ground 600 m
Speed of Aircraft (TAS) 36 m/s
Laser Pulse Rate 100 000 Hz
Scan Rate 66 000 Hz
Strip Adjustment Yes
Filtering Robust interpolation (SCOP++)
DTM-Resolution 0.5 m
Proc. of SPIE Vol. 9229 92291D-3
Downloaded From: http://proceedings.spiedigitallibrary.org/ on 08/20/2014 Terms of Use: http://spiedl.org/terms
1
3.2 Openness
The concept openness was first introduced by Ryuzo Yokoyama, Mlchlo Shlrasawa, and Richard Pike in 2002 and they defined openness as follows: a parameter expressing the degree of dominance or enclosure of a location on an irregular surface is developed to visualize topographic character. Openness is an angular measure of the relation between surface relief and horizontal distance. For angles less than 90 degrees, it is equivalent to the internal angle of a cone, its apex at a DEM location, constrained by neighbouring elevations within a specified radial distance. Openness incorporates the terrain line-of-sight, or view shed, concept and is calculated from multiple zenith and nadir angles. Openness has two viewer perspectives. Positive values, expressing openness above the surface, are high for convex forms, whereas negative values describe this attribute below the surface and are high for concave forms. Openness values are mapped by grey-scale tones.[11] As opposed to various shading techniques, openness is not subject to directional bias and relief features highlighted by openness do not contain any horizontal displacement, which is imperative for accurate interpretative mapping. Additionally, it offers a clear distinction between relief features and the surrounding topography, while it highlights both the highest and lowest parts of features. This makes openness an ideal tool for mapping and outlining of archaeological features. Furthermore, as openness can outline features, it has the potential to function as a basis for (semi-)automatic classification based on pattern recognition and image classification algorithms.[11] This makes openness very interesting as most of the visualization techniques help the user to perceive archaeological and palaeoenvironmental features, but not all of them are helpful when trying to delineate individual structures during interpretative mapping.[12] 3.3 Intensity
Another possible technique for the visualisation of road and paths is intensity. It is defined as the characterisation of the backscattered signal strength of an echo. However, often this specification is not accurately defined. In that the term intensity can for example express the maximum as well as the total energy of one echo.[13] In our case we will estimate the signal intensity as the product of the full waveform attributes amplitude and echo width.[14] This means that for calculation of the intensity we need the full wave recording. The main value of using a full-waveform recording scanner is the availability of additional physical observations of the reflecting surface elements, which can be useful for object classification.[2] In the full waveform format these additional physical observation are stored. As mentioned above for our purposes, we need for the calculation of the intensity the echo width and the amplitude. The echo width provides us information on the range distribution of all the small individual scatters contributing to one echo. The amplitude gives information about the radiometric scattering properties of the illuminated targets that contribute to one echo. For example if the echo width is small, a rather flat surface element was illuminated. However, when it is large, scatters at different ranges contribute to the one determined echo.[6] In addition, the amplitude can give us extra information on the quality of the reflection. Nevertheless, the difficulty is to use the amplitude for classification purposes. The reason for this is that different effects like footprint area, the scattering directionality, size, topography, vertical distribution, and reflectivity of the target contribute to single amplitude. The recorded intensity values are very noisy and additionally, a lot of systematic effects can be recognised due to the fact that these intensities are not calibrated.[4] This makes it rather complicated to use intensity for classification purposes and explains why the intensity of the received echo is very rarely used. Nevertheless, through using amplitude and echo width to calculate intensity, it is possible to investigate the return signal and extract additional ground characteristics, as was shown in earlier tests in the research area.[6]
4. SOFTWARE APPLICATIONS FOR EXTRACTION 4.1 STREX
In order to extract break lines from ALS data the software package STREX was used. STREX stands for structure line extraction. This package has been developed by the Technical University of Vienna. Applying this package is not only useful for the goal of this research, but also contributes to general investigation of the local adoption of processing parameters.[4] It makes use of an algorithm that for each point in the point cloud calculates the curvature within a certain number of surrounding points. STREX software runs in a DOS environment. It has three processing steps (command lines); detection of structure line (strex.exe), the break line finder (breaklf.exe) and post processing structure line data (strexp.exe). They run in the mentioned order. However, it possible to run all the processing steps separately in the DOS shell. Strex.exe allows the extraction of structure line segments (initial start segments) based on point cloud data. Breaklf.exe models structure lines
Proc. of SPIE Vol. 9229 92291D-4
Downloaded From: http://proceedings.spiedigitallibrary.org/ on 08/20/2014 Terms of Use: http://spiedl.org/terms

1
based on surrounding point cloud data and given 2D start-segments (result of STREX or manual input). Strexp.exe allows the refinement of the automatically generated lines. Each processing step consists out of a set of arguments (parameters), which can be changed. According to changed settings different output will be generated. 4.2 Feature Analyst
Feature Analyst is software plug-in tool from GeoEye and is compatible with ArcGIS and Erdas Imagine. As accounts for STREX also Feature Analyst has parameters, which should be optimised to get the best results. The first step is digitising a training set and the software is run. It can be followed up by different steps which eventually lead to a model that can be used for batch processing. It is a quite easy and straightforward software package. 4.3 eCognition
A last software package that is tested is eCognition. This package has a lot of possibilities and it goes beyond the scope of this paper to explain it in detail. The most important notion to make is that it can work both with radiometric and geometric characteristics, also in combination. Like in Feature Analyst a model must be built, which can be used for batch processing. It has already proved to deliver excellent results for extracting archaeological features in a short time, less than a day.[16] However, before eCognition can be fully exploited the program has to be learned and this takes some time.
5. RESULTS AND DISCUSSION . Some aspects of the break line approach in STREX of workflow 1 are worthwhile to take a closer look at. For example the delineation of the whole line is not performed by the connection of neighboured and similar oriented break line segments. Instead of this procedure the concept of break line growing was utilised. Immediately the question rises which concept is more adapted for connecting break line segments (part of roads) to create a network. Therefore further research for the determination of a reliable break line network is needed. Regarding the break line growing procedure, it needs improvement in areas of strongly curved lines.[5] The refinement (strexp.exe) step is also intriguing. On the one hand it removes short gaps, which seems positive, for creating a network. However, on the other hand in this step also short line elements are removed. However, these short line elements could be remains of historic (not vanished) roads and paths, and therefore of interest. For this reason this step was left out. The results of STREX can be seen in figure 4. A disadvantage of the technique is that two or more lines can be depicted for roads and paths, especially the ones which have strong edges (“breaks”) on either side. This happens mainly with the broader (modern) roads. As the research is more focused on subtle roads, the problem of plural linear features for one road is an issue of minor importance. In trying to optimize the final results a trade-off must be made between the quantity and quality. In other words, changing the parameters of the different steps to increase the number of extracted linear features leads not only to a higher number of roads or paths but also to higher number of noise features. This kind of trade-offs accounts for all three methods applied in this article. Both researchers tried separately the STREX software and came more or less to the same parameters settings. Another disadvantage is that before the results of the post processing (refinement) can visualised in ArcGIS a conversion has to be carried out in another software of the TU, SCOP ++. A solution for combining different kind of roads (based on different parameter settings) would be using the Merge application in ArcGIS. This works fine, but constitutes an extra elaboration step and thus time. It necessary to mention that in work flow 1 the visualisation and extraction are both carried out in STREX. Before discussing openness, used in both workflow 3 and 4, it is interesting to take a look at the input DTM. The provided DTM was created by using robust interpolation (RI) in SCOP++. This interpolation flattens to a certain degree micro topographic features.[1] Immediately the question arises how this influences the visibility of subtle road and path features on the DTM. Therefore, when the results of the extraction techniques are confronted with the DTM, one should be aware that some of the subtle path and tracked features have been flattened out. One should also remind that RI filtering results in a DTM, which is one of the possible representations of the relief. We applied the concept of openness within in the software package OPALS of the Technical University of Vienna (TU). Is an acronym of Orientation and Processing of Airborne Laser Scanning data.This software package has a module called openness. The module is run in a DOS environment. After several test runs it was concluded that openness with a kernel size of 5 led to the best results, as with this setting also subtle linear features were detected.
Proc. of SPIE Vol. 9229 92291D-5
Downloaded From: http://proceedings.spiedigitallibrary.org/ on 08/20/2014 Terms of Use: http://spiedl.org/terms
A possible fvisualisation geographical processing isbetween HDRreason it was Another comcomplete covpart lacked. Tpaths would hThe TUV proimported in thadded (echo wIn the figure that scarcely and break linintensity regathe fact the dAnother posssurroundingsmade for thissurfaces withreflectance daimprovementAs the qualityflow 4. Also or there were
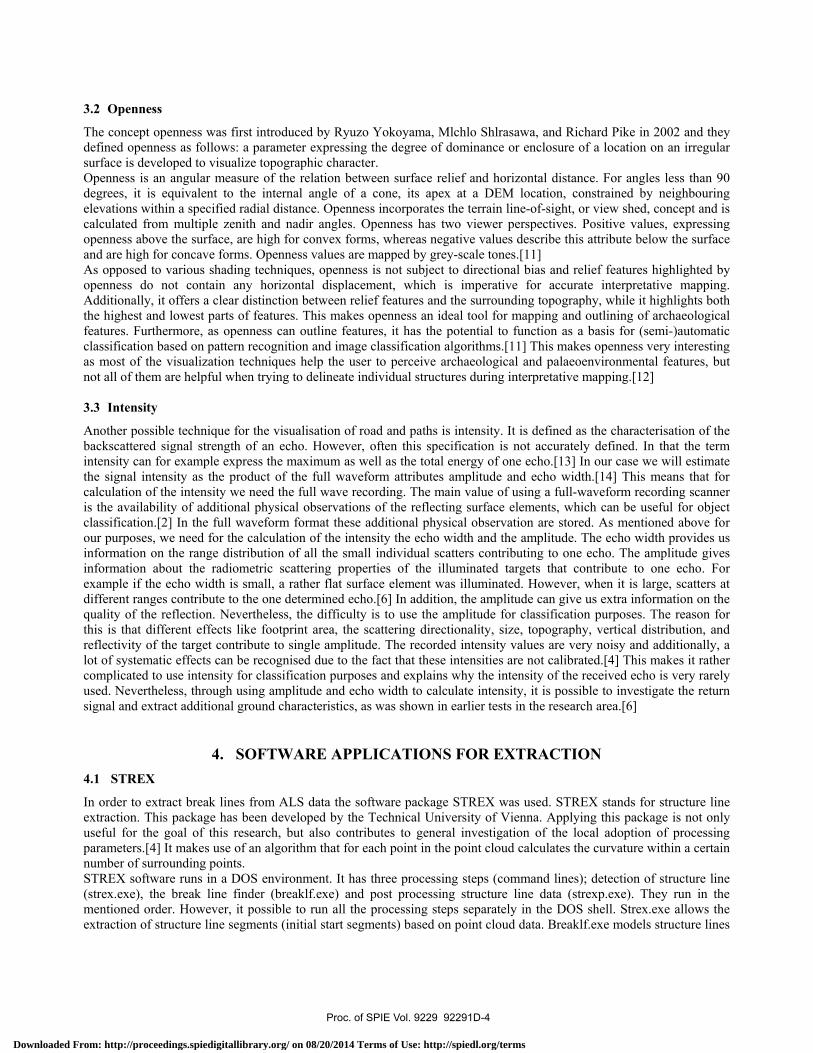
Figure 1. the s
In the extractin tool from
following up can be improinformation.
s probable, it R elaborated decided to su
mplication emeverage (areas wTherefore forhave to be draovided a tile ohe OPALS sofwidth multipli1 the outcomany water flo
nes, where it arding opennedata comes frsible reason m. Nevertheless objective. Hhin the projecata were not t, that it wouldy differed so other package some not reso
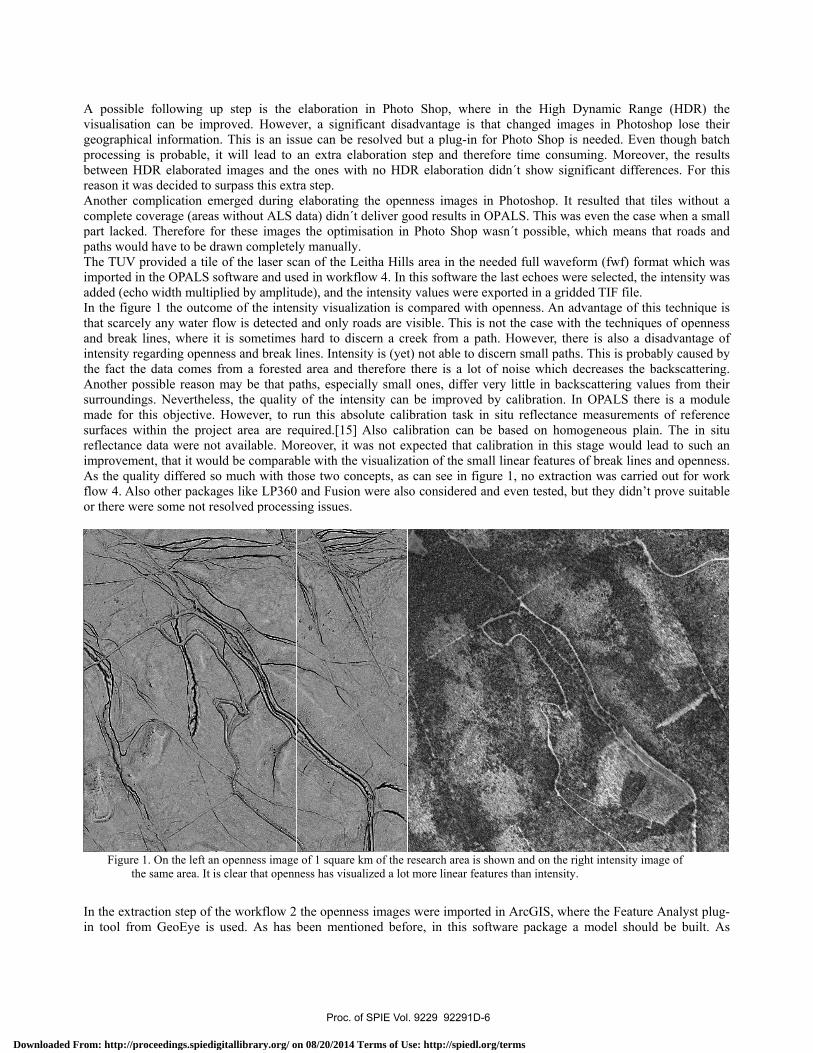
On the left an oame area. It is c
tion step of thGeoEye is u
step is the oved. HowevThis is an isswill lead to images and t
urpass this extrerged during without ALS dr these imagesawn completelof the laser scftware and usied by amplitu
me of the intenow is detectedis sometimes
ess and break lrom a forestedmay be that pas, the quality
However, to rct area are reavailable. Mod be comparabmuch with thes like LP360olved process
openness imageclear that openn
e workflow 2 used. As has b
elaboration iver, a significsue can be rean extra elab
the ones with ra step. elaborating thdata) didn´t ds the optimisaly manually. can of the Leited in workflowude), and the insity visualizad and only roa
hard to discelines. Intensityd area and thaths, especiall
y of the intensrun this absolequired.[15] Aoreover, it wable with the vhose two conc0 and Fusion wsing issues.
e of 1 square kmness has visuali
the opennessbeen mention
in Photo Shocant disadvantsolved but a p
boration step ano HDR elab
he openness eliver good reation in Photo
tha Hills areaw 4. In this sointensity valueation is compaads are visibleern a creek fry is (yet) not aerefore there ly small onessity can be imlute calibratioAlso calibratioas not expecteisualization o
cepts, as can swere also cons
m of the researcized a lot more
s images werened before, in
op, where in tage is that cplug-in for Phand thereforeboration didn
images in Phesults in OPALo Shop wasn
a in the neededoftware the lases were exporared with opee. This is not trom a path. Hable to discernis a lot of no
s, differ very mproved by con task in situon can be baed that calibraf the small lin
see in figure 1sidered and ev
ch area is shownlinear features t
imported in An this softwar
the High Dychanged imaghoto Shop is n time consum
n´t show signi
hotoshop. It reLS. This was ´t possible, w
d full wavefost echoes wererted in a griddnness. An advthe case with
However, thern small paths.oise which delittle in backs
calibration. In u reflectance sed on homo
ation in this stnear features o1, no extractioven tested, bu
n and on the rigthan intensity.
ArcGIS, wherre package a
ynamic Rangges in Photoshneeded. Even
ming. Moreovificant differe
esulted that teven the case
which means t
rm (fwf) forme selected, theed TIF file. vantage of thithe technique
re is also a di This is proba
ecreases the bscattering valu
OPALS thermeasurement
ogeneous plaintage would leof break lines on was carriedut they didn’t
ght intensity ima
re the Feature model should
1
ge (HDR) thehop lose their
n though batchver, the resultsences. For this
iles without ae when a smalthat roads and
mat which wase intensity was
is technique ises of opennessisadvantage oably caused bybackscatteringues from theire is a modules of referencen. The in situead to such anand openness
d out for workprove suitable
age of
Analyst plugd be built. As
1
e r h s s
a ll d
s s
s s f y
g. r e e u n s. k e
-s
Proc. of SPIE Vol. 9229 92291D-6
Downloaded From: http://proceedings.spiedigitallibrary.org/ on 08/20/2014 Terms of Use: http://spiedl.org/terms
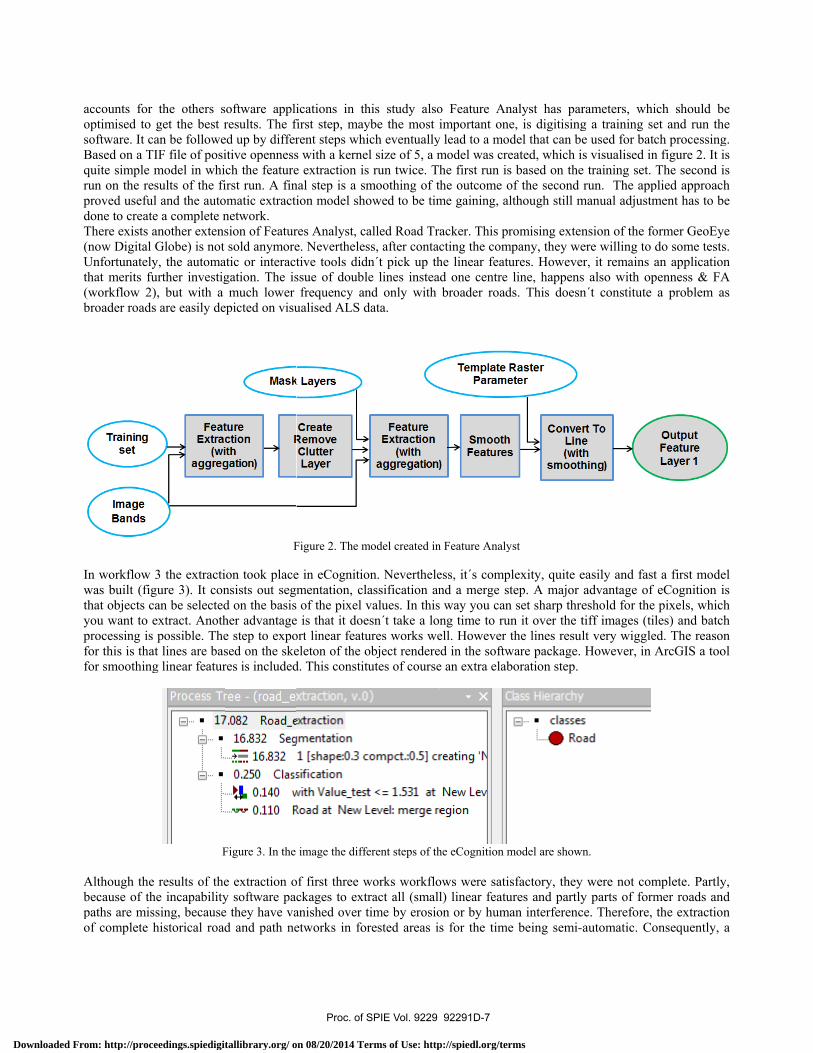
accounts for optimised to software. It cBased on a Tquite simple run on the reproved usefuldone to createThere exists a(now Digital Unfortunatelythat merits fu(workflow 2)broader roads
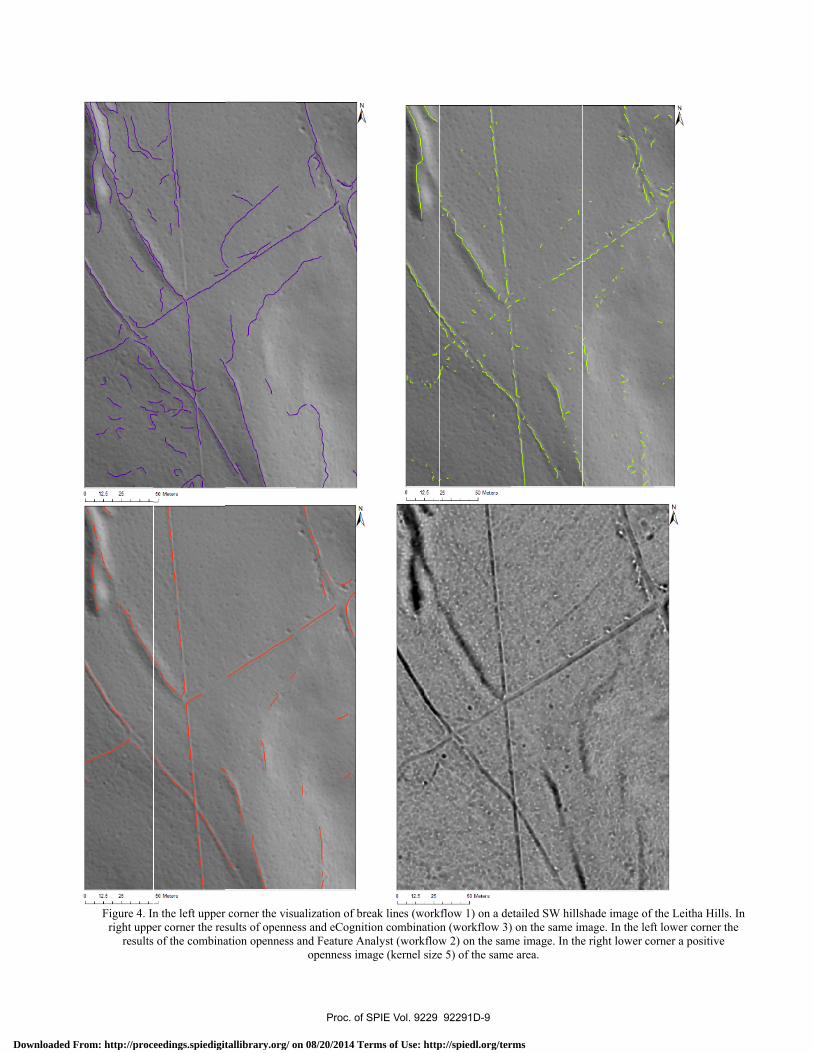
In workflow was built (figthat objects cyou want to eprocessing is for this is thafor smoothing
Although thebecause of thpaths are misof complete h
the others sget the best ran be followeIF file of posimodel in whisults of the fil and the autoe a complete nanother extensGlobe) is not y, the automaurther investig), but with a s are easily de
3 the extractigure 3). It concan be selectedextract. Anothpossible. The
at lines are basg linear featur
F
e results of thehe incapabilityssing, becausehistorical road
software appliresults. The f
ed up by differitive opennessch the featureirst run. A finomatic extractinetwork. sion of Featursold anymore
atic or interactgation. The ismuch lower
epicted on visu
F
ion took placensists out segmd on the basisher advantagee step to exposed on the skeres is included
Figure 3. In the
e extraction oy software pace they have vad and path ne
ications in thfirst step, mayrent steps whis with a kernee extraction isnal step is a smion model sho
res Analyst, cae. Neverthelestive tools didnssue of doublfrequency an
ualised ALS d
Figure 2. The m
e in eCognitiomentation, cla of the pixel v
e is that it doeort linear featueleton of the od. This constitu
image the diffe
of first three wckages to extranished over tetworks in for
his study alsoybe the most iich eventuallyl size of 5, a m
s run twice. Thmoothing of towed to be tim
alled Road Trss, after contacn´t pick up the lines insteand only with data.
model created in
on. Nevertheleassification anvalues. In thisesn´t take a loures works weobject rendereutes of course
erent steps of th
works workfloract all (smalltime by erosiorested areas is
o Feature Animportant one
y lead to a modmodel was crehe first run isthe outcome ome gaining, al
acker. This prcting the comhe linear featud one centre broader road
n Feature Analy
ess, it´s complnd a merge sts way you canng time to runell. However ted in the softwe an extra elab
he eCognition m
ows were satisl) linear featuon or by humas for the time
nalyst has pare, is digitisingdel that can beeated, which is based on theof the second lthough still m
romising extenmpany, they we
ures. Howeveline, happens
ds. This doesn
yst
lexity, quite etep. A major
n set sharp thren it over the tthe lines resul
ware package. boration step.
model are shown
sfactory, they ures and partlyan interference being semi-
rameters, whig a training see used for bats visualised in
e training set. run. The app
manual adjustm
nsion of the foere willing to r, it remains
s also with opn´t constitute
easily and fastadvantage of eshold for thetiff images (tilt very wiggleHowever, in
n.
y were not comy parts of formce. Therefore, automatic. Co
1
ich should beet and run thech processingn figure 2. It isThe second is
plied approachment has to be
ormer GeoEyedo some testsan applicationpenness & FAa problem as
t a first modeeCognition is
e pixels, whichles) and batch
ed. The reasonArcGIS a too
mplete. Partlymer roads andthe extraction
onsequently, a
1
e e
g. s s h e
e s. n A s
el s h h n l
y, d n a
Proc. of SPIE Vol. 9229 92291D-7
Downloaded From: http://proceedings.spiedigitallibrary.org/ on 08/20/2014 Terms of Use: http://spiedl.org/terms

1
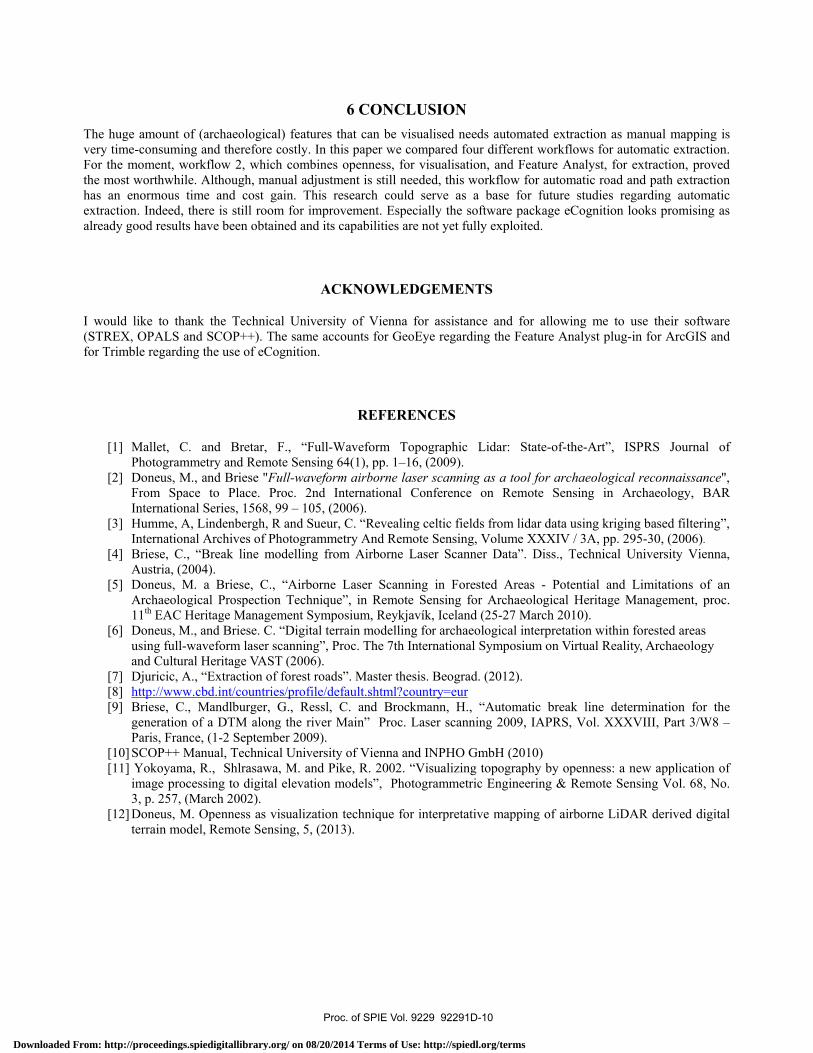
following up step will be the manual mapping of missing parts and connecting them. Comparing the three (remained) workflows, we can establish the difference in quality. The combination of openness and Feature Analyst, work flow 2; didn’t face, or at least far less, the problems of “double lines” of workflow 1 (STREX with break lines). Further, it doesn´t have neither the issue of creeks and roads, and different roads becoming one feature. Moreover, workflow 2 demonstrated less noise, smoother lines and better connectivity than workflow 1. On the other hand workflow 1 seems better capable of detecting subtle features. However, a lot of them are probably not a road or a path. Workflow 2 has smoother and longer lines than workflow 3 (openness & eCognition). Also workflow 1 has longer line segments than workflow 3. This workflow performs better regarding detecting of subtle features. Nevertheless, this is only a very small advantage. Therefore, regarding quality, workflow 2 is preferred over workflow 1 and workflow 3. In figure 4 the results of these workflows are displayed. Regarding the extraction methods we can establish that the STREX method and the combined method of Openness and Feature Analyst have been intensively investigated. Nevertheless, there is probably room for improvement. This is even more the case for eCognition. This software package has a lot of functionalities and tools. A major drawback is the huge of amount of time needed to really get acquainted with its capabilities. Unfortunately time was lacking. However, the results obtained by creating a simple model make this package interesting.
Next to quality, time is of course an important issue. We can split time in processing time and testing time. With the latter is meant the time needed to get acknowledged with the software and to optimize the model or settings. It is hard to quantify the testing time, because it is difficult to measure. However, an estimation based on experience suggests that one needs at least a couple of weeks to get to know STREX. The same accounts more or less for Feature Analyst and OPALS. As stated, for eCognition is much more time needed, as it is less straightforward. The processing time of the different methods are shown in table 3. It shows clearly that STREX needs much more processing time than the other software packages. The time range of 78 till 84 minutes of STREX depends on which mode is used for selecting points. One can choose between a certain number around the point of interest or the points which fall in a certain window size around the point of interest. The latter option takes more time. Intensity (OPALS) needs less time, but the quality is not sufficient. The differences become more important as the number of tiles increases. The laser scan of the Leitha hills area exists out of some 190 tiles of 1 square kilometer. As time gain is a main reason for the application of an extraction technique it is clear that both Feature Analyst and eCognition stand out. Combining the results of the quality of the extraction of the workflows with the processing time they need, we propose the combination of Feature Analyst and openness as a workflow for extraction road and paths from ALS data in forested areas. In the end we batch processed the model created in Feature Analyst. In less than one working day (8 hours) almost 12.000 km of linear features were extracted for an area of around 190 square kilometres, based on existing DTM´s. At least 90 % consists out of roads and paths.
Table 3. In the table the (aggregated) calculated processing time of the four workflows are shown for a forested area of 1000 x 1000 meters (1 tile) in the Leitha Hills (Austria).
Time 1. 2. 3. 4.
Data Format LAS LAS LAS Full wafeform
Preprocessing - DTM (SCOP++) 16 Min.
DTM (SCOP++) 16 min
OPALS
Visualisation technique
Break Lines (STREX)
Openness (OPALS) 1 min.
Openness (OPALS) 1 min.
Intensity (OPALS) 8-9
Extraction software STREX/ SCOP ++
Feature Analyst 1-2 min
eCognition 1-2 min
Estimated 1-2 min
Total time 74-84min 19 min 19 min 9-11 min
Proc. of SPIE Vol. 9229 92291D-8
Downloaded From: http://proceedings.spiedigitallibrary.org/ on 08/20/2014 Terms of Use: http://spiedl.org/terms
1
1
Figure 4. In the left upper corner the visualization of break lines (workflow 1) on a detailed SW hillshade image of the Leitha Hills. In right upper corner the results of openness and eCognition combination (workflow 3) on the same image. In the left lower corner the
results of the combination openness and Feature Analyst (workflow 2) on the same image. In the right lower corner a positive openness image (kernel size 5) of the same area.
Proc. of SPIE Vol. 9229 92291D-9
Downloaded From: http://proceedings.spiedigitallibrary.org/ on 08/20/2014 Terms of Use: http://spiedl.org/terms
6 CONCLUSION The huge amount of (archaeological) features that can be visualised needs automated extraction as manual mapping is very time-consuming and therefore costly. In this paper we compared four different workflows for automatic extraction. For the moment, workflow 2, which combines openness, for visualisation, and Feature Analyst, for extraction, proved the most worthwhile. Although, manual adjustment is still needed, this workflow for automatic road and path extraction has an enormous time and cost gain. This research could serve as a base for future studies regarding automatic extraction. Indeed, there is still room for improvement. Especially the software package eCognition looks promising as already good results have been obtained and its capabilities are not yet fully exploited.
ACKNOWLEDGEMENTS
I would like to thank the Technical University of Vienna for assistance and for allowing me to use their software (STREX, OPALS and SCOP++). The same accounts for GeoEye regarding the Feature Analyst plug-in for ArcGIS and for Trimble regarding the use of eCognition.
REFERENCES
[1] Mallet, C. and Bretar, F., “Full-Waveform Topographic Lidar: State-of-the-Art”, ISPRS Journal of Photogrammetry and Remote Sensing 64(1), pp. 1–16, (2009).
[2] Doneus, M., and Briese "Full-waveform airborne laser scanning as a tool for archaeological reconnaissance", From Space to Place. Proc. 2nd International Conference on Remote Sensing in Archaeology, BAR International Series, 1568, 99 – 105, (2006).
[3] Humme, A, Lindenbergh, R and Sueur, C. “Revealing celtic fields from lidar data using kriging based filtering”, International Archives of Photogrammetry And Remote Sensing, Volume XXXIV / 3A, pp. 295-30, (2006).
[4] Briese, C., “Break line modelling from Airborne Laser Scanner Data”. Diss., Technical University Vienna, Austria, (2004).
[5] Doneus, M. a Briese, C., “Airborne Laser Scanning in Forested Areas - Potential and Limitations of an Archaeological Prospection Technique”, in Remote Sensing for Archaeological Heritage Management, proc. 11th EAC Heritage Management Symposium, Reykjavík, Iceland (25-27 March 2010).
[6] Doneus, M., and Briese. C. “Digital terrain modelling for archaeological interpretation within forested areas using full-waveform laser scanning”, Proc. The 7th International Symposium on Virtual Reality, Archaeology and Cultural Heritage VAST (2006).
[7] Djuricic, A., “Extraction of forest roads”. Master thesis. Beograd. (2012). [8] http://www.cbd.int/countries/profile/default.shtml?country=eur [9] Briese, C., Mandlburger, G., Ressl, C. and Brockmann, H., “Automatic break line determination for the
generation of a DTM along the river Main” Proc. Laser scanning 2009, IAPRS, Vol. XXXVIII, Part 3/W8 – Paris, France, (1-2 September 2009).
[10] SCOP++ Manual, Technical University of Vienna and INPHO GmbH (2010) [11] Yokoyama, R., Shlrasawa, M. and Pike, R. 2002. “Visualizing topography by openness: a new application of
image processing to digital elevation models”, Photogrammetric Engineering & Remote Sensing Vol. 68, No. 3, p. 257, (March 2002).
[12] Doneus, M. Openness as visualization technique for interpretative mapping of airborne LiDAR derived digital terrain model, Remote Sensing, 5, (2013).
Proc. of SPIE Vol. 9229 92291D-10
Downloaded From: http://proceedings.spiedigitallibrary.org/ on 08/20/2014 Terms of Use: http://spiedl.org/terms

1
[13] http://www.geo.tuwien.ac.at/opals/html/ref_glossary.html#ref_gloss_intensity [14] http://www.geo.tuwien.ac.at/opals/html/ModuleAddInfo.html [15] http://www.geo.tuwien.ac.at/opals/html/ModuleRadioCal.html [16] Pregesbauer, M. “Object versus Pixel – Classification Techniques for high resolution airborne remote sensing
data” Proc. 10th International Conference on Archaeological Prospection. Wien, Austria, 29.05.-02.06.2013. 200–202. (2013)
Proc. of SPIE Vol. 9229 92291D-11
Downloaded From: http://proceedings.spiedigitallibrary.org/ on 08/20/2014 Terms of Use: http://spiedl.org/terms