seismic velocities of fractured carbonate rocks (southern apennines, italy)
TRANSCRIPT
Geophys. l. Int. (1993) 113,739-746
Seismic velocities of fractured carbonate rocks (southern Apennines,Italy)
F. M. Guadasno and C. NunziataDipartimento di Geofrtica e Vulcanologia, Uniuersita' di Napoli 'Federico II', Largo S. Marcellino 10, 80138 Napoli, Italy
Accepted 1992 November 9. Received 1992 May 15; in original form 1992 February 6
S U M M A R YA study of the effect of fractures on seismic velocities has been carried out through acomparative study in the field and the laboratory. P- and S-wave velocities wereobtained from surface and borehole seismic measurements and, in the laboratory,ultrasonic velocities were measured on intact and artificially fractured specimens ofcarbonate rocks from the Miranda area (southern Apennine chain, Italy). Calca-reous and calcareous-chert sequences are present in the area, with a discontinuityspacing from very close to very wide. Essentially dry rocks have been tested.
A correspondence was found between visible rock fracturing and compressionalwave velocities from surface seismic measurements. The downhole velocities werelov/er than the corresponding ultrasonic velocities on core specimens and increasedwith depth. Specimens vr'ere then cut to simulate field discontinuities, and loaded tostudy the influence of vertical pressure on the seismic velocities. Laboratory andfield velocities were finally compared as functions of vertical pressure. It turns outthat fractures reduce and vertical pressure increases velocities. Since the rock qualitydesignation (RQD) indices were generally very low, the increasing seismic velocitieswith depths in poor quality rocks can be explained in terms of better contactbet\ryeen fracture surf aces.
Key words: carbonate fractured rocks, seismic velocities.
INTRO DU CTIO N
Rock formations are generally characterized by the presenceof structural discontinuities such as joints, faults and beddingplanes, which can be relaîed to sedimentary, tectonic andweathering processes.
The study of rock ftactures and the pertinent knowledgeof rock quality are important for the solution of manyengineering geology problems, such as the positioning offoùndations or the stabilization of landslide areas (Goodman1989).
The influence of ftactures and cracks on the elasticpropeÍies of rocks has long been recognized (King, Stauffer& Pandit 1978; Hajral et al. 1983; King, Myer & Rezowalli1986). The effects are evideDt in laboratory measurements ofultrasonic velocities as a function of pressure. Increasing theconf,ning pressure causes a marked increase in ultrasonicvelocities and this is particularly the case when the rocks aredry. This effect is primarily due to the closing of cracks(Adams & Williamson 1923; Birch 1960, 1961; Walsh 1965a,b; 1968; 1969).
Theoretical studies sÌrggest that seismic velocities in
fractured rocks are most dependent upon ftacture density,degree of preferred orientation and degree of fluidsaturation (Garbin & Knopoff 1973: O'Connell & Budiansky1974, Crampin 1980; Hudson 1981, 1988; Yang & King1986).
Field measurements show that P- and S-wave velocities infractured rocks are related to macrofracture density (Moos& Zoback 1983). Other authors have explored the feasibilityof locating and characterizing fractures based on velocityanisotropy (Leary & Henyey 1985; King er cl 1986).
The comparison of field seismic velocities with laboratoryvelocities helps to undentand the mechanism by whichftactures affect velocities irr sifa. For example, Simmons &Nur (1968) found that field P-wave velocities of graniteswere higher than laboratory measurements on dry samples;this discrepancy was attdbuted to the presence of water inmicrocracks in situ. h highly fractured rocks, when therocks are dry or partially water saturated, in situ P-wa',/evelocities are less than laboratory ones (Stierrnen & Kovach1979; Sjogren, Ofsthus & Sandberg 1979).
In this paper we present seismic measurements carried outboth i'? sitll and in the laboratory in an attemot to
739

740 F. M. Guadagno and C. Nunziqta
unde$tand the factors controlling seismic velocities inessentially dry calcareous ftactured rocks. 1z slrz seismicvelocities were measured in rocks with diferent degrees offtacturing. Laboratory ultrasonic velocities were measuredas a function of pressure on intact and artificially fracturedspecimens recovered from core drilling. 1z slra andlaboratory seismic velocities are then compared in order toexplain the field velocities and their change \ùith depth.
G E O L O G I C A L B A C K G R O U N D
Carbonate forrnations outcrop wideìy along the ItalianApennine chain. Such formations have suffered the effectsof the tectonic phases responsible for the Apennine uplift.The area studied is located in the Campania MoliseApennine sector (Fig. 1), It is characterized by the outcropof calcareous-chert sequences for over 300 m. These
5
i
i
a(
Figure 1' Geological map and section of the Miranda area. 1-Detritus; 2- {alcirudites, calcarenites and calcilutites (Campanian-Maastrichtian); 3- {alcilutitic, caìcarenitic and calciruditic beds (0.1-0.5 cm) altemating with yellow and red cherty limestones(Cenomanian Senonian); 4-fault; s-boundary; 6-attitude of b€dding; ?-section; S---surface seismic measurements; g-borehole.
5
i l
f t
s6I
ft
ci
d
Tis
i.clm
F
c,I N
Hrh
M iranda
2a . s . l .
M i ra n d a
Eîect of fractures on seismic velocities 741
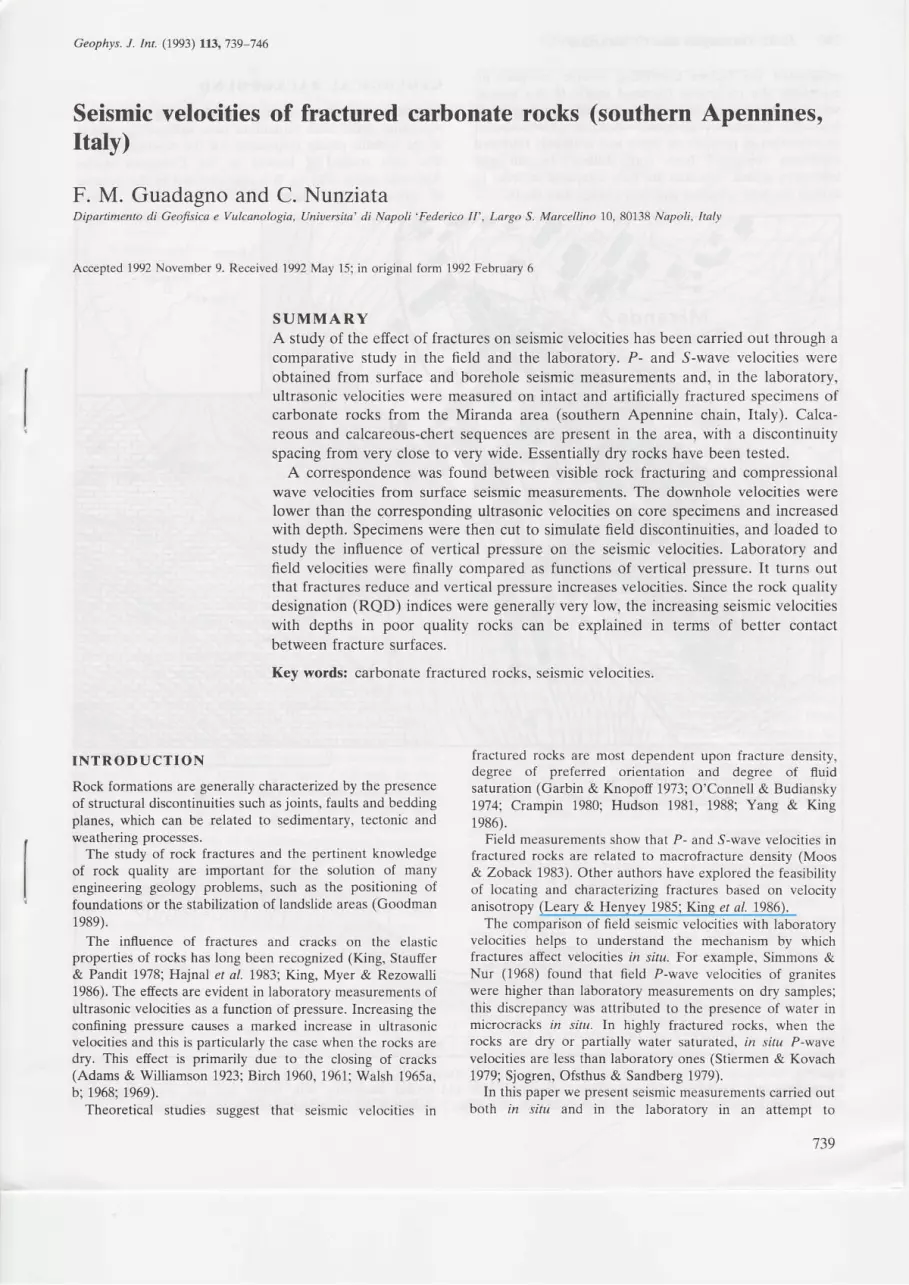
fìgùre 2. The Schmidt stereographic diagnm of the discontinuityattitudes showing interseciing fmcture planes. For comparison thepoles of seismic measurement planes are also reported.
sequerces belong to the Mesozoic Molise basin (Ippolito etal. 19'Ì3), aîd are dislocated by fold structures and faultsystems. Fig. 1 shows the geological setting of the area,characterized by two formations. The younger formationconsists of totally calcareous layers (0.5-2 m thick); theolder is a sequence of calcareous laye$ (0.1-0.5m thick)*'ith chert interbedding at intervals.
The Schmidt stereographic representation (Fig. 2) of thestructural discontinuity attitudes shows that fracture planesare intersecting and, therefore, rock bodies are fracturedinto blocks. The dimensions of the rock blocks are afunction of the fracture spacing. Following the InternationalSociety of Rock Mechanics (ISRM) classification (1981),field investigations generally indicate very closely spaced(<6cm) fractures in the cherty-calcareous formaîion andmoderately to widely spaced fractures (>20cm) in thecalcareous formation, These observations are also consistentwith findings of Price (1966) who noted that lithotypes withdifferent layer thicknesses show different fracture densities.The high fracture density of the cherty-calcareous formationis also confirmed by RQD indices (Deere 1963) which aregenerally lower than 10 per cent, and only occasionallyreach 50 per cent. The examined rock masses can beclassified from 'very poor' to 'poor', aIld therefore, theymust be considered as a discontinuous geological sysîem.
F I E L D S E I S M I C S U R V E Y S
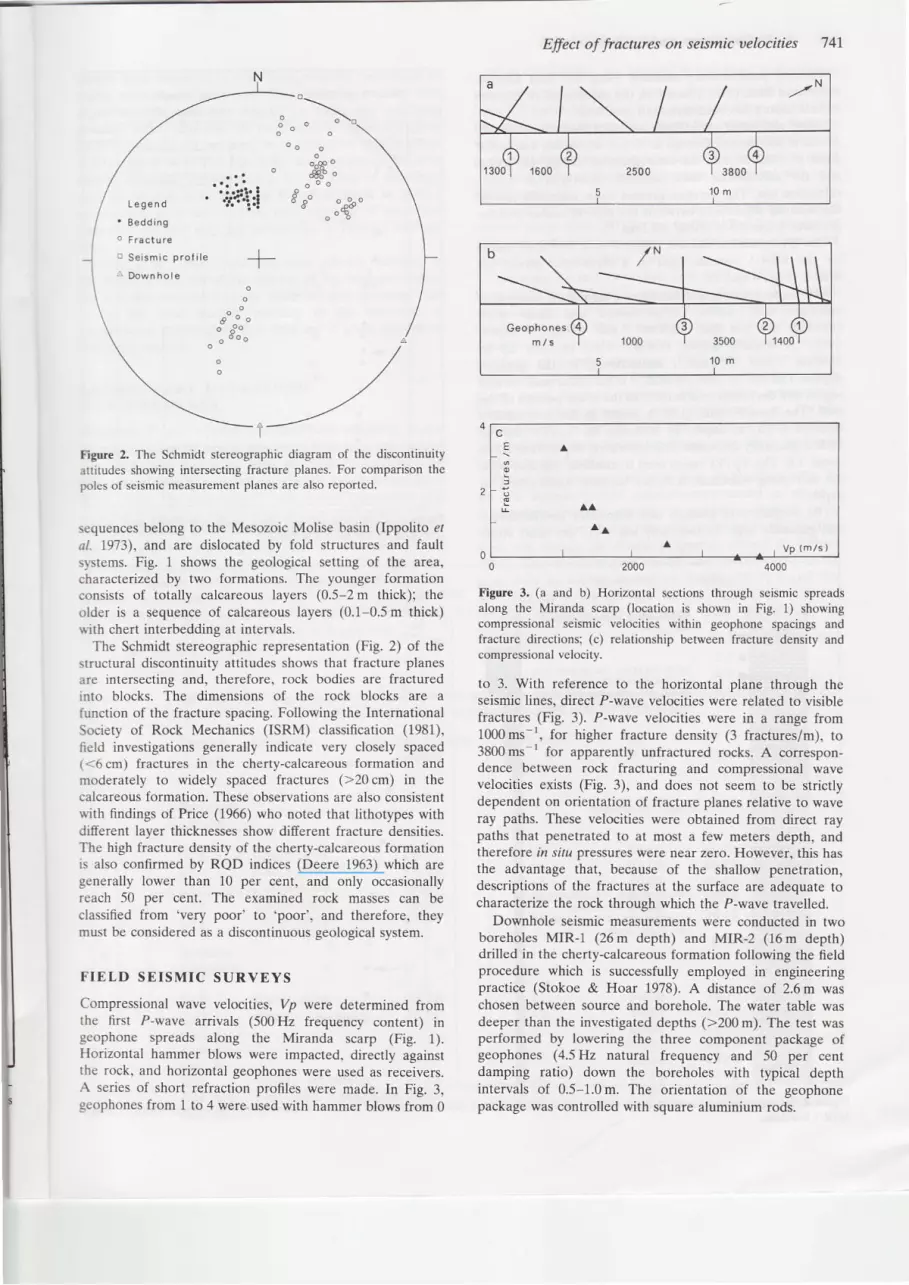
Compressional wave velocities, Vp were determined fromthe first P-wave arrivals (500H2 frequency content) ingeophone spreads along the Miranda scarp (Fig. 1).Horizontal hammer blows were impacted, directly againstthe rock, and horizontal geophones were used as receivers.A series of short reftaction profiles were made, In Fig. 3,geophones from 1 to 4 were.used with hammer blows from 0
Figure 3. (a and b) Horizontal sections through seismic spreadsalong the Miranda scarp (location is shown in Fig. 1) sho\ringcompressional seismic velocities within geophone spacings andfracture directions; (c) relationship between fracture density andcompressional velocity.
to 3. With reference îo the horizontal plane through theseismic lines, direct P-wave velocities were related to visiblelractures (Fig.3). P-wave velocities were in a range from1000 ms-r, for higher fracture density (3 iractures/m), to3800ms-r for apparently uofractwed rocks, A corespon-dence between rock fracturing and compressional wavevelocities exists (Fig, 3), and does not seem to be st ctlydependent on orientation of fracture planes relative to waveray paths. These velocities were obtained ftom direct raypaîhs that penetrated to at most a few mete$ depth, andtherefore in Ji/a pressures were near zero. However, this hasthe advantage that, because of the shallow penetration,descdptions of the fractures at the sudace are adequate tocharacterize the rock through which the P-wave travelled.
Downhole seismic measurements were conducted in twoboreholes MIR-I (2óm depth) and MIR-2 (16m depth)d.illed in the cherty-calcareous formation following the fieldprocedure which is successfully employed in engineeringpractice (Stokoe & Hoar 1978). A distance of 2.6m waschosen b€tween source and borehole. The water table wasdeeper îhan the investigated depths (>200 m). The test wasperformed by lowering the three component package ofgeophones (4.5 Hz natural frequency and 50 per centdamping ratio) down the boreholes with typical depthintervals of 0.5-1.0 m. The orientation oî the geophonepackage was controlled with square aluminium rods.
rn/s | 1000 | 3500 11400
cE l
;
L
742 F. M. Guadagno and C. Nunziata
Velocity profiles were deduced using the data analysismethod of Mok (1987), based on the application of discreteinverse theory to overdetermined problems.
Using measured traveltimes as input data, the velocityprofile is determined through an iterative process. The initialguess is obtained with îhe assumpîion of straight ray paths,and îhe calculations then continue according to Snell'srefraction law. The iterative process stops when the sum ofthe squared differences between the rew velocities and theprevious velociries is wiLhin +0.3 ms 2
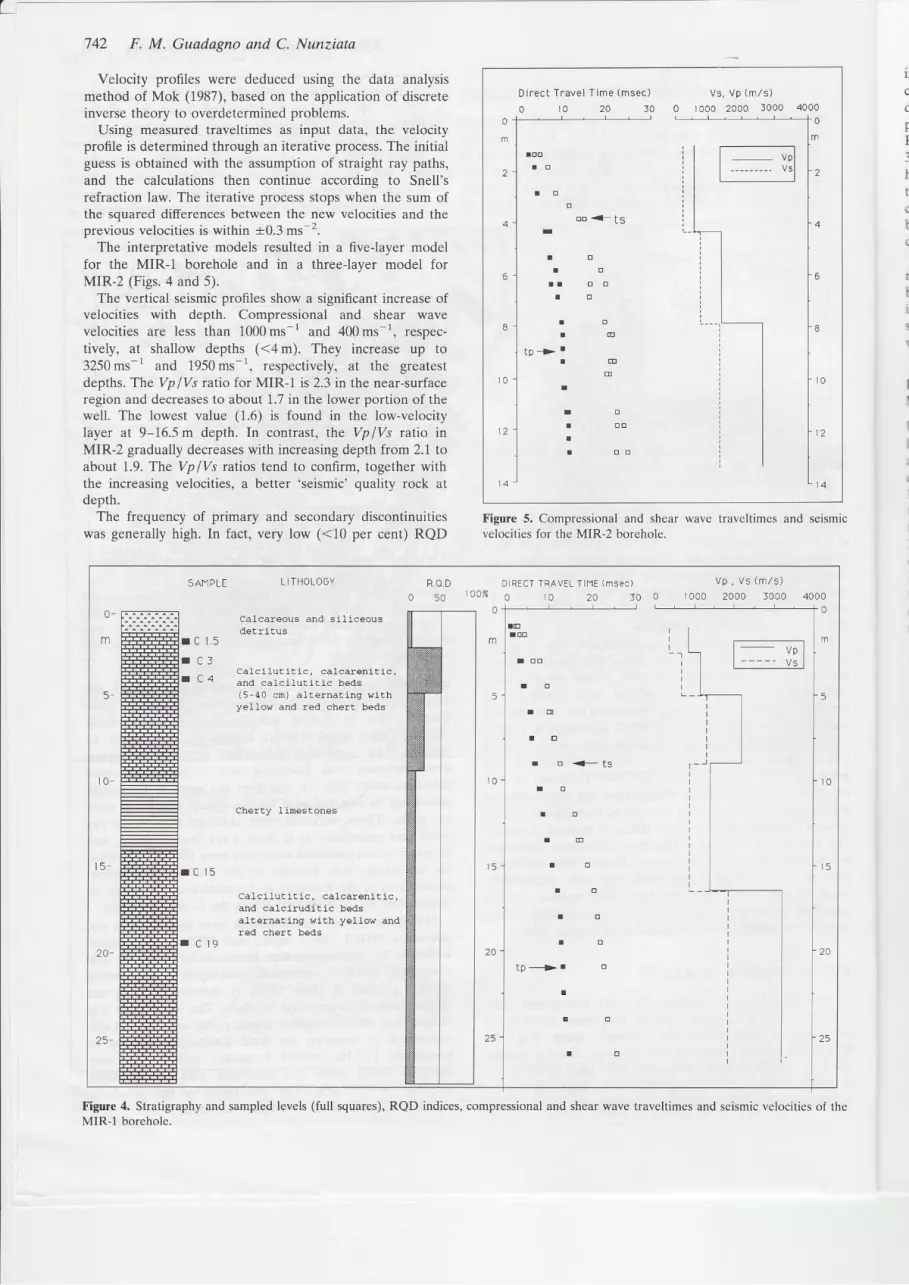
The interpretative models resulted in a five-layer modelfor the MIR-1 borehole and in a threelayer model forMIR-2 (Figs. 4 and 5).
The vertical seismic profiles show a signifrcant increase ofvelocities with depth. Compressional and shear wavevelocities are less than 1000ms I and 400ms-1, respec-tively, at shallow depths (<4m). They increase up to3250ms-' and 1950ms-', respectively, at the greatestdepths. The VplVs ratio for MIR-1 is 2.3 in the near-sudaceregion and decreases to about 1.7 in the lower portion of thewell. The lowest value (1.6) is found in the low-velocitylayer at 9-16.5m depth. In conîrast, the yp/yJ ratio inMIR-2 gradually decreases with increasing depth from 2.1 toabout 1.9. The Vp lVs ratios tend to confirm, together withthe increasing velocities, a better 'seismic' quality rock atdepth.
The frequency of primary and secondary discontinuitieswas generally high. In fact, very low (<10 per cent) RQD
0
2
Dlrect Travel l lme (msec)
0 t 0 2 0 l o rooo 2000 l0o0 40000
2
rti!
Figure 5. Compressional and shear wave traveltimes and seismicvelocities for the MIR-2 borehole.
LI IHOLOGY R.o.D DIRECT ÍRAVEL l lmE (msec)
5 0 r 0 0 % O 1 O 2 0 l O
V p , V s ( m / s )
ì000 20oo 30000
4000---f 0
calcareous and s il iceoì.rsde t r i tus
r C 1 . 5
r c lI L 4 à n d c à l c i l u t r t i . b è d s
{ 5 - 4 0 c m ) a l t e l n a È i n q w i t h
Yellow and red chert beds
m
5
t 0
cherty timesEones
r c l 5
Calc i luc i t i c , ca lcaren i t i c ,and catciludiÈic bedsalternating with yellow andred chert beds
a c 1 9
Figure 4. Strafigraphy and sampled levels (full squares), RQD indices, compressional and shear \rave traveltimes and seismic velocities of theMIR-1 borehole.
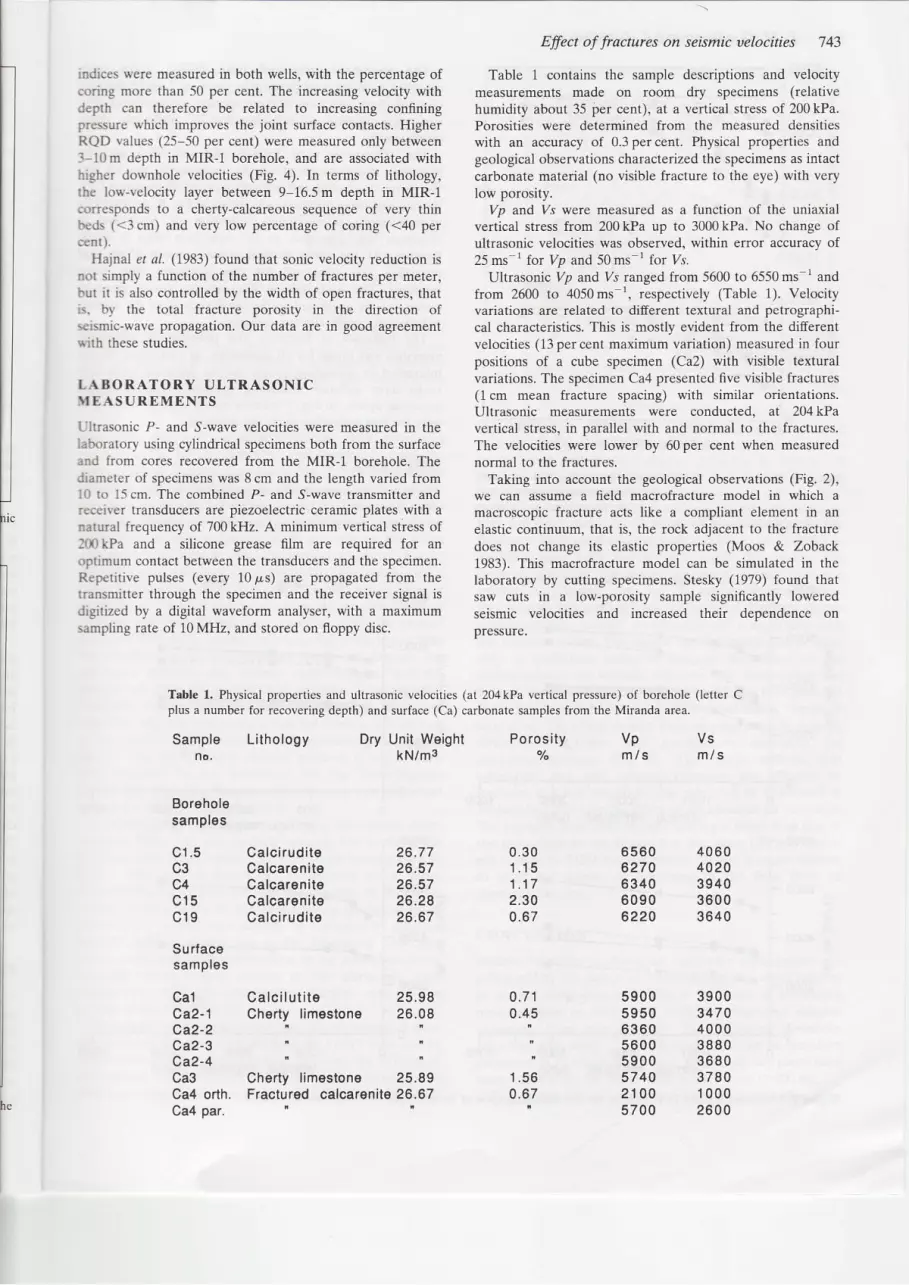
indices were measured in both wells, with the percentage ofcoring more than 50 per cent. The increasing velocity withdepth can therefore be related to increasing confiningpressure which improves the joint surface contacts. HigherRQD values (25-50 per cent) were measured only between,3-l0m depth in MIR-1 borehole, and are associated vr'ithhieher downhole veÌocities (Fig. 4). In terms of lithology,rhe low-velocity layer between 9-16.5m depth ir MIR-1corresponds to a cherty-calcareous sequence of very thinbeds (<3 cm) and very low percentage of codng (<40 percent ) .
H{nal et al. (1983) found that sonic velocity reduction isnot simply a function of the number of fractures per meter,but it is also controlled by the width of open fractures, thatis. b)' the totaÌ ftacture porosity in the direction ofseismic-wave propagation. Our data are in good agreement\*ith these studies.
L A B O R A T O R Y U L T R A S O N I C} I E AS UREME NTS
Ultrasonic P- and S-wave velocities were measured in thelaboratory using cylilddcal specimens both from the surfaceand from cores recovered from the MIR-I borehole. Thediameter of specimens was 8 cm and the length varied froml0 to 15 cm. The coúbiled P- and S-wave transmitter andreceiver transducen are piezoelectric ceramic plates with anatural frequency of 700 kHz. A minimum vertical stress of:mkPa and a silicone grease film are required for anoptimum contact between the transducers and the specimen.Rep€titive pulses (every 10ps) are propagated from therraosmitter through the specimen and the receiver signal isdigitized by a digital waveform analyser, with a maximumsampling rate of 10 MHz, and stored on floppy disc.
Sample L i tho logyno .
Effect of fractures on seismic velocities 743
Table 1 contains the sample descriptions and velocitymeasurements made on room dry specirnens (relativehumidity about 35 per cent), at a vertical stress of 200 kPa.Porosities were determined flom the measured densitieswith an accuracy of 0.3 per cent. Physical prope ies andgeological observations characterized the specimens as ìntactcarbonate mate al (no visible fracture to the eye) with verylow porosity,
Vp aíd Vs were measured as a function of the uniaxialvertical stress from 200 kPa up to 3000kPa. No change ofultrasonic velocities was observed, within eÍor accuracy ofl) ms lor y, ano )u ms tor v.r.
Ultrasonic Vp and, Vs ranged from 5600 to ó550 ms-r andfrom 2600 to 4050 ms r, respectively (Table 1). Velocityvadations are relaîed to different textural and petrographi-cal characteristics. This is mostly evident from the differentvelocities (13 per cenî maximum vadation) measured in fourpositions of a cube specimen (Ca2) with visible texturalvariations. The specimen Ca4 presented five visible fractures(1cm mean ftacture spacing) with similar orientations.Ultrasonic measurements were conducted, af 204kPavertical stress, in parallel with and normal to the fractures.The velocities were lower by 60per cent when measurednormal to the fractures.
Taking into account the geological observations (Fig. 2),we can assume a field macrofracture model in which amacroscopic fracture acts like a compliant element in anelasîic continuum, that is, the rock adjacent to the fracturedoes not change its elastic properties (Moos & Zoback1983). This macrofracture model can be simulated in thelaboratory by cutting specimens. Stesky (1979) found thatsaw cuts in a low-porosity sample signiflcantly loweredseismic velocities and increased their dependence onpressure.
Porosi ty
Tabfe 1. Physical properties and ultrasonic velocities (at 204kPa vertical pressure) of borehole (letter Cplus a number for recovering depth) and surface (Ca) carbonate samples hom the Miranda area.
Dry Unit WeightkN/m3
Vpm / s
Vsm/s
Bor€holesam pr6s
uit
c4c15c l9
Sur facssampr9s
C a lc i rud i tsCalcareni taCalcareni teCalcareni teC a lc i ru d i ts
26.7726.57z b , 5 t
26.28
0 . 3 01 . 1 51 . 1 72.30
6 5 6 0627069406 0 9 06220
5 9 0 05 9 5 06 3 6 05 6 0 05 9 0 05 7 4 02 1 0 05 7 0 0
4 0 6 040203 9 4 03 6 0 03 6 4 0
3 9 0 034704 0 0 03 8 8 03 6 8 03 7 8 01 0 0 02 6 0 0
Ca1 Calc i lu t i to 25.98Ca2-1 Ch€rty lim€stono 26.0SCa2-2Ca2-3Ca2-4Ca3 Chsrty limestone 25.89Ca4 orth. Fractured calcar€nite 26.67Qa4 par.
0 . 7 10 . 4 5
t . J o
0 . 6 7
744 F. M. Guadagno and C. Nunziota
î s000
F
5 zooo
> 3ooo
1 000
4000
1000VERTICTAL
^ 1-FroctureI 3-Froctures
- lntoct- - | cycle---- ll cycle
VERTICAL PRESSURE (kPo)
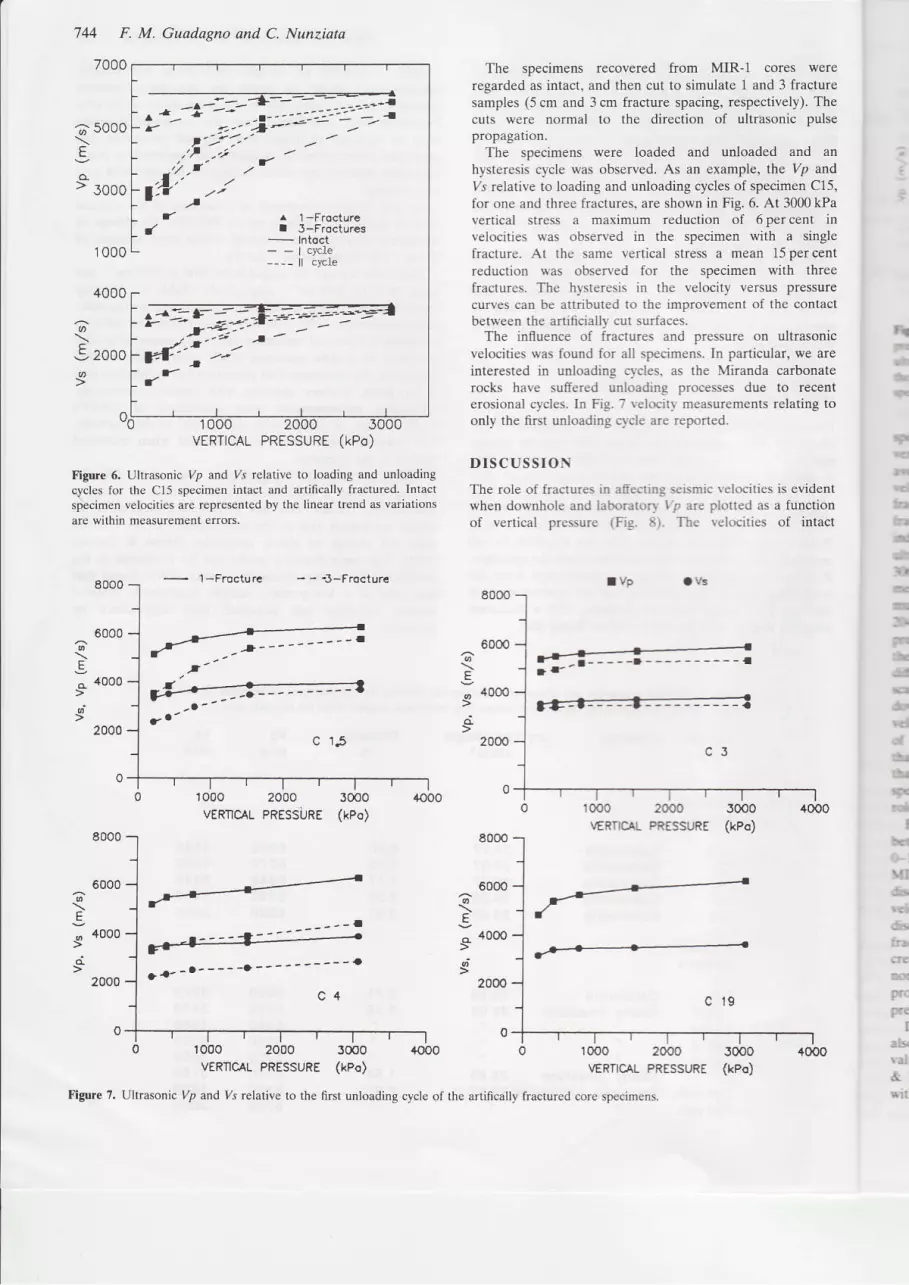
Figur€ 6. Ultrasonic yp and yr relative to loading and unloadingqycles for the C15 specimen intact and artificalÌy fractured. Intactslìecimen velocities are represented by the liDear trend as variationsare within measurement errors.
- 1-Frocture
The specimens recovered from MIR-1 cores wereregarded as intact, and then cut to simulaîe 1 and 3 ftactuesamples (5 cm and 3 cm ftacture spacing, respectively). Thecuts were normal to the direction of ultlasonic pulsepropagation.
The specimens were loaded and unloaded and anhysteresis cycle was observed. As an example, the Vp andys relative to loading and unloading cycles of specimetr C15,for one and three fractures, are sho\{n in Fig. 6. At 3000 kPavertical stress a maximum reduction of 6percent invelocities was observed in the specimen with a singleftacture. At the same vertical stress a mean 15 per cent.eduction was observed for the specimen with threeftacîures. The hysteresis in the velocity versus pressurecurves can be atîributed to the improvement of the contactbetween the artincially cut surfaces.
The influence of ftacîures aDd pressure on ultrasonicvelocities was found for all specirnens. In particular, we areinterested in unloading cycles, as the Miranda carbonaterocks have suffered unloading processes due to recenterosional cycles. ID Fig. 7 velocity measurements relating toonly the fust unloading cycle are reponed.
DISCUS SION
The role of fractures in affecting seismic velocities is evidentwhen downhole atrd laboratory yp arc plotted as a fuDctionof vertical pr€ssure (Fig- 8). The velocities of intact
o 1000 2000VERTICAL PRESSURE
gI
o, 40oo
<i
À 4000
2000
E^ 40@5o;
20m
2000 3moPRESSÙRE (kPo)
lls-|lt!
!latdhh-aII
I
IFt-G
-td{tt!Fd
Ilco-lXI&€&&r
€o 4000
.i
2000
0 tO00 2000 3mO 4@0vER'noqL PRESSURE (kPo)
cncII
r FF
I.lrizlr&rit
3mo +000(kPo)
...f'
r/,ERnC[ PRESSURE
Figure 7. Ultrasonic yp and yr relative to the first unloading cycle of the artifically fractured core specimens.
- - - _
. r Il ' ot o
a - '
i +oooE
PRESSURE (kPo)
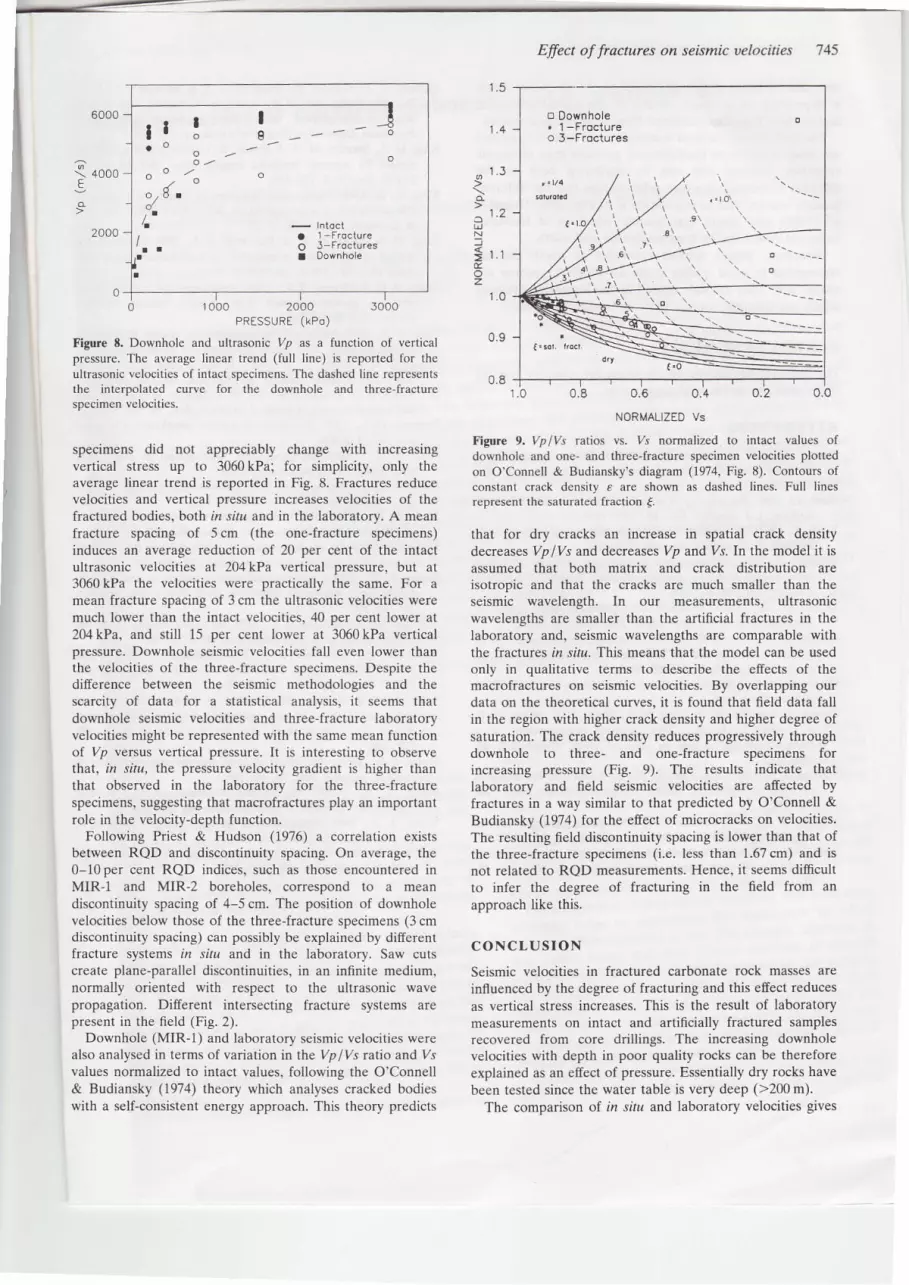
Figule 8. Downhole and ultrasonic yp as a function of verticalpressure. Thc average linear trend (full line) is reported for theultrasonic velocilies of intacl specirnens. The dashed line representsthe interpolatcd curve for the downhole and three-fracturcspecimen vclocities.
specimens did not appreciably change with increasingvertical stress up to 3060 kPa; for simplicity, only theaverage linear trend is reported in Fig.8. Fractures reducevelocities and vertical pressure increases velocities of thefractured bodies, both ir?,rl& and in the laboratory. A meanftacture spacing of 5 cm (the one-fracture specimens)induces an average reduction of 20 per cent of the intactultrasonic veÌocitìes at 204 kPa vertical pressure, but at3060 kPa the veÌocities were practically the same. For amean fracture spacing of 3 cm the ultrasonic velocities weremuch lower than the intact velocities,40 per cent lower at204 kPa, and still 15 per cent lower at 3060 kPa verticalpressure. Downhole seismic velocities fall even lower thanthe velocities of the three-fracture specimens. Despite thedifference between the seismic methodologies and thescarcity of data for a statistical analysis, it seems thatdownhole seismic velocities and three-ftacture laboratoryvelocities might be represented with the same mean functionof Vp versus vertical pressure. It is interesting to observethaî, in situ, the pressure velocity gradient is higher thanthat obsened in the laboratory for the three-fracturespecimens, suggestìng that macrofractures play an importantrole in the velocity-depth function.
Following Priest & Hudson (1976) a correlation existsbetween RQD and discontinuity spacing. On average, the0-10per cenî RQD indices, such as those encountered inMIR-1 and MIR-2 boreholes, cofiespond to a meandiscontinuity spacing of 4-5 cm. The position of downholevelocities below those of the three-fracture specimens (3 cmdiscontinuity spacing) can possibly be explained by differentfracture systems in situ and in the laboratory. Saw cutscreate plane-parallel discontinuities, in an infinite medium,normally odented with respect to the ultrasonic wavepropagation. Different intersecting fracture systems arepresent in the field (Fig. 2).
Downhole (MIR-l) and Iaboratory seismic velocities werealso analysed in terms of variation in the Vp lVs fatio and Vsvalues normalized to intact values, following the O'Connell& Budiansky (1974) theory which analyses cracked bodieswith a self-consistent energy approach. This theory predicts
Effect of fractures on seismic velocities 745
1.0 0 .8 0 .6 0 .4 0 .2 0 .0
N0RMALIZED vs
FigllÍe 9. Vplvs ratios vs. ys nomalized to inîact values ofdownhole and one- and three-fracture specimen velocities plottedon O'Connell & Budiansky's diagram (1974, Fig.8). Contours ofconstant crack density € are shown as dashed lines. Fult linesrepresenl thc saturated fraction 6.
that for dry cracks an increase in spatial crack densitydecreases Vp/Vs and decreases Vp and Vs.In îhe model it isassumed that both mat x and crack disîribution areisotropic and that the cracks are much smalÌer than theseismic wavelength, In our measurementst ultrasonicwavelengths are smaller than the artificial fractures in thelaboratory and, seismic wavelengths are comparable withthe fractures ln sita. This means that the model can be usedonly in qualitative terms to describe the eff€cts of themacrofractures on seismic velocities. By overlapping ourdata on the theoretical curves, it is found that field data fallin the region with higher crack density and higher degree ofsaturation. The crack density reduces progressively throughdownhole to three- and one-ftacture specimens forincreasing pressure (Fig, 9). The results indicate thatlaboratory and Aeld seismic velocities are affected byfractures in a way similar to that predicted by O'Connell &Budiansky (1974) for the effect of microcracks on velocities.The resulting field discontinuity spacing is lower than that ofthe three-fracture specimens (i.e. less than 1.67 cm) and isnot related to RQD measurements. Hence, it seems difficultto infer the degree of fractuling in the field from anapproach like this.
C O N C L U S I O N
Seismic velocities in ftactured carbonate rock masses areinfluenced by the degree of ftacturing and this effect reducesas vertical stress increases, This is the result of laboratorymeasurements on intact and artificially fractured samplesrecovered from core drillings. The increasing downholevelocities with depth in poor quality rocks can be thereforeexplained as an effect of pressure. Essentially dry rocks havebeen tested since the water table is very deep (>200 m).
The comparison of ir sllu and laboratory velocities gives
I t
-> r . l
oz
1 . 0
o oownhole. 1 -Frociureo 3-Froclures
í ;, ""-)

746 F. M. Guadagno and C. Nunziata
an evalution oî the degree of fracturing of rock bodies whichis dependent on pressureJ mostly at the lowest pressures,and is lower than that predicted from RQD measurements.
The field fracture system is complex and seismic velocitiesare more sensitive to ftactures and pressure than ultrasonicvelocities. Perhaps this can be attributed both to thedifferent wavelength-ftacture relationships and the differentfracture widths. This interpretation is supported by Hajnal etal. (1983) who found that seismic velocities in fracturedrocks are controlled by fracture density and width.
Moreover, higher seismic velocities at dePth do notcorrespond to good quality rocks as îhe RQD indices arealways low. They are only caused by the increasing Pressurewhich inproves the contact between ftacture sufaces.
AC KNOIryL EDGM E NTS
The authors are grateful to D. Moos for criîically readingthe manuscript and helpful suggestions.
RE FEREN CES
Adams, L. H. & Williamson, E. D., 1923. The compressibility ofminerals and rocks at high pressure, "/. Frunklin Inst., 195,475-529.
Birch, F., 1960. The velocity of compressional waves in rocks to 10kilobars, 7, J. geophts. Res., 65, 1083-1102.
Birch, F., 1961. The velocity of compressional waves in rocks to 10kilobars, 2, J. geophys. Res., 6,2199-224.
Crampin, S., 1980. Seismic-wave propagation through a crackedsolid: polarization as a possibÌe dilatancy diagnostic, CeopàF.J.R. astr. Soc., 53,467-496.
Deere, D. U., 1963. Technical description of rock cores forEngineering purpose, Rock Mech. Eng. Geol., l,16-21.
Garbin, H. D. & Knopofr, L., 1n3. The compressional modulus ofa material permeated by a random distribution of circularcracks, Q. appl Math., 30, 453-464.
Goodman, R. E., 1989. Inîroduction to Rock Mechanics, Johî Wiley& Sons, New York.
Hajnal,2., Staufier, M. R., King, M. S., Wallis, P. F., Wang, H. P.& Jones, L. E. A.. 1983. Seismic characteristics of aPrecambrian pluton and its adjacent rocks, Geophysics, 48,569-581.
Hudson, J. A., 1981. Wave speeds and attenuation of elastic wavesin material containing cracks, Geophrs. J.R. astr. Soc., 64,133-150.
Hudson, J. 4., 1988. Seismic ùave propagation through materialcontaining partially saturated úacks, Geophys. J, 92, 33-3'1.
Intemational Society for Rock Mechanics, 1981, Basic technicaldescription of rock masses, lnt. J. Rock Mech. Min. Sci., 18,85-110.
Ippolito, F., D'Argenio,8., Pescatore, T. S. & Scandone, P., 1973,Tectonic framework of the southern Apennines and relatedstructural-stratigraphic units, îre guidebook to lîalyPetrcleum Explorution Society of Libya, pp. 317-328.
King, M. S., Stauffer, M. R. & Pandit, B. I., 1978. Quality of Rockmasses by acoustic borehole logging, Proc. 3rd Int. Cong.IAEG. sec. lV. 1. 156-lú.
King, M. S., 1984. Elastic-wave velocities in Quartz Monzonite atdifferent levels of water saturation. 1rt "/- Rock Mech. Min. Sci.& Geomech.. Abstr.. 21. 35-38.
King, M. S., Myer, L. R, & Rezowalli, J. J., 1986. Experimentalstudies of elastic-wave propagation in a columnar-jointed rockmass, Geophys. Ptosp., 34, 1185-11.99.
Leary, P. C. & Henyey, T. L., 1985. Anisotropy and fracture zonesabout a geothermal well from P-wave velocity profiles,Geophys ìcs., 50, 25-36.
Mok, Y. J., 1987. Analytical and experimental studies of boreholeseismic methods, PrD thesis., University of Texas at Austin.
Moos, D. & Zoback, M. D., 1983. /n fla& studies of velocity infractured crystalline rocks, J. geophys.lRes., 88, 2345-2358.
O'Connell, R. J. & Budiansky, B., 1974. Seismic velocities in dryand saturated cracked solids,./. geopÀys. Res.,79,5412 5426.
Parasnis, D. 5., 1975. Principles of Applied geophysics, Chapmanand Hall. London.
Price, N. J., 1966. Fault and Joint deuelopment in britle andsemi-b ttle tuck, Pergamon, Oxford.
Pliest, S. D. & Hudson, J. 4., 1976. Discontinuity spacings in rock,Int. J. Rock Mech. Min. Sci..13.135 148.
Simmons, G. & Nur, 4., 1968. Granites: relation of properties inrit, to laboratory measurements, .tcience, 162, 789-'791.
Sjogren, B., Ofsthus, A. & Sandberg, J., 1979. Seismic classificationof rock mass qualities, Ceophys. Prosp., 27, 409-442.
Stesky, R. M., 1q79. Compressional wave velocities of jointed rock:a laboratory simulatiori (abstract), EOS Trans. Am. geophys.Un..6n.%9.
Stierman, D. J. & Kovach, R. L., 19?9. An il? srlu velocity study: theStone Canyon well,./. geophys. Res., U,6'72-6'78.
Stokoe, K. H., II & Hoar, R. J., 1978. Variables affecting in rir,rseismic measurements, Proc. Conf. Eafthq. Eng. Soil Dyn.,ASCE Geot. Eng. Div., tI, 919-939.
Yang, H. J. P. & King, M. S., 1986. A study of elastic wavevelocities in dry and water-saturated, regularly-jointed rockmasses, Inr. J. Rock Mech. Mín. Sci. & Geomech. Abstr.,zl,2'7'7 280.
Walsh, J. B., 1965a. The effect of cracks on the compressibility oftocks, J. geophys. Res., 70, 381-389.
walsh. J. B.. 1965b. The effect of cracks on the uniaxialcoúpression of rocks, J. geophys., Res., 70' 399-411.
Walsh, J. 8., 19ó8. Attenuation in partially melted material, J.geo p hys. Re s., 73, 2209-221 6,
rÀralsh, J. B., 1969. New analysis of attenuation in partialìy meltedrock. J. Beophys. Rps.. 74. 4333-4331.