seismic evaluation of r/c framed building using
TRANSCRIPT
SEISMIC EVALUATION OF R/C FRAMED BUILDING USING SHEAR FAILURE MODEL
A thesis Submitted by
Avadhoot Bhosale
(210CE2029)
In partial fulfillment of the requirements for the award of the degree of
Master of Technology In
Civil Engineering (Structural Engineering)
Under The Guidance of Dr. Pradip Sarkar
Department of Civil Engineering National Institute of Technology Rourkela
Orissa -769008, India May 2012
brought to you by COREView metadata, citation and similar papers at core.ac.uk
provided by ethesis@nitr

NATIONAL INSTITUTE OF TECHNOLOGY ROURKELA, ORISSA -769008, INDIA
This is to certify that the thesis entitled, “SEISMIC EVALUATION OF R/C
FRAMED BUILDING USING SHEAR FAILURE MODEL” submitted by
Avadhoot Bhosale in partial fulfillment of the requirement for the award of Master
of Technology degree in Civil Engineering with specialization in Structural
Engineering at the National Institute of Technology Rourkela is an authentic work
carried out by his under my supervision and guidance. To the best of my knowledge,
the matter embodied in the thesis has not been submitted to any other
University/Institute for the award of any degree or diploma.
Research Guide
Place: Rourkela Dr. Pradip Sarkar Date: Associate Professor Department of Civil Engineering
NIT Rourkela

i
ACKNOWLEDGEMENTS
First and foremost, praise and thanks goes to my God for the blessing that has bestowed upon me
in all my endeavors.
I am deeply indebted to Dr. Pradip Sarkar, Associate Professor of Structural Engineering
Division, my advisor and guide, for the motivation, guidance, tutelage and patience throughout
the research work. I appreciate his broad range of expertise and attention to detail, as well as the
constant encouragement he has given me over the years. There is no need to mention that a big
part of this thesis is the result of joint work with him, without which the completion of the work
would have been impossible.
I am grateful to Prof. N Roy, Head, Department of Civil Engineering for his valuable suggestions
during the synopsis meeting and necessary facilities for the research work.
I extend my sincere thanks to Dr. Robin Davis P the faculty members of Structural Engineering
Division for their helpful comments and encouragement for this work.
I am grateful for friendly atmosphere of the Structural Engineering Division and all kind and
helpful professors that I have met during my course.
I would like thank my parents and sister. Without their love, patience and support, I could
not have completed this work.
Finally, I wish to thank many friends for the encouragement during these difficult years,
especially, Snehash, Bijali, Kirti, Hemanth, Santosh, Reddy, Malli, Sukumar.
Avadhoot Bhosale
ABSTRACT
KEYWORDS: shear hinges, shear strength, shear displacement, nonlinear static pushover analysis, hinge property, reinforced concrete.
Prediction of nonlinear shear hinge parameters in RC members is difficult because it involves
a number of parameters like shear capacity, shear displacement, shear stiffness. As shear
failure are brittle in nature, designer must ensure that shear failure can never occur. Designer
has to design the sections such that flexural failure (ductile mode of failure) precedes the
shear failure. Also design code does not permit shear failure. However, past earthquakes
reveal that majority of the reinforced concrete (RC) structures failed due to shear. Indian
construction practice does not guaranty safety against shear. Therefore accurate modelling of
shear failure is almost certain for seismic evaluation of RC framed building.
A thorough literature review does not reveal any information about the nonlinear modelling
of RC sections in Shear. The current industry practice is to do nonlinear analysis for flexure
only. Therefore, the primary objective of the present work is to develop nonlinear force-
deformation model for reinforced concrete section for shear and demonstrate the importance
of modelling shear hinge in seismic evaluation of RC framed building. From the existing
literature it is found that equations given in Indian Standard IS-456: 2000 and American
Standard ACI-318: 2008 represent good estimate of ultimate strength. However, FEMA-356
recommends ignoring concrete contribution in shear strength calculation for ductile beam
under earthquake loading. No clarity is found regarding yield strength from the literature.
Priestley et al. (1996) is reported to be most effective for calculating shear displacement at
iii
yield whereas model proposed by Park and Paulay (1975) is most effective in predicting the
ultimate shear displacements for beams and columns. Combining these models shear hinge
properties can be calculated.
To demonstrate the importance of modelling shear hinges, an existing RC framed building is
selected. Two building models, one with shear hinge and other without shear hinges, are
analysed using nonlinear static (pushover) analysis.
This study found that modelling shear hinges is necessary to correctly evaluate strength and
ductility of the building. When analysis ignores shear failure model it overestimates the base
shear and roof displacement capacity of the building. The results obtained here show that the
presence of shear hinge can correctly reveal the non-ductile failure mode of the building.
iv
TABLE OF CONTENTS
Title Page No.
ACKNOWLEDGEMENTS .......................................................................................... i
ABSTRACT ................................................................................................................. ii
TABLES OF CONTENTS ......................................................................................... iv
LIST OF TABLES .................................................................................................... viii
LIST OF FIGURES ................................................................................................... .ix
ABBREVIATIONS .................................................................................................... xi
NOTATIONS ............................................................................................................ xiii
CHAPTER 1 INTRODUCTION
1.1. Overview ................................................................................................................1
1.2. Literature Review ...................................................................................................3
1.3. Objective ................................................................................................................9
1.4. Scope of Study .....................................................................................................10
1.5. Methodology ........................................................................................................10
1.6. Organization of Thesis .........................................................................................10
CHAPTER 2 PREVAILING CODE PROVISIONS
2.1. Overview ..............................................................................................................12
2.2. IS 456: 2000 .........................................................................................................13
2.3. BS 8110: 1997 (PART 1) .....................................................................................14
2.4. ACI 318: 2008 .................................................................................................…15
2.5. FEMA 356 ...........................................................................................................15
2.6. Summary ..............................................................................................................16
v
Title Page No
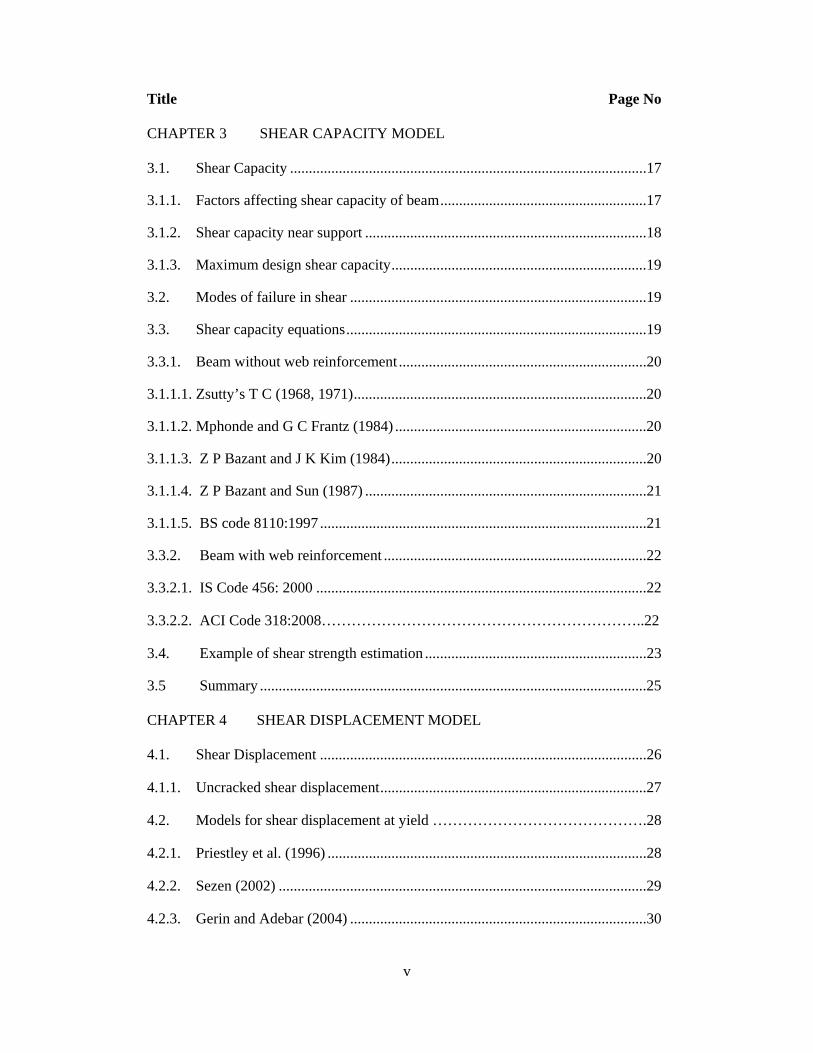
CHAPTER 3 SHEAR CAPACITY MODEL
3.1. Shear Capacity ...............................................................................................17
3.1.1. Factors affecting shear capacity of beam .......................................................17
3.1.2. Shear capacity near support ...........................................................................18
3.1.3. Maximum design shear capacity ....................................................................19
3.2. Modes of failure in shear ...............................................................................19
3.3. Shear capacity equations ................................................................................19
3.3.1. Beam without web reinforcement ..................................................................20
3.1.1.1. Zsutty’s T C (1968, 1971) ..............................................................................20
3.1.1.2. Mphonde and G C Frantz (1984) ...................................................................20
3.1.1.3. Z P Bazant and J K Kim (1984) ....................................................................20
3.1.1.4. Z P Bazant and Sun (1987) ...........................................................................21
3.1.1.5. BS code 8110:1997 .......................................................................................21
3.3.2. Beam with web reinforcement ......................................................................22
3.3.2.1. IS Code 456: 2000 ........................................................................................22
3.3.2.2. ACI Code 318:2008………………………………………………………..22
3.4. Example of shear strength estimation ...........................................................23
3.5 Summary .......................................................................................................25
CHAPTER 4 SHEAR DISPLACEMENT MODEL
4.1. Shear Displacement .......................................................................................26
4.1.1. Uncracked shear displacement .......................................................................27
4.2. Models for shear displacement at yield …………………………………….28
4.2.1. Priestley et al. (1996) .....................................................................................28
4.2.2. Sezen (2002) ..................................................................................................29
4.2.3. Gerin and Adebar (2004) ...............................................................................30
vi
4.2.3. Lehman and Moehle (2000) ...........................................................................30
4.2.4. Panagiotakos and Fardis (2001) .....................................................................31
4.3. Models for ultimate shear displacement ........................................................32
4.3.1. Park and Paulay (1975) ..................................................................................32
4.3.2. CEB (1985) ....................................................................................................33
4.3.3. Gerin and Adebar (2004) ...............................................................................33
4.4. Calculations for yield and ultimate displacement ..........................................34
4.5 Summary ........................................................................................................36
Chapter 5 STRUCTURAL MODELLING
5.1. Introduction .....................................................................................................37
5.2. Computational Model .....................................................................................37
5.2.1. Material Properties ..........................................................................................38
5.2.2. Structural Elements .........................................................................................38
5.3. Building Geometry .........................................................................................39
5.4. Modelling of flexural Hinges ..........................................................................48
5.4.1. Stress-Strain Characteristics for Concrete ......................................................49
5.4.2. Stress-Strain Characteristics for Reinforcing Steel .........................................52
5.4.3. Moment-Curvature Relationship ....................................................................52
5.4.4. Modelling of Moment-Curvature in RC Sections ...........................................54
5.4.5. Moment-Rotation Parameters .........................................................................56
5.5. Modelling of shear hinges ..............................................................................59
5.6. Summary .........................................................................................................62
Chapter 6 NONLINEAR STATIC (PUSHOVER) ANALYSIS
6.1. Introduction .....................................................................................................63
6.2. Capacity curve ................................................................................................64
vii
6.2.1. Shear Hinge Properties for the Frame Elements .............................................64
6.2.2. Capacity Curves for Push X and for Push Y ...................................................70
6.2.3. Ductility ratio for Push X and Push Y analysis ..............................................74
6.3. Plastic hinge mechanism .................................................................................75
6.4. Summary .........................................................................................................81
Chapter 7 SUMMARY AND CONCLUSIONS
7.1 Summary .........................................................................................................82
7.2. Conclusions .....................................................................................................83
7.3. Scope for future work .....................................................................................85
ANNEXURE –A PUSHOVER ANALYSIS (FEMA-356, ATC-40)
A.1. Introduction ....................................................................................................86
A.1.1. Pushover Analysis Procedure ........................................................................87
A.1.2. Lateral Load Profile .......................................................................................89
A.1.3. Target Displacement ......................................................................................92
A.1.3.1.Displacement Coefficient Method (FEMA 356) ...........................................92
A.1.3.1.Capacity Spectrum Method (ATC 40) ...........................................................94
REFERENCES ...........................................................................................................98
viii
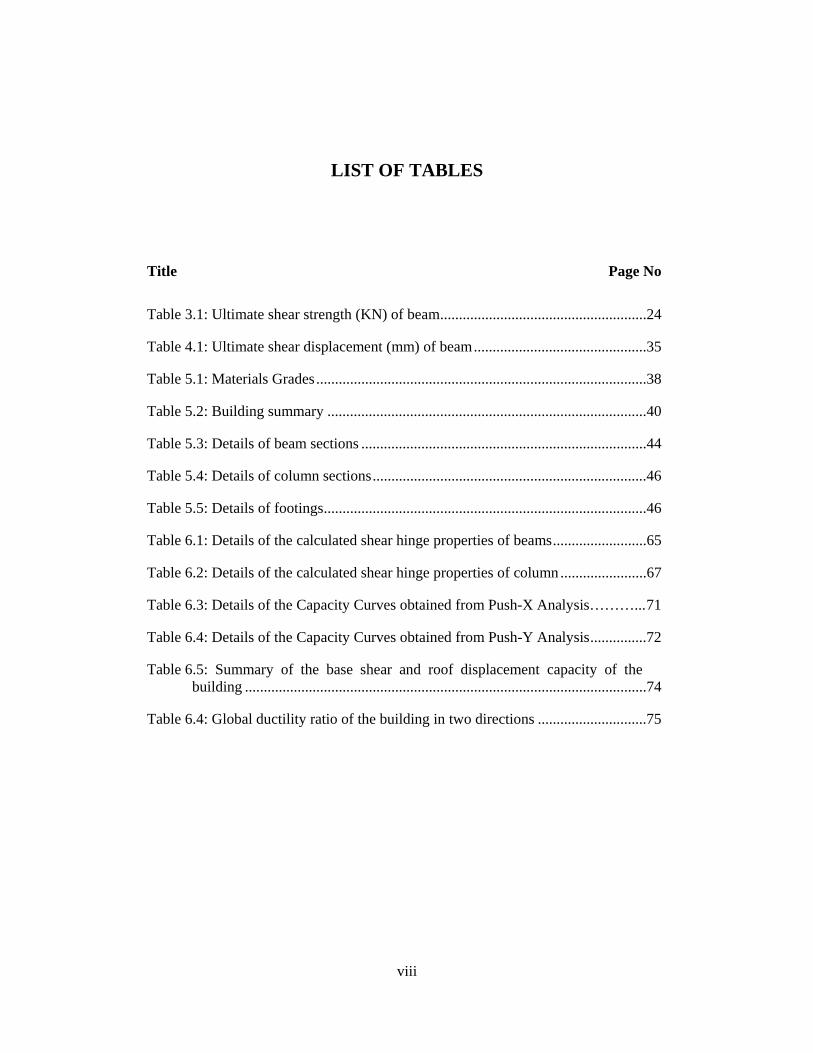
LIST OF TABLES
Title Page No
Table 3.1: Ultimate shear strength (KN) of beam .......................................................24
Table 4.1: Ultimate shear displacement (mm) of beam ..............................................35
Table 5.1: Materials Grades ........................................................................................38
Table 5.2: Building summary .....................................................................................40
Table 5.3: Details of beam sections ............................................................................44
Table 5.4: Details of column sections .........................................................................46
Table 5.5: Details of footings ......................................................................................46
Table 6.1: Details of the calculated shear hinge properties of beams .........................65
Table 6.2: Details of the calculated shear hinge properties of column .......................67
Table 6.3: Details of the Capacity Curves obtained from Push-X Analysis………... 71
Table 6.4: Details of the Capacity Curves obtained from Push-Y Analysis ...............72
Table 6.5: Summary of the base shear and roof displacement capacity of the building ...........................................................................................................74
Table 6.4: Global ductility ratio of the building in two directions .............................75
ix
LIST OF FIGURES
Title Page No
Fig.1.1: Deformed shape of a nonlinear building model under lateral load .................1
Fig.1.2: Nonlinear models for Moment v/s Rotations ..................................................2
Fig.1.3: Shear force v/s Shear Displacement ................................................................2
Fig.2.1: Shear Transfer Mechanism ............................................................................12
Fig.3.1: Shear capacity near support ...........................................................................18
Fig.3.2: Test beam section considered for the comparison. ........................................24
Fig.4.1: Shear displacement of concrete member .......................................................26
Fig.4.2: Shear displacement for beam (Park and Paulay 1975) ..................................32
Fig.4.3: Test beam section considered for the comparison. ........................................35
Fig.5.1: Use of end offsets at beam-column joint .......................................................39
Fig.5.2: Floor (for Plinth, Ground, First and Second) framing plan – Beam location ........................................................................................................................40
Fig.5.3: Roof framing plan - Beam location ...............................................................41
Fig.5.4: Column location ............................................................................................42
Fig.5.5: Elevation of the building - Front view ..........................................................42
Fig.5.6: Elevation of the building - Side view ............................................................43
Fig.5.7: 3D computer model of the building ...............................................................43
Fig.5.8: Typical plan of footing ..................................................................................47
Fig.5.9: The coordinate system used to define the flexural and shear hinges ............48
Fig.5.10: Typical stress-strain curve for M-20 grade concrete (Panagiotakos and Fardis, 2001) ...............................................................................................................50
Fig.5.11: Stress-strain relationship for reinforcement – IS 456 (2000) ......................51
Fig.5.12: Curvature in an initially straight beam section (Pillai and Menon, 2006) ...52
x
Fig.5.13: a) cantilever beam, (b) Bending moment distribution, and (c) Curvature distribution (Park and Paulay 1975) ...........................................................................56
Fig.5.14: Idealised moment-rotation curve of RC elements .......................................58
Fig.5.15: Typical shear force-deformation curves to model shear hinges (IITM-SERC Report, 2005) ...................................................................................................60
Fig.6.1: Load –Deformation curve ..............................................................................63
Fig.6.2: Capacity curve for Push X analysis ...............................................................73
Fig.6.3: Capacity curve for Push Y analysis ...............................................................73
Fig.6.4: Sequence of yielding for building without shear hinge (Push-X) .................76
Fig.6.5: Sequence of yielding for building with shear hinge (Push-X) ......................78
Fig.6.6: Sequence of yielding for building without shear hinge (Push-Y) .................79
Fig.6.7: Sequence of yielding for building with shear hinge (Push-Y) ......................81
Fig.A.1: Schematic representation of pushover analysis procedure ...........................88
Fig.A.2: Lateral load pattern for pushover analysis as per FEMA 356 (Considering uniform mass distribution) ....................................................................91
Fig.A.3: Schematic representation of Displacement Coefficient Method (FEMA 356)…………………… ................................................................................93
Fig.A.4: Schematic representation of Capacity Spectrum Method (ATC 40) ............95
Fig.A.5: Effective damping in Capacity Spectrum Method (ATC 40) .......................96

xi
ABBREVIATIONS
3D Three Dimensions
ACI American Concrete Institute
ADRS Acceleration-Displacement Response Spectrum
ATC Applied Technology Council
BS British Standard
CEB Comité Euro-Internacional du Béton
CM Center of Mass
CP Collapse Prevention
CR Center of Rigidity
CS Centre of Stiffness
CSA Canadian Standards Association
CSM Capacity Spectrum Method
DCM Displacement Coefficient Method
DL Dead load
EL Earthquake load
FEMA Federal Emergency Management Agency
IO Intermediate Occupancy
IS Indian Standard
LL Live Load
LS Life Safety
MPa Mega Pascal
xii
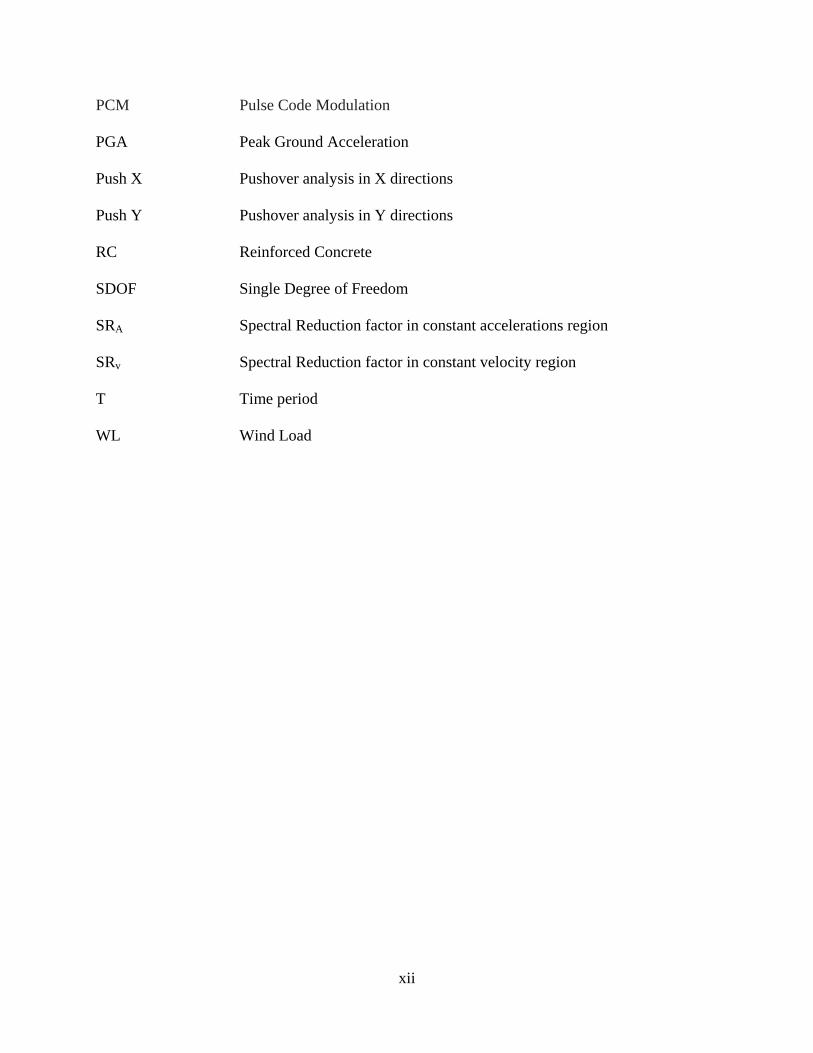
PCM Pulse Code Modulation
PGA Peak Ground Acceleration
Push X Pushover analysis in X directions
Push Y Pushover analysis in Y directions
RC Reinforced Concrete
SDOF Single Degree of Freedom
SRA Spectral Reduction factor in constant accelerations region
SRv Spectral Reduction factor in constant velocity region
T Time period
WL Wind Load
xiii
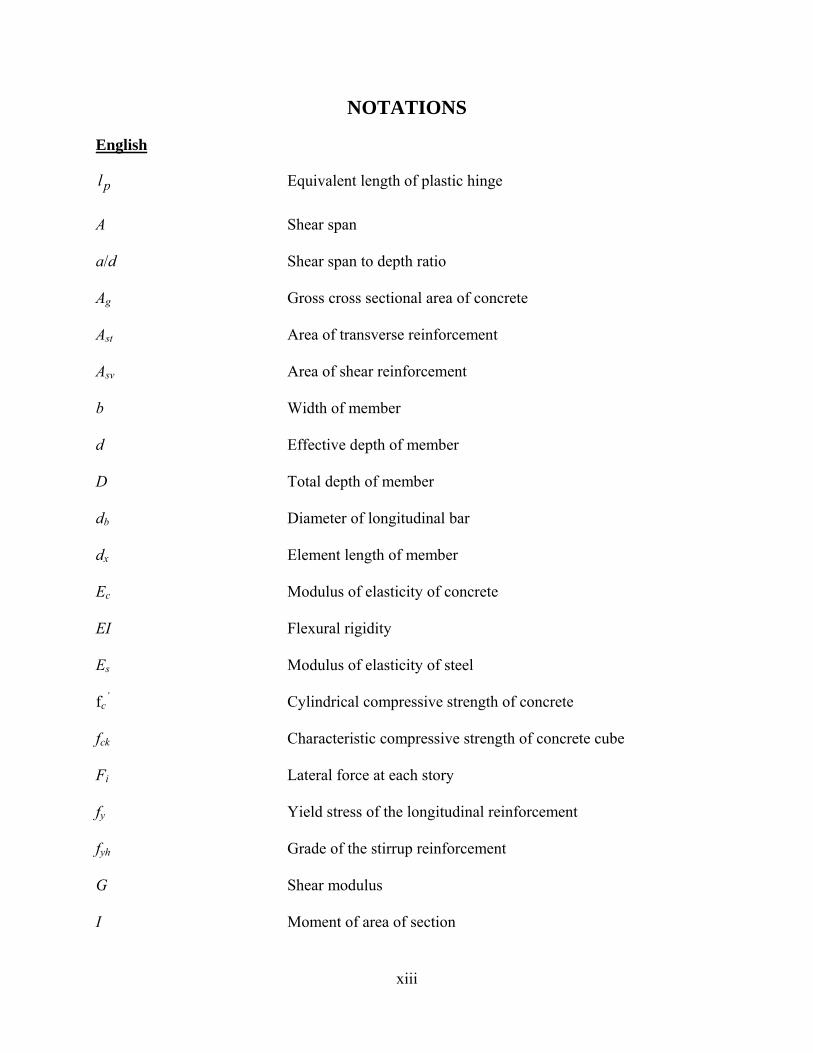
NOTATIONS
English
pl Equivalent length of plastic hinge
A Shear span
a/d Shear span to depth ratio
Ag Gross cross sectional area of concrete
Ast Area of transverse reinforcement
Asv Area of shear reinforcement
b Width of member
d Effective depth of member
D Total depth of member
db Diameter of longitudinal bar
dx Element length of member
Ec Modulus of elasticity of concrete
EI Flexural rigidity
Es Modulus of elasticity of steel
fc’ Cylindrical compressive strength of concrete
fck Characteristic compressive strength of concrete cube
Fi Lateral force at each story
fy Yield stress of the longitudinal reinforcement
fyh Grade of the stirrup reinforcement
G Shear modulus
I Moment of area of section
xiv
L Length of member
Mu Ultimate moment capacity
My Yield moment capacity
Pt Percentage of steel
Sa/g Average response acceleration coefficient
T Time period
Teq The equivalent period
Ti Initial period of vibration of nonlinear system
VB Base shear
Vc Shear strength of concrete
Vp Shear carried by axial load
Vs Shear strength of steel
Vu Ultimate shear strength of concrete
Vy Yield shear strength of concrete
W Seismic weight of the building
Wi Seismic weight of floor i
Z Seismic Zone factor
Greek
Δ Roof displacement
α Angle between inclined stirrups
βeq Equivalent damping ratio
γ Shear strain
xv
γm Partial safety factor
δ Shear displacement
δt Target displacement
θp Plastic rotation
θu Ultimate rotation
θy Yield rotation
μ Displacement ductility ratio
ρ Longitudinal reinforcement ratio
τc Design shear strength of concrete
τv Nominal shear stress
φ Curvature
ω Frequency
1
CHAPTER 1
INTRODUCTION
1.1. OVERVIEW
The problem of shear is not yet fully understood due to involvement of number of
parameters. In earthquake resistance structure heavy emphasis is placed on ductility.
Hence designer must ensure that shear failure can never occur as it is a brittle mode of
failure. Designer has to design the sections such that flexural failure (ductile mode of
failure) antedates the shear failure. Also, shear design is major important factor in
concrete structure since strength of concrete in tension is lower than its strength in
compressions. However, past earthquakes reveal that majority of the reinforced concrete
(RC) structures failed due to shear. Indian construction practice does not guaranty safety
against shear.
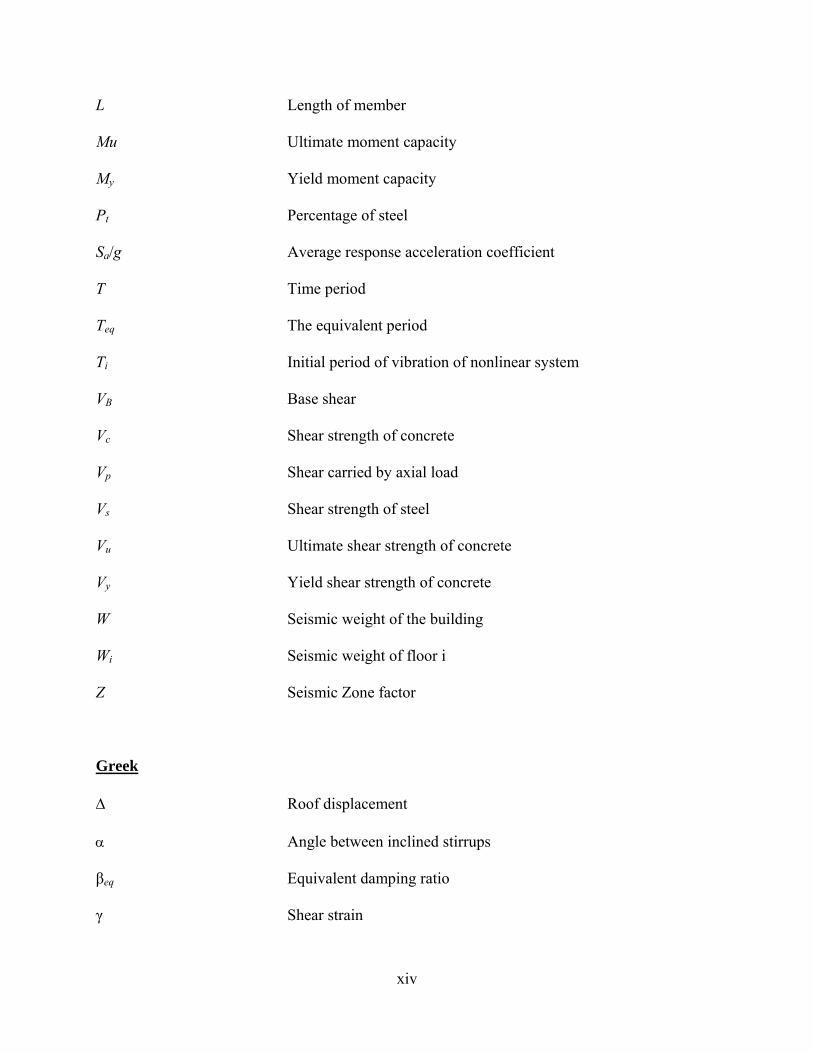
Fig. 1.1: Deformed shape of a nonlinear building model under lateral load
Fig. 1.1 represents deformed shape of a building model under lateral load. Failure
through formation of hinges in the columns is also shown in this figure. A nonlinear
2
analysis like this can predict the failure mode, maximum force and deformation capacity
of the structure. But to do an accurate analysis nonlinear modelling of frame sections for
flexure and shear is very important.
However, the nonlinear modelling of RC sections in shear is not well understood. A
thorough literature review does not reveal any information about the nonlinear modelling
of RC sections in Shear. The current industry practice is to do nonlinear analysis for
flexure only.
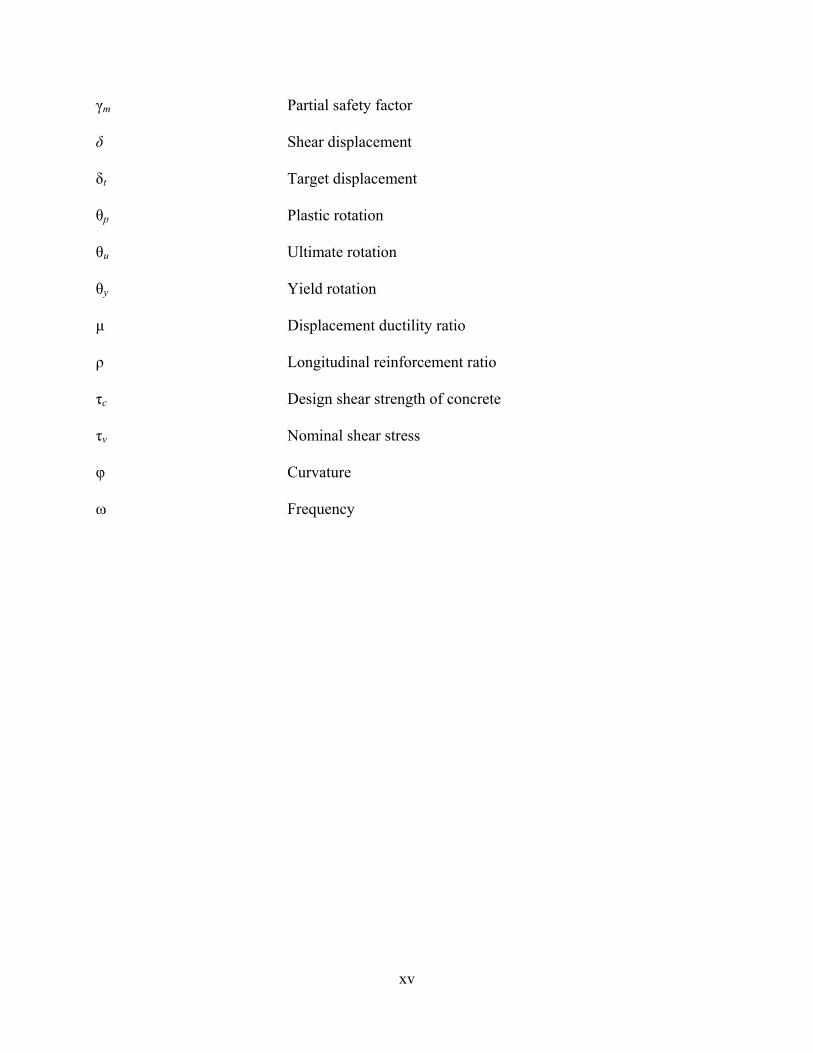
Fig.1.2: Nonlinear models for Moment v/s Rotations
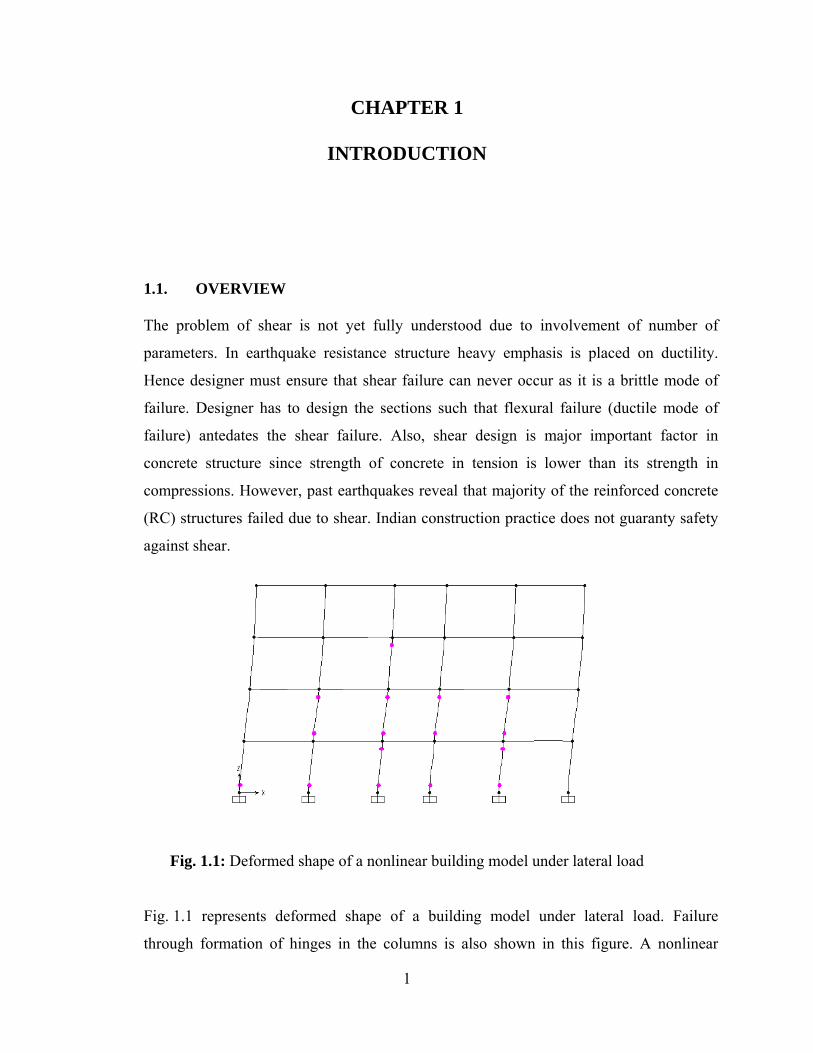
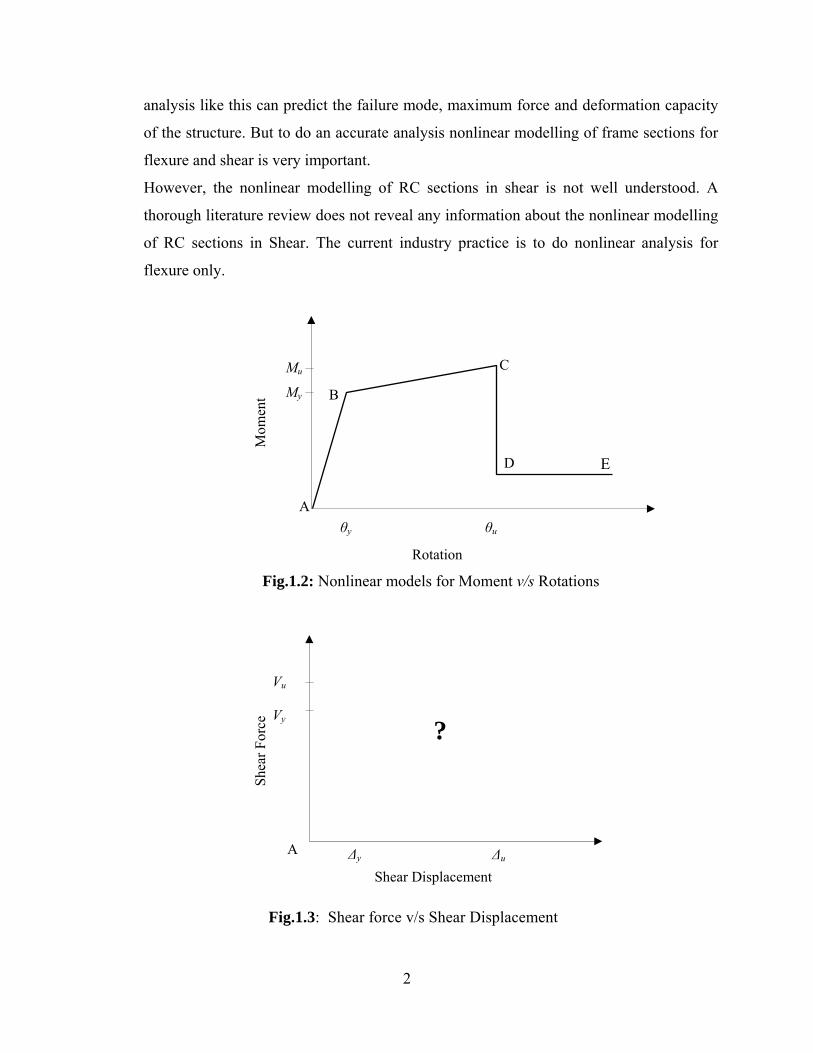
Fig.1.3: Shear force v/s Shear Displacement
A
Vy
Vu
?
Δy Δu
Shear Displacement
Shea
r For
ce
Rotation
A
B
C
D E
My
Mu
θy θu
Mom
ent
3
Fig. 1.2 presents a typical nonlinear moment rotation curve for RC member. Alternative methods
are available in literature to calculate the important points required to define the nonlinear
moment rotation curve for any section. In the conventional analysis the sections are generally
considered to be elastic in shear although this not true. Therefore, the primary objective of the
present work is to develop nonlinear force-deformation model for RC rectangular section for
shear (Fig. 1.3). Also it is important to check how nonlinear modelling of shear alters the seismic
behaviour of RC framed building.
1.2. LITERATURE REVIEW
An extensive literature review is carried out on the three subjects: (a) Estimation of shear
strength of RC section, (b) estimation of shear deformation capacity of RC section and (c)
pushover analysis of RC framed buildings. A number of literatures are found on the estimation of
shear strength for RC sections with and without web reinforcement. Majority of the previous
works on shear strength estimations are based on experimental study. However, there is only one
published literature found on the estimation of shear displacement capacity of RC section. There
is no literature available that demonstrate the pushover analysis of framed building considering
shear failure. Following section presents a brief report of the literature review carried out on the
above mentioned subjects as part of this project.
Ghaffar et. al. (2010) verified the applications of shear strength equations available in literatures
through experimental work. An extensive experimental study was carried out on rectangular
reinforced concrete (RC) beams without web reinforcement. By considering three parameters,
percentage of tension steel (Pt), compressive strength (fck) of concrete, and shear span to depth
4
ratio (a/d), new equations are developed for the shear strength estimation. Experimental results
of the study show that the concrete shear capacity ranges from 1.7√fc΄ to 1.8√fc΄ before any
cracking is observed. It shows that contribution of fc΄ is about 80 to 90% of the total shear before
any cracking which is against the Kani (1979). By considering divorcing point this study
developed new equations for predictions of Cracking shear capacity and Ultimate shear capacity.
Beam design may be economical if shear capacity supplied by new developed equations are kept
in view.
Xu et. al. (2005) presented shear capability of reinforced concrete beams without stirrups using a
fracture mechanics approach. The new analytical formula is developed to shows the
contributions of the reinforcement ratio ( ρ ), shear span to depth ratio (a/d), concrete quality to
shear strength and the size effect in shear fracture. Finally from this new formula, shear bearing
capability of reinforced concrete beam without stirrups evaluated and compared to that
calculated by using Gastebled and May (1998) model, the ACI 318: 1989 Code and CEB-FIP
Model Code (1990) respectively. It is further confirmed that fracture mechanics can be applied to
know both the mode II fracture toughness KIIc and mode II fracture energy GIIF of concrete
materials capability of reinforced concrete beams without stirrups to the assessment of shear
bearing important to perform more pure mode II fracture tests for various concrete materials and
also provides knowledge to develop analytical formula for shear fracture problems in reinforced
concrete members.
Karayannis et. al. (2005) performed experimental investigations on shear capacity of RC
rectangular beam with continuous spiral transverse reinforcement under monotonic loading.
Three specimens consist of beam with common stirrups, spiral transversal reinforcement and
spiral transversal reinforcement with favourably inclined leg with shear span ratio 2.67
5
constructed. Based on experimental results and the behavioural curve of tested beams they found
that the specimens with continuous spiral reinforcements demonstrated 15% and 17%
respectively higher shear strength than the beam with closed stirrups. Beam with spiral
reinforcements with favourably inclined legs exhibited enhanced performance and rather ductile
response whereas other beam shows brittle shear failure.
Chowdhury (2007) developed a suitable hysteretic model that would predict the lateral
deformation behaviour of lightly reinforced or shear-critical columns subjected to gravity and
seismic load. Several tests on reinforced concrete columns under lateral loads have shown that
the total drift stems from deformations owing to flexure, reinforcement slip, and shear. Existing
analytical and experimental research on lightly reinforced columns is examined. This
information is used for modify to ultimately develop a suitable overall hysteretic model that
would accurately predict the lateral response of this class of columns with a limited
computational effort. The behaviour of a column is classified into one of five categories based on
a comparison of the shear, yield and flexural strengths. Overall the model did a reasonable job of
simulating the load deformation relationships of shear-critical columns and provides a suitable
platform to analyze older reinforced concrete buildings with a view to determining the amount of
remediation necessary for satisfactory seismic performance.
Sezen and Setzler (2008) focused on modelling the behaviour of reinforced concrete columns
subjected to lateral loads. Shear failure in columns initially dominated by flexural response is
considered through the use of a shear capacity model. The proposed model was tested on 37
columns from various experimental studies. In general, the model predicted the lateral
deformation response envelope reasonably well. The focus of this research was the creation of a
model that can predict the monotonic lateral force displacement relationship for reinforced
6
concrete columns subjected to lateral loading. The research concentrated on lightly reinforced
columns that experience flexure-shear failures. However, the model can be applied to columns
with any ratio of shear and flexural strengths. Therefore, it is applicable to columns that
experience shear, flexure, or flexure-shear failures.
Ahmad et. al. (2009) presented statistical model for the prediction of shear strength of high
strength reinforced concrete (HSRC) beams. By comparing the actual and predicted values of
shear strength of beams it shows that the proposed equation is conservatives for various
longitudinal reinforcement ratios (ρ). It also compared the predicted values of shear strength to
the values proposed by ACI, Russo et al. (2004), and Bazant et al. (1984). Bazant et al. (1984) is
found to be un-conservative in estimating the shear stress for the HSRC beams without web
reinforcement. The Russo et al. (2004) is more conservative as it underestimates the shear
strength of the HSRC beams without web reinforcement. The ACI-318 equation for shear
strength of HSRC beams gives some reasonable values when compared with the actual and
predicted values. The Russo et al. (2004) on the other hand, is un-conservative for shear strength
of HSRC beams with web reinforcement.
Wafa et. al. (1994) carried out experiment investigations on shear behaviour of reinforced high
strength concrete beam without shear reinforcement. 18 rectangular beams are tested in
combined shear and flexure and compared the experimental shear capacities with shear
capacities predicted by different empirical equations. Two empirical equations have been
proposed to better predict the shear capacity of reinforced high strength concrete beams without
stirrups. The study concluded that beam of low reinforcement ratios fail in flexure irrespective of
their a/d values. Modifications in the ACI code equations (2008) and Zsutty’s equations
7
(1968,1971) have been proposed to predict the shear capacity of reinforced high strength
concrete beam without stirrups.
Paczkowski and Nowak (2008) reviewed the available data base and shear model for reinforced
concrete beams without shear reinforcement and select the most efficient model for design code
for concrete structure. The relationship between shear capacity and parameters such as width and
depth of beam, longitudinal reinforcement ratio and compressive strength of concrete has been
established by using test results.
Zakaria et. al. (2009) present experimental investigations to clarify shear cracking behaviour of
reinforced concrete beams. Test results show that shear reinforcement characteristics,
longitudinal reinforcement ratios, the distance of shear crack from the crack tip and the
intersections with nearest reinforcement’s ratio play critical role in controlling diagonal crack
spacing and openings. This research concluded that shear cracks width increases proportionally
with both the strain of shear reinforcements and the spacing between the shear cracks. This
implies that the stirrups strain and diagonal crack spacing are main factors on shear crack
displacements.
Rao and Injaganeri (2011) performed nonlinear analysis for developing the refined design
models for both the cracking and ultimate shear strength of reinforced concrete beam without
web reinforcement. The proposed models are functions of cylindrical compressive strength (fc’),
longitudinal reinforcement ratio (ρ) and effective depth (d). The proposed models have been
validated with the existing popular model as well as with the design code provisions. The study
concluded that proposed model to predict the ultimate shear strength is simple and predicts shear
strength of RC beams with fair degree of accuracy on the deep, short and normal beams.
8
Angelakos (1999) investigated the influence of concrete strength and main longitudinal
reinforcement ratio on the shear capacity of large, lightly reinforced concrete members with and
without transverse reinforcement. In addition, the test results were used to assess the
performance of the North American code provisions, AC1 318-95 and CSA A23 -3-94 (General
Method). It is found that the general method of CSA A23 -3-94 yielded much better predictions
than the AC1 approach. The five beam specimens constructed with 1% longitudinal
reinforcement without stirrups and several concrete strengths had essentially the same ultimate
shear capacity. The implementation of high-strength concrete proved to be beneficial only when
transverse reinforcement was utilized.
Patwardhan (2005) presented lateral load- shear displacement relationship. By using available
experimental data they evaluated existing available model. The modified compression filed
theory is very complicated to implement but results are to be very accurate. In this study through
investigations of modified compression filed theory analyses performed. By comparing proposed
model with the predictions obtained from existing models and experimental data. The study
concluded that in predicting lateral load – shear displacement relations the proposed model is
simple and give accurate results.
Kadid and Boumrkik (2008) evaluated the performance of framed buildings under earthquakes
with the help of a nonlinear static pushover analysis. Three framed buildings were analyzed with
5, 8 and 12 stories respectively and results obtained from this study show that under seismic
loads, properly designed frames will perform well. This study based on flexural hinge model
concludes that the pushover analysis is relatively simple method to explore the nonlinear
behaviour of buildings. By the intersection of the demand and capacity curves and the
distribution of hinges in the beams and the columns, the behaviour of properly detailed
9
reinforced concrete frame building is adequately indicated. Most of the hinges are formed in the
beams and few in the columns with limited damage.
Inel and Ozmen (2006) considered four and seven-story buildings to investigate the possible
differences in the results of pushover analysis due to user defined nonlinear component
properties for flexure. Pushover analysis is carried out assuming effective parameters like plastic
hinge length and transverse reinforcement spacing for user-defined hinge properties. Plastic
hinge length and transverse reinforcement spacing found to have no influence on the base shear
capacity but they have considerable effects on the displacement capacity of the frames.
Displacement capacity improves by increasing the amount of transverse reinforcement. From this
study they can observe that displacement capacity of the frames is greatly influenced by plastic
hinge length (Lp). Comparisons show that there is a variation of about 30% in displacement
capacities due to plastic hinge length. Modern code compliant buildings may yield a reasonable
capacity curve for the default-hinge model but this model is not suitable for other type of
buildings. Also observations clearly show that in reflecting nonlinear behaviour compatible with
the element properties the user-defined hinge model is better than the default-hinge model.
1.3. OBJECTIVES
Based on the literature review presented above salient objectives of the present study are defined
as follows:
i) To develop nonlinear modelling parameters of rectangular RC members with transverse
reinforcement in shear.
ii) To carry out a seismic evaluation case study of a RC framed building considering
nonlinearity in shear as well as flexure using the developed modelling parameters.

10
1.4. SCOPE OF THE STUDY
i) Only rectangular sections are considered for the present study.
ii) Spiral web reinforcement is kept outside the scope of the present study.
iii) Stress-strain relation for reinforcing steel is taken from the IS 456:2000.
1.5. METHODOLOGY
i) Carry-out detailed literature review on behaviour of shear in RC rectangular sections to
determine nonlinear modelling parameters (yield and ultimate shear strength and
associated displacement).
ii) Carry out a case study of seismic evaluation of a RC building considering nonlinearity in
shear as developed in the present study.
1.6. ORGANIZATION OF THESIS
This introductory chapter (Chapter 1) presents the background and motivation behind this study
followed by a brief report on the literature survey. The objectives and scope of the proposed
research work are presented in this chapter.
Chapter 2 reviews major international design codes with regard to the shear provision. This
includes Indian Standard IS 456: 2000, British standard BS 8110: 1997 (Part 1), American
Standard ACI 318: 2008 and FEMA 356: 2000.
Chapter 3 includes the discussions of existing models for shear capacity with and without web
reinforcement. Alternate shear capacity calculation procedures for structural member as per
published literature are illustrated in this chapter.
11
Chapter 4 presents the existing models available for shear displacement at yield and ultimate
failure point. Existing procedures of shear displacement calculation for RC sections are
discussed in this chapter.
Chapter 5 presents the details of the selected building for the case study, computational
modelling details of selected buildings. It also describes in detail the modelling of nonlinear
force deformations behaviour for flexural and shear hinges.
Chapter 6 presents and discusses the results obtained from nonlinear pushover analysis of the
selected building considering (and ignoring) shear hinge model.
Finally, in Chapter 7, the summary and conclusions are presented. The scope for future work is
also discussed.
12
CHAPTER 2
REVIEW OF CODE PROVISIONS
2.1. OVERVIEW
This chapter reviews major international design codes with regard to the shear provision
in RC section. This includes Indian Standard IS 456: 2000, British standard BS 8110:
1997 (Part 1), American Standard ACI 318: 2008 and FEMA 356: 2000. The shear
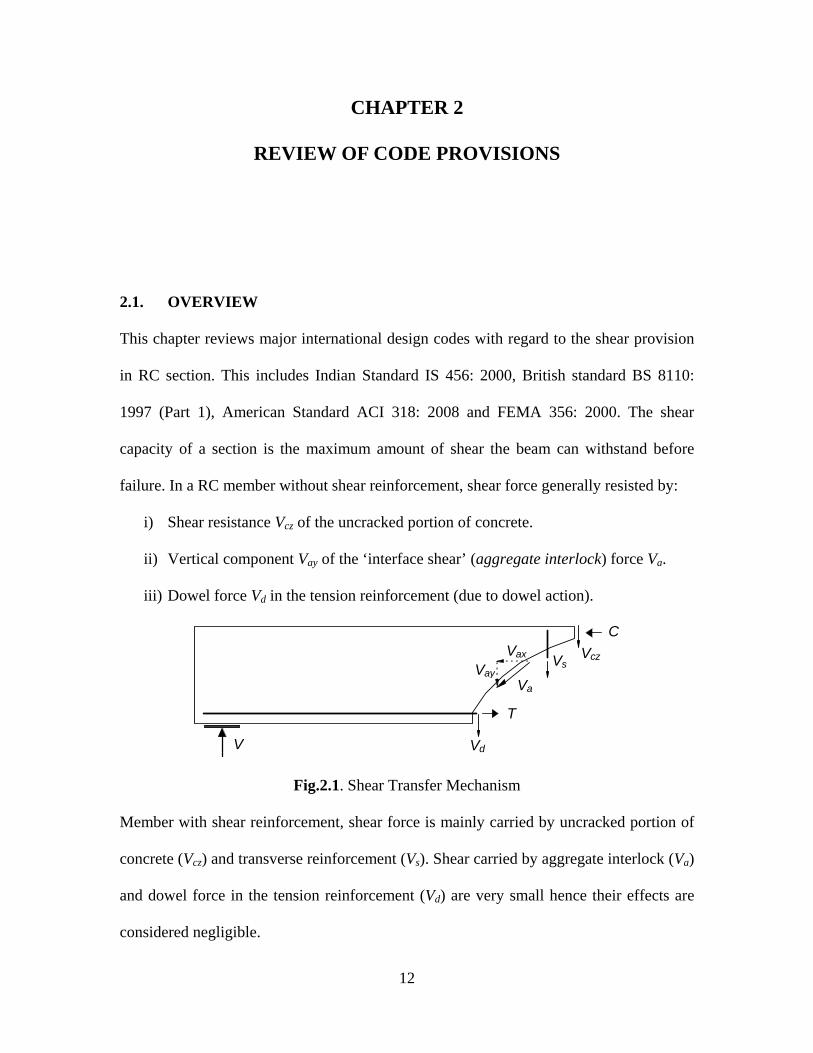
capacity of a section is the maximum amount of shear the beam can withstand before
failure. In a RC member without shear reinforcement, shear force generally resisted by:
i) Shear resistance Vcz of the uncracked portion of concrete.
ii) Vertical component Vay of the ‘interface shear’ (aggregate interlock) force Va.
iii) Dowel force Vd in the tension reinforcement (due to dowel action).
Fig.2.1. Shear Transfer Mechanism
Member with shear reinforcement, shear force is mainly carried by uncracked portion of
concrete (Vcz) and transverse reinforcement (Vs). Shear carried by aggregate interlock (Va)
and dowel force in the tension reinforcement (Vd) are very small hence their effects are
considered negligible.
V Vd
Vax
VayVa
VsVcz
C
T
13
International design codes except British Standard recommend procedures to calculate
shear strength of rectangular and circular RC sections with transverse reinforcement.
However, all the design codes are silent about the maximum shear displacement capacity
of RC sections. Shear strength estimation procedures as per few major international codes
are discussed as follows.
2.2. INDIAN STANDARD (IS 456: 2000)
Indian standard IS 456: 2000 as per Clause 40.1, specify the nominal shear stress by
following equations.
( )2.1uv
Vbd
τ =
Shear carried by concrete is given by
( )2.2u cV bdδ τ=
( )0.85 0.8 1 5 131 1.56
0.116 1.0100
ckuc
g ck
ck
st
fPWhere andA f
f bdHereA
βδ τ
β
β
+ −= + ≤ =
= ≥
As per clause 40.2.2, for member subjected to axial compression Pu , the design shear
strength of concrete, given in Table 19 shall be multiplied by the following factor :
( )31 1.5 2.3u
g ck
PA f
δ = + ≤
The design shear strength of concrete ( cτ ) in beam without shear reinforcements is given
in Table 19. cτ depend upon percentage of steel tp which is given by
14
( )100 2.4tAstp
bd=
If vτ exceeds cτ given in Table 19 , Shear reinforcement shall be provided in any of the
following forms:
• Vertical stirrups
• Bent-up bars along with stirrups
• Inclined stirrups
Contribution of web reinforcement in shear strength given in IS-456: 2000 represent
ultimate strength of the stirrups given by
( )
( )
( ) ( )
0.87 2.5
0.87 sin 2.5.
0.87 sin cos 2.5.
s y svv
s y sv
s y svv
dV f A for vertical stirrupss
V f A for bent upbars a
dV f A for inclined stirrups bs
α
α α
=
=
= +
2.3. BRITISH STANDARD (BS 8110: 1997, PART 1)
British standard BS 8110: PART 1 as per clause 3.4.5.2, specify the nominal shear stress
by following equations.
( )2.6v
Vvb d
=
Where bv is the breadth of the section. For a flanged beam width is taken as the width of
the rib below the flange. V is the design shear force due to ultimate loads and d is the
effective depth. The code gives in Table 3.9 the design concrete shear stress cv which is
used to determine the shear capacity of the concrete alone. Values of cv depend on the
15
percentage of steel in the member, the depth and the concrete grade. The design concrete
shear stress is given by
( )1 113 341000.79 400 2 2.7
25s cu
cm
A f aV forbd d dγ
⎡ ⎤ ⎡ ⎤ ⎡ ⎤⎡ ⎤= × × × >⎢ ⎥ ⎢ ⎥ ⎢ ⎥⎢ ⎥⎣ ⎦⎣ ⎦ ⎣ ⎦⎣ ⎦
100 4003, 1, 1.25 & 40sm cu
Awhere f MPabd d
γ≤ ≥ = ≤ .
2.4. AMERICAN CONCRETE INSTITUTE (ACI318: 2008)
ACI 318: 2008, specify that the shear strength is based on an average shear stress on the
full effective cross section bw d. For a member without shear reinforcement, shear is
assumed to be carried by the concrete web and member with shear reinforcement, a
portion of the shear strength is assumed to be provided by the concrete and the remainder
by the shear reinforcement.
As per clause 11.2,
( )
( ) ( )
( )
( )
'
2.8
0.17 where, 1 2.914
2.10
(sin cos ) 2.10.
y c s
uc c
g
sv yhs
v
sv yhs
v
V V V
PV f bdA
A f dV for vertical stirrups
sA f d
V for inclined stirrups as
δ δ
α α
= +
⎛ ⎞= × × = +⎜ ⎟⎜ ⎟
⎝ ⎠× ×
=
× ×= +
2.5. FEDERAL EMERGENCY MANAGEMENT AGENCY (FEMA 356)
FEMA-356 does not consider contribution of concrete in shear strength calculation for
beam under earthquake loading. FEMA-356 consider ultimate shear strength carried by
16
the web reinforcement (= strength of the beam) as 1.05 times the yield strength. But there
is no engineering background for this consideration.
2.6. SUMMARY
In this chapter the provisions for shear capacity in different international codes are
explained. All the major international codes are using similar function to calculate shear
capacity. However, the prescribed values of the coefficients differ from code to code.
17
CHAPTER 3
SHEAR CAPACITY MODEL
3.1. SHEAR CAPACITY
The shear capacity of a section is the maximum amount of shear the section can withstand before
failure. Based on theoretical concept and experimental data researchers developed many
equations to predict shear capacity but no unique solutions are available. Several equations are
available to determine shear capacity of RC section, i.e., ACI 318:2005 equations, Zsutty’s
equation (1968,1971) and Kim and White equation (1991) etc. To verify the applicability of
these equations experimental study was carried out by several researchers on rectangular RC
beam with and without web reinforcement. Three parameters: cylindrical compressive strength
(fc’), longitudinal reinforcement ratio (ρ) and shear span-to-depth ratio (a/d) are considered for
developing equations for estimating shear strength of RC section without web reinforcement.
3.1.1. Factors affecting shear capacity of beam
There are several parameters that affect the shear capacity of RC sections without web
reinforcement. Following is a list of important parameters that can influence shear capacity of
RC section considerably:
Shear span to depth ratio (a/d)
Tension steel ratio (ρ)
Compressive strength of Concrete (fc)
18
Size of coarse aggregate
Density of concrete
Size of beam
Tensile strength of concrete
Support conditions
Clear span to depth ratio (L/d)
Number of layers of tension reinforcement
Grade of tension reinforcement
End anchorage of tension reinforcement.
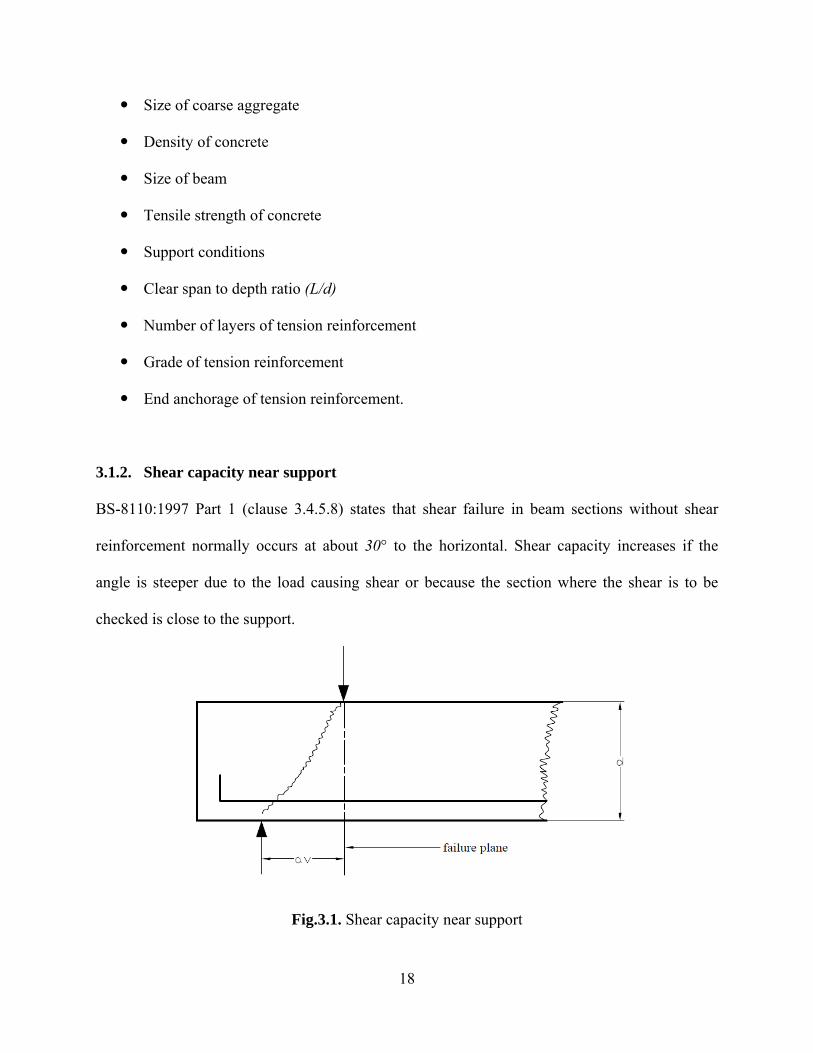
3.1.2. Shear capacity near support
BS-8110:1997 Part 1 (clause 3.4.5.8) states that shear failure in beam sections without shear
reinforcement normally occurs at about 30° to the horizontal. Shear capacity increases if the
angle is steeper due to the load causing shear or because the section where the shear is to be
checked is close to the support.
Fig.3.1. Shear capacity near support
19
The increase is because the concrete in diagonal compression resists shear (Fig. 3.1). The shear
span ratio av /d is small in this case. The design concrete shear can be increased from Vc as
determined above to 2Vcd/av. Where av = length of that part of a member traversed by a shear
plane.
3.1.3. Maximum design shear capacity
BS8110: 1997, Part 1, clauses 3.4.52 and 3.4.58 states that
Nominal shear stress Vvbd
= ≤ 0.8fcu1/2 or 5 N/mm2
even if the beam is reinforced to resist shear. This upper limit prevents failure of the concrete in
diagonal compression. If v is exceeded the beam must be made larger.
3.2. MODES OF FAILURE IN SHEAR
Modes of shear failure for beam without web reinforcement depend on the shear span. Shear
failure is generally classified based on shear span into three types as follows:
i) Diagonal tension failure ( a > 2d)
ii) Diagonal compression failure ( d ≤ a ≤ 2d )
iii) Splitting or true shear failure ( a < d )
3.3. SHEAR CAPACITY EQUATIONS
A number of equations for estimating shear capacity of beam section are available in literature.
This section compiles these equations in two subheadings: (a) beams without web reinforcement
and (b) beams with web reinforcement
20
3.3.1. Beam without web reinforcement
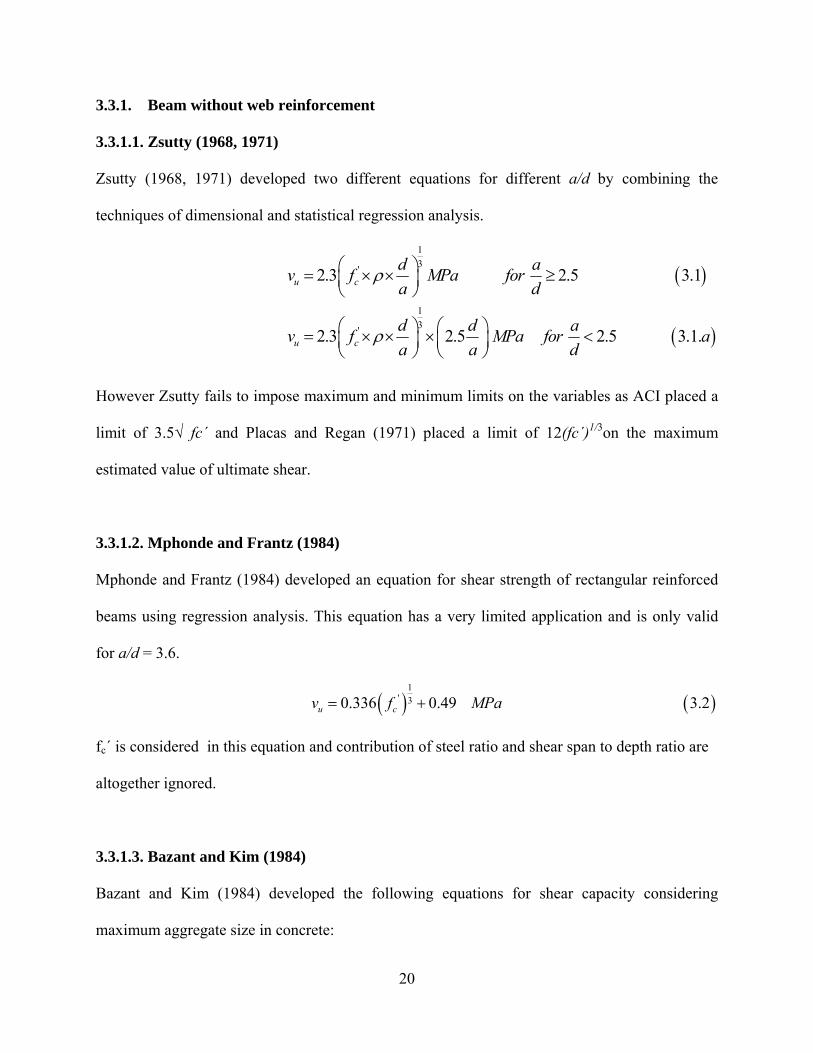
3.3.1.1. Zsutty (1968, 1971)
Zsutty (1968, 1971) developed two different equations for different a/d by combining the
techniques of dimensional and statistical regression analysis.
( )
( )
13'
13'
2.3 2.5 3.1
2.3 2.5 2.5 3.1.
u c
u c
d av f MPa fora d
d d av f MPa for aa a d
ρ
ρ
⎛ ⎞= × × ≥⎜ ⎟⎝ ⎠
⎛ ⎞ ⎛ ⎞= × × × <⎜ ⎟ ⎜ ⎟⎝ ⎠ ⎝ ⎠
However Zsutty fails to impose maximum and minimum limits on the variables as ACI placed a
limit of 3.5√ fc΄ and Placas and Regan (1971) placed a limit of 12(fc΄)1/3on the maximum
estimated value of ultimate shear.
3.3.1.2. Mphonde and Frantz (1984)
Mphonde and Frantz (1984) developed an equation for shear strength of rectangular reinforced
beams using regression analysis. This equation has a very limited application and is only valid
for a/d = 3.6.
( ) ( )1
' 30.336 0.49 3.2u cv f MPa= +
fc΄ is considered in this equation and contribution of steel ratio and shear span to depth ratio are
altogether ignored.
3.3.1.3. Bazant and Kim (1984)
Bazant and Kim (1984) developed the following equations for shear capacity considering
maximum aggregate size in concrete:
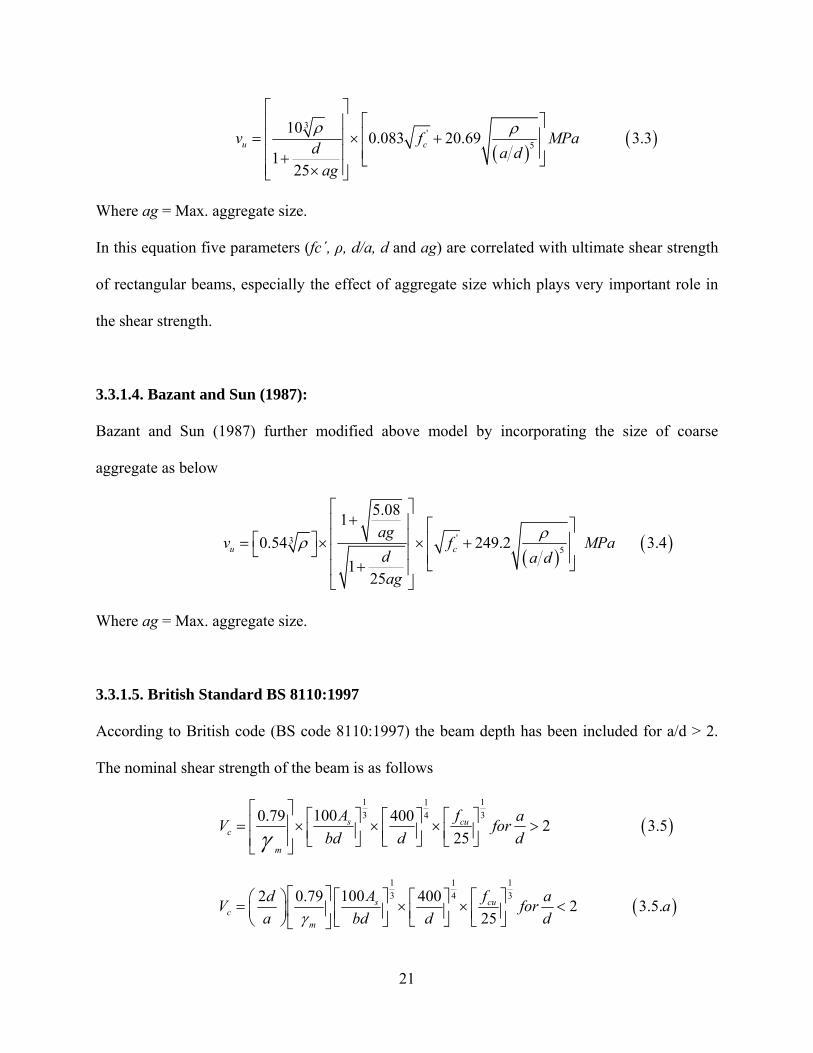
21
( )
( )3
'5
100.083 20.69 3.3
125
u cv f MPad a dag
ρ ρ⎡ ⎤
⎡ ⎤⎢ ⎥⎢ ⎥= × +⎢ ⎥⎢ ⎥⎢ ⎥+ ⎣ ⎦⎢ ⎥×⎣ ⎦
Where ag = Max. aggregate size.
In this equation five parameters (fc΄, ρ, d/a, d and ag) are correlated with ultimate shear strength
of rectangular beams, especially the effect of aggregate size which plays very important role in
the shear strength.
3.3.1.4. Bazant and Sun (1987):
Bazant and Sun (1987) further modified above model by incorporating the size of coarse
aggregate as below
( )
( )'35
5.0810.54 249.2 3.4
125
u cag
v f MPad a dag
ρρ
⎡ ⎤+⎢ ⎥ ⎡ ⎤
⎢ ⎥⎡ ⎤ ⎢ ⎥= × × +⎣ ⎦ ⎢ ⎥ ⎢ ⎥⎣ ⎦+⎢ ⎥⎣ ⎦
Where ag = Max. aggregate size.
3.3.1.5. British Standard BS 8110:1997
According to British code (BS code 8110:1997) the beam depth has been included for a/d > 2.
The nominal shear strength of the beam is as follows
( )1 113 341000.79 400 2 3.5
25s cu
c
m
A f aV forbd d dγ
⎡ ⎤ ⎡ ⎤ ⎡ ⎤⎡ ⎤⎢ ⎥= × × × >⎢ ⎥ ⎢ ⎥⎢ ⎥⎢ ⎥ ⎣ ⎦⎣ ⎦ ⎣ ⎦⎣ ⎦
( )1 113 341002 0.79 400 2 3.5.
25s cu
cm
A fd aV for aa bd d dγ
⎡ ⎤ ⎡ ⎤ ⎡ ⎤⎛ ⎞ ⎡ ⎤= × × <⎢ ⎥⎜ ⎟ ⎢ ⎥ ⎢ ⎥⎢ ⎥⎝ ⎠ ⎣ ⎦⎣ ⎦ ⎣ ⎦⎣ ⎦
22
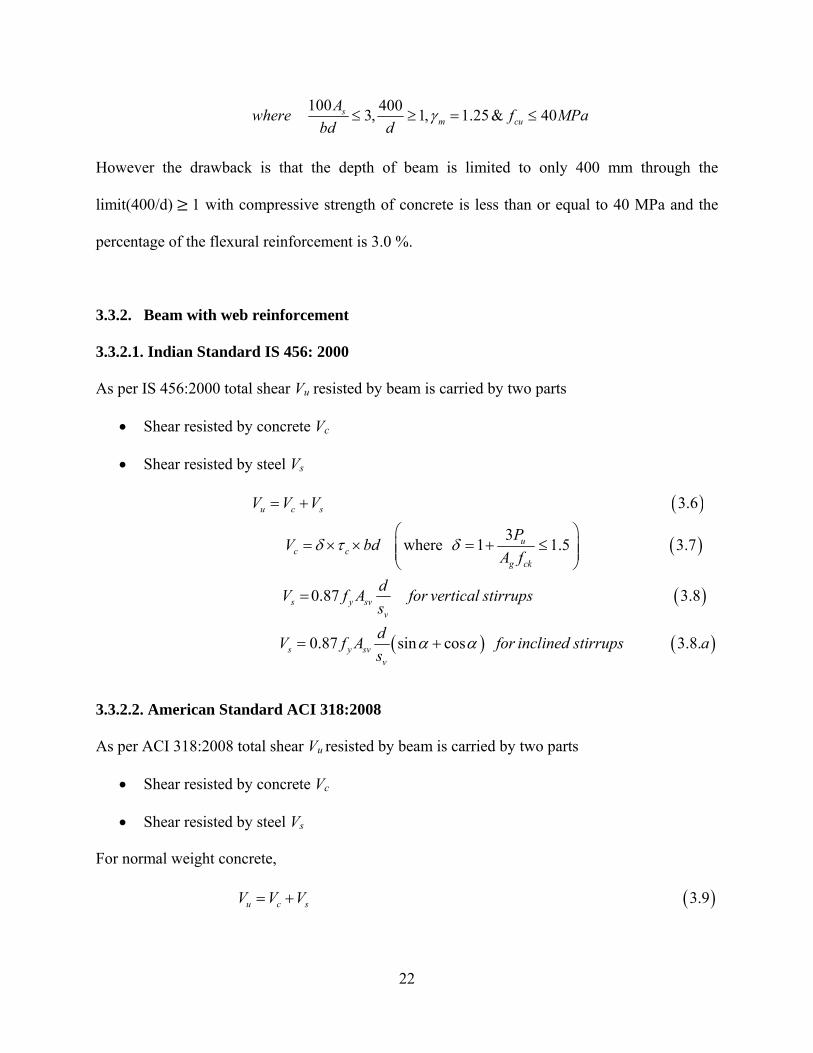
100 4003, 1, 1.25 & 40sm cu
Awhere f MPabd d
γ≤ ≥ = ≤
However the drawback is that the depth of beam is limited to only 400 mm through the
limit(400/d) 1 with compressive strength of concrete is less than or equal to 40 MPa and the
percentage of the flexural reinforcement is 3.0 %.
3.3.2. Beam with web reinforcement
3.3.2.1. Indian Standard IS 456: 2000
As per IS 456:2000 total shear Vu resisted by beam is carried by two parts
• Shear resisted by concrete Vc
• Shear resisted by steel Vs
( )
( )
( )
( ) ( )
3.6
3where 1 1.5 3.7
0.87 3.8
0.87 sin cos 3.8.
u c s
uc c
g ck
s y svv
s y svv
V V V
PV bdA f
dV f A for vertical stirrupssdV f A for inclined stirrups as
δ τ δ
α α
= +
⎛ ⎞= × × = + ≤⎜ ⎟⎜ ⎟
⎝ ⎠
=
= +
3.3.2.2. American Standard ACI 318:2008
As per ACI 318:2008 total shear Vu resisted by beam is carried by two parts
• Shear resisted by concrete Vc
• Shear resisted by steel Vs
For normal weight concrete,
( )3.9u c sV V V= +
23
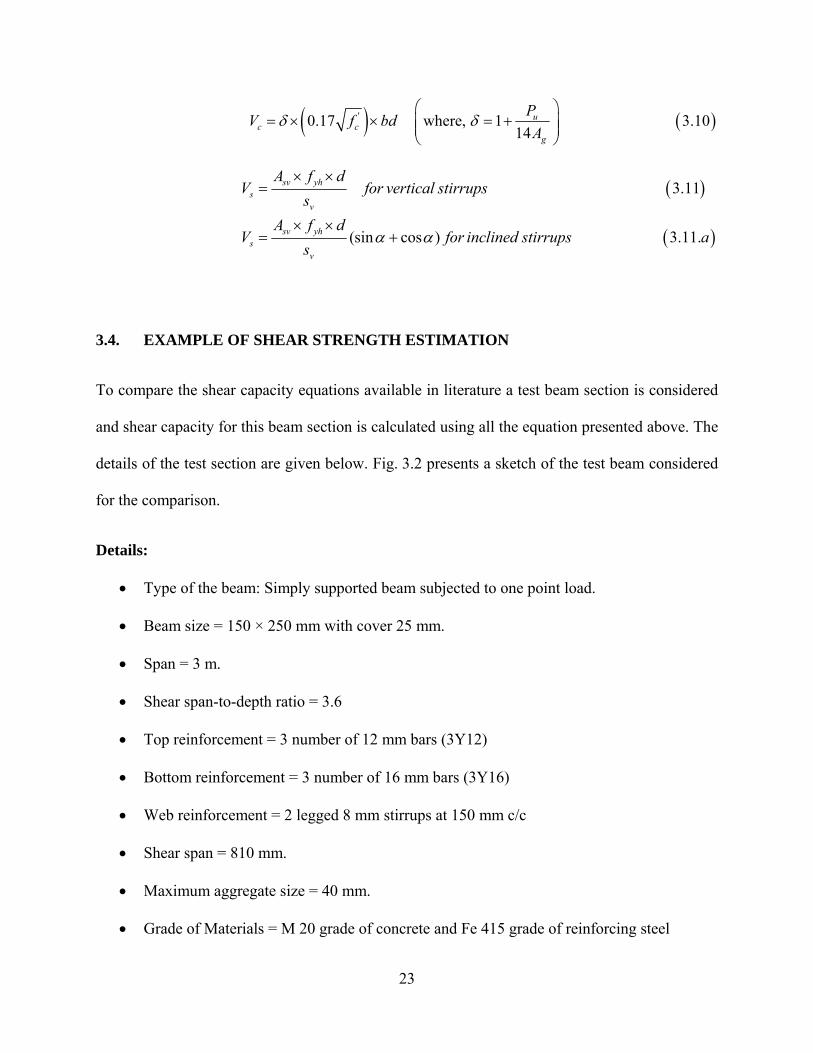
( ) ( )'0.17 where, 1 3.1014
uc c
g
PV f bdA
δ δ⎛ ⎞
= × × = +⎜ ⎟⎜ ⎟⎝ ⎠
( )
( )
3.11
(sin cos ) 3.11.
sv yhs
v
sv yhs
v
A f dV for vertical stirrups
sA f d
V for inclined stirrups as
α α
× ×=
× ×= +
3.4. EXAMPLE OF SHEAR STRENGTH ESTIMATION
To compare the shear capacity equations available in literature a test beam section is considered
and shear capacity for this beam section is calculated using all the equation presented above. The
details of the test section are given below. Fig. 3.2 presents a sketch of the test beam considered
for the comparison.
Details:
• Type of the beam: Simply supported beam subjected to one point load.
• Beam size = 150 × 250 mm with cover 25 mm.
• Span = 3 m.
• Shear span-to-depth ratio = 3.6
• Top reinforcement = 3 number of 12 mm bars (3Y12)
• Bottom reinforcement = 3 number of 16 mm bars (3Y16)
• Web reinforcement = 2 legged 8 mm stirrups at 150 mm c/c
• Shear span = 810 mm.
• Maximum aggregate size = 40 mm.
• Grade of Materials = M 20 grade of concrete and Fe 415 grade of reinforcing steel
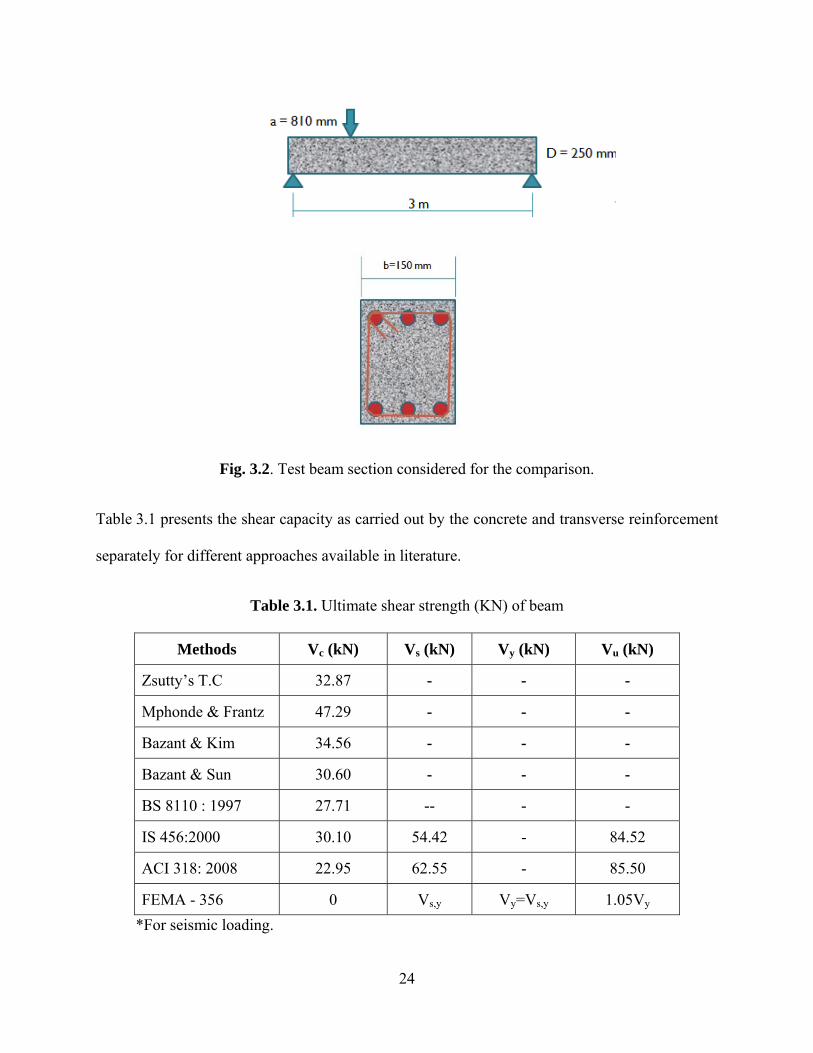
24
Fig. 3.2. Test beam section considered for the comparison.
Table 3.1 presents the shear capacity as carried out by the concrete and transverse reinforcement
separately for different approaches available in literature.
Table 3.1. Ultimate shear strength (KN) of beam
Methods Vc (kN) Vs (kN) Vy (kN) Vu (kN)
Zsutty’s T.C 32.87 - - -
Mphonde & Frantz 47.29 - - -
Bazant & Kim 34.56 - - -
Bazant & Sun 30.60 - - -
BS 8110 : 1997 27.71 -- - -
IS 456:2000 30.10 54.42 - 84.52
ACI 318: 2008 22.95 62.55 - 85.50
FEMA - 356 0 Vs,y Vy=Vs,y 1.05Vy *For seismic loading.
25
3.5. SUMMARY
This chapter discusses briefly the existing models available for shear capacity estimation for
sections with and without web reinforcement. Shear capacity calculations for structural member
are included as well. From this chapter it can be calculated that FEMA-356 does not consider
contribution of concrete in shear strength calculation for beam under earthquake loading.
Contribution of web reinforcement in shear strength given in IS-456: 2000 and ACI-318: 2008
represent ultimate strength of the stirrups. FEMA-356 consider ultimate shear strength carried by
the web reinforcement (= strength of the beam) as 1.05 times the yield strength hence no clarity
in yield strength.
26
CHAPTER 4
SHEAR DISPLACEMENT MODEL
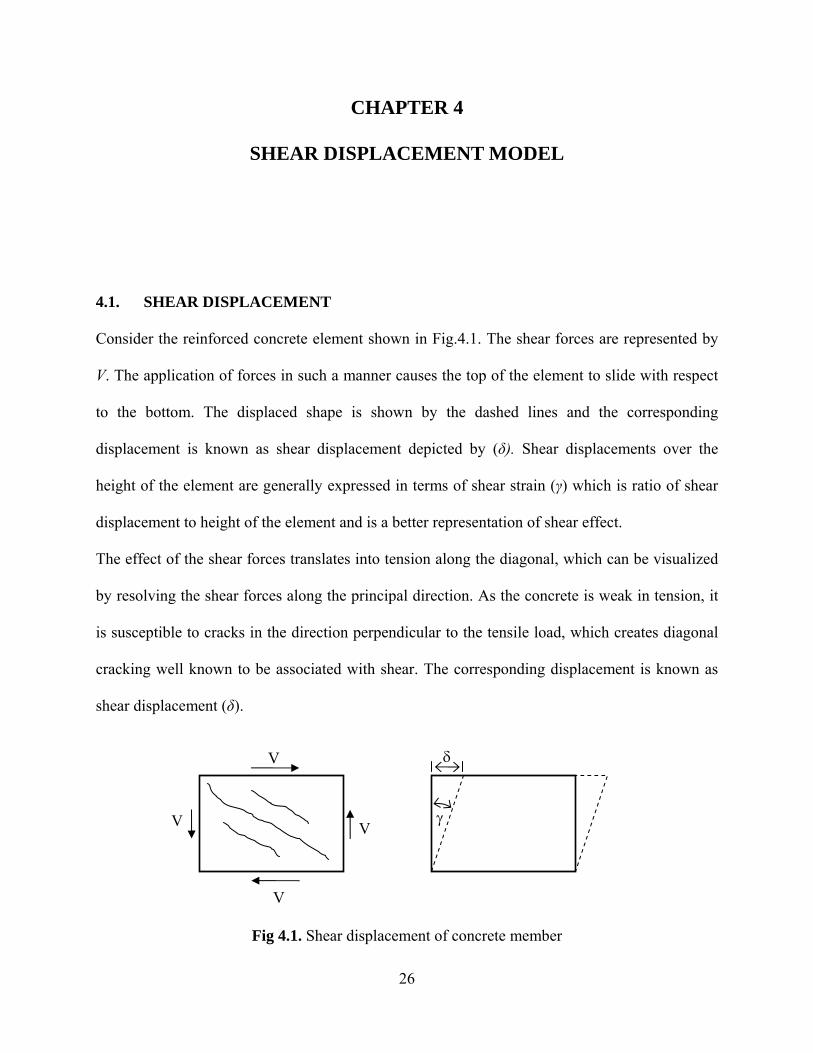
4.1. SHEAR DISPLACEMENT
Consider the reinforced concrete element shown in Fig.4.1. The shear forces are represented by
V. The application of forces in such a manner causes the top of the element to slide with respect
to the bottom. The displaced shape is shown by the dashed lines and the corresponding
displacement is known as shear displacement depicted by (δ). Shear displacements over the
height of the element are generally expressed in terms of shear strain (γ) which is ratio of shear
displacement to height of the element and is a better representation of shear effect.
The effect of the shear forces translates into tension along the diagonal, which can be visualized
by resolving the shear forces along the principal direction. As the concrete is weak in tension, it
is susceptible to cracks in the direction perpendicular to the tensile load, which creates diagonal
cracking well known to be associated with shear. The corresponding displacement is known as
shear displacement (δ).
Fig 4.1. Shear displacement of concrete member
V
V
V
V
δ
γ
27
Deflections due to flexure and bond-slip are relatively easy to model with adequate accuracy
whereas calculating shear displacement accurately has not been investigated thoroughly. The
accuracy of the few existing models is not known. This chapter presents various methodologies
available in literature to estimate shear displacement of RC section for un-cracked phase, at yield
and at collapse.
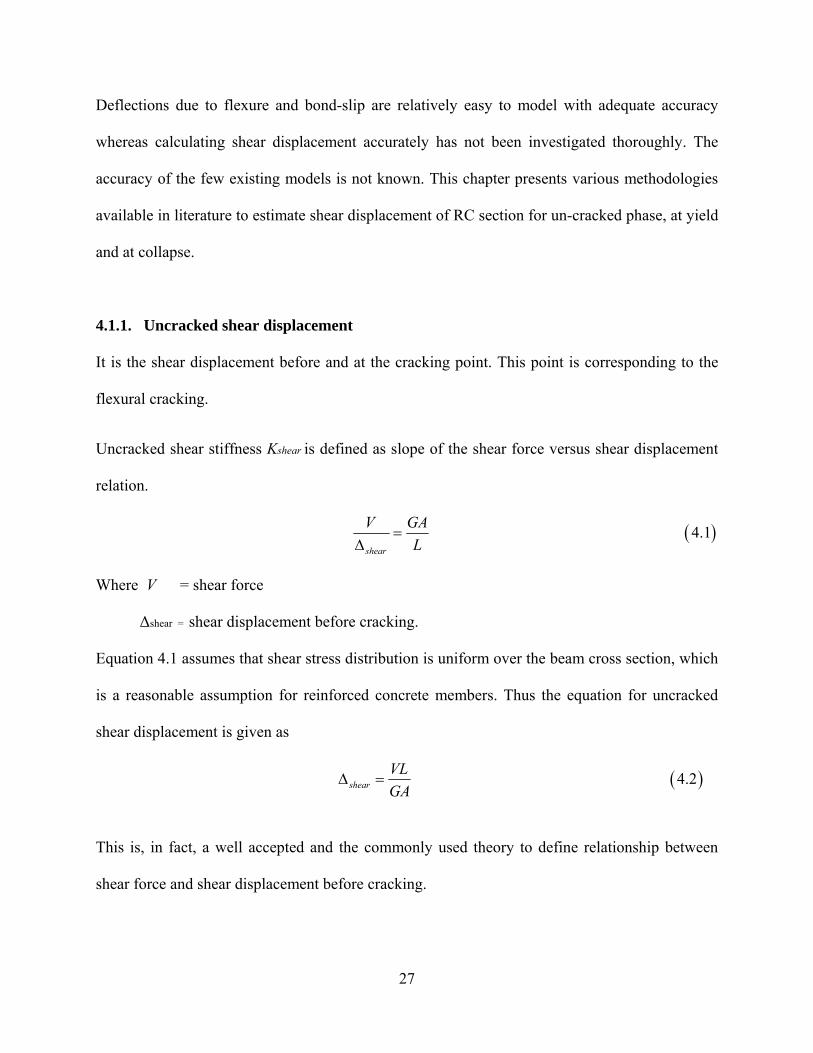
4.1.1. Uncracked shear displacement
It is the shear displacement before and at the cracking point. This point is corresponding to the
flexural cracking.
Uncracked shear stiffness Kshear is defined as slope of the shear force versus shear displacement
relation.
( )4.1shear
V GAL
=Δ
Where V = shear force
Δshear = shear displacement before cracking.
Equation 4.1 assumes that shear stress distribution is uniform over the beam cross section, which
is a reasonable assumption for reinforced concrete members. Thus the equation for uncracked
shear displacement is given as
( )4.2shearVLGA
Δ =
This is, in fact, a well accepted and the commonly used theory to define relationship between
shear force and shear displacement before cracking.
28
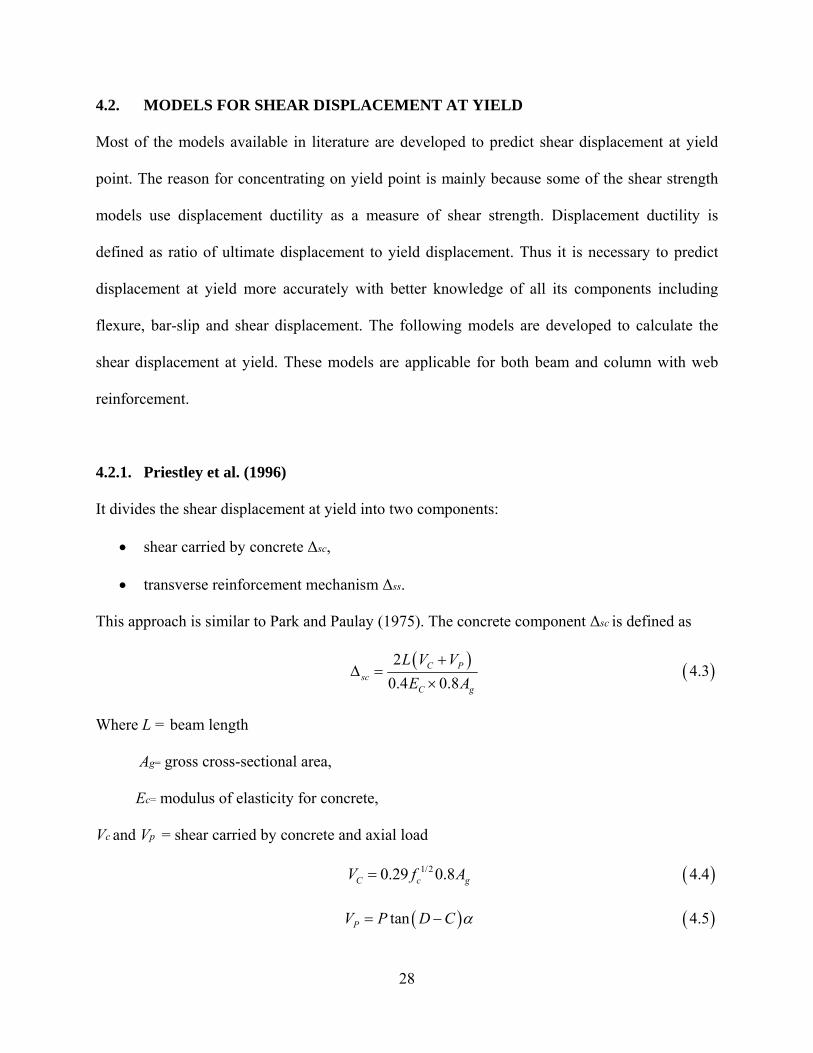
4.2. MODELS FOR SHEAR DISPLACEMENT AT YIELD
Most of the models available in literature are developed to predict shear displacement at yield
point. The reason for concentrating on yield point is mainly because some of the shear strength
models use displacement ductility as a measure of shear strength. Displacement ductility is
defined as ratio of ultimate displacement to yield displacement. Thus it is necessary to predict
displacement at yield more accurately with better knowledge of all its components including
flexure, bar-slip and shear displacement. The following models are developed to calculate the
shear displacement at yield. These models are applicable for both beam and column with web
reinforcement.
4.2.1. Priestley et al. (1996)
It divides the shear displacement at yield into two components:
• shear carried by concrete Δsc,
• transverse reinforcement mechanism Δss.
This approach is similar to Park and Paulay (1975). The concrete component Δsc is defined as
( ) ( )2
4.30.4 0.8
C Psc
C g
L V VE A
+Δ =
×
Where L = beam length
Ag= gross cross-sectional area,
Ec= modulus of elasticity for concrete,
Vc and Vp = shear carried by concrete and axial load
( )1/20.29 0.8 4.4C c gV f A=
( ) ( )tan 4.5PV P D C α= −
29
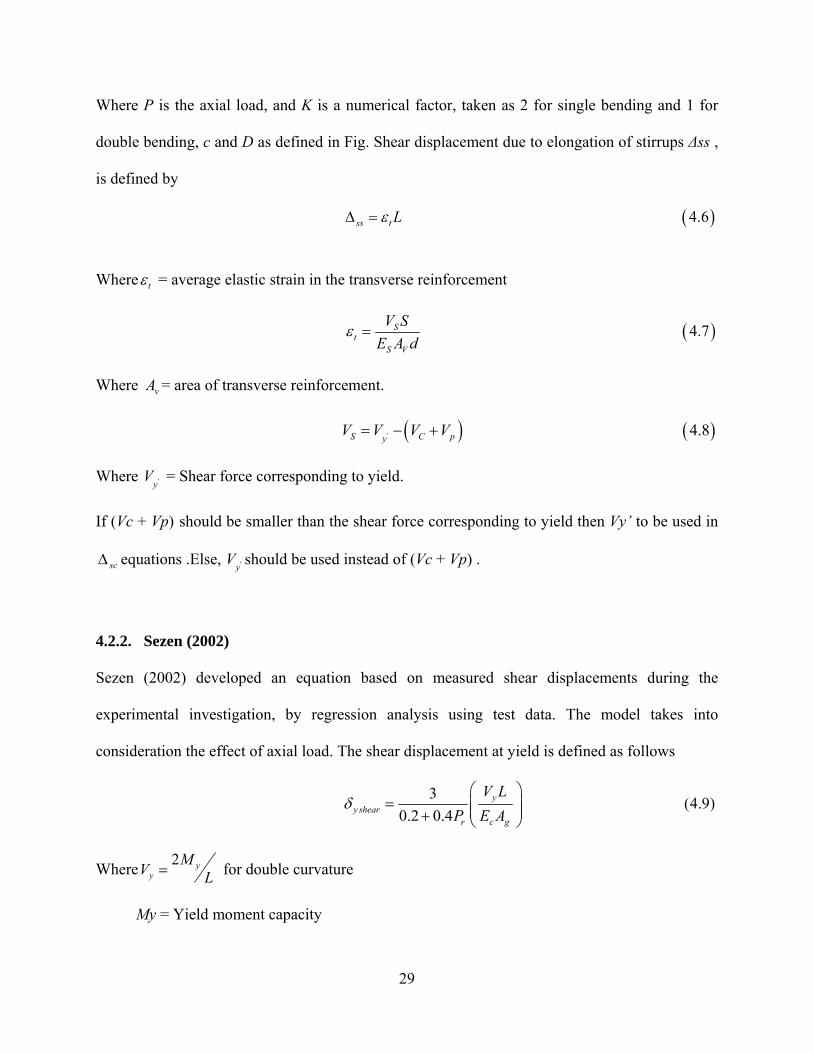
Where P is the axial load, and K is a numerical factor, taken as 2 for single bending and 1 for
double bending, c and D as defined in Fig. Shear displacement due to elongation of stirrups Δss ,
is defined by
( )4.6ss t LεΔ =
Where tε = average elastic strain in the transverse reinforcement
( )4.7St
S V
V SE A d
ε =
Where vA = area of transverse reinforcement.
( ) ( )' 4.8S C pyV V V V= − +
Where 'yV = Shear force corresponding to yield.
If (Vc + Vp) should be smaller than the shear force corresponding to yield then Vy’ to be used in
scΔ equations .Else, 'yV should be used instead of (Vc + Vp) .
4.2.2. Sezen (2002)
Sezen (2002) developed an equation based on measured shear displacements during the
experimental investigation, by regression analysis using test data. The model takes into
consideration the effect of axial load. The shear displacement at yield is defined as follows
3 (4.9)0.2 0.4
yy shear
r c g
V LP E A
δ⎛ ⎞
= ⎜ ⎟⎜ ⎟+ ⎝ ⎠
Where 2 yy
MV L= for double curvature
My = Yield moment capacity
30
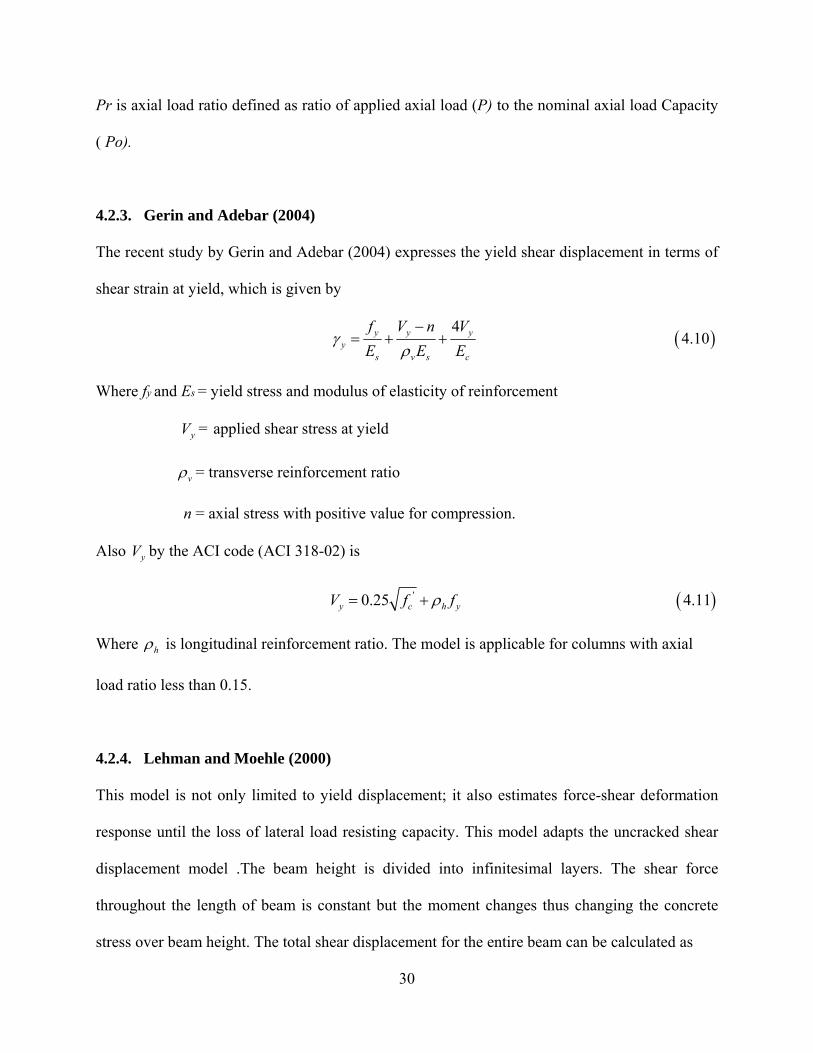
Pr is axial load ratio defined as ratio of applied axial load (P) to the nominal axial load Capacity
( Po).
4.2.3. Gerin and Adebar (2004)
The recent study by Gerin and Adebar (2004) expresses the yield shear displacement in terms of
shear strain at yield, which is given by
( )4
4.10y y yy
s v s c
f V n VE E E
γρ−
= + +
Where fy and Es = yield stress and modulus of elasticity of reinforcement
yV = applied shear stress at yield
vρ = transverse reinforcement ratio
n = axial stress with positive value for compression.
Also yV by the ACI code (ACI 318-02) is
( )'0.25 4.11y c h yV f fρ= +
Where hρ is longitudinal reinforcement ratio. The model is applicable for columns with axial
load ratio less than 0.15.
4.2.4. Lehman and Moehle (2000)
This model is not only limited to yield displacement; it also estimates force-shear deformation
response until the loss of lateral load resisting capacity. This model adapts the uncracked shear
displacement model .The beam height is divided into infinitesimal layers. The shear force
throughout the length of beam is constant but the moment changes thus changing the concrete
stress over beam height. The total shear displacement for the entire beam can be calculated as
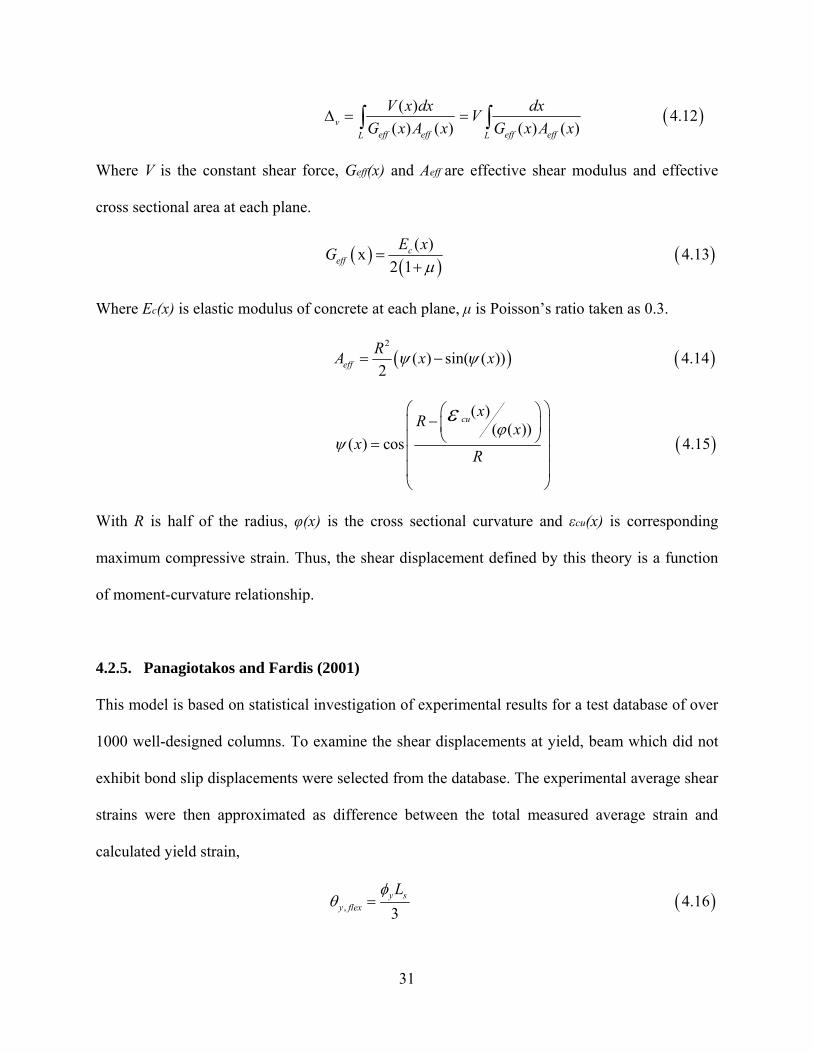
31
( )( ) 4.12( ) ( ) ( ) ( )v
eff eff eff effL L
V x dx dxVG x A x G x A x
Δ = =∫ ∫
Where V is the constant shear force, Geff(x) and Aeff are effective shear modulus and effective
cross sectional area at each plane.
( ) ( ) ( )( )x 4.132 1
ceff
E xGμ
=+
Where Ec(x) is elastic modulus of concrete at each plane, μ is Poisson’s ratio taken as 0.3.
( ) ( )2
( ) sin( ( )) 4.142eff
RA x xψ ψ= −
( )
( )( ( ))
( ) cos 4.15
cu xR xx
R
ϕψ
ε⎛ ⎞⎛ ⎞−⎜ ⎟⎜ ⎟⎝ ⎠⎜ ⎟=
⎜ ⎟⎜ ⎟⎝ ⎠
With R is half of the radius, φ(x) is the cross sectional curvature and εcu(x) is corresponding
maximum compressive strain. Thus, the shear displacement defined by this theory is a function
of moment-curvature relationship.
4.2.5. Panagiotakos and Fardis (2001)
This model is based on statistical investigation of experimental results for a test database of over
1000 well-designed columns. To examine the shear displacements at yield, beam which did not
exhibit bond slip displacements were selected from the database. The experimental average shear
strains were then approximated as difference between the total measured average strain and
calculated yield strain,
( ), 4.163y s
y flex
Lφθ =
32
Where Ls =shear span,
yφ = Yield curvature = cc
ε
Shear displacement at yield is given by:
( )0.0025 4.17y shear sLδ =
4.3. MODELS FOR ULTIMATE SHEAR DISPLACEMENT
The following models are developed to calculate the shear displacement at the maximum shear
strength.
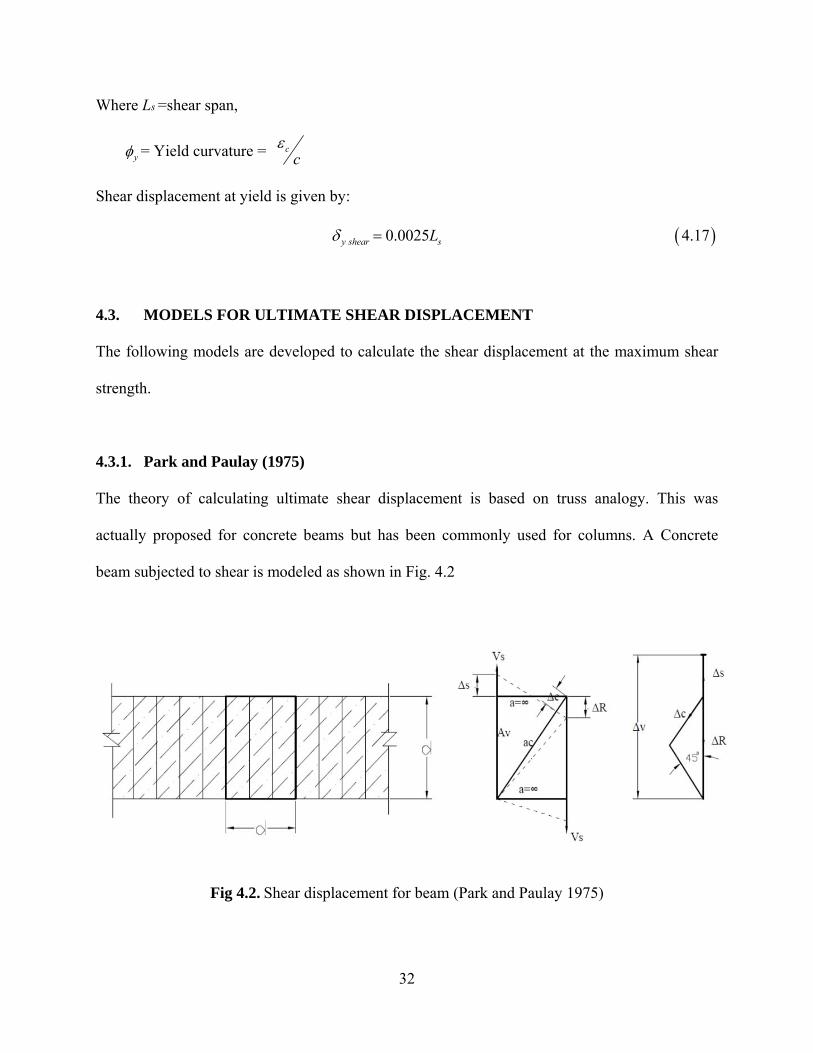
4.3.1. Park and Paulay (1975)
The theory of calculating ultimate shear displacement is based on truss analogy. This was
actually proposed for concrete beams but has been commonly used for columns. A Concrete
beam subjected to shear is modeled as shown in Fig. 4.2
Fig 4.2. Shear displacement for beam (Park and Paulay 1975)
33
From geometry, shear displacement as,
( )2 4.18v s cΔ = Δ + Δ
Where 2 2 s
cc w
VE b
Δ = = Shortening of concrete (i.e. compression of struts)
ss
s v
V sE A
Δ = = Elongations of stirrups
Expressing the displacements in terms of the shear force resisted by stirrups Vs, Then shear
distortion per unit length θv as
( )1 4 4.19sv
s w v
VE b d
θ ηρ
⎛ ⎞= +⎜ ⎟
⎝ ⎠
Where Es = Modulus of elasticity for steel,
n = = Modular ratio
wb = Width of beam web
d = Effective depth
vv
w
Asb
ρ = = Transverse reinforcement ratio
It does not take into account the effect of axial load thus its use to predict the shear displacement
of compression members should be avoided.
4.3.2. CEB (1985)
Comite Euro-International du Beton (CEB) (1985) uses the theory proposed by Park and Paulay
(1975) with a change for the value of shear force. It can be noted that shear distortion per unit
length uses amount of shear resisted by stirrups Vs, whereas CEB suggests to use the total shear
force V that includes contribution of stirrups as well as concrete.
34
4.3.3. Gerin and Adebar (2004)
Ultimate shear displacement can be obtained in terms of ultimate shear strain yγ in this mode. As
given by Equation proposed for shear strain ductility yμ based on investigation of expt. data
( )4 12 4.20'
0.25 '
yuy
y c
y
f
here fc
νγμγ
ν
= = −
≤
Where yγ is the yield shear strain and yυ is the yield shear stress.
4.4. CALCULATIONS FOR YIELD AND ULTIMATE SHEAR DISPLACEMENT
To compare equations available in literature for estimation of shear displacement at yield and
ultimate point, a test beam section is considered and shear displacement for this beam section is
calculated using all the equation presented above. The details of the test section are given below.
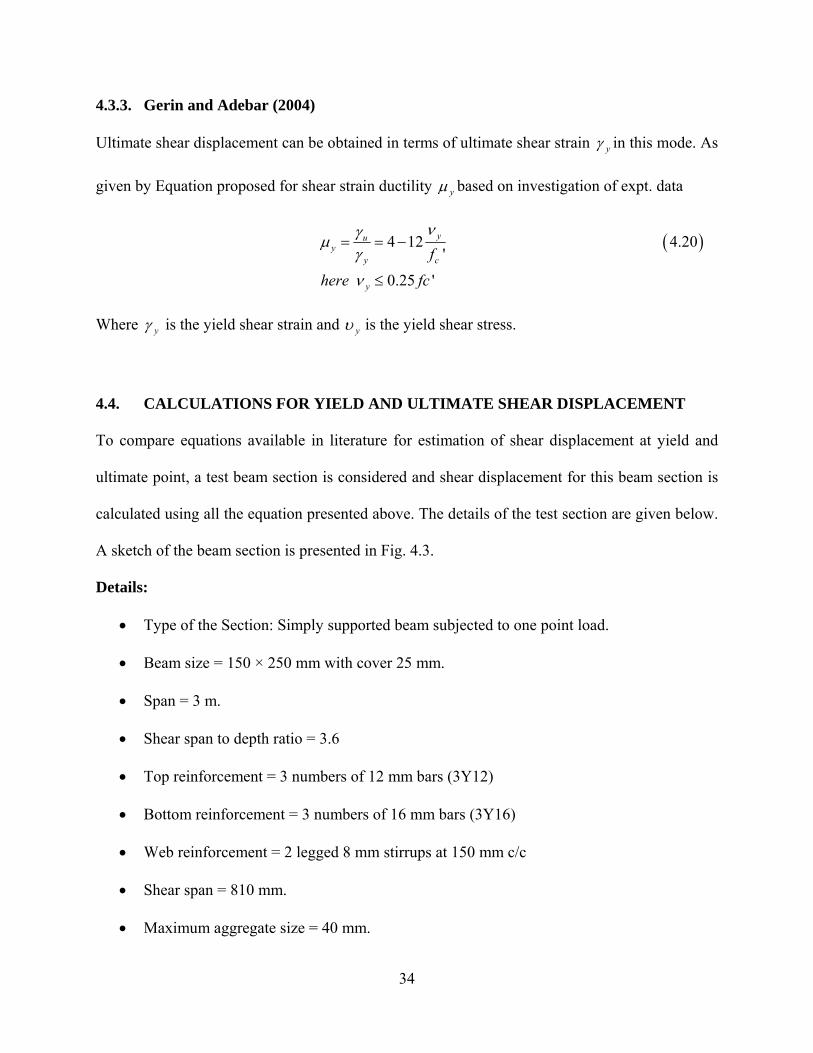
A sketch of the beam section is presented in Fig. 4.3.
Details:
• Type of the Section: Simply supported beam subjected to one point load.
• Beam size = 150 × 250 mm with cover 25 mm.
• Span = 3 m.
• Shear span to depth ratio = 3.6
• Top reinforcement = 3 numbers of 12 mm bars (3Y12)
• Bottom reinforcement = 3 numbers of 16 mm bars (3Y16)
• Web reinforcement = 2 legged 8 mm stirrups at 150 mm c/c
• Shear span = 810 mm.
• Maximum aggregate size = 40 mm.
35
• Grade of materials = M 20 grade of concrete and Fe 415 grade of reinforcing steel.
Fig. 4.3. Test beam section considered for the comparison.
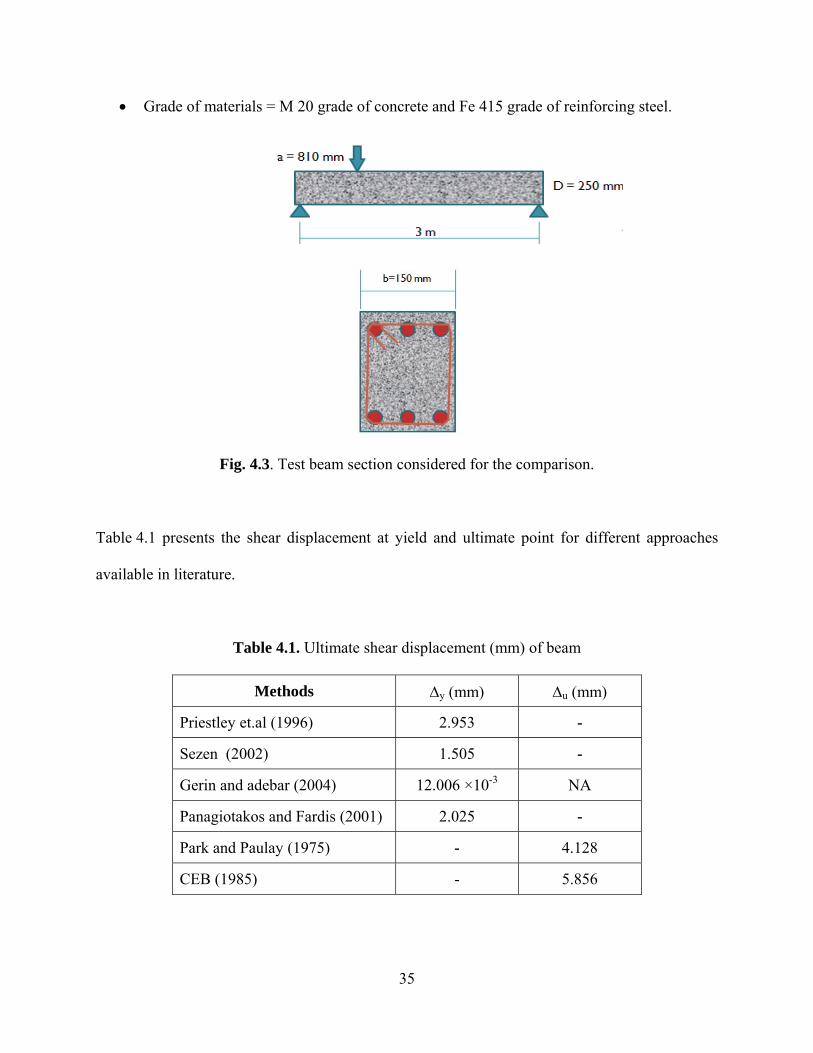
Table 4.1 presents the shear displacement at yield and ultimate point for different approaches
available in literature.
Table 4.1. Ultimate shear displacement (mm) of beam
Methods Δy (mm) Δu (mm)
Priestley et.al (1996) 2.953 -
Sezen (2002) 1.505 -
Gerin and adebar (2004) 12.006 ×10⁻³ NA
Panagiotakos and Fardis (2001) 2.025 -
Park and Paulay (1975) - 4.128
CEB (1985) - 5.856

36
4.5. SUMMARY
Estimation of shear displacement capacity of RC section is an important part of the nonlinear
shear failure modelling. There are very few published literatures available on this area. Chapter 4
presents the existing models available for shear displacement at yield and ultimate. Shear
displacement calculation for structural member using available methods are also demonstrated
through a case study. The model by Sezen (2002) is based on regression analysis of test data.
Model by Panagiotakos and Fardis (2001) is simple but it is reported to be overestimating the
shear displacement. Model proposed by Gerin and Adebar (2004) is reported to be
underestimating the shear displacements at yeild. Models proposed by Park and Paulay (1975)
and CEB (1985) are reported to be effective in predicting the ultimate shear displacements.
Model by Gerin and Adebar (2004) is reported to be not suitable for predicting the ultimate shear
displacements.
37
CHAPTER 5
STRUCTURAL MODELLING
5.1. INTRODUCTION
In the present study an existing building is selected for seismic evaluation case study.
This building is analyzed considering nonlinear flexural and shear failure of the frame
elements. Shear failure model is developed from the existing literature presented in the
previous chapters. The building is also analyzed ignoring the shear failure of the frame
elements for demonstrating the importance of shear failure model in seismic evaluation
study. All the analyses are carried out in commercial software SAP 2000.
Developing computational model is an important part on which linear or nonlinear, static
or dynamic analysis performed. First part of this chapter explains the details of
computational model. Also, details of the selected building model are described in this
section. Accurate modeling of the nonlinear properties of various structural elements is
very important in nonlinear analysis. Frame elements in this study are modelled with
inelastic flexural hinges and shear hinges. The procedure to generate these hinge
properties and its related assumptions are briefly explained in the second part of this
chapter.
5.2. COMPUTATIONAL MODEL
Modeling a building consist of the modeling and assemblage of its various load-carrying
38
elements. A model must represent the 3D characteristics of building, including mass
distribution, strength, stiffness and deformability. Modeling of the material properties and
structural elements used in the present study is discussed below.
5.2.1 Material Properties
The material properties of any member consists of its mass, unit weight ,modulus of
elasticity, poisson’s ratio, shear modulus and coefficient of thermal expansions.The
material grades used for frame model are presented in Table 5.1.
Table 5.1 Materials Grades
Material Grade
Concrete M 20
Reinforcing steel Fe 415
Elastic material properties of these materials are taken as per Indian Standard IS 456:
2000. The short-term modulus of elasticity (Ec) of concrete is taken as:
E 5000 5.1
fck is the characteristic compressive strength of concrete cube in MPa at 28-day (25 MPa
in this case). For the steel rebar, yield stress (fy) and modulus of elasticity (Es) is taken as
per IS 456 (2000).
5.2.2. Structural Elements
Beams and columns are modelled by 3D frame elements. To obtain the bending moments
and forces at the beam and column faces beam-column joints are modelled by giving end-
39
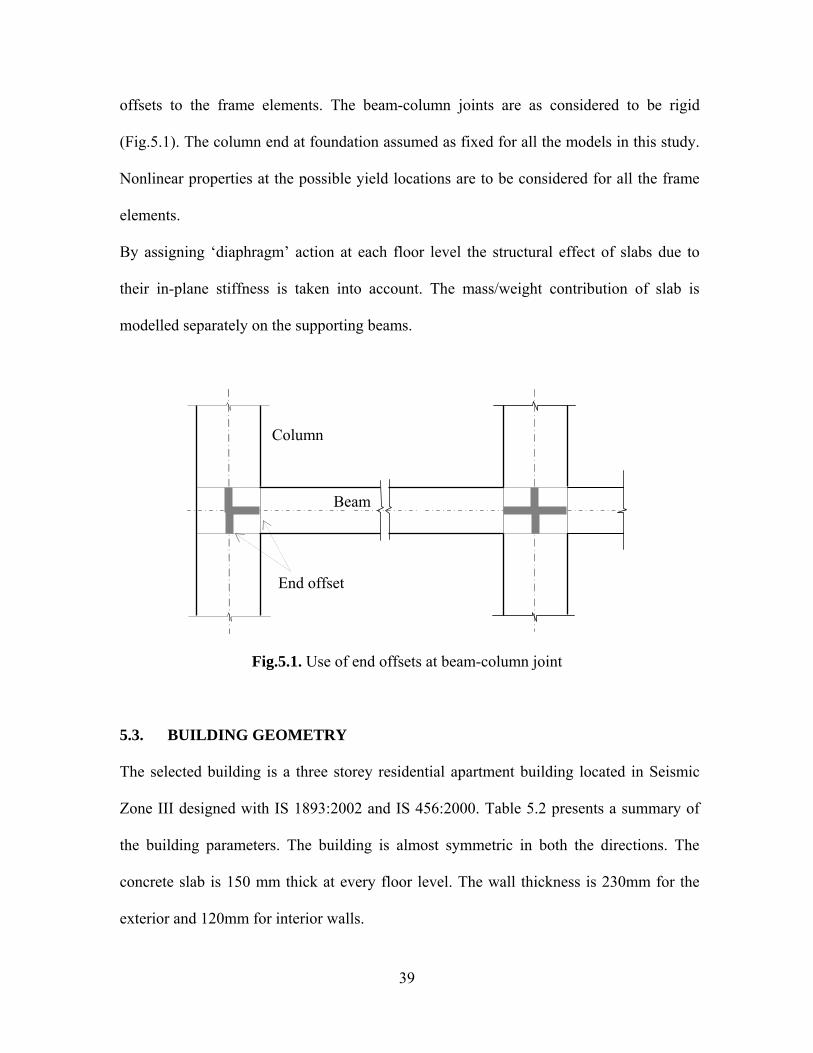
offsets to the frame elements. The beam-column joints are as considered to be rigid
(Fig.5.1). The column end at foundation assumed as fixed for all the models in this study.
Nonlinear properties at the possible yield locations are to be considered for all the frame
elements.
By assigning ‘diaphragm’ action at each floor level the structural effect of slabs due to
their in-plane stiffness is taken into account. The mass/weight contribution of slab is
modelled separately on the supporting beams.
Fig.5.1. Use of end offsets at beam-column joint
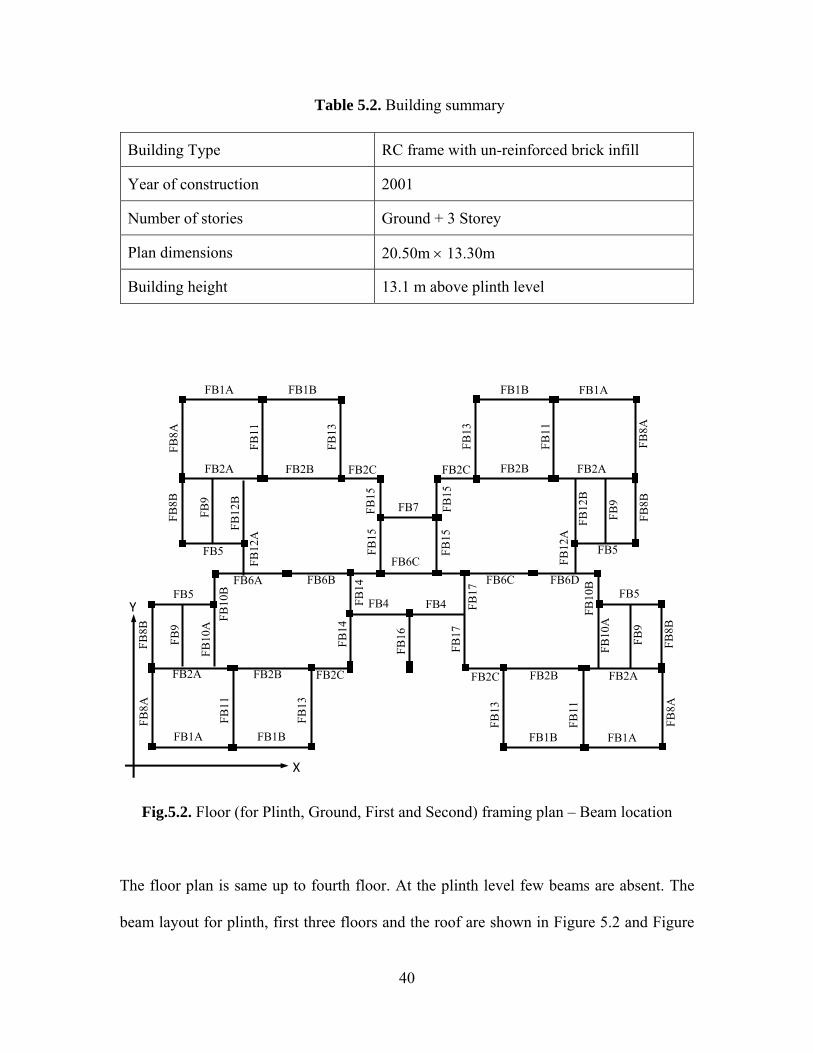
5.3. BUILDING GEOMETRY
The selected building is a three storey residential apartment building located in Seismic
Zone III designed with IS 1893:2002 and IS 456:2000. Table 5.2 presents a summary of
the building parameters. The building is almost symmetric in both the directions. The
concrete slab is 150 mm thick at every floor level. The wall thickness is 230mm for the
exterior and 120mm for interior walls.
Beam
Column
End offset
40
Table 5.2. Building summary
Building Type RC frame with un-reinforced brick infill
Year of construction 2001
Number of stories Ground + 3 Storey
Plan dimensions 20.50m × 13.30m
Building height 13.1 m above plinth level
Fig.5.2. Floor (for Plinth, Ground, First and Second) framing plan – Beam location
The floor plan is same up to fourth floor. At the plinth level few beams are absent. The
beam layout for plinth, first three floors and the roof are shown in Figure 5.2 and Figure
FB1B FB1A FB1B FB1A
FB2A FB2B FB2C FB2C FB2B FB2A
FB6A
FB7
FB2A FB2B FB2C FB2C FB2B FB2A
FB6B FB6C
FB6C FB6D FB5 FB5
FB4 FB4
FB1B FB1A FB1B FB1A
FB5 FB5
FB8A
FB11
FB13
FB13
FB11
FB8A
FB8B
FB9
FB12
B
FB8B
FB9
FB12
B
FB15
FB
15
FB15
FB
15
FB12
A
FB12
A
FB8B
FB9
FB10
A FB
10B
FB10
B
FB10
A
FB9
FB8B
FB8A
FB11
FB13
FB13
FB11
FB8A
FB14
FB16
FB17
FB
17
FB14
X
Y
41
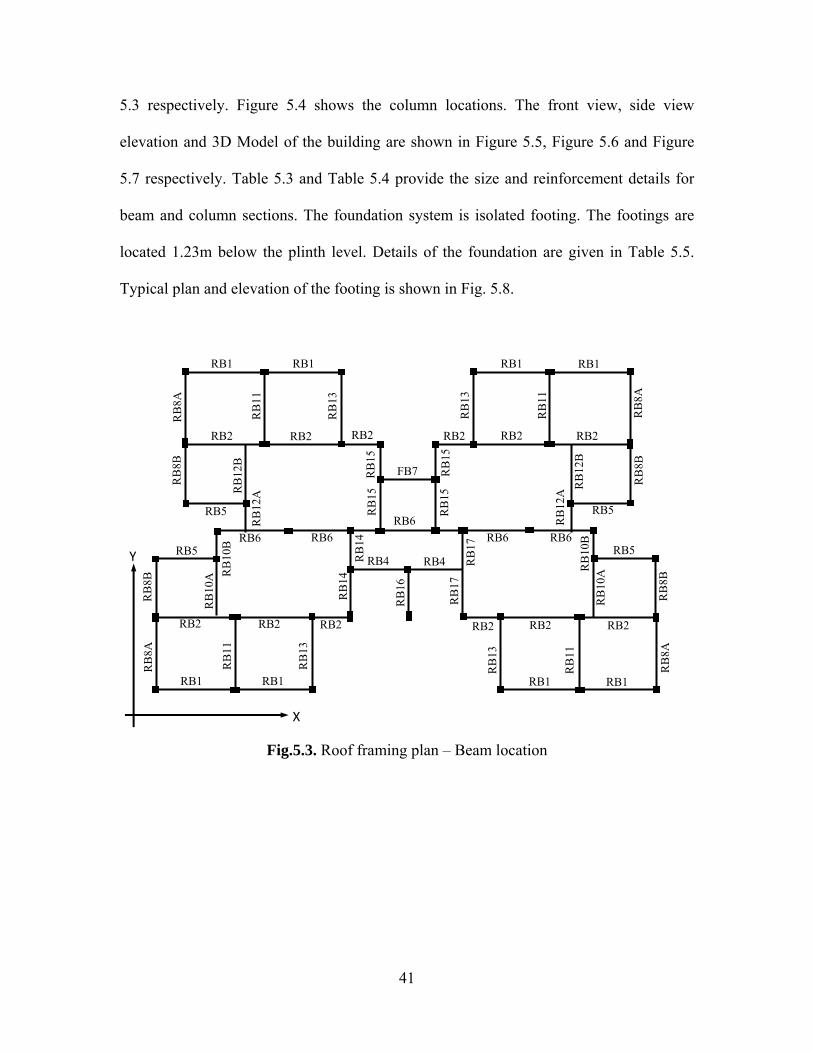
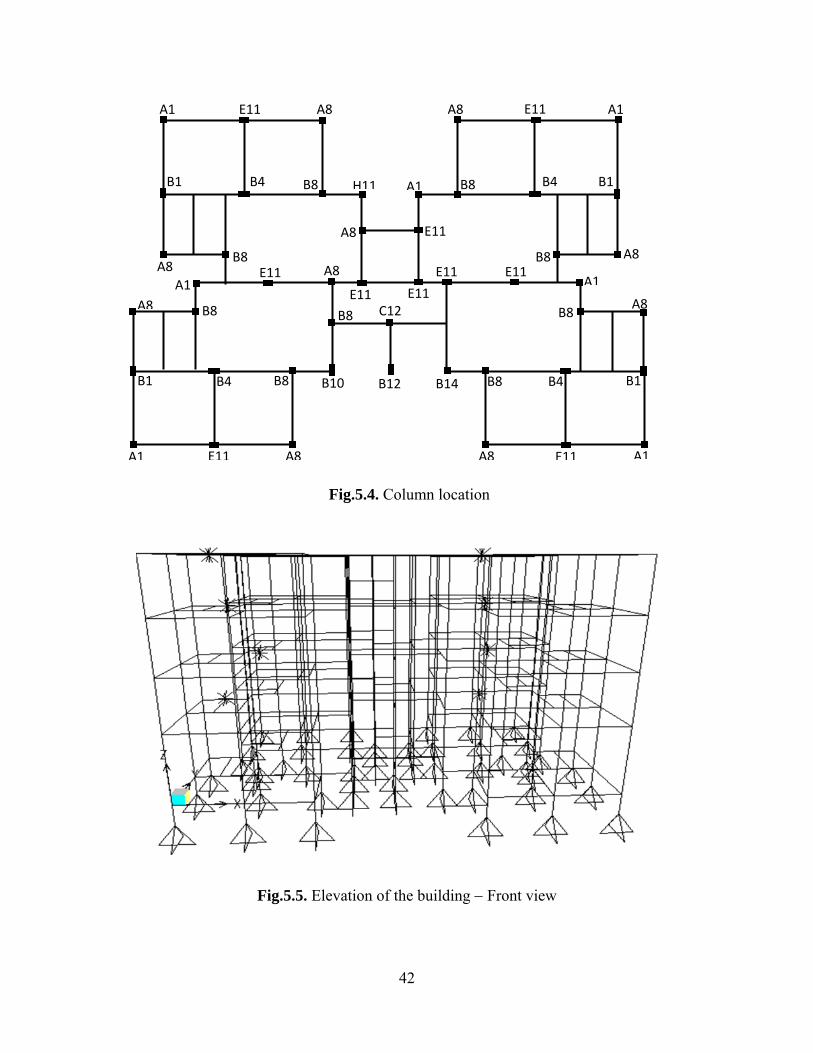
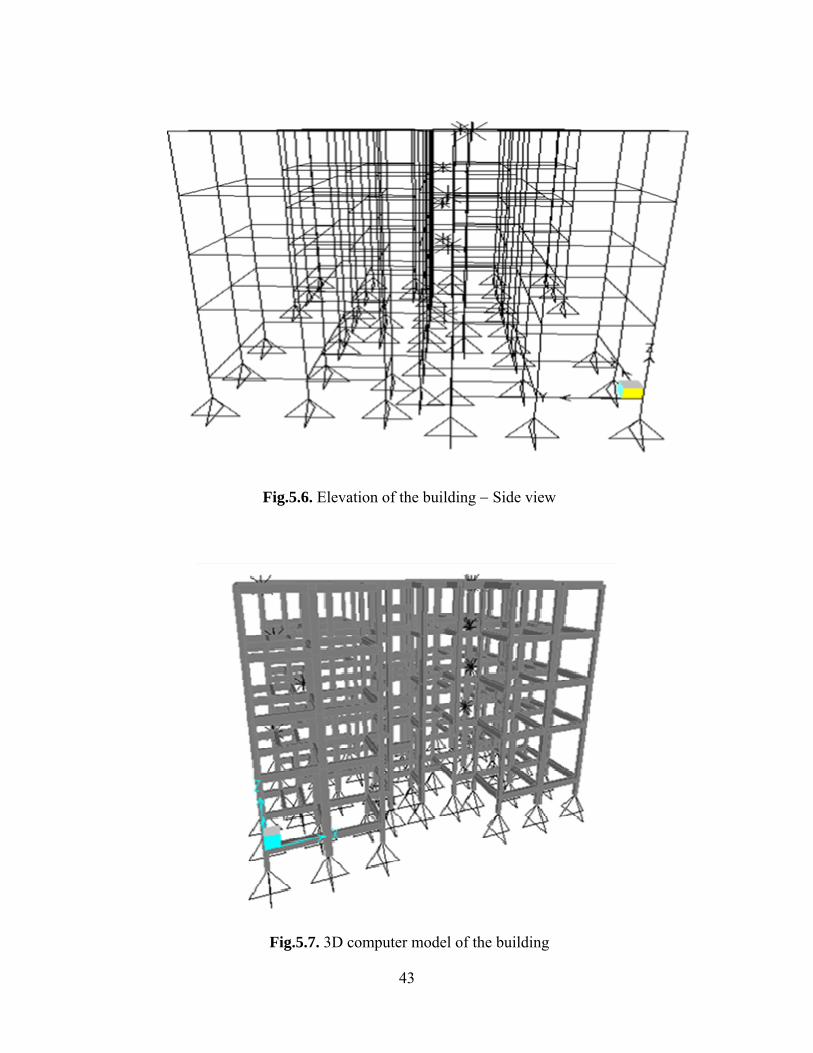
5.3 respectively. Figure 5.4 shows the column locations. The front view, side view
elevation and 3D Model of the building are shown in Figure 5.5, Figure 5.6 and Figure
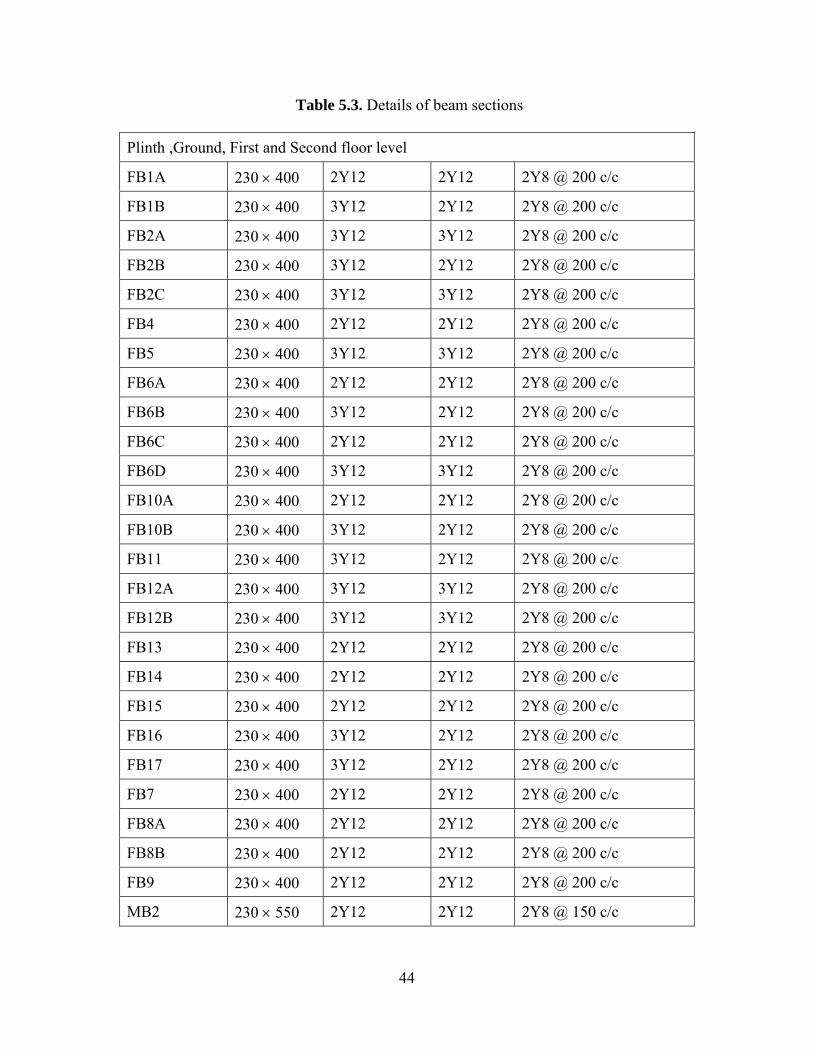
5.7 respectively. Table 5.3 and Table 5.4 provide the size and reinforcement details for
beam and column sections. The foundation system is isolated footing. The footings are
located 1.23m below the plinth level. Details of the foundation are given in Table 5.5.
Typical plan and elevation of the footing is shown in Fig. 5.8.
Fig.5.3. Roof framing plan – Beam location
RB1 RB1 RB1 RB1
RB2 RB2 RB2 RB2 RB2 RB2
RB6
FB7
RB2 RB2 RB2 RB2 RB2 RB2
RB6 RB6
RB6 RB6 RB5 RB5
RB4 RB4
RB1 RB1 RB1 RB1
RB5 RB5
RB
8A
RB
11
RB
13
RB
13
RB
11
RB
8A
RB
8B
RB
12B
RB
8B
RB
12B
RB
15
RB
15
RB
15
RB
15
RB
12A
RB
12A
RB
8B
RB
10A
RB
10B
RB
10B
R
B10
A
RB
8B
RB
8A
RB
11
RB
13
RB
13
RB
11
RB
8A
RB
14
RB
16
RB
17
RB
17
RB
14
X
Y
42
Fig.5.4. Column location
Fig.5.5. Elevation of the building − Front view
A8
A1 A8 A8 A1E11 E11
B1 B4 B8 B10 B12 B14 B8 B4 B1
B8 C12A8 B8 B8
A1 E11 A8
E11 E11
E11 E11 A1
A8 B8 A8 B8
A8 E11
B1 B4 B8 H11 A1 B8 B4 B1
A1 A8 E11 A8 A1 E11
43
Fig.5.6. Elevation of the building − Side view
Fig.5.7. 3D computer model of the building
44
Table 5.3. Details of beam sections
Plinth ,Ground, First and Second floor level
FB1A 230 × 400 2Y12 2Y12 2Y8 @ 200 c/c
FB1B 230 × 400 3Y12 2Y12 2Y8 @ 200 c/c
FB2A 230 × 400 3Y12 3Y12 2Y8 @ 200 c/c
FB2B 230 × 400 3Y12 2Y12 2Y8 @ 200 c/c
FB2C 230 × 400 3Y12 3Y12 2Y8 @ 200 c/c
FB4 230 × 400 2Y12 2Y12 2Y8 @ 200 c/c
FB5 230 × 400 3Y12 3Y12 2Y8 @ 200 c/c
FB6A 230 × 400 2Y12 2Y12 2Y8 @ 200 c/c
FB6B 230 × 400 3Y12 2Y12 2Y8 @ 200 c/c
FB6C 230 × 400 2Y12 2Y12 2Y8 @ 200 c/c
FB6D 230 × 400 3Y12 3Y12 2Y8 @ 200 c/c
FB10A 230 × 400 2Y12 2Y12 2Y8 @ 200 c/c
FB10B 230 × 400 3Y12 2Y12 2Y8 @ 200 c/c
FB11 230 × 400 3Y12 2Y12 2Y8 @ 200 c/c
FB12A 230 × 400 3Y12 3Y12 2Y8 @ 200 c/c
FB12B 230 × 400 3Y12 3Y12 2Y8 @ 200 c/c
FB13 230 × 400 2Y12 2Y12 2Y8 @ 200 c/c
FB14 230 × 400 2Y12 2Y12 2Y8 @ 200 c/c
FB15 230 × 400 2Y12 2Y12 2Y8 @ 200 c/c
FB16 230 × 400 3Y12 2Y12 2Y8 @ 200 c/c
FB17 230 × 400 3Y12 2Y12 2Y8 @ 200 c/c
FB7 230 × 400 2Y12 2Y12 2Y8 @ 200 c/c
FB8A 230 × 400 2Y12 2Y12 2Y8 @ 200 c/c
FB8B 230 × 400 2Y12 2Y12 2Y8 @ 200 c/c
FB9 230 × 400 2Y12 2Y12 2Y8 @ 200 c/c
MB2 230 × 550 2Y12 2Y12 2Y8 @ 150 c/c
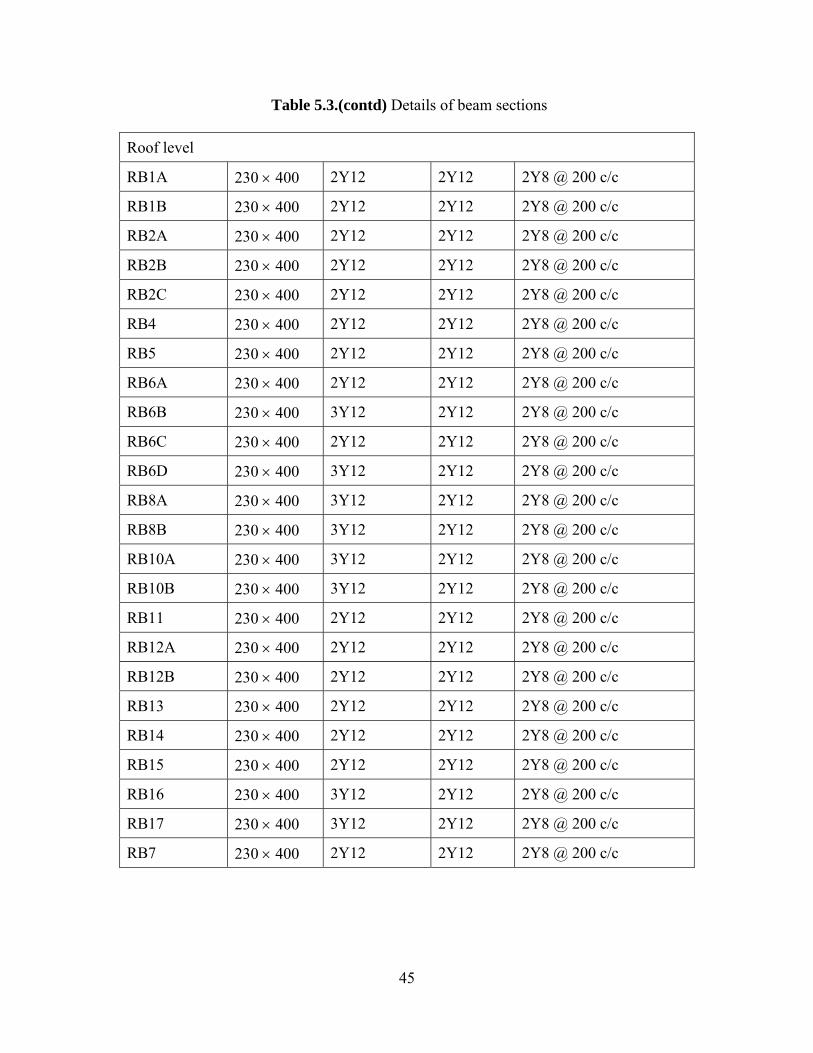
45
Table 5.3.(contd) Details of beam sections
Roof level
RB1A 230 × 400 2Y12 2Y12 2Y8 @ 200 c/c
RB1B 230 × 400 2Y12 2Y12 2Y8 @ 200 c/c
RB2A 230 × 400 2Y12 2Y12 2Y8 @ 200 c/c
RB2B 230 × 400 2Y12 2Y12 2Y8 @ 200 c/c
RB2C 230 × 400 2Y12 2Y12 2Y8 @ 200 c/c
RB4 230 × 400 2Y12 2Y12 2Y8 @ 200 c/c
RB5 230 × 400 2Y12 2Y12 2Y8 @ 200 c/c
RB6A 230 × 400 2Y12 2Y12 2Y8 @ 200 c/c
RB6B 230 × 400 3Y12 2Y12 2Y8 @ 200 c/c
RB6C 230 × 400 2Y12 2Y12 2Y8 @ 200 c/c
RB6D 230 × 400 3Y12 2Y12 2Y8 @ 200 c/c
RB8A 230 × 400 3Y12 2Y12 2Y8 @ 200 c/c
RB8B 230 × 400 3Y12 2Y12 2Y8 @ 200 c/c
RB10A 230 × 400 3Y12 2Y12 2Y8 @ 200 c/c
RB10B 230 × 400 3Y12 2Y12 2Y8 @ 200 c/c
RB11 230 × 400 2Y12 2Y12 2Y8 @ 200 c/c
RB12A 230 × 400 2Y12 2Y12 2Y8 @ 200 c/c
RB12B 230 × 400 2Y12 2Y12 2Y8 @ 200 c/c
RB13 230 × 400 2Y12 2Y12 2Y8 @ 200 c/c
RB14 230 × 400 2Y12 2Y12 2Y8 @ 200 c/c
RB15 230 × 400 2Y12 2Y12 2Y8 @ 200 c/c
RB16 230 × 400 3Y12 2Y12 2Y8 @ 200 c/c
RB17 230 × 400 3Y12 2Y12 2Y8 @ 200 c/c
RB7 230 × 400 2Y12 2Y12 2Y8 @ 200 c/c
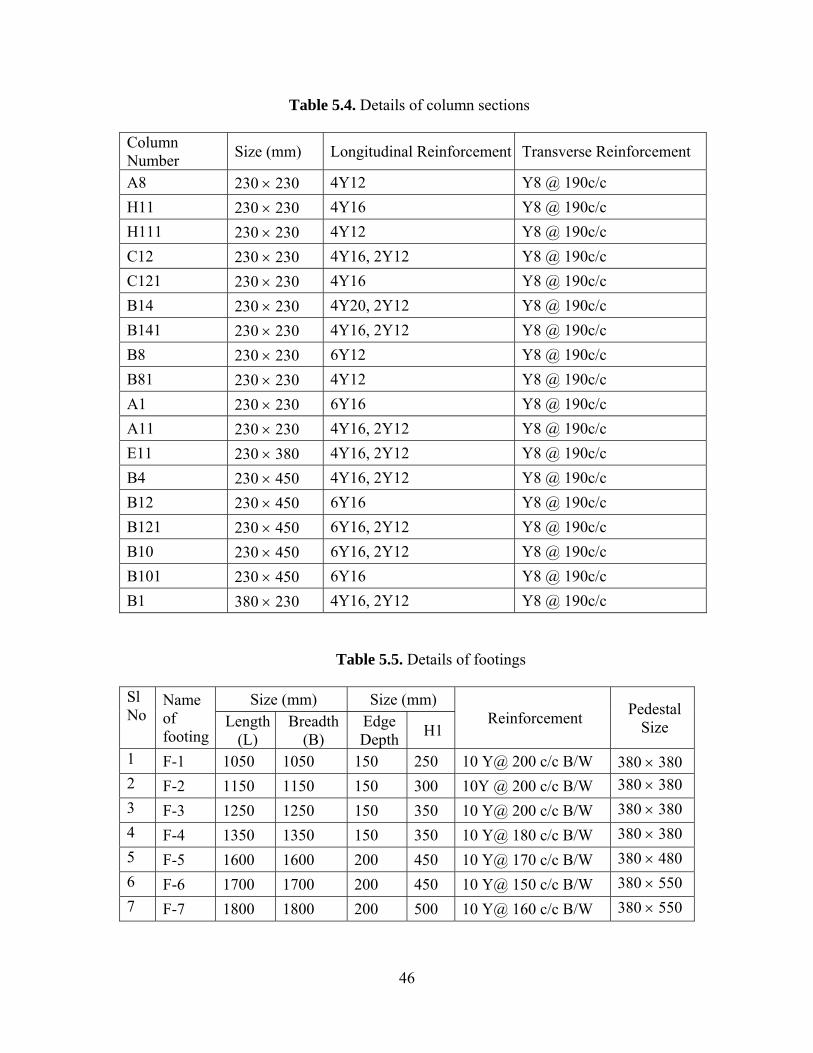
46
Table 5.4. Details of column sections
Column Number Size (mm) Longitudinal Reinforcement Transverse Reinforcement
A8 230 × 230 4Y12 Y8 @ 190c/c H11 230 × 230 4Y16 Y8 @ 190c/c H111 230 × 230 4Y12 Y8 @ 190c/c C12 230 × 230 4Y16, 2Y12 Y8 @ 190c/c C121 230 × 230 4Y16 Y8 @ 190c/c B14 230 × 230 4Y20, 2Y12 Y8 @ 190c/c B141 230 × 230 4Y16, 2Y12 Y8 @ 190c/c B8 230 × 230 6Y12 Y8 @ 190c/c B81 230 × 230 4Y12 Y8 @ 190c/c A1 230 × 230 6Y16 Y8 @ 190c/c A11 230 × 230 4Y16, 2Y12 Y8 @ 190c/c E11 230 × 380 4Y16, 2Y12 Y8 @ 190c/c B4 230 × 450 4Y16, 2Y12 Y8 @ 190c/c B12 230 × 450 6Y16 Y8 @ 190c/c B121 230 × 450 6Y16, 2Y12 Y8 @ 190c/c B10 230 × 450 6Y16, 2Y12 Y8 @ 190c/c B101 230 × 450 6Y16 Y8 @ 190c/c B1 380 × 230 4Y16, 2Y12 Y8 @ 190c/c
Table 5.5. Details of footings
Sl No
Name of footing
Size (mm) Size (mm) Reinforcement Pedestal
Size Length (L)
Breadth (B)
Edge Depth H1
1 F-1 1050 1050 150 250 10 Y@ 200 c/c B/W 380 × 380 2 F-2 1150 1150 150 300 10Y @ 200 c/c B/W 380 × 380 3 F-3 1250 1250 150 350 10 Y@ 200 c/c B/W 380 × 380 4 F-4 1350 1350 150 350 10 Y@ 180 c/c B/W 380 × 380 5 F-5 1600 1600 200 450 10 Y@ 170 c/c B/W 380 × 480 6 F-6 1700 1700 200 450 10 Y@ 150 c/c B/W 380 × 550 7 F-7 1800 1800 200 500 10 Y@ 160 c/c B/W 380 × 550
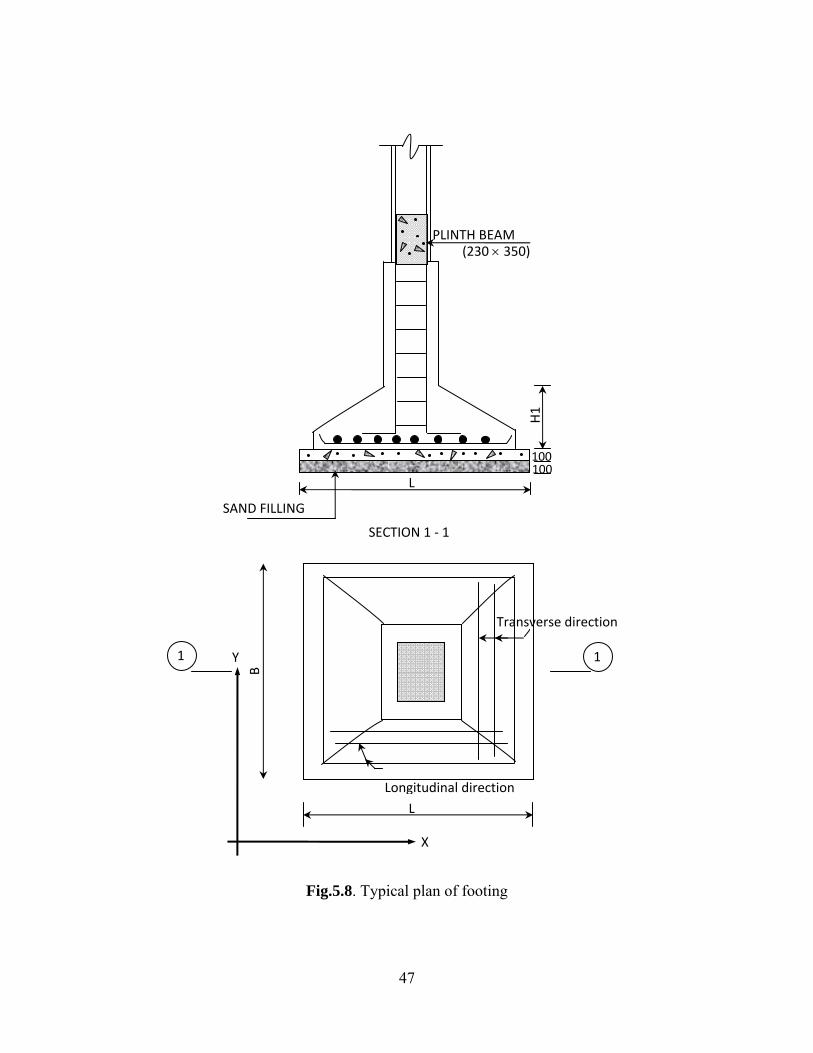
47
Fig.5.8. Typical plan of footing
L
SECTION 1 ‐ 1
PLINTH BEAM
H1
SAND FILLING
(230 × 350)
100100
B
LLongitudinal direction
Transverse direction
1 1
X
Y
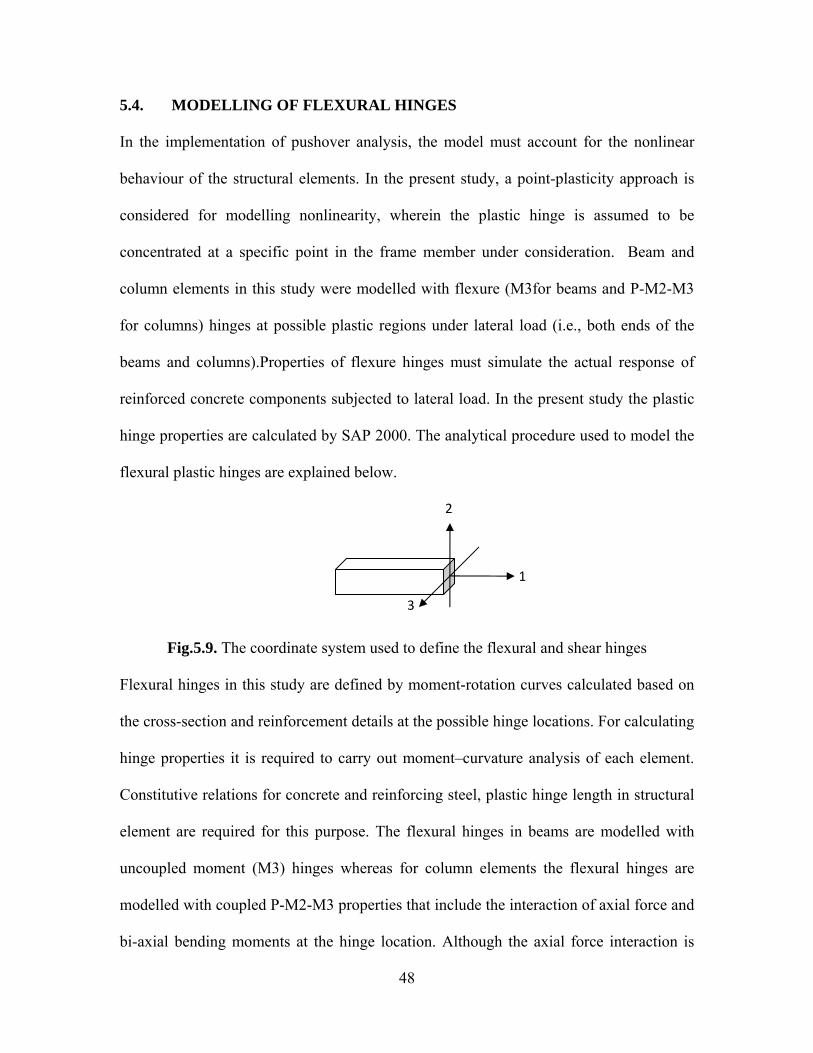
48
5.4. MODELLING OF FLEXURAL HINGES
In the implementation of pushover analysis, the model must account for the nonlinear
behaviour of the structural elements. In the present study, a point-plasticity approach is
considered for modelling nonlinearity, wherein the plastic hinge is assumed to be
concentrated at a specific point in the frame member under consideration. Beam and
column elements in this study were modelled with flexure (M3for beams and P-M2-M3
for columns) hinges at possible plastic regions under lateral load (i.e., both ends of the
beams and columns).Properties of flexure hinges must simulate the actual response of
reinforced concrete components subjected to lateral load. In the present study the plastic
hinge properties are calculated by SAP 2000. The analytical procedure used to model the
flexural plastic hinges are explained below.
Fig.5.9. The coordinate system used to define the flexural and shear hinges
Flexural hinges in this study are defined by moment-rotation curves calculated based on
the cross-section and reinforcement details at the possible hinge locations. For calculating
hinge properties it is required to carry out moment–curvature analysis of each element.
Constitutive relations for concrete and reinforcing steel, plastic hinge length in structural
element are required for this purpose. The flexural hinges in beams are modelled with
uncoupled moment (M3) hinges whereas for column elements the flexural hinges are
modelled with coupled P-M2-M3 properties that include the interaction of axial force and
bi-axial bending moments at the hinge location. Although the axial force interaction is
1
2
3
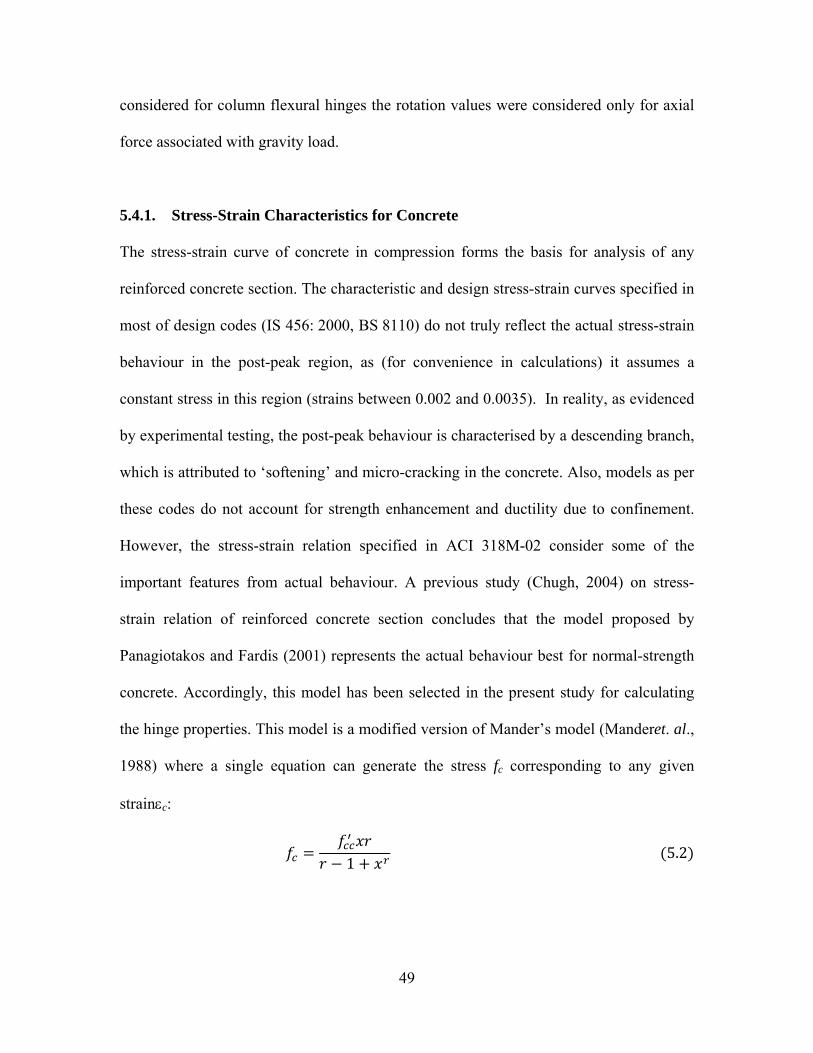
49
considered for column flexural hinges the rotation values were considered only for axial
force associated with gravity load.
5.4.1. Stress-Strain Characteristics for Concrete
The stress-strain curve of concrete in compression forms the basis for analysis of any
reinforced concrete section. The characteristic and design stress-strain curves specified in
most of design codes (IS 456: 2000, BS 8110) do not truly reflect the actual stress-strain
behaviour in the post-peak region, as (for convenience in calculations) it assumes a
constant stress in this region (strains between 0.002 and 0.0035). In reality, as evidenced
by experimental testing, the post-peak behaviour is characterised by a descending branch,
which is attributed to ‘softening’ and micro-cracking in the concrete. Also, models as per
these codes do not account for strength enhancement and ductility due to confinement.
However, the stress-strain relation specified in ACI 318M-02 consider some of the
important features from actual behaviour. A previous study (Chugh, 2004) on stress-
strain relation of reinforced concrete section concludes that the model proposed by
Panagiotakos and Fardis (2001) represents the actual behaviour best for normal-strength
concrete. Accordingly, this model has been selected in the present study for calculating
the hinge properties. This model is a modified version of Mander’s model (Manderet. al.,
1988) where a single equation can generate the stress fc corresponding to any given
strainεc:
1 5.2
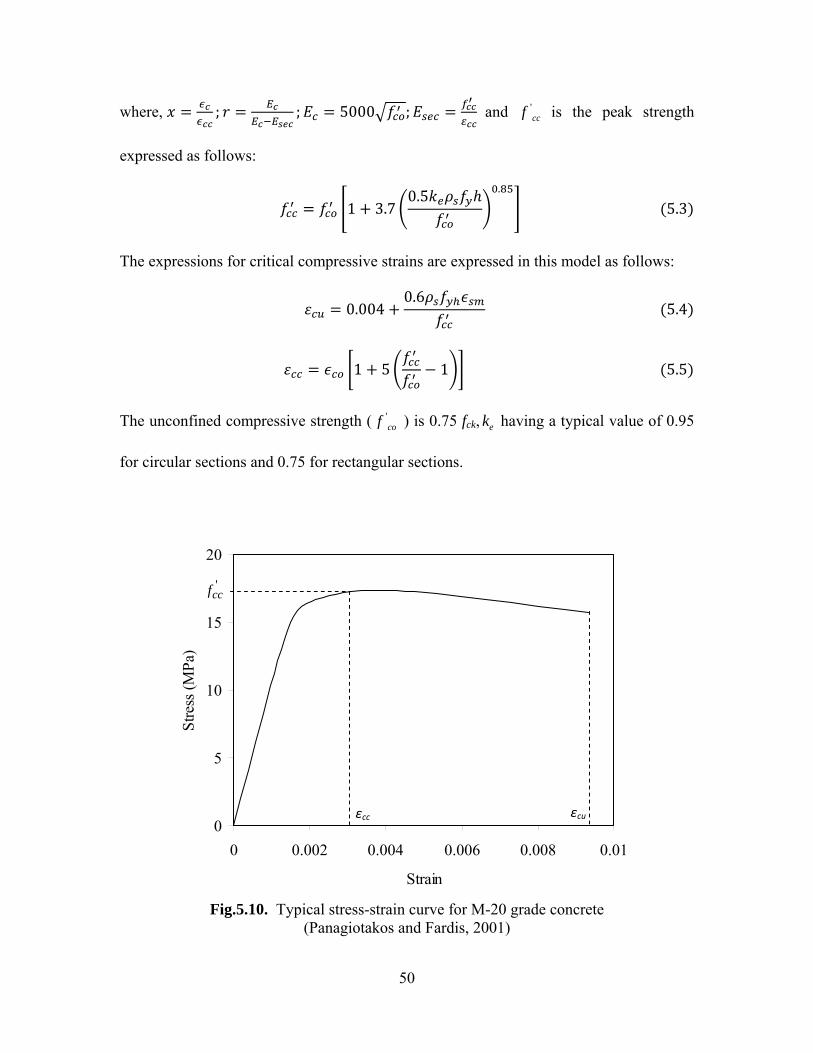
50
where, ; ; 5000 ; and 'ccf is the peak strength
expressed as follows:
1 3.70.5 .
5.3
The expressions for critical compressive strains are expressed in this model as follows:
0.0040.6
5.4
1 5 1 5.5
The unconfined compressive strength ( 'cof ) is 0.75 fck, ek having a typical value of 0.95
for circular sections and 0.75 for rectangular sections.
Fig.5.10. Typical stress-strain curve for M-20 grade concrete (Panagiotakos and Fardis, 2001)
0
5
10
15
20
0 0.002 0.004 0.006 0.008 0.01
Strain
Stre
ss (M
Pa)
'ccf
εcu εcc
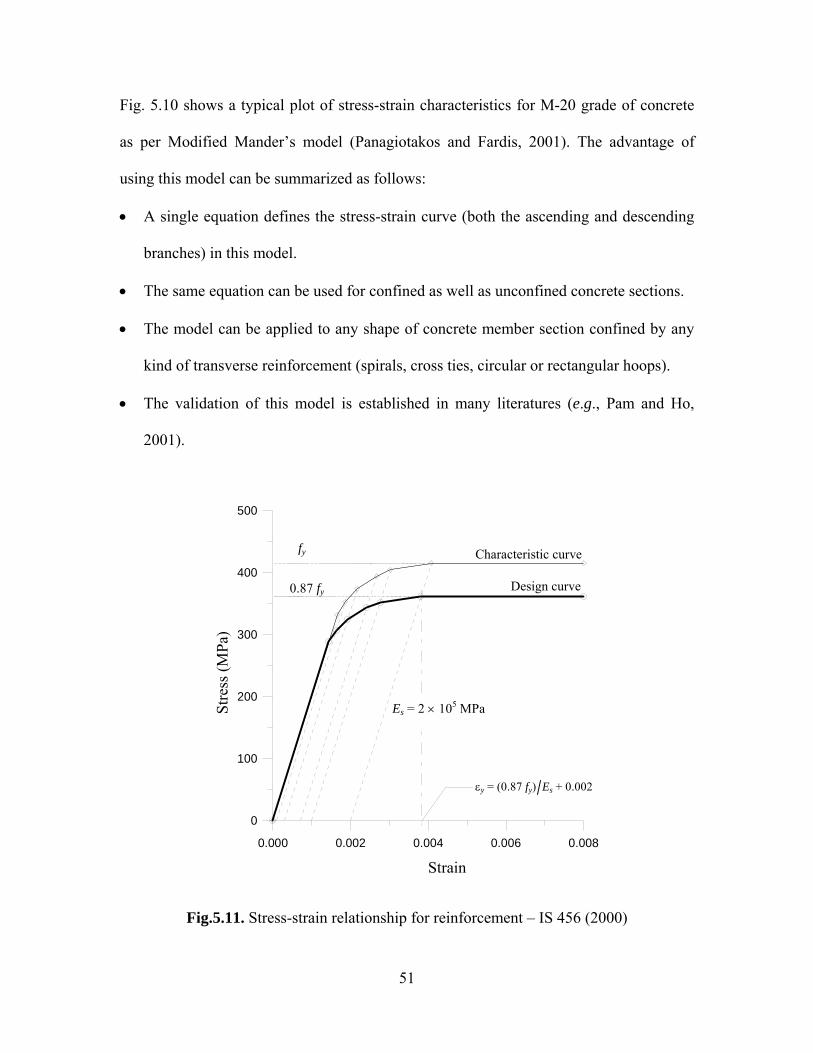
51
Fig. 5.10 shows a typical plot of stress-strain characteristics for M-20 grade of concrete
as per Modified Mander’s model (Panagiotakos and Fardis, 2001). The advantage of
using this model can be summarized as follows:
• A single equation defines the stress-strain curve (both the ascending and descending
branches) in this model.
• The same equation can be used for confined as well as unconfined concrete sections.
• The model can be applied to any shape of concrete member section confined by any
kind of transverse reinforcement (spirals, cross ties, circular or rectangular hoops).
• The validation of this model is established in many literatures (e.g., Pam and Ho,
2001).
0.000 0.002 0.004 0.006 0.008
strain
0
100
200
300
400
500
stre
ss (M
Pa)
0.87 fy
fy Characteristic curve
Design curve
Es = 2 × 10⁵ MPa
εy = (0.87 fy) Es + 0.002
Strain
Stre
ss (M
Pa)
Fig.5.11. Stress-strain relationship for reinforcement – IS 456 (2000)
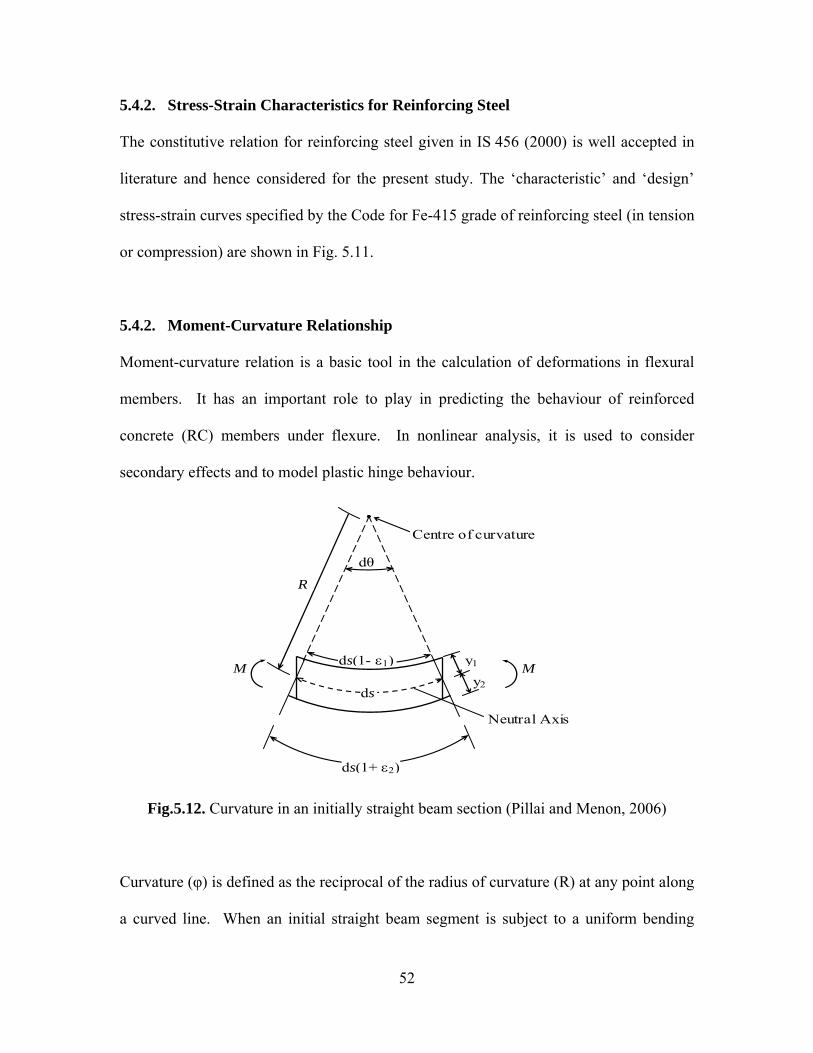
52
5.4.2. Stress-Strain Characteristics for Reinforcing Steel
The constitutive relation for reinforcing steel given in IS 456 (2000) is well accepted in
literature and hence considered for the present study. The ‘characteristic’ and ‘design’
stress-strain curves specified by the Code for Fe-415 grade of reinforcing steel (in tension
or compression) are shown in Fig. 5.11.
5.4.2. Moment-Curvature Relationship
Moment-curvature relation is a basic tool in the calculation of deformations in flexural
members. It has an important role to play in predicting the behaviour of reinforced
concrete (RC) members under flexure. In nonlinear analysis, it is used to consider
secondary effects and to model plastic hinge behaviour.
Centre of curvature
ds(1- ε1)
Neutral Axis
M
ds
M
ds(1+ ε2)
dθ
R
y1
y2
Fig.5.12. Curvature in an initially straight beam section (Pillai and Menon, 2006)
Curvature (φ) is defined as the reciprocal of the radius of curvature (R) at any point along
a curved line. When an initial straight beam segment is subject to a uniform bending
53
moment throughout its length, it is expected to bend into a segment of a circle with a
curvature φ that increases in some manner with increase in the applied moment (M).
Curvature φ may be alternatively defined as the angle change in the slope of the elastic
curve per unit length ( )1ϕ = = θR d ds . At any section, using the ‘plane sections remain
plane’ hypothesis under pure bending, the curvature can be computed as the ratio of the
normal strain at any point across the depth to the distance measured from the neutral axis
at that section (Fig. 5.12).
If the bending produces extreme fibre strains of ε1 and ε2 at top and bottom at any section
as shown in Fig. 5.12 (compression on top and tension at bottom assumed in this case),
then, for small deformations, it can be shown that ( )1 2ϕ = ε + ε D . If the beam behaviour
is linear elastic, then the moment-curvature relationship is linear, and the curvature is
obtained as
5.6
The flexural rigidity (EI) of the beam is obtained as a product of the modulus of elasticity
E and the second moment of area of the section I.
When an RC flexural member is subjected to a gradually increasing moment, it’s
behaviour transits through various stages, starting from the initial un-cracked state to the
ultimate limit state of collapse. The stresses in the tension steel and concrete go on
increasing as the moment increases. The behaviour at the ultimate limit state depends on
the percentage of steel provided, i.e., on whether the section is ‘under-reinforced’ or
‘over-reinforced’. In the case of under-reinforced sections, failure is triggered by
yielding of tension steel whereas in over-reinforced section the steel does not yield at the
54
limit state of failure. In both cases, the failure eventually occurs due to crushing of
concrete at the extreme compression fibre, when the ultimate strain in concrete reaches its
limit. Under-reinforced beams are characterised by ‘ductile’ failure, accompanied by
large deflections and significant flexural cracking. On the other hand, over-reinforced
beams have practically no ductility, and the failure occurs suddenly, without the warning
signs of wide cracking and large deflections.
In the case of a short column subject to uni-axial bending combined with axial
compression, it is assumed that Eq. 5.6 remains valid and that “plane sections before
bending remain plane”. However, the ultimate curvature (and hence, ductility) of the
section is reduced as the compression strain in the concrete contributes to resisting axial
compression in addition to flexural compression.
5.4.3. Modelling of Moment-Curvature in RC Sections
Using the Modified Mander model of stress-strain curves for concrete (Panagiotakos and
Fardis, 2001) and Indian Standard IS 456 (2000) stress-strain curve for reinforcing steel,
for a specific confining steel, moment curvature relations can be generated for beams and
columns (for different axial load levels). The assumptions and procedure used in
generating the moment-curvature curves are outlined below.
Assumptions
i. The strain is linear across the depth of the section (‘plane sections remain plane’).
ii. The tensile strength of the concrete is ignored.
iii. The concrete spalls off at a strain of 0.0035.
55
iv. The initial tangent modulus of the concrete, Ec is adopted from IS 456 (2000), as
5000 ckf .
v. In determining the location of the neutral axis, convergence is assumed to be
reached within an acceptable tolerance of 1%.
Algorithm for Generating Moment-Curvature Relation
i. Assign a value to the extreme concrete compressive fibre strain (normally starting
with a very small value).
ii. Assume a value of neutral axis depth measured from the extreme concrete
compressive fibre.
iii. Calculate the strain and the corresponding stress at the centroid of each
longitudinal reinforcement bar.
iv. Determine the stress distribution in the concrete compressive region based on the
Modified Mander stress-strain model for given volumetric ratio of confining steel.
The resultant concrete compressive force is then obtained by numerical
integration of the stress over the entire compressive region.
v. Calculate the axial force from the equilibrium and compare with the applied axial
load (for beam element both of these will be zero). If the difference lies within the
specified tolerance, the assumed neutral axis depth is adopted. The moment
capacity and the corresponding curvature of the section are then calculated.
Otherwise, a new neutral axis is determined from the iteration (using bisection
method) and steps (iii) to (v) are repeated until it converges.
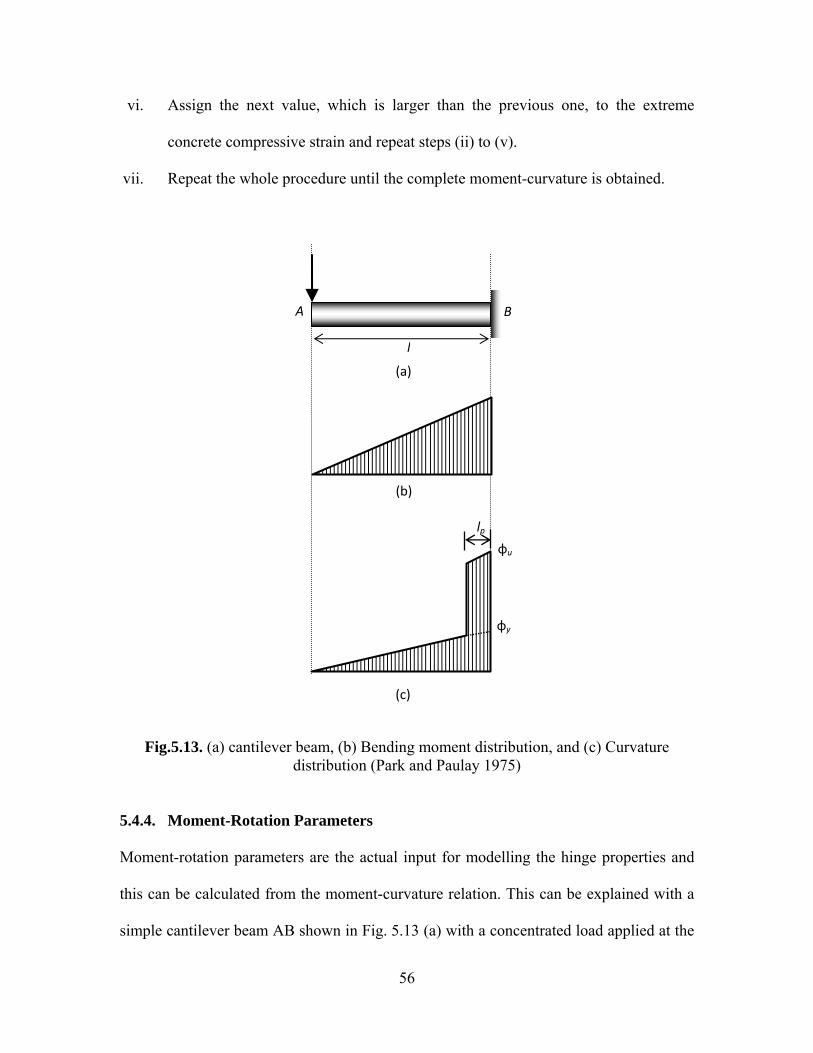
56
vi. Assign the next value, which is larger than the previous one, to the extreme
concrete compressive strain and repeat steps (ii) to (v).
vii. Repeat the whole procedure until the complete moment-curvature is obtained.
Fig.5.13. (a) cantilever beam, (b) Bending moment distribution, and (c) Curvature distribution (Park and Paulay 1975)
5.4.4. Moment-Rotation Parameters
Moment-rotation parameters are the actual input for modelling the hinge properties and
this can be calculated from the moment-curvature relation. This can be explained with a
simple cantilever beam AB shown in Fig. 5.13 (a) with a concentrated load applied at the
A B
l
(a)
(b)
(c)
lp φu
φy
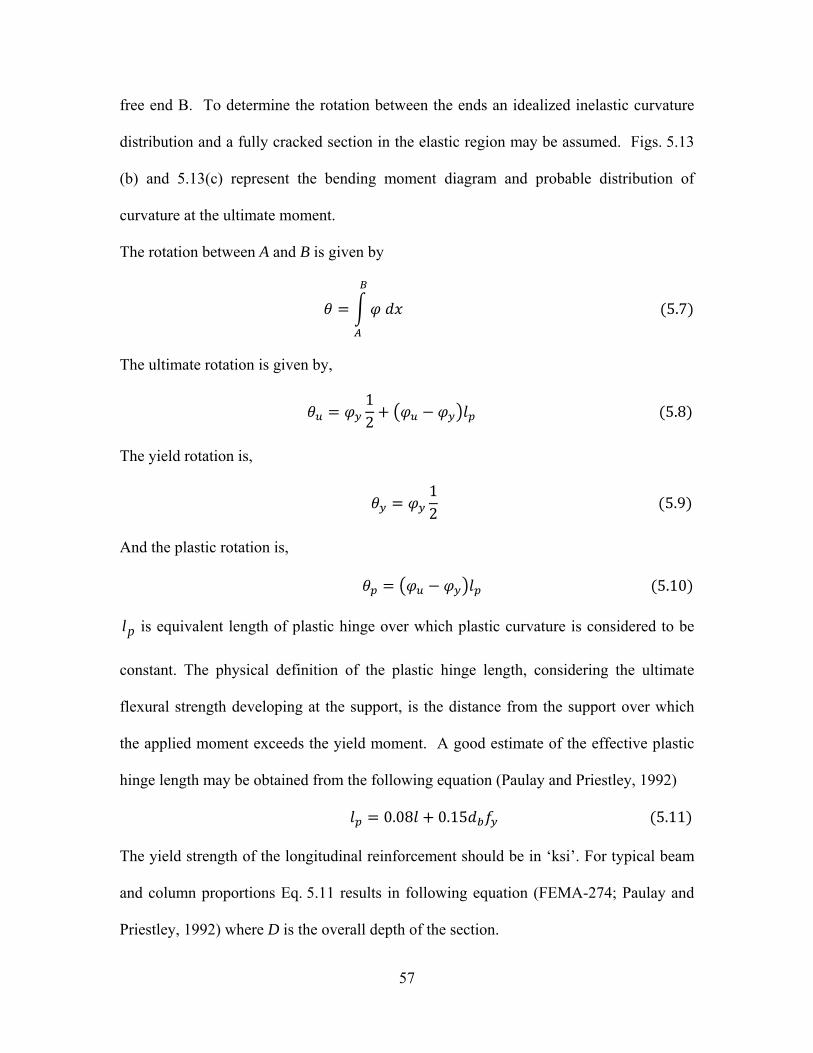
57
free end B. To determine the rotation between the ends an idealized inelastic curvature
distribution and a fully cracked section in the elastic region may be assumed. Figs. 5.13
(b) and 5.13(c) represent the bending moment diagram and probable distribution of
curvature at the ultimate moment.
The rotation between A and B is given by
5.7
The ultimate rotation is given by,
12 5.8
The yield rotation is,
12 5.9
And the plastic rotation is,
5.10
pl is equivalent length of plastic hinge over which plastic curvature is considered to be
constant. The physical definition of the plastic hinge length, considering the ultimate
flexural strength developing at the support, is the distance from the support over which
the applied moment exceeds the yield moment. A good estimate of the effective plastic
hinge length may be obtained from the following equation (Paulay and Priestley, 1992)
0.08 0.15 5.11
The yield strength of the longitudinal reinforcement should be in ‘ksi’. For typical beam
and column proportions Eq. 5.11 results in following equation (FEMA-274; Paulay and
Priestley, 1992) where D is the overall depth of the section.
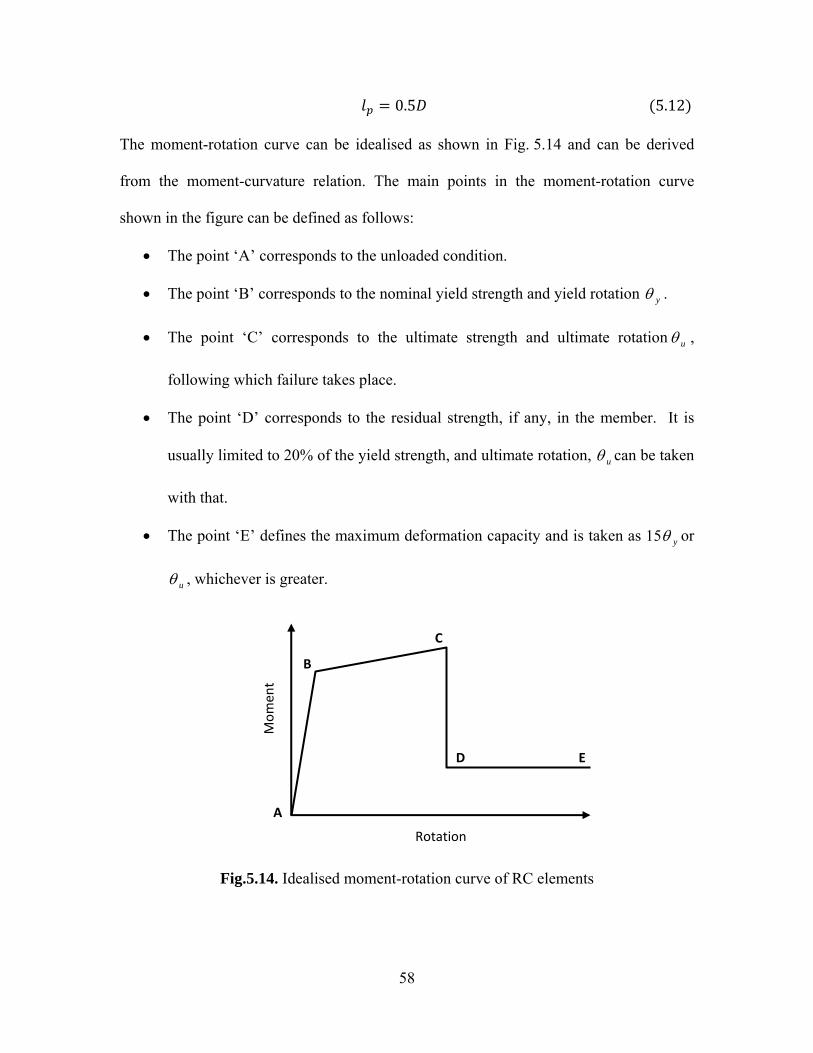
58
0.5 5.12
The moment-rotation curve can be idealised as shown in Fig. 5.14 and can be derived
from the moment-curvature relation. The main points in the moment-rotation curve
shown in the figure can be defined as follows:
• The point ‘A’ corresponds to the unloaded condition.
• The point ‘B’ corresponds to the nominal yield strength and yield rotation θ y .
• The point ‘C’ corresponds to the ultimate strength and ultimate rotation θ u ,
following which failure takes place.
• The point ‘D’ corresponds to the residual strength, if any, in the member. It is
usually limited to 20% of the yield strength, and ultimate rotation, θ u can be taken
with that.
• The point ‘E’ defines the maximum deformation capacity and is taken as 15θ y or
θ u , whichever is greater.
Fig.5.14. Idealised moment-rotation curve of RC elements
A
B
C
D E
Rotation
Mom
ent
59
While applying Eqs.5.9 and 5.10 to determine the ultimate and yield rotations, care must
be taken to adopt the correct value of the length l, applicable for cantilever action. In the
case of a frame member in a multi-storey frame subject to lateral loads, it may be
conveniently assumed that the points of contra flexure are located (approximately) at the
mid-points of the beams and columns. In such cases, an approximate value of l is given
by half the span of the member under consideration.
5.5. MODELLING OF SHEAR HINGES
When there is no prior failure in shear, flexural plastic hinges will develop along with the
predicted values of ultimate moment capacity. Design codes prescribe specifications (e.g.
ductile detailing requirement of IS 13920: 1993) for adequate shear reinforcement,
corresponding to the ultimate moment capacity level. Therefore, it is obvious for a code
designed building to fail in flexure and not in shear. There are a lot of buildings existing
those are not detailed with IS 13920: 1993. Also, poor construction practise may lead to
shear failure in framed building in the event of severe earthquakes.
Shear failure mostly occur in beams and columns owing to inadequate shear design. In
non-linear analysis, this can be modelled by providing ‘shear hinges’. These hinges
located at the same points as the flexural hinges near the beam column joints. If the shear
hinge mechanism occurred before the formation of flexural hinge, the moment demand
gets automatically restricted because of this flexural hinge may not develop.
In this section, procedure for generating shear force-deformation curves to assign shear
hinges for beams and columns explained. It is assumed that shear force-deformation
curves is symmetric for positive and negative shear forces. Figure 5.15 represents typical
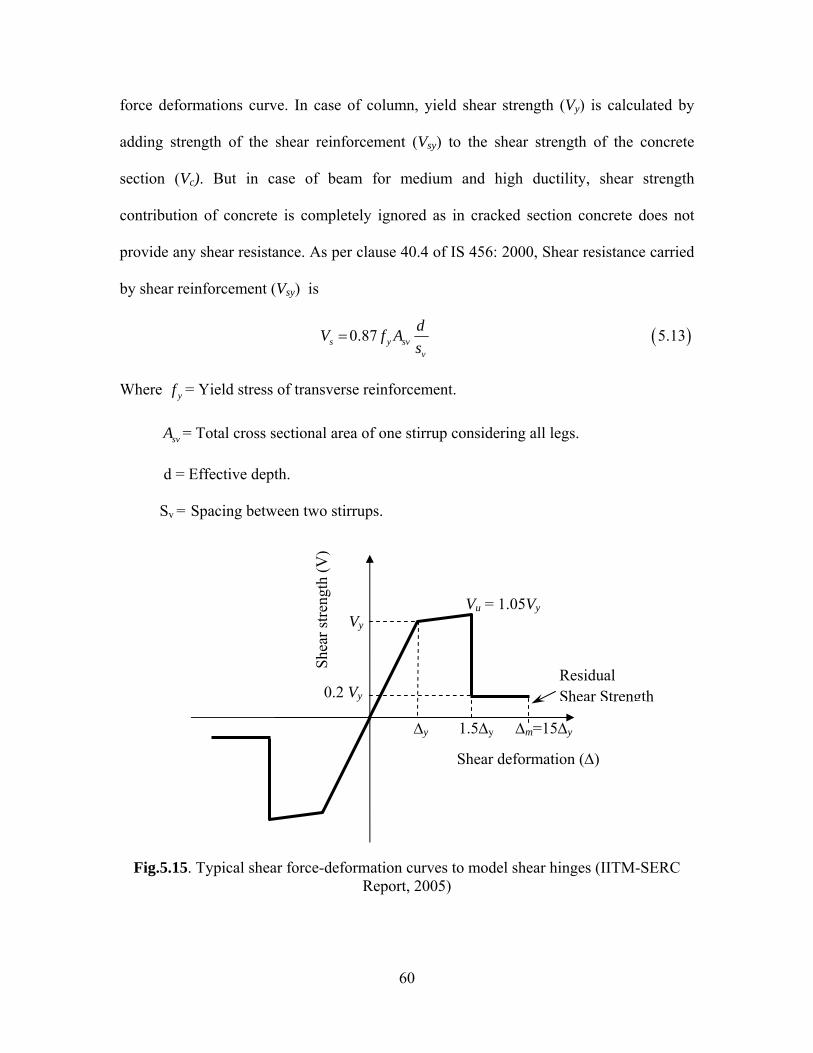
60
force deformations curve. In case of column, yield shear strength (Vy) is calculated by
adding strength of the shear reinforcement (Vsy) to the shear strength of the concrete
section (Vc). But in case of beam for medium and high ductility, shear strength
contribution of concrete is completely ignored as in cracked section concrete does not
provide any shear resistance. As per clause 40.4 of IS 456: 2000, Shear resistance carried
by shear reinforcement (Vsy) is
( )0.87 5.13s y svv
dV f As
=
Where yf = Yield stress of transverse reinforcement.
svA = Total cross sectional area of one stirrup considering all legs.
d = Effective depth.
Sv = Spacing between two stirrups.
Fig.5.15. Typical shear force-deformation curves to model shear hinges (IITM-SERC Report, 2005)
Vy
0.2 Vy
Δy Δm=15Δy
Shear deformation (Δ)
Shea
r stre
ngth
(V)
Residual Shear Strength
Vu = 1.05Vy
1.5Δy
61
In the actual strain hardened reinforcement for calculations of Vsy above formula is used
putting fy instead of 0.87fy.
( )1.0 5.14s y svv
dV f As
=
In case of column shear strength in existing construction is calculated by the following
expression
scu VVV += (5.15)
As per clause 40.2.2 of IS 456:2000 shear resistance carried by concrete Vc is
( )5.16c cV bdδ τ=
The factor δ is defined in Chapter 2 (Eq. 2.2)
As per ATC 40, for moderate and high ductile column sections
( )30 0.5 5.17u
g ck
PA f
δ = + ≤
Shear deformation (∆) is to be calculated by
( )5.18v
yield shear strength Rshear stiffness K
Δ = =
As shown in Equation 5.19, yield deformation should be calculated using shear stiffness
of un-cracked member
( )1 5.19wv
G b dKf l⎛ ⎞= ⎜ ⎟⎝ ⎠
Where G = Shear modulus of the reinforced concrete section, Ag = wb d = Gross area of
the section and l = Length of member
f is factor to account non-uniform distribution of shear stress. For rectangular section, f
is equal to 1.2 and for T and I section f is equal to 1.0.
62
By using shear stiffness of the cracked member, ultimate shear deformation can be
calculated. Using the procedure explained Park and Paulay (1975), shear stiffness for the
cracked member can be calculated.
Shear stiffness of a rectangular section with 450 diagonal cracks and vertical stirrups is
given by
( )45, 5.20
1 4v
v s wv
K E b dn
ρρ
⎛ ⎞= ⎜ ⎟+⎝ ⎠
For other inclination of cracking and stirrups, similar expression is available in Park and
Paulay (1975).
As per FEMA recommendations, for modelling of the shear hinges as shown in
Figure 5.9 the ultimate shear strength (Vu) is taken as 5% more than yield shear strength
(Vy) and residual shear strength is taken as 20% of the yield shear strength. Similarly
maximum shear deformation (Δm) is considered as 15 times the yield deformation (Δy).
In this study, shear strength was calculated by using IS code 456: 2000 and shear
displacement at yield and ultimate point were calculated by using Priestley et al. (1996)
and Park and Paulay (1975) model respectively.
5.6. SUMMARY
This chapter starts with basic modelling technique for the linear and nonlinear analyses of
the selected framed building. Then modelling nonlinear point plastic flexure and shear
hinges for RC rectangular section is explained. This chapter also describes the
geometries, frame section details including the reinforcement detail, foundation detail of
the selected building choose in the present study.
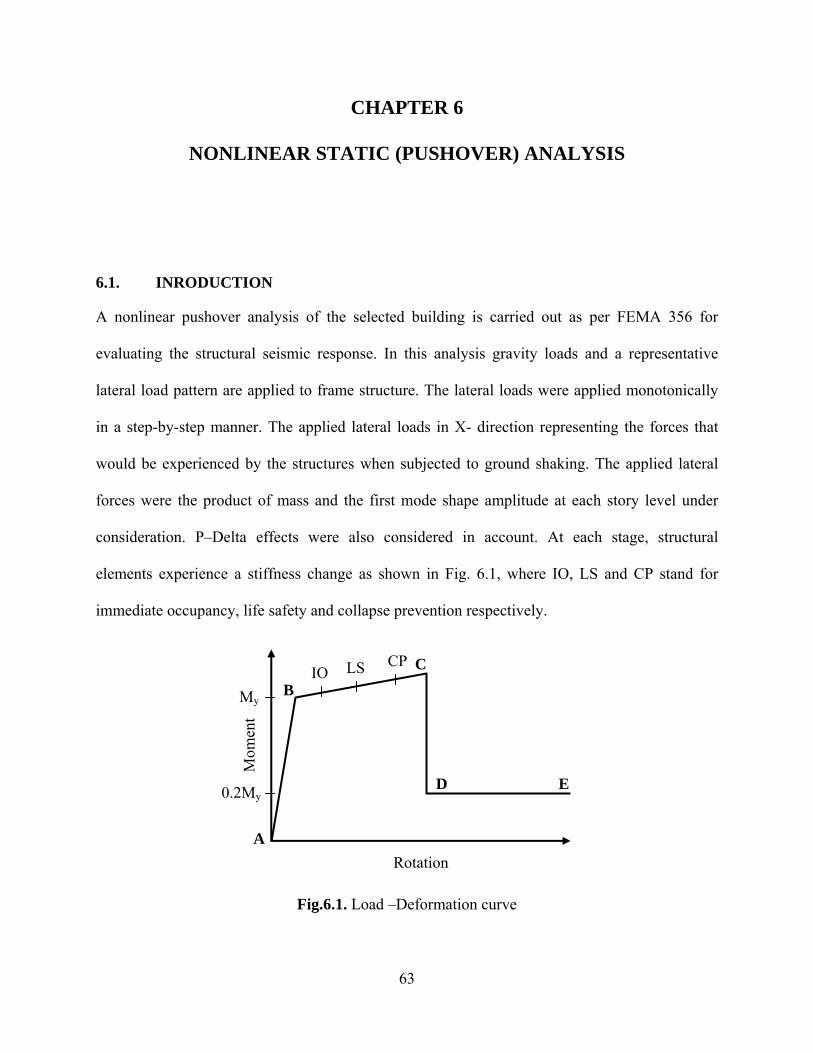
63
CHAPTER 6
NONLINEAR STATIC (PUSHOVER) ANALYSIS
6.1. INRODUCTION
A nonlinear pushover analysis of the selected building is carried out as per FEMA 356 for
evaluating the structural seismic response. In this analysis gravity loads and a representative
lateral load pattern are applied to frame structure. The lateral loads were applied monotonically
in a step-by-step manner. The applied lateral loads in X- direction representing the forces that
would be experienced by the structures when subjected to ground shaking. The applied lateral
forces were the product of mass and the first mode shape amplitude at each story level under
consideration. P–Delta effects were also considered in account. At each stage, structural
elements experience a stiffness change as shown in Fig. 6.1, where IO, LS and CP stand for
immediate occupancy, life safety and collapse prevention respectively.
Fig.6.1. Load –Deformation curve
A
B C
D E
Rotation
Mom
ent
0.2My
My IO LS CP
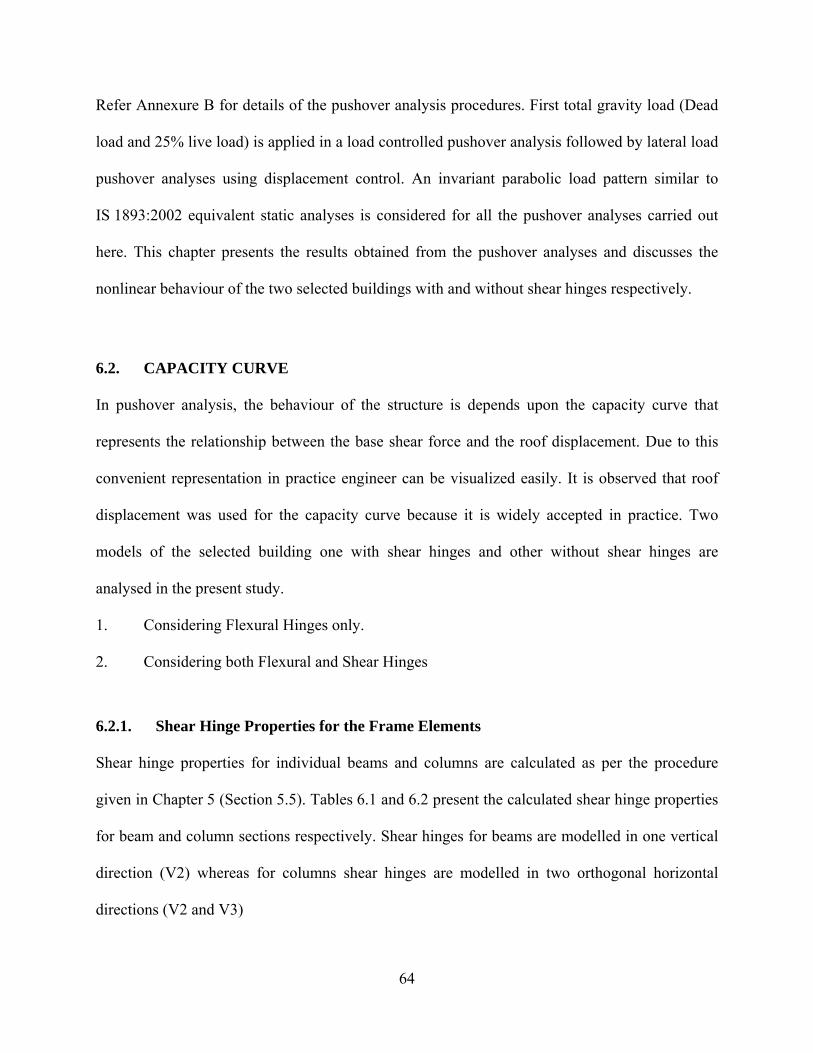
64
Refer Annexure B for details of the pushover analysis procedures. First total gravity load (Dead
load and 25% live load) is applied in a load controlled pushover analysis followed by lateral load
pushover analyses using displacement control. An invariant parabolic load pattern similar to
IS 1893:2002 equivalent static analyses is considered for all the pushover analyses carried out
here. This chapter presents the results obtained from the pushover analyses and discusses the
nonlinear behaviour of the two selected buildings with and without shear hinges respectively.
6.2. CAPACITY CURVE
In pushover analysis, the behaviour of the structure is depends upon the capacity curve that
represents the relationship between the base shear force and the roof displacement. Due to this
convenient representation in practice engineer can be visualized easily. It is observed that roof
displacement was used for the capacity curve because it is widely accepted in practice. Two
models of the selected building one with shear hinges and other without shear hinges are
analysed in the present study.
1. Considering Flexural Hinges only.
2. Considering both Flexural and Shear Hinges
6.2.1. Shear Hinge Properties for the Frame Elements
Shear hinge properties for individual beams and columns are calculated as per the procedure
given in Chapter 5 (Section 5.5). Tables 6.1 and 6.2 present the calculated shear hinge properties
for beam and column sections respectively. Shear hinges for beams are modelled in one vertical
direction (V2) whereas for columns shear hinges are modelled in two orthogonal horizontal
directions (V2 and V3)
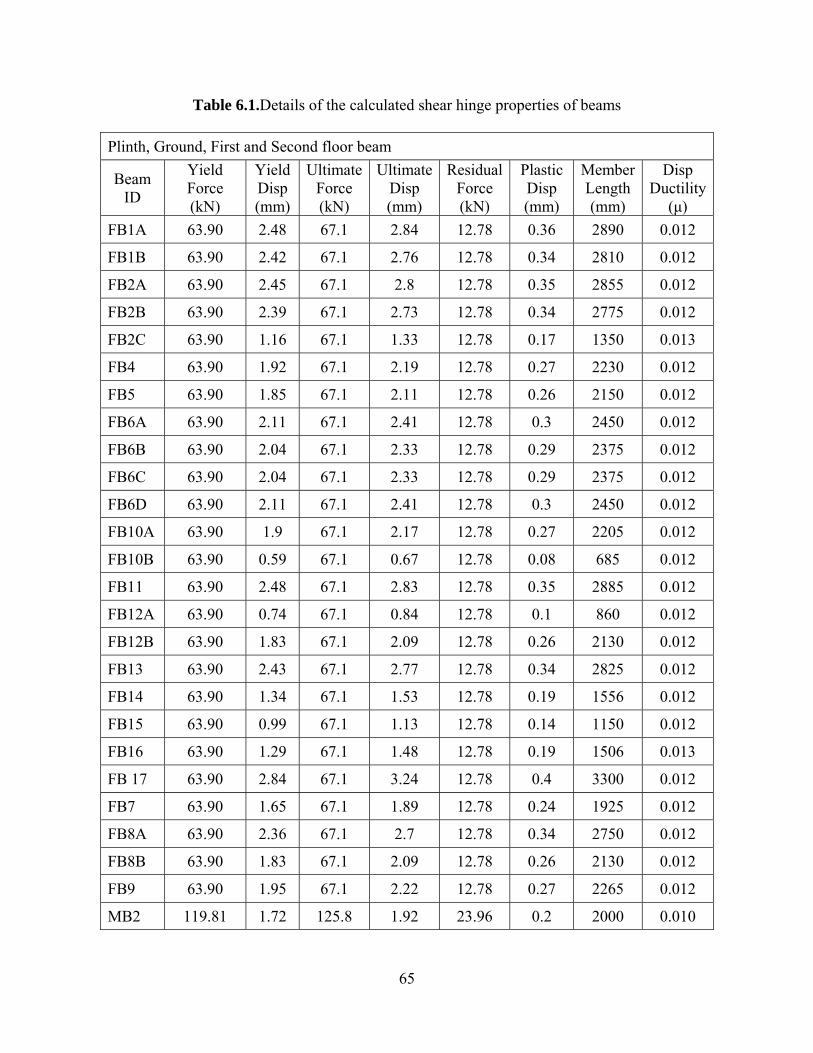
65
Table 6.1.Details of the calculated shear hinge properties of beams
Plinth, Ground, First and Second floor beam
Beam ID
Yield Force (kN)
Yield Disp (mm)
Ultimate Force (kN)
Ultimate Disp (mm)
Residual Force (kN)
Plastic Disp (mm)
Member Length (mm)
Disp Ductility
(μ) FB1A 63.90 2.48 67.1 2.84 12.78 0.36 2890 0.012
FB1B 63.90 2.42 67.1 2.76 12.78 0.34 2810 0.012
FB2A 63.90 2.45 67.1 2.8 12.78 0.35 2855 0.012
FB2B 63.90 2.39 67.1 2.73 12.78 0.34 2775 0.012
FB2C 63.90 1.16 67.1 1.33 12.78 0.17 1350 0.013
FB4 63.90 1.92 67.1 2.19 12.78 0.27 2230 0.012
FB5 63.90 1.85 67.1 2.11 12.78 0.26 2150 0.012
FB6A 63.90 2.11 67.1 2.41 12.78 0.3 2450 0.012
FB6B 63.90 2.04 67.1 2.33 12.78 0.29 2375 0.012
FB6C 63.90 2.04 67.1 2.33 12.78 0.29 2375 0.012
FB6D 63.90 2.11 67.1 2.41 12.78 0.3 2450 0.012
FB10A 63.90 1.9 67.1 2.17 12.78 0.27 2205 0.012
FB10B 63.90 0.59 67.1 0.67 12.78 0.08 685 0.012
FB11 63.90 2.48 67.1 2.83 12.78 0.35 2885 0.012
FB12A 63.90 0.74 67.1 0.84 12.78 0.1 860 0.012
FB12B 63.90 1.83 67.1 2.09 12.78 0.26 2130 0.012
FB13 63.90 2.43 67.1 2.77 12.78 0.34 2825 0.012
FB14 63.90 1.34 67.1 1.53 12.78 0.19 1556 0.012
FB15 63.90 0.99 67.1 1.13 12.78 0.14 1150 0.012
FB16 63.90 1.29 67.1 1.48 12.78 0.19 1506 0.013
FB 17 63.90 2.84 67.1 3.24 12.78 0.4 3300 0.012
FB7 63.90 1.65 67.1 1.89 12.78 0.24 1925 0.012
FB8A 63.90 2.36 67.1 2.7 12.78 0.34 2750 0.012
FB8B 63.90 1.83 67.1 2.09 12.78 0.26 2130 0.012
FB9 63.90 1.95 67.1 2.22 12.78 0.27 2265 0.012
MB2 119.81 1.72 125.8 1.92 23.96 0.2 2000 0.010
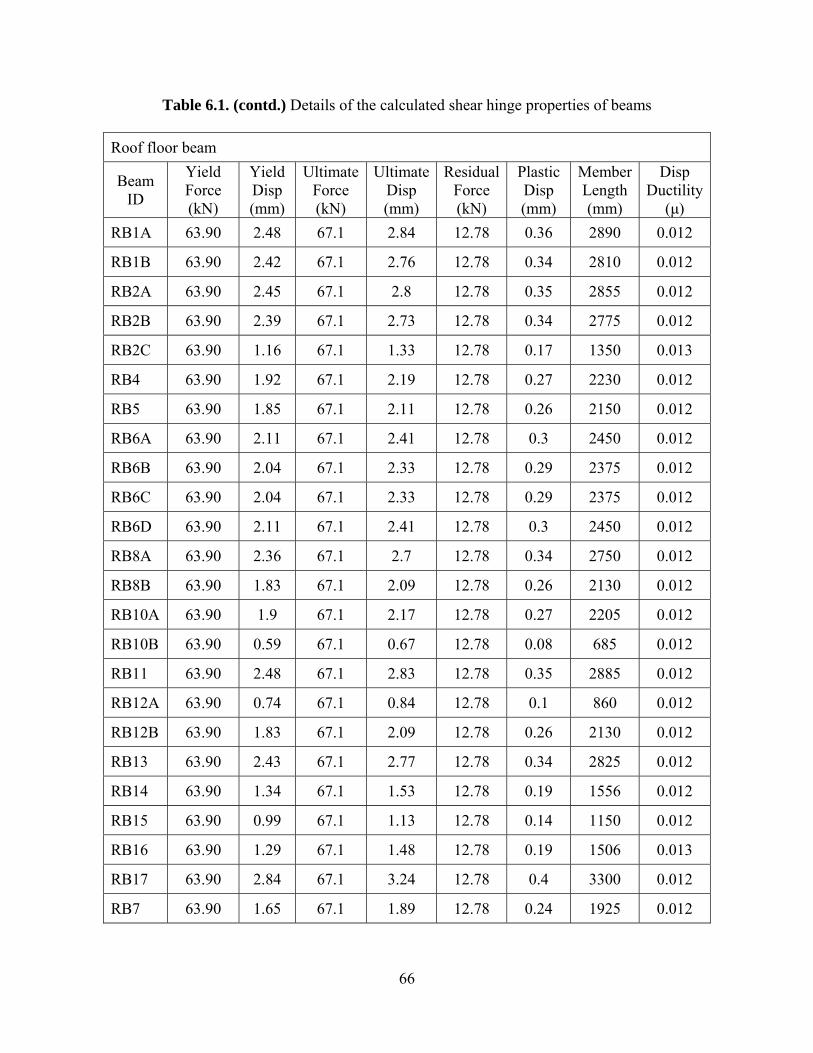
66
Table 6.1. (contd.) Details of the calculated shear hinge properties of beams
Roof floor beam
Beam ID
Yield Force (kN)
Yield Disp (mm)
Ultimate Force (kN)
Ultimate Disp (mm)
Residual Force (kN)
Plastic Disp (mm)
Member Length (mm)
Disp Ductility
(μ) RB1A 63.90 2.48 67.1 2.84 12.78 0.36 2890 0.012
RB1B 63.90 2.42 67.1 2.76 12.78 0.34 2810 0.012
RB2A 63.90 2.45 67.1 2.8 12.78 0.35 2855 0.012
RB2B 63.90 2.39 67.1 2.73 12.78 0.34 2775 0.012
RB2C 63.90 1.16 67.1 1.33 12.78 0.17 1350 0.013
RB4 63.90 1.92 67.1 2.19 12.78 0.27 2230 0.012
RB5 63.90 1.85 67.1 2.11 12.78 0.26 2150 0.012
RB6A 63.90 2.11 67.1 2.41 12.78 0.3 2450 0.012
RB6B 63.90 2.04 67.1 2.33 12.78 0.29 2375 0.012
RB6C 63.90 2.04 67.1 2.33 12.78 0.29 2375 0.012
RB6D 63.90 2.11 67.1 2.41 12.78 0.3 2450 0.012
RB8A 63.90 2.36 67.1 2.7 12.78 0.34 2750 0.012
RB8B 63.90 1.83 67.1 2.09 12.78 0.26 2130 0.012
RB10A 63.90 1.9 67.1 2.17 12.78 0.27 2205 0.012
RB10B 63.90 0.59 67.1 0.67 12.78 0.08 685 0.012
RB11 63.90 2.48 67.1 2.83 12.78 0.35 2885 0.012
RB12A 63.90 0.74 67.1 0.84 12.78 0.1 860 0.012
RB12B 63.90 1.83 67.1 2.09 12.78 0.26 2130 0.012
RB13 63.90 2.43 67.1 2.77 12.78 0.34 2825 0.012
RB14 63.90 1.34 67.1 1.53 12.78 0.19 1556 0.012
RB15 63.90 0.99 67.1 1.13 12.78 0.14 1150 0.012
RB16 63.90 1.29 67.1 1.48 12.78 0.19 1506 0.013
RB17 63.90 2.84 67.1 3.24 12.78 0.4 3300 0.012
RB7 63.90 1.65 67.1 1.89 12.78 0.24 1925 0.012
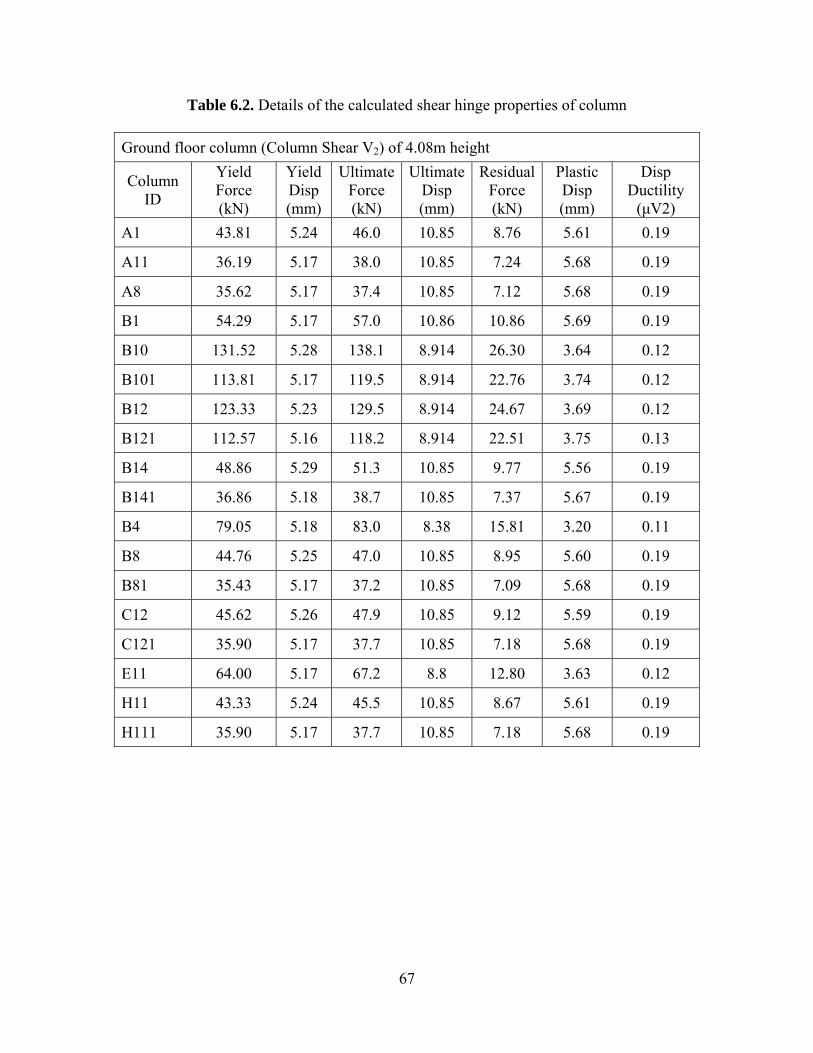
67
Table 6.2. Details of the calculated shear hinge properties of column
Ground floor column (Column Shear V2) of 4.08m height
Column ID
Yield Force (kN)
Yield Disp (mm)
Ultimate Force (kN)
Ultimate Disp (mm)
Residual Force (kN)
Plastic Disp (mm)
Disp Ductility
(μV2) A1 43.81 5.24 46.0 10.85 8.76 5.61 0.19
A11 36.19 5.17 38.0 10.85 7.24 5.68 0.19
A8 35.62 5.17 37.4 10.85 7.12 5.68 0.19
B1 54.29 5.17 57.0 10.86 10.86 5.69 0.19
B10 131.52 5.28 138.1 8.914 26.30 3.64 0.12
B101 113.81 5.17 119.5 8.914 22.76 3.74 0.12
B12 123.33 5.23 129.5 8.914 24.67 3.69 0.12
B121 112.57 5.16 118.2 8.914 22.51 3.75 0.13
B14 48.86 5.29 51.3 10.85 9.77 5.56 0.19
B141 36.86 5.18 38.7 10.85 7.37 5.67 0.19
B4 79.05 5.18 83.0 8.38 15.81 3.20 0.11
B8 44.76 5.25 47.0 10.85 8.95 5.60 0.19
B81 35.43 5.17 37.2 10.85 7.09 5.68 0.19
C12 45.62 5.26 47.9 10.85 9.12 5.59 0.19
C121 35.90 5.17 37.7 10.85 7.18 5.68 0.19
E11 64.00 5.17 67.2 8.8 12.80 3.63 0.12
H11 43.33 5.24 45.5 10.85 8.67 5.61 0.19
H111 35.90 5.17 37.7 10.85 7.18 5.68 0.19
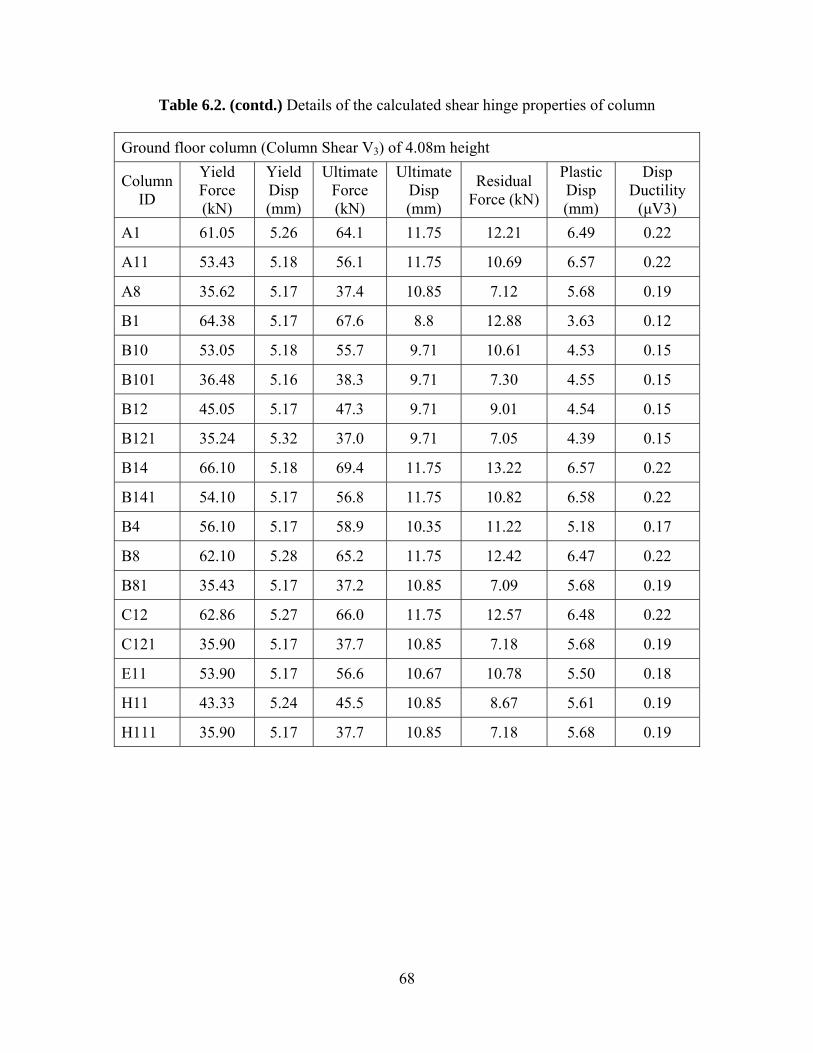
68
Table 6.2. (contd.) Details of the calculated shear hinge properties of column
Ground floor column (Column Shear V3) of 4.08m height
Column ID
Yield Force (kN)
Yield Disp (mm)
Ultimate Force (kN)
Ultimate Disp (mm)
Residual Force (kN)
Plastic Disp (mm)
Disp Ductility
(μV3) A1 61.05 5.26 64.1 11.75 12.21 6.49 0.22
A11 53.43 5.18 56.1 11.75 10.69 6.57 0.22
A8 35.62 5.17 37.4 10.85 7.12 5.68 0.19
B1 64.38 5.17 67.6 8.8 12.88 3.63 0.12
B10 53.05 5.18 55.7 9.71 10.61 4.53 0.15
B101 36.48 5.16 38.3 9.71 7.30 4.55 0.15
B12 45.05 5.17 47.3 9.71 9.01 4.54 0.15
B121 35.24 5.32 37.0 9.71 7.05 4.39 0.15
B14 66.10 5.18 69.4 11.75 13.22 6.57 0.22
B141 54.10 5.17 56.8 11.75 10.82 6.58 0.22
B4 56.10 5.17 58.9 10.35 11.22 5.18 0.17
B8 62.10 5.28 65.2 11.75 12.42 6.47 0.22
B81 35.43 5.17 37.2 10.85 7.09 5.68 0.19
C12 62.86 5.27 66.0 11.75 12.57 6.48 0.22
C121 35.90 5.17 37.7 10.85 7.18 5.68 0.19
E11 53.90 5.17 56.6 10.67 10.78 5.50 0.18
H11 43.33 5.24 45.5 10.85 8.67 5.61 0.19
H111 35.90 5.17 37.7 10.85 7.18 5.68 0.19
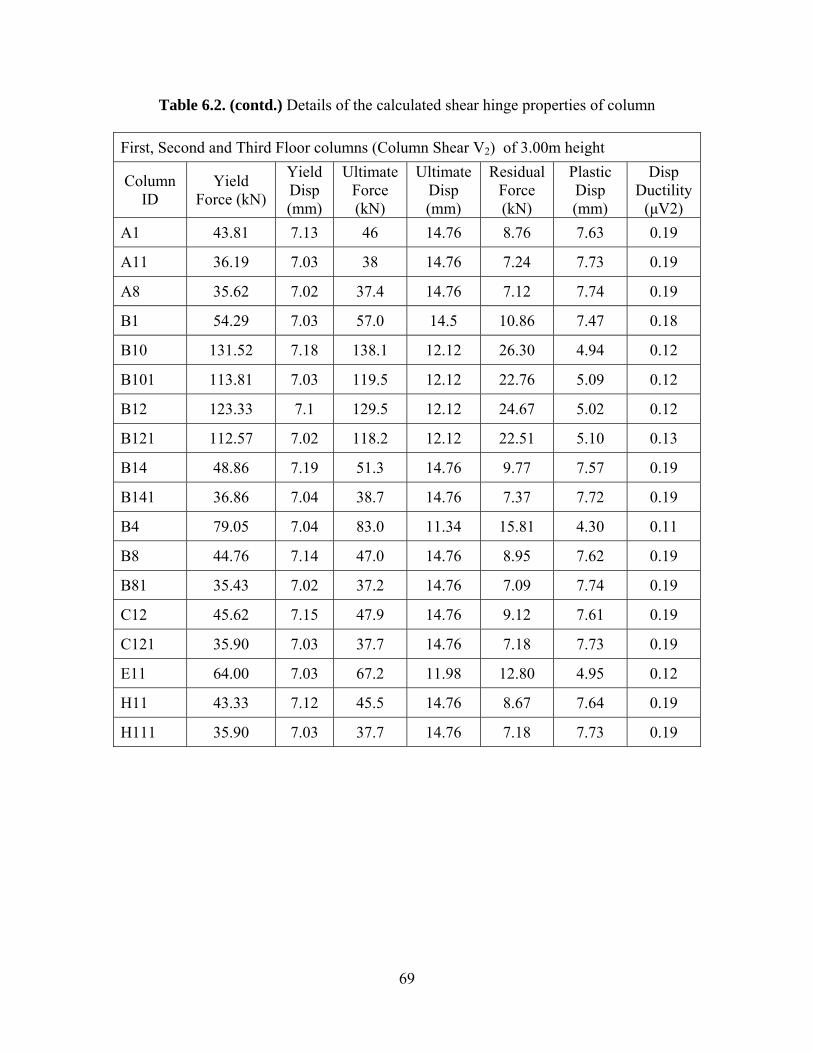
69
Table 6.2. (contd.) Details of the calculated shear hinge properties of column
First, Second and Third Floor columns (Column Shear V2) of 3.00m height
Column ID
Yield Force (kN)
Yield Disp (mm)
Ultimate Force (kN)
Ultimate Disp (mm)
Residual Force (kN)
Plastic Disp (mm)
Disp Ductility
(μV2) A1 43.81 7.13 46 14.76 8.76 7.63 0.19
A11 36.19 7.03 38 14.76 7.24 7.73 0.19
A8 35.62 7.02 37.4 14.76 7.12 7.74 0.19
B1 54.29 7.03 57.0 14.5 10.86 7.47 0.18
B10 131.52 7.18 138.1 12.12 26.30 4.94 0.12
B101 113.81 7.03 119.5 12.12 22.76 5.09 0.12
B12 123.33 7.1 129.5 12.12 24.67 5.02 0.12
B121 112.57 7.02 118.2 12.12 22.51 5.10 0.13
B14 48.86 7.19 51.3 14.76 9.77 7.57 0.19
B141 36.86 7.04 38.7 14.76 7.37 7.72 0.19
B4 79.05 7.04 83.0 11.34 15.81 4.30 0.11
B8 44.76 7.14 47.0 14.76 8.95 7.62 0.19
B81 35.43 7.02 37.2 14.76 7.09 7.74 0.19
C12 45.62 7.15 47.9 14.76 9.12 7.61 0.19
C121 35.90 7.03 37.7 14.76 7.18 7.73 0.19
E11 64.00 7.03 67.2 11.98 12.80 4.95 0.12
H11 43.33 7.12 45.5 14.76 8.67 7.64 0.19
H111 35.90 7.03 37.7 14.76 7.18 7.73 0.19
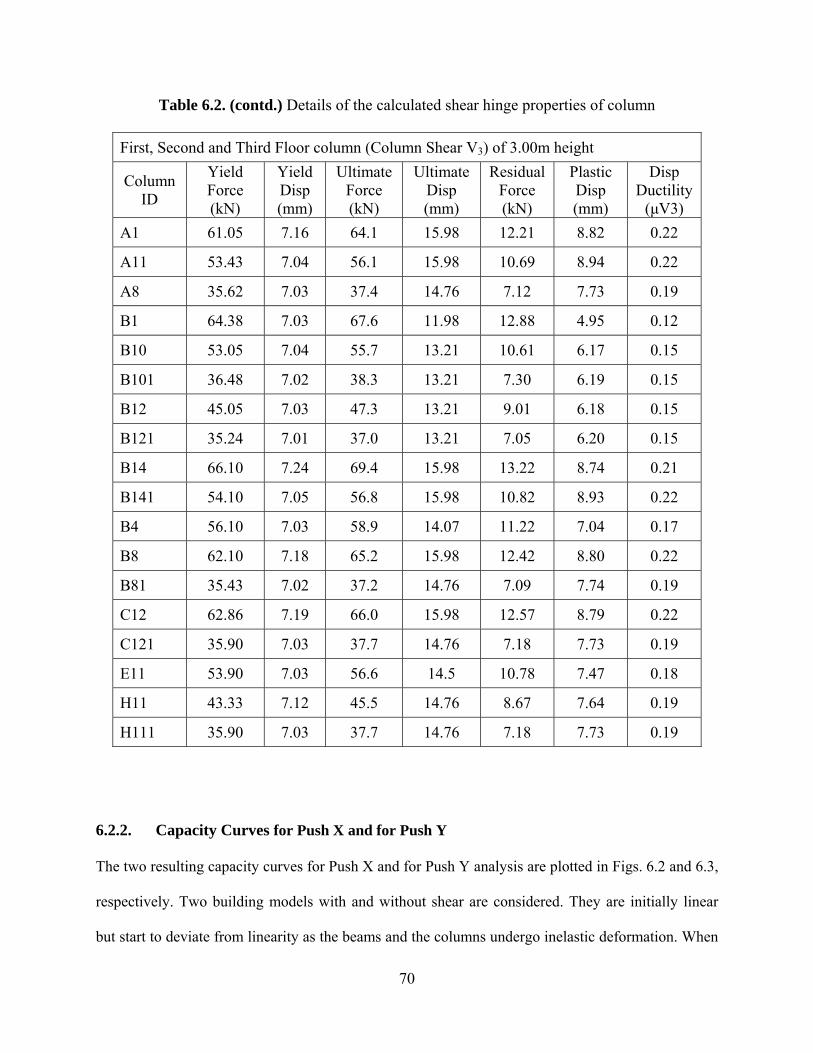
70
Table 6.2. (contd.) Details of the calculated shear hinge properties of column
First, Second and Third Floor column (Column Shear V3) of 3.00m height
Column ID
Yield Force (kN)
Yield Disp (mm)
Ultimate Force (kN)
Ultimate Disp (mm)
Residual Force (kN)
Plastic Disp (mm)
Disp Ductility
(μV3) A1 61.05 7.16 64.1 15.98 12.21 8.82 0.22
A11 53.43 7.04 56.1 15.98 10.69 8.94 0.22
A8 35.62 7.03 37.4 14.76 7.12 7.73 0.19
B1 64.38 7.03 67.6 11.98 12.88 4.95 0.12
B10 53.05 7.04 55.7 13.21 10.61 6.17 0.15
B101 36.48 7.02 38.3 13.21 7.30 6.19 0.15
B12 45.05 7.03 47.3 13.21 9.01 6.18 0.15
B121 35.24 7.01 37.0 13.21 7.05 6.20 0.15
B14 66.10 7.24 69.4 15.98 13.22 8.74 0.21
B141 54.10 7.05 56.8 15.98 10.82 8.93 0.22
B4 56.10 7.03 58.9 14.07 11.22 7.04 0.17
B8 62.10 7.18 65.2 15.98 12.42 8.80 0.22
B81 35.43 7.02 37.2 14.76 7.09 7.74 0.19
C12 62.86 7.19 66.0 15.98 12.57 8.79 0.22
C121 35.90 7.03 37.7 14.76 7.18 7.73 0.19
E11 53.90 7.03 56.6 14.5 10.78 7.47 0.18
H11 43.33 7.12 45.5 14.76 8.67 7.64 0.19
H111 35.90 7.03 37.7 14.76 7.18 7.73 0.19
6.2.2. Capacity Curves for Push X and for Push Y
The two resulting capacity curves for Push X and for Push Y analysis are plotted in Figs. 6.2 and 6.3,
respectively. Two building models with and without shear are considered. They are initially linear
but start to deviate from linearity as the beams and the columns undergo inelastic deformation. When
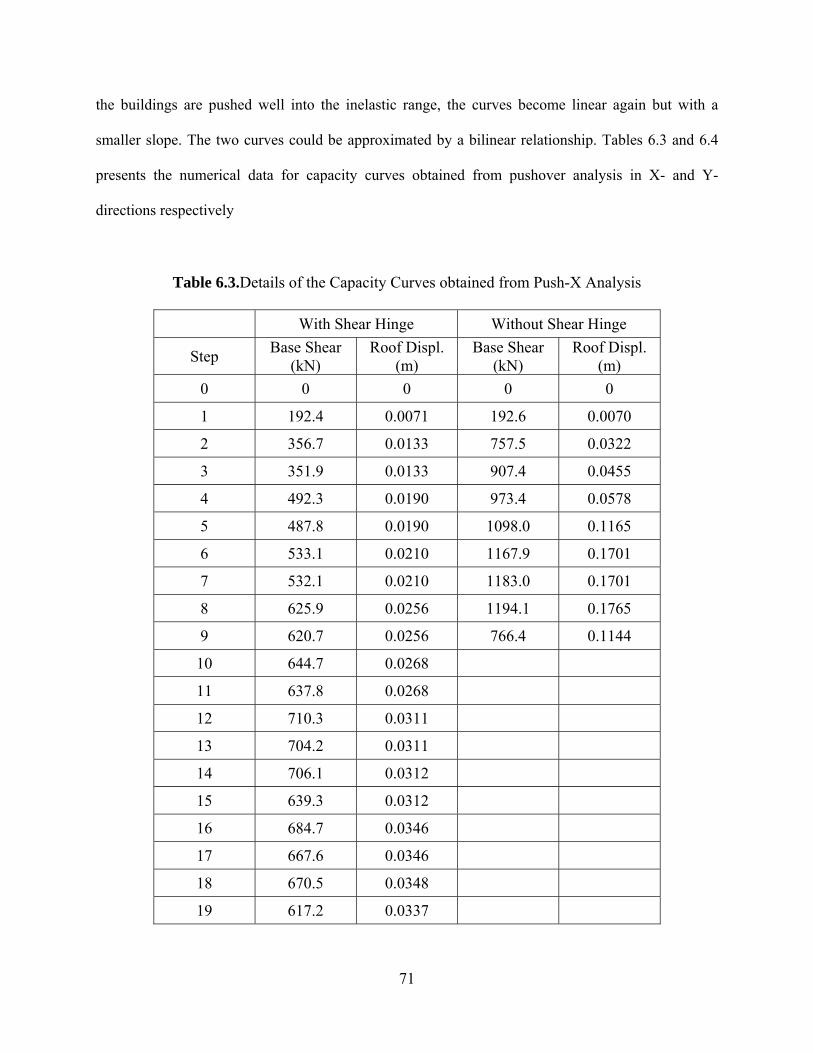
71
the buildings are pushed well into the inelastic range, the curves become linear again but with a
smaller slope. The two curves could be approximated by a bilinear relationship. Tables 6.3 and 6.4
presents the numerical data for capacity curves obtained from pushover analysis in X- and Y-
directions respectively
Table 6.3.Details of the Capacity Curves obtained from Push-X Analysis
With Shear Hinge Without Shear Hinge
Step Base Shear (kN)
Roof Displ. (m)
Base Shear (kN)
Roof Displ. (m)
0 0 0 0 0
1 192.4 0.0071 192.6 0.0070
2 356.7 0.0133 757.5 0.0322
3 351.9 0.0133 907.4 0.0455
4 492.3 0.0190 973.4 0.0578
5 487.8 0.0190 1098.0 0.1165
6 533.1 0.0210 1167.9 0.1701
7 532.1 0.0210 1183.0 0.1701
8 625.9 0.0256 1194.1 0.1765
9 620.7 0.0256 766.4 0.1144
10 644.7 0.0268
11 637.8 0.0268
12 710.3 0.0311
13 704.2 0.0311
14 706.1 0.0312
15 639.3 0.0312
16 684.7 0.0346
17 667.6 0.0346
18 670.5 0.0348
19 617.2 0.0337
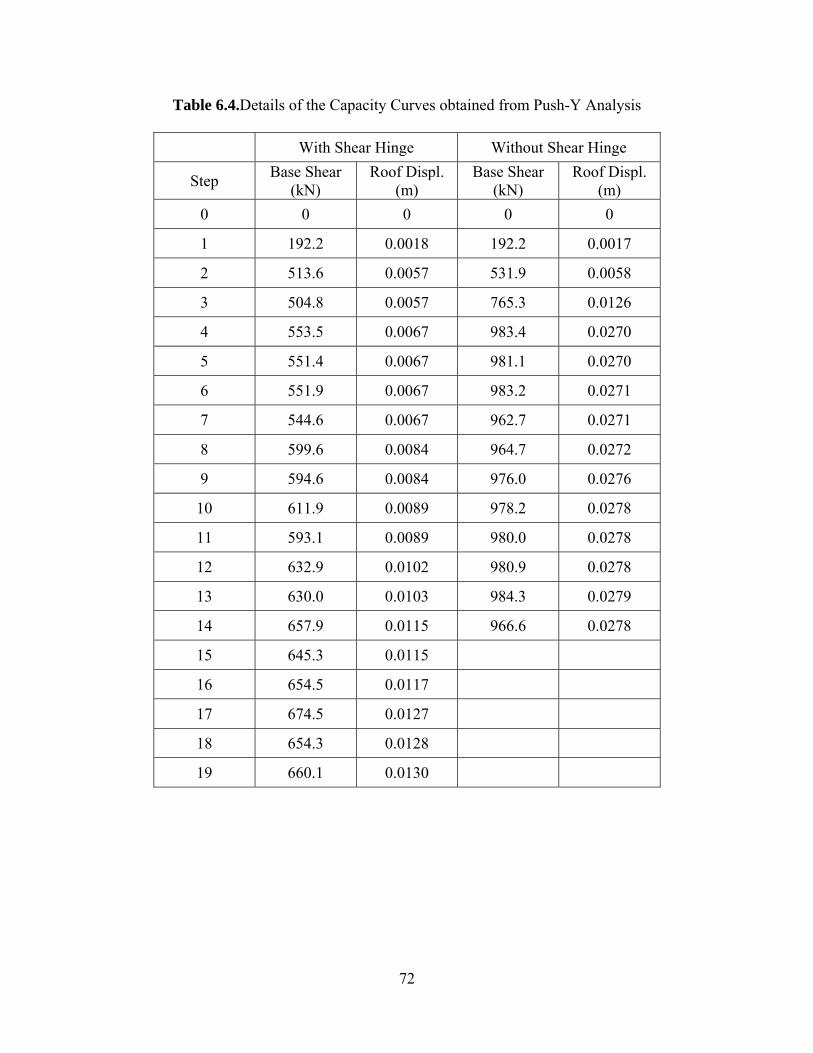
72
Table 6.4.Details of the Capacity Curves obtained from Push-Y Analysis
With Shear Hinge Without Shear Hinge
Step Base Shear (kN)
Roof Displ. (m)
Base Shear (kN)
Roof Displ. (m)
0 0 0 0 0
1 192.2 0.0018 192.2 0.0017
2 513.6 0.0057 531.9 0.0058
3 504.8 0.0057 765.3 0.0126
4 553.5 0.0067 983.4 0.0270
5 551.4 0.0067 981.1 0.0270
6 551.9 0.0067 983.2 0.0271
7 544.6 0.0067 962.7 0.0271
8 599.6 0.0084 964.7 0.0272
9 594.6 0.0084 976.0 0.0276
10 611.9 0.0089 978.2 0.0278
11 593.1 0.0089 980.0 0.0278
12 632.9 0.0102 980.9 0.0278
13 630.0 0.0103 984.3 0.0279
14 657.9 0.0115 966.6 0.0278
15 645.3 0.0115
16 654.5 0.0117
17 674.5 0.0127
18 654.3 0.0128
19 660.1 0.0130
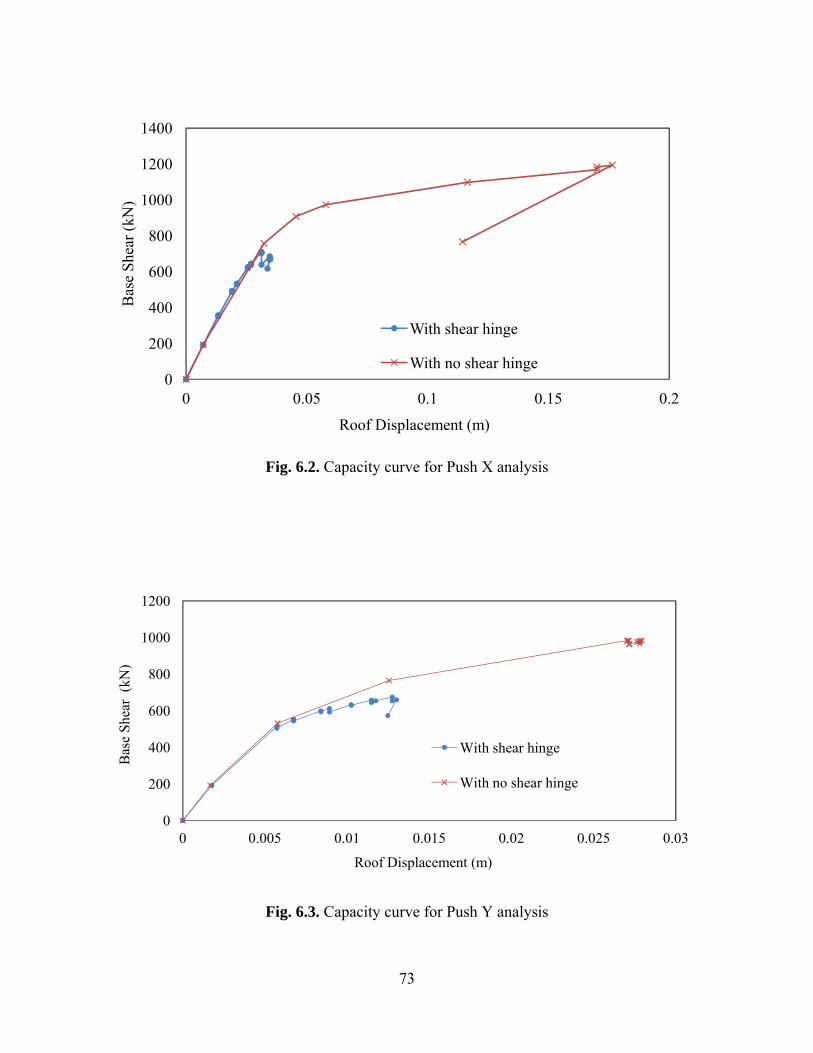
73
Fig. 6.2. Capacity curve for Push X analysis
Fig. 6.3. Capacity curve for Push Y analysis
0
200
400
600
800
1000
1200
1400
0 0.05 0.1 0.15 0.2
Bas
e Sh
ear (
kN)
Roof Displacement (m)
With shear hinge
With no shear hinge
0
200
400
600
800
1000
1200
0 0.005 0.01 0.015 0.02 0.025 0.03
Bas
e Sh
ear
(kN
)
Roof Displacement (m)
With shear hinge
With no shear hinge
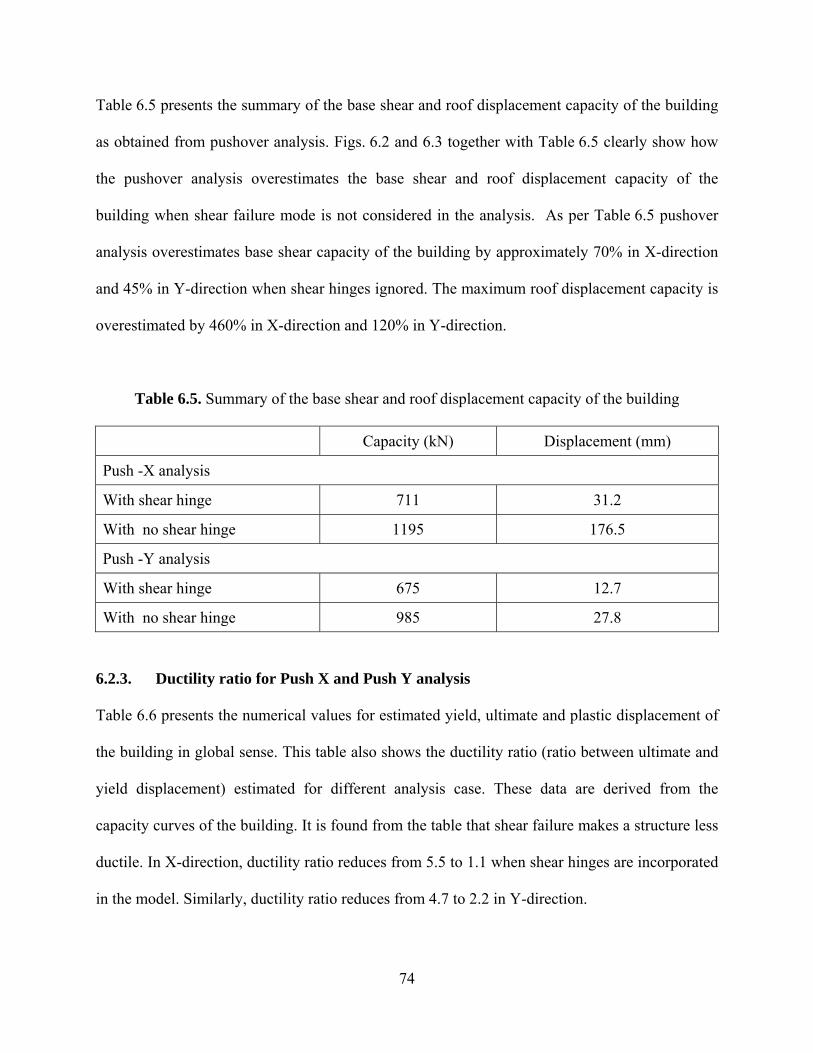
74
Table 6.5 presents the summary of the base shear and roof displacement capacity of the building
as obtained from pushover analysis. Figs. 6.2 and 6.3 together with Table 6.5 clearly show how
the pushover analysis overestimates the base shear and roof displacement capacity of the
building when shear failure mode is not considered in the analysis. As per Table 6.5 pushover
analysis overestimates base shear capacity of the building by approximately 70% in X-direction
and 45% in Y-direction when shear hinges ignored. The maximum roof displacement capacity is
overestimated by 460% in X-direction and 120% in Y-direction.
Table 6.5. Summary of the base shear and roof displacement capacity of the building
Capacity (kN) Displacement (mm)
Push -X analysis
With shear hinge 711 31.2
With no shear hinge 1195 176.5
Push -Y analysis
With shear hinge 675 12.7
With no shear hinge 985 27.8
6.2.3. Ductility ratio for Push X and Push Y analysis
Table 6.6 presents the numerical values for estimated yield, ultimate and plastic displacement of
the building in global sense. This table also shows the ductility ratio (ratio between ultimate and
yield displacement) estimated for different analysis case. These data are derived from the
capacity curves of the building. It is found from the table that shear failure makes a structure less
ductile. In X-direction, ductility ratio reduces from 5.5 to 1.1 when shear hinges are incorporated
in the model. Similarly, ductility ratio reduces from 4.7 to 2.2 in Y-direction.
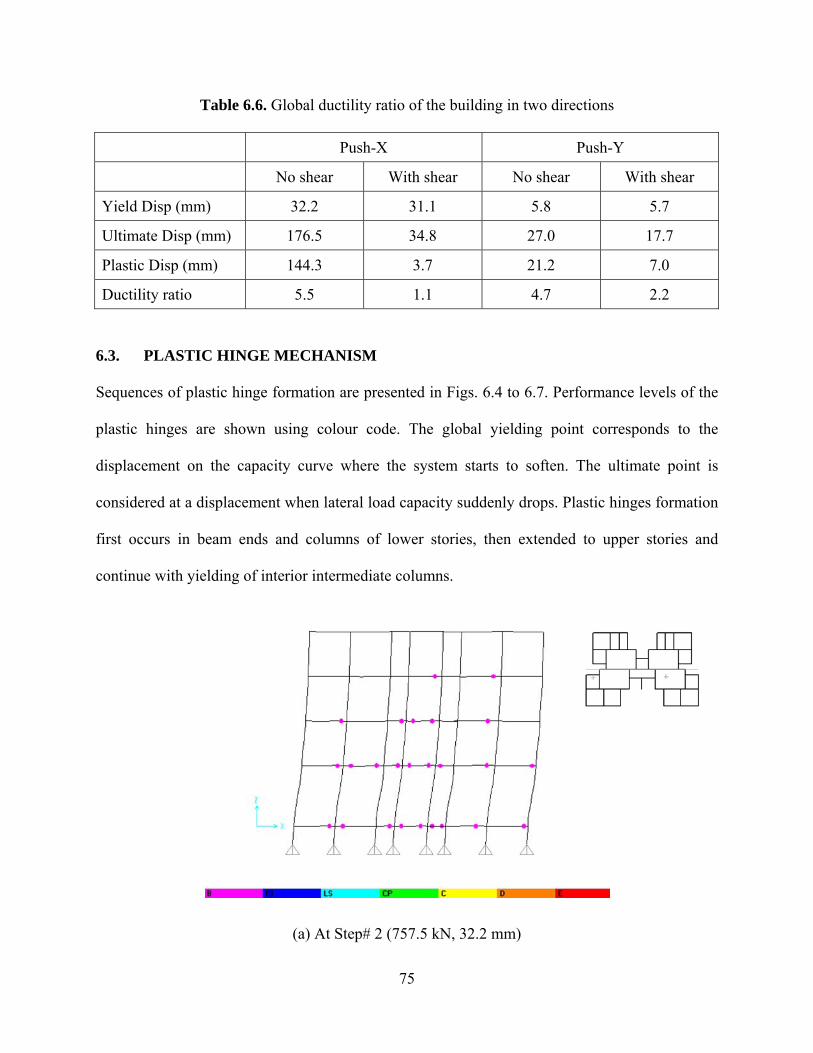
75
Table 6.6. Global ductility ratio of the building in two directions
Push-X Push-Y
No shear With shear No shear With shear
Yield Disp (mm) 32.2 31.1 5.8 5.7
Ultimate Disp (mm) 176.5 34.8 27.0 17.7
Plastic Disp (mm) 144.3 3.7 21.2 7.0
Ductility ratio 5.5 1.1 4.7 2.2
6.3. PLASTIC HINGE MECHANISM
Sequences of plastic hinge formation are presented in Figs. 6.4 to 6.7. Performance levels of the
plastic hinges are shown using colour code. The global yielding point corresponds to the
displacement on the capacity curve where the system starts to soften. The ultimate point is
considered at a displacement when lateral load capacity suddenly drops. Plastic hinges formation
first occurs in beam ends and columns of lower stories, then extended to upper stories and
continue with yielding of interior intermediate columns.
(a) At Step# 2 (757.5 kN, 32.2 mm)
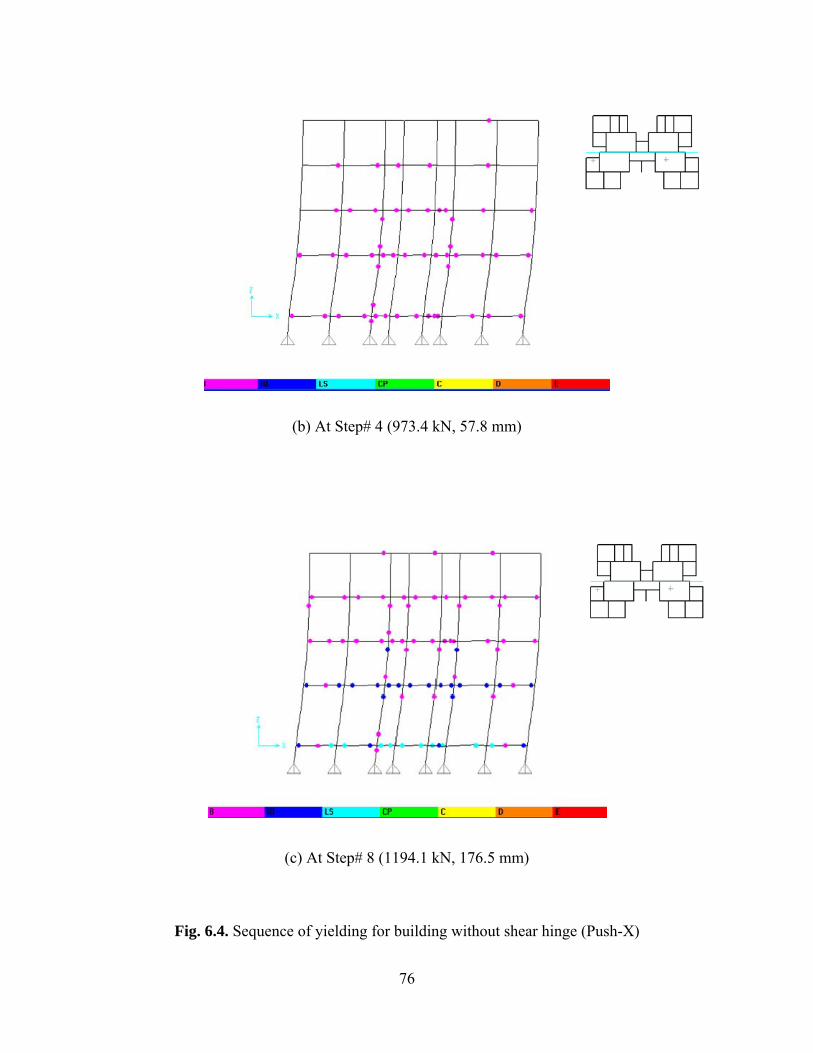
76
(b) At Step# 4 (973.4 kN, 57.8 mm)
(c) At Step# 8 (1194.1 kN, 176.5 mm)
Fig. 6.4. Sequence of yielding for building without shear hinge (Push-X)
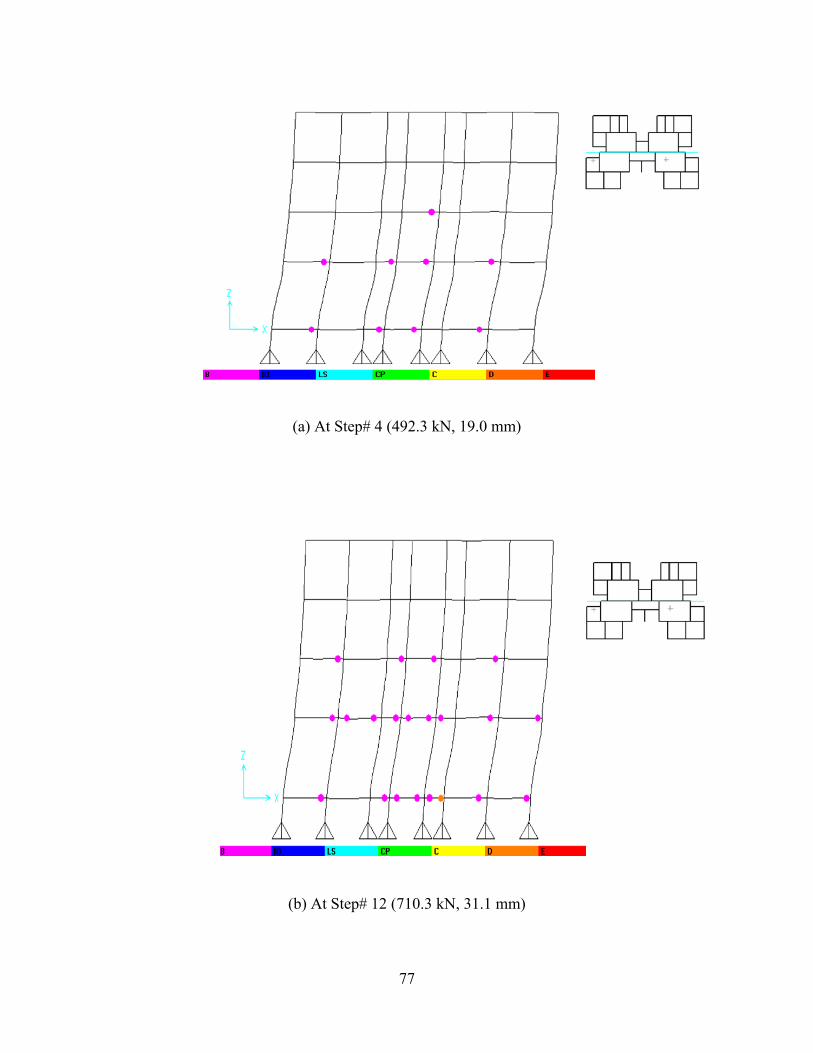
77
(a) At Step# 4 (492.3 kN, 19.0 mm)
(b) At Step# 12 (710.3 kN, 31.1 mm)
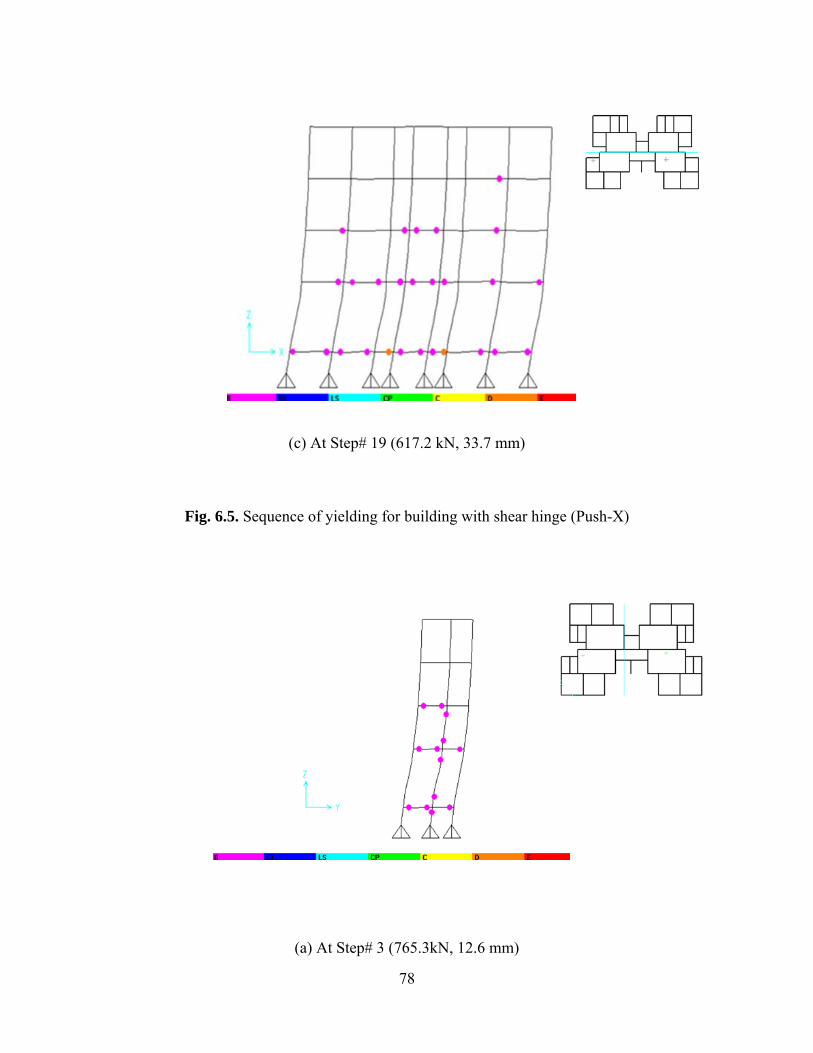
78
(c) At Step# 19 (617.2 kN, 33.7 mm)
Fig. 6.5. Sequence of yielding for building with shear hinge (Push-X)
(a) At Step# 3 (765.3kN, 12.6 mm)
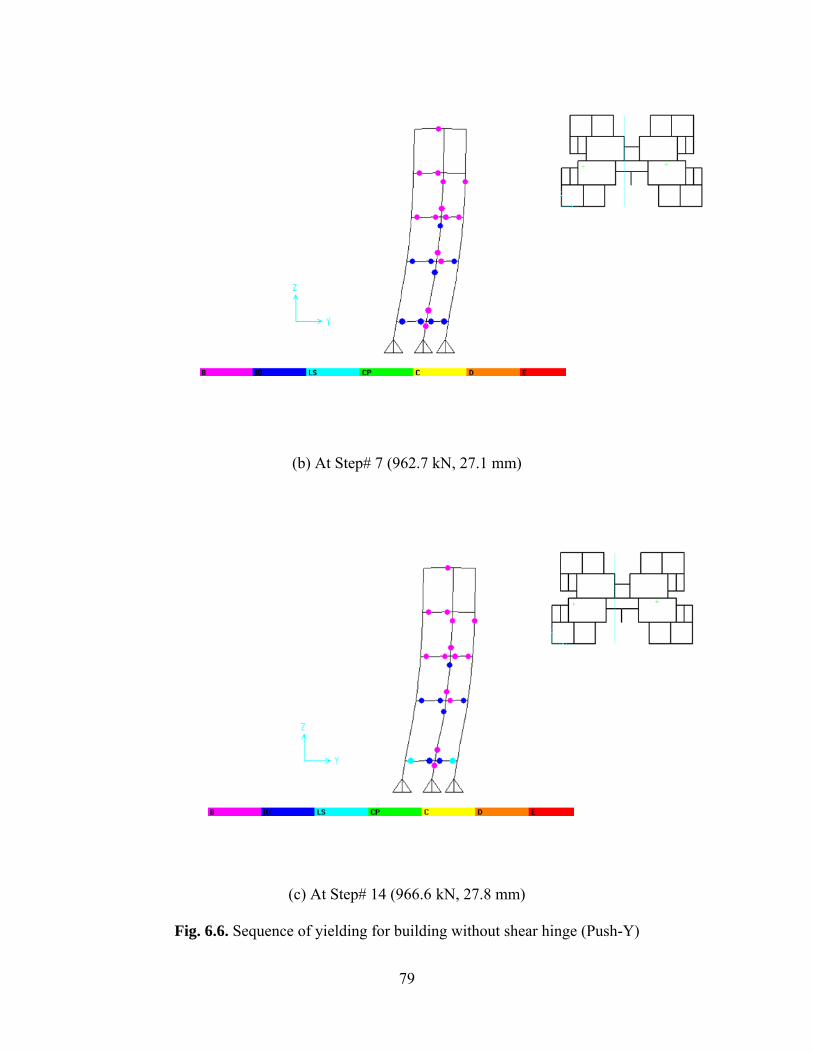
79
(b) At Step# 7 (962.7 kN, 27.1 mm)
(c) At Step# 14 (966.6 kN, 27.8 mm)
Fig. 6.6. Sequence of yielding for building without shear hinge (Push-Y)
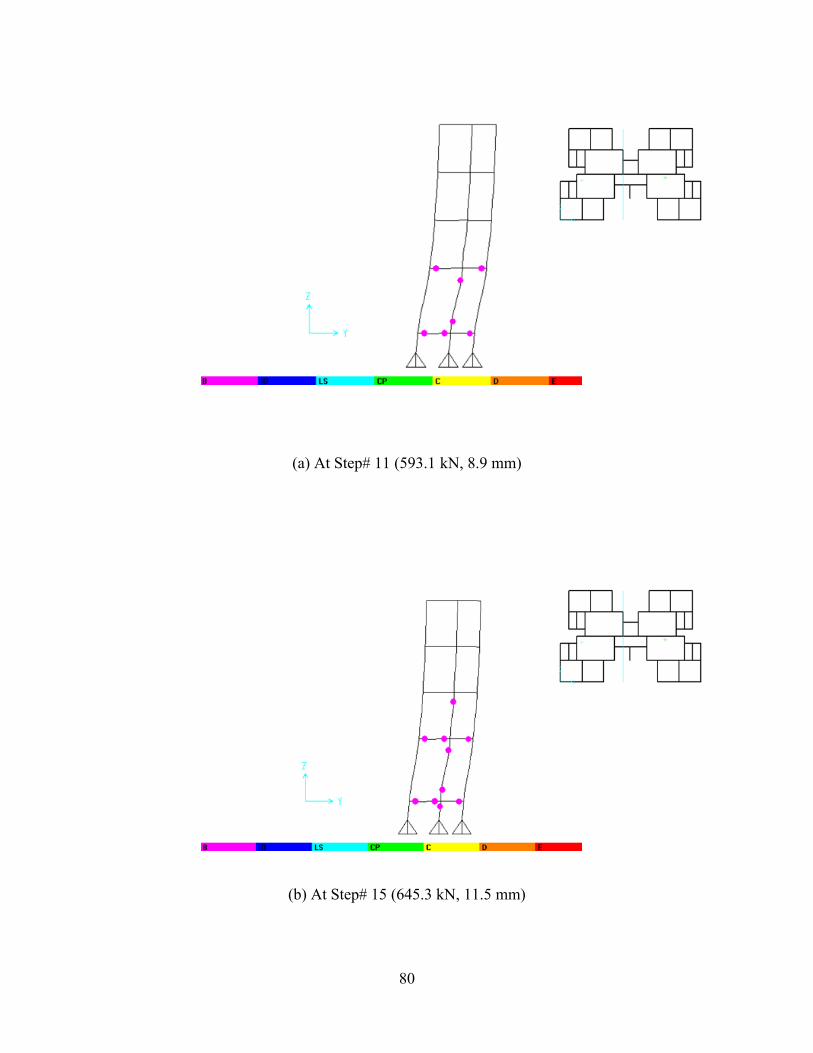
80
(a) At Step# 11 (593.1 kN, 8.9 mm)
(b) At Step# 15 (645.3 kN, 11.5 mm)
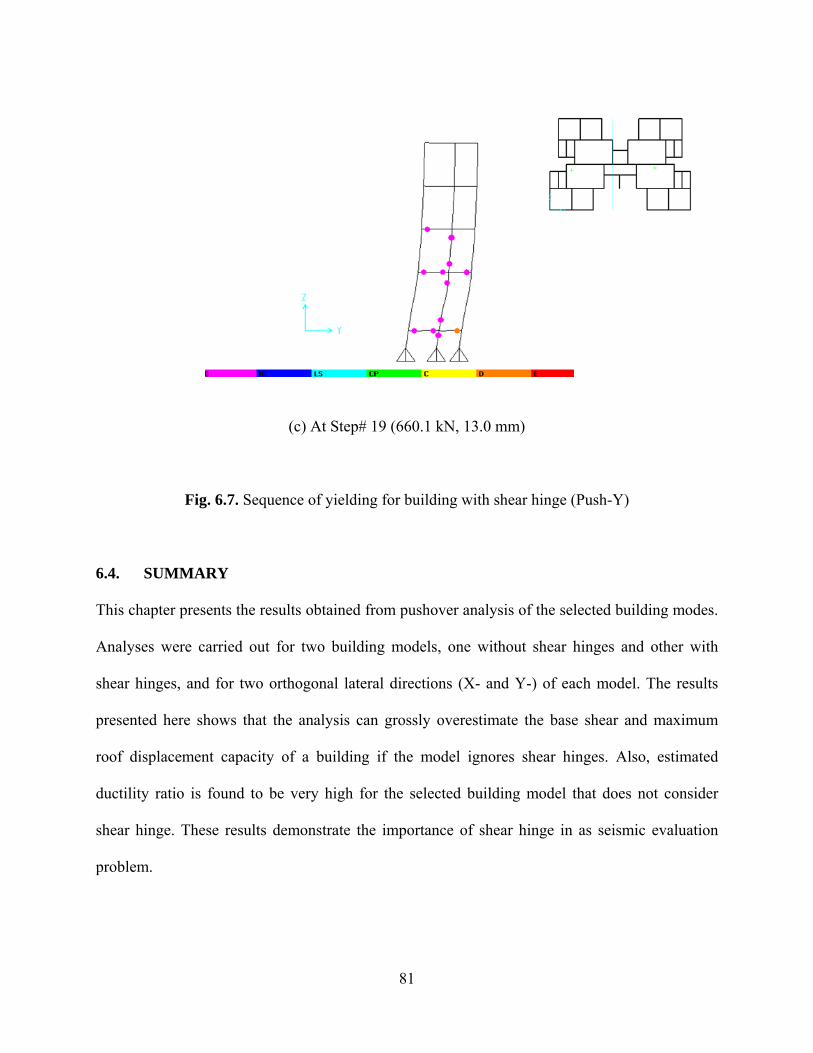
81
(c) At Step# 19 (660.1 kN, 13.0 mm)
Fig. 6.7. Sequence of yielding for building with shear hinge (Push-Y)
6.4. SUMMARY
This chapter presents the results obtained from pushover analysis of the selected building modes.
Analyses were carried out for two building models, one without shear hinges and other with
shear hinges, and for two orthogonal lateral directions (X- and Y-) of each model. The results
presented here shows that the analysis can grossly overestimate the base shear and maximum
roof displacement capacity of a building if the model ignores shear hinges. Also, estimated
ductility ratio is found to be very high for the selected building model that does not consider
shear hinge. These results demonstrate the importance of shear hinge in as seismic evaluation
problem.
82
CHAPTER 7
SUMMARY AND CONCLUSIONS
7.1. SUMMARY
The main objective of the present study is to demonstrate the importance of shear hinges
in seismic evaluation of RC framed building. A detailed literature review is carried out as
part of the present study on shear strength and displacement capacity of rectangular RC
sections and seismic evaluation based on nonlinear static pushover analysis. Different
methods to estimate shear strength and displacement capacity are studied. These
calculation procedures are discussed through example calculations in Chapters 3 and 4.
There is no published literature found on the nonlinear force-deformation model of RC
rectangular section for shear. A model for nonlinear shear force versus shear deformation
relation is developed using FEMA 356, IS 456:2000, Priestley et al. (1996) and Park and
Paulay (1975). To demonstrate the importance of shear hinges in seismic evaluation of
RC framed building an existing framed residential apartment building is selected. This
building is analyzed for two different cases: (a) considering flexural and shear hinges (b)
considering only flexural hinges (i.e., without considering shear hinges). The structures
are analyzed for pushover analysis in X and Y directions.
Beams and columns in the present study were modelled as frame elements with the
centrelines joined at nodes using commercial software SAP2000 (v14). The rigid beam-
column joints were modelled by using end offsets at the joints. The floor slabs were
assumed to act as diaphragms, which ensure integral action of all the vertical lateral load-
83
resisting elements. The weight of the slab was distributed as triangular and trapezoidal
load to the surrounding beams. M 20 grade of concrete and Fe 415 grade of reinforcing
steel were used to design the building. The column end at foundation was considered as
fixed for all the models in this study.
The flexural hinges in beams are modelled with uncoupled moment (M3) hinges whereas
for column elements the flexural hinges are modelled with coupled P-M2-M3 properties
based on the interaction of axial force and bi-axial bending moments at the hinge
location.
All the building models were then analysed using non-linear static (pushover) analysis.
At first, the pushover analysis is done for the gravity loads (DL+0.25LL) incrementally
under load control. The lateral pushover analysis (in X- and Y-directions) was followed
after the gravity pushover, under displacement control.
Pushover analysis results for two different cases, as mentioned earlier, compared to
identify the importance of the shear hinges in seismic evaluation problem.
7.2. CONCLUSIONS
Followings are the salient conclusions from the present study:
Shear strength
i) FEMA-356 does not consider contribution of concrete in shear strength
calculation for beam under earthquake loading for moderate to high ductility.
ii) Contribution of web reinforcement in shear strength given in IS-456: 2000
and ACI-318: 2008 represent ultimate strength.
84
iii) FEMA-356 consider ultimate shear strength carried by the web reinforcement
(= strength of the beam) as 1.05 times the yield strength. But there is no
engineering background for this consideration.
iv) No clarity is found in yield strength from the literature.
Shear displacement at yield
i) The model by Sezen (2002) is based on regression analysis of test data
ii) Model by Panagiotakos and Fardis (2001) is simple but it is reported to be
overestimating the shear displacement.
iii) Model proposed by Gerin and Adebar (2004) is reported to be
underestimating the shear displacements at yield.
iv) Priestley et al. (1996) is reported to be most effective for calculating shear
displacement at yield for beams and columns.
Ultimate Shear displacement
i) Model of Park and Paulay (1975) is reported to be most effective in predicting
the ultimate shear displacements for beams and columns.
ii) CEB (1985) is also reported to be effective in predicting the ultimate shear
displacements of beam.
iii) Model by Gerin and Adebar (2004) is reported to be not suitable for
predicting the ultimate shear displacements.
85
Case study
i) The case study presented here demonstrate the importance of modelling
shear hinges to correctly evaluate strength and ductility of the building
ii) When analysis ignores shear failure model it overestimate base shear and
roof displacement capacity of the building.
iii) Presence of shear hinge can correctly reveal the non-ductile failure mode
of the building.
7.3. SCOPE FOR FUTURE WORK
i) The nonlinear shear hinge properties of rectangular RC sections developed
here can be validated through experimental study.
ii) The present study considers only rectangular sections with rectangular links
as web reinforcement. This study can be further extended to spiral web
reinforcement in circular section.
86
ANNEXURE A
PUSHOVER ANALYSIS (FEMA-356, ATC-40)
A.1 INTRODUCTION
The use of the nonlinear static analysis (pushover analysis) came in to practice in 1970’s
but the potential of the pushover analysis has been recognized for last 10-15 years. This
procedure is mainly used to estimate the strength and drift capacity of existing structure
and the seismic demand for this structure subjected to selected earthquake. This
procedure can be used for checking the adequacy of new structural design as well. The
effectiveness of pushover analysis and its computational simplicity brought this
procedure in to several seismic guidelines (ATC 40 and FEMA 356) and design codes
(Euro code 8 and PCM 3274) in last few years.
Pushover analysis is defined as an analysis wherein a mathematical model directly
incorporating the nonlinear load-deformation characteristics of individual components
and elements of the building shall be subjected to monotonically increasing lateral loads
representing inertia forces in an earthquake until a ‘target displacement’ is exceeded.
Target displacement is the maximum displacement (elastic plus inelastic) of the building
at roof expected under selected earthquake ground motion. Pushover analysis assesses
the structural performance by estimating the force and deformation capacity and seismic
demand using a nonlinear static analysis algorithm. The seismic demand parameters are
global displacements (at roof or any other reference point), storey drifts, storey forces,
and component deformation and component forces. The analysis accounts for
87
geometrical nonlinearity, material inelasticity and the redistribution of internal forces.
Response characteristics that can be obtained from the pushover analysis are
summarised as follows:
a) Estimates of force and displacement capacities of the structure. Sequence of
the member yielding and the progress of the overall capacity curve.
b) Estimates of force (axial, shear and moment) demands on potentially brittle
elements and deformation demands on ductile elements.
c) Estimates of global displacement demand, corresponding inter-storey drifts
and damages on structural and non-structural elements expected under the
earthquake ground motion considered.
d) Sequences of the failure of elements and the consequent effect on the overall
structural stability.
e) Identification of the critical regions, where the inelastic deformations are
expected to be high and identification of strength irregularities (in plan or in
elevation) of the building.
Pushover analysis delivers all these benefits for an additional computational effort
(modeling nonlinearity and change in analysis algorithm) over the linear static analysis.
Step by step procedure of pushover analysis is discussed next.
A.1.1 Pushover Analysis Procedure
Pushover analysis is a static nonlinear procedure in which the magnitude of the lateral
load is increased monotonically maintaining a predefined distribution pattern along the
height of the building (Fig. A.1a). Building is displaced till the ‘control node’ reaches
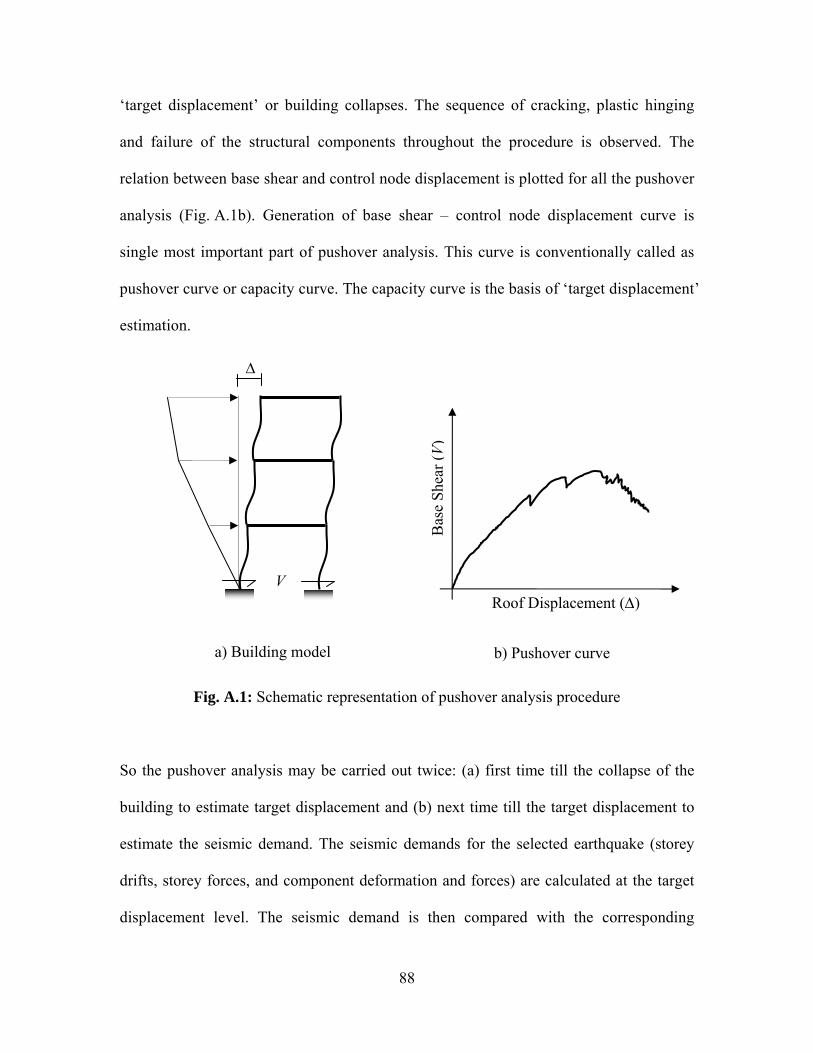
88
‘target displacement’ or building collapses. The sequence of cracking, plastic hinging
and failure of the structural components throughout the procedure is observed. The
relation between base shear and control node displacement is plotted for all the pushover
analysis (Fig. A.1b). Generation of base shear – control node displacement curve is
single most important part of pushover analysis. This curve is conventionally called as
pushover curve or capacity curve. The capacity curve is the basis of ‘target displacement’
estimation.
Fig. A.1: Schematic representation of pushover analysis procedure
So the pushover analysis may be carried out twice: (a) first time till the collapse of the
building to estimate target displacement and (b) next time till the target displacement to
estimate the seismic demand. The seismic demands for the selected earthquake (storey
drifts, storey forces, and component deformation and forces) are calculated at the target
displacement level. The seismic demand is then compared with the corresponding
Bas
e Sh
ear (
V)
Roof Displacement (Δ)
a) Building model b) Pushover curve
Δ
V
89
structural capacity or predefined performance limit state to know what performance the
structure will exhibit. Independent analysis along each of the two orthogonal principal
axes of the building is permitted unless concurrent evaluation of bi-directional effects is
required.
The analysis results are sensitive to the selection of the control node and selection of
lateral load pattern. In general, the centre of mass location at the roof of the building is
considered as control node. For selecting lateral load pattern in pushover analysis, a set
of guidelines as per FEMA 356 is explained in Section A.1.2. The lateral load generally
applied in both positive and negative directions in combination with gravity load (dead
load and a portion of live load) to study the actual behavior.
A.1.2 Lateral Load Profile
In pushover analysis the building is pushed with a specific load distribution pattern
along the height of the building. The magnitude of the total force is increased but the
pattern of the loading remains same till the end of the process. Pushover analysis results
(i.e., pushover curve, sequence of member yielding, building capacity and seismic
demand) are very sensitive to the load pattern. The lateral load patterns should
approximate the inertial forces expected in the building during an earthquake. The
distribution of lateral inertial forces determines relative magnitudes of shears, moments,
and deformations within the structure. The distribution of these forces will vary
continuously during earthquake response as the members yield and stiffness
characteristics change. It also depends on the type and magnitude of earthquake ground
motion. Although the inertia force distributions vary with the severity of the earthquake
90
and with time, FEMA 356 recommends primarily invariant load pattern for pushover
analysis of framed buildings.
Several investigations (Mwafy and Elnashai, 2000; Gupta and Kunnath, 2000) have
found that a triangular or trapezoidal shape of lateral load provide a better fit to dynamic
analysis results at the elastic range but at large deformations the dynamic envelopes are
closer to the uniformly distributed force pattern. Since the constant distribution methods
are incapable of capturing such variations in characteristics of the structural behavior
under earthquake loading, FEMA 356 suggests the use of at least two different patterns
for all pushover analysis. Use of two lateral load patterns is intended to bind the range
that may occur during actual dynamic response. FEMA 356 recommends selecting one
load pattern from each of the following two groups:
A. Group – I:
i) Code-based vertical distribution of lateral forces used in equivalent static
analysis (permitted only when more than 75% of the total mass participates in
the fundamental mode in the direction under consideration).
ii) A vertical distribution proportional to the shape of the fundamental mode in
the direction under consideration (permitted only when more than 75% of the
total mass participates in this mode).
iii) A vertical distribution proportional to the story shear distribution calculated
by combining modal responses from a response spectrum analysis of the
building (sufficient number of modes to capture at least 90% of the total
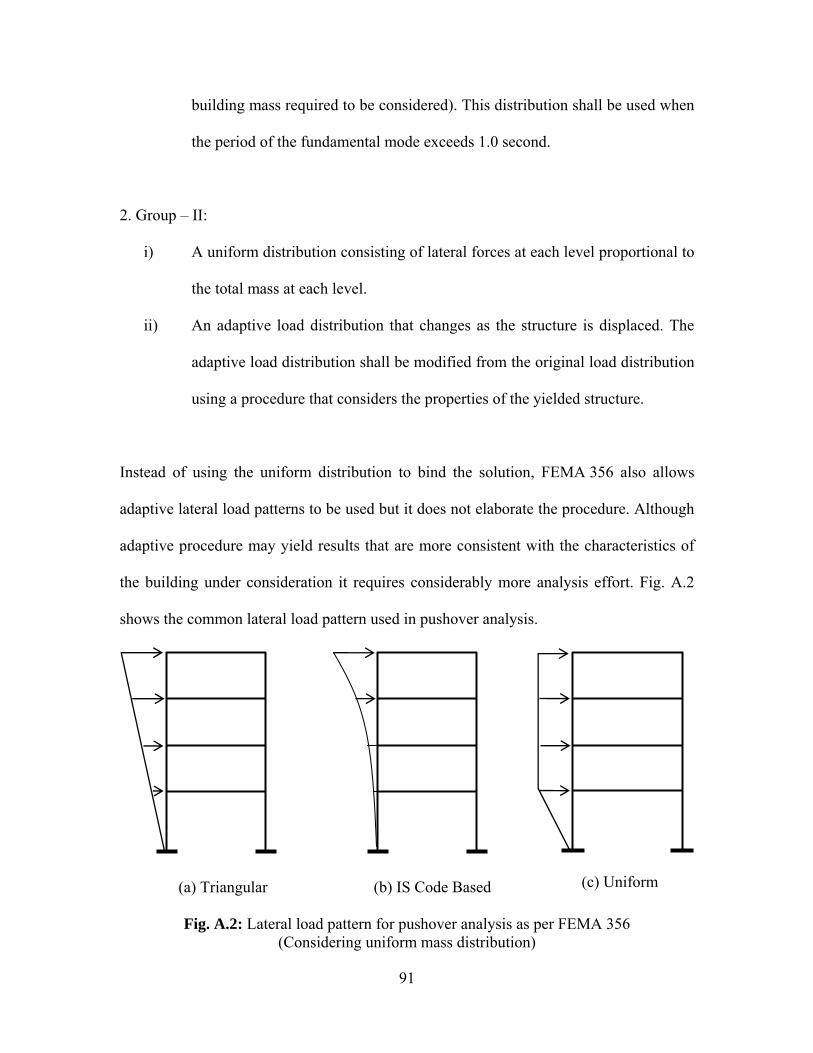
91
building mass required to be considered). This distribution shall be used when
the period of the fundamental mode exceeds 1.0 second.
2. Group – II:
i) A uniform distribution consisting of lateral forces at each level proportional to
the total mass at each level.
ii) An adaptive load distribution that changes as the structure is displaced. The
adaptive load distribution shall be modified from the original load distribution
using a procedure that considers the properties of the yielded structure.
Instead of using the uniform distribution to bind the solution, FEMA 356 also allows
adaptive lateral load patterns to be used but it does not elaborate the procedure. Although
adaptive procedure may yield results that are more consistent with the characteristics of
the building under consideration it requires considerably more analysis effort. Fig. A.2
shows the common lateral load pattern used in pushover analysis.
Fig. A.2: Lateral load pattern for pushover analysis as per FEMA 356 (Considering uniform mass distribution)
(a) Triangular (b) IS Code Based (c) Uniform
92
A.1.3 Target Displacement
Target displacement is the displacement demand for the building at the control node
subjected to the ground motion under consideration. This is a very important parameter in
pushover analysis because the global and component responses (forces and displacement)
of the building at the target displacement are compared with the desired performance
limit state to know the building performance. So the success of a pushover analysis
largely depends on the accuracy of target displacement. There are two approaches to
calculate target displacement:
(a) Displacement Coefficient Method (DCM) of FEMA 356 and
(b) Capacity Spectrum Method (CSM) of ATC 40.
Both of these approaches use pushover curve to calculate global displacement demand on
the building from the response of an equivalent single-degree-of-freedom (SDOF) system.
The only difference in these two methods is the technique used.
A.1.3.1 Displacement Coefficient Method (FEMA 356)
This method primarily estimates the elastic displacement of an equivalent SDOF system
assuming initial linear properties and damping for the ground motion excitation under
consideration. Then it estimates the total maximum inelastic displacement response for
the building at roof by multiplying with a set of displacement coefficients.
The process begins with the base shear versus roof displacement curve (pushover curve)
as shown in Fig. A.3a. An equivalent period (Teq) is generated from initial period (Ti) by
graphical procedure. This equivalent period represents the linear stiffness of the
equivalent SDOF system. The peak elastic spectral displacement corresponding to this
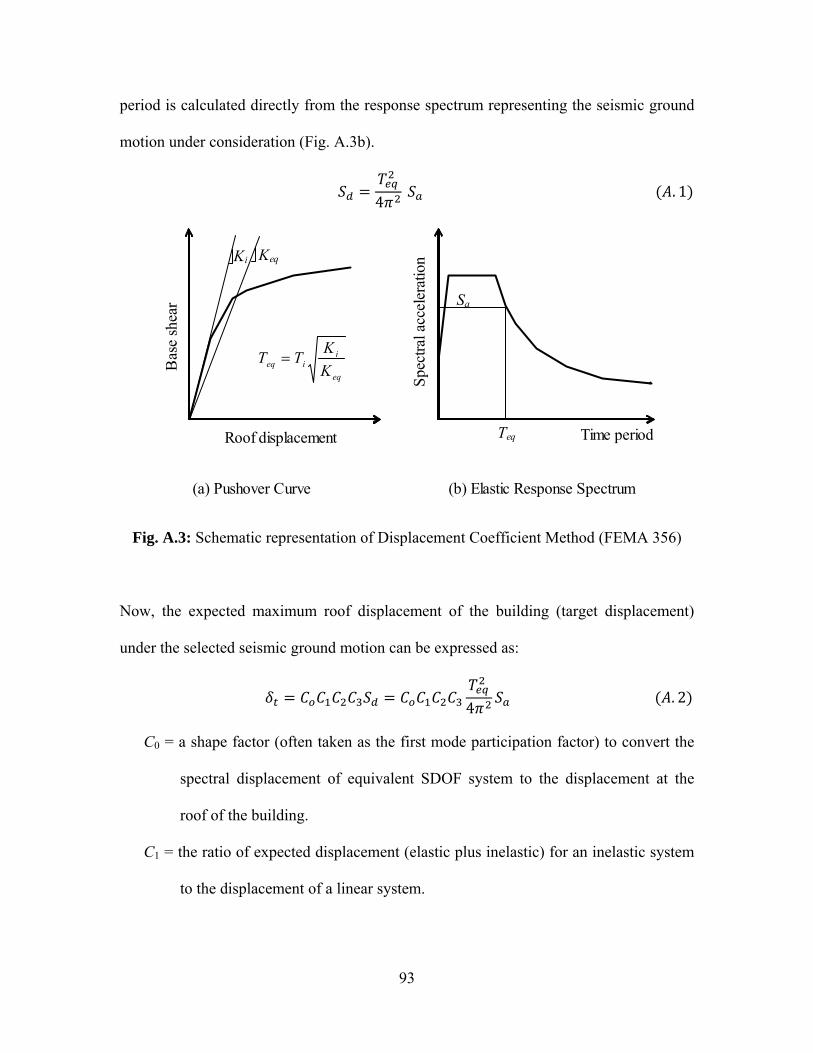
93
period is calculated directly from the response spectrum representing the seismic ground
motion under consideration (Fig. A.3b).
4 . 1
Roof displacement
Bas
e sh
ear
Teq
Sa
Time period Sp
ectra
l acc
eler
atio
n
(a) Pushover Curve (b) Elastic Response Spectrum
Keq Ki
eq
iieq K
KTT =
Fig. A.3: Schematic representation of Displacement Coefficient Method (FEMA 356)
Now, the expected maximum roof displacement of the building (target displacement)
under the selected seismic ground motion can be expressed as:
4 . 2
C0 = a shape factor (often taken as the first mode participation factor) to convert the
spectral displacement of equivalent SDOF system to the displacement at the
roof of the building.
C1 = the ratio of expected displacement (elastic plus inelastic) for an inelastic system
to the displacement of a linear system.
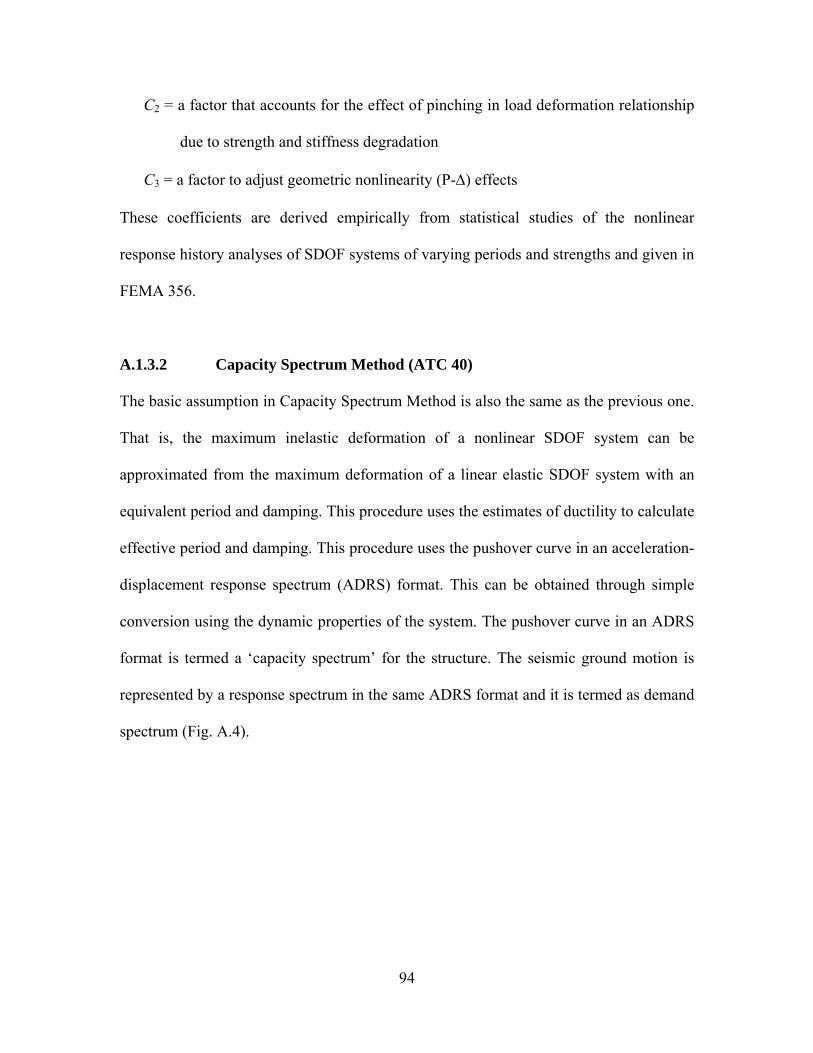
94
C2 = a factor that accounts for the effect of pinching in load deformation relationship
due to strength and stiffness degradation
C3 = a factor to adjust geometric nonlinearity (P-Δ) effects
These coefficients are derived empirically from statistical studies of the nonlinear
response history analyses of SDOF systems of varying periods and strengths and given in
FEMA 356.
A.1.3.2 Capacity Spectrum Method (ATC 40)
The basic assumption in Capacity Spectrum Method is also the same as the previous one.
That is, the maximum inelastic deformation of a nonlinear SDOF system can be
approximated from the maximum deformation of a linear elastic SDOF system with an
equivalent period and damping. This procedure uses the estimates of ductility to calculate
effective period and damping. This procedure uses the pushover curve in an acceleration-
displacement response spectrum (ADRS) format. This can be obtained through simple
conversion using the dynamic properties of the system. The pushover curve in an ADRS
format is termed a ‘capacity spectrum’ for the structure. The seismic ground motion is
represented by a response spectrum in the same ADRS format and it is termed as demand
spectrum (Fig. A.4).
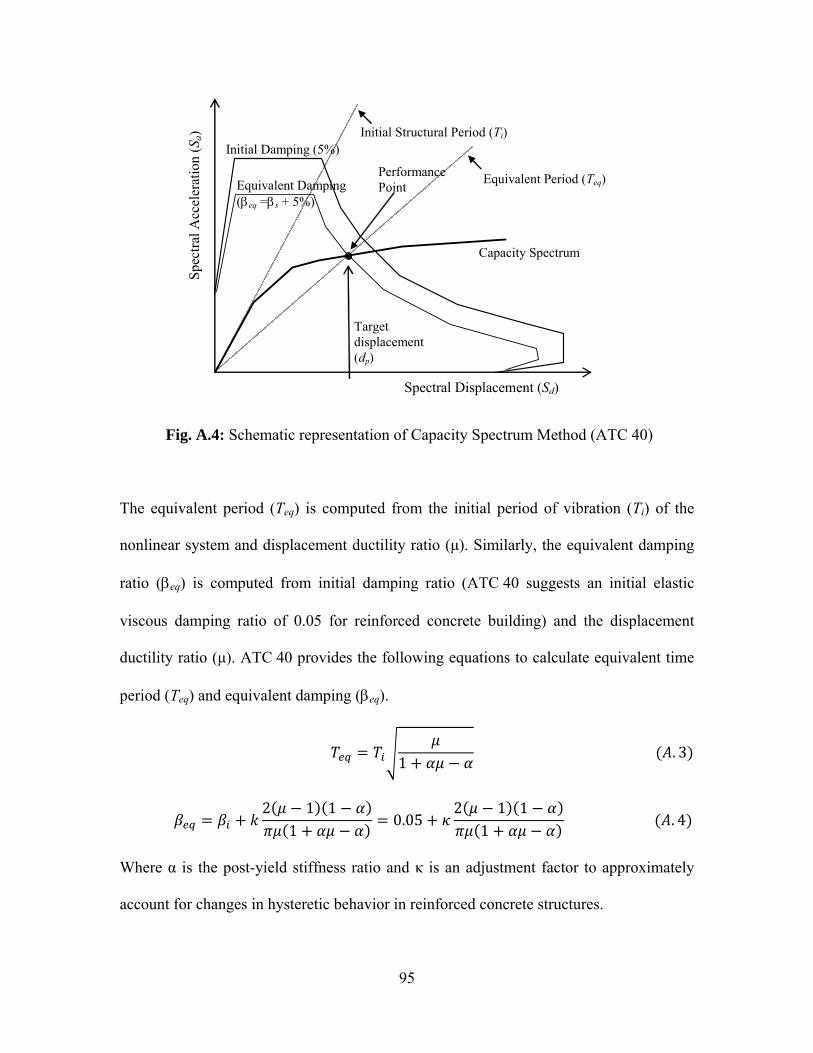
95
Capacity Spectrum
Initial Damping (5%)
Performance Point
Spectral Displacement (Sd)
Spec
tral A
ccel
erat
ion
(Sa)
Equivalent Damping (βeq =βs + 5%)
Initial Structural Period (Ti)
Equivalent Period (Teq)
Target displacement (dp)
Fig. A.4: Schematic representation of Capacity Spectrum Method (ATC 40)
The equivalent period (Teq) is computed from the initial period of vibration (Ti) of the
nonlinear system and displacement ductility ratio (μ). Similarly, the equivalent damping
ratio (βeq) is computed from initial damping ratio (ATC 40 suggests an initial elastic
viscous damping ratio of 0.05 for reinforced concrete building) and the displacement
ductility ratio (μ). ATC 40 provides the following equations to calculate equivalent time
period (Teq) and equivalent damping (βeq).
1 . 3
2 1 1
1 0.052 1 1
1 . 4
Where α is the post-yield stiffness ratio and κ is an adjustment factor to approximately
account for changes in hysteretic behavior in reinforced concrete structures.
96
ATC 40 relates effective damping to the hysteresis curve Fig. A.5 and proposes three
hysteretic behavior types that alter the equivalent damping level. Type A hysteretic
behavior is meant for new structures with reasonably full hysteretic loops, and the
corresponding equivalent damping ratios take the maximum values. Type C hysteretic
behavior represents severely degraded hysteretic loops, resulting in the smallest
equivalent damping ratios. Type B hysteretic behavior is an intermediate hysteretic
behavior between types A and C. The value of κ decreases for degrading systems
(hysteretic behavior types B and C).
Fig. A.5: Effective damping in Capacity Spectrum Method (ATC 40)
The equivalent period in Eq. A.3 is based on a lateral stiffness of the equivalent system
that is equal to the secant stiffness at the target displacement. This equation does not
depend on the degrading characteristics of the hysteretic behavior of the system. It only
Sd
S a
ED
ES
dp
ap
Teq βs = (1/4π) × (ED /ES)
97
depends on the displacement ductility ratio (μ) and the post-yield stiffness ratio (α) of the
inelastic system.
ATC 40 provides reduction factors to reduce spectral ordinates in the constant
acceleration region and constant velocity region as a function of the effective damping
ratio. The spectral reduction factors are given by:
3.21 0.68 100
2.2 . 5
2.31 0.41 100
1.65 . 6
Where SRA is the spectral reduction factor to be applied to the constant acceleration
region, and SRV is the spectral reduction factor to be applied to the constant velocity
region (descending branch) in the linear elastic spectrum.
Since the equivalent period and equivalent damping are both functions of the
displacement ductility ratio (Eqs. A.3 and A.4), it is required to have prior knowledge of
displacement ductility ratio. However, this is not known at the time of evaluating a
structure. Therefore, iteration is required to determine target displacement. ATC 40
describes three iterative procedures with different merits and demerits to reach the
solution.
98
REFERENCES
1. A. Kadid and A. Boumrkik, “Pushover analysis of reinforced concrete frame
structures”, Asian journal of civil engineering (building and housing) Vol. 9, No.1, pp.
75-83, 2008.
2. A.Ghaffar, A.Javed, H.Rehman, K.Ahmed and M hyas, “Development of shear
capacity equations for rectangular reinforced beams”, Park J Eng. & appl.Sci.Vol.6, pp.
3. ACI 318, Building Code Requirements for Reinforced Concrete, American Concrete
Institute, Detroit, Michigan, 2002.
4. Alexander Placas and Paul E. Regan and A.L.L Baker, "Shear failure of reinforced
concrete beams," ACI journal, title No.68-67, pp.763-773, October 1971.
5. Applied Technology Council (ATC-40), “Seismic evaluation and retrofit of concrete
buildings”, Vol.1& 2, California, 1996.
6. ASCE-ACI Task Committee 426, “The Shear Strength of Reinforced Concrete
Members,” ASCE Journal of Structural Div., Vol. 99, pp. 1091-1187, June 1973.
7. Bazant Z P and Kazemi M T, “Size effect on diagonal shear failure of beams without
stirrups”, ACI Structural Journal, 88(3), pp.268–276, 1991.
8. Bazant Z P and Sun H H, “Size effect in diagonal shear failure: influence of aggregate
size and stirrups”, ACI Materials Journal, 84(4) pp. 259–272, 1987.
9. Bazant, Z. P., Yu and Qiang, “Design Against Size Effect on Shear Strength of
Reinforced Concrete Beams without Stirrups”. Structural Engineering Report No.03-
02/A466s, Northwestern University, Evanston, Illions, 2003.
10. BS 8110-1, Structural use of concrete, Part 1: Code of Practice for Design and
Construction, British Standards Institution, London, 1997.
11. C.G.Karayannis, C.E.Chalioris and P.D.Mavroeidis, “Shear capacity of RC
rectangular beam with continuous spiral transverse reinforcement”, proceedings of
Twelfth International Conference on Computational Methods and Experimental
Measurements, Malta, pp.379-386, 2005.
12. Chaitanya Patwardhan (2005), “Shear strength and deformation modeling of reinforced
Concrete columns”, Department of Civil Engineering, Ohio State University, 2005.
99
13. Chopra A.K and Goel R.K, “A modal pushover analysis procedure to estimate seismic
demands for buildings: Theory and preliminary evaluation”, Report No PEER 2001/03,
Pacific Earthquake Engineering Research Center, University of California, Berkeley,
California, 2001.
14. Comité Euro-International du Béton, CEB-FIP Model Code 1990, Redwood Books,
Wiltshire, England, pp.437, 1993.
15. Dino Angelakos, “The influence of concrete strength and longitudinal reinforcement
ratio on the shear strength of large-size reinforced concrete bars with and without
transverse reinforcement” Department of Civil Engineering, University of Toronto, 1999.
16. F.F.Wafa, S.A.Ashour and G. S.Hasanian, “Experiment investigations on shear
behaviour of reinforced high strength concrete beam without shear reinforcement”, Vol.
7, p.91-113, 1994.
17. Federal Emergency Management Agency, FEMA-356, “Pre standard and commentary
for seismic rehabilitation of buildings”. Washington (DC), 2000.
18. G. Russo, G. Somma and P. Angeli, “Design Shear Strength Formula for High Strength
Concrete Beams”, Journal of Material and Structures, 10(37), pp. 1519–1527, 2004.
19. G.A.Rao and S.S.Injaganeri, “Evaluation of size dependent design shear strength of
reinforced concrete beams without web reinforcement”, Sadhana Vol.36, Part 3, pp.393-
410, 2011.
20. Gastebled, Olivier J. and May Lan M, “Fracture Mechanics Model Applied to Shear
Failure of Reinforced Concrete Beams without Stirrups”, ACI Structural Journal, pp.184-
190, 1998.
21. Gerin, M. and Adebar P., “Accounting for shear in seismic analysis of concrete
structures”, in Proceedings of the 13th World Conference on Earthquake Engineering,
paper 1747. Vancouver, B.C., Canada, Aug. 2004.
22. H.Sezen and E.J.Setzle, “Model for the lateral behaviour of reinforced concrete columns
including shear deformations earthquake spectra”, Vol. 24, No. 2, pages 493–511, May
2008.
23. IITM-SERC Manual, Manual on seismic evaluations and retrofitting of RC building
multi-storied RC building, March 2005.
24. Indian Standard (IS 456), “Plain and Reinforced Concrete – Code of Practice”, 4th
revision, Civil Engineering Division Council, India, 2000.
25. Kani G N J, “The basic facts concerning shear failure”, Proc. ACI Journal., 63(7), pp.
675–692, 1966.
100
26. Kim J K and Park Y D, “Shear strength of reinforced high strength concrete beams
without web reinforcement, Magazine of Concrete Research, 46(166), pp. 7–16, 1994.
27. Kim. W. and White R.N, “Initiations of shear cracking in reinforced concrete beam with
no web reinforcement.” ACI structural journal, 88(3), pp.301-308, 1991.
28. Kowalsky M.J., Priestley M.J.N., and Seible F., “Shear Behavior of Lightweight
Concrete Columns Under Seismic Conditions,” University of California, San
Diego,Structural Systems Research Project, Report No. SSRP-95/10, pp.216, July 1995.
29. Lynn, A. C., Moehle, J. P., Mahin, S. A., and Holmes, W. T., “Seismic evaluation of
existing reinforced concrete building columns.” Earthquake Spectra, 124_4_, pp. 715–
739, 1996.
30. M.Zakaria,T.Ueda, Z.Wu and L.Meng, “Experimental investigations to clarify shear
cracking behaviour of reinforced concrete beams with shear reinforcement”, Journal of
Advance Concrete Technology,Vol.7,No.1, pp.79-96, 2009.
31. Marumaya M. and Jirsa J.O., “ Shear Behavior of Reinforced Concrete Members
under Bidirectional Reversed Lateral Loading, “ CESRL Report No.78-1, University of
Texas,Austin,1979.
32. Mehmet Inel and Hayri Baytan Ozmen, “Effects of plastic hinge properties in
nonlinear analysis of reinforced concrete buildings”, Department of Civil Engineering,
Pamukkale University, 20070 Denizli, Turkey, 2006.
33. Moehle J.P. and Mahin S.A., “Observations of the Behavior of Reinforced Concrete
Buildings during Earthquakes,” ACI SP-127, Earthquake-Resistant Concrete Structures
Inelastic Response and Design, S.K. Ghosh, ed., American Concrete Institute, pp.67-89,
1991.
34. Ousalem H., Kabeyasawa T.A., and Tasai Y., “Axial Load Collapse of Reinforced
Concrete Columns Under Seismic Loading,” 13th World Conference on Earthquake
Engineering, pp.1233, Aug. 2004.
35. P.Paczkowski and A.S.Nowak, “Shear resistances of reinforced concrete beams without
web reinforcements”, Department of Civil Engineering, University of Nebraska, Lincoln,
ne 68588-0531,USA,2008.
36. Panagiotakos T.B. and Fardis M.N., “Deformations of Reinforced Concrete Members
at Yielding and Ultimate,” ACI Structural Journal, Vol. 98, 2, pp. 135-148, Mar-Apr.,
2001.
37. Priestley M.J.N., Verma R., and Xiao Y., “Seismic Shear Strength of Reinforced
Concrete Columns,” ASCE Journal of Structural Engineering, Vol. 120, pp. 2310-2329,
Aug 1994.
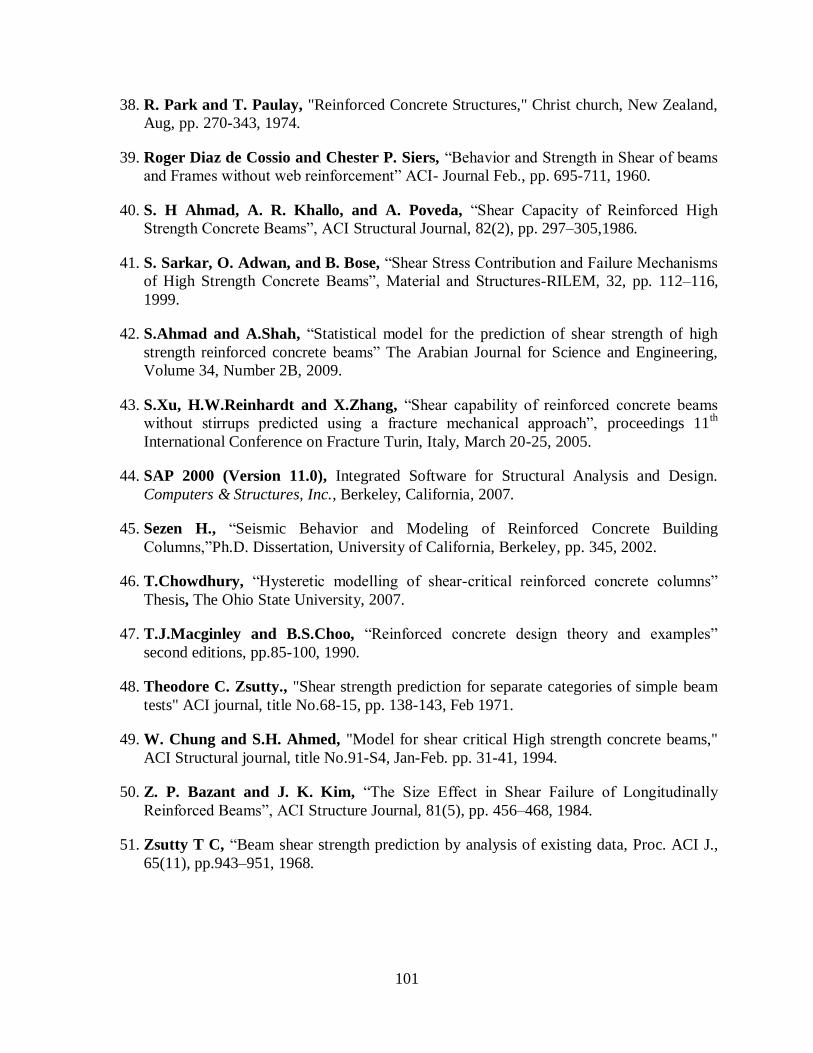
101
38. R. Park and T. Paulay, "Reinforced Concrete Structures," Christ church, New Zealand,
Aug, pp. 270-343, 1974.
39. Roger Diaz de Cossio and Chester P. Siers, “Behavior and Strength in Shear of beams
and Frames without web reinforcement” ACI- Journal Feb., pp. 695-711, 1960.
40. S. H Ahmad, A. R. Khallo, and A. Poveda, “Shear Capacity of Reinforced High
Strength Concrete Beams”, ACI Structural Journal, 82(2), pp. 297–305,1986.
41. S. Sarkar, O. Adwan, and B. Bose, “Shear Stress Contribution and Failure Mechanisms
of High Strength Concrete Beams”, Material and Structures-RILEM, 32, pp. 112–116,
1999.
42. S.Ahmad and A.Shah, “Statistical model for the prediction of shear strength of high
strength reinforced concrete beams” The Arabian Journal for Science and Engineering,
Volume 34, Number 2B, 2009.
43. S.Xu, H.W.Reinhardt and X.Zhang, “Shear capability of reinforced concrete beams
without stirrups predicted using a fracture mechanical approach”, proceedings 11th
International Conference on Fracture Turin, Italy, March 20-25, 2005.
44. SAP 2000 (Version 11.0), Integrated Software for Structural Analysis and Design.
Computers & Structures, Inc., Berkeley, California, 2007.
45. Sezen H., “Seismic Behavior and Modeling of Reinforced Concrete Building
Columns,”Ph.D. Dissertation, University of California, Berkeley, pp. 345, 2002.
46. T.Chowdhury, “Hysteretic modelling of shear-critical reinforced concrete columns”
Thesis, The Ohio State University, 2007.
47. T.J.Macginley and B.S.Choo, “Reinforced concrete design theory and examples”
second editions, pp.85-100, 1990.
48. Theodore C. Zsutty., "Shear strength prediction for separate categories of simple beam
tests" ACI journal, title No.68-15, pp. 138-143, Feb 1971.
49. W. Chung and S.H. Ahmed, "Model for shear critical High strength concrete beams,"
ACI Structural journal, title No.91-S4, Jan-Feb. pp. 31-41, 1994.
50. Z. P. Bazant and J. K. Kim, “The Size Effect in Shear Failure of Longitudinally
Reinforced Beams”, ACI Structure Journal, 81(5), pp. 456–468, 1984.
51. Zsutty T C, “Beam shear strength prediction by analysis of existing data, Proc. ACI J.,
65(11), pp.943–951, 1968.