seeds of success - bse
TRANSCRIPT

Annual Report 2017-18
Seeds of Success

www.trivenigroup.com
Visit
for more details on the Company
Forward-looking statement
This report contains forward-looking statements,
which may be identified by their use of words
like ‘plans’, ‘expects’, ‘will’, ‘anticipates’, ‘believes’,
‘intends’, ‘projects’, ‘estimates’ or other words
of similar meaning. All statements that address
expectations of projections about the future,
including but not limited to statements about
the Company’s strategy for growth, product
development, market position, expenditures and
financial results, are forward-looking statements.
Forward-looking statements are based on certain
assumptions and expectations of future events.
The Company cannot guarantee that these
assumptions and expectations are accurate or
will be realised. The Company’s actual results,
performance or achievements could thus differ
materially from those projected in any such
forward-looking statements. The Company
assumes no responsibility to publicly amend,
modify or revise any forward-looking statements,
on the basis of any subsequent developments,
information or events. The Company has sourced
the industry information from the publicly
available resources and has not verified those
information independently.
CONTENTCORPORATE OVERVIEW
Seeding Success 02
Engineering Success 04
Business Profile 06
MANAGEMENT STATEMENTS
Message from the Chairman 18
Q&A with the Vice Chairman and
Managing Director20
STATUTORY REPORTS
Management Discussion and
Analysis24
Financial Review 46
Risk Management and Mitigation 50
Directors’ Report 53
Corporate Governance Report 62
Business Responsibility Report 82
FINANCIAL STATEMENTS
Standalone Financials 102
Consolidated Financials 183

At Triveni Engineering & Industries Ltd. (Triveni), we measure success not just by a yardstick of numbers, but also by the development of intrinsic strengths that steer our growth strategy. It is our belief that the roots of success are nurtured as much by the seeds sown, as by the external environment in which they flourish.
Led by this belief, we have consistently augmented our
core capabilities to drive better-than-industry performance
in our Sugar Business, while concurrently strengthening
our Engineering platform, to boost profitability and deliver
world-class solutions.
The quality of the seeds of our success are manifest in
the superior varieties of sugarcane which we are able to
procure through hard work in the fields in partnership with
our farmers, and also in the record production of sugar
in our ultra-modern facilities equipped with the best-in-
class machines. It is also evident in the buoyancy in the
Engineering business, where the opportunity landscape
provides an excellent lever for the Company’s growth in
both the Gears and the Water segments.
Triveni is one of India’s largest integrated sugar manufacturers and a market leader in its Engineering businesses, encompassing high-speed gears, gearboxes, and water and wastewater treatment solutions.

Seeding SuccessThe Cane Development Programme, nurtured by our strong farmer relations, remains the seed of our success strategy in the Sugar business.
1,84,305 HectaresArea under sugarcane production
8.37 million tonnesSugarcane crushed
9,52,100 tonnesSugar produced
11.38%Recovery
7,61,276 tonnesSugar Despatches
Increased sugarcane crushing at 8.37
million tonnes in Sugar Season (SS)
2017-18, against 6.40 million tonnes
in the previous sugar season, followed
by a spurt in recovery to 11.38%,
led to record sugar production. A
lower finance cost, secured through
judicious deployment of internal
accruals, further boosted excellence in
operational performance and helped in
payback of debt.
With the Government intervening to
take a series of initiatives to balance
the supply-demand pressures and
stabilise prices, encouraging and
promoting ethanol blending through
a friendly policy, the industry macro
ROOTED IN OPPORTUNITY
We have worked relentlessly to
partner with cane farmers to
improve cane quality and farm level
productivity. The offshoots of our
efforts are visible in the phenomenal
growth in our Sugar business, which
posted record highs on its operational
matrices during the year. The strategic
roadmap of our Sugar business,
which carries on it the stamp of
our visionary focus and detailed
implementation approach, has been
crafted to harness the emerging
opportunities along the entire value
chain of operations – from Sugar
production to Co-generation of power
and Distillation.
P. 02

environment appears to be positive.
With our lower-than-average industry
production costs giving us a strong
competitive advantage, we are well
positioned to capitalise on the positivity
in the sector.
NURTURING GROWTH
The seeds of success in our Sugar
business have also emerged as
powerful nurturers of growth in
our Co-generation and Distillery
businesses. Steered by improved
operating efficiencies, our Co-generation
plants reported excellent operations,
leading to increase in year-on-year
profitability.
On the Distillery business, the
operations were impacted due to
unscheduled closure for over a
month, and supplies deferred due to
late finalisation of ethanol tenders.
Barring the aforesaid, the operations
were satisfactory and these would be
further benefited on account of low raw
material (molasses) prices due to a glut.
The prospects for the future, in view
of Government policies to encourage
ethanol blending, appear to be quite
encouraging, and we see our intrinsic
strengths and strategic approach
propelling growth in our Distillery
business.
P. 03
Annual Report 2017-18
02-17 | Co
rpo
rate Overview
24-101 | Statuto
ry Rep
orts
18-23 | Man
agem
ent Statem
ents
102-266 | Finan
cial Statemen
ts

GEARED FOR GROWTH
With a positive enquiry pipeline
materialising into strong order
booking, our Gears business has
registered robust growth in terms of
turnover and profitability. Turnover
from OEMs in both domestic
and international markets has
risen substantially, endorsing the
strength of our business model and
underscoring our capabilities in
the field.
The overall stability in the market,
coupled with positive signs of growth
in some of our key sectors, has
boosted the visibility for the Gears
business. This helped us sow the
seeds of higher growth all through
FY 18, and for well beyond, when our
current orders become executable.
Our entry into the Defence sector,
where we have strategically forayed
on the strength of our expertise and
experience, is, in particular, offering
significant opportunities for growth.
We have enhanced our focus on this
and other sectors which are showing
greater demand potential.
As new products and geographies are
getting added to our portfolio, offering
potential growth opportunities, the
Gears business is set to achieve higher
growth in the coming years.
Engineering Success
C 187.8 CroreOrder booking
74% Increased Profitability
Our enhanced focus on sectors showing greater demand potential along with inherent strength of our business model, is driving the growth of our Engineering Businesses.
P. 04

READY FOR GERMINATION
The Water segment offers encouraging
prospects for growth, which we are
capable of harnessing with the strength
of our technology, project management
skill, strategic thinking and experience.
We believe that there is enormous
business potential in the Water
Business, but somehow the prospects
did not materialise due to subdued
business conditions, demonetisation and
transition to GST. The performance of the
business during the year was impacted
due to lower than optimal turnover,
slow project execution due to reasons
attributable to our clients, cost overruns
due to delays and resultant provisioning.
We, however, witnessed a perceptible
change towards the end of the year
when traction in order finalisation was
clearly visible. We earnestly believe
that, with our competitiveness, we will
be able to secure adequate orders to
put our Water business on the growth
trajectory.
With our inherent strengths to
drive our business strategy, we find
ourselves well placed to secure
some large municipal orders
in the coming quarters. We are
also focused on leveraging our
existing relationships, especially
our engineering relationships with
industrial sectors, to get more business.
Increased Government spending on
infrastructure development is also
opening up humungous opportunities
in large projects especially in sewage
treatment, which we are well prepared
to harness.
P. 05
Annual Report 2017-18
02-17 | Co
rpo
rate Overview
24-101 | Statuto
ry Rep
orts
18-23 | Man
agem
ent Statem
ents
102-266 | Finan
cial Statemen
ts

Business Profile
Integrated.
Sustainable.
Quality Product.
Sugar
Triveni is one of the
largest integrated
sugar manufacturers in
India, with seven sugar
mills strategically
located across the
western, central and
eastern parts of the
sugarcane rich areas
of Uttar Pradesh
(U.P.) - India’s largest
sugarcane producing
state. Integrated
production concept
ensures that almost
all the raw material
is converted into high
quality products.
P. 06

INTEGRATED OPERATIONS
Our Khatauli, Deoband and Sabitgarh
units are in Western UP, while Rani
Nangal, Chandanpur and Milak
Narayanpur units are in central UP,
and the Ramkola unit is in Eastern
UP. Integrated with co-generation
and distillery businesses, our sugar
operations are optimised for value
addition. Two of our facilities, Khatauli
and Sabitgarh, produce refined sugar,
which accounts for almost 40% of
total sugar production, while the
other five units manufacture white
sulphitation sugar. The Sabitgarh
unit also produces different grades
of Pharmaceutical sugar that can
be customised as per customer’s
requirements. Triveni presently
operates grid-connected three co-
generation plants, and three incidental
co-generation plants located across
five sugar units which facilitate the
export of surplus power to Uttar
Pradesh Power Corporation Limited
(UPPCL). We have one of the largest
and most efficient single stream
molasses-based distillery in the
country, located at Muzaffarnagar,
which operates on captive feedstock
from our sugar units.
REACH
Across
14 states
PBIT
` 241.2 Crore
BUSINESS
Integrated
sugar
manufacturing
LOCATION
7 Sugar units in
Uttar Pradesh;
three co-
generation and
three incidental
co-generation
units; one
standalone
distillery
PRODUCT VARIETY
Sugar: Multi grade -
Large, Medium and
Small crystal - Sugar,
Refined Sugar, Pharma-
grade Sugar
Co-generation: Power
export to UPPCL
Distillery: Flexi product
manufacturing -
Ethanol, ENA, RS, SDS
REVENUE
` 3,330.7 Crore
P. 07
Annual Report 2017-18
02-17 | Co
rpo
rate Overview
24-101 | Statuto
ry Rep
orts
18-23 | Man
agem
ent Statem
ents
102-266 | Finan
cial Statemen
ts

HIGH QUALITY PRODUCTS
Sugar:
We produce premium quality multi-
grade plantation white, refined
and pharmaceutical sugar. Our
Sugar units are FSSC-2000:2010
certified. Our sugar is supplied not
only to household consumers but
also to bulk consumers. We have
supply chain relationships with
leading multinational beverage
companies, food & FMCG companies,
pharmaceutical companies and
leading confectionery producers.
We also have a strong presence in
branded sugar market through our
brand “Shagun”.
Distillery-based products:
The distillery has a flexible
manufacturing process, allowing it
to produce Ethanol, Extra Neutral
Alcohol (ENA), Rectified Spirit (RS)
and Specially Denatured Spirit (SDS),
all of which are renowned for
high quality.
Power Export:
Triveni currently operates 104.5
MW grid connected co-generation
capacity. The Company’s Sabitgarh
unit is registered as Renewable
Energy Certificate (REC) project
under CERC.
COMPETITIVE EDGE
Geographic advantage due to natural
favourable conditions –
The Sugar Units are spread over
western, central and eastern parts
of Uttar Pradesh. The land is highly
fertile and well irrigated, and is fit
for sugarcane cultivation
Besides the sugarcane catchment
areas, all sugar units of the
Company are under canal irrigation,
both in western and central UP,
leading to reduced dependency on
the monsoon
P. 08

Mills located near major
consumption centres –
The strategic vicinity of the units
to the country’s major sugar
consuming markets ensures
better realisation prices through
lower transportation costs and the
possibility of greater off-take
Our units produce an optimal blend
of different qualities and sizes of
sugar
Cane Development & Research –
We remain continuously focused
on increasing the farm level
productivity by working with
farmers on implementing the latest
agro-techniques for sustainable
farming
We are working with scientists and
research institutes for propagation
and adoption of the new high
sugared and high-yielding varieties
of sugarcane
We are engaged in carrying out soil
analysis at soil testing labs and
preparing soil maps to ascertain
deficiency in nutrients, if any, and
implementing a plan to restore
such nutrients in partnership with
farmers. Soil health cards are
given to the farmers, to explain
the concept of soil health and
recommend an action plan to
restore soil health
We encourage farmers to
implement better and scientific
techniques using modern
agri-tools, which helps in yield
enhancement and generation of
additional income, besides helping
in sustenance of soil health
DIVERSE MARKETS
14 Sugar, Power and Ethanol producing units
2,50,000+ Associated farmers
1,84,000+ Hectares of area under sugarcane cultivation
~ 40% Of the sugar produced is Refined sugar
66% Power is exported to grid
94% Ethanol sales in distillery product mix
Madhya PradeshGujarat
Rajasthan
Chhattisgarh
JharkhandWest Bengal
Assam
Sikkim
Bihar
Uttar Pradesh
Jammu & Kashmir
Himachal Pradesh
Uttarakhand
Delhi
Haryana
Punjab
Dadar & Nagar Haveli
States
P. 09
Annual Report 2017-18
02-17 | Co
rpo
rate Overview
24-101 | Statuto
ry Rep
orts
18-23 | Man
agem
ent Statem
ents
102-266 | Finan
cial Statemen
ts

Excellence.
Expertise.
Technology.
Gears
Driven by quality,
innovation and flexibility,
Triveni Gears has been
delivering customised
solutions for industrial
gearboxes for the past
four decades. Started
in 1976, with the
objective of fulfilling
the Company’s captive
demand for high-speed
gears, the business has
become a dominant
supplier to all major
OEMs in the country,
offering solutions to
all industrial segments
including Oil and Gas
as per AGMA, API-613
and API-677 standards.
We remain the market
leader in high-speed
Gears and Gearboxes up
to 70 MW capacity and
speed of 70,000 rpm.
Business Profile
P. 10

ADVANCED PRODUCTS
Triveni delivers robust and reliable
Gears solutions covering a wide
range of applications and industries,
to meet the ever-changing
operating conditions and customer
requirements. The major product
portfolio includes steam turbine,
gas turbine, and compressor
gearboxes under the High Power
High-Speed segment. In the
Low-Speed segment, the Company
focusses on the gearboxes used in
applications such as reciprocating
pumps and compressors, hydel
turbines, mill and extruder drives
for metal, sugar, rubber and plastic
industries, marine applications,
etc. All the products are designed,
manufactured and commissioned in
accordance with international quality
norms such as DIN/ AGMA/ API/ ISO
standards and as a result, Triveni
gearboxes are synonymous with
delivering maximum performance
with minimum downtime.
REACH
More than
60% supplies
to South East
Asia, market
leader in India
PBIT
` 31.4 Crore
BUSINESS
Largest
engineered-
to-order
turbo gearbox
manufacturer in
India
LOCATION
10.5 Acres
world-class
manufacturing
facility in
Mysuru,
Karnataka
PRODUCT
VARIETY
High Power and
High-Speed,
Low-Speed and
Specialised
Applications
REVENUE
` 111.8 Crore
P. 11
Annual Report 2017-18
02-17 | Co
rpo
rate Overview
24-101 | Statuto
ry Rep
orts
18-23 | Man
agem
ent Statem
ents
102-266 | Finan
cial Statemen
ts

MANUFACTURING EXPERTISE
The state-of-the-art plant, equipped
with the latest technology for
manufacturing and assembly, helps
our highly experienced team to
deliver internationally benchmarked
products at highly competitive
costs, leading to a reduced cost of
ownership and lower life cycle costs
for customers. Using the latest
software design tools, our dedicated
team of engineers designs products
based on complex and time-bound
customer requirements.
Infrastructure
Fully integrated facility with
in-house core processes up to
2 metre dia and in-house heat
treatment facility
Latest profile grinding, hobbing,
horizontal and vertical grinding,
horizontal boring machines,
plano-milling machines and
vertical machining centres
World-Class Quality Assurance
infrastructure with in-house
Metallurgical Lab
Testing and assembly bay with
multiple workstations and three test
benches to test Gearboxes up to
90 MW capacity
Adhering to highest quality standards
- ISO 9001–2015, ISO 14001–2004,
OHSAS 18001:2007, CE Certified
Multi-modal bay for flexible
manufacturing
OPTIMISED SUPPLY CHAIN
Our ability to provide optimised solutions
with quick delivery comes from our
efficient and robust supply chain. All the
supply chain partners are governed by
a strict code of conduct, with emphasis
on cost control, quality, timely delivery,
consistency and transparency.
Fully integrated
plant with all critical
operations in-house
with state-of-the-art
infrastructure
Preferred partner
to all Domestic and
Multinational OEMs
Strong presence in
Replacement markets
Leading Turbo Gears
company in India and SE
Asia, market share of
>80% in the High-Speed
segment
Benchmarked
to global quality
practices and 5S
principles
World-class
technology
ISO 9001-2015OHSAS
18001:2007ISO 14001-2004
CE selfcertification
status
P. 12

DESIGN & DEVELOPMENT
Our continuous focus on value engineering helps to deliver products designed to meet customer requirements for economical installation and operation.
Holistic R&D Model
Enhancing performance by deploying latest design tools and software
Superior Designs
Maximising efficiency and reliability by upgrading product designs
Cost Efficiencies
Retrofit and refurbishment of older generation equipment to make them more cost-efficient
Total Customer SatisfactionDelivering more to the customer - help them to achieve unhindered performance at lower cost
Leading Edge Technology
05
Mexico
USA
Jamaica
Brazil
Columbia
Belize
GuatemalaVenezuela
GuyanaEI Salvador
Costa Rica
Nicaragua
Iceland
United Kingdom
France
Spain
NigeriaGhana
Congo
South Africa
ZambiaMalawi
Tanzania
Kenya
Ethiopia
Mauritius
Oman
Saudi Arabia
Egypt
Bosnia
Italy
Germany
SwedenFinland
Turkey
Russia
RomaniaUzbekistan
UAE ChinaPakistanNepal Bangladesh
Myanmar
Fiji
Indonesia
Srilanka
Singapore
Malaysia
Thailand Philippines
Papua New Guinea
VietnamLaos
North Korea
Japan
South Korea
TRIVENI GEARBOX INSTALLATIONS
Country
360-DEGREE SERVICE
SOLUTIONS
Our robust and reliable products
are backed by 360-degree service
solutions, which minimise the
downtime for our customers. We
provide health monitoring services
for all types of critical gearboxes,
high-speed and low-speed, and also
maintain an inventory of dimension-
ready sites for immediate solution.
Our highly trained field service
specialists provide lifetime support
and strive to help our customers in
avoiding expensive downtime. Our
repair and retrofitting solutions are
offered across applications – all
Industrial, Oil and Gas covering
High-speed to Low-speed,
API and Non-API. Our service
offerings and solutions include
emergency breakdown support
like repair or rush delivery of parts,
diagnostics and troubleshooting
support, reverse engineering and
dimensioning expertise at site
or in-house with Design and QA
engineers, drop-in replacements
of gearbox and gear internals,
replacements/development of
spare white metal bearings, etc.
India
P. 13
Annual Report 2017-18
02-17 | Co
rpo
rate Overview
24-101 | Statuto
ry Rep
orts
18-23 | Man
agem
ent Statem
ents
102-266 | Finan
cial Statemen
ts

Efficient,
Sustainable
and Complete
Water Treatment
Solutions.
Water
For over three decades, we have helped our customers overcome complex challenges related to water management, water scarcity and water quality. Triveni Water offers efficient total water management and sustainable solutions for treatment across the water cycle.
Business Profile
P. 14

Advanced Solutions offered for total
water management:
Turnkey / EPC (Engineering
Procurement Construction)
Customer Care, Operations and
Maintenance
Life cycle models – Design, Build
Own & Operate (DBOO), Design,
Build Own Operate and Transfer
(DBOOT), BOOT
Equipment supply for unit
processes like screening, grit
separation, clarification and sludge
handling
WATER TREATMENT
Declining water availability,
deteriorating water quality and
growing environmental concerns are
constantly challenging the economics
of water treatment processes. In
order to ensure water sustainability
for industrial consumption, it is
essential for companies to invest
in technologically advanced water
treatment processes. We provide
efficient and cost-effective solutions
to help our customers meet the
growing demand for water across
a large cross section of industries
and municipalities. We provide such
solutions using the latest technologies
and processes, with a strong focus on
design and engineering.
REACH
Pan-India
PBIT
` (13.9) Crore
BUSINESS
Leading solution
providers for
water treatment,
wastewater
treatment and
recycle of water
LOCATION
Noida, UP
PRODUCT
VARIETY
Total water
management
solutions
REVENUE
` 175.7 Crore
P. 15
Annual Report 2017-18
02-17 | Co
rpo
rate Overview
24-101 | Statuto
ry Rep
orts
18-23 | Man
agem
ent Statem
ents
102-266 | Finan
cial Statemen
ts

The largest source of surface
and ground water pollution in
India is untreated sewage. A
large number of Indian rivers
are severely polluted as a result
of discharge of industrial and
domestic sewage. With increasing
environmental concerns and
legislations, wastewater treatment
is a mandate to continually improve
the discharge standards and lower
the environmental hazards. Triveni
Water offers sustainable solutions for
effluent treatment, common effluent
treatment and sewage treatment, which
comprises physical, chemical and
biological treatment based on advanced
technologies. With over a hundred
successfully operating installations,
our designs offer highly economical
plant installation and operation, lowest
footprint area, minimal waste generation,
and treatment of water to the specified
standards.
WASTEWATER AND SEWAGE TREATMENT
P. 16

Over 1,000 successfully
operating installations
across various
segments –
infrastructure,
industrial and
municipal -
across India
Technology
associations with
the world’s leading
technology providers
for various products,
processes and
solutions.
Approx. 8,000 MLD
of water is treated
through our projects
and equipment.
Received several
Water Awards for
innovative project
designs.
RECYCLE AND REUSE OF
WASTEWATER
Water scarcity, and increasing costs
of water and its treatment have made
recycle and reuse of wastewater a
necessity. We have designed, supplied
and installed a large number of
successfully operating recycle plants
in India. We offer a wide range of
technologies to provide complete
solutions for recycle, reuse and Zero
Liquid Discharge (ZLD).
We offer the widest range of process
equipment, such as:
Screening
Grit Separation
Clarification and Thickening
Aeration Systems
Anaerobic Digestion Systems
Bio Gas Handling Systems
Solid - Liquid Filtration Systems
Oil - Water Separation Systems
CUSTOMER CARE, OPERATIONS
AND MAINTENANCE
Our Customer Care Division offers
value-added services for operational
management and performance
optimisation. The following quality
service offerings are tailored to
customers’ requirements, which in
many cases form an integral part of the
main contract:
Operations and maintenance
Annual maintenance contracts
Product and process audit, health
check-up and overhauling
Pilot experiments
Refurbishment, upgradation and
automation of existing plants
Spares and service consumables and
chemicals
On-site training and assistance
P. 17
Annual Report 2017-18
02-17 | Co
rpo
rate Overview
24-101 | Statuto
ry Rep
orts
18-23 | Man
agem
ent Statem
ents
102-266 | Finan
cial Statemen
ts

Message from the Chairman
Dear Shareholders,
Transitioning a challenging macro
environment to nurture the seeds
of success needs a powerful focus
on building strengths and driving
efficiencies. At Triveni, we are
continuously sharpening this focus
to drive excellence in performance
by harnessing the opportunities of
tomorrow.
The performance of our Sugar business
stands testimony to the success of
this strategic agenda of the Company.
With a record sugarcane crush and
sugar production, FY 18 turned out
to be another remarkable year of
excellent performance in this segment.
The demand-pricing dynamics in
the industry did impact the financial
performance of the business, but with
our sugar units performing better than
the industry, the Company achieved
record crushing, production and
recovery during the year. The positive
Sugar business operating performance
further translated into good
performance for our Co-generation
plants. Though our Distillery was
closed for over a month in the first
half of the fiscal, causing the segment
performance to be impacted, we are
extremely positive about this business
and have decided to go in for expansion
of our distillery capacity.
Our Engineering business has also
shown encouraging performance, with
Triveni Gears reporting higher growth
in bookings, turnover and profitability,
and order position. Though a subdued
market environment impacted our
Water business, the growth prospects in
the coming quarters appear to be quite
positive, with our innovative solutions
for efficient water management and
effluent treatment finding a strong
demand in the evolving market.
SUGAR BUSINESS
Amid a volatile pricing environment,
India reported record sugar production
during SS 2017-18. The peculiarity of
the industry is indicated by the fact that
over a period of one year, the production
has increased by as much as 60%.
Though surplus production in the global
market as well as domestic market
threatened to derail the domestic sugar
industry, timely strategic initiatives
by the Government of India, to a great
extent, ensured that the situation did not
escalate out of control.
It is good to see the Central Government
taking note of the problems facing the
industry and taking several measures
to address the same, including export
of 2 million tonnes of sugar under the
Overall, while the Sugar operations
may be impacted by the surplus
availability of sugar in the country, we
would be helped by strong operating
performance in sugar operations and
much improved performance of Sugar
co-products and Engineering business.
With respect to the Engineering
business, the market sentiment
appears to be on a positive growth
trend, with your Company being
well equipped to capture the new
opportunities of growth on the strength
of its robust fundamentals and growing
capabilities. The seeds of success have
already been sown and it only remains
for us to rear them to their maximum
potential, so that we can reap the fruits
of our efforts more effectively in the
months and years to come.
P. 18

Scheme of Minimum Indicative Export
Quantities (MIEQ), cane payment subsidy
of ` 55/ MT, reverse stock limits in
February and March 2018 etc. As a
long-term solution, the Government
has announced a new Bio-fuel
Policy which permits alternate raw
material, including sugarcane juice /
B-heavy molasses, to be used for the
production of Ethanol. It is certainly a
good step to be able to regulate sugar
production, whenever required, to step
up production of ethanol but it can
only be successful if the pricing issues
are also addressed and incentives
are provided for setting up more
distillation capacities. Most importantly,
more proactive Government reforms
are required to address the pricing
imbalance between raw material
(sugarcane) and the product (sugar), if
the sugar industry is to be brought out
of the current conundrum in which it
finds itself due to the existing lopsided
regulation and pricing structure.
As far as our integrated sugar
operations are concerned, we are
quite encouraged by the Government
of India’s initiatives to boost Ethanol
blending and intend to increase
distillation capacities, which should be
operational in the next fiscal. High level
of integration and flexibility to produce
optimal mix of final products should
contribute significantly and largely
de-risk the Company against cyclical
downturn in the Sugar business.
At Triveni, we remain poised to seize
the opportunities that we expect
to be unleashed as a result of the
Government’s strategic initiatives and
interventions across the integrated
value chain of the business. Our focus
on strengthening cost and operational
efficiencies, nurturing our cane
development programme, diversifying
the product specifications such as
refined sugar, pharma-grade sugar etc.,
and building the capabilities needed
to tackle the myriad challenges faced
by the industry will, in my opinion,
continue to keep us firmly on the track
of progress.
ENGINEERING BUSINESS
A perceptible positivity in the user
industry sentiment, propelled by
improved sentiments and capital
infusions in the relevant industrial
segments, has raised hopes for
revival in the Gears market. With our
specialised focus on all high-speed and
niche low-speed gears in the high-
growth sectors of opportunity, we have
seen a remarkable growth in turnover
and order bookings during the year.
Steering our growth in the Gears
business is our strategic focus on
fast-growing sectors, such as Oil & Gas,
Fertiliser, Mini Hydel, and Defence, as
well as our decision to diversify into
Wind gear components to utilise our
excess capacity. Our long-term multi-
year agreement with a global OEM for
Wind gear components is a significant
development which we see translating
into a stable growth-led performance
for your Company in the long-term.
The replacement market, especially
in South and South East Asia, Middle
East and Africa, has also emerged as a
key area of our growth and expansion
focus.
The opportunity matrix catalysed by
the Central Government’s ‘Make in
India’ thrust is further opening up
new areas of potential growth in the
diverse engineered products segment,
which we are aggressively targeting as
part of our focussed strategic agenda.
Your Company is further exploring
opportunities for utilisation of its
existing infrastructure for customised
manufacturing and solutions, with
Marine Defence engineered products
emerging as an important target
segment for the Company.
In the Water segment, during the
period of slowdown, we have taken
the opportunity to restructure our
operations for more productivity
and efficiencies, sharpen our project
management skills, and achieve
commercial closure of virtually all the
old jobs. It has paved the way for a
more focussed business development
approach and use of our resources
on revenue earning activities, which
promises greater visibility for our
Water and Wastewater management
business in the coming year. With
Namami Gange and other large
projects that are in the offing, we are
optimistic about our Water business
witnessing strong performance in the
coming years.
ON A CONCLUDING NOTE
We are confident that our inherent
resilience, coupled with our strategic
thrust on fostering greater efficiencies
across our systems and processes,
will continue to enable your Company
to chart the path of growth even more
aggressively, going forward.
On this positive note, let me thank all
our stakeholders for their unwavering
support and trust in the Company.
Your invaluable cooperation remains
our motivational strength, as we get
ready to chart new frontiers of growth.
With best regards,
Dhruv M. Sawhney
Chairman & Managing Director
P. 19
Annual Report 2017-18
02-17 | Co
rpo
rate Overview
24-101 | Statuto
ry Rep
orts
18-23 | Man
agem
ent Statem
ents
102-266 | Finan
cial Statemen
ts

How do you rate your Company’s
performance during FY 18,
given the industry and market
environment?
It has been a satisfying year
from operational performance
perspective, given the tremendous
efforts that have been put in
by the Management team. This
performance is not well reflected in
the financial results in view of the
softening in sugar prices towards
the year end due to a record all India
sugar production. The profitability of
the business was nevertheless high
though lower than our forecasts. Our
robust operating performance will
see us through challenging business
conditions in our Sugar segment in
the coming year.
Our continued focus on cane
development has helped us attain
record crush, recoveries and sugar
production. We have been able to
achieve 35% higher production over
Sugar Season (SS) 2016-17 and 95%
over SS 2015-16, without incurring
any major capital expenditure to
increase our capacities. The most
satisfying aspect has been the
remarkable increase in recoveries
by around 32 basis points over
SS 2016-17 and 58 basis points over
SS 2015-16. The increased recoveries
have the effect of substantially lowering
our cost of production, and making us
more resilient to withstand cyclicality in
the Sugar industry.
As a result of strong internal accruals,
we have been able to substantially
reduce the debts, which is essential in
a cyclical business like Sugar. At the
end of the year, the term debt is only
` 163.3 crore, with interest free or
softer loans constituting ` 39.3 crore.
We did reasonably well in Co-
generation and Gears Business,
especially in respect of the latter,
despite a subdued market. Our
decision to diversify into machining
of Wind gear components has come
as a key growth enabler, with Defence
emerging as another area that has
brought increased visibility to our
Gears business. The profitability of
our Distillery was impacted due to
unscheduled closures but it still caught
up thereafter.
Water business continued to
underperform due to lower than
optimal turnover in view of the
extremely slow order intake. It was
encouraging, however, to witness
return of momentum in order
finalisation towards the end of the
year, which may result in substantial
improvement in the fundamentals of
Water business, going forward.
How has the Sugar business
performed during the year?
We have been one of the top
performers in the state of Uttar
Pradesh as regards sugarcane
crush, recovery and production.
Most importantly, our recoveries are
higher than the state average by 53
basis points as compared to 44 basis
points in SS 2016-17 and 19 basis
points in SS 2015-16. The improved
relative performance will give us an
advantage in withstanding downturn
in the cycle over our peers.
The country’s production in SS 2017-18
is expected to be around 32.4 million
tonnes, higher by 28% over the initial
estimates. This has led to a steep
softening of sugar prices and the
present financial results incorporate a
provision for inventory write-down of
` 220 crore.
With the state of UP having scaled
up its production substantially, the
position of surplus production has
come to stay for some years and it
is imperative that we have sound
policies to ensure that the surplus
sugar is regularly exported out. The
losses in exports will be well taken
care of by healthy sugar prices for
We have been able to achieve 35% higher production over SS 2016-17 and 95% over SS 2015-16.
Q&A with the Vice Chairman & Managing DirectorTarun Sawhney
P. 20

the remaining sugar to be sold in the
domestic market. Further, we need to
create adequate distillation capacities
to ensure that sugar production
is regulated to produce additional
ethanol. And most importantly, the
linkage of sugarcane prices with
sugar prices is a long-awaited reform,
which could be a game changer for
the industry.
The Government has taken some
tangible measures to rescue the
sugar industry in a time of crisis and it
is hoped that besides such short-term
remedial plans, long-term sustainable
plans / policies will be formulated to
address some serious gaps.
Was this performance excellence
also manifested in your
Co-generation and Distillery
businesses?
The high crushing quantum naturally
translated into excellent performance
at our Co-generation plants at
Khatauli and Deoband, with higher
number of days of operations. We
succeeded in efficiently meeting our
captive power and process steam
requirements. In fact, we went a step
ahead and procured bagasse from
external sources to ensure optimal
co-generation operations at these
two plants during the off-season.
Our incidental co-generation plants
at Chandanpur, Milak Narayanpur
and Sabitgarh units also performed
exceptionally well during the year,
to record their highest ever power
exports, respectively.
On the Distillery front, temporary
closure of the distillery unit in the
P. 21
Annual Report 2017-18
02-17 | Co
rpo
rate Overview
24-101 | Statuto
ry Rep
orts
18-23 | Man
agem
ent Statem
ents
102-266 | Finan
cial Statemen
ts

operational efficiencies to optimise all
controllable factors.
In order to further integrate our sugar
operations and in response to the
New Bio-fuel Policy, the Company
has decided to set up a new state-
of-the-art 160 KLPD ethanol plant at
its sugar unit at Sabitgarh with an
incineration boiler. The incineration
boiler will also be installed at the
existing distillery and it will enable
both the distilleries to operate for
330 days annually – It will raise the
production capacity by about 140%.
The project cost is estimated at ` 200
crore with an excellent ROI.
Can you provide an update on the
performance of the Engineering
business? What have been the
drivers of growth in the Gears
business?
There has been a definite uptick
in demand for high-speed gears
and also for replacement solutions
across most of the key sectors of
our presence, leading to significant
growth in terms of revenue and
profitability. The domestic market
segments of our Gears business
showed marginal increase during
the year, along with growth triggered
by indirect exports through OEMs.
Our growth has come mainly from
major OEMs for high-speed turbo
applications.
The Oil & Gas segment, as well as
the Process Industry along with
IPPs, have pushed growth in the
Aftermarket business, including
Replacements, which has witnessed
increase in turnover and order
bookings. Although the growth we
were expecting through strategic
supply agreement with GE did not
come through, some order inflow
from GE towards the end of the
year indicate that the revival in this
segment may have begun.
Based on the initiatives taken by
Government of India on “Make in
India” and especially the Defence
sector, the Company has taken
concrete steps to grow in Naval
early part of the year led to lower
despatches and capacity utilisation,
causing business performance to
be impacted.
How does the Company see the
Sugar and integrated businesses
panning out in the coming year?
The surplus sugar availability in
the country will stay for a few
years till the surplus is regularly
exported out or sugar production
is regulated by production of
ethanol using new distillation
capacities, or till the farmers are
persuaded to switch to other crops
by prescribing remunerative prices
vis-à-vis sugarcane. However,
the Company is better placed in
view of its efficient operations,
and it being a low-cost producer.
In the event of serious mismatch
between sugar prices and the cane
prices, we expect the Government
to intervene and support the sugar
prices to avoid accumulation of
cane dues. We would continue
to focus on further improving
There has been a definite uptick in demand for high-speed gears and also for replacement solutions across most of the key sectors of our presence, leading to significant growth in terms of revenue and profitability.
P. 22

Defence segment, aligning to the
Group’s strengths in designing and
manufacturing engineered-to-order
equipment. Further, the Company has
been successful in bagging the order
for development of Turbo Extraction
Condensate Pump Naval platform and
certain critical parts for the OPV project.
The performance in the Water
business, however, remained muted
due to inconsistent and unsatisfactory
order inflow. Continuing delays
in some projects, leading to cost
overruns and provisioning, also
impacted our performance in this
segment. However, towards the year
end, we distinctly saw momentum in
order finalisation and robust order
booking.
What is the Company’s outlook for
the Engineering business, going
forward?
As far as Gears Business is
concerned, we see the growth
momentum sustaining in the
coming year, with our foray into new
products expected to result in better
performance in the immediate future.
Serial production of customised gears,
along with new segments of growth
such as Marine Defence, are the areas
where we see bigger opportunities for
growth in the coming years. We also
see the Fertiliser sector offering new
windows of opportunity for growth.
The Company has been approved as
propulsion gearbox manufacturer
for class and warships, as well as
for indigenous development of other
turbo machinery products that are
being used in existing platforms and
are also needed for future platforms.
The Company is well poised to capture
this exciting opportunity with high
long-term growth potential.
In the Water business, the early signs
indicate that the process of order
finalisation would be faster next year.
We see considerable traction in the
Namami Gange programme, which is
part of the Clean Ganga Mission of the
Government, along with the Swachh
Bharat Mission and Smart Cities.
We also see better opportunities
emerging from the enhanced
Government focus on sewage and
effluent treatment, with bidding
process already initiated for some
mega projects, in some of which we
are advantageously placed.
P. 23
Annual Report 2017-18
02-17 | Co
rpo
rate Overview
24-101 | Statuto
ry Rep
orts
18-23 | Man
agem
ent Statem
ents
102-266 | Finan
cial Statemen
ts

Management Discussion and Analysis
THE SUGAR INDUSTRY
As the largest sugar consumer in the world and the second
largest producer of sugar, India has a unique industry
landscape. In view of the large domestic market, India is
not actively linked with the global trades, and becomes a
marginal exporter or importer, depending upon higher or
lower production than consumption in the domestic market.
Even though, over the years, Governments have made several
policy changes in the sector, the sugar industry in India is still
highly regulated, as the sugarcane price fixation vests with
the Government, which feels the need to protect the interests
of the large community of sugarcane farmers, and also due
to the fact that the final product - sugar - is considered an
The Sugar Industry is one of the key agro-commodity industries in India, a significant contributor to the GDP, and also a source of substantial rural / semi-urban employment.
P. 24

“essential commodity”. Further, similar to other sugar-
producing countries, India’s Sugar industry also, to a great
extent, still depends on the vagaries of nature, due to which
the country’s output varies significantly year-on-year.
THE SUGAR MARKET
Market Analysis
The Sugar Industry is one of the key agro-commodity
industries in India, a significant contributor to the GDP, and
also a source of substantial rural / semi-urban employment.
The country’s sugar mills have evolved, over the past
decades, into multi-product, integrated industrial complexes,
which not just manufacture sugar but also utilise the
co-products for generating green power and green fuel.
India’s sugar industry has witnessed a remarkable
turnaround in the past two years, as a result of production
being well below the demand, which has led to strengthening
of sugar prices. FY 18, too, started with stable sugar prices,
along with good margins, which continued for the first half of
the year. However, the prices started declining considerably
towards the end of the first nine-month period in view of
revised production figures being substantially higher than
the initial estimates, well in excess of consumption. The
current market dynamics underscores the urgent need for a
well-structured and equitable sugarcane pricing policy.
Sugar Production
The country’s sugar production for SS 2017-18 is estimated at
~ 32.4 million tonnes, higher by more than 60% over the previous
sugar season. This has been the country’s highest sugar
production so far, out-performing the previous high of 28.3
million in SS 2014-15. This estimated production excellence
is due to record production by the States of Maharashtra
and Uttar Pradesh. As per recent estimates, Uttar Pradesh is
expected to produce around 12 million tonnes of sugar, followed
by Maharashtra at over 10.5 million tonnes, while Karnataka is
expected to produce around 3.5 million tonnes of sugar.
The substantial increase in sugar production in Maharashtra
is attributable to improved climatic conditions. In U.P.,
continuous cane development efforts made by sugar mills,
and the widespread adoption of new high sugared and high
yielding varieties of sugarcane suited to the present sub-
tropical climating conditions, has led to higher sugarcane
availability and sugarcane yields with improved sugar
recovery, resulting in record sugar production.
Sugarcane Pricing
The Central government announced the Fair and Remunerative
Price (FRP) for sugarcane for SS 2017-18 at ` 255 per quintal,
an increase of 11% from the previous season. This price
has been linked to a basic recovery rate of 9.5%, subject to
a further premium of ` 2.68 per quintal for every 0.1%-point
increase in recovery beyond 9.5%. However, some of the major
sugarcane producing states, such as, UP, Punjab, Uttarakhand
and Haryana, announced State Advised Prices (SAP)
significantly above the FRP. The UP Government announced
SAP for SS 2017-18 at a price hike of ` 10/quintal over the
previous season. The SAP of general variety of sugarcane is
` 315/quintal, ` 325/quintal for early maturing and ` 310 per
quintal for rejected variety, respectively.
The long-standing demand of the Industry for linkage of
sugarcane price with sugar price has not yet materialised.
For sustainable and long-term viability of the industry,
the industry association has been recommending to the
Government that the SAP pricing model needs to be changed,
and the cane prices be linked to the output prices, subject to
a floor limit. In the event of a mismatch between the sugar
and cane prices, the cane prices, to the extent not supported
by sugar prices, may be paid by the Government from a fund,
P. 25
Annual Report 2017-18
02-17 | Co
rpo
rate Overview
24-101 | Statuto
ry Rep
orts
18-23 | Man
agem
ent Statem
ents
102-266 | Finan
cial Statemen
ts

to be specially constituted for this purpose and funded by any
cess or levy as may be imposed by the Government on sale of
sugar. In the new GST regime, which has subsumed multiple
indirect taxes, the Government is evaluating the possibility
and mechanics of introducing such a tax. The implementation
of these reforms in the sugarcane pricing mechanism will
be a game changer, and will enable the industry to subsist
without any dependence on the Government. It would also
provide stable livelihood to farmers, and most importantly,
will help in timely future payment of dues to them.
Sugar Prices
Domestic
The year under review witnessed huge volatility in sugar
prices in the domestic market. After witnessing a strong
rally in sugar prices in FY 17, the sugar prices remained
strong during the first half of FY 18. However, with the
increasing estimates of production in SS 2017-18, the
sugar prices started declining from November 2017,
except for a brief improvement in February 2018 due to
the imposition of reverse stock limits by the Government.
The revised estimates of production in SS 2017-18, at
around 32.4 million tonnes against 25 million tonnes
projected before the start of the sugarcane crushing for
SS 2017-18, along with supply pressures, have resulted
in change in market sentiments. This has resulted in a
steady decline in sugar prices since November 2017, to
levels below the cost of production. The last six months of
FY 18 witnessed a decline in sugar prices by 23% from
the high of ` 39.45/kg witnessed during FY 18. Towards the
year-end, sugar prices were hovering around ̀ 2,800/quintal,
which is significantly lower than the cost of production, that
stands, on an average, at ` 34/kg for UP mills.
Global
As a result of a global surplus in 2017-18, world market
prices have remained under pressure since February 2017.
The world market prices, for both raw and white, further
declined in June, from 14.65 cents/lb at the beginning
of the month to below 13 cents/lb by June 28, 2017. The
sugar prices remained under pressure in September,
with raw sugar spot prices monthly average being
USD 14.39 cents/lb - almost the similar levels as of August
Avg. Spot Price NCDEX, Duty Paid-M Grade Muzaffarnagar
Apr
il
May
June
July
Aug
ust
Sept
embe
rO
ctob
erN
ovem
ber
Dec
embe
rJa
nuar
yFe
brua
ry
Mar
ch
FY 16 FY 17 FY 18
41,000
35,000
30,000
25,000
20,000
` /
ton
ne
Avg. Spot Rate NCDEX, Duty Paid-M Grade Muzaffarnagar Vs NY-11
Avg. Spot Rate-M Grade (Muzaffarnagar) NY 11
41,000
39,000
37,000
35,000
33,000
31,000
29,000
27,000
25,000
18.00
17.00
16.00
15.00
14.00
13.00
12.00
11.00
10.00
Ce
nts
/Po
un
d
` /
ton
ne
Apr
-17
May
-17
Jun-
17Ju
l-17
Aug
-17
Sep-
17O
ct-1
7N
ov-1
7D
ec-1
7Ja
n-18
Feb-
18M
ar-1
8
P. 26

(USD 14.37 cents/lb). White sugar prices witnessed a 2.1%
drop from August 2017, resulting in a monthly average of
USD 371.92/tonne. The global sugar prices remained under
pressure even at the end of January 2018, to touch 13.23
Cents/Pound for raw sugar and 352.40 USD/MT for white
sugar. In March 2018, the prices dipped further and touched
USD 12.44 cents/lb for raw and 343 USD/MT for
white sugar.
Demand-Supply Scenario
Domestic
Factors like growing retail consumption, particularly the
increasing institutional/bulk demand resulting from rising
population and increasing disposable incomes, is triggering
the increase in demand for sugar. As per estimates, the
share of bulk consumers in the domestic sugar consumption
would be around 60%, while the rest of the consumption is
directly by individual households. The bulk consumption is
also estimated to go up due to increase in consumption in
sectors like beverages, processed food, confectionery, bakery
products, pharmaceutical, etc.
The estimated sugar production for the country during
SS 2017-18 is ~32.4 million tonnes, which is around 60%
higher over the previous sugar season. With an opening
sugar stock of ~3.9 million tonnes and estimated sugar
production of 32.4 million tonnes, the total sugar availability
in SS 2017-18 will be 36.3 million tonnes. The annual sugar
consumption is estimated at 25.5 million tonnes, and with
expected exports of 0.5 million tonnes of sugar, the total
sugar stock at the beginning of the next sugar season is
expected to be around 10.3 million tonnes, which is 40% of
the annual consumption.
Global
The estimates of the world sugar production indicates a
surplus of over 6 million tonnes in 2017-18. The surplus
production is on account of higher production in Brazil, India
and Thailand. Favourable weather conditions in India and
Thailand have led to a substantial increase in production. Apart
from these factors, expansion of cultivation area in China and
ending of production quotas in European Union have also led
to the overall increase in global sugar production.
The sugarcane crushed in Brazil CS region since the beginning
of the current harvest had reached 588.5 million tonnes till
mid-March 2018, with 46.7% of the feedstock being utilised
to make sugar. Sugar production had reached 35.9 million
tonnes till mid-March 2018, which was 1.5% higher than the
corresponding period of the previous year. After two years of
severe drought, Thailand is estimated to produce 11.5 million
tonnes of sugar in 2017-18, which is over 14% higher than
the previous year.
Government Policy
At the beginning of the financial year 2017-18, the Central
Government increased the import duty on sugar [Raw sugar,
Refined or White sugar] to 50% from 40%. This was done
to curb dumping of sugar from the international market,
keeping in view the low global sugar prices, which would have
severely impacted the domestic industry by exacerbating the
surplus availability and impacting the sugar prices. To keep
speculation in check, the Government extended the stock
limit on dealers of sugar - 10,000 quintals in Kolkata and
5,000 quintals in other regions - to December 31, 2017.
The Government had initiated a series of actions from the
beginning of 2018 to reverse the trend of decline in prices
and increasing sugarcane arrears, including withdrawal
of stock holding limit on traders and increasing the import
duty to 100%. The Central Government also announced
reverse stock limits for sale of sugar in February and March
P. 27
Annual Report 2017-18
02-17 | Co
rpo
rate Overview
24-101 | Statuto
ry Rep
orts
18-23 | Man
agem
ent Statem
ents
102-266 | Finan
cial Statemen
ts

2018 with a view to limiting the supplies for supporting the
declining sugar prices.
In March 2018, the Government mandated export of two
million tonnes of sugar until the end of the September 2018,
to partially liquidate surplus stocks in order to stabilise and
support the falling sugar prices. Improved and remunerative
sugar prices would have enabled sugar mills to avail higher
bank credit and enhance their accruals, to place them
in a position to pay outstanding sugarcane dues. Under
the Minimum Indicative Export Quota (MIEQ), it has been
mandated to export the fixed quota that has been allocated to
each sugar mill, taking into account the average production
of mills achieved in the last two years and up to February
of this marketing year. The sugar mills can export the quota
or get it exported by a merchant exporter by sourcing sugar
from other mills on mutually agreeable conditions. Further,
the Government also allowed export of white sugar till
September 2018, under the Duty Free Import Authorisation
(DFIA) scheme, which allows exporters to import sugar at
zero duty within three years.
Based on the prevailing/expected global and domestic sugar
price matrix, mandatory exports can take place only at a loss,
which is dependent on the conditions prevailing at the time of
exports. However, liquidation of surplus sugar is paramount
to reduce the overhang of surplus sugar, so that the balance
sugar can be sold in the domestic market at remunerative
prices. Considering the gravity of situation, the Government
has introduced a scheme of cane price assistance of ` 55/MT
to sugar mills based on certain conditions.
THE ETHANOL MARKET
Market Analysis
India is the fourth largest producer of alcohol globally, and
the leading producer of alcohol in the South-East Asian
region with about 65% share. The Central Government
has been promoting the production and blending of
Fuel Ethanol with petrol, and has targeted 10% blending
(EBP10). Apart from being environment-friendly, this also
ensures fuel security for the country, besides conserving
foreign exchange and helping the sugar industry to get an
additional revenue stream to minimise the impact of the
inherent cyclicality in the industry. In order to meet the 10%
blending goal, it is estimated that approximately 313 crore
litres of ethanol is required.
Demand Drivers
Population growth and increasing urbanisation are pushing
the need for mobility. India’s transportation sector is growing
rapidly, with dependence on oil also concurrently rising.
Considering the burgeoning oil import bill and the growing
concern for the environment, there is need to adopt non-
conventional fuels. The blending of ethanol at 5% with petrol
helps in reducing dependence on oil, besides lowering pollution,
while saving ` 6,000 crore in foreign exchange annually.
Ethanol has about 30% oxygen, which in turn enables fossil fuel
to burn much better within the engine. This extra and efficient
burning of the fossil fuel within the engine, due to the presence
of ethanol, significantly reduces the emissions. Ethanol, being
a value-added product from molasses - a co-product in the
manufacture of sugar from sugarcane, directly benefits the
sugarcane farmers across the country.
Increasing
mobility
Reduce
foreign
exchange
outgo
Improve
profitability
of Sugar
business
Need for
renewable
fuel
India is the fourth largest producer of alcohol globally, and the leading producer of alcohol in the South-East Asian region with about 65% share.
P. 28

Demand-Supply Scenario
Currently, out of the 530 sugar mills in the country, only about
130 have the capacities to produce fuel ethanol. The country’s
total production capacity is 224 crore litres of ethanol.
In SS 2017-18, Oil Marketing Companies (OMCs) released
tenders worth 313.57 crore litres for the current marketing
year. To achieve 10% blending, distillation capacities need
to be increased, which requires increasing the existing
capacities as well as the establishment of new capacities.
There has been a record sugar production in SS 2017-18,
mainly due to better recoveries and yields. The current
production trend, subject to the impact of any adverse
climatic factors, is likely to continue, and is expected to well
outstrip the consumption. Instead of exporting such surplus
at losses, the Government would do well to permit sugar
mills to produce ethanol from B-Heavy molasses, to be able
to regulate sugar production in the years of surplus sugar
production and simultaneously, to strengthen the ethanol
blending programme. It may require policy formulation and
dual pricing mechanism, based on the type of molasses used
in the production of ethanol.
The Central Government has raised the ethanol price by around
5% - from ` 39/ltr to ` 40.85/ltr for Marketing Year 2017-18
starting from December 2017 for a total quantity of 313 crore
litres, marking an increase of ~12% over last year’s quantity.
Government Policy
The various policy initiatives undertaken by the Indian
Government for Ethanol blending:
2002EBP started
2007EBP with
5% blending
mandatory; fixed
procurement
price
2015Fixed pricing
mechanism with
10% blending
2017Increase in
Ethanol price for
MY 2017-18
2013Price decided
through open
tenders
2016Introduced
mechanism
for revision of
ethanol price
P. 29
Annual Report 2017-18
02-17 | Co
rpo
rate Overview
24-101 | Statuto
ry Rep
orts
18-23 | Man
agem
ent Statem
ents
102-266 | Finan
cial Statemen
ts

There has been a sharp increase in energy consumption, triggered by high levels of economic growth and industrialisation.
THE CO-GENERATION MARKET
Co-generation is a decentralised incremental power addition
that has many associated benefits, such as mitigated risk of
loss of power to large areas due to shutdown, reduced T&D
losses, local power supply, and employment generation.
The importance of having high efficiency grid connected co-
generation power plants for generating exportable surplus
has been established well in the Indian sugar mills.
Market Analysis
The installed power generation capacity in India is 334
GW, as on March 31, 2018, out of which 20% at 69 GW is
renewable power. The Government has set a target of
175 GW renewable power installed capacity by the end of
2022, which includes 60 GW from wind power, 100 GW from
solar power, 10 GW from biomass power and 5 GW from
small hydro power. The all-India potential of bagasse based
co-generation is estimated at 7,000-7,500 MW. UP is the
leading state in bagasse-based power generation, with
an installed capacity of around 1,200 MW. The potential of
bagasse co-generation within UP is around 1,500 MW, from
over 130 sugar mills. The sugar mills work on a Power
Purchase Agreement (PPA) model with the Uttar Pradesh
Power Corporation Ltd. (UPPCL).
Demand Drivers
There has been a sharp increase in energy consumption,
triggered by high levels of economic growth and
industrialisation. Power demand in the residential sector has
also increased. Limited fossil fuel availability requires usage
of non-conventional fuel sources for power generation.
Bagasse co-generation not only reduces dependence on
conventional fuel sources but also helps in saving precious
foreign exchange by limiting the import of coal. The Clean
Energy so generated with bagasse has a favourable impact
on climate. India’s climate action plan aims for 40% installed
capacity from non-fossil fuel by 2030. Using bagasse for
power generation also leads to significant revenue for sugar
mills through the sale of electricity.
Rising demand for electricity
Address environ- ment goals
Improve profitability of the Sugar business
Fuel security
P. 30

Demand-Supply Scenario
Bagasse-based co-generation should remain in focus in
U.P., along with other renewables. The potential for bagasse
co-generation lies mainly in the nine key sugar-producing
States, especially in U.P., since it is one of the highest
sugarcane-producing states.
Government Policy
The Government is providing various incentives and schemes
to promote grid interactive biomass power and bagasse
based co-generation in sugar mills. A subsidy is provided
under Central Financial Assistance for private sector
projects, such as IPP Grid interactive biomass combustion
power projects and bagasse co-generation in private / joint
sector sugar mills, IPP-based BOOT/BOLT model projects in
Cooperative / Public sector sugar mills.
Sugar Industry and Economy
It is estimated that the annual direct and indirect contribution
of the sugar industry to the exchequer is around ` 75,000
crore. The industry has the potential to cater to the growing
domestic sugar consumption, while supporting the country in
reducing the oil import bill through supply of ethanol for fuel
blending, and also generate energy as a renewable power
producer. The need of the hour is to improve the quality of
the sugarcane produced, i.e. higher yields and recoveries,
along with increase in the operating efficiencies at the
mills. In order to unleash the full potential of the sector, it is
necessary to rationalise the sugarcane pricing mechanism.
Policy level interventions are required to ensure the viability
of the sugar industry, while protecting the interest of all
stakeholders i.e. farmers, consumers and sugar mills.
Ensure a level playing field with rational sugarcane pricing
policy based on commercial considerations across the
country
Incentivise farm level productivity
Strengthen farmer-miller relationship
Sustainable inter-crop price parity
Ensure sugar price linked to input prices
Enforce better and on-time import/export decisions
Incentivise the production of green power and green fuel
These interventions should help in uncapping the immense
potential of the sugar industry. The Government is exploring
the possibility of manufacturing flexi-fuel cars and vehicles in
India, which can run on higher ethanol blend percentages. This
will require increased ethanol production. The sugar industry
in India has the potential to act as an energy-producing hub
for the rural sector, which will boost the rural economy and
facilitate the Government in enabling the socio-economic
transformation of the rural population. Rising fossil fuel costs,
fuel security issues and Government policies to support
renewable energy will allow renewable fuels to compete
economically over time.
Paying Capacity of
Sugar Mills/Cane
Arrears
Sugarcane Pricing Policy
Sugarcane Planting
SugarPrice
Sugarcane Production
Sugar Production
Inter-crop price parity/estimated return on the sugarcane crop; cane arrears
Impact of operational efficiencies; Varietal balance
Impact of demand-supply scenario in domestic market and global sugar price
Impact of weather conditions
Impact of Losses to Sugar Industry
Impact of Profitable Sugar Industry
On-time sugarcane payment to farmer
Engage resources for development of farm level productivity
Brownfield/greenfield expansion of plants and distilleries
The sugar industry in India has the potential to act as an energy-producing hub for the rural sector, which will boost the rural economy and facilitate the Government in enabling the socio-economic transformation of the rural population.
P. 31
Annual Report 2017-18
02-17 | Co
rpo
rate Overview
24-101 | Statuto
ry Rep
orts
18-23 | Man
agem
ent Statem
ents
102-266 | Finan
cial Statemen
ts

BUSINESS REVIEW
With its synergistic and strategic business units, the Company
is continuously sowing new seeds to nurture greater
success, year-on-year, to drive increased value delivery for
its stakeholders.
Sugar Business
Triveni operates seven sugar units spread across the State
of Uttar Pradesh (U.P.). Most of its mills are located in
Western and Central U.P., while one unit is located in Eastern
U.P. The weightage of sugarcane crushed by the Company
in Sugar Season 2017-18 is ~7.5%, while sugar output is
equivalent to ~7.9% in the State. The Company manufactures
refined sugar, which constitutes ~40% of the total sugar
production and fetches a premium over the sugar price of
normal sulphitation sugar. The refined sugar is supplied to
high grade end-users, thereby creating a niche customer
profile. The Company also produces different grades of
Pharma sugar that can be customised as per customer’s
requirements. Triveni’s seven sugar units strictly adhere
to best-in-class manufacturing processes and quality
Chandanpur, Milak Narayanpur and Sabitgarh units operate
incidental co-generation units and export the surplus power
to the grid, leading to the generation of an export revenue of
` 23.6 crore in FY 18.
benchmarks, and supply sugar to major multinational soft
drink companies, leading confectionery manufacturers,
breweries, pharmaceutical companies and leading ice cream
producers for their requirements.
Performance Overview
The Company has achieved record sugarcane crush and sugar
production during Sugar Season 2017-18. The sugarcane
crushed by the Company during the season was 31% higher
than the previous season, with an increase in recovery by
32 basis points, which resulted in about 35% increase in sugar
production. The performance of Triveni sugar units has been
significantly higher than the U.P. state average – the differential
recovery in the present season is 53 basis points more than
the state average, as against 44 basis points in the previous
season. The increase in sugar production in the current
season is 35% as against 38% in the entire state. The refined
sugar production from the two units of Khatauli and Sabitgarh
remained at 40% of the total sugar production, which will also
help Triveni achieve better overall average sugar realisation.
The average sugar price realisation for the Company has been
` 36,244/MT during the year.
Organic Growth through Cane Development Programme
Being a large-scale manufacturer of different varieties
of sugar, along with co-products, the Company works
continuously with its farmers to increase farm productivity
through a well-planned Cane Development programme.
(Million Tonnes)
Units Sugar Recovery (%) Sugarcane Crushed Sugar Production Increase over SS 2016-17
SS
2017-18
SS
2016-17
SS
2017-18
SS
2016-17
SS
2017-18
SS
2016-17
Recovery Sugarcane
Crushed
Sugar
Production
Khatauli 11.38 11.01 2.21 1.82 0.25 0.20 0.37 22% 26%
Deoband 11.11 10.70 1.50 1.17 0.17 0.12 0.41 29% 34%
Ramkola 11.24 11.21 0.98 0.69 0.11 0.08 0.03 42% 42%
Sabitgarh 11.03 10.39 0.97 0.74 0.11 0.08 0.64 31% 39%
Chandanpur 12.00 11.83 1.00 0.78 0.12 0.09 0.17 28% 30%
Rani Nangal 12.00 11.78 0.93 0.71 0.11 0.08 0.22 30% 33%
Milak Narayanpur 10.97 10.60 0.78 0.50 0.08 0.05 0.37 57% 62%
Group 11.38 11.06 8.37 6.40 0.95 0.71 0.32 31% 35%
P. 32

This programme is carried out with rigour and fervour, across all the seven sugar manufacturing units. The Company’s efforts
in providing high-yielding seeds and inducing better agronomic practices have positively impacted the yields, earning the
confidence of more than 250,000 sugarcane growers.
Triveni Sugarcane Area and Crushing
Cane Area (Hectares) Cane Crushed (Lakh Quintal)
190000
175000
160000
145000
130000
115000
100000
850
800
750
700
650
600
550
500
450
400
837
640
452
513
465
2013-14 2014-15 2015-16 2016-17 2017-18
Performance - Triveni V/s UP
Triveni share in UP sugarcane crushed (%)
Triveni Recovery (%) UP Recovery (%)
8.00
7.80
7.60
7.40
7.20
7.00
6.80
6.60
6.40
6.20
6.00
11.50
11.00
10.50
10.00
9.50
9.002013-14 2014-15 2015-16 2016-17 2017-18
11.38
11.06
10.61
10.80
10.61
9.549.32
9.26
9.57
10.85
7.687.74
7.01
6.696.64
The sugarcane crushed by the Company during SS 2017-18 was 31% higher than the previous season.
P. 33
Annual Report 2017-18
02-17 | Co
rpo
rate Overview
24-101 | Statuto
ry Rep
orts
18-23 | Man
agem
ent Statem
ents
102-266 | Finan
cial Statemen
ts

These continuous efforts have resulted in increase in area
under sugarcane plantation, leading to increased sugarcane
crushing and higher yields. While the State of Uttar Pradesh
showed a CAGR of 9.23% in sugarcane crushed during the
past five years, Triveni Sugar grew by 12.5% during the
same period. Similarly, the average recovery improvement
during the past five years for the state of Uttar Pradesh
has been 1.61%, whereas Triveni successfully achieved an
improvement of 2.06% during the same period. The increase
in crushing, coupled with higher recoveries, led to record
sugar production for the Company in SS 2017-18.
During the past few years, the Company’s sustained efforts
have helped in increasing the varietal mix towards early and
improved varieties of cane, leading to significantly enhanced
recoveries. Focus on plantation of high sugared/high yielding
early varieties, such as Co-0238, Co-0118, Co-98014, CoJ-85
and improved variety CoJ-88, has helped in transforming the
varietal balance. Over these years, the Company succeeded
in shifting the farmers from planting rejected varieties
of cane to high yielding varieties which resulted in overall
improvement in the quality of sugarcane crushing in all the
Triveni facilities.
Besides varietal development, the Company is also working
on yield enhancement activities such as green manuring,
intercropping, deep ploughing, planting by trench method,
4-5 feet planting; single bud planting and planting by upper
1/3rd portion of cane. This has resulted in yield improvement
- from 450 quintals/hectare in 2013-14 to over 600 quintals/
hectare in 2017-18.
The cane development team works closely with farmers,
right from seed preparation to plantation, pest management,
plant protection and harvesting. As part of the programme,
optimising the nutrient content in soil for farming operations
is also undertaken. Farmers are being educated and
persuaded about the benefits of these scientific methods
through various channels, such as publicity, door-to-door
contact, grower interactions, etc.
Outlook
Sugar stocks are expected to increase from ~ 3.9 million tonnes
at the beginning of SS 2017-18 to over 10 million tonnes by the
end of this sugar season, after considering 0.5 million tonnes of
exports under MIEQ. The stocks are higher than the acceptable
levels by 2-3 million tonnes, and there are forecasts of even
higher production next year, which could be the reason for the
Change in Sugarcane Varietal Mix and Recovery
100%
90%
80%
70%
60%
50%
40%
30%
20%
10%
0%
12.00
11.50
11.00
10.50
10.00
9.50
9.00
8.50
8.00
Early & Improved General Rejected Recovery
2013-14
10.80 11.06
11.38
2015-16
57%
34%
10%
2017-18
92%
7%
1%
2016-17
77%
20%
3%
2014-15
37%
49%
14%
9.5730%
55%
15%
9.32
P. 34

depressed sugar pricing scenario. Pressure on sugar prices,
and the consequent deteriorating financials, are leading to the
building of cane arrears - to around ` 20,000 crore by end of
May 2018. The planting for SS 2018-19 has been completed,
and as per estimates, the area under sugarcane cultivation has
increased by 1% y-o-y across India, which is expected to result
in another year of surplus. There is dire need of sugarcane
price linkage with sugar prices, as the sugar industry cannot
sustain another slump of the kind witnessed during 2012-
2015. The industry is hopeful that the Governments, both at
the Centre and in the state of UP, will seriously address the
issue of sugar prices and financial support in the short term,
and will initiate some much needed reforms linking sugar
prices with cane prices, along with flexibility to regulate
sugar production through the production of ethanol from
sugarcane juice / B-heavy molasses, in the long term, for the
sustainability and viability of the industry.
Co-generation Business
Bagasse is a fibrous residue left after crushing of sugarcane
and is a key by-product of the sugar industry. Being a renewable
fuel, it does not lead to any net carbon dioxide addition to the
atmosphere and is thus regarded as green fuel.
Triveni currently operates grid-connected three large
capacity co-generation plants and three smaller
co-generation capacities (incidental co-generation facilities)
at its five sugar units, namely Khatauli, Deoband, Chandanpur,
Milak Narayanpur and Sabitgarh units. The former three
large-sized plants are part of the operations of Co-generation,
whereas the other three small-sized plants are considered a
part of the sugar operations. Triveni’s co-generation plants at
Khatauli and Deoband utilise highly efficient 87 ata / 515ºC
steam cycle to maximise efficient usage of bagasse.
After meeting the sugar factory’s captive requirement as well
as the co-generation plant’s auxiliary power requirement,
surplus power from these plants is exported to the grid. The
Company has power purchase agreements with UPPCL for
all its co-generation facilities.
Facilities
The co-generation plants at Khatauli and Deoband utilise
highly efficient high pressure (87 ata) and temperature
(515ºC) steam cycles, and are regarded amongst the most
efficient co-generation plants in India. The Company’s smaller
capacity co-generation plants operate mostly on medium
pressure steam cycles (46 ata/440OC). These plants are
designed to conduct fully-automated operations, using the
latest Distributed Control System (DCS). Highly experienced
and skilled manpower operates these plants, thus ensuring
trouble-free efficient operations with high uptime and reliable
operations, along with very high operating efficiencies. The
Company puts significant emphasis on maintaining excellent
management of the boiler feed water quality parameters to
ensure sustained and trouble-free operation of the boiler and
the turbine.
Unit-wise capacities of the co-generation plants are as follows;
Sl.
No.
Name of the
unit
Installed
capacity
1. Deoband 22 MW
2. Khatauli Phase 1 & Phase 2 23 MW each
3. Sabitgarh 13.5 MW
4. Chandanpur 10 MW
5. Milak Narayanpur 13 MW
Total 104.5 MW
Performance Overview
The operation of the bagasse-based co-generation plant
depends upon the availability of bagasse from the sugar
factory to a large extent. The availability of bagasse from the
sugar factory in turn depends upon cane availability for the
crush during the season and efficient operations of the sugar
factories. Higher cane availability leads to more season
operating days, higher bagasse savings, and therefore longer
operation of the co-generation plants.
P. 35
Annual Report 2017-18
02-17 | Co
rpo
rate Overview
24-101 | Statuto
ry Rep
orts
18-23 | Man
agem
ent Statem
ents
102-266 | Finan
cial Statemen
ts

The Company has undertaken an extensive and focussed
cane development programme in the command areas of its
sugar units, particularly in the previous three years. This has
led to much better availability of sugarcane in view of the
significantly improved yields. Accordingly, the operating days
increased by 25% and bagasse availability increased by 20%,
and these two factors were responsible for much improved
financial performance of the co-generation segment.
The performance of the co-generation plants at Khatauli and
Deoband continued to be excellent, with very high uptime and
reliable operations. The requirements of process steam and
captive power of the sugar factory operations were fully and
efficiently met. Apart from captive supply, bagasse was also
procured from outside sources to optimise the co-generation
operations at both the co-generation plants during the off-
season, the results of which will be reflected in the next
accounting year.
The Company’s incidental co-generation facilities also
performed well and its plants at Chandanpur, Milak
Narayanpur & Sabitgarh units recorded their respective
highest power export in 2017-18 since inception. Due to
increased cane availability at Chandanpur unit, a small
capacity low pressure boiler was installed and commissioned
during the ongoing crushing season 2017-18, in the month
of December 2017, and this facilitated continuous export of
power from the unit, post commissioning of the boiler.
During the year under review, the co-generation units
generated ~28% higher at 275.4 million units, while the
exports to the grid have been 182.3 million units. Apart from
this, the incidental co-generation units of Chandanpur, Milak
Narayanpur and Sabitgarh exported 44% higher at 40 million
units to the State Grid.
The operations of co-generation include income of ` 10.1
crore arising from the sale of The Renewable Energy
Certificates (RECs), as per the CERC’s REC mechanism during
the year, through transaction of the already issued RECs. In
view of some recent changes, against which the industry has
made strong representation, all the sugar units, except at
Sabitgarh, will no longer be eligible to be issued RECs from
April 1, 2018.
Awards & Recognition
The Company pays high level of management focus on the
safety of its operating staff, plants and machinery. Greentech
safety awards have been won by Khatauli (Greentech
Platinum Safety Award) and Deoband (Greentech Silver
Safety Award) in the past. The Khatauli co-generation plant
also won the Gold award in EKDKN INNOV Award 2017 under
OHS Category in Power (Inclusive Renewables) Sector.
Outlook
The Company’s sustained focus on cane development
activities in the command areas of its sugar units should
lead to better cane availability for crushing, resulting in
higher operating days of the co-generation plants due to
enhanced bagasse availability. The Company is also taking
various steps to further improve the efficiency of the sugar
plants’ operations in order to reduce the process steam
consumptions, thereby enabling more savings of bagasse for
enhanced operation days of the co-generation plants.
Distillery Business
The Company operates a 160 Kilo Litre Per Day (KLPD)
capacity state-of-the-art molasses-based distillery in
Muzaffarnagar district in U.P. It is one of the largest single
stream molasses-based distilleries in India. Strategically
located in close proximity to two of the Company’s largest
sugar units (Khatauli & Deoband), the distillery has an
assured access to consistent supply of captive raw material
(molasses). The unit extracts bio-gas from the effluent, and
uses it as the main fuel in the boiler to meet the process
steam and power requirements.
The Company has undertaken an extensive and focussed cane development programme in the command areas of its sugar units, particularly in the previous three years, enhancing bagasse availability for co-generation plants.
P. 36

The distillery has a flexible manufacturing process, allowing it
to produce high quality Extra Neutral Alcohol (ENA), Rectified
Spirit (RS), Specially Denatured Spirit (SDS) and Ethanol,
based on the market dynamics and requirements. However,
for the last few years, the distillery has been producing the
maximum quantity of Ethanol and supplying it to OMCs for
blending in petrol. The ethanol produced from the distillery is
also supplied to other major players in the O&G sector.
Performance Overview
The distillery unit continued to operate efficiently and
achieved high levels of the fermentation and distillation
efficiencies during the year. The distillery remained closed
for over a month in the first half of FY 18, which adversely
impacted the overall production. During the year under
review, approximately 94% sales of the distillery was Ethanol,
with the balance 6% being ENA. The total production of the
distillery for FY 18 has been 26.624 million litres, while sales
stood at 28.093 million litres.
Ethanol, also known as fuel alcohol, is blended with petrol
as a green fuel. Apart from augmenting the country’s fuel
self-sufficiency with cost advantage, blending of ethanol
with petrol helps in reducing the nation’s carbon footprint,
besides enabling savings of precious foreign exchange on
import of crude oil. As per the bio-fuel policy of the Central
Government, ethanol blending is targeted to be 20% by 2022,
creating continued demand from the indigenous suppliers.
The off-take by Oil Marketing Companies (OMCs) has been
steadily improving. Triveni has aggressively participated
in all tenders issued by the OMCs for the procurement of
Ethanol and has secured sizeable quantities.
Awards & Recognition
Triveni is the first Company in U.P. which has obtained
certificate from Food Safety and Standards Authority of India
(FSSAI) for manufacture of RS (P) and ENA. The Company’s
distillery has won many awards in the past, and in 2017,
the unit won Golden Peacock Business Excellence Award in
Chemical sector from the Institute of Directors, New Delhi.
Outlook
The Central Government has embarked on an ambitious
ethanol blending programme under its bio-fuel policy, and
is keeping a strong focus on enhancing the ethanol blending
percentage, with the aim of going to over 20% in very near
future. However, there is continued shortage of indigenous
ethanol, which means that a large market exists for ethanol
from the Indian manufacturers.
In view of higher sugarcane crush in the state of Uttar
Pradesh in SS 2017-18, there has been a glut of molasses,
but inadequacy of storage capacities has caused the prices
to nosedive to almost nought due to panic selling. While it is
a considerable loss for the sugar mills, the operations of the
distillery have become very profitable, due to the abnormally
low raw material prices. Considering the aforesaid scenario,
the Company has decided to set up another distillery of 160
KLPD at its Sabitgarh sugar unit and install incineration boilers
at both the units for 330 days operations. Such capacities are
expected to be functional in the first half of FY 19 and the
production potential is likely to increase by 140% as a result.
The additional capacities will also help the Company produce
ethanol from B-heavy molasses, if required and found viable.
The Industrial Gears industry
The Gears Industry in India is categorised into Industrial
Gears and Auto Gears. The Industrial Gears segment
manufactures Gears, Gearboxes, Gear Motors and Gear
Assemblies. Industrial gearboxes are a common type of
power transmission devices, used as a component in various
types of machineries and heavy electrical equipment. The
majority of the players in the domestic market manufacture
standard products i.e. standardised catalogue type, as it
P. 37
Annual Report 2017-18
02-17 | Co
rpo
rate Overview
24-101 | Statuto
ry Rep
orts
18-23 | Man
agem
ent Statem
ents
102-266 | Finan
cial Statemen
ts

requires less customisation and engineering. There are only
a few players in customised gears manufacturing, which
requires advanced technology, and stringent adherence to
international standards, with requisite infrastructure and
highly skilled manpower.
Demand Drivers
The major demand driver for Industrial Gears is industrial
capital expenditure, mainly in sectors like Power, Steel,
Refineries, Fertilisers, Cement, Textiles, Sugar, Mining,
Power, etc. The infrastructure-related investment in the
country stimulates the growth of heavy industries, which
in turn fuels the growth of the Industrial gearboxes market.
Triveni’s core product - High-Speed Gears - are used for
all turbo applications like gas turbines, steam turbines,
water turbines, compressors, pumps, blowers and test rigs
meeting AGMA and API design standards. Demand for these
products is linked to industrial growth and the capital goods
sector. However, part of the demand is generated from the
exports undertaken by domestic OEM customers, which is
linked to global demand of products related to Capital spend.
Aftermarket opportunity demand is linked to plant utilisation
levels, cost pressures on maintenance budgets, policy of
keeping insurance spares, emergency breakdowns and
alternate sourcing needs to bring down product costs.
Business Opportunities
As a result of the policies being pursued by the Government,
business sentiment and capacity utilisation have improved
perceptibly, and there are some indications of fresh capital
investment in industrial segments like steel, cement, sugar
and oil and gas. Increased acceptance of engineered capital
goods from India in global markets has boosted sourcing
from quality-conscious credible Indian manufacturers.
The Government of India’s Make in India initiative has led
to new opportunities for diverse engineered products, and
Triveni’s Mysuru facility is actively participating in many
of these indigenous development projects. The Defence
Procurement Policy 2016 focusses on self-reliance for
various equipment in Design, Development and Manufacture
by Indian Industry. Most of the new projects envisaged by
the Defence sector are customised requirement for critical
equipment, offering substantial value to the existing portfolio
of Triveni Gear’s rotating machinery. Triveni Gears is initially
focussing on Naval Defence markets and has gained some
foothold in the critical turbo pumps space.
The Company also expects new capex in the Oil refinery
segment for upgrading facilities to meet the prescribed
better emission norms, which could be a driver of demand
for the equipment manufactured by Triveni. Additionally,
the Fertiliser sector is also expected to go for revamp and
brownfield expansions, which may generate fresh capital
expenditure.
Outlook
The thermal power sector continues to be under pressure
for new capex because of the surplus electricity availability
in many states, due to nationalisation of grid and slackened
industrial activities. There has been a perceptible pickup
in activities in Cement, where the capacity utilisation has
improved by around 10%. After the diminishing effect of
GST and demonetisation, normalcy is being restored, and
various sectors of the industry are poised to show growth
in the coming quarters. Growth initiating policies like smart
cities project, national corridors, water ways and ports
infrastructure are likely to boost demand in the Infrastructure
sector, particularly Cement and Steel.
The Steel sector has witnessed better price realisation and
increase in demand due to a multitude of external factors,
such as higher import taxes, but liquidity has been a concern
P. 38

and has negatively impacted this sector. Sugar segment in
the northern region has seen good growth in price realisation,
owing to improved financial conditions in the past two years.
The growth of the Capital Goods sector in India is expected
to be led by increased demand and improved business
sentiment, owing to favourable Government policies. The
demand drivers for Triveni Gears are expected to be mainly
Infrastructure development, new investments in Power
projects, Marine and Naval vessels, Metals, Oil and Gas,
and Petrochemicals industries. The Government’s focus on
projects like ‘Make in India’ is giving further impetus to the
overall growth of the Capital goods and other Manufacturing
sectors. Apart from the domestic market, it is imperative to
explore exports to its full potential.
Triveni Gears – Business Overview
The Company is focussed on all high-speed and niche low-
speed products, encompassing supply of new equipment
as well as providing replacement solutions for the Power
sector, Oil & Gas, Sugar, Cement, IPPs, Steel & Metals, Paper,
Chemical/Process and Mini Hydel. In exports, the focus is on
new equipment in South East Asia, while for replacement
solutions, the key target markets are South Asia and South
East Asia, Middle East and Africa. During FY 18, the domestic
market segments in which the Triveni Gears business
operates have shown marginal increase, combined with
growth coming from indirect exports through OEMs sourcing
gearboxes to meet their export demand.
Major OEMs for high-speed turbo applications such as Steam
Turbine, Pumps and Compressors have shown growth in
the domestic as well as export markets. Gears Business
has witnessed good growth in turnover and bookings. The
bookings growth includes diversification into machining of
Wind gear components to utilise excess capacity, and long-
term supplies to Defence and global OEMs.
The Aftermarket segment, along with replacement solutions,
has witnessed growth of 20% in turnover, as a result of
increase in spend towards maintenance spares during the
year. O&G and Process industry along with IPPs have been
the major contributors to growth in this segment.
The Company is exploring other avenues of growth
and utilising its existing infrastructure for component
manufacturing, aligned to the customer’s drawing, on a serial
production basis, and contracts for these have been signed.
Similarly, the Company is also exploring the possibility of
venturing into Marine Defence engineered products.
The expected business from the strategic supply agreement
with GE Oil and Gas could not materialise due to slackened
global demand owing to the slowdown in Global Oil and
Gas Market. However, during the last quarter, business has
witnessed encouraging order inflow from GE.
Market Overview
Gearbox for steam turbines segment order booking has shown
a growth of 55% in the financial year under review, both from
domestic and exports regions. In the refinery sector, several
expansions have been announced, which are likely to fructify
into new orders in the coming year, even though some growth
in this segment on account of upgradations was witnessed
even in FY 18. The Government’s initiative to revive the
Fertiliser sector has given a boost to pump and compressor
manufacturers, thus triggering expected growth for
our products.
Only few thermal plant projects were contracted, which
resulted in lower orders for Boiler feed pump requirement
during the year, and the trend is likely to continue in
the coming years as the focus is on non-thermal power
generation due to environmental concerns. Gas turbine
based power generation continues to be operating at very
low capacity due to low availability and high gas price.
In the Hydel segment, due to environmental clearances
etc., not many projects were taken up during FY 18. Other
infrastructure dependent sectors like Cement and Steel have
shown mild growth, owing to increase in capacity utilisation
and better financial health of the sector.
Globally, the Oil and Gas segment is still not showing big
growth, despite increase in oil prices; capex is dependent
on sustainability of oil prices. The geopolitical issues and
increase in shale gas production have also resulted in lack
of investment in new greenfield projects. However, in the
domestic O&G sector, some improvement in capex spend
is being witnessed due to upgradation of plants to BS6
norms – a trend that is likely to continue in the coming years.
Replacement markets in the O&G segment is also seeing
some growth in investments in the domestic market, though
the international markets continue to remain muted.
P. 39
Annual Report 2017-18
02-17 | Co
rpo
rate Overview
24-101 | Statuto
ry Rep
orts
18-23 | Man
agem
ent Statem
ents
102-266 | Finan
cial Statemen
ts

Segments
OEM
Triveni Gears is a dominant player in high-speed Gears
segment in India. Having achieved over 80% of the domestic
market share across OEMs, it is expanding its market reach
and dominance in select South East Asian markets. The
Company also supplies gear boxes for Hydel application and
low-speed applications, including reciprocating pumps and
compressors, mill drives and pump drives.
Replacement, Refurbishing and Spares
This has been a dominant market segment for the Gears
business and, being an OEM, customers repose confidence
in the offerings of the Company. This market is governed
by quick response, robust service capabilities and strong
stakeholder relationship. The business caters to the same
products as in the OEM segment and all other critical products
in the low speed segment. The service solutions provided by
the Company for proactive health monitoring of all types of
critical gearboxes, high-speed and low-speed, and its strong
inventory of dimension-ready sites create a differentiator
vis-à-vis competition in terms of offering a quick solution,
should the need arise. Apart from technical competence, the
speed and quality of response provided by the service team
is critical for customers to decide order placement, and the
Company scores high in this area. The solutions provided
by the Company are technologically at par while remaining
cost competitive in comparison to international competitors.
This, coupled with a shorter lead time, provides a competitive
advantage to Triveni in this business segment.
Loose Gearing
The market dynamics of this segment are similar to the
OEM segment. This segment demands a capacity availability
of critical machines like hobbing, teeth grinding, as well as
surface grinding. The Company has a limited yet strategic
presence in the segment.
Exports
In order to have reach and access to international customers,
Triveni Gears has appointed agents in South Africa and
African region, Malaysia, UAE, etc., and it is expected to yield
results over a period of time. It is in the process of evaluating
and strengthening its network of agents in other geographies,
namely Vietnam, Thailand, Philippines and Turkey.
Performance Overview
The performance of Triveni Gears has been encouraging
across metrics, and also has firmed up its footprint through
diversification into Wind Gears machining by entering into a
multi-year agreement with a global OEM. Bookings, turnover
and order position have witnessed growth of 85%, 32%
and 133%, respectively. In addition, lateral diversification
into engineered products in Naval Defence space has also
been undertaken by the Company, unleashing higher growth
potential in upcoming sectors like Defence.
Key highlights of FY 18:
Domestic
An order of highest power of 64 MW Gearbox received from
GE Triveni Ltd. for an export order
Entry into prestigious Defence project for design,
development, manufacture and supply of prototype Turbo
Extraction Condensate Pump and fin stabilisers
Supply of gear internals for 5 OPV project for the naval
marine
Received multiple orders for replacement of high power
gears and gearboxes of European makes from diverse
industries
100% market share in boiler feed pump segment
Exports
Received a large order from GE PT for high power
gearboxes through GE NP for an overseas project
Received order from global multinational high-speed
pump manufacturers for gearboxes
Introductory order received for integrally geared
compressor from China and approved for long-term
sourcing
Multiple orders received from global customers for
replacement of high-speed turbo gears across various
geographies
P. 40

INDIAN WATER INDUSTRY
Triveni is focussed on two major customer segments in its
Water business – Municipal and Industrial. This section gives
an overview of the current state and future evolution of the
Water industry in India.
Market Analysis
With more than 18% of the world’s population and only 4%
of world’s renewable water resources, India presents a huge
business potential. It has been estimated that the water
demand in the country will increase from 710 BCM (Billion
Cubic Meters) in 2010 to almost 1180 BCM in 2050. Increasing
urbanisation is significantly pushing water demand in India,
and exerting considerable stress on civic authorities to provide
basic requirements, such as safe drinking water, sanitation
and infrastructure. Rising industrialisation, to support the
rapid urbanisation, and increase in the demand of energy, is
further affecting the demand-supply scenario of water.
The domestic and industrial water consumption is expected to
increase almost 2.5 times by 2050. The Central Government
has been committed to enhancing the water availability and
quality through various measures over the past two decades.
The country is still facing challenges like water deficiency,
mismanagement of water resources, regional disparities,
groundwater depletion and contamination, and inefficiencies in
usage. The estimated sewage generation in the country till 2015
was 61,754 MLD, as against the developed sewage treatment
capacity of 22,963 MLD, leading to about 62% of untreated
sewage being discharged directly into nearby water-bodies.
Industry experts are optimistic that these issues can be
resolved with the implementation of innovative solutions
for more efficient water management through Demand
Side Management, Enhanced Water Use Efficiency and
Wastewater Recycling.
Demand Drivers
Various estimates suggest that India’s water sector is a USD
4 billion market, with an expected double-digit growth in
the coming years. Stringent environment norms, depleting
groundwater sources, commissioning of industrial hubs/
SEZs are the key drivers for the industrial segment. In the
municipal segment, the Central Government policies, along
with the focus of State Governments and municipalities
on improving their performance in providing water and
sanitation to citizens, are the major demand drivers. The
Government-related projects contribute over 50% of
the revenues in the market, with private sector projects
constituting the remaining. India is one of the biggest
markets in size and growth rate, but the volume of capital
expenditure is the lowest compared to other countries
globally. This suggests that India has the largest potential
for further growth in this segment.
Government Policy Framework
The Central Government has devised various schemes
to address the gaps in accessing fresh water. The direct
financial assistance for water sector projects at the state
level, and funding from multilateral and bilateral agencies,
The domestic and industrial water consumption is expected to increase almost 2.5 times by 2050.
P. 41
Annual Report 2017-18
02-17 | Co
rpo
rate Overview
24-101 | Statuto
ry Rep
orts
18-23 | Man
agem
ent Statem
ents
102-266 | Finan
cial Statemen
ts

are giving further impetus to the growth of this sector. The
National Water Mission, launched by the Central Government,
focusses on increasing water use efficiency at least by 20%,
attention on overexploited areas, and promotion of basin level
integrated water resources management. The Government
has also established wastewater discharge standards
for all segments, including municipal and industrial. The
Government’s recent initiatives – Clean Ganga Mission,
Swachh Bharat Mission and Smart Cities projects – augur
well for the sector.
Business Opportunities
The Central Government is planning to spend ̀ 20,000 crore
till 2019-2020 on cleaning Ganga river under “Namami
Gange” programme, increasing the budget by four-fold,
and with 100% Central share. The implementation of the
programme is divided into phases. The medium-term
activities (to be implemented within 5 years of the time
frame) will focus on arresting the municipal and industrial
pollution entering into the rivers, along with creation of
2,500 MLD municipal sewage treatment capacity. For
managing the industrial pollution, industries located
along Ganga have been directed to implement zero liquid
discharge. All the industries have to install real-time online
effluent monitoring stations. In Union Budget 2017-18,
` 2,250 crore has been allocated towards Namami Gange –
National Ganga Plan.
The Government has also allocated about ` 9,000 crore for
two central schemes – Atal Mission for Rejuvenation and
Urban Transformation (AMRUT) and ‘Smart Cities’ Mission.
The Smart Cities and AMRUT schemes support the creation
of world-class urban environments in select cities, including
the creation of basic infrastructure services in water supply
and sanitation, such as 24X7 water supply, sanitation,
drainage, solid waste management and sewage treatment.
Under the Smart Cities programme, it is proposed to develop
100 smart cities – 99 cities have already been selected so far,
and in the 2018-19 budget, ` 6,169 crore has been allocated.
In the 2018-19 budget, ` 6,000 crore has been allocated for
AMRUT, which aims to develop 500 cities.
In the industrial segment, water availability is critical for
power generation, as power plants need a significant volume
of water for steam generation and cooling. Thermal power
plant, petroleum and refinery, textiles, pulp and paper, and
iron and steel are highly water-intensive sectors where
water is primarily used in heat transfer. As water availability
and quality declines, companies may need to invest in water
infrastructure projects to secure supplies, water treatment
systems, and/or more advanced cooling systems. The
industrial units across the country have to set up effluent
treatment plants and zero liquid discharge systems in order
to curb the release of untreated waste into the water bodies,
as per the Government norms.
Under the Smart
Cities programme,
it is proposed to
develop 100 smart
cities – 99 cities
have already been
selected so far, and in
the 2018-19 budget,
` 6,169 crore has
been allocated.
P. 42

TRIVENI WATER - BUSINESS PERFORMANCE
Continuing its focus on key operational areas of water and
wastewater treatment and management, Triveni Water
(WBG) made significant progress during the year, with
commercial closure of almost all old jobs. This will not only
enable collection of blocked dues but will also improve
focus on revenue earning jobs. A focussed region-wise
business development approach resulted in the Company
making successful strides in southern India in the Municipal
segment. This is expected to multiply the Company’s
presence in hitherto unchartered territories, ably aided by
its track record of completed projects, many of which are
now industry benchmarks.
The market remained inactive during the year, with
extremely low order finalisation. The Company has a strong
bidding pipeline and is hopeful of securing significant
orders as and when these are finalised. The scenario of
order finalisation considerably improved towards the end
of the year, raising prospects of significant order booking
for the Company next year.
Performance Overview
The market remains subdued in the first half of the year due
to various factors, including GST implementation, and most
of the Government bids were re-invited in the later half of
the year with revised commercial document. Another key
factor for the low sentiment in the market was the change in
Government in states like U.P. & Punjab, and other geopolitical
situations in many of the northern as well as some southern
states (Tamil Nadu mainly), where major investments were
expected in this segment. All these factors had a significant
adverse impact on the Company’s business plans.
In view of the minimum infrastructure required in the Water
Business by way of various personnel in the support services
and operating functions, it is imperative to achieve optimal
turnover for profitable operations. In view of problems
attributable to customers, there had been slow execution
of some projects. Also, the order intake was meagre due to
subdued business conditions, leading to lower than optimal
turnover. It is expected that things would start looking up
with better order flow.
In its export market foray, the Company received some jobs
in neighbouring countries, which should gradually lead to
better growth opportunities in the future.
Key Highlights
Secured a contract for a 40 MLD Sewage Treatment Plant
(STP) from Bangalore Water Supply & Sewerage Board
(BWSSB), which will help the city in managing its acute
untreated sewage problems. Project has long-term O&M
contract as part of the scope
From the same client (BWSSB), secured a contract for 210
MLD Sewage Pump House in Bengaluru (Koramangala),
which is very crucial for transferring untreated sewage
to sewage treatment facilities. Due to specific site issues,
this pump house will be constructed using well-sinking
methodology, and will be one of the largest facilities in the
city built with such construction methodology
Completed Performance Guarantee (PG) test successfully
for water treatment plant comprising Condensate
Polishing Units (CPU) and DM plants for M/s Gas Authority
of India Ltd (GAIL) at their Pata (U.P.) petrochemical facility,
and has been handed over
Completed PG tests at Effluent Recycling Plant (ERP) of
18,000 M3/day (18 MLD) capacity for M/s Aravalli Power
Company Pvt Ltd (a Joint Venture of NTPC, HPGCL and
IPGCL) at their Jhajjar (Haryana) Thermal Power Plant of
3 X 500 MW capacity. The ERP facility is based on extensive
state-of-the-art treatment scheme, including Ultrafiltration
(UF) and Reverse Osmosis (RO). The water so produced is
being used by the Power Plant as their raw water source,
thus reducing dependence of external fresh water supply
by 18 MLD
Continued good performance for Biogas-based Power
Generation 100 MLD STP at Gurgaon for Haryana Urban
Development Authority (HUDA), as one of the largest
facilities in the National Capital Region (NCR), thereby
contributing its share to Waste-to-Energy programme of
the Government
Outlook
With the precarious water availability scenario, every country,
community and company should seek innovative solutions
for efficient water management. The opportunities presented
by the domestic water sector are enormous. Synchronised
efforts of the public and private sectors can lead to the
development of integrated water solutions to resolve the
water crisis in the country.
P. 43
Annual Report 2017-18
02-17 | Co
rpo
rate Overview
24-101 | Statuto
ry Rep
orts
18-23 | Man
agem
ent Statem
ents
102-266 | Finan
cial Statemen
ts

Various schemes under JICA (Japan International Cooperation
Agency) funding have started the bidding process for various
large-sized STP projects, particularly in Delhi. Various
Industrial clusters are expected to finalise their Common
Effluent Treatment Plants (CETP) in the coming year, due
to increasing pressure from the National Green Tribunal
(NGT), specially for the industries where up to 70% Central
Government funding is available.
The industrial market, except for PSUs, remained subdued
during the year, due to various economic factors, and the
Company does not expect a major change in this segment
for the next couple of years. Desalination for large projects
will be driven by the states of Tamil Nadu and Gujarat. KfW,
a German developmental funding agency, and JICA have
committed funding towards mega-sized drinking water
Desalination projects, which should pave the way for setting
up of large desalination plants.
The industry needs to develop new and more cost-effective
technology and design systems that work for local needs
while improving efficiencies. The sector would remain one
of the key focus areas for the country in the medium to long
term, as improved water resources management contributes
significantly to increased production and productivity, thus
boosting the country’s economic growth.
COMMUNITY DEVELOPMENT INITIATIVES
Triveni’s community development initiatives are focussed
on five key areas - education, healthcare, environment,
community enhancement and sports & recreation.
Education
The Company runs schools at three of its major sugar units
namely Khatauli, Deoband and Ramkola. The Company
established Lala Puran Chand Sawhney Memorial Inter
College, Deoband as a primary school in the year 1970. Now
this school imparts education up to Class 12th to the children
of the factory employees as well as to the poorest of poor
family’s children in the vicinity of the factory at a very nominal
fee. The Company has established a basic Prarambhik
Pathshala and Rai Bahadur Ishwardas Sawhney Junior High
School under the aegis of Rai Bahadur Ishwardas Sawhney
Educational Society, Khatauli. The Company also support
Smt. Gopi Devi Girls Junior High School, Ramkola to facilitate
girls’ education in the area. More than 1,300 students are
enrolled in these schools out of which around 85% students
are from the financially weaker section. These schools
encourage activity-based learning. For inclusive growth of
students, the schools organise various activities like painting
and drawing competition, essay writing competition, singing
and dancing competition, sports activities etc.
The Company runs schools at three of its major sugar units namely Khatauli, Deoband and Ramkola.
P. 44

Early childhood care and education is now being universally
recognised as a crucial input for overall development of
Pre-Primary child. Realising this, many Non-Governmental
Organisations like Pratham, Mysore have come up with model
Preschool centres called Balawadis which advocate and
practice play-way methods. The Company supports Pratham in
its effort to address the Pre-School needs of children in slums
and narrow lanes in Mysore. Pratham Mysore’s Balawadi
programme targets children from low-income families in the
age group of 3-5½ years and familiarises them with schooling
such that ‘school-going’ becomes a habit. The Company also
sponsored E-Learning kit at Government Higher Primary
School at Bhogatgalli village, outskirts of Mysore. This was in
collaboration with Rotary Mysore West in its mission “Rotary
India Literacy Project”.
Healthcare
The Company established dispensaries for the employees and
the nearby villagers since the time of commissioning of sugar
units at Khatauli, Deoband and Ramkola in 1930s. This initiative
was taken to provide free medical facilities to the employees and
the villagers of the nearby areas who could not afford medical
expenses and first aid facilities. These dispensaries provide
free treatment for general ailments. The villagers from the
nearby areas come for the first aid and routine check-ups in the
dispensary and get free medical aid. On an average, around 200
patients are treated every day at these dispensaries. The sugar
units also organise health check-up camps, blood donation
and vaccination camps from time to time for the employees
and nearby villagers. The Company sponsors Akshaya Patra
Programme of ISKCON, which offers free, nutritious mid-day
meals to underprivileged children studying in Government
primary school in and around Mysore. The programme helps in
increased enrolment of children in schools, enhanced classroom
performance of children and improves nutrition status.
Environment, community enhancement and
sports & recreation
The Company organises Inter unit sports activities for
employees with the purpose of enhancing various skills like
team building, managing stress and conflicts and thus helping
employees to develop attitude for success. Various units of
the Company also organise sports activities for residents of
adjoining villages and support community fairs and festivities
with useful contributions for organising such activities. The
sugar units distribute blankets amongst underprivileged
people of surrounding villages. Triveni recognises its
responsibility towards environment protection and realises
the importance of awakening and engaging public at large
to achieve greater impact. All units of the Company regularly
organise tree plantation campaigns throughout the year and
ensure participation of local communities into it.
P. 45
Annual Report 2017-18
02-17 | Co
rpo
rate Overview
24-101 | Statuto
ry Rep
orts
18-23 | Man
agem
ent Statem
ents
102-266 | Finan
cial Statemen
ts

FINANCIAL REVIEW
` lakhs
Description 2017-18 2016-17 Change %
Income from Operations (Gross) 341238 296687 15%
EBITDA 30014 55194 (46%)
Depreciation and Amortisation 5537 5721 (3%)
Finance Cost 8534 12655 (33%)
Profit Before Exceptional / Non-Recurring Items and Tax 15943 36818 (57%)
Exceptional / Non-Recurring Items (Net) (8547)
Tax 4969 4915 1%
Profit After Tax 10974 23356 (53%)
Other Comprehensive Income 122 (449)
Total Comprehensive Income 11096 22907 (52%)
The Profitability in the current financial year was adversely
affected due to significant collapse of sugar prices in the
last quarter of the current year, necessitating write-down of
sugar inventories, which along with estimated export losses
pursuant to the scheme of Minimum Indicative Export Quota
(MIEQ) notified by the Government, impacted the performance
results by ` 219.7 crore. In view of declining sugar prices
as a result of more than expected sugar production in the
SS 2017-18, the Government introduced MIEQ Scheme and
export obligation was mandated for each sugar mill based
on their past production data.
It was otherwise a record performance for the Sugar
Business in terms of crush, recovery and production. After
achieving 45% increase in production in SS 2016-17, it has
further achieved 35% higher production in the SS 2017-18.
The Co-generation business performed much better than
last year due to higher operational days in view of elongated
sugar season and commensurate with increase in crush.
The performance of Distillery was effected as it remained
closed for over a month and operated at lower capacity
due to some NGT mandated checks, which impacted the
overall production. In view of strong commitment of the
Government to pursue and support Ethanol Blending
Programme, the Company has decided to set up additional
distillation capacities at a cost of around ` 200 crore, which
will be largely funded by soft loans to be provided by
the Government.
The gears business performed well during the current year
with robust increase in turnover, profitability and order
booking. The performance of Water business was effected by
delayed execution of projects attributable to customers, cost
overruns, slow intake of orders due to delayed finalisation
and resultant high provisioning. The momentum in order
booking certainly looks promising towards the year-end
and Water Business is confident of securing strong intake
of orders in FY 19, which will lead to improved performance
results.
Raw Material and Manufacturing Expenses
` lakhs
Description 2017-18 2016-17 Change %
Raw material 259820 207983 25%
Percentage to sales 76% 70%
Manufacturing expenses 20398 18220 12%
Percentage to sales 6% 6%
The increase in raw material cost is attributed to 3% increase
in cane prices and 22% increase in cane crush. The cane
price applicable to the SS 2017-18 is at ` 3,150/tonne as
against ` 3,050/tonne in the previous season.
Manufacturing expenses have increased due to higher cane
crush.
Both raw material and manufacturing cost in respect of
sugar business have direct linkage with the cane crush
rather than with sales.
P. 46

Personnel Cost, Administration
Expenses and Depreciation ` lakhs
Description 2017-18 2016-17 Change %
Personnel cost 20240 18771 8%
Percentage to sales 6% 6%
Administration 7785 7750 0%
Percentage to sales 2% 3%
Selling expenses 2087 1523 37%
Percentage to sales 1% 1%
Depreciation &
Amortisation
5537 5721 (3%)
Percentage to sales 2% 2%
The increase in personnel cost is reflective of annual salary
increase. Despite increased activity level, the administrative
expenses have been well controlled and selling expenses
have increased by 37% in view of 24% higher sales volume
in sugar business and additional freight component on sale
of ethanol in the state of U.P.
Finance Cost ` lakhs
Description 2017-18 2016-17 Change %
Interest on term loans 2615 4593 (43%)
Interest on working
capital funds
5583 7615 (27%)
Others 336 447 (25%)
Net finance cost 8534 12655 (33%)
During the year, term loans were repaid to the extent of ̀ 323.98
crore (undiscounted principal), including prepayments of
` 121.38 crore. In view of improved financials, the interest
rates were rationalised with the lenders and the average cost
of term loans was at 8.55%.
The average working capital utilisation during the year was at
` 618 crore which is 15% lower than in the previous year in view
of faster liquidation of sugar stocks relating to the previous year,
lower bank credit due to low valuation of sugar inventories,
and relatively slower cane payment in view of declining sugar
prices. The cost of working capital funds was at 9.03%.
Overall cost of funds was 8.87% as against 9.65% in the
previous year. There was substantial improvement in the debt
profile of the Company and Total Debt : Equity Ratio improved
from 1.99 last year to 1.41 as on March 31, 2018.
Segment Analysis ` lakhs
Revenue PBIT*
Description 2017-18 2016-17 Change % 2017-18 2016-17 Change %
Business Segments
- Sugar 333069 296136 12% 24123 48091 (50%)
- Engineering 28744 27339 5% 1748 1527 14%
- Others 6087 5618 8% 20 31 (35%)
Unallocated/inter unit adjustment (26662) (32406) (1414) (174)
Total 341238 296687 15% 24477 49475 (51%)
*Before exceptional items
The Company has two major business segments – Sugar business and Engineering business. Sugar business comprises sugar
manufacturing operations across 7 Sugar mills, 03 incidental co-generation facilities at three of its Sugar mills, 3 Co-generation
plants located at two of its Sugar mills and a standalone Distillery, all located in the State of U.P. Co-generation plants and
Distillery source captive raw material, namely, bagasse and molasses, from the Sugar mills. Engineering business comprises
of Gears manufacturing at Mysore and Water and Wastewater Treatment business operating from Noida, U.P.
P. 47
Annual Report 2017-18
02-17 | Co
rpo
rate Overview
24-101 | Statuto
ry Rep
orts
18-23 | Man
agem
ent Statem
ents
102-266 | Finan
cial Statemen
ts

Sugar Business Segments
Sugar Operations ` lakhs
Description 2017-18 2016-17 Change %
Turnover 299964 261079 15%
PBIT 11559 36492 (68%)
PBIT/Turnover (%) 4% 14%
Cane crush (MT) 7338500 6005586 22%
Recovery (%) 11.29% 11.01% 0.28%
Cane cost (landed)
(` /MT)
3337 3229 3%
Production of sugar
(MT)
828517 661229 25%
Volume of sugar sold
(MT)
761276 613755 24%
Average realisation
price (` /MT)
36244 36228 0%
During the year, the profitability of sugar operations was
impacted by steep fall in sugar prices in the last quarter
of the year due to which, the Company had to write-down
sugar inventory by ` 219.7 crore, including estimated losses
on exports pursuant to MIEQ Scheme. Increased costs due
to higher cane price and substantial decline in molasses
prices were somewhat mitigated by higher recoveries and
economies of scale.
The operational efficiencies and the productivity of the
sugar units in terms of cane crush and recovery improved
considerably during the year.
Co-generation Business ` lakhs
Description 2017-18 2016-17 Change %
Turnover 20505 17437 18%
Income from carbon
credit/REC
1011 824 23%
Total turnover 21516 18261 18%
PBIT 9890 6942 42%
PBIT/ Total Turnover (%) 46% 38%
Power Generation –
million units
275 216 28%
Power export (%) 66% 63%
The profitability in the Co-generation business was higher
due to higher operating period and higher REC income.
The power generation during the year was higher by 28%
with power exports increasing from 63% to 66% of the total
power generation.
Distillery Business ` lakhs
Description 2017-18 2016-17 Change %
Turnover 11589 16796 (31%)
PBIT 2674 4657 (43%)
PBIT/Turnover (%) 23% 28%
Production (KL) 26624 39721 (33%)
Sales Volume (KL) 28093 38078 (26%)
Avg. realisation price of
alcohol ` /litre (net of
excise duty)
39.36 41.38 (5%)
Profitability in FY 18 is lower than the last year due to lower
capacity utilisation, primarily due to closure of distillery over
a month and its operation at lower capacity, resulting in lower
production by 33% from last year. The previous year includes
an income of ` 8.29 crore due to reversal of provision against
unutilised CENVAT Credit in view of benefit available under
GST Act.
Engineering Business Segment
Gears Business ` lakhs
Description 2017-18 2016-17 Change %
Turnover 11177 9216 21%
PBIT 3142 1802 74%
PBIT/Turnover (%) 28% 20%
The performance of Gear business during the current year
was much improved with 21% increase in turnover and
74% increase in profitability. The activities picked up during
FY 18 as the order booking improved by 84% as compared
to last year.
The outstanding order book as on March 31, 2018 stood
at ` 134 crore including orders of ` 50.8 crore executable
beyond FY 19. The Company is exploring new products,
geographies and actively engaged with the Defence Sector
to tap business opportunities to further improve its turnover
and profitability.
P. 48

Water and Wastewater Treatment Business ` lakhs
Description 2017-18 2016-17 Change %
Turnover 17567 18123 (3%)
PBIT (1394) (275) (407%)
PBIT/Turnover (%) (8%) (2%)
The slow order intake and delayed project execution due
to reasons attributable to customers led to sub-optimal
revenues, cost overruns and resultant provisioning.
During the year, orders of ̀ 125 crore were booked as against
orders of ` 171 crore in FY 17. Orders in hand were at ` 575
crore (including long-term O&M contracts of ̀ 254 crore). The
Company has participated in large number of tenders which
are in various stages of finalisation. The momentum in order
of finalisation is quite evident towards the year-end and the
Company expects to secure significant order booking in FY
19, which will ensure normalisation of operations and growth
in turnover in coming years.
Review of Balance Sheet
Major changes in the Balance Sheet items are explained as
hereunder:
Non-Current Assets
Property, Plant and Equipment
During the year, there have been additions to the extent
of ` 44.33 crore. These mainly include balancing /de-
bottlenecking plant / equipment and facilities at various
sugar units to improve crush as well as capital expenditure
to set up facilities to manufacture 150 tonnes per day of
pharma grade sugar at one of the sugar units.
Income Tax Assets (net)
The income tax assets (net) represents amount receivable
in view of various appeals decided in favour of the Company,
the refund procedures of which are in progress, and amount
excess paid during previous year in anticipation of higher
profitability.
Current Assets
Inventories
Inventories have reduced from ` 1,674.82 crore as on March
31, 2017 to ` 1,579.19 crore as on March 31, 2018. While in
quantitative terms, the sugar inventories held as on March
31, 2018 are higher by 14%, its value has declined to low
valuation rates consequent to significant write-down to net
realisable value.
Other Current Assets
It has reduced from ` 129.80 crore as on March 31, 2017 to
` 86.45 crore as on March 31, 2018, mainly due to utilisation
of substantial unutilised CENVAT balance at distillery after
implementation of GST Act.
Non-Current Liabilities
Equity
Share Capital
It has remained unchanged during the year.
Other Equity
During the year, Other Equity increased by ` 103.19 crore
(14%) to ` 855.07 crore due to profit earned during the year
and transferred to Retained Earnings.
Borrowings
Total long-term borrowings at the year-end, including
current maturities of long-term borrowings, are at ` 163.27
crore as against ` 479.03 crore as at the end of the previous
year. During the year, repayments were made to the extent
of ` 315.76 crore (undiscounted principal repaid - ` 323.98
crore). The long-term borrowings comprise loans of ` 39.34
crore with soft interest or with interest subvention.
Deferred Tax Liability (net)
Deferred tax liability (net) has increased during the year from
` 23.42 crore as on March 31, 2017 to ` 41.72 crore as on
March 31, 2018 mainly on account of utilisation of brought
forward tax losses (recognised as deferred tax assets).
P. 49
Annual Report 2017-18
02-17 | Co
rpo
rate Overview
24-101 | Statuto
ry Rep
orts
18-23 | Man
agem
ent Statem
ents
102-266 | Finan
cial Statemen
ts

Current Liabilities
Borrowings
Short-term borrowings are lower at ` 1,076.47 crore as
against ` 1,242.09 crore as on March 31, 2017. In view of
lower sugar prices at the year-end, the entitlement of Cash
credit limits was pruned as these are dependent on the
prevailing sugar prices.
Trade Payables
Trade payables are higher at ` 628.06 crore as on March 31,
2017 as against to ` 256.58 crore as on March 31, 2017 due
to higher cane dues payable than the previous year wherein
payment of cane price was relatively faster due to improved
fundamentals and liquidity.
Other Financial liabilities
Other Financial liabilities are lower at ` 164.26 crore as
against ̀ 247.46 crore as on March 31, 2018. The reduction is
primarily due to reduction in current maturities of long-term
loans as considerable amount of term loans were repaid/
prepaid during the year.
Other Current liabilities
Other Current liabilities are lower at ` 79.92 crore as against
` 171.88 crore as on March 31, 2017. Previous year includes
provision of excise duty of ` 101.89 crore on finished goods
whereas no such provision is required with excise duty
having been subsumed in GST.
RISK MANAGEMENT AND MITIGATION
The Company follows a well-structured Enterprise Risk
Management (ERM) Policy, which requires the organisation
to identify risks which its businesses are exposed to and to
categorise them based on their severity. Risk-based mitigation
plans are laid out for each risk along with designation of
an owner thereof. It is the endeavour of the Company to
continually review and strengthen its systems, processes and
controls to improve the overall risk profile of the Company.
The ERM policy defines the risk parameters within which
the businesses should operate. It helps to build a discipline
within the organisation wherein all business decisions are
taken after assessing the attendant risks and formulating
effective mitigation plans to contain the impact of such risks.
Since the Company is engaged in diversified businesses
having completely different risk profiles, Risk Management
Framework for each business has been devised considering
its complexity and uniqueness.
Sugar business of the Company is agro-based and is largely
dependent on uncontrollable climatic factors and Government
Regulations and Policies whereas the Engineering business
relates to capital goods and infrastructure sectors, which are
dependent on the economic growth of the country.
Sugar Business
Sugar business is exposed to significant external risks,
which mostly are uncontrollable and thus, it is imperative
to optimise the controllable business productivity and
efficiencies on a dynamic basis to counteract the impact
of such uncontrollable external risks. Internal risks, such
as, engineering breakdowns, cane procurement logistics,
storage of sugar etc., are moderate and are by and large
repetitive and manageable.
It is the objective of the Company to be amongst the top
performers in UP, way above the average, so that it remains
less impacted by the cyclicality associated with this industry.
Some of the external risks which the Sugar business faces
with are described herein below:
Risk of unrealistic Cane Price: The Company has all its
sugar mills located in the State of Uttar Pradesh (U.P.) where
the sugarcane price is declared by the State Government
and the price so declared (State Advised Price – SAP) is
normally much higher than the Fair and Remunerative Price
(FRP) declared by the Central Government. If the cane price is
unrealistically fixed and is not commensurate with the output
(sugar) prices, the Company may incur losses.
With a view to secure a long-term sustainable solution,
the sugar industry has been vigorously representing to the
Government to fix realistic cane prices linked with sugar
prices and adopt Dr. Rangarajan Committee report for
revenue sharing. Simultaneously, the Company had been
working vigorously to improve sugarcane quality and had
undertaken a massive cane development programme in
partnership with its farmers to significantly improve quality
of cane to achieve higher recoveries and yields. It appears
from the performance of the last two seasons that the
Company has substantially achieved its objectives, which
will help in mitigating the impact of unrealistic cane prices at
least to some extent, if not fully.
Sugar Price risk: Sugar prices are not controlled and these
are governed by market forces, including domestic demand
P. 50

and supply, international trends, export / import restrictions
etc. Excessive stocks in the country have the effect of
depressing sugar prices. Further, sugar being an essential
commodity, the Government has statutory powers to impose
stock limits or restrict import / export or vary customs duty
to control domestic sugar prices and supplies.
The risk is completely beyond the control of the Company and
there are no adequate hedging mechanisms in the country in
view of limited breadth of the commodity exchange. However,
the Company endeavours to manage the risks through
an effective Sales plan which aims to balance the sugar
realisation prices along with optimum inventory carrying
cost. The Company manufactures around 40% refined sugar
which is sold at a premium to normal sulphitation sugar.
Lately, it has set up facilities to manufacture pharma-grade
sugar at one of its sugar units, with a view to increase the
overall realisation prices. Further, institutional sales form
16% of the total sugar sales and these are generally at higher
realisation than the normal wholesale prices. While all the
aforesaid mitigations cumulatively help in improving sugar
realisation price but these are not adequate to fully mitigate
the risk.
Risk of Climatic Factors: Climatic factors such as monsoon,
flood, drought and crop diseases impact the yield and sugar
recovery from cane. Lower yields result in lower cane
availability to the sugar mills whereas lower recovery leads
to higher cost of production.
Again such risks being by and large uncontrollable, the
Company focusses on internal efficiencies and productivities to
counter the impact. The Company’s cane staff are quite vigilant
and after the sowing season, they closely monitor the growth
of sugarcane and infestation with disease, if any, so that timely
action could be taken to avert or minimise the damage.
Other Mitigation Measures
The Company has been focussing on cane development
initiatives in a big way and the results achieved during
the last two seasons have been encouraging. After having
achieved 85% higher crush, 58 basis points higher recovery
and 95% higher production over the SS 2015-16, the
Company continues to focus on cane development to further
increase high sugared varieties, to reduce overdependence
on any one variety and reduce lead time from harvest to
crush, which has a favourable impact on the recovery
The Company has integrated sugar operations with
three co-generation plants and a large-sized distillery.
Additionally, the Company has set up three incidental
co-generation plants having aggregate power export
capacity of 11 MW. The operations of such businesses are
profitable and stable
In view of the Government’s commitment to Ethanol
blending programme, the Company is proceeding to set
up another 160 KLPD distillery at its Sabitgarh sugar
unit. With total distillation capacity of 320 KLPD with
incineration boiler based operations of 330 days annually,
the alcohol manufacturing capacity is estimated to
increase by 140%
The Company has stringent budgetary and cost control
systems which help the Company to contain its costs.
Engineering Business
The Gears and Water businesses are in the capital goods
and infrastructure sectors and are largely dependent on the
industrial and general economic conditions in the country
which stimulate demand of the products of our Engineering
businesses. These businesses are exposed to the following
major risks:
Risk of economic slow-down: Slow-down in the economy
results in sluggish demand of the products of the user
industries, which in turn has adverse effect on investment
spend on capital goods required for capacity creation or
modernisation. New markets are regularly explored to
identify business opportunities based on its engineering
strength. For example, Gears Business has secured some
preliminary orders from Defence Sector which may pave the
way for sizeable business in future.
Scarcity of funds: The sluggish demand puts financial stress
on the industrial companies and in view of stressed financials
and risk aversion, the lenders generally subject the projects
to stringent diligence before arriving at funding decisions. The
user industries are forced to defer their expansion plans in view
of delay in funding, resulting in poor off-take of capital goods.
Technology risks: It is extremely vital for the Engineering
business to offer technology and benchmark efficiencies at
par with the competition and in the event of a significant gap
in its offerings as compared to its peers, the customers may
not prefer the products of the Company.
P. 51
Annual Report 2017-18
02-17 | Co
rpo
rate Overview
24-101 | Statuto
ry Rep
orts
18-23 | Man
agem
ent Statem
ents
102-266 | Finan
cial Statemen
ts

Project delays and payment risks: It is particularly more
relevant in the case of Water business where the period
of project completion is normally 2 to 3 years. On account
of problems relating to funds availability with customers,
the project may get delayed, resulting in credit risks, cost
overruns and blockage of working capital.
The Company does proper diligence on its customer prior to
accepting any order, which includes evaluating its financials,
to ensure financial closure of the project, credit ratings (if
any), track record and market feedback, and continues to
closely monitor any financial stress which the customer may
be subject to during the execution of the project.
Gears Business
Unfortunately, the expected business from GE Lufkin
could not fructify due to severe downturn in the global
markets. It’s believed that upon restoration of normalcy,
the Company may be able to secure such business in view
of its large potential
Being associated with the world premier gear manufacturing
companies, best technology is available with the Company.
Additionally, it also endeavours to broad-base its products
and is continually engaged in developing new products for
other industrial segments through R&D efforts
Water Business
To ensure optimal resource allocation, the Water business
accepts product order/projects only beyond a threshold
amount and consequently, it has limited number of
projects of reasonable size to execute. It ensures focussed
management attention and efforts
Before accepting fresh orders, Water business carries
out a detailed credit analysis of the customer and funding
arrangements for the proposed project and the orders are
accepted only from credible customers
In view of financial stress in certain sectors, the Water
business is generally not inclined to accept orders from
these sectors except in cases with special merit
Water Business is also exploring international market to
avoid over dependence on the domestic market.
All these actions help the business to manage its resources
efficiently and effectively, and make use of the opportunities
which may arise due to specific initiatives of the Government
and also due to higher sensitivity and concern for the
environmental issues.
P. 52

P. 53
Annual Report 2017-18
02-17 | Co
rpo
rate Overview
24-101 | Statuto
ry Rep
orts
18-23 | Man
agem
ent Statem
ents
102-266 | Finan
cial Statemen
ts
Directors' Report
Your Directors have pleasure in presenting the 82nd Annual Report and audited financial statements for the Financial Year (FY) ended
March 31, 2018.
FINANCIAL RESULTS
(` in lakhs)
Standalone Consolidated
2017-18 2016-17 2017-18 2016-17
Revenue from operations (Gross) 341238.37 296686.61 341238.37 296686.61
Operating Profit (EBITDA) 30013.82 55194.78 29132.20 54867.83
Finance cost 8533.87 12655.44 8533.97 12655.44
Depreciation and Amortisation 5536.55 5720.99 5536.55 5720.99
Profit before exceptional items & tax 15943.40 36818.35 15061.68 36491.40
Exceptional Items -- (8546.74) -- (8546.74)
Profit before Tax (PBT) 15943.40 28271.61 15061.68 27944.66
Tax Expenses 4969.02 4915.36 4969.68 4916.30
Profit after Tax (PAT), before Share of Net Profit of
Associates10974.38 23356.25 10092.00 23028.36
Share of net profit of Associates 1822.01 2267.76
Profit for the year 10974.38 23356.25 11914.01 25296.12
Other comprehensive income (net of tax) 121.72 (448.62) 120.57 (479.89)
Total comprehensive income 11096.10 22907.63 12034.58 24816.23
Earning per equity share of ` 1 each (in `) 4.25 9.06 4.62 9.81
Retained Earnings brought forward (4954.46) (27842.07) (1498.45) (26297.49)
Appropriation:
- Equity Dividend (including dividend distribution tax) 776.20 - 776.20 -
- Transfer to/ (withdrawn) from molasses storage fund
reserve (net) (6.14) 20.03 (6.14) 20.03
Retained earnings carried forward 5371.58 (49,54.46) 9774.25 (1498.45)
No material changes and commitments affecting the financial position of the company have occurred between end of the financial
year of the Company to which these financial statements relate and the date of this report.
BUSINESS OPERATIONS AND FUTURE PROSPECTS
Sugar Business:
The performance of Sugar operations had been a mixed bag during the year. As against PBIT (before exceptional items) of ` 480.91
crore in FY 17, there has been a decline in profitability to ` 241.23 crore in the current year. The decline is due to significant and
rapid decline in sugar prices from ` 33/Kg as at the end of the third quarter to about ` 28/Kg. as on 31st March 2018, which together
with estimated export losses under the scheme of Minimum Indicative Export Quota (MIEQ) of the Central Government necessitated
significant write-down of inventory. While the country’s production for the season 2017-18 was initially estimated at 25 million
tonnes but the estimates had to be progressively revised upwards in view of unanticipated higher yields, especially in Maharashtra,
and the present final estimate of around 32.4 million tonne is substantially higher than the initial estimates. The surplus sugar
availability over consumption led to collapse of sugar prices and these have crashed to levels much below the cost of production
causing significant losses.
The Government has comprehended the magnitude of the sugar production and resultant surplus and has taken series of actions
to arrest the decline in sugar price, such as, increasing import duty on sugar to 100%, abolition of export duty, stipulating reverse
stock limits for February and March, 2018 and a scheme to export 2 MT of sugar by allocating export quota to all sugar mills. The

P. 54
government is aware that without an increase in sugar prices,
there would be acute financial hardship to the sugar mills which
may render them unable to liquidate cane dues. The action so
far taken by the Government had limited impact on the sugar
prices and the Government is required to take some more
effective steps to resurrect sugar prices by limiting supply in
the short term and encouraging exports all through the next
sugar season to correct adverse demand-supply position. With
the state of UP and Maharashtra showing a higher trend of
production on a sustainable basis, there has been a structural
change and the increase in the overall production in the
country may not be a temporary phenomenon and may exist
on a sustainable basis. Unless the surplus production is not
effectively checked, a situation of glut will depress the sugar
prices causing total mismatch between the input and the output
prices. The Government has done well to declare a new Bio-fuel
Policy permitting sugarcane juice and B-heavy molasses to be
used in the production of Ethanol. The proper implementation of
the policy along with realistic pricing will be the key in promoting
ethanol production, which in turn has the potential to regulate
sugar production. The entire process may take few years till
additional distillation capacities are set up but the process may
be accelerated if some incentive is provided to the industry to
set up such capacities within a prescribed timeframe. Last but
not the least, much awaited reform of linking sugarcane prices
with sugar prices is the only way forward to ensure viability and
self-sufficiency of the industry.
We take pride in highlighting that the company’s operating
performance has significantly improved over the last two
sugar seasons and the Company is now one of top performers
in the State. In a span of two years, sugar production has
almost doubled from 48.8 lac quintals in 2015-16 to 95.2 lac
quintals in sugar season 2017-18 without incurring any capital
expenditure. Further, the Company has judiciously used its cash
flows to substantially pare debts and accordingly, the finance
cost has reduced significantly.
During the year, the Company has also implemented a project
of producing 150 tonne/day pharma quality sugar in order
to improve the overall sugar realization price and to make
the Company resilient to meet normal cyclicality in the sugar
business.
Engineering Business:
The engineering business of the Company is comprised of the
Gears business and the Water business. On a consolidated
basis, the turnover and profitability has remained stable.
There has been significant improvement in the performance
of Gear business in terms of turnover, profitability and order
bookings. While the turnover and the profitability (PBIT) have
increased by 21% and 74% respectively, the increase in order
booking has been 84%. The performance of the Gears business
is commendable, especially, in the present sluggish capital
goods market. The business is evaluating potential business
opportunities in the Defence Sector based on its technological
skills and inherent strength and is endeavouring to target orders
which may lead to sizable business in future. The traction under
strategic supply agreement with GE Lufkin has been slower due
to tough global market conditions and it is hoped that with the
normalisation of business conditions and restoration of demand,
there could be significant uptrend in the business. The Company
has been able to forge alliances with other international players
to develop / manufacture products to meet their specific
requirements and supply on a regular basis.
Water business was adversely impacted in view of delay in
project execution due to reasons attributable to customers
and delayed finalization of orders by prospective customers,
resulting in increase in project costs and provisioning and sub-
optimal turnover. Lately, there has been a distinct momentum
in tendering and awarding contracts, including under National
Mission for Clean Ganga. The Company has bid for various EPC
jobs and it expects favourable outcome leading to better and
steady order inflow during the financial year 2018-19 which will
result in normalisation of the operations of the business.
DIVIDEND
An interim dividend of ` 0.25 per equity share of ` 1/- each
(25%) was declared and paid by the Company during the
financial year ended on March 31, 2018. In view of adverse
business conditions being faced by the sugar industry, the
Board has refrained from recommending any final dividend for
the financial year 2017-18. Accordingly, the interim dividend
declared by the Board of Directors is being proposed to be
confirmed as final dividend for the financial year 2017-18 at
the ensuing Annual General Meeting.
DIVIDEND DISTRIBUTION POLICY
As per the provision of Regulation 43A of Securities and
Exchange Board of India (Listing Obligations and Disclosure
Requirements) Regulations, 2015 (“Listing Regulations”), the
top 500 listed companies, based on market capitalization shall
formulate a Dividend Distribution Policy. Accordingly, policy
was adopted to set out the parameters and circumstances
that will be taken into account by the Board in determining the
distribution of dividend to the shareholders of the Company and
to retain profits earned by the Company. The Policy is available
on the website of the Company at http://www.trivenigroup.com/
investor/corporate-governance/policies.html.

P. 55
Annual Report 2017-18
02-17 | Co
rpo
rate Overview
24-101 | Statuto
ry Rep
orts
18-23 | Man
agem
ent Statem
ents
102-266 | Finan
cial Statemen
ts
SUBSIDIARY AND ASSOCIATE COMPANIES
PERFORMANCE
Associate Companies
Triveni Turbine Ltd. (TTL)
TTL is engaged in the manufacture and design of steam
turbines up to 100 MW and delivers robust, reliable and efficient
end-to-end solutions. The larger of the range – above 30 MW to
100MW – is addressed through GE Triveni Limited, a majority
held exclusive Joint Venture with BHGE.
The Company holds 21.82% stake in the equity shareholding of
TTL. On a consolidated basis, TTL has achieved Net Turnover and
Profit after Tax (PAT) of ` 751 crore and ` 96 crore respectively,
registering an increase of about 1 % in turnover and decline of
22% in PAT. The decline in profitability is due to lower foreign
exchange gains as well as due to costs associated with extensive
international marketing and setting up of new manufacturing
facilities, which will help the Company to secure and service
future growth in orders. It is commendable that despite
challenging business conditions, order booking during the year
has increased by about 17% and export orders constitute about
51% of the total order booking. Consequently, orders book at the
year-end is about 12% higher than the previous year.
The company has been successfully operating globally and is
assisted by its international subsidiaries and overseas offices.
Aqwise-Wise Water Technologies Ltd. (Aqwise)
The Company holds 25.04% stake in the equity capital of Aqwise.
Aqwise recorded its highest order booking in calendar 2017 at
USD 40 million which is a growth of 78% over the previous year
at USD 22.5 million. The order in-take represents a healthy mix
of projects and technology sales, with main growth in turnkey
projects, without civil work in most cases. It has been able to
make an entry into some large global clients, having projects
currently running in various geographies and it will help the
Company to broad base its presence. During 2017, the Company
won the largest single order valued at USD 10 million, which
once executed will enable the company to pre-qualify for even
larger projects. Due to lower carry forward order booking from
the previous year and also due to the finalisation of orders
towards the later part of 2017, the turnover for 2017 was flat
at USD 20 million with a consolidated loss of USD 0.5 million
in comparison to a consolidated net profit of USD 1.3 million
in calendar year 2016.With a strong order booking and carry
forward order-book, the company is poised to achieve good
growth in future.
Subsidiary Companies
The Company has five wholly owned subsidiaries namely Triveni
Industries Ltd., Triveni Engineering Ltd., Triveni Entertainment
Ltd. Triveni Energy Systems Ltd. and Svastida Projects Ltd and
one subsidiary Triveni Sugar Ltd. in which the Company holds
99.99% equity stake. These companies are relatively much
smaller and there has not been any material business activities
in these companies.
As required under the provisions of Section 129 of the
Companies Act, 2013 read with Companies (Accounts) Rules,
2014, a statement containing salient features of the financial
statement of subsidiaries and associates is provided in the
prescribed format AOC-1 as Annexure-A to the Board’s Report.
MATERIAL SUBSIDIARIES
In accordance with the Regulation 16 of the Listing Regulations
none of the subsidiaries of this Company is a material non-
listed subsidiary. The Company has formulated a policy for
determining material subsidiaries. The policy has been uploaded
on the website of the Company at http://www.trivenigroup.com/
investor/corporate-governance/policies.html.
CONSOLIDATED FINANCIAL STATEMENTS
In compliance with the provisions of Companies Act 2013 and
Indian Accounting Standards (Ind AS) as specified in Section
133 of the Act, your Directors have pleasure in attaching the
consolidated financial statements of the Company which form a
part of the Annual Report.
Financial Statements including consolidated financial
statements and the audited accounts of each of the subsidiary
are available on the Company’s website www.trivenigroup.com.
DIRECTORS RESPONSIBILITY STATEMENT
Pursuant to Section 134(5) of the Companies Act, 2013, your
directors confirm that:
a) in the preparation of the annual accounts for the financial
year ended March 31, 2018, the applicable accounting
standards have been followed and there are no material
departures;
b) the directors have selected such accounting policies
and applied them consistently and made judgments and
estimates that are reasonable and prudent so as to give
a true and fair view of the state of affairs of the Company
at the end of the financial year and of the profit of the
Company for that year;
c) the directors have taken proper and sufficient care for
the maintenance of adequate accounting records in
accordance with the provisions of the Companies Act,
2013 for safeguarding the assets of the Company and for
preventing and detecting fraud and other irregularities;

P. 56
d) the directors have prepared the annual accounts on a
going concern basis;
e) the directors have laid down internal financial controls to
be followed by the Company and that such internal financial
controls are adequate and were operating effectively; and
f) the directors have devised proper systems to ensure
compliance with the provisions of all applicable laws and
that such systems were adequate and operating effectively.
CORPORATE GOVERNANCE
In accordance with the listing Regulations, a separate report on
Corporate Governance is given in Annexure-B along with the
Auditors’ Certificate on its compliance in Annexure-C to the
Board’s Report. The Auditors’ Certificate does not contain any
qualification, reservation and adverse remark.
RELATED PARTY CONTRACTS / TRANSACTIONS
The Company has formulated a Related Party Transaction
Policy, which has been uploaded on its website at http://www.
trivenigroup.com/investor/corporate-governance/policies.
html. It is the endeavour of the Company to enter into related
party transaction on commercial and arms’ length basis with a
view to optimise the overall resources of the group.
All transactions entered into with related parties during the year
were in the ordinary course of business of the Company and
at arms’ length basis. The Company has not entered into any
contract/arrangement/transactions with related parties which
could be considered material in accordance with the Policy of
the Company on the materiality of related party transactions.
Form AOC-2 is not attached with this report as there was no
such related party transaction for which disclosure in terms of
Section 134(3)(h) of the Companies Act, 2013 read with Rule 8(2)
of the Companies (Accounts) Rules, 2014 is required.
RISK MANAGEMENT POLICY AND INTERNAL FINANCIAL
CONTROL
The Company has a risk management policy the objective of
which is to lay down a structured framework for identifying
potential threats to the organisation on a regular basis,
assessing likelihood of their occurrence, designate risk owners
to continually evaluate the emergent risks and plan measures to
mitigate the impact on the Company, to the extent possible. The
framework and the system are reviewed from time to time
to enhance their usefulness and effectiveness. The policy
recognizes that all risks in the business cannot be eliminated
but these could be controlled or minimized through effective
mitigation measures, effective internal controls and by defining
risk limits.
A comprehensive Risk Management Framework has been
put in place for each of the businesses of the Company
which is stringently followed for the management of risks,
including categorisation thereof based on their severity. Such
categorisation gives highest weightage to the risks which have
the potential to threaten the existence of the Company. The risks
with higher severity receive more attention and management
time and it is the endeavour of the Company to strengthen
internal controls and other mitigation measures on a continuous
basis to improve the risk profile of the Company.
Risk Management System has been integrated with the
requirements of internal controls as referred to in Section 134(5)
(e) of the Companies Act, 2013 to evolve risk related controls.
Detailed internal financial controls have been specified covering
key operations, to safeguard of assets, to prevent and detect
frauds, to ensure completeness and accuracy of accounting
records, to ensure robust financial reporting and statements
and timely preparation of reliable financial information. These
are achieved through Delegation of Authority, Policies and
Procedures and other specifically designed controls, and
their effectiveness is tested regularly as per the well laid out
mechanism as well as through external agencies.
DIRECTORS AND KEY MANAGERIAL PERSONNEL (KMP)
As per the provisions of the Companies Act, 2013 (Act), Mr Tarun
Sawhney, Vice Chairman and Managing Director will retire by
rotation at the ensuing Annual General Meeting (AGM) of the
Company and being eligible, seeks re-appointment. The Board
has recommended his re-appointment.
The Company has received declarations of Independence
in terms of Section 149 of the Act and also under the Listing
Regulations from all the Independent Directors.
As required under the provisions of Section 203 of the Act, the
Key Managerial Personnel namely, Vice Chairman & Managing
Director, CFO and Company Secretary continue to hold that
office as on the date of this report.
EMPLOYEES STOCK OPTION
There are no outstanding stock options and no stock options
were either issued or allotted during the year.
AUDITORS
Statutory Audit
M/s S.S. Kothari Mehta & Co. (SSKM), Chartered Accountants (FRN:
000756N) were appointed as Statutory Auditors of the Company
at the 81st AGM to hold office for a period of five consecutive years
from the conclusion of that AGM until the conclusion of 86th AGM
of the Company to be held in the year 2022.

P. 57
Annual Report 2017-18
02-17 | Co
rpo
rate Overview
24-101 | Statuto
ry Rep
orts
18-23 | Man
agem
ent Statem
ents
102-266 | Finan
cial Statemen
ts
Cost Audit
In terms of the provisions of Section 148 of the Companies
Act, 2013 read with the Companies (Audit and Auditors)
Rules, 2014 and the Companies (Cost Records and Audit)
Rules, 2014 duly amended, Cost Audit is applicable to the
Sugar and Gears businesses of the Company for the FY 2018-
19. Mr Rishi Mohan Bansal and Mr. T.L. Sangameswaran,
Cost Accountants have been appointed as Cost Auditors to
conduct the cost audit of the Sugar businesses (including
cogeneration and distillery) and Gears business respectively
of the Company for the FY 2018-19, subject to ratification
of their remuneration by the shareholders at the ensuing
Annual General Meeting. The Board recommends the
ratification of the remuneration of the Cost Auditors for the
FY 19.
COMMENTS ON THE AUDITOR’S REPORT
Statutory Audit
The Auditors report for FY 18 does not contain any qualification,
reservation or adverse remark. Further pursuant to section
143(12) of the Act, the Statutory auditors of the Company has
not reported any instances of fraud committed in the Company
by its officers or employees, the details of which would need to
be mentioned in the Board’s Report.
In para i (c) of Annexure -A to the Auditors Report, the auditor
has reported that in 38 cases having book value of 394.60
lakh, the title deeds are not held in the name of the Company.
The total area of land and cost thereof involved in these
cases are not material. The transfer of land in the name of
the Company in few cases could not be completed on account
of certain technicalities/documentary deficiencies, which the
Company is trying to resolve to the extent feasible. In certain
other cases, the transfer process has not been completed
in view of the decision of the Company to dispose of certain
parcels of land, which are no longer part of its business
requirements. However, all such land continues to remain in
the possession of the Company.
Secretarial Audit
In terms of Section 204 of the Companies Act, 2013 read
with the Companies (Appointment and Remuneration of
Managerial Personnel) Rules, 2014, the Board appointed M/s
Suresh Gupta & Associates, a firm of Company Secretaries in
practice to undertake the Secretarial Audit of the Company.
The report on secretarial audit is annexed as Annexure-D
to the Board’s report. The report does not contain any
qualification, reservation or adverse remark.
DISCLOSURES
Corporate Social Responsibility (CSR)
The CSR Policy is available on the Company’s website at
http://www.trivenigroup.com/investor/corporate-governance/
policies.html.
The composition of the CSR Committee is provided in the
Corporate Governance Report that forms part of this Annual
Report. In view of earlier losses, no formal CSR activity has been
initiated during the period under review and therefore, no annual
report on CSR activity is provided with this report. However, the
Company continues to remain engaged in meaningful charitable
work, primarily around its area of operations.
AUDIT COMMITTEE
The composition of Audit Committee is provided in the Corporate
Governance Report that forms part of this Annual Report.
VIGIL MECHANISM
The Company has established a vigil mechanism through the
Whistle Blower Policy and it oversees the genuine concerns
expressed by the employees and other directors through the
Audit Committee. The vigil mechanism also provides for adequate
safeguards against victimisation of employees and directors who
may express their concerns pursuant to this policy. It has also
provided direct access to the Chairperson of the Audit Committee
in appropriate or exceptional cases. The policy is uploaded on
the website of the Company at http://www.trivenigroup.com/
investor/corporate-governance/policies.html.
DISCLOSURE UNDER THE SEXUAL HARASSMENT OF
WOMEN AT WORKPLACE (PREVENTION, PROHIBITION
AND REDRESSAL) ACT 2013
The Company has an Anti-Sexual Harassment Policy in line with
the requirements of Sexual Harassment of Women at Workplace
(Prevention, Prohibition and Redressal) Act 2013. No compliant
was received by the Internal Complaint Committee.
BOARD MEETINGS
During the year, four board meetings were held, the details of
which are provided in the Corporate Governance Report that
forms part of this Annual Report. The maximum interval between
the two meetings did not exceed 120 days as prescribed under
the Companies Act, 2013 and the Listing Regulations.
PARTICULARS OF LOANS, GUARANTEES OR
INVESTMENTS MADE UNDER SECTION 186 OF THE
COMPANIES ACT, 2013
Note 6 of the standalone financial statements of the Company
contained in the Annual report, provides the particulars of

P. 58
the investments made by the Company in the securities of
other bodies corporate and Notes 8 and 48 provide details of
loans advanced. The Company has not given any guarantee or
provided any security in connection with a loan to any other
body corporate or person.
CONSERVATION OF ENERGY, TECHNOLOGY ABSORPTION,
FOREIGN EXCHANGE EARNINGS AND OUTGO
The particulars required under Section 134(3)(m) of the
Companies Act, 2013 read with the Companies (Accounts) Rules,
2014 are provided in Annexure-E to the Board’s report.
PARTICULARS OF EMPLOYEES
The information as required under Section 197 of the Companies
Act, 2013 read with Rule 5(1) of the Companies (Appointment
and Remuneration of Managerial Personnel) Rules, 2014 is
provided in Annexure-F to the Board’s Report.
The particulars of employees drawing remuneration in excess
of limits set out in the Rule 5(2) of Companies (Appointment
and Remuneration of Managerial Personnel) Rules, 2014 are
provided in Annexure-G to the Board’s Report. However, as per
the provisions of Section 136 of the Companies Act, 2013, the
annual report is being sent to all the members of the Company
excluding the aforesaid information. The said information is
available for inspection by the members at the registered office
of the Company up to the date of the ensuing Annual General
Meeting. Any member interested in obtaining such particulars
may write to the Company Secretary at the registered office of
the Company.
MANAGEMENT’S DISCUSSION AND ANALYSIS
In terms of the provisions of Regulation 34 of the Listing
Regulations, the Management Discussion and Analysis is set out
in this Annual Report.
BUSINESS RESPONSIBILITY REPORT
The Listing Regulations mandate top 500 listed entities based
on the market capitalization as on March 31, 2017, the inclusion
of the Business Responsibility Report as part of the Directors’
Report of the Company. The report in the prescribed form is
annexed as Annexure-H to the Board Report.
SECRETARIAL STANDARDS
The Company has devised proper systems to ensure compliance
with the provisions of all applicable Secretarial Standards
issued by the Institute of Company Secretaries of India and that
such systems are adequate and operating effectively.
DEPOSITS
The Company has not accepted any public deposits under
Section 73 of the Companies Act, 2013.
DEBENTURES
No debentures were issued during the period under review.
EXTRACTS OF ANNUAL RETURN
Pursuant to Section 92(3) of the Companies Act, 2013 and Rule
12(1) of the Companies (Management and Administration)
Rules, 2014, extracts of the annual return in the prescribed form
is annexed as Annexure-I to the Board’s Report.
SIGNIFICANT AND MATERIAL ORDERS
There are no significant and material orders passed by the
regulators or courts or tribunal impacting the going concern
status and Company’s operations in future.
HUMAN RESOURCES
Your Company believes and considers its human resources
as the most valuable asset. The management is committed to
provide an empowered, performance oriented and stimulating
work environment to its employees to enable them to realise
their full potential. Industrial relations remained cordial and
harmonious during the year.
POLICY ON DIRECTORS’ APPOINTMENT AND
REMUNERATION
The policy of the Company on Directors’ appointment and
remuneration, including criteria for determining qualifications,
positive attributes, independence of a director and other
matters provided under sub-section (3) of Section 178 of the
Companies Act, 2013, adopted by the Board is available on
the website of the Company at http://www.trivenigroup.com/
investor/corporategovernance/policies.html.
BOARD EVALUATION MECHANISM
Pursuant to the provisions of Companies Act, 2013 and Listing
Regulations, the Board has carried out annual performance
evaluation of its own performance, that of individual Directors
as well as evaluation of its committees. The evaluation criteria,
as defined in the Nomination and Remuneration Policy of the
Company, covered various aspects of Board such as composition,
performance of specific duties, obligations and governance.
The performance of individual directors was evaluated on
parameters, such as, number of meetings attended, contribution
made in the discussions, contribution towards formulation of the

P. 59
Annual Report 2017-18
02-17 | Co
rpo
rate Overview
24-101 | Statuto
ry Rep
orts
18-23 | Man
agem
ent Statem
ents
102-266 | Finan
cial Statemen
ts
growth strategy of the Company, independence of judgement,
safeguarding the interest of the Company and minority
shareholders, additional time devoted besides attending Board
/ Committee meetings. The Directors have expressed their
satisfaction with the evaluation process.
APPRECIATION
Your Directors wish to take the opportunity to express their
sincere appreciation to our customers, suppliers, shareholders,
employees, the Central, Uttar Pradesh and Karnataka
Governments, financial institutions, banks and all other
stakeholders for their whole-hearted support and co-operation.
We look forward to their continued support and encouragement.
For and on behalf of the Board of Directors
Dhruv M. Sawhney
Place: Noida (U.P.) Chairman and Managing Director
Date : May 24, 2018 DIN: 00102999

P. 60
STATEMENT CONTAINING SALIENT FEATURES OF THE FINANCIAL STATEMENT OF SUBSIDIARIES OR ASSOCIATE
COMPANIES OR JOINT-VENTURES
Part A : Subsidiaires
(` in Lakhs)
Name of the subsidiary Triveni Energy
Systems Ltd.
Triveni
Engineering Ltd.
Triveni
Entertainment
Ltd.
Triveni
Sugar Ltd.
Svastida
Projects Ltd.
Triveni
Industries
Limited
(TESL) (TEL) (TENL) (TSL) (SPL) (TIL)
Wholly Owned
Subsidiary
Wholly Owned Subsidiary
Wholly Owned Subsidiary
Subsidiary Wholly Owned Subsidiary
Wholly Owned Subsidiary
Date of becoming
subsidiary/acquisition
15.02.2008 27.06.2006 20.03.2014 19.03.2014 19.03.2014 22.07.2015
1. Reporting period for the
subsidiary concerned,
if different from the
holding company’s
reporting period
NA NA NA NA NA NA
2. Reporting currency and
Exchange rate as on the
last date of the relevant
Financial year in the case
of foreign subsidiaries
NA NA NA NA NA NA
3. Share capital 385.00 265.00 417.00 5.00 215 0.50
4. Reserves & surplus -9.65 -23.51 -19.70 -4.00 -9.01 -3.38
5. Total assets 375.50 441.79 397.45 1.14 206.17 0.60
6. Total Liabilities 0.15 200.30 0.15 0.14 0.18 3.48
7. Investments 369.28 435.94 383.37 - 200.00 -
8. Turnover - - - - - -
9. Profit before taxation -1.23 -1.38 1.76 -0.82 -1.19 -1.09
10. Provision for taxation - - 0.64 0.02 - -
11. Profit after taxation -1.23 -1.38 1.12 -0.84 -1.19 -1.09
12. Proposed Dividend - - - - - -
13. Extent of shareholding
(in %age)
100.00% 100.00% 100.00% 99.99% 100.00% 100.00%
Note: All the above subsidiaries are relatively much smaller and no material business activities are being carried out in these companies.
Part “B”: Associates and Joint Ventures
Name of Associates or Joint Ventures Triveni Turbine Ltd. Aqwise-Wise Water
Technologies Ltd.
1. Latest audited Balance Sheet Date 31-Mar-18 31-Dec-17
2. Date on which the Associate or Joint Venture was acquired 01.10.2010 30.07.2012
3. Shares of Associate or Joint Ventures held by the company on the year end
- No of shares 72000000 13008
- Amount of Investment in Associates/Joint Venture (` Lakhs) 720.07 3006.19
- Extent of Holding % 21.82 25.04
Annexure-A

P. 61
Annual Report 2017-18
02-17 | Co
rpo
rate Overview
24-101 | Statuto
ry Rep
orts
18-23 | Man
agem
ent Statem
ents
102-266 | Finan
cial Statemen
ts
Name of Associates or Joint Ventures Triveni Turbine Ltd. Aqwise-Wise Water
Technologies Ltd.
4. Description of how there is significant influence Due to equity stake
being more than
20%
Due to equity stake
being more than
20%
5. Reason why the associate/joint venture is not consolidated Being consolidated Being consolidated
6. Networth attributable to Shareholding as per latest audited Balance Sheet
(` Lakhs)9865.51 826.00
7. Profit or Loss for the year (after tax) (` Lakhs) – as per consolidated financial
statements 9596.95 347.08*
i. Considered in Consolidation (` Lakhs)** 1735.10 86.91
ii. Not Considered in Consolidation -- --
* Based on unaudited consolidated results for the period 1.4.2017 to 31.3.2018.
** Net of tax on undistributed profits.
For and on behalf of the Board of Directors of Triveni Engineering & Industries Limited
Dhruv M. Sawhney Homai A. Daruwalla
Chairman and Managing Director Director & Chairperson Audit Committee
Place: Noida (U.P.) Suresh Taneja Geeta Bhalla
Date : May 24, 2018 Group CFO Group Vice President & Company Secretary

P. 62
COMPANY’S PHILOSOPHY ON CODE OF GOVERNANCE
Your Company is of the belief that sound Corporate Governance is
vital to enhance and retain stakeholder trust. Good Governance
underpins the success and integrity of the organisation,
institutions and markets. It is one of the essential pillars for
building an efficient and sustainable environment, systems and
practices to ensure that the affairs of the Company are being
managed in a way which ensure accountability, transparency,
fairness in all its transactions in the widest sense and meeting
its stakeholder’s aspirations and societal expectations. Your
Company is committed to adopt the best governance practices
and their adherence in the true spirit at all times. It envisages
the attainment of a high level of transparency and accountability
in the functioning of the Company and in the way it conducts
business internally and externally.
In line with the above philosophy, your Company continuously
strives for excellence through adoption of best governance
and disclosure practices. The Company recognises that
good governance is a continuing exercise and thus reiterates
its commitment to pursue highest standard of Corporate
Governance in the overall interest of its stakeholders.
Your Company has been consistently working for the betterment
of the governance system executed with the Stock Exchanges.
We are committed to doing things in the right way which
includes but not limited to compliance with its applicable legal
requirement.
THE HIGHLIGHT OF THE CORPORATE GOVERNANCE
SYSTEM INCLUDES:
1. The Board of Directors of the Company is well represented
with Executive, Non-Executive and Independent Non-
Executive Directors with the Executive Chairman and
Managing Director. As on the date of this report, the
Independent & Non-Executive Directors form about 67% of
the Board of Directors.
2. The Board has constituted several Committees viz. Audit
Committee, Nomination and Remuneration Committee,
Stakeholders Relationship Committee, Corporate Social
Responsibility Committee and Executive Sub Committee
for more focused attention. The Board is empowered to
constitute additional functional Committees from time to
time, depending on the business needs.
3. The Company has established a Code of Conduct for
Directors and Senior Management of the Company.
4. Whistle Blower Policy wherein the Employees and
Directors may have the direct access to the Chairperson of
the Audit Committee.
5. Risk Management framework to identify the risk for its
businesses, to assess the probability of its occurrence and
its mitigation plans. The information about the framework
is placed before the Audit Committee and the Board
periodically.
BOARD OF DIRECTORS
The Company is managed and guided by the Board of Directors
(“Board”). The Board formulates the strategy, regularly reviews
the performance of the Company and determines the purpose
and values of the Company. The Board provides and evaluates
the strategic direction of the Company, management policies and
their effectiveness and ensures that the long-term interests of
the shareholders are being served. The Chairman and Managing
Director with the support of the Vice Chairman and Managing
Director and senior executives oversees the functional matters
of the Company.
As on the date of this report, the Board comprises of nine (9)
Directors - 6 (six) Non-Executive and Independent Directors
including one Women Director, 1(one) Non Executive Non-
Independent Director and 2 (two) Executive Directors. All the
members of the Board are eminent persons with professional
expertise and valuable experience in their respective areas of
specialisation and bring a wide range of skills and experience
to the Board.
None of the Directors on the Board is a Member on more than
10 Committees, and Chairperson of more than 5 Committees
across all listed companies in which he is a Director. Necessary
disclosures regarding Committee positions have been made by
the Directors.
Meetings of the Board
The Board of Directors met four times during the FY 18 ended
on March 31, 2018. The interval between any two successive
meetings did not exceed one hundred and twenty days. Board
Meetings were held on May 20, 2017, August 10, 2017, November
8, 2017 and February 12, 2018.
Independent Directors
All the Independent Directors have confirmed that they meet
the criteria as stipulated under Regulation 16(1)(b) of the
Securities and Exchange Board of India (Listing Obligations
Annexure-B
CORPORATE GOVERNANCE REPORT

P. 63
Annual Report 2017-18
02-17 | Co
rpo
rate Overview
24-101 | Statuto
ry Rep
orts
18-23 | Man
agem
ent Statem
ents
102-266 | Finan
cial Statemen
ts
and Disclosure Requirements) Regulations, 2015 (‘Listing
Regulations’) read with Section 149(6) of the Companies Act,
2013. All such declarations were placed before the Board. The
maximum tenure of independent directors is in compliance
with the Companies Act, 2013 and the terms and conditions of
their appointment have been disclosed on the website of the
Company.
FAMILIARISATION PROGRAMME FOR INDEPENDENT
DIRECTORS
All the Directors including Independent Directors are provided
with the necessary documents / brochures, reports and internal
policies, codes of conduct to enable them to familiarise with
the Company’s procedure and practices. Directors are regularly
updated on performance of each line of business of the
Company, business strategy going forward and new initiatives
being taken / proposed to be taken by the Company through
presentation. Factory visits are organised, as and when required,
for the Directors. The details of the familiarisation programme
of the Independent Directors are available on the Company’s
website at http://www.trivenigroup.com/investor/corporate-
governance/policies.html
SUCCESSION PLANNING FOR THE BOARD AND SENIOR
MANAGEMENT
Board of Directors
The Nomination and Remuneration Committee (NRC) of the
Board, shall identify the suitable person for appointment at
Board level including from the existing top management. The
NRC shall apply due diligence process to determine competency
of person(s) being considered for appointment or re-
appointment as a Director including Managing Director / Whole-
time Director of the Company in accordance with the provisions
of the Nomination and Remuneration Policy of the Company and
the applicable provisions of the Companies Act, 2013 and the
Rules made thereunder and the SEBI (LODR) Regulations, 2015,
as amended from time to time.
Senior Management
The Managing Director(s) / Executive Director (s) are empowered
to identify, appoint and remove the Senior Management
Personnel in accordance with the provisions of the NRC Policy,
and keeping in view the organization’s mission, vision, values,
goals and objectives.
COMPOSITION OF THE BOARD
The composition of the Board of Directors, their attendance at Board Meetings held during the year and at the last Annual General
Meeting (AGM) as also the details of Directorships and Committee positions held by them in other companies are given below:-
Name of the Director Category No. of Board
Meetings
Attendance
at last AGM
held on
22-Sep-17
No. of other
Directorships*2
No. of Committees
positions held
in other companies*3
Held Attended Chairman Member
Mr. Dhruv M. Sawhney*1
Chairman and Managing
Director
DIN-00102999
Promoter &
Executive
Director
4 4 No 2 1 None
Mr. Tarun Sawhney*1
Vice Chairman and
Managing Director
DIN-00382878
Promoter &
Executive
Director
4 4 Yes 3 None 1
Mr. Nikhil Sawhney*1
DIN-00029028
Promoter & Non-
Executive Director
4 4 Yes 3 None 2
Dr. F.C. Kohli
DIN-00102878
Independent Non-
Executive Director
4 1 No 1 None None
Lt. Gen. K.K. Hazari (Retd.)
DIN-00090909
Independent Non-
Executive Director
4 3 No 2 2 None
Mr. Shekhar Datta
DIN- 00045591
Independent Non-
Executive Director
4 4 No 3 2 1
Ms. Homai A. Daruwalla
DIN-00365880
Independent Non-
Executive Director
4 4 Yes 8 2 3

P. 64
Name of the Director Category No. of Board
Meetings
Attendance
at last AGM
held on
22-Sep-17
No. of other
Directorships*2
No. of Committees
positions held
in other companies*3
Held Attended Chairman Member
Dr. Santosh Pande
DIN-01070414
Independent Non-
Executive Director
4 4 No 2 None 2
Mr. Sudipto Sarkar
DIN-00048279
Independent Non-
Executive Director
4 4 No 4 None 5
*1 Mr. Tarun Sawhney and Mr. Nikhil Sawhney are sons of Mr. Dhruv M. Sawhney, Chairman & Managing Director of the Company and are thus related.
*2 Excludes Directorships in Indian Private Limited Companies, Foreign Companies, Firms, Partnerships including LLPs, Section 8 Companies and
membership of various Chambers and other non-corporate organisations.
*3 The committees considered for the purpose are those prescribed under Regulation 26(1) of Listing Regulations i.e. Audit Committee and
Stakeholders’ Relationship Committee of public limited companies, whether listed or not.
BOARD FUNCTIONING AND PROCEDURE
Board Meeting Frequency and circulation of Agenda papers
The Board and its Committees meet at regular intervals
for discussion on agenda circulated well in advance by the
Company. All material information is incorporated in the agenda
for facilitating meaningful and focused discussion at the
meeting. Where it is not practical to attach or send the relevant
information as a part of agenda papers, the same are tabled at
the Meeting. To meet business exigencies, resolutions in respect
of urgent matters are passed by the Directors by Circulation.
The Company has proper systems to enable the Board to
periodically review compliance reports of all laws applicable
to the Company, as prepared by the Company as well as steps
taken by the Company to rectify instances of non-compliances.
The Board reviewed compliance reports prepared by the
Company on quarterly periodicity.
Presentation by the Management
The senior management of the Company is invited at the meetings
to make presentations to the Board, covering operations of the
businesses of the Company, Strategy and Business Plans and to
provide clarifications as and when necessary.
Access to Employees
The Directors bring an independent perspective on the issues
deliberated by the Board. They have complete and unfettered
access to any information of the Company and to any employee
of the Company.
Availability of Information to Board Member includes:
going forward, new initiatives being taken / proposed to be
taken and business plans of the Company.
expenditure budgets and any updates.
business segments.
officers just below the Board level, including appointment
or removal of Chief Financial Officer and the Company
Secretary.
notices which are materially important.
material effluent or pollution problems.
the Company, or substantial non-payment for goods sold /
services provided by the Company.
claims of substantial nature, including any judgment or
order which, may have passed strictures on the conduct of
the Company or taken an adverse view regarding another
enterprise that can have negative implications on the
Company.
goodwill, brand equity, or intellectual property.

P. 65
Annual Report 2017-18
02-17 | Co
rpo
rate Overview
24-101 | Statuto
ry Rep
orts
18-23 | Man
agem
ent Statem
ents
102-266 | Finan
cial Statemen
ts
Any significant development in Human Resources /
Industrial Relations front like signing of wage agreement,
implementation of Voluntary Retirement Scheme etc.
assets, which is not in normal course of business.
the steps taken by the management to limit the risks of
adverse exchange rate movement, if material.
requirements and shareholders servicing issues, such as
non-payment of dividend, delay in share transfer etc.
Company.
Post Meeting follow up Mechanism
The important decisions taken at the Board / Committee
meetings are promptly communicated to the respective units/
departments. Action taken report on the decisions of the
previous meeting(s) is placed at the immediately succeeding
meeting of the Board/ Committee for information and review
by the Board.
Re-appointment of Director
The information / details pertaining to Director seeking
re-appointment in ensuing Annual General Meeting (AGM), is
provided in the Notice for the AGM. The Notice contains the
relevant information, like brief resume of the Directors, nature
of their expertise in specific functional areas and names of the
companies in which they hold Directorship and membership of
any Committee of the Board.
BOARD COMMITTEES
The Board of Directors have constituted following Committees
consisting of Executive and Non Executive Directors of the
Company with adequate delegation of powers to meet various
mandatory requirements of the Act and Listing Regulations
and perform as also to oversee business of the Company
and to take decisions within the parameters defined by the
Board. The Company Secretary acts as the Secretary to all the
Committees of the Board:
1. Audit Committee
2. Nomination and Remuneration Committee
3. Stakeholders’ Relationship Committee
4. Corporate Social Responsibility Committee
Details on the role and composition of these committees,
including the number of meetings held during the financial year
and the related attendance are provided below:
(I) Audit Committee
Composition, Meetings & Attendance
The Committee is headed by an Independent Director
and consists of the members as stated below. The Audit
Committee met four times during the FY 18 ended on March
31, 2018 i.e. on May 19, 2017, August 10, 2017, November
7, 2017 and February 12, 2018. The composition and
attendance of each Audit Committee Member is as under:-
Name of the
Member
Category No. of Meetings
Held Attended
Ms. Homai A.
Daruwalla –
Chairperson
Independent Non-
Executive Director
4 4
Mr Tarun
Sawhney
Promoter &
Executive Director
4 4
Mr Shekhar
Datta
Independent Non-
Executive Director
4 4
Lt. Gen. K.K.
Hazari (Retd.)
Independent Non-
Executive Director
4 3
The Chairperson of the Audit Committee attended the
last AGM held on September 22, 2017 to answer the
shareholders’ queries.
The terms of reference of the Committee inter-alia
include:-
(i) Reviewing the Company’s financial reporting process
and its financial statements.
(ii) Reviewing the accounting and financial policies and
practices and compliance with applicable accounting
standards.
(iii) Reviewing the efficacy of the internal control
mechanism, monitor risk management policies
adopted by the Company and ensure compliance with
regulatory guidelines.
(iv) Reviewing reports furnished by the internal and
statutory auditors, and ensure that suitable follow-up
action is taken.
(v) Examining accountancy and disclosure aspects of all
significant transactions.

P. 66
(vi) Reviewing with management the quarterly, half
yearly & annual financial statements including review
of qualifications, if any, in the audit report before
submission to the Board for approval.
(vii) Recommending appointment of external and internal
auditors and fixation of audit fees.
(viii) Seeking legal or professional advice, if required.
(ix) Approval or any subsequent modifications of
transactions of the Company with related parties.
(x) Scrutiny of Inter-Corporate loans and investments.
(xi) Valuation of undertakings or assets of the Company,
wherever required.
The constitution and term of reference of the Audit
Committee meet the requirements of Regulation 18 of the
Listing Regulations read with the relevant provisions of the
Companies Act, 2013.
(II) Nomination and Remuneration Committee (NRC)
Composition, Meetings & Attendance
The NRC is headed by an Independent Director and
consists of the members as stated below. The NRC didn’t
meet during the FY18 ended on March 31, 2018. The
composition of Committee is as under:-
Name of the Member Category
Lt. Gen. K.K. Hazari (Retd.) -
Chairman
Independent Non-
Executive Director
Mr Shekhar Datta Independent Non-
Executive Director
Mr Nikhil Sawhney Promoter & Non-
Executive Director
Dr Santosh Pande Independent Non-
Executive Director
The broad terms of reference of the NRC include:
Directors (Executive, Non-Executive and Independent
Directors) and who may be appointed in senior
management in accordance with the criteria laid down,
removal and shall carry out evaluation of every
director’s performance.
positive attributes and independence of a director
and recommend to the Board a policy, relating to
the remuneration for the directors (Executive, Non-
Executive and Independent Directors), key managerial
personnel and other employees.
Managerial Personnel;
Company’s Employee Stock Option Schemes (ESOP
Schemes) including grant of stock options under the
ESOP Schemes to the permanent employees of the
Company from time to time in accordance with SEBI
Guidelines/Regulations; and
reference and recommend any proposed change to
the Board for its approval.
The constitution and term of reference of the NRC meet the
requirements of Regulation 19 of the Listing Regulations
read with the relevant provisions of the Companies Act,
2013 and the SEBI ESOP Guidelines/Regulations.
Remuneration Policy
In terms of the provisions of the Companies Act, 2013
and the Listing Regulations, the Board of Directors of the
Company has adopted Nomination and Remuneration
Policy for nomination and remuneration of Directors, Key
Managerial Personnel (KMP) and Senior Management,
which forms part of this Annual Report. The Nomination
and Remuneration Committee inter-alia recommends the
remuneration of Executive Directors, which is approved
by the Board of Directors, subject to approval of the
shareholders, wherever necessary. The Chairman and
Managing Director and Vice Chairman and Managing
Director evaluates the Senior Management Personnel,
including KMPs considering the competencies/indicators
provided in the Remuneration Policy.
Performance Evaluation Criteria for Independent
Directors
The Nomination and Remuneration Committee has
laid down the criteria for evaluation of performance of
Independent Directors based on the indicators provided in
the Remuneration Policy. The performance evaluation of
Independent Directors (IDs) was done by the entire Board
of Directors, excluding the ID being evaluated, based on
parameters, such as, number of meetings attended, inputs
and contribution made, independence of judgement,
effectiveness etc.

P. 67
Annual Report 2017-18
02-17 | Co
rpo
rate Overview
24-101 | Statuto
ry Rep
orts
18-23 | Man
agem
ent Statem
ents
102-266 | Finan
cial Statemen
ts
Remuneration to Executive Directors
The remuneration to the Executive Directors is
recommended by the Nomination and Remuneration
Committee to the Board and after approval by the Board,
the same is put up for the Shareholders approval. Executive
Directors do not receive any sitting fees for attending the
Board and Committee meetings.
During the FY 18 ended on March 31, 2018, the Company
had two Executive Directors viz. Mr. Dhruv M Sawhney,
Chairman and Managing Director (CMD) and Mr. Tarun
Sawhney, Vice Chairman and Managing Director (VCMD).
The details of remuneration paid/payable to CMD and
VCMD during the FY 18 ended on March 31, 2018 are as
under:
(` in Lakhs)
Name of the
Executive Director
Mr. Dhruv M.
Sawhney
Mr. Tarun
Sawhney
CMD VCMD
No. of Equity Shares
held
38391756 14695375
Service Period 31.03.2015 to
30.03.2020
01.10.2013 to
30.09.2018
Salary (in `) Nil 182.70
Contribution to PF &
other funds
Nil 29.16*
Other Perquisites Nil 27.87
Total Nil 239.73
*does not include gratuity as it is provided based on
actuarial valuation.
During the year, Mr Dhruv M. Sawhney has not drawn
any remuneration from this Company in his capacity as
Chairman and Managing Director of the Company. He has
drawn remuneration from Triveni Turbines DMCC, Dubai
(UAE), a foreign step-down subsidiary of an Associate
Company, Triveni Turbine Ltd. (TTL). The remuneration
drawn by Mr Tarun Sawhney is within the ceiling prescribed
under the Companies Act, 2013 and in accordance with the
approval of the Board and the Shareholders of the Company.
Remuneration to Non-Executive Directors (NEDs)
The Company pays sitting fee to its NEDs for attending
the meetings of the Board and its Committees within the
limits prescribed under the provisions of the Companies
Act, 2013. In addition to the sitting fees, the NEDs are
entitled to profit based commission within the limits
approved by the shareholders of the Company. During
the FY18 ended March 31, 2018, the performance of the
Company has considerably improved and there has been
substantial profits. However, there has not been adequate
profits for payment of commission to NEDs after setting off
accumulated losses pertaining to earlier years. In view of
this, no provision for commission to NEDs has been made.
The details of the remuneration paid/provided during the
FY 18 ended on March 31, 2018 to NEDs are as follows:-
(` in Lakhs)
Name of the Non-
Executive Director
Sitting
Fees
Commission No. of
Equity
Shares
held
Dr. F. C. Kohli 1.25 Nil Nil
Lt. Gen. K. K.
Hazari (Retd.)
5.50 Nil Nil
Mr. Shekhar Datta 6.00 Nil 10000
Mr. Nikhil Sawhney 3.70 Nil 15277653
Ms. Homai A.
Daruwalla
6.00 Nil Nil
Dr. Santosh Pande 4.00 Nil Nil
Mr. Sudipto Sarkar 4.00 Nil Nil
None of the Independent / Non-Executive Directors have any
pecuniary relationship or transactions with the Company,
its promoters and its senior management, its subsidiaries
and associate companies except for the payment of
remuneration as stated above. Lt. Gen K.K. Hazari (Retd.),
Mr. Shekhar Datta, and Dr. Santosh Pande, Independent
Directors have received sitting fee / commission as Director
and Member of Board/Committees of Triveni Turbine
Ltd. (Associate Company), whereas Mr. Nikhil Sawhney,
Promoter & Non-Executive Director is the Vice Chairman
and Managing Director of the said Associate Company and
has drawn remuneration from that Company.
During the year, the Company has not issued any Stock
Option to the Directors including Independent Directors
under its ESOP Schemes.
(III) Stakeholders’ Relationship Committee
Composition, Meetings & Attendance
The Committee is headed by an Independent Director and
consists of the members as stated below. The Committee
met four times during the FY 18 ended on March 31, 2018
i.e. on May 20, 2017, August 10, 2017, November 7, 2017
and February 12, 2018. The composition and attendance of
each Committee Member is as under:-

P. 68
Name of the
Member
Category No. of Meetings
Held Attended
Lt. Gen. K.K.
Hazari (Retd.) -
Chairman
Independent Non-
Executive Director
4 3
Mr Tarun
Sawhney
Promoter &
Executive Director
4 4
Mr Nikhil
Sawhney
Promoter & Non-
Executive Director
4 4
Function and term of reference
The Committee has the mandate to look into and review
the actions for redressal of security holders grievances,
such as non-receipt of transferred / transmitted share
certificates /annual report / declared dividend etc. as also
to review the reports submitted by the Company Secretary
relating to approval / confirmation of requests for share
transfer/ transmission / transposition/ consolidation/
issue of duplicate share certificates/ sub-division, remat,
demat of shares etc. from time to time.
The constitution and term of reference of the Stakeholders’
Relationship Committee meet the requirements of
Regulation 20 of the Listing Regulations read with the
relevant provisions of the Companies Act, 2013. Ms. Geeta
Bhalla, Group Vice President & Company Secretary has
been designated as the Compliance Officer of the Company.
Details of investor complaints
During the FY 18 ended on March 31, 2018, the Company
received complaints from various shareholders / investors
directly and/or through the Stock Exchanges / SEBI
relating to non-receipt of dividend / redemption money,
annual report/notice of general meeting, new share
certificates etc. All of them were resolved / replied suitably
by furnishing the requisite information /documents. Details
of investor complaints received and resolved during the FY
18 are as follows:
Opening Balance Received Resolved Pending
Nil 13 13 Nil
Further there were no pending share transfers and
requests for dematerialisation as on March 31, 2018.
(IV) Corporate Social Responsibility Committee (CSR
Committee)
The Committee is headed by an Independent Director and
consists of four members, viz. Ms. Homai A. Daruwalla –
Chairperson, Dr. Santosh Pande, Mr Tarun Sawhney and
Mr Nikhil Sawhney. During the FY 18 ended on March 31,
2018, the CSR Committee didn’t meet as the Company was
not required to initiate any CSR activity due to past years’
losses.
The CSR Committee is authorized to formulate and
recommend to the Board, a CSR policy indicating the
activity or activities to be undertaken by the Company
as specified in Schedule VII of the Companies Act, 2013;
recommend the amount to be spent on such activities;
monitor the Company’s CSR policy periodically and
institute a transparent monitoring mechanism for the
implementation of the CSR projects.
The constitution and term of reference of the CSR
Committee meet the requirements of relevant provisions
of the Companies Act, 2013.
Other Committees
Executive Sub-Committee
Apart from the above statutory committees, the Board of
Directors have constituted an Executive Sub-Committee
comprising of four (4) Directors to oversee routine matters
that are in the normal course of the business. The Board of
Directors have delegated certain powers to this Committee
to facilitate the working of the Company. The Committee
met six times during the FY18 ended on March 31, 2018.
GENERAL BODY MEETINGS
Particulars of the last three Annual General Meetings are as follows:
Year Date & Day Location Time Special Resolution
2016-17 September 22, 2017
Friday
Company’s Guest House
at Deoband Sugar Unit
Complex Deoband,
District Saharanpur,
U.P.
12:30 p.m. None
2015-16 September 14, 2016
Wednesday
Company’s Guest House
at Deoband Sugar Unit
Complex Deoband,
District Saharanpur,
U.P.
12:00 Noon 1. Payment of remuneration
by way of commission
to the Non-Executive
Directors of the Company

P. 69
Annual Report 2017-18
02-17 | Co
rpo
rate Overview
24-101 | Statuto
ry Rep
orts
18-23 | Man
agem
ent Statem
ents
102-266 | Finan
cial Statemen
ts
POSTAL BALLOT
(a) Details of the Special Resolution passed by the Company
through Postal Ballot:
During the FY 18 ended on March 31, 2018, the Company
has not sought approval from its shareholders for passing
of any special resolution through Postal Ballot.
(b) Whether any special resolution is proposed to be
conducted through postal ballot:
There is no immediate proposal for passing any special
resolution through postal ballot on or before ensuing
Annual General Meeting.
(c) Procedure for Postal Ballot:
The Company endeavours to follow the procedure laid
down under the relevant provisions of the Act read with
rules thereof and the provisions of the Listing Regulations
as and when there is any proposal for passing resolutions
by postal ballot.
MEANS OF COMMUNICATION
(a) Quarterly Results: The Unaudited quarterly / half yearly
financial results and the annual audited financial results of
the Company were published in National English and Hindi
newspapers and displayed on the website of the Company
at www.trivenigroup.com and the same were also sent to
all the Stock Exchanges where the equity shares of the
Company are listed. The Investor’s brief were also sent to
Stock Exchanges. The half-yearly unaudited results were
also sent through email to those shareholders, who had
registered their email IDs with the Company/Depositories.
(b) Website www.trivenigroup.com: Detailed information on
the Company’s business and products; quarterly / half
yearly / nine months and annual financial results, Investor
brief and the quarterly distribution of Shareholding are
displayed on the Company’s website.
(c) Teleconferences and Press conferences, Presentation etc.:
The Company held quarterly Investors Teleconferences and
Press Conferences for the investors of the Company after the
declaration of the Quarterly / Annual Results. The Company
made presentations to institutional investors /analysts during
the period which are available on the Company’s website.
(d) Exclusive email ID for investors: The Company has
designated the email id [email protected]
exclusively for investor servicing, and the same is
prominently displayed on the Company’s website www.
trivenigroup.com. The Company strives to reply to the
Complaints within a period of 6 working days.
(e) Annual Report: Annual Report contains inter-alia Audited
Annual Stand-alone Financial Statement, Consolidated
Financial Statement, Directors’ Report and Auditors’
Report. The Management Perspective, Business Review
and Financial Highlights are also part of the annual report.
(f) The Management Discussion & Analysis: The
Management Discussion & Analysis Report forms part of
the annual report.
(g) Intimation to Stock Exchanges: The Company intimates
stock exchanges all price sensitive information or such
other information which in its opinion are material & of
relevance to the shareholders. The Company also submits
electronically various compliance reports / statements
periodically in accordance with the provisions of the Listing
Regulations on NSE and BSE Electronic Filing System.
GENERAL SHAREHOLDER INFORMATION
(a) Annual General Meeting
Date : September 28, 2018
Time : 12.30 p.m.
Venue : Company’s Guest House at Deoband
Sugar Unit Complex, Deoband, Distt.
Saharanpur, Uttar Pradesh-247 554.
(b) Financial Year : April to March
Financial calendar for the financial year 2018-19 (tentative)
Financial Reporting for the
quarter ending June 30, 2018
: By mid of August
2018
Financial Reporting for the
quarter / half year ending
September 30, 2018
: By mid of
November 2018
Financial Reporting for the
quarter / nine months ending
December 31, 2018
: By mid of
February 2019
Year Date & Day Location Time Special Resolution
2014-15 September 23, 2015
Wednesday
Company’s Guest House
at Deoband Sugar Unit
Complex Deoband,
District Saharanpur,
U.P.
12:00 Noon None

P. 70
Financial Reporting for the
annual audited accounts for
the financial year ending
March, 31, 2019
: By the end of
May 2019
(c) Listing on Stock Exchanges
The equity shares of the Company are listed at the following
stock exchanges:
Sl.
No.
Name and Address of Stock Exchanges Stock
Code
1. BSE Ltd., Phiroze Jeejeebhoy Towers,
Dalal Street, Fort, Mumbai - 400 023.
532356
2. National Stock Exchange of India Ltd.
Exchange Plaza,5th Floor, Plot No. C/1,
G Block, Bandra (E), Mumbai - 400 051.
TRIVENI
The Company has paid the listing fees for the Financial
Year 2018-2019 to both the aforesaid Stock Exchanges.
(d) Market Price Data/Stock Performance: FY 18 ended on
March 31, 2018
During the year under report, the trading in Company’s
equity shares was from April 1, 2017 to March 31, 2018.
The high low price during this period on the BSE and NSE
was as under:-
Month Bombay Stock
Exchange (BSE)
National Stock
Exchange (NSE)
High Low High Low
April, 2017 100.00 89.00 99.90 89.00
May, 2017 95.20 77.00 95.25 76.80
June, 2017 80.20 68.45 80.40 68.05
July, 2017 85.40 69.50 85.40 69.50
August, 2017 107.90 80.30 108.00 80.00
September, 2017 96.50 83.40 96.30 83.10
October, 2017 101.90 85.80 101.70 85.55
November, 2017 99.00 85.00 98.55 84.60
December, 2017 90.50 73.20 89.90 73.15
January, 2018 80.40 60.95 80.30 60.70
February, 2018 71.35 57.00 71.50 57.00
March, 2018 64.35 39.95 64.70 39.80
(e) Performance of the share price of the Company in
comparison to the BSE Sensex
Stock Performance Graph
Triv
en
i S
ha
re P
rice
(B
SE
) `
BS
E S
en
se
x
120
100
80
60
40
20
0
Ap
r17
Ma
y17
Jun
17
Jul1
7
Au
g1
7
Oct
17
Se
p1
7
No
v17
De
c17
Jan
18
Fe
b1
8
Ma
r18
40,000
35,000
30,000
25,000
20,000
15,000
10,000
05,000
0
Triveni Share price (BSE) High
Triveni Share price (BSE) Low
BSE Sensex
(f) Registrar & Share Transfer Agent
M/s Karvy Computershare Pvt. Ltd.,
Unit: Triveni Engineering & Industries Limited
Karvy Selenium Tower B, Plot 31-32, Gachibowli
Financial District, Nanakramguda,
Hyderabad – 500 032
Tel. :- Board No.: 040 6716 2222
Fax No.: 040 23001153
Email : [email protected]
(g) Share Transfer System
The Company’s share transfer authority has been delegated
to the Company Secretary / Registrar and Transfer Agent
M/s Karvy Computershare Private Ltd., which generally
approves and confirms the request for share transfer /
transmission / transposition / consolidation / issue of
duplicate share certificates / sub-division, consolidation,
remat, demat and perform other related activities
in accordance with the Listing Regulations and SEBI
(Depositories and Participants) Regulations, 1996 and
submit a report in this regard to Stakeholders’ Relationship
Committee.
The shares sent for physical transfer are registered and
returned within the stipulated period from the date of
receipt of request, if the documents are complete in all
respects. As per the requirement of regulation 40(9) of
the Listing Regulations, a certificate on half yearly basis
confirming due compliance of share transfer/transmission
formalities by the Company from Practicing Company
Secretary has been submitted to Stock Exchanges within
stipulated time.
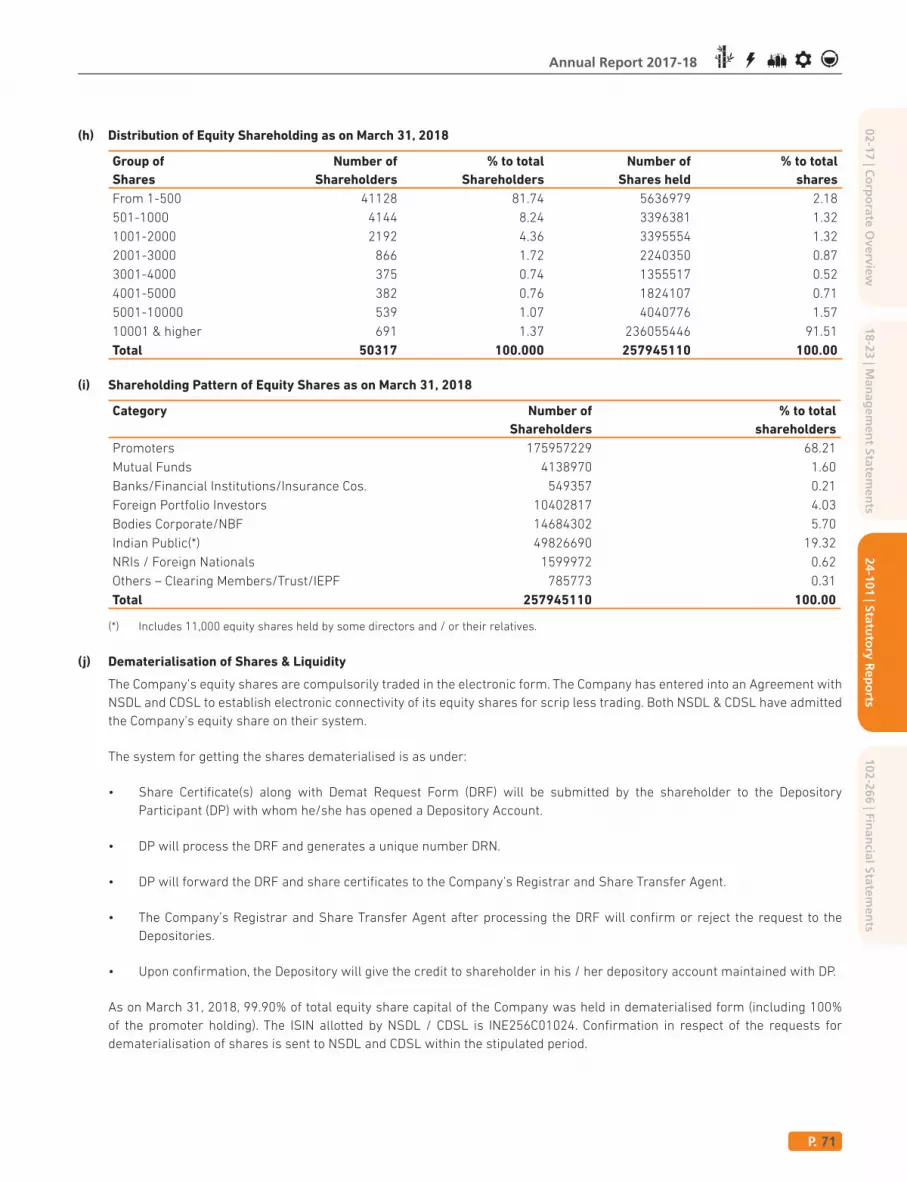
P. 71
Annual Report 2017-18
02-17 | Co
rpo
rate Overview
24-101 | Statuto
ry Rep
orts
18-23 | Man
agem
ent Statem
ents
102-266 | Finan
cial Statemen
ts
(h) Distribution of Equity Shareholding as on March 31, 2018
Group of
Shares
Number of
Shareholders
% to total
Shareholders
Number of
Shares held
% to total
shares
From 1-500 41128 81.74 5636979 2.18
501-1000 4144 8.24 3396381 1.32
1001-2000 2192 4.36 3395554 1.32
2001-3000 866 1.72 2240350 0.87
3001-4000 375 0.74 1355517 0.52
4001-5000 382 0.76 1824107 0.71
5001-10000 539 1.07 4040776 1.57
10001 & higher 691 1.37 236055446 91.51
Total 50317 100.000 257945110 100.00
(i) Shareholding Pattern of Equity Shares as on March 31, 2018
Category Number of
Shareholders
% to total
shareholders
Promoters 175957229 68.21
Mutual Funds 4138970 1.60
Banks/Financial Institutions/Insurance Cos. 549357 0.21
Foreign Portfolio Investors 10402817 4.03
Bodies Corporate/NBF 14684302 5.70
Indian Public(*) 49826690 19.32
NRIs / Foreign Nationals 1599972 0.62
Others – Clearing Members/Trust/IEPF 785773 0.31
Total 257945110 100.00
(*) Includes 11,000 equity shares held by some directors and / or their relatives.
(j) Dematerialisation of Shares & Liquidity
The Company’s equity shares are compulsorily traded in the electronic form. The Company has entered into an Agreement with
NSDL and CDSL to establish electronic connectivity of its equity shares for scrip less trading. Both NSDL & CDSL have admitted
the Company’s equity share on their system.
The system for getting the shares dematerialised is as under:
Participant (DP) with whom he/she has opened a Depository Account.
Depositories.
As on March 31, 2018, 99.90% of total equity share capital of the Company was held in dematerialised form (including 100%
of the promoter holding). The ISIN allotted by NSDL / CDSL is INE256C01024. Confirmation in respect of the requests for
dematerialisation of shares is sent to NSDL and CDSL within the stipulated period.

P. 72
(k) Outstanding GDR / ADR or Warrants
As on date there are no Global Depository Receipts (GDR),
American Depository Receipt (ADR), Warrants or any other
convertible instrument.
(l) Commodity price risk or foreign exchange risk and
hedging activities
Barring sugarcane, the price of which is fixed by
the Government, the Company is not exposed to any
material commodity price risks in respect of other raw
materials. In respect of its final products, the Company is
exposed to sugar price risk and in view of sugar business
being a dominant business of the Company, its impact
is substantial. However, the Company does not have
significant risks from foreign currency fluctuations as
the foreign exposures are nominal. The details on these
risks, mitigation and hedging potential thereof are stated
in Note 41 of the Standalone Financial Statements and in
the Management Discussions & Analysis forming part of
the Annual Report.
(m) Reconciliation of Share Capital Audit
As stipulated by SEBI, a qualified Practicing Company
Secretary carries out Reconciliation of Share Capital Audit
to reconcile the total admitted capital with NSDL and CDSL
and the total issued and listed capital. This audit is carried
out every quarter and the report thereon is submitted to the
Stock Exchanges. The Audit confirms that the total listed
and paid-up capital is in agreement with the aggregate of
the total number of shares in dematerialised form and in
physical form.
(n) Unclaimed Dividend
All unclaimed dividends upto the financial year 2009-
10 (Final & Special Dividend) have been transferred
to the Investor Education and Protection Fund (IEPF),
administered by the Central Government.
The dividends for the succeeding years remaining
unclaimed for 7 years will be transferred by the Company
to the said IEPF on the due dates as given hereunder:
Financial
Year/
Period
Whether
Interim/
Final
Date of
declaration
of Dividend
Due date for
transfer to
IEPF
2010-2011 Final Dividend 10.02.2012 09.02.2019
2011-2012 Final Dividend 19.02.2013 18.02.2020
2017-18 Interim Dividend 10.08.2017 09.08.2024
Shareholders who have not so far encashed their dividend
warrant(s) or have not received the same are requested
to seek issuance of duplicate warrant(s) by writing to the
Company confirming non-encashment / non-receipt of
dividend warrant(s).
(o) Transfer of Equity Shares to Investor Education and
Protection Fund (IEPF)
In compliance with the requirements laid down in Section
124(6) of the Companies Act, 2013 read with the Investor
Education and Protection Fund Authority (Accounting,
Audit, Transfer and Refund) Rules, 2016, the Company
has transferred equity shares of all such shareholders
whose dividends had remained unpaid or unclaimed for
seven consecutive years or more, to the Demand Account
of IEPF. However, the shareholders are entitled to claim
their equity shares including all the corporate benefits
accruing on such shares, if any, from the IEPF Authority
by submitting an online application in prescribed Form
IEPF-5 and sending a physical copy of the said Form duly
signed by all the joint shareholders, if any, as per the
specimen signatures recorded with the Company along
with requisite documents enumerated in the Form IEPF-5,
to the Company’s Registrar & Transfer Agent, M/s Karvy
Computershare Pvt. Ltd., Hyderabad. The Rules and Form
IEPF-5 for claiming back the equity shares are available on
the website of IEPF www.iepf.gov.in. It may please be noted
that no claim shall lie against the Company in respect of
equity shares transferred to IEPF pursuant to the said
Rules. The details of the shareholders whose equity
shares had been transferred to the Demat Account of the
IEPF is available on the website of the Company at www.
trivenigroup.com/investor/shareholders-information/
transfer-of-shares-to-the-iepf.html
p) Locations
Registered Office
Triveni Engineering & Industries Limited
Deoband, Distt. Saharanpur
Uttar Pradesh - 247 554
Tel. :- 01336-222185, 222866
Fax :- 01336-222220
Share Department
Triveni Engineering & Industries Ltd.
8th Floor, Express Trade Towers,
15-16, Sector 16A, Noida-201 301.
Tel. :- 0120-4308000; Fax :- 0120-4311010-11
email :- [email protected]
Plant Locations
Detailed information on plant / business locations is
provided elsewhere in the Annual Report.

P. 73
Annual Report 2017-18
02-17 | Co
rpo
rate Overview
24-101 | Statuto
ry Rep
orts
18-23 | Man
agem
ent Statem
ents
102-266 | Finan
cial Statemen
ts
Address for correspondence
Please contact the Compliance Officer of the Company at
the following address regarding any questions or concerns:
Ms. Geeta Bhalla
Group Vice President & Company Secretary
Triveni Engineering & Industries Ltd.
8th Floor, Express Trade Towers,
15-16, Sector 16A, Noida-201 301.
Tel. :- 0120-4308000; Fax :- 0120-4311010-11
Email :- [email protected]
OTHER DISCLOSURES
During the year, there was no materially significant related
party transaction which may have potential conflict with
the interest of the Company. The Company has formulated a
Related Party Transaction Policy which has been uploaded
on its website at http://www.trivenigroup.com/investor/
corporate-governance/policies.html Details of related
party information and transactions are being placed
before the Audit Committee from time to time. The details
of the related party transactions during the year have been
provided in Note No. 39 to the financial statements.
In the financial statements for the year ended March
31, 2018, the Company has followed the treatment
as prescribed in the applicable Accounting Standards.
stricture imposed on the Company by the Stock
Exchanges, SEBI or any statutory authorities or any
matter related to capital markets.
The Company has complied with all the requirements of
the Stock Exchanges / the Regulations and guidelines
of SEBI and other Statutory Authorities on all matters
relating to capital markets. No penalties or strictures have
been imposed by SEBI, Stock Exchanges or any statutory
authorities on matters relating to capital markets during
the last three years.
has been denied access to the Audit Committee
The Company has established a vigil mechanism through
a Whistle Blower Policy for directors and employees
to report concerns about unethical behavior, actual or
suspected fraud or violation of the Company’s code of
conduct or ethics policy. The mechanism provides for
adequate safeguards against victimisation of director(s) /
employee(s) who express their concerns and also provides
for direct access to the Chairperson of the Audit Committee
in exceptional cases. During the year under review, no
personnel was denied access to the Audit Committee.
Further, no complaint of sexual harassment was received
from any women employee.
The Company has formulated comprehensive Code of
Conduct to regulate, monitor and report trading by Insiders
in line with the SEBI (Prohibition of Insider Trading)
Regulations, 2015. The Code lays down the guidelines
which advise on procedures to be followed and disclosures
to be made, while dealing in shares of the Company and
the consequences of non-compliances.
The Company has laid down a Code of Conduct for all Board
Members and the Senior Executives of the Company. The
Code of conduct is available on the Company’s website www.
trivenigroup.com. They have affirmed their compliance with
the said code of conduct for the financial year ended March
31, 2018. A declaration to this effect duly signed by the
Chairman and Managing Director is given below:
To the Shareholders of Triveni Engineering & Industries Ltd.
Sub.: Compliance with Code of Conduct
I hereby declare that all the Board Members and the Senior
Management Personnel have affirmed compliance with
the Code of Conduct as adopted by the Board of Directors
and applicable to them for the financial year ended March
31, 2018.
Date: May 24, 2018 Dhruv M. Sawhney
Place: Noida (U.P.) Chairman and Managing Director
A prescribed certificate as stipulated in Regulation 17 (8)
of the Listing Regulations duly signed by the Chairman and
Managing Director and Group CFO was placed before the
Board alongwith the financial statements for the FY 18
ended on March 31, 2018. The said certificate is provided
elsewhere in this Annual Report.
adoption of the non-mandatory requirements
The details of mandatory requirements are mentioned
in this Report. The Company is in compliance with the
requirements specified under regulations 17 to 27 and
clauses (b) to (i) of sub-regulation (2) of regulation 46 of the
Listing Regulations, as applicable, with regard to corporate
governance.

P. 74
The status of adoption of the discretionary requirement as
prescribed in Schedule II Part E of the Listing Regulations
is as under:
The opinion expressed by the Auditor in the audit report on
the financial statements for the year ended March 31, 2018
is unmodified.
There are six unlisted Indian subsidiary companies viz.
Triveni Industries Ltd., Triveni Engineering Ltd., Triveni
Energy Systems Ltd., Triveni Entertainment Ltd., Svastida
Projects Ltd. and Triveni Sugar Ltd. Out of these, five are
wholly owned subsidiaries except Triveni Sugar Ltd., which
is a subsidiary. None of these subsidiaries is the “Material
Non-listed Subsidiary” in terms of Regulation 16(1)(c) of
the Listing Regulations. The Company regularly places
before the Board, minutes of the unlisted subsidiaries of
the Company. The Company has a policy for determining
Material Subsidiary which has been uploaded on its
website at http://www.trivenigroup.com/investor/
corporate-governance/policies.html
hedging activities
With respect to inputs, the Company is not exposed to any
material commodity price risks. However, with respect
to the outputs, the Company is exposed to risks relating
to the sugar price. In view of lack of adequate depth in
commodity exchange/s in India, there is little potential of
effective hedging but the Company strives to minimise the
risk by an effective sales strategy.
AUDITORS’ CERTIFICATE ON COMPLIANCE OF
CORPORATE GOVERNANCE
The certificate dated May 24, 2018 from Statutory Auditors of the
Company (M/s SS Kothari Mehta & Co.) confirming compliance
with the Corporate Governance requirements as stipulated
under the Listing Regulations is annexed hereto.
The above report has been adopted by the Board of Directors of
the Company at their meeting held on May 24, 2018.
For and on behalf of the Board of Directors
Dhruv M. Sawhney
Place: Noida (U.P.) Chairman and Managing Director
Date : May 24, 2018 DIN: 00102999

P. 75
Annual Report 2017-18
02-17 | Co
rpo
rate Overview
24-101 | Statuto
ry Rep
orts
18-23 | Man
agem
ent Statem
ents
102-266 | Finan
cial Statemen
ts
INDEPENDENT AUDITOR’S CERTIFICATE ON CORPORATE GOVERNANCE
To
The Members of
Triveni Engineering & Industries Limited
We have examined the compliance of conditions of Corporate Governance by Triveni Engineering & Industries Limited (“the
Company”) for the year ended 31st March, 2018, as stipulated in Regulations 17 to 27 and clause (b) to (i) of Regulation 46 (2) and
paragraphs C, D and E of Schedule V of the Securities and Exchange Board of India (Listing Obligations and Disclosure Requirements)
Regulations, 2015 (‘Listing Regulations’) pursuant to the Listing Agreement of the Company with Stock Exchanges.
MANAGEMENT’S RESPONSIBILITYThe compliance of the Corporate Governance Report is the responsibility of the Management of the Company including the preparation
and maintenance of all relevant supporting records and documents. This responsibility also includes the design, implementation and
maintenance of internal control relevant to ensure the compliance with the conditions of Corporate Governance as stipulated in the
Listing Regulations, issued by the Securities and Exchange Board of India.
AUDITOR’S RESPONSIBILITYOur examination was limited to procedures and implementation thereof, adopted by the Company for ensuring the compliance of
the terms and conditions of Corporate Governance. It is neither an audit nor an expression of opinion on the financial statements of
the Company.
We have examined the relevant records and documents maintained by the Company for the purposes of providing reasonable
assurance on the compliance with Corporate Governance requirements by the Company.
Pursuant to the requirements of the Listing Regulations, it is our responsibility to provide a reasonable assurance whether the
Company has complied with the conditions of Corporate Governance as stipulated in Listing Regulations for the year ended 31st
March, 2018.
We have carried out an examination of the relevant records of the Company in accordance with the Guidance Note on Certification
of Corporate Governance issued by the Institute of the Chartered Accountants of India (the ICAI), the Standards on Auditing specified
under Section 143(10) of the Companies Act 2013, in so far as applicable for the purpose of this certificate and as per the Guidance
Note on Reports or Certificates for Special Purposes issued by the ICAI which requires that we comply with the ethical requirements
of the Code of Ethics issued by the ICAI.
We have complied with the relevant applicable requirements of the Standard on Quality Control (SQC) 1, Quality Control for Firms that
Perform Audits and Reviews of Historical Financial Information, and Other Assurance and Related Services Engagements.
OPINIONBased on our examination of the relevant records and according to the information and explanations provided to us and the
representations provided by the Management, we certify that the Company has complied with the conditions of Corporate Governance
as stipulated in regulations 17 to 27 and Clauses (b) to (i) of Regulation 46(2) and para C , D and E of Schedule V of the Listing
Regulations during the year ended 31st March, 2018.
We state that such compliance is neither an assurance as to the future viability of the Company nor the efficiency or effectiveness
with which the Management has conducted the affairs of the Company.
RESTRICTION ON USE This certificate is issued solely for the purpose of complying with the aforesaid regulations and may not be suitable for any other purpose.
For S. S. Kothari Mehta & Co.
Chartered Accountants
Firm Registration No. 000756N
Yogesh K. Gupta
Place : Noida Partner
Date : May 24, 2018 Membership No. 093214
Annexure-C

P. 76
CEO/CFO CERTIFICATION
To
Board of Directors
Triveni Engineering & Industries Ltd.
We, Dhruv M. Sawhney, Chairman and Managing Director and Mr. Suresh Taneja, Group CFO certify to the Board that:
(a) We have reviewed financial statements and the cash flow statement for the financial year ended March 31, 2018 and that to the
best of our knowledge and belief:
(i) These statements do not contain any materially untrue statement or omit any material fact or contain statements that
might be misleading;
(ii) These statements together present a true and fair view of the Company’s affairs and are in compliance with existing
accounting standards, applicable laws and regulations.
(b) There are, to the best of our knowledge and belief, no transactions entered into by the Company during the year which are
fraudulent, illegal or violative of the Company’s code of conduct.
(c) We accept responsibility for establishing and maintaining internal controls for financial reporting and that we have evaluated
the effectiveness of internal control systems of the Company pertaining to financial reporting and we have disclosed to the
auditors and the Audit Committee, deficiencies in the design or operation of such internal controls, if any, of which we are aware
and the steps we have taken or propose to take to rectify these deficiencies.
(d) We have indicated to the auditors and the Audit Committee:
(i) That there were no significant changes in internal control over financial reporting during the year;
(ii) There are no significant changes in accounting policies during the year; and
(iii) That there were no instances of significant fraud, of which we have become aware and the involvement therein, if any,
of the management or an employee having a significant role in the Company’s internal control system over financial
reporting.
Suresh Taneja Dhruv M. Sawhney
Group CFO Chairman and Managing Director
DIN: 00102999
Place : Noida (U.P.)
Date : May 24, 2018

P. 77
Annual Report 2017-18
02-17 | Co
rpo
rate Overview
24-101 | Statuto
ry Rep
orts
18-23 | Man
agem
ent Statem
ents
102-266 | Finan
cial Statemen
ts
FORM NO. MR-3
SECRETARIAL AUDIT REPORT
For The Financial Year Ended 31st March 2018
[Pursuant to section 204(1) of the Companies Act, 2013 and
rule No.9 of the Companies (Appointment and Remuneration
Personnel) Rules, 2014]
To,
The Members,
Triveni Engineering and Industries Limited
(CIN: L15421UP1932PLC022174)
Deoband, District Saharanpur,
Uttar Pradesh-247 554.
We have conducted the secretarial audit of the compliance of
applicable statutory provisions and the adherence to good
corporate practices by Triveni Engineering and Industries
Limited (hereinafter called the “Company”). Secretarial Audit
was conducted in a manner that provided us a reasonable basis
for evaluating the corporate conducts/statutory compliances
and expressing our opinion thereon.
WE REPORT THAT-
a) Maintenance of secretarial record is the responsibility of
the management of the Company. Our responsibility is to
express an opinion on these secretarial records based on
our audit.
b) We have followed the audit practices and processes as
were appropriate to obtain reasonable assurance about
the correctness of the contents of the secretarial records.
The verification was done on test basis to ensure that
correct facts are reflected in secretarial records. We
believe that the processes and practices, we followed
provide a reasonable basis for our opinion.
c) We have not verified the correctness and appropriateness
of the financial statements of the Company.
d) Where ever required, we have obtained the Management
representation about the compliances of laws, rules and
regulations and happening of events etc.
e) The compliance of the provisions of the Corporate and
other applicable laws, rules, regulation, standards is the
responsibility of the management. Our examination was
limited to the verification of procedures on test basis.
f) The Secretarial Audit report is neither an assurance as to
the future viability of the company nor of the efficacy or
effectiveness with which the management has conducted
the affairs of the Company.
Based on our verification of the Company’s books, papers, minute
books, forms and returns filed and other records maintained
by the Company and also the information provided by the
Company, its officers, agents and authorized representatives
during the conduct of Secretarial Audit, we hereby report that in
our opinion, the company has, during the audit period covering
the financial year ended on 31st March, 2018 (“Audit Period”)
complied with the statutory provisions listed hereunder and also
that the Company has proper Board processes and compliance
mechanism in place to the extent, in the manner and subject to
the reporting made hereinafter:
We have examined the books, papers, minute books, forms and
returns filed and other records maintained by the company for
the financial year ended on 31st March, 2018 according to the
provisions of:
(i) The Companies Act, 2013 (the Act) and the rules made
thereunder;
(ii) The Securities Contracts (Regulation) Act, 1956 (‘SCRA’)
and the rules made thereunder;
(iii) The Depositories Act, 1996 and the Regulations and Bye-
laws framed thereunder;
(iv) Foreign Exchange Management Act, 1999 and the rules
and regulations made thereunder to the extent of Foreign
Direct Investment, Overseas Direct Investment and
External Commercial Borrowings;
(v) The following Regulations and Guidelines prescribed
under the Securities and Exchange Board of India Act,
1992 (‘SEBI Act’):-
(a) The Securities and Exchange Board of India
(Substantial Acquisition of Shares and Takeovers)
Regulations, 2011;
(b) The Securities and Exchange Board of India
(Prohibition of Insider Trading) Regulations, 2015;
(c) *The Securities and Exchange Board of India (Issue of
Capital and Disclosure Requirements) Regulations, 2009;
Annexure-D

P. 78
(d) *Securities and Exchange Board of India (Share
Based Employee Benefits) Regulations, 2014;
(e) *The Securities and Exchange Board of India (Issue
and Listing of Debt Securities) Regulations, 2008;
(f) The Securities and Exchange Board of India
(Registrars to an Issue and Share Transfer Agents)
Regulations, 1993;
(g) *The Securities and Exchange Board of India (Delisting
of Equity Shares) Regulations, 2009;
(h) *The Securities and Exchange Board of India (Buyback
of Securities) Regulations, 1998; and
(i) The Securities and Exchange Board of India
(Listing Obligations and Disclosure Requirements)
Regulations, 2015.
*No event took place under these Regulations during the
Audit period.
We have also examined compliance with the applicable
clauses of the Secretarial Standards on Meetings of the Board
of Directors and General Meetings issued by The Institute of
Company Secretaries of India.
During the period under review, the Company has complied with
the provisions of the Act, Rules, Regulations, Guidelines and
Standards, to the extent applicable, as mentioned above.
(vi) Some of the other laws specifically applicable to the
company are as under:-
We have checked the compliance management system of the
Company to obtain reasonable assurance about the adequacy of
systems in place to ensure compliance of specifically applicable
laws and this verification was done on test basis. In our opinion
and to the best of our information and according to explanations
given to us, we believe that the compliance management
system of the Company is adequate to ensure compliance of
laws specifically applicable to the Company.
We further report that the Board of Directors of the Company is
duly constituted with proper balance of Executive Directors, Non-
Executive Directors and Independent Directors. The changes in
the composition of the Board of Directors that took place during
the period under review were carried out in compliance with the
provisions of the Act.
Adequate notices were given to all directors of the Board
Meetings. Agenda and detailed notes on agenda were sent in
advance and a system exists for seeking and obtaining further
information and clarifications on the agenda items before the
meeting for meaningful participation at the meeting.
Board decisions are carried out with unanimous consent and
therefore, no dissenting views were required to be captured and
recorded as part of the minutes.
We further report that there are adequate systems and
processes in the company commensurate with the size and
operations of the company to monitor and ensure compliance
with applicable laws, rules, regulations, standards and
guidelines.
We further report that during the audit period the Company
has not undertaken any event/action which would have a major
bearing on the Company’s affairs in pursuance of the above
referred laws, rules, regulations, standards, guidelines, etc.
For Suresh Gupta & Associates
Company Secretaries
Suresh Gupta
Proprietor
Date : May 24, 2018 FCS No.:5660
Place: Delhi CP No.:5204

P. 79
Annual Report 2017-18
02-17 | Co
rpo
rate Overview
24-101 | Statuto
ry Rep
orts
18-23 | Man
agem
ent Statem
ents
102-266 | Finan
cial Statemen
ts
A) CONSERVATION OF ENERGY
a) The steps taken or impact on conservation of energy
1. Quality of insulation is improved at Khatauli
Co-generation unit resulting in reduction of un-
accounted losses, including radiation heat.
2. Installed VFDs at centrifugal machines, clear
juice pump and at defecater juice pumps
resulting in saving of power at Khatauli unit.
3. Installation of 62 number LED Flood light of
80W and 150W all over the plant at sugar unit
Khatauli in place of HPSV lights.
4. Provision of 2nd condensate flash for soda boiling
in Evaporators in place of exhaust steam and
installation of 4 Nos flow meters to measure
and control process water resulted in steam
saving at Rani Nangal unit.
5. Installed capacitor banks at different panels to
increase power factor at Rani Nangal unit.
6. 20 HPSV lights of 250 watts replaced by 30 watt
LED lights to save 220 watts of power per light
at Rani Nangal unit.
7. Using state of the art AC VFD drive at centrifugal
machine at pharma sugar section in place of
thyristor controlled DC drive. This has resulted
in around 40 % saving in net power demand at
Sabitgarh unit.
8. Colour coated roof sheets replaced by transparent
sheets at identified locations preventing use of
lighting during day time at Sabitgarh.
9. Energy efficiency measures were taken in boiling
house to cut down the net steam requirement.
This includes addition of direct contact molasses
conditioners, Plate heat exchangers to recover
the heat from condensate, altering the vapour
bleeding system to utilize later effect vapours &
using variable frequency drive at defecated juice
pumping at Sabitgarh unit.
10. Extensive use of energy saving high end LED
lights to cut down energy consumption at
Sabitgarh.
11. Installed LT capacitors at Milak Narayanpur
to improve power factor and consequently to
reduce power losses.
12. Installed VFD at Boiler feed water pump
resulting in power saving at Milak Narayanpur.
13. Replaced 4 Flap pumps with progressive cavity
pumps on B and C magma resulting in saving of
power at Milak Narayanpur.
14. Installation of steam traps on exhaust lines and
lagging on steam lines resulted in steam saving
and lower radiation losses at Milak Narayanpur.
15. Replacement of GUFR with TUFR on 1st and 4th
mill resulting in improved extraction and power
saving at Milak Narayanpur.
16. Replaced gear and pinion type high power
consuming drives at Crystallizers with planetary
drives and installed VFD at raw juice pumping
station to save power at Ramkola unit.
b) The steps taken by the Company for utilising
alternate source of energy
through India Energy Exchange which facilitates
trading in alternate sources of power.
at out-centre cane weighbridges for lighting and
other uses during season period.
Apart from above, in all sugar units of the
Company, majority of power is generated
through bagasse, which is a renewable source
of energy. At Distillery, bio-gas is generated
from the effluent and is used as a fuel in the
boiler for generation of steam and power.
c) The capital investment on energy conservation
equipment
The Company has incurred capital expenditure
of ` 227.35 lakh towards energy conservation
equipment during the year.
Annexure-E

P. 80
B) TECHNOLOGY ABSORPTION
(i) The efforts made towards technology absorption;
All our businesses use mostly indigenous technology
except for Gear Business, which apart from own
technology up to 7.5 MW, gets technology under
Licence Agreements. Gear business is self-sufficient
in the application of the technologies obtained under
the Licence Agreements. The Gear Business is also
involved in R&D activities to develop fundamental
understanding of technology, to evolve other products
and also to improve upon existing range of products.
cost reduction, product development or import
substitution
Both our engineering businesses are continually
engaged in the improvement of the product features,
process engineering and value engineering so as to
be cost competitive in the market place and to protect
their margins.
(ii) In case of imported technology (imported during
the last three years reckoned from the beginning of
-
a) the details of technology
imported*
No technology was
imported during
the last three
years.
b) the year of import NA
c) whether the technology
has been fully absorbed
NA
d) if not fully absorbed,
areas where absorption
has not taken place and
reasons thereof;
NA
*The Gear Business has a License Agreement with an
overseas party under which limited information by
way of drawings is provided to undertake manufacture
of the product and as such, the underlying technology
is not passed. However, the exposure and interaction
with the Licensor helps the Gear Business to increase
its learning and use the learning for development of
other products.
C) FOREIGN EXCHANGE EARNINGS & OUTGO
Earnings in foreign exchange ` 1642.98 lakh*
Foreign exchange outgo ` 2833.16 lakh*
*does not include inflow of ̀ 25790.42 lakh and outgo of ̀ 14362.92
lakh in respect of borrowings in foreign currency during the year.
For and on behalf of the Board of Directors
Dhruv M. Sawhney
Place: Noida (U.P.) Chairman and Managing Director
Date : May 24, 2018 DIN: 00102999

P. 81
Annual Report 2017-18
02-17 | Co
rpo
rate Overview
24-101 | Statuto
ry Rep
orts
18-23 | Man
agem
ent Statem
ents
102-266 | Finan
cial Statemen
ts
PARTICULARS OF EMPLOYEES PURSUANT TO SECTION 197 (12) OF THE COMPANIES ACT, 2013 (‘ACT’) READ WITH
RULE 5(1) OF THE COMPANIES (APPOINTMENT AND REMUNERATION OF MANAGERIAL PERSONNEL) RULES, 2014
(i) The percentage increase in remuneration of each Director, CFO and CS during the FY 18, ratio of remuneration of each Director
to the median remuneration of the employees of the Company for the FY 18
Name of Director/KMP and Designation Ratio of remuneration
to Median remuneration
% increase of
remuneration in FY 18
Mr. Dhruv M. Sawhney **
Chairman and Managing Director (CMD)
N.A. NIL
Mr. Tarun Sawhney*
Vice Chairman and Managing Director (VCMD)
68 17.62%
Mr. Nikhil Sawhney
Non-Executive Director
1.06 NIL
Dr. F.C. Kohli
Non-Executive Independent Director
0.36 NIL
Lt. Gen. K.K. Hazari (Retd.)
Non-Executive Independent Director
1.57 NIL
Mr. Shekhar Datta
Non-Executive Independent Director
1.71 NIL
Ms. Homai A. Daruwalla
Non-Executive Independent Director
1.71 NIL
Dr. Santosh Pande
Non-Executive Independent Director
1.14 NIL
Mr. Sudipto Sarkar
Non-Executive Independent Director
1.14 NIL
Mr. Suresh Taneja*
Group Chief Financial Officer
55 7.95%
Ms. Geeta Bhalla*
Group Vice President & Company Secretary
20 13.33%
* Gratuity is provided based on actuarial valuation and hence, remuneration does not include gratuity.
** No salary is being drawn by the CMD.
Note: The remuneration of the non-executive & independent directors includes sitting fees only for attending Board or Committee meetings and
there was no change in the sitting fee during the year. Further no commission was paid during FY 18 in view of losses incurred during the
earlier years.
Annexure-F
(ii) In the Financial year 2017 – 18, there was an increase of
6.29 % in the median remuneration of the employees (The
salaries of seasonal employees in sugar units have not
been considered herein as they are deployed only for the
duration of the Sugar season and not for the entire year).
(iii) There were 3906 permanent employees (752 officers,
3154 workmen including 1754 seasonal employees) on the
rolls of the Company as on March 31, 2018.
(iv) The average percentile salary increase of employees
other than managerial personnel was 7.33% against
13.09% in the managerial remuneration. The increase in
remuneration is in line with considerable management
efforts to plan, implement and achieve improvement in
operational efficiencies of the Sugar Business which will
help the Company to better withstand cyclicality in the
sugar industry.
(v) It is hereby affirmed that the remuneration paid during the
financial ended March 31, 2018 is as per the Nomination
and Remuneration policy of the Company.
For and on behalf of the Board of Directors
Dhruv M. Sawhney
Date : May 24, 2018 Chairman and Managing Director
Place : Noida (U.P) DIN:00102999

P. 82
Annexure-H
BUSINESS RESPONSIBILITY REPORT – 2017-18
Section A: General Information about the Company
1 Corporate Identity Number (CIN) of the Company L15421UP1932PLC022174
2 Name of the Company Triveni Engineering & Industries Limited
3 Registered Address Deoband, District Saharanpur, Uttar Pradesh- 247554
4 Website www.trivenigroup.com
5 E-mail ID [email protected]
6 Financial Year reported 2017-18
7 Sector(s) that the Company engaged in (industrial activity
code-wise)
NIC Code Product Description
1072 Sugar
35106 Co-generation (Power)
1101 Industrial Alcohol
281 Industrial Gears
360 Water & Waste Water Treatment
8 List three key products/services that the Company
manufactures/ provides
Sugar and By-products
Industrial Gears (High speed Gears)
Solutions relating to Waste Water, Sewage and Effluents
9 Total number of location where business activity is undertaken
by the Company
(a) Number of International Locations (Provide details
of major 5)
Not Applicable - the Company is majorly operating in
domestic market
(b) Number of National Locations:
Uttar Pradesh (U.P.)
03 Sugar manufacturing plants in West U.P.,
03 in Central U.P. and 01 in East U.P.;
03 Cogeneration plants in two sugar units situated in
West U.P.;
Distillery situated in District: Muzaffarnagar,
West U.P.;
Water Business at Noida, with projects being executed
all over India; and
Corporate and Registered Offices at Noida and
Deoband respectively.
Karnataka
Manufacturing facilities of High Speed Gears at Mysore
10 Markets served by the Company: Local/State /National/
International
Local Yes
State Yes
National Yes
International Yes*
* To the extent of exports by the Gears Business

P. 83
Annual Report 2017-18
02-17 | Co
rpo
rate Overview
24-101 | Statuto
ry Rep
orts
18-23 | Man
agem
ent Statem
ents
102-266 | Finan
cial Statemen
ts
Section B: Financial Details of the Company
Triveni Engineering and Industries Limited (` in lakhs)
FY 18
Standalone
FY 18
Consolidated
1. Paid-up Capital 2579.47 2579.47
2. Total Turnover 343646.70 342782.40
(a) Revenue from operations ( gross) 341238.37 341238.37
(b) Other income 2408.33 1544.03
3. Profit for the year (after taxes and minority interest) 10974.38 11914.01
4. Total Comprehensive Income 11096.10 12034.58
5. Total Spending on Corporate Social Responsibility (CSR) as percentage of profit
before tax
There was no CSR obligation on
the Company during the year
under the Companies Act in view of
losses in previous years. However,
the Company engages actively in
operating and managing schools in
rural areas for the benefit of people
residing in the vicinity of its Sugar
Units and engages with farmers to
improve agricultural practices and
productivity for overall improvement
of the productivity of the land.
6. List of activities in which expenditure in 5 above has been incurred Nil
Section C: Other Details
1. Does the Company have any Subsidiary Company/
Companies?
Yes, the Company has six subsidiaries as on March 31, 2018.
2. Do the Subsidiary Company/Companies participate in
the BR Initiatives of the parent company? If yes, then
indicate the number of such subsidiary company(s).
The Subsidiary Companies are in the nascent stages of
setting up their respective businesses and hence, these do
not have any active participation in the BR initiatives.
3. Do any other entity/entities (e.g. suppliers, distributors
etc.) that the Company does business with, participate in
the BR initiatives of the Company?
While the suppliers or distributors are not directly involved
in the BR initiatives pursued by the Company, the Company
makes arrangements with third parties to provide their
expertise, products and services for the benefit of the
farmers who are the supply chain partners to the Company.
If yes, then indicate the percentage of such entity/
entities? [Less than 30%, 30-60%, More than 60%].
Not Applicable
Section D: BR Information
1. Details of Director/Directors responsible of BR
a) Details of the Director/Director responsible for
implementation of the BR policy/policies
DIN No: 00382878
Name: Mr. Tarun Sawhney
Designation: Vice Chairman and Managing Director
b) Details of the BR head*
Sl.
No.
Particulars Details
1. DIN Number
(if applicable)
Not applicable
2. Name &
Designation
Mr Sameer Sinha, President-SBG &
Corporate Planning
Mr. Rajiv Rajpal, CEO-Gears Business
Mr. B.K. Agrawal, CEO-Water Business
3. Telephone
number
0120-4308000; 0821-4280501;
0120-4748000
4. e-mail id [email protected]

P. 84
2. Principle-wise (as per NVGs) BR Policy/policies:
The National Voluntary Guidelines on Social, Environmental and Economic Responsibilities of Business (NVGs) released by the
Ministry of Corporate Affairs has adopted nine areas of Business Responsibility. These briefly are as follows:
P1 Business should conduct and govern themselves with ethics, Transparency and Accountability.
P2 Businesses should provide goods and services that are safe and contribute to sustainability throughout their life cycle.
P3 Businesses should promote the well-being of all employees.
P4 Businesses should respect the interests of, and be responsive towards all stakeholders, especially those who are
disadvantaged, vulnerable and marginalized.
P5 Businesses should respect and promote human rights.
P6 Business should respect, protect, and make efforts to restore the environment.
P7 Businesses, when engaged in influencing public and regulatory policy, should do so in a responsible manner.
P8 Businesses should support inclusive growth and equitable development.
P9 Businesses should engage with and provide value to their customers and consumers in a responsible manner.
a. Details of compliance:
Sl.
No.Questions P1 P2 P3 P4 P5 P6 P7 P8 P9
1 Do you have policy/policies for…. Yes
2 Has the policy being formulated
in consultation with the relevant
stakeholder?
The Company has formulated the policies, SOPs and adopted best
practices by considering inputs, feedback and sensitivities of the
stakeholders, wherever practicable.
3 Does the policy conform to any national/
international standards? If yes, specify?
(50 words)
Yes, the policies/practices broadly conform to the National Voluntary
Guidelines (NVGs) issued by the Ministry of Corporate Affairs,
Government of India, and the policies are compliant with applicable
laws as mapped against the principles mentioned in NVGs.
4 Has the policy being approved by the
Board? If yes, has it been signed by MD/
owner/CEO/appropriate Board Director?
Yes, the Board of Directors of the Company has approved the BR
Policy and the same has been signed by the VCMD, pursuant to the
authorization by the Board.
5 Does the company have a specified
committee of the Board/Director/Official
to oversee the implementation of the
policy?
Yes
6 Indicate the link for the policy to be viewed
online?
The link for the Policy(ies): www.trivenigroup.com
7 Has the policy been formally
communicated to all relevant internal and
external stakeholders?
The internal stakeholders have been made aware of the policy through
appropriate means of communication. For the external stakeholders,
the policy has been posted on the Company’s website and they
have also being made aware of details of such policy and about its
availability on the website of the Company.
8 Does the company have in-house
structure to implement the policy/policiesY Y Y Y Y Y Y Y Y
9 Does the Company have a grievance
redressal mechanism related to the
policy/policies to address stakeholders’
grievances related to the policy/policies?
Y Y Y Y Y Y Y Y Y
10 Has the company carried out independent
audit/evaluation of the working of this
policy by an internal or external agency?
There is an adequate system in force to ensure effective implementation.
The audit by an external agency will be arranged in the due course.

P. 85
Annual Report 2017-18
02-17 | Co
rpo
rate Overview
24-101 | Statuto
ry Rep
orts
18-23 | Man
agem
ent Statem
ents
102-266 | Finan
cial Statemen
ts
b. If answer to the question at Sl.No. 1 against any principle, is “No” please explain why: (Tick up to 2 options):
Sl.
No.Questions P1 P2 P3 P4 P5 P6 P7 P8 P9
1 The company has not understood the
Principles
NOT APPLICABLE
2 The Company is not at a stage where
it finds itself in a position to formulate
and implement the policies on specified
principles.
3 The Company does not have financial
or manpower resources available for
the task.
4 It is planned to be done within next
6 months
5 It is planned to be done within next 1 year
6 Any other reason (please specify)
3. Governance related to BR
Indicate the frequency with which the Board of
Directors, Committee of the Board or CEO to access
the BR performance of the Company. Within 3
months. 3-6 months, Annually, More than 1 year.
This is the first Business Responsibility Report for the
financial year 2017-18. The Board of Directors have
adopted BR Policy in Feb 2018 and BR Performance
of the Company will be reviewed by VCMD/BR Heads
on a half yearly basis.
Does the Company publish a BR or a Sustainability
Report? What is the hyperlink for viewing this
report? How frequently it is published?
This is the first Business Responsibility Report which
forms part of the Company’s annual report for the
financial year 2017-18. The annual report containing
this Business Responsibility Report will be put up on
the web site of the Company at www.trivenigroup.com.
Section E: Principle-wise performance
Principle 1: Ethics, Transparency and Accountability
The Company’s commitment to ethical and lawful business
conduct is a fundamental shared value of the Board of Directors,
the senior management and all employees of the Company. The
Corporate Governance philosophy of the Company is anchored
on the values of integrity, transparency, building efficient and
sustainable environment, system and practices to ensure
accountability, transparency, fairness in all the transactions in
the widest sense to meet stakeholders and societal expectations.
The Code of Conduct and other policies adopted by the Company
apply to the employees of the Company. In addition, the Company
has a Whistle Blower Policy through which the Company seeks to
provide a mechanism to the employees and directors to disclose
any unethical and/or improper practice(s) suspected to be taking
place in the Company for appropriate action and reporting.
Further, no employee is denied access to the Audit Committee
and all disclosures are reported to the Chairman of the Audit
Committee. The Code of Conduct and Whistle Blower Policy are
uploaded on the Company’s website- www.trivenigroup.com
1. Does the Policy relating to ethics, bribery and corruption
cover only the Company? Does it extend to the Group /
Joint Ventures / Suppliers/ Contractors / NGOs/ Others?
The policies, philosophy and thinking in respect of the
above issues are practiced by the Company in the normal
conduct of the business and it also encourages its
suppliers and contractors to adopt such practices. While
the business activities in subsidiaries are miniscule,
associate companies in India do practice their own well-
structured policies on the same lines.
2. How many stakeholders’ complaints have been received
satisfactorily resolved by the management? If so,
provide details thereof.
Stakeholder Complaints
received during
2017-18
Complaints
resolved
during 2017-18
%age
resolved
Investors’
Complaints
13 13 100%
Customers’
Complaints
94 87 93%
Total 107 100 93%

P. 86
Principle 2: Sustainability of Products & Services across
Life –Cycle
1. List up to 3 of your products or services whose design
has incorporated social or environmental concerns,
risks and / or opportunities
Most of the products manufactured or dealt with by the
Company are environmental friendly:
cogeneration facilities set up in the Sugar
manufacturing units, the Company produces power
mostly from captive generation of bagasse (a by-
product produced during manufacture of sugar from
sugarcane), which is a renewable source of energy.
Two of the Cogeneration plants were registered
with UNFCCC as CDM projects and were entitled for
carbon credits. Further, some of the Cogeneration
plants or incidental cogeneration facilities are eligible
to Renewable Energy certificates.
molasses (a by-product produced during manufacture
of sugar from sugarcane) to manufacture environment
friendly Ethanol (in substitution of fossil fuels) which
is used by the Oil Marketing Companies to blend
with petrol as per the mandate of the Government.
Further, during the manufacture of Ethanol, electricity
requirement of the plant is largely met through bio
methanation – utilization of waste products. The
company uses effective systems and equipment to
reduce effluents.
offering solution to the industries and municipalities
in the area of waste water, sewage and effluents
treatment which has the impact of preserving much
precious water and reduce pollution and contamination.
inter-alia are used to operate steam turbines based
on various renewable energy sources, such as,
biomass, agricultural waste, waste heat recovery etc.
2. For each such product provide the following details in
respect of resource use (energy, water, raw material
etc.) per unit of product (Optional).
a) Reduction during sourcing / production / distribution
achieved since the previous year throughout the
value chain?
b) Reduction during usage by consumers (energy,
water) has been achieved since the previous year?
conservation (please refer to Annexure -E of the
Director’s Report) with a view to optimize the
resource use.
In respect of Sugar operations, each of the by-product
produced during the manufacture of sugar is majorly
captively used to generate power, produce Ethanol or
used as organic manure for the benefit of farmers.
The conversion of by-products into environmentally
beneficial products is made through the advanced
energy efficient equipment.
The Company has been focusing on enhancing
raw material productivity in sugar operations
by propagating appropriate sugarcane varieties
which provide higher yield to the farmers and thus
augmenting their income and higher sugar recoveries
which help the Company to lower its raw material
costs per unit of the output produced. During the
Financial year 2017-18, the Company has achieved
recovery of 11.29% as against 11.01% in the previous
year and due to better yields, it has been able to
increase the supply of sugar cane by 22%.
3. Does the Company have procedures in place for
sustainable sourcing (including transportation)? If yes,
what percentage of your inputs was sourced sustainably?
Yes. The Company deploys procurement practices
and procedures for sustainable sourcing based on
the requirements of different businesses pursued by
the Company.
The sugarcane required for the manufacture of sugar
is sourced from the farmers. About 55% of the total
requirement of sugarcane is supplied by the farmers
at the sugar mill’s gate and the balance about 45%
is supplied at the cane centers which are up to 100
km from the sugar mills. There are about 576 cane
centers operated by our seven sugar mills. To avoid
staling of cane, the Company employs an extensive
and efficient transport arrangements so that the off-
take from the cane centers is regular and timely and,
in a cost effective manner.
Cogenerations plants are set up at the sugar mills
and they seamlessly get supply of bagasse, which
is produced during manufacture of sugar, through
conveyer belts.
In respect of Distillery, the main raw material
(molasses) is sourced from the sugar mills and
is transported through tankers. The reliability of
transport arrangement is ensured for uninterrupted
operation of the distillery.

P. 87
Annual Report 2017-18
02-17 | Co
rpo
rate Overview
24-101 | Statuto
ry Rep
orts
18-23 | Man
agem
ent Statem
ents
102-266 | Finan
cial Statemen
ts
Water Business is engaged in project execution at the
customer’s site. Most of the supplies are engineered-
to-order and are outsourced to approved vendors who
are entrusted to transport the material directly to the
project site. There is a structured mechanism to develop
vendors and to maintain a list of approved vendors
for various machineries / components required in
project execution. In some cases, recommended list of
vendors is provided by customers.
The Gear Business has an active supply chain for
various items required to be procured. Based on the
criticality and vendor ratings, orders are placed on
various vendors. The selection of vendor is based
on their past performance, reliability, adherence to
delivery timelines, cost competitiveness, compliance
to laws, including the standards set up by the
Company towards EHS, quality of products / services
and willingness to reduce costs / wastages and
increase productivity as a supply chain partner.
4. Has the Company taken any steps to procure goods
and services from local and small producers, including
communities surrounding their place of work? If yes,
what steps have been taken to improve their capacity
and capability of local and small vendors?
The Company procures sugarcane from about 2,50,000
farmers for its seven sugar mills in the state of Uttar
Pradesh. As a part of the cane development programme,
the Company partners with the famers on an ongoing basis
to improve sowing, cultivation and harvesting techniques
in a mutually beneficial manner.
The Company also encourages SMEs, especially in the
vicinity of the manufacturing plants, to supply their
products and services to the Company and imparts training
to them to improve their technical skills.
5. Does the Company have a mechanism to recycle products
and waste? If yes, what is the percentage of recycling of
products and waste (separately as <5%, 5-10%, >10%).
Also, provide details thereof, in about 50 words or so.
In respect of the Sugar Business, the Company has an
effective system to treat the industrial effluents and it
regularly monitors the efficacy of ETP. Further, it has
installed well engineered ESPs/Wet Scrubbers in its
boilers to limit air pollution. All the by-products generated
during manufacture of sugar are used to produce
environment friendly products of commercial value.
Water requirements of sugar mills are significant and the
Company has an effective system to recycle the water to
conserve its utilization.
Additionally, other waste products include used lubricants,
machinery oil and manufacturing scrap which are disposed
of to be recycled for further use.
Principle 3: Employee Well-being
Sl.
No.
Category Response
1. Total number of employees 6620 as on March 31, 2018 (includes permanent,
temporary, trainee and contractual employees)
2. Total numbers of employees hired on temporary /
contractual / casual basis
2714 as on March 31, 2018
3. Total number of permanent women employees 26 as on March 31, 2018
4. Total number of permanent employees with disabilities NIL
5. Do you have employee association that is recognized by
management?
Yes
6. What percentages of your permanent employees are
members of this recognized employee association?
Around 38%
7. Please indicate the number of complaints relating to child
labour, forced labour, involuntary labour, sexual harassment
in the last financial year and pending, as on the end of the
financial year:
Nil
8 What percentage of your under mentioned employees were
given safety & skill up-gradation training in the last year?
Category Safety (%) Skill Up-gradation (%)
a. Permanent employees 85% 56%
b. Permanent Women employees 75% 72%
c. Casual / Temporary / Contractual employees 80% 20%
d. Employees with disabilities Nil Nil

P. 88
Principle 4: Stake Holder Engagement
1. Has the Company mapped its internal and external
stakeholders?
Yes, the key stakeholders of the Company are employees,
customers, government authorities, suppliers and
shareholders.
disadvantaged, vulnerable & marginalized stakeholders?
The company treats all the stakeholders important
and endeavours to remedy hardships, if any, caused
by any action attributable to it. Further, the Company
realizes that its sugar mills are situated in rural areas
and it has responsibility to generate employment and
entrepreneurship amongst the locals residing in the vicinity.
It operates and manages schools for the betterment of the
local people.
3. Are there any special initiative taken by the Company
to engage with the disadvantage, vulnerable and
marginalized stakeholders. If so, provide details thereof,
in about 50 words or so.
The Company realizes that its sugar mills are situated
in rural areas and it has responsibility to generate
employment and entrepreneurship amongst the locals
residing in the vicinity. It operates and manages schools
for the betterment of the local people.
Principle 5: Human Rights
1. Does the policy of the Company on human rights
cover only the Company or extend to the Group/ Joint
Ventures/ Suppliers/ Contractors/ NGOs/Others?
While the Company or its subsidiaries do not have a
stated policy on human rights, it has been practicing to
respect human rights as a responsible corporate citizen,
without any gender discrimination and exploitation. It
believes in providing equal opportunity and to remunerate
them in a fair manner commensurate with their skills
and competence. The Company ensures conformance to
fundamental labour principles including prohibition of
child labour, forced labour, freedom of association and
protection from discrimination in all its operation.
2. How many stakeholders’ complaints have been received
satisfactorily resolved by the management?
During FY 2017-18, the Company has not received any
complaints from any stakeholder pertaining to the
human rights.
Principle 6: Protection & Restoration of the Environment
1. Does the Policy related to Principle 6 cover only the
Company or extend to the Group/ Joint Ventures/
Suppliers/ Contractors/ NGOs/Others.
The Company’s Policy on Safety, Health & Environment
extend to all its offices, manufacturing locations, its
employees and its surrounding places and habitat which
could be impacted by its operations. The Company
encourages its vendors, suppliers, and contractors to follow
the Principle envisaged in the Policy. The company does not
have any subsidiary with significant business activities.
2. Does the Company have strategies / initiatives to
address global environmental issues such as climate
change, global warming etc.? (Y/N) If yes, please give
hyperlink for webpage etc.
Yes, as a responsible corporate, the Company considers
environment issues very seriously. In fact, most of the
products manufactured by the Company are either agri-
based products or contribute to betterment of environment
- promotion of renewable energy sources in producing
green power, producing Ethanol in substitution of fossil
fuel and active presence in Waste water / sewage /
effluent treatment segment. The company has associated
with Confederation of Indian Industry (CII) and formed a
center of excellence “CII Triveni Water Institute” which does
extensive research and advise wide ranging interventions
to improve the quality of water and restore adequate water
tables. Two of the Cogeneration Plants are registered with
UNFCCC under Clean Development Mechanism.
Under various “Green initiatives”, the Gear and Sugar
Businesses of the Company have planted number of trees.
3. Does the Company identify and assess potential
environmental risks? (Y/N)
Yes, the Company is cognizant of the environment risks
and continually evaluates the impact of its manufacturing
operations on the environment and endeavours to improve
its benchmarks for stringent compliance. Further, all
decisions relating to development of new products duly
incorporate implications, if any, to the environment.
4. Does the Company have any Project related to
Clean Development Mechanism? If yes, whether any
Two of the Cogeneration Plants of the Company at Deoband
and Khatauli (Phase I) are registered with UNFCCC under
Clean Development Mechanism. Additionally, some of its
cogeneration / incidental cogeneration facilities are also
eligible for Renewable Energy Certificate.

P. 89
Annual Report 2017-18
02-17 | Co
rpo
rate Overview
24-101 | Statuto
ry Rep
orts
18-23 | Man
agem
ent Statem
ents
102-266 | Finan
cial Statemen
ts
5. Has the Company undertaken any other initiatives on clean
technology, energy efficiency, renewable energy, etc.
The company generates green power from renewable
energy sources and also manufactures green fuel for
blending with petrol, Additionally, the Company is also
engaged in all segments relating to waste water, sewage
and effluent treatment. Apart from the environment
products manufactured by the Company, the Company is
conscious of its responsibility to conduct its operations
in a manner to conserve energy and to achieve zero
effluent discharge.
6. Are the Emissions/ Waste generated by the Company
within the permissible limits given by CPCB/ SPCB for
Yes, the emissions / waste generated by the Company are
within the permissible limits prescribed by Central Pollution
Control Board (“CPCB”) / UP State Pollution Control Board /
Karnataka State Pollution Control Board (“SPCB”).
7. Number of show cause / legal notices received from
CPCB/ SPCB which are pending (i.e. not resolved to
No such notice from CPCB/SPCB is pending at the end of
the financial year.
Principle 7: Responsible Advocacy
1. Is your Company a member of any trade and chamber
or association? If yes, name only the ones that your
business deals with:
The Company is a member of various trade and chamber
associations. The major ones are:
a. Confederation of Indian Industries (CII)
b. Federation of Indian Chambers of Commerce and
Industry (FICCI)
c. The Sugar Technologists’ Association of India (STAI)
d. Indian Sugar Mills Association (ISMA)
2. Have you advocated / lobbied through above associations
for the advancement or improvement of public good?
Yes/ No; if yes specify the broad areas.
The Company is continuously in touch with various
organization, namely, CII, FICCI, ISMA for improvement
of various economic and social policies for sustainable
growth in the Sugar and Water Industry. The company has
also associated with CII and formed a center of excellence
“CII Triveni Water Institute” which does extensive research
and advise wide ranging interventions to improve the
quality of water and restore adequate water tables.
Principle 8: Supporting inclusive Growth & Equitable
Development
projects in pursuit of the Policy related to Principle 8? If
yes, details thereof.
across all its seven sugar mills relating to the
procurement of sugarcane for the manufacture of
sugar. The Company engages in meaningful cane
development programme which aims to develop
improved sowing, cultivation and harvesting
techniques and to improve crop and land productivity
resulting in enhanced income in the hands of farmers.
During the FY 2017-18, the Company has purchased
cane worth ` 2337.81 crore from its farmers.
banking channels as a result of which they become
entitled for crop related banking assistance.
people and promotes entrepreneurship amongst
them to supply goods or render services to the sugar
mills. The technical training and skill upgradation is
provided by the Company, if required.
vicinity of the sugar mills to provide education to the
children residing in the vicinity.
2. Are the Programs/ Projects undertaken through in house
team / own foundation/ external NGO/ Government
structures / any other organisation?
Most of the programmes are undertaken by the In-house
team. The specialized services, wherever required, are
procured from expert third parties, including through
various tie-ups.
3. Have you done any impact assessment of your initiatives?
While it is difficult to quantify, the results are visible through
better income accruing in the hands of farmers and
improved operational performance of the Company in terms
of better sugar recovery and increased supply of sugarcane.
The mutual cooperation with its farmers will help the
Company to meet its social and commercial objectives.
4. What is your Company’s direct contribution to community
development projects – amount in INR and the details of
the project undertaken?
The Company has incurred ` 2.81 crore in the cane
development activities. The time spent in counselling,
educating farmers, managing schools and providing other

P. 90
services are administrative and time extensive, and are
difficult to be quantified.
5. Have you taken steps to ensure that this community
development initiative is successfully adopted by the
Community?
Yes, the Company believes that if the activities are carried
out in a structured manner as per well laid out plan with
proper identification of the target class of the community, it
is bound to be received well and adopted by the community.
The Company stringently follows this line of thinking and
continually monitors community development initiatives
through various parameters such as health indicators,
literacy levels, sustainable livelihood processes, population
data and state of infrastructure among others.
Principle 9: Providing value to Customers and Consumers
1. What percentage of customer complaints / consumer
The Company considers customer satisfaction as an
important objective and has a well-structured policy on
customer complaints resolution. The Company endeavours
to resolve all complaints in an expeditious manner.
As on 31.03.2018, there were 7% complaints pending
for resolution.
2. Does the Company display product information on the
product label, over and above what is mandated as per
local laws?
The Company displays applicable product information
as mandated by Bureau of Indian Standards/FSSAI. The
Company complies with all the applicable regulations
as provided in Legal Metrology Act, Bureau of Indian
Standards Specifications, Food Safety and Standards Act
and the relevant rules prescribed therein.
Company regarding unfair trade practices, irresponsible
advertising/ or anti-competitive behaviour during the
so, provide details thereof, in about 50 words or so.
The Company has never indulged in any unfair
trade practices, irresponsible advertising or anti-
competitive behavior.
However, based on a complaint for anti-competitive
behavior in the tender floated by Oil Marketing Companies
(OMCs) in 2012-13 for procurement of Ethanol under
the Ethanol Blending with Petrol Programme of the
Government of India, the Competition Commission of
India (CCI) had ordered an investigation against the OMCs,
ISMA and various Sugar Mills (including the Company).
On the directions of CCI, Director General has carried
out the investigation and submitted his report alleging
cartelization, which has been challenged by the distilleries
in U.P. including the Company. The matter is being
adjudicated by CCI.
4. Did your Company carry out any consumer survey/
consumer satisfaction trends?
The Company considers customer satisfaction as one of its
foremost objectives and endeavors to take feedback from
customers through practical means. In the Engineering
Businesses, wherein the number of customers are not
very large, the Company takes feedback directly from the
customers, including through electronic means. In the
Sugar business, such feedback, essentially on quality, is
received through sugar agents as it not possible to deal
with innumerable final customers.

P. 91
Annual Report 2017-18
02-17 | Co
rpo
rate Overview
24-101 | Statuto
ry Rep
orts
18-23 | Man
agem
ent Statem
ents
102-266 | Finan
cial Statemen
ts
Annexure-I
FORM NO. MGT-9
EXTRACT OF ANNUAL RETURN
as on the financial year ended on 31st March, 2018
of Triveni Engineering & Industries Limited
[Pursuant to Section 92(1) of the Companies Act, 2013 and rule 12(1) of the Companies
(Management and Administration) Rules, 2014]
I. REGISTRATION AND OTHER DETAILS:
i) CIN L15421UP1932PLC022174
ii) Registration Date 27th July, 1932
iii) Name of the Company Triveni Engineering & Industries Limited
iv) Category/sub-Category of the Company Public Company limited by shares / Indian Non-Government
Company
v) Address of the Registered Office and contact details Deoband, District Saharanpur, Uttar Pradesh-247 554; Ph:
(01336) 222185
vi) Whether listed company (Yes/No) Yes
vii) Name, Address and Contract details of Registrar and
Transfer Agent, if any
M/s Karvy Computershare Pvt. Ltd.
Karvy Selenium Tower-B,
Plot 31-32, Gachibowli, Financial District,
Nanakramguda, Hyderabad-500 032
Ph: 040 6716 2222
Email : [email protected]
II. PRINCIPAL BUSINESS ACTIVITIES OF THE COMPANY
All the business activities contributing 10% or more of the total turnover of the company shall be stated:-
Sl.
No.
Name and Description of main products /
services
NIC Code of the
Product/ service
% to total turnover
of the company
1. MANUFACTURE OF SUGAR 1072 82%
III. PARTICULARS OF HOLDING, SUBSIDIARY AND ASSOCIATE COMPANIES -
Sl.
N0.
Name and Address of the Company CIN/GLN Holding/
Subsidiary/
Associate
% of
shares
held
Applicable
Section
1. Triveni Engineering Limited
8th Floor, Express Trade Towers, 15-16,
Sector-16A, Noida-201 301 (U.P.)
U29119UP2006PLC032060 Subsidiary 100% 2(87)
2. Triveni Energy Systems Limited
8th Floor, Express Trade Towers, 15-16,
Sector-16A, Noida-201 301 (U.P.).
U40102UP2008PLC034648 Subsidiary 100% 2(87)
3. Triveni Entertainment Limited
Grand Plaza, 104, 1st Floor, 99 Old Rajinder Nagar
Market, New Delhi-110 060.
U52110DL1986PLC024603 Subsidiary 100% 2(87)
4. Triveni Sugar Limited
(formerly Bhudeva Projects Limited)
A-44, Hosiery Complex, Phase II Extension,
Noida-201 305 (U.P.)
U45201UP2014PLC063454 Subsidiary 99.99% 2(87)

P. 92
Sl.
N0.
Name and Address of the Company CIN/GLN Holding/
Subsidiary/
Associate
% of
shares
held
Applicable
Section
5. Svastida Projects Limited
A-44, Hosiery Complex, Phase II Extension,
Noida-201 305 (U.P.)
U45201UP2014PLC063455 Subsidiary 100% 2(87)
6. Triveni Industries Limited
Sugar Unit, Deoband-247 554,
Uttar Pradesh
U15122UP2015PLC072202 Subsidiary 100% 2(87)
7. Triveni Turbine Limited
A-44, Hosiery Complex, Phase II Extension,
Noida-201 305 (U.P.)
L29110UP1995PLC041834 Associate 21.82 2(6)
8. Aqwise-Wise Water Technologies Ltd., Israel Foreign Company Associate 25.04 2(6)
IV. SHARE HOLDING PATTERN (EQUITY SHARE CAPITAL BREAKUP AS PERCENTAGE OF TOTAL EQUITY)
(i) Category-wise Share Holding
Category of shareholder No. of Shares held at the beginning of the year No. of Shares held at the end of the year % Change during the
yearDemat Physical Total % of Total
SharesDemat Physical Total % of
Total Shares
(A) Promoter
(1) Indian 34511253 0 34511253 13.379 34511253 0 34511253 13.379 0.000
(a) Individuals/ HUF
(b) Central Government
(c) State Government(s)
(d) Bodies Corporate 82696056 0 82696056 32.060 82696056 0 82696056 32.060 0.000
(e) Bank /FI
(f) Any Other
Sub-Total (A)(1) 117207309 0 117207309 45.439 117207309 0 117207309 45.439 0.000
(2) Foreign
(a) NRI - Individuals 58749920 0 58749920 22.776 58749920 0 58749920 22.776 0.000
(b) Other - Individuals
(c) Bodies Corporate
(d) Bank /FI
(e) Any Other
Sub-Total (A)(2) 58749920 0 58749920 22.776 58749920 0 58749920 22.776 0.000
Total Shareholding of Promoter
175957229 0 175957229 68.215 175957229 0 175957229 68.215 0.000
(A)= (A)(1)+(A)(2)
(B) Public shareholding
(1) Institutions
(a) Mutual Funds/UTI 13982418 0 13982418 5.421 4138970 0 4138970 1.605 -3.816
(b) Bank / FI 383433 0 383433 0.149 549357 0 549357 0.213 0.064
(c) Central Government
(d) State Government(s)
(e) Venture Capital Funds
(f) Insurance Companies
(g) FIIs 0 0 0 0.000 0 0 0 0.000 0.000
(h) Foreign Venture Capital Investors
(i) Any Other (specify)

P. 93
Annual Report 2017-18
02-17 | Co
rpo
rate Overview
24-101 | Statuto
ry Rep
orts
18-23 | Man
agem
ent Statem
ents
102-266 | Finan
cial Statemen
ts
Category of shareholder No. of Shares held at the beginning of the year No. of Shares held at the end of the year % Change during the
yearDemat Physical Total % of Total
SharesDemat Physical Total % of
Total Shares
(j) Foreign Portfolio Investor (Corporate)
7985443 0 7985443 3.096 10402817 0 10402817 4.033 0.937
Sub-Total (B)(1) 22351294 0 22351294 8.665 15091144 0 15091144 5.851 -2.815
(2) Non-institutions
(a) Bodies Corporate
i) Indian 15289544 1 15289545 5.927 14684301 1 14684302 5.693 -0.235
ii) Overseas
(b) Individuals -
i. Individual shareholders holding nominal share capital up to ` 1 lakh.*
22698639 254336 22952975 8.898 30038717 250026 30288743 11.742 2.844
ii. Individual shareholders holding nominal share capital in excess of ` 1 lakh.
16830492 0 16830492 6.525 17385032 0 17385032 6.740 0.215
(c) Any Other (specify)
[i] NRI 1624767 0 1624767 0.630 1599854 0 1599854 0.620 -0.010
[ii] HUF 2432319 0 2432319 0.943 2152915 0 2152915 0.835 -0.108
[iii] Clearing Member
502689 0 502689 0.195 740574 0 740574 0.287 0.092
[iv] Trust 3800 0 3800 0.001 13700 0 13700 0.005 0.004
[v] Foreign National 0 0 0 0.000 118 0 118 0.000 0.000
[vi] IEPF 0 0 0 0.000 31499 0 31499 0.012 0.012
Sub-Total (B)(2) 59382250 254337 59636587 23.120 66646710 250027 66896737 25.935 2.815
Total Public Shareholding (B)= (B)(1)+(B)(2)
81733544 254337 81987881 31.785 81737854 250027 81987881 31.785 0.000
(C) Shares held by Custodians for GDRs & ADRs
- - - - - - - - -
GRAND TOTAL (A)+(B)+(C)
257690773 254337 257945110 100 257695083 250027 257945110 100 0.000
(ii) Shareholding of Promoters
Sr. No.
Shareholders’s Name Shareholding at the beginningof the year
Shares holding at the end of the year % change in the
shareholding during the
year
No. of Shares
% of total shares
of the Company
% of Shares Pledge /
encumbered of total shares
No. of Shares
% of total
shares of the
Company
% of Shares Pledge /
encumbered of total shares
(a) Individual/Hindu Undivided Family / NRI
1 Mr. Dhruv M. Sawhney 38391756 14.883 0 38391756 14.883 0 0.000
2 Mrs. Rati Sawhney 20358164 7.892 0 20358164 7.892 0 0.000
3 Mr. Tarun Sawhney 14695375 5.697 0 14695375 5.697 0 0.000
4 Mr. Nikhil Sawhney 15277653 5.923 0 15277653 5.923 0 0.000
5 Manmohan Sawhney (HUF) 4513225 1.750 0 4513225 1.750 0 0.000
6 Mrs. Tarana Sawhney 25000 0.010 0 25000 0.010 0 0.000
Total (a) 93261173 36.155 0 93261173 36.155 0 0.000

P. 94
Sr. No.
Shareholders’s Name Shareholding at the beginningof the year
Shares holding at the end of the year % change in the
shareholding during the
year
No. of Shares
% of total shares
of the Company
% of Shares Pledge /
encumbered of total shares
No. of Shares
% of total
shares of the
Company
% of Shares Pledge /
encumbered of total shares
(b) Bodies Corporate
1 Subhadra Trade & Finance Limited
82696056 32.060 0 0 0.000 0 -32.060
2 STFL Trading & Finance Private Limited
0 0.000 0 82696056 32.060 0 32.060
3 Tarun Sawhney Trust 0 0.000 0 0 0.000 0 0.000
4 Nikhil Sawhney Trust 0 0.000 0 0 0.000 0 0.000
Total (b) 82696056 32.060 0 82696056 32.060 0 0.000
TOTAL (a+b) 175957229 68.215 0 175957229 68.215 0 0.000
(iii) Change in Promoters’ Shareholding (please specify, if there is no change):
Sl. No.
Shareholder's Name Shareholding at the beginning of the year
Date Increase / Decrease
in the shareholding
Reason Cumulative shareholding during
the year
No. of Shares
% of total shares
of the Company
No. of Shares
% of total shares
of the Company
1 Subhadra Trade & Finance Limited 82696056 32.060 26-12-2017 -82696056 0 -32.060
2 STFL Trading & Finance Private Limited
0 0.000 29-12-2017 82696056 82696056 32.060
(iv) Shareholding Pattern of top ten Shareholders (other than Directors, Promoters and Holders of GDRs and ADRs):
Sl. No.
Shareholder's Name Shareholding at the beginning of the year
Date Increase / Decrease
in the shareholding
Reason Cumulative shareholding during
the year
No. of Shares
% of total shares
of the Company
No. of Shares
% of total shares
of the Company
1* L AND T MUTUAL FUND TRUSTEE LTD-L AND T INDIA VALUE FUND
8009053 3.105 21-Jul-17 -2984773 Transfer 5024280 1.948
28-Jul-17 -1282447 Transfer 3741833 1.451
04-Aug-17 -1211747 Transfer 2530086 0.981
11-Aug-17 -2530086 Transfer 0 0
2 Government Pension Fund Global 5700000 2.21 07-Apr-17 -300000 Transfer 5400000 2.093
04-Aug-17 -200000 Transfer 5200000 2.016
11-Aug-17 -100000 Transfer 5100000 1.977
3 INDIANIVESH CAPITALS LIMITED 4300631 1.667 07-Apr-17 -635336 Transfer 3665295 1.421
21-Apr-17 60000 Transfer 3725295 1.444
28-Apr-17 -50000 Transfer 3675295 1.425
02-Jun-17 100000 Transfer 3775295 1.464
28-Jul-17 -5600 Transfer 3769695 1.461
11-Aug-17 202072 Transfer 3971767 1.54
08-Sep-17 232978 Transfer 4204745 1.63
06-Oct-17 -500000 Transfer 3704745 1.436
13-Oct-17 -500 Transfer 3704245 1.436
20-Oct-17 5000 Transfer 3709245 1.438
27-Oct-17 10000 Transfer 3719245 1.442
03-Nov-17 -1000 Transfer 3718245 1.441
24-Nov-17 250 Transfer 3718495 1.442
01-Dec-17 -250 Transfer 3718245 1.441

P. 95
Annual Report 2017-18
02-17 | Co
rpo
rate Overview
24-101 | Statuto
ry Rep
orts
18-23 | Man
agem
ent Statem
ents
102-266 | Finan
cial Statemen
ts
Sl. No.
Shareholder's Name Shareholding at the beginning of the year
Date Increase / Decrease
in the shareholding
Reason Cumulative shareholding during
the year
No. of Shares
% of total shares
of the Company
No. of Shares
% of total shares
of the Company
08-Dec-17 -32436 Transfer 3685809 1.429
15-Dec-17 500 Transfer 3686309 1.429
12-Jan-18 27200 Transfer 3713509 1.44
19-Jan-18 119962 Transfer 3833471 1.486
25-Jan-18 15000 Transfer 3848471 1.492
09-Feb-18 29141 Transfer 3877612 1.503
16-Feb-18 -10000 Transfer 3867612 1.499
23-Feb-18 400000 Transfer 4267612 1.654
09-Mar-18 344504 Transfer 4612116 1.788
16-Mar-18 12669 Transfer 4624785 1.793
23-Mar-18 196105 Transfer 4820890 1.869
31-Mar-18 712291 Transfer 5533181 2.145
4* L AND T MUTUAL FUND TRUSTEE LTD-L AND T INDIA SPECIAL SITUATIONS FUND
2976977 1.154 07-Apr-17 -385058 Transfer 2591919 1.005
28-Apr-17 -332624 Transfer 2259295 0.876
05-May-17 -602379 Transfer 1656916 0.642
12-May-17 -485244 Transfer 1171672 0.454
19-May-17 -85672 Transfer 1086000 0.421
02-Jun-17 -141368 Transfer 944632 0.366
09-Jun-17 -150280 Transfer 794352 0.308
16-Jun-17 -251987 Transfer 542365 0.21
23-Jun-17 -13850 Transfer 528515 0.205
30-Jun-17 -171011 Transfer 357504 0.139
07-Jul-17 -357504 Transfer 0 0
5* FAMOUS DEVELOPERS PRIVATE LIMITED
1701000 0.659 28-Apr-17 13138 Transfer 1714138 0.665
05-May-17 21862 Transfer 1736000 0.673
09-Jun-17 -10000 Transfer 1726000 0.669
16-Jun-17 -70000 Transfer 1656000 0.642
23-Jun-17 -160000 Transfer 1496000 0.58
07-Jul-17 -50000 Transfer 1446000 0.561
14-Jul-17 -40000 Transfer 1406000 0.545
28-Jul-17 -50000 Transfer 1356000 0.526
13-Oct-17 -15000 Transfer 1341000 0.52
17-Nov-17 -70000 Transfer 1271000 0.493
24-Nov-17 -47000 Transfer 1224000 0.475
15-Dec-17 -25000 Transfer 1199000 0.465
22-Dec-17 -20000 Transfer 1179000 0.457
29-Dec-17 -75000 Transfer 1104000 0.428
05-Jan-18 -25000 Transfer 1079000 0.418
12-Jan-18 -14000 Transfer 1065000 0.413
19-Jan-18 -35000 Transfer 1030000 0.399
25-Jan-18 -35000 Transfer 995000 0.386
16-Feb-18 -35000 Transfer 960000 0.372
23-Feb-18 -16000 Transfer 944000 0.366
02-Mar-18 -10000 Transfer 934000 0.362
09-Mar-18 -374000 Transfer 560000 0.217
16-Mar-18 -190000 Transfer 370000 0.143
23-Mar-18 -190000 Transfer 180000 0.07
31-Mar-18 -30000 Transfer 150000 0.058
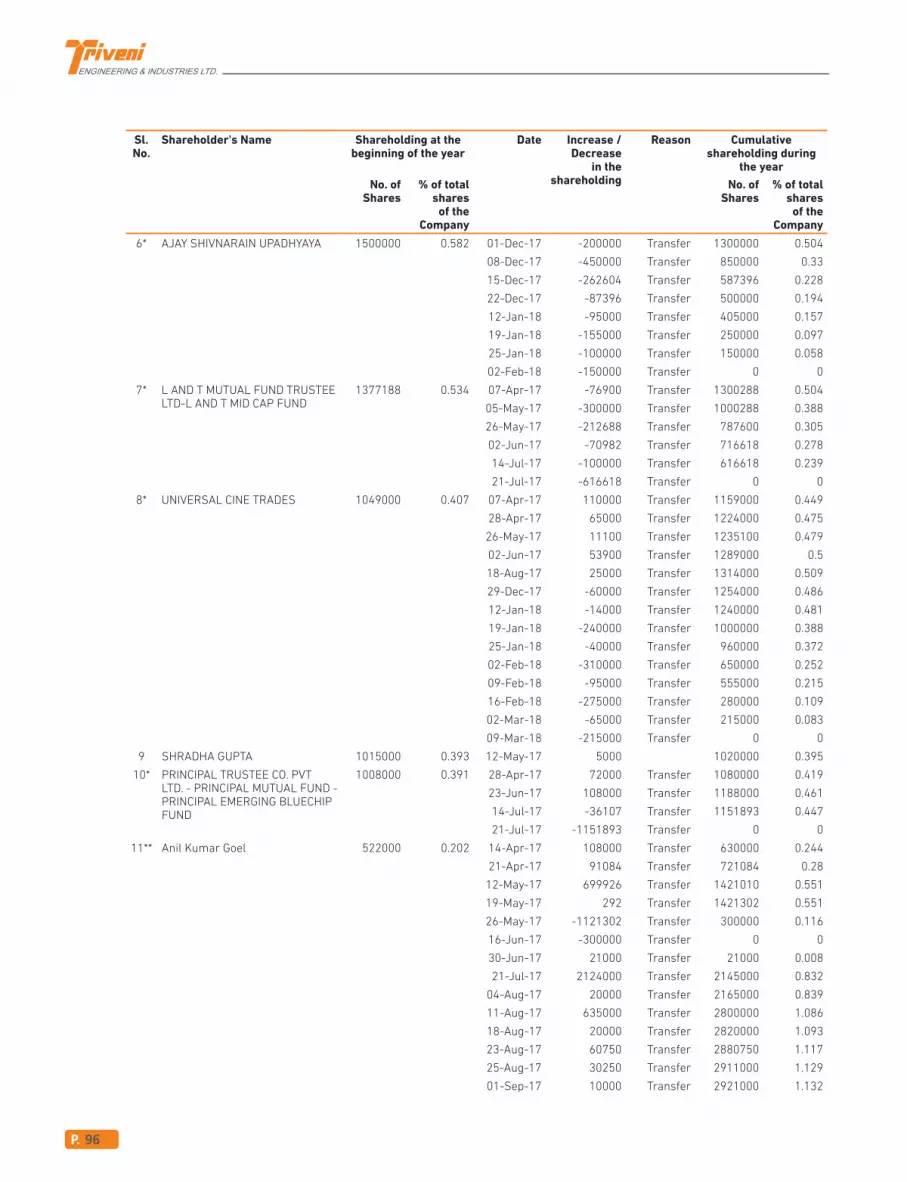
P. 96
Sl. No.
Shareholder's Name Shareholding at the beginning of the year
Date Increase / Decrease
in the shareholding
Reason Cumulative shareholding during
the year
No. of Shares
% of total shares
of the Company
No. of Shares
% of total shares
of the Company
6* AJAY SHIVNARAIN UPADHYAYA 1500000 0.582 01-Dec-17 -200000 Transfer 1300000 0.504
08-Dec-17 -450000 Transfer 850000 0.33
15-Dec-17 -262604 Transfer 587396 0.228
22-Dec-17 -87396 Transfer 500000 0.194
12-Jan-18 -95000 Transfer 405000 0.157
19-Jan-18 -155000 Transfer 250000 0.097
25-Jan-18 -100000 Transfer 150000 0.058
02-Feb-18 -150000 Transfer 0 0
7* L AND T MUTUAL FUND TRUSTEE LTD-L AND T MID CAP FUND
1377188 0.534 07-Apr-17 -76900 Transfer 1300288 0.504
05-May-17 -300000 Transfer 1000288 0.388
26-May-17 -212688 Transfer 787600 0.305
02-Jun-17 -70982 Transfer 716618 0.278
14-Jul-17 -100000 Transfer 616618 0.239
21-Jul-17 -616618 Transfer 0 0
8* UNIVERSAL CINE TRADES 1049000 0.407 07-Apr-17 110000 Transfer 1159000 0.449
28-Apr-17 65000 Transfer 1224000 0.475
26-May-17 11100 Transfer 1235100 0.479
02-Jun-17 53900 Transfer 1289000 0.5
18-Aug-17 25000 Transfer 1314000 0.509
29-Dec-17 -60000 Transfer 1254000 0.486
12-Jan-18 -14000 Transfer 1240000 0.481
19-Jan-18 -240000 Transfer 1000000 0.388
25-Jan-18 -40000 Transfer 960000 0.372
02-Feb-18 -310000 Transfer 650000 0.252
09-Feb-18 -95000 Transfer 555000 0.215
16-Feb-18 -275000 Transfer 280000 0.109
02-Mar-18 -65000 Transfer 215000 0.083
09-Mar-18 -215000 Transfer 0 0
9 SHRADHA GUPTA 1015000 0.393 12-May-17 5000 1020000 0.395
10* PRINCIPAL TRUSTEE CO. PVT LTD. - PRINCIPAL MUTUAL FUND - PRINCIPAL EMERGING BLUECHIP FUND
1008000 0.391 28-Apr-17 72000 Transfer 1080000 0.419
23-Jun-17 108000 Transfer 1188000 0.461
14-Jul-17 -36107 Transfer 1151893 0.447
21-Jul-17 -1151893 Transfer 0 0
11** Anil Kumar Goel 522000 0.202 14-Apr-17 108000 Transfer 630000 0.244
21-Apr-17 91084 Transfer 721084 0.28
12-May-17 699926 Transfer 1421010 0.551
19-May-17 292 Transfer 1421302 0.551
26-May-17 -1121302 Transfer 300000 0.116
16-Jun-17 -300000 Transfer 0 0
30-Jun-17 21000 Transfer 21000 0.008
21-Jul-17 2124000 Transfer 2145000 0.832
04-Aug-17 20000 Transfer 2165000 0.839
11-Aug-17 635000 Transfer 2800000 1.086
18-Aug-17 20000 Transfer 2820000 1.093
23-Aug-17 60750 Transfer 2880750 1.117
25-Aug-17 30250 Transfer 2911000 1.129
01-Sep-17 10000 Transfer 2921000 1.132

P. 97
Annual Report 2017-18
02-17 | Co
rpo
rate Overview
24-101 | Statuto
ry Rep
orts
18-23 | Man
agem
ent Statem
ents
102-266 | Finan
cial Statemen
ts
Sl. No.
Shareholder's Name Shareholding at the beginning of the year
Date Increase / Decrease
in the shareholding
Reason Cumulative shareholding during
the year
No. of Shares
% of total shares
of the Company
No. of Shares
% of total shares
of the Company
08-Sep-17 164000 Transfer 3085000 1.196
15-Sep-17 135000 Transfer 3220000 1.248
22-Sep-17 32000 Transfer 3252000 1.261
29-Sep-17 702000 Transfer 3954000 1.533
06-Oct-17 196000 Transfer 4150000 1.609
10-Nov-17 561531 Transfer 4711531 1.827
17-Nov-17 128469 Transfer 4840000 1.876
24-Nov-17 120000 Transfer 4960000 1.923
01-Dec-17 20000 Transfer 4980000 1.931
08-Dec-17 120000 Transfer 5100000 1.977
22-Dec-17 20000 Transfer 5120000 1.985
19-Jan-18 10000 Transfer 5130000 1.989
25-Jan-18 30000 Transfer 5160000 2
02-Feb-18 30000 Transfer 5190000 2.012
09-Feb-18 25000 Transfer 5215000 2.022
09-Mar-18 3453 Transfer 5218453 2.023
16-Mar-18 6547 Transfer 5225000 2.026
23-Mar-18 5000 Transfer 5230000 2.028
30-Mar-18 15000 Transfer 5240000 2.031
12** DSP BLACKROCK SMALL CAP FUND
0 0 11-Aug-17 1975000 Transfer 1975000 0.766
18-Aug-17 61136 Transfer 2036136 0.789
25-Aug-17 102500 Transfer 2138636 0.829
01-Sep-17 52006 Transfer 2190642 0.849
08-Sep-17 185768 Transfer 2376410 0.921
05-Jan-18 182463 Transfer 2558873 0.992
12-Jan-18 78400 Transfer 2637273 1.022
19-Jan-18 479559 Transfer 3116832 1.208
25-Jan-18 164287 Transfer 3281119 1.272
02-Feb-18 433272 Transfer 3714391 1.44
13** Anil Kumar Goel 0 0 26-May-17 1200000 Transfer 1200000 0.465
16-Jun-17 300000 Transfer 1500000 0.582
14** Seema Goel 0 0 11-Aug-17 300000 Transfer 300000 0.116
15-Sep-17 25500 Transfer 325500 0.126
22-Sep-17 264500 Transfer 590000 0.229
29-Sep-17 130000 Transfer 720000 0.279
20-Oct-17 50000 Transfer 770000 0.299
27-Oct-17 40559 Transfer 810559 0.314
03-Nov-17 39441 Transfer 850000 0.33
10-Nov-17 230000 Transfer 1080000 0.419
24-Nov-17 36000 Transfer 1116000 0.433
01-Dec-17 15636 Transfer 1131636 0.439
08-Dec-17 38364 Transfer 1170000 0.454
22-Dec-17 90000 Transfer 1260000 0.488
09-Feb-18 -11000 Transfer 1249000 0.484
16-Feb-18 -19000 Transfer 1230000 0.477

P. 98
Sl. No.
Shareholder's Name Shareholding at the beginning of the year
Date Increase / Decrease
in the shareholding
Reason Cumulative shareholding during
the year
No. of Shares
% of total shares
of the Company
No. of Shares
% of total shares
of the Company
15** EMERGING MARKETS CORE EQUITY PORTFOLIO (THE PORTFOLIO) OF DFA INVESTMENT DIMENSIONS GROUP INC. (DFAIDG)
532491 0.206 07-Apr-17 28659 Transfer 561150 0.218
14-Apr-17 81200 Transfer 642350 0.249
21-Apr-17 68720 Transfer 711070 0.276
28-Apr-17 160589 Transfer 871659 0.338
12-May-17 20295 Transfer 891954 0.346
19-May-17 9243 Transfer 901197 0.349
26-May-17 27005 Transfer 928202 0.36
22-Sep-17 7441 Transfer 935643 0.363
29-Sep-17 15132 Transfer 950775 0.369
13-Oct-17 10336 Transfer 961111 0.373
27-Oct-17 19283 Transfer 980394 0.38
10-Nov-17 20144 Transfer 1000538 0.388
24-Nov-17 29307 Transfer 1029845 0.399
15-Dec-17 12849 Transfer 1042694 0.404
22-Dec-17 39481 Transfer 1082175 0.42
16** UNIVERSAL GOLDEN FUND 0 0 25-Jan-18 400000 Transfer 400000 0.155
09 Feb-18 226700 Transfer 626700 0.243
02-Mar-18 112600 Transfer 739300 0.287
16-Mar-18 278000 Transfer 1017300 0.394
17** THE MASTER TRUST BANK OF JAPAN, LTD. AS TRUSTEE OF BLACKROCK INDIA EQUITY FUND
0 0 08-Sep-17 461976 Transfer 461976 0.179
13-Oct-17 458228 Transfer 920204 0.357
20-Oct-17 113367 Transfer 1033571 0.401
10-Nov-17 -44040 Transfer 989531 0.384
02-Feb-18 -23955 Transfer 965576 0.374
02-Mar-18 -12925 Transfer 952651 0.369
*Ceased to be in the list of top 10 shareholders as on 31.3.2018. However, the same has been reflected above since the shareholder was
one of the top 10 shareholders as on 01.04.2017.
**Not in the list of top 10 shareholders as on 01.04.2017. However, the same has been reflected above since the shareholder was one of
the top 10 shareholders as on 31.03.2018.
(v). Shareholding of Directors and Key Managerial Personnel:
Sl. No.
Shareholder's Name Shareholding at the beginning of the year
Date Increase / Decrease
in the shareholding
Reason Cumulative shareholding during
the year
No. of Shares
% of total shares
of the Company
No. of Shares
% of total shares
of the Company
A. DIRECTORS
1 Mr Dhruv M Sawhney 38391756 14.883 - 0 38391756 14.883
2 Mr Tarun Sawhney 14695375 5.697 - 0 - 14695375 5.697
3 Mr Nikhil Sawhney 15277653 5.923 - 0 - 15277653 5.923
4 Dr. F.C. Kohli 0 0 - 0 - 0 0
5 Lt. Gen. K.K. Hazari (Retd.) 0 0 - 0 - 0 0
6 Mr. Shekhar Datta 10000 0.004 - 0 - 10000 0.004
7 Ms. Homai A. Daruwalla 0 0 - 0 - 0 0
8 Dr. Santosh Pande 0 0 0 0
9 Mr. Sudipto Sarkar 0 0 0 0
B. KEY MANAGERIAL PERSONNEL
10 Mr Suresh Taneja 14000 0.005 - 0 - 14000 0.005
11 Mrs Geeta Bhalla 0 0 - 0 - 0 0

P. 99
Annual Report 2017-18
02-17 | Co
rpo
rate Overview
24-101 | Statuto
ry Rep
orts
18-23 | Man
agem
ent Statem
ents
102-266 | Finan
cial Statemen
ts
V. INDEBTEDNESS
Indebtedness of the Company including interest outstanding/accrued but not due for payment
(` in Lakhs)
Secured LoansexcludingDeposits*
UnsecuredLoans
Unclaimed Deposits
TotalIndebtedness
Indebtedness at the beginning of the Financial year
i) Principal Amount 171541.60 1666.03 -- 173207.63
ii) Interest due but not paid -- -- 0.21 0.21
iii) Interest accrued but not due 218.57 -- -- 218.57
Total (i+ii+iii) 171760.17 1666.03 0.21 173426.40
159.64 2090.00 -- 2249.64
49694.98 1666.03 0.21 51361.22
Net Change -49535.34 423.97 -0.21 -49111.58
Indebtedness at the end of the year
i) Principal Amount 122128.82 2090.00 -- 124218.82
ii) Interest due but not paid -- -- -- --
iii) Interest accrued but not due 96.00 -- -- 96.00
Total (i+ii+iii) 122224.82 2090.00 -- 124314.82
*Includes short term borrowings(cash credit) from banks
Note :- Term Loans have been considered at undiscounted value
VI. REMUNERATION OF DIRECTORS AND KEY MANAGERIAL PERSONNEL
A. Remuneration to Managing Director, Whole-time Directors and/or Manager:
(` in Lakhs)
Sl.No.
Particulars of Remuneration Name of MD/WTD/Manager TotalAmountMr Dhruv M. Sawhney
CMDMr Tarun Sawhney
VCMD
1.
Gross salary
(a) Salary as per provisions contained in section 17(1) of the Income-tax Act, 1961
-- 182.70 182.70
(b) Value of perquisites u/s 17(2) Income-tax Act, 1961
-- 27.87 27.87
(c) Profits in lieu of salary under17(3) Income-tax Act, 1961
-- -- --
2. Stock Option -- -- --
3. Sweat Equity -- -- --
4. Commission- as % of profit- others, please specify
-- -- --
5. Others (Retiral Benefits) -- 29.16* 29.16*
Total (A) -- 239.73 239.73
Ceiling as per the Act In view of inadequate profits, the above remuneration was paid as ‘minimum remuneration’ in accordance with the applicable provisions of the Companies Act, 2013.
*does not include gratuity as it is provided on actuarial valuation.

P. 100
B. Remuneration to other directors:
(` in Lakhs)
Sl.No.
Particulars of Remuneration Fee for attending board/ committee meetings
Commission Others, please specify
Total Amount
1. Independent Directors
Dr F.C. Kohli 1.25 -- -- 1.25
Lt. Gen. K.K. Hazari (Retd.) 5.50 -- -- 5.50
Mr Shekhar Datta 6.00 -- -- 6.00
Ms. Homai A. Daruwalla 6.00 -- -- 6.00
Dr Santosh Pande 4.00 -- 4.00
Mr Sudipto Sarkar 4.00 -- 4.00
Total (1) 26.75 -- -- 26.75
2. Other Non-Executive Directors
Mr Nikhil Sawhney 3.70 -- -- 3.70
Total (2) 3.70 -- -- 3.70
Total (B) = (1+2) 30.45 -- 30.45
Total Remuneration (A+B) 270.18
Overall ceiling as per the Act In view of inadequate profits, the above remuneration was paid in accordance with the applicable provisions of the Companies Act, 2013.
C. Remuneration to Key Managerial Personnel other than MD / MANAGER/WTD
(` in Lakhs)
Sl.
No.
Particulars of Remuneration Key Managerial Personnel
CEO CFO CS Total
1 Gross salary
(a) Salary as per provisions contained in
section 17(1) of the Income-tax Act,
1961
NA 183.69 65.33 249.02
(b) Value of perquisites u/s 17(2) Income
tax Act, 1961
NA 0.75 0.34 1.09
(c) Profits in lieu of salary under section
17(3) Income-tax Act, 1961
NA Nil Nil Nil
2 Stock Option NA Nil Nil Nil
3 Sweat Equity NA Nil Nil Nil
4 Commission
- as % of profit
- others, specify…
NA Nil Nil Nil
5 Others (Retiral benefits)* NA 7.95 2.94 10.89
Total NA 192.39 68.61 261.00
*does not include gratuity as it is provided based on actuarial valuation.

P. 101
Annual Report 2017-18
02-17 | Co
rpo
rate Overview
24-101 | Statuto
ry Rep
orts
18-23 | Man
agem
ent Statem
ents
102-266 | Finan
cial Statemen
ts
VII. PENALTIES / PUNISHMENT/ COMPOUNDING OF OFFENCES:
Type Section of the Companies Act
BriefDescription
Details ofPenalty/
Punishment/Compoundingfees imposed
Authority[RD/
NCLT/COURT]
Appealmade,if any(give
Details)
A. COMPANY
Penalty
None Punishment
Compounding
B. DIRECTORS
Penalty
None Punishment
Compounding
C. OTHER OFFICERS IN DEFAULT
Penalty
None Punishment
Compounding

P. 102
To
The Members
Triveni Engineering & Industries Limited
REPORT ON THE STANDALONE INDIAN ACCOUNTING
STANDARDS (IND AS) FINANCIAL STATEMENTS
We have audited the accompanying standalone Ind AS financial
statements of TRIVENI ENGINEERING & INDUSTRIES LIMITED
(“the Company”), which comprises the Balance Sheet as at
March 31, 2018, the Statement of Profit and Loss (including
Other Comprehensive Income), the Statement of Cash Flows
and the Statement of Changes in Equity for the year then ended
and a summary of the significant accounting policies and other
explanatory information (hereinafter referred to as “standalone
Ind AS financial statements”).
MANAGEMENT’S RESPONSIBILITY FOR THE
STANDALONE IND AS FINANCIAL STATEMENTS
The Company’s Board of Directors is responsible for the matters
stated in Section 134(5) of the Companies Act, 2013 (“the Act”)
with respect to the preparation of these standalone Ind AS
financial statements to give a true and fair view of the state of
affairs (financial position), profit or loss (financial performance
including other comprehensive income), cash flows and changes
in equity of the Company in accordance with the accounting
principles generally accepted in India, including the Indian
Accounting Standards (Ind AS) specified under Section 133 of
the Act, read with relevant rules issued thereunder.
This responsibility also includes maintenance of adequate
accounting records in accordance with the provisions of the Act
for safeguarding the assets of the Company and for preventing
and detecting frauds and other irregularities; selection
and application of appropriate accounting policies; making
judgments and estimates that are reasonable and prudent; and
design, implementation and maintenance of adequate internal
financial controls, that were operating effectively for ensuring
the accuracy and completeness of the accounting records,
relevant to the preparation and presentation of the standalone
Ind AS financial statements that give a true and fair view and are
free from material misstatement, whether due to fraud or error.
AUDITOR’S RESPONSIBILITY
Our responsibility is to express an opinion on these standalone
Ind AS financial statements based on our audit.
We have taken into account the provisions of the Act, the
accounting and auditing standards and matters which are
required to be included in the audit report under the provisions
of the Act and the Rules made thereunder.
We conducted our audit of the standalone Ind AS financial
statements in accordance with the Standards on Auditing specified
under Section 143(10) of the Act. Those Standards require that we
comply with ethical requirements and plan and perform the audit
to obtain reasonable assurance about whether the standalone Ind
AS financial statements are free from material misstatement.
An audit involves performing procedures to obtain audit
evidence about the amounts and the disclosures in the
standalone Ind AS financial statements. The procedures
selected depend on the auditor’s judgment, including the
assessment of the risks of material misstatement of the
standalone Ind AS financial statements, whether due to
fraud or error. In making those risk assessments, the auditor
considers internal financial control relevant to the Company’s
preparation of the standalone Ind AS financial statements that
give a true and fair view in order to design audit procedures that
are appropriate in the circumstances. An audit also includes
evaluating the appropriateness of the accounting policies used
and the reasonableness of the accounting estimates made
by the Company’s Directors, as well as evaluating the overall
presentation of the standalone Ind AS financial statements.
We believe that the audit evidence we have obtained is sufficient
and appropriate to provide a basis for our audit opinion on the
standalone Ind AS financial statements.
OPINION
In our opinion and to the best of our information and according
to the explanations given to us, the aforesaid standalone Ind
AS financial statements give the information required by the
Act in the manner so required and give a true and fair view in
conformity with the accounting principles generally accepted in
India, of the state of affairs (financial position) of the Company
as at March 31, 2018, its profit (financial performance including
other comprehensive income), its cash flows and the changes in
equity for the year ended on that date.
OTHER MATTER
The standalone Ind AS financial statements of the Company for
the year ended March 31, 2017, were audited by another firm
of chartered accountants under the Companies Act, 2013 who,
vide their report dated May 20, 2017, expressed an unmodified
opinion on those financial statements. Our opinion is not
modified in respect of this matter.
Independent Auditors’ Report

P. 103
Annual Report 2017-18
02-17 | Co
rpo
rate Overview
24-101 | Statuto
ry Rep
orts
18-23 | Man
agem
ent Statem
ents
102-266 | Finan
cial Statemen
ts
REPORT ON OTHER LEGAL AND REGULATORY
REQUIREMENTS
1. As required by the Companies (Auditor’s Report) Order,
2016 (“the Order”) issued by the Central Government of
India in terms of Section 143(11) of the Act, we give in
the “Annexure A” a statement on the matters specified in
paragraphs 3 and 4 of the Order.
2. As required by Section 143 (3) of the Act, we report that:
a) We have sought and obtained all the information and
explanations which to the best of our knowledge and
belief were necessary for the purposes of our audit.
b) In our opinion, proper books of account as required
by law have been kept by the Company so far as it
appears from our examination of those books.
c) The Balance Sheet, the Statement of Profit and
Loss (including Other Comprehensive Income),
the Statement of Cash Flows and the Statement of
Changes in Equity dealt with by this Report are in
agreement with the books of account.
d) In our opinion, the aforesaid standalone Ind AS
financial statements comply with the Indian
Accounting Standards specified under Section 133 of
the Act, read with relevant rules issued thereunder.
e) On the basis of the written representations received
from the directors as on March 31, 2018 taken on
record by the Board of Directors, none of the directors is
disqualified as on March 31, 2018 from being appointed
as a director in terms of Section 164 (2) of the Act.
f) With respect to the adequacy of the internal financial
controls over financial reporting of the Company and
the operating effectiveness of such controls, refer to
our separate Report in “Annexure B”.
g) With respect to the other matters to be included in
the Auditor’s Report in accordance with Rule 11 of
the Companies (Audit and Auditors) Rules, 2014, in
our opinion and to the best of our information and
according to the explanations given to us:
i. The Company has disclosed the impact of
pending litigations as at March 31, 2018 on
its financial position in its Standalone Ind AS
financial statements – Refer Note 46 to the
Standalone Ind AS financial statements.
ii. The Company has made provision, as required
under the applicable law or accounting
standards, for material foreseeable losses,
on long-term contracts including long term
derivative contracts.
iii. There were no amounts which were required
to be transferred to the Investor Education and
Protection Fund by the Company.
iv. The reporting on the disclosures relating to
Specified Bank Notes is not applicable to the
Company for the year ended March 31, 2018.
For S. S. Kothari Mehta & Co.
Chartered Accountants
Firm Registration No. 000756N
Yogesh K. Gupta
Place: Noida Partner
Dated: May 24, 2018 Membership No. 093214

P. 104
The Annexure as referred in paragraph (1) ‘Report on Other
Legal and Regulatory Requirements of our Independent
Auditors’ Report to the members of TRIVENI ENGINEERING
& INDUSTRIES LIMITED on the standalone Ind AS financial
statements for the year ended March 31, 2018, we report that:
i. (a) The Company has generally maintained proper
records showing full particulars including quantitative
details and situation of fixed assets.
(b) The Company has a regular program of physical
verification of its fixed assets which in our opinion, is
reasonable having regard to the size of the Company
and the nature of its fixed assets. In accordance with
this program, all major items of fixed assets were
physically verified by the Management during the year
and no material discrepancies were noticed on such
verification as compared to the books of accounts.
(c) According to the information and explanation given
to us and on the basis of examination of title deeds
/ sale deed / transfer deed / conveyance deed /
possession letter / allotment letter and other relevant
records evidencing title/ possession provided and
legal opinion obtained by the Company, we report that
the title deeds of the immovable properties are held
in the name of the Company as at the balance sheet
date except for 3 cases having gross book value of Rs.
13.13 lakhs in respect of freehold land as disclosed
in Note No. 3 on Property, Plant & Equipment and 35
cases having gross book value of Rs. 381.47 lakhs in
respect of freehold land, disclosed in Note No. 4 on
Investment Property, to standalone Ind AS financial
statements, where the title deeds are not held in the
name of the Company.
ii The physical verification of the inventory have been
conducted at reasonable intervals by the management
during the year. As far as we could ascertain and according
to information and explanations given to us, no material
discrepancies were noticed between the physical stock
and the book records.
iii. According to the information and explanations given to
us and on the basis of our examination of the records of
the Company, the Company has not granted any loans,
secured or unsecured to companies, firms, limited liability
partnerships or other parties covered in the register
maintained under section 189 of the Companies Act, 2013.
Accordingly, the provisions of clause 3 (iii) (a) to (c) of the
Order are not applicable to the Company.
iv. According to the information and explanations given to
us, the Company has not granted any loans or provided
any guarantees or security as specified under Section
185 and 186 of the Companies Act, 2013. The Company
has complied with the provisions of section 186 of the
Companies Act, 2013 with regards to investments made.
v. According to the information and explanations given
to us, the Company has not accepted any deposits from
the public within the meaning of sections 73 to 76 of the
Companies Act, 2013 and the rules framed there under.
Accordingly, the provisions of clause 3 (v) of the Order are
not applicable to the Company.
vi. We have broadly reviewed the books of account maintained
by the Company pursuant to the rules prescribed by
the Central Government of India for the maintenance of
cost records under sub-section 1 of Section 148 of the
Companies Act, 2013 and are of the opinion that, prima
facie, the prescribed records and accounts have been
made and maintained. However, we have not carried out
a detailed examination of such records with a view to
determining whether they are accurate or complete.
vii. (a) According to the information and explanations given
to us and on the basis of examination of the records
of the Company, the Company is generally regular
in depositing undisputed statutory dues including
provident fund, employees’ state insurance, sales-tax,
income tax, service tax, custom duty, excise duty, value
added tax, goods and services tax with effect from July
1, 2017 and other material statutory dues with the
appropriate authorities to the extent applicable.
(b) According to the information and explanations given to
us and on the basis of examination of the records of the
Company there are no undisputed aforesaid statutory
dues payable as at March 31, 2018 for a period of more
than six months from the date they became payable.
(c) According to the records and information and
explanations given to us, there are no dues in respect
of income tax, sales tax, service tax, duty of excise,
duty of customs, or value added tax which have not
been deposited on account of any dispute except as
given below:
“Annexure A” to the Independent Auditors’ Report

P. 105
Annual Report 2017-18
02-17 | Co
rpo
rate Overview
24-101 | Statuto
ry Rep
orts
18-23 | Man
agem
ent Statem
ents
102-266 | Finan
cial Statemen
ts
Name of Statute Nature of Dues
Period (F.Y.) to which the amount relates
Amount Demanded (Excluding
interest)(` in Lakhs)
Amount paid(` in Lakhs)
Forum where dispute is pending
The Central Excise Act, 1944
Excise duty 1998-99 to 2004-05 and 2007-08 to 2012-13
35.12 13.82 High Court
The Central Excise Act, 1944
Penalty 1998-99 to 2004-05 and 2007-08 to 2012-13
290.60 266.00 High Court
The Central Excise Act, 1944
Excise duty 1995-96, 1996-97, 2006-07 & 2009-10 to 2015-16
145.61 26.74 Customs, Excise and Service Tax Appellate Tribunal
The Central Excise Act, 1944
Penalty 1995-96 - 1996-97 & 2005-06 to 2015-16
127.90 0.12 Customs, Excise and Service Tax Appellate Tribunal
The Central Excise Act, 1944
Excise duty 1995-96 & 2010-11 to 2016-17
274.55 25.38 Commissioner (Appeal)
The Central Excise Act, 1944
Penalty 1995-96 & 2010-11 to 2016-17
230.91 - Commissioner (Appeal)
The Finance Act, 1994 (Service Tax)
Service Tax 2012-13 & 2013-14 23.37 23.37 Customs, Excise and Service Tax Appellate Tribunal
The Finance Act, 1994 (Service Tax)
Service Tax 2016-17 2.13 - Commissioner (Appeal)
The Finance Act, 1994 (Service Tax)
Penalty 2016-17 2.13 - Commissioner (Appeal)
The Central Sales Tax Act, 1944 & State VAT Act
Sales Tax 1993-94 to 1996-97 & 1999-00
52.08 51.12 High Court
The Central Sales Tax Act, 1944 & State VAT Act
Penalty 1993-94 to 1996-97 & 1999-00
0.21 - High Court
The Central Sales Tax Act, 1944 & State VAT Act
Sales Tax 1998-99 to 2000-01, 2009-10, 2011-12 to 2013-14
484.53 61.99 Tribunal
The Central Sales Tax Act, 1944 & State VAT Act
Penalty 1998-99 to 2000-01, 2009-10, 2011-12 to 2013-14
10.78 1.82 Tribunal
The Central Sales Tax Act, 1944 & State VAT Act
Sales Tax 2013-14 & 2014-15 148.45 22.59 Addl/ Joint Commissioner
The Central Sales Tax Act, 1944 & State VAT Act
Penalty 2013-14 & 2014-15 3.89 3.30 Addl/ Joint Commissioner
The Central Sales Tax Act, 1944 & State VAT Act
Sales Tax 1986-87, 1993-94 & 1995-96 to 1996-97
58.14 42.29 Assessing authority
The Customs Act, 1962 Penalty 2004-05 19.93 6.19 Customs, Excise and Service Tax Appellate Tribunal
Prescribed remission Under UP Trade Tax (UP Sugar Promotion Policy, 2004)
Entry Tax 2009-10 & 2013-14 625.05 - High Court
Prescribed remission Under UP Trade Tax (UP Sugar Promotion Policy, 2004)
VAT 2009-10 & 2013-14 101.14 - High Court
The Income Tax Act, 1961 Income Tax 2002-03, 2004-05, 2005-06, 2007-08 & 2010-11
2,766 1,414 Income Tax Appellate Tribunal
viii. In our opinion, on the basis of audit procedures and according to the information and explanations given to us, the Company
has not defaulted in repayment of loans or borrowings to any banks, financial institutions or government during the year. The
Company has not issued any debentures.

P. 106
ix. According to the information and explanations given to us,
the Company has not raised moneys by way of initial public
offer or further public offer (including debt instruments)
during the year. The term loans have been applied for the
purpose for which they were raised.
x. During the course of our examination of the books and
records of the Company carried out in accordance with
the generally accepted auditing practices in India, we have
neither come across any instance of fraud by the Company
or on the Company by its officers or employees being
noticed or reported during the year, nor have we been
informed of such case by the Management.
xi. According to the information and explanations given to
us and based on our examination of the records of the
Company, the Company has paid/ provided for managerial
remuneration in accordance with the requisite approvals
mandated by the provisions of section 197 read with
Schedule V to the Companies Act, 2013.
xii. In our opinion and according to the information and
explanations given to us, the Company is not a Nidhi
Company. Accordingly, clause 3(xii) of the Order is not
applicable.
xiii. According to the information and explanations given to
us and based on our examination of the records of the
Company, transactions with the related parties are in
compliance with section 177 and 188 of the Companies Act,
REPORT ON THE INTERNAL FINANCIAL CONTROLS
UNDER CLAUSE (I) OF SUB-SECTION 3 OF SECTION
143 OF THE COMPANIES ACT, 2013 (“THE ACT”) AS
REFERRED TO IN PARAGRAPH 2(F) OF ‘REPORT ON
OTHER LEGAL AND REGULATORY REQUIREMENTS’
We have audited the internal financial controls over financial
reporting of TRIVENI ENGINEERING & INDUSTRIES LIMITED
(“the Company”) as of March 31, 2018 in conjunction with our
audit of the standalone Ind AS financial statements of the
Company for the year ended on that date.
MANAGEMENT’S RESPONSIBILITY FOR INTERNAL
FINANCIAL CONTROLS
The Company’s management is responsible for establishing
and maintaining internal financial controls based on the
internal control over financial reporting criteria established by
the Company considering the essential components of internal
control stated in the Guidance Note on Audit of Internal Financial
Controls over Financial Reporting issued by the Institute of
Chartered Accountants of India. These responsibilities include
the design, implementation and maintenance of adequate
internal financial controls that were operating effectively for
ensuring the orderly and efficient conduct of its business,
including adherence to company’s policies, the safeguarding of
its assets, the prevention and detection of frauds and errors, the
accuracy and completeness of the accounting records, and the
timely preparation of reliable financial information, as required
under the Companies Act, 2013.
AUDITORS’ RESPONSIBILITY
Our responsibility is to express an opinion on the Company’s
internal financial controls over financial reporting based on our
2013, where applicable, and details of such transactions
have been disclosed in the Financial Statements as
required under Indian Accounting Standard (Ind AS) 24,
Related Party Disclosures specified under section 133 of
the Companies Act, 2013.
xiv. According to the information and explanations given to
us and based on our examination of the records of the
Company, the Company has not made any preferential
allotment or private placement of shares or fully or partly
convertible debentures during the year. Accordingly, clause
3(xiv) of the Order is not applicable.
xv. According to the information and explanations given to
us and based on our examination of the records of the
Company, the Company has not entered into non-cash
transactions with directors or persons connected with him.
Accordingly, clause 3(xv) of the Order is not applicable.
xvi. The Company is not required to be registered under Section
45-IA of the Reserve Bank of India Act, 1934. Accordingly,
clause 3(xvi) of the Order is not applicable.
For S. S. Kothari Mehta & Co.
Chartered Accountants
Firm Registration No. 000756N
Yogesh K. Gupta
Place: Noida Partner
Dated: May 24, 2018 Membership No. 093214
“Annexure B” to the Independent Auditors’ Reportof even date on the Standalone Ind AS Financial Statements of Triveni Engineering & Industries Limited.

P. 107
Annual Report 2017-18
02-17 | Co
rpo
rate Overview
24-101 | Statuto
ry Rep
orts
18-23 | Man
agem
ent Statem
ents
102-266 | Finan
cial Statemen
ts
audit. We conducted our audit in accordance with the Guidance
Note on Audit of Internal Financial Controls Over Financial
Reporting (the “Guidance Note”) issued by the Institute of
Chartered Accountants of India and the Standards on Auditing,
prescribed under section 143(10) of the Companies Act, 2013,
to the extent applicable to an audit of internal financial controls.
Those Standards and the Guidance Note require that we comply
with ethical requirements and plan and perform the audit to obtain
reasonable assurance about whether adequate internal financial
controls over financial reporting was established and maintained
and if such controls operated effectively in all material respects.
Our audit involves performing procedures to obtain audit evidence
about the adequacy of the internal financial controls system over
financial reporting and their operating effectiveness. Our audit
of internal financial controls over financial reporting included
obtaining an understanding of internal financial controls over
financial reporting, assessing the risk that a material weakness
exists, and testing and evaluating the design and operating
effectiveness of internal control based on the assessed risk.
The procedures selected depend on the auditor’s judgement,
including the assessment of the risks of material misstatement
of the financial statements, whether due to fraud or error.
We believe that the audit evidence we have obtained is
sufficient and appropriate to provide a basis for our audit
opinion on the Company’s internal financial controls system
over financial reporting.
MEANING OF INTERNAL FINANCIAL CONTROLS OVER
FINANCIAL REPORTING
A Company’s internal financial control over financial reporting is
a process designed to provide reasonable assurance regarding
the reliability of financial reporting and the preparation of
financial statements for external purposes in accordance with
generally accepted accounting principles. A company’s internal
financial control over financial reporting includes those policies
and procedures that (1) pertain to the maintenance of records
that, in reasonable detail, accurately and fairly reflect the
transactions and dispositions of the assets of the company; (2)
provide reasonable assurance that transactions are recorded
as necessary to permit preparation of financial statements in
accordance with generally accepted accounting principles, and
that receipts and expenditures of the company are being made
only in accordance with authorisations of management and
directors of the company; and (3) provide reasonable assurance
regarding prevention or timely detection of unauthorised
acquisition, use, or disposition of the company’s assets that
could have a material effect on the financial statements.
INHERENT LIMITATIONS OF INTERNAL FINANCIAL
CONTROLS OVER FINANCIAL REPORTING
Because of the inherent limitations of internal financial controls
over financial reporting, including the possibility of collusion
or improper management override of controls, material
misstatements due to error or fraud may occur and not be
detected. Also, projections of any evaluation of the internal
financial controls over financial reporting to future periods
are subject to the risk that the internal financial control over
financial reporting may become inadequate because of changes
in conditions, or that the degree of compliance with the policies
or procedures may deteriorate.
OPINION
In our opinion, the Company has, in all material respects, an
adequate internal financial controls system over financial
reporting and such internal financial controls over financial
reporting were operating effectively as at March 31, 2018,
based on the internal control over financial reporting criteria
established by the Company considering the essential
components of internal control stated in the Guidance Note on
Audit of Internal Financial Controls Over Financial Reporting
issued by the Institute of Chartered Accountants of India.
For S. S. Kothari Mehta & Co.
Chartered Accountants
Firm Registration No. 000756N
Yogesh K. Gupta
Place: Noida Partner
Dated: May 24, 2018 Membership No. 093214

P. 108
Standalone Balance Sheet as at March 31, 2018
(All amounts in ` lakhs, unless otherwise stated)
Note No.As at
31-Mar-18As at
31-Mar-17ASSETSNon-current assetsProperty plant and equipment 3 83466.00 84580.20 Capital work-in-progress 3 1004.75 211.33 Investment property 4 821.14 702.23 Intangible assets 5 35.84 82.32 Investments in subsidiaries and associates 6 (a) 5000.78 4620.78 Financial assets i. Investments 6 (b) 455.51 488.23 ii. Trade receivables 7 50.32 81.98 iii. Loans 8 2.98 7.12 iv. Other financial assets 9 733.25 924.84 Income tax assets (net) 22 5733.97 2919.25 Other non-current assets 10 576.48 643.53 Total non-current assets 97881.02 95261.81 Current assetsInventories 11 157918.64 167481.68 Financial assets i. Trade receivables 7 31140.07 27709.52 ii. Cash and cash equivalents 12 (a) 338.70 651.45 iii. Bank balances other than cash and cash equivalents 12 (b) 273.02 38.26 iv. Loans 8 53.55 38.69 v. Other financial assets 9 424.31 908.59 Other current assets 10 8645.08 12980.06
198793.37 209808.25 Assets classified as held for sale 13 - 118.91 Total current assets 198793.37 209927.16 Total assets 296674.39 305188.97 EQUITY AND LIABILITIESEquityEquity share capital 14 2579.47 2579.47 Other equity 15 85507.10 75187.20 Total equity 88086.57 77766.67 LIABILITIESNon-current liabilitiesFinancial liabilities i. Borrowings 16 3495.28 27536.23 ii. Other financial liabilities 17 - 30.62 Provisions 18 3969.48 3863.01 Deferred tax liabilities (net) 23 4171.76 2342.30 Other non-current liabilities 19 149.13 250.84 Total non-current liabilities 11785.65 34023.00 Current liabilitiesFinancial liabilities i. Borrowings 20 107647.23 124209.92 ii. Trade payables 21 62805.57 25658.22 iii. Other financial liabilities 17 16425.65 24745.82 Other current liabilities 19 7991.63 17188.19 Provisions 18 1932.09 1332.40 Income tax liabilities (net) 22 - 264.75 Total current liabilities 196802.17 193399.30 Total liabilities 208587.82 227422.30 Total equity and liabilities 296674.39 305188.97
The accompanying notes 1 to 52 form an integral part of these standalone financial statements
As per our report of even date attached
For S S Kothari Mehta & Company For and on behalf of the Board of Directors of Triveni Engineering & Industries Limited Chartered AccountantsFirm’s registration number : 000756N
Yogesh K. Gupta Dhruv M. Sawhney Homai A. DaruwallaPartner Chairman & Managing Director Director & Chairperson Audit CommitteeMembership No. 093214
Place : Noida (U.P.) Suresh Taneja Geeta BhallaDate : May 24, 2018 Group CFO Group Vice President & Company Secretary

P. 109
Annual Report 2017-18
02-17 | Co
rpo
rate Overview
24-101 | Statuto
ry Rep
orts
18-23 | Man
agem
ent Statem
ents
102-266 | Finan
cial Statemen
ts
The accompanying notes 1 to 52 form an integral part of these standalone financial statements
As per our report of even date attached
For S S Kothari Mehta & Company For and on behalf of the Board of Directors of Triveni Engineering & Industries Limited Chartered AccountantsFirm’s registration number : 000756N
Yogesh K. Gupta Dhruv M. Sawhney Homai A. DaruwallaPartner Chairman & Managing Director Director & Chairperson Audit CommitteeMembership No. 093214
Place : Noida (U.P.) Suresh Taneja Geeta BhallaDate : May 24, 2018 Group CFO Group Vice President & Company Secretary
Standalone Statement of Profit and Lossfor the year ended March 31, 2018
(All amounts in ` lakhs, unless otherwise stated)
Note No.
Year ended
31-Mar-18
Year ended
31-Mar-17
Revenue from operations 24 341238.37 296686.61
Other income 25 2408.33 3037.45
Total income 343646.70 299724.06
Expenses
Cost of materials consumed 26 258145.53 206446.07
Purchases of stock-in-trade 27 1674.24 1536.93
Changes in inventories of finished goods, stock-in-trade and work-in-progress 28 (866.12) (23950.82)
Excise duty on sale of products 4167.99 14231.95
Employee benefits expense 29 20240.34 18771.48
Finance costs 30 8533.87 12655.44
Depreciation and amortisation expense 31 5536.55 5720.99
Impairment loss on financial assets (including reversals of impairment losses) 32 (296.41) 635.83
Other expenses 33 30567.31 26857.84
Total expenses 327703.30 262905.71
Profit before exceptional items and tax 15943.40 36818.35
Exceptional items 34 - (8546.74)
Profit before tax 15943.40 28271.61
Tax expense:
- Current tax 35 3203.97 2335.63
- Deferred tax 35 1765.05 2579.73
Total tax expense 4969.02 4915.36
Profit for the year 10974.38 23356.25
Other comprehensive income
A (i) Items that will not be reclassified to profit or loss
- Remeasurements of the defined benefit plans 38 186.13 (686.05)
186.13 (686.05)
A (ii) Income tax relating to items that will not be reclassified to profit or loss 35 64.41 (237.43)
121.72 (448.62)
B (i) Items that may be reclassified to profit or loss - -
B (ii) Income tax relating to items that may be reclassified to profit or loss 35 - -
Other comprehensive income for the year, net of tax 121.72 (448.62)
Total comprehensive income for the year 11096.10 22907.63
Earnings per equity share (face value ` 1 each)
Basic 36 4.25 9.06
Diluted 36 4.25 9.06

P. 110
Standalone Statement of Changes in Equityfor the year ended March 31, 2018
(All amounts in ` lakhs, unless otherwise stated)
Th
e a
cco
mp
an
yin
g n
ote
s 1
to
52
fo
rm a
n in
teg
ral
pa
rt o
f th
ese
sta
nd
alo
ne
fin
an
cia
l sta
tem
en
ts
As p
er
ou
r re
po
rt o
f e
ven
da
te a
tta
che
d
Fo
r S
S K
oth
ari
Me
hta
& C
om
pa
ny
F
or
an
d o
n b
eh
alf
of
the
Bo
ard
of
Dir
ec
tors
of
Tri
ve
ni
En
gin
ee
rin
g &
In
du
str
ies
Lim
ite
d
Ch
art
ere
d A
cco
un
tan
ts
Fir
m’s
re
gis
tra
tio
n n
um
be
r : 0
00
75
6N
Yo
ge
sh
K.
Gu
pta
D
hru
v M
. S
aw
hn
ey
H
om
ai
A.
Da
ruw
all
a
Pa
rtn
er
Ch
air
ma
n &
Ma
na
gin
g D
ire
cto
r D
ire
cto
r &
Ch
air
pe
rso
n A
ud
it C
om
mit
tee
Me
mb
ers
hip
No
. 09
32
14
Pla
ce :
No
ida
(U
.P.)
S
ure
sh
Ta
ne
ja
Ge
eta
Bh
all
a
Da
te :
Ma
y 2
4, 2
01
8
Gro
up
CF
O
Gro
up
Vic
e P
resid
en
t &
Co
mp
an
y S
ecr
eta
ry
A.
Eq
uit
y s
ha
re c
ap
ita
l
E
qu
ity
sh
are
s o
f `
1 e
ach
issu
ed
, su
bscr
ibe
d a
nd
fu
lly
pa
id u
p (
incl
ud
ing
fo
rfe
ite
d s
ha
res)
As a
t 3
1 M
arc
h 2
01
6 2
57
9.4
7
Ch
an
ge
s d
uri
ng
th
e y
ea
r -
As
at
31
Ma
rch
20
17
25
79
.47
Ch
an
ge
s d
uri
ng
th
e y
ea
r -
As
at
31
Ma
rch
20
18
25
79
.47
B.
Oth
er
eq
uit
y
Re
se
rve
s a
nd
su
rplu
s
To
tal
oth
er
eq
uit
yC
ap
ita
l
red
em
pti
on
res
erv
e
Ca
pit
al
res
erv
e
Se
cu
riti
es
pre
miu
m
Am
alg
am
ati
on
res
erv
e
Ge
ne
ral
res
erv
e
Mo
las
se
s
sto
rag
e f
un
d
res
erv
e
Re
tain
ed
ea
rnin
gs
Ba
lan
ce a
s a
t 3
1 M
arc
h 2
01
63
97
.40
28
55
.85
26
54
6.9
39
26
.34
49
21
2.7
21
82
.39
(2
78
42
.06
)5
22
79
.57
Pro
fit
for
the
ye
ar
-
-
-
-
-
-
23
35
6.2
52
33
56
.25
Oth
er
com
pre
he
nsiv
e in
com
e, n
et
of
inco
me
ta
x -
-
-
-
-
-
(
44
8.6
2)
(4
48
.62
)
To
tal
com
pre
he
ns
ive
in
com
e f
or
the
ye
ar
-
-
-
-
-
-
22
90
7.6
32
29
07
.63
Tra
nsfe
rre
d t
o m
ola
sse
s s
tora
ge
fu
nd
re
se
rve
-
-
-
-
-
20
.03
(
20
.03
) -
Ba
lan
ce a
s a
t 3
1 M
arc
h 2
01
73
97
.40
28
55
.85
26
54
6.9
39
26
.34
49
21
2.7
22
02
.42
(4
95
4.4
6)
75
18
7.2
0
Pro
fit
for
the
ye
ar
-
-
-
-
-
-
10
97
4.3
8
10
97
4.3
8
Oth
er
com
pre
he
nsiv
e in
com
e, n
et
of
inco
me
ta
x -
-
-
-
-
-
1
21
.72
1
21
.72
To
tal
com
pre
he
ns
ive
in
com
e f
or
the
ye
ar
-
-
-
-
-
-
11
09
6.1
0
11
09
6.1
0
Tra
nsfe
rre
d t
o m
ola
sse
s s
tora
ge
fu
nd
re
se
rve
-
-
-
-
-
32
.96
(
32
.96
) -
Wit
hd
raw
al
fro
m m
ola
sse
s s
tora
ge
fu
nd
re
se
rve
-
-
-
-
-
(3
9.1
0)
39
.10
-
Tra
ns
ac
tio
ns
wit
h o
wn
ers
in
th
eir
ca
pa
cit
y a
s
ow
ne
rs
- D
ivid
en
ds p
aid
-
-
-
-
-
-
(6
44
.91
) (
64
4.9
1)
- D
ivid
en
d d
istr
ibu
tio
n t
ax
-
-
-
-
-
-
(1
31
.29
) (
13
1.2
9)
Ba
lan
ce a
s a
t 3
1 M
arc
h 2
01
83
97
.40
28
55
.85
26
54
6.9
39
26
.34
49
21
2.7
21
96
.28
53
71
.58
8
55
07
.10

P. 111
Annual Report 2017-18
02-17 | Co
rpo
rate Overview
24-101 | Statuto
ry Rep
orts
18-23 | Man
agem
ent Statem
ents
102-266 | Finan
cial Statemen
ts
Year ended 31-Mar-18
Year ended 31-Mar-17
Cash flows from operating activities
Profit before tax 15943.40 28271.61
Adjustments for
Depreciation and amortisation expense 5536.55 5720.99
Bad debts written off - trade receivables and other financial assets carried at amortised cost 607.12 2215.18
Impairment loss allowance on trade receivables and other financial assets (net of reversals) (903.53) (1579.35)
Bad debts written off - Non financial assets 83.00 1009.60
Impairment loss allowance on non financial assets (net of reversals) 20.95 (1927.94)
Provision for non moving / obsolete inventory 77.24 95.30
Loss on sale /write off of inventory 33.57 24.39
Net fair value (gains)/losses on investments (23.16) (97.44)
Mark-to-market losses / (gains) on derivatives (87.85) 84.88
Credit balances written back (156.99) (154.50)
Exceptional items - 8546.74
Unrealised losses / (gains) from changes in foreign exchange rates 12.99 (40.35)
Loss on sale / write off / impairment of property plant and equipment 32.88 82.15
Net (profit)/loss on sale / redemption of investments (0.60) 0.65
Interest income (121.35) (655.71)
Dividend income (868.66) (326.94)
Finance costs 8533.87 12655.44
Working capital adjustments :
Change in inventories 9452.24 (26366.70)
Change in trade receivables (3110.85) (1651.08)
Change in other financial assets 531.71 94.72
Change in other assets 4322.00 2447.01
Change in trade payables 37265.07 (18912.21)
Change in other financial liabilities (721.46) 1149.06
Change in other liabilities (8367.97) 3383.02
Change in provisions 892.27 188.80
Cash generated from operations 68982.44 14257.32
Income tax (paid)/ refund (6283.44) 214.94
Net cash inflow from operating activities 62699.00 14472.26
Cash flows from investing activities
Purchase of property, plant and equipment (5209.90) (4196.99)
Proceeds from sale of property, plant and equipment 29.16 110.12
Refund of advance received against assets held for sale (200.00) -
Purchase of investments
Subsidiary (380.00) -
Others - (198.70)
Proceeds from sale of investments (other than Subsidiary) 60.00 50.08
Decrease / (increase) in deposits with banks (59.18) (48.39)
Interest received 170.89 66.54
Dividend received 868.66 326.94
Net cash outflow from investing activities (4720.37) (3890.40)
Standalone Statement of Cash Flowsfor the year ended March 31, 2018
(All amounts in ` lakhs, unless otherwise stated)

P. 112
Standalone Statement of Cash Flows (Contd.)for the year ended March 31, 2018
(All amounts in ` lakhs, unless otherwise stated)
Year ended 31-Mar-18
Year ended 31-Mar-17
Cash flows from financing activities
Proceeds from long term borrowings 159.64 9990.75
Repayment of long term borrowings (32447.39) (15534.34)
Increase / (decrease) in short term borrowings (16568.91) 8044.98
Interest paid (8657.00) (12616.43)
Dividend paid to Company's shareholders (644.91) -
Dividend distribution tax (131.29) -
Payment of unclaimed dividend (1.52) (4.27)
Redemption of unclaimed preference shares - (90.22)
Net cash outflow financing activities (58291.38) (10209.53)
Net increase / (decrease) in cash and cash equivalents (312.75) 372.33
Cash and cash equivalents at the beginning of the year (refer note 12 (a)) 651.45 279.12
Cash and cash equivalents at the end of the year (refer note 12 (a)) 338.70 651.45
Reconciliation of liabilities arising from financing activites:
Non-current borrowings
(including current maturities
and deferred grant related to
borrowings) Current
borrowings
Interest payable on
borrowings/ deposits
Unpaid dividends
Dividend paid to Company’s shareholders
(including DDT)
Balance as at 31 March, 2017 48865.49 124209.92 218.78 5.00 -
Cash flows (32287.75) (16568.91) (8657.00) (1.52) (776.20)
Foreign exchange movements - 6.22 0.35 - -
Finance costs accruals - - 8533.87 - -
Dividend distributions (including DDT) accruals - - - - 776.20
Balance as at 31 March 2018 16577.74 107647.23 96.00 3.48 -
The accompanying notes 1 to 52 form an integral part of these standalone financial statements
As per our report of even date attached
For S S Kothari Mehta & Company For and on behalf of the Board of Directors of Triveni Engineering & Industries Limited
Chartered Accountants
Firm’s registration number : 000756N
Yogesh K. Gupta Dhruv M. Sawhney Homai A. Daruwalla
Partner Chairman & Managing Director Director & Chairperson Audit Committee
Membership No. 093214
Place : Noida (U.P.) Suresh Taneja Geeta Bhalla
Date : May 24, 2018 Group CFO Group Vice President & Company Secretary

P. 113
Annual Report 2017-18
02-17 | Co
rpo
rate Overview
24-101 | Statuto
ry Rep
orts
18-23 | Man
agem
ent Statem
ents
102-266 | Finan
cial Statemen
ts
CORPORATE INFORMATIONTriveni Engineering & Industries Limited (“the Company”) is
a company limited by shares, incorporated and domiciled in
India. The Company’s equity shares are listed at two recognised
stock exchanges in India (BSE and NSE). The registered office
of the Company is located at Deoband, Distt. Saharanpur, Uttar
Pradesh – 247554. The Company is engaged in diversified
businesses mainly categorised into two segments – Sugar
& allied businesses and Engineering business. Sugar & allied
businesses primarily comprise manufacture of sugar, co-
generation and distillery. Engineering business primarily
comprises manufacture of high speed gears, gearboxes and
providing water treatment solutions.
Note 1: Significant accounting policies
This note provides a list of the significant accounting policies
adopted in the preparation of these standalone financial
statements. These policies have been consistently applied to all
the years presented, unless otherwise stated.
(a) Basis of preparation and presentation
(i) Compliance with Ind AS
The standalone financial statements comply in all
material aspects with Indian Accounting Standards
(Ind AS) notified under Section 133 of the Companies
Act, 2013 (the Act) [Companies (Indian Accounting
Standards) Rules, 2015] and other relevant provisions
of the Act.
(ii) Historical cost convention
The standalone financial statements have been
prepared on an accrual basis under historical cost
convention except for certain assets and liabilities that
are measured at fair values at the end of each reporting
period, as explained in the respective accounting
policies described in subsequent paragraphs.
Historical cost is generally based on the fair value
of the consideration given in exchange for goods
and services.
Fair value is the price that would be received to sell
an asset or paid to transfer a liability in an orderly
transaction between market participants at the
measurement date, regardless of whether that price
is directly observable or estimated using another
valuation technique. In estimating the fair value of an
asset or a liability, the Company takes into account
the characteristics of the asset or liability if market
participants would take those characteristics into
account when pricing the asset or liability at the
measurement date. Fair value for measurement and/
or disclosure purposes in these standalone financial
statements is determined on such a basis, except
for leasing transactions that are within the scope of
Ind AS 17 Leases (see note 1(d)), and measurements
that have some similarities to fair value but are not
fair value, such as net realisable value in Ind AS 2
Inventories (see note 1(l)) or value in use in Ind AS 36
Impairment of Assets (see note 1(f)).
(iii) Classification of assets and liabilities into current/
non-current
All assets and liabilities have been classified as
current or non-current as per the Company’s normal
operating cycle and other criteria set out in Schedule
III to the Act. The operating cycle of the Company is the
time between the acquisition of assets for processing
and their realisation in cash or cash equivalents.
(b) Revenue recognition
Revenue is measured at the fair value of the consideration
received or receivable. Amounts disclosed as revenue
are inclusive of excise duty and net of returns, trade
allowances, rebates, other similar allowances, value added
taxes, service tax, goods & services tax and amounts
collected on behalf of third parties, if any.
The Company recognises revenue when the amount of
revenue can be reliably measured, it is probable that future
economic benefits will flow to the Company and specific
criteria have been met for each of the Company’s activities
as described below.
Recognising revenue from major business activities
(i) Sale of goods
Revenue from the sale of goods is recognised when
the goods are delivered and titles have passed, at
which time all the following conditions are satisfied:
significant risks and rewards of ownership of
the goods;
managerial involvement to the degree usually
associated with ownership nor effective control
over the goods sold; and
Notes to the Standalone Financial Statementsfor the year ended March 31, 2018

P. 114
the transaction can be measured reliably.
(ii) Rendering of services
Revenue from a contract to provide services is
recognised when the outcome of a transaction
involving the rendering of services can be estimated
reliably, by reference to the stage of completion of the
contract. The stage of completion of the contract is
determined as follows:
is recognised by reference to the stage of
completion of the erection & commissioning/
service, determined based on technical estimate
of completion of physical proportion of the
contract work;
by reference to the stage of completion of
operations & maintenance work, determined
as the proportion of the total period of services
contract that has elapsed at the end of the
reporting period
(iii) Construction contracts
When the outcome of a construction contract can
be estimated reliably, revenue is recognised by
reference to the stage of completion of the contract
activity at the end of the reporting period, measured
based on the proportion of contract costs incurred
for work performed to date relative to the estimated
total contract costs, except where this would not be
representative of the stage of completion. Variations
in contract work, claims and incentive payments are
included to the extent that the amount can be measured
reliably and its receipt is considered probable.
When the outcome of a construction contract cannot
be estimated reliably, contract revenue is recognised
to the extent of contract costs incurred that it is
probable will be recoverable. Contract costs are
recognised as expenses in the period in which they
are incurred.
When it is probable that total contract costs will
exceed total contract revenue, the expected loss is
recognised as an expense immediately.
When contract costs incurred to date plus recognised
profits less recognised losses exceed progress
billings, the surplus is shown as amounts due from
customers for contract work. For contracts where
progress billings exceed contract costs incurred
to date plus recognised profits less recognised
losses, the surplus is shown as the amounts due
to customers for contract work. Amounts received
before the related work is performed are included
in the standalone balance sheet, as a liability,
as advances received. Amounts billed for work
performed but not yet paid by the customer are
included in the standalone balance sheet under
trade receivables.
(iv) Revenue from sale of Certified Emission Reductions
(CERs) and Renewable Energy Certificates (RECs)
Income from the sale of CERs and RECs is recognised
on the delivery of the CERs/RECs to the customer’s
account as evidenced by the receipt of confirmation
of execution of delivery instructions.
(v) Rental income
The Company’s policy for recognition of revenue from
operating leases is described in note 1(d) below.
(vi) Dividend income
Dividend income from investments is recognised
when the Company’s right to receive payment has
been established.
(vii) Interest income
Interest income is accrued on a time basis, by
reference to the principal outstanding and at the
effective interest rate applicable, which is the rate
that exactly discounts estimated future cash receipts
through the expected life of the financial asset to that
asset’s net carrying amount on initial recognition.
(c) Government grants
Grants from the government are recognised where there is
a reasonable assurance that the grant will be received and
the Company will comply with all attached conditions.
Government grants relating to income are deferred and
recognised in the profit or loss over the period necessary
to match them with the costs that they are intended to
compensate and presented either within other income or
net of related costs.
Notes to the Standalone Financial Statementsfor the year ended March 31, 2018

P. 115
Annual Report 2017-18
02-17 | Co
rpo
rate Overview
24-101 | Statuto
ry Rep
orts
18-23 | Man
agem
ent Statem
ents
102-266 | Finan
cial Statemen
ts
Government grants relating to the purchase of property,
plant and equipment are included in non-current liabilities
as deferred income and are credited to profit or loss on a
systematic and rational basis over the expected useful lives
of the related assets and presented within other income.
Government grants that are receivable as compensation
for expenses or losses already incurred or for the purpose
of giving immediate financial support to the Company with
no future related costs are recognised in profit or loss in
the period in which they become receivable.
The benefit of a loan at a below market rate of interest or
loan with interest subvention is treated as a government
grant, measured as a difference between proceeds
received and the fair value of the loan based on prevailing
market interest rates.
See note 43 for disclosures and treatment of government
grants in standalone financial statements.
(d) Leases
Leases are classified as finance leases whenever the
terms of the lease transfer substantially all the risks and
rewards of ownership to the lessee. All other leases are
classified as operating leases.
(i) As a lessee
Assets held under finance leases are initially
recognised as assets of the Company at their fair
value at the inception of the lease or, if lower, at
the present value of the minimum lease payments.
The corresponding liability to the lessor is included
in the standalone balance sheet as a finance lease
obligation. Lease payments are apportioned between
finance expenses and reduction of the lease obligation
so as to achieve a constant rate of interest on the
remaining balance of the liability. Finance expenses
are recognised immediately in profit or loss, unless
they are directly attributable to qualifying assets, in
which case they are capitalised in accordance with
the Company’s general policy on borrowing costs
(see note 1(g) below).
Payments made under operating leases (net of any
incentives received from the lessor) are charged to
profit or loss on a straight-line basis over the period
of the lease, unless the payments are structured to
increase in line with expected general inflation to
compensate for the lessor’s expected inflationary
cost increases, in which case lease expenses are
charged to profit or loss on the basis of actual
payments to the lessors.
(ii) As a lessor
Lease income from operating leases where the
Company is a lessor is recognised as income on
a straight-line basis over the lease term, unless
the receipts are structured to increase in line with
expected general inflation to compensate for the
expected inflationary cost increases where such
increases are recognised in the year in which such
benefits accrue. Initial direct costs incurred in
negotiating and arranging an operating lease are
added to the carrying amount of the leased asset and
recognised on a straight-line basis over the lease
term. Respective leased assets are included in the
standalone balance sheet based on their nature.
(e) Foreign currency translation
(i) Functional and presentation currency
The standalone financial statements are presented in
Indian rupee (`), which is Company’s functional and
presentation currency unless stated otherwise.
(ii) Transactions and balances
Foreign currency transactions are translated into
the functional currency using the exchange rates
at the dates of the transactions. Foreign exchange
gains and losses resulting from the settlement
of such transactions and from the translation of
monetary assets and liabilities denominated in
foreign currencies at year end exchange rates are
recognised in profit or loss in the period in which
they arise except for foreign exchange differences
on foreign currency borrowings relating to assets
under construction for future productive use, which
are included in cost of those assets when they are
regarded as an adjustment to interest costs on those
foreign currency borrowings.
Foreign exchange differences regarded as an
adjustment to borrowing costs are presented in
the standalone statement of profit and loss, within
finance costs. All other foreign exchange gains and
losses are presented in the standalone statement of
profit and loss on a net basis within other income.
Notes to the Standalone Financial Statementsfor the year ended March 31, 2018

P. 116
(f) Impairment of non-financial assets
Non-financial assets are tested for impairment whenever
events or changes in circumstances indicate that the
carrying amount may not be recoverable. An impairment
loss is recognised for the amount by which the asset’s
carrying amount exceeds its recoverable amount. The
recoverable amount is the higher of an asset’s fair value
less costs of disposal and value in use. For the purposes
of assessing impairment, assets are grouped at the lowest
levels for which there are separately identifiable cash
inflows which are largely independent of the cash inflows
from other assets or groups of assets (cash-generating
units). Non-financial assets that suffered an impairment
are reviewed for possible reversal of the impairment at
the end of each reporting period. When an impairment loss
subsequently reverses, the carrying amount of the asset
is increased to the revised estimate of its recoverable
amount, so however that the increased carrying amount
does not exceed the carrying amount that would have been
determined had no impairment loss been recognised for
the asset in prior years. A reversal of an impairment loss
is recognised immediately in profit or loss.
(g) Borrowing costs
Borrowing costs directly attributable to the acquisition,
construction or production of a qualifying asset are
capitalised during the period of time that is required to
complete and prepare the asset for its intended use or
sale. Borrowing costs are not capitalised during extended
periods in which active development of qualifying assets is
suspended. Qualifying assets are assets that necessarily
take a substantial period of time to get ready for their
intended use or sale.
Other borrowing costs are expensed in the period in which
they are incurred.
(h) Income tax
Income tax expense represents the sum of the tax currently
payable and deferred tax.
(i) Current tax
The tax currently payable is based on taxable profit
for the year. Taxable profit differs from ‘profit before
tax’ as reported in the standalone statement of profit
and loss because of items of income or expense that
are taxable or deductible in other years and items
that are never taxable or deductible. The Company’s
current tax is calculated using tax rates that have
been enacted or substantively enacted by the end of
the reporting period.
(ii) Deferred tax
Deferred tax is recognised on temporary differences
between the carrying amounts of assets and
liabilities in the standalone financial statements and
the corresponding tax bases used in the computation
of taxable profit. Deferred tax liabilities are generally
recognised for all taxable temporary differences.
Deferred tax assets are generally recognised for all
deductible temporary differences, the carry forward
of unused tax credits and unused tax losses to the
extent that it is probable that taxable profits will be
available against which those deductible temporary
differences, the carry forward of unused tax credits
and unused tax losses can be utilised. Such deferred
tax assets and liabilities are not recognised if
the temporary difference arises from the initial
recognition (other than in a business combination)
of assets and liabilities in a transaction that affects
neither the taxable profit nor the accounting profit.
In addition, deferred tax liabilities are not recognised
if the temporary difference arises from the initial
recognition of goodwill.
The carrying amount of deferred tax assets is
reviewed at the end of each reporting period and
reduced to the extent that it is no longer probable that
sufficient taxable profits will be available to allow all
or part of the asset to be recovered.
Deferred tax liabilities and assets are measured at
the tax rates that are expected to apply in the period
in which the liability is settled or the asset realised,
based on tax rates (and tax laws) that have been
enacted or substantively enacted by the end of the
reporting period.
The measurement of deferred tax liabilities and assets
reflects the tax consequences that would follow from
the manner in which the Company expects, at the
end of the reporting period, to recover or settle the
carrying amount of its assets and liabilities.
(iii) Current and deferred tax for the year
Current and deferred tax are recognised in profit
or loss, except when they relate to items that are
Notes to the Standalone Financial Statementsfor the year ended March 31, 2018

P. 117
Annual Report 2017-18
02-17 | Co
rpo
rate Overview
24-101 | Statuto
ry Rep
orts
18-23 | Man
agem
ent Statem
ents
102-266 | Finan
cial Statemen
ts
recognised in other comprehensive income or directly
in equity, in which case, the current and deferred tax
are also recognised in other comprehensive income
or directly in equity respectively. Where current tax or
deferred tax arises from the initial accounting for a
business combination, the tax effect is included in the
accounting for the business combination.
(i) Property, plant and equipment
Property, plant and equipment are tangible items that are
held for use in the production or supply for goods and
services, rental to others or for administrative purposes
and are expected to be used during more than one period.
The cost of an item of property, plant and equipment is
recognised as an asset if and only if it is probable that
future economic benefits associated with the item will
flow to the Company and the cost of the item can be
measured reliably. Freehold land is carried at cost. All
other items of property, plant and equipment are stated
at cost less accumulated depreciation and accumulated
impairment losses, if any. Cost comprises purchase price
after deducting trade discounts/rebates, including import
duties and non-refundable purchase taxes, borrowing
costs, any costs that is directly attributable to the bringing
the asset to the location and condition necessary for
it to be capable of operating in the manner intended by
management and costs of dismantling/removing the item
and restoring the site on which it was located under an
obligation. Subsequent costs are included in the asset’s
carrying amount or recognised as a separate asset, as
appropriate, only when it is probable that future economic
benefits associated with the item will flow to the Company
and the cost of the item can be measured reliably.
Each part of item of property, plant and equipment, if
significant in relation to the total cost of the item, is
depreciated separately. Further, parts of plant and
equipment that are technically advised to be replaced
at prescribed intervals/period of operation, insurance
spares and cost of inspection/overhauling are depreciated
separately based on their specific useful life provided these
are of significant amounts commensurate with the size
of the Company and scale of its operations. The carrying
amount of any equipment / inspection / overhauling
accounted for as separate asset is derecognised when
replaced. All other repairs and maintenance costs are
charged to profit or loss during the reporting period in
which they are incurred.
An item of property, plant and equipment is derecognised
upon disposal or when no future economic benefits are
expected to arise from the continued use of the asset. Any
gain or loss arising on the disposal or retirement of an
item of property, plant and equipment is determined as the
difference between the sales proceeds and the carrying
amount of the asset and is recognised in profit or loss.
Transition to Ind AS
On transition to Ind AS, the Company has elected to
continue with the carrying value of all of its property, plant
and equipment recognised as at 1 April 2015 (transition
date) measured as per the previous GAAP and use that
carrying value as the deemed cost of the property, plant
and equipment.
Depreciation methods, estimated useful lives and
residual value
Depreciation commences when the assets are available
for their intended use. Depreciation is calculated using
the straight-line method to allocate their cost, net of their
residual values, over their estimated useful lives.
The management has estimated the useful lives and
residual values of all property, plant and equipment and
adopted useful lives as stated in Schedule II along with
residual values of 5% except for the following:
experience:
and control devices installed at sugar plants is
considered at ten years as against prescribed
life of twenty five years in respect of continuous
process plant.
` 5000/- or more are
depreciated over two years.
over three years.
ranging from five to ten years.
` 5000/- are fully depreciated
in the year of purchase.
Notes to the Standalone Financial Statementsfor the year ended March 31, 2018

P. 118
Estimated useful lives considered are as follows:
Assets Estimated useful life
Buildings 3 - 60 years
Roads 3 - 10 years
Plant & equipment 3 - 25 years
Furniture & fixtures 10 years
Vehicles 8 - 10 years
Office equipment 2 - 5 years
Computers 3 - 6 years
Laboratory equipment 10 years
Electrical installations and
equipment
10 years
Fixture and fittings and improvements to leasehold
buildings not owned by the Company are amortised over
the unexpired lease period or estimated useful life of such
fixture, fittings and improvements, whichever is lower.
The estimated useful lives, residual values and depreciation
method are reviewed at the end of each reporting period,
with the effect of any changes in estimate accounted for on
a prospective basis.
The property, plant and equipment acquired under finance
leases is depreciated over the asset’s useful life or over
the shorter of the asset’s useful life and the lease term
if there is no reasonable certainty that the Company will
obtain ownership at the end of the lease term.
(j) Investment property
Property that is held for long-term rental yields or for
capital appreciation or both, is classified as investment
property. Investment property is stated at cost less
accumulated depreciation and accumulated impairment
losses, if any. Investment property is measured initially
at its cost, including related transaction costs and where
applicable borrowing costs. Cost comprises purchase
price after deducting trade discounts/rebates, including
duties and taxes, borrowing costs, any costs that is directly
attributable to the bringing the asset to the location and
condition necessary for it to be capable of operating
in the manner intended by management and costs of
dismantling/removing the item and restoring the site on
which it was located under an obligation. Subsequent
expenditure is capitalised to the asset’s carrying amount
only when it is probable that future economic benefits
associated with the expenditure will flow to the Company
and the cost of the item can be measured reliably.
All other repairs and maintenance costs are expensed
when incurred.
An investment property is derecognised upon disposal or
when the investment property is permanently withdrawn
from use and no future economic benefits are expected
from the disposal. Any gain or loss arising on derecognition
of the property (calculated as the difference between the
net disposal proceeds and the carrying amount of the
asset) is included in profit or loss in the period in which the
property is derecognised.
Investment property being building is depreciated using
the straight-line method over their estimated useful lives
as stated in Schedule II at 30 years along with residual
values of 5%.
Transition to Ind AS
On transition to Ind AS, the Company has elected to
continue with the carrying value of all of its investment
properties recognised as at 1 April 2015 (transition date)
measured as per the previous GAAP and use that carrying
value as the deemed cost of investment properties.
(k) Intangible assets
Intangible assets are carried at cost less accumulated
amortisation and accumulated impairment losses, if
any. Costs comprises purchase price after deducting
trade discounts/rebates, including import duties and
non-refundable purchase taxes, borrowing costs and
any directly attributable cost of preparing the asset for
its intended use. Subsequent costs are included in the
asset’s carrying amount or recognised as a separate
asset, as appropriate, only when it is probable that future
economic benefits associated with the item will flow to
the Company and the cost of the item can be measured
reliably. Amortisation is recognised on a straight-line basis
over their estimated useful lives. The estimated useful life
and amortisation method are reviewed at the end of each
reporting period, with the effect of any changes in estimate
being accounted for on a prospective basis.
Estimated useful lives considered are as follows:
Assets Estimated useful life
Computer software 3 years
Technical know-how 6 years
Notes to the Standalone Financial Statementsfor the year ended March 31, 2018

P. 119
Annual Report 2017-18
02-17 | Co
rpo
rate Overview
24-101 | Statuto
ry Rep
orts
18-23 | Man
agem
ent Statem
ents
102-266 | Finan
cial Statemen
ts
An intangible asset is derecognised on disposal, or when no
future economic benefits are expected from use or disposal.
Gains or losses arising from derecognition of an intangible
asset, measured as the difference between the net disposal
proceeds and the carrying amount of the asset, is recognised
in profit or loss when the asset is derecognised.
Transition to Ind AS
On transition to Ind AS, the Company has elected to
continue with the carrying value of all of intangible assets
recognised as at 1 April 2015 measured as per the previous
GAAP and use that carrying value as the deemed cost of
intangible assets.
(l) Inventories
(i) Finished goods and work-in-progress are valued at
lower of cost and net realisable value. The cost of
finished goods and work-in-progress is computed on
weighted average basis and includes raw material
costs, direct cost of conversion and proportionate
allocation of indirect costs incurred in bringing the
inventories to their present location and condition.
Finished goods and work-in-progress are written
down if their net realisable value declines below the
carrying amount of the inventories and such write
downs to inventories are recognised in profit or loss.
When reasons for such write downs ceases to exist,
such write downs are reversed through profit or loss.
(ii) Inventories of raw materials & components, stores
& spares and stock-in-trade are valued at lower
of cost and net realisable value. Raw materials
and other items held for use in the production of
inventories are not written down below cost if the
finished goods in which they will be incorporated are
expected to be sold at or above cost. Write down of
such inventories are recognised in profit or loss and
when reasons for such write downs ceases to exist,
such write downs are reversed through profit or loss.
Cost of such inventories comprises of purchase price
and other directly attributable costs that have been
incurred in bringing the inventories to their present
location and condition. By-products used as raw
material are valued at transfer price linked with net
realisable value. Cost for the purpose of valuation of
raw materials & components, stores & spares and
stock-in-trade is considered on the following basis :
Raw materials & Components
Business Units Basis
Sugar First in first out
Co-generation &
Distillery
Weighted Average
Water Business Group Specific Cost
Gears Business Group Weighted Average and
Specific Cost
Stores & Spares
Business Units Basis
Water Business Group Specific Cost
Other units Weighted Average
Stock-in-trade
Business Units Basis
Branded goods trading
business
Weighted Average
Diesel/petrol retailing
business
First in first out
(iii) By-products (excluding those used as raw materials)
and scrap are valued at estimated net realisable value.
(iv) Unsold certified emission reductions (CERs) and
renewable energy certificates (RECs) are recognised
as inventory in accordance with the Guidance Note
on Accounting for Self-generated Certified Emission
Reductions, issued by the Institute of Chartered
Accountants of India. Inventory of CERs and RECs is
valued at lower of cost and net realisable value. The
cost incurred on verification/certification of CERs/RECs
is considered as the cost of inventories of CERs/RECs.
(m) Non-current assets held for sale
Non-current assets are classified as held for sale if their
carrying amount will be recovered principally through
a sale transaction rather than through continuing use.
This condition is regarded as met only when the asset
is available for immediate sale in its present condition
subject only to terms that are usual and customary for
sales of such asset and its sale is highly probable. They are
measured at the lower of their carrying amount and fair
value less costs to sell. Non-current assets once classified
as held for sale are neither depreciated nor amortised.
Notes to the Standalone Financial Statementsfor the year ended March 31, 2018

P. 120
(n) Provisions, contingent liabilities and contingent assets
(i) Provisions are recognised when the Company has a
present obligation (legal or constructive) as a result
of a past event, it is probable that the Company will
be required to settle the obligation, and a reliable
estimate can be made of the amount of the obligation.
The amount recognised as a provision is the best
estimate of the consideration required to settle the
present obligation at the end of the reporting period,
taking into account the risks and uncertainties
surrounding the obligation. When the effect of the time
value of money is material, provision is measured at
the present value of cash flows estimated to settle the
present obligation. When some or all of the economic
benefits required to settle a provision are expected
to be recovered from a third party, a receivable is
recognised as an asset if it is virtually certain that
reimbursement will be received and the amount of
the receivable can be measured reliably.
(ii) A contingent liability is not recognised in the
standalone financial statements, however, is
disclosed, unless the possibility of an outflow of
resources embodying economic benefits is remote.
If it becomes probable that an outflow of future
economic benefits will be required for an item dealt
with as a contingent liability, a provision is recognised
in the standalone financial statements of the period
(except in the extremely rare circumstances where
no reliable estimate can be made).
(iii) A contingent asset is not recognised in the standalone
financial statements, however, is disclosed, where
an inflow of economic benefits is probable. When
the realisation of income is virtually certain, then
the asset is no longer a contingent asset, and is
recognised as an asset.
(iv) Provisions, contingent liabilities and contingent
assets are reviewed at each balance sheet date.
(o) Employee benefits
(i) Short-term obligations
Liabilities for wages and salaries, including non-
monetary benefits that are expected to be settled
wholly within twelve months after the end of the
period in which the employees render the related
service are recognised in respect of employees’
services up to the end of the reporting period and are
measured at the undiscounted amounts expected to
be paid when the liabilities are settled. The liabilities
are presented as current benefit obligations in the
standalone balance sheet.
(ii) Other long-term employee benefit obligations
Other long-term employee benefits include earned
leaves and sick leaves. The liabilities for earned leaves
and sick leaves are not expected to be settled wholly
within twelve months after the end of the period in
which the employees render the related service.
They are therefore measured at the present value
of expected future payments to be made in respect
of services provided by employees up to the end of
the reporting period using the projected unit credit
method, with actuarial valuations being carried out at
the end of each annual reporting period. The benefits
are discounted using the market yield on government
bonds at the end of the reporting period that have
maturity term approximating to the estimated term
of the related obligation. Remeasurements as a
result of experience adjustments and changes in
actuarial assumptions are recognised in profit or
loss. The obligations are presented as provisions in
the standalone balance sheet.
(iii) Post-employment obligations
The Company operates the following post-
employment schemes:
gratuity; and
provident fund & employee pension scheme,
employees’ state insurance, superannuation
scheme, national pension scheme and
employees’ provident fund (set-up by the
Company and administered through trust).
Defined benefit plan
The Company provides for gratuity obligations through
a defined benefit retirement plan (the ‘Gratuity Plan’)
covering all employees. The Gratuity Plan provides
a lump sum payment to vested employees at
retirement/termination of employment or death of an
employee, based on the respective employees’ salary
and years of employment with the Company.
Notes to the Standalone Financial Statementsfor the year ended March 31, 2018

P. 121
Annual Report 2017-18
02-17 | Co
rpo
rate Overview
24-101 | Statuto
ry Rep
orts
18-23 | Man
agem
ent Statem
ents
102-266 | Finan
cial Statemen
ts
The liability or asset recognised in the standalone
balance sheet in respect of the defined benefit plan is
the present value of the defined benefit obligation at
the end of the reporting period less the fair value of
plan assets. The present value of the defined benefit
obligation is determined using projected unit credit
method by discounting the estimated future cash
outflows by reference to market yield at the end
of the reporting period on government bonds that
have maturity terms approximating to the estimated
term of the related obligation, with actuarial
valuations being carried out at the end of each annual
reporting period.
The net interest cost is calculated by applying the
discount rate to the net balance of the defined
benefit obligation and the fair value of plan assets.
This cost is included in employee benefit expense
in the standalone statement of profit and loss.
Remeasurement gains and losses arising from
experience adjustments and changes in actuarial
assumptions are recognised in the period in which
they occur, directly in other comprehensive income.
They are included in retained earnings in the
standalone statement of changes in equity and in the
standalone balance sheet.
Defined contribution plans
Defined contribution plans are retirement benefit plans
under which the Company pays fixed contributions to
separate entities (funds) or financial institutions or
state managed benefit schemes. The Company has no
further payment obligations once the contributions
have been paid. The defined contributions plans are
recognised as employee benefit expense when they
are due. Prepaid contributions are recognised as an
asset to the extent that a cash refund or a reduction
in the future payments is available.
Provident Fund Plan & Employee Pension
Scheme
The Company makes monthly contributions at
prescribed rates towards Employees’ Provident
Fund/ Employees’ Pension Scheme to a Fund
administered and managed by the Government
of India.
The Company makes prescribed monthly
contributions towards Employees’ State
Insurance Scheme.
The Company contributes towards a fund
established to provide superannuation benefit
to certain employees in terms of Group
Superannuation Policy entered into by such fund
with the Life Insurance Corporation of India.
The Company makes contributions to the
National Pension Scheme fund in respect of
certain employees of the Company.
administered through trust)
The Company makes contribution towards
provident fund, in substance a defined
contribution plan, which was set-up by the
Company and administered through trust for
the benefit of certain employees. The interest
rate payable by the trust to the beneficiaries
is regulated by statutory authorities which
requires that if the Board of Trustees are unable
to pay interest at the rate declared by the Central
Government under para 60 of the Employees’
Provident Fund Scheme, 1952, for the reason
that the return of investments is less or for any
other reason, then the deficiency shall be made
good by the Company.
(p) Dividends
Provision is made for the amount of any dividend declared,
being appropriately authorised and no longer at the
discretion of the Company, on or before the end of the
reporting period but not distributed by the end of the
reporting period.
(q) Financial assets
(i) Classification
The Company classifies its financial assets in the
following measurement categories:
(either through other comprehensive income, or
through profit or loss), and
The classification depends on the Company’s
business model for managing the financial assets
and the contractual terms of the cash flows.
Notes to the Standalone Financial Statementsfor the year ended March 31, 2018

P. 122
For assets measured at fair value, gains and losses
will either be recorded in profit or loss or other
comprehensive income. For assets in the nature of
debt instruments, this will depend on the business
model. For assets in the nature of equity instruments,
this will depend on whether the Company has
made an irrevocable election at the time of initial
recognition to account for the equity instrument at
fair value through other comprehensive income.
The Company reclassifies debt instruments when
and only when its business model for managing
those assets changes.
(ii) Measurement
At initial recognition, the Company measures a
financial asset at its fair value plus, in the case of a
financial asset not at fair value through profit or loss,
transaction costs that are directly attributable to the
acquisition of the financial asset. Transaction costs of
financial assets carried at fair value through profit or
loss are expensed in profit or loss.
Debt instruments
Subsequent measurement of debt instruments
depends on the Company’s business model for
managing the asset and the cash flow characteristics
of the asset. There are three measurement
categories into which the Company classifies its
debt instruments:
Assets that are held for
collection of contractual cash flows where
those cash flows represent solely payments of
principal and interest are measured at amortised
cost. A gain or loss on a debt investment that
is subsequently measured at amortised cost is
recognised in profit or loss when the asset is
derecognised or impaired. Interest income from
these financial assets is recognised using the
effective interest rate method.
income (FVTOCI): Assets that are held for
collection of contractual cash flows and for
selling the financial assets, where the assets’
cash flows represent solely payments of
principal and interest, are measured at FVTOCI.
Movements in the carrying amount are taken
through OCI, except for the recognition of
impairment gains or losses, interest income and
foreign exchange gains and losses which are
recognised in profit or loss. When the financial
asset is derecognised, the cumulative gain or
loss previously recognised in OCI is reclassified
from equity to profit or loss and recognised in
other gains/(losses). Interest income from these
financial assets is included in other income
using the effective interest rate method.
Assets that do not meet the criteria for
amortised cost or FVTOCI are measured at fair
value through profit or loss. A gain or loss on a
debt investment that is subsequently measured
at fair value through profit or loss is recognised
in profit or loss and presented net in the
standalone statement of profit and loss within
other gains/(losses) in the period in which it
arises. Interest income from these financial
assets is included in other income.
Equity instruments
The Company subsequently measures all equity
investments at fair value, except for equity
investments in subsidiaries and associates where the
Company has the option to either measure it at cost or
fair value. The Company has opted to measure equity
investments in subsidiaries and associates at cost
hence investments in subsidiaries and associates
are carried at cost less impairment, if any. Where
the Company’s management has elected to present
fair value gains and losses on equity investments in
other comprehensive income, there is no subsequent
reclassification of fair value gains and losses to
profit or loss. Dividends from such investments are
recognised in profit or loss as other income when the
Company’s right to receive payments is established.
(iii) Impairment of financial assets
In accordance with Ind AS 109 Financial Instruments,
the Company applies expected credit loss (ECL) model
for measurement and recognition of impairment
loss associated with its financial assets carried at
amortised cost and FVTOCI debt instruments.
Notes to the Standalone Financial Statementsfor the year ended March 31, 2018

P. 123
Annual Report 2017-18
02-17 | Co
rpo
rate Overview
24-101 | Statuto
ry Rep
orts
18-23 | Man
agem
ent Statem
ents
102-266 | Finan
cial Statemen
ts
For trade receivables or any contractual right to
receive cash or another financial asset that result
from transactions that are within the scope of Ind AS
11 Construction Contracts and Ind AS 18 Revenue,
the Company applies simplified approach permitted
by Ind AS 109 Financial Instruments, which requires
expected life time losses to be recognised after
initial recognition of receivables. For recognition of
impairment loss on other financial assets and risk
exposure, the Company determines whether there
has been a significant increase in the credit risk since
initial recognition. If credit risk has not increased
significantly, twelve months ECL is used to provide for
impairment loss. However, if credit risk has increased
significantly, lifetime ECL is used. If, in a subsequent
period, credit quality of the instrument improves such
that there is no longer a significant increase in credit
risk since initial recognition, then the entity reverts
to recognising impairment loss allowance based on
twelve-months ECL.
ECL represents expected credit loss resulting from
all possible defaults and is the difference between all
contractual cash flows that are due to the Company
in accordance with the contract and all the cash flows
that the entity expects to receive, discounted at the
original effective interest rate. While determining
cash flows, cash flows from the sale of collateral held
or other credit enhancements that are integral to the
contractual terms are also considered.
ECL is determined with reference to historically
observed default rates over the expected life of the
trade receivables and is adjusted for forward looking
estimates. Note 41(i) details how the Company
determines expected credit loss.
(iv) Derecognition of financial assets
A financial asset is derecognised only when
receive cash flows from the financial asset; or
cash flows of the financial asset, but assumes
a contractual obligation to pay the cash flows to
one or more recipients.
Where the Company has transferred an asset, it
evaluates whether it has transferred substantially all
risks and rewards of ownership of the financial asset.
In such cases, the financial asset is derecognised.
Where the Company has not transferred substantially
all risks and rewards of ownership of the financial
asset, the financial asset is not derecognised.
Where the Company has neither transferred a
financial asset nor retained substantially all risks
and rewards of ownership of the financial asset, the
financial asset is derecognised if the Company has
not retained control of the financial asset. Where the
Company retains control of the financial asset, the
asset is continued to be recognised to the extent of
continuing involvement in the financial asset.
On derecognition of a financial asset in its entirety,
the difference between the asset’s carrying amount
and the sum of the consideration received and
receivable and the cumulative gain or loss that had
been recognised in other comprehensive income
and accumulated in equity is recognised in profit
or loss if such gain or loss would have otherwise
been recognised in profit or loss on disposal of that
financial asset.
On derecognition of a financial asset other than in its
entirety, the Company allocates the previous carrying
amount of the financial asset between the part it
continues to recognise under continuing involvement,
and the part it no longer recognises on the basis of
the relative fair values of those parts on the date of
the transfer. The difference between the carrying
amount allocated to the part that is no longer
recognised and the sum of the consideration received
for the part no longer recognised and any cumulative
gain or loss allocated to it that had been recognised in
other comprehensive income is recognised in profit
or loss if such gain or loss would have otherwise
been recognised in profit or loss on disposal of that
financial asset. A cumulative gain or loss that had
been recognised in other comprehensive income
is allocated between the part that continues to be
recognised and the part that is no longer recognised
on the basis of the relative fair values of those parts.
(v) Effective interest method
The effective interest method is a method of
calculating the amortised cost of a debt instrument
and of allocating interest income over the relevant
Notes to the Standalone Financial Statementsfor the year ended March 31, 2018

P. 124
period. The effective interest rate is the rate that
exactly discounts estimated future cash receipts
through the expected life of the financial asset to
the gross carrying amount of a financial asset. When
calculating the effective interest rate, the Company
estimates the expected cash flows by considering all
the contractual terms of the financial instrument but
does not consider the expected credit losses. Income
is recognised on an effective interest basis for
debt instruments other than those financial assets
classified as at FVTPL.
(r) Financial liabilities and equity instruments
(i) Classification
Debt and equity instruments issued by the Company
are classified as either financial liabilities or as equity
in accordance with the substance of the contractual
arrangements and the definitions of a financial
liability and an equity instrument.
Equity instruments
An equity instrument is any contract that evidences
a residual interest in the assets of the Company after
deducting all of its liabilities.
Financial liabilities
The Company classifies its financial liabilities in the
following measurement categories:
through profit or loss, and
Financial liabilities are classified as at FVTPL when
the financial liability is held for trading or it is
designated as at FVTPL, other financial liabilities are
measured at amortised cost at the end of subsequent
accounting periods.
(ii) Measurement
Equity instruments
Equity instruments issued by the Company are
recognised at the proceeds received. Transaction
cost of equity transactions shall be accounted for as
a deduction from equity.
Financial liabilities
At initial recognition, the Company measures a
financial liability at its fair value net of, in the case of
a financial liability not at fair value through profit or
loss, transaction costs that are directly attributable to
the issue of the financial liability. Transaction costs of
financial liability carried at fair value through profit or
loss are expensed in profit or loss.
Subsequent measurement of financial liabilities
depends on the classification of financial liabilities.
There are two measurement categories into which
the Company classifies its financial liabilities:
Fair value through profit or loss (FVTPL):
Financial liabilities are classified as at FVTPL
when the financial liability is held for trading or
it is designated as at FVTPL. Financial liabilities
at FVTPL are stated at fair value, with any gains
or losses arising on remeasurement recognised
in profit or loss.
Amortised cost: Financial liabilities that are
not held-for-trading and are not designated as
at FVTPL are measured at amortised cost at
the end of subsequent accounting periods. The
carrying amounts of financial liabilities that
are subsequently measured at amortised cost
are determined based on the effective interest
method. Interest expense that is not capitalised
as part of costs of an asset is included in the
‘Finance costs’ line item.
(iii) Derecognition
Equity instruments
Repurchase of the Company’s own equity instruments
is recognised and deducted directly in equity. No gain
or loss is recognised in profit or loss on the purchase,
sale, issue or cancellation of the Company’s own
equity instruments.
Financial liabilities
The Company derecognises financial liabilities
when, and only when, the Company’s obligations
are discharged, cancelled or have expired. An
exchange with a lender of debt instruments with
substantially different terms is accounted for as an
extinguishment of the original financial liability and
the recognition of a new financial liability. Similarly,
a substantial modification of the terms of an existing
financial liability (whether or not attributable to the
financial difficulty of the debtor) is accounted for as
Notes to the Standalone Financial Statementsfor the year ended March 31, 2018

P. 125
Annual Report 2017-18
02-17 | Co
rpo
rate Overview
24-101 | Statuto
ry Rep
orts
18-23 | Man
agem
ent Statem
ents
102-266 | Finan
cial Statemen
ts
an extinguishment of the original financial liability
and the recognition of a new financial liability. The
difference between the carrying amount of the
financial liability derecognised and the consideration
paid and payable is recognised in profit or loss.
(iv) Effective interest method
The effective interest method is a method of
calculating the amortised cost of a financial liability
and of allocating interest expense over the relevant
period. The effective interest rate is the rate that
exactly discounts estimated future cash payments
through the expected life of the financial liability to
the gross carrying amount of a financial liability.
(v) Foreign exchange gains and losses
For financial liabilities that are denominated in a
foreign currency and are measured at amortised
cost at the end of each reporting period, the foreign
exchange gains and losses are determined based
on the amortised cost of the instruments and
are recognised in ‘Other income’. The fair value
of financial liabilities denominated in a foreign
currency is determined in that foreign currency
and translated at the spot rate at the end of the
reporting period.
(s) Derivatives
Derivatives are initially recognised at fair value on the date
a derivative contract is entered into and are subsequently
re-measured to their fair value at the end of each reporting
period. The resulting gain or loss is recognised in profit or
loss immediately.
(t) Offsetting financial instruments
Financial assets and liabilities are offset and the net
amount is reported in the standalone balance sheet where
there is a legally enforceable right to offset the recognised
amounts and there is an intention to settle on a net basis
or realise the asset and settle the liability simultaneously.
The legally enforceable right must not be contingent on
future events and must be enforceable in the normal
course of business and in the event of default, insolvency
or bankruptcy of the Company or the counterparty.
(u) Fair value of financial instruments
Fair value measurements are categorised into Level 1, 2 or
3 based on the degree to which the inputs to the fair value
measurements are observable and the significance of the
inputs to the fair value measurement in its entirety, which
are described as follows:
Level 1 inputs are quoted prices (unadjusted) in
active markets for identical assets or liabilities that
the Company can access at the measurement date;
Level 2 inputs are inputs, other than quoted prices
included within Level 1, that are observable for the
asset or liability, either directly or indirectly; and
Level 3 inputs are unobservable inputs for the asset
or liability.
(v) Cash flow statement
Cash flows are reported using the indirect method,
whereby profit/loss before tax is adjusted for the effects of
transactions of a non-cash nature, any deferrals or accruals
of past or future operating cash receipts or payments and
item of income or expenses associated with investing of
financing flows. The cash flows from operating, investing
and financing activities of the Company are segregated.
(w) Cash and cash equivalents
Cash and cash equivalents in the standalone balance sheet
comprise of cash on hand, cheques on hand, balance with
banks on current accounts and short term, highly liquid
investments with an original maturity of three months or
less and which carry insignificant risk of change in value.
For the purpose of cash flow statement, cash and cash
equivalents consist of cash and cash equivalents as
defined above.
(x) Earnings per share
Basic earnings per share is calculated by dividing the
profit attributable to owners of the Company by the
weighted average number of equity shares outstanding
during the financial year, adjusted for bonus elements
in equity shares issued during the year and excluding
treasury shares.
Diluted earnings per share adjusts the figures used in
the determination of basic earnings per share to take
into account the after income tax effect of interest and
financing costs associated with dilutive potential equity
shares and the weighted average number of additional
equity shares that would have been outstanding assuming
the conversion of all dilutive potential equity shares.
Notes to the Standalone Financial Statementsfor the year ended March 31, 2018

P. 126
(y) Segment reporting
Operating segments are reported in a manner consistent with
the internal reporting provided to the chief operating decision
maker. Refer note 37 for segment information presented.
NOTE 2: CRITICAL ACCOUNTING JUDGEMENTS AND KEY SOURCES OF ESTIMATION UNCERTAINTYThe preparation of standalone financial statements requires the
use of accounting estimates which, by definition, will seldom
equal the actual results. Management also needs to exercise
judgement in applying the Company’s accounting policies.
This note provides an overview of the areas that involved a
higher degree of judgement or complexity, and of items which
are more likely to be materially adjusted due to estimates
and assumptions turning out to be different than those
originally assessed.
Estimates and judgements are continually evaluated. They are
based on historical experience and other factors, including
expectations of future events that may have a financial impact
on the Company and that are believed to be reasonable under
the circumstances.
(a) Critical accounting judgments
In the process of applying the Company’s accounting
policies, management has made the following judgements,
which has the most significant effect on the amounts
recognised in the standalone financial statements:
(i) Land under finance lease
The office premises and the workshop of water
business group of the Company is constructed upon
land acquired from a third party which was initially
acquired by that third party under a lease term of
ninety years allotted by the Noida Authority. The
said land was acquired by paying a consideration
which reflected the prevalent market price and
upfront payment of all future lease rentals. There
are no further lease rental obligations upon the
Company to be paid to the Authority. There are no
restrictions on usage or transfer of the land to any
party by the Company. In view of aforesaid facts and
circumstances, the Company has classified this land
as a finance lease. Another property at New Delhi
was acquired under a perpetual lease. There are no
restriction on usage and transfer of the property.
Accordingly, this property has also been classified
under finance lease.
(ii) Interest on delayed payment of cane price
The State Government of Uttar Pradesh (“State
Government”) had, based on the financial hardships
of sugar mills arising due to mismatch of cane price
and sugar price, waived interest on delayed payments
of cane price for the seasons 2012-13, 2013-14 and
2014-15 in accordance with the provisions of Section
17(3) of UP Sugar Cane (Regulations of Supply and
Purchase) Act, 1953. In a Public Interest Litigation,
the Hon’ble Allahabad High Court has passed an order
on 9 March 2017 directing the Cane Commissioner
to decide the issue afresh taking into consideration
certain factors. Against the order of High Court, the
State Government had preferred an appeal before
the Supreme Court which has been dismissed. In the
absence of any order passed by the Commissioner
and based on discussions with legal experts and
industry association, it is felt that the interest may not
be imposed by the State Government on sugar mills
in view of acute financial hardships experienced by
the sugar mills during the aforesaid relevant years.
Accordingly, no provision to this effect has been
considered necessary.
(iii) Society commission
In the cane price package offered by the State
Government of Uttar Pradesh (“State Government”) to
sugar mills, the State Government had reduced rate
of commission payable to cane societies for sugar
season 2012-13 and 2014-15 by way of notification
dated 12 June 2015 and for 2015-16 vide notifications
dated 5 February 2016, to provide relief to the Sugar
Industry in view of disparity in the cane price and the
market outlook of the sugar prices. In the writ petitions
filed by certain cane societies against such reduction
in commission rates, the Hon’ble Allahabad High
Court has held that these notifications cannot have
retrospective applicability. The reduction in the rate of
commission payable being part of the relief package
announced by the State Government, the Company
believes that the State Government is not likely to
pass the cost burden upon the sugar industry and
instead, may explore other ways to meet the outcome
of the order of the Court. Accordingly, no provision to
this effect has been considered necessary.
(b) Key sources of estimation uncertainty
The following are the key assumptions concerning
the future, and other key sources of estimation
Notes to the Standalone Financial Statementsfor the year ended March 31, 2018

P. 127
Annual Report 2017-18
02-17 | Co
rpo
rate Overview
24-101 | Statuto
ry Rep
orts
18-23 | Man
agem
ent Statem
ents
102-266 | Finan
cial Statemen
ts
uncertainty at the end of the reporting period that
may have a significant risk of causing a material
adjustment to the carrying amounts of assets and
liabilities within the next financial year.
(i) Fair value measurements and valuation
processes
Some of the Company’s assets and liabilities
are measured at fair value for financial
reporting purposes. When the fair values of
these assets and liabilities cannot be measured
based on quoted prices in active markets,
their fair value is measured using valuation
techniques by engaging third party qualified
external valuers or internal valuation team
to perform the valuation. The inputs to these
models are taken from observable markets
where possible, but where this is not feasible, a
degree of judgement is required in establishing
fair values. Judgements include considerations
of inputs such as liquidity risk, credit risk and
volatility. Changes in assumptions about these
factors could affect the reported fair value of
financial instruments. See note 4, 6, 9 and 42 for
further disclosures.
(ii) Employee benefit plans
The cost of employee benefits under the defined
benefit plan and other long term employee
benefits as well as the present value of the
obligation there against are determined using
actuarial valuations. An actuarial valuation
involves making various assumptions that may
differ from actual developments in the future.
These include the determination of the discount
rate, future salary increases, attrition and
mortality rates. Due to the complexities involved
in the valuation and its long-term nature,
obligation amount is highly sensitive to changes
in these assumptions.
The parameter most subject to change is the
discount rate. In determining the appropriate
discount rate for plans, the management
considers the market yields on government
bonds. Future salary increases are based on
expected future inflation rates and expected
salary trends in the industry. Attrition rates
are considered based on past observable
data of employees leaving the services of
the Company. The mortality rate is based
on publicly available mortality tables. Those
mortality tables tend to change only at interval
in response to demographic changes. See note
38 for further disclosures.
(iii) Impairment of trade receivables
The Company has a stringent policy of
ascertaining impairment, if any, as result of
detailed scrutiny of major cases and through
determining expected credit losses. Despite
best estimates and periodic credit appraisals
of customers, the Company’s receivables are
exposed to delinquency risks due to material
adverse changes in business, financial or
economic conditions that are expected to cause
a significant change to the party’s ability to meet
its obligations. All such parameters relating
to impairment or potential impairment are
reviewed at each reporting date. See note 41(i)
for further disclosures.
(iv) Revenue and cost estimation for construction
contracts
The revenue recognition pertaining to
construction contracts are determined on
proportionate completion method based on
actual construction contract costs incurred
till balance sheet date and total budgeted
construction contract costs. An estimation
of total budgeted construction contract cost
involves making various assumptions that
may differ from the actual developments in the
future. These include delays in execution due
to unforeseen reasons, inflation rate, future
material rates, future labour rates etc. The
estimates/assumptions are made considering
past experience, market/inflation trends and
technological developments etc. All such
estimates/ assumptions are reviewed at each
reporting date.
(v) Provision for warranty claims
The Company, in the usual course of sale
of its products, gives warranties on certain
products and services, undertaking to repair
Notes to the Standalone Financial Statementsfor the year ended March 31, 2018

P. 128
or replace the items that fail to perform
satisfactorily during the specified warranty
period. Provisions made represent the amount
of expected cost of meeting such obligations
of rectifications / replacements based on best
estimate considering the historical warranty
claim information and any recent trends that
may suggest future claims could differ from
historical amounts. The assumptions made in
relation to the current period are consistent
with those in the prior years.
(vi) Provision for litigations and contingencies
The provision for litigations and contingencies
are determined based on evaluation made
by the management of the present obligation
arising from past events the settlement of which
is expected to result in outflow of resources
embodying economic benefits, which involves
judgements around estimating the ultimate
outcome of such past events and measurement
of the obligation amount.
(vii) Useful life and residual value of plant,
property equipment and intangible assets
The useful life and residual value of plant,
property equipment and intangible assets are
determined based on technical evaluation made
by the management of the expected usage of the
asset, the physical wear and tear and technical
or commercial obsolescence of the asset. Due
to the judgements involved in such estimations,
the useful life and residual value are sensitive to
the actual usage in future period.
(viii) Recognition of deferred tax assets for unused
tax credit
Deferred tax assets are recognised for unused
tax credit to the extent that it is probable that
taxable profit would be available against
which the losses could be utilised. Significant
management judgment is required to determine
the amount of deferred tax assets that can be
recognised, based upon the likely timing and
the level of future taxable profits together with
future tax optimisation strategies.
Notes to the Standalone Financial Statementsfor the year ended March 31, 2018

P. 129
Annual Report 2017-18
02-17 | Co
rpo
rate Overview
24-101 | Statuto
ry Rep
orts
18-23 | Man
agem
ent Statem
ents
102-266 | Finan
cial Statemen
ts
Notes to the Standalone Financial Statementsfor the year ended March 31, 2018
(All amounts in ` lakhs, unless otherwise stated)
NO
TE
3:
PR
OP
ER
TY,
PL
AN
T A
ND
EQ
UIP
ME
NT
AN
D C
AP
ITA
L W
OR
K-I
N-P
RO
GR
ES
S
Pro
pe
rty,
pla
nt
an
d e
qu
ipm
en
t C
ap
ita
l w
ork
-
in-p
rog
res
s F
ree
ho
ld
La
nd
Le
as
eh
old
La
nd
Bu
ild
ing
s
& R
oa
ds
Pla
nt
an
d
Eq
uip
me
nt
Fu
rnit
ure
& F
ixtu
res
Ve
hic
les
O
ffice
Eq
uip
me
nt
Co
mp
ute
rs
To
tal
Ye
ar
en
de
d 3
1 M
arc
h 2
01
7
Gro
ss
ca
rry
ing
am
ou
nt
Op
en
ing
gro
ss c
arr
yin
g a
mo
un
t 3
56
7.7
4
76
0.2
4
18
91
9.2
5
67
32
9.1
8
23
9.5
1
59
8.0
9
24
1.9
0
19
2.6
5
91
84
8.5
6
99
0.0
0
Ad
dit
ion
s -
-
3
15
.83
3
70
2.8
9
31
.09
1
85
.37
5
1.0
9
96
.32
4
38
2.5
9
18
85
.71
Dis
po
sa
ls -
-
(
50
.57
) (
12
5.8
3)
(1
.28
) (
16
.14
) (
12
.87
) (
2.9
3)
(2
09
.62
) -
Tra
nsfe
rs *
-
-
-
-
-
-
-
-
-
(2
60
8.0
7)
Oth
er
ad
justm
en
ts -
-
(
46
.11
) 3
8.5
3
0.2
0
-
0.5
3
1.0
6
(5
.79
) -
Clo
sin
g g
ros
s c
arr
yin
g a
mo
un
t 3
56
7.7
4
76
0.2
4
19
13
8.4
0
70
94
4.7
7
26
9.5
2
76
7.3
2
28
0.6
5
28
7.1
0
96
01
5.7
4
26
7.6
4
Acc
um
ula
ted
de
pre
cia
tio
n a
nd
im
pa
irm
en
t
Op
en
ing
acc
um
ula
ted
de
pre
cia
tio
n a
nd
imp
air
me
nt
-
4.6
4
67
1.7
7
48
79
.97
5
0.6
7
93
.55
5
9.4
9
46
.36
5
80
6.4
5
56
.31
De
pre
cia
tio
n c
ha
rge
du
rin
g t
he
ye
ar
-
4.6
4
69
7.8
6
46
97
.50
4
8.4
4
10
2.0
9
41
.30
6
0.5
9
56
52
.42
-
Dis
po
sa
ls -
-
(
1.8
6)
(8
.30
) (
0.5
7)
(2
.31
) (
8.8
8)
(0
.11
) (
22
.03
) -
Oth
er
ad
justm
en
ts -
-
(
4.4
9)
3.4
0
0.2
0
-
(1
.47
) 1
.06
(
1.3
0)
-
Clo
sin
g a
ccu
mu
late
d d
ep
rec
iati
on
an
d
imp
air
me
nt
-
9.2
8
13
63
.28
9
57
2.5
7
98
.74
1
93
.33
9
0.4
4
10
7.9
0
11
43
5.5
4
56
.31
Ne
t ca
rry
ing
am
ou
nt
35
67
.74
7
50
.96
1
77
75
.12
6
13
72
.20
1
70
.78
5
73
.99
1
90
.21
1
79
.20
8
45
80
.20
2
11
.33
Ye
ar
en
de
d 3
1 M
arc
h 2
01
8
Gro
ss
ca
rry
ing
am
ou
nt
Op
en
ing
gro
ss c
arr
yin
g a
mo
un
t 3
56
7.7
4
76
0.2
4
19
13
8.4
0
70
94
4.7
7
26
9.5
2
76
7.3
2
28
0.6
5
28
7.1
0
96
01
5.7
4
26
7.6
4
Ad
dit
ion
s -
-
9
89
.99
2
96
6.5
2
12
.24
2
35
.84
6
0.5
1
16
8.3
5
44
33
.45
2
03
7.2
4
Dis
po
sa
ls -
-
(
21
.37
) (
64
.52
) (
5.5
0)
(2
8.5
4)
(6
.77
) (
5.7
4)
(1
32
.44
) -
Tra
nsfe
rs *
-
-
-
-
-
-
-
-
-
(1
24
3.8
2)
Clo
sin
g g
ros
s c
arr
yin
g a
mo
un
t 3
56
7.7
4
76
0.2
4
20
10
7.0
2
73
84
6.7
7
27
6.2
6
97
4.6
2
33
4.3
9
44
9.7
1
10
03
16
.75
1
06
1.0
6
Acc
um
ula
ted
de
pre
cia
tio
n a
nd
im
pa
irm
en
t
Op
en
ing
acc
um
ula
ted
de
pre
cia
tio
n a
nd
imp
air
me
nt
-
9.2
8
13
63
.28
9
57
2.5
7
98
.74
1
93
.33
9
0.4
4
10
7.9
0
11
43
5.5
4
56
.31
De
pre
cia
tio
n c
ha
rge
du
rin
g t
he
ye
ar
-
4.6
4
71
0.4
7
44
83
.21
4
3.1
5
12
0.0
9
35
.91
8
8.1
8
54
85
.65
-
Dis
po
sa
ls -
-
(
13
.72
) (
35
.21
) (
3.9
8)
(1
2.0
9)
(4
.82
) (
0.6
2)
(7
0.4
4)
-
Clo
sin
g a
ccu
mu
late
d d
ep
rec
iati
on
an
d
imp
air
me
nt
-
13
.92
2
06
0.0
3
14
02
0.5
7
13
7.9
1
30
1.3
3
12
1.5
3
19
5.4
6
16
85
0.7
5
56
.31
Ne
t ca
rry
ing
am
ou
nt
35
67
.74
7
46
.32
1
80
46
.99
5
98
26
.20
1
38
.35
6
73
.29
2
12
.86
2
54
.25
8
34
66
.00
1
00
4.7
5
* R
ep
rese
nts
am
ou
nt
cap
ita
lise
d d
uri
ng
th
e y
ea
r u
nd
er
pro
pe
rty,
pla
nt
an
d e
qu
ipm
en
t o
ut
of
cap
ita
l w
ork
-in
-pro
gre
ss.
No
tes:
(i)
Le
as
eh
old
la
nd
: T
he
ori
gin
al
lea
se
te
rm in
re
sp
ect
of
a p
arc
el
of
lan
d a
cqu
ire
d u
nd
er
fin
an
ce l
ea
se
wa
s n
ine
ty y
ea
rs w
he
rea
s a
no
the
r la
nd
at
De
lhi i
s f
or
a p
erp
etu
al
lea
se
te
rm. T
he
se
le
ase
s
of
lan
ds h
ave
be
en
cla
ssifi
ed
as fi
na
nce
le
ase
in
te
rms o
f cr
ite
ria
sp
eci
fie
d i
n
Ind
AS
17
Le
ase
s, i
ncl
ud
ing
th
e f
act
s t
ha
t th
e m
ark
et
valu
e o
f th
e l
an
d (
as o
n t
he
da
te o
f tr
an
sa
ctio
n)
ha
d b
ee
n
pa
id t
o t
he
le
sso
r a
t th
e in
cep
tio
n o
f th
e l
ea
se
an
d t
he
Co
mp
an
y h
as t
ran
sfe
r ri
gh
ts in
re
sp
ect
of
su
ch l
an
ds.
(ii)
R
es
tric
tio
ns
on
Pro
pe
rty,
pla
nt
an
d e
qu
ipm
en
t: R
efe
r n
ote
16
(i)
& 2
0(i
) fo
r in
form
ati
on
on
ch
arg
es c
rea
ted
on
pro
pe
rty,
pla
nt
an
d e
qu
ipm
en
t. F
urt
he
r, f
ree
ho
ld l
an
d i
ncl
ud
es l
an
d h
avi
ng
ca
rryi
ng
am
ou
nt
of `
13
.13
la
kh
s f
or
wh
ich
tra
nsfe
r o
f ti
tle
s in
th
e n
am
e o
f th
e C
om
pa
ny
is p
en
din
g.
(iii)
C
on
tra
ctu
al
com
mit
me
nts
: R
efe
r n
ote
45
fo
r d
iscl
osu
re o
f co
ntr
act
ua
l co
mm
itm
en
ts f
or
the
acq
uis
itio
n o
f p
rop
ert
y, p
lan
t a
nd
eq
uip
me
nt.
(iv)
C
ap
ita
l w
ork
-in
-pro
gre
ss
: C
ap
ita
l w
ork
-in
-pro
gre
ss m
ain
ly c
om
pri
se
s o
f p
lan
t &
eq
uip
me
nt
(viz
. Mu
lti-
eff
ect
eva
po
rato
r, C
ord
ina
te m
ea
su
rin
g m
ach
ine
etc
.) u
nd
er
the
pro
cess o
f in
sta
lla
tio
n
pe
rta
inin
g t
o D
isti
lle
ry &
Ge
ar
bu
sin
ess o
f th
e C
om
pa
ny.
(v)
Im
pa
irm
en
t lo
ss
: T
he
im
pa
irm
en
t lo
ss i
n C
ap
ita
l w
ork
-in
-pro
gre
ss r
ela
tes t
o e
xpe
nd
itu
re i
ncu
rre
d o
n c
on
str
uct
ion
of
resid
en
tia
l b
uil
din
gs a
t ce
rta
in f
act
ori
es, w
hic
h w
ere
un
de
r p
rog
ress t
ill
fin
an
cia
l ye
ar
20
11
-12
. H
ow
eve
r, t
he
sa
id p
roje
ct w
as s
ub
se
qu
en
tly
dis
con
tin
ue
d a
nd
th
e e
nti
re e
xpe
nd
itu
re i
ncu
rre
d w
as r
eco
gn
ise
d a
s a
n i
mp
air
me
nt
loss i
n t
he
sta
nd
alo
ne
sta
tem
en
t o
f p
rofi
t &
lo
ss c
on
sid
eri
ng
no
po
ssib
le f
utu
re e
con
om
ic b
en
efi
ts fl
ow
ing
fro
m t
he
pro
ject
.

P. 130
NOTE 4: INVESTMENT PROPERTY
Year ended
31-Mar-18
Year ended
31-Mar-17
Gross carrying amount
Opening gross carrying amount 702.23 702.23
Additions/deletions (refer note 13) 118.91 -
Closing gross carrying amount 821.14 702.23
Accumulated depreciation and impairment
Opening accumulated depreciation - -
Depreciation charge/impairment losses - -
Closing accumulated depreciation and impairment - -
Net carrying amount 821.14 702.23
(i) Description about investment properties
Investment properties consist of :
(a) various parcels of freehold land located in the states of Uttar Pradesh and Gujarat.
(b) an office flat owned by the Company having carrying amount of ` 0.12 lakhs, constructed by a Society on a leasehold land
at Mumbai.
(ii) Amount recognised in standalone statement of profit & loss
Year ended
31-Mar-18
Year ended
31-Mar-17
Rental income from office flat at Mumbai 14.16 10.92
Direct operating expenses from property that generated rental income - -
Direct operating expenses from property that did not generate rental income (9.56) (9.79)
Profit from investment properties before depreciation 4.60 1.13
Depreciation - -
Profit from investment properties 4.60 1.13
(iii) Restrictions on realisability and contractual obligations
Though the transfer of titles in the name of the Company is pending in respect of freehold land having carrying amount of
` 381.47 lakhs, the Company has no restrictions on the realisability of any of its investment properties and it is under no contractual
obligations to either purchase, construct or develop investment properties or for repairs, maintenance and enhancements.
(iv) Fair value
As at
31-Mar-18
As at
31-Mar-17
Investment properties
- Land at Digrauli, Distt. Saharanpur (Uttar Pradesh) * *
- Land at Bhopura, District Baghpat (Uttar Pradesh) * *
- Land at Dibai, District Bulandshahar (Uttar Pradesh) * *
- Land at Kharar, District Shamli (Uttar Pradesh) * *
- Land at Dhanot, District Gandhinagar Gujarat * *
- Office flat at Mumbai 503.88 503.88
Notes to the Standalone Financial Statementsfor the year ended March 31, 2018
(All amounts in ` lakhs, unless otherwise stated)

P. 131
Annual Report 2017-18
02-17 | Co
rpo
rate Overview
24-101 | Statuto
ry Rep
orts
18-23 | Man
agem
ent Statem
ents
102-266 | Finan
cial Statemen
ts
* The majority of parcels of land owned by the Company are situated in the sugar belts of Uttar Pradesh. In view of slowdown in real estate and
industrial activities, the circle rates may not be fully reflective of the fair value in the absence of transactions of similar properties (including
size) in the vicinity of the subject properties. The land at Vill. Dhanot Dist. Gandhinagar Gujarat is a small plot of uncultivated land, situated at a
remote location and hence there is a difficulty in carrying out realistic fair value thereof.
Estimation of fair value of office flat at Mumbai
The valuation of the office flat situated at Mumbai has been carried by a registered approved valuer, conversant with and having
knowledge of real estate activities in the concerned area, based on prevalent rates and other observable market inputs (Level
2 fair value).
NOTE 5: INTANGIBLE ASSETS
Computer software
Year ended 31 March 2017
Gross carrying amount
Opening gross carrying amount 224.45
Additions 6.79
Disposals (0.01)
Closing gross carrying amount 231.23
Accumulated amortisation
Opening accumulated amortisation 71.74
Amortisation charge for the year 77.17
Disposals -
Closing accumulated amortisation 148.91
Closing net carrying amount 82.32
Year ended 31 March 2018
Gross carrying amount
Opening gross carrying amount 231.23
Additions 9.56
Disposals (0.60)
Closing gross carrying amount 240.19
Accumulated amortisation
Opening accumulated amortisation 148.91
Amortisation charge for the year 56.00
Disposals (0.56)
Closing accumulated amortisation 204.35
Closing net carrying amount 35.84
Notes to the Standalone Financial Statementsfor the year ended March 31, 2018
(All amounts in ` lakhs, unless otherwise stated)

P. 132
Notes to the Standalone Financial Statementsfor the year ended March 31, 2018
(All amounts in ` lakhs, unless otherwise stated)
NOTE 6: INVESTMENTS
(a) Investments in subsidiaries and associates
As at
31-Mar-18
As at
31-Mar-17At Cost
Quoted Investments (fully paid-up)
Investments in Equity Instruments
- of Associate
7,20,00,000 (31 March 2017: 7,20,00,000) Equity shares of ` 1/- each of Triveni
Turbine Limited 720.07 720.07 Total aggregate quoted investments 720.07 720.07
Unquoted Investments (fully paid-up)
Investments in Equity Instruments
- of Subsidiaries
2,65,00,000 (31 March 2017: 2,05,00,000) Equity shares of ` 1/- each of Triveni
Engineering Ltd. 265.00 205.00
3,85,00,000 (31 March 2017: 2,05,00,000) Equity shares of ` 1/- each of Triveni
Energy Systems Ltd. 385.00 205.00
4,99,950 (31 March 2017: 4,99,950) Equity shares of ` 1/- each of Triveni Sugar
Limited 5.00 5.00
2,15,00,000 (31 March 2017: 2,05,00,000) Equity shares of ` 1/- each of
Svastida Projects Limited 215.00 205.00
41,70,000 (31 March 2017: 28,70,000) Equity shares of ` 10/- each of Triveni
Entertainment Limited 404.02 274.02
50,000 (31 March 2017: 50,000) Equity shares of ` 1/- each of Triveni Industries
Limited 0.50 0.50 - of Associate
13,008 (31 March 2017: 13,008) Equity shares of New Israeli Shekel 0.10 each of
Aqwise-Wise Water Technologies Ltd.(Israel) 3006.19 3006.19 Total aggregate unquoted investments 4280.71 3900.71
Total investments in subsidiaries and associates 5000.78 4620.78
Total investments in subsidiaries and associates 5000.78 4620.78 Aggregate amount of quoted investments 720.07 720.07 Aggregate amount of market value of quoted investment 72360.00 104328.00 Aggregate amount of unquoted investments 4280.71 3900.71 Aggregate amount of impairment in the value of investments - -
Details of the Company’s subsidiaries and associates at the end of the reporting period are as follows:
Name of Subsidiaries / AssociatesPlace of
incorporation and operation
Proportion of ownership interest and voting power held by the Company
As at 31-Mar-18
As at 31-Mar-17
Subsidiaries
Triveni Engineering Limited India 100% 100% Triveni Energy Systems Limited India 100% 100% Svastida Projects Limited India 100% 100% Triveni Entertainment Limited India 100% 100% Triveni Industries Limited India 100% 100% Triveni Sugar Limited India 99.99% 99.99%
Associates
Triveni Turbine Limited India 21.82% 21.82% Aqwise-Wise Water Technologies Ltd. Israel 25.04% 25.04%

P. 133
Annual Report 2017-18
02-17 | Co
rpo
rate Overview
24-101 | Statuto
ry Rep
orts
18-23 | Man
agem
ent Statem
ents
102-266 | Finan
cial Statemen
ts
Notes to the Standalone Financial Statementsfor the year ended March 31, 2018
(All amounts in ` lakhs, unless otherwise stated)
(b) Non-current investments
As at
31-Mar-18
As at
31-Mar-17
At Amortised cost
Unquoted Investments
Investments in Government or trust securities
National Saving Certificates (kept as security) 0.03 0.03
Total non-current investments carried at amortised cost [A] 0.03 0.03
At Fair value through Profit or Loss (FVTPL) (refer note 42)
Quoted Investments (fully paid-up)
Investments in Equity Instruments
13,500 (31 March 2017: 13,500) Equity shares of ` 2/- each of
Housing Development Finance Corporation Ltd 246.46 202.78
2,500 (31 March 2017: 2,500) Equity shares of ` 2/- each of HDFC Bank Ltd. 47.15 36.06
24,175 (31 March 2017: 24,175) Equity shares of ` 2/- each of
Punjab National Bank 23.04 36.24
76 (31 March 2017: 76) Equity shares of ` 10/- each of Central Bank of India 0.05 0.08
3,642 (31 March 2017: 1,821) Equity shares of ` 5/- each (31 March 2017 :
` 10/- each) of NBI Industrial Finance Co. Ltd. 49.74 67.29
Total aggregate quoted investments 366.44 342.45
Unquoted Investments (fully paid-up)
Investments in Bonds
2 (31 March 2017: 2) 11% bonds of ` 10.00 lakhs each of Power Finance
Corporation Ltd. 21.37 21.09
Nil (31 March 2017: 2) 8.95% bonds of ` 10.00 lakhs each of Power Finance
Corporation Ltd. - 20.36
1 (31 March 2017: 1) 9.81% bonds of `10.00 lakhs each of Power Finance
Corporation Ltd. 10.53 10.40
1 (31 March 2017: 1) 10.60% bonds of ` 10.00 lakhs each of Indian Railway
Finance Corporation Ltd. 10.57 10.02
1 (31 March 2017: 1) 8.55% bonds of ` 10.00 lakhs each of Indian Railway
Finance Corporation Ltd. 10.41 9.84
Nil (31 March 2017: 1) 9.80% bonds of ` 10.00 lakhs each of LIC Housing Finance
Ltd. - 10.11
Nil (31 March 2017: 1) 10.10% bonds of ` 10.00 lakhs each of State Bank of India - 8.67
2 (31 March 2017: 2) 8.90% bonds of ` 10.00 lakhs each of UCO Bank 20.16 20.05
1 (31 March 2017: 1) 8.57% bonds of `10.00 lakhs each of Central Bank of India 10.74 9.93
5 (31 March 2017: 5) 8% bonds of ` 1.00 lakh each of IDBI Bank Limited 5.26 5.02
Nil (31 March 2017: 1) 8.95% bonds of ` 10.00 lakhs each of IDFC Bank Limited - 10.15
Nil (31 March 2017: 1) 8.43% bonds of ` 10.00 lakhs each of IDFC Bank Limited - 10.11
Total aggregate unquoted investments 89.04 145.75
Total non-current investments carried at FVTPL [B] 455.48 488.20
Total non-current investments ([A]+[B]) 455.51 488.23
Total non-current investments 455.51 488.23
Aggregate amount of quoted investments 366.44 342.45
Aggregate amount of market value of quoted investment 366.44 342.45
Aggregate amount of unquoted investments 89.07 145.78
Aggregate amount of impairment in the value of investments - -

P. 134
Notes to the Standalone Financial Statementsfor the year ended March 31, 2018
(All amounts in ` lakhs, unless otherwise stated)
NOTE 7: TRADE RECEIVABLES
As at 31-Mar-18 As at 31-Mar-17
Current Non-current Current Non-Current
Trade receivables (at amortised cost)
- Unsecured, considered good 31140.07 50.32 27709.52 81.98
- Doubtful 534.33 1246.48 476.93 2191.76
Less: Allowance for bad and doubtful debts (534.33) (1246.48) (476.93) (2191.76)
Total trade receivables 31140.07 50.32 27709.52 81.98
(i) Refer note 41(i) for credit risk, impairment of trade receivables under expected credit loss model and other related disclosures.
(ii) Current trade receivable include ̀ 3906.99 lakhs (31 March 2017 : ̀ 2049.41 lakhs) expected to be received after twelve months
within the operating cycle.
NOTE 8: LOANS
As at 31-Mar-18 As at 31-Mar-17
Current Non-current Current Non-Current
At amortised cost
Loan to employees
- Unsecured, considered good 53.26 2.98 38.16 7.12
Loan to others
- Unsecured, considered good 0.29 - 0.53 -
- Doubtful - 44.53 - 44.53
Less: Allowance for bad and doubtful loans - (44.53) - (44.53)
0.29 - 0.53 -
Total loans 53.55 2.98 38.69 7.12
NOTE 9: OTHER FINANCIAL ASSETS
As at 31-Mar-18 As at 31-Mar-17
Current Non-current Current Non-Current
At amortised cost
Advance to related parties (refer note 39 and
note 48)
- Doubtful - - - 13.76
Less: Allowance for bad and doubtful debts - - - (13.76)
- - - -
Security deposits 41.74 455.28 43.08 401.71
Earnest money deposits 162.47 2.00 150.05 2.00
Less: Allowance for bad and doubtful debts (1.15) - - -
161.32 2.00 150.05 2.00
Bank balances:
Earmarked balances with banks:
- Deposit against molasses storage fund (refer
note 15(vi))
- 233.72 - 235.63
Balances under lien/margin/kept as security:
- Post office savings account - 0.19 - 0.27

P. 135
Annual Report 2017-18
02-17 | Co
rpo
rate Overview
24-101 | Statuto
ry Rep
orts
18-23 | Man
agem
ent Statem
ents
102-266 | Finan
cial Statemen
ts
Notes to the Standalone Financial Statementsfor the year ended March 31, 2018
(All amounts in ` lakhs, unless otherwise stated)
As at 31-Mar-18 As at 31-Mar-17
Current Non-current Current Non-Current
- Fixed / margin deposits (original maturity more
than one year)
- 36.66 - 211.84
Other balances:
- Fixed deposits (original maturity more than
one year)
- 4.20 - 4.20
- 274.77 - 451.94
Interest accrued 32.26 1.20 32.46 69.19
Insurance claim recoverable 86.00 - 62.96 -
Amount recoverable against sale of fixed assets - - 588.19 -
Miscellaneous other financial assets 11.17 14.90 31.85 17.94
Less: Allowance for bad and doubtful debts - (14.90) - (17.94)
11.17 - 31.85 -
Total other financial assets at
amortised cost [A]
332.49 733.25 908.59 924.84
At fair value through Profit or Loss
(refer note 42)
Derivatives financial instruments carried
at fair value
- Foreign-exchange forward contracts/
Currency swaps/Interest rate swaps
91.82 - - -
Total other financial assets at FVTPL [B] 91.82 - - -
Total other financial assets ([A]+[B]) 424.31 733.25 908.59 924.84
NOTE 10: OTHER ASSETS
As at 31-Mar-18 As at 31-Mar-17
Current Non-current Current Non-Current
Capital advances - 30.56 - 6.63
Advances to suppliers 622.24 19.89 470.10 19.89
Less: Allowance for bad and doubtful debts (26.89) (19.89) (1.56) (19.89)
595.35 - 468.54 -
Advances to related parties (refer note 39) 2.13 - 34.72 -
Indirect tax and duties recoverable 1433.44 357.60 5549.25 443.96
Less: Allowance for bad and doubtful debts (40.32) (21.38) (21.78) (28.02)
1393.12 336.22 5527.47 415.94
Deposit with sales tax authorities 130.35 43.55 77.62 46.66
Less: Allowance for bad and doubtful debts - (37.00) - (37.00)
130.35 6.55 77.62 9.66
Bank guarantee encashments recoverable - 200.00 - 200.00
Less: Allowance for bad and doubtful debts - (200.00) - (200.00)
- - - -
Export incentives receivable 43.12 - 23.67 -
Less: Allowance for bad and doubtful debts (15.26) - - -
27.86 - 23.67 -

P. 136
Notes to the Standalone Financial Statementsfor the year ended March 31, 2018
(All amounts in ` lakhs, unless otherwise stated)
As at 31-Mar-18 As at 31-Mar-17
Current Non-current Current Non-Current
Advances to employees 16.05 1.45 15.90 1.45
Prepaid expenses 549.16 98.81 373.70 96.74
Due from customers under construction
contracts [refer (i) below]
5702.70 - 6225.28 -
Unbilled revenue 191.96 - 198.58 -
Miscellaneous other assets 36.40 131.61 34.58 173.37
Less: Allowance for bad and doubtful debts - (28.72) - (60.26)
36.40 102.89 34.58 113.11
Total other assets 8645.08 576.48 12980.06 643.53
(i) Construction contracts
As at
31-Mar-18
As at
31-Mar-17
Contracts in Progress at the end of reporting period
Construction costs incurred plus profits recognised less losses recognised 76329.94 84306.15
Less: Progress Billings (71661.59) (78635.38)
4668.35 5670.77
Recognised and included in standalone financial statements as amounts due:
(i) Amounts due from customers under construction contracts 5702.70 6225.28
(ii) Amounts due to customers under construction contracts (1034.35) (554.51)
4668.35 5670.77
Retentions held by customers 5650.93 6666.80
Advances received from customers 2605.01 2471.85
NOTE 11: INVENTORIES
As at
31-Mar-18
As at
31-Mar-17
Raw materials and components 2698.80 3065.44
Less: Provision for obsolescence/slow moving raw materials and components (199.22) (182.78)
Work-in-progress 3157.30 2669.25
Finished goods 148847.59 158669.55
Stock in trade 31.47 18.06
Stores and spares [including stock in transit ` 14.09 lakhs as at 31 March 2018
(31 March 2017: `0.09 lakhs)]
3507.80 3202.71
Less: Provision for obsolescence/slow moving stores and spares (185.13) (124.33)
Certified emission reductions/renewable energy certificates (refer note 49) 0.77 3.16
Others - Scrap & low value patterns 59.26 160.62
Total inventories 157918.64 167481.68
(i) The cost of inventories recognised as an expense during the year was `279641.05 lakhs (31 March 2017: ` 231279.71 lakhs)
(ii) Refer note 20(i) for information on charges created on inventories.
(iii) The mode of valuation of inventories has been stated in note 1(l).

P. 137
Annual Report 2017-18
02-17 | Co
rpo
rate Overview
24-101 | Statuto
ry Rep
orts
18-23 | Man
agem
ent Statem
ents
102-266 | Finan
cial Statemen
ts
Notes to the Standalone Financial Statementsfor the year ended March 31, 2018
(All amounts in ` lakhs, unless otherwise stated)
(iv) All inventories are expected to be utilised/sold within twelve months except certain items of stores and spares, which are
utilised on need basis. Quantum of such stores and spares, which may be utilised beyond one year, is not determinable and is
not expected to be material with reference to the total value of inventories.
(v) For impairment losses recognised during the year refer note 33.
(vi) In addition to the cost of inventories recognised as expense as mentioned in note 11(i) above, there are write-downs of inventories
to net realisable value amounted to `21970.87 lakhs (31 March 2017: ` Nil) which are also recognised as an expense during the
year and included in ‘Changes in inventories of finished goods, stock-in-trade and work-in-progress’ in standalone statement of
profit and loss.
NOTE 12: CASH AND BANK BALANCES
(a) Cash and cash equivalents
As at
31-Mar-18
As at
31-Mar-17
At amortised cost
Balances with banks 310.81 602.20
Cheques / drafts on hand 3.58 19.99
Cash on hand 24.31 29.26
Total cash and cash equivalents 338.70 651.45
(b) Bank balances other than cash and cash equivalents
As at
31-Mar-18
As at
31-Mar-17
At amortised cost
Earmarked balances with banks:
- unpaid dividend and preference share redemption accounts 3.49 5.00
Balances under lien/margin/kept as security:
- in fixed/margin deposits (original maturity upto one year) 265.35 25.89
Other balances:
- in fixed deposits (original maturity exceeding three months but upto one year) 4.18 7.37
Total bank balances other than cash and cash equivalents 273.02 38.26
NOTE 13: ASSETS CLASSIFIED AS HELD FOR SALE
As at
31-Mar-18
As at
31-Mar-17
Freehold land - 118.91
Total assets classified as held for sale - 118.91
The above represents portion of the land in the state of Uttar Pradesh which was intended to be disposed of by the Company.
However, sale of such land, which was to be transferred to a subsidiary company under an agreement to sell, could not be effected
on account of certain technical reasons and hence are classified as Investment Property in current year since it is now held for such
purposes (refer note 4). The asset does not form part of any segment assets.

P. 138
Notes to the Standalone Financial Statementsfor the year ended March 31, 2018
(All amounts in ` lakhs, unless otherwise stated)
NOTE 14: SHARE CAPITAL
As at 31-Mar-18 As at 31-Mar-17
Number of shares Amount Number of shares Amount
AUTHORISED
Equity shares of ` 1 each 50,00,00,000 5000.00 50,00,00,000 5000.00
Preference shares of ` 10 each 2,00,00,000 2000.00 2,00,00,000 2000.00
7000.00 7000.00
ISSUED
Equity shares of ` 1 each 25,79,53,110 2579.53 25,79,53,110 2579.53
25,79,53,110 2579.53 25,79,53,110 2579.53
SUBSCRIBED AND PAID UP
Equity shares of ` 1 each 25,79,45,110 2579.45 25,79,45,110 2579.45
Add: Paid up value of equity shares of ` 1 each
forfeited
8,000 0.02 8,000 0.02
25,79,53,110 2579.47 25,79,53,110 2579.47
(i) Movements in equity share capital
Number of shares Amount
As at 31 March 2016 25,79,45,110 2579.45
Movement during the year - -
As at 31 March 2017 25,79,45,110 2579.45
Movement during the year - -
As at 31 March 2018 25,79,45,110 2579.45
(ii) Terms and rights attached to equity shares
The Company has only one class of equity shares with a par value of ` 1/- per share. The holder of equity shares is entitled to
one vote per share. The Company declares and pays dividends in Indian rupees. The dividend proposed by the Board of Directors
is subject to the approval of the shareholders in the ensuing Annual General Meeting.
In the event of liquidation of the Company, the holders of equity shares are entitled to receive the remaining assets of the
Company, after meeting all liabilities and distribution of all preferential amounts, in proportion to their shareholding.
(iii) Details of shareholders holding more than 5% shares in the Company
As at 31-Mar-18 As at 31-Mar-17
Number of shares % holding Number of shares % holding
Dhruv M. Sawhney 3,83,91,756 14.88 3,83,91,756 14.88
Rati Sawhney 2,03,58,164 7.89 2,03,58,164 7.89
Subhadra Trade & Finance Limited - - 8,26,96,056 32.06
STFL Trading and Finance Private Limited 8,26,96,056 32.06 - -
Nikhil Sawhney 1,52,77,653 5.92 1,52,77,653 5.92
Tarun Sawhney 1,46,95,375 5.70 1,46,95,375 5.70

P. 139
Annual Report 2017-18
02-17 | Co
rpo
rate Overview
24-101 | Statuto
ry Rep
orts
18-23 | Man
agem
ent Statem
ents
102-266 | Finan
cial Statemen
ts
Notes to the Standalone Financial Statementsfor the year ended March 31, 2018
(All amounts in ` lakhs, unless otherwise stated)
NOTE 15: OTHER EQUITY
As at
31-Mar-18
As at
31-Mar-17
Capital redemption reserve 397.40 397.40
Capital reserve 2855.85 2855.85
Securities premium 26546.93 26546.93
Amalgamation reserve 926.34 926.34
General reserve 49212.72 49212.72
Molasses storage fund reserve 196.28 202.42
Retained earnings 5371.58 (4954.46)
Total other equity 85507.10 75187.20
(i) Capital redemption reserve
Year ended
31-Mar-18
Year ended
31-Mar-17
Opening balance 397.40 397.40
Movement during the year - -
Closing balance 397.40 397.40
Capital redemption reserve was created consequent to redemption of preference share capital, as required under the provisions
of the Companies Act, 1956. This reserve shall be utilised in accordance with the provisions of Companies Act, 2013.
(ii) Capital reserve
Year ended
31-Mar-18
Year ended
31-Mar-17
Opening balance 2855.85 2855.85
Movement during the year - -
Closing balance 2855.85 2855.85
Capital reserve majorly comprise of reserve created consequent to business combination in earlier years, in accordance with
applicable accounting standard as on that date.
(iii) Securities premium
Year ended
31-Mar-18
Year ended
31-Mar-17
Opening balance 26546.93 26546.93
Movement during the year - -
Closing balance 26546.93 26546.93
Securities premium is used to record the premium on issue of shares. The reserve is utilised in accordance with the provisions
of the Companies Act, 2013.
(iv) Amalgamation reserve
Year ended
31-Mar-18
Year ended
31-Mar-17
Opening balance 926.34 926.34
Movement during the year - -
Closing balance 926.34 926.34
Amalgamation reserve was created consequent to business combinations in past in accordance with applicable accounting
standard as on that date.

P. 140
Notes to the Standalone Financial Statementsfor the year ended March 31, 2018
(All amounts in ` lakhs, unless otherwise stated)
(v) General reserve
Year ended
31-Mar-18
Year ended
31-Mar-17
Opening balance 49212.72 49212.72
Movement during the year - -
Closing balance 49212.72 49212.72
The general reserve represents amount kept by the Company out of its profits for future purposes. It is not earmarked for any
specific purpose.
(vi) Molasses storage fund reserve
Year ended
31-Mar-18
Year ended
31-Mar-17
Opening balance 202.42 182.39
Amount transferred from surplus/ (deficit) in the statement of profit and loss 32.96 20.03
Amount transferred to surplus/ (deficit) in the statement of profit and loss (39.10) -
Closing balance 196.28 202.42
Molasses storage fund reserve is created and maintained under the provisions of the Uttar Pradesh Sheera Niyantran
Adhiniyam, 1964 (U.P. Act No. XXIV of 1964) and is to be utilised for the provision and maintenance of adequate storage facilities
for molasses. Fixed deposit of ` 233.72 lakhs (31 March 2017: ` 235.63 lakhs) is earmarked against molasses storage fund
(refer note 9).
(vii) Retained earnings
Year ended
31-Mar-18
Year ended
31-Mar-17
Opening balance (4954.46) (27842.06)
Net profit for the year 10974.38 23356.25
Other comprehensive income arising from the remeasurement of defined benefit
obligation net of income tax 121.72 (448.62)
Withdrawn from molasses storage fund reserve 39.10 -
Transfer to molasses storage fund reserve (32.96) (20.03)
Dividends paid (644.91) -
Dividend distribution tax (131.29) -
Closing balance 5371.58 (4954.46)
(a) Retained earnings represents undistributed profits of the Company which can be distributed to its equity shareholders in
accordance with the requirement of the Companies Act, 2013.
(b) As required under Schedule III (Division II), the Company has recognised remeasurement defined benefit plans (net of tax)
as part of retained earnings.
(c) Details of dividend distributions made:
Year ended
31-Mar-18
Year ended
31-Mar-17
Cash dividends on equity shares declared and paid:
First interim dividend for the year ended 31 March 2018: 25%
(` 0.25 per equity share of ` 1/- each) [31 March 2017: ` Nil] 644.91 -
Dividend distribution tax on first interim dividend 131.29 -
Total cash dividends on equity shares declared and paid 776.20 -

P. 141
Annual Report 2017-18
02-17 | Co
rpo
rate Overview
24-101 | Statuto
ry Rep
orts
18-23 | Man
agem
ent Statem
ents
102-266 | Finan
cial Statemen
ts
Notes to the Standalone Financial Statementsfor the year ended March 31, 2018
(All amounts in ` lakhs, unless otherwise stated)
NOTE 16: NON-CURRENT BORROWINGS
As at 31-Mar-18 As at 31-Mar-17
Current maturities Non-current Current maturities Non- current
Secured- at amortised cost
Term loans
- from banks 12607.56 3483.54 20170.53 27320.31
- from other parties 224.03 11.74 196.53 215.92
12831.59 3495.28 20367.06 27536.23
Less: Amount disclosed under the head "Other
financial liabilities- current" (refer note 17)
(12831.59) - (20367.06) -
Total non-current borrowings - 3495.28 - 27536.23

P. 142
Notes to the Standalone Financial Statementsfor the year ended March 31, 2018
(All amounts in ` lakhs, unless otherwise stated)
NO
TE
16
: N
ON
-CU
RR
EN
T B
OR
RO
WIN
GS
(C
ON
TD
.)
(i)
De
tail
s o
f lo
ng
te
rm b
orr
ow
ing
s o
f th
e C
om
pa
ny
Am
ou
nt
ou
tsta
nd
ing
as
at
Eff
ec
tiv
e
inte
res
t ra
te
Co
up
on
ra
teN
um
be
r o
f in
sta
lme
nts
Te
rms
of
Re
pa
ym
en
t
Na
ture
of
Se
cu
rity
31
-Ma
r-1
83
1-M
ar-
17
31
-Ma
r-1
83
1-M
ar-
17
Se
cu
red
- a
t a
mo
rtis
ed
co
st
Te
rm l
oa
ns
fro
m b
an
ks
(`
lo
an
s)
1
Ca
na
ra B
an
k -
3
27
3.8
4
Th
e e
ffe
ctiv
e
inte
rest
rate
as
on
31
.03
.20
18
ran
ge
be
twe
en
10
.25
% t
o 1
2%
pe
r a
nn
um
.
At
ba
se
ra
tes/
MC
LR
plu
s
ap
pli
cab
le s
pre
ad
.
Th
e in
tere
st
rate
as o
n 3
1.0
3.2
01
8
ran
ge
be
twe
en
8.5
0%
to
9.3
0%
pe
r a
nn
um
.
Nil
7
-S
ecu
red
by
firs
t p
ari
-
pa
ssu
ch
arg
e c
rea
ted
/ t
o
be
cre
ate
d b
y e
qu
ita
ble
mo
rtg
ag
e o
n im
mo
vea
ble
asse
ts a
nd
hyp
oth
eca
tio
n
of
all
mo
vea
ble
asse
ts, b
oth
pre
se
nt
an
d f
utu
re o
f th
e
Co
mp
an
y su
bje
ct t
o b
an
ke
rs
pri
or
cha
rge
s c
rea
ted
/ t
o b
e
cre
ate
d o
n c
urr
en
t a
sse
ts
for
pro
vid
ing
wo
rkin
g c
ap
ita
l
faci
liti
es a
nd
exc
lud
ing
asse
ts p
urc
ha
se
d u
nd
er
veh
icle
lo
an
sch
em
e.
2
Axi
s B
an
k
-
83
2.7
2
Nil
2-
3
Yes B
an
k 4
68
.57
2
34
1.1
2
15
Eq
ua
l q
ua
rte
rly
insta
llm
en
ts u
pto
Jun
e 2
01
8.
4
Ra
tna
ka
r B
an
k L
imit
ed
89
9.2
3
20
96
.53
3
7Q
ua
rte
rly
insta
llm
en
ts
up
to D
ece
mb
er
20
18
.
5
Ra
tna
ka
r B
an
k L
imit
ed
26
28
.08
9
93
4.0
7
59
Eq
ua
l q
ua
rte
rly
insta
llm
en
ts u
pto
Jun
e 2
01
9.
6
Ce
ntr
al
Ba
nk
of
Ind
ia 2
76
9.9
5
44
39
.32
2
03
2E
qu
ate
d m
on
thly
insta
llm
en
ts u
pto
De
cem
be
r 2
01
9.
Se
cure
d b
y fi
rst
pa
ri-p
assu
cha
rge
on
cu
rre
nt
asse
ts,
thir
d c
ha
rge
on
fixe
d a
sse
ts
of
Kh
ata
uli
an
d R
am
ko
la
un
its a
nd
se
con
d c
ha
rge
on
fixe
d a
sse
ts o
f o
the
r u
nit
s o
f
the
Co
mp
an
y.
7
Ori
en
tal
Ba
nk
of
Co
mm
erc
e -
2
14
2.1
5
Nil
31
-S
ecu
red
by
thir
d c
ha
rge
on
fixe
d a
sse
ts o
f K
ha
tau
li a
nd
Ra
mko
la u
nit
s a
nd
se
con
d
cha
rge
on
fixe
d a
sse
ts o
f
oth
er
un
its o
f th
e C
om
pa
ny.
8
Axi
s B
an
k 9
89
.21
1
81
6.9
0
59
Eq
ua
l q
ua
rte
rly
insta
llm
en
ts u
pto
Ma
y 2
01
9.
Se
cure
d b
y se
con
d p
ari
-
pa
ssu
ch
arg
e o
n c
urr
en
t
asse
ts, t
hir
d c
ha
rge
o
n
fixe
d a
sse
ts o
f K
ha
tau
li a
nd
Ra
mko
la u
nit
s a
nd
se
con
d
cha
rge
on
fixe
d a
sse
ts o
f
oth
er
un
its o
f th
e C
om
pa
ny.
9
Ce
ntr
al
Ba
nk
of
Ind
ia 8
73
.75
1
37
2.6
3
71
1E
qu
al
qu
art
erl
y
insta
llm
en
ts u
pto
De
cem
be
r 2
01
9.
Se
cure
d b
y fi
rst
pa
ri-p
assu
cha
rge
on
th
e fi
xed
asse
ts o
f
the
Co
mp
an
y1
0
Ori
en
tal
Ba
nk
of
Co
mm
erc
e -
9
24
.68
N
il6
-

P. 143
Annual Report 2017-18
02-17 | Co
rpo
rate Overview
24-101 | Statuto
ry Rep
orts
18-23 | Man
agem
ent Statem
ents
102-266 | Finan
cial Statemen
ts
Notes to the Standalone Financial Statementsfor the year ended March 31, 2018
(All amounts in ` lakhs, unless otherwise stated)
Am
ou
nt
ou
tsta
nd
ing
as
at
Eff
ec
tiv
e
inte
res
t ra
te
Co
up
on
ra
teN
um
be
r o
f in
sta
lme
nts
Te
rms
of
Re
pa
ym
en
t
Na
ture
of
Se
cu
rity
31
-Ma
r-1
83
1-M
ar-
17
31
-Ma
r-1
83
1-M
ar-
17
11
P
un
jab
Na
tio
na
l B
an
k (
So
ft
Lo
an
)
-
44
90
.46
A
t b
ase
ra
tes/
MC
LR
plu
s
ap
pli
cab
le s
pre
ad
.
Th
e in
tere
st
rate
as o
n 3
1.0
3.2
01
7
ran
ge
be
twe
en
11
.40
% t
o 1
2.2
5%
pe
r a
nn
um
. [se
e
no
te 4
3(i
)(A
)]
Nil
12
-
Se
cure
d b
y se
con
d c
ha
rge
on
all
fixe
d a
sse
ts o
f th
e
com
pa
ny
exc
ep
t R
am
ko
la
un
it (
wh
ere
SD
F h
old
s
se
con
d e
xclu
siv
e c
ha
rge
)
an
d t
hir
d c
ha
rge
on
fixe
d
asse
ts o
f R
am
ko
la u
nit
.
12
C
en
tra
l B
an
k o
f In
dia
(S
oft
Lo
an
) -
3
89
6.9
5
Nil
12
-
13
O
rie
nta
l B
an
k o
f C
om
me
rce
(So
ft L
oa
n)
-
66
7.8
0
Nil
12
-
14
C
an
ara
Ba
nk
(S
oft
Lo
an
) -
1
86
1.1
6
Nil
12
-
15
P
un
jab
Na
tio
na
l B
an
k (
Exc
ise
Du
ty L
oa
n)
25
56
.08
5
04
3.5
0
Inte
rest
fre
e l
oa
n
[se
e n
ote
43
(i)(
A)]
11
23
Eq
ua
ted
mo
nth
ly
insta
llm
en
ts u
pto
Fe
bru
ary
20
19
.
Se
cure
d b
y se
con
d c
ha
rge
on
fixe
d a
sse
ts o
f a
ll
bu
sin
ess u
nit
s e
xce
pt
Kh
ata
uli
an
d R
am
ko
la u
nit
s.
16
C
en
tra
l B
an
k o
f In
dia
(E
xcis
e
Du
ty L
oa
n)
11
61
.59
2
19
3.6
0
48
Eq
ua
l q
ua
rte
rly
insta
llm
en
ts u
pto
Ma
rch
20
19
.
Se
cure
d b
y se
con
d c
ha
rge
on
fixe
d a
sse
ts o
f a
ll
bu
sin
ess u
nit
s e
xce
pt
Kh
ata
uli
an
d R
am
ko
la u
nit
s.
17
A
xis B
an
k (
Ve
hic
le l
oa
n)
13
8.5
9
11
5.7
3
Ra
ng
ing
fro
m 7
.99
% t
o
10
.75
% p
.a.
At
fixe
d
rate
s r
an
gin
g
fro
m 7
.99
% t
o
10
.75
% p
.a.
4 t
o 6
2
mo
nth
s
4 t
o 7
4
mo
nth
s
Eq
ua
ted
mo
nth
ly
insta
llm
en
ts
Se
cure
d b
y h
ypo
the
cati
on
of
veh
icle
s a
cqu
ire
d u
nd
er
the
resp
ect
ive
ve
hic
le l
oa
ns.
18
IC
ICI B
an
k (
Ve
hic
le l
oa
n)
2.8
8
14
.04
19
P
NB
Ba
nk
(V
eh
icle
lo
an
) 2
8.9
3
33
.64
20
Ye
s B
an
k (
Ve
hic
le l
oa
n)
48
.69
-
12
56
5.5
5
47
49
0.8
4
Te
rm l
oa
ns
fro
m b
an
ks
(U
S$
lo
an
s)
1
Ra
tna
ka
r B
an
k L
imit
ed
(F
CT
L )
35
25
.55
-
8
.50
% p
.a.
At
US
D 6
M L
ibo
r
+1
.95
% p
.a.
6N
ilE
qu
al
qu
art
erl
y
insta
llm
en
t u
pto
July
20
19
.
Se
cure
d b
y fi
rst
pa
ri-
pa
ssu
ch
arg
e c
rea
ted
/ t
o
be
cre
ate
d b
y e
qu
ita
ble
mo
rtg
ag
e o
n im
mo
vea
ble
asse
ts a
nd
hyp
oth
eca
tio
n
of
all
mo
vea
ble
asse
ts, b
oth
pre
se
nt
an
d f
utu
re o
f th
e
Co
mp
an
y su
bje
ct t
o b
an
ke
rs
pri
or
cha
rge
s c
rea
ted
/ t
o b
e
cre
ate
d o
n c
urr
en
t a
sse
ts
for
pro
vid
ing
wo
rkin
g c
ap
ita
l
faci
liti
es a
nd
exc
lud
ing
asse
ts p
urc
ha
se
d u
nd
er
veh
icle
lo
an
sch
em
e.
35
25
.55
-
To
tal
term
lo
an
s f
rom
ba
nk
s 1
60
91
.10
4
74
90
.84
Term
lo
an
s f
rom
oth
er
pa
rtie
s
(` l
oa
ns)
1
Da
imle
r F
ina
nci
al
Se
rvic
es P
vt.
Ltd
. (V
eh
icle
lo
an
)
19
.88
-
6
.86
% p
.a.
At
fixe
d r
ate
of
6.8
6%
p.a
.
28
Nil
Eq
ua
ted
mo
nth
ly
insta
llm
en
ts
Se
cure
d b
y h
ypo
the
cati
on
of
veh
icle
s a
cqu
ire
d u
nd
er
the
resp
ect
ive
ve
hic
le l
oa
ns.
2
Oth
er
Lo
an
s -
Su
ga
r
De
velo
pm
en
t F
un
d,
Go
vt. o
f In
dia
21
5.8
9
41
2.4
5
12
.5%
p.a
.2
% b
elo
w t
he
Ba
nk
Ra
te a
t
pre
se
nt
4%
[se
e
no
te 4
3(i
)(A
)]
Yea
rly
- 1
Ha
lf y
ea
rly
- N
il
Yea
rly
- 2
Ha
lf y
ea
rly
- N
il
Yea
rly
an
d h
alf
ye
arl
y
insta
llm
en
ts u
pto
Se
pte
mb
er
20
18
Se
cure
d b
y e
xclu
siv
e
se
con
d c
ha
rge
cre
ate
d o
ver
mo
vea
ble
/im
mo
vea
ble
asse
ts o
f R
am
ko
la u
nit
.
To
tal
term
lo
an
s f
rom
oth
er
pa
rtie
s 2
35
.77
4
12
.45
To
tal
loa
ns
16
32
6.8
7
47
90
3.2
9

P. 144
Notes to the Standalone Financial Statementsfor the year ended March 31, 2018
(All amounts in ` lakhs, unless otherwise stated)
NOTE 17: OTHER FINANCIAL LIABILITIES
As at 31-Mar-18 As at 31-Mar-17
Current Non-current Current Non- current
At amortised cost
Current maturities of long-term borrowings
(refer note 16)
12831.59 - 20367.06 -
Interest accrued 96.00 - 187.95 30.62
Capital creditors 744.60 - 699.24 -
Employee benefits & other dues payable 2371.67 - 3044.13 -
Security deposits (see (i) below) 374.35 - 357.35 -
Unclaimed preference shares redemption (see
(ii) below)
- - - -
Unpaid dividends (see (ii) below) 3.48 - 5.00 -
Unclaimed matured deposits (see (ii) below) - - - -
Unclaimed interest on deposits (see (ii) below) - - 0.21 -
Total other financial liabilities
at amortised cost [A]
16421.69 - 24660.94 30.62
At fair value through Profit or Loss
(refer note 42)
Derivatives financial instruments carried
at fair value
- Foreign-exchange forward contracts/
Currency swaps/Interest rate swaps
3.96 - 84.88 -
Total other financial liabilities at FVTPL [B] 3.96 - 84.88 -
Total other financial liabilities ([A]+[B]) 16425.65 - 24745.82 30.62
(i) Security deposits as at 31 March 2018 include ̀ 316 lakhs (31 March 2017 : ̀ 298 lakhs) deposits from sugar selling agents which
are interest bearing subject to fullfilment of terms and conditions. These deposits are repayable on cessation of contractual
arrangements. Interest payable is normally settled annually.
(ii) There are no amounts as at the end of the year which are due and outstanding to be credited to the Investors Education and
Protection Fund.
NOTE 18: PROVISIONS
As at 31-Mar-18 As at 31-Mar-17
Current Non-current Current Non- current
Provision for employee benefits
Gratuity (refer note 38) 203.63 3078.47 216.79 3033.05
Compensated absences 321.49 891.01 325.57 829.96
Other Provisions
Warranty 838.49 - 491.25 -
Cost to completion 314.29 - 20.00 -
Arbitration/Court case claims 254.19 - 278.79 -
Total provisions 1932.09 3969.48 1332.40 3863.01

P. 145
Annual Report 2017-18
02-17 | Co
rpo
rate Overview
24-101 | Statuto
ry Rep
orts
18-23 | Man
agem
ent Statem
ents
102-266 | Finan
cial Statemen
ts
Notes to the Standalone Financial Statementsfor the year ended March 31, 2018
(All amounts in ` lakhs, unless otherwise stated)
(i) Information about individual provisions and significant estimates
(a) Warranty
The company provides warranties on certain products and services, undertaking to repair or replace the items that fail to
perform satisfactorily during the warranty period. Provisions made represent the amount of expected cost of meeting such
obligations of rectifications / replacements based on best estimate considering the historical warranty claim information
and any recent trends that may suggest future claims could differ from historical amounts. The timing of the outflows is
expected to be within the period of two years.
(b) Cost to completion
The provision represents costs of materials and services required for integration of water treatment package at the site
(the revenue of which has been fully recognised), prior to commissioning.
(c) Arbitration / Court-case Claims
Represents the provision made towards certain claims awarded against the company in legal proceedings which have
been challenged by the Company before appropriate authorities. The timing of the outflows is uncertain.
(ii) Movement in provisions
Movement in each class of provision are set out below:
As at 31-Mar-18 As at 31-Mar-17
Warranty Cost to
completion
Arbitration/
Court case
claims
Warranty Cost to
completion
Arbitration/
Court case
claims
Balance at the beginning of the year 491.25 20.00 278.79 253.02 30.00 265.23
Additional provisions recognised 376.04 314.29 10.40 371.50 20.00 13.56
Amounts used during the year (13.55) - (35.00) (79.93) - -
Unused amounts reversed during the year (15.25) (20.00) - (53.34) (30.00) -
Balance at the end of the year 838.49 314.29 254.19 491.25 20.00 278.79
NOTE 19: OTHER LIABILITIES
As at 31-Mar-18 As at 31-Mar-17
Current Non-current Current Non- current
Advance from customers 3478.22 - 3812.32 -
Deferred revenue arising from government grant
related to assets (refer note 43)
1.33 149.13 - -
Deferred revenue arising from government grant
related to income (refer note 43)
250.87 - 711.36 250.84
Amount due to customers under construction
contracts [refer note 10(i)]
1034.35 - 554.51 -
Advance against assets classified as held for sale - - 200.00 -
Statutory remittances 3174.84 - 11855.84 -
Miscellaneous other payables 52.02 - 54.16 -
Total other liabilities 7991.63 149.13 17188.19 250.84

P. 146
Notes to the Standalone Financial Statementsfor the year ended March 31, 2018
(All amounts in ` lakhs, unless otherwise stated)
NOTE 20: CURRENT BORROWINGS
As at
31-Mar-18
As at
31-Mar-17
Secured- at amortised cost
Repayable on demand
- Cash credits/working capital demand loans from banks (see (i) below) 105557.23 122543.89
Unsecured- at amortised cost
Other loans
- Foreign currency loans (buyers' credits) from banks (see (ii) below) 2090.00 1666.03
Total current borrowings 107647.23 124209.92
(i) Cash credit/working capital demand loans from banks are secured by pledge/hypothecation of the stock-in-trade, raw material,
stores and spare parts, work-in-progress and trade receivables and second charge created/to be created on the properties of
all the Engineering units and third charge on the properties of Sugar, Co-Generation and Distillery units of the Company on pari-
passu basis. It also included working capital demand loans of `15000 lakhs availed during last year with outstanding balance
as at 31 March 2018 ` Nil (31 March 2017: ` 15000 lakhs, which were secured by sub-servient charge on the current assets of
the Company by way of hypothecation. Interest rates on cash credits and working capital demand loans availed at the year end
majorly ranges between 8.5% to 9.85% (weighted average interest rate : 8.62% p.a.).
(ii) The weighted average effective interest rate on foreign currency loans (buyers’ credits) from banks is 2.72% per annum.
NOTE 21: TRADE PAYABLES
As at
31-Mar-18
As at
31-Mar-17
Trade payables (at amortised cost)
- Total outstanding dues of micro enterprises and
small enterprises (refer note 47)
43.42 37.35
- Total outstanding dues of creditors other than
micro enterprises and small enterprises
62762.15 25620.87
Total trade payables 62805.57 25658.22
NOTE 22: INCOME TAX BALANCES
As at 31-Mar-18 As at 31-Mar-17
Current Non-current Current Non-current
Income tax assets
Tax refund receivable (net) - 5733.97 - 2919.25
- 5733.97 - 2919.25
Income tax liabilities
Provision for income tax (net) - - 264.75 -
- - 264.75 -
NOTE 23: DEFERRED TAX BALANCES
As at
31-Mar-18
As at
31-Mar-17
Deferred tax assets 12357.06 14144.98
Deferred tax liabilities (16528.82) (16487.28)
Net deferred tax assets/(liabilities) (4171.76) (2342.30)

P. 147
Annual Report 2017-18
02-17 | Co
rpo
rate Overview
24-101 | Statuto
ry Rep
orts
18-23 | Man
agem
ent Statem
ents
102-266 | Finan
cial Statemen
ts
Notes to the Standalone Financial Statementsfor the year ended March 31, 2018
(All amounts in ` lakhs, unless otherwise stated)
(i) Movement in deferred tax balances
For the year ended 31 March 2018
Opening
balance
Recognised in
profit or loss
Recognised
in OCI
Closing
balance
Tax effect of items constituting deferred tax assets/
(liabilities)
Difference in carrying values of property, plant &
equipment and intangible assets
(16487.28) (41.54) - (16528.82)
Difference in carrying values of investment property 216.67 48.42 - 265.09
Liabilities and provisions tax deductible only upon
payment/actual crystallisation
- Employee benefits 1602.47 47.37 (64.41) 1585.43
- Statutory taxes and duties 961.19 (776.49) - 184.70
- Interest payable to banks/financial
institutions
32.19 (32.19) - -
- Other contractual provisions 272.91 164.72 - 437.63
Impairment provisions of financial assets
made in books, but tax deductible only on
actual write-off
1120.43 (308.66) - 811.77
Other temporary differences 16.09 (12.93) - 3.16
Unutilised tax losses 4057.73 (4057.73) - -
Unutilised tax credits 5865.30 3203.98 - 9069.28
Net deferred tax assets/(liabilities) (2342.30) (1765.05) (64.41) (4171.76)
For the year ended 31 March 2017
Opening
balance
Recognised in
profit or loss
Recognised
in OCI
Closing
balance
Tax effect of items constituting deferred tax assets/
(liabilities)
Difference in carrying values of property, plant &
equipment and intangible assets
(16539.21) 51.93 - (16487.28)
Difference in carrying values of investment property 201.86 14.81 - 216.67
Liabilities and provisions tax deductible only upon
payment/actual crystallisation
- Employee benefits 1240.25 124.79 237.43 1602.47
- Statutory taxes and duties 359.19 602.00 - 961.19
- Interest payable to banks/financial
institutions
47.62 (15.43) - 32.19
- Other contractual provisions 188.32 84.59 - 272.91
Impairment provisions of financial assets
made in books, but tax deductible only on
actual write-off
2202.69 (1082.26) - 1120.43
Other temporary differences 114.91 (98.82) - 16.09
Unutilised tax losses 12184.37 (8126.64) - 4057.73
Unutilised tax credits - 5865.30 - 5865.30
Net deferred tax assets/(liabilities) - (2579.73) 237.43 (2342.30)

P. 148
Notes to the Standalone Financial Statementsfor the year ended March 31, 2018
(All amounts in ` lakhs, unless otherwise stated)
(ii) Unrecognised deductible temporary differences, unused tax losses and unused tax credits
Deferred tax assets have not been recognised in respect of following items, because it is not probable that future taxable profit
will be available against which the Company can use the benefit therefrom.
As at
31-Mar-18
As at
31-Mar-17
Tax effect on unused tax losses (long term capital loss) (see table below for expiry) 569.50 888.96
Net deferred tax assets/(liabilities) 569.50 888.96
Expiry profile of unrecognised unused tax losses
Unused tax losses (long term capital loss) shall expire on -
March 31, 2018 - 319.46
March 31, 2019 557.16 557.16
March 31, 2020 0.57 0.57
March 31, 2021 11.77 11.77
569.50 888.96
NOTE 24 : REVENUE FROM OPERATIONS
Year ended
31-Mar-18
Year ended
31-Mar-17
Sale of products [refer note 37(vii) and note 51(i)]
Finished goods 321611.96 276238.01
Stock-in-trade 1627.41 1488.20
Sale of services
Erection and commissioning 22.90 57.75
Servicing 262.65 288.20
Operation and maintenance 3927.25 3472.07
Construction contract revenue 12324.57 14012.33
Other operating revenue
Income from sale of renewable energy certificates 1311.48 1026.93
Export incentives [refer note 43(i)(B)] 78.03 23.49
Income from scrap 72.12 79.63
Total revenue from operations 341238.37 296686.61
NOTE 25: OTHER INCOME
Year ended
31-Mar-18
Year ended
31-Mar-17
Interest income
Interest income from bank deposits (at amortised cost) 57.85 49.93
Interest income from customers (at amortised cost) 31.03 20.68
Interest income from financial assets carried at amortised cost 15.12 27.82
Interest income from investments carried at FVTPL 12.28 15.72
Interest income from others 5.07 541.56
121.35 655.71
Dividend income
Dividend income from equity investments 868.66 326.94
868.66 326.94

P. 149
Annual Report 2017-18
02-17 | Co
rpo
rate Overview
24-101 | Statuto
ry Rep
orts
18-23 | Man
agem
ent Statem
ents
102-266 | Finan
cial Statemen
ts
Notes to the Standalone Financial Statementsfor the year ended March 31, 2018
(All amounts in ` lakhs, unless otherwise stated)
Year ended
31-Mar-18
Year ended
31-Mar-17
Other non-operating income (net of expenses directly attributable to such income)
Rental income (refer note 4 (ii)) 52.50 24.89
Subsidy from U.P. Government [refer note 43(i)(A)] 0.99 -
Miscellaneous income 1067.50 830.73
1120.99 855.62
Other gains/(losses)
Net fair value gains/(losses) on investments 23.16 97.44
Net gains/(losses) on derivatives 19.85 (97.28)
Net foreign exchange rate fluctuation gains - 75.06
Credit balances written back 156.99 154.50
Net profit/(loss) on sale / redemption of investments 0.60 (0.65)
Net reversal of impairment loss allowance on non financial assets (includes amounts
written off 31 March 2017 : ` 1009.60 lakhs) (refer note 10)
- 918.34
Excess provision for cost to completion reversed (net) (refer note 18) - 10.00
Excess provision of expenses reversed 96.73 41.77
297.33 1199.18
Total other income 2408.33 3037.45
NOTE 26: COST OF MATERIALS CONSUMED
Year ended
31-Mar-18
Year ended
31-Mar-17
Stock at the beginning of the year 3065.44 2015.42
Add: Purchases 257798.52 207518.79
Less: Amount capitalised (included in the cost of property, plant and equipment) (19.63) (22.70)
Less: Stock at the end of the year (2698.80) (3065.44)
Total cost of materials consumed (refer note 43(i)(B) and 43(ii)) 258145.53 206446.07
NOTE 27: PURCHASES OF STOCK-IN-TRADE
Year ended
31-Mar-18
Year ended
31-Mar-17
Petroleum goods 1635.88 1477.98
Consumer goods 38.36 58.95
Total purchases of stock-in-trade 1674.24 1536.93
NOTE 28: CHANGES IN INVENTORIES OF FINISHED GOODS, STOCK-IN-TRADE AND WORK-IN-PROGRESS
Year ended
31-Mar-18
Year ended
31-Mar-17
Inventories at the beginning of the year:
Finished goods 158669.55 134424.77
Stock-in-trade 18.06 10.38
Work-in-progress 2669.25 1723.95
Certified emission reduction 3.16 2.95
Total inventories at the beginning of the year 161360.02 136162.05

P. 150
Notes to the Standalone Financial Statementsfor the year ended March 31, 2018
(All amounts in ` lakhs, unless otherwise stated)
Year ended
31-Mar-18
Year ended
31-Mar-17
Inventories at the end of the year:
Finished goods 148847.59 158669.55
Stock-in-trade 31.47 18.06
Work-in-progress 3157.30 2669.25
Certified emission reduction 0.77 3.16
Total inventories at the end of the year 152037.13 161360.02
Add/(Less): Impact of excise duty on finished goods (10189.01) 1247.15
Total changes in inventories of finished goods, stock-in-trade and work-in-progress (866.12) (23950.82)
NOTE 29: EMPLOYEE BENEFIT EXPENSE
Year ended
31-Mar-18
Year ended
31-Mar-17
Salaries and wages 17844.68 16709.25
Contribution to provident and other funds (refer note 38) 1874.96 1640.57
Staff welfare expenses 528.89 435.39
20248.53 18785.21
Less: Amount capitalised (included in the cost of property, plant and equipment) (8.19) (13.73)
Total employee benefit expense 20240.34 18771.48
NOTE 30: FINANCE COSTS
Year ended
31-Mar-18
Year ended
31-Mar-17
Interest costs
- Interest on loans with interest subvention [refer note 43(i)(A)] 216.52 894.08
- Interest on loans with below-market rate of interest [refer note 43(i)(A)] 12.74 21.72
- Interest on other borrowings 8131.05 11586.37
- Other interest expense 88.81 139.36
Total interest expense on financial liabilities not classified as at FVTPL 8449.12 12641.53
Less : Amount capitalised (included in the cost of property, plant and equipment) - (0.48)
8449.12 12641.05
Exchange differences regarded as an adjustment to borrowing costs 76.36 1.68
Other borrowing costs
- Loan monitoring and administration charges 8.39 12.71
Total finance costs 8533.87 12655.44
NOTE 31: DEPRECIATION AND AMORTISATION EXPENSE
Year ended
31-Mar-18
Year ended
31-Mar-17
Depreciation of property, plant and equipment (refer note 3) 5485.65 5652.42
Depreciation of investment property (refer note 4) - -
Amortisation of intangible assets (refer note 5) 56.00 77.17
5541.65 5729.59
Less: Amount capitalised (included in the cost of property, plant and equipment) (5.10) (8.60)
Total depreciation and amortisation expense 5536.55 5720.99

P. 151
Annual Report 2017-18
02-17 | Co
rpo
rate Overview
24-101 | Statuto
ry Rep
orts
18-23 | Man
agem
ent Statem
ents
102-266 | Finan
cial Statemen
ts
Notes to the Standalone Financial Statementsfor the year ended March 31, 2018
(All amounts in ` lakhs, unless otherwise stated)
NOTE 32: IMPAIRMENT LOSS ON FINANCIAL ASSETS (INCLUDING REVERSALS OF IMPAIRMENT LOSSES)
Year ended
31-Mar-18
Year ended
31-Mar-17
Bad debts written off - trade receivables and other financial assets carried
at amortised cost
607.12 2215.18
Impairment loss allowance on trade receivables (net of reversals) (refer note 7) (887.88) (1537.04)
Impairment loss allowance on other financial assets carried at amortised cost (net of
reversals) (refer note 8 & 9)
(15.65) (42.31)
Total impairment loss on financial assets (including reversals of impairment losses) (296.41) 635.83
NOTE 33: OTHER EXPENSES
Year ended
31-Mar-18
Year ended
31-Mar-17
Stores and spares consumed 2869.21 2256.11
Power and fuel 1831.37 1806.55
Design and engineering charges 122.07 90.10
Cane development expenses 280.59 326.85
Machining/fabrication expenses 79.26 94.30
Erection and commissioning expenses 426.21 600.71
Civil construction charges 4176.06 4271.28
Packing and stacking expenses 3942.22 2836.34
Repairs and maintenance
- Machinery 4039.99 3717.80
- Building 380.32 261.02
- Others 346.49 441.58
Factory/operational expenses 1903.80 1517.18
Travelling and conveyance 1334.70 1334.77
Rent [refer note 44 (ii)] 589.77 593.40
Rates and taxes 653.88 1080.88
Insurance 269.41 244.87
Directors' fee 30.45 36.90
Legal and professional expenses 932.10 691.69
Security service expenses 1247.40 1062.92
Net impairment loss allowance on non financial assets (includes amounts written off
31 March 2018: ` 83.00 lakhs) (refer note 10)
103.95 -
Net foreign exchange rate fluctuation losses 231.42 -
Warranty expenses [includes provision for warranty (net) ` 360.79 lakhs (31 March 2017:
` 318.16 lakhs) (refer note 18)]
368.49 320.73
Liquidated damages charges 310.56 -
Provision for Arbitration/Court case claims (refer note 18) 10.40 13.56
Provision for cost to completion on construction contracts (net) (refer note 18) 294.29 -
Payment to Auditors (see (i) below) 70.03 122.93
Provision for non moving / obsolete inventory 77.24 95.30
Loss on sale /write off of inventory 33.57 24.39
Loss on sale / write off / impairment of property, plant and equipment 32.88 82.15
Selling commission 859.41 719.26

P. 152
Notes to the Standalone Financial Statementsfor the year ended March 31, 2018
(All amounts in ` lakhs, unless otherwise stated)
Year ended
31-Mar-18
Year ended
31-Mar-17
Royalty 236.99 189.50
Advertisement and sales promotion 30.78 37.30
Rebate and discount 19.67 27.07
Outward freight and forwarding 638.41 488.36
Other selling expenses 302.26 61.54
Miscellaneous expenses 1512.24 1419.53
Less: Amount capitalised (included in the cost of property, plant and equipment) (20.58) (9.03)
Total other expenses 30567.31 26857.84
(i) Detail of payment to auditors
Statutory Auditors Branch Auditors Cost Auditors
Year ended
31-Mar-18
Year ended
31-Mar-17
Year ended
31-Mar-18
Year ended
31-Mar-17
Year ended
31-Mar-18
Year ended
31-Mar-17
Audit fee 41.00 45.54 - 6.92 3.75 3.38
Tax audit fee - 18.89 - 3.41 - -
Limited review fee 17.01 21.03 0.91 2.73 - -
Other services (Certification) 0.30 9.56 0.10 1.10 0.50 0.68
Reimbursement of expenses 4.36 5.50 1.71 4.10 0.39 0.09
Total payment to auditors 62.67 100.52 2.72 18.26 4.64 4.15
NOTE 34: EXCEPTIONAL ITEMS
Year ended
31-Mar-18
Year ended
31-Mar-17
Write off of incentives recoverable under UP Sugar Promotion Policy 2004
[refer note 43(iii)]
- (8546.74)
Total exceptional items - (8546.74)
NOTE 35: INCOME TAX EXPENSE
(i) Income tax recognised in profit or loss
Year ended
31-Mar-18
Year ended
31-Mar-17
Current tax
In respect of the current year 3065.16 2335.63
In respect of the earlier year 138.81 -
Total current tax expense 3203.97 2335.63
Deferred tax
In respect of current year origination and reversal of temporary differences * 1765.05 2579.73
Total deferred tax expense 1765.05 2579.73
Total income tax expense recognised in profit or loss 4969.02 4915.36
* includes MAT credit entitlement of ` 3203.97 lakhs (31 March 2017: ` 2335.63 lakhs).

P. 153
Annual Report 2017-18
02-17 | Co
rpo
rate Overview
24-101 | Statuto
ry Rep
orts
18-23 | Man
agem
ent Statem
ents
102-266 | Finan
cial Statemen
ts
Notes to the Standalone Financial Statementsfor the year ended March 31, 2018
(All amounts in ` lakhs, unless otherwise stated)
Reconciliation of income tax expense and the accounting profit multiplied by Company’s tax rate:
Year ended
31-Mar-18
Year ended
31-Mar-17
Profit before tax 15943.40 28271.61
Income tax expense calculated at 34.608% (including surcharge and education cess)
(2017: 34.608%)
5517.69 9784.24
Changes in tax rate 145.75 -
Effect of income that is exempt from taxation (311.93) (693.62)
Effect of income that is taxable at lower rates (3.11) -
Effect of expenses that are non-deductible in determining taxable profit 83.92 3018.05
Effect of tax incentives and concessions (1262.93) -
Effect of current year losses for which no deferred tax asset is recognised - -
Effect of recognition of previously unrecognised tax losses now recognised
as deferred tax assets
- (3663.64)
Changes in recognised deductible temporary differences (46.03) -
Changes in estimates related to prior years 845.66 -
Recognition of unutilised tax credits - (3529.67)
Total income tax expense recognised in profit or loss 4969.02 4915.36
(ii) Income tax recognised in other comprehensive income
Year ended
31-Mar-18
Year ended
31-Mar-17
Deferred tax related to items recognised in other comprehensive income
during the year:
Remeasurement of defined benefit obligations 64.41 (237.43)
Total income tax expense recognised in other comprehensive income 64.41 (237.43)
Bifurcation of the income tax recognised in other comprehensive income into:
Items that will not be reclassified to profit or loss 64.41 (237.43)
Items that may be reclassified to profit or loss - -
Total income tax expense recognised in other comprehensive income 64.41 (237.43)
NOTE 36: EARNINGS PER SHARE
Year ended
31-Mar-18
Year ended
31-Mar-17
Profit for the year attributable to owners of the Company [A] 10974.38 23356.25
Weighted average number of equity shares for the purposes of basic EPS/ diluted EPS [B] 25,79,45,110 25,79,45,110
Basic earnings per share (face value of ` 1 per share) [A/B] 4.25 9.06
Diluted earnings per share (face value of ` 1 per share) [A/B] 4.25 9.06

P. 154
NOTE 37: SEGMENT INFORMATION
(i) Description of segments and principal activities
The operating segments are classified under two major businesses which the Company is engaged in, and are briefly described
as under:
Sugar & Allied Business
(a) Sugar : The Company is a manufacturer of white crystal sugar, having seven manufacturing plants situated in the states
of Uttar Pradesh. The sugar is sold to wholesalers and industrial users. The Company sells the surplus molasses and
bagasse, which are produced as by-products in the manufacturing of sugar, after meeting its captive requirements. The
Company also sells the surplus power incidentally produced at three of its sugar units.
(b) Co-generation : This segment uses captively produced bagasse, generated as a by-product in the manufacture of sugar,
as a feed stock and apart from meeting the power and steam requirements of the associated sugar units, also exports
power to the state grid. It has installed capacity of 68 MW spread over Khatauli and Deoband sugar mills.
(c) Distillery : The 160 kilo-litres per day capacity distillery located at Muzaffarnagar, Uttar Pradesh, uses captive molasses
produced in manufacture of sugar as the principal raw material in production of various categories of alcohol.
Engineering Business
(a) Gears : This business segment is focused on all high speed and niche low speed products - supply of new equipment as
well as providing replacement solutions for power sector, having its manufacturing facility located at Mysore, Karnataka.
(b) Water/Wastewater treatment : The business segment operates from Noida, Uttar Pradesh and provides engineered to
order process equipment and comprehensive solutions in the water and wastewater management.
The ‘Other Operations’ mainly include trading of various packaged fast moving consumer goods under the Company’s
brand name (including sugar) and retailing of diesel/petrol through a Company operated fuel station. It also operate
a turnkey project relating to steam turbines which was awarded to it pursuant to bids tendered prior to demerger of
business of steam turbine.
The above reportable segments have been identified based on the significant components of the enterprise for which
discrete financial information is available and are reviewed by the Chief operating decision maker (CODM) to assess the
performance and allocate resources to the operating segments
There are no geographical segments as the volume of exports is not significant and the major turnover of the Company
takes place indigenously. There is no major reliance on a few customers or suppliers.
Notes to the Standalone Financial Statementsfor the year ended March 31, 2018
(All amounts in ` lakhs, unless otherwise stated)
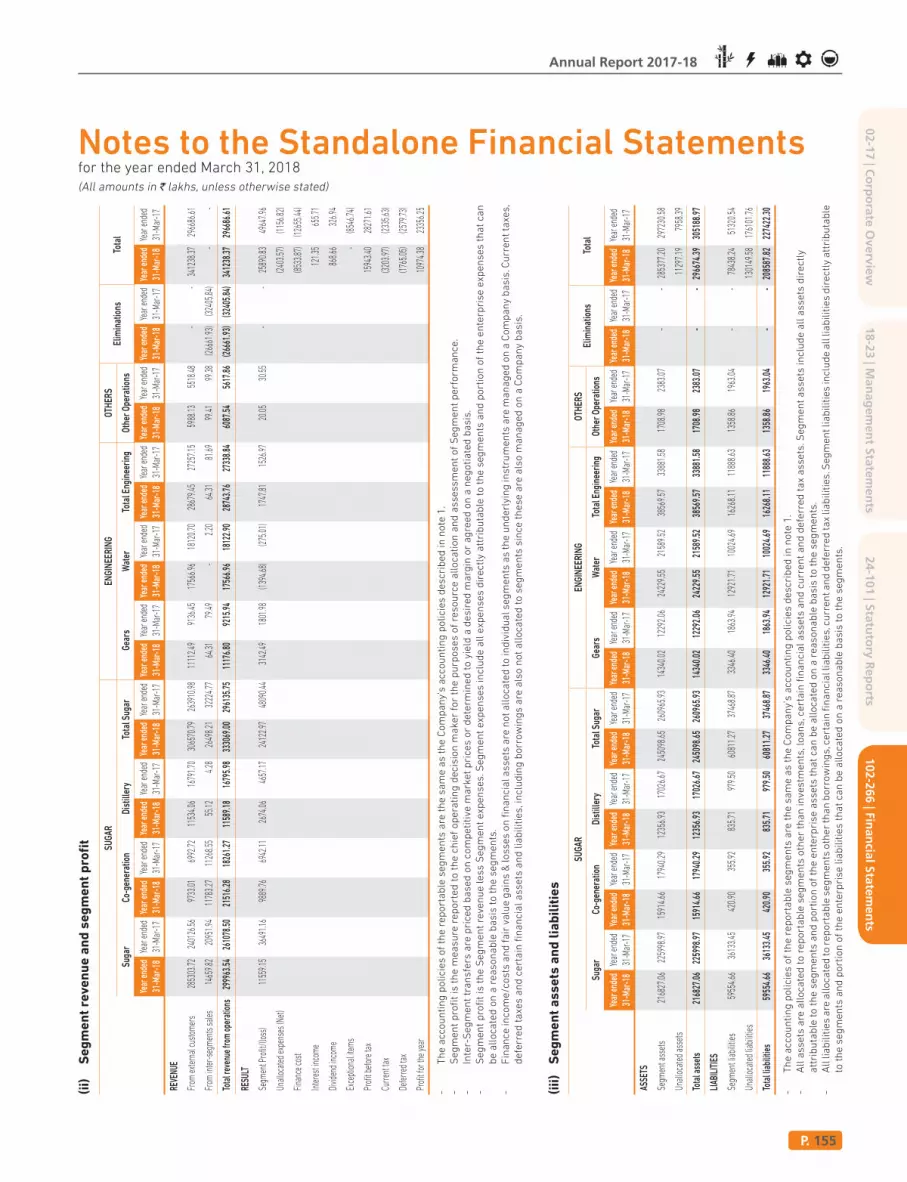
P. 155
Annual Report 2017-18
02-17 | Co
rpo
rate Overview
24-101 | Statuto
ry Rep
orts
18-23 | Man
agem
ent Statem
ents
102-266 | Finan
cial Statemen
ts
Notes to the Standalone Financial Statementsfor the year ended March 31, 2018
(All amounts in ` lakhs, unless otherwise stated)
(ii)
S
eg
me
nt
rev
en
ue
an
d s
eg
me
nt
pro
fit
SUGA
REN
GIN
EERI
NG
OTH
ERS
Elim
inat
ions
Tota
lSu
gar
Co-g
ener
atio
nDi
still
ery
Tota
l Sug
arGe
ars
Wat
erTo
tal E
ngin
eeri
ngOt
her
Oper
atio
ns
Year
end
ed
31-M
ar-1
8
Year
end
ed
31-M
ar-1
7
Year
end
ed
31-M
ar-1
8
Year
end
ed
31-M
ar-1
7
Year
end
ed
31-M
ar-1
8
Year
end
ed
31-M
ar-1
7
Year
end
ed
31-M
ar-1
8
Year
end
ed
31-M
ar-1
7
Year
end
ed
31-M
ar-1
8
Year
end
ed
31-M
ar-1
7
Year
end
ed
31-M
ar-1
8
Year
end
ed
31-M
ar-1
7
Year
end
ed
31-M
ar-1
8
Year
end
ed
31-M
ar-1
7
Year
end
ed
31-M
ar-1
8
Year
end
ed
31-M
ar-1
7
Year
end
ed
31-M
ar-1
8
Year
end
ed
31-M
ar-1
7
Year
end
ed
31-M
ar-1
8
Year
end
ed
31-M
ar-1
7
REV
ENUE
Fro
m e
xter
nal c
usto
mer
s 28
5303
.72
2401
26.56
9
733.0
1 6
992.7
2 1
1534
.06
167
91.70
30
6570
.79
2639
10.98
1
1112
.49
913
6.45
175
66.96
1
8120
.70
286
79.45
2
7257
.15
598
8.13
551
8.48
- -
3412
38.37
29
6686
.61
Fro
m in
ter-
segm
ents
sale
s 1
4659
.82
209
51.94
1
1783
.27
112
68.55
5
5.12
4.28
2
6498
.21
322
24.77
6
4.31
79.4
9 -
2.20
6
4.31
81.6
9 9
9.41
99.3
8 (2
6661
.93)
(324
05.84
) -
-
Tota
l rev
enue
from
ope
ratio
ns
2999
63.5
4 26
1078
.50
215
16.2
8 1
8261
.27
115
89.1
8 1
6795
.98
3330
69.0
0 29
6135
.75
111
76.8
0 9
215.
94
175
66.9
6 1
8122
.90
287
43.7
6 2
7338
.84
608
7.54
5
617.
86
(266
61.9
3)(3
2405
.84)
3412
38.3
7 29
6686
.61
RES
ULT
Seg
men
t Pro
fit/(l
oss)
1
1559
.15
364
91.16
9
889.7
6 6
942.1
1 2
674.0
6 4
657.1
7 2
4122
.97
480
90.44
3
142.4
9 1
801.9
8 (1
394.6
8) (2
75.01
) 1
747.8
1 1
526.9
7 2
0.05
30.5
5 -
- 2
5890
.83
496
47.96
Una
lloca
ted
expe
nses
(Net
) (2
403.5
7) (1
156.8
2)
Fin
ance
cost
(8
533.8
7) (1
2655
.44)
Inte
rest
inco
me
121
.35
655
.71
Divi
dend
inco
me
868
.66
326
.94
Exc
eptio
nal i
tem
s -
(854
6.74)
Pro
fit b
efor
e ta
x 1
5943
.40
282
71.61
Cur
rent
tax
(320
3.97)
(233
5.63)
Def
erre
d ta
x (1
765.0
5) (2
579.7
3)
Pro
fit fo
r the
year
1
0974
.38
233
56.25
- T
he
acc
ou
nti
ng
po
lici
es o
f th
e r
ep
ort
ab
le s
eg
me
nts
are
th
e s
am
e a
s t
he
Co
mp
an
y’s a
cco
un
tin
g p
oli
cie
s d
escr
ibe
d in
no
te 1
.
- S
eg
me
nt
pro
fit
is t
he
me
asu
re r
ep
ort
ed
to
th
e c
hie
f o
pe
rati
ng
de
cisio
n m
ake
r fo
r th
e p
urp
ose
s o
f re
so
urc
e a
llo
cati
on
an
d a
sse
ssm
en
t o
f S
eg
me
nt
pe
rfo
rma
nce
.
- In
ter-
Se
gm
en
t tr
an
sfe
rs a
re p
rice
d b
ase
d o
n c
om
pe
titi
ve m
ark
et
pri
ces o
r d
ete
rmin
ed
to
yie
ld a
de
sir
ed
ma
rgin
or
ag
ree
d o
n a
ne
go
tia
ted
ba
sis
.
- S
eg
me
nt
pro
fit
is t
he
Se
gm
en
t re
ven
ue
le
ss S
eg
me
nt
exp
en
se
s. S
eg
me
nt
exp
en
se
s in
clu
de
all
exp
en
se
s d
ire
ctly
att
rib
uta
ble
to
th
e s
eg
me
nts
an
d p
ort
ion
of
the
en
terp
rise
exp
en
se
s t
ha
t ca
n
be
all
oca
ted
on
a r
ea
so
na
ble
ba
sis
to
th
e s
eg
me
nts
.
- F
ina
nce
inco
me
/co
sts
an
d f
air
va
lue
ga
ins &
lo
sse
s o
n fi
na
nci
al a
sse
ts a
re n
ot
all
oca
ted
to
ind
ivid
ua
l se
gm
en
ts a
s t
he
un
de
rlyi
ng
instr
um
en
ts a
re m
an
ag
ed
on
a C
om
pa
ny
ba
sis
. Cu
rre
nt
taxe
s,
de
ferr
ed
ta
xes a
nd
ce
rta
in fi
na
nci
al
asse
ts a
nd
lia
bil
itie
s, i
ncl
ud
ing
bo
rro
win
gs a
re a
lso
no
t a
llo
cate
d t
o s
eg
me
nts
sin
ce t
he
se
are
als
o m
an
ag
ed
on
a C
om
pa
ny
ba
sis
.
(iii
) S
eg
me
nt
as
se
ts a
nd
lia
bil
itie
s
SUGA
REN
GIN
EERI
NG
OTH
ERS
Elim
inat
ions
Tota
lSu
gar
Co-g
ener
atio
nDi
still
ery
Tota
l Sug
arGe
ars
Wat
erTo
tal E
ngin
eeri
ngOt
her
Oper
atio
ns
Year
end
ed
31-M
ar-1
8
Year
end
ed
31-M
ar-1
7
Year
end
ed
31-M
ar-1
8
Year
end
ed
31-M
ar-1
7
Year
end
ed
31-M
ar-1
8
Year
end
ed
31-M
ar-1
7
Year
end
ed
31-M
ar-1
8
Year
end
ed
31-M
ar-1
7
Year
end
ed
31-M
ar-1
8
Year
end
ed
31-M
ar-1
7
Year
end
ed
31-M
ar-1
8
Year
end
ed
31-M
ar-1
7
Year
end
ed
31-M
ar-1
8
Year
end
ed
31-M
ar-1
7
Year
end
ed
31-M
ar-1
8
Year
end
ed
31-M
ar-1
7
Year
end
ed
31-M
ar-1
8
Year
end
ed
31-M
ar-1
7
Year
end
ed
31-M
ar-1
8
Year
end
ed
31-M
ar-1
7
ASS
ETS
Seg
men
t ass
ets
2168
27.0
6 22
5998
.97
159
14.6
6 1
7940
.29
123
56.9
3 1
7026
.67
2450
98.6
5 26
0965
.93
143
40.0
2 1
2292
.06
242
29.5
5 2
1589
.52
385
69.5
7 3
3881
.58
170
8.98
2
383.
07
- -
2853
77.2
0 29
7230
.58
Una
lloca
ted
asse
ts
112
97.1
9 7
958.
39
Tota
l ass
ets
2168
27.0
6 22
5998
.97
159
14.6
6 1
7940
.29
123
56.9
3 1
7026
.67
2450
98.6
5 26
0965
.93
143
40.0
2 1
2292
.06
242
29.5
5 2
1589
.52
385
69.5
7 3
3881
.58
170
8.98
2
383.
07
- -
2966
74.3
9 30
5188
.97
LIA
BILI
TIES
Seg
men
t lia
bilit
ies
595
54.6
6 3
6133
.45
420
.90
355
.92
835
.71
979
.50
608
11.2
7 3
7468
.87
334
6.40
1
863.
94
129
21.7
1 1
0024
.69
162
68.1
1 1
1888
.63
135
8.86
1
963.
04
- -
784
38.2
4 5
1320
.54
Una
lloca
ted
liabi
litie
s 1
3014
9.58
1
7610
1.76
Tota
l lia
bilit
ies
5955
4.66
3613
3.45
420.
9035
5.92
835.
7197
9.50
608
11.2
7 3
7468
.87
3346
.40
1863
.94
1292
1.71
1002
4.69
162
68.1
1 1
1888
.63
1358
.86
1963
.04
- -
2085
87.8
2 22
7422
.30
- T
he
acc
ou
nti
ng
po
lici
es o
f th
e r
ep
ort
ab
le s
eg
me
nts
are
th
e s
am
e a
s t
he
Co
mp
an
y’s a
cco
un
tin
g p
oli
cie
s d
escr
ibe
d in
no
te 1
.
- A
ll a
sse
ts a
re a
llo
cate
d t
o r
ep
ort
ab
le s
eg
me
nts
oth
er
tha
n in
vestm
en
ts, l
oa
ns, c
ert
ain
fin
an
cia
l a
sse
ts a
nd
cu
rre
nt
an
d d
efe
rre
d t
ax
asse
ts. S
eg
me
nt
asse
ts in
clu
de
all
asse
ts d
ire
ctly
att
rib
uta
ble
to
th
e s
eg
me
nts
an
d p
ort
ion
of
the
en
terp
rise
asse
ts t
ha
t ca
n b
e a
llo
cate
d o
n a
re
aso
na
ble
ba
sis
to
th
e s
eg
me
nts
.
- A
ll li
ab
ilit
ies a
re a
llo
cate
d t
o r
ep
ort
ab
le s
eg
me
nts
oth
er
tha
n b
orr
ow
ing
s, c
ert
ain
fin
an
cia
l lia
bil
itie
s, c
urr
en
t a
nd
de
ferr
ed
ta
x li
ab
ilit
ies. S
eg
me
nt
lia
bil
itie
s in
clu
de
all
lia
bil
itie
s d
ire
ctly
att
rib
uta
ble
to t
he
se
gm
en
ts a
nd
po
rtio
n o
f th
e e
nte
rpri
se
lia
bil
itie
s t
ha
t ca
n b
e a
llo
cate
d o
n a
re
aso
na
ble
ba
sis
to
th
e s
eg
me
nts
.

P. 156
Notes to the Standalone Financial Statementsfor the year ended March 31, 2018
(All amounts in ` lakhs, unless otherwise stated)
(iv
) O
the
r s
eg
me
nt
info
rma
tio
n
SUGA
REN
GIN
EERI
NG
OTH
ERS
Elim
inat
ions
Tota
lSu
gar
Co-g
ener
atio
nDi
still
ery
Tota
l Sug
arGe
ars
Wat
erTo
tal E
ngin
eeri
ngOt
her
Oper
atio
ns
Year
end
ed
31-M
ar-1
8
Year
end
ed
31-M
ar-1
7
Year
end
ed
31-M
ar-1
8
Year
end
ed
31-M
ar-1
7
Year
end
ed
31-M
ar-1
8
Year
end
ed
31-M
ar-1
7
Year
end
ed
31-M
ar-1
8
Year
end
ed
31-M
ar-1
7
Year
end
ed
31-M
ar-1
8
Year
end
ed
31-M
ar-1
7
Year
end
ed
31-M
ar-1
8
Year
end
ed
31-M
ar-1
7
Year
end
ed
31-M
ar-1
8
Year
end
ed
31-M
ar-1
7
Year
end
ed
31-M
ar-1
8
Year
end
ed
31-M
ar-1
7
Year
end
ed
31-M
ar-1
8
Year
end
ed
31-M
ar-1
7
Year
end
ed
31-M
ar-1
8
Year
end
ed
31-M
ar-1
7
Amou
nt c
onsi
dere
d in
segm
ent r
esul
ts
Depr
ecia
tion
and
amor
tisat
ion
323
1.28
3
426.
25
686
.09
685
.26
509
.30
557
.50
442
6.67
4
669.
01
822
.47
789
.41
186
.50
188
.95
100
8.97
9
78.3
6 6
.66
6.6
3 -
- 5
442.
30
565
4.00
Unal
loca
ted
dere
ciat
ion
and
amor
tisat
ion
94.
25
66.
99
Tota
l dep
reci
atio
n an
d
amor
tisat
ion
323
1.28
3
426.
25
686
.09
685
.26
509
.30
557
.50
442
6.67
4
669.
01
822
.47
789
.41
186
.50
188
.95
100
8.97
9
78.3
6 6
.66
6.6
3 -
- 5
536.
55
572
0.99
Non
cash
item
s (o
ther
than
depr
ecia
tion
and
amor
tisat
ion)
24.
20
351
8.81
1
03.8
2 1
97.4
0 (2
6.09
) (8
31.4
9) 1
01.9
3 2
884.
72
119
.59
178
.33
(453
.78)
240
.07
(334
.19)
418
.40
10.
43
(59.
16)
- -
(221
.83)
324
3.96
Unal
loca
ted
non
cash
item
s
(oth
er th
an d
epre
ciat
ion
and
amor
tisat
ion)
(127
.82)
497
2.91
Tota
l non
cash
item
s (o
ther
than
dep
reci
atio
n an
d
amor
tisat
ion)
24.
20
351
8.81
1
03.8
2 1
97.4
0 (2
6.09
) (8
31.4
9) 1
01.9
3 2
884.
72
119
.59
178
.33
(453
.78)
240
.07
(334
.19)
418
.40
10.
43
(59.
16)
- -
(349
.65)
821
6.87
Amou
nts
not c
onsi
dere
d in
segm
ent r
esul
ts
Inte
rest
exp
ense
7
840.
43
110
84.1
7 2
8.24
1
21.7
6 1
80.3
4 2
85.3
6 8
049.
01
114
91.2
9 1
25.7
9 3
05.0
0 4
64.6
7 6
96.8
4 5
90.4
6 1
001.
84
- -
- -
863
9.47
1
2493
.13
Unal
loca
ted
inte
rest
exp
ense
(1
05.6
0) 1
62.3
1
Tota
l int
eres
t exp
ense
7
840.
43
110
84.1
7 2
8.24
1
21.7
6 1
80.3
4 2
85.3
6 8
049.
01
114
91.2
9 1
25.7
9 3
05.0
0 4
64.6
7 6
96.8
4 5
90.4
6 1
001.
84
- -
- -
853
3.87
1
2655
.44
Inte
rest
inco
me
47.
88
33.
78
3.6
1 3
.62
1.7
2 2
.05
53.
21
39.
45
4.4
7 9
.75
20.
92
34.
78
25.
39
44.
53
- -
- -
78.
60
83.
98
Unal
loca
ted
inte
rest
inco
me
42.
75
571
.73
Tota
l int
eres
t inc
ome
47.
88
33.
78
3.6
1 3
.62
1.7
2 2
.05
53.
21
39.
45
4.4
7 9
.75
20.
92
34.
78
25.
39
44.
53
- -
- -
121
.35
655
.71
Exce
ptio
nal i
tem
s -
682
0.08
-
130
3.96
-
422
.70
- 8
546.
74
- -
- -
- -
- -
- -
- 8
546.
74
Capi
tal e
xpen
ditu
re
294
2.52
1
913.
15
189
.39
91.
29
902
.48
456
.44
403
4.39
2
460.
88
836
.82
101
5.50
1
88.8
3 1
03.2
9 1
025.
65
111
8.79
1
.35
2.0
5 -
- 5
061.
39
358
1.72
Unal
loca
ted
capi
tal
expe
nditu
re
175
.04
85.
30
Tota
l Cap
ital e
xpen
ditu
re
294
2.52
1
913.
15
189
.39
91.
29
902
.48
456
.44
403
4.39
2
460.
88
836
.82
101
5.50
1
88.8
3 1
03.2
9 1
025.
65
111
8.79
1
.35
2.0
5 -
- 5
236.
43
366
7.02

P. 157
Annual Report 2017-18
02-17 | Co
rpo
rate Overview
24-101 | Statuto
ry Rep
orts
18-23 | Man
agem
ent Statem
ents
102-266 | Finan
cial Statemen
ts
Notes to the Standalone Financial Statementsfor the year ended March 31, 2018
(All amounts in ` lakhs, unless otherwise stated)
(v) Break-up of revenue by geographical area
Year ended
31-Mar-18
Year ended
31-Mar-17
India (country of domicile) 339925.57 295314.19
Foreign countries 1312.80 1372.42
341238.37 296686.61
(vi) Non-current assets by geographical area
All non current assets of the Company are located in India except investment of ` 3006.19 lakhs in an Associate company
located in Israel.
(vii) Break-up of revenue from major products and services
Year ended
31-Mar-18
Year ended
31-Mar-17
Sale of products
Finished goods
- Sugar 279926.58 234514.36
- Molasses 2217.96 2103.55
- Bagasse 4612.53 4705.76
- Power 10783.59 7598.43
- Alcohol 11446.52 16587.71
- Mechanical equipment - Water/Waste-water 1483.67 1395.13
- Gears/Gear Boxes 9292.12 7313.33
- Bought outs and Spares 1442.30 1489.25
- Others 406.69 530.49
321611.96 276238.01
Stock in trade
- Diesel/Petrol/Lubricants 1575.22 1419.85
- Other consumer goods 52.19 68.35
1627.41 1488.20
323239.37 277726.21
Sale of services
Erection and commissioning 22.90 57.75
Servicing 262.65 288.20
Operation and maintenance 3927.25 3472.07
4212.80 3818.02
- -
Construction contract revenue
Water, Waste-water and Sewage treatment 12098.41 13138.29
Power generation and evacuation system 226.16 874.04
12324.57 14012.33
(viii) Information about major customers
There is no single customer who has contributed 10% or more to the Company’s revenue for both the years ended
31 March 2018 and 31 March 2017.

P. 158
Notes to the Standalone Financial Statementsfor the year ended March 31, 2018
(All amounts in ` lakhs, unless otherwise stated)
NOTE 38: EMPLOYEE BENEFIT PLANS
(i) Defined contribution plans
(a) The Company operates defined contribution retirement benefit plans under which the Company pays fixed contributions to
separate entities (funds) or financial institutions or state managed benefit schemes. The Company has no further payment
obligations once the contributions have been paid. Following are the schemes covered under defined contributions plans
of the Company:
Provident Fund Plan & Employee Pension Scheme: The Company makes monthly contributions at prescribed rates
towards Employee Provident Fund/ Employee Pension Scheme to fund administered and managed by the Government of
India. The Company has also set up provident fund Trust to secure the provident fund dues in respect of certain employees
of the Company. The provident fund is administered by the concerned trustees. The rules of the Company’s provident
fund administered by the Trust, require that if the Board of Trustees are unable to pay interest at the rate declared by the
Employees’ Provident Fund Organisation, Government of India, under para 60 of the Employees’ Provident Fund Scheme,
1952 for the reason that the return on investment is less or for any other reason, then the deficiency shall be made good
by the Company when determined. Having regard to the assets of the fund and the return on the investments, the Company
does not expect any deficiency as at the year end and accordingly, such plan has been considered by the Company in
substance to be a defined contribution plan.
Employee State Insurance: The Company makes prescribed monthly contributions towards Employees State
Insurance Scheme.
Superannuation Scheme: The Company contributes towards a fund established to provide superannuation benefit to
certain employees in terms of Group Superannuation Policies entered into by such fund with the Life Insurance Corporation
of India.
National Pension Scheme: The Company makes contributions to the National Pension Scheme fund in respect of certain
employees of the Company.
(b) The expense recognised during the period towards defined contribution plans are as follows:
Year ended
31-Mar-18
Year ended
31-Mar-17
Employers’ Contribution to Employees’ Provident Fund 1068.97 969.89
Administration and other expenses relating to above 26.56 29.10
Employers’ Contribution to Employees' State Insurance Scheme 16.01 8.85
Employers’ Contribution to Superannuation Scheme 114.75 116.95
Employers’ Contribution to National Pension Scheme 20.80 14.41
(ii) Defined benefit plans
(a) The Company operates a defined benefit retirement plan under which the Company pays certain defined benefit by
way of gratuity to its employees. The Gratuity Plan provides a lump sum payment to vested employees at retirement/
termination of employment or death of an employee, based on the respective employees’ salary and years of employment
with the Company.

P. 159
Annual Report 2017-18
02-17 | Co
rpo
rate Overview
24-101 | Statuto
ry Rep
orts
18-23 | Man
agem
ent Statem
ents
102-266 | Finan
cial Statemen
ts
Notes to the Standalone Financial Statementsfor the year ended March 31, 2018
(All amounts in ` lakhs, unless otherwise stated)
(b) Risk exposure
The plan typically exposes the Company to number of actuarial risks, the most significant of which are detailed below:
Investment risk: The plan liabilities are calculated using a discount rate set with references to government bond yields
as at end of reporting period; if plan assets under perform compared to the government bonds discount rate, this will
create or increase a deficit. The investments in plan assets are made in accordance with pattern of investment prescribed
by central government and ensures that the funds are invested in a balanced mix of investments comprising central
government securities, state government securities, other debt instruments as well as equity instruments. Most of the
plan investments is in fixed income securities with high grades and in government securities. The Company has a risk
management strategy which defines exposure limits and acceptable credit risk rating.
Interest risk: A decrease in government bond yields will increase plan liabilities, although this is expected to be partially
offset by an increase in the value of the plan’s debt instruments.
Life expectancy: The present value of the defined benefit plan liability is calculated by reference to the best estimate of
the mortality of plan participants during their employment. A change in the life expectancy of the plan participants will
impact the plan’s liability.
Salary risk: The present value of the defined benefit plan liability is calculated by reference to the future salaries of plan
participants. As such, an increase in the salary of the plan participants will increase the plan’s liability.
Attrition rate: The present value of the defined benefit plan liability is impacted by the rate of employee turnover,
disability and early retirement of plan participants. A change in the attrition rate of the plan participants will impact the
plan’s liability.
(c) The significant actuarial assumptions used for the purposes of the actuarial valuations were as follows:
Valuation as at
31-Mar-18 31-Mar-17
Discounting rate 7.69% 6.81%
Future salary growth rate 8.00% 7.00%
Mortality Table * IALM 2006-2008 Ultimate IALM 2006-2008 Ultimate
Attrition rate 6.00% for Permanent employees
2.00% for Seasonal employees
8.00% for Permanent employees
3.00% for Seasonal employees
Method used Projected unit credit method Projected unit credit method
* Assumptions regarding future mortality are set based on actuarial advice in accordance with published statistics (i.e. IALM 2006-08
Ultimate). These assumptions translate into an average life expectancy in years at retirement age.

P. 160
Notes to the Standalone Financial Statementsfor the year ended March 31, 2018
(All amounts in ` lakhs, unless otherwise stated)
(d) Amounts recognised in statement of profit & loss in respect of the defined benefit plan are as follows:
Year ended
31-Mar-18
Year ended
31-Mar-17
Current service cost 333.64 275.90
Net interest expense 220.47 145.06
Components of defined benefit costs recognised in profit or loss 554.11 420.96
Remeasurement on the net defined benefit liability
- Return on plan assets (excluding amount included in net interest expense) (43.30) (31.06)
- Actuarial gains and loss arising form changes in financial assumptions 36.60 482.43
- Actuarial gains and loss arising form experience adjustments (179.43) 234.68
Components of defined benefit costs recognised in other comprehensive
income
(186.13) 686.05
Total 367.98 1107.01
The current service cost and the net interest expense for the year are included in the ‘Employee benefits expense’
line item in the statement of profit & loss. The remeasurement of the net defined benefit liability is included in other
comprehensive income.
(e) Amounts included in the balance sheet arising from the entity’s obligation in respect of the defined benefit plan is as follows:
As at
31-Mar-18
As at
31-Mar-17
Present value of defined benefit obligation as at the end of the year 4734.30 4558.14
Fair value of plan assets 1452.20 1308.30
Funded status (3282.10) (3249.84)
Net asset/(liability) arising from defined benefit obligation recognised in the
balance sheet
(3282.10) (3249.84)
(f) Movement in the present value of the defined benefit obligation is as follows:
Year ended
31-Mar-18
Year ended
31-Mar-17
Present value of defined benefit obligation at the beginning of the year 4558.14 3632.88
Expenses recognised in profit or loss
- Current Service Cost 333.64 275.90
- Interest Expense (Income) 321.08 226.50
Remeasurement (gains)/losses recognised in other comprehensive income
- Actuarial (gain)/loss arising from:
i. Financial Assumptions 36.60 482.43
ii. Experience Adjustments (179.43) 234.68
Benefit payments (335.73) (294.25)
Present value of defined benefit obligation at the end of the year 4734.30 4558.14

P. 161
Annual Report 2017-18
02-17 | Co
rpo
rate Overview
24-101 | Statuto
ry Rep
orts
18-23 | Man
agem
ent Statem
ents
102-266 | Finan
cial Statemen
ts
Notes to the Standalone Financial Statementsfor the year ended March 31, 2018
(All amounts in ` lakhs, unless otherwise stated)
(g) Movement in the fair value of the plan assets is as follows:
Year ended
31-Mar-18
Year ended
31-Mar-17
Fair value of plan assets at the beginning of the year 1308.30 1195.80
Recognised in profit or loss
- Expected return on plan assets 100.61 81.44
Remeasurement gains / (losses) recognised in other comprehensive income
- Actual Return on plan assets in excess of the expected return 43.29 31.06
Contributions by employer 335.73 294.25
Benefit payments (335.73) (294.25)
Fair value of plan assets at the end of the year 1452.20 1308.30
The fair value of the plan assets at the end of the reporting period for each category, are as follows:
As at 31-Mar-18 As at 31-Mar-17
Quoted Unquoted Total Quoted Unquoted Total
Cash and cash equivalents - 12.45 12.45 - 17.83 17.83
Debt instruments
- Government securities - 264.26 264.26 - 257.53 257.53
- State development loans - 452.07 452.07 - 340.95 340.95
- Private sector bonds - 123.24 123.24 - 104.45 104.45
- Public sector bonds - 112.33 112.33 - 138.53 138.53
- Fixed deposits with banks - 166.00 166.00 - 155.50 155.50
- Special Deposit Scheme balance
with RBI
- 102.13 102.13 - 102.13 102.13
- Debt mutual funds - 64.95 64.95 - 60.92 60.92
Equity instruments
- Index mutual funds - 10.06 10.06 - 2.43 2.43
- Arbitrage mutual funds - 12.58 12.58 - 8.93 8.93
Accrued interest and other
recoverables
- 132.13 132.13 - 119.10 119.10
Total plan assets - 1452.20 1452.20 - 1308.30 1308.30
The investible funds of the Gratuity Plan are invested in accordance with the investment pattern and norms prescribed
by the Ministry of Finance, Government of India. The investment pattern mandates that the investible funds are invested
across the permitted investments in the prescribed pattern, whereby the investment risk is spread across various
categories of investment comprising sovereign government securities, state development loans monitored by the Reserve
Bank of India, investment grade rated debt securities issued by private and public sector companies, fixed-deposit with
banks fulfilling the prescribed norms, units of debt and equity mutual funds. The investments made are generally on held-
to-maturity basis. It is the endeavour of the Company to mitigate risk by investing only in high-quality debt securities and
in mutual funds after undertaking due diligence.
There has been no change in the process used by the Company to manage its risks from prior periods.

P. 162
Notes to the Standalone Financial Statementsfor the year ended March 31, 2018
(All amounts in ` lakhs, unless otherwise stated)
(h) Sensitivity analysis
The sensitivity of the defined benefit obligation to changes in the weighted principal assumptions is:
Change in
assumption
by
Impact on defined benefit obligatio
Increase/
decrease
Increase in assumption Decrease in assumption
31-Mar-18 31-Mar-17 31-Mar-18 31-Mar-17
Discounting rate 0.50% in ` (177.37) (262.01) 190.36 266.30
in % -3.75% -5.75% 4.02% 5.84%
Future salary growth rate 0.50% in ` 187.87 246.57 (176.71) (241.86)
in % 3.97% 5.41% -3.73% -5.31%
Attrition rate 0.50% in ` (46.12) (44.17) 48.81 46.74
in % -0.97% -0.97% 1.03% 1.03%
Mortality rate 10.00% in ` (39.85) (38.17) 42.54 40.74
in % -0.84% -0.84% 0.90% 0.89%
The above sensitivity analysis are based on a change in an assumption while holding all other assumptions constant. In
practise, this is unlikely to occur, and changes in some of the assumptions may be correlated. The methods and types of
assumptions used in preparing the sensitivity analysis did not change compared to prior period.
(i) Defined benefit liability and employer contributions
The Company remains committed to fund all gratuity payments falling due and shall strive to gradually reduce the
deficit in funding of its obligation in the coming years.
The Company expects to contribute ` 245.07 lakhs to the defined benefit plan relating to gratuity during the next
financial year.
The weighted average duration of the defined gratuity obligation as at 31 March 2018 is 9.2 years (31 March 2017:
9.5 years).
The expected maturity analysis of undiscounted defined benefit obligation as at 31 March 2018 is as follows:
Less than a
year
Between
1-2 years
Between
3-5 years
Over
5 years
Total
Defined benefit obligation (Gratuity) 245.07 405.43 1460.65 8219.59 10330.74

P. 163
Annual Report 2017-18
02-17 | Co
rpo
rate Overview
24-101 | Statuto
ry Rep
orts
18-23 | Man
agem
ent Statem
ents
102-266 | Finan
cial Statemen
ts
Notes to the Standalone Financial Statementsfor the year ended March 31, 2018
(All amounts in ` lakhs, unless otherwise stated)
NOTE 39: RELATED PARTY TRANSACTIONS
(i) Related parties where control exists
Subsidiaries
- Wholly owned
Triveni Energy Systems Limited
Triveni Engineering Limited
Triveni Entertainment Limited
Svastida Projects Limited
Triveni Industries Limited
- Others
Triveni Sugar Limited
(ii) Related parties with whom transactions have taken place during the year alongwith details of such transactions and
outstanding balances as at the end of the year:
Name of related party and nature of transactions RelationshipYear ended
31-Mar-18
Year ended
31-Mar-17
Sales and rendering services
Triveni Sugar Limited Subsidiary 0.70 0.69
Svastida Projects Limited Subsidiary 0.70 0.69
Triveni Entertainment Limited Subsidiary 0.70 0.69
Triveni Energy Systems Limited Subsidiary 0.70 0.69
Triveni Engineering Limited Subsidiary 0.70 0.69
Triveni Industries Limited Subsidiary 0.70 0.75
Triveni Turbine Limited Associate 4304.01 3229.45
Purchases and receiving services
Triveni Turbine Limited Associate 382.52 1079.72
Tirath Ram Shah Charitable Trust Enterprise over which key
managerial personnel
have substantial interest/
significant influence
0.47 0.99
Advance paid against order
Triveni Turbine Limited Associate 35.00 -
Rent paid
Dhruv M. Sawhney (Chairman & Managing Director) Key managerial personnel 48.76 45.50
Rati Sawhney Relative of key managerial
personnel
34.60 48.00
Kameni Upaskar Limited Enterprise over which key
managerial personnel
have substantial interest/
significant influence
76.69 72.88

P. 164
Notes to the Standalone Financial Statementsfor the year ended March 31, 2018
(All amounts in ` lakhs, unless otherwise stated)
Name of related party and nature of transactions RelationshipYear ended
31-Mar-18
Year ended
31-Mar-17
Rent & other charges received
Triveni Turbine Limited Associate 20.40 16.00
Dividend received from Investment in Equity shares
Triveni Turbine Limited Associate 864.00 324.00
Dividend paid on Equity shares
Dhruv M. Sawhney (Chairman & Managing Director) Key managerial personnel 95.98 -
Tarun Sawhney (Vice Chairman & Managing
Director)
Key managerial personnel 36.74 -
Nikhil Sawhney (Promoter Non-Executive Director) Key managerial personnel 38.19 -
Suresh Taneja (Group Chief Financial Officer) Key managerial personnel 0.04 -
Shekhar Dutta (Independent Non-Executive Director) Key managerial personnel 0.03 -
Manmohan Sawhney HUF Relative of key managerial
personnel
11.28 -
Rati Sawhney Relative of key managerial
personnel
50.90 -
Tarana Sawhney Relative of key managerial
personnel
0.06 -
Mira Hazari Relative of key managerial
personnel
- -
Subhadra Trade & Finance Limited Enterprise over which key
managerial personnel
have substantial interest/
significant influence
206.74 -
Expenses incurred by the Company on behalf of
party (net of expenses incurred by party on behalf of
the Company) on reimbursable basis
Triveni Turbine Limited Associate (18.76) (2.77)
Kameni Upaskar Limited Enterprise over which key
managerial personnel
have substantial interest/
significant influence
2.22 2.28
Triveni Engineering Works Limited Gratuity Fund Post employment
benefit plan
- 0.06
Triveni Engineering and Industries Ltd. Officers’
Pension Fund
Post employment
benefit plan
- 0.01
Triveni Engineering Works Limited Employees’
Provident Fund
Post employment
benefit plan
- -
Upper India Sugar Mills Employees’ Provident Fund Post employment
benefit plan
0.03 0.05
Remuneration
Tarun Sawhney (Vice Chairman & Managing Director) Key managerial personnel 239.73 203.82
Suresh Taneja (Group Chief Financial Officer) Key managerial personnel 192.39 178.22
Geeta Bhalla (Group Vice President & Company
Secretary)
Key managerial personnel 68.61 60.54

P. 165
Annual Report 2017-18
02-17 | Co
rpo
rate Overview
24-101 | Statuto
ry Rep
orts
18-23 | Man
agem
ent Statem
ents
102-266 | Finan
cial Statemen
ts
Notes to the Standalone Financial Statementsfor the year ended March 31, 2018
(All amounts in ` lakhs, unless otherwise stated)
Name of related party and nature of transactions RelationshipYear ended
31-Mar-18
Year ended
31-Mar-17
Directors fee paid
Nikhil Sawhney (Promoter Non-Executive Director) Key managerial personnel 3.70 5.20
Lt. Gen (Retd.) Kanwal Kishan Hazari (Independent
Non-Executive Director)
Key managerial personnel 5.50 8.45
M. K. Daga (Independent Non-Executive Director) Key managerial personnel - 2.25
Fakir Chand Kohli
(Independent Non-Executive Director)
Key managerial personnel 1.25 2.25
Shekhar Dutta (Independent Non-Executive Director) Key managerial personnel 6.00 6.50
Homai A. Daruwalla
(Independent Non-Executive Director)
Key managerial personnel 6.00 6.25
Dr. Santosh Pande
(Independent Non-Executive Director)
Key managerial personnel 4.00 3.75
Sudipto Sarkar
(Independent Non-Executive Director)
Key managerial personnel 4.00 2.25
Contribution to Post employment benefit plans
Triveni Engineering Works Limited Gratuity Fund Post employment
benefit plan
335.73 294.25
Triveni Engineering and Industries Ltd. Officers’
Pension Fund
Post employment
benefit plan
114.75 115.69
Upper India Sugar Mills Employees’ Provident Fund Post employment
benefit plan
1033.20 907.61
Deposit received against appointment of Director
Subhadra Trade & Finance Limited Enterprise over which key
managerial personnel
have substantial interest/
significant influence
- 3.00
Investment in shares
Triveni Engineering Limited Subsidiary 60.00 -
Triveni Energy Systems Ltd Subsidiary 180.00 -
Triveni Entertainment Limited Subsidiary 130.00 -
Svastida Projects Limited Subsidiary 10.00 -
Outstanding balances
RelationshipYear ended
31-Mar-18
Year ended
31-Mar-17
Receivable
Triveni Entertainment Limited Subsidiary - 183.23
Triveni Energy Systems Limited Subsidiary - 169.15
Triveni Engineering Limited Subsidiary - 249.57
Triveni Industries Limited Subsidiary - -
Triveni Turbine Limited Associate 1082.03 460.32
Provision for doubtful debts/advances
Triveni Engineering Limited Subsidiary - 13.76

P. 166
Notes to the Standalone Financial Statementsfor the year ended March 31, 2018
(All amounts in ` lakhs, unless otherwise stated)
RelationshipYear ended
31-Mar-18
Year ended
31-Mar-17
Payable
Svastida Projects Limited Subsidiary - 200.00
Triveni Turbine Limited Associate 1310.51 1878.15
Dhruv M. Sawhney (Chairman & Managing Director) Key managerial personnel 4.92 5.25
Tarun Sawhney (Vice Chairman & Managing Director) Key managerial personnel 3.65 3.05
Suresh Taneja (Group Chief Financial Officer) Key managerial personnel 0.61 8.39
Geeta Bhalla (Group Vice President &
Company Secretary)
Key managerial personnel 0.15 3.45
Subhadra Trade & Finance Limited Enterprise over which key
managerial personnel
have substantial interest/
significant influence
- 2.00
Tirath Ram Shah Charitable Trust Enterprise over which key
managerial personnel
have substantial interest/
significant influence
- 0.30
Triveni Engineering and Industries Ltd. Officers’
Pension Fund
Post employment
benefit plan
113.29 115.69
Upper India Sugar Mills Employees’ Provident Fund Post employment
benefit plan
90.32 82.75
Guarantees / Surety /commitment outstanding
(refer note 46(b))
Triveni Turbine Limited Associate - 1450.51
(iii) Remuneration of key managerial personnel:
Name of related party and nature of transactionsYear ended
31-Mar-18
Year ended
31-Mar-17
Short-term employee benefits 460.69 402.46
Post-employment benefits 40.05 40.12
Total 500.74 442.58
The remuneration of key managerial personnel is determined by the remuneration committee having regard to the performance
of individuals, market trends and applicable provisions of Companies Act, 2013.
(iv) Remuneration and oustanding balances of KMP does not include long term employee benefits by way of gratuity and
compensated absences, which are currently not payable and are provided on the basis of actuarial valuation by the Company.
(v) Terms & conditions:
The sales to and purchases from related parties, including rendering/availment of service, are made on terms equivalent to
those that prevail in arm’s length transactions. The outstanding balances at the year-end are unsecured and interest free and
settlement occurs in cash. There have been no guarantees provided to or received for any related party receivable or payables.
The Company has not recorded any impairment of receivables relating to amounts owed by related parties for the year ended
31 March 2018 and 31 March 2017 other than that stated above.

P. 167
Annual Report 2017-18
02-17 | Co
rpo
rate Overview
24-101 | Statuto
ry Rep
orts
18-23 | Man
agem
ent Statem
ents
102-266 | Finan
cial Statemen
ts
Notes to the Standalone Financial Statementsfor the year ended March 31, 2018
(All amounts in ` lakhs, unless otherwise stated)
NOTE 40: CAPITAL MANAGEMENT
For the purpose of capital management, capital includes net debt and total equity of the Company. The primary objective of the
capital management is to maximize shareholder value along with an objective to keep the leverage in check in view of cyclical capital
intensive sugar business of the Company.
One of the major businesses of the Company is the sugar business, which is a seasonal industry, where the entire production is
made in about five months and then sold throughout the year. Thus, it necessitates keeping high sugar inventory levels requiring high
working capital funding. Sugar business being a cyclical business, it is prudent to avoid high leverage and the resultant high finance
cost. It is the endeavour of the company to prune down debts to acceptable levels based on its financial position.
The Company may resort to further issue of capital when the funds are required to make the company stronger financially or to
invest in projects meeting the ROI expectations of the Company.
The Company monitors capital structure through gearing ratio represented by debt-equity ratio (debt/total equity). The gearing ratios
for the Company as at the end of reporting period were as follows:
As at
31-Mar-18
As at
31-Mar-17
Non-current borrowings (note 16) 3495.28 27536.23
Current borrowings (note 20) 107647.23 124209.92
Current maturities of long-term borrowings (note 17) 12831.59 20367.06
Total debt 123974.10 172113.21
Less: Cash and cash equivalents (note 12(a)) (338.70) (651.45)
Net debt 123635.40 171461.76
Total equity (note 14 & note 15) 88086.57 77766.67
Net debt to equity ratio 1.40 2.20
Long term debt equity ratio 0.19 0.62
In addition to the above gearing ratio, the Company also looks at operating profit to total debt ratio (EBITDA/Total Debts) which gives an
indication of adequacy of earnings to service the debts. The Company carefully negotiates the terms and conditions of the loans and
ensures adherence to all the financial covenants. With a view to arrive at the desired capital structure based on the financial condition
of the Company, the Company normally incorporates a clause in loan agreements for prepayment of loans without any premium.
Further, no changes were made in the objectives, policies or process for managing capital during the years ended 31 March 2018 and
31 March 2017.
The Company is not subject to any externally imposed capital requirements.
NOTE 41: FINANCIAL RISK MANAGEMENT
The Company’s principal financial liabilities comprise loans and borrowings, trade payables and other payables. The main purpose
of the financial liabilities is to finance the Company’s operations. The Company’s principal financial assets include loans, trade
and other receivables and cash and bank balances that derive directly from its operations. The Company also holds investments
measured at fair value through profit or loss and enters into derivative transactions, which are not extensive.
The Company’s activities expose it mainly to market risk, liquidity risk and credit risk. The monitoring and management of such
risks is undertaken by the senior management of the Company and there are appropriate policies and procedures in place through
which such financial risks are identified, measured and managed in accordance with the Company’s policies and risk objectives. The
Company has specialised teams to undertake derivative activities for risk management purposes and such team has appropriate
skills, experience and expertise. It is the Company policy not to carry out any trading in derivative for speculative purposes. The
Audit Committee and the Board are regularly apprised of these risks every quarter and each such risk and mitigation measures are
extensively discussed.

P. 168
Notes to the Standalone Financial Statementsfor the year ended March 31, 2018
(All amounts in ` lakhs, unless otherwise stated)
(i) Credit risk
Credit risk arises when a counterparty defaults on its contractual obligations to pay, resulting in financial loss to the Company.
The Company is exposed to credit risks from its operating activities, primarily trade receivables. The credit risks in respect of
deposits with the banks, foreign exchange transactions and other financial instruments are nominal.
(a) Credit risk management
The customer credit risk is managed by each business subject to the Company’s established policy, procedure and controls
relating to customer credit risk management. Various businesses require different processes and policies to be followed
based on the business risks, industry practice and customer profiles.
In the case of Sugar business, majority of the sales are made either against advance payments or on very short credit period
upto 7-10 days to reputed customers whereas in Cogeneration and Distillery, most of the sales are made to Government
customers, such as, State Electricity Board (UPPCL) and Oil Marketing Companies (OMCs). There may be delays, generally
not exceeding one year, in receiving payments from UPPCL but the risk in respect of realisation of dues is minimal. In Gear
business, it is the policy of the Company to receive payment prior to delivery of the material except in the case of some well
established OEMs, including group companies and public sector undertakings, where the credit up to 90 days is extended.
Water business is engaged in EPC business with municipal and industrial sector where it is customary to have prescribed
retentions which are payable upon completion of the project and after satisfactory performance of the plant.
In order to contain the business risk, creditworthiness of the customer is ensured through scrutiny of its financials, status
of financial closure of the project, if required, market reports and reference checks. The Company remains vigilant and
regularly assesses the financial position of customers during execution of contracts with a view to restrict risks of delays
and default. In view of its diversified business profile and considering the size of the Company, credit risks from receivables
are well contained on an overall basis.
The impairment analysis is performed on each reporting period on individual basis for major customers. In addition, a
large number of receivables are grouped and assessed for impairment collectively. The calculation of impairment loss
is based on historical data of losses, current conditions and forecasts and future economic conditions. The Company’s
maximum exposure to credit risk at the reporting date is the carrying amount of each financial asset as detailed in note 6,
7, 8 and 9.
The business wise receivable position as at the end of the year is provided here below:
As at
31-Mar-18
As at
31-Mar-17
Sugar business 4551.36 4797.61
Cogeneration business 4427.14 5882.47
Distillery business 2060.60 1185.22
Water business 13858.94 10480.02
Gear business 4837.04 3412.10
Others 1455.31 2034.08
Total Receivables (note 7) 31190.39 27791.50
Receivables individually in excess of 10% of the business receivables 16665.33 14809.41
Percentage of above receivables to the total receivables of the Company 53.43% 53.29%
Receivables in excess of 10% of individual business receivables majorly comprises receivables from UPPCL which forms
16.85% of total receivables of the Company as on 31 March 2018 and 26 % as on 31 March 2017. It can be observed that the
concentration of risk in respect of trade receivables is moderate on an overall basis. Further, its customers are located in
several jurisdictions and industries and operate in largely independent markets. The Company does not hold any collateral
as security for such receivables.

P. 169
Annual Report 2017-18
02-17 | Co
rpo
rate Overview
24-101 | Statuto
ry Rep
orts
18-23 | Man
agem
ent Statem
ents
102-266 | Finan
cial Statemen
ts
Notes to the Standalone Financial Statementsfor the year ended March 31, 2018
(All amounts in ` lakhs, unless otherwise stated)
(b) Provision for expected credit losses
Basis as explained above, life time expected credit loss (“ECL”) is determined on trade receivables except in cases where
advance payment terms are prescribed or payment is due from Central / State Government or Government Authorities /
entities where there is no track record of short receipts. ECL arising from delays in receiving payments from the Government
customers pursuant to sale of goods or under construction contracts are not considered if such delays are commonly
prevalent in the industry and / or the delays are not exceeding one year. All other short receipts other than arising from
expense claims are duly considered in determining ECL. In view of the business model of the Company, engineered-to-order
products and the profile of trade receivables, the determination of provision based on age analysis may not be a realistic
and hence, the provision of expected credit loss is determined for the total trade receivables outstanding as on the reporting
date. This provision for ECL is made in addition to the specific credit losses, if any, provided on specific financial assets.
Provision matrix (%, amounts) of ECL for trade receivables, other than specific credit losses separately recognised is
as under:
Business % ECLECL amount
as at 31-Mar-18
ECL amount
as at 31-Mar-17
Sugar Nil Nil Nil
Co-generation Nil Nil Nil
Distillery Nil Nil Nil
Water 0.83% 115.99 98.55
Gear 1.17% 57.91 35.91
(c) Reconciliation of loss allowance provision
Trade receivables:
Year ended
31-Mar-18
Year ended
31-Mar-17
Balance at beginning of the year 2668.69 4205.73
Provision for credit loss allowance made during the year 377.16 786.97
Provision reversed/utilised during the year (1265.04) (2324.01)
Balance at the end of the year 1780.81 2668.69
Loans and other financial assets:
Loans Other financial assets
Year ended
31-Mar-18
Year ended
31-Mar-17
Year ended
31-Mar-18
Year ended
31-Mar-17
Balance at beginning of the year 44.53 44.53 31.70 74.01
Movement in expected credit loss allowance - - (15.65) (42.31)
Balance at the end of the year 44.53 44.53 16.05 31.70
(ii) Liquidity risk
The Company uses liquidity forecast tools to manage its liquidity. The Company operates capital intensive sugar business
and has obligation to timely make cane price payments within the statutory time period. The Company is able to organise
liquidity through own funds and through working capital loans. The company has good relationship with its lenders and has
not defaulted at any point of time in the past, as a result of which it does not experience any difficulty in arranging funds from
its lenders. However, when the sugar fundamentals are unfavourable, either due to market forces or due to excessive cane
pricing by the Government, the payment of cane price gets delayed. However, it is the endeavour of the Company to make cane
payment on a priority basis. It is the objective and focus of the Company to reduce debts to be able to meet the cyclicalities of
the sugar business.

P. 170
Notes to the Standalone Financial Statementsfor the year ended March 31, 2018
(All amounts in ` lakhs, unless otherwise stated)
Apart from cyclical sugar business, the Company has alternate revenue streams in the form of cogeneration, distillery and
engineering business, which, to a large extent, offset the impact of sugar cyclicalities.
Table hereunder provides the current ratios of the Company as at the year end
As at
31-Mar-18
As at
31-Mar-17
Total current assets 198793.37 209927.16
Total current liabilities 196802.17 193399.30
Current ratio 1.01 1.09
In view of seasonal nature of sugar business, which is a dominant business of the Company, there is a peak build-up of sugar
inventories at the year end, resulting in peak working capital requirement. With the liquidation of such inventories over the year,
the working capital requirement is gradually reduced. Thus, the current ratio computed at the year end is not a reflection of
average and realistic ratio for the year.
(a) Maturities of financial instruments
Maturities of non-derivative financial liabilities:
The following tables detail the remaining contractual maturity for its non-derivative financial liabilities with agreed
repayment periods. The amount disclosed in the tables have been drawn up based on the undiscounted cash flows of
financial liabilities. The contractual maturity is based on the earliest date on which the Company may be required to pay.
on demand < 1 year 1-3 years 3-5 years > 5 years Total Carrying
amount
As at 31 March 2018
Borrowings 105557.23 15174.86 3453.08 32.73 0.92 124218.82 123974.10
Trade payables - 62422.14 383.43 - - 62805.57 62805.57
Other financial liabilities - 3590.10 - - - 3590.10 3590.10
105557.23 81187.10 3836.51 32.73 0.92 190614.49 190369.77
As at 31 March 2017
Borrowings 122543.89 22674.11 26137.76 1845.75 6.13 173207.64 172113.21
Trade payables - 24844.14 814.08 - - 25658.22 25658.22
Other financial liabilities - 4293.88 30.62 - - 4324.50 4324.50
122543.89 51812.13 26982.46 1845.75 6.13 203190.36 202095.93
Maturities of derivative financial instruments:
The Company enters into derivative contracts (viz. foreign exchange forward contracts, foreign currency swaps and interest
rate swaps) to manage some of its foreign currency exposures and interest rate exposures that are settled on a net basis.
Derivative asset (net) are of ` 87.86 lakhs as at 31 March 2018. All derivative assets/ liabilities shall mature within one
year from the reporting date except derivative liability `0.96 lakhs , in respect of foreign currency swap & interest rate
swap taken to hedge foreign currency borrowing, which shall be settled alongwith payment of such borrowing in six equal
quarterly instalments ending on July 2019 (31 March 2017 : derivative liability (net) ` 84.88 lakhs shall mature within one
year from reporting date).
(iii) Market risk
The Company is exposed to following key market risks:
(a) Interest rate risk on loans and borrowings
(b) Sugar price risk
(c) Other market risks

P. 171
Annual Report 2017-18
02-17 | Co
rpo
rate Overview
24-101 | Statuto
ry Rep
orts
18-23 | Man
agem
ent Statem
ents
102-266 | Finan
cial Statemen
ts
Notes to the Standalone Financial Statementsfor the year ended March 31, 2018
(All amounts in ` lakhs, unless otherwise stated)
(a) Interest rate risk
Most of the borrowings availed by the Company are subject to interest on floating rate basis linked to the Base Rate or
MCLR (marginal cost of funds based lending rate) or LIBOR. In view of the fact that the total borrowings of the Company
are quite substantial, the Company is exposed to interest rate risk.
The above strategy of the Company to opt for floating interest rates is helpful in maintaining market related realistic rates.
Further, most of the loans and borrowings have a prepayment clause through which the loans could be prepaid without
any prepayment premium. The said clause helps the Company to arrange debt substitution to bring down the interest
costs or to prepay the loans out of the surplus funds held.
While declining interest rates would be beneficial to the Company, adverse interest rate fluctuations could increase the
finance cost. The total impact, in respect of borrowings on floating interest rate basis, is limited as per sensitivity analysis
provided here under:
Year ended
31-Mar-18
Year ended
31-Mar-17
Total debt as at the end of the year 123974.10 172113.21
Debt at floating rate of interest as at the end of the year 116276.02 164300.25
Average annual utilisation of debts at floating rate of interest (%) 73% 71%
Average availment of borrowings at floating rate of interest 85179.94 115920.14
Impact of 1% interest rate variation 851.80 1159.20
The above sensitivity has been computed after excluding the impact of change in interest rates of the floating interest rate
foreign currency borrowing of USD 53,76,344.09 @ 6 months LIBOR plus 1.95% (as at 31 March 2018 @ 4.1955% p.a.)
since same has been hedged through interest rate swap @ fixed interest rate 8.5% p.a.
(b) Sugar price risk
In the Sugar business being carried out by the Company, sugar is produced during the season commencing from October/
November till March/April. Sugar so produced during the season of around 130 to 150 days, is sold throughout the year.
The sugar inventories are at the highest level as at the end of the financial year and these are normally stated at cost or
net realizable value, whichever is lower.
The Company is exposed to sugar price risk in respect of the inventories held at the year-end as any decline in prices
below the carrying amount will inflict losses to the Company. There are no effective hedging mechanisms available in view
of limited breadth in the commodity exchange market and hence the Company follows a strategy of selling sugar based
upon market forecasts and holding cost of inventories, subject to minimum floor limits.
Sensitivity analysis in respect of sugar price risk is provided here below:
Year ended
31-Mar-18
Year ended
31-Mar-17
Sugar inventory held (MT) 5,31,098.85 4,58,199.00
Impact of sugar price variation by ` 1000/MT 5,310.99 4,581.99
(c) Other market risks
The other market risks includes Equity price risk and Foreign currency risk.
Equity price risk in respect of listed and non listed equity securities which are susceptible to market price risk arising from
uncertainties about future value of the investment securities. In view of nominal value of investments being held by the
Company, other than in the subsidiaries and associates which are measured at cost, the magnitude of risk is only nominal.

P. 172
Notes to the Standalone Financial Statementsfor the year ended March 31, 2018
(All amounts in ` lakhs, unless otherwise stated)
The Company is exposed to foreign currency risk mainly on account of foreign currency borrowings, foreign exchange
trades being minimal. The foreign currency borrowing is for a period of more than a year and the Company is exposed to
foreign exchange fluctuation risks during this period. As per policy, the foreign currency borrowings are hedged through
foreign exchange forward contracts / foreign currency swap contracts to capture the interest arbitrage over domestic
interest rates.
Foreign currency risk exposure
The Company’s exposure to foreign currency risk at the end of the reporting period are as follows:
US$ EURO GBP
As at 31 March 2018
Financial assets
- Trade receivables in foreign currency lakhs 3.80 2.53 -
in equivalent ` lakhs 244.35 199.29 -
Derivatives (in respect of underlying financial
assets)
- - -
Net exposure to foreign currency risk (assets) in foreign currency lakhs 3.80 2.53 -
in equivalent ` lakhs 244.35 199.29 -
Financial liabilities
- Trade payables in foreign currency lakhs 1.32 0.77 0.55
in equivalent ` lakhs 86.53 62.21 50.89
- Borrowings (including interest) in foreign currency lakhs 203.68 - -
in equivalent ` lakhs 13402.02 - -
Derivatives (in respect of underlying financial
liabilities)
- Foreign exchange forward contracts/Swaps in foreign currency lakhs 203.47 - -
buy foreign currency in equivalent ` lakhs 13388.40 - -
Net exposure to foreign currency risk (liabilities) in foreign currency lakhs 1.53 0.77 0.55
in equivalent ` lakhs 100.15 62.21 50.89
US$ EURO GBP
As at 31 March 2017
Financial assets
- Trade receivables in foreign currency lakhs 3.00 1.23 -
in equivalent ` lakhs 192.36 83.58 -
Derivatives (in respect of underlying financial
assets)
- Foreign exchange forward contracts in foreign currency lakhs 1.24 - -
sell foreign currency in equivalent ` lakhs 79.48 - -
Net exposure to foreign currency risk (assets) in foreign currency lakhs 1.76 1.23 -
in equivalent ` lakhs 112.88 83.58 -
Financial liabilities
- Trade payables in foreign currency lakhs 1.07 0.69 0.02
in equivalent ` lakhs 69.96 48.92 1.50
- Borrowings (including interest) in foreign currency lakhs 25.54 - -
in equivalent ` lakhs 1,675.69 - -
Derivatives (in respect of underlying
financial liabilities)
- Foreign exchange forward contracts in foreign currency lakhs 25.40 0.28 0.02
buy foreign currency in equivalent ` lakhs 1,666.03 19.44 1.50
Net exposure to foreign currency risk (liabilities) in foreign currency lakhs 1.21 0.41 -
in equivalent ` lakhs 79.62 29.48 -

P. 173
Annual Report 2017-18
02-17 | Co
rpo
rate Overview
24-101 | Statuto
ry Rep
orts
18-23 | Man
agem
ent Statem
ents
102-266 | Finan
cial Statemen
ts
Notes to the Standalone Financial Statementsfor the year ended March 31, 2018
(All amounts in ` lakhs, unless otherwise stated)
The Company’s foreign currency derivatives outstanding (including for firm commitments) at the end of the reporting
period are as follows:
US$ EURO GBP
As at 31 March 2018
Foreign exchange forward contracts to sell
foreign currency
in foreign currency lakhs 2.00 1.35 -
in equivalent ` lakhs 128.48 106.34 -
Foreign exchange forward contracts/Swaps to
buy foreign currency
in foreign currency lakhs 205.18 3.80 -
in equivalent ` lakhs 13500.83 308.71 -
As at 31 March 2017
Foreign exchange forward contracts to sell
foreign currency
in foreign currency lakhs 1.24 - -
in equivalent ` lakhs 79.48 - -
Foreign exchange forward contracts to buy
foreign currency
in foreign currency lakhs 11.72 1.02 1.24
in equivalent ` lakhs 768.96 72.34 101.84
All the above contracts are maturing within one year except for foreign currency swap, taken to hedge foreign
currency borrowing, which shall be settled alongwith payment of such borrowing in six equal quarterly instalments
ending on July 2019.
Sensitivity
The following table demonstrate the sensitivity of net unhedged foreign currency exposures relating to financial
instruments to reasonably possible changes in foreign currency exchange rates, with all other variables held constant.
Change in
FC exchange
rate by
Impact on profit or loss and equity (in ` lakhs)
Increase in FC exchange rates Decrease in FC exchange rates
31-Mar-18 31-Mar-17 31-Mar-18 31-Mar-17
US$ sensitivity 5% 7.21 1.66 (7.21) (1.66)
EURO sensitivity 5% 6.85 2.71 (6.85) (2.71)
GBP sensitivity 5% (2.54) - 2.54 -
Further, the change in foreign currency rates will impact the fair value of the derivatives and correspondingly impact the
profit or loss, but there will not be any impact over the hedge period as the derivatives will enable capturing the hedged
rates and the budgeted profitability would remain unchanged.
Further, the impact of change in foreign currency rates (assuming forward premium to remain unchanged) on the fair
valuation of derivatives (excluding derivatives which have hedged the foreign currency denominated receivables and
payables) as at the end of the year, is demonstrated in the table below. However, apart from the impact on the profit or loss
due to fair value changes of the derivatives, the derivatives will help the Company in capturing the hedged rates including
forward premium and the budgeted profitability will remain unaffected.
Change in
FC exchange
rate by
Impact on profit or loss and equity (in ` lakhs)
Increase in FC exchange rates Decrease in FC exchange rates
31-Mar-18 31-Mar-17 31-Mar-18 31-Mar-17
US$ sensitivity 0.05 (0.80) (44.85) 0.80 44.85
EURO sensitivity 0.05 10.12 2.65 (10.12) (2.65)
GBP sensitivity 0.05 - 5.02 - (5.02)
There is no impact on other components of equity since the Company has not elected to apply hedge accounting.

P. 174
Notes to the Standalone Financial Statementsfor the year ended March 31, 2018
(All amounts in ` lakhs, unless otherwise stated)
NOTE 42: FAIR VALUE MEASUREMENTS
(i) Financial instruments by category
As at 31-Mar-18 As at 31-Mar-17
FVTPL * Amortised cost FVTPL * Amortised cost
Financial assets
Investments
- Equity instruments 366.44 - 342.45 -
- Bonds 89.04 - 145.75 -
- National Saving Certificates - 0.03 - 0.03
Trade receivables - 31190.39 - 27791.50
Loans - 56.53 - 45.81
Cash and bank balances - 919.95 - 1243.30
Security deposits - 497.02 - 444.79
Earnest money deposits - 163.32 - 152.05
Derivative financial assets 91.82 - - -
Other receivables - 97.17 - 683.00
Total financial assets 547.30 32924.41 488.20 30360.48
Financial liabilities
Borrowings - 123974.10 - 172113.21
Trade payables - 62805.57 - 25658.22
Capital creditors - 744.60 - 699.24
Security deposits - 374.35 - 357.35
Derivative financial liabilities 3.96 - 84.88 -
Other payables - 2471.15 - 3267.91
Total financial liabilities 3.96 190369.77 84.88 202095.93
*Mandatorily required to be measured at FVTPL. There is no financial instrument which is designated as FVTPL.
(ii) Fair value hierarchy
This section explains the judgements and estimates made in determining the fair values of the financial instruments that
are recognised and measured at fair value. To provide an indication about the reliability of the inputs used in determining fair
value, the Company has classified its financial instruments into the three levels prescribed under the accounting standard. An
explanation of each level follows underneath the table.
Financial assets and liabilities measured at fair value - recurring fair value measurements
Note No. Level 1 Level 2 Level 3 Total
As at 31 March 2018
Financial assets
- Investments in equity instruments at FVTPL
(Quoted)
6 366.44 - - 366.44
- Investments in bonds at FVTPL 6 - 89.04 - 89.04
- Foreign-exchange forward contracts/
Currency swaps/Interest rate swaps at FVTPL
9 - 91.82 - 91.82
366.44 180.86 - 547.30

P. 175
Annual Report 2017-18
02-17 | Co
rpo
rate Overview
24-101 | Statuto
ry Rep
orts
18-23 | Man
agem
ent Statem
ents
102-266 | Finan
cial Statemen
ts
Notes to the Standalone Financial Statementsfor the year ended March 31, 2018
(All amounts in ` lakhs, unless otherwise stated)
Note No. Level 1 Level 2 Level 3 Total
Financial liabilities
- Foreign-exchange forward contracts/
Currency swaps/Interest rate swaps at FVTPL
17 - 3.96 - 3.96
- 3.96 - 3.96
As at 31 March 2017
Financial assets
- Investments in equity instruments at FVTPL
(Quoted)
6 342.45 - - 342.45
- Investments in bonds at FVTPL 6 - 145.75 - 145.75
342.45 145.75 - 488.20
Financial liabilities
- Foreign-exchange forward contracts/
Currency swaps/Interest rate swaps at FVTPL
17 - 84.88 - 84.88
- 84.88 - 84.88
Level 1: Level 1 hierarchy includes financial instruments measured using quoted unadjusted market prices in active markets
for identical assets or liabilities. This includes listed equity instruments that have quoted price. The fair value of all equity
instruments which are traded in the stock exchanges is valued using the closing price as at the reporting date.
Level 2: The fair value of financial instruments that are not traded in an active market is determined using valuation techniques
which maximise the use of observable market data and rely as little as possible on entity-specific estimates. If all significant
inputs required to fair value an instrument are observable, the instrument is included in level 2.
Level 3: If one or more of the significant inputs is not based on observable market data, the instrument is included in level 3.
There are no transfers between levels 1 and 2 during the year.
(iii) Valuation technique used to determine fair value
Specific valuation techniques used to value financial instruments include:
- the fair value of derivatives (viz. foreign exchange forward contracts, foreign currency swaps and interest rate swaps)
is determined using market observable inputs, including prevalent forward rates for the maturities of the respective
contracts and interest rate curves as indicated by banks and third parties.
- the fair value of bonds, determined using observable market data of yield to maturity and coupon rates of securities.
All of the resulting fair value estimates are included in level 2.
(iv) Valuation processes
The Corporate finance team has requisite knowledge and skills in valuation of financial instruments. The team headed by Group
CFO directly reports to the audit committee on the fair value of financial instruments.
(v) Fair value of financial assets and liabilities that are not measured at fair value (but fair value disclosures are required)
Except as detailed in the following table, the management considers that the carrying amounts of financial assets and financial
liabilities recognised in the financial statements approximate their fair values

P. 176
Notes to the Standalone Financial Statementsfor the year ended March 31, 2018
(All amounts in ` lakhs, unless otherwise stated)
As at 31-Mar-18 As at 31-Mar-17
Carrying amount Fair value Carrying amount Fair value
Financial assets
Trade receivables 31190.39 30495.00 27791.50 27495.92
31190.39 30495.00 27791.50 27495.92
Financial liabilities
Trade payables 62805.57 62753.23 25658.22 25540.91
62805.57 62753.23 25658.22 25540.91
Fair value hierarchy
Level 1 Level 2 Level 3 Total
As at 31 March 2018
Financial assets
Trade receivables - - 30495.00 30495.00
- - 30495.00 30495.00
Financial liabilities
Trade payables - - 62753.23 62753.23
62753.23 62753.23
As at 31 March 2017
Financial assets
Trade receivables - - 27495.92 27495.92
- - 27495.92 27495.92
Financial liabilities
Trade payables - - 25540.91 25540.91
- - 25540.91 25540.91
(a) The fair values for trade receivables and trade payables which are expected to be settled after twelve months (including
those which are within the operating cycle) are computed based on discounted cash flows. They are classified as level 3
fair values in the fair value hierarchy due to the inclusion of unobservable inputs including counterparty credit risk. The
carrying amounts of the remaining trade receivables and trade payables are considered to be the same as their fair values,
due to their short-term nature.
NOTE 43: GOVERNMENT GRANTS
(i) Government grants recognised in the standalone financial statements
Grants recognised in profit or loss Grant recoverable
Year ended
31-Mar-18
Year ended
31-Mar-17
Treatment
in financial
statements
As at
31-Mar-18
As at
31-Mar-17
A Deferred government grants
a) Interest subvention @ 12% per annum
on loans aggregating to `12626.00
lakhs availed during financial year
2012-13 under the "Scheme of
Extending Financial Assistance to
Sugar Undertakings, 2013” notified by
the Government of India.
683.45 1075.07 Reduced
from finance
cost (note 30)
- -

P. 177
Annual Report 2017-18
02-17 | Co
rpo
rate Overview
24-101 | Statuto
ry Rep
orts
18-23 | Man
agem
ent Statem
ents
102-266 | Finan
cial Statemen
ts
Notes to the Standalone Financial Statementsfor the year ended March 31, 2018
(All amounts in ` lakhs, unless otherwise stated)
Grants recognised in profit or loss Grant recoverable
Year ended
31-Mar-18
Year ended
31-Mar-17
Treatment
in financial
statements
As at
31-Mar-18
As at
31-Mar-17
b) Loans at below market interest rate
from Sugar Development Fund,
Government of India
27.88 45.14 Reduced
from finance
cost (note 30)
- -
c) Interest subvention @10% per
annum granted by the Government
of India for one year from the date of
disbursement on loans aggregating to
` 11450.50 lakhs availed in financial
year 2015-16 under the ‘Scheme of
extending Soft Loans to Sugar Mills’.
- 552.81 Reduced
from finance
cost (note 30)
- -
d) Grant of ` 10.00 lakhs in respect of
Moist Hot Air Treatment Plants (MHAT)
received from the State Government of
Uttar Pradesh under Rashtriya Krishi
Vikas Yojna during current year.
0.99 - Presented
under "Other
income"
(note 25)
- -
e) Grant of ` 141.45 lakhs in the form of
duties saved upon import of machinery
under Export Promotion Capital Goods
(EPCG) scheme during current year.
- - Presented
under "Other
income"
(note 25)
- -
Total deferred government grants 712.32 1673.02 - -
B Other revenue grants
a) Reversal of grant, related to cane
production subsidy of ` 4.50 per
quintal of cane pertaining to season
2015-16, (net of grant of ` 39.80 lakhs
accrued during the year) necessitated
due to different computation adopted
by the Government.
- (44.18) Other
expenses
(note 33)
- -
b) Reversal of grant, related to
reimbursement of cane commission
on cane purchased for season 2015-
16, based on the final decision of the
state government of UP on cane price
package for Season 2015-16
- (1330.73) Raw material
consumed
(note 26)
- -
c) Export incentives under Duty Draw
back Scheme, Incremental Export
Incentive Scheme and Merchandise
Export Incentive Scheme
78.03 23.49 Presented
under "Other
operating
revenue"
(note 24)
- -
Total other revenue grants 78.03 (1351.42) - -
Total grants 790.35 321.60 - -

P. 178
Notes to the Standalone Financial Statementsfor the year ended March 31, 2018
(All amounts in ` lakhs, unless otherwise stated)
(ii) Government grants in the form of remissions of taxes and duties availed and recognised in the standalone financial
statements:
Year ended
31-Mar-18
Year ended
31-Mar-17
a) Remission of Purchase tax @ ` 2 per quintal on purchase of cane
- for the sugar season 2015-16. - 17.21
- for the sugar season 2012-13. - 137.70
- 154.91
b) Remissions availed as per the interim order of the High Court in respect of UP
Sugar Industry Promotion Policy, 2004 [see note 43 (i) (a) & (b) above)
- 526.87
(iii) Movement of deferred government grants is provided here below:
Year ended
31-Mar-18
Year ended
31-Mar-17
As at the beginning of the year 962.20 8090.94
Recognised during the year 151.45 -
Released to the standalone statement of profit and loss (712.32) (1673.02)
Written back [see note below] - (5455.72)
As at the end of the year 401.33 962.20
Current (refer note 19) 252.20 711.36
Non-current (refer note 19) 149.13 250.84
Total 401.33 962.20
Note :
* The Company had availed the remissions in respect of certain taxes and duties under UP Sugar Industry Promotion Policy, 2004 (“the Policy”)
issued by the state Government of Uttar Pradesh. The Policy was pre-maturely terminated on 4 June 2007 and the Company challanged such
termination and non-grant of prescribed incentives under the Policy before the Lucknow bench of Allahabad High Court. Pending final adjudication
in the matter, the High Court vide its interim order dated 9 May 2008 permitted limited protection of remissions which were being enjoyed on the
date when the Policy was revoked. Apart from these remissions, the Company was also eligible for reimbursement of certain expenses and a
capital subsidy equivalent to 10% of the amount of investment made in establishment and expansion of sugar and allied industry.
As the prescribed incentive period of 10 years under the Policy had expired and it was taking considerable time for final adjudication of the
matter in the courts, the Company had written-off `14002.46 lakh during FY 2016-17 appearing as recoverable from the state Government
of UP on account of aforesaid reimbursement of expenses and capital subsidy earlier accounted by it under the Policy. Accordingly, deferred
government grant of ` 5455.72 lakhs as on 31 March 2016, pertaining to the capital subsidy, was also written back. Consequently, there was a
net impact of ` 8546.74 lakhs which had been classified under exceptional items in FY 2016-17.
NOTE 44: LEASES
(i) Obligations under finance leases
The Company has acquired certain lands under lease, classified as finance leases. Original lease term in respect of one of the land is ninety
years whereas another land is on perpetual lease basis. The Company had paid one time payment of lease charges in respect of these leases
and there are no further future lease maintenance payments under the lease agreement. There is no contingent rent or restriction imposed in
the lease agreement.
(ii) Operating lease arrangements
As Lessee
The Company has taken various residential, office and godown premises under operating lease. These are generally not non-
cancellable leases (except for few premises) having unexpired period upto eight years. The leases are renewable by mutual
consent and on mutually agreeable terms. The Company has given refundable interest free security deposits under certain
lease agreements. There is no contingent rent, sublease payments or restriction imposed in the lease agreement.

P. 179
Annual Report 2017-18
02-17 | Co
rpo
rate Overview
24-101 | Statuto
ry Rep
orts
18-23 | Man
agem
ent Statem
ents
102-266 | Finan
cial Statemen
ts
Notes to the Standalone Financial Statementsfor the year ended March 31, 2018
(All amounts in ` lakhs, unless otherwise stated)
Payments recognised as expense
Year ended
31-Mar-18
Year ended
31-Mar-17
Lease payments (refer note 33) 589.77 593.40
589.77 593.40
Non-cancellable operating lease commitments
As at
31-Mar-18
As at
31-Mar-17
Not later than one year 259.55 259.55
Later than one year and not later than five years 21.63 281.18
Later than five years -
281.18 540.73
As Lessor
The Company has given certain portion of its office / factory premises under operating leases (including lease for investment
properties (refer note 4)). These leases are not non-cancellable and are extendable by mutual consent and at mutually agreeable
terms. The gross carrying amount, accumulated depreciation and depreciation recognised in the statement of profit and loss
in respect of such portion of the leased premises are not separately identifiable. There is no impairment loss in respect of such
premises. No contingent rent has been recognised in the standalone statement of profit and loss. There are no minimum future
lease payments as there are no non-cancellable leases. Lease income is recognised in the statement of profit and loss under
“Other income” (refer note 25). Rental income earned by the Company from its investment properties and direct operating
expenses arising on the investment properties for the year is set out in note 4.
NOTE 45: COMMITMENTS
As at
31-Mar-18
As at
31-Mar-17
(i) Estimated amount of contracts remaining to be executed on capital account and not
provided for (after adjusting advances aggregating to ` 28.27 lakhs (31 March 2017:
` 3.70 lakhs))
50.30 256.51
(ii) For commitments relating to non-cancellable operating leases, refer Note 44
NOTE 46: CONTINGENT LIABILITIES AND CONTINGENT ASSETS
Contingent liabilities
As at
31-Mar-18
As at
31-Mar-17
(a) Claims against the Company not acknowledged as debts:
(i) Claims which are being contested by the Company and in respect of which the
Company has paid amounts aggregating to ` 414.94 lakhs (31 March 2017: ` 474.41
lakhs), excluding interest, under protest pending final adjudication of the cases:
1732.64 2068.50
Sl.
No. Particulars
Amount of contingent liability Amount paid
31-Mar-18 31-Mar-17 31-Mar-18 31-Mar-17
1 Sales tax 245.59 321.68 86.38 106.63
2 Excise duty 773.95 1034.80 294.55 334.34
3 GST 0.57 - 0.57 -
4 Others 712.53 712.02 33.44 33.44

P. 180
As at
31-Mar-18
As at
31-Mar-17
(ii) The Company is contingently liable in respect of short provision against disputed
income tax liabilities (excluding determination of final interest payable thereon) of
` 3169.86 lakhs (31 March 2017: ` 3798.73 lakhs) against which ` 2844.62 lakhs
(31 March 2017: ` 2739.06 lakhs) stands paid. The disputed income tax liability
mainly arises on the issue of taxability of unrealised incentives, majority of which
have been held to be non-taxable in the first appeal filed by the Company.
3169.86 3798.73
(iii) Statutory levies against which remission has been availed under U.P. Sugar
Industry Promotion Policy 2004 issued by the state government of Uttar Pradesh
(refer note 43)
4158.38 4158.38
(iv) Liability arising from claims / counter claims/ Interest in arbitration/ court cases,
claims of certain employees/ex-employees and in respect of service tax, if any, on
certain activities of the Company which are being contested by the Company.
Indeterminate Indeterminate
The amount shown above represent the best possible estimates arrived at on
the basis of available information. The uncertainties, possible payments and
reimbursements are dependent on the outcome of the different legal processes
which have been invoked by the Company or the claimants, as the case may be,
and therefore cannot be predicted accurately. The Company engages reputed
professional advisors to protect its interests and has been advised that it has
strong legal position against such disputes.
(b) Guarantees/sureties excluding financial guarantees
Guarantees/surety given on behalf of companies ` Nil (31 March 2017: ` 1490.51
lakhs), including a corporate guarantee of ` Nil (31 March 2017: ` 1450.51 lakhs)
equivalent to GBP Nil (31 March 2017: GBP 17.62 lakhs) given on behalf of an associate
company as a surety for due performance of its obligations under a contract awarded
by an overseas customer and in respect of which, the associate company has fully
indemnified the Company against any claims, damages or expenses, including legal
costs. The guarantees have been given in the normal course of operations of these
companies and are not expected to result in any loss to the Company on the basis of
such companies fulfilling their ordinary commercial obligations.
- 1490.51
Contingent assets
Based on management analysis, there are no material contingent assets as at 31 March 2018 (31 March 2017: ` Nil).
NOTE 47: DISCLOSURES REQUIRED UNDER SECTION 22 OF THE MICRO, SMALL AND MEDIUM ENTERPRISES
DEVELOPMENT ACT, 2006
Based on the intimation received by the Company from its suppliers regarding their status under the Micro, Small and Medium
Enterprises Development Act, 2006, the relevant information is provided here below:
31-Mar-18 31-Mar-17
The principal amount and the interest due thereon remaining unpaid to any supplier at
the end of each accounting year; as at the end of the year
(i) Principal amount 43.42 37.35
(ii) Interest due on above - -
The amount of interest paid by the buyer in terms of section 16 of Micro, Small and
Medium Enterprises Development Act, 2006, along with the amount of the payment made
to the supplier beyond the appointed day during each accounting year.
- -
Notes to the Standalone Financial Statementsfor the year ended March 31, 2018
(All amounts in ` lakhs, unless otherwise stated)

P. 181
Annual Report 2017-18
02-17 | Co
rpo
rate Overview
24-101 | Statuto
ry Rep
orts
18-23 | Man
agem
ent Statem
ents
102-266 | Finan
cial Statemen
ts
Notes to the Standalone Financial Statementsfor the year ended March 31, 2018
(All amounts in ` lakhs, unless otherwise stated)
31-Mar-18 31-Mar-17
The amount of interest due and payable for the year on delay in making payment (which
have been paid but beyond the appointed day during the year) but without adding the
interest specified under the Micro, Small and Medium Enterprises Development Act, 2006
- -
The amount of interest accrued and remaining unpaid at the end of each accounting year;
and
- -
The amount of further interest remaining due and payable even in the succeeding years,
until such date when the interest dues above are actually paid to the small enterprise, for
the purpose of disallowance of a deductible expenditure under section 23 of the Micro,
Small and Medium Enterprises Development Act, 2006
- -
NOTE 48: DISCLOSURE AS PER REGULATION 34(3) OF THE LISTING AGREEMENTS WITH THE STOCK EXCHANGES
Financial year Outstanding
balance
Maximum amount
due during the year
Loans & advances to subsidiaries (see note (i) below)
- Triveni Engineering Limited 31-Mar-18 - 13.76
31-Mar-17 13.76 13.76
Loans & advances to associates 31-Mar-18 - -
31-Mar-17 - -
Loans & advances to firms/companies in which directors are interested 31-Mar-18 - -
31-Mar-17 - -
Investment by the loanee in the shares of Triveni Engineering & Industries
Ltd. and its subsidiaries
31-Mar-18 - -
31-Mar-17 - -
(i) Represents amount incurred/ advanced by the Company to support initial expenses of the Subsidiary, repayable on demand.
NOTE 49: DISCLOSURE FOR CERTIFIED EMISSION REDUCTIONS AND RENEWABLE ENERGY CERTIFICATES
(i) In accordance with the Guidance Note on Accounting for self-generated Certified Emission Reductions (CERs), issued by the
Institute of Chartered Accountants of India, the Company has recognised the CERs held by it as inventories in its financial
statements. Disclosures as required under the Guidance Note are as under:
(a) 86,562 (31 March 2017: 86,562) CERs (net of fee for UNFCCC adaptation fund) have been held as inventory by the Company
as at the end of the year.
(b) There are no CERs under certification as on the date of the financial statements;
(c) The Company’s Deoband and Khatauli Phase-I projects are registered as Clean Development Mechanism (CDM) projects
with United Nations Framework Convention on Climate Change (UNFCCC) and it is not feasible to identify specific items
of machinery/equipment as an “emission reduction equipment”. Accordingly, details of depreciation and operation &
maintenance costs, pertaining to emission reducing equipment have not been provided.
(ii) During the year, the National Load Despatch Centre (NLDC) has issued 8,420 (31 March 2017: 58,525) Renewable Energy
Certificates (RECs) to the Company under the Central Electricity Regulatory Commission Regulation on RECs. At the close of the
year Nil (31 March 2017: 1,22,728) RECs remained unsold and are held as inventories in the financial statements.

P. 182
Notes to the Standalone Financial Statementsfor the year ended March 31, 2018
(All amounts in ` lakhs, unless otherwise stated)
NOTE 50: STANDARDS ISSUED BUT NOT YET EFFECTIVE
The Ministry of Corporate Affairs (MCA) vide notification dated 28 March 2018 has issued the Companies (Indian Accounting Standards)
Amendment Rules, 2018 which has come up with omission of Ind AS 11 Construction Contracts & Ind AS 18 Revenue with the
introduction of Ind AS 115 Revenue from Contracts with Customers and amendments in various other Ind ASs. These amendments
are effective for accounting periods beginning on or after 1 April 2018 and the Company intends to adopt these amendments when
they become effective. The new Ind AS that are issued, but not yet effective, upto the date of issuance of the Company’s standalone
financial statements are disclosed below:
Ind AS 115 Revenue from Contracts with Customers : Ind AS 115 establishes a five-step model to account for reveue arising from
contracts with customers. Under Ind AS 115 revenue is recognised when (or as) the entity satisfies a performance obligation by
transferring a promised good or service (i.e. an asset) to a customer (i.e. when (or as) the customer obtains control of that asset) at
an amount that reflects the consideration to which the entity expects to be entitled in exchange for transferring goods or services
to a customer. The new revenue standard will supersede all current revenue recognition requirements under Ind AS. Either a full
retrospective application or a modified retrospective application is required for accounting periods commencing on or after 1 April 2018.
The Company is in process of evaluating the requirements of the said standard and its impact on its standalone financial statements.
NOTE 51: COMPARATIVES
(i) Goods and Services Tax (“GST”) has been implemented with effect from July 1, 2017 and therefore, revenue from operations
for the period from July 1, 2017 to March 31, 2018 are net of GST. Revenue from operations and expenses for the year ended
March 31, 2017 being inclusive of excise duty are not comparable with corresponding figures for the year ended March 31, 2018.
(ii) The Company has reclassified certain items of financials of comparative year to confirm this year’s classification, however,
impact of these reclassification are not material.
NOTE 52: APPROVAL OF STANDALONE FINANCIAL STATEMENTS
The standalone financial statements were approved for issue by the Board of Directors on 24 May 2018 subject to approval of
shareholders.
As per our report of even date attached
For S S Kothari Mehta & Company For and on behalf of the Board of Directors of Triveni Engineering & Industries Limited
Chartered Accountants
Firm’s registration number : 000756N
Yogesh K. Gupta Dhruv M. Sawhney Homai A. Daruwalla
Partner Chairman & Managing Director Director & Chairperson Audit Committee
Membership No. 093214
Place : Noida (U.P.) Suresh Taneja Geeta Bhalla
Date : May 24, 2018 Group CFO Group Vice President & Company Secretary
P. 183
Annual Report 2017-18
102-266 | Finan
cial Statemen
ts24-101 | Statu
tory R
epo
rts02-17 | C
orp
orate O
verview18-23 | M
anag
emen
t Statemen
ts
Independent Auditor’s Report
To
The Members
Triveni Engineering & Industries Limited
REPORT ON THE CONSOLIDATED INDIAN ACCOUNTING
STANDARDS (IND AS) FINANCIAL STATEMENTS
We have audited the accompanying consolidated Ind
AS financial statements of TRIVENI ENGINEERING &
INDUSTRIES LIMITED (hereinafter referred to as “the Holding
Company”) and its subsidiaries (the Holding Company and
its subsidiaries together referred to as “the Group”) and its
associates, comprising of the Consolidated Balance Sheet as at
March 31, 2018, the Consolidated Statement of Profit and Loss
(including Other Comprehensive Income), the Consolidated
Statement of Cash Flows and Consolidated Statement of
Changes in Equity for the year then ended and a summary
of the significant accounting policies and other explanatory
information prepared based on the relevant records (hereinafter
referred to as “the consolidated Ind AS financial statements”).
MANAGEMENT’S RESPONSIBILITY FOR THE
CONSOLIDATED IND AS FINANCIAL STATEMENTS
The Holding Company’s Board of Directors is responsible for the
preparation of these consolidated Ind AS financial statements
in terms of the requirements of the Companies Act, 2013
(hereinafter referred to as “the Act”) that give a true and fair
view of the consolidated state of affairs (financial position),
consolidated profit or loss (financial performance including
other comprehensive income), consolidated cash flows and
consolidated statement of changes in equity of the Group
including its associates in accordance with the accounting
principles generally accepted in India, including the Indian
Accounting Standards prescribed under Section 133 of the
Act, read with relevant rules issued thereunder. The respective
Board of Directors of the companies included in the Group and
of its associates are responsible for maintenance of adequate
accounting records in accordance with the provisions of the Act
for safeguarding the assets of the Group and its associates and
for preventing and detecting frauds and other irregularities; the
selection and application of appropriate accounting policies;
making judgments and estimates that are reasonable and
prudent; and the design, implementation and maintenance
of adequate internal financial controls, that were operating
effectively for ensuring the accuracy and completeness of the
accounting records, relevant to the preparation and presentation
of the consolidated Ind AS financial statements that give a true
and fair view and are free from material misstatement, whether
due to fraud or error, which have been used for the purpose of
preparation of the consolidated Ind AS financial statements by
the Directors of the Holding Company, as aforesaid.
AUDITOR’S RESPONSIBILITY
Our responsibility is to express an opinion on these consolidated
Ind AS financial statements based on our audit. While conducting
the audit, we have taken into account the provisions of the Act,
the accounting and auditing standards and matters which are
required to be included in the audit report under the provisions
of the Act and the Rules made thereunder.
We conducted our audit in accordance with the Standards
on Auditing specified under Section 143(10) of the Act. Those
Standards require that we comply with ethical requirements
and plan and perform the audit to obtain reasonable assurance
about whether the consolidated Ind AS financial statements are
free from material misstatement.
An audit involves performing procedures to obtain audit
evidence about the amounts and the disclosures in the
consolidated Ind AS financial statements. The procedures
selected depend on the auditor’s judgment, including the
assessment of the risks of material misstatement of the
consolidated Ind AS financial statements, whether due to
fraud or error. In making those risk assessments, the auditor
considers internal financial control relevant to the Holding
Company’s preparation of the consolidated Ind AS financial
statements that give a true and fair view in order to design
audit procedures that are appropriate in the circumstances.
An audit also includes evaluating the appropriateness of
the accounting policies used and the reasonableness of the
accounting estimates made by the Holding Company’s Board of
Directors, as well as evaluating the overall presentation of the
consolidated Ind AS financial statements.
We believe that the audit evidence obtained by us, the audit
evidence obtained by the other auditors in terms of their reports
referred to in sub-paragraph (a) of the Other Matters paragraph
below other than unaudited financial statement as certified
by the management referred to in sub-paragraph (b) of the
Other Matters paragraph below, is sufficient and appropriate to
provide a basis for our audit opinion on the consolidated Ind AS
financial statements.
OPINION
In our opinion and to the best of our information and according
to the explanations given to us, the aforesaid consolidated Ind
AS financial statements give the information required by the

P. 184
Act in the manner so required and give a true and fair view in
conformity with the accounting principles generally accepted in
India including the Ind AS, of the consolidated state of affairs
(financial position) of the Group and its associates as at March
31, 2018, their consolidated profit (financial performance
including other comprehensive income), their consolidated cash
flows and consolidated statement of changes in the equity for
the year ended on that date.
OTHER MATTERS
(a) We did not audit the financial statements of six subsidiaries,
whose financial statement reflect total assets of Rs. 1423
Lakhs and total net assets of Rs. 1418 Lakhs as at March
31, 2018, total revenue of Rs. 4.54 Lakhs, net cash out
flow Rs. 22.16 Lakhs, total comprehensive income / (loss)
(comprising of profit and other comprehensive income) of
Rs. (-) 4.62 Lakhs, as considered in the consolidated Ind
AS financial statements. The Statement also includes the
Group’s share of net profit (before other comprehensive
income) of Rs. 1735.10 Lakhs and other comprehensive
income of Rs. 7.08 Lakhs for the year ended March 31,
2018, in respect of one associate. These Ind AS financial
statements have been audited by the other auditors whose
reports have been furnished to us by the Management
and our opinion on the consolidated Ind AS financial
statements, in so far as it relates to the amounts and
disclosures included in respect of aforesaid subsidiaries
and one associate and our report in terms of sub-sections
(3) and (11) of Section 143 of the Act , in so far as it relates
to the aforesaid subsidiaries and one associate, is based
solely on the report of other auditors.
(b) The consolidated Ind AS financial statements include the
group’s share of net profit (before other comprehensive
income) of Rs. 86.91 Lakhs and other comprehensive
income of Rs. (-) 8.23 Lakhs for the year ended March
31, 2018, in respect of one associate, whose financial
statements have not been audited by us. This financial
statements and other financial information is unaudited
and has been furnished to us by the management and our
opinion on the consolidated Ind AS financial statements,
in so far as it relates to the amounts and disclosures
included in respect of this associate is based solely on
the unaudited financial statements and other financial
information certified by the management.
(c) Our opinion on the consolidated Ind AS financial
statements, and our report on Other Legal and Regulatory
Requirements below, is not modified in respect of the
above matters with respect to our reliance on the work
done and the reports of the other auditors and financial
statements certified by the management.
(d) The consolidated Ind AS financial statements of the Company
for the year ended March 31, 2017, were audited by another
firm of chartered accountants under the Companies Act,
2013 who, vide their report dated May 20, 2017, expressed
an unmodified opinion on those financial statements. Our
opinion is not modified in respect of this matter.
REPORT ON OTHER LEGAL AND REGULATORY
REQUIREMENTS
As required by Section 143(3) of the Act, based on our audit and
on consideration of the report of the other auditors on financial
statements and the other financial information of subsidiaries
and one associate referred to in sub-paragraph (a) of the Other
Matters paragraph and unaudited financial statements as
certified by the management as referred to in sub-paragraph
(b) of the Other Matters paragraph, we report, to the extent
applicable, that:
(a) We have sought and obtained all the information and
explanations which to the best of our knowledge and
belief were necessary for the purposes of our audit of the
aforesaid consolidated Ind AS financial statements.
(b) In our opinion, proper books of account as required
by law has been maintained by the Holding Company,
its subsidiaries included in the Group and associate
companies, including relevant records relating to
preparation of the aforesaid consolidated Ind AS financial
statements, so far as it appears from our examination of
those books and records of the Holding Company, reports
of the other auditors and certificate received from the
management as referred in sub-paragraph (b) of the ‘Other
Matters’ paragraph.
(c) The Consolidated Balance Sheet, the Consolidated Statement
of Profit and Loss (including Other Comprehensive Income),
the Consolidated Statement of Cash Flows and Consolidated
Statement of Changes in Equity dealt with by this Report are
in agreement with the relevant books of account maintained
for the purpose of preparation of the consolidated Ind AS
financial statements.
(d) In our opinion, the aforesaid consolidated Ind AS financial
statements comply with the Accounting Standards
specified under Section 133 of the Act, read with relevant
rules issued thereunder.
(e) On the basis of the written representations received from
the directors of the Holding Company as on March 31, 2018
taken on record by the Board of Directors of the Holding
Company and the reports of the statutory auditors of its
subsidiary companies including its associate company

P. 185
Annual Report 2017-18
102-266 | Finan
cial Statemen
ts24-101 | Statu
tory R
epo
rts02-17 | C
orp
orate O
verview18-23 | M
anag
emen
t Statemen
ts
incorporated in India, none of the directors of the Group
Companies and its associate company incorporated in India
is disqualified as on March 31, 2018 from being appointed
as a Director of that company in terms of Section 164 (2)
of the Act.
(f) With respect to the adequacy of the internal financial
controls over financial reporting of the Holding Company,
its subsidiary companies and its associate company
incorporated in India and the operating effectiveness of
such controls, refer to our separate report in Annexure ‘A’.
(g) With respect to the other matters to be included in
the Auditor’s Report in accordance with Rule 11 of the
Companies (Audit and Auditor’s) Rules, 2014, in our opinion
and to the best of our information and according to the
explanations given to us and based on consideration of the
report of the other auditors on financial statements and
also the other financial information of subsidiaries and
its associate referred to in sub-paragraph (a) of the Other
Matters paragraph and unaudited financial statements as
certified by the management referred to in sub-paragraph
(b) of the Other Matters paragraph :
i. The consolidated Ind AS financial statements
disclose the impact of pending litigations on the
consolidated financial position of the Group and its
associates – Refer Note No 48 to the consolidated
Ind AS financial statements.
ii. The Group and its associates have made provision,
as required under the applicable law or accounting
standards, for material foreseeable losses, on
long-term contracts including long term derivative
contracts.
iii. There were no amounts which were required to be
transferred to the Investor Education and Protection
Fund by the Group and its associates.
iv. The reporting on the disclosure relating to Specified
Bank Notes is not applicable to the Group and its
associates for the year ended March 31, 2018.
For S. S. Kothari Mehta & Co.
Chartered Accountants
Firm Registration No. 000756N
Yogesh K. Gupta
Place: Noida Partner
Dated: May 24, 2018 Membership No. 093214

P. 186
REPORT ON THE INTERNAL FINANCIAL CONTROLS
UNDER CLAUSE (I) OF SUB-SECTION 3 OF SECTION
143 OF THE COMPANIES ACT, 2013 (“THE ACT”) AS
REFERRED TO IN PARAGRAPH (F) OF ‘REPORT ON
OTHER LEGAL AND REGULATORY REQUIREMENTS’
In conjunction with our audit of the consolidated Ind AS financial
statements of the Company as of and for the year ended March
31, 2018, we have audited the internal financial controls over
financial reporting of TRIVENI ENGINEERING & INDUSTRIES
LIMITED (hereinafter referred to as “the Holding Company”) and
its subsidiary companies and its associate company, which are
companies incorporated in India, as of that date.
MANAGEMENT’S RESPONSIBILITY FOR INTERNAL
FINANCIAL CONTROLS
The respective Board of Directors of the Holding Company,
its subsidiary companies and its associate company, which
are companies incorporated in India, are responsible for
establishing and maintaining internal financial controls
based on the internal control over financial reporting criteria
established by the Company considering the essential
components of internal control stated in the Guidance Note on
Audit of Internal Financial Controls Over Financial Reporting
issued by the Institute of Chartered Accountants of India (ICAI).
These responsibilities include the design, implementation
and maintenance of adequate internal financial controls
that were operating effectively for ensuring the orderly and
efficient conduct of its business, including adherence to the
respective company’s policies, the safeguarding of its assets,
the prevention and detection of frauds and errors, the accuracy
and completeness of the accounting records, and the timely
preparation of reliable financial information, as required under
the Companies Act, 2013.
AUDITOR’S RESPONSIBILITY
Our responsibility is to express an opinion on the Company’s
internal financial controls over financial reporting based on our
audit. We conducted our audit in accordance with the Guidance
Note on Audit of Internal Financial Controls Over Financial
Reporting (the “Guidance Note”) issued by the ICAI and the
Standards on Auditing prescribed under section 143(10) of the
Companies Act, 2013, to the extent applicable to an audit of
internal financial controls. Those Standards and the Guidance
Note require that we comply with ethical requirements and plan
and perform the audit to obtain reasonable assurance about
whether adequate internal financial controls over financial
reporting was established and maintained and if such controls
operated effectively in all material respects.
Our audit involves performing procedures to obtain audit evidence
about the adequacy of the internal financial controls system over
financial reporting and their operating effectiveness. Our audit
of internal financial controls over financial reporting included
obtaining an understanding of internal financial controls over
financial reporting, assessing the risk that a material weakness
exists, and testing and evaluating the design and operating
effectiveness of internal control based on the assessed risk. The
procedures selected depend on the auditor’s judgment, including
the assessment of the risks of material misstatement of the Ind
AS financial statements, whether due to fraud or error.
We believe that the audit evidence we have obtained and the
audit evidence obtained by the other auditors in terms of their
reports referred to in the Other Matters paragraph below,
is sufficient and appropriate to provide a basis for our audit
opinion on the Company’s internal financial controls system
over financial reporting.
MEANING OF INTERNAL FINANCIAL CONTROLS OVER
FINANCIAL REPORTING
A company’s internal financial control over financial reporting is
a process designed to provide reasonable assurance regarding
the reliability of financial reporting and the preparation of
financial statements for external purposes in accordance with
generally accepted accounting principles. A company’s internal
financial control over financial reporting includes those policies
and procedures that (1) pertain to the maintenance of records
that, in reasonable detail, accurately and fairly reflect the
transactions and dispositions of the assets of the company; (2)
provide reasonable assurance that transactions are recorded
as necessary to permit preparation of financial statements in
accordance with generally accepted accounting principles, and
that receipts and expenditures of the company are being made
only in accordance with authorizations of management and
directors of the company; and (3) provide reasonable assurance
regarding prevention or timely detection of unauthorized
acquisition, use, or disposition of the company’s assets that
could have a material effect on the financial statements.
INHERENT LIMITATIONS OF INTERNAL FINANCIAL
CONTROLS OVER FINANCIAL REPORTING
Because of the inherent limitations of internal financial controls
over financial reporting, including the possibility of collusion
Annexure A to the Independent Auditor’s Report of even date to the members of TRIVENI ENGINEERING & INDUSTRIES LIMITED (Holding Company) on its Consolidated Ind AS Financial Statements

P. 187
Annual Report 2017-18
102-266 | Finan
cial Statemen
ts24-101 | Statu
tory R
epo
rts02-17 | C
orp
orate O
verview18-23 | M
anag
emen
t Statemen
ts
or improper management override of controls, material
misstatements due to error or fraud may occur and not be
detected. Also, projections of any evaluation of the internal
financial controls over financial reporting to future periods
are subject to the risk that the internal financial control over
financial reporting may become inadequate because of changes
in conditions, or that the degree of compliance with the policies
or procedures may deteriorate.
OPINION
In our opinion, to the best of our information and according to
the explanations given to us and based on the consideration
of reports of other auditors, as referred to in Other Matters
paragraph, the Holding Company , its subsidiary companies
and its associate company which are companies incorporated
in India, have, in all material respects, an adequate internal
financial controls system over financial reporting and such
internal financial controls over financial reporting were operating
effectively as at March 31, 2018, based on the internal control
over financial reporting criteria established by the Company
considering the essential components of internal control stated
in the Guidance Note on Audit of Internal Financial Controls
Over Financial Reporting issued by the Institute of Chartered
Accountants of India.
OTHER MATTERS
Our aforesaid reports under Section 143(3) (i) of the Act on the
adequacy and operating effectiveness of the internal financial
controls over financial reporting in so far as it relates to the six
subsidiary companies and one associate company, which are
companies incorporated in India, is based on the corresponding
reports of the auditors of such companies incorporated in India.
Our opinion is not modified in respect of this matter.
For S. S. Kothari Mehta & Co.
Chartered Accountants
Firm Registration No. 000756N
Yogesh K. Gupta
Place: Noida Partner
Dated: May 24, 2018 Membership No. 093214

P. 188
Consolidated Balance Sheet as at March 31, 2018
(All amounts in ` lakhs, unless otherwise stated)
Note No.As at
31-Mar-18As at
31-Mar-17ASSETSNon-current assetsProperty plant and equipment 3 83466.00 84580.20 Capital work-in-progress 3 1004.75 211.33 Investment property 4 1170.12 1170.12 Intangible assets 5 35.84 82.32 Investments accounted for using the equity method 6 (a) 11170.81 10375.48 Financial assets i. Investments 6 (b) 455.51 488.23 ii. Trade receivables 7 50.32 81.98 iii. Loans 8 2.98 7.12 iv. Other financial assets 9 733.25 924.84 Income tax assets (net) 22 5735.12 2920.15 Other non-current assets 10 576.48 643.53 Total non-current assets 104401.18 101485.30 Current assetsInventories 11 157918.64 167481.68 Financial assets i. Trade receivables 7 31140.07 27709.52 ii. Cash and cash equivalents 12 (a) 366.51 657.10 iii. Bank balances other than cash and cash equivalents 12 (b) 274.66 84.73 iv. Loans 8 53.55 38.69 v. Other financial assets 9 424.38 324.34 Other current assets 10 8645.08 12980.06 Total current assets 198822.89 209276.12 Total assets 303224.07 310761.42 EQUITY AND LIABILITIESEquityEquity share capital 13 2579.47 2579.47 Other equity 14 92055.74 80958.90 Equity attributable to owners of the Company 94635.21 83538.37 Non-controlling interests 15 0.00 0.00Total equity 94635.21 83538.37 LIABILITIESNon-current liabilitiesFinancial liabilities i. Borrowings 16 3495.28 27536.23 ii. Other financial liabilities 17 0.10 30.62 Provisions 18 3969.48 3863.01 Deferred tax liabilities (net) 23 4171.76 2342.30 Other non-current liabilities 19 149.13 250.84 Total non-current liabilities 11785.75 34023.00 Current liabilitiesFinancial liabilities i. Borrowings 20 107647.23 124209.92 ii. Trade payables 21 62806.45 25658.94 iii. Other financial liabilities 17 16425.65 24745.82 Other current liabilities 19 7991.69 16988.19 Provisions 18 1932.09 1332.40 Income tax liabilities (net) 22 - 264.78 Total current liabilities 196803.11 193200.05 Total liabilities 208588.86 227223.05 Total equity and liabilities 303224.07 310761.42
The accompanying notes 1 to 53 form an integral part of these consolidated financial statements
As per our report of even date attached
For S S Kothari Mehta & Company For and on behalf of the Board of Directors of Triveni Engineering & Industries Limited Chartered AccountantsFirm’s registration number : 000756N
Yogesh K. Gupta Dhruv M. Sawhney Homai A. DaruwallaPartner Chairman & Managing Director Director & Chairperson Audit CommitteeMembership No. 093214
Place : Noida (U.P.) Suresh Taneja Geeta BhallaDate : May 24, 2018 Group CFO Group Vice President & Company Secretary

P. 189
Annual Report 2017-18
102-266 | Finan
cial Statemen
ts24-101 | Statu
tory R
epo
rts02-17 | C
orp
orate O
verview18-23 | M
anag
emen
t Statemen
ts
Consolidated Statement of Profit and Lossfor the year ended March 31, 2018
(All amounts in ` lakhs, unless otherwise stated)
Note No.Year ended 31-Mar-18
Year ended 31-Mar-17
Revenue from operations 24 341238.37 296686.61 Other income 25 1544.03 2713.70 Total income 342782.40 299400.31 ExpensesCost of materials consumed 26 258145.53 206446.07 Purchases of stock-in-trade 27 1674.24 1536.93 Changes in inventories of finished goods, stock-in-trade and work-in-progress 28 (866.12) (23950.82)Excise duty on sale of products 4167.99 14231.95 Employee benefits expense 29 20240.34 18771.48 Finance costs 30 8533.97 12655.44 Depreciation and amortisation expense 31 5536.55 5720.99 Impairment loss on financial assets (including reversals of impairment losses) 32 (282.65) 635.83 Other expenses 33 30570.87 26861.04 Total expenses 327720.72 262908.91 Profit before share of net profits of investments accounted for using equity method and tax 15061.68 36491.40 Share of net profit of associates accounted for using the equity method 44 1822.01 2267.76 Profit before exceptional items and tax 16883.69 38759.16 Exceptional items 34 - (8546.74)Profit before tax 16883.69 30212.42 Tax expense:- Current tax 35 3204.63 2336.57 - Deferred tax 35 1765.05 2579.73 Total tax expense 4969.68 4916.30 Profit for the year 11914.01 25296.12 Other comprehensive incomeA (i) Items that will not be reclassified to profit or loss - Remeasurements of the defined benefit plans 38 186.13 (686.05) - Share of other comprehensive income of associates accounted for using the
equity method 44 7.03 (28.43) 193.16 (714.48)
A (ii) Income tax relating to items that will not be reclassified to profit or loss 35 64.41 (237.43) 128.75 (477.05)
B (i) Items that may be reclassified to profit or loss - Share of other comprehensive income of associates accounted for using the
equity method (pertaining to exchange differences arising on translating the foreign operations) 44 (8.18) (2.84)
(8.18) (2.84)B (ii) Income tax relating to items that may be reclassified to profit or loss 35 - -
(8.18) (2.84)Other comprehensive income for the year, net of tax 120.57 (479.89)Total comprehensive income for the year 12034.58 24816.23 Profit/(loss) attributable to: Owners of the Company 11914.01 25296.12 Non-controlling interests (0.00) (0.00)
11914.01 25296.12 Other comprehensive income attributable to: Owners of the Company 120.57 (479.89) Non-controlling interests - -
120.57 (479.89)Total comprehensive income attributable to: Owners of the Company 12034.58 24816.23 Non-controlling interests (0.00) (0.00)
12034.58 24816.23 Earnings per equity share (face value ` 1 each)Basic 36 4.62 9.81 Diluted 36 4.62 9.81
The accompanying notes 1 to 53 form an integral part of these consolidated financial statements
As per our report of even date attached
For S S Kothari Mehta & Company For and on behalf of the Board of Directors of Triveni Engineering & Industries Limited Chartered AccountantsFirm’s registration number : 000756N
Yogesh K. Gupta Dhruv M. Sawhney Homai A. DaruwallaPartner Chairman & Managing Director Director & Chairperson Audit CommitteeMembership No. 093214
Place : Noida (U.P.) Suresh Taneja Geeta BhallaDate : May 24, 2018 Group CFO Group Vice President & Company Secretary

P. 190
Consolidated Statement of Changes in Equityfor the year ended March 31, 2018
(All amounts in ` lakhs, unless otherwise stated)
Th
e a
cco
mp
an
yin
g n
ote
s 1
to
53
fo
rm a
n in
teg
ral
pa
rt o
f th
ese
co
nso
lid
ate
d fi
na
nci
al
sta
tem
en
ts
As p
er
ou
r re
po
rt o
f e
ven
da
te a
tta
che
d
Fo
r S
S K
oth
ari
Me
hta
& C
om
pa
ny
F
or
an
d o
n b
eh
alf
of
the
Bo
ard
of
Dir
ec
tors
of
Tri
ve
ni
En
gin
ee
rin
g &
In
du
str
ies
Lim
ite
d
Ch
art
ere
d A
cco
un
tan
ts
Fir
m’s
re
gis
tra
tio
n n
um
be
r : 0
00
75
6N
Yo
ge
sh
K.
Gu
pta
D
hru
v M
. S
aw
hn
ey
H
om
ai
A.
Da
ruw
all
a
Pa
rtn
er
Ch
air
ma
n &
Ma
na
gin
g D
ire
cto
r D
ire
cto
r &
Ch
air
pe
rso
n A
ud
it C
om
mit
tee
Me
mb
ers
hip
No
. 09
32
14
Pla
ce :
No
ida
(U
.P.)
S
ure
sh
Ta
ne
ja
Ge
eta
Bh
all
a
Da
te :
Ma
y 2
4, 2
01
8
Gro
up
CF
O
Gro
up
Vic
e P
resid
en
t &
Co
mp
an
y S
ecr
eta
ry
A.
Eq
uit
y s
ha
re c
ap
ita
l
E
qu
ity
sh
are
s o
f `
1 e
ach
issu
ed
, su
bscr
ibe
d a
nd
fu
lly
pa
id u
p (
incl
ud
ing
fo
rfe
ite
d s
ha
res)
As a
t 3
1 M
arc
h 2
01
6 2
57
9.4
7
Ch
an
ge
s d
uri
ng
th
e y
ea
r -
A
s a
t 3
1 M
arc
h 2
01
7 2
57
9.4
7
Ch
an
ge
s d
uri
ng
th
e y
ea
r -
A
s a
t 3
1 M
arc
h 2
01
8 2
57
9.4
7
B.
Oth
er
eq
uit
y
Att
ribu
tabl
e to
ow
ners
of
the
Com
pany
Non
-
cont
roll
ing
inte
rest
s
Tota
l R
eser
ves
and
surp
lus
Item
s of
oth
er
com
preh
ensi
ve
inco
me
Tota
l oth
er
equi
tyC
apit
al
rede
mpt
ion
rese
rve
Cap
ital
rese
rve
Sec
urit
ies
prem
ium
Am
alga
mat
ion
rese
rve
Gen
eral
rese
rve
Mol
asse
s
stor
age
fund
rese
rve
Ret
aine
d
earn
ings
Fore
ign
curr
ency
tran
slat
ion
rese
rve
Ba
lan
ce a
s a
t 3
1 M
arc
h 2
01
6 4
58
.50
2
86
8.8
3
26
57
4.5
4
92
6.3
4
51
44
0.9
0
18
2.3
9
(2
62
97
.49
) (
24
.74
) 5
61
29
.27
0
.00
5
61
29
.27
Pro
fit/
(los
s) f
or t
he
year
-
-
-
-
-
-
252
96.1
2 -
2
5296
.12
(0.0
0) 2
5296
.12
Oth
er c
ompr
ehen
sive
inco
me,
net
of
inco
me
tax
-
-
-
-
-
-
(448
.62)
-
(448
.62)
-
(448
.62)
Sh
are
of o
ther
com
preh
ensi
ve in
com
e
of a
ssoc
iate
s -
-
-
-
-
-
(2
8.43
) (2
.84)
(31.
27)
-
(31.
27)
Tota
l co
mp
reh
en
sive
inco
me
fo
r th
e y
ea
r -
-
-
-
-
-
2
48
19
.07
(
2.8
4)
24
81
6.2
3
(0
.00
) 2
48
16
.23
Sh
are
of a
ssoc
iate
s -
-
1
3.40
-
-
-
-
-
1
3.40
-
1
3.40
Tran
sfer
red
to m
olas
ses
stor
age
fun
d re
serv
e -
-
-
-
-
2
0.03
(2
0.03
) -
-
-
-
Ba
lan
ce a
s a
t 3
1 M
arc
h 2
01
7 4
58
.50
2
86
8.8
3
26
58
7.9
4
92
6.3
4
51
44
0.9
0
20
2.4
2
(1
49
8.4
5)
(2
7.5
8)
80
95
8.9
0
0.0
0
80
95
8.9
0
Pro
fit/
(los
s) f
or t
he
year
-
-
-
-
-
-
119
14.0
1 -
1
1914
.01
(0.0
0) 1
1914
.01
Oth
er c
ompr
ehen
sive
inco
me,
net
of
inco
me
tax
-
-
-
-
-
-
121
.72
121
.72
-
121
.72
Sh
are
of o
ther
com
preh
ensi
ve in
com
e
of a
ssoc
iate
s -
-
-
-
-
-
7
.03
(8.1
8) (1
.15)
-
(1.1
5)
Tota
l co
mp
reh
en
sive
inco
me
fo
r th
e y
ea
r -
-
-
-
-
-
1
20
42
.76
(
8.1
8)
12
03
4.5
8
(0
.00
) 1
20
34
.58
Sh
are
of a
ssoc
iate
s -
(1
62.0
6) 0
.52
-
-
-
-
-
(161
.54)
-
(161
.54)
Tran
sfer
red
to m
olas
ses
stor
age
fun
d re
serv
e -
-
-
-
-
3
2.96
(3
2.96
) -
-
-
-
Wit
hdr
awal
fro
m m
olas
ses
stor
age
fun
d re
serv
e -
-
-
-
-
(3
9.10
) 3
9.10
-
-
-
-
Tra
nsa
ctio
ns
wit
h o
wn
ers
in t
he
ir c
ap
aci
ty a
s
own
ers
- D
ivid
ends
pai
d -
-
-
-
-
-
(6
44.9
1) -
(6
44.9
1) -
(6
44.9
1)
- D
ivid
end
dist
ribu
tion
tax
-
-
-
-
-
-
(131
.29)
-
(131
.29)
-
(131
.29)
Ba
lan
ce a
s a
t 3
1 M
arc
h 2
01
8 4
58
.50
2
70
6.7
7
26
58
8.4
6
92
6.3
4
51
44
0.9
0
19
6.2
8
97
74
.25
(
35
.76
) 9
20
55
.74
0
.00
9
20
55
.74

P. 191
Annual Report 2017-18
102-266 | Finan
cial Statemen
ts24-101 | Statu
tory R
epo
rts02-17 | C
orp
orate O
verview18-23 | M
anag
emen
t Statemen
ts
Year ended
31-Mar-18
Year ended
31-Mar-17
Cash flows from operating activities
Profit before tax 16883.69 30212.42
Adjustments for
Share of net profit of associate accounted for using the equity method (1822.01) (2267.76)
Depreciation and amortisation expense 5536.55 5720.99
Bad debts written off - trade receivables and other financial assets carried at amortised cost 607.12 2215.18
Impairment loss allowance on trade receivables and other financial assets (net of reversals) (889.77) (1579.35)
Bad debts written off - Non financial assets 83.00 1009.60
Impairment loss allowance on non financial assets (net of reversals) 20.95 (1927.94)
Provision for non moving / obsolete inventory 77.24 95.30
Loss on sale /write off of inventory 33.57 24.39
Net fair value (gains)/losses on investments (23.16) (97.44)
Mark-to-market losses / (gains) on derivatives (87.85) 84.88
Credit balances written back (156.99) (154.50)
Exceptional items - 8546.74
Unrealised losses / (gains) from changes in foreign exchange rates 12.99 (40.35)
Loss on sale / write off / impairment of property, plant and equipment 32.88 82.15
Net (profit)/loss on sale / redemption of investments (0.60) 0.65
Interest income (124.66) (659.56)
Dividend income (4.66) (2.94)
Finance costs 8533.97 12655.44
Working capital adjustments :
Change in inventories 9452.24 (26366.70)
Change in trade receivables (3110.85) (1651.49)
Change in other financial assets (70.23) 94.72
Change in other assets 4322.00 2447.01
Change in trade payables 37265.23 (18912.21)
Change in other financial liabilities (721.46) 1149.06
Change in other liabilities (8367.91) 3383.02
Change in provisions 892.27 188.80
Cash generated from operations 68373.55 14250.11
Income tax (paid)/ refund (6284.38) 213.98
Net cash inflow from operating activities 62089.17 14464.09
Cash flows from investing activities
Purchase of property, plant and equipment (5209.90) (4196.99)
Proceeds from sale of property, plant and equipment 29.16 110.12
Purchase of investments - (198.70)
Proceeds from sale of investments 60.00 50.08
Decrease / (increase) in deposits with banks (14.36) (43.42)
Interest received 178.06 67.97
Dividend received from associates 864.00 324.00
Other dividends received 4.66 2.94
Net cash outflow from investing activities (4088.38) (3884.00)
Consolidated Statement of Cash Flowsfor the year ended March 31, 2018
(All amounts in ` lakhs, unless otherwise stated)

P. 192
Consolidated Statement of Cash Flows (Contd.)for the year ended March 31, 2018
(All amounts in ` lakhs, unless otherwise stated)
Year ended
31-Mar-18
Year ended
31-Mar-17
Cash flows from financing activities
Proceeds from long term borrowings 159.64 9990.75
Repayment of long term borrowings (32447.39) (15534.34)
Increase / (decrease) in short term borrowings (16568.91) 8044.98
Interest paid (8657.00) (12616.43)
Dividend paid to Company's shareholders (644.91) -
Dividend distribution tax (131.29) -
Payment of unclaimed dividend (1.52) (4.27)
Redemption of unclaimed preference shares - (90.22)
Net cash outflow financing activities (58291.38) (10209.53)
Net increase / (decrease) in cash and cash equivalents (290.59) 370.56
Cash and cash equivalents at the beginning of the year (refer note 12 (a)) 657.10 286.54
Cash and cash equivalents at the end of the year (refer note 12 (a)) 366.51 657.10
Reconciliation of liabilities arising from financing activites:
Non-current borrowings
(including current maturities
and deferred grant related to
borrowings) Current
borrowings
Interest payable on
borrowings/ deposits
Unpaid dividends
Dividend paid to Company’s shareholders
(including DDT)
Balance as at 31 March, 2017 48865.49 124209.92 218.78 5.00 -
Cash flows (32287.75) (16568.91) (8657.00) (1.52) (776.20)
Foreign exchange movements - 6.22 0.35 - -
Finance costs accruals - - 8533.97 - -
Dividend distributions (including DDT) accruals - - - - 776.20
Balance as at 31 March 2018 16577.74 107647.23 96.10 3.48 -
The accompanying notes 1 to 53 form an integral part of these consolidated financial statements
As per our report of even date attached
For S S Kothari Mehta & Company For and on behalf of the Board of Directors of Triveni Engineering & Industries Limited
Chartered Accountants
Firm’s registration number : 000756N
Yogesh K. Gupta Dhruv M. Sawhney Homai A. Daruwalla
Partner Chairman & Managing Director Director & Chairperson Audit Committee
Membership No. 093214
Place : Noida (U.P.) Suresh Taneja Geeta Bhalla
Date : May 24, 2018 Group CFO Group Vice President & Company Secretary

P. 193
Annual Report 2017-18
102-266 | Finan
cial Statemen
ts24-101 | Statu
tory R
epo
rts02-17 | C
orp
orate O
verview18-23 | M
anag
emen
t Statemen
ts
CORPORATE INFORMATION
The consolidated financial statements comprises of financial
statements of Triveni Engineering & Industries Limited and its
subsidiaries (collectively the “Group”) and the Group’s interest
in associates. Triveni Engineering & Industries Limited (the
“Company” or the “Parent”) is a company limited by shares,
incorporated and domiciled in India. The Company’s equity
shares are listed at two recognised stock exchanges in India
(BSE and NSE). The registered office of the Company is located
at Deoband, Distt. Saharanpur, Uttar Pradesh – 247554. The
Group is engaged in diversified businesses mainly categorised
into two segments – sugar & allied businesses and Engineering
business. Sugar & allied businesses primarily comprises
manufacture of sugar, co-generation and distillery. Engineering
business primarily comprises manufacture of high speed gears,
gearboxes and providing water treatment solutions.
Note 1: Significant accounting policies
This note provides a list of the significant accounting policies
adopted in the preparation of these consolidated financial
statements. These policies have been consistently applied to all
the years presented, unless otherwise stated.
(a) Basis of preparation and presentation
(i) Compliance with Ind AS
The consolidated financial statements comply in all
material aspects with Indian Accounting Standards
(Ind AS) notified under Section 133 of the Companies
Act, 2013 (the Act) [Companies (Indian Accounting
Standards) Rules, 2015] and other relevant provisions
of the Act.
(ii) Historical cost convention
The consolidated financial statements have been
prepared on an accrual basis under historical cost
convention except for certain assets and liabilities that
are measured at fair values at the end of each reporting
period, as explained in the respective accounting
policies described in subsequent paragraphs.
Historical cost is generally based on the fair value
of the consideration given in exchange for goods
and services.
Fair value is the price that would be received to sell
an asset or paid to transfer a liability in an orderly
transaction between market participants at the
measurement date, regardless of whether that price
is directly observable or estimated using another
valuation technique. In estimating the fair value of
an asset or a liability, the Group takes into account
the characteristics of the asset or liability if market
participants would take those characteristics into
account when pricing the asset or liability at the
measurement date. Fair value for measurement and/
or disclosure purposes in these consolidated financial
statements is determined on such a basis, except
for leasing transactions that are within the scope of
Ind AS 17 Leases (see note 1(d)), and measurements
that have some similarities to fair value but are not
fair value, such as net realisable value in Ind AS 2
Inventories (see note 1(l)) or value in use in Ind AS 36
Impairment of Assets (see note 1(f)).
(iii) Classification of assets and liabilities into current/
non-current
All assets and liabilities have been classified as
current or non-current as per the Group’s normal
operating cycle and other criteria set out in Schedule
III to the Act. The operating cycle of the Group is the
time between the acquisition of assets for processing
and their realisation in cash or cash equivalents.
(iv) Principles of consolidation and equity accounting
Subsidiaries
Subsidiaries are all entities over which the Group has
control. The Group controls an entity when the Group
is exposed to, or has rights to, variable returns from
its involvement with the entity and has the ability
to affect those returns through its power to direct
the relevant activities of the entity. Subsidiaries are
fully consolidated from the date on which control is
transferred to the Group. They are deconsolidated
from the date that control ceases.
The Group combines the financial statements of
the Parent and its subsidiaries line by line adding
together like items of assets, liabilities, equity, income
and expenses. Inter-company transactions, balances
and unrealised gains on transactions between group
companies are eliminated. Unrealised losses are also
eliminated unless the transaction provides evidence
of an impairment of the transferred asset. Accounting
policies of subsidiaries have been changed where
necessary to ensure consistency with the policies
adopted by the Group.
Notes to the Consolidated Financial Statementsfor the year ended March 31, 2018

P. 194
Associates
Associates are all entities over which the Group has
significant influence but not control or joint control.
This is generally the case where the Group holds
between 20% and 50% of the voting rights.
Interests in associates are accounted for using the
equity method, after initially being recognised at cost
in the consolidated balance sheet.
Under the equity method of accounting, the
investments are initially recognised at cost and
adjusted thereafter to recognise the Group’s share
of the post-acquisition profits or losses of the
investee in profit or loss, and the Group’s share
of other comprehensive income of the investee in
other comprehensive income. Dividends received
or receivable from associates are recognised as a
reduction in the carrying amount of the investment.
When the Group’s share of losses in an equity-
accounted investment equals or exceeds its interest
in the entity, including any other unsecured long-term
receivables, the Group does not recognise further
losses, unless it has incurred obligations or made
payments on behalf of the other entity.
Unrealised gains on transactions between the Group
and its associates are eliminated to the extent of the
Group’s interest in these entities. Unrealised losses
are also eliminated unless the transaction provides
evidence of an impairment of the asset transferred.
Changes in ownership interests
The group treats transactions with non-controlling
interests that do not result in a loss of control as
transactions with equity owners of the Group. A
change in ownership interest results in an adjustment
between the carrying amounts of the controlling and
non-controlling interests to reflect their relative
interests in the subsidiary. Any difference between
the amount of the adjustment to non-controlling
interests and any consideration paid or received is
recognised within equity.
When the Group ceases to consolidate or equity
account for an investment because of a loss of
control or significant influence, any retained interest
in the entity is remeasured to its fair value with
the change in carrying amount recognised in profit
or loss. This fair value becomes the initial carrying
amount for the purposes of subsequently accounting
for the retained interest as an associate or financial
asset. In addition, any amounts previously recognised
in other comprehensive income in respect of that
entity are accounted for as if the Group had directly
disposed of the related assets or liabilities. This
may mean that amounts previously recognised in
other comprehensive income are reclassified to
profit or loss.
If the ownership interest in an associate is reduced but
significant influence is retained, only a proportionate
share of the amounts previously recognised in other
comprehensive income are reclassified to profit or
loss where appropriate.
(b) Revenue recognition
Revenue is measured at the fair value of the consideration
received or receivable. Amounts disclosed as revenue
are inclusive of excise duty and net of returns, trade
allowances, rebates, other similar allowances, value added
taxes, service tax, goods & services tax and amounts
collected on behalf of third parties, if any.
The Group recognises revenue when the amount of
revenue can be reliably measured, it is probable that future
economic benefits will flow to the Group and specific
criteria have been met for each of the Group’s activities as
described below.
Recognising revenue from major business activities
(i) Sale of goods
Revenue from the sale of goods is recognised when
the goods are delivered and titles have passed, at
which time all the following conditions are satisfied:
significant risks and rewards of ownership of
the goods;
involvement to the degree usually associated
with ownership nor effective control over the
goods sold; and
the transaction can be measured reliably.
Notes to the Consolidated Financial Statementsfor the year ended March 31, 2018

P. 195
Annual Report 2017-18
102-266 | Finan
cial Statemen
ts24-101 | Statu
tory R
epo
rts02-17 | C
orp
orate O
verview18-23 | M
anag
emen
t Statemen
ts
(ii) Rendering of services
Revenue from a contract to provide services is
recognised when the outcome of a transaction
involving the rendering of services can be estimated
reliably, by reference to the stage of completion of the
contract. The stage of completion of the contract is
determined as follows:
is recognised by reference to the stage of
completion of the erection & commissioning/
service, determined based on technical estimate
of completion of physical proportion of the
contract work;
by reference to the stage of completion of
operations & maintenance work, determined
as the proportion of the total period of services
contract that has elapsed at the end of the
reporting period
(iii) Construction contracts
When the outcome of a construction contract can
be estimated reliably, revenue is recognised by
reference to the stage of completion of the contract
activity at the end of the reporting period, measured
based on the proportion of contract costs incurred
for work performed to date relative to the estimated
total contract costs, except where this would not be
representative of the stage of completion. Variations
in contract work, claims and incentive payments are
included to the extent that the amount can be measured
reliably and its receipt is considered probable.
When the outcome of a construction contract cannot
be estimated reliably, contract revenue is recognised to
the extent of contract costs incurred that it is probable
will be recoverable. Contract costs are recognised as
expenses in the period in which they are incurred.
When it is probable that total contract costs will exceed
total contract revenue, the expected loss is recognised
as an expense immediately.
When contract costs incurred to date plus recognised
profits less recognised losses exceed progress
billings, the surplus is shown as amounts due from
customers for contract work. For contracts where
progress billings exceed contract costs incurred to
date plus recognised profits less recognised losses,
the surplus is shown as the amounts due to customers
for contract work. Amounts received before the related
work is performed are included in the consolidated
balance sheet, as a liability, as advances received.
Amounts billed for work performed but not yet paid by
the customer are included in the consolidated balance
sheet under trade receivables.
(iv) Revenue from sale of Certified Emission Reductions
(CERs) and Renewable Energy Certificates (RECs)
Income from the sale of CERs and RECs is recognised
on the delivery of the CERs/RECs to the customer’s
account as evidenced by the receipt of confirmation
of execution of delivery instructions.
(v) Rental income
The Group’s policy for recognition of revenue from
operating leases is described in note 1(d) below.
(vi) Dividend income
Dividend income from investments is recognised
when the Group’s right to receive payment has
been established.
(vii) Interest income
Interest income is accrued on a time basis, by
reference to the principal outstanding and at the
effective interest rate applicable, which is the rate
that exactly discounts estimated future cash receipts
through the expected life of the financial asset to that
asset’s net carrying amount on initial recognition.
(c) Government grants
Grants from the government are recognised where there is
a reasonable assurance that the grant will be received and
the Group will comply with all attached conditions.
Government grants relating to income are deferred and
recognised in the profit or loss over the period necessary
to match them with the costs that they are intended to
compensate and presented either within other income or
net of related costs.
Government grants relating to the purchase of property,
plant and equipment are included in non-current
liabilities as deferred income and are credited to profit or
Notes to the Consolidated Financial Statementsfor the year ended March 31, 2018

P. 196
loss on a systematic and rational basis over the expected
useful lives of the related assets and presented within
other income.
Government grants that are receivable as compensation
for expenses or losses already incurred or for the purpose
of giving immediate financial support to the Group with no
future related costs are recognised in profit or loss in the
period in which they become receivable.
The benefit of a loan at a below market rate of interest or
loan with interest subvention is treated as a government
grant, measured as a difference between proceeds
received and the fair value of the loan based on prevailing
market interest rates.
See note 43 for disclosures and treatment of government
grants in consolidated financial statements.
(d) Leases
Leases are classified as finance leases whenever the
terms of the lease transfer substantially all the risks and
rewards of ownership to the lessee. All other leases are
classified as operating leases.
(i) As a lessee
Assets held under finance leases are initially
recognised as assets of the Group at their fair
value at the inception of the lease or, if lower, at the
present value of the minimum lease payments. The
corresponding liability to the lessor is included in
the consolidated balance sheet as a finance lease
obligation. Lease payments are apportioned between
finance expenses and reduction of the lease obligation
so as to achieve a constant rate of interest on the
remaining balance of the liability. Finance expenses
are recognised immediately in profit or loss, unless
they are directly attributable to qualifying assets, in
which case they are capitalised in accordance with
the Group’s general policy on borrowing costs (see
note 1(g) below).
Payments made under operating leases (net of any
incentives received from the lessor) are charged to
profit or loss on a straight-line basis over the period
of the lease, unless the payments are structured to
increase in line with expected general inflation to
compensate for the lessor’s expected inflationary
cost increases, in which case lease expenses are
charged to profit or loss on the basis of actual
payments to the lessors.
(ii) As a lessor
Lease income from operating leases where the Group
is a lessor is recognised as income on a straight-line
basis over the lease term, unless the receipts are
structured to increase in line with expected general
inflation to compensate for the expected inflationary
cost increases where such increases are recognised
in the year in which such benefits accrue. Initial
direct costs incurred in negotiating and arranging an
operating lease are added to the carrying amount of
the leased asset and recognised on a straight-line
basis over the lease term. Respective leased assets
are included in the consolidated balance sheet based
on their nature.
(e) Foreign currency translation
(i) Functional and presentation currency
Items included in the financial statements of each
of the Group’s entities are measured using the
currency of the primary economic environment in
which the entity operates (‘the functional currency’).
The consolidated financial statements are presented
in Indian rupee (`), which is Group’s functional and
presentation currency unless stated otherwise.
(ii) Transactions and balances
Foreign currency transactions are translated into
the functional currency using the exchange rates
at the dates of the transactions. Foreign exchange
gains and losses resulting from the settlement
of such transactions and from the translation of
monetary assets and liabilities denominated in
foreign currencies at year end exchange rates are
recognised in profit or loss in the period in which
they arise except for foreign exchange differences
on foreign currency borrowings relating to assets
under construction for future productive use, which
are included in cost of those assets when they are
regarded as an adjustment to interest costs on those
foreign currency borrowings.
Foreign exchange differences regarded as an
adjustment to borrowing costs are presented in the
consolidated statement of profit and loss within
Notes to the Consolidated Financial Statementsfor the year ended March 31, 2018

P. 197
Annual Report 2017-18
102-266 | Finan
cial Statemen
ts24-101 | Statu
tory R
epo
rts02-17 | C
orp
orate O
verview18-23 | M
anag
emen
t Statemen
ts
finance costs. All other foreign exchange gains and
losses are presented in the consolidated statement
of profit and loss on a net basis within other income.
(iii) Group companies
The results and financial position of foreign operations
(none of which has the currency of a hyperinflationary
economy) that have a functional currency different
from the presentation currency are translated into
the presentation currency as follows:
closing rate at the date of that consolidated
balance sheet
exchange rates (unless this is not a reasonable
approximation of the cumulative effect of the
rates prevailing on the transaction dates, in
which case income and expenses are translated
at the dates of the transactions), and
recognised in other comprehensive income.
On consolidation, exchange differences arising from
the translation of any net investment in foreign entities,
and of borrowings and other financial instruments
designated as hedges of such investments, are
recognised in other comprehensive income. When a
foreign operation is sold, the associated exchange
differences are reclassified to profit or loss, as part of
the gain or loss on sale.
(f) Impairment of non-financial assets
Non-financial assets are tested for impairment whenever
events or changes in circumstances indicate that the
carrying amount may not be recoverable. An impairment
loss is recognised for the amount by which the asset’s
carrying amount exceeds its recoverable amount. The
recoverable amount is the higher of an asset’s fair value
less costs of disposal and value in use. For the purposes
of assessing impairment, assets are grouped at the lowest
levels for which there are separately identifiable cash
inflows which are largely independent of the cash inflows
from other assets or groups of assets (cash-generating
units). Non-financial assets that suffered an impairment
are reviewed for possible reversal of the impairment at
the end of each reporting period. When an impairment loss
subsequently reverses, the carrying amount of the asset
is increased to the revised estimate of its recoverable
amount, so however that the increased carrying amount
does not exceed the carrying amount that would have been
determined had no impairment loss been recognised for
the asset in prior years. A reversal of an impairment loss
is recognised immediately in profit or loss.
(g) Borrowing costs
Borrowing costs directly attributable to the acquisition,
construction or production of a qualifying asset are
capitalised during the period of time that is required to
complete and prepare the asset for its intended use or
sale. Borrowing costs are not capitalised during extended
periods in which active development of qualifying assets is
suspended. Qualifying assets are assets that necessarily
take a substantial period of time to get ready for their
intended use or sale.
Other borrowing costs are expensed in the period in which
they are incurred.
(h) Income tax
Income tax expense represents the sum of the tax currently
payable and deferred tax.
(i) Current tax
The tax currently payable is based on taxable profit
for the year. Taxable profit differs from ‘profit before
tax’ as reported in the consolidated statement
of profit and loss because of items of income or
expense that are taxable or deductible in other years
and items that are never taxable or deductible. The
Group’s current tax is calculated using tax rates that
have been enacted or substantively enacted by the
end of the reporting period.
(ii) Deferred tax
Deferred tax is recognised on temporary differences
between the carrying amounts of assets and liabilities
in the consolidated financial statements and the
corresponding tax bases used in the computation of
taxable profit. Deferred tax liabilities are generally
recognised for all taxable temporary differences.
Deferred tax assets are generally recognised for all
deductible temporary differences, the carry forward
of unused tax credits and unused tax losses to the
Notes to the Consolidated Financial Statementsfor the year ended March 31, 2018

P. 198
extent that it is probable that taxable profits will be
available against which those deductible temporary
differences, the carry forward of unused tax credits
and unused tax losses can be utilised. Such deferred
tax assets and liabilities are not recognised if
the temporary difference arises from the initial
recognition (other than in a business combination)
of assets and liabilities in a transaction that affects
neither the taxable profit nor the accounting profit.
In addition, deferred tax liabilities are not recognised
if the temporary difference arises from the initial
recognition of goodwill.
Deferred tax liabilities are recognised for taxable
temporary differences associated with investments
in subsidiaries and interests in associates, except
where the Group is able to control the reversal of
the temporary difference and it is probable that
the temporary difference will not reverse in the
foreseeable future. Deferred tax assets arising from
deductible temporary differences associated with
such investments and interests are only recognised
to the extent that it is probable that there will be
sufficient taxable profits to utilise the benefits of
the temporary differences and they are expected to
reverse in the foreseeable future.
The carrying amount of deferred tax assets is
reviewed at the end of each reporting period and
reduced to the extent that it is no longer probable that
sufficient taxable profits will be available to allow all
or part of the asset to be recovered.
Deferred tax liabilities and assets are measured at
the tax rates that are expected to apply in the period
in which the liability is settled or the asset realised,
based on tax rates (and tax laws) that have been
enacted or substantively enacted by the end of the
reporting period.
The measurement of deferred tax liabilities and
assets reflects the tax consequences that would
follow from the manner in which the Group expects,
at the end of the reporting period, to recover or settle
the carrying amount of its assets and liabilities.
(iii) Current and deferred tax for the year
Current and deferred tax are recognised in profit
or loss, except when they relate to items that are
recognised in other comprehensive income or directly
in equity, in which case, the current and deferred tax
are also recognised in other comprehensive income
or directly in equity respectively. Where current tax or
deferred tax arises from the initial accounting for a
business combination, the tax effect is included in the
accounting for the business combination.
(i) Property, plant and equipment
Property, plant and equipment are tangible items that are
held for use in the production or supply for goods and
services, rental to others or for administrative purposes
and are expected to be used during more than one period.
The cost of an item of property, plant and equipment
is recognised as an asset if and only if it is probable
that future economic benefits associated with the item
will flow to the Group and the cost of the item can be
measured reliably. Freehold land is carried at cost. All
other items of property, plant and equipment are stated
at cost less accumulated depreciation and accumulated
impairment losses, if any. Cost comprises purchase price
after deducting trade discounts/rebates, including import
duties and non-refundable purchase taxes, borrowing
costs, any costs that is directly attributable to the bringing
the asset to the location and condition necessary for
it to be capable of operating in the manner intended by
management and costs of dismantling/removing the item
and restoring the site on which it was located under an
obligation. Subsequent costs are included in the asset’s
carrying amount or recognised as a separate asset, as
appropriate, only when it is probable that future economic
benefits associated with the item will flow to the Group and
the cost of the item can be measured reliably.
Each part of item of property, plant and equipment, if
significant in relation to the total cost of the item, is
depreciated separately. Further, parts of plant and
equipment that are technically advised to be replaced
at prescribed intervals/period of operation, insurance
spares and cost of inspection/overhauling are depreciated
separately based on their specific useful life provided these
are of significant amounts commensurate with the size of
the Group and scale of its operations. The carrying amount
of any equipment / inspection / overhauling accounted for
as separate asset is derecognised when replaced. All other
repairs and maintenance costs are charged to profit or
loss during the reporting period in which they are incurred.
Notes to the Consolidated Financial Statementsfor the year ended March 31, 2018

P. 199
Annual Report 2017-18
102-266 | Finan
cial Statemen
ts24-101 | Statu
tory R
epo
rts02-17 | C
orp
orate O
verview18-23 | M
anag
emen
t Statemen
ts
An item of property, plant and equipment is derecognised
upon disposal or when no future economic benefits are
expected to arise from the continued use of the asset. Any
gain or loss arising on the disposal or retirement of an
item of property, plant and equipment is determined as the
difference between the sales proceeds and the carrying
amount of the asset and is recognised in profit or loss.
Transition to Ind AS
On transition to Ind AS, the Group has elected to continue
with the carrying value of all of its property, plant and
equipment recognised as at 1 April 2015 (transition date)
measured as per the previous GAAP and use that carrying
value as the deemed cost of the property, plant and
equipment.
Depreciation methods, estimated useful lives and
residual value
Depreciation commences when the assets are available
for their intended use. Depreciation is calculated using
the straight-line method to allocate their cost, net of their
residual values, over their estimated useful lives.
The management has estimated the useful lives and
residual values of all property, plant and equipment and
adopted useful lives as stated in Schedule II along with
residual values of 5% except for the following:
experience:
and control devices installed at sugar plants is
considered at ten years as against prescribed
life of twenty five years in respect of continuous
process plant.
` 5000/- or more are
depreciated over two years.
over three years.
ranging from five to ten years.
` 5000/- are fully depreciated
in the year of purchase.
Estimated useful lives considered are as follows:
Assets Estimated useful life
Buildings 3 - 60 years
Roads 3 - 10 years
Plant & equipment 3 - 25 years
Furniture & fixtures 10 years
Vehicles 8 - 10 years
Office equipment 2 - 5 years
Computers 3 - 6 years
Laboratory equipment 10 years
Electrical installations and
equipment
10 years
Fixture and fittings and improvements to leasehold
buildings not owned by the Group are amortised over the
unexpired lease period or estimated useful life of such
fixture, fittings and improvements, whichever is lower.
The estimated useful lives, residual values and depreciation
method are reviewed at the end of each reporting period,
with the effect of any changes in estimate accounted for on
a prospective basis.
The property, plant and equipment acquired under finance
leases is depreciated over the asset’s useful life or over
the shorter of the asset’s useful life and the lease term if
there is no reasonable certainty that the Group will obtain
ownership at the end of the lease term.
(j) Investment property
Property that is held for long-term rental yields or for
capital appreciation or both, is classified as investment
property. Investment property is stated at cost less
accumulated depreciation and accumulated impairment
losses, if any. Investment property is measured initially
at its cost, including related transaction costs and where
applicable borrowing costs. Cost comprises purchase
price after deducting trade discounts/rebates, including
duties and taxes, borrowing costs, any costs that is directly
attributable to the bringing the asset to the location and
condition necessary for it to be capable of operating in the
manner intended by management and costs of dismantling/
removing the item and restoring the site on which it was
located under an obligation. Subsequent expenditure is
capitalised to the asset’s carrying amount only when it is
probable that future economic benefits associated with
Notes to the Consolidated Financial Statementsfor the year ended March 31, 2018

P. 200
the expenditure will flow to the Group and the cost of
the item can be measured reliably. All other repairs and
maintenance costs are expensed when incurred.
An investment property is derecognised upon disposal or
when the investment property is permanently withdrawn
from use and no future economic benefits are expected
from the disposal. Any gain or loss arising on derecognition
of the property (calculated as the difference between the
net disposal proceeds and the carrying amount of the
asset) is included in profit or loss in the period in which the
property is derecognised.
Investment property being building is depreciated using
the straight-line method over their estimated useful lives
as stated in Schedule II at 30 years along with residual
values of 5%.
Transition to Ind AS
On transition to Ind AS, the Group has elected to continue
with the carrying value of all of its investment properties
recognised as at 1 April 2015 (transition date) measured
as per the previous GAAP and use that carrying value as
the deemed cost of investment properties.
(k) Intangible assets
Intangible assets are carried at cost less accumulated
amortisation and accumulated impairment losses, if
any. Costs comprises purchase price after deducting
trade discounts/rebates, including import duties and
non-refundable purchase taxes, borrowing costs and
any directly attributable cost of preparing the asset for
its intended use. Subsequent costs are included in the
asset’s carrying amount or recognised as a separate
asset, as appropriate, only when it is probable that future
economic benefits associated with the item will flow to
the Company and the cost of the item can be measured
reliably. Amortisation is recognised on a straight-line basis
over their estimated useful lives. The estimated useful life
and amortisation method are reviewed at the end of each
reporting period, with the effect of any changes in estimate
being accounted for on a prospective basis.
Estimated useful lives considered are as follows:
Assets Estimated useful life
Computer software 3 years
Technical know-how 6 years
An intangible asset is derecognised on disposal, or when no
future economic benefits are expected from use or disposal.
Gains or losses arising from derecognition of an intangible
asset, measured as the difference between the net disposal
proceeds and the carrying amount of the asset, is recognised
in profit or loss when the asset is derecognised.
Transition to Ind AS
On transition to Ind AS, the Group has elected to continue
with the carrying value of all of intangible assets
recognised as at 1 April 2015 measured as per the
previous GAAP and use that carrying value as the deemed
cost of intangible assets.
(l) Inventories
(i) Finished goods and work-in-progress are valued at
lower of cost and net realisable value. The cost of
finished goods and work-in-progress is computed on
weighted average basis and includes raw material
costs, direct cost of conversion and proportionate
allocation of indirect costs incurred in bringing the
inventories to their present location and condition.
Finished goods and work-in-progress are written
down if their net realisable value declines below the
carrying amount of the inventories and such write
downs to inventories are recognised in profit or loss.
When reasons for such write downs ceases to exist,
such write downs are reversed through profit or loss.
(ii) Inventories of raw materials & components, stores &
spares and stock-in-trade are valued at lower of cost
and net realisable value. Raw materials and other
items held for use in the production of inventories are
not written down below cost if the finished goods in
which they will be incorporated are expected to be
sold at or above cost. Write down of such inventories
are recognised in profit or loss and when reasons for
such write downs ceases to exist, such write downs
are reversed through profit or loss. Cost of such
inventories comprises of purchase price and other
directly attributable costs that have been incurred
in bringing the inventories to their present location
and condition. By-products used as raw material are
valued at transfer price linked with net realisable
value. Cost for the purpose of valuation of raw
materials & components, stores & spares and stock-
in-trade is considered on the following basis :
Notes to the Consolidated Financial Statementsfor the year ended March 31, 2018

P. 201
Annual Report 2017-18
102-266 | Finan
cial Statemen
ts24-101 | Statu
tory R
epo
rts02-17 | C
orp
orate O
verview18-23 | M
anag
emen
t Statemen
ts
Raw materials & Components
Business Units Basis
Sugar First in first out
Co-generation &
Distillery
Weighted Average
Water Business Group Specific Cost
Gears Business Group Weighted Average and
Specific Cost
Stores & Spares
Business Units Basis
Water Business Group Specific Cost
Other units Weighted Average
Stock-in-trade
Business Units Basis
Branded goods trading
business
Weighted Average
Diesel/petrol retailing
business
First in first out
(iii) By-products (excluding those used as raw materials)
and scrap are valued at estimated net realisable value.
(iv) Unsold certified emission reductions (CERs) and
renewable energy certificates (RECs) are recognised
as inventory in accordance with the Guidance Note
on Accounting for Self-generated Certified Emission
Reductions, issued by the Institute of Chartered
Accountants of India. Inventory of CERs and RECs is
valued at lower of cost and net realisable value. The
cost incurred on verification/certification of CERs/RECs
is considered as the cost of inventories of CERs/RECs.
(m) Provisions, contingent liabilities and contingent assets
(i) Provisions are recognised when the Group has a
present obligation (legal or constructive) as a result
of a past event, it is probable that the Group will
be required to settle the obligation, and a reliable
estimate can be made of the amount of the obligation.
The amount recognised as a provision is the best
estimate of the consideration required to settle the
present obligation at the end of the reporting period,
taking into account the risks and uncertainties
surrounding the obligation. When the effect of the time
value of money is material, provision is measured at
the present value of cash flows estimated to settle the
present obligation. When some or all of the economic
benefits required to settle a provision are expected
to be recovered from a third party, a receivable is
recognised as an asset if it is virtually certain that
reimbursement will be received and the amount of
the receivable can be measured reliably.
(ii) A contingent liability is not recognised in the
consolidated financial statements, however, is
disclosed, unless the possibility of an outflow of
resources embodying economic benefits is remote.
If it becomes probable that an outflow of future
economic benefits will be required for an item dealt
with as a contingent liability, a provision is recognised
in the consolidated financial statements of the period
(except in the extremely rare circumstances where
no reliable estimate can be made).
(iii) A contingent asset is not recognised in the
consolidated financial statements, however, is
disclosed, where an inflow of economic benefits is
probable. When the realisation of income is virtually
certain, then the asset is no longer a contingent asset,
and is recognised as an asset.
(iv) Provisions, contingent liabilities and contingent
assets are reviewed at each balance sheet date.
(n) Employee benefits
(i) Short-term obligations
Liabilities for wages and salaries, including non-
monetary benefits that are expected to be settled
wholly within twelve months after the end of the
period in which the employees render the related
service are recognised in respect of employees’
services up to the end of the reporting period and are
measured at the undiscounted amounts expected to
be paid when the liabilities are settled. The liabilities
are presented as current benefit obligations in the
consolidated balance sheet.
(ii) Other long-term employee benefit obligations
Other long-term employee benefits include earned
leaves and sick leaves. The liabilities for earned leaves
and sick leaves are not expected to be settled wholly
within twelve months after the end of the period in
Notes to the Consolidated Financial Statementsfor the year ended March 31, 2018

P. 202
which the employees render the related service.
They are therefore measured at the present value
of expected future payments to be made in respect
of services provided by employees up to the end of
the reporting period using the projected unit credit
method, with actuarial valuations being carried out at
the end of each annual reporting period. The benefits
are discounted using the market yield on government
bonds at the end of the reporting period that have
maturity term approximating to the estimated term
of the related obligation. Remeasurements as a
result of experience adjustments and changes in
actuarial assumptions are recognised in profit or
loss. The obligations are presented as provisions in
the consolidated balance sheet.
(iii) Post-employment obligations
The Group operates the following post-employment
schemes:
gratuity; and
provident fund & employee pension scheme,
employees’ state insurance, superannuation
scheme, national pension scheme and
employees’ provident fund (set-up by the
Company and administered through trust).
Defined benefit plan
The Group provides for gratuity obligations through
a defined benefit retirement plan (the ‘Gratuity Plan’)
covering all employees. The Gratuity Plan provides
a lump sum payment to vested employees at
retirement/termination of employment or death of an
employee, based on the respective employees’ salary
and years of employment with the Group.
The liability or asset recognised in the consolidated
balance sheet in respect of the defined benefit plan is
the present value of the defined benefit obligation at
the end of the reporting period less the fair value of
plan assets. The present value of the defined benefit
obligation is determined using projected unit credit
method by discounting the estimated future cash
outflows by reference to market yield at the end of
the reporting period on government bonds that have
maturity term approximating to the estimated term of
the related obligation, with actuarial valuations being
carried out at the end of each annual reporting period.
The net interest cost is calculated by applying the
discount rate to the net balance of the defined
benefit obligation and the fair value of plan assets.
This cost is included in employee benefit expense
in the consolidated statement of profit and loss.
Remeasurement gains and losses arising from
experience adjustments and changes in actuarial
assumptions are recognised in the period in which
they occur, directly in other comprehensive income.
They are included in retained earnings in the
consolidated statement of changes in equity and in
the consolidated balance sheet.
Defined contribution plans
Defined contribution plans are retirement benefit
plans under which the Group pays fixed contributions
to separate entities (funds) or financial institutions or
state managed benefit schemes. The Group has no
further payment obligations once the contributions
have been paid. The defined contributions plans are
recognised as employee benefit expense when they
are due. Prepaid contributions are recognised as an
asset to the extent that a cash refund or a reduction
in the future payments is available.
Provident Fund Plan & Employee Pension
Scheme
The Group makes monthly contributions at
prescribed rates towards Employees’ Provident
Fund/ Employees’ Pension Scheme to a Fund
administered and managed by the Government
of India.
The Group makes prescribed monthly
contributions towards Employees’ State
Insurance Scheme.
The Group contributes towards a fund
established to provide superannuation benefit
to certain employees in terms of Group
Superannuation Policy entered into by such fund
with the Life Insurance Corporation of India.
Notes to the Consolidated Financial Statementsfor the year ended March 31, 2018

P. 203
Annual Report 2017-18
102-266 | Finan
cial Statemen
ts24-101 | Statu
tory R
epo
rts02-17 | C
orp
orate O
verview18-23 | M
anag
emen
t Statemen
ts
The Group makes contributions to the National
Pension Scheme fund in respect of certain
employees of the Group.
administered through trust)
The Company makes contribution towards
provident fund, in substance a defined
contribution plan, which was set-up by the
Company and administered through trust for
the benefit of certain employees. The interest
rate payable by the trust to the beneficiaries
is regulated by statutory authorities which
requires that if the Board of Trustees are unable
to pay interest at the rate declared by the Central
Government under para 60 of the Employees’
Provident Fund Scheme, 1952, for the reason
that the return of investments is less or for any
other reason, then the deficiency shall be made
good by the Company.
(o) Dividends
Provision is made for the amount of any dividend
declared, being appropriately authorised and no longer
at the discretion of the Group, on or before the end of
the reporting period but not distributed by the end of the
reporting period.
(p) Financial assets
(i) Classification
The Group classifies its financial assets in the
following measurement categories:
(either through other comprehensive income, or
through profit or loss), and
The classification depends on the Group’s business
model for managing the financial assets and the
contractual terms of the cash flows.
For assets measured at fair value, gains and losses
will either be recorded in profit or loss or other
comprehensive income. For assets in the nature of
debt instruments, this will depend on the business
model. For assets in the nature of equity instruments,
this will depend on whether the Group has made an
irrevocable election at the time of initial recognition
to account for the equity instrument at fair value
through other comprehensive income.
The Group reclassifies debt instruments when and
only when its business model for managing those
assets changes.
(ii) Measurement
At initial recognition, the Group measures a financial
asset at its fair value plus, in the case of a financial
asset not at fair value through profit or loss,
transaction costs that are directly attributable to the
acquisition of the financial asset. Transaction costs of
financial assets carried at fair value through profit or
loss are expensed in profit or loss.
Debt instruments
Subsequent measurement of debt instruments
depends on the Group’s business model for managing
the asset and the cash flow characteristics of the
asset. There are three measurement categories into
which the Group classifies its debt instruments:
Assets that are held for
collection of contractual cash flows where
those cash flows represent solely payments of
principal and interest are measured at amortised
cost. A gain or loss on a debt investment that
is subsequently measured at amortised cost is
recognised in profit or loss when the asset is
derecognised or impaired. Interest income from
these financial assets is recognised using the
effective interest rate method.
income (FVTOCI): Assets that are held for
collection of contractual cash flows and for
selling the financial assets, where the assets’
cash flows represent solely payments of
principal and interest, are measured at FVTOCI.
Movements in the carrying amount are taken
through OCI, except for the recognition of
impairment gains or losses, interest income and
foreign exchange gains and losses which are
recognised in profit or loss. When the financial
Notes to the Consolidated Financial Statementsfor the year ended March 31, 2018

P. 204
asset is derecognised, the cumulative gain or
loss previously recognised in OCI is reclassified
from equity to profit or loss and recognised in
other gains/(losses). Interest income from these
financial assets is included in other income
using the effective interest rate method.
Assets that do not meet the criteria for
amortised cost or FVTOCI are measured at fair
value through profit or loss. A gain or loss on a
debt investment that is subsequently measured
at fair value through profit or loss is recognised
in profit or loss and presented net in the
consolidated statement of profit and loss within
other gains/(losses) in the period in which it
arises. Interest income from these financial
assets is included in other income.
Equity instruments
The Group subsequently measures all equity
investments at fair value, except for equity investments
in associates where equity accounting is followed
(note 1(a) (iv)). Where the Group’s management has
elected to present fair value gains and losses on
equity investments in other comprehensive income,
there is no subsequent reclassification of fair value
gains and losses to profit or loss. Dividends from such
investments are recognised in profit or loss as other
income when the Group’s right to receive payments is
established.
(iii) Impairment of financial assets
In accordance with Ind AS 109 Financial Instruments,
the Group applies expected credit loss (ECL) model
for measurement and recognition of impairment
loss associated with its financial assets carried at
amortised cost and FVTOCI debt instruments.
For trade receivables or any contractual right to
receive cash or another financial asset that result
from transactions that are within the scope of Ind AS
11 Construction Contracts and Ind AS 18 Revenue,
the Group applies simplified approach permitted by
Ind AS 109 Financial Instruments, which requires
expected life time losses to be recognised after
initial recognition of receivables. For recognition of
impairment loss on other financial assets and risk
exposure, the Group determines whether there has
been a significant increase in the credit risk since
initial recognition. If credit risk has not increased
significantly, twelve months ECL is used to provide for
impairment loss. However, if credit risk has increased
significantly, lifetime ECL is used. If, in a subsequent
period, credit quality of the instrument improves such
that there is no longer a significant increase in credit
risk since initial recognition, then the entity reverts
to recognising impairment loss allowance based on
twelve-months ECL.
ECL represents expected credit loss resulting from
all possible defaults and is the difference between all
contractual cash flows that are due to the Group in
accordance with the contract and all the cash flows
that the entity expects to receive, discounted at the
original effective interest rate. While determining
cash flows, cash flows from the sale of collateral held
or other credit enhancements that are integral to the
contractual terms are also considered.
ECL is determined with reference to historically
observed default rates over the expected life of
the trade receivables and is adjusted for forward
looking estimates. Note 41(i) details how the Group
determines expected credit loss.
(iv) Derecognition of financial assets
A financial asset is derecognised only when
cash flows from the financial asset; or
cash flows of the financial asset, but assumes
a contractual obligation to pay the cash flows to
one or more recipients.
Where the Group has transferred an asset, it
evaluates whether it has transferred substantially all
risks and rewards of ownership of the financial asset.
In such cases, the financial asset is derecognised.
Where the Group has not transferred substantially all
risks and rewards of ownership of the financial asset,
the financial asset is not derecognised.
Where the Group has neither transferred a financial
asset nor retained substantially all risks and rewards
Notes to the Consolidated Financial Statementsfor the year ended March 31, 2018

P. 205
Annual Report 2017-18
102-266 | Finan
cial Statemen
ts24-101 | Statu
tory R
epo
rts02-17 | C
orp
orate O
verview18-23 | M
anag
emen
t Statemen
ts
of ownership of the financial asset, the financial asset
is derecognised if the Group has not retained control
of the financial asset. Where the Group retains control
of the financial asset, the asset is continued to be
recognised to the extent of continuing involvement in
the financial asset.
On derecognition of a financial asset in its entirety,
the difference between the asset’s carrying amount
and the sum of the consideration received and
receivable and the cumulative gain or loss that had
been recognised in other comprehensive income
and accumulated in equity is recognised in profit
or loss if such gain or loss would have otherwise
been recognised in profit or loss on disposal of that
financial asset.
On derecognition of a financial asset other than in its
entirety, the Group allocates the previous carrying
amount of the financial asset between the part it
continues to recognise under continuing involvement,
and the part it no longer recognises on the basis of
the relative fair values of those parts on the date of
the transfer. The difference between the carrying
amount allocated to the part that is no longer
recognised and the sum of the consideration received
for the part no longer recognised and any cumulative
gain or loss allocated to it that had been recognised in
other comprehensive income is recognised in profit
or loss if such gain or loss would have otherwise
been recognised in profit or loss on disposal of that
financial asset. A cumulative gain or loss that had
been recognised in other comprehensive income
is allocated between the part that continues to be
recognised and the part that is no longer recognised
on the basis of the relative fair values of those parts.
(v) Effective interest method
The effective interest method is a method of
calculating the amortised cost of a debt instrument
and of allocating interest income over the relevant
period. The effective interest rate is the rate that
exactly discounts estimated future cash receipts
through the expected life of the financial asset to
the gross carrying amount of a financial asset. When
calculating the effective interest rate, the Group
estimates the expected cash flows by considering all
the contractual terms of the financial instrument but
does not consider the expected credit losses. Income
is recognised on an effective interest basis for
debt instruments other than those financial assets
classified as at FVTPL.
(q) Financial liabilities and equity instruments
(i) Classification
Debt and equity instruments issued by the Group are
classified as either financial liabilities or as equity
in accordance with the substance of the contractual
arrangements and the definitions of a financial
liability and an equity instrument.
Equity instruments
An equity instrument is any contract that evidences
a residual interest in the assets of the Group after
deducting all of its liabilities.
Financial liabilities
The Group classifies its financial liabilities in the
following measurement categories:
through profit or loss, and
Financial liabilities are classified as at FVTPL when
the financial liability is held for trading or it is
designated as at FVTPL, other financial liabilities are
measured at amortised cost at the end of subsequent
accounting periods.
(ii) Measurement
Equity instruments
Equity instruments issued by the Group are
recognised at the proceeds received. Transaction
cost of equity transactions shall be accounted for as
a deduction from equity.
Financial liabilities
At initial recognition, the Group measures a financial
liability at its fair value net of, in the case of a financial
liability not measured at fair value through profit or
loss, transaction costs that are directly attributable to
the issue of the financial liability. Transaction costs of
financial liability carried at fair value through profit or
loss are expensed in profit or loss.
Notes to the Consolidated Financial Statementsfor the year ended March 31, 2018

P. 206
Subsequent measurement of financial liabilities
depends on the classification of financial liabilities.
There are two measurement categories into which
the Group classifies its financial liabilities:
Fair value through profit or loss (FVTPL):
Financial liabilities are classified as at FVTPL
when the financial liability is held for trading or
it is designated as at FVTPL. Financial liabilities
at FVTPL are stated at fair value, with any gains
or losses arising on remeasurement recognised
in profit or loss.
Amortised cost: Financial liabilities that are
not held-for-trading and are not designated as
at FVTPL are measured at amortised cost at
the end of subsequent accounting periods. The
carrying amounts of financial liabilities that
are subsequently measured at amortised cost
are determined based on the effective interest
method. Interest expense that is not capitalised
as part of costs of an asset is included in the
‘Finance costs’ line item.
(iii) Derecognition
Equity instruments
Repurchase of the Group’s own equity instruments is
recognised and deducted directly in equity. No gain or
loss is recognised in profit or loss on the purchase,
sale, issue or cancellation of the Group’s own equity
instruments.
Financial liabilities
The Group derecognises financial liabilities when, and
only when, the Group’s obligations are discharged,
cancelled or have expired. An exchange with a lender
of debt instruments with substantially different
terms is accounted for as an extinguishment of the
original financial liability and the recognition of a new
financial liability. Similarly, a substantial modification
of the terms of an existing financial liability (whether
or not attributable to the financial difficulty of the
debtor) is accounted for as an extinguishment of the
original financial liability and the recognition of a new
financial liability. The difference between the carrying
amount of the financial liability derecognised and the
consideration paid and payable is recognised in profit
or loss.
(iv) Effective interest method
The effective interest method is a method of
calculating the amortised cost of a financial liability
and of allocating interest expense over the relevant
period. The effective interest rate is the rate that
exactly discounts estimated future cash payments
through the expected life of the financial liability to
the gross carrying amount of a financial liability.
(v) Foreign exchange gains and losses
For financial liabilities that are denominated in a
foreign currency and are measured at amortised
cost at the end of each reporting period, the foreign
exchange gains and losses are determined based
on the amortised cost of the instruments and are
recognised in ‘Other income’. The fair value of
financial liabilities denominated in a foreign currency
is determined in that foreign currency and translated
at the spot rate at the end of the reporting period.
(r) Derivatives
Derivatives are initially recognised at fair value on the date
a derivative contract is entered into and are subsequently
re-measured to their fair value at the end of each reporting
period. The resulting gain or loss is recognised in profit or
loss immediately.
(s) Offsetting financial instruments
Financial assets and liabilities are offset and the net
amount is reported in the consolidated balance sheet
where there is a legally enforceable right to offset the
recognised amounts and there is an intention to settle
on a net basis or realise the asset and settle the liability
simultaneously. The legally enforceable right must not be
contingent on future events and must be enforceable in
the normal course of business and in the event of default,
insolvency or bankruptcy of the Group or the counterparty.
(t) Fair value of financial instruments
Fair value measurements are categorised into Level 1, 2 or
3 based on the degree to which the inputs to the fair value
measurements are observable and the significance of the
inputs to the fair value measurement in its entirety, which
are described as follows:
Level 1 inputs are quoted prices (unadjusted) in
active markets for identical assets or liabilities that
the Group can access at the measurement date;
Notes to the Consolidated Financial Statementsfor the year ended March 31, 2018

P. 207
Annual Report 2017-18
102-266 | Finan
cial Statemen
ts24-101 | Statu
tory R
epo
rts02-17 | C
orp
orate O
verview18-23 | M
anag
emen
t Statemen
ts
Level 2 inputs are inputs, other than quoted prices
included within Level 1, that are observable for the
asset or liability, either directly or indirectly; and
Level 3 inputs are unobservable inputs for the asset
or liability.
(u) Cash flow statement
Cash flows are reported using the indirect method,
whereby profit/loss before tax is adjusted for the effects of
transactions of a non-cash nature, any deferrals or accruals
of past or future operating cash receipts or payments and
item of income or expenses associated with investing of
financing flows. The cash flows from operating, investing
and financing activities of the Company are segregated.
(v) Cash and cash equivalents
Cash and cash equivalents in the consolidated balance
sheet comprise of cash on hand, cheques on hand, balance
with banks on current accounts and short term, highly
liquid investments with an original maturity of three
months or less and which carry insignificant risk of change
in value.
For the purpose of cash flow statement, cash and cash
equivalents consist of cash and cash equivalents as
defined above.
(w) Earnings per share
Basic earnings per share is calculated by dividing the
profit attributable to owners of the Company by the
weighted average number of equity shares outstanding
during the financial year, adjusted for bonus elements
in equity shares issued during the year and excluding
treasury shares.
Diluted earnings per share adjusts the figures used in
the determination of basic earnings per share to take
into account the after income tax effect of interest and
financing costs associated with dilutive potential equity
shares and the weighted average number of additional
equity shares that would have been outstanding assuming
the conversion of all dilutive potential equity shares.
(x) Segment reporting
Operating segments are reported in a manner consistent with
the internal reporting provided to the chief operating decision
maker. Refer note 37 for segment information presented.
NOTE 2: CRITICAL ACCOUNTING JUDGEMENTS AND KEY
SOURCES OF ESTIMATION UNCERTAINTY
The preparation of consolidated financial statements requires
the use of accounting estimates which, by definition, will seldom
equal the actual results. Management also needs to exercise
judgement in applying the Group’s accounting policies.
This note provides an overview of the areas that involved a
higher degree of judgement or complexity and of items which
are more likely to be materially adjusted due to estimates and
assumptions turning out to be different than those originally
assessed.
Estimates and judgements are continually evaluated. They are
based on historical experience and other factors, including
expectations of future events that may have a financial impact
on the Group and that are believed to be reasonable under the
circumstances.
(a) Critical accounting judgments
In the process of applying the Group’s accounting policies,
management has made the following judgements, which
has the most significant effect on the amounts recognised
in the consolidated financial statements:
(i) Land under finance lease
The office premises and the workshop of water
business group of the Group is constructed upon
land acquired from a third party which was initially
acquired by that third party under a lease term of
ninety years allotted by the Noida Authority. The said
land was acquired by paying a consideration which
reflected the prevalent market price and upfront
payment of all future lease rentals. There are no
further lease rental obligations upon the Group to
be paid to the Authority. There are no restrictions
on usage or transfer of the land to any party by the
Group. In view of aforesaid facts and circumstances,
the Group has classified this land as a finance lease.
Another property at New Delhi was acquired under
a perpetual lease. There are no restriction on usage
and transfer of the property. Accordingly, this property
has also been classified under finance lease.
(ii) Interest on delayed payment of cane price
The State Government of Uttar Pradesh (“State
Government”) had, based on the financial hardships
of sugar mills arising due to mismatch of cane price
Notes to the Consolidated Financial Statementsfor the year ended March 31, 2018

P. 208
Notes to the Consolidated Financial Statementsfor the year ended March 31, 2018
and sugar price, waived interest on delayed payments
of cane price for the seasons 2012-13, 2013-14 and
2014-15 in accordance with the provisions of Section
17(3) of UP Sugar Cane (Regulations of Supply and
Purchase) Act, 1953. In a Public Interest Litigation,
the Hon’ble Allahabad High Court has passed an order
on 9 March 2017 directing the Cane Commissioner
to decide the issue afresh taking into consideration
certain factors. Against the order of High Court, the
State Government had preferred an appeal before
the Supreme Court which has been dismissed. In the
absence of any order passed by the Commissioner
and based on discussions with legal experts and
industry association, it is felt that the interest may not
be imposed by the State Government on sugar mills
in view of acute financial hardships experienced by
the sugar mills during the aforesaid relevant years.
Accordingly, no provision to this effect has been
considered necessary.
(iii) Society commission
In the cane price package offered by the State
Government of Uttar Pradesh (“State Government”) to
sugar mills, the State Government had reduced rate
of commission payable to cane societies for sugar
season 2012-13 and 2014-15 by way of notification
dated 5 February 2016, to provide relief to the Sugar
Industry in view of disparity in the cane price and
the market outlook of the sugar prices. In the writ
petitions filed by certain cane societies against such
reduction in commission rates, the Hon’ble Allahabad
High Court has held that these notifications cannot
have retrospective applicability. The reduction in the
rate of commission payable being part of the relief
package announced by the State Government, the
Group believes that the State Government is not likely
to pass the cost burden upon the sugar industry and
instead, may explore other ways to meet the outcome
of the order of the Court. Accordingly, no provision to
this effect has been considered necessary.
(b) Key sources of estimation uncertainty
The following are the key assumptions concerning
the future, and other key sources of estimation
uncertainty at the end of the reporting period that
may have a significant risk of causing a material
adjustment to the carrying amounts of assets and
liabilities within the next financial year.
(i) Fair value measurements and valuation
processes
Some of the Group’s assets and liabilities are
measured at fair value for financial reporting
purposes. When the fair values of these assets
and liabilities cannot be measured based on
quoted prices in active markets, their fair
value is measured using valuation techniques
by engaging third party qualified external
valuers or internal valuation team to perform
the valuation. The inputs to these models
are taken from observable markets where
possible, but where this is not feasible, a degree
of judgement is required in establishing fair
of inputs such as liquidity risk, credit risk and
volatility. Changes in assumptions about these
factors could affect the reported fair value of
financial instruments. See note 4, 6, 9 and 42 for
further disclosures.
(ii) Employee benefit plans
The cost of employee benefits under the defined
benefit plan and other long term employee
benefits as well as the present value of the
obligation there against are determined using
actuarial valuations. An actuarial valuation
involves making various assumptions that may
differ from actual developments in the future.
These include the determination of the discount
rate, future salary increases, attrition and
mortality rates. Due to the complexities involved
in the valuation and its long-term nature,
obligation amount is highly sensitive to changes
in these assumptions.
The parameter most subject to change is the
discount rate. In determining the appropriate
discount rate for plans, the management
considers the market yields on government
bonds. Future salary increases are based on
expected future inflation rates and expected
salary trends in the industry. Attrition rates are
considered based on past observable data of

P. 209
Annual Report 2017-18
102-266 | Finan
cial Statemen
ts24-101 | Statu
tory R
epo
rts02-17 | C
orp
orate O
verview18-23 | M
anag
emen
t Statemen
ts
Notes to the Consolidated Financial Statementsfor the year ended March 31, 2018
employees leaving the services of the Group.
The mortality rate is based on publicly available
mortality tables. Those mortality tables tend
to change only at interval in response to
demographic changes. See note 38 for further
disclosures.
(iii) Impairment of trade receivables
The Group has a stringent policy of ascertaining
impairment, if any, as result of detailed scrutiny
of major cases and through determining
expected credit losses. Despite best estimates
and periodic credit appraisals of customers, the
Group’s receivables are exposed to delinquency
risks due to material adverse changes in
business, financial or economic conditions that
are expected to cause a significant change to the
party’s ability to meet its obligations. All such
parameters relating to impairment or potential
impairment are reviewed at each reporting date.
See note 41(i) for further disclosures.
(iv) Revenue and cost estimation for construction
contracts
The revenue recognition pertaining to
construction contracts are determined on
proportionate completion method based on
actual construction contract costs incurred
till balance sheet date and total budgeted
construction contract costs. An estimation
of total budgeted construction contract cost
involves making various assumptions that
may differ from the actual developments in the
future. These include delays in execution due
to unforeseen reasons, inflation rate, future
material rates, future labour rates etc. The
estimates/assumptions are made considering
past experience, market/inflation trends and
technological developments etc. All such
estimates/ assumptions are reviewed at each
reporting date.
(v) Provision for warranty claims
The Group, in the usual course of sale of
its products, gives warranties on certain
products and services, undertaking to repair
or replace the items that fail to perform
satisfactorily during the specified warranty
period. Provisions made represent the amount
of expected cost of meeting such obligations
of rectifications / replacements based on best
estimate considering the historical warranty
claim information and any recent trends that
may suggest future claims could differ from
historical amounts. The assumptions made in
relation to the current period are consistent
with those in the prior years.
(vi) Provision for litigations and contingencies
The provision for litigations and contingencies
are determined based on evaluation made
by the management of the present obligation
arising from past events the settlement of which
is expected to result in outflow of resources
embodying economic benefits, which involves
judgements around estimating the ultimate
outcome of such past events and measurement
of the obligation amount.
(vii) Useful life and residual value of plant,
property equipment and intangible assets
The useful life and residual value of plant,
property equipment and intangible assets are
determined based on technical evaluation made
by the management of the expected usage of the
asset, the physical wear and tear and technical
or commercial obsolescence of the asset. Due
to the judgements involved in such estimations,
the useful life and residual value are sensitive to
the actual usage in future period.
(viii) Recognition of deferred tax assets for unused
tax credit
Deferred tax assets are recognised for unused
tax credit to the extent that it is probable that
taxable profit would be available against
which the losses could be utilised. Significant
management judgment is required to determine
the amount of deferred tax assets that can be
recognised, based upon the likely timing and
the level of future taxable profits together with
future tax optimisation strategies.

P. 210
Notes to the Consolidated Financial Statementsfor the year ended March 31, 2018
(All amounts in ` lakhs, unless otherwise stated)
NO
TE
3:
PR
OP
ER
TY,
PL
AN
T A
ND
EQ
UIP
ME
NT
AN
D C
AP
ITA
L W
OR
K-I
N-P
RO
GR
ES
S P
rop
ert
y, p
lan
t a
nd
eq
uip
me
nt
Ca
pit
al
wo
rk-
in-p
rog
res
s F
ree
ho
ld
La
nd
Le
as
eh
old
La
nd
Bu
ild
ing
s
& R
oa
ds
Pla
nt
an
d
Eq
uip
me
nt
Fu
rnit
ure
& F
ixtu
res
Ve
hic
les
O
ffice
Eq
uip
me
nt
Co
mp
ute
rs
To
tal
Ye
ar
en
de
d 3
1 M
arc
h 2
01
7
Gro
ss
ca
rry
ing
am
ou
nt
Op
en
ing
gro
ss c
arr
yin
g a
mo
un
t 3
56
7.7
4
76
0.2
4
18
91
9.2
5
67
32
9.1
8
23
9.5
1
59
8.0
9
24
1.9
0
19
2.6
5
91
84
8.5
6
99
0.0
0
Ad
dit
ion
s -
-
3
15
.83
3
70
2.8
9
31
.09
1
85
.37
5
1.0
9
96
.32
4
38
2.5
9
18
85
.71
Dis
po
sa
ls -
-
(
50
.57
) (
12
5.8
3)
(1
.28
) (
16
.14
) (
12
.87
) (
2.9
3)
(2
09
.62
) -
Tra
nsfe
rs *
-
-
-
-
-
-
-
-
-
(2
60
8.0
7)
Oth
er
ad
justm
en
ts -
-
(
46
.11
) 3
8.5
3
0.2
0
-
0.5
3
1.0
6
(5
.79
) -
Clo
sin
g g
ros
s c
arr
yin
g a
mo
un
t 3
56
7.7
4
76
0.2
4
19
13
8.4
0
70
94
4.7
7
26
9.5
2
76
7.3
2
28
0.6
5
28
7.1
0
96
01
5.7
4
26
7.6
4
Acc
um
ula
ted
de
pre
cia
tio
n a
nd
im
pa
irm
en
t
Op
en
ing
acc
um
ula
ted
de
pre
cia
tio
n a
nd
imp
air
me
nt
-
4.6
4
67
1.7
7
48
79
.97
5
0.6
7
93
.55
5
9.4
9
46
.36
5
80
6.4
5
56
.31
De
pre
cia
tio
n c
ha
rge
du
rin
g t
he
ye
ar
-
4.6
4
69
7.8
6
46
97
.50
4
8.4
4
10
2.0
9
41
.30
6
0.5
9
56
52
.42
-
Dis
po
sa
ls -
-
(
1.8
6)
(8
.30
) (
0.5
7)
(2
.31
) (
8.8
8)
(0
.11
) (
22
.03
) -
Oth
er
ad
justm
en
ts -
-
(
4.4
9)
3.4
0
0.2
0
-
(1
.47
) 1
.06
(
1.3
0)
-
Clo
sin
g a
ccu
mu
late
d d
ep
rec
iati
on
an
d
imp
air
me
nt
-
9.2
8
13
63
.28
9
57
2.5
7
98
.74
1
93
.33
9
0.4
4
10
7.9
0
11
43
5.5
4
56
.31
Ne
t ca
rry
ing
am
ou
nt
35
67
.74
7
50
.96
1
77
75
.12
6
13
72
.20
1
70
.78
5
73
.99
1
90
.21
1
79
.20
8
45
80
.20
2
11
.33
Ye
ar
en
de
d 3
1 M
arc
h 2
01
8
Gro
ss
ca
rry
ing
am
ou
nt
Op
en
ing
gro
ss c
arr
yin
g a
mo
un
t 3
56
7.7
4
76
0.2
4
19
13
8.4
0
70
94
4.7
7
26
9.5
2
76
7.3
2
28
0.6
5
28
7.1
0
96
01
5.7
4
26
7.6
4
Ad
dit
ion
s -
-
9
89
.99
2
96
6.5
2
12
.24
2
35
.84
6
0.5
1
16
8.3
5
44
33
.45
2
03
7.2
4
Dis
po
sa
ls -
-
(
21
.37
) (
64
.52
) (
5.5
0)
(2
8.5
4)
(6
.77
) (
5.7
4)
(1
32
.44
) -
Tra
nsfe
rs *
-
-
-
-
-
-
-
-
-
(1
24
3.8
2)
Clo
sin
g g
ros
s c
arr
yin
g a
mo
un
t 3
56
7.7
4
76
0.2
4
20
10
7.0
2
73
84
6.7
7
27
6.2
6
97
4.6
2
33
4.3
9
44
9.7
1
10
03
16
.75
1
06
1.0
6
Acc
um
ula
ted
de
pre
cia
tio
n a
nd
im
pa
irm
en
t
Op
en
ing
acc
um
ula
ted
de
pre
cia
tio
n a
nd
imp
air
me
nt
-
9.2
8
13
63
.28
9
57
2.5
7
98
.74
1
93
.33
9
0.4
4
10
7.9
0
11
43
5.5
4
56
.31
De
pre
cia
tio
n c
ha
rge
du
rin
g t
he
ye
ar
-
4.6
4
71
0.4
7
44
83
.21
4
3.1
5
12
0.0
9
35
.91
8
8.1
8
54
85
.65
-
Dis
po
sa
ls -
-
(
13
.72
) (
35
.21
) (
3.9
8)
(1
2.0
9)
(4
.82
) (
0.6
2)
(7
0.4
4)
-
Clo
sin
g a
ccu
mu
late
d d
ep
rec
iati
on
an
d
imp
air
me
nt
-
13
.92
2
06
0.0
3
14
02
0.5
7
13
7.9
1
30
1.3
3
12
1.5
3
19
5.4
6
16
85
0.7
5
56
.31
Ne
t ca
rry
ing
am
ou
nt
35
67
.74
7
46
.32
1
80
46
.99
5
98
26
.20
1
38
.35
6
73
.29
2
12
.86
2
54
.25
8
34
66
.00
1
00
4.7
5
* R
ep
rese
nts
am
ou
nt
cap
ita
lise
d d
uri
ng
th
e y
ea
r u
nd
er
pro
pe
rty,
pla
nt
an
d e
qu
ipm
en
t o
ut
of
cap
ita
l w
ork
-in
-pro
gre
ss.
No
tes:
(i)
Le
as
ed
as
se
ts:
T
he
ori
gin
al l
ea
se
te
rm in
re
sp
ect
of
a p
arc
el o
f la
nd
acq
uir
ed
un
de
r fi
na
nce
lea
se
wa
s n
ine
ty y
ea
rs w
he
rea
s a
no
the
r la
nd
at
De
lhi i
s f
or
a p
erp
etu
al l
ea
se
te
rm. T
he
se
lea
se
s o
f la
nd
s h
ave
be
en
cl
assifi
ed
as fi
na
nce
le
ase
in
te
rms o
f cr
ite
ria
sp
eci
fie
d in
In
d A
S 1
7 L
ea
se
s, i
ncl
ud
ing
th
e f
act
s t
ha
t th
e m
ark
et
valu
e o
f th
e l
an
d (
as o
n t
he
da
te o
f tr
an
sa
ctio
n)
ha
d b
ee
n p
aid
to
th
e l
esso
r a
t th
e in
cep
tio
n o
f th
e l
ea
se
an
d t
he
Gro
up
ha
s t
ran
sfe
r ri
gh
ts in
re
sp
ect
of
su
ch l
an
ds.
(ii)
R
es
tric
tio
ns
on
Pro
pe
rty,
pla
nt
an
d e
qu
ipm
en
t:
Re
fer
no
te 1
6(i
) &
20
(i)
for
info
rma
tio
n o
n c
ha
rge
s c
rea
ted
on
pro
pe
rty,
pla
nt
an
d e
qu
ipm
en
t. F
urt
he
r, f
ree
ho
ld l
an
d in
clu
de
s l
an
d h
avi
ng
ca
rryi
ng
am
ou
nt
of `
13
.13
la
kh
s f
or
wh
ich
tra
nsfe
r o
f ti
tle
s in
th
e n
am
e o
f th
e C
om
pa
ny
is p
en
din
g.
(iii)
C
on
tra
ctu
al
com
mit
me
nts
:
Re
fer
no
te 4
7 f
or
dis
clo
su
re o
f co
ntr
act
ua
l co
mm
itm
en
ts f
or
the
acq
uis
itio
n o
f p
rop
ert
y, p
lan
t a
nd
eq
uip
me
nt.
(iv)
C
ap
ita
l w
ork
-in
-pro
gre
ss
:
Ca
pit
al
wo
rk-i
n-p
rog
ress m
ain
ly c
om
pri
se
s o
f p
lan
t &
eq
uip
me
nt
(viz
. Mu
lti-
eff
ect
eva
po
rato
r, C
ord
ina
te m
ea
su
rin
g m
ach
ine
etc
.) u
nd
er
the
pro
cess o
f in
sta
lla
tio
n p
ert
ain
ing
to
Dis
till
ery
an
d
Ge
ar
bu
sin
esse
s o
f th
e G
rou
p.
(v)
Imp
air
me
nt
los
s:
T
he
im
pa
irm
en
t lo
ss i
n C
ap
ita
l w
ork
-in
-pro
gre
ss r
ela
tes t
o e
xpe
nd
itu
re i
ncu
rre
d o
n c
on
str
uct
ion
of
resid
en
tia
l b
uil
din
gs a
t ce
rta
in f
act
ori
es,
wh
ich
we
re u
nd
er
pro
gre
ss t
ill
fin
an
cia
l ye
ar
20
11
-12
. H
ow
eve
r, t
he
sa
id p
roje
ct w
as s
ub
se
qu
en
tly
dis
con
tin
ue
d a
nd
th
e e
nti
re e
xpe
nd
itu
re i
ncu
rre
d w
as r
eco
gn
ise
d a
s a
n i
mp
air
me
nt
loss i
n t
he
co
nso
lid
ate
d s
tate
me
nt
of
pro
fit
& l
oss
con
sid
eri
ng
no
po
ssib
le f
utu
re e
con
om
ic b
en
efi
ts fl
ow
ing
fro
m t
he
pro
ject
.

P. 211
Annual Report 2017-18
102-266 | Finan
cial Statemen
ts24-101 | Statu
tory R
epo
rts02-17 | C
orp
orate O
verview18-23 | M
anag
emen
t Statemen
ts
NOTE 4: INVESTMENT PROPERTY
Year ended
31-Mar-18
Year ended
31-Mar-17
Gross carrying amount
Opening gross carrying amount 1170.12 1170.12
Additions/deletions - -
Closing gross carrying amount 1170.12 1170.12
Accumulated depreciation and impairment
Opening accumulated depreciation - -
Depreciation charge/impairment losses - -
Closing accumulated depreciation and impairment - -
Net carrying amount 1170.12 1170.12
(i) Description about investment properties
Investment properties consist of :
(a) various parcels of freehold land located in the states of Uttar Pradesh and Gujarat.
(b) an office flat owned by the Group having carrying amount of ` 0.12 lakhs, constructed by a Society on a leasehold land
at Mumbai.
(ii) Amount recognised in consolidated statement of profit & loss
Year ended
31-Mar-18
Year ended
31-Mar-17
Rental income from office flat at Mumbai 14.16 10.92
Direct operating expenses from property that generated rental income - -
Direct operating expenses from property that did not generate rental income (9.56) (9.79)
Profit from investment properties before depreciation 4.60 1.13
Depreciation - -
Profit from investment properties 4.60 1.13
(iii) Restrictions on realisability and contractual obligations
Though the transfer of titles in the name of the Company is pending in respect of freehold land having carrying amount of
` 381.47 lakhs the Group has no restrictions on the realisability of any of its investment properties and it is under no contractual
obligations to either purchase, construct or develop investment properties or for repairs, maintenance and enhancements.
(iv) Fair value
As at
31-Mar-18
As at
31-Mar-17
Investment properties
- Land at Digrauli, Distt. Saharanpur (Uttar Pradesh) * *
- Land at Bhopura, District Baghpat (Uttar Pradesh) * *
- Land at Dibai, District Bulandshahar (Uttar Pradesh) * *
- Land at Kharar, District Shamli (Uttar Pradesh) * *
- Land at Dhanot, District Gandhinagar Gujarat * *
- Office flat at Mumbai 503.88 503.88
* The majority of parcels of land owned by the Group are situated in the sugar belts of Uttar Pradesh. In view of slowdown in real estate and
industrial activities, the circle rates may not be fully reflective of the fair value in the absence of transactions of similar properties (including
Notes to the Consolidated Financial Statementsfor the year ended March 31, 2018
(All amounts in ` lakhs, unless otherwise stated)

P. 212
size) in the vicinity of the subject properties. The land at Vill. Dhanot Dist. Gandhinagar Gujarat is a small plot of uncultivated land, situated at a
remote location and hence there is a difficulty in carrying out realistic fair value thereof.
Estimation of fair value of office flat at Mumbai
The valuation of the office flat situated at Mumbai has been carried by a registered approved valuer, conversant with and having
knowledge of real estate activities in the concerned area, based on prevalent rates and other observable market inputs (Level
2 fair value).
NOTE 5: INTANGIBLE ASSETS
Computer software
Year ended 31 March 2017
Gross carrying amount
Opening gross carrying amount 224.45
Additions 6.79
Disposals (0.01)
Closing gross carrying amount 231.23
Accumulated amortisation
Opening accumulated amortisation 71.74
Amortisation charge for the year 77.17
Disposals -
Closing accumulated amortisation 148.91
Closing net carrying amount 82.32
Year ended 31 March 2018
Gross carrying amount
Opening gross carrying amount 231.23
Additions 9.56
Disposals (0.60)
Closing gross carrying amount 240.19
Accumulated amortisation
Opening accumulated amortisation 148.91
Amortisation charge for the year 56.00
Disposals (0.56)
Closing accumulated amortisation 204.35
Closing net carrying amount 35.84
Notes to the Consolidated Financial Statementsfor the year ended March 31, 2018
(All amounts in ` lakhs, unless otherwise stated)

P. 213
Annual Report 2017-18
102-266 | Finan
cial Statemen
ts24-101 | Statu
tory R
epo
rts02-17 | C
orp
orate O
verview18-23 | M
anag
emen
t Statemen
ts
Notes to the Consolidated Financial Statementsfor the year ended March 31, 2018
(All amounts in ` lakhs, unless otherwise stated)
NOTE 6: INVESTMENTS
(a) Investments accounted for using the equity method
As at
31-Mar-18
As at
31-Mar-17
Quoted Investments (fully paid-up)
Investments in Equity Instruments
- of Associate
7,20,00,000 (31 March 2017: 7,20,00,000) Equity shares of ` 1/- each of Triveni
Turbine Limited (refer note 44 (ii)) 8327.93 7449.74
Total aggregate quoted investments 8327.93 7449.74
Unquoted Investments (fully paid-up)
Investments in Equity Instruments
- of Associate
13,008 (31 March 2017: 13,008) Equity shares of New Israeli Shekel 0.10 each of
Aqwise-Wise Water Technologies Ltd.(Israel) (refer note 44 (ii)) 2842.88 2925.74
Total aggregate unquoted investments 2842.88 2925.74
Total investments accounted for using the equity method 11170.81 10375.48
Total investments accounted for using the equity method 11170.81 10375.48
Aggregate amount of quoted investments 8327.93 7449.74
Aggregate amount of market value of quoted investment 72360.00 104328.00
Aggregate amount of unquoted investments 2842.88 2925.74
Aggregate amount of impairment in the value of investments - -
(b) Non-current investments
As at
31-Mar-18
As at
31-Mar-17
At Amortised cost
Unquoted Investments
Investments in Government or trust securities
National Saving Certificates (kept as security) 0.03 0.03
Total non-current investments carried at amortised cost [A] 0.03 0.03
At Fair value through Profit or Loss (FVTPL) (refer note 42)
Quoted Investments (fully paid-up)
Investments in Equity Instruments
13,500 (31 March 2017: 13,500) Equity shares of ` 2/- each of
Housing Development Finance Corporation Ltd 246.46 202.78
2,500 (31 March 2017: 2,500) Equity shares of ` 2/- each of HDFC Bank Ltd. 47.15 36.06
24,175 (31 March 2017: 24,175) Equity shares of ` 2/- each of
Punjab National Bank 23.04 36.24
76 (31 March 2017: 76) Equity shares of ` 10/- each of Central Bank of India 0.05 0.08
3,642 (31 March 2017: 1,821) Equity shares of ` 5/- each (31 March 2017 :
` 10/- each) of NBI Industrial Finance Co. Ltd. 49.74 67.29
Total aggregate quoted investments 366.44 342.45

P. 214
As at
31-Mar-18
As at
31-Mar-17
Unquoted Investments (fully paid-up)
Investments in Bonds
2 (31 March 2017: 2) 11% bonds of ` 10.00 lakhs each of Power Finance
Corporation Ltd. 21.37 21.09
Nil (31 March 2017: 2) 8.95% bonds of ` 10.00 lakhs each of Power Finance
Corporation Ltd. - 20.36
1 (31 March 2017: 1) 9.81% bonds of ` 10.00 lakhs each of Power Finance
Corporation Ltd. 10.53 10.40
1 (31 March 2017: 1) 10.60% bonds of ` 10.00 lakhs each of Indian Railway
Finance Corporation Ltd. 10.57 10.02
1 (31 March 2017: 1) 8.55% bonds of ` 10.00 lakhs each of Indian Railway
Finance Corporation Ltd. 10.41 9.84
Nil (31 March 2017: 1) 9.80% bonds of ` 10.00 lakhs each of LIC Housing
Finance Ltd. - 10.11
Nil (31 March 2017: 1) 10.10% bonds of ` 10.00 lakhs each of State Bank of India - 8.67
2 (31 March 2017: 2) 8.90% bonds of ` 10.00 lakhs each of UCO Bank 20.16 20.05
1 (31 March 2017: 1) 8.57% bonds of ` 10.00 lakhs each of Central Bank of India 10.74 9.93
5 (31 March 2017: 5) 8% bonds of ` 1.00 lakh each of IDBI Bank Limited 5.26 5.02
Nil (31 March 2017: 1) 8.95% bonds of ` 10.00 lakhs each of IDFC Bank Limited - 10.15
Nil (31 March 2017: 1) 8.43% bonds of ` 10.00 lakhs each of IDFC Bank Limited - 10.11
Total aggregate unquoted investments 89.04 145.75
Total non-current investments carried at FVTPL [B] 455.48 488.20
Total non-current investments ([A]+[B]) 455.51 488.23
Total non-current investments 455.51 488.23
Aggregate amount of quoted investments 366.44 342.45
Aggregate amount of market value of quoted investment 366.44 342.45
Aggregate amount of unquoted investments 89.07 145.78
Aggregate amount of impairment in the value of investments - -
NOTE 7: TRADE RECEIVABLES
As at 31-Mar-18 As at 31-Mar-17
Current Non-current Current Non-Current
Trade receivables (at amortised cost)
- Unsecured, considered good 31140.07 50.32 27709.52 81.98
- Doubtful 534.33 1246.48 476.93 2191.76
Less: Allowance for bad and doubtful debts (534.33) (1246.48) (476.93) (2191.76)
Total trade receivables 31140.07 50.32 27709.52 81.98
(i) Refer note 41(i) for credit risk, impairment of trade receivables under expected credit loss model and other related disclosures.
(ii) Current trade receivable include ̀ 3906.99 lakhs (31 March 2017 : ̀ 2049.41 lakhs) expected to be received after twelve months
within the operating cycle.
Notes to the Consolidated Financial Statementsfor the year ended March 31, 2018
(All amounts in ` lakhs, unless otherwise stated)

P. 215
Annual Report 2017-18
102-266 | Finan
cial Statemen
ts24-101 | Statu
tory R
epo
rts02-17 | C
orp
orate O
verview18-23 | M
anag
emen
t Statemen
ts
NOTE 8: LOANS
As at 31-Mar-18 As at 31-Mar-17
Current Non-current Current Non-Current
At amortised cost
Loan to employees
- Unsecured, considered good 53.26 2.98 38.16 7.12
Loan to others
- Unsecured, considered good 0.29 - 0.53 -
- Doubtful - 44.53 - 44.53
Less: Allowance for bad and doubtful loans - (44.53) - (44.53)
0.29 - 0.53 -
Total loans 53.55 2.98 38.69 7.12
NOTE 9: OTHER FINANCIAL ASSETS
As at 31-Mar-18 As at 31-Mar-17
Current Non-current Current Non-Current
At amortised cost
Security deposits 41.74 455.28 43.08 401.71
Earnest money deposits 162.47 2.00 150.05 2.00
Less: Allowance for bad and doubtful debts (1.15) - - -
161.32 2.00 150.05 2.00
Bank balances:
Earmarked balances with banks:
- Deposit against molasses storage fund (refer
note 14(vi)) - 233.72 - 235.63
Balances under lien/margin/kept as security:
- Post office savings account - 0.19 - 0.27
- Fixed / margin deposits (original maturity
more than one year) - 36.66 - 211.84
Other balances:
- Fixed deposits (original maturity more than
one year) - 4.20 - 4.20
- 274.77 - 451.94
Interest accrued 32.33 1.20 36.40 69.19
Insurance claim recoverable 86.00 - 62.96 -
Miscellaneous other financial assets 11.17 14.90 31.85 17.94
Less: Allowance for bad and doubtful debts - (14.90) - (17.94)
11.17 - 31.85 -
Total other financial assets at
amortised cost [A] 332.56 733.25 324.34 924.84
At fair value through Profit or Loss
(refer note 42)
Derivatives financial instruments carried
at fair value
- Foreign-exchange forward contracts/
Currency swaps/Interest rate swaps 91.82 - - -
Total other financial assets at FVTPL [B] 91.82 - - -
Total other financial assets ([A]+[B]) 424.38 733.25 324.34 924.84
Notes to the Consolidated Financial Statementsfor the year ended March 31, 2018
(All amounts in ` lakhs, unless otherwise stated)

P. 216
NOTE 10: OTHER ASSETS
As at 31-Mar-18 As at 31-Mar-17
Current Non-current Current Non-Current
Capital advances - 30.56 - 6.63
Advances to suppliers 622.24 19.89 470.10 19.89
Less: Allowance for bad and doubtful debts (26.89) (19.89) (1.56) (19.89)
595.35 - 468.54 -
Advances to related parties (refer note 39) 2.13 - 34.72 -
Indirect tax and duties recoverable 1433.44 357.60 5549.25 443.96
Less: Allowance for bad and doubtful debts (40.32) (21.38) (21.78) (28.02)
1393.12 336.22 5527.47 415.94
Deposit with sales tax authorities 130.35 43.55 77.62 46.66
Less: Allowance for bad and doubtful debts - (37.00) - (37.00)
130.35 6.55 77.62 9.66
Bank guarantee encashments recoverable - 200.00 - 200.00
Less: Allowance for bad and doubtful debts - (200.00) - (200.00)
- - - -
Export incentives receivable 43.12 - 23.67 -
Less: Allowance for bad and doubtful debts (15.26) - - -
27.86 - 23.67 -
Advances to employees 16.05 1.45 15.90 1.45
Prepaid expenses 549.16 98.81 373.70 96.74
Due from customers under construction
contracts [refer (i) below] 5702.70 - 6225.28 -
Unbilled revenue 191.96 - 198.58 -
Miscellaneous other assets 36.40 131.61 34.58 173.37
Less: Allowance for bad and doubtful debts - (28.72) - (60.26)
36.40 102.89 34.58 113.11
Total other assets 8645.08 576.48 12980.06 643.53
(i) Construction contracts
As at
31-Mar-18
As at
31-Mar-17
Contracts in Progress at the end of reporting period
Construction costs incurred plus profits recognised less losses recognised 76329.94 84306.15
Less: Progress Billings (71661.59) (78635.38)
4668.35 5670.77
Recognised and included in consolidated financial statements as amounts due:
(i) Amounts due from customers under construction contracts 5702.70 6225.28
(ii) Amounts due to customers under construction contracts (1034.35) (554.51)
4668.35 5670.77
Retentions held by customers 5650.93 6666.80
Advances received from customers 2605.01 2471.85
Notes to the Consolidated Financial Statementsfor the year ended March 31, 2018
(All amounts in ` lakhs, unless otherwise stated)

P. 217
Annual Report 2017-18
102-266 | Finan
cial Statemen
ts24-101 | Statu
tory R
epo
rts02-17 | C
orp
orate O
verview18-23 | M
anag
emen
t Statemen
ts
NOTE 11: INVENTORIES
As at
31-Mar-18
As at
31-Mar-17
Raw materials and components 2698.80 3065.44
Less: Provision for obsolescence/slow moving raw materials and components (199.22) (182.78)
Work-in-progress 3157.30 2669.25
Finished goods 148847.59 158669.55
Stock in trade 31.47 18.06
Stores and spares [including stock in transit ` 14.09 lakhs as at 31 March 2018
(31 March 2017: `0.09 lakhs)] 3507.80 3202.71
Less: Provision for obsolescence/slow moving stores and spares (185.13) (124.33)
Certified emission reductions/renewable energy certificates (refer note 50) 0.77 3.16
Others - Scrap & low value patterns 59.26 160.62
Total inventories 157918.64 167481.68
(i) The cost of inventories recognised as an expense during the year was ` 279641.05 lakhs (31 March 2017: ` 231279.71 lakhs)
(ii) Refer note 20(i) for information on charges created on inventories.
(iii) The mode of valuation of inventories has been stated in note 1(l).
(iv) All inventories are expected to be utilised/sold within twelve months except certain items of stores and spares, which are
utilised on need basis. Quantum of such stores and spares, which may be utilised beyond one year, is not determinable and is
not expected to be material with reference to the total value of inventories.
(v) For impairment losses recognised during the year refer note 33.
(vi) In addition to the cost of inventories recognised as expense as mentioned in note 11(i) above, there are write-downs of inventories
to net realisable value amounted to ̀ 21970.87 lakhs (31 March 2017: ̀ Nil) which are also recognised as an expense during the
year and included in ‘Changes in inventories of finished goods, stock-in-trade and work-in-progress’ in consolidated statement
of profit and loss.
NOTE 12: CASH AND BANK BALANCES
(a) Cash and cash equivalents
As at
31-Mar-18
As at
31-Mar-17
At amortised cost
Balances with banks 338.62 607.85
Cheques / drafts on hand 3.58 19.99
Cash on hand 24.31 29.26
Total cash and cash equivalents 366.51 657.10
Notes to the Consolidated Financial Statementsfor the year ended March 31, 2018
(All amounts in ` lakhs, unless otherwise stated)

P. 218
(b) Bank balances other than cash and cash equivalents
As at
31-Mar-18
As at
31-Mar-17
At amortised cost
Earmarked balances with banks:
- unpaid dividend and preference share redemption accounts 3.49 5.00
Balances under lien/margin/kept as security:
- in fixed/margin deposits (original maturity upto one year) 265.35 25.89
Other balances:
- in fixed deposits (original maturity exceeding three months but upto one year) 5.82 53.84
Total bank balances other than cash and cash equivalents 274.66 84.73
NOTE 13: SHARE CAPITAL
As at 31-Mar-18 As at 31-Mar-17
Number of shares Amount Number of shares Amount
AUTHORISED
Equity shares of ` 1 each 5,00,000,000 5000.00 50,00,00,000 5000.00
Preference shares of ` 10 each 2,00,00,000 2000.00 2,00,00,000 2000.00
7000.00 7000.00
ISSUED
Equity shares of ` 1 each 25,79,53,110 2579.53 25,79,53,110 2579.53
25,79,53,110 2579.53 25,79,53,110 2579.53
SUBSCRIBED AND PAID UP
Equity shares of ` 1 each 25,79,45,110 2579.45 25,79,45,110 2579.45
Add: Paid up value of equity shares of ` 1 each
forfeited 8,000 0.02 8,000 0.02
25,79,53,110 2579.47 25,79,53,110 2579.47
(i) Movements in equity share capital
Number of shares Amount
As at 31 March 2016 25,79,45,110 2579.45
Movement during the year - -
As at 31 March 2017 25,79,45,110 2579.45
Movement during the year - -
As at 31 March 2018 25,79,45,110 2579.45
(ii) Terms and rights attached to equity shares
The Company has only one class of equity shares with a par value of ` 1/- per share. The holder of equity shares is entitled to
one vote per share. The Company declares and pays dividends in Indian rupees. The dividend proposed by the Board of Directors
is subject to the approval of the shareholders in the ensuing Annual General Meeting.
In the event of liquidation of the Company, the holders of equity shares are entitled to receive the remaining assets of the
Company, after meeting all liabilities and distribution of all preferential amounts, in proportion to their shareholding.
Notes to the Consolidated Financial Statementsfor the year ended March 31, 2018
(All amounts in ` lakhs, unless otherwise stated)

P. 219
Annual Report 2017-18
102-266 | Finan
cial Statemen
ts24-101 | Statu
tory R
epo
rts02-17 | C
orp
orate O
verview18-23 | M
anag
emen
t Statemen
ts
(iii) Details of shareholders holding more than 5% shares in the Company
As at 31-Mar-18 As at 31-Mar-17
Number of shares % holding Number of shares % holding
Dhruv M. Sawhney 3,83,91,756 14.88 3,83,91,756 14.88
Rati Sawhney 2,03,58,164 7.89 2,03,58,164 7.89
Subhadra Trade & Finance Limited - - 8,26,96,056 32.06
STFL Trading and Finance Private Limited 8,26,96,056 32.06 - -
Nikhil Sawhney 1,52,77,653 5.92 1,52,77,653 5.92
Tarun Sawhney 1,46,95,375 5.70 1,46,95,375 5.70
NOTE 14: OTHER EQUITY
As at
31-Mar-18
As at
31-Mar-17
Capital redemption reserve 458.50 458.50
Capital reserve 2706.77 2868.83
Securities premium 26588.46 26587.94
Amalgamation reserve 926.34 926.34
General reserve 51440.90 51440.90
Molasses storage fund reserve 196.28 202.42
Retained earnings 9774.25 (1498.45)
Foreign currency translation reserve (35.76) (27.58)
Total other equity 92055.74 80958.90
(i) Capital redemption reserve
Year ended
31-Mar-18
Year ended
31-Mar-17
Opening balance 458.50 458.50
Movement during the year - -
Closing balance 458.50 458.50
Capital redemption reserve was created consequent to redemption of preference share capital, as required under the provisions
of the Companies Act, 1956. This reserve shall be utilised in accordance with the provisions of Companies Act, 2013.
(ii) Capital reserve
Year ended
31-Mar-18
Year ended
31-Mar-17
Opening balance 2868.83 2868.83
Share of associates- addition in capital reserve during the year (162.06) -
Closing balance 2706.77 2868.83
Capital reserve majorly comprise of reserve created consequent to business combination in earlier years, in accordance with
applicable accounting standard as on that date.
Notes to the Consolidated Financial Statementsfor the year ended March 31, 2018
(All amounts in ` lakhs, unless otherwise stated)

P. 220
(iii) Securities premium
Year ended
31-Mar-18
Year ended
31-Mar-17
Opening balance 26587.94 26574.54
Share of associates- addition in securities premium during the year 0.52 13.40
Closing balance 26588.46 26587.94
Securities premium is used to record the premium on issue of shares. The reserve is utilised in accordance with the provisions
of the Companies Act, 2013.
(iv) Amalgamation reserve
Year ended
31-Mar-18
Year ended
31-Mar-17
Opening balance 926.34 926.34
Movement during the year - -
Closing balance 926.34 926.34
Amalgamation reserve was created consequent to business combinations in past in accordance with applicable accounting
standard as on that date.
(v) General reserve
Year ended
31-Mar-18
Year ended
31-Mar-17
Opening balance 51440.90 51440.90
Movement during the year - -
Closing balance 51440.90 51440.90
General reserve represents amount kept by the Company out of its profits for future purposes. It is not earmarked for any
specific purpose.
(vi) Molasses storage fund reserve
Year ended
31-Mar-18
Year ended
31-Mar-17
Opening balance 202.42 182.39
Amount transferred from surplus/ (deficit) in the consolidated statement of
profit and loss 32.96 20.03
Amount transferred to surplus/ (deficit) in the consolidated statement of
profit and loss (39.10) -
Closing balance 196.28 202.42
Molasses storage fund reserve is created and maintained under the provisions of the Uttar Pradesh Sheera Niyantran
Adhiniyam, 1964 (U.P. Act No. XXIV of 1964) and is to be utilised for the provision and maintenance of adequate storage facilities
for molasses. Fixed deposit of ` 233.72 lakhs (31 March 2017: ` 235.63 lakhs) is earmarked against molasses storage fund
(refer note 9).
Notes to the Consolidated Financial Statementsfor the year ended March 31, 2018
(All amounts in ` lakhs, unless otherwise stated)

P. 221
Annual Report 2017-18
102-266 | Finan
cial Statemen
ts24-101 | Statu
tory R
epo
rts02-17 | C
orp
orate O
verview18-23 | M
anag
emen
t Statemen
ts
(vii) Retained earnings
Year ended
31-Mar-18
Year ended
31-Mar-17
Opening balance (1498.45) (26297.49)
Net profit for the year 11914.01 25296.12
Other comprehensive income arising from the remeasurement of defined benefit
obligation net of income tax 121.72 (448.62)
Share of other comprehensive income of associates arising from the
remeasurement of defined benefit obligation 7.03 (28.43)
Withdrawn from molasses storage fund reserve 39.10 -
Transfer to molasses storage fund reserve (32.96) (20.03)
Dividends paid (644.91) -
Dividend distribution tax (131.29) -
Closing balance 9774.25 (1498.45)
(a) Retained earnings represents undistributed profits of the Company which can be distributed to its equity shareholders in
accordance with the requirement of the Companies Act, 2013.
(b) As required under Schedule III (Division II), the Company has recognised remeasurement defined benefit plans (net of tax)
as part of retained earnings.
(c) Details of dividend distributions made:
Year ended
31-Mar-18
Year ended
31-Mar-17
Cash dividends on equity shares declared and paid:
First interim dividend for the year ended 31 March 2018: 25% (` 0.25 per
equity share of ` 1/- each) [31 March 2017: ` Nil] 644.91 -
Dividend distribution tax on first interim dividend 131.29 -
Total cash dividends on equity shares declared and paid 776.20 -
(vii) Foreign currency translation reserve
Year ended
31-Mar-18
Year ended
31-Mar-17
Opening balance (27.58) (24.74)
Share of other comprehensive income of associates arising from the exchange
differences on translation of foreign operations (8.18) (2.84)
Closing balance (35.76) (27.58)
Exchange differences relating to the translation of the foreign operations are recognised in other comprehensive income and
accumulated in the foreign currency translation reserve. The cumulative amount is reclassified to profit or loss when the net
investment is disposed-off.
Notes to the Consolidated Financial Statementsfor the year ended March 31, 2018
(All amounts in ` lakhs, unless otherwise stated)

P. 222
Notes to the Consolidated Financial Statementsfor the year ended March 31, 2018
(All amounts in ` lakhs, unless otherwise stated)
NOTE 15: NON-CONTROLLING INTERESTS
Year ended
31-Mar-18
Year ended
31-Mar-17
Opening balance 0.00 0.00
Share of loss for the year (0.00) (0.00)
Closing balance 0.00 0.00
NOTE 16: NON-CURRENT BORROWINGS
As at 31-Mar-18 As at 31-Mar-17
Current maturities Non-current Current maturities Non- current
Secured- at amortised cost
Term loans
- from banks 12607.56 3483.54 20170.53 27320.31
- from other parties 224.03 11.74 196.53 215.92
12831.59 3495.28 20367.06 27536.23
Less: Amount disclosed under the head "Other
financial liabilities- current" (refer note 17) (12831.59) - (20367.06) -
Total non-current borrowings - 3495.28 - 27536.23

P. 223
Annual Report 2017-18
102-266 | Finan
cial Statemen
ts24-101 | Statu
tory R
epo
rts02-17 | C
orp
orate O
verview18-23 | M
anag
emen
t Statemen
ts
NO
TE
16
: N
ON
-CU
RR
EN
T B
OR
RO
WIN
GS
(C
ON
TD
.)
(i)
De
tail
s o
f lo
ng
te
rm b
orr
ow
ing
s o
f th
e G
rou
p
Am
ou
nt
ou
tsta
nd
ing
as
at
Eff
ec
tiv
e
inte
res
t ra
te
Co
up
on
ra
teN
um
be
r o
f in
sta
lme
nts
Te
rms
of
Re
pa
ym
en
t
Na
ture
of
Se
cu
rity
31
-Ma
r-1
83
1-M
ar-
17
31
-Ma
r-1
83
1-M
ar-
17
Se
cu
red
- a
t a
mo
rtis
ed
co
st
Te
rm l
oa
ns
fro
m b
an
ks
(`
lo
an
s)
1
Ca
na
ra B
an
k -
3
27
3.8
4
Th
e e
ffe
ctiv
e
inte
rest
rate
as
on
31
.03
.20
18
ran
ge
be
twe
en
10
.25
% t
o 1
2%
pe
r a
nn
um
.
At
ba
se
ra
tes/
MC
LR
plu
s
ap
pli
cab
le s
pre
ad
.
Th
e in
tere
st
rate
as o
n 3
1.0
3.2
01
8
ran
ge
be
twe
en
8.5
0%
to
9.3
0%
pe
r a
nn
um
.
Nil
7
-S
ecu
red
by
firs
t p
ari
-
pa
ssu
ch
arg
e c
rea
ted
/ t
o
be
cre
ate
d b
y e
qu
ita
ble
mo
rtg
ag
e o
n im
mo
vea
ble
asse
ts a
nd
hyp
oth
eca
tio
n
of
all
mo
vea
ble
asse
ts, b
oth
pre
se
nt
an
d f
utu
re o
f th
e
Co
mp
an
y su
bje
ct t
o b
an
ke
rs
pri
or
cha
rge
s c
rea
ted
/ t
o b
e
cre
ate
d o
n c
urr
en
t a
sse
ts
for
pro
vid
ing
wo
rkin
g c
ap
ita
l
faci
liti
es a
nd
exc
lud
ing
asse
ts p
urc
ha
se
d u
nd
er
veh
icle
lo
an
sch
em
e.
2
Axi
s B
an
k
-
83
2.7
2
Nil
2-
3
Yes B
an
k 4
68
.57
2
34
1.1
2
15
Eq
ua
l q
ua
rte
rly
insta
llm
en
ts u
pto
4
Ra
tna
ka
r B
an
k L
imit
ed
89
9.2
3
20
96
.53
3
7Q
ua
rte
rly
insta
llm
en
ts
up
to D
ece
mb
er
20
18
.
5
Ra
tna
ka
r B
an
k L
imit
ed
26
28
.08
9
93
4.0
7
59
Eq
ua
l q
ua
rte
rly
insta
llm
en
ts u
pto
6
Ce
ntr
al
Ba
nk
of
Ind
ia 2
76
9.9
5
44
39
.32
2
03
2E
qu
ate
d m
on
thly
insta
llm
en
ts u
pto
De
cem
be
r 2
01
9.
Se
cure
d b
y fi
rst
pa
ri-p
assu
cha
rge
on
cu
rre
nt
asse
ts,
thir
d c
ha
rge
on
fixe
d a
sse
ts
of
Kh
ata
uli
an
d R
am
ko
la
un
its a
nd
se
con
d c
ha
rge
on
fixe
d a
sse
ts o
f o
the
r u
nit
s o
f
the
Co
mp
an
y.
7
Ori
en
tal
Ba
nk
of
Co
mm
erc
e -
2
14
2.1
5
Nil
31
-S
ecu
red
by
thir
d c
ha
rge
on
fixe
d a
sse
ts o
f K
ha
tau
li a
nd
Ra
mko
la u
nit
s a
nd
se
con
d
cha
rge
on
fixe
d a
sse
ts o
f
oth
er
un
its o
f th
e C
om
pa
ny.
8
Axi
s B
an
k 9
89
.21
1
81
6.9
0
59
Eq
ua
l q
ua
rte
rly
insta
llm
en
ts u
pto
Ma
y 2
01
9.
Se
cure
d b
y se
con
d p
ari
-
pa
ssu
ch
arg
e o
n c
urr
en
t
asse
ts, t
hir
d c
ha
rge
o
n
fixe
d a
sse
ts o
f K
ha
tau
li a
nd
Ra
mko
la u
nit
s a
nd
se
con
d
cha
rge
on
fixe
d a
sse
ts o
f
oth
er
un
its o
f th
e C
om
pa
ny.
9
Ce
ntr
al
Ba
nk
of
Ind
ia 8
73
.75
1
37
2.6
3
71
1E
qu
al
qu
art
erl
y
insta
llm
en
ts u
pto
De
cem
be
r 2
01
9.
Se
cure
d b
y fi
rst
pa
ri-p
assu
cha
rge
on
th
e fi
xed
asse
ts o
f
the
Co
mp
an
y.1
0
Ori
en
tal
Ba
nk
of
Co
mm
erc
e -
9
24
.68
N
il6
-
Notes to the Consolidated Financial Statementsfor the year ended March 31, 2018
(All amounts in ` lakhs, unless otherwise stated)

P. 224
Am
ou
nt
ou
tsta
nd
ing
as
at
Eff
ec
tiv
e
inte
res
t ra
te
Co
up
on
ra
teN
um
be
r o
f in
sta
lme
nts
Te
rms
of
Re
pa
ym
en
t
Na
ture
of
Se
cu
rity
31
-Ma
r-1
83
1-M
ar-
17
31
-Ma
r-1
83
1-M
ar-
17
11
P
un
jab
Na
tio
na
l B
an
k (
So
ft
Lo
an
)
-
44
90
.46
A
t b
ase
ra
tes/
MC
LR
plu
s
ap
pli
cab
le s
pre
ad
.
Th
e in
tere
st
rate
as o
n 3
1.0
3.2
01
7
ran
ge
be
twe
en
11
.40
% t
o 1
2.2
5%
pe
r a
nn
um
. [se
e
no
te 4
3(i
)(A
)]
Nil
12
-
Se
cure
d b
y se
con
d c
ha
rge
on
all
fixe
d a
sse
ts o
f th
e
com
pa
ny
exc
ep
t R
am
ko
la
un
it (
wh
ere
SD
F h
old
s
se
con
d e
xclu
siv
e c
ha
rge
)
an
d t
hir
d c
ha
rge
on
fixe
d
asse
ts o
f R
am
ko
la u
nit
.
12
C
en
tra
l B
an
k o
f In
dia
(S
oft
Lo
an
) -
3
89
6.9
5
Nil
12
-
13
O
rie
nta
l B
an
k o
f C
om
me
rce
(So
ft L
oa
n)
-
66
7.8
0
Nil
12
-
14
C
an
ara
Ba
nk
(S
oft
Lo
an
) -
1
86
1.1
6
Nil
12
-
15
P
un
jab
Na
tio
na
l B
an
k
(Exc
ise
Du
ty L
oa
n)
25
56
.08
5
04
3.5
0
Inte
rest
fre
e l
oa
n
[se
e n
ote
43
(i)(
A)]
11
23
Eq
ua
ted
mo
nth
ly
insta
llm
en
ts u
pto
Fe
bru
ary
20
19
.
Se
cure
d b
y se
con
d c
ha
rge
on
fixe
d a
sse
ts o
f a
ll
bu
sin
ess u
nit
s e
xce
pt
Kh
ata
uli
an
d R
am
ko
la u
nit
s.
16
C
en
tra
l B
an
k o
f In
dia
(E
xcis
e
Du
ty L
oa
n)
11
61
.59
2
19
3.6
0
48
Eq
ua
l q
ua
rte
rly
insta
llm
en
ts u
pto
Ma
rch
20
19
.
Se
cure
d b
y se
con
d c
ha
rge
on
fixe
d a
sse
ts o
f a
ll
bu
sin
ess u
nit
s e
xce
pt
Kh
ata
uli
an
d R
am
ko
la u
nit
s.
17
A
xis B
an
k (
Ve
hic
le l
oa
n)
13
8.5
9
11
5.7
3
Ra
ng
ing
fro
m 7
.99
% t
o
10
.75
% p
.a.
At
fixe
d
rate
s r
an
gin
g
fro
m 7
.99
% t
o
10
.75
% p
.a.
4 t
o 6
2
mo
nth
s
4 t
o 7
4
mo
nth
s
Eq
ua
ted
mo
nth
ly
insta
llm
en
ts
Se
cure
d b
y h
ypo
the
cati
on
of
veh
icle
s a
cqu
ire
d u
nd
er
the
resp
ect
ive
ve
hic
le l
oa
ns.
18
IC
ICI B
an
k (
Ve
hic
le l
oa
n)
2.8
8
14
.04
19
P
NB
Ba
nk
(V
eh
icle
lo
an
) 2
8.9
3
33
.64
20
Ye
s B
an
k (
Ve
hic
le l
oa
n)
48
.69
-
12
56
5.5
5
47
49
0.8
4
Te
rm l
oa
ns
fro
m b
an
ks
(U
S$
lo
an
s)
1
Ra
tna
ka
r B
an
k L
imit
ed
(F
CT
L )
35
25
.55
-
8
.50
% p
.a.
At
US
D 6
M L
ibo
r
+1
.95
% p
.a.
6N
ilE
qu
al
qu
art
erl
y
insta
llm
en
t u
pto
Se
cure
d b
y fi
rst
pa
ri-
pa
ssu
ch
arg
e c
rea
ted
/ t
o
be
cre
ate
d b
y e
qu
ita
ble
mo
rtg
ag
e o
n im
mo
vea
ble
asse
ts a
nd
hyp
oth
eca
tio
n
of
all
mo
vea
ble
asse
ts, b
oth
pre
se
nt
an
d f
utu
re o
f th
e
Co
mp
an
y su
bje
ct t
o b
an
ke
rs
pri
or
cha
rge
s c
rea
ted
/ t
o b
e
cre
ate
d o
n c
urr
en
t a
sse
ts
for
pro
vid
ing
wo
rkin
g c
ap
ita
l
faci
liti
es a
nd
exc
lud
ing
asse
ts p
urc
ha
se
d u
nd
er
veh
icle
lo
an
sch
em
e.
35
25
.55
-
To
tal
term
lo
an
s f
rom
ba
nk
s 1
60
91
.10
4
74
90
.84
Te
rm l
oa
ns
fro
m o
the
r p
art
ies
(` l
oa
ns
)
1
Da
imle
r F
ina
nci
al
Se
rvic
es P
vt.
Ltd
. (V
eh
icle
lo
an
)
19
.88
-
6
.86
% p
.a.
At
fixe
d r
ate
of
6.8
6%
p.a
.
28
Nil
Eq
ua
ted
mo
nth
ly
insta
llm
en
ts
Se
cure
d b
y h
ypo
the
cati
on
of
veh
icle
s a
cqu
ire
d u
nd
er
the
resp
ect
ive
ve
hic
le l
oa
ns.
2
Oth
er
Lo
an
s -
Su
ga
r
De
velo
pm
en
t F
un
d,
Go
vt. o
f In
dia
21
5.8
9
41
2.4
5
12
.5%
p.a
.2
% b
elo
w t
he
Ba
nk
Ra
te a
t
pre
se
nt
4%
[se
e n
ote
43
(i)(
A)]
Yea
rly
- 1
Ha
lf y
ea
rly
- N
il
Yea
rly
- 2
Ha
lf y
ea
rly
- N
il
Yea
rly
an
d h
alf
ye
arl
y
insta
llm
en
ts u
pto
Se
pte
mb
er
20
18
Se
cure
d b
y e
xclu
siv
e
se
con
d c
ha
rge
cre
ate
d o
ver
mo
vea
ble
/im
mo
vea
ble
asse
ts o
f R
am
ko
la u
nit
.
To
tal
term
lo
an
s f
rom
oth
er
pa
rtie
s 2
35
.77
4
12
.45
To
tal
loa
ns
16
32
6.8
7
47
90
3.2
9
Notes to the Consolidated Financial Statementsfor the year ended March 31, 2018
(All amounts in ` lakhs, unless otherwise stated)

P. 225
Annual Report 2017-18
102-266 | Finan
cial Statemen
ts24-101 | Statu
tory R
epo
rts02-17 | C
orp
orate O
verview18-23 | M
anag
emen
t Statemen
ts
NOTE 17: OTHER FINANCIAL LIABILITIES
As at 31-Mar-18 As at 31-Mar-17
Current Non-current Current Non- current
At amortised cost
Current maturities of long-term borrowings
(refer note 16) 12831.59 - 20367.06 -
Interest accrued 96.00 0.10 187.95 30.62
Capital creditors 744.60 - 699.24 -
Employee benefits & other dues payable 2371.67 - 3044.13 -
Security deposits (see (i) below) 374.35 - 357.35 -
Unpaid dividends (see (ii) below) 3.48 - 5.00 -
Unclaimed interest on deposits (see (ii) below) - - 0.21 -
Total other financial liabilities at amortised
cost [A] 16421.69 0.10 24660.94 30.62
At fair value through Profit or Loss
(refer note 42)
Derivatives financial instruments carried
at fair value
- Foreign-exchange forward contracts/
Currency swaps/Interest rate swaps 3.96 - 84.88 -
Total other financial liabilities at FVTPL [B] 3.96 - 84.88 -
Total other financial liabilities ([A]+[B]) 16425.65 0.10 24745.82 30.62
(i) Security deposits as at 31 March 2018 include ` 316.00 lakhs (31 March 2017 : ` 298.00 lakhs) deposits from sugar selling
agents which are interest bearing subject to fullfilment of terms and conditions. These deposits are repayable on cessation of
contractual arrangements. Interest payable is normally settled annually.
(ii) There are no amounts as at the end of the year which are due and outstanding to be credited to the Investors Education and
Protection Fund.
NOTE 18: PROVISIONS
As at 31-Mar-18 As at 31-Mar-17
Current Non-current Current Non- current
Provision for employee benefits
Gratuity (refer note 38) 203.63 3078.47 216.79 3033.05
Compensated absences 321.49 891.01 325.57 829.96
Other Provisions
Warranty 838.49 - 491.25 -
Cost to completion 314.29 - 20.00 -
Arbitration/Court case claims 254.19 - 278.79 -
Total provisions 1932.09 3969.48 1332.40 3863.01
Notes to the Consolidated Financial Statementsfor the year ended March 31, 2018
(All amounts in ` lakhs, unless otherwise stated)

P. 226
(i) Information about individual provisions and significant estimates
(a) Warranty
The Company provides warranties on certain products and services, undertaking to repair or replace the items that fail to
perform satisfactorily during the warranty period. Provisions made represent the amount of expected cost of meeting such
obligations of rectifications / replacements based on best estimate considering the historical warranty claim information
and any recent trends that may suggest future claims could differ from historical amounts. The timing of the outflows is
expected to be within the period of two years.
(b) Cost to completion
The provision represents costs of materials and services required for integration of water treatment package at the site
(the revenue of which has been fully recognised), prior to commissioning.
(c) Arbitration / Court-case Claims
Represents the provision made towards certain claims awarded against the company in legal proceedings which have
been challenged by the Company before appropriate authorities. The timing of the outflows is uncertain.
(ii) Movement in provisions
Movement in each class of provision are set out below:
Year ended 31-Mar-18 Year ended31-Mar-17
Warranty Cost to
completion
Arbitration/
Court case
claims
Warranty Cost to
completion
Arbitration/
Court case
claims
Balance at the beginning of the year 491.25 20.00 278.79 253.02 30.00 265.23
Additional provisions recognised 376.04 314.29 10.40 371.50 20.00 13.56
Amounts used during the year (13.55) - (35.00) (79.93) - -
Unused amounts reversed during the year (15.25) (20.00) - (53.34) (30.00) -
Balance at the end of the year 838.49 314.29 254.19 491.25 20.00 278.79
NOTE 19: OTHER LIABILITIES
As at 31-Mar-18 As at 31-Mar-17
Current Non-current Current Non- current
Advance from customers 3478.22 - 3812.32 -
Deferred revenue arising from government grant
related to assets (refer note 43) 1.33 149.13 - -
Deferred revenue arising from government grant
related to income (refer note 43) 250.87 - 711.36 250.84
Amount due to customers under construction
contracts [refer note 10(i)] 1034.35 - 554.51 -
Statutory remittances 3174.90 - 11855.84 -
Miscellaneous other payables 52.02 - 54.16 -
Total other liabilities 7991.69 149.13 16988.19 250.84
Notes to the Consolidated Financial Statementsfor the year ended March 31, 2018
(All amounts in ` lakhs, unless otherwise stated)

P. 227
Annual Report 2017-18
102-266 | Finan
cial Statemen
ts24-101 | Statu
tory R
epo
rts02-17 | C
orp
orate O
verview18-23 | M
anag
emen
t Statemen
ts
NOTE 20: CURRENT BORROWINGS
As at
31-Mar-18
As at
31-Mar-17
Secured- at amortised cost
Repayable on demand
- Cash credits/working capital demand loans from banks (see (i) below) 105557.23 122543.89
Unsecured- at amortised cost
Other loans
- Foreign currency loans (buyers' credits) from banks (see (ii) below) 2090.00 1666.03
Total current borrowings 107647.23 124209.92
(i) Cash credit/working capital demand loans from banks are secured by pledge/hypothecation of the stock-in-trade, raw material,
stores and spare parts, work-in-progress and trade receivables and second charge created/to be created on the properties
of all the Engineering units and third charge on the properties of Sugar, Co-Generation and Distillery units of the Company on
pari-passu basis. It also included working capital demand loans of ` 15000.00 lakhs availed during last year with outstanding
balance as at 31 March 2018 ` Nil (31 March 2017: ` 15000.00 lakhs, which were secured by sub-servient charge on the current
assets of the Company by way of hypothecation. Interest rates on cash credits and working capital demand loans availed at the
year end majorly ranges between 8.5% to 9.85% (weighted average interest rate : 8.62% p.a.).
(ii) The weighted average effective interest rate on foreign currency loans (buyers’ credits) from banks is 2.72% per annum.
NOTE 21: TRADE PAYABLES
As at
31-Mar-18
As at
31-Mar-17
Trade payables (at amortised cost)
- Total outstanding dues of micro enterprises and
small enterprises (refer note 49) 43.42 37.35
- Total outstanding dues of creditors other than
micro enterprises and small enterprises 62763.03 25621.59
Total trade payables 62806.45 25658.94
NOTE 22: INCOME TAX BALANCES
As at 31-Mar-18 As at 31-Mar-17
Current Non-current Current Non-current
Income tax assets
Tax refund receivable (net) - 5735.12 - 2920.15
- 5735.12 - 2920.15
Income tax liabilities
Provision for income tax (net) - - 264.78 -
- - 264.78 -
NOTE 23: DEFERRED TAX BALANCES
As at
31-Mar-18
As at
31-Mar-17
Deferred tax assets 12357.06 14144.98
Deferred tax liabilities (16528.82) (16487.28)
Net deferred tax assets/(liabilities) (4171.76) (2342.30)
Notes to the Consolidated Financial Statementsfor the year ended March 31, 2018
(All amounts in ` lakhs, unless otherwise stated)

P. 228
(i) Movement in deferred tax balances
For the year ended 31 March 2018
Opening
balance
Recognised in
profit or loss
Recognised
in OCI
Closing
balance
Tax effect of items constituting deferred tax
assets/ (liabilities)
Difference in carrying values of property, plant &
equipment and intangible assets (16487.28) (41.54) - (16528.82)
Difference in carrying values of investment
property 216.67 48.42 - 265.09
Liabilities and provisions tax deductible only upon
payment/actual crystallisation
- Employee benefits 1602.47 47.37 (64.41) 1585.43
- Statutory taxes and duties 961.19 (776.49) - 184.70
- Interest payable to banks/financial
institutions 32.19 (32.19) - -
- Other contractual provisions 272.91 164.72 - 437.63
Impairment provisions of financial assets made
in books, but tax deductible only on actual
write-off 1120.43 (308.66) - 811.77
Other temporary differences 16.09 (12.93) - 3.16
Unutilised tax losses 4057.73 (4057.73) - -
Unutilised tax credits 5865.30 3203.98 - 9069.28
Net deferred tax assets/(liabilities) (2342.30) (1765.05) (64.41) (4171.76)
For the year ended 31 March 2017
Opening
balance
Recognised in
profit or loss
Recognised
in OCI
Closing
balance
Tax effect of items constituting deferred tax
assets/ (liabilities)
Difference in carrying values of property, plant &
equipment and intangible assets (16539.21) 51.93 - (16487.28)
Difference in carrying values of investment
property 201.86 14.81 - 216.67
Expense provided in books, but tax deductible
only upon payment/actual crystallisation
- Employee benefits 1240.25 124.79 237.43 1602.47
- Statutory taxes and duties 359.19 602.00 - 961.19
- Interest payable to banks/financial
institutions 47.62 (15.43) - 32.19
- Other contractual provisions 188.32 84.59 - 272.91
Impairment provisions of financial assets
made in books, but tax deductible only on
actual write-off 2202.69 (1082.26) - 1120.43
Other temporary differences 114.91 (98.82) - 16.09
Unutilised tax losses 12184.37 (8126.64) - 4057.73
Unutilised tax credits - 5865.30 - 5865.30
Net deferred tax assets/(liabilities) - (2579.73) 237.43 (2342.30)
Notes to the Consolidated Financial Statementsfor the year ended March 31, 2018
(All amounts in ` lakhs, unless otherwise stated)

P. 229
Annual Report 2017-18
102-266 | Finan
cial Statemen
ts24-101 | Statu
tory R
epo
rts02-17 | C
orp
orate O
verview18-23 | M
anag
emen
t Statemen
ts
(ii) Unrecognised deductible temporary differences, unused tax losses and unused tax credits
Deferred tax assets have not been recognised in respect of following items, because it is not probable that future taxable profit
will be available against which the Group can use the benefit therefrom.
As at
31-Mar-18
As at
31-Mar-17
Tax effect on unused tax losses (long term capital loss) (see table below for expiry) 569.50 888.96
Net deferred tax assets/(liabilities) 569.50 888.96
Expiry profile of unrecognised unused tax losses
Unused tax losses (long term capital loss) shall expire on -
March 31, 2018 - 319.46
March 31, 2019 557.16 557.16
March 31, 2020 0.57 0.57
March 31, 2021 11.77 11.77
569.50 888.96
NOTE 24 : REVENUE FROM OPERATIONS
Year ended
31-Mar-18
Year ended
31-Mar-17
Sale of products [refer note 37(vii) and note 52(i)]
Finished goods 321611.96 276238.01
Stock-in-trade 1627.41 1488.20
Sale of services
Erection and commissioning 22.90 57.75
Servicing 262.65 288.20
Operation and maintenance 3927.25 3472.07
Construction contract revenue 12324.57 14012.33
Other operating revenue
Income from sale of renewable energy certificates 1311.48 1026.93
Export incentives [refer note 43(i)(B)] 78.03 23.49
Income from scrap 72.12 79.63
Total revenue from operations 341238.37 296686.61
NOTE 25: OTHER INCOME
Year ended
31-Mar-18
Year ended
31-Mar-17
Interest income
Interest income from bank deposits (at amortised cost) 61.16 53.78
Interest income from customers (at amortised cost) 31.03 20.68
Interest income from financial assets carried at amortised cost 15.12 27.82
Interest income from investments carried at FVTPL 12.28 15.72
Interest income from others 5.07 541.56
124.66 659.56
Dividend income
Dividend income from equity investments 4.66 2.94
4.66 2.94
Notes to the Consolidated Financial Statementsfor the year ended March 31, 2018
(All amounts in ` lakhs, unless otherwise stated)

P. 230
Year ended
31-Mar-18
Year ended
31-Mar-17
Other non-operating income (net of expenses directly attributable to such income)
Rental income (refer note 4 (ii)) 52.50 24.89
Subsidy from U.P. Government [refer note 43(i)(A)] 0.99 -
Miscellaneous income 1063.89 827.13
1117.38 852.02
Other gains/(losses)
Net fair value gains/(losses) on investments 23.16 97.44
Net gains/(losses) on derivatives 19.85 (97.28)
Net foreign exchange rate fluctuation gains - 75.06
Credit balances written back 156.99 154.50
Net profit/(loss) on sale / redemption of investments 0.60 (0.65)
Net reversal of impairment loss allowance on non financial assets (includes amounts
written off 31 March 2017 : `1009.60 lakhs) (refer note 10) - 918.34
Excess provision for cost to completion reversed (net) (refer note 18) - 10.00
Excess provision of expenses reversed 96.73 41.77
297.33 1199.18
Total other income 1544.03 2713.70
NOTE 26: COST OF MATERIALS CONSUMED
Year ended
31-Mar-18
Year ended
31-Mar-17
Stock at the beginning of the year 3065.44 2015.42
Add: Purchases 257798.52 207518.79
Less: Amount capitalised (included in the cost of property, plant and equipment) (19.63) (22.70)
Less: Stock at the end of the year (2698.80) (3065.44)
Total cost of materials consumed (refer note 43(i)(B) and 43(ii)) 258145.53 206446.07
NOTE 27: PURCHASES OF STOCK-IN-TRADE
Year ended
31-Mar-18
Year ended
31-Mar-17
Petroleum goods 1635.88 1477.98
Consumer goods 38.36 58.95
Total purchases of stock-in-trade 1674.24 1536.93
NOTE 28: CHANGES IN INVENTORIES OF FINISHED GOODS, STOCK-IN-TRADE AND WORK-IN-PROGRESS
Year ended
31-Mar-18
Year ended
31-Mar-17
Inventories at the beginning of the year:
Finished goods 158669.55 134424.77
Stock-in-trade 18.06 10.38
Work-in-progress 2669.25 1723.95
Certified emission reduction 3.16 2.95
Total inventories at the beginning of the year 161360.02 136162.05
Notes to the Consolidated Financial Statementsfor the year ended March 31, 2018
(All amounts in ` lakhs, unless otherwise stated)

P. 231
Annual Report 2017-18
102-266 | Finan
cial Statemen
ts24-101 | Statu
tory R
epo
rts02-17 | C
orp
orate O
verview18-23 | M
anag
emen
t Statemen
ts
Year ended
31-Mar-18
Year ended
31-Mar-17
Inventories at the end of the year:
Finished goods 148847.59 158669.55
Stock-in-trade 31.47 18.06
Work-in-progress 3157.30 2669.25
Certified emission reduction 0.77 3.16
Total inventories at the end of the year 152037.13 161360.02
Add/(Less): Impact of excise duty on finished goods (10189.01) 1247.15
Total changes in inventories of finished goods, stock-in-trade and work-in-progress (866.12) (23950.82)
NOTE 29: EMPLOYEE BENEFIT EXPENSE
Year ended
31-Mar-18
Year ended
31-Mar-17
Salaries and wages 17844.68 16709.25
Contribution to provident and other funds (refer note 38) 1874.96 1640.57
Staff welfare expenses 528.89 435.39
20248.53 18785.21
Less: Amount capitalised (included in the cost of property, plant and equipment) (8.19) (13.73)
Total employee benefit expense 20240.34 18771.48
NOTE 30: FINANCE COSTS
Year ended
31-Mar-18
Year ended
31-Mar-17
Interest costs
- Interest on loans with interest subvention [refer note 43(i)(A)] 216.52 894.08
- Interest on loans with below-market rate of interest [refer note 43(i)(A)] 12.74 21.72
- Interest on other borrowings 8131.15 11586.37
- Other interest expense 88.81 139.36
Total interest expense on financial liabilities not classified as at FVTPL 8449.22 12641.53
Less : Amount capitalised (included in the cost of property, plant and equipment) - (0.48)
8449.22 12641.05
Exchange differences regarded as an adjustment to borrowing costs 76.36 1.68
Other borrowing costs
- Loan monitoring and administration charges 8.39 12.71
Total finance costs 8533.97 12655.44
NOTE 31: DEPRECIATION AND AMORTISATION EXPENSE
Year ended
31-Mar-18
Year ended
31-Mar-17
Depreciation of property, plant and equipment (refer note 3) 5485.65 5652.42
Amortisation of intangible assets (refer note 5) 56.00 77.17
5541.65 5729.59
Less: Amount capitalised (included in the cost of property, plant and equipment) (5.10) (8.60)
Total depreciation and amortisation expense 5536.55 5720.99
Notes to the Consolidated Financial Statementsfor the year ended March 31, 2018
(All amounts in ` lakhs, unless otherwise stated)

P. 232
NOTE 32: IMPAIRMENT LOSS ON FINANCIAL ASSETS (INCLUDING REVERSALS OF IMPAIRMENT LOSSES)
Year ended
31-Mar-18
Year ended
31-Mar-17
Bad debts written off - trade receivables and other financial assets carried
at amortised cost 607.12 2215.18
Impairment loss allowance on trade receivables (net of reversals) (refer note 7) (887.88) (1537.04)
Impairment loss allowance on other financial assets carried at amortised cost (net of
reversals) (refer note 8 & 9) (1.89) (42.31)
Total impairment loss on financial assets (including reversal of impairment losses) (282.65) 635.83
NOTE 33: OTHER EXPENSES
Year ended
31-Mar-18
Year ended
31-Mar-17
Stores and spares consumed 2869.21 2256.11
Power and fuel 1831.37 1806.55
Design and engineering charges 122.07 90.10
Cane development expenses 280.59 326.85
Machining/fabrication expenses 79.26 94.30
Erection and commissioning expenses 426.21 600.71
Civil construction charges 4176.06 4271.28
Packing and stacking expenses 3942.22 2836.34
Repairs and maintenance
- Machinery 4039.99 3717.80
- Building 380.32 261.02
- Others 346.49 441.58
Factory/operational expenses 1903.80 1517.18
Travelling and conveyance 1334.70 1334.77
Rent (refer note 46 (ii)) 591.09 594.17
Rates and taxes 654.86 1081.59
Insurance 269.41 244.87
Directors' fee 30.45 36.90
Legal and professional expenses 932.52 692.66
Security service expenses 1247.40 1062.92
Net impairment loss allowance on non financial assets (includes amounts written off 31
March 2018: ` 83.00 lakhs) (refer note 10) 103.95 -
Net foreign exchange rate fluctuation losses 231.42 -
Warranty expenses [includes provision for warranty (net) ` 360.79 lakhs (31 March 2017:
` 318.16 lakhs) (refer note 18)] 368.49 320.73
Liquidated damages charges 310.56 -
Provision for Arbitration/Court case claims (refer note 18) 10.40 13.56
Provision for cost to completion on construction contracts (net) (refer note 18) 294.29 -
Payment to Auditors (see (i) below) 70.77 123.65
Provision for non moving / obsolete inventory 77.24 95.30
Loss on sale /write off of inventory 33.57 24.39
Loss on sale / write off / impairment of property, plant and equipment 32.88 82.15
Selling commission 859.41 719.26
Notes to the Consolidated Financial Statementsfor the year ended March 31, 2018
(All amounts in ` lakhs, unless otherwise stated)

P. 233
Annual Report 2017-18
102-266 | Finan
cial Statemen
ts24-101 | Statu
tory R
epo
rts02-17 | C
orp
orate O
verview18-23 | M
anag
emen
t Statemen
ts
Year ended
31-Mar-18
Year ended
31-Mar-17
Royalty 236.99 189.50
Advertisement and sales promotion 30.78 37.30
Rebate and discount 19.67 27.07
Outward freight and forwarding 638.41 488.36
Other selling expenses 302.26 61.54
Miscellaneous expenses 1512.34 1419.56
Less : Amount capitalised (included in the cost of property, plant and equipment) (20.58) (9.03)
Total other expenses 30570.87 26861.04
(i) Detail of payment to auditors
Statutory Auditors Branch Auditors Cost Auditors
Year ended
31-Mar-18
Year ended
31-Mar-17
Year ended
31-Mar-18
Year ended
31-Mar-17
Year ended
31-Mar-18
Year ended
31-Mar-17
Audit fee 41.74 46.26 - 6.92 3.75 3.38
Tax audit fee - 18.89 - 3.41 - -
Limited review fee 17.01 21.03 0.91 2.73 - -
Other services (Certification) 0.30 9.56 0.10 1.10 0.50 0.68
Reimbursement of expenses 4.36 5.50 1.71 4.10 0.39 0.09
Total payment to auditors 63.41 101.24 2.72 18.26 4.64 4.15
NOTE 34: EXCEPTIONAL ITEMS
Year ended
31-Mar-18
Year ended
31-Mar-17
Write off of incentives recoverable under UP Sugar Promotion Policy 2004
[refer note 43(iii)] - (8546.74)
Total exceptional items - (8546.74)
NOTE 35: INCOME TAX EXPENSE
(i) Income tax recognised in profit or loss
Year ended
31-Mar-18
Year ended
31-Mar-17
Current tax
In respect of the current year 3065.82 2336.57
In respect of the prior years 138.81 -
Total current tax expense 3204.63 2336.57
Deferred tax
In respect of current year origination and reversal of temporary differences * 1765.05 2579.73
Total deferred tax expense 1765.05 2579.73
Total income tax expense recognised in profit or loss 4969.68 4916.30
* includes MAT credit entitlement of ` 3203.97 lakhs (31 March 2017: ` 2335.63 lakhs).
Notes to the Consolidated Financial Statementsfor the year ended March 31, 2018
(All amounts in ` lakhs, unless otherwise stated)

P. 234
Reconciliation of income tax expense and the accounting profit multiplied by Company’s tax rate:
Year ended
31-Mar-18
Year ended
31-Mar-17
Profit before tax 16883.69 30212.42
Income tax expense calculated at 34.608% (including surcharge and education cess)
(2017: 34.608%) 5843.11 10455.91
Changes in tax rate 145.75 -
Effect of income that is exempt from taxation (12.92) (581.49)
Effect of income that is taxable at lower rates (3.11) -
Effect of expenses that is non-deductible in determining taxable profit 90.26 3020.16
Effect of tax incentives and concessions (1262.93) -
Effect of recognition of previously unrecognised tax losses now recognised as deferred
tax assets - (3663.64)
Changes in recognised deductible temporary differences (46.03) -
Changes in estimates related to prior years 845.76 -
Effect of different tax rates for subsidiaries 0.35 (0.14)
Effect of tax on share of profit of associates (630.56) (784.83)
Recognition of unutilised tax credits - (3529.67)
Total income tax expense recognised in profit or loss 4969.68 4916.30
(ii) Income tax recognised in other comprehensive income
Year ended
31-Mar-18
Year ended
31-Mar-17
Deferred tax related to items recognised in other comprehensive income during
the year:
Remeasurement of defined benefit obligations 64.41 (237.43)
Total income tax expense recognised in other comprehensive income 64.41 (237.43)
Bifurcation of the income tax recognised in other comprehensive income into:
Items that will not be reclassified to profit or loss 64.41 (237.43)
Items that may be reclassified to profit or loss - -
Total income tax expense recognised in other comprehensive income 64.41 (237.43)
NOTE 36: EARNINGS PER SHARE
Year ended
31-Mar-18
Year ended
31-Mar-17
Profit for the year attributable to owners of the Company [A] 11914.01 25296.12
Weighted average number of equity shares for the purposes of basic EPS/ diluted EPS [B] 25,79,45,110 25,79,45,110
Basic earnings per share (face value of ` 1 per share) [A/B] 4.62 9.81
Diluted earnings per share (face value of ` 1 per share) [A/B] 4.62 9.81
Notes to the Consolidated Financial Statementsfor the year ended March 31, 2018
(All amounts in ` lakhs, unless otherwise stated)

P. 235
Annual Report 2017-18
102-266 | Finan
cial Statemen
ts24-101 | Statu
tory R
epo
rts02-17 | C
orp
orate O
verview18-23 | M
anag
emen
t Statemen
ts
NOTE 37: SEGMENT INFORMATION
(i) Description of segments and principal activities
The operating segments are classified under two major businesses which the Group is engaged in, and are briefly described
as under:
Sugar & Allied Business
(a) Sugar : The Group is a manufacturer of white crystal sugar, having seven manufacturing plants situated in the states of
Uttar Pradesh. The sugar is sold to wholesalers and industrial users. The Group sells the surplus molasses and bagasse,
which are produced as by-products in the manufacturing of sugar, after meeting its captive requirements. The Group also
sells the surplus power incidentally produced at three of its sugar units.
(b) Co-generation : This segment uses captively produced bagasse, generated as a by-product in the manufacture of sugar,
as a feed stock and apart from meeting the power and steam requirements of the associated sugar units, also exports
power to the state grid. It has installed capacity of 68 MW spread over Khatauli and Deoband sugar mills.
(c) Distillery : The 160 kilo-litres per day capacity distillery located at Muzaffarnagar, Uttar Pradesh, uses captive molasses
produced in manufacture of sugar as the principal raw material in production of various categories of alcohol.
Engineering Business
(a) Gears : This business segment is focused on all high speed and niche low speed products - supply of new equipment as
well as providing replacement solutions for power sector, having its manufacturing facility located at Mysore, Karnataka.
(b) Water/Wastewater treatment : The business segment operates from Noida, Uttar Pradesh and provides engineered to
order process equipment and comprehensive solutions in the water and wastewater management.
The ‘Other Operations’ mainly include trading of various packaged fast moving consumer goods under the Company’s
brand name (including sugar) and retailing of diesel/petrol through a Group operated fuel station. It also operate a turnkey
project relating to steam turbines which was awarded to it pursuant to bids tendered prior to demerger of business of
steam turbine.
The above reportable segments have been identified based on the significant components of the enterprise for which
discrete financial information is available and are reviewed by the Chief operating decision maker (CODM) to assess the
performance and allocate resources to the operating segments.
There are no geographical segments as the volume of exports is not significant and the major turnover of the Group takes
place indigenously. There is no major reliance on a few customers or suppliers.
Notes to the Consolidated Financial Statementsfor the year ended March 31, 2018
(All amounts in ` lakhs, unless otherwise stated)

P. 236
(ii)
S
eg
me
nt
rev
en
ue
an
d s
eg
me
nt
pro
fit
SUGA
REN
GIN
EERI
NG
OTH
ERS
Elim
inat
ions
Tota
lSu
gar
Co-g
ener
atio
nDi
still
ery
Tota
l Sug
arGe
ars
Wat
erTo
tal E
ngin
eeri
ngOt
her
Oper
atio
ns
Year
end
ed
31-M
ar-1
8
Year
end
ed
31-M
ar-1
7
Year
end
ed
31-M
ar-1
8
Year
end
ed
31-M
ar-1
7
Year
end
ed
31-M
ar-1
8
Year
end
ed
31-M
ar-1
7
Year
end
ed
31-M
ar-1
8
Year
end
ed
31-M
ar-1
7
Year
end
ed
31-M
ar-1
8
Year
end
ed
31-M
ar-1
7
Year
end
ed
31-M
ar-1
8
Year
end
ed
31-M
ar-1
7
Year
end
ed
31-M
ar-1
8
Year
end
ed
31-M
ar-1
7
Year
end
ed
31-M
ar-1
8
Year
end
ed
31-M
ar-1
7
Year
end
ed
31-M
ar-1
8
Year
end
ed
31-M
ar-1
7
Year
end
ed
31-M
ar-1
8
Year
end
ed
31-M
ar-1
7
REV
ENUE
From
ext
erna
l cus
tom
ers
285
303.
72
2401
26.5
6 9
733.
01
699
2.72
1
1534
.06
167
91.7
0 3
0657
0.79
26
3910
.98
111
12.4
9 9
136.
45
175
66.9
6 1
8120
.70
286
79.4
5 2
7257
.15
598
8.13
5
518.
48
- -
341
238.
37
2966
86.6
1
From
inte
r-se
gmen
ts
sale
s 1
4659
.82
209
51.9
4 1
1783
.27
112
68.5
5 5
5.12
4
.28
264
98.2
1 3
2224
.77
64.
31
79.
49
- 2
.20
64.
31
81.
69
99.
41
99.
38
(266
61.9
3) (3
2405
.84)
- -
Tota
l rev
enue
from
oper
atio
ns
2999
63.5
4 26
1078
.50
215
16.2
8 1
8261
.27
115
89.1
8 1
6795
.98
3330
69.0
0 29
6135
.75
111
76.8
0 9
215.
94
175
66.9
6 1
8122
.90
287
43.7
6 2
7338
.84
608
7.54
5
617.
86 (
2666
1.93
)(3
2405
.84)
3412
38.3
7 29
6686
.61
RESU
LT
Segm
ent P
rofit
/(los
s)
115
59.1
5 3
6491
.16
988
9.76
6
942.
11
267
4.06
4
657.
17
241
22.9
7 4
8090
.44
314
2.49
1
801.
98
(139
4.68
) (2
75.0
1) 1
747.
81
152
6.97
2
0.05
3
0.55
2
5890
.83
496
47.9
6
Unal
loca
ted
expe
nses
(Net
) (2
424.
50)
(116
3.62
)
Fina
nce
cost
(8
533.
97)
(126
55.4
4)
Inte
rest
inco
me
124
.66
659
.56
Divi
dend
inco
me
4.6
6 2
.94
Exce
ptio
nal i
tem
s -
(854
6.74
)
Shar
e of
pro
fit o
f
asso
ciat
es
182
2.01
2
267.
76
Profi
t bef
ore
tax
168
83.6
9 3
0212
.42
Curr
ent t
ax
(320
4.63
) (2
336.
57)
Defe
rred
tax
(176
5.05
) (2
579.
73)
Profi
t for
the
year
1
1914
.01
252
96.1
2
- T
he
acc
ou
nti
ng
po
lici
es o
f th
e r
ep
ort
ab
le s
eg
me
nts
are
th
e s
am
e a
s t
he
Gro
up
’s a
cco
un
tin
g p
oli
cie
s d
escr
ibe
d in
no
te 1
.
- S
eg
me
nt
pro
fit
is t
he
me
asu
re r
ep
ort
ed
to
th
e c
hie
f o
pe
rati
ng
de
cisio
n m
ake
r fo
r th
e p
urp
ose
s o
f re
so
urc
e a
llo
cati
on
an
d a
sse
ssm
en
t o
f S
eg
me
nt
pe
rfo
rma
nce
.
- In
ter-
Se
gm
en
t tr
an
sfe
rs a
re p
rice
d b
ase
d o
n c
om
pe
titi
ve m
ark
et
pri
ces o
r d
ete
rmin
ed
to
yie
ld a
de
sir
ed
ma
rgin
or
ag
ree
d o
n a
ne
go
tia
ted
ba
sis
.
- S
eg
me
nt
pro
fit
is t
he
Se
gm
en
t re
ven
ue
le
ss S
eg
me
nt
exp
en
se
s. S
eg
me
nt
exp
en
se
s in
clu
de
all
exp
en
se
s d
ire
ctly
att
rib
uta
ble
to
th
e s
eg
me
nts
an
d p
ort
ion
of
the
en
terp
rise
exp
en
se
s t
ha
t ca
n
be
all
oca
ted
on
a r
ea
so
na
ble
ba
sis
to
th
e s
eg
me
nts
.
- F
ina
nce
inco
me
an
d c
osts
an
d f
air
va
lue
ga
ins &
losse
s o
n fi
na
nci
al a
sse
ts a
re n
ot
all
oca
ted
to
ind
ivid
ua
l se
gm
en
ts a
s t
he
un
de
rlyi
ng
instr
um
en
ts a
re m
an
ag
ed
on
a G
rou
p b
asis
. Cu
rre
nt
taxe
s,
de
ferr
ed
ta
xes a
nd
ce
rta
in fi
na
nci
al
asse
ts a
nd
lia
bil
itie
s, i
ncl
ud
ing
bo
rro
win
gs a
re a
lso
no
t a
llo
cate
d t
o s
eg
me
nts
sin
ce t
he
se
are
als
o m
an
ag
ed
on
a G
rou
p b
asis
.
(iii
) S
eg
me
nt
as
se
ts a
nd
lia
bil
itie
s
SUGA
REN
GIN
EERI
NG
OTH
ERS
Elim
inat
ions
Tota
lSu
gar
Co-g
ener
atio
nDi
still
ery
Tota
l Sug
arGe
ars
Wat
erTo
tal E
ngin
eeri
ngOt
her
Oper
atio
ns
Year
end
ed
31-M
ar-1
8
Year
end
ed
31-M
ar-1
7
Year
end
ed
31-M
ar-1
8
Year
end
ed
31-M
ar-1
7
Year
end
ed
31-M
ar-1
8
Year
end
ed
31-M
ar-1
7
Year
end
ed
31-M
ar-1
8
Year
end
ed
31-M
ar-1
7
Year
end
ed
31-M
ar-1
8
Year
end
ed
31-M
ar-1
7
Year
end
ed
31-M
ar-1
8
Year
end
ed
31-M
ar-1
7
Year
end
ed
31-M
ar-1
8
Year
end
ed
31-M
ar-1
7
Year
end
ed
31-M
ar-1
8
Year
end
ed
31-M
ar-1
7
Year
end
ed
31-M
ar-1
8
Year
end
ed
31-M
ar-1
7
Year
end
ed
31-M
ar-1
8
Year
end
ed
31-M
ar-1
7
ASS
ETS
Seg
men
t ass
ets
216
827.
06
2259
98.9
7 1
5914
.66
179
40.2
9 1
2356
.93
170
26.6
7 2
4509
8.65
26
0965
.93
143
40.0
2 1
2292
.06
242
29.5
5 2
1589
.52
385
69.5
7 3
3881
.58
170
8.98
2
383.
07
- -
285
377.
20
2972
30.5
8
Una
lloca
ted
asse
ts
178
46.8
7 1
3530
.84
Tot
al a
sset
s 21
6827
.06
2259
98.9
7 1
5914
.66
179
40.2
9 1
2356
.93
170
26.6
7 24
5098
.65
2609
65.9
3 1
4340
.02
122
92.0
6 2
4229
.55
215
89.5
2 3
8569
.57
338
81.5
8 1
708.
98
238
3.07
-
- 30
3224
.07
3107
61.4
2
LIA
BILI
TIES
Seg
men
t lia
bilit
ies
595
54.6
6 3
6133
.45
420
.90
355
.92
835
.71
979
.50
608
11.2
7 3
7468
.87
334
6.40
1
863.
94
129
21.7
1 1
0024
.69
162
68.1
1 1
1888
.63
135
8.86
1
963.
04
- -
784
38.2
4 5
1320
.54
Una
lloca
ted
liabi
litie
s 1
3015
0.62
17
5902
.51
Tot
al li
abili
ties
595
54.6
6 3
6133
.45
420
.90
355
.92
835
.71
979
.50
608
11.2
7 3
7468
.87
334
6.40
1
863.
94
129
21.7
1 1
0024
.69
162
68.1
1 1
1888
.63
135
8.86
1
963.
04
- -
2085
88.8
6 22
7223
.05
- T
he
acc
ou
nti
ng
po
lici
es o
f th
e r
ep
ort
ab
le s
eg
me
nts
are
th
e s
am
e a
s t
he
Gro
up
’s a
cco
un
tin
g p
oli
cie
s d
escr
ibe
d in
no
te 1
.
- A
ll a
sse
ts a
re a
llo
cate
d t
o r
ep
ort
ab
le s
eg
me
nts
oth
er
tha
n in
vestm
en
ts, l
oa
ns, c
ert
ain
fin
an
cia
l a
sse
ts a
nd
cu
rre
nt
an
d d
efe
rre
d t
ax
asse
ts. S
eg
me
nt
asse
ts in
clu
de
all
asse
ts d
ire
ctly
att
rib
uta
ble
to
th
e s
eg
me
nts
an
d p
ort
ion
of
the
en
terp
rise
asse
ts t
ha
t ca
n b
e a
llo
cate
d o
n a
re
aso
na
ble
ba
sis
to
th
e s
eg
me
nts
.
- A
ll l
iab
ilit
ies a
re a
llo
cate
d t
o r
ep
ort
ab
le s
eg
me
nts
oth
er
tha
n b
orr
ow
ing
s, c
ert
ain
fin
an
cia
l li
ab
ilit
ies, c
urr
en
t a
nd
de
ferr
ed
ta
x li
ab
ilit
ies. S
eg
me
nt
lia
bil
itie
s in
clu
de
All
lia
bil
itie
s d
ire
ctly
att
rib
uta
ble
to
th
e s
eg
me
nts
an
d p
ort
ion
of
the
en
terp
rise
lia
bil
itie
s t
ha
t ca
n b
e a
llo
cate
d o
n a
re
aso
na
ble
ba
sis
to
th
e s
eg
me
nts
.
Notes to the Consolidated Financial Statementsfor the year ended March 31, 2018
(All amounts in ` lakhs, unless otherwise stated)

P. 237
Annual Report 2017-18
102-266 | Finan
cial Statemen
ts24-101 | Statu
tory R
epo
rts02-17 | C
orp
orate O
verview18-23 | M
anag
emen
t Statemen
ts
(iv
) O
the
r s
eg
me
nt
info
rma
tio
n
SUGA
REN
GIN
EERI
NG
OTH
ERS
Elim
inat
ions
Tota
lSu
gar
Co-g
ener
atio
nDi
still
ery
Tota
l Sug
arGe
ars
Wat
erTo
tal E
ngin
eeri
ngOt
her
Oper
atio
ns
Year
end
ed
31-M
ar-1
8
Year
end
ed
31-M
ar-1
7
Year
end
ed
31-M
ar-1
8
Year
end
ed
31-M
ar-1
7
Year
end
ed
31-M
ar-1
8
Year
end
ed
31-M
ar-1
7
Year
end
ed
31-M
ar-1
8
Year
end
ed
31-M
ar-1
7
Year
end
ed
31-M
ar-1
8
Year
end
ed
31-M
ar-1
7
Year
end
ed
31-M
ar-1
8
Year
end
ed
31-M
ar-1
7
Year
end
ed
31-M
ar-1
8
Year
end
ed
31-M
ar-1
7
Year
end
ed
31-M
ar-1
8
Year
end
ed
31-M
ar-1
7
Year
end
ed
31-M
ar-1
8
Year
end
ed
31-M
ar-1
7
Year
end
ed
31-M
ar-1
8
Year
end
ed
31-M
ar-1
7
Amou
nt c
onsi
dere
d in
segm
ent r
esul
ts
Depr
ecia
tion
and
amor
tisat
ion
323
1.28
3
426.
25
686
.09
685
.26
509
.30
557
.50
442
6.67
4
669.
01
822
.47
789
.41
186
.50
188
.95
100
8.97
9
78.3
6 6
.66
6.6
3 -
- 5
442.
30
565
4.00
Unal
loca
ted
dere
ciat
ion
and
amor
tisat
ion
94.
25
66.
99
Tota
l dep
reci
atio
n an
d
amor
tisat
ion
323
1.28
3
426.
25
686
.09
685
.26
509
.30
557
.50
442
6.67
4
669.
01
822
.47
789
.41
186
.50
188
.95
100
8.97
9
78.3
6 6
.66
6.6
3 -
- 5
536.
55
572
0.99
Non
cash
item
s (o
ther
than
dep
reci
atio
n an
d
amor
tisat
ion)
2
4.20
3
518.
81
103
.82
197
.40
(26.
09)
(831
.49)
101
.93
288
4.72
1
19.5
9 1
78.3
3 (4
53.7
8) 2
40.0
7 (3
34.1
9) 4
18.4
0 1
0.43
(5
9.16
) -
- (2
21.8
3) 3
243.
96
Unal
loca
ted
non
cash
item
s
(oth
er th
an d
epre
ciat
ion
and
amor
tisat
ion)
(1
14.0
6) 4
972.
91
Tota
l non
cas
h ite
ms
(oth
er
than
dep
reci
atio
n an
d
amor
tisat
ion)
2
4.20
3
518.
81
103
.82
197
.40
(26.
09)
(831
.49)
101
.93
288
4.72
1
19.5
9 1
78.3
3 (4
53.7
8) 2
40.0
7 (3
34.1
9) 4
18.4
0 1
0.43
(5
9.16
) -
- (3
35.8
9) 8
216.
87
Amou
nts
not c
onsi
dere
d in
segm
ent r
esul
ts
Inte
rest
exp
ense
7
840.
43
110
84.1
7 2
8.24
1
21.7
6 1
80.3
4 2
85.3
6 8
049.
01
114
91.2
9 1
25.7
9 3
05.0
0 4
64.6
7 6
96.8
4 5
90.4
6 1
001.
84
- -
- -
863
9.47
1
2493
.13
Unal
loca
ted
inte
rest
exp
ense
(1
05.5
0) 1
62.3
1
Tota
l int
eres
t exp
ense
7
840.
43
110
84.1
7 2
8.24
1
21.7
6 1
80.3
4 2
85.3
6 8
049.
01
114
91.2
9 1
25.7
9 3
05.0
0 4
64.6
7 6
96.8
4 5
90.4
6 1
001.
84
- -
- -
853
3.97
1
2655
.44
Inte
rest
inco
me
47.
88
33.
78
3.6
1 3
.62
1.7
2 2
.05
53.
21
39.
45
4.4
7 9
.75
20.
92
34.
78
25.
39
44.
53
- -
- -
78.
60
83.
98
Unal
loca
ted
inte
rest
inco
me
46.
06
575
.58
Tota
l int
eres
t inc
ome
47.
88
33.
78
3.6
1 3
.62
1.7
2 2
.05
53.
21
39.
45
4.4
7 9
.75
20.
92
34.
78
25.
39
44.
53
- -
- -
124
.66
659
.56
Exce
ptio
nal i
tem
s -
682
0.08
-
130
3.96
-
422
.70
- 8
546.
74
- -
- -
- -
- -
- -
- 8
546.
74
Capi
tal e
xpen
ditu
re
294
2.52
1
913.
15
189
.39
91.
29
902
.48
456
.44
403
4.39
2
460.
88
836
.82
101
5.50
1
88.8
3 1
03.2
9 1
025.
65
111
8.79
1
.35
2.0
5 -
- 5
061.
39
358
1.72
Unal
loca
ted
capi
tal
expe
nditu
re
175
.04
85.
30
Tota
l Cap
ital e
xpen
ditu
re
294
2.52
1
913.
15
189
.39
91.
29
902
.48
456
.44
403
4.39
2
460.
88
836
.82
101
5.50
1
88.8
3 1
03.2
9 1
025.
65
111
8.79
1
.35
2.0
5 -
- 5
236.
43
366
7.02
Notes to the Consolidated Financial Statementsfor the year ended March 31, 2018
(All amounts in ` lakhs, unless otherwise stated)

P. 238
(v) Break-up of revenue by geographical area
Year ended
31-Mar-18
Year ended
31-Mar-17
India (country of domicile) 339925.57 295314.19
Foreign countries 1312.80 1372.42
341238.37 296686.61
(vi) Non-current assets by geographical area
All non current assets (other than financial instruments, deferred tax assets, post employment benefit assets and right arising
under insurance contracts) of the Group are located in India except investment in a foreign associate (located in Israel) of
` 2842.88 lakhs as at 31 March 2018 (31 March 2017: ` 2925.74 lakhs).
(vii) Break-up of revenue from major products and services
Year ended
31-Mar-18
Year ended
31-Mar-17
Sale of products
Finished goods
- Sugar 279926.58 234514.36
- Molasses 2217.96 2103.55
- Bagasse 4612.53 4705.76
- Power 10783.59 7598.43
- Alcohol 11446.52 16587.71
- Mechanical equipment - Water/Waste-water 1483.67 1395.13
- Gears/Gear Boxes 9292.12 7313.33
- Bought outs and Spares 1442.30 1489.25
- Others 406.69 530.49
321611.96 276238.01
Stock in trade
- Diesel/Petrol/Lubricants 1575.22 1419.85
- Other consumer goods 52.19 68.35
1627.41 1488.20
323239.37 277726.21
Sale of services
Erection and commissioning 22.90 57.75
Servicing 262.65 288.20
Operation and maintenance 3927.25 3472.07
4212.80 3818.02
Construction contract revenue
Water, Waste-water and Sewage treatment 12098.41 13138.29
Power generation and evacuation system 226.16 874.04
12324.57 14012.33
(viii) Information about major customers
There is no single customer who has contributed 10% or more to the Group’s revenue for both the years ended 31 March 2018
and 31 March 2017.
Notes to the Consolidated Financial Statementsfor the year ended March 31, 2018
(All amounts in ` lakhs, unless otherwise stated)

P. 239
Annual Report 2017-18
102-266 | Finan
cial Statemen
ts24-101 | Statu
tory R
epo
rts02-17 | C
orp
orate O
verview18-23 | M
anag
emen
t Statemen
ts
NOTE 38: EMPLOYEE BENEFIT PLANS
(i) Defined contribution plans
(a) The Group operates defined contribution retirement benefit plans under which the Group pays fixed contributions to
separate entities (funds) or financial institutions or state managed benefit schemes. The Group has no further payment
obligations once the contributions have been paid. Following are the schemes covered under defined contributions plans
of the Group:
Provident Fund Plan & Employee Pension Scheme: The Group makes monthly contributions at prescribed rates towards
Employee Provident Fund/ Employee Pension Scheme to fund administered and managed by the Government of India. The
Group has also set up provident fund Trust to secure the provident fund dues in respect of certain employees of the Group.
The provident fund is administered by the concerned trustees. The rules of the Group’s provident fund administered by
the Trust, require that if the Board of Trustees are unable to pay interest at the rate declared by the Employees’ Provident
Fund Organisation, Government of India, under para 60 of the Employees’ Provident Fund Scheme, 1952 for the reason
that the return on investment is less or for any other reason, then the deficiency shall be made good by the Group when
determined. Having regard to the assets of the fund and the return on the investments, the Group does not expect any
deficiency as at the year end and accordingly, such plan has been considered by the Group in substance to be a defined
contribution plan.
Employee State Insurance: The Group makes prescribed monthly contributions towards Employees State Insurance Scheme.
Superannuation Scheme: The Group contributes towards a fund established to provide superannuation benefit to certain
employees in terms of Group Superannuation Policies entered into by such fund with the Life Insurance Corporation of India.
National Pension Scheme: The Group makes contributions to the National Pension Scheme fund in respect of certain
employees of the Group.
(b) The expense recognised during the period towards defined contribution plans are as follows:
Year ended
31-Mar-18
Year ended
31-Mar-17
Employers’ contribution to Employees’ Provident Fund 1068.97 969.89
Administration and other expenses relating to above 26.56 29.10
Employers’ contribution to Employees State Insurance Scheme 16.01 8.85
Employers’ contribution to Superannuation Scheme 114.75 116.95
Employers’ contribution to National Pension Scheme 20.80 14.41
(ii) Defined benefit plans
(a) The Group operates a defined benefit retirement plan under which the Group pays certain defined benefit by way of gratuity
to its employees. The Gratuity Plan provides a lump sum payment to vested employees at retirement/termination of
employment or death of an employee, based on the respective employees’ salary and years of employment with the Group.
(b) Risk exposure
The plan typically exposes the Group to number of actuarial risks, the most significant of which are detailed below:
Investment risk: The plan liabilities are calculated using a discount rate set with references to government bond yields
as at end of reporting period; if plan assets under perform compared to the government bonds discount rate, this
will create or increase a deficit. The investments in plan assets are made in accordance with pattern of investment
prescribed by central government and ensures that the funds are invested in a balanced mix of investments comprising
Notes to the Consolidated Financial Statementsfor the year ended March 31, 2018
(All amounts in ` lakhs, unless otherwise stated)

P. 240
central government securities, state government securities, other debt instruments as well as equity instruments. Most
of the plan investments is in fixed income securities with high grades and in government securities. The Group has a risk
management strategy which defines exposure limits and acceptable credit risk rating.
Interest risk: A decrease in government bond yields will increase plan liabilities, although this is expected to be partially
offset by an increase in the value of the plan’s debt instruments.
Life expectancy: The present value of the defined benefit plan liability is calculated by reference to the best estimate of
the mortality of plan participants during their employment. A change in the life expectancy of the plan participants will
impact the plan’s liability.
Salary risk: The present value of the defined benefit plan liability is calculated by reference to the future salaries of plan
participants. As such, an increase in the salary of the plan participants will increase the plan’s liability.
Attrition rate: The present value of the defined benefit plan liability is impacted by the rate of employee turnover,
disability and early retirement of plan participants. A change in the attrition rate of the plan participants will impact the
plan’s liability.
(c) The significant actuarial assumptions used for the purposes of the actuarial valuations were as follows:
Valuation as at
31-Mar-18 31-Mar-17
Discounting rate 7.69% 6.81%
Future salary growth rate 8.00% 7.00%
Mortality Table * IALM 2006-2008 Ultimate IALM 2006-2008 Ultimate
Attrition rate 6.00% for Permanent employees
2.00% for Seasonal employees
8.00% for Permanent employees
3.00% for Seasonal employees
Method used Projected unit credit method Projected unit credit method
* Assumptions regarding future mortality are set based on actuarial advice in accordance with published statistics (i.e. IALM 2006-08
Ultimate). These assumptions translate into an average life expectancy in years at retirement age.
Notes to the Consolidated Financial Statementsfor the year ended March 31, 2018
(All amounts in ` lakhs, unless otherwise stated)

P. 241
Annual Report 2017-18
102-266 | Finan
cial Statemen
ts24-101 | Statu
tory R
epo
rts02-17 | C
orp
orate O
verview18-23 | M
anag
emen
t Statemen
ts
(d) Amounts recognised in consolidated statement of profit & loss in respect of the defined benefit plan are as follows:
Year ended
31-Mar-18
Year ended
31-Mar-17
Current service cost 333.64 275.90
Net interest expense 220.47 145.06
Components of defined benefit costs recognised in profit or loss 554.11 420.96
Remeasurement on the net defined benefit liability
- Return on plan assets (excluding amount included in net interest expense) (43.30) (31.06)
- Actuarial (gain)/ loss arising form changes in financial assumptions 36.60 482.43
- Actuarial (gain) / loss arising form experience adjustments (179.43) 234.68
Components of defined benefit costs recognised in other comprehensive
income (186.13) 686.05
Total 367.98 1107.01
The current service cost and the net interest expense for the year are included in the ‘Employee benefits expense’ line item
in the consolidated statement of profit & loss. The remeasurement of the net defined benefit liability is included in other
comprehensive income.
(e) Amounts included in the consolidated balance sheet arising from the Group’s obligation in respect of the defined benefit plan
is as follows:
As at
31-Mar-18
As at
31-Mar-17
Present value of defined benefit obligation as at the end of the year 4734.30 4558.14
Fair value of plan assets 1452.20 1308.30
Funded status (3282.10) (3249.84)
Net asset/(liability) arising from defined benefit obligation recognised in the
balance sheet (3282.10) (3249.84)
(f) Movement in the present value of the defined benefit obligation is as follows:
Year ended
31-Mar-18
Year ended
31-Mar-17
Present value of defined benefit obligation at the beginning of the year 4558.14 3632.88
Expenses recognised in profit or loss
- Current Service Cost 333.64 275.90
- Interest Expense (Income) 321.08 226.50
Remeasurement (gains)/losses recognised in other comprehensive income
- Actuarial (gain)/loss arising from:
i. Financial Assumptions 36.60 482.43
ii. Experience Adjustments (179.43) 234.68
Benefit payments (335.73) (294.25)
Present value of defined benefit obligation at the end of the year 4734.30 4558.14
Notes to the Consolidated Financial Statementsfor the year ended March 31, 2018
(All amounts in ` lakhs, unless otherwise stated)

P. 242
(g) Movement in the fair value of the plan assets is as follows:
Year ended
31-Mar-18
Year ended
31-Mar-17
Fair value of plan assets at the beginning of the year 1308.30 1195.80
Recognised in profit or loss
- Expected return on plan assets 100.61 81.44
Remeasurement gains / (losses) recognised in other comprehensive income
- Actual Return on plan assets in excess of the expected return 43.29 31.06
Contributions by employer 335.73 294.25
Benefit payments (335.73) (294.25)
Fair value of plan assets at the end of the year 1452.20 1308.30
The fair value of the plan assets at the end of the reporting period for each category, are as follows:
As at 31-Mar-18 As at 31-Mar-17
Quoted Unquoted Total Quoted Unquoted Total
Cash and cash equivalents - 12.45 12.45 - 17.83 17.83
Debt instruments
- Government securities - 264.26 264.26 - 257.53 257.53
- State development loans - 452.07 452.07 - 340.95 340.95
- Private sector bonds - 123.24 123.24 - 104.45 104.45
- Public sector bonds - 112.33 112.33 - 138.53 138.53
- Fixed deposits with banks - 166.00 166.00 - 155.50 155.50
- Special Deposit Scheme balance
with RBI - 102.13 102.13 - 102.13 102.13
- Debt mutual funds - 64.95 64.95 - 60.92 60.92
Equity instruments
- Index mutual funds - 10.06 10.06 - 2.43 2.43
- Arbitrage mutual funds - 12.58 12.58 - 8.93 8.93
Accrued interest and other
recoverables - 132.13 132.13 - 119.10 119.10
Total plan assets - 1452.20 1452.20 - 1308.30 1308.30
The investible funds of the Gratuity Plan are invested in accordance with the investment pattern and norms prescribed
by the Ministry of Finance, Government of India. The investment pattern mandates that the investible funds are invested
across the permitted investments in the prescribed pattern, whereby the investment risk is spread across various
categories of investment comprising sovereign government securities, state development loans monitored by the Reserve
Bank of India, investment grade rated debt securities issued by private and public sector companies, fixed-deposit with
banks fulfilling the prescribed norms, units of debt and equity mutual funds. The investments made are generally on held-
to-maturity basis. It is the endeavour of the Group to mitigate risk by investing only in high-quality debt securities and in
mutual funds after undertaking due diligence.
There has been no change in the process used by the Group to manage its risks from prior periods.
Notes to the Consolidated Financial Statementsfor the year ended March 31, 2018
(All amounts in ` lakhs, unless otherwise stated)

P. 243
Annual Report 2017-18
102-266 | Finan
cial Statemen
ts24-101 | Statu
tory R
epo
rts02-17 | C
orp
orate O
verview18-23 | M
anag
emen
t Statemen
ts
(h) Sensitivity analysis
The sensitivity of the defined benefit obligation to changes in the weighted principal assumptions is:
Change in
assumption
by
Impact on defined benefit obligation
Increase/
decrease
Increase in assumption Decrease in assumption
31-Mar-18 31-Mar-17 31-Mar-18 31-Mar-17
Discounting rate 0.50% in ` (177.37) (262.01) 190.36 266.30
in % -3.75% -5.75% 4.02% 5.84%
Future salary growth rate 0.50% in ` 187.87 246.57 (176.71) (241.86)
in % 3.97% 5.41% -3.73% -5.31%
Attrition rate 0.50% in ` (46.12) (44.17) 48.81 46.74
in % -0.97% -0.97% 1.03% 1.03%
Mortality rate 10.00% in ` (39.85) (38.17) 42.54 40.74
in % -0.84% -0.84% 0.90% 0.89%
The above sensitivity analysis are based on a change in an assumption while holding all other assumptions constant. In
practise, this is unlikely to occur, and changes in some of the assumptions may be correlated. The methods and types of
assumptions used in preparing the sensitivity analysis did not change compared to prior period.
(i) Defined benefit liability and employer contributions
The Group remains committed to fund all gratuity payments falling due and shall strive to gradually reduce the deficit
in funding of its obligation in the coming years.
The Group expects to contribute ` 245.07 lakhs to the defined benefit plan relating to gratuity during the next
financial year.
The weighted average duration of the defined gratuity obligation as at 31 March 2018 is 9.2 years (31 March 2017:
9.5 years).
The expected maturity analysis of undiscounted defined benefit obligation as at 31 March 2018 is as follows:
Less than a
year
Between
1-2 years
Between
2-5 years
Over
5 years
Total
Defined benefit obligation (Gratuity) 245.07 405.43 1460.65 8219.59 10330.74
Notes to the Consolidated Financial Statementsfor the year ended March 31, 2018
(All amounts in ` lakhs, unless otherwise stated)

P. 244
NOTE 39: RELATED PARTY TRANSACTIONS
(i) Related parties with whom transactions have taken place during the year alongwith details of such transactions and
outstanding balances as at the end of the year:
Name of related party and nature of transactions RelationshipYear ended
31-Mar-18
Year ended
31-Mar-17
Sales and rendering services
Triveni Turbine Limited Associate 4304.01 3,229.45
Purchases and receiving services
Triveni Turbine Limited Associate 382.52 1,079.72
Tirath Ram Shah Charitable Trust Enterprise over which key
managerial personnel
have substantial interest/
significant influence
0.47 0.99
Advance paid against order
Triveni Turbine Limited Associate 35.00 -
Rent paid
Dhruv M. Sawhney (Chairman & Managing Director) Key managerial personnel 48.76 45.50
Rati Sawhney Relative of key managerial
personnel
34.60 48.00
Kameni Upaskar Limited Enterprise over which key
managerial personnel
have substantial interest/
significant influence
76.69 72.88
Rent & other charges received
Triveni Turbine Limited Associate 20.40 16.00
Dividend received from Investment in Equity shares
Triveni Turbine Limited Associate 864.00 324.00
Dividend paid on Equity shares
Dhruv M. Sawhney (Chairman & Managing Director) Key managerial personnel 95.98 -
Tarun Sawhney (Vice Chairman & Managing Director) Key managerial personnel 36.74 -
Nikhil Sawhney (Promoter Non-Executive Director) Key managerial personnel 38.19 -
Suresh Taneja (Group Chief Financial Officer) Key managerial personnel 0.04 -
Shekhar Dutta (Independent Non-Executive Director) Key managerial personnel 0.03 -
Manmohan Sawhney HUF Relative of key managerial
personnel
11.28 -
Rati Sawhney Relative of key managerial
personnel
50.90 -
Tarana Sawhney Relative of key managerial
personnel
0.06 -
Mira Hazari Relative of key managerial
personnel
- -
Subhadra Trade & Finance Limited Enterprise over which key
managerial personnel
have substantial interest/
significant influence
206.74 -
Notes to the Consolidated Financial Statementsfor the year ended March 31, 2018
(All amounts in ` lakhs, unless otherwise stated)

P. 245
Annual Report 2017-18
102-266 | Finan
cial Statemen
ts24-101 | Statu
tory R
epo
rts02-17 | C
orp
orate O
verview18-23 | M
anag
emen
t Statemen
ts
Name of related party and nature of transactions RelationshipYear ended
31-Mar-18
Year ended
31-Mar-17
Expenses incurred by the Company on behalf of
party (net of expenses incurred by party on behalf of
the Company) on reimbursable basis
Triveni Turbine Limited Associate (18.76) (2.77)
Kameni Upaskar Limited Enterprise over which key
managerial personnel
have substantial interest/
significant influence
2.22 2.28
Triveni Engineering Works Limited Gratuity Fund Post employment
benefit plan
- 0.06
Triveni Engineering and Industries Ltd. Officers’
Pension Fund
Post employment
benefit plan
- 0.01
Triveni Engineering Works Limited Employees’
Provident Fund
Post employment
benefit plan
- -
Upper India Sugar Mills Employees’ Provident Fund Post employment
benefit plan
0.03 0.05
Remuneration
Tarun Sawhney (Vice Chairman & Managing Director) Key managerial personnel 239.73 203.82
Suresh Taneja (Group Chief Financial Officer) Key managerial personnel 192.39 178.22
Geeta Bhalla (Group Vice President &
Company Secretary)
Key managerial personnel 68.61 60.54
Directors fee paid
Nikhil Sawhney (Promoter Non-Executive Director) Key managerial personnel 3.70 5.20
Lt. Gen (Retd.) Kanwal Kishan Hazari (Independent
Non-Executive Director)
Key managerial personnel 5.50 8.45
M. K. Daga (Independent Non-Executive Director) Key managerial personnel - 2.25
Fakir Chand Kohli
(Independent Non-Executive Director)
Key managerial personnel 1.25 2.25
Shekhar Dutta (Independent Non-Executive Director) Key managerial personnel 6.00 6.50
Homai A. Daruwalla
(Independent Non-Executive Director)
Key managerial personnel 6.00 6.25
Dr. Santosh Pande
(Independent Non-Executive Director)
Key managerial personnel 4.00 3.75
Sudipto Sarkar
(Independent Non-Executive Director)
Key managerial personnel 4.00 2.25
Contribution to Post employment benefit plans
Triveni Engineering Works Limited Gratuity Fund Post employment
benefit plan
335.73 294.25
Triveni Engineering and Industries Ltd.
Officers’ Pension Fund
Post employment
benefit plan
114.75 115.69
Upper India Sugar Mills Employees’ Provident Fund Post employment
benefit plan
1033.20 907.61
Deposit received against appointment of Director
Subhadra Trade & Finance Limited Enterprise over which key
managerial personnel
have substantial interest/
significant influence
- 3.00
Notes to the Consolidated Financial Statementsfor the year ended March 31, 2018
(All amounts in ` lakhs, unless otherwise stated)

P. 246
Outstanding balances
RelationshipAs at
31-Mar-18
As at
31-Mar-17
Receivable
Triveni Turbine Limited Associate 1082.03 460.32
Payable
Triveni Turbine Limited Associate 1310.51 1878.15
Dhruv M. Sawhney (Chairman & Managing Director) Key managerial personnel 4.92 5.25
Tarun Sawhney (Vice Chairman & Managing Director) Key managerial personnel 3.65 3.05
Suresh Taneja (Group Chief Financial Officer) Key managerial personnel 0.61 8.39
Geeta Bhalla (Group Vice President &
Company Secretary)
Key managerial personnel 0.15 3.45
Subhadra Trade & Finance Limited Enterprise over which key
managerial personnel
have substantial interest/
significant influence
- 2.00
Tirath Ram Shah Charitable Trust Enterprise over which key
managerial personnel
have substantial interest/
significant influence
- 0.30
Triveni Engineering and Industries Ltd.
Officers’ Pension Fund
Post employment
benefit plan
113.29 115.69
Upper India Sugar Mills Employees’ Provident Fund Post employment
benefit plan
90.32 82.75
Guarantees / Surety /commitment outstanding
(refer note 48(b))
Triveni Turbine Limited Associate - 1450.51
(ii) Remuneration of key managerial personnel:
Year ended
31-Mar-18
Year ended
31-Mar-17
Short-term employee benefits 460.69 402.46
Post-employment benefits 40.05 40.12
Total 500.74 442.58
The remuneration of key managerial personnel is determined by the remuneration committee having regard to the performance
of individuals, market trends and applicable provisions of Companies Act, 2013.
(iii) Remuneration and oustanding balances of KMP does not include long term employee benefits by way of gratuity and
compensated absences, which are currently not payable and are provided on the basis of actuarial valuation by the Company.
(iv) Terms & conditions:
The sales to and purchases from related parties, including rendering/availment of service, are made on terms equivalent to
those that prevail in arm’s length transactions. The outstanding balances at the year-end are unsecured and interest free and
settlement occurs in cash. There have been no guarantees provided to or received for any related party receivable or payables.
The Group has not recorded any impairment of receivables relating to amounts owed by related parties for the year ended
31 March 2018 and 31 March 2017 other than that stated above.
Notes to the Consolidated Financial Statementsfor the year ended March 31, 2018
(All amounts in ` lakhs, unless otherwise stated)

P. 247
Annual Report 2017-18
102-266 | Finan
cial Statemen
ts24-101 | Statu
tory R
epo
rts02-17 | C
orp
orate O
verview18-23 | M
anag
emen
t Statemen
ts
NOTE 40: CAPITAL MANAGEMENT
For the purpose of capital management, capital includes net debt and total equity of the Group. The primary objective of the capital
management is to maximize shareholder value along with an objective to keep the leverage in check in view of cyclical capital
intensive sugar business of the Group.
One of the major businesses of the Group is the sugar business, which is a seasonal industry where the entire production is made
in about five months and then sold throughout the year. Thus, it necessitates keeping high sugar inventory levels requiring high
working capital funding. Sugar business being a cyclical business, it is prudent to avoid high leverage and the resultant high finance
cost. It is the endeavour of the Group to prune down debts to acceptable levels based on its financial position.
The Group may resort to further issue of capital when the funds are required to make the Group stronger financially or to invest in
projects meeting the ROI expectations of the Group.
The Group monitors capital structure through gearing ratio represented by debt-equity ratio (debt/total equity). The gearing ratios for
the Group as at the end of reporting period were as follows:
As at
31-Mar-18
As at
31-Mar-17
Non-current borrowings (note 16) 3495.28 27536.23
Current borrowings (note 20) 107647.23 124209.92
Current maturities of long-term borrowings (note 17) 12831.59 20367.06
Total debt 123974.10 172113.21
Less: Cash and cash equivalents (note 12(a)) (366.51) (657.10)
Net debt 123607.59 171456.11
Total equity (note 13, 14 & 15) 94635.21 83538.37
Net debt to equity ratio 1.31 2.05
Long term debt equity ratio 0.17 0.57
In addition to the above gearing ratio, the Group also looks at operating profit to total debt ratio (EBITDA/Total Debts) which gives an
indication of adequacy of earnings to service the debts. The Group carefully negotiates the terms and conditions of the loans and
ensures adherence to all the financial covenants. With a view to arrive at the desired capital structure based on the financial condition
of the Group, the Group normally incorporates a clause in loan agreements for prepayment of loans without any premium.
Further, no changes were made in the objectives, policies or process for managing capital during the years ended 31 March 2018 and
31 March 2017.
The Group is not subject to any externally imposed capital requirements.
NOTE 41: FINANCIAL RISK MANAGEMENT
The Group’s principal financial liabilities comprise loans and borrowings, trade payables and other payables. The main purpose
of the financial liabilities is to finance the Group’s operations. The Group’s principal financial assets include loans, trade and other
receivables and cash and bank balances that derive directly from its operations. The Group also holds investments measured at fair
value through profit or loss and enters into derivative transactions, which are not extensive.
The Group’s activities expose it mainly to market risk, liquidity risk and credit risk. The monitoring and management of such risks is
undertaken by the senior management of the Group and there are appropriate policies and procedures in place through which such
financial risks are identified, measured and managed in accordance with the Group’s policies and risk objectives. The Group has
specialised teams to undertake derivative activities for risk management purposes and such team has appropriate skills, experience
and expertise. It is the Group policy not to carry out any trading in derivative for speculative purposes. The Audit Committee and the
Board are regularly apprised of these risks every quarter and each such risk and mitigation measures are extensively discussed.
Notes to the Consolidated Financial Statementsfor the year ended March 31, 2018
(All amounts in ` lakhs, unless otherwise stated)

P. 248
(i) Credit risk
Credit risk arises when a counterparty defaults on its contractual obligations to pay, resulting in financial loss to the Group. The
Group is exposed to credit risks from its operating activities, primarily trade receivables. The credit risks in respect of deposits
with the banks, foreign exchange transactions and other financial instruments are nominal.
(a) Credit risk management
The customer credit risk is managed by each business subject to the Group’s established policy, procedure and controls
relating to customer credit risk management. Various businesses require different processes and policies to be followed
based on the business risks, industry practice and customer profiles.
In the case of Sugar business, majority of the sales are made either against advance payments or on very short credit
period upto 7-10 days to reputed customers whereas in Cogeneration and Distillery, most of the sales are made to
Government customers, such as, State Electricity Board (UPPCL) and Oil Marketing Companies (OMCs). There may be
delays, generally not exceeding one year, in receiving payments from UPPCL but the risk in respect of realisation of dues
is minimal. In Gear business, it is the policy of the Group to receive payment prior to delivery of the material except in the
case of some well established OEMs, including public sector undertakings, where the credit up to 90 days is extended.
Water business is engaged in EPC business with municipal and industrial sector where it is customary to have prescribed
retentions which are payable upon completion of the project and after satisfactory performance of the plant.
In order to contain the business risk, creditworthiness of the customer is ensured through scrutiny of its financials, status
of financial closure of the project, if required, market reports and reference checks. The Group remains vigilant and
regularly assesses the financial position of customers during execution of contracts with a view to restrict risks of delays
and default. In view of its diversified business profile and considering the size of the Group, credit risks from receivables
are well contained on an overall basis.
The impairment analysis is performed on each reporting period on individual basis for major customers. In addition,
a large number of receivables are grouped and assessed for impairment collectively. The calculation of impairment
loss is based on historical data of losses, current conditions and forecasts and future economic conditions. The Group’s
maximum exposure to credit risk at the reporting date is the carrying amount of each financial asset as detailed in note 6,
7, 8 and 9.
The business wise receivable position as at the end of the year is provided here below:
As at
31-Mar-18
As at
31-Mar-17
Sugar business 4551.36 4797.61
Cogeneration business 4427.14 5882.47
Distillery business 2060.60 1185.22
Water business 13858.94 10480.02
Gear business 4837.04 3412.10
Others 1455.31 2034.08
Total Receivables (note 7) 31190.39 27791.50
Receivables individually in excess of 10% of the business receivables 16665.33 14809.41
Percentage of above receivables to the total receivables of the Group 53.43% 53.29%
Receivables in excess of 10% of individual business receivables majorly comprise receivables from UPPCL which forms
16.85% of total receivables of the Group as on 31 March 2018, 26% as on 31 March 2017. It can be observed that the
concentration of risk in respect of trade receivables is moderate on an overall basis. Further, its customers are located in
several jurisdictions and industries and operate in largely independent markets. The Group does not hold any collateral as
security for such receivables.
Notes to the Consolidated Financial Statementsfor the year ended March 31, 2018
(All amounts in ` lakhs, unless otherwise stated)

P. 249
Annual Report 2017-18
102-266 | Finan
cial Statemen
ts24-101 | Statu
tory R
epo
rts02-17 | C
orp
orate O
verview18-23 | M
anag
emen
t Statemen
ts
(b) Provision for expected credit losses
Basis as explained above, life time expected credit loss (“ECL”) is determined on trade receivables except in cases where
advance payment terms are prescribed or payment is due from Central / State Government or Government Authorities /
entities where there is no track record of short receipts. ECL arising from delays in receiving payments from the Government
customers pursuant to sale of goods or under construction contracts are not considered if such delays are commonly
prevalent in the industry and / or the delays are not exceeding one year. All other short receipts other than arising from
expense claims are duly considered in determining ECL. In view of the business model of the Group, engineered-to-order
products and the profile of trade receivables, the determination of provision based on age analysis may not be a realistic
and hence, the provision of expected credit loss is determined for the total trade receivables outstanding as on the reporting
date. This provision for ECL is made in addition to the specific credit losses, if any, provided on specific financial assets.
Provision matrix (%, amounts) of ECL for trade receivables, other than specific credit losses separately recognised is
as under:
Business % ECLECL amount
as at 31-Mar-18
ECL amount
as at 31-Mar-17
Sugar Nil Nil Nil
Co-generation Nil Nil Nil
Distillery Nil Nil Nil
Water 0.83% 115.99 98.55
Gear 1.17% 57.91 35.91
(c) Reconciliation of loss allowance provision
Trade receivables:
Year ended
31-Mar-18
Year ended
31-Mar-17
Balance at beginning of the year 2668.69 4205.73
Additional provisions recognised during the year 377.16 786.97
Provision reversed/utilised during the year (1265.04) (2324.01)
Balance at the end of the year 1780.81 2668.69
Loans and other financial assets:
Loans Other financial assets
Year ended
31-Mar-18
Year ended
31-Mar-17
Year ended
31-Mar-18
Year ended
31-Mar-17
Balance at beginning of the year 44.53 44.53 17.94 60.25
Movement in expected credit loss allowance - - (1.89) (42.31)
Balance at the end of the year 44.53 44.53 16.05 17.94
(ii) Liquidity risk
The Group uses liquidity forecast tools to manage its liquidity. The Group operates capital intensive sugar business and has
obligation to timely make cane price payments within the statutory time period. The Group is able to organise liquidity through
own funds and through working capital loans. The Group has good relationship with its lenders and has not defaulted at
any point of time in the past, as a result of which it does not experience any difficulty in arranging funds from its lenders.
However, when the sugar fundamentals are unfavourable, either due to market forces or due to excessive cane pricing by the
Government, the payment of cane price gets delayed. However, it is the endeavour of the Group to make cane payment on a
priority basis. It is the objective and focus of the Group to reduce debts to be able to meet the cyclicalities of the sugar business.
Notes to the Consolidated Financial Statementsfor the year ended March 31, 2018
(All amounts in ` lakhs, unless otherwise stated)

P. 250
Apart from cyclical sugar business, the Group has alternate revenue streams in the form of cogeneration, distillery and
engineering business, which, to a large extent, offset the impact of sugar cyclicalities.
Table hereunder provides the current ratios of the Company as at the year end
As at
31-Mar-18
As at
31-Mar-17
Total current assets 198822.89 209276.12
Total current liabilities 196803.11 193200.05
Current ratio 1.01 1.08
In view of seasonal nature of sugar business, which is a dominant business of the Group, there is a peak build-up of sugar
inventories at the year end, resulting in peak working capital requirement. With the liquidation of such inventories over the year,
the working capital requirement is gradually reduced. Thus, the current ratio computed at the year end is not a reflection of
average and realistic ratio for the year.
(a) Maturities of financial instruments
Maturities of non-derivative financial liabilities:
The following tables detail the remaining contractual maturity for its non-derivative financial liabilities with agreed
repayment periods. The amount disclosed in the tables have been drawn up based on the undiscounted cash flows of
financial liabilities. The contractual maturity is based on the earliest date on which the Company may be required to pay.
on demand < 1 year 1-3 years 3-5 years > 5 years Total Carrying
amount
As at 31 March 2018
Borrowings 105557.23 15174.86 3453.08 32.73 0.92 124218.82 123974.10
Trade payables - 62423.02 383.43 - - 62806.45 62806.45
Other financial liabilities - 3590.10 0.10 - - 3590.20 3590.20
105557.23 81187.98 3836.61 32.73 0.92 190615.47 190370.75
As at 31 March 2017
Borrowings 122543.89 22674.11 26137.76 1845.75 6.13 173207.64 172113.21
Trade payables - 24844.86 814.08 - - 25658.94 25658.94
Other financial liabilities - 4293.88 30.62 - - 4324.50 4324.50
122543.89 51812.85 26982.46 1845.75 6.13 203191.08 202096.65
Maturities of derivative financial instruments:
The Group enters into derivative contracts (viz. foreign exchange forward contracts, foreign currency swaps and interest
rate swaps) to manage some of its foreign currency exposures and interest rate exposures that are settled on a net basis.
Derivative asset (net) are of ` 87.86 lakhs as at 31 March 2018. All derivative assets/ liabilities shall mature within one
year from the reporting date except derivative liability ` 0.96 lakhs, in respect of foreign currency swap & interest rate
swap taken to hedge foreign currency borrowing, which shall be settled alongwith payment of such borrowing in six equal
` 84.88 lakhs shall mature within one
year from reporting date).
(iii) Market risk
The Group is exposed to following key market risks:
(a) Interest rate risk on loans and borrowings
(b) Sugar price risk
(c) Other market risks
Notes to the Consolidated Financial Statementsfor the year ended March 31, 2018
(All amounts in ` lakhs, unless otherwise stated)

P. 251
Annual Report 2017-18
102-266 | Finan
cial Statemen
ts24-101 | Statu
tory R
epo
rts02-17 | C
orp
orate O
verview18-23 | M
anag
emen
t Statemen
ts
(a) Interest rate risk
Most of the borrowings availed by the Group are subject to interest on floating rate basis linked to the Base Rate or MCLR
(marginal cost of funds based lending rate) or LIBOR. In view of the fact that the total borrowings of the Group are quite
substantial, the Group is exposed to interest rate risk.
The above strategy of the Group to opt for floating interest rates is helpful in maintaining market related realistic rates,
which is presently the case. Further, most of the loans and borrowings have a prepayment clause through which the loans
could be prepaid without any prepayment premium. The said clause helps the Group to arrange debt substitution to bring
down the interest costs or to prepay the loans out of the surplus funds held.
While declining interest rates would be beneficial to the Group, adverse interest rate fluctuations could increase the
finance cost. The total impact, in respect of borrowings on floating interest rate basis, is limited as per sensitivity analysis
provided here under:
Year ended
31-Mar-18
Year ended
31-Mar-17
Total debt as at the end of the year 123974.10 172113.21
Debt at floating rate of interest as at the end of the year 116276.02 164300.25
Average annual utilisation of debts at floating rate of interest (%) 73% 71%
Average availment of borrowings at floating rate of interest 85179.94 115920.14
Impact of 1% interest rate variation 851.80 1159.20
The above sensitivity has been computed after excluding the impact of change in interest rates of the floating interest rate
foreign currency borrowing of USD 53,76,344.09 @ 6 months LIBOR plus 1.95% (as at 31 March 2018 @ 4.1955% p.a.)
since same has been hedged through interest rate swap @ fixed interest rate 8.5% p.a.
(b) Sugar price risk
IIn the Sugar business being carried out by the Group, sugar is produced during the season commencing from October/
November till March/April. Sugar so produced during the season of around 130 to 150 days, is sold throughout the year.
The sugar inventories are at the highest level as at the end of the financial year and these are normally stated at cost or
net realizable value, whichever is lower.
The Group is exposed to sugar price risk in respect of the inventories held at the year-end as any decline in prices below
the carrying amount will inflict losses to the Group. There are no effective hedging mechanisms available in view of
limited breadth in the commodity exchange market and hence the Group follows a strategy of selling sugar based upon
market forecasts and holding cost of inventories, subject to minimum floor limits.
Sensitivity analysis in respect of sugar price risk is provided here below:
Year ended
31-Mar-18
Year ended
31-Mar-17
Sugar inventory held (MT) 5,31,098.85 4,58,199.00
Impact of sugar price variation by ` 1000/MT 5,310.99 4,581.99
(c) Other market risks
The other market risks includes Equity price risk and Foreign currency risk.
Equity price risk in respect of listed and non listed equity securities which are susceptible to market price risk arising from
uncertainties about future value of the investment securities. In view of nominal value of investments being held by the
Company, other than in the subsidiaries and associates which are measured at cost, the magnitude of risk is only nominal.
Notes to the Consolidated Financial Statementsfor the year ended March 31, 2018
(All amounts in ` lakhs, unless otherwise stated)

P. 252
The Group is exposed to foreign currency risk mainly on account of foreign currency borrowings, foreign exchange
trades being minimal. The foreign currency borrowing is for a period of more than a year and the Group is exposed to
foreign exchange fluctuation risks during this period. As per policy, the foreign currency borrowings are hedged through
foreign exchange forward contracts / foreign currency swap contracts to capture the interest arbitrage over domestic
interest rates.
Foreign currency risk exposure
The Group’s exposure to foreign currency risk at the end of the reporting period are as follows:
US$ EURO GBP
As at 31 March 2018
Financial assets
- Trade receivables in foreign currency lakhs 3.80 2.53 -
in equivalent ` lakhs 244.35 199.29 -
Derivatives (in respect of underlying financial
assets)
- - -
Net exposure to foreign currency risk (assets) in foreign currency lakhs 3.80 2.53 -
in equivalent ` lakhs 244.35 199.29 -
Financial liabilities
- Trade payables in foreign currency lakhs 1.32 0.77 0.55
in equivalent ` lakhs 86.53 62.21 50.89
- Borrowings (including interest) in foreign currency lakhs 203.68 - -
in equivalent ` lakhs 13402.02 - -
Derivatives (in respect of underlying financial
liabilities)
- Foreign exchange forward contracts/Swaps in foreign currency lakhs 203.47 - -
buy foreign currency in equivalent ` lakhs 13388.40 - -
Net exposure to foreign currency risk (liabilities) in foreign currency lakhs 1.53 0.77 0.55
in equivalent ` lakhs 100.15 62.21 50.89
US$ EURO GBP
As at 31 March 2017
Financial assets
- Trade receivables in foreign currency lakhs 3.00 1.23 -
in equivalent ` lakhs 192.36 83.58 -
Derivatives (in respect of underlying financial
assets)
- Foreign exchange forward contracts in foreign currency lakhs 1.24 - -
sell foreign currency in equivalent ` lakhs 79.48 - -
Net exposure to foreign currency risk (assets) in foreign currency lakhs 1.76 1.23 -
in equivalent ` lakhs 112.88 83.58 -
Financial liabilities
- Trade payables in foreign currency lakhs 1.07 0.69 0.02
in equivalent ` lakhs 69.96 48.92 1.50
- Borrowings (including interest) in foreign currency lakhs 25.54 - -
in equivalent ` lakhs 1675.69 - -
Derivatives (in respect of underlying
financial liabilities)
- Foreign exchange forward contracts in foreign currency lakhs 25.40 0.28 0.02
buy foreign currency in equivalent ` lakhs 1666.03 19.44 1.50
Net exposure to foreign currency risk (liabilities) in foreign currency lakhs 1.21 0.41 -
in equivalent ` lakhs 79.62 29.48 -
Notes to the Consolidated Financial Statementsfor the year ended March 31, 2018
(All amounts in ` lakhs, unless otherwise stated)

P. 253
Annual Report 2017-18
102-266 | Finan
cial Statemen
ts24-101 | Statu
tory R
epo
rts02-17 | C
orp
orate O
verview18-23 | M
anag
emen
t Statemen
ts
The Group’s foreign currency derivatives outstanding (including for firm commitments) at the end of the reporting period
are as follows:
US$ EURO GBP
As at 31 March 2018
Foreign exchange forward contracts to sell
foreign currency
in foreign currency lakhs
in equivalent ` lakhs
2.00 1.35 -
128.48 106.34 -
Foreign exchange forward contracts/Swaps to
buy foreign currency
in foreign currency lakhs
in equivalent ` lakhs
205.18 3.80 -
13500.83 308.71 -
As at 31 March 2017
Foreign exchange forward contracts to sell
foreign currency
in foreign currency lakhs
in equivalent ` lakhs
1.24 - -
79.48 - -
Foreign exchange forward contracts to buy
foreign currency
in foreign currency lakhs
in equivalent ` lakhs
11.72 1.02 1.24
768.96 72.34 101.84
All the above contracts are maturing within one year except for foreign currency swap, taken to hedge foreign currency
borrowing, which shall be settled alongwith payment of such borrowing in six equal quarterly instalments ending on
Sensitivity
The following table demonstrate the sensitivity of net unhedged foreign currency exposures relating to financial
instruments to reasonably possible changes in foreign currency exchange rates, with all other variables held constant.
Change in
FC exchange
rate by
Impact on profit or loss and equity (in ` lakhs)
Increase in FC exchange rates Decrease in FC exchange rates
31-Mar-18 31-Mar-17 31-Mar-18 31-Mar-17
US$ sensitivity 5% 7.21 1.66 (7.21) (1.66)
EURO sensitivity 5% 6.85 2.71 (6.85) (2.71)
GBP sensitivity 5% (2.54) - 2.54 -
Further, the change in foreign currency rates will impact the fair value of the derivatives and correspondingly impact the
profit or loss, but there will not be any impact over the hedge period as the derivatives will enable capturing the hedged
rates and the budgeted profitability would remain unchanged.
Further, the impact of change in foreign currency rates (assuming forward premium to remain unchanged) on the fair
valuation of derivatives (excluding derivatives which have hedged the foreign currency denominated receivables and
payables) as at the end of the year, is demonstrated in the table below. However, apart from the impact on the profit or
loss due to fair value changes of the derivatives, the derivatives will help the Group in capturing the hedged rates including
forward premium and the budgeted profitability will remain unaffected.
Change in
FC exchange
rate by
Impact on profit or loss and equity (in ` lakhs)
Increase in FC exchange rates Decrease in FC exchange rates
31-Mar-18 31-Mar-17 31-Mar-18 31-Mar-17
US$ sensitivity 5% (0.80) (44.85) 0.80 44.85
EURO sensitivity 5% 10.12 2.65 (10.12) (2.65)
GBP sensitivity 5% - 5.02 - (5.02)
There is no impact on other components of equity since the Company has not elected to apply hedge accounting.
Notes to the Consolidated Financial Statementsfor the year ended March 31, 2018
(All amounts in ` lakhs, unless otherwise stated)
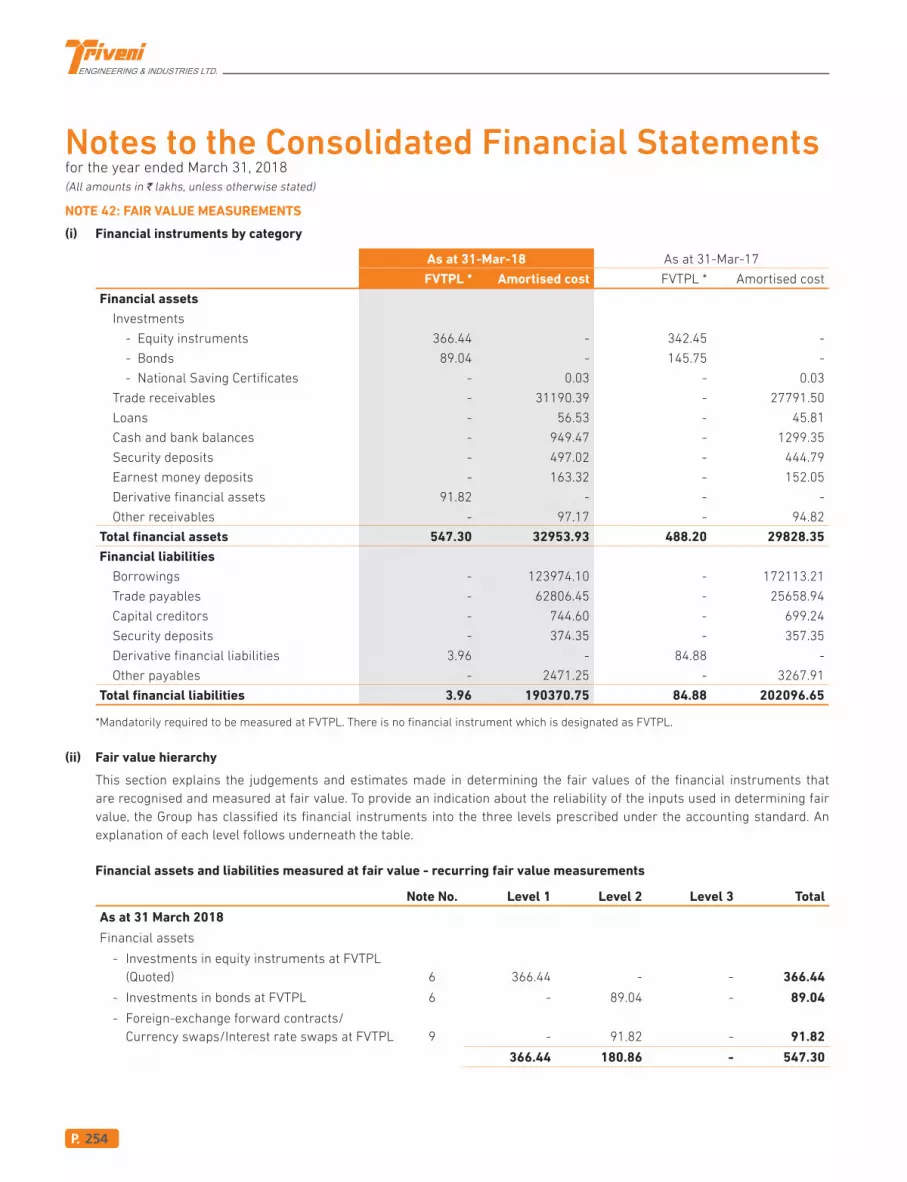
P. 254
NOTE 42: FAIR VALUE MEASUREMENTS
(i) Financial instruments by category
As at 31-Mar-18 As at 31-Mar-17
FVTPL * Amortised cost FVTPL * Amortised cost
Financial assets
Investments
- Equity instruments 366.44 - 342.45 -
- Bonds 89.04 - 145.75 -
- National Saving Certificates - 0.03 - 0.03
Trade receivables - 31190.39 - 27791.50
Loans - 56.53 - 45.81
Cash and bank balances - 949.47 - 1299.35
Security deposits - 497.02 - 444.79
Earnest money deposits - 163.32 - 152.05
Derivative financial assets 91.82 - - -
Other receivables - 97.17 - 94.82
Total financial assets 547.30 32953.93 488.20 29828.35
Financial liabilities
Borrowings - 123974.10 - 172113.21
Trade payables - 62806.45 - 25658.94
Capital creditors - 744.60 - 699.24
Security deposits - 374.35 - 357.35
Derivative financial liabilities 3.96 - 84.88 -
Other payables - 2471.25 - 3267.91
Total financial liabilities 3.96 190370.75 84.88 202096.65
*Mandatorily required to be measured at FVTPL. There is no financial instrument which is designated as FVTPL.
(ii) Fair value hierarchy
This section explains the judgements and estimates made in determining the fair values of the financial instruments that
are recognised and measured at fair value. To provide an indication about the reliability of the inputs used in determining fair
value, the Group has classified its financial instruments into the three levels prescribed under the accounting standard. An
explanation of each level follows underneath the table.
Financial assets and liabilities measured at fair value - recurring fair value measurements
Note No. Level 1 Level 2 Level 3 Total
As at 31 March 2018
Financial assets
- Investments in equity instruments at FVTPL
(Quoted) 6 366.44 - - 366.44
- Investments in bonds at FVTPL 6 - 89.04 - 89.04
- Foreign-exchange forward contracts/
Currency swaps/Interest rate swaps at FVTPL 9 - 91.82 - 91.82
366.44 180.86 - 547.30
Notes to the Consolidated Financial Statementsfor the year ended March 31, 2018
(All amounts in ` lakhs, unless otherwise stated)

P. 255
Annual Report 2017-18
102-266 | Finan
cial Statemen
ts24-101 | Statu
tory R
epo
rts02-17 | C
orp
orate O
verview18-23 | M
anag
emen
t Statemen
ts
Note No. Level 1 Level 2 Level 3 Total
Financial liabilities
- Foreign-exchange forward contracts/
Currency swaps/Interest rate swaps at FVTPL 17 - 3.96 - 3.96
- 3.96 - 3.96
As at 31 March 2017
Financial assets
- Investments in equity instruments at FVTPL
(Quoted) 6 342.45 - - 342.45
- Investments in bonds at FVTPL 6 - 145.75 - 145.75
342.45 145.75 - 488.20
Financial liabilities
- Foreign-exchange forward contracts/
Currency swaps/Interest rate swaps at FVTPL 17 - 84.88 - 84.88
- 84.88 - 84.88
Level 1: Level 1 hierarchy includes financial instruments measured using quoted unadjusted market prices in active markets
for identical assets or liabilities. This includes listed equity instruments that have quoted price. The fair value of all equity
instruments which are traded in the stock exchanges is valued using the closing price as at the reporting date.
Level 2: The fair value of financial instruments that are not traded in an active market is determined using valuation techniques
which maximise the use of observable market data and rely as little as possible on entity-specific estimates. If all significant
inputs required to fair value an instrument are observable, the instrument is included in level 2.
Level 3: If one or more of the significant inputs is not based on observable market data, the instrument is included in level 3.
There are no transfers between levels 1 and 2 during the year.
(iii) Valuation technique used to determine fair value
Specific valuation techniques used to value financial instruments include:
- the fair value of derivatives (viz. foreign exchange forward contracts, foreign currency swaps and interest rate swaps)
is determined using market observable inputs, including prevalent forward rates for the maturities of the respective
contracts and interest rate curves as indicated by banks and third parties.
- the fair value of bonds, determined using observable market data of yield to maturity and coupon rates of securities.
All of the resulting fair value estimates are included in level 2.
(iv) Valuation processes
The Corporate finance team has requisite knowledge and skills in valuation of financial instruments. The team headed by Group
CFO directly reports to the audit committee on the fair value of financial instruments.
(v) Fair value of financial assets and liabilities that are not measured at fair value (but fair value disclosures are required)
Except as detailed in the following table, the management considers that the carrying amounts of financial assets and financial
liabilities recognised in the consolidated financial statements approximate their fair values.
Notes to the Consolidated Financial Statementsfor the year ended March 31, 2018
(All amounts in ` lakhs, unless otherwise stated)

P. 256
As at 31-Mar-18 As at 31-Mar-17
Carrying amount Fair value Carrying amount Fair value
Financial assets
Trade receivables 31190.39 30495.00 27791.50 27495.92
31190.39 30495.00 27791.50 27495.92
Financial liabilities
Trade payables 62806.45 62754.11 25658.94 25541.63
62806.45 62754.11 25658.94 25541.63
Fair value hierarchy
Level 1 Level 2 Level 3 Total
As at 31 March 2018
Financial assets
Trade receivables - - 30495.00 30495.00
- - 30495.00 30495.00
Financial liabilities
Trade payables - - 62754.11 62754.11
- - 62754.11 62754.11
As at 31 March 2017
Financial assets
Trade receivables - - 27495.92 27495.92
- - 27495.92 27495.92
Financial liabilities
Trade payables - - 25541.63 25541.63
- - 25541.63 25541.63
(a) The fair values for trade receivables and trade payables which are expected to be settled after twelve months (including
those which are within the operating cycle) are computed based on discounted cash flows. They are classified as level 3
fair values in the fair value hierarchy due to the inclusion of unobservable inputs including counterparty credit risk. The
carrying amounts of the remaining trade receivables and trade payables are considered to be the same as their fair values,
due to their short-term nature.
NOTE 43: GOVERNMENT GRANTS
(i) Government grants recognised in the consolidated financial statements
Grants recognised in profit or loss Grant recoverable
Year ended
31-Mar-18
Year ended
31-Mar-17
Treatment in
consolidated
financial
statements
As at
31-Mar-18
As at
31-Mar-17
A Deferred government grants
a) Interest subvention @ 12% per annum
on loans aggregating to `12626.00
lakhs availed during financial year
2012-13 under the "Scheme of
Extending Financial Assistance to
Sugar Undertakings, 2013” notified by
the Government of India.
683.45 1075.07 Reduced
from finance
cost (note 30)
- -
Notes to the Consolidated Financial Statementsfor the year ended March 31, 2018
(All amounts in ` lakhs, unless otherwise stated)

P. 257
Annual Report 2017-18
102-266 | Finan
cial Statemen
ts24-101 | Statu
tory R
epo
rts02-17 | C
orp
orate O
verview18-23 | M
anag
emen
t Statemen
ts
Grants recognised in profit or loss Grant recoverable
Year ended
31-Mar-18
Year ended
31-Mar-17
Treatment in
consolidated
financial
statements
As at
31-Mar-18
As at
31-Mar-17
b) Loans at below market interest rate
from Sugar Development Fund,
Government of India
27.88 45.14 Reduced
from finance
cost (note 30)
- -
c) Interest subvention @10% per
annum granted by the Government
of India for one year from the date of
disbursement on loans aggregating to
` 11450.50 lakhs availed in financial
year 2015-16 under the ‘Scheme of
extending Soft Loans to Sugar Mills’.
- 552.81 Reduced
from finance
cost (note 30)
- -
d) Grant of ` 10.00 lakhs in respect of
Moist Hot Air Treatment Plants (MHAT)
received from the State Government of
Uttar Pradesh under Rashtriya Krishi
Vikas Yojna during current year.
0.99 - Presented
under "Other
income"
(note 25)
- -
e) Grant of ` 141.45 lakhs in the form of
duties saved upon import of machinery
under Export Promotion Capital Goods
(EPCG) scheme during current year.
- - Presented
under "Other
income"
(note 25)
- -
Total deferred government grants 712.32 1673.02 - -
B Other revenue grants
a) Reversal of grant, related to cane
production subsidy of ` 4.50 per
quintal of cane pertaining to season
2015-16, (net of grant of ` 39.80 lakhs
accrued during the year) necessitated
due to different computation adopted
by the Government.
- (44.18) Other
expenses
(note 33)
- -
b) Reversal of grant, related to
reimbursement of cane commission on
cane purchased for season
2015-16, based on the final decision
of the state government of UP on cane
price package for Season 2015-16.
- (1330.73) Raw material
consumed
(note 26)
- -
c) Export incentives under Duty Draw
back Scheme, Incremental Export
Incentive Scheme and Merchandise
Export Incentive Scheme.
78.03 23.49 Presented
under "Other
operating
revenue"
(note 24)
- -
Total other revenue grants 78.03 (1351.42) - -
Total grants 790.35 321.60 - -
Notes to the Consolidated Financial Statementsfor the year ended March 31, 2018
(All amounts in ` lakhs, unless otherwise stated)

P. 258
(ii) Government grants in the form of remissions of taxes and duties availed and recognised in the consolidated financial
statements:
Year ended
31-Mar-18
Year ended
31-Mar-17
a) Remission of Purchase tax @ ` 2 per quintal on purchase of cane
- for the sugar season 2015-16. - 17.21
- for the sugar season 2012-13. - 137.70
- 154.91
b) Remissions availed as per the interim order of the High Court in respect of UP
Sugar Industry Promotion Policy, 2004 [see note below] - 526.87
(iii) Movement of deferred government grants is provided here below:
Year ended
31-Mar-18
Year ended
31-Mar-17
As at the beginning of the year 962.20 8090.94
Recognised during the year 151.45 -
Released to the consolidated statement of profit and loss (712.32) (1673.02)
Written back [see note below] - (5455.72)
As at the end of the year 401.33 962.20
Current (refer note 19) 252.20 711.36
Non-current (refer note 19) 149.13 250.84
Total 401.33 962.20
Note :
* The Company had availed the remissions in respect of certain taxes and duties under UP Sugar Industry Promotion Policy, 2004 (“the Policy”)
termination and non-grant of prescribed incentives under the Policy before the Lucknow bench of Allahabad High Court. Pending final adjudication
in the matter, the High Court vide its interim order dated 9 May 2008 permitted limited protection of remissions which were being enjoyed on the
date when the Policy was revoked. Apart from these remissions, the Company was also eligible for reimbursement of certain expenses and a
capital subsidy equivalent to 10% of the amount of investment made in establishment and expansion of sugar and allied industry.
As the prescribed incentive period of 10 years under the Policy had expired and it was taking considerable time for final adjudication of the
matter in the courts, the Company had written-off ` 14002.46 lakhs during FY 2016-17 appearing as recoverable from the state Government
of UP on account of aforesaid reimbursement of expenses and capital subsidy earlier accounted by it under the Policy. Accordingly, deferred
government grant of ` 5455.72 lakhs as on 31 March 2016, pertaining to the capital subsidy, was also written back. Consequently, there was a
net impact of ` 8546.74 lakhs which had been classified under exceptional items in FY 2016-17.
Notes to the Consolidated Financial Statementsfor the year ended March 31, 2018
(All amounts in ` lakhs, unless otherwise stated)

P. 259
Annual Report 2017-18
102-266 | Finan
cial Statemen
ts24-101 | Statu
tory R
epo
rts02-17 | C
orp
orate O
verview18-23 | M
anag
emen
t Statemen
ts
NOTE 44: INTEREST IN OTHER ENTITIES
(i) Subsidiaries
Details of the Group’s subsidiaries at the end of the reporting period are as follows:
Proportion of ownership interest and
voting power held by the Group
Name of Subsidiaries
Principal
activities
Place of incorporation
and operation
As at
31-Mar-18
As at
31-Mar-17
Triveni Engineering Limited see (a) below India 100% 100%
Triveni Energy Systems Limited see (a) below India 100% 100%
Svastida Projects Limited see (a) below India 100% 100%
Triveni Entertainment Limited see (a) below India 100% 100%
Triveni Industries Limited see (a) below India 100% 100%
Triveni Sugar Limited see (a) below India 99.99% 99.99%
(a) These companies are relatively much smaller and there have been no significant business activities in these companies.
(ii) Interest in Associates
Details of the Group’s associates at the end of the reporting period are as follows:
Proportion of ownership interest and
voting power held by the Group
Name of Associates
Principal
activities
Place of incorporation
and operation
As at
31-Mar-18
As at
31-Mar-17
Triveni Turbine Limited Power
generating
equipment and
solutions
India 21.82% 21.82%
Aqwise-Wise Water Technologies Ltd. Water and
wastewater
treatment
solutions
Israel 25.04% 25.04%
The above associates are accounted for using the equity method in these consolidated financial statements.
(a) Summarised financial information of Associates
The summarised financial information below represents amounts shown in the associate’s financial statements and
drawn up for consolidation under equity accounting method by the Group.
Summarised balance sheet of Associates
Triveni Turbine LimitedAqwise-Wise Water
Technologies Ltd.
As at
31-Mar-18
As at
31-Mar-17
As at
31-Mar-18
As at
31-Mar-17
Current assets
Cash and cash equivalent 1153.59 1769.89 1822.27 1918.73
Other assets 46169.49 34862.65 10275.39 7482.19
Total current assets 47323.08 36632.54 12097.66 9400.92
Total non-current assets 27949.18 27751.32 1913.56 922.39
Notes to the Consolidated Financial Statementsfor the year ended March 31, 2018
(All amounts in ` lakhs, unless otherwise stated)

P. 260
Triveni Turbine LimitedAqwise-Wise Water
Technologies Ltd.
As at
31-Mar-18
As at
31-Mar-17
As at
31-Mar-18
As at
31-Mar-17
Current liabilities
Financial liabilities (excluding trade payables
and provisions) 955.72 1415.87 2038.07 5176.04
Other liabilities 27888.87 20969.04 8403.40 1761.29
Total current liabilities 28844.59 22384.91 10441.47 6937.33
Non-current liabilities
Financial liabilities (excluding trade payables
and provisions) 5.06 23.76 979.18 991.22
Other liabilities 1209.50 1629.12 - -
Total non-current liabilities 1214.56 1652.88 979.18 991.22
Balance 45213.11 40346.07 2590.57 2394.76
Contributions of non-controlling interest towards
share in losses - - 86.17 379.65
Net assets 45213.11 40346.07 2676.74 2774.41
Summarised statement of profit and loss of Associates
Triveni Turbine LimitedAqwise-Wise Water
Technologies Ltd.
Year ended
31-Mar-18
Year ended
31-Mar-17
Year ended
31-Mar-18
Year ended
31-Mar-17
Revenue 75331.61 76556.99 13726.28 12566.75
Interest income 17.14 13.92 - -
Depreciation and amortisation 1912.40 1479.87 79.09 69.20
Interest expense 53.34 33.23 91.90 441.83
Profit from continuing operations 9596.95 12355.46 347.08 77.68
Profit from discontinued operations - - - -
Profit for the year 9596.95 12355.46 347.08 77.68
Other comprehensive income 35.93 (162.47) - -
Total comprehensive income 9632.88 12192.99 347.08 77.68
Dividend received from the Associate 864.00 324.00 - -
Reconciliation of the above summarised financial information to the carrying amount of the interest in the associates
recognised in consolidated financial statements:
Triveni Turbine LimitedAqwise-Wise Water
Technologies Ltd.
As at
31-Mar-18
As at
31-Mar-17
As at
31-Mar-18
As at
31-Mar-17
Net assets of the Associates 45213.11 40346.07 2676.74 2774.41
Group's share in % 21.82% 21.82% 25.04% 25.04%
Group's share in ` 9865.51 8803.52 670.26 694.71
Adjustments:
Group's share in adjustment for unrealised profits
on inter-company transactions (net of tax) (4.32) (6.81) - -
Notes to the Consolidated Financial Statementsfor the year ended March 31, 2018
(All amounts in ` lakhs, unless otherwise stated)

P. 261
Annual Report 2017-18
102-266 | Finan
cial Statemen
ts24-101 | Statu
tory R
epo
rts02-17 | C
orp
orate O
verview18-23 | M
anag
emen
t Statemen
ts
Triveni Turbine LimitedAqwise-Wise Water
Technologies Ltd.
As at
31-Mar-18
As at
31-Mar-17
As at
31-Mar-18
As at
31-Mar-17
Goodwill on acquisition (as restated) - - 2172.62 2231.03
Adjustment for tax on balance undistributed profits (1533.33) (1347.04) - -
Other adjustments 0.07 0.07 - -
Carrying amount 8327.93 7449.74 2842.88 2925.74
NOTE 45: ADDITIONAL INFORMATION REQUIRED BY SCHEDULE III
Name of the entity in the Group
Net Assets, i.e., total assets
minus total liabilities Share in profit or loss
Share in other
comprehensive income
Share in total
comprehensive income
As % of
consolidated
net assets Amount
As % of
consolidated
profit or loss Amount
As % of
consolidated
other
comprehensive
income Amount
As % of
consolidated
total
comprehensive
income Amount
Parent
Triveni Engineering &
Industries Limited
31 March 2018 90.86% 85972.44 84.75% 10096.62 100.95% 121.72 84.91% 10218.34
31 March 2017 90.55% 75644.72 91.06% 23032.23 93.47% (448.62) 90.99% 22583.61
Subsidiaries (Group's share)
Indian
Triveni Engineering Ltd.
31 March 2018 0.47% 441.49 -0.01% (1.38) 0.00% - -0.01% (1.38)
31 March 2017 0.52% 437.35 -0.01% (1.27) 0.00% - -0.01% (1.27)
Triveni Energy Systems Ltd.
31 March 2018 0.40% 375.35 -0.01% (1.24) 0.00% - -0.01% (1.24)
31 March 2017 0.44% 370.64 -0.01% (1.27) 0.00% - -0.01% (1.27)
Triveni Sugar Limited
31 March 2018 0.00% 1.00 -0.01% (0.84) 0.00% - -0.01% (0.84)
31 March 2017 0.00% 1.84 0.00% (0.87) 0.00% - 0.00% (0.87)
Svastida Projects Limited
31 March 2018 0.01% 5.99 -0.01% (1.19) 0.00% - -0.01% (1.19)
31 March 2017 0.00% 2.22 0.00% (1.17) 0.00% - 0.00% (1.17)
Triveni Entertainment
Limited
31 March 2018 0.42% 393.92 0.01% 1.12 0.00% - 0.01% 1.12
31 March 2017 0.52% 431.99 0.01% 2.07 0.00% - 0.01% 2.07
Triveni Industries Limited
31 March 2018 0.00% 0.47 -0.01% (1.09) 0.00% - -0.01% (1.09)
31 March 2017 0.00% 0.39 -0.01% (1.36) 0.00% - -0.01% (1.36)
Notes to the Consolidated Financial Statementsfor the year ended March 31, 2018
(All amounts in ` lakhs, unless otherwise stated)

P. 262
Name of the entity in the Group
Net Assets, i.e., total assets
minus total liabilities Share in profit or loss
Share in other
comprehensive income
Share in total
comprehensive income
As % of
consolidated
net assets Amount
As % of
consolidated
profit or loss Amount
As % of
consolidated
other
comprehensive
income Amount
As % of
consolidated
total
comprehensive
income Amount
Non-controlling interests in all
subsidiaries
31 March 2018 0.00% (0.00) 0.00% 0.00 0.00% - 0.00% 0.00
31 March 2017 0.00% (0.00) 0.00% 0.00 0.00% - 0.00% 0.00
Associates (Investments as per
the equity method)
Indian
Triveni Turbine Limited
31 March 2018 8.04% 7607.86 14.56% 1735.10 5.87% 7.08 14.48% 1742.18
31 March 2017 8.06% 6729.67 8.89% 2248.31 7.39% (35.45) 8.92% 2212.86
Foreign
Aqwise-Wise Water
Technologies Ltd.
31 March 2018 -0.17% (163.31) 0.73% 86.91 -6.82% (8.23) 0.65% 78.68
31 March 2017 -0.10% (80.45) 0.08% 19.45 -0.87% 4.18 0.10% 23.63
Total
31 March 2018 100.00% 94635.21 100.00% 11914.01 100.00% 120.57 100.00% 12034.58
31 March 2017 100.00% 83538.37 100.00% 25296.12 100.00% (479.89) 100.00% 24816.23
NOTE 46: LEASES
(i) Obligations under finance leases
The Group has acquired certain lands under lease, classified as finance leases. Original lease term in respect of one of the land is ninety
years whereas another land is on perpetual lease basis. The Group had paid one time payment of lease charges in respect of these leases
and there are no further future lease maintenance payments under the lease agreement. There is no contingent rent or restriction imposed
in the lease agreement.
(ii) Operating lease arrangements
As Lessee
The Group has taken various residential, office and godown premises under operating lease. These are generally not non-
cancellable leases (except for few premises) having unexpired period upto eight years. The leases are renewable by mutual
consent and on mutually agreeable terms. The Group has given refundable interest free security deposits under certain lease
agreements. There is no contingent rent, sublease payments or restriction imposed in the lease agreement.
Payments recognised as expense
Year ended
31-Mar-18
Year ended
31-Mar-17
Lease payments (refer note 33) 591.09 594.17
591.09 594.17
Notes to the Consolidated Financial Statementsfor the year ended March 31, 2018
(All amounts in ` lakhs, unless otherwise stated)

P. 263
Annual Report 2017-18
102-266 | Finan
cial Statemen
ts24-101 | Statu
tory R
epo
rts02-17 | C
orp
orate O
verview18-23 | M
anag
emen
t Statemen
ts
Non-cancellable operating lease commitments
As at
31-Mar-18
As at
31-Mar-17
Not later than one year 259.55 259.55
Later than one year and not later than five years 21.63 281.18
Later than five years - -
281.18 540.73
As Lessor
The Group has given certain portion of its office / factory premises under operating leases (including lease for investment
properties (refer note 4)). These leases are not non-cancellable and are extendable by mutual consent and at mutually agreeable
terms. The gross carrying amount, accumulated depreciation and depreciation recognised in the consolidated statement of
profit and loss in respect of such portion of the leased premises are not separately identifiable. There is no impairment loss in
respect of such premises. No contingent rent has been recognised in the consolidated statement of profit and loss. There are
no minimum future lease payments as there are no non-cancellable leases. Lease income is recognised in the consolidated
statement of profit and loss under “Other income” (refer note 25). Rental income earned by the Group from its investment
properties and direct operating expenses arising on the investment properties for the year is set out in note 4.
NOTE 47: COMMITMENTS
As at
31-Mar-18
As at
31-Mar-17
(a) Estimated amount of contracts remaining to be executed on capital account and not
provided for (net of advances) 50.30 256.51
(b) Operating lease commitments Refer note 46 (ii)
(c) Group's share of associates' commitments:
Estimated amount of contracts remaining to be executed on capital account and not
provided for (net of advances) 147.75 273.12
NOTE 48: CONTINGENT LIABILITIES AND CONTINGENT ASSETS
Contingent liabilities
As at
31-Mar-18
As at
31-Mar-17
(a) Claims against the Group not acknowledged as debts:
(i) Claims which are being contested by the Group and in respect of which the Group
has paid amounts aggregating to ` 414.94 lakhs (31 March 2017: ` 474.41 lakhs ),
excluding interest, under protest pending final adjudication of the cases:
1732.64 2068.50
Sl.
No. Particulars
Amount of contingent liability Amount paid
31-Mar-18 31-Mar-17 31-Mar-18 31-Mar-17
1 Sales tax 245.59 321.68 86.38 106.63
2 Excise duty 773.95 1034.80 294.55 334.34
3 GST 0.57 - 0.57 -
4 Others 712.53 712.02 33.44 33.44
Notes to the Consolidated Financial Statementsfor the year ended March 31, 2018
(All amounts in ` lakhs, unless otherwise stated)

P. 264
Notes to the Consolidated Financial Statementsfor the year ended March 31, 2018
(All amounts in ` lakhs, unless otherwise stated)
As at
31-Mar-18
As at
31-Mar-17
(ii) The Group is contingently liable in respect of short provision against disputed
income tax liabilities (excluding determination of final interest payable thereon) of
` 3174.34 lakhs (31 March 2017: ` 3803.21 lakhs) against which ` 2844.62 lakhs
(31 March 2017: ` 2739.06 lakhs) stands paid. The disputed income tax liability
mainly arises on the issue of taxability of unrealised incentives, majority of which
have been held to be non-taxable in the first appeal filed by the Group.
3174.34 3803.21
(iii) Statutory levies against which remission has been availed under U.P. Sugar
Industry Promotion Policy 2004 issued by the state government of Uttar Pradesh
(refer note 43)
4158.38 4158.38
(iv) Liability arising from claims / counter claims/ Interest in arbitration/ court cases,
claims of certain employees/ex-employees and in respect of service tax, if any, on
certain activities of the Group which are being contested by the Group.
Indeterminate Indeterminate
(v) Group’s share of associates’ contingent liabilities
The amount shown above represent the best possible estimates arrived at on
the basis of available information. The uncertainties, possible payments and
reimbursements are dependent on the outcome of the different legal processes
which have been invoked by the Group or the claimants, as the case may be, and
therefore cannot be predicted accurately. The Group engages reputed professional
advisors to protect its interests and has been advised that it has strong legal
position against such disputes.
147.05 292.33
(b) Guarantees/sureties excluding financial guarantees
Guarantees/surety given on behalf of companies ` Nil (31 March 2017: ` 1490.51
lakhs), including a corporate guarantee of ` Nil (31 March 2017: ` 1450.51 lakhs)
equivalent to GBP Nil (31 March 2017: GBP 17.62 lakhs) given on behalf of an associate
company as a surety for due performance of its obligations under a contract awarded
by an overseas customer and in respect of which, the associate company has fully
indemnified the Company against any claims, damages or expenses, including legal
costs. The guarantees have been given in the normal course of operations of these
companies and are not expected to result in any loss to the Company on the basis of
such companies fulfilling their ordinary commercial obligations.
- 1490.51
Contingent assets
Based on management analysis, there are no material contingent assets as at 31 March 2018 (31 March 2017: ` Nil).
NOTE 49: DISCLOSURES REQUIRED UNDER SECTION 22 OF THE MICRO, SMALL AND MEDIUM ENTERPRISES
DEVELOPMENT ACT, 2006
Based on the intimation received by the Group from its suppliers regarding their status under the Micro, Small and Medium
Enterprises Development Act, 2006, the relevant information is provided here below:
31-Mar-18 31-Mar-17
The principal amount and the interest due thereon remaining unpaid to any supplier at
the end of each accounting year; as at the end of the year
(i) Principal amount 43.42 37.35
(ii) Interest due on above - -

P. 265
Annual Report 2017-18
102-266 | Finan
cial Statemen
ts24-101 | Statu
tory R
epo
rts02-17 | C
orp
orate O
verview18-23 | M
anag
emen
t Statemen
ts
Notes to the Consolidated Financial Statementsfor the year ended March 31, 2018
(All amounts in ` lakhs, unless otherwise stated)
31-Mar-18 31-Mar-17
The amount of interest paid by the buyer in terms of section 16 of Micro, Small and
Medium Enterprises Development Act, 2006, along with the amount of the payment made
to the supplier beyond the appointed day during each accounting year. - -
The amount of interest due and payable for the year on delay in making payment (which
have been paid but beyond the appointed day during the year) but without adding the
interest specified under the Micro, Small and Medium Enterprises Development Act, 2006 - -
The amount of interest accrued and remaining unpaid at the end of each accounting year;
and - -
The amount of further interest remaining due and payable even in the succeeding years,
until such date when the interest dues above are actually paid to the small enterprise, for
the purpose of disallowance of a deductible expenditure under section 23 of the Micro,
Small and Medium Enterprises Development Act, 2006 - -
NOTE 50: DISCLOSURE FOR CERTIFIED EMISSION REDUCTIONS AND RENEWABLE ENERGY CERTIFICATES
(i) In accordance with the Guidance Note on Accounting for self-generated Certified Emission Reductions (CERs), issued by the
Institute of Chartered Accountants of India, the Group has recognised the CERs held by it as inventories in its consolidated
financial statements. Disclosures as required under the Guidance Note are as under:
(a) 86,562 (31 March 2017: 86,562) CERs (net of fee for UNFCCC adaptation fund) have been held as inventory by the Group as
at the end of the year.
(b) There are no CERs under certification as on the date of the consolidated financial statements;
(c) The Group’s Deoband and Khatauli Phase-I projects are registered as Clean Development Mechanism (CDM) projects
with United Nations Framework Convention on Climate Change (UNFCCC) and it is not feasible to identify specific items
of machinery/equipment as an “emission reduction equipment”. Accordingly, details of depreciation and operation &
maintenance costs, pertaining to emission reducing equipment have not been provided.
(ii) During the year, the National Load Despatch Centre (NLDC) has issued 8,420 (31 March 2017: 58,525) Renewable Energy
Certificates (RECs) to the Group under the Central Electricity Regulatory Commission Regulation on RECs. At the close of the
year Nil (31 March 2017: 1,22,728) RECs remained unsold and are held as inventories in the consolidated financial statements.
NOTE 51: STANDARDS ISSUED BUT NOT YET EFFECTIVE
The Ministry of Corporate Affairs (MCA) vide notification dated 28 March 2018 has issued the Companies (Indian Accounting Standards)
Amendment Rules, 2018 which has come up with omission of Ind AS 11 Construction Contracts & Ind AS 18 Revenue with the
introduction of Ind AS 115 Revenue from Contracts with Customers and amendments in various other Ind ASs. These amendments
are effective for accounting periods beginning on or after 1 April 2018 and the Group intends to adopt these amendments when they
become effective. The new Ind AS that are issued, but not yet effective, upto the date of issuance of the Group’s consolidated financial
statements are disclosed below:
Ind AS 115 Revenue from Contracts with Customers : Ind AS 115 establishes a five-step model to account for reveue arising from
contracts with customers. Under Ind AS 115 revenue is recognised when (or as) the entity satisfies a performance obligation by
transferring a promised good or service (i.e. an asset) to a customer (i.e. when (or as) the customer obtains control of that asset) at
an amount that reflects the consideration to which the entity expects to be entitled in exchange for transferring goods or services
to a customer. The new revenue standard will supersede all current revenue recognition requirements under Ind AS. Either a full
retrospective application or a modified retrospective application is required for accounting periods commencing on or after 1 April 2018.
The Group is in process of evaluating the requirements of the said standard and its impact on its consolidated financial statements.

P. 266
Notes to the Consolidated Financial Statementsfor the year ended March 31, 2018
(All amounts in ` lakhs, unless otherwise stated)
NOTE 52: COMPARATIVES
March 31, 2017 being inclusive of excise duty are not comparable with corresponding figures for the year ended March 31, 2018.
(ii) The Group has reclassified certain items of financials of comparative year to confirm this year’s classification, however, impact
of these reclassification are not material.
NOTE 53: APPROVAL OF CONSOLIDATED FINANCIAL STATEMENTS
The consolidated financial statements were approved for issue by the Board of Directors of the Company on 24 May 2018 subject to
approval of shareholders.
As per our report of even date attached
For S S Kothari Mehta & Company For and on behalf of the Board of Directors of Triveni Engineering & Industries Limited
Chartered Accountants
Firm’s registration number : 000756N
Yogesh K. Gupta Dhruv M. Sawhney Homai A. Daruwalla
Partner Chairman & Managing Director Director & Chairperson Audit Committee
Membership No. 093214
Place : Noida (U.P.) Suresh Taneja Geeta Bhalla
Date : May 24, 2018 Group CFO Group Vice President & Company Secretary

Notes

Notes

Information on the Company’s Business Locations
Registered Office
Deoband, District-Saharanpur
Uttar Pradesh-247 554
STD Code: 01336
Phone: 222866, 222185
Fax: 222220
CIN- L15421UP1932PLC022174
Corporate Office
‘Express Trade Towers’, 8th Floor
15-16, Sector - 16A
Noida - 201 301 (U.P.)
STD Code: 0120
Phone: 4308000
Fax: 4311010-11
Share Department/Investors’
Grievances
‘Express Trade Towers’, 8th Floor
15-16, Sector - 16A
Noida - 201 301 (U.P.)
STD Code: 0120
Phone: 4308000, Fax: 4311010-11
Email: [email protected]
Registrar and Share
Transfer Agents
For Equity Shares held in physical
and electronic mode
(Correspondence Address)
M/s Karvy Computershare Pvt. Ltd.
Unit: Triveni Engineering &
Industries Limited
Karvy Selenium Tower B,
Plot 31-32, Gachibowli,
Financial District, Nanakramguda,
Hyderabad-500 032
Phone: 040-67162222
Fax: 040-23001153
Email: [email protected]
Khatauli Sugar Unit
Khatauli, District- Muzaffarnagar,
Uttar Pradesh-251 201
STD Code: 01396
Phone: 0885910861/62
Deoband Sugar Unit
Deoband, District-Saharanpur
Uttar Pradesh-247 554
STD Code: 01336
Phone: 222185, 222866
Fax: 222220
Ramkola sugar unit
Ramkola, District-Kushinagar
Uttar Pradesh-247 305
STD Code: 05567
Phone: 9936300473
Fax: 256248
Sabitgarh Sugar Unit
P.O. Karora, Tehsil Khurja
District-Bulandshahar,
Uttar Pradesh
STD Code: 05733
Phone: 9557794246
Fax: 228894/95
Rani Nangal Sugar Unit
Rani Nangal, Thakurdwara
District - Moradabad
Uttar Pradesh
STD Code: 0591
Phone: 09690003373
Milak Narayanpur Sugar Unit
Milak Narayanpur, P.O. Dadiyal
District-Rampur
Uttar Pradesh - 244 925
STD Code: 0595
Phone: 9758019455
Fax: 2565002
Chandanpur Sugar Unit
P.O. Chapna, Tehsil-Hasanpur,
District - Amroha
Uttar Pradesh - 244 255
STD Code: 05924
Phone: 267004/05, 7830220828
Fax: 267001
Co-generation Khatauli
Khatauli, District - Muzaffarnagar,
Uttar Pradesh - 251 201
STD Code: 01396
Phone: 9897133335
Fax: 9897544464
Co-generation Deoband
Deoband, District-Saharanpur
Uttar Pradesh - 247 554
STD Code: 01336
Phone: 222185, 222866
Fax: 222220
Alco-Chemical Unit
Village Bhikki Bilaspur,
Jolly Road,
District - Muzaffarnagar,
Uttar Pradesh-251 001
STD Code: 0131
Phone: 7895900631-36
Fax: 2600569
Branded Division
‘Express Trade Towers’, 8th Floor
15-16, Sector - 16A
Noida - 201 301(U.P.)
STD Code: 0120
Phone: 4308000
Fax: 4311010-11
Gears Business
1,2,3 Belagola Industrial Area,
Metagalli Post, K.R.S. Road,
Mysore-570 016
STD Code: 0821
Phone: 4280501, 4280502
Fax: 2582694
Water Business
Plot No. 44, Block-A,
Phase II Extension,
Hosiery Complex, Noida,
District Gautam Budh Nagar, U.P.
STD Code: 0120
Phone: 4748000, Fax: 4243049
Subsidiary Companies
Triveni Industries Limited
Sugar Unit Deoband,
District-Saharanpur
Uttar Pradesh-247 554
STD Code: 01336
Phone: 222497, 222185
Fax: 222220
Triveni Engineering Limited
‘Express Trade Towers’, 8th Floor
15-16, Sector- 16A
Noida 201 301(U.P.)
STD Code: 0120
Phone: 4308000, Fax: 4311010-11
Triveni Energy Systems Limited
‘Express Trade Towers’, 8th Floor
15-16, Sector - 16A
Noida - 201 301 (U.P.)
STD Code: 0120
Phone: 4308000, Fax: 4311010-11
Triveni Entertainment Limited
Grand Plaza, 104, 1st Floor,
99, Old Rajinder Nagar Market,
New Delhi-110 060
STD Code: 011
Phone: 25810660
Triveni Sugar Limited
Plot No. 44, Block-A,
Phase II Extension,
Hosiery Complex, Noida,
District Gautam Budh Nagar, U.P.
STD Code: 0120
Phone: 4748000, Fax: 4243049
Svastida Projects Limited
Plot No. 44, Block-A,
Phase II Extension,
Hosiery Complex, Noida,
District Gautam Budh Nagar, U.P.
STD Code: 0120
Phone: 4748000, Fax: 4243049
Corporate Information
Chairman and Managing Director
Mr. Dhruv M. Sawhney
(DIN-00102999)
Vice Chairman & Managing Director
Mr. Tarun Sawhney
(DIN-00382878)
Directors
Mr. Nikhil Sawhney
(DIN-00029028)
Dr. F.C. Kohli
(DIN-00102878)
Lt. Gen. K.K. Hazari (Retd.)
(DIN-00090909)
Mr. Shekhar Datta
(DIN-00045591)
Ms. Homai A. Daruwalla
(DIN-00365880)
Dr. Santosh Pande
(DIN-01070414)
Mr. Sudipto Sarkar
(DIN-00048279)
Group Chief Financial Officer
Mr. Suresh Taneja
Group Vice President &
Company Secretary
Ms. Geeta Bhalla
Bankers
Axis Bank Ltd.
Canara Bank
Central Bank of India
IDBI Bank Ltd.
IndusInd Bank Ltd.
Oriental Bank of Commerce
Punjab National Bank
RBL Bank Ltd.
State Bank of India
Yes Bank Ltd.
Auditors
M/s S.S. Kothari Mehta & Co.
Triveni Group website
www.trivenigroup.com

CIN: L15421UP1932PLC022174
‘Express Trade Towers’,
8th Floor, 15-16, Sector - 16A
Noida - 201 301 (U.P.)
STD Code: 0120
Phone: 4308000
Fax: 4311010-11
Website: www.trivenigroup.com