sedimentation rates test models of oceanic detachment faulting
TRANSCRIPT
Sedimentation rates test models of oceanic
detachment faulting
Ross Parnell-Turner1, Johnson R. Cann2, Deborah K. Smith3, Hans Schouten3, Dana Yoerger3,
Camilla Palmiotto4, Alexei Zheleznov5, and Hailong Bai6
1Department of Earth Sciences, University of Cambridge, Cambridge, UK, 2School of Earth and Environment, University of
Leeds, Leeds, UK, 3Woods Hole Oceanographic Institution, Woods Hole, Massachusetts, USA, 4Istituto di Scienze Marine,
CNR, Bologna, Italy, 5Institute of Earth Sciences, Saint Petersburg State University, St. Petersburg, Russia, 6Department of
Geology, University of Maryland, College Park, Maryland, USA
Abstract Long-lived detachment faults play an important role in the construction of new oceanic crust
at slow-spreading mid-oceanic ridges. Although the corrugated surfaces of exposed low-angle faults
demonstrate past slip, it is difficult to determine whether a given fault is currently active. If inactive, it is
unclear when slip ceased. This judgment is crucial for tectonic reconstructions where detachment faults
are present, and for models of plate spreading. We quantify variation in sediment thickness over two
corrugated surfaces near 16.5°N at the Mid-Atlantic Ridge using near-bottom Compressed High Intensity
Radar Pulse (CHIRP) data. We show that the distribution of sediment and tectonic features at one detachment
fault is consistent with slip occurring today. In contrast, another corrugated surface 20 km to the south
shows a sediment distribution suggesting that slip ceased ~150,000 years ago. Data presented here
provide new evidence for active detachment faulting, and suggest along-axis variations in fault activity
occur over tens of kilometers.
1. Introduction
It is now recognized that detachment faulting, leading to the formation of oceanic core complexes, plays a
significant role in crustal construction at slow- and ultraslow-spreading ridges [Tucholke et al., 1998; Smith et al.,
2006; Ildefonse et al., 2007]. Typically, normal faults accommodate plate spreading through a few hundreds
of meters of slip, before becoming inactive as a new generation of normal faults initiates closer to the axis. Slip
on detachment faults, by contrast, can lead to heaves (i.e., horizontal displacements) of up to 100 km,
exhuming lower crust and upper mantle rocks to the seafloor [Tucholke and Lin, 1994; Cann et al., 1997; Cannat
et al., 2006; Smith et al., 2006; Okino et al., 2004; Baines et al., 2008; Grimes et al., 2008; Dick et al., 2008].
Corrugations oriented parallel to the direction of spreading have been frequently observed over the surfaces
of oceanic detachment faults [Tucholke and Lin, 1994; Cann et al., 1997; Tucholke et al., 1998]. Corrugated
surfaces are interpreted as the exposed footwall of low-angle detachments, emerging from beneath the
hanging wall of the median valley floor [Cann et al., 1997; Tucholke et al., 1998;MacLeod et al., 2002]. Despite
the growing evidence that detachment faulting is very common at slow-spreading ridges, only one such
area has been studied to determine whether it was actively slipping at depth. A section of the TAG detachment
at 26°N on the MAR was the site of a successful seismicity and seismic structure study [DeMartin et al., 2007].
The experiment showed an active dome-shaped fault surface extending between 3 and 7 km below the
seafloor. In the absence of these data at other sites, it has been difficult to obtain direct evidence whether a
detachment fault in the rift valley wall is active or not. If no longer active, the timing of when a fault stopped
slipping is central to understanding the formation and evolution of detachment faulting.
The large number of hydroacoustically detected earthquakes (magnitude of completeness >3; Bohnenstiehl
et al. [2002]) and a preliminary bathymetric survey provided early clues that detachment faulting plays a
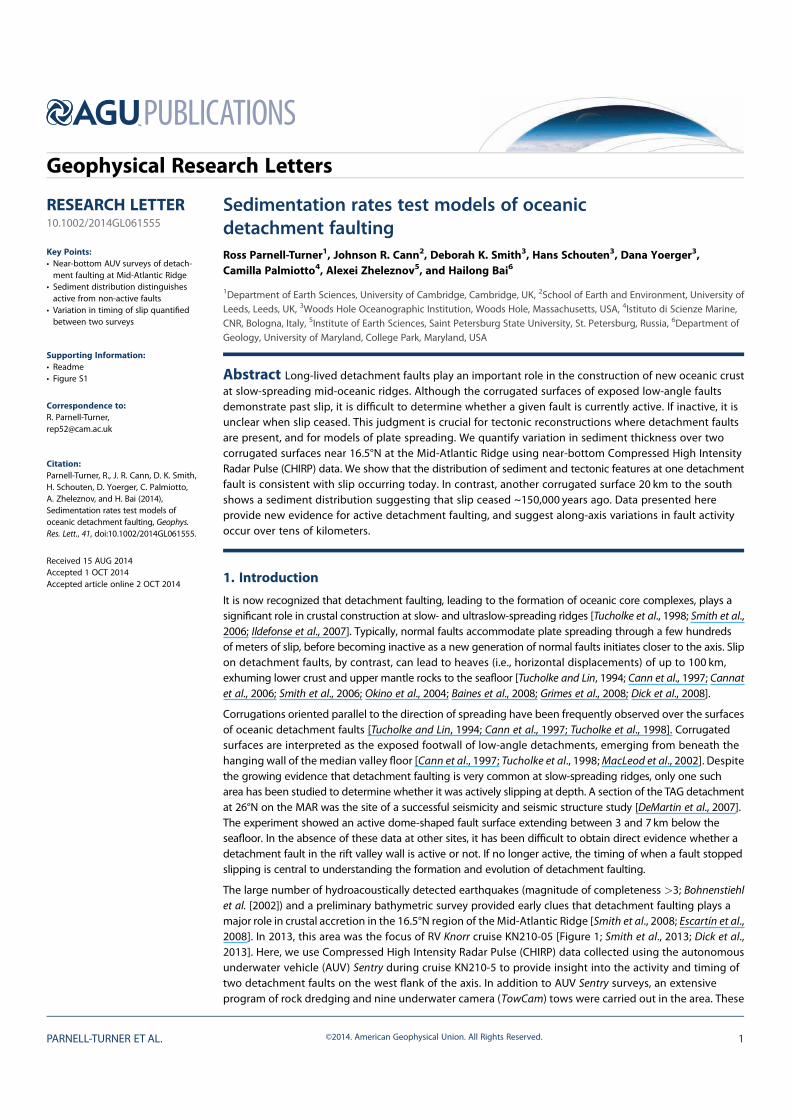
major role in crustal accretion in the 16.5°N region of the Mid-Atlantic Ridge [Smith et al., 2008; Escartín et al.,
2008]. In 2013, this area was the focus of RV Knorr cruise KN210-05 [Figure 1; Smith et al., 2013; Dick et al.,
2013]. Here, we use Compressed High Intensity Radar Pulse (CHIRP) data collected using the autonomous
underwater vehicle (AUV) Sentry during cruise KN210-5 to provide insight into the activity and timing of
two detachment faults on the west flank of the axis. In addition to AUV Sentry surveys, an extensive
program of rock dredging and nine underwater camera (TowCam) tows were carried out in the area. These
PARNELL-TURNER ET AL. ©2014. American Geophysical Union. All Rights Reserved. 1
PUBLICATIONS
Geophysical Research Letters
RESEARCH LETTER10.1002/2014GL061555
Key Points:
• Near-bottom AUV surveys of detach-
ment faulting at Mid-Atlantic Ridge
• Sediment distribution distinguishes
active from non-active faults
• Variation in timing of slip quantified
between two surveys
Supporting Information:
• Readme
• Figure S1
Correspondence to:
R. Parnell-Turner,
Citation:
Parnell-Turner, R., J. R. Cann, D. K. Smith,
H. Schouten, D. Yoerger, C. Palmiotto,
A. Zheleznov, and H. Bai (2014),
Sedimentation rates test models of
oceanic detachment faulting, Geophys.
Res. Lett., 41, doi:10.1002/2014GL061555.
Received 15 AUG 2014
Accepted 1 OCT 2014
Accepted article online 2 OCT 2014
additional data provide independent
constraints on the rock types,
sediment cover, and fault terminations
at the seafloor.
2. AUV Sentry Data
AUV Sentrywas used tomake 14 detailed
survey dives within the 16.5°N region.
We examine the multibeam bathymetry,
side scan sonar and CHIRP data from two
of these Sentry dives. Each dive covered
an area of ~10 km2. AUV Sentry flew at a
height of ~65m above the seafloor, at a
speed of ~0.8m s!1 (~1.5 kts). Tracks
were spaced ~180m apart to obtain
100% coverage by the 400 kHz Reson
7125 multibeam sonar, which has a
spatial resolution of ~0.5m. CHIRP
profiles, which provide cross-sectional
images of shallow sediment cover, were
acquired with an Edgetech 2200M unit
operating with a frequency sweep of
4–24 kHz. Vertical resolution is ~10 cm.
CHIRP data were processed using open
Figure 1. Location map (inset) and multibeam bathymetric map of study
area [Cruise KN210-05; Smith et al., 2013]. Numbered black boxes = location
of Sentry dives 180 and 181; red line = spreading axis; dashed line with
tick marks = eastern bounding fault; SCC = South Core Complex.
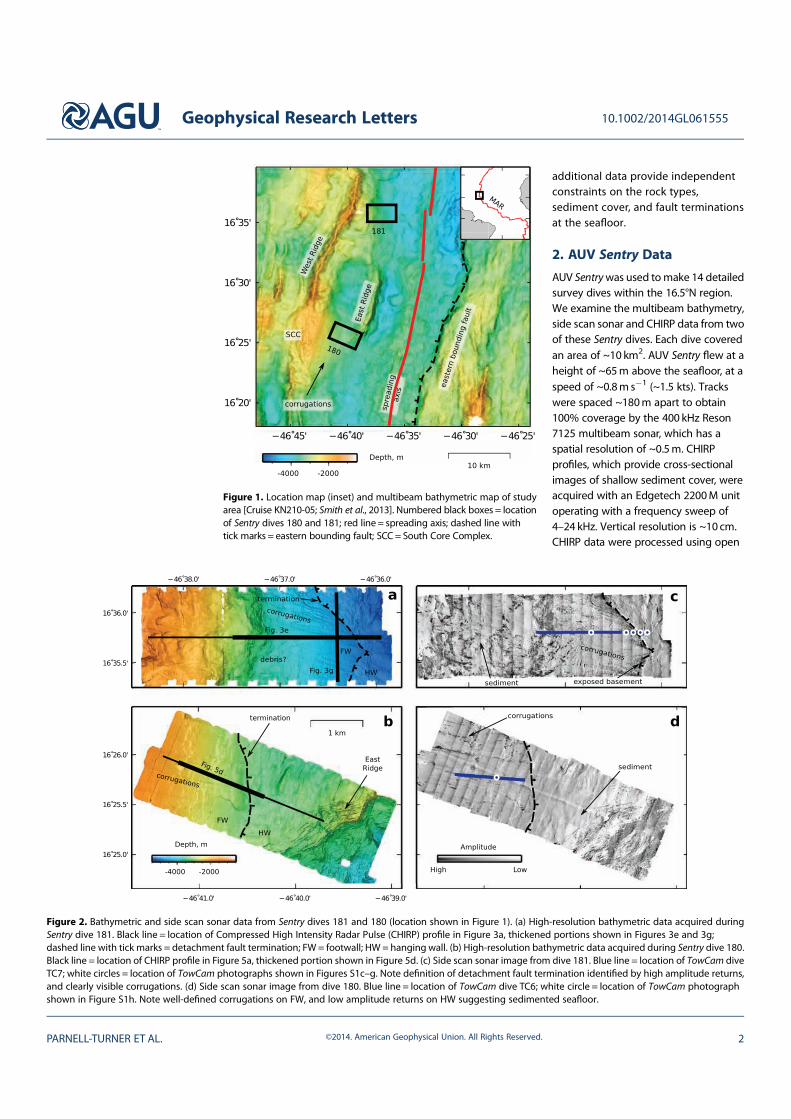
Figure 2. Bathymetric and side scan sonar data from Sentry dives 181 and 180 (location shown in Figure 1). (a) High-resolution bathymetric data acquired during
Sentry dive 181. Black line = location of Compressed High Intensity Radar Pulse (CHIRP) profile in Figure 3a, thickened portions shown in Figures 3e and 3g;
dashed line with tick marks = detachment fault termination; FW= footwall; HW= hanging wall. (b) High-resolution bathymetric data acquired during Sentry dive 180.
Black line = location of CHIRP profile in Figure 5a, thickened portion shown in Figure 5d. (c) Side scan sonar image from dive 181. Blue line = location of TowCam dive
TC7; white circles = location of TowCam photographs shown in Figures S1c–g. Note definition of detachment fault termination identified by high amplitude returns,
and clearly visible corrugations. (d) Side scan sonar image from dive 180. Blue line = location of TowCam dive TC6; white circle = location of TowCam photograph
shown in Figure S1h. Note well-defined corrugations on FW, and low amplitude returns on HW suggesting sedimented seafloor.
Geophysical Research Letters 10.1002/2014GL061555
PARNELL-TURNER ET AL. ©2014. American Geophysical Union. All Rights Reserved. 2
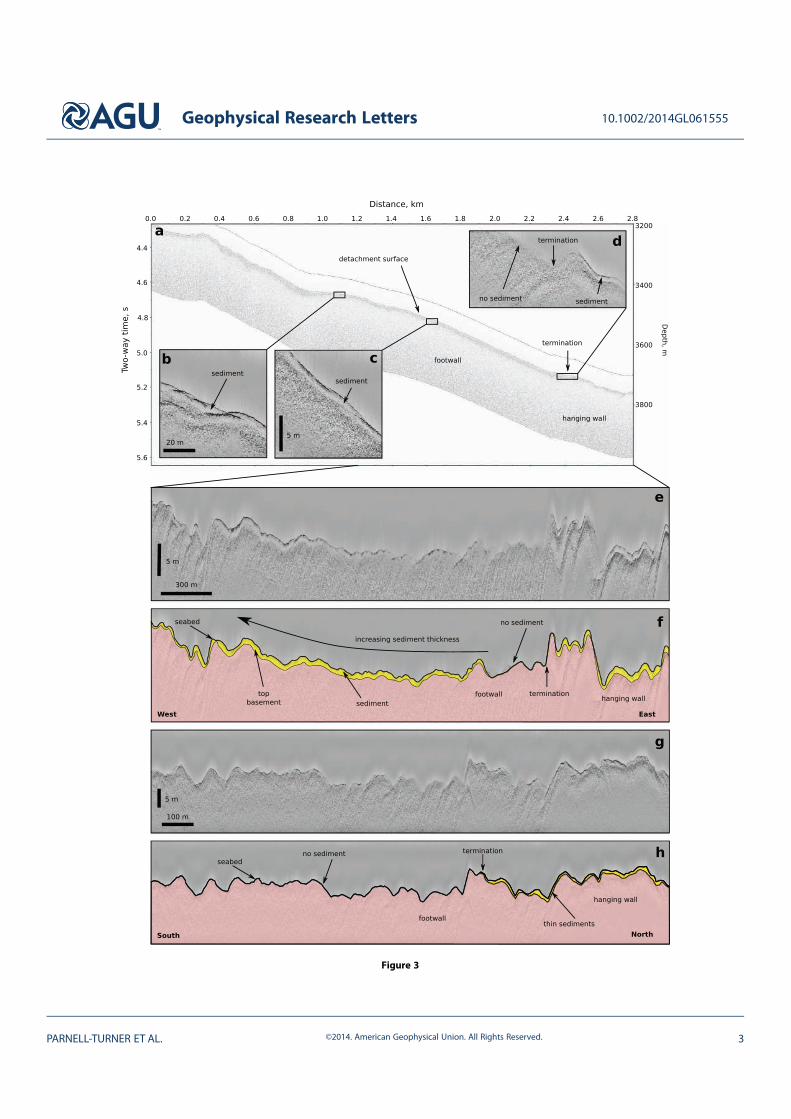
Figure 3
Geophysical Research Letters 10.1002/2014GL061555
PARNELL-TURNER ET AL. ©2014. American Geophysical Union. All Rights Reserved. 3
source MB-System and SeismicUnix software packages [Caress and Chayes, 1996; Cohen and Stockwell,
2013]. Processing consisted of applying a zero-phase, sine-squared bandpass filter (trapezoidal weights 0, 1, 1,
0; frequencies 0.08, 0.1, 24, 25 kHz) to remove noise and frequencies associated with other instruments on the
vehicle; static correction according to vehicle depth, and depth conversion using a constant (water) velocity of
1500ms!1.
3. Sediment Thickness at Two Detachment Faults Near 16.5°N
We compare the results of two Sentry dives, 180 and 181, located on the western rift valley wall (Figure 1). Dive
181 was located close to 16° 36′N, ~5.5 km from the crest of the axial volcanic ridge. An evenly dipping
(slope ~18°), convex upward, corrugated surface was revealed by the high-resolution bathymetric data. The
corrugated surface transitions to an area of irregular topography at the top of the slope (Figure 2a). The
fine-scale corrugations on this surface, tens of meters in wavelength, are resolvable only with the high-
resolution bathymetric data acquired using Sentry [Smith et al., 2013]. The corrugations terminate along an
arcuate line at the base of the slope, against a terrain that has the hummocky morphology of volcanic
seafloor (eastern portion of Figure 2a). In the detachment fault interpretation, this termination would be
the line along which the footwall of the detachment emerges at the seafloor from beneath a hanging
wall (i.e., the inner valley floor in this case). Approximately 1.5 km to the west of the fault termination, the
low-angle corrugated surface appears to be covered by debris, most likely to be material eroded from upslope.
High amplitude (i.e., dark) returns from the tops of the corrugations near the termination in the side scan
sonar image suggest basement rock protruding from beneath a thin covering of sediment (Figure 2c).
The termination itself is sharp in character. Immediately to the west of the termination, sonar returns from
the most recently exposed footwall are high in amplitude, indicating outcropping basement or very thin
sediment cover.
Figure 3 shows a CHIRP profile crossing the termination of the corrugated surface from dive 181. Sediments are
1–2m thick on the upper slopes of the domed detachment surface (footwall, Figure 3b), and progressively thin
downslope (Figure 3c). No resolvable sediment is observed near the western side of the termination (Figure 3d).
Sediment thickness maps were constructed from the CHIRP profiles collected along the Sentry tracklines.
Profiles are spaced 180m apart and run across the survey; a single profile was collected through the middle of
each survey (black lines, Figures 2a and 2b). Seabed and sediment-basement reflections were hand-picked
along flattened CHIRP profiles, and converted from two-way travel time to depth using a constant (water)
velocity of 1500ms!1. These horizons were used to create a gridded isopach of sediment thickness for each
dive area. The resulting map shows varying amounts of sediment cover, decreasing downslope toward the
termination (Figure 4a). Profiles closest to the termination are devoid of resolvable sediment. The lack of
sediment adjacent to the termination implies that slip is currently occurring on the detachment fault at dive
181. Patches of thicker sediment close to the top of the footwall slope in Figure 4a are likely to be the result
of material slumped from higher up. In general, to the east of the termination on the hanging wall side,
sediment is ~2m thick (Figures 3d, 3e, and 3f). Profiles oriented perpendicular to the slip direction on the
hanging wall side also show a sediment thickness of ~2m (Figures 3g and 3h).
The discontinuity in sediment thickness is confirmed by photographs acquired at the seafloor during
deep-towed imaging surveys with the TowCam imaging system [Fornari, 2003]. Seafloor photographs
acquired at dives 180 and 181 are presented in the supporting information (location shown in Figure 2;
Figure 3. CHIRP profiles acquired during Sentry dive 181 (see Figure 2a for location). Insets (b)–(d) plotted at same scale.
(a) Profile extending west–east through the center of the survey across the detachment surface. (b) Detailed inset showing
~1–2m thick sediment cover on upper (west) slope of detachment surface. (c) Detailed inset showing sediment progres-
sively thinning downslope. (d) Detailed inset at the detachment termination, showing absence of sediment west of the
termination (footwall), and 1m of sediment immediately east on the hanging wall. (e) Detailed portion of profile in
Figure 3a, flattened according to height of Sentry vehicle above the seafloor to remove the effect of steep bathymetric
slopes to aid interpretation seafloor (see Figure 2a for location). Note variation in sediment thickness across the detachment
surface. (f) Interpreted version of Figure 3e, note location of termination and increasing up-slope sediment cover. Yellow
shading: sediment; pink shading: basement. (g) Profile oriented perpendicular to footwall corrugations, flattened according to
height of Sentry vehicle above the seafloor (location shown in Figure 2a). (h) Interpreted version of Figure 3g. Note lack of
sediment south of the termination, and consistent veneer of sediment on the hanging wall side of profile.
Geophysical Research Letters 10.1002/2014GL061555
PARNELL-TURNER ET AL. ©2014. American Geophysical Union. All Rights Reserved. 4
photographs in Figure S1). Figure S1c shows that in the area covered by dive 181, sediment blankets the
western part of the corrugated surface, far from the termination. About 150m west of the termination, the
detachment surface is partly sediment covered with numerous rock fragments (Figure S1d). The approach to
the termination is shown in Figure S1e, where a very thin sediment layer partly covers the basement. The ~10m
high edge of the hanging wall at the termination (with overlying sediments) is imaged in Figure S1f. The
sediment covered hanging wall is shown in Figure S1g.
Dive 180 was located ~20 km south of dive 181. It is ~10 km from the volcanic axis and covers the
northern section of the corrugated surface of South Core Complex (SCC; Figure 1). Between the eastern
extent of the corrugated surface of the SCC in dive 180 and the volcanic spreading axis is a more
recent normal fault, called East Ridge. This fault is the new inner valley floor boundary fault. Assuming
that East Ridge fault initiated 3.5 km from the axis, it has been active for ~200 ka [Smith et al., 2008].
Smith et al. [2013] suggested that the section of the SCC detachment fault behind East Ridge stopped
slipping when East Ridge fault formed. Dive 180 examined this section of the SCC fault and its possible
extinct termination.
Bathymetric data from dive 180 show the corrugated surface to be a uniformly convex surface terminating at
a break in slope against the fill of the basin behind East Ridge (Figure 2c). The termination of the fault
with the basin material is sharp and easily identified. High amplitude returns on side scan images reveal a
pattern of parallel corrugations to the west of the fault termination (Figure 2d). A CHIRP profile oriented
roughly parallel to the corrugations and straddling the termination is shown in Figure 5. Sediment of variable
thickness blankets the entire survey area, including a 0.5–2m thick veneer of sediment over the domed
corrugated surface (Figures 4b and 5). TowCam images show that sediment blankets the seafloor to the west
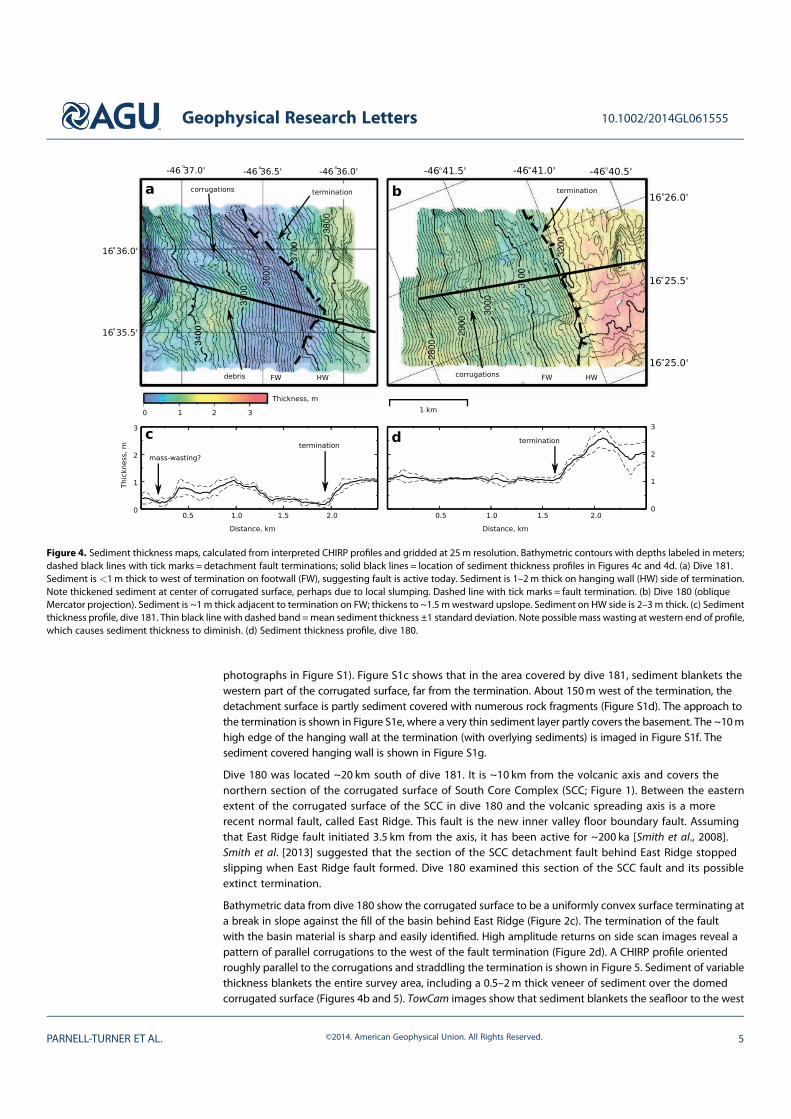
Figure 4. Sediment thickness maps, calculated from interpreted CHIRP profiles and gridded at 25m resolution. Bathymetric contours with depths labeled in meters;
dashed black lines with tick marks = detachment fault terminations; solid black lines = location of sediment thickness profiles in Figures 4c and 4d. (a) Dive 181.
Sediment is <1m thick to west of termination on footwall (FW), suggesting fault is active today. Sediment is 1–2m thick on hanging wall (HW) side of termination.
Note thickened sediment at center of corrugated surface, perhaps due to local slumping. Dashed line with tick marks = fault termination. (b) Dive 180 (oblique
Mercator projection). Sediment is ~1m thick adjacent to termination on FW; thickens to ~1.5m westward upslope. Sediment on HW side is 2–3m thick. (c) Sediment
thickness profile, dive 181. Thin black line with dashed band =mean sediment thickness ±1 standard deviation. Note possible mass wasting at western end of profile,
which causes sediment thickness to diminish. (d) Sediment thickness profile, dive 180.
Geophysical Research Letters 10.1002/2014GL061555
PARNELL-TURNER ET AL. ©2014. American Geophysical Union. All Rights Reserved. 5
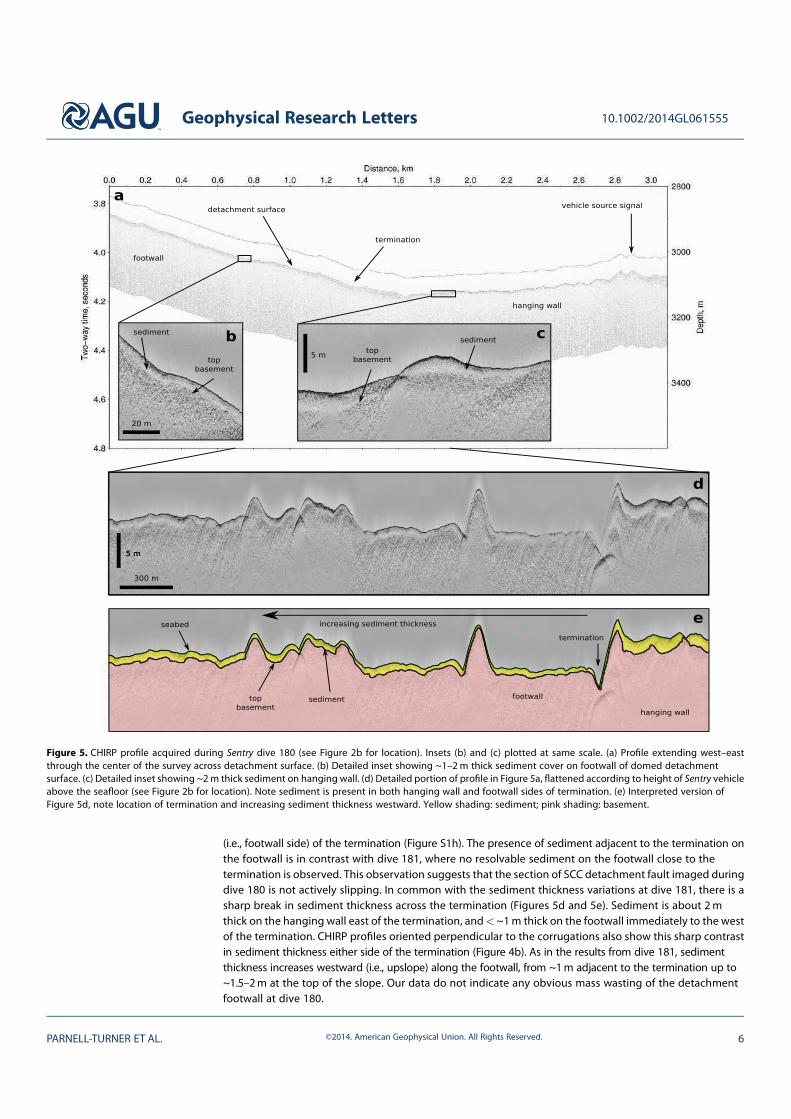
(i.e., footwall side) of the termination (Figure S1h). The presence of sediment adjacent to the termination on
the footwall is in contrast with dive 181, where no resolvable sediment on the footwall close to the
termination is observed. This observation suggests that the section of SCC detachment fault imaged during
dive 180 is not actively slipping. In common with the sediment thickness variations at dive 181, there is a
sharp break in sediment thickness across the termination (Figures 5d and 5e). Sediment is about 2m
thick on the hanging wall east of the termination, and<~1m thick on the footwall immediately to the west
of the termination. CHIRP profiles oriented perpendicular to the corrugations also show this sharp contrast
in sediment thickness either side of the termination (Figure 4b). As in the results from dive 181, sediment
thickness increases westward (i.e., upslope) along the footwall, from ~1m adjacent to the termination up to
~1.5–2m at the top of the slope. Our data do not indicate any obvious mass wasting of the detachment
footwall at dive 180.
Figure 5. CHIRP profile acquired during Sentry dive 180 (see Figure 2b for location). Insets (b) and (c) plotted at same scale. (a) Profile extending west–east
through the center of the survey across detachment surface. (b) Detailed inset showing ~1–2m thick sediment cover on footwall of domed detachment
surface. (c) Detailed inset showing ~2m thick sediment on hanging wall. (d) Detailed portion of profile in Figure 5a, flattened according to height of Sentry vehicle
above the seafloor (see Figure 2b for location). Note sediment is present in both hanging wall and footwall sides of termination. (e) Interpreted version of
Figure 5d, note location of termination and increasing sediment thickness westward. Yellow shading: sediment; pink shading: basement.
Geophysical Research Letters 10.1002/2014GL061555
PARNELL-TURNER ET AL. ©2014. American Geophysical Union. All Rights Reserved. 6
4. Discussion
In a simple interpretation of detachment faulting, the footwall at the termination should be the most recent
section exhumed to the seafloor, and the time of exposure of the footwall should increase with distance from
the termination. Thus, in an active detachment, the footwall near the termination should be more recently
exposed than at an inactive detachment. We test and develop this hypothesis below.
Combining observations from AUV Sentry bathymetric data, side scan sonar images, CHIRP profiles, and
TowCam seafloor photographs has allowed us to locate the terminations of two detachment faults in the
western rift valley wall in the 16.5°N region (dives 181 and 180; Figure 1). At both terminations the sediment
thickness shows a sharp increase from the corrugated footwall onto the un-corrugated hanging wall, and a
gradual increase in thickness away from the termination westward across the corrugated footwall. This is
consistent with the simple interpretation above.
At dive 181, the 0–0.5m thick sediment on the corrugated surface immediately adjacent to the termination
suggests that it is actively emerging at the seafloor. There has not been enough time for significant sediment to
accumulate. The observed upslope thickening of sediments is consistent with the increase in time that the
footwall has been exposed at the seafloor. In dive 180 by contrast, the 1m thick sediment cover on the footwall
adjacent to the termination suggests that the detachment fault there is not active today and has been
inactive for long enough for 1m of sediment to accumulate. Here again, the sediment thickens westward
away from the termination consistent with past slip on the detachment, and an increase in length of
time the footwall has been exposed at the seafloor. These observations also are consistent with our initial
simple interpretation of fault behavior.
We use two independent estimates of sedimentation rate to quantify the timing and rate of slip on the SCC
and dive 181 detachment faults. First, constraints on the lithology and accumulation rate of sediments in
the region can be obtained from sediment cores recovered nearby. The nearest sediment sample was
collected ~75 km north of our study area in a piston core at site V23-112 (17°16′N, 46°45′W; 2845m water
depth). Sediments at this site consist of foraminiferal ooze, greyish-orange in color, with a very high
carbonate content [National Geophysical Data Center digital archive], in good agreement with sediments
recovered during our dredge hauls in the 16.5°N study area. The sediment accumulation rate calculated from
V23-112 and one other nearby piston core recovered nearest to the ridge axis in this region is 7 ± 2mmka!1
[Damuth, 1977]. Second, we use the half-spreading rate at 16.5°N as an alternative approach to estimate the
sedimentation rate, as follows. If we assume that slip on a detachment fault accounts for half of the extension
at a spreading center the slip on the faults would be at the half-spreading rate of 12.5mm a!1 [Fujiwara et al.,
2003], implying that the 1.5 km long corrugated surface at dive 181 took ~120 ka to form. The observed 1m
thick sediment located at the top of this corrugated surface, 1.5 km west of the termination, must have
accumulated over this ~120 ka period, yielding a sedimentation rate of 8mmka!1. Combining these two
independent estimates gives a mean sedimentation rate of ~7±2mmka!1.
We use this accumulation rate to quantify the time at which slip ceased on the fault at dive 180. Since we
observe on average, 1m of sediment adjacent to the termination at dive 180, slip on that fault must have
ceased at 150 ± 50 ka. This timing is consistent with the structural estimate that slip began on East Ridge at
approximately 200 ka [Smith et al., 2008], suggesting that when East Ridge fault formed, the detachment at
dive 180 ceased extending. Finally, the 2m thick sediment on the hanging wall side of the terminations at both
dive 180 and 181 implies that the hanging walls have not been volcanically resurfaced for ~300±100 ka.
Observations of continental detachment faults suggest that cataclasites and fault breccias are thickest on the
lateral walls of fault corrugations [John, 1987; Davis and Lister, 1988]. Sediments might also be expected to
accumulate in the troughs of corrugations [Davis et al., 1993]. Our observations show that perpendicular
to the spreading direction, corrugations are more or less uniformly covered in sediment at the resolution of
the CHIRP data (cms). Toward the lower slopes of the detachment surface at dive 181, the corrugations
appear to be sediment-free (see corrugation-perpendicular CHIRP profile in Figure 3g). The possible effects of
mass wasting upon the distribution of sediment across the study area also should be considered. Headwall
scars on the upper slopes of the 181 detachment fault (Figure 1b), and irregular variations in sediment
thickness (Figures 3, 4, and 5), suggest that mass wasting plays a role in redistributing sediment here. Sediment
is likely to be slumping eastward off the upper slope in the dive 181 area, but it does not appear to be
accumulating near the termination (Figures 2e and 2f). Nonetheless, sediment redistribution through land
Geophysical Research Letters 10.1002/2014GL061555
PARNELL-TURNER ET AL. ©2014. American Geophysical Union. All Rights Reserved. 7
sliding as well as ocean currents may explain the uneven and occasionally patchy sediment at the top of the
detachment footwall slopes. Turbulent oceanic mixing and stronger tidal currents are more likely in locations
of rough bathymetry [Ledwell et al., 2000], such as on the uneven terrain on the upper slopes of detachment
fault surfaces (Figures 2 and 4).
5. Conclusions
We have presented observations of sediment thickness over oceanic detachment faults using near-bottom
CHIRP data acquired by AUV Sentry. Overall the distribution of sediment thicknesses is consistent with a
simple interpretation of detachment faulting. In this hypothesis, a corrugated surface emerges from beneath
the hanging wall at the fault termination, then spreads steadily away from the termination and the volcanic
axis. The low-angle, corrugated detachment fault imaged with dive 181 has a sharp termination located
4.5 km from the axis. The footwall, where it emerges from beneath the valley floor, has 0–0.5m thick sediment
cover. These observations suggest that this surface is recently exposed at the surface and thus is actively
slipping today. A section of the low-angle, corrugated SCC detachment (dive 180) located ~20 km to the
south of dive 181, and ~10 km from the volcanic axis also has a sharp termination. Near to the termination
the exposed surface has ~1m of sediment. Assuming a sedimentation rate of 7 ± 2mmka!1, this part of
the SCC detachment fault has been inactive for 150 ± 50 ka, which is consistent with slip initiating closer
to the axis on East Ridge fault at ~200 ka [Smith et al., 2008]. Our results suggest that the style of active normal
faulting in this region varies along axis on scales as short as 20 km. Determinations of sediment thickness
from near-bottom CHIRP data have allowed us to make a significant step forward in quantitatively unraveling
the tectonic history of an area dominated by detachment faulting.
ReferencesBaines, A. G., M. J. Cheadle, B. E. John, and J. J. Schwartz (2008), The rate of oceanic detachment faulting at Atlantis Bank SW Indian Ridge,
Earth Planet. Sci. Lett., 273, 105–114.
Bohnenstiehl, D. R., M. Tolstoy, R. P. Dziak, C. G. Fox, and D. K. Smith (2002), Aftershock sequences in the mid-ocean ridge environment: An
analysis using hydroacoustic data, Tectonophysics, 354(1–2), 49–70.
Cann, J. R., D. K. Blackman, D. K. Smith, E. McAllister, B. Janssen, S. Mello, E. Avgerinos, A. R. Pascoe, and J. Escartín (1997), Corrugated slip
surfaces formed at North Atlantic ridge-transform intersections, Nature, 385, 329–332.
Cannat, M., D. Sauter, V. Mendel, E. Ruellan, K. Okino, J. Escartín, V. Combier, and M. Baala (2006), Modes of seafloor generation at a melt-poor
ultraslow-spreading ridge, Geology, 34, 605–608.
Caress, D. W., and D. L. Chayes (1996), Improved Processing of Hydrosweep DSMultibeam Data on the R/V Maurice Ewing,Mar. Geophys. Res.,
18, 631–650.
Cohen, J. K., and J. W. Stockwell (2013), CWP/SU: Seismic Un*x. Release No. 43R5: An open source software package for seismic research and
processing, Center for Wave Phenomena, Colo. School of Mines, Golden, Colo.
Damuth, J. E. (1977), Late Quaternary sedimentation in the western equatorial Atlantic Late Quaternary sedimentation in the western
equatorial Atlantic, Geol. Soc. Am. Bull., 88, 695–710.
Davis, G. A., and G. S. Lister (1988), Detachment faulting in continental extension; Perspectives from the Southwestern U.S. Cordillera, Geol.
Soc. Am. Spec. Pap., 218, 133–159.
Davis, G. A., T. K. Fowler, K. M. Bishop, T. C. Brudos, S. J. Friedmann, D. W. Burbank, M. A. Parke, and B. C. Burchfiel (1993), Pluton pinning of an
active Miocene detachment fault system, eastern Mojave Desert, California, Geology, 21(7), 627.
DeMartin, B. J., R. A. Sohn, J. P. Canales, and S. E. Humphris (2007), Kinematics and geometry of active detachment faulting beneath the Trans-
Atlantic Geotraverse (TAG) hydrothermal field on the Mid-Atlantic Ridge, Geology, 35(8), 711–714.
Dick, H. J. B., M. A. Tivey, and B. E. Tucholke (2008), Plutonic foundation of a slow-spreading ridge segment: Oceanic core complex at Kane
Megamullion, 23°30’N, 45°20’W, Geochem. Geophys. Geosyst., 9, Q05014, doi:10.1029/2007GC001645.
Dick, H. J. B., D. K. Smith, J. R. Cann, H. Schouten, H. Marschall, R. E. Parnell-Turner, and D. Yoerger (2013), Crustal Heterogeneity and
Stratigraphy on the Mid-Atlantic Ridge at 16°-17°N, Abstract OS41E-06 presented at 2013 Fall Meeting, AGU, San Francisco, Calif., 9–13 Dec.
Escartín, J., D. K. Smith, J. R. Cann, H. Schouten, C. H. Langmuir, and S. Escrig (2008), Central role of detachment faults in accretion of slow-
spreading oceanic lithosphere, Nature, 455(7214), 790–4.
Fornari, D. J. (2003), A new deep-sea towed digital camera and multi-rock coring system, Eos Trans. AGU, 84, 69–76, doi:10.1029/
2003EO080001.
Fujiwara, T., J. Lin, T. Matsumoto, P. B. Kelemen, B. E. Tucholke, and J. F. Casey (2003), Crustal evolution of the Mid-Atlantic Ridge near the
Fifteen-Twenty Fracture Zone in the last 5 Ma, Geochem. Geophys. Geosyst., 4, 1024, doi:10.1029/2002GC000364.
Grimes, C. B., B. E. John, M. J. Cheadle, and J. L. Wooden (2008), Protracted construction of gabbroic crust at a slow spreading ridge:
Constraints from 206 Pb/ 238 U zircon ages from Atlantis Massif and IODP Hole U1309D (30°N, MAR), Geochem. Geophys. Geosyst, 9,
Q08012, doi:10.1029/2008GC002063.
Ildefonse, B., D. K. Blackman, B. E. John, Y. Ohara, D. J. Miller, and C. J. MacLeod (2007), Oceanic core complexes and crustal accretion at slow-
spreading ridges, Geology, 35(7), 623–626.
John, B. E. (1987), Geometry and evolution of a mid-crustal extensional fault system: Chemehuevi Mountains, southeastern California, in
Continental Extensional Tectonics, edited by M. P. Coward, J. F. Dewey, and P. L. Hancock, pp. 313–335, Geol. Soc., London, U. K.
Ledwell, J. R., E. T. Montgomery, K. L. Polzin, L. C. St. Laurent, R. W. Schmitt, and J. M. Toole (2000), Evidence for enhanced mixing over rough
topography in the abyssal ocean, Nature, 403, 179–82.
MacLeod, C. J., et al. (2002), Direct geological evidence for oceanic detachment faulting: The Mid-Atlantic Ridge, 15 45’N, Geology, 30(10), 879–882.
Geophysical Research Letters 10.1002/2014GL061555
PARNELL-TURNER ET AL. ©2014. American Geophysical Union. All Rights Reserved. 8
Acknowledgments
Data are available upon request from
the author. This work was supported by
the National Science Foundation grant
number OCE-1155650. We thank the
Captain and crew of RV Knorr for their
excellent support and dedication during
Cruise KN210-05. We are also grateful to
the Sentry group and to the entire
scientific party. We thank M. H. Cormier
and N. Hayman for constructive reviews.
Earth Sciences contribution esc.3135.
Eric Calais thanks Marie-Helene Cormier
and Nicholas Hayman for their assis-
tance in evaluating this manuscript.
Okino, K., K. Matsuda, D. M. Christie, Y. Nogi, and K. Koizumi (2004), Development of oceanic detachment and asymmetric spreading at the
Australian-Antarctic Discordance, Geochem. Geophys. Geosyst., 5, Q12012, doi:10.1029/2004GC000793.
Smith, D. K., J. R. Cann, and J. Escartín (2006), Widespread active detachment faulting and core complex formation near 13°N on the Mid-
Atlantic, Nature, 442, 440–443.
Smith, D. K., J. Escartín, H. Schouten, and J. R. Cann (2008), Fault rotation and core complex formation: Significant processes in seafloor
formation at slow-spreading mid-ocean ridges (Mid-Atlantic Ridge, 13°–15°N), Geochem. Geophys. Geosyst., 9, Q03003, doi:10.1029/
2007GC001699.
Smith, D. K., H. Schouten, H. J. B. Dick, and J. R. Cann (2013), Development of different modes of detachment faulting at intermediate magma
supply, Abstract T23F-2657 presented at 2013 Fall Meeting, AGU, San Francisco, Calif., 5–9 Dec.
Tucholke, B. E., and J. Lin (1994), A geological model for the structure of ridge segments in slow spreading ocean crust, J. Geophys. Res., 99,
11,911–937,958.
Tucholke, B. E., J. Lin, and M. C. Kleinrock (1998), Megamullions and mullion structure defining oceanic metamorphic core complexes on the
Mid-Atlantic Ridge, J. Geophys. Res., 103, 9857–9866, doi:10.1029/98JB00167.
Geophysical Research Letters 10.1002/2014GL061555
PARNELL-TURNER ET AL. ©2014. American Geophysical Union. All Rights Reserved. 9