sea level variability in the eastern tropical pacific as observed by topex and tropical ocean-global...
TRANSCRIPT
JOURNAL OF GEOPHYSICAL RESEARCH, VOL. 99, NO. C12, PAGES 24,739-24,748, DECEMBER 15, 1994
Sea level variability in the eastern tropical Pacific as observed by TOPEX and Tropical Ocean-Global Atmosphere Tropical Atmosphere-Ocean Experiment
Benjamin S. Giese, •,2 James A. Carton, • and Lydia J. Holl 3
Abstract. Sea surface height measurements from the TOPEX altimeter and dynamic height from Tropical Ocean-Global Atmosphere Tropical Atmosphere-Ocean (TOGA TAO) moorings are used to explore sea level variability in the northeastern tropical Pacific Ocean. After the annual harmonic is removed, there are two distinct bands of variability: one band is centered at 5øN to 7øN and extends from 165øW to 110øW, and the other band is centered at 10øN to 12øN and extends from 120øW to the coast of
Central America. The correspondence between the two independent observation data sets at 5øN is excellent with correlations of about 90%. The variability at 5ø-7øN is identified as instability waves formed just south of the North Equatorial Countercurrent during the months of July through March. Wave amplitudes are largest in the range of longitudes 160ø-140øW, where they can exceed 10 cm. The waves disappear when the equatorial current system weakens, during the months of March through May. The variability at 11øN in 1993 has the form of anticyclonic eddies. These eddies propagate westward at a speed of about 17 cm s-1 consistent with the dispersion characteristics of free Rossby waves. The eddies are shown to have their origin near the coast of Central America during northern fall and winter. Their formation seems to result from intense wind bursts across the Gulfs of Tehuantepec and Papagayo which generate strong anticyclonic ocean eddies. The disappearance of the eddies in the summer of 1993 coincides with the seasonal intensification of equatorial currents. Thus the variability at 11øN has very little overlap in time with the variability at 5øN.
1. Introduction
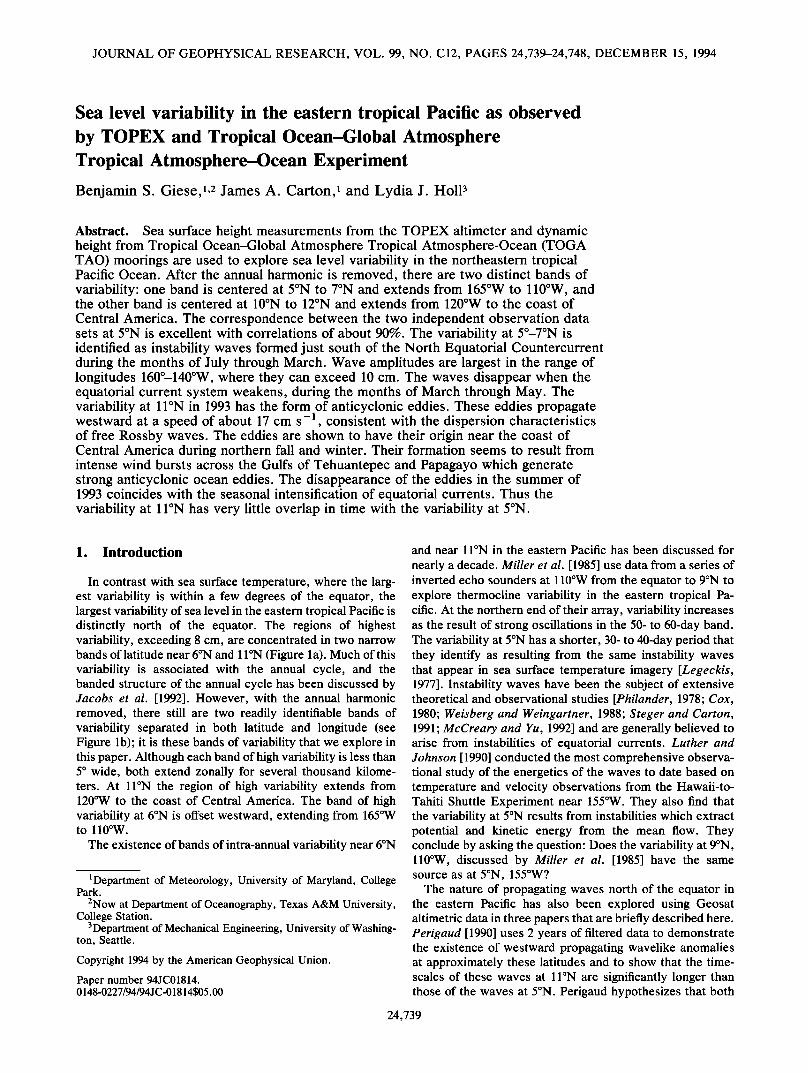
In contrast with sea surface temperature, where the larg- est variability is within a few degrees of the equator, the largest variability of sea level in the eastern tropical Pacific is distinctly north of the equator. The regions of highest variability, exceeding 8 cm, are concentrated in two narrow bands of latitude near 6øN and 1 IøN (Figure la). Much of this variability is associated with the annual cycle, and the banded structure of the annual cycle has been discussed by Jacobs et al. [1992]. However, with the annual harmonic removed, there still are two readily identifiable bands of variability separated in both latitude and longitude (see Figure lb); it is these bands of variability that we explore in this paper. Although each band of high variability is less than 5 ø wide, both extend zonally for several thousand kilome- ters. At liøN the region of high variability extends from 120øW to the coast of Central America. The band of high variability at 6øN is offset westward, extending from 165øW to 110øW.
The existence of bands of intra-annual variability near 6øN
1Department of Meteorology, University of Maryland, College Park.
2Now at Department of Oceanography, Texas A&M University, College Station.
3Department of Mechanical Engineering, University of Washing- ton, Seattle.
Copyright 1994 by the American Geophysical Union.
Paper number 94JC01814. 0148-0227/94/94JC-01814505.00
and near 1 IøN in the eastern Pacific has been discussed for
nearly a decade. Miller et al. [1985] use data from a series of inverted echo sounders at 110øW from the equator to 9øN to explore thermocline variability in the eastern tropical Pa- cific. At the northern end of their array, variability increases as the result of strong oscillations in the 50- to 60-day band. The variability at 5øN has a shorter, 30- to 40-day period that they identify as resulting from the same instability waves that appear in sea surface temperature imagery [Legeckis, 1977]. Instability waves have been the subject of extensive theoretical and observational studies [Philander, 1978; Cox, 1980; Weisberg and Weingartner, 1988; Steger and Carton, 1991; McCreary and Yu, 1992] and are generally believed to arise from instabilities of equatorial currents. Luther and Johnson [1990] conducted the most comprehensive observa- tional study of the energetics of the waves to date based on temperature and velocity observations from the Hawaii-to- Tahiti Shuttle Experiment near 155øW. They also find that the variability at 5øN results from instabilities which extract potential and kinetic energy from the mean flow. They conclude by asking the question: Does the variability at 9øN, 110øW, discussed by Miller et al. [1985] have the same source as at 5øN, 155øW?
The nature of propagating waves north of the equator in the eastern Pacific has also been explored using Geosat altimetric data in three papers that are briefly described here. Perigaud [1990] uses 2 years of filtered data to demonstrate the existence of westward propagating wavelike anomalies at approximately these latitudes and to show that the time- scales of these waves at 11øN are significantly longer than those of the waves at 5øN. Perigaud hypothesizes that both
24,739
24,740 GIESE ET AL.' SEA LEVEL VARIABILITY OBSERVED BY TOPEX AND TOGA TAO
15
lO
5
o
-5
-lO 18o 17ow 16ow 15ow 14ow 13ow 12ow 11ow 1oow 9ow sow
180 170W 160W 150W 140W 130W 120W 110W 100W 90W 80W
Figure 1. (a) Root-mcan-square (rms) sea level height anomaly observed by TOPEX for cycles 1-53. The contour interval is I cm, with values greater than 8 cm shaded. The locations of the five TOGA TAO moorings along 5øN used in this study are shown by solid dots. (b) As in Figure la, but with the annual harmonic removed and with values greater than 6 cm shaded.
sets of waves result from shear instabilities on either side of
the North Equatorial Countercurrent (NECC). However, the heavy spectral filtering required by the relatively noisy Geosat data reduces the amplitude of the waves to less than 2 cm and makes it difficult to determine their spatial and temporal characteristics.
Hansen and Maul [1991] also use Geosat observations, in conjunction with surface drifters, to describe the evolution of eddies that emanate from the coast of Central America.
They observe a single eddy in each of 5 years, one of which they are able to track to at least 115øW [see Hansen and Maul, 1991, Figure ld]. The eddies propagate westward at a speed of about 15 cm s -1 . This yearly eddy, they hypothe- size, is forced when the NECC intensifies in late northern summer and collides with the coast of Central America. To
conserve potential vorticity, the northward component of the flow forms an anticyclonic vortex. Leben et al. [1990] also examine eddy features in the eastern Pacific with Geosat altimetry. In contrast to Hansen and Maul, they observe as many as three separate eddy events per year.
In the past 2 years, two important new sources of data have become available for examining variability in the
eastern tropical Pacific. Spurred on by interest in the causes of E1 Nifio, the Tropical Ocean-Global Atmosphere (TOGA) program has deployed an extensive array of moorings throughout the tropical Pacific [Hayes et al., 1991]. The spatial structure of the variability is most evident in a second data set, the sea level data produced by the TOPEX altim- eter. By combining an analysis of these two data sets, we explore the causes of sea level variability in the eastern Pacific and the relationship between the bands of variability at 6øN and 11øN. In particular, we seek to answer the question: Are the two maxima of variability in the eastern equatorial Pacific manifestations of the same process, namely, instabilities of the mean zonal current structure?
2. Data Processing Processing of the TOPEX timing data into sea level
records has been carried out at the National Ocean Service
division of the National Oceanic and Atmospheric Adminis- tration (NOAA) and the following is a description of their analysis method (for more information see Cheney et al. [this issue]). The data set consists of data from 53 exact repeat
GIESE ET AL.' SEA LEVEL VARIABILITY OBSERVED BY TOPEX AND TOGA TAO 24,741
cycles of the 9.92-day orbit. Analysis of the first 47 cycles is based on the Geophysical Data Records (GDRs) provided by the Jet Propulsion Laboratory (JPL), while the analysis for cycles 48-53 uses JPL's interim geophysical data records (IGDRs) [Callahan, 1992]. Orbit precision is approximately 5 cm for the GDRs and 10 cm for the IGDRs (the joint gravity model (JGM-2) is used throughout). Standard corrections for the troposphere, ionosphere, tides, inverse barometer, and sea state bias are applied as described by Callahan [ 1992]. A correction for ocean tides is then made using the tide model of Cartwright and Ray [ 1990]. The sea level estimates appear to retain some aliased tidal signal, which introduces energy at a period of about 60 days. Tidal aliasing is reduced in this data set by an empirical method discussed by Wagner et al. [this issue]. The general problem of tidal aliasing is discussed by Parke et al. [1987].
Time series of sea level change are generated by averaging the fully corrected heights along 1 ø latitude segments. For each segment, sea level height is averaged over the 53 cycles and the resulting mean is removed, giving estimates of sea level anomaly. This anomaly is averaged in bins that are 1 ø latitude x 3 ø longitude x 10-day duration. Missing data in this analysis occur when the TOPEX altimeter was deacti- vated. Data from the French POSEIDON altimeter were not
used in this analysis because of a significant bias between TOPEX and POSEIDON measurements.
In situ observations of the depth of the thermocline (indicated by the 20øC isotherm and dynamic height) are provided by moorings of the TOGA Tropical Atmosphere- Ocean (TAO) observing array. Currently, fewer than 65 moorings are deployed at a range of longitudes between 8øS and 8øN. The longest records in the high-variability region shaded in Figure 1 are from five moorings at 5øN at 170øW, 155øW, 140øW, 125øW, and 110øW. At each mooring a thermistor chain with 11 instruments measures in situ tem-
perature to a depth of 500 m. Dynamic height (0/500 dbar) is calculated from the tem-
perature observations, using spatially and seasonally varying salinity of Levitus [1982] and the international equation of state for seawater (EOS-80). If on a particular day the temperature measurements at the surface or 500-m depth were missing, or if two consecutive thermistors were mal- functioning, that day's average temperature profile is dis- carded in computing the 10-day average. The mean, calcu- lated over the same 53 ten-day periods as with TOPEX sea level observations, is removed from the resulting dynamic height calculation.
3. Forms of Variability Variability at 5ø-7øN •
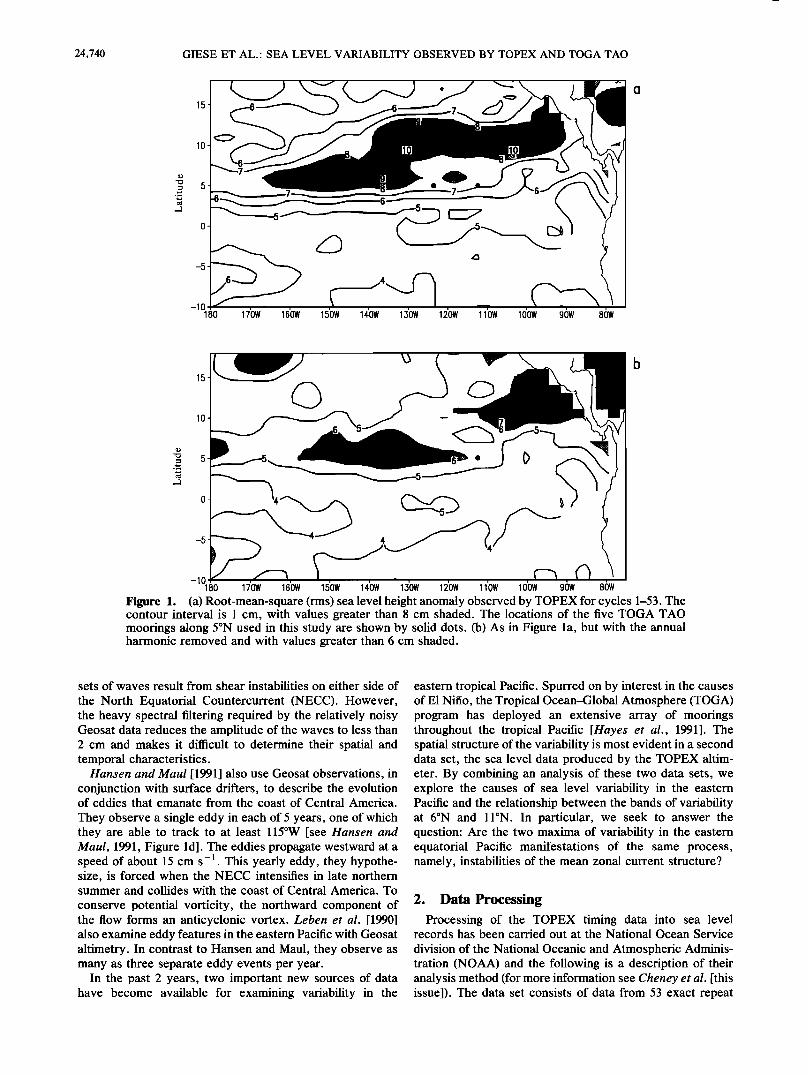
Time series of dynamic height at the five mooring loca- tions are shown in Figure 2. Superimposed on the time series is plotted sea level height measured by the TOPEX altime- ter. There is an abrupt sea level rise of over 20 cm in July 1993 at both 155øW and 170øW. Farther east the increase in
sea level is less dramatic and may have occurred earlier. The decrease in sea level height in winter is more gradual, occurring over 2 months.
Superimposed on the seasonal variations are strong sea level fluctuations associated with instability waves. The waves are most energetic in late fall 1992 and early winter 1993, when they have a root-mean-square (rms) variability of
10
-10
-20
rms = 5.1 170W, 5N
cor = 0.76 •,•
• ' t 155W 5N - 20 rms = 4 4
.-. 10 / cor = 0.93 I•, ' ', _
-20 1
20
-20
rms = 4.2 _ 140W, 5N
20 L rms = 4.3 cor = 0.84
• •o •" 0 -'""P
•. -10 -20
20 rms = 5 4 / cor = o. 3,3 .. ' . i
20 ,
APR JUL OCT JAN APR JUL OCT 1992 199,3
Figure 2. Anomalies of dynamic height (0/500 dbar) (open circles) and sea level height (solid circles) at 5øN for the longitudes (from top to bottom) 170øW, 155øW, 140øW, 125øW, and 110øW. Units are dynamic centimeters and centimeters.
about 9 cm at 155øW and 140øW. They return in late summer 1993 when the NECC is again strong. The instability wave field develops first in the eastern Pacific with waves appear- ing at 110øW in May 1993. The instability waves appear later and have larger amplitude in the central Pacific, with a range of 10-20 cm at 155øW. The wave signal decreases rapidly westward of 155øW, with little signal apparent at 170øW. At 155øW their appearance in August 1992 is similar to that observed during the Hawaii-to-Tahiti Shuttle Experiment in 1979 [Luther and Johnson, 1990].
The correspondence between sea level and dynamic height is excellent, with an average correlation at the four western stations of 0.86 and an average rms difference at these four stations of 4.5 cm. The rms difference of 5.4 cm is
higher, and the correlation of 0.53 is lower at 110øW. The remarkable correspondence between dynamic height and altimeter sea level suggests that approximations associated with the comparison of point measurements with box aver- ages and the construction of dynamic height (500-m refer- ence level, the TAO vertical sampling, and use of climato- logical salinity) are valid, and thus the intrinsic accuracy of the TOPEX observations is below the 4-cm difference. The
high correlation occurs on both annual and shorter time-
24,742 GIESE ET AL.' SEA LEVEL VARIABILITY OBSERVED BY TOPEX AND TOGA TAO
dAN1994 • NOV1993
JUN1993 " '• ' '-' ; • ,,,; ".,'-,, 0
,'" - ,
NOV1992 -lSO -1o -1o -1o -1o
",,,.,,, '-::.-.;.__,.. -5
-140 -120 -lOO
b
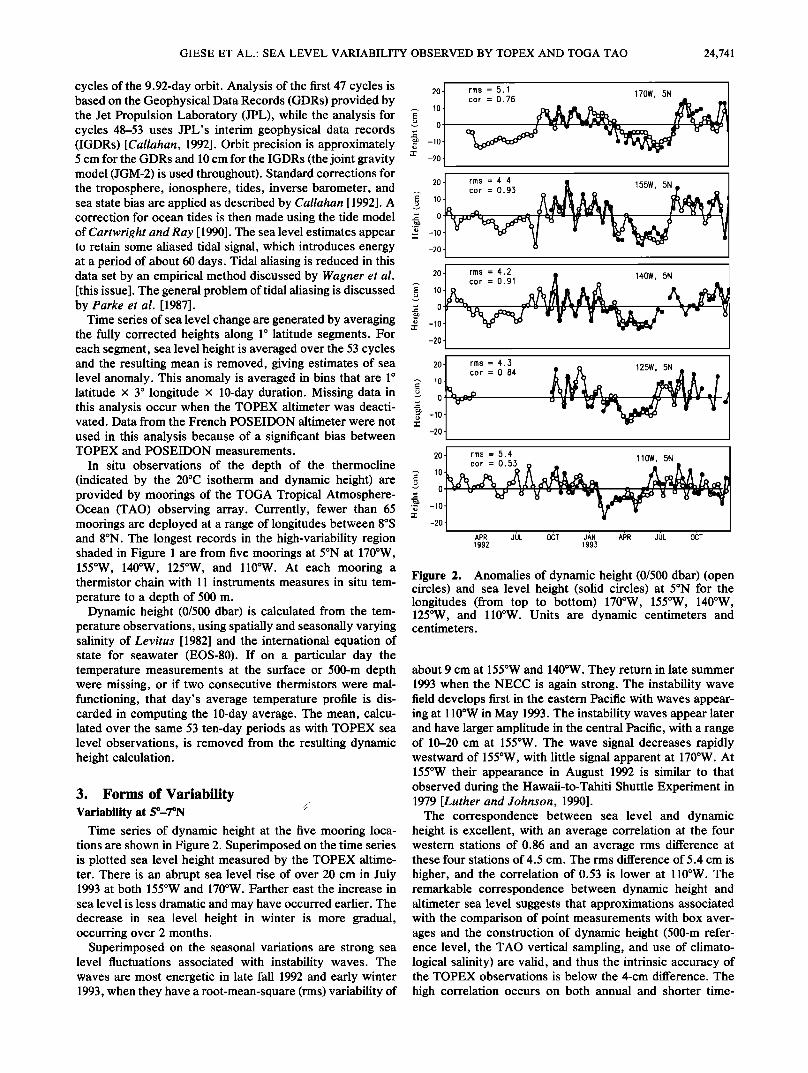
Figure 3. Time-longitude cross section of sea level height in centimeters for two latitude bands, (a) 5øN to 7øN with height greater than 10.0 cm shaded and (b) 10øN to 12øN with height greater than 15.0 cm shaded.
scales; removal of the annual harmonic does not alter the agreement qualitatively.
The zonal propagation characteristics of the instability wave field are most evident in the time-longitude section shown in Figure 3a. The waves are present when the sea level record begins, and they weaken first in the east in December 1992. There is relatively little variability in the 20- to 30-day band until June 1993, when the instability wave field begins to pick up again in the far eastern Pacific. Westward propagation occurs in both fall and spring at approximately 46 cm s -1 at 30- to 40-day periods. The propagation speed was estimated by fitting a straight line to wave characteristics in Figure 3, and it is subject to consid- erable uncertainty. These periods and the amplitudes of the waves are similar to those observed in inverted echo sounder
records at 5øN by Miller et al., [1985] for the years 1980 and 1981.
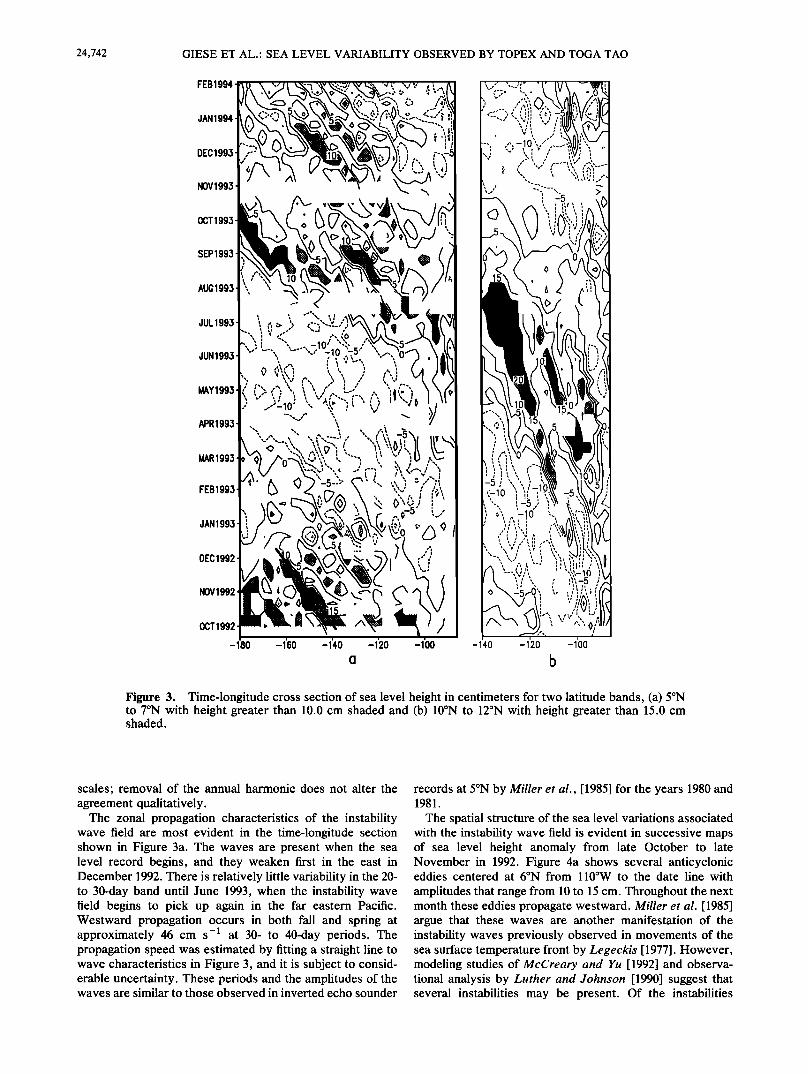
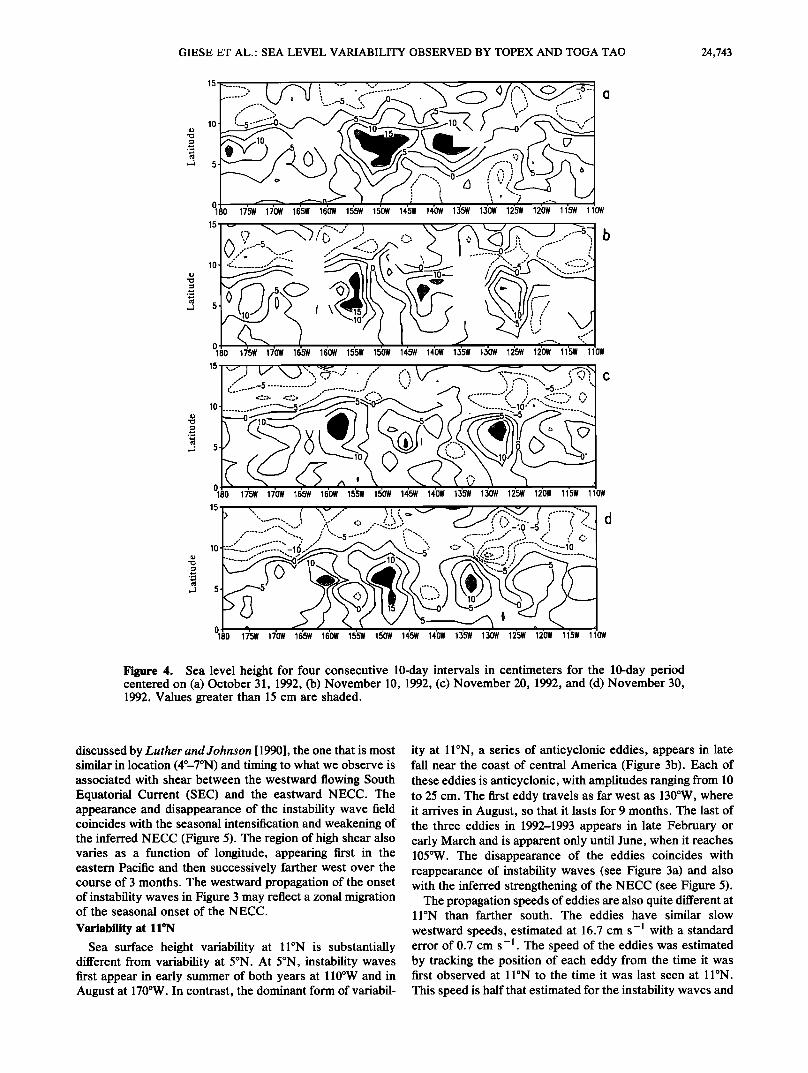
The spatial structure of the sea level variations associated with the instability wave field is evident in successive maps of sea level height anomaly from late October to late November in 1992. Figure 4a shows several anticyclonic eddies centered at 6øN from 110øW to the date line with
amplitudes that range from 10 to 15 cm. Throughout the next month these eddies propagate westward. Miller et al. [1985] argue that these waves are another manifestation of the instability waves previously observed in movements of the sea surface temperature front by Legeckis [1977]. However, modeling studies of McCreary and Yu [1992] and observa- tional analysis by Luther and Johnson [1990] suggest that several instabilities may be present. Of the instabilities
GIESE ET AL.: SEA LEVEL VARIABILITY OBSERVED BY TOPEX AND TOGA TAO 24,743
o 18o 175w 17ow 165w 16'ow 15•w 15ow 145w 14ow 135w 13ow 125w 12ow 115w
k"' '"' ""' '- I
1 lOW
15
10
..• ' 5 '"--5 --'---.
0 180 175w 170w 165w 160w 155w 150w 14'5w 140w 135w 130w 125w 120w 115w 1 ow
15
10
5
O, 180 175W 170W 165W 160W 155W 150W 145W 140W 155W 150W 125W 120W 1 5W 110W
Figure 4. Sea level height for four consecutive 10-day intervals in centimeters for the 10-day period centered on (a) October 31, 1992, (b) November 10, 1992, (c) November 20, 1992, and (d) November 30, 1992. Values greater than 15 cm are shaded.
discussed by Luther and Johnson [1990], the one that is most similar in location (4ø--7øN) and timing to what we observe is associated with shear between the westward flowing South Equatorial Current (SEC) and the eastward NECC. The appearance and disappearance of the instability wave field coincides with the seasonal intensification and weakening of the inferred NECC (Figure 5). The region of high shear also varies as a function of longitude, appearing first in the eastern Pacific and then successively farther west over the course of 3 months. The westward propagation of the onset of instability waves in Figure 3 may reflect a zonal migration of the seasonal onset of the NECC.
Variability at 11øN
Sea surface height variability at 11øN is substantially different from variability at 5øN. At 5øN, instability waves first appear in early summer of both years at 110øW and in August at 170øW. In contrast, the dominant form of variabil-
ity at 11øN, a series of anticyclonic eddies, appears in late fall near the coast of central America (Figure 3b). Each of these eddies is anticyclonic, with amplitudes ranging from 10 to 25 cm. The first eddy travels as far west as 130øW, where it arrives in August, so that it lasts for 9 months. The last of the three eddies in 1992-1993 appears in late February or early March and is apparent only until June, when it reaches 105øW. The disappearance of the eddies coincides with reappearance of instability waves (see Figure 3a) and also with the inferred strengthening of the NECC (see Figure 5).
The propagation speeds of eddies are also quite different at 11øN than farther south. The eddies have similar slow
westward speeds, estimated at 16.7 cm s -1 with a standard error of 0.7 cm s-1. The speed of the eddies was estimated by tracking the position of each eddy from the time it was first observed at 11øN to the time it was last seen at 11øN.
This speed is half that estimated for the instability waves and
24,744 GIESE ET AL.: SEA LEVEL VARIABILITY OBSERVED BY TOPEX AND TOGA TAO
{ .//'::>-9.?,,',, ,.'- ...... ';F.'
'- ..','.. .... ..... ,..;; , ....... :...:.. ... . .... ...,, : / ',,
o ....... ....... OCT NOV DEC JAN FEB MAR APR MAY JUN JUL AUG SEP OCT NOV DEC JAN FEB 1992 1993 1994
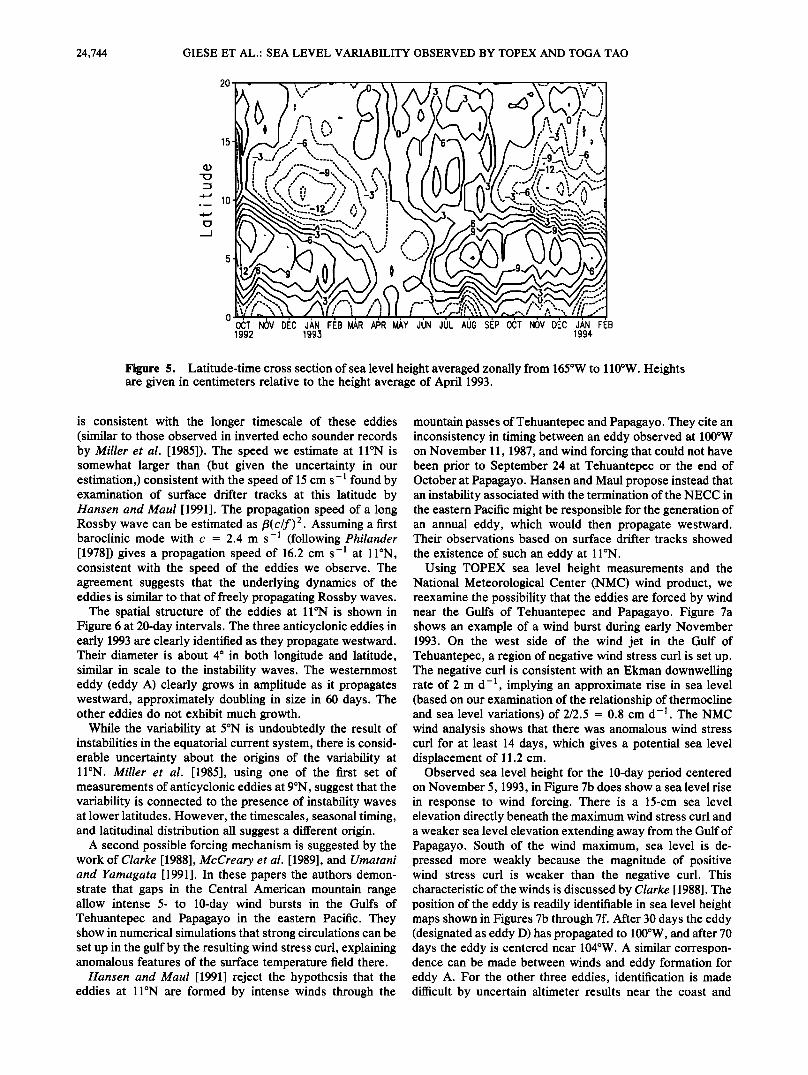
Figure 5. Latitude-time cross section of sea level height averaged zonally from 165øW to 110øW. Heights are given in centimeters relative to the height average of April 1993.
is consistent with the longer timescale of these eddies (similar to those observed in inverted echo sounder records by Miller et al. [1985]). The speed we estimate at liøN is somewhat larger than (but given the uncertainty in our estimation,) consistent with the speed of 15 cm s -• found by examination of surface drifter tracks at this latitude by Hansen and Maul [1991]. The propagation speed of a long Rossby wave can be estimated as •3(c/f) 2. Assuming a first baroclinic mode with c = 2.4 m s -• (following Philander [1978]) gives a propagation speed of 16.2 cm s -• at liøN, consistent with the speed of the eddies we observe. The agreement suggests that the underlying dynamics of the eddies is similar to that of freely propagating Rossby waves.
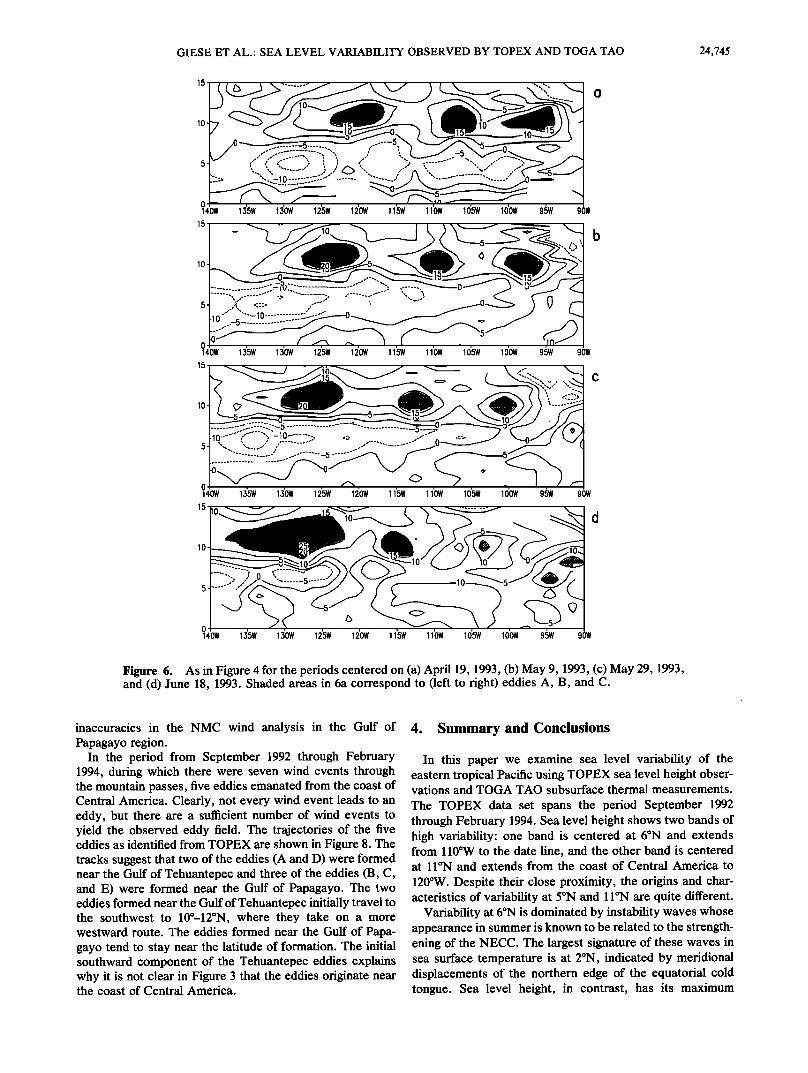
The spatial structure of the eddies at 1 IøN is shown in Figure 6 at 20-day intervals. The three anticyclonic eddies in early 1993 are clearly identified as they propagate westward. Their diameter is about 4 ø in both longitude and latitude, similar in scale to the instability waves. The westernmost eddy (eddy A) clearly grows in amplitude as it propagates westward, approximately doubling in size in 60 days. The other eddies do not exhibit much growth.
While the variability at 5øN is undoubtedly the result of instabilities in the equatorial current system, there is consid- erable uncertainty about the origins of the variability at 11øN. Miller et al. [1985], using one of the first set of measurements of anticyclonic eddies at 9øN, suggest that the variability is connected to the presence of instability waves at lower latitudes. However, the timescales, seasonal timing, and latitudinal distribution all suggest a different origin.
A second possible forcing mechanism is suggested by the work of Clarke [1988], McCreary et al. [1989], and Umatani and Yamagata [1991]. In these papers the authors demon- strate that gaps in the Central American mountain range allow intense 5- to 10-day wind bursts in the Gulfs of Tehuantepec and Papagayo in the eastern Pacific. They show in numerical simulations that strong circulations can be set up in the gulf by the resulting wind stress curl, explaining anomalous features of the surface temperature field there.
Hansen and Maul [1991] reject the hypothesis that the eddies at 11øN are formed by intense winds through the
mountain passes of Tehuantepec and Papagayo. They cite an inconsistency in timing between an eddy observed at 100øW on November 11, 1987, and wind forcing that could not have been prior to September 24 at Tehuantepec or the end of October at Papagayo. Hansen and Maul propose instead that an instability associated with the termination of the NECC in the eastern Pacific might be responsible for the generation of an annual eddy, which would then propagate westward. Their observations based on surface drifter tracks showed
the existence of such an eddy at 1 IøN. Using TOPEX sea level height measurements and the
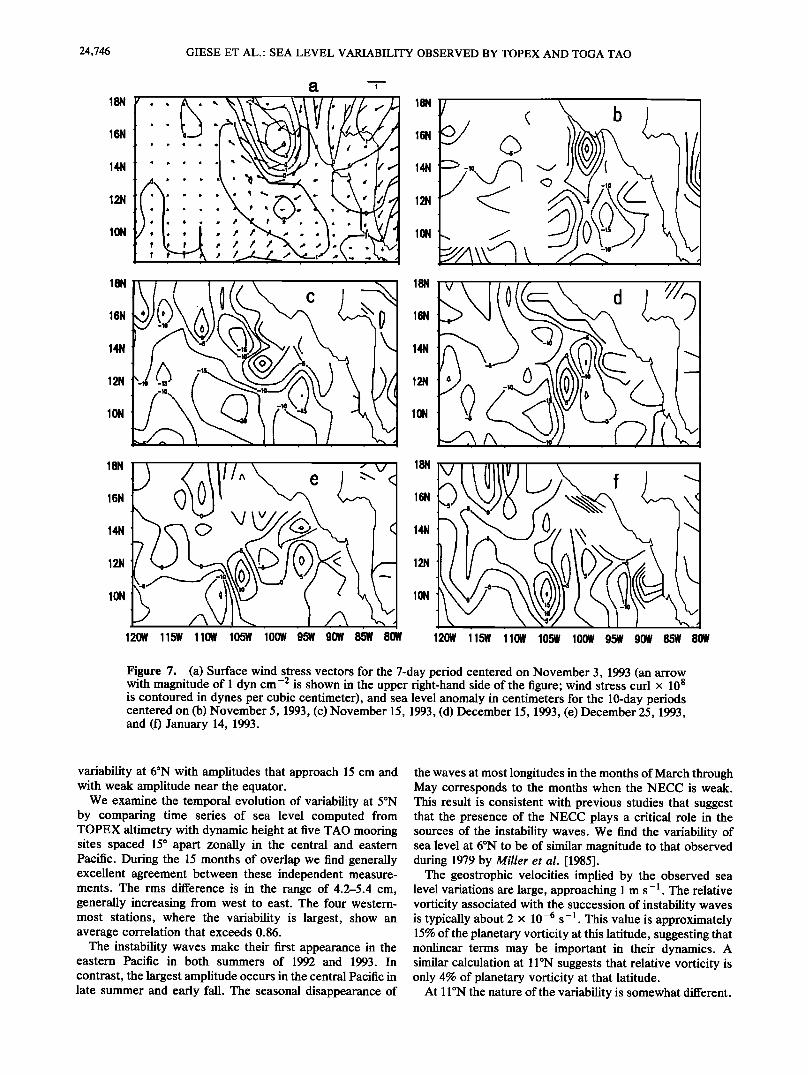
National Meteorological Center (NMC) wind product, we reexamine the possibility that the eddies are forced by wind near the Gulfs of Tehuantepec and Papagayo. Figure 7a shows an example of a wind burst during early November 1993. On the west side of the wind jet in the Gulf of Tehuantepec, a region of negative wind stress curl is set up. The negative curl is consistent with an Ekman downwelling rate of 2 m d -1, implying an approximate rise in sea level (based on our examination of the relationship of thermocline and sea level variations) of 2/2.5 = 0.8 cm d -•. The NMC wind analysis shows that there was anomalous wind stress curl for at least 14 days, which gives a potential sea level displacement of 11.2 cm.
Observed sea level height for the 10-day period centered on November 5, 1993, in Figure 7b does show a sea level rise in response to wind forcing. There is a 15-cm sea level elevation directly beneath the maximum wind stress curl and a weaker sea level elevation extending away from the Gulf of Papagayo. South of the wind maximum, sea level is de- pressed more weakly because the magnitude of positive wind stress curl is weaker than the negative curl. This characteristic of the winds is discussed by Clarke [1988]. The position of the eddy is readily identifiable in sea level height maps shown in Figures 7b through 7f. After 30 days the eddy (designated as eddy D) has propagated to 100øW, and after 70 days the eddy is centered near 104øW. A similar correspon- dence can be made between winds and eddy formation for eddy A. For the other three eddies, identification is made difficult by uncertain altimeter results near the coast and
GIESE ET AL.: SEA LEVEL VARIABILITY OBSERVED BY TOPEX AND TOGA TAO 24,745
140W 135W 130W 125W 120W 115W 1 lOW 105W 100W 95W 90W
15
10
5
0 140W 13õW 130W 12õW 120W 115W 110W 10õW 100W 9õW 90W
15/•'""---:---.• -•{h.-'"'--.• •• • , \ ,:-'. •._1 1,5• '•- "-" ••"5•' •' 0 -..::¾::.,, ,,.. C
lO
14ow 135w 13ow 125w 12ow 115w 1 lOW lO5W 1oow 95w 9ow
15• 15 10 d 5
10
140W 155W 150W 125W 120W 115W 1 lOW 105W 100W 95W 90W
Figure 6. As in Figure 4 for the periods centered on (a) April 19, 1993, (b) May 9, 1993, (c) May 29, 1993, and (d) June 18, 1993. Shaded areas in 6a correspond to (left to right) eddies A, B, and C.
inaccuracies in the NMC wind analysis in the Gulf of Papagayo region.
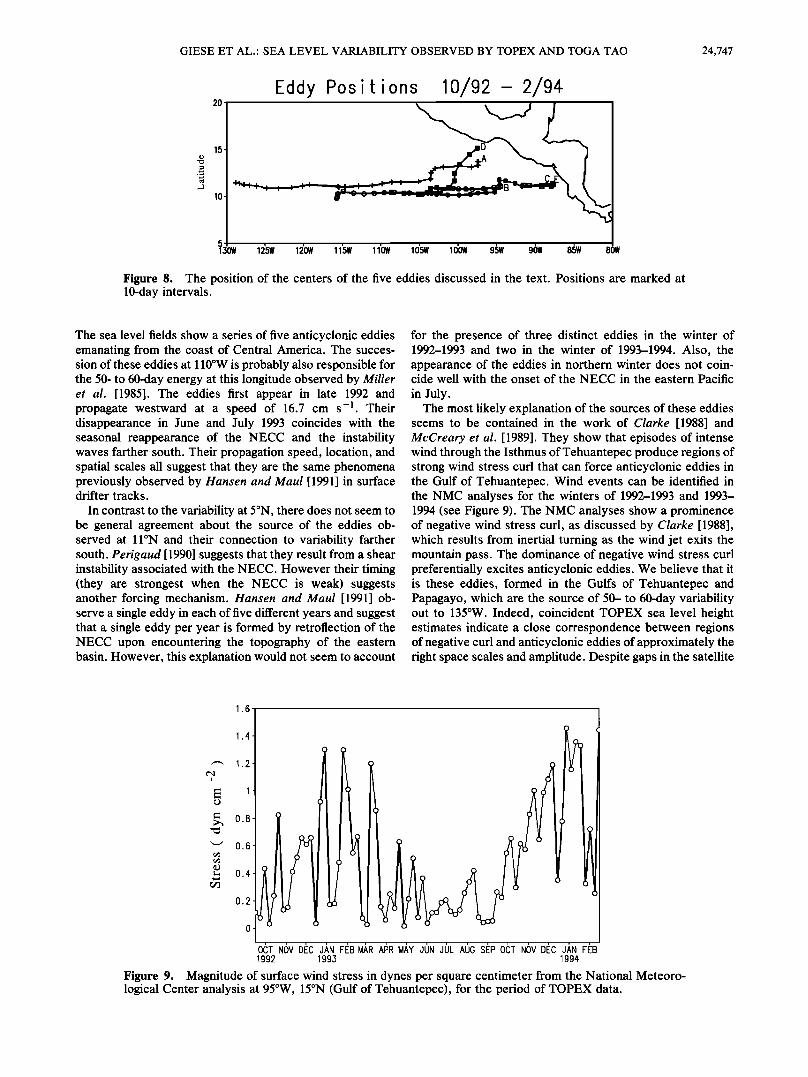
In the period from September 1992 through February 1994, during which there were seven wind events through the mountain passes, five eddies emanated from the coast of Central America. Clearly, not every wind event leads to an eddy, but there are a sufficient number of wind events to yield the observed eddy field. The trajectories of the five eddies as identified from TOPEX are shown in Figure 8. The tracks suggest that two of the eddies (A and D) were formed near the Gulf of Tehuantepec and three of the eddies (B, C, and E) were formed near the Gulf of Papagayo. The two eddies formed near the Gulf of Tehuantepec initially travel to the southwest to 10ø-12øN, where they take on a more westward route. The eddies formed near the Gulf of Papa- gayo tend to stay near the latitude of formation. The initial southward component of the Tehuantepec eddies explains why it is not clear in Figure 3 that the eddies originate near the coast of Central America.
4. Summary and Conclusions
In this paper we examine sea level variability of the eastern tropical Pacific using TOPEX sea level height obser- vations and TOGA TAO subsurface thermal measurements.
The TOPEX data set spans the period September 1992 through February 1994. Sea level height shows two bands of high variability: one band is centered at 6øN and extends from 110øW to the date line, and the other band is centered at 11øN and extends from the coast of Central America to
120øW. Despite their close proximity, the origins and char- acteristics of variability at 5øN and 11øN are quite different.
Variability at 6øN is dominated by instability waves whose appearance in summer is known to be related to the strength- ening of the NECC. The largest signature of these waves in sea surface temperature is at 2øN, indicated by meridional displacements of the northern edge of the equatorial cold tongue. Sea level height, in contrast, has its maximum
24,746 GIESE ET AL.: SEA LEVEL VARIABILITY OBSERVED BY TOPEX AND TOGA TAO
a -T'
Figure 7. (a) Surface wind stress vectors for the 7-day period centered on November 3, 1993 (an arrow with magnitude of 1 dyn cm -2 is shown in the upper right-hand side of the figure; wind stress curl x 10 8 is contoured in dynes per cubic centimeter), and sea level anomaly in centimeters for the 10-day periods centered on (b) November 5, 1993, (c) November 15, 1993, (d) December 15, 1993, (e) December 25, 1993, and (f) January 14, 1993.
variability at 6øN with amplitudes that approach 15 cm and with weak amplitude near the equator.
We examine the temporal evolution of variability at 5øN by comparing time series of sea level computed from TOPEX altimetry with dynamic height at five TAO mooring sites spaced 15 ø apart zonally in the central and eastern Pacific. During the 15 months of overlap we find generally excellent agreement between these independent measure- ments. The rms difference is in the range of 4.2-5.4 cm, generally increasing from west to east. The four western- most stations, where the variability is largest, show an average correlation that exceeds 0.86.
The instability waves make their first appearance in the eastern Pacific in both summers of 1992 and 1993. In
contrast, the largest amplitude occurs in the central Pacific in late summer and early fall. The seasonal disappearance of
the waves at most longitudes in the months of March through May corresponds to the months when the NECC is weak. This result is consistent with previous studies that suggest that the presence of the NECC plays a critical role in the sources of the instability waves. We find the variability of sea level at 6øN to be of similar magnitude to that observed during 1979 by Miller et al. [1985].
The geostrophic velocities implied by the observed sea level variations are large, approaching 1 m s-•. The relative vorticity associated with the succession of instability waves is typically about 2 x 10 -6 s-•. This value is approximately 15% of the planetary vorticity at this latitude, suggesting that nonlinear terms may be important in their dynamics. A similar calculation at 1 IøN suggests that relative vorticity is only 4% of planetary vorticity at that latitude.
At 11 øN the nature of the variability is somewhat different.
GIESE ET AL.' SEA LEVEL VARIABILITY OBSERVED BY TOPEX AND TOGA TAO 24,747
Eddy Positions 10/92- 2/94
15
125W 120W 115W 110W 105W 100W 95W 90W 85W 80W
Figure 8. The position of the centers of the five eddies discussed in the text. Positions are marked at 10-day intervals.
The sea level fields show a series of five anticyclonic eddies emanating from the coast of Central America. The succes- sion of these eddies at 110øW is probably also responsible for the 50- to 60-day energy at this longitude observed by Miller et al. [1985]. The eddies first appear in late 1992 and propagate westward at a speed of 16.7 cm s -1 . Their disappearance in June and July 1993 coincides with the seasonal reappearance of the NECC and the instability waves farther south. Their propagation speed, location, and spatial scales all suggest that they are the same phenomena previously observed by Hansen and Maul [1991] in surface drifter tracks.
In contrast to the variability at 5øN, there does not seem to be general agreement about the source of the eddies ob- served at 11øN and their connection to variability farther south. Perigaud [1990] suggests that they result from a shear instability associated with the NECC. However their timing (they are strongest when the NECC is weak) suggests another forcing mechanism. Hansen and Maul [1991] ob- serve a single eddy in each of five different years and suggest that a single eddy per year is formed by retroflection of the NECC upon encountering the topography of the eastern basin. However, this explanation would not seem to account
for the presence of three distinct eddies in the winter of 1992-1993 and two in the winter of 1993-1994. Also, the appearance of the eddies in northern winter does not coin- cide well with the onset of the NECC in the eastern Pacific
in July. The most likely explanation of the sources of these eddies
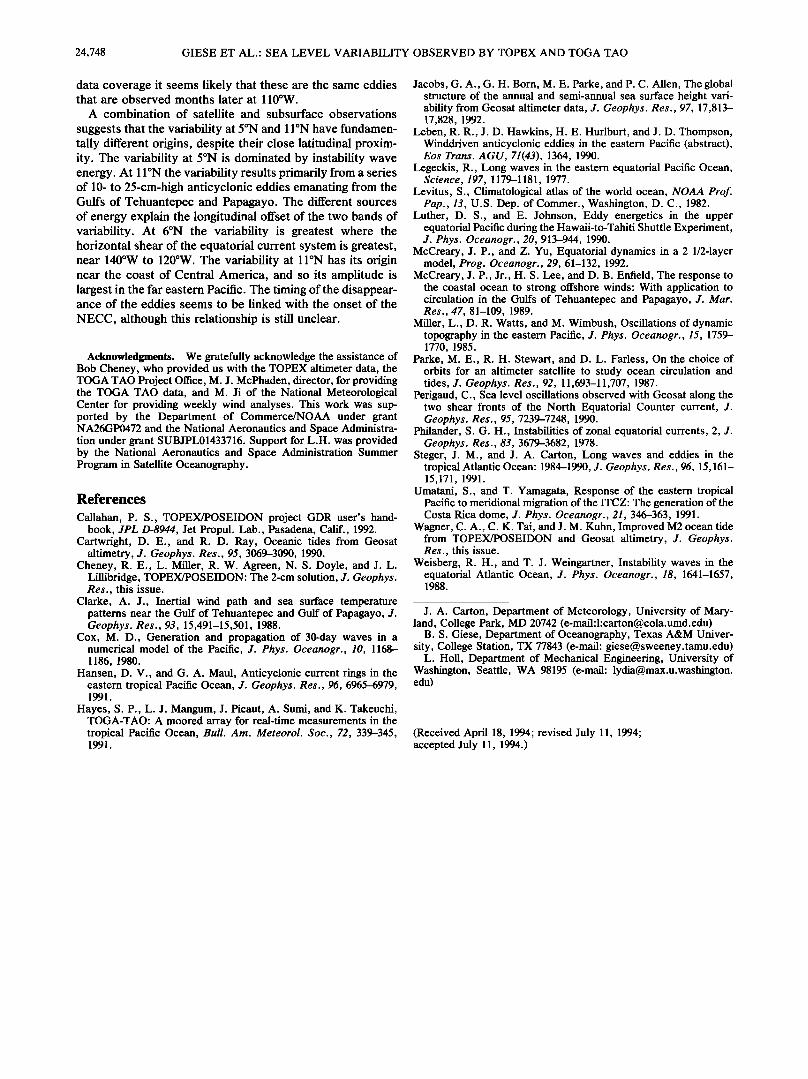
seems to be contained in the work of Clarke [1988] and McCreary et al. [1989]. They show that episodes of intense wind through the Isthmus of Tehuantepec produce regions of strong wind stress curl that can force anticyclonic eddies in the Gulf of Tehuantepec. Wind events can be identified in the NMC analyses for the winters of 1992-1993 and 1993- 1994 (see Figure 9). The NMC analyses show a prominence of negative wind stress curl, as discussed by Clarke [1988], which results from inertial turning as the wind jet exits the mountain pass. The dominance of negative wind stress curl preferentially excites anticyclonic eddies. We believe that it is these eddies, formed in the Gulfs of Tehuantepec and Papagayo, which are the source of 50- to 60-day variability out to 135øW. Indeed, coincident TOPEX sea level height estimates indicate a close correspondence between regions of negative curl and anticyclonic eddies of approximately the right space scales and amplitude. Despite gaps in the satellite
1.6
1.4
08
06
04
o2
o
,
OCT N•V D•C J•N F•B M•R A•R M•Y JON JOL AOG $•P O•T N•V D•C JkN F•B 1992 1993 1994
Figure 9. Magnitude of surface wind stress in dynes per square centimeter from the National Meteoro- logical Center analysis at 95øW, 15øN (Gulf of Tehuantepec), for the period of TOPEX data.
24,748 GIESE ET AL.: SEA LEVEL VARIABILITY OBSERVED BY TOPEX AND TOGA TAO
data coverage it seems likely that these are the same eddies that are observed months later at 110øW.
A combination of satellite and subsurface observations
suggests that the variability at 5øN and 11 øN have fundamen- tally different origins, despite their close latitudinal proxim- ity. The variability at 5øN is dominated by instability wave energy. At 11 øN the variability results primarily from a series of 10- to 25-cm-high anticyclonic eddies emanating from the Gulfs of Tehuantepec and Papagayo. The different sources of energy explain the longitudinal offset of the two bands of variability. At 6øN the variability is greatest where the horizontal shear of the equatorial current system is greatest, near 140øW to 120øW. The variability at 11øN has its origin near the coast of Central America, and so its amplitude is largest in the far eastern Pacific. The timing of the disappear- ance of the eddies seems to be linked with the onset of the
NECC, although this relationship is still unclear.
Acknowledgments. We gratefully acknowledge the assistance of Bob Cheney, who provided us with the TOPEX altimeter data, the TOGA TAO Project Office, M. J. McPhaden, director, for providing the TOGA TAO data, and M. Ji of the National Meteorological Center for providing weekly wind analyses. This work was sup- ported by the Department of Commerce/NOAA under grant NA26GP0472 and the National Aeronautics and Space Administra- tion under grant SUBJPL01433716. Support for L.H. was provided by the National Aeronautics and Space Administration Summer Program in Satellite Oceanography.
References
Callahan, P.S., TOPEX/POSEIDON project GDR user's hand- book, JPL D-8944, Jet Propul. Lab., Pasadena, Calif., 1992.
Cartwright, D. E., and R. D. Ray, Oceanic tides from Geosat altimetry, J. Geophys. Res., 95, 3069-3090, 1990.
Cheney, R. E., L. Miller, R. W. Agreen, N. S. Doyle, and J. L. Lillibridge, TOPEX/POSEIDON: The 2-cm solution, J. Geophys. Res., this issue.
Clarke, A. J., Inertial wind path and sea surface temperature patterns near the Gulf of Tehuantepec and Gulf of Papagayo, J. Geophys. Res., 93, 15,491-15,501, 1988.
Cox, M.D., Generation and propagation of 30-day waves in a numerical model of the Pacific, J. Phys. Oceanogr., 10, 1168- 1186, 1980.
Hansen, D. V., and G. A. Maul, Anticyclonic current rings in the eastern tropical Pacific Ocean, J. Geophys. Res., 96, 6965-6979, 1991.
Hayes, S. P., L. J. Mangum, J. Picaut, A. Sumi, and K. Takeuchi, TOGA-TAO: A moored array for real-time measurements in the tropical Pacific Ocean, Bull. Am. Meteorol. $oc., 72, 339-345, 1991.
Jacobs, G. A., G. H. Born, M. E. Parke, and P. C. Allen, The global structure of the annual and semi-annual sea surface height vari- ability from Geosat altimeter data, J. Geophys. Res., 97, 17,813- 17,828, 1992.
Leben, R. R., J. D. Hawkins, H. E. Hurlburt, and J. D. Thompson, Winddriven anticyclonic eddies in the eastern Pacific (abstract), Eos Trans. AGU, 71(43), 1364, 1990.
Legeckis, R., Long waves in the eastern equatorial Pacific Ocean, Science, 197, 1179-1181, 1977.
Levitus, S., Climatological atlas of the world ocean, NOAA Prof. Pap., 13, U.S. Dep. of Commer., Washington, D.C., 1982.
Luther, D. S., and E. Johnson, Eddy energetics in the upper equatorial Pacific during the Hawaii-to-Tahiti Shuttle Experiment, J. Phys. Oceanogr., 20, 913-944, 1990.
McCreary, J.P., and Z. Yu, Equatorial dynamics in a 2 1/2-layer model, Prog. Oceanogr., 29, 61-132, 1992.
McCreary, J.P., Jr., H. S. Lee, and D. B. Enfield, The response to the coastal ocean to strong offshore winds: With application to circulation in the Gulfs of Tehuantepec and Papagayo, J. Mar. Res., 47, 81-109, 1989.
Miller, L., D. R. Watts, and M. Wimbush, Oscillations of dynamic topography in the eastern Pacific, J. Phys. Oceanogr., 15, 1759- 1770, 1985.
Parke, M. E., R. H. Stewart, and D. L. Farless, On the choice of orbits for an altimeter satellite to study ocean circulation and tides, J. Geophys. Res., 92, 11,693-11,707, 1987.
Perigaud, C., Sea level oscillations observed with Geosat along the two shear fronts of the North Equatorial Counter current, J. Geophys. Res., 95, 7239-7248, 1990.
Philander, S. G. H., Instabilities of zonal equatorial currents, 2, J. Geophys. Res., 83, 3679-3682, 1978.
Steger, J. M., and J. A. Carton, Long waves and eddies in the tropical Atlantic Ocean: 1984-1990, J. Geophys. Res., 96, 15,161- 15,171, 1991.
Umatani, S., and T. Yamagata, Response of the eastern tropical Pacific to meridional migration of the ITCZ: The generation of the Costa Rica dome, J. Phys. Oceanogr., 21,346-363, 1991.
Wagner, C. A., C. K. Tai, and J. M. Kuhn, Improved M2 ocean tide from TOPEX/POSEIDON and Geosat altimetry, J. Geophys. Res., this issue.
Weisberg, R. H., and T. J. Weingartner, Instability waves in the equatorial Atlantic Ocean, J. Phys. Oceanogr., 18, 1641-1657, 1988.
J. A. Carton, Department of Meteorology, University of Mary- land, College Park, MD 20742 (e-mail:l:[email protected])
B. S. Giese, Department of Oceanography, Texas A&M Univer- sity, College Station, TX 77843 (e-mail: [email protected])
L. Holl, Department of Mechanical Engineering, University of Washington, Seattle, WA 98195 (e-mail: [email protected]. edu)
(Received April 18, 1994; revised July 11, 1994; accepted July 11, 1994.)