scientific papers & media articles that disagree with the 2017
TRANSCRIPT
Scientific Papers & Media Articles that Disagree with the
2017 Scientific Consensus Statement and other reef papers.
\-:5,~
_) ~~ o~g
-o vl \ _ c:;:;: ,, ...-/
c:D ,J' ..r
~ 3 ro
:i:i . . E ~ ~ :::r i= iii

Index Section A: Media Releases and news articles
1. Farmers day environment minister's Great Barrier Reef claim is 10 million times wrong
2. Research shows fish behaviour normal as ocean acidifies
3. Ocean acidification does not impair the behaviour of cora I reef fish
4. Responses to questions from SCS presentation - Jane Waterhouse
5. Flagship Cairns trial provides solution to reduce nitrate run-off onto Great Barrier Reef by 15 per cent-plus
Section B: General reef articles - 31
1. Great Barrier Reef starts to recover after severe coral bleaching, survey of sites between Cairns and Townsville shows
2. Great Barrier Reef coral bleaching causes number of baby coral to plummet
3. Global warming impairs stock-recruitment dynamics of corals
• References • Authors, contributors and Corresponding authors • Supplementary and Additional Information
4. Great Barrier Reef recovery hopes buoyed by resilient 'source reefs'
5. Research Article - Connectivity and systemic resilience of the Great Barrier Reef
• Abstract • Author Summary
Introduction
Results: Criterion 1: Important sources of larvae
Queensland Country Life -Published 26 July 2020 Stock Journal -Published 11 January 2020 Nature.com -Published 8 January 2020 BMRG Paddock to Reef Forum - Published 11 February 2021 Reef & Rainforest Research Centre Media Release -Published 27 September 2020
ABC News by David Chen -Published 29 September 2017 ABC Science (News) by Nick Kilvert - Published 4 April 2019 Nature.com - Published 3 April 2019
ABC Science by Nick Kilvert -Published 29 November 2017 PLOS biology by K. Hock, N Wolff, J. Ortiz, Scott A. Condie, Kenneth R. N. Anthony, Paul G. Blackwell, Peter J. Mumby. Published 28 November 2017
• • • • • •
Figure 1. Conceptual diagram describing the process for identifying Criterion 2. Lower thermal stress and exposure to coral bleaching
Criterion 3. Lower risk of conveying COTS outbreaks Figure 3. Linking connectivity and COTS abundance estimates from field
survey
1-3
5
7 - 21
23 - 25
27-30
33 - 35
37 -41
43-54
45 48 51
55-58
59-82
59 59
60 61 61 62 63 64
• Figure 4. Identifying robust sources on the GBR
• Integrating connectivity and disturbance patterns
• Figure 5. Distance of reefs on the GBR from robust sources in terms of colonisation steps
Discussion
Materials and Methods
Connectivity network analysis
Thermal stress analysis
• • • • • • • • • • • •
COTS spatial dynamics and analysis of field surveys
Classification of reefs according to outbreak risk
Analysis of the CPUE data from COTS eradication efforts
Key assumptions regarding 3 criteria for reefs to become robust sources
Estimating replenishment potential of the robust sourses
Statistical analyses
Supporting information
Acknowledgements
• Author contributions
• References 6. Real-life finding Nemo: Turtle survives epic East Australian Current
journey from Cairns to Sydney ABC Far North
News by Brendan
Mounter and Adam Stephen. Published 4
December 2020
Section C: Crown of Thorns report - 87
1. Crown of Thorns starfish on the Great Barrier Reef thrive
in warmer water, study finds. 2. Crown of Thorns thriving as ocean temperature rise
3. Climate change as an unexpected co-factor promoting
coral eating seastar (Acanthaster planci) outbreak.
• Abstract
Results
ABC News by Allyson Horn Published 13 February 2015 AIMS.gov published 12 February 2015 Scientific Reports Nature Research by S. Uthicke, M.Logan, M.Liddy, D.Francis,
N.Hardy, M. Lamare
• • •
Figure 1. Developmental stages of Acanthaster Planic
Larvae development and settlement
• Figure 2. The effect of increased.food and temperature
• Figure 3.
• Larval morphology
• Figure 4. Biometric analyses of Acanthaster Planci larvae at day 10 and 24 of their development under different algal concentrations and temperatures
• Larvae mortality
• • • • •
Discussion
Specimen collection and spawning
Feeding
Experimental design
Statistical analyses
65
66
67 69 71 72
73
74
75 76 77
83 -86
89-90
91 - 92
93-108
93
94 95
96 98 98 99
99
100 102 102 103 103
• Supplementary information
• Acknowledgements
• References
4. Great Barrier Reef: Crown - of- thorns starfish eating ABC News by George Roberts
their way through coral in major outbreak published 5 January 2018
5. Research Article -Origins and Implications of a Primary Journal of Marine Biology by
Crown - of - Thorns Starfish Outbreak in the Southern I. Miller, H. Sweatman, A.
Great Barrier Reef Chea I, M. Emslie, K. Johns, M. Jonker, & K. Osbourne.
• Introduction Published 19 February 2015
• Methods
• Results
• Discussion
• Conflict of Interest
• Acknowledgements
• References
• Crown - of-Thorns Starfish 'Cockroach of the ABC Coffs Coast News by
ocean' and much more resilient than previously thought Melissa Martin Published 21 July 2020
6. Diet flexibility and growth of the early herbivorous DioneJ. Deaker, B. Mos, H.
juvenile Crown - of Thorns Seastar, implications for its Lin, C. Lawson, C. Budden, S.
boom-bust population dynamics A.Dworjanyn, M. Byrne.
• Abstract Published 20 July 2020
• I ntrod uctio n
• Methods
• Results
• Discussions
• References 7 . Crown - of-Thorns eat themselves out of house and Arc Centre of Excellence
home Media Release Coral Reef Studies
Section D: Articles about Nutrients - 141
1. Southern Great Barrier Reef island shows signs of coral recovery after cyclone Hamish
ABC Coffs Coast News by Melissa Martin & Erin Semmler Published 2 July 2019 Frontiers in Marine Science. K. L. Davis, A.McMahon, B.Kelaher, E. Shaw, I. R. Santos.
2. Fifty Years of Sporadic Coral Reef Calcification Estimates at One Tree Island, Great Barrier Reef: Is it enough to Imply Long Term Trends?
• • • • • • •
Introduction
Materials and Methods
Calculations
Results
Discussion
Calcification and Reef Acidification
Conclusion
June 2019 I Volume 6 I Article 282
104 104 104
109 -112
113-124
113
114 115
117
119
125 -128
129-138
129 129
130
131 132
134 139 -140
143 -148
149-162
149 150 151 152
155
157
159
• Author Contributions
• Funding • Acknowledgements
3. Welcome to Lady Elliott Island - the postcard sized gem brought back from the brink
4. Rats are wreaking havoc on our coral reefs and reducing fish numbers
5. Seabirds enhance coral reef productivity and functioning in the absence of invasive rats
• Abstract
• References
• Acknowledgements
• Contributions
• Corresponding Author
• Ethics declarations
• Competing interests
• Additional information
• Supplementary information
• Rights and permissions
• Cite this article
• Further reading
Section E: Impact of Climate Reports - 191
1. The coral bleaching debate: Is bleaching the Legacy of a Marvelous Adaption Mechanism or A Prelude to Extirpation?
2. Does coral create rain?
3. Coral bleaching: Extreme heat pushes parts of the Great Barrier Reef beyond recovery
4. Global warming and recurrent mass bleaching of corals
• Abstract
• References
• Acknowledgements
• Author information
• Affiliations
• Contributions
• Corresponding Authors
• Ethics declarations
• Additional information
• Extended data figures and tables
• Cite this article
ABC News by Cate Carrigan published 29 September 2019 ABC Science. By Nick Kilvert published 12 July 2018 Nature.com published by N. A. J. Graham, S. K. Wilson, P. Carr, A. S. Hoey, S. Jennings, & M. A. MacNeil. 11 July 2018
Landscapes and cycles webpage. May 17 2016 ABC News Report by Kathy Mcleish published 14 October 2016 ABC Science by Anna Salleh Published 16 March 2017 Nature.com by T. P. Hughes, J. T. Kerry, S. K. Wilson. Published 16 March 2017
163 - 170
171- 176
177 -190
177 178 185 187
188
189
193 - 202
203 - 212
213 - 218
219-232
219 220 224
227
228
230
Section F: Impact of Floods and Sediment reports - 233
1. Keppel Bay's7700-year-old reefs
• References
2. Flood Impacts in Keppel Bay, Southern Great Barrier Reef in the Aftermath of Cyclonic Rainfall
Keppels.com by Alison Jones published 23 August 2020 PLOS by A. M. Jones & R. Berkelmans.
234 - 248
249-266
• Abstract Editor- P.A. Todd 249
• Introduction
• Methods
• Results
• Discussion
• Conclusion
• Acknowledgement
• Funding Statement
• References
Section G: AIMS coral reports showing good growth in Southern GBR- 267
1. Cyclone Hamish reef damage 'worst in 30 years' ABC News by Sarah West. Published 25 March 2020
2. The Great Barrier Reef has lost half of its coral in the last 27 AIMS.gov published 2 October years 2012
• Media Contacts
• Background information
• Abstract
• Author and key contacts
• About AIMS 3. Latest field survey results show strong coral recovery in the AIMS.gov published 8
southern reefs of the GBR December 2015
• Research 4. Long term reed Monitoring Program -Annual Summary AIMS.gov
Report on coral condition for 2018/19
Section H: Local Inshore Corals - 309
1. Belbendimin Wulgun Djau (caring for sea country) - in-shore Gidarjil Sea Rangers coral monitoring in the Burnett Mary
251 256 259
261
269
271-278
273
274 277
279-292
292-308
311- 318


Section A:
Media Releases and News Articles

Farmers say environment minister's Great Barrier Reef claim is 10 million times wrong 26 Jul 2020, 7 p.m.
News
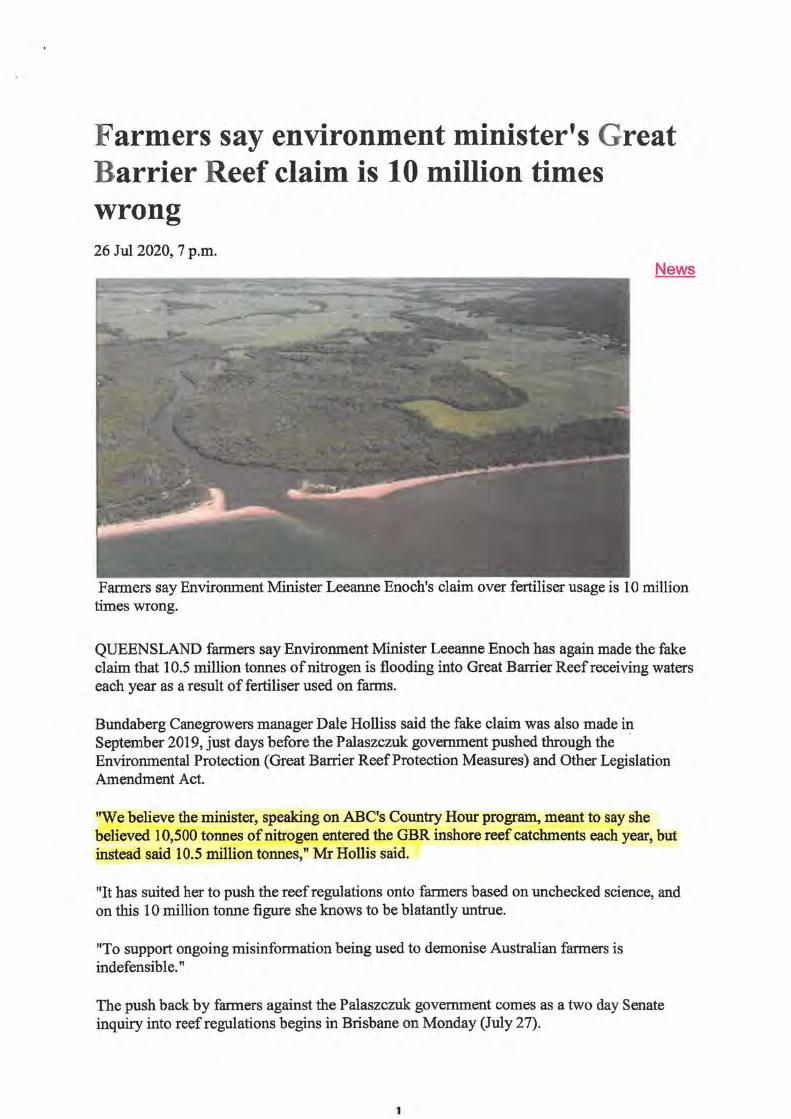
Farmers say Environment Minister Leeanne Enoch's claim over fertiliser usage is 10 million times wrong.
QUEENSLAND farmers say Environment Minister Leeanne Enoch has again made the fake claim that 10.5 million tonnes of nitrogen is flooding into Great Barrier Reef receiving waters each year as a result of fertiliser used on farms.
Bundaberg Canegrowers manager Dale Holliss said the fake claim was also made in September 2019, just days before the Palaszczuk government pushed through the · Environmental Protection (Great Barrier Reef Protection Measures) and Other Legislation Amendment Act.
"We believe the minister, speaking on ABC's Country Hour program, meant to say she believed 10,500 tonnes of nitrogen entered the GBR inshore reef catchments each year, but instead said 10.5 million tonnes," Mr Hollis said.
"It has suited her to push the reef regulations onto farmers based on unchecked science, and on this 10 million tonne figure she knows to be blatantly untrue.
"To support ongoing misinformation being used to demonise Australian farmers is indefensible."
The push back by fanners against the Palaszczuk government comes as a two day Senate inquiry into reef regulations begins in Brisbane on Monday (July 27).
1
To support ongoing misinformation being used to demonise Australian farmers is indefensible.- Dale Hollis, Bundaberg Canegrowers The latest call for Ms Enoch to come clean on fake figure also follows a furore this week where the Palaszczuk government attempted to initiate one of the controversial clauses in the new reef regulations laws.
MORE READING: 'Reefregulation measures ramp up'. "This clause has given the State Government the power to acquire from anyone who works with or for farmers, records about farm businesses," said Mr Hollis, who also is a director of the National Irrigators Council and holds a Masters of Science in Environmental Management.
"When questioned by the media, it immediately backflipped and withdrew a tender process designed to put the newly acquired power into action. "The Reef Regulations Amendment Act 2019 delivers regulation by stealth, with a lack of parliamentary scrutiny built in and powers given instead to unelected bureaucrats and the executive.
"This is a very dangerous power the government has given itself, from the perspective of all Queenslanders."
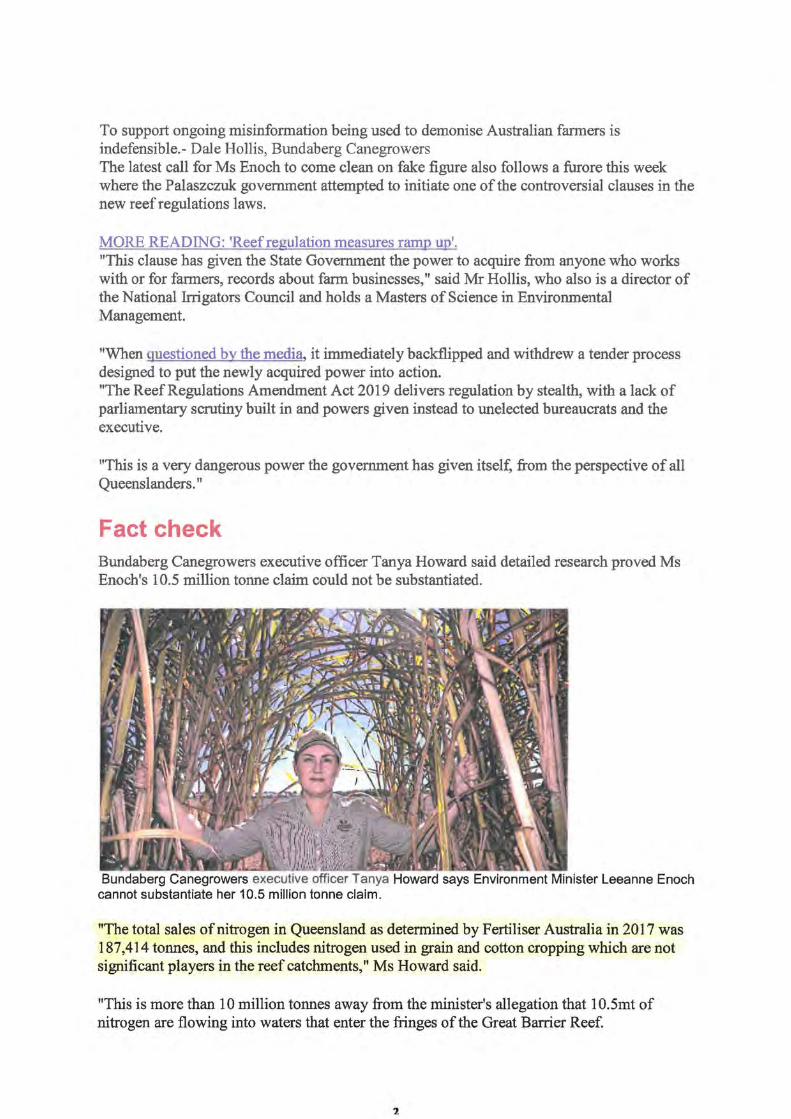
Fact check Bundaberg Canegrowers executive officer Tanya Howard said detailed research proved Ms Enoch's 10.5 million tonne claim could not be substantiated.
Bundaberg Canegrowers executive officer Tanya Howard says Environment Minister Leeanne Enoch cannot substantiate her 10.5 million tonne claim.
"The total sales of nitrogen in Queensland as determined by Fertiliser Australia in 2017 was 187,414 tonnes, and this includes nitrogen used in grain and cotton cropping which are not significant players in the reef catchments," Ms Howard said.
"This is more than 10 million tonnes away from the minister's allegation that 10.5mt of nitrogen are flowing into waters that enter the fringes of the Great Barrier Reef.
2
Fertiliser Australia records for all fertiliser products used in Queensland in 2017 totalled less than lmt.
"In addition, it has been made clear any reach would be limited to the tiny inshore reefs, which make up around one per cent of the 344,000 sq km of the Great Barrier Reef.
"To put some perspective on the amount of nitrogen fertiliser found in the waters of the inshore reefs of the GBR, 10,500t would equate to the weight of Sc to 1 0c piece in an Olympic swimming pool. It is so miniscule as to be almost untraceable."
Ms Howard also pointed out that cane farms, strongly targeted by Labor over the issue of alleged fertiliser run-off, are on the wane.
"Australian Sugar Milling Council figures shows that in 2014 there was 363,339ha of cane harvested in Queensland, but by 2019 this has dropped by 13,257ha," she said.
"This is just yet another sign of the Australian farmers who are putting 88pc of all food and drink on every table across the nation being pushed to the wall by the rising tide of unwarranted red tape. It has to stop now."
Petition Bundaberg Cane growers is part of a consortium of farmer groups running a petition under the banner of#farmersfeedus. It wants the Queensland Government to revoke the 2019 Reef Regulations Amendment Act and establish an Office of Science Quality Assurance to check the science being used to make political decisions. The petition, launched in State Parliament just last month, has already gained almost 5000 signatures from voters across urban and regional areas.
MORE READING: 'Old farmers petition against unchecked science'.
3

A
Research shows fish behaviour normal as ocean acidifies 11 Jan 2020, 6:30 a.m.
News
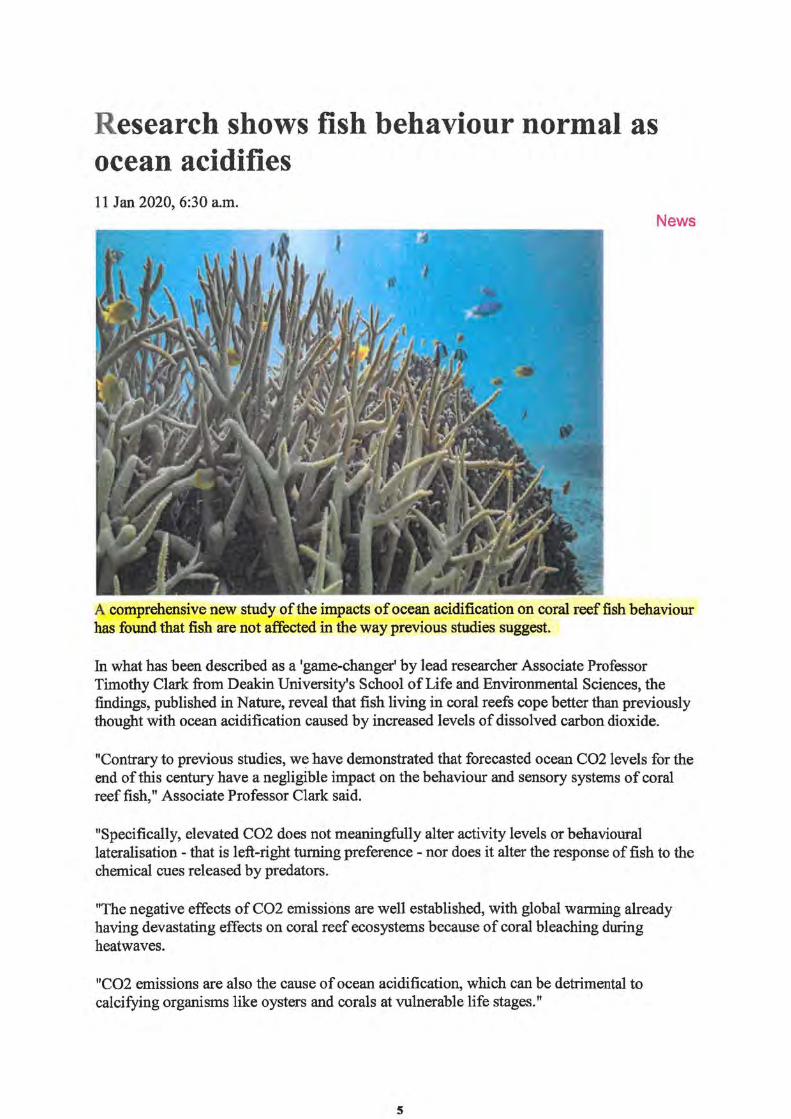
A comprehensive new study of the impacts of ocean acidification on coral reef fish behaviour has found that fish are not affected in the way previous studies suggest.
In what has been described as a 'game-changer' by lead researcher Associate Professor Timothy Clark from Deakin University's School of Life and Environmental Sciences, the findings, published in Nature, reveal that fish living in coral reefs cope better than previously thought with ocean acidification caused by increased levels of dissolved carbon dioxide.
"Contrary to previous studies, we have demonstrated that forecasted ocean CO2 levels for the end of this century have a negligible impact on the behaviour and sensory systems of coral reef fish," Associate Professor Clark said.
"Specifically, elevated CO2 does not meaningfully alter activity levels or behavioural lateralisation - that is left-right turning preference - nor does it alter the response of fish to the chemical cues released by predators.
"The negative effects of CO2 emissions are well established, with global wanning already having devastating effects on coral reef ecosystems because of coral bleaching during heatwaves.
"CO2 emissions are also the cause of ocean acidification, which can be detrimental to calcifying organisms like oysters and corals at vulnerable life stages."
5
But Associate Professor Clark said the new study does not align with reported results from earlier studies of coral reef fish.
"The past decade has seen many high-profile studies that have found alarming effects of ocean acidification on coral reef fish behaviour," Associate Professor Clark said.
"Previous research has reported that fish become attracted to the smell of predators in acidified waters.
"But by measuring multiple behaviours in multiple species and making our data freely available, we have comprehensively and transparently shown that end-of-century ocean acidification has negligible direct impacts on the behaviour of fish in coral reefs."
In addition to the new data presented in the study, the authors also used data simulations and show that the phenomena reported in several previous studies are highly improbable.
"We expected previous results would be easy to replicate because of how clear and strong they appeared in those papers. Instead, we found consistently normal behaviours in fish that we acclimated to elevated CO2," Associate Professor Clark said.
"While our new work suggests ocean acidification may not cause population declines because of behavioural disturbances in coral reef fish, climate change is currently destroying the reef habitat through coral bleaching during heat waves.
"So, despite our new results, coral reefs and their fish communities remain in grave danger because of increasing atmospheric CO2.
"We are confident that our paper will have a pronounced impact on the entire field of ocean acidification biology."
The story Research shows fish behaviour normal as ocean acidifies first appeared on Farm Online.
6
22J02/2021 Ocean acidification does not impair the behaviour of coral reef fishes I Nature
nature View All Nature Research Journals Search Login
Content v Journal Info v Publish v Sign Up For Alerts O RSS Feed
nature > articles > article
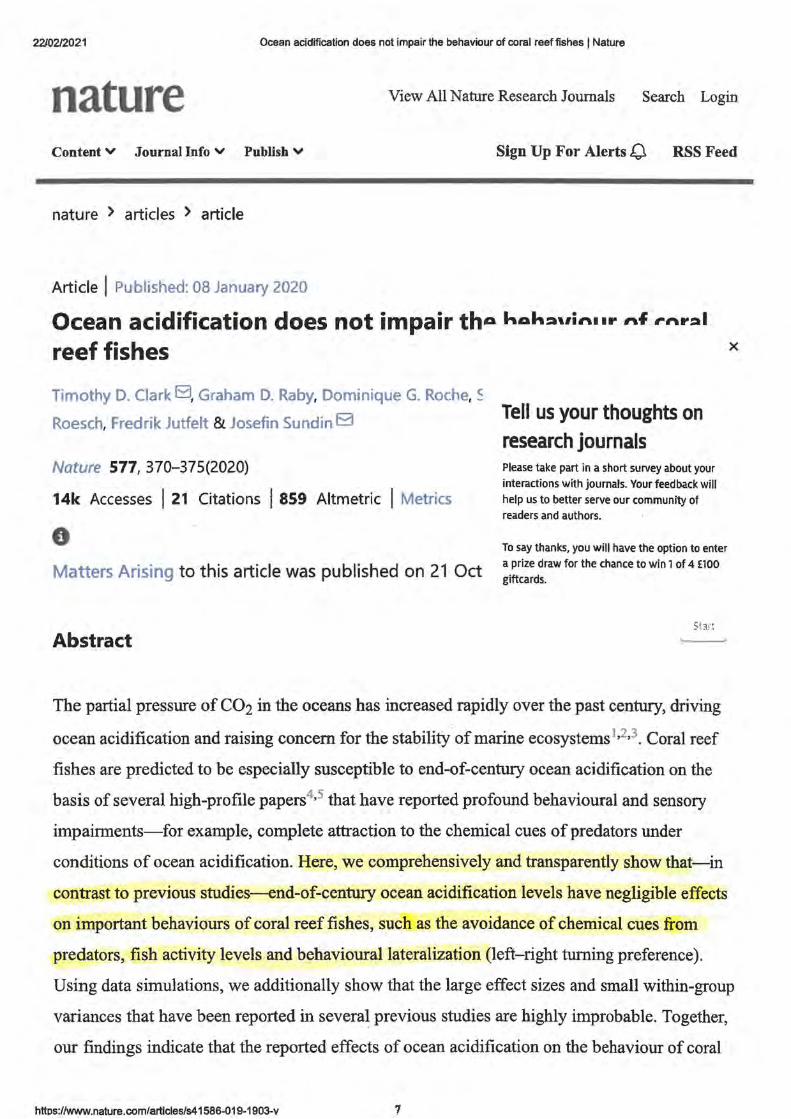
Article I Published: 08 January 2020
Ocean acidification does not impair thA hAh:n,in1 Ir nf rnr::al
reef fishes
Timothy D. Clark El, Graham D. Raby, Dominique G. Roche, ~
Roesch, Fredrik Jutfelt & Josefin Sundin B
Nature 577, 370-375(2020)
14k Accesses I 21 Citations I 859 Altmetric I Metrics
0 Matters Arising to this article was published on 21 Oct
Abstract
Tell us your thoughts on research journals Please take part in a short survey about your interactions with journals. Your feedback will help us to better serve our community of readers and authors.
To say thanks, you will have the option to enter a prize draw for the chance to win 1 of 4 £100 giftcards.
X
The partial pressure of CO2 in the oceans has increased rapidly over the past century, driving
ocean acidification and raising concern for the stability· of marine ecosystems 1 •2•3. Coral reef
fishes are predicted to be especially susceptible to end-of-century ocean acidification on the
basis of several high-profile papers4•5 that have reported profound behavioural and sensory
impairments-for example, complete attraction to the chemical cues of predators under
conditions of ocean acidification. Here, we comprehensively and transparently show that-in
contrast to previous studies--end-of-century ocean acidification levels have negligible effects
on important behaviours of coral reef fishes, such as the avoidance of chemical cues from
predators, fish activity levels and behavioural lateralization (left-right turning preference).
Using data simulations, we additionally show that the large effect sizes and small within-group
variances that have been reported in several previous studies are highly improbable. Together,
our findings indicate that the reported effects of ocean acidification on the behaviour of coral
httos://www.nature.com/articles/s41586-019-1903-v 7

22/02/2021 Ocean acidification does not impair the behaviour of coral reef fishes I Nature
reef fishes are not reproducible, suggesting that behavioural perturbations will not be a major
consequence for coral reef fishes in high CO2 oceans .
.lfl. Access through your institution
Buy or subscribe
Access options
Rent or Buy
article
Get time limited or full article
access on ReadCube.
from $8.99
Rent or Buy
All prices are NET prices.
Additional access options:
Login
Access through your institution
Learn about institutional subscriptions
Data availability
Get Tell us your thoughts on research journals
VATwill
Please take part in a short survey about your interactions with journals. Your feedback will help us to better serve our community of readers and authors.
To say thanks, you will have the option to enter a prize draw for the chance to win 1 of 4 £100 giftcards.
The data necessary to reproduce figures and results in this study are publicly archived in
Figshare following best-practice guidelines55, and were made available to editors and
reviewers at the time of submission: https://doi.org/10.6084/m9.figshare.7871522. We place
no restrictions on data availability.
Code availability 8
X
22./02/2021 Ocean acidification does not impair the behaviour of coral reef fishes I Nature
Scripts for statistical analyses are available from Figshare
(https://doi.org/10.6084/m9.figshare.7871522). We place no restrictions on code availability.
References
1. Honisch, B. et al. The geological record of ocean acidification. Science 335, 1058-
1063 (2012).
2. Luthi, D. et al. High-resolution carbon dioxide cone
years before present. Nature 453, 379-382 (2008). Tell us your thoughts on
research journals 3. Riebesell, U. & Gattuso, J.-P. Lessons learned from
Clim. Change 5, 12-14 (2015).
4. Dixson, D. L., Munday, P. L. & Jones, G. P. Ocean.
ability of fish to detect predator olfactory cues. Ecol. 1
Please take part in a short survey about your interactions with journals. Your feedback will help us to better serve our community of readers and authors.
To say thanks, you will have the option to enter a prize draw for the chance to win 1 of 4 £100 giftcards.
5. Munday, P. L. et al. Replenishment of fish populati<
acidification. Proc. Natl Acad. Sci. USA 107, 12930-12934 (2010).
X
6. Ishimatsu, A., Hayashi, M., Lee, K.-S., Kikkawa, T. & Kita, J. Physiological effects on
fishes in a high-CO2 world. J Geophys. Res. Oceans 110, C09S09 (2005).
7. Heuer, R. M. & Grosell, M. Physiological impacts of elevated carbon dioxide and
ocean acidification on fish. Am. J Physiol. Regul. Integr. Comp. Physiol. 307, R1061-
Rl084 (2014).
8. Melzner, F. et al. Physiological basis for high CO2 tolerance in marine ectothermic
animals: pre-adaptation through lifestyle and ontogeny? Biogeosciences 6, 2313-2331
(2009).
9.
https:/twww.nature.com/articles/s415B6-019-1903-y
22/02/2021 Ocean acidification does not impair the behaviour of coral reef fishes I Nature
Munday, P. L. et al. Ocean acidification impairs olfactory discrimination and homing
ability of a marine fish. Proc. Natl Acad. Sci. USA 106, 1848-1852 (2009).
10. Shaw, E. C., McNeil, B. I. & Tilbrook, B. Impacts of ocean acidification in naturally
variable coral reef flat ecosystems. J Geophys. Res. Oceans 117, C03038 (2012).
11. Clements, J.C. & Hunt, H. L. Marine animal behaviour in a high CO2 ocean. Mar.
Ecol. Prag. Ser. 536, 259-279 (2015).
12. McNeil, B. I. & Sasse, T. P. Future ocean hyperca1
amplification of the natural CO2 cycle. Nature 529, 3~
Tell us your thoughts on 13. Leis, J.M. Paradigm lost: ocean acidification will research journals biophysical dispersal. Front. Mar. Sci. 5, 47 (2018). Please take part in a short survey about your
interactions with journals. Your feedback will help us to better serve our community of
14. Bignami, S., Sponaugle, S. & Cowen, R. K. Respc
of a large tropical marine fish, Rachycentron canadum
(2013).
15. Sundin, J., Amcoff, M., l\1ateos-Gonzalez, F., Rab
readers and authors.
To say thanks, you will have the option to enter a prize draw for the chance to win 1 of 4 £100 giftcards.
acclimation to near-future ocean acidification has negligible effects on energetic
attributes in a juvenile coral reef fish. Oecologia 190, 689-702 (2019).
16. Munday, P. L., Cheal, A. J., Dixson, D. L., Rummer, J. L. & Fabricius, K. E.
Behavioural impairment in reef fishes caused by ocean acidification at CO2 seeps. Nat.
Clim. Change 4, 487-492 (2014).
17. Nilsson, G. E. et al. Near-future carbon dioxide levels alter fish behaviour by
interfering with neurotransmitter function. Nat. Clim. Change 2, 201-204 (2012).
X
18. Button, K. S. et al. Power failure: why small sample size undermines the reliability of
neuroscience. Nat. Rev. Neurosci. 14, 365-376 (2013).
19. Baker, M. 1,500 scientists lift the lid on reproducibility. Nature 533, 452-454 (2016).
_ _.__ ____ __ _ ,_ ........ !_t __ ,_,.,.rnl'!> n.•" Ann-, ..
22/02/2021 Ocean acidification does not impair the behaviour of coral reef fishes I Nature
20. Eisenstein, M. Public health: an injection of trust. Nature 507, S17-S19 (2014).
21. 21. Browman, H. I. Applying organized scepticism to ocean acidification research. ICES
J Mar. Sci. 73, 529-536 (2016).
22. Parker, T. H. et al. Transparency in ecology and evolution: real problems, real
solutions. Trends Ecol. Evol. 31, 711-719 (2016).
23. Clark, T. D. Science, lies and video-taped experiments. Nature 542, 139 (2017).
24. Clark, T. D. et al. Scientific misconduct: the eleph
et al. Trends Ecol. Evol. 31, 899-900 (2016).
25. Welch, M. J., Watson, S.-A., Welsh, J. Q., McCon
of elevated CO2 on fish behaviour undiminished by tr;
Clim. Change 4, 1086-1089 (2014).
26. Ferrari, M. C. 0. et al. Effects of ocean acidificati,
coral reef fishes. Funct. Ecol. 26, 553-558 (2012).
Tell us your thoughts on research journals Please take part in a short survey about your interactions with journals. Your feedback will help us to better serve our community of readers and authors.
To say thanks, you will have the option to enter a prize draw for the chance to win 1 of 4 £100
giftcards.
Stan
27. Munday, P. L. et al. Elevated CO2 affects the behavior of an ecologically and
economically important coral reef fish. Mar. Biol. 160, 2137-2144 (2013).
X
28. Vallortigara, G. & Rogers, L. J. Survival with an asymmetrical brain: advantages and
disadvantages of cerebral lateralization. Behav. Brain Sci. 28, 575-589 (2005).
29. Chung, W.-S., Marshall, N. J., Watson, S.-A., Munday, P. L. & Nilsson, G. E. Ocean
acidification slows retinal function in a damselfish through interference with GABA A
receptors. J Exp. Biol. 217, 323-326 (2014).
30. Peel, G. T. et al. Biodiversity redistribution under climate change: impacts on
ecosystems and human well-being. Science 355, eaai9214 (2017).
31.
https://www.nature.com/articles/s41586-019-1903-y 11
22/02/2021 Ocean acidification does not impair the behaviour of coral reef fishes I Nature
ffihuld, A. L., Harii, S. & Dunlap, P. V. Cues from the reef: olfactory preferences of a
symbiotically luminous cardinalfish. Coral Reefs 34, 673-677 (2015).
32. 32. Dixson, D. L., Abrego, D. & Hay, M. E. Chemically mediated behavior of recruiting
corals and fishes: a tipping point that may limit reef recovery. Science 345, 892-897
(2014).
33. Riebesell, U., Fabry, V. J., Hansson, L. & Gattuso, J.-P. Guide to Best Practices for
Ocean Acidification Research and Data Reporting (Publications Office of the European
Union Luxembourg, 2010). x
34. Moran, D. The importance of accurate CO2 dosini Tell us your thoughts on
acidification studies. J. Exp. Biol. 217, 1827-1828 (2C research journals
35. Cornwall, C. E. & Hurd, C. L. Experimental desig
problems and solutions. ICES J Mar. Sci. 73, 572-58 ·
36. Dickson, A. G. Standard potential of the reaction:
HCl(aq), and the standard acidity constant of the ion I-
273.15 to 318.15 K. J. Chem. Thermodyn. 22, 113-12'
Please take part in a short survey about your interactions with journals. Your feedback will help us to better serve our community of readers and authors.
To say thanks, you will have the option to enter a prize draw for the chance to win 1 of 4 £100 giftcards.
37. Lueker, T. J., Dickson, A.G. & Keeling, C. D. OceanpCO2 calculated from
dissolved inorganic carbon, alkalinity, and equations for K 1 and K 2: validation based on
laboratory measurements of CO2 in gas and seawater at equilibrium. Mar. Chem. 70,
105-119 (2000).
38. Jutfelt, F., Bresolin de Souza, K., Vuylsteke, A. & Sturve, J. Behavioural
disturbances in a temperate fish exposed to sustained high-CO2 levels. PLoS One 8,
e65825 (2013).
39. Ishimatsu, A., Hayashi, M. & Kikkawa, T. Fishes in high-CO2, acidified oceans. Mar.
Ecol. Prag. Ser. 373, 295-302 (2008).
40.
12
22/02/2021 Ocean acidification does not impair the behaviour of coral reef fishes I Nature
fflw., M. et al. Responses of pink salmon to CO2-induced aquatic acidification. Nat. Clim.
Change 5, 950-955 (2015).
41. Munday, P. L. et al. Selective mortality associated with variation in CO2 tolerance in
a marine fish. Ocean Acidif. l, 1-5 (2012).
42. Green, L. & Jutfelt, F. Elevated carbon dioxide alters the plasma composition and
behaviour of a shark. Biol. Lett. 10, 20140538 (2014).
43. Sundin, J. et al. Long-term exposure to elevated c~
levels of a coral reef fish in response to predator chem
71, 108 (2017).
44. Doherty, P. J. Light-traps: selective but useful devi
distributions and abundances of larval fishes. Bull. Mc.
45. Jutfelt, F., Sundin, J., Raby, G. D., Krang, A.-S. &
flumes for testing avoidance and preference in aquatic
379-390 (2017).
Tell us your thoughts on research journals Please take part in a short survey about your interactions with journals. Your feedback will help us to better serve our community of readers and authors.
To say thanks, you will have the option to enter a prize draw for the chance to win 1 of 4 £100 giftcards.
46. Atema, J., Kingsford, M. J. & Gerlach, G. Larval reef fish could use odour for
detection, retention and orientation to reefs. Mar. Ecol. Prog. Ser. 241, 151-160 (2002).
47. Bisazza, A., Facchin, L., Pignatti, R. & Vallortigara, G. Lateralization of detour
behaviour in poeciliid fish: the effect of species, gender and sexual motivation. Behav.
Brain Res. 91, 157-164 (1998).
48. Bisazza, A., Pignatti, R. & Vallortigara, G. Detour tests reveal task- and stimulus
specific behavioral lateralization in mosquitofish ( Gambusia holbrooki). Behav. Brain
Res. 89, 237-242 (1997).
49. Nakagawa, S. A farewell to Bonferroni: the problems of low statistical power and
publication bias. Behav. Ecol. 15, 1044-1045 (2004).
https:/twww.nature.com/articles/s415B6-019-1903-y 13
X
22/02/2021 Ocean acidification does not impair the behaviour of coral reef fishes I Nature
50. 50. Zuur, A. F., Ieno, E. N., \Valker, N. J., Saveliev, A. A. & Smith, G. M. Mixed Effects
Models and Extensions in Ecology with R (Springer, 2009).
51. 51. Simonsohn, U. Just post it: the lesson from two cases of fabricated data detected by
statistics alone. Psycho!. Sci. 24, 1875-1888 (2013).
52. Roche, D. et al. Replication alert: behavioural lateralisation in a detour test is not
repeatable in fishes. Preprint at EcoEvoRxiv https://doi.org/10.32942/osf.io/6kcwa
(2019).
53. Domenici, P., Allan, B., McCormick, M. I. & Mur
affects behavioural lateralization in a coral reef fish. B
54. Roche, D. G., Binning, S. A., Strong, L. E., Davie.
Increased behavioural lateralization in parasitized con
67, 1339-1344 (2013).
55. Roche, D. G., Kruuk, L. E. B., Lanfear, R. & Binn
ecology and evolution: how well are we doing? PLoS
Tell us your thoughts on research journals Please take part in a short survey about your interactions with journals. Your feedback will help us to better serve our community of readers and authors.
To say thanks, you will have the option to enter a prize draw for the chance to win 1 of 4 £100 giftcards.
X
56. Clark, T. D., Roche, D. G., Binning, S. A., Speers-Roesch, B. & Sundin, J. Maximum
thermal limits of coral reef damselfishes are size dependent and resilient to near-future
ocean acidification. J Exp. Biol. 220, 3519-3526 (2017).
Acknowledgements
T.D.C. was funded by a Future Fellowship Grant (FT180100154) from the Australian
Research Council. J.S. was funded by a Mobility Grant from the Swedish Research Council
Formas (2013-947). G.D.R. was funded by a Postdoctoral Fellowship from the Natural
Sciences and Engineering Research Council of Canada (NSERC). S.A.B. and B.S.-R. were
funded by Discovery Grants from NSERC. B.S.-R. was also funded by a Harrison McCain
Young Scholars Award. F.J. was funded by Formas (2009-596), the Swedish Research Council
VR (621-2012-4679) and the Research Council ofNorway (262942). Additional funding was
14
22/02/2021 Ocean acidification does not impair the behaviour of coral reef fishes I Nature
obtained from the Society for Experimental Biology and Company of Biologists Travel Grants
(J.S., JEBTF-150422), Magnus Bergvalls Stiftelse (J.S., 2014-00620), Australian Endeavor
Research Fellowship (G.D.R.), IRIS stipendiet (J.S., 2015-0264), Stiftelsen Lars Hiertas
Minne (J.S., FO2014-0659), the Wenner-Gren Foundation (J.S.), Wallenbergstiftelsen (J.S.),
Inez Johanssons stiftelse (J.S.) and Sederholms utrikes stiftelse (J.S.). We thank N. Sopinka
and A. Yu for assistance with behavioural lateralization trials in 2015, S. Noonan for analysing
water samples for total alkalinity, R. Streit for assistance with some experiments in 2014, A.
Severati and C. Schlott for wild fish collections in 2015, K. Stark for assistance with the R
script for bootstrapping simulations, and V. Messmer, A. Hoev and A. Tobin for assistinQ with
the collection of fishes for the 2014 experiments. Thanks to
logistical support.
Author information
Affiliations
1. School of Life and Environmental Sciences, Deakin U
Australia
Timothy D. Clark
Tell us your thoughts on research journals Please take part in a short survey about your interactions with journals. Your feedback will help us to better serve our community of readers and authors.
To say thanks, you will have the option to enter a prize draw for the chance to win 1 of 4 £100 giftcards.
2. Great Lakes Institute for Environmental Research, University of Windsor, Windsor,
Ontario, Canada
Graham D. Raby
3. Department of Biology, Carleton University, Ottawa, Ontario, Canada
Dominique G. Roche
4. Institut de Biologie, Eco-Ethologie, Universite de Neuchatel, Neuchatel, Switzerland
Dominique G. Roche & Sandra A. Binning
https://www.nature.com/articles/s41586-019-1903-y 15
X
22/02/2021 Ocean acidification does not impair the behaviour of coral reef fishes I Nature
5. Departement de Sciences Biologiques, Universite de Montreal, Montreal, Quebec,
Canada
Dominique G. Roche & Sandra A. Binning
6. Department of Biological Sciences, University of New Brunswick, Saint John, New
Brunswick, Canada
Ben Speers-Roesch
7. Department of Biology, Norwegian University of Scie
Norway
Fredrik Jutfelt & Josefin Sundin
8. Department of Neuroscience, Uppsala University, UpJ
Josefin Sundin
9. Department of Aquatic Resources, Swedish Universi~
Drottningholm, Sweden
Josefin Sundin
Contributions
Tell us your thoughts on research journals Please take part in a short survey about your interactions with journals. Your feedback will help us to better serve our community of readers and authors.
To say thanks, you will have the option to enter a prize draw for the chance to win 1 of 4 £100 giftcards.
X
All authors contributed to the design and execution of behavioural experiments; T.D.C. drafted
the manuscript and Supplementary Information with assistance from all authors; T.D.C. and
J.S. managed and prepared the raw data with assistance from co-authors; G.D.R., D.G.R. and
T.D.C. conducted the statistical analyses and created the figures. J.S. managed the revisions
with assistance from all co-authors.
Corresponding authors
Correspondence to Timothy D. Clark or Josefin Sundin.
16
22/02/2021 Ocean acidification does not impair the behaviour of coral reef fishes I Nature
Ethics declarations
Competing interests
The authors declare no competing interests.
Additional information
Peer review information Nature thanks David Bierbach an
reviewer(s) for their contribution to the peer review of this,
Publisher's note Springer Nature remains neutral with rega
published maps and institutional affiliations.
Extended data figures and tables
Extended Data Fig. 1 Interactions between CO2 tr1
fish activity.
Tell us your thoughts on research journals Please take part in a short survey about your interactions with journals. Your feedback will help us to better serve our community of readers and authors.
To say thanks, you will have the option to enter a prize draw for the chance to win 1 of 4 £100 giftcards.
X
a-c, Raw data points and fitted model estimates for activity in D. aruanus in 2014 (a), A.
polyacanthus in 2014 (b) and A. polyacanthus in 2015 ( c) as a function of acclimation
treatment (grey diamonds, control; blue circles, high CO2) and size (x axis), with shaded areas
indicating 95% confidence intervals of model estimates. Model parameter estimates are
included in Extended Data Table 3. a, n = 23 per treatment. b, n = 8 per treatment. c, Control,
n = 28; CO2, n = 38. Sample sizes represent biologically independent animals.
Extended Data Fig. 2 Widespread resilience of behavioural lateralization in coral reef damselfishes when faced with end-of-century levels of CO2.
a-g, Number of right turns (out of 10) under control (closed grey bars) and high CO2 (open
blue bars) conditions for fishes facing either a centred barrier at one end of the T-maze (a-f) or
an offset barrier at the other end of the T-maze (g). Sample sizes represent biologically
independent animals). a, P. moluccensis. Control, n = 29; CO2, n = 20. b, C. atripectoralis.
Control, n = 26; CO2, n = 17. c, D. aruanus. Control, n = 19; CO2, n = 21. d, P. amboinensis.
https://www.nature.com/articles/s41586-019-1903-y 17
22/02/2021 Ocean acidification does not impair the behaviour of coral reef fishes I Nature
Control, n = 21; CO2, n = 22. e, P. amboinensis retested. Control, n = 15; CO2, n = 15. f, A.
polyacanthus. Control, n = 120; CO2, n = 104. g, A. polyacanthus (same sample sizes as inf).
a-e, Data were obtained at the LIRS in 2014. f, g, Data were obtained at the AIMS in 2015.
Dashed lines represent the mean number of right turns for each treatment group. A tick mark
on the panel ( coloured according to treatment) indicates significant individual-level
lateralization, whereas an asterisk at the top of the panel indicates significant population-level
lateralization. See Extended Data Tables 4, 5 for statistics.
Extended Data Fig. 3 Histogram of the percentage of time in oredator cue data for fish used in choice flume trials at LIRS in 2016 x
Each data point included in this summary represents analys1
data for a fish; the plot contains many repeated measuremer
Extended Data Fig. 4 Histogram of representative spent in water containing predator cue or conspeci Histograms of representative data ( 4-min means) from a pre
the disproportionate number of fish that were reported to sp
chemical alarm cue when acclimated to control water (a) or
acclimated to water with elevated CO2 levels (b ). The repre
juvenile A. polyacanthus in control water from parents accH
Tell us your thoughts on research journals Please take part in a short survey about your interactions with journals. Your feedback will help us to better serve our community of readers and authors.
To say thanks, you will have the option to enter a prize draw for the chance to win 1 of 4 £100 giftcards.
n = 62) and juvenile A. polyacanthus in high CO2 water from parents acclimated to high CO2
water (b, n = 62). Also presented are data (4-min means) from the present study (6 species,
open bars; n = 247 control, n = 239 high CO2) showing peak frequencies around 50% of time
in predator cue for both control (a) and high-CO2-exposed (b) fish. Sample sizes represent
biologically independent animals. Mean values for each of the datasets are indicated with
vertical lines, and arrows are directed at modal values in each of the datasets.
Extended Data Table 1 \Vater chemistry data for the two sites for the three years of
the study
Extended Data Table 2 Model predictions of time spent in predator chemical cue
11
22102/2021 Ocean acidification does not impair the behaviour of coral reef fishes I Nature
Extended Data Table 3 Model predictions of mean activity levels
Extended Data Table 4 Individual- and population-level lateralization of coral reef
fishes
Extended Data Table 5 Individual- and population-level lateralization of wild and
captive-reared A. polyacanthus
Supplementary information
Supplementary Information This file contains additional details on the methods. It also c
studies, life stages and definition of larval versus juvenile fi
individual variation, and further details on the contents of F
Reporting Summary
Rights and permissions
Reprints and Permissions
About this article
Cite this article
Tell us your thoughts on research journals Please take part in a short survey about your interactions with journals. Your feedback will help us to better serve our community of readers and authors.
To say thanks, you will have the option to enter a prize draw for the chance to win 1 of 4 £100 giftcards.
Stan
Clark, T.D., Raby, G.D., Roche, D.G. et al. Ocean acidification does not impair the behaviour
of coral reef fishes. Nature 577, 370-375 (2020). https://doi.org/10.1038/s41586-019-1903-y
Received 25 April 2019 Accepted 21 November 2019 Published 08 January 2020
https://www.nature.com/articles/s415B6-019-1903-y 19
X
22/02/2021 Ocean acidification does not impair the behaviour of coral reef fishes I Nature
Issue Date 16 January 2020 DOI https://doi.org/10.1038/s41586-019-1903-y
Subjects
Behavioural ecology • Chemical ecology • Climate-change ecology • Ecophysiology • Ethics
Further reading
• Anthropogenic forcing of fish boldness a, Tell us your thoughts on ecosystem structure Wei Wang, Nuo Xu [ ... ] & Jonatan Klaminder
Global Change Biology (2021)
• The Neurobiology of Ocean Change - insi
crustaceans Wolfgang Stein & Steffen Harzsch
Zoology (2021)
research journals Please take part in a short survey about your interactions with journals. Your feedback will help us to better serve our community of readers and authors.
To say thanks, you will have the option to enter a prize draw for the chance to win 1 of 4 £100 giftcards.
• Animal size and sea water temperature, but not pH, influence a
repeatable startle response behaviour in a wide-ranging marine mollusc Jeff C. Clements, Kirti Ramesh[ ... } & Fredrik Jutfelt
Animal Behaviour (2021)
• Methods matter in repeating ocean acidification studies
Philip L. Munday, Danielle L. Dixson [ ... ] & Sue-Ann Watson
Nature (2020)
20
X
22/02/2021 Ocean acidification does not impair the behaviour of coral reef fishes I Nature
• Predator populations differ in their foraging responses to acute
seawater acidification GM Contolini, KJ Kroeker & EP Palkovacs
Marine Ecology Progress Series (2020)
Nature ISSN 1476-4687 (online)
© 2021 Springer Nature Limited
https://www.nature.com/articles/s41586-019-1903-y 21
Tell us your thoughts on research journals Please take part in a short survey about your interactions with journals. Your feedback will help us to better serve our community of readers and authors.
To say thanks, you will have the option to enter a prize draw for the chance to win 1 of 4 £100 giftcards.
X

22
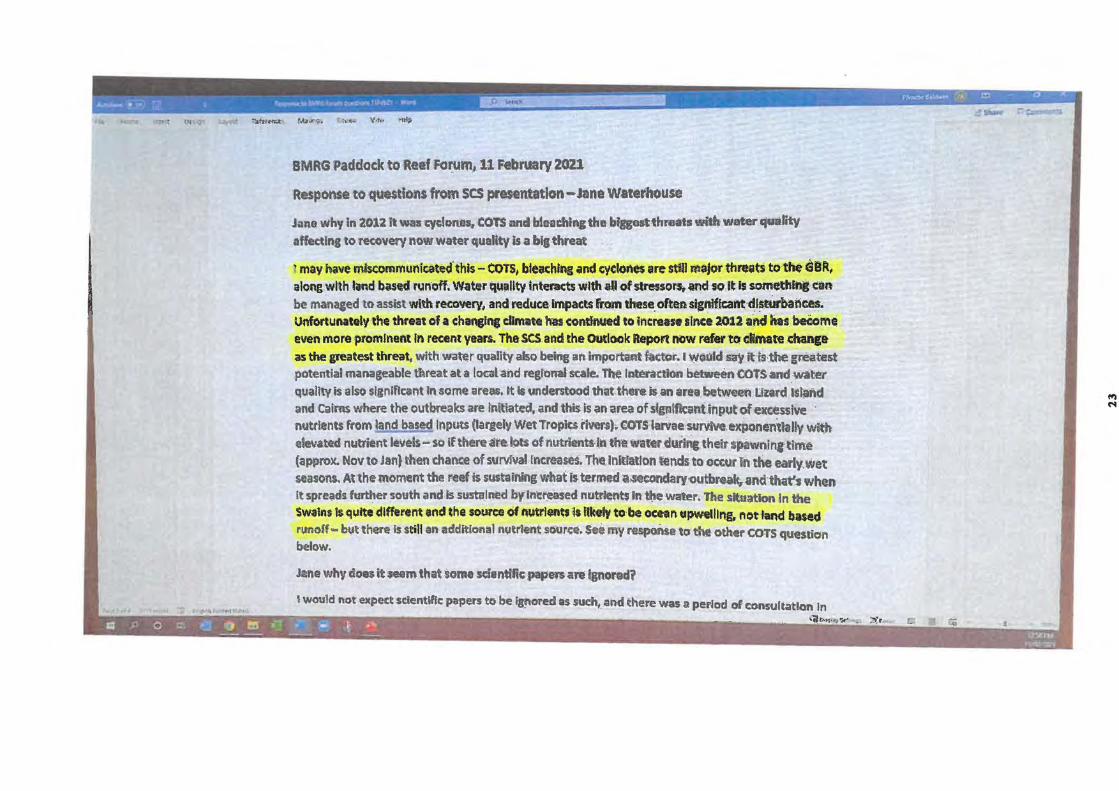
BMRG Paddock to Reef forum, U February 2021
Response t-o questions from. scs p~ntatlon-Jane Waterhouse
Jane why in Z0:12 it was cyc!onas. COTS nnd bleaching the bfggostthrliat• With water quality affectlnt to recovery now water quallty is a bit threat
' mav have rnlseomrnunfcated· this - COTS, bleaching ind cyclones are stfll major thnuits to·the 68R, along with land basted ninoff~ mltctr quilllty lnteracts wl~ all of stressorc5;. and so It Is somethfnl can be managed to assist wlth re.covery, and reduce Impacts from these_ ofttn signlffcaftt ·dlsturbai'i~Unfortunately the threat of a chqfng climate ha:1 continued to increase since 2012 and has become even more prominent In recent years. Theses and the OUdook Report now reter·to-cMmate dl:anle as the greatest threat. with water quality also being an impQrtantf•Ctoi:. I would siifyitts-.the greatilist potential m.inageable threat au losil~nd regionahcale. ~ lntetattlon ~nCOlSand water quality is also sl1nifttilnt fn.somt a teas. It is understood that there iun area. betw~en lltard ltland and cairns where the outbreaks are initiated, .and thb is ~n rarea of signlftteniinputof aeessive · nutrients from land based lnputt (largely Wet TroplQ rivers). COTS larvae surviVe exponentialty with. e!evated nutrient levels- so if there ale.fl)!$ of nutrients0Jt1 thet water during their spawnln,rtirne {approx. Nov to Jan) then chante of survival rncreases. Th~ lnitlatlon tends, to occur in the early.. wet seasons. At the moment~ reef ts sustaining what is: termed :uecondary,c,utbreak, and·that'1 when l.t sprel;lds further south .ind Is susta:lned byin~~;ed nutri~nts In tl,ew~~r. The situation in the Swalns ts qufte different encl the source of llutrlentt Is ffkely to be ocean upwetllna, not Janel based runoff .. but ther11t is still an additional nijtrlent sour«. Se• rnv respons~ to d,it other COTS question below.
Jane why does it ff8m that ;ome sdentffic.papets aJe l&nom?
I would not expect sctentific papers to be Ignored as sueb1 .incl there was a pulod of consultation In

24
. MRG• ff-twolltWllh-""" °"d,a li>IDMftetoOll.,....illtlligl,Jil)\lU tke....,... of r.~-
Ill N

MEDIA RELEASE Reef and Rainforest Research Centre, Cairns, Australia For immediate release
eef & a·ntorest RESEARCH CENTRE
September27,2020
Flagship Cairns trial provides solution to reduce nitrate run-off onto Great
Barrier Reef by 15 per cent-plus
Key Outcomes of Project 25
• Building trust between Far North Queensland farmers and water quality scientists is
delivering major gains that will significantly improve coral health on the Great Barrier Reef
• The flagship Project 25 has shown that to achieve successful sustainable solutions to
reduce nitrogen fertiliser runoff from farms, landholders must be closely Involved in discussions
and scientific trials.
• Using the drainage channel network that links sugarcane farms to rivers to hold back, filter
and slow the first flush of water runoff after early Wet Season rains, by adding gates or baffles, can
reduce the amount of damaging nitrates that end up on the Great Barrier Reef by at least 15%.
A unique pilot project in North Queensland encouraging farmers and marine scientists to cooperate
and work more closely together to protect the long-term health of the Great Barrier Reef is yielding
major dividends and practical solutions.
The Project 25 initiative, funded by the Australian Government's National Environmental Science
Program through the Cairns-based Reef and Rainforest Research Centre (RRRC), aims to significantly
reduce the amount of damaging nitrogen fertiliser running off sugarcane farms into the creeks and
rivers that flow into the waters of the Great Barrier Reef.
A flagship four-year partnership between scientists from James Cook University (JCU) and CSIRO, and
more than 100 cane-growers along the high-rainfall Russell and Mulgrave river catchments south of
Cairns has involved the installation of hi-tech telemetry and water quality sensors along the rivers and
creeks close to their farms.
17
For the first time, this technology has allowed accurate and real time measurements of nitrate
concentrations in local waterways throughout the year to be gathered - rather than the estimates,
assumptions and modelling-based data used previously - with the critical information immediately
fed back to local canegrowers via CSIRO's specially-developed mobile phone app 1622.
Correctly determining the source and amounts of dissolved inorganic nitrogen, sediment and other
pollutants in river systems that flow onto the Great Barrier Reef is key to implementing management
actions to reduce their level and meet water quality targets set under the Reef 2050 Plan.
"You can't control what you can't measure, and you can't expect farmers to change their practices
and behaviour unless they trust the data, are fully informed and understand what the issues are and
their impact on the Reef," says RRRC chief executive Sheriden Morris.
"That is what Project 25 has shown; not only are we excited about the potential to cut and control
nitrogen runoff from cane farms onto the Reef using the existing and extensive farm drainage network,
but the fact it is growers who, together with the water quality scientists, have suggested this is a
practical and viable way to make it happen."
As part of Project 25, scientists held regular meetings with local farmers to keep them abreast of latest
scientific developments and results, and to discuss practical management options for reducing the
harmful impact nitrogen runoff can have on harming coral growth and survival on reefs and islands
offshore from the Russell-Mulgrave river mouth.
The practices of sugarcane farmers are a major influence on water quality in the catchment. Providing
accurate evidence-based data is vital to both farmers' understanding of the issue and their subsequent
decisions to adapt and alter their farm management practices.
In turn, growers have been able to educate scientists working on Tropical Water Quality issues as part
of the federal National Environmental Science Program (NESP), about the financial and practical
repercussions of potential government-imposed limits and regulations on their farms and families.
The two-way co-operation and improved trust and understanding - the lack of which has for many
years seen some Queensland canegrowers question the science and data behind controls placed on
their farm operations - is now leading to successful environmental outcomes for the Great Barrier Reef
which are also acceptable to landholders.
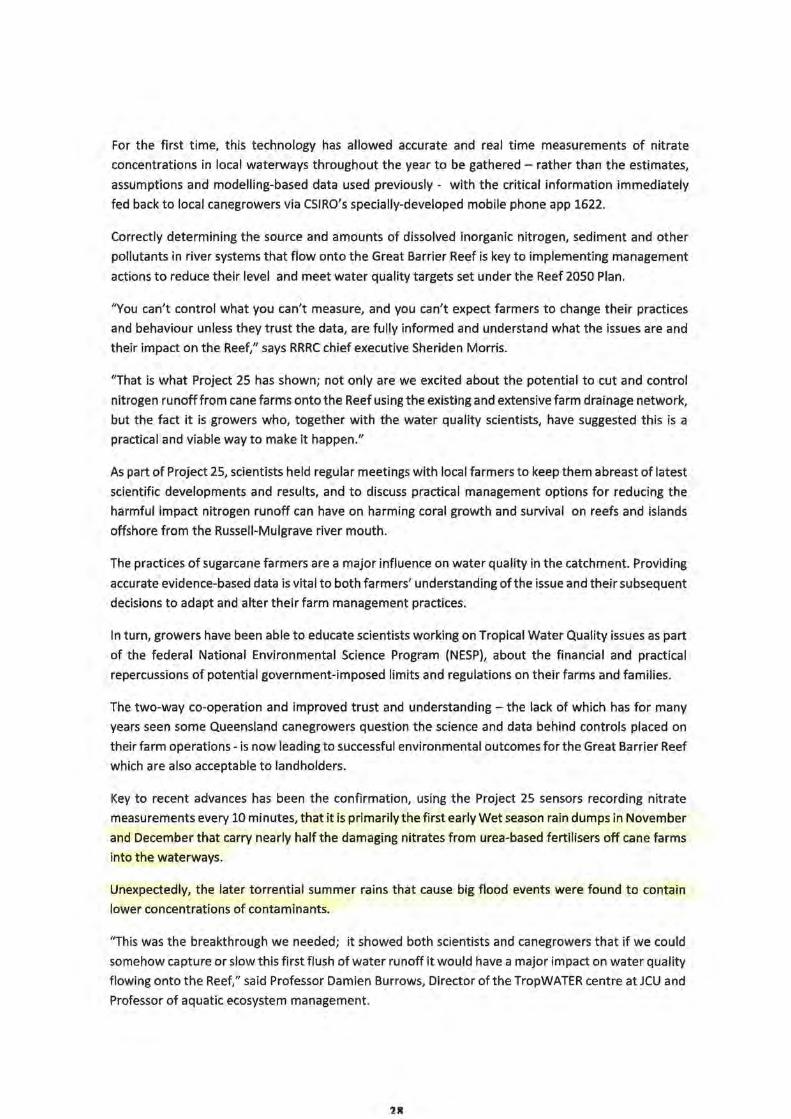
Key to recent advances has been the confirmation, using the Project 25 sensors recording nitrate
measurements every 10 minutes, that it is primarily the first early Wet season rain dumps in November
and December that carry nearly half the damaging nitrates from urea-based fertilisers off cane farms
into the waterways.
Unexpectedly, the later torrential summer rains that cause big flood events were found to contain
lower concentrations of contaminants.
"This was the breakthrough we needed; it showed both scientists and canegrowers that if we could
somehow capture or slow this first flush of water runoff it would have a major impact on water quality
flowing onto the Reef," said Professor Damien Burrows, Director of the TropWATER centre at JCU and
Professor of aquatic ecosystem management.
2X
"If we can hold this water back from entering the waterways and let it settle for just a few days, we
know that natural processes and bacteria "denitrify" the nitrates in the runoff while it is sitting there
and the nitrogen is lost as a gas before the water flows into the rivers.
"We talked about creating settling ponds on farms or on crown land but that was too expensive and
unpopular; this was when it was suggested we use the existing drainage network already in place,
originally to drain cane fields, reduce waterlogging and improve crop production, to hold back, filter
and slow these low-volume early rain flushes that contain such large amounts of nitrates."
The plan is to prevent this first N-rich runoff entering major rivers and creeks in the Russell-Mulgrave
catchment by inserting automatic gates, controls or baffle boards at the end of the vast volume of
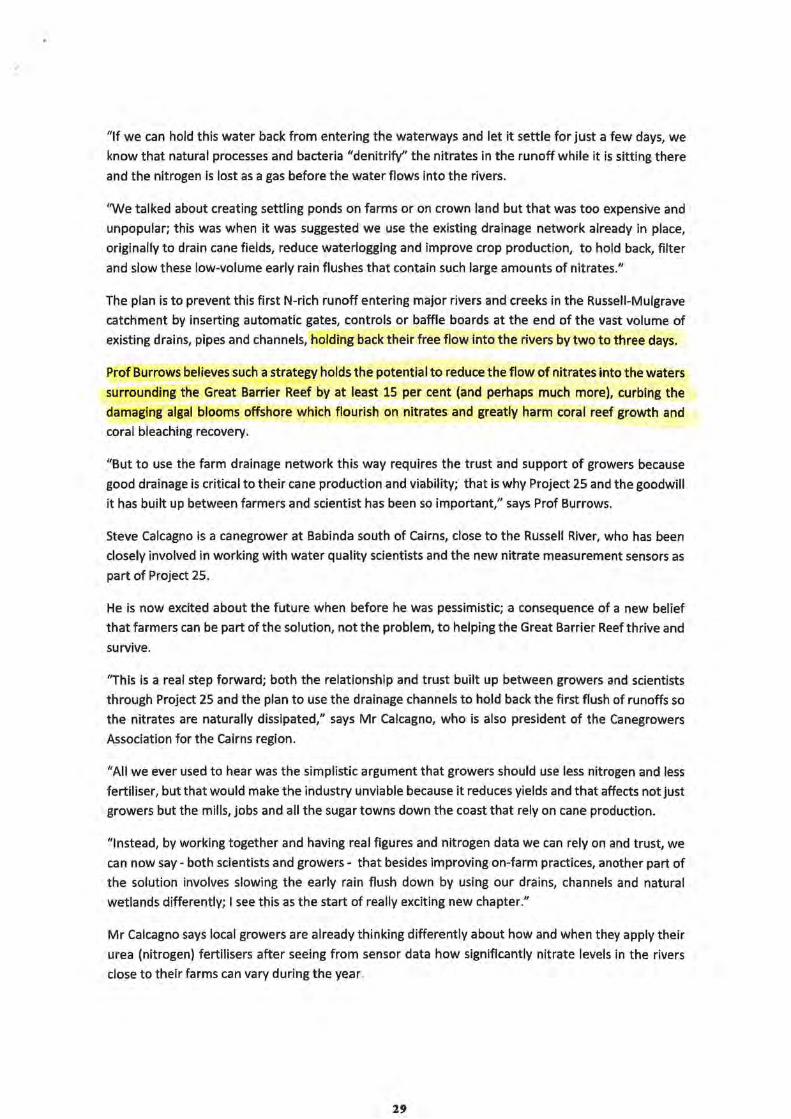
existing drains, pipes and channels, holding back their free flow into the rivers by two to three days.
Prof Burrows believes such a strategy holds the potential to reduce the flow of nitrates into the waters
surrounding the Great Barrier Reef by at least 15 per cent (and perhaps much more), curbing the
damaging algal blooms offshore which flourish on nitrates and greatly harm coral reef growth and
coral bleaching recovery.
"But to use the farm drainage network this way requires the trust and support of growers because
good drainage is critical to their cane production and viability; that is why Project 25 and the goodwill
it has built up between farmers and scientist has been so important," says Prof Burrows.
Steve Calcagno is a canegrower at Babinda south of Cairns, close to the Russell River, who has been
closely involved in working with water quality scientists and the new nitrate measurement sensors as
part of Project 25.
He is now excited about the future when before he was pessimistic; a consequence of a new belief
that farmers can be part of the solution, not the problem, to helping the Great Barrier Reef thrive and
survive.
"This is a real step forward; both the relationship and trust built up between growers and scientists
through Project 25 and the plan to use the drainage channels to hold back the first flush of runoffs so
the nitrates are naturally dissipated," says Mr Calcagno, who is also president of the Canegrowers
Association for the Cairns region.
"All we ever used to hear was the simplistic argument that growers should use less nitrogen and less
fertiliser, but that would make the industry unviable because it reduces yields and that affects not just
growers but the mills, jobs and all the sugar towns down the coast that rely on cane production.
"Instead, by working together and having real figures and nitrogen data we can rely on and trust, we
can now say- both scientists and growers - that besides improving on-farm practices, another part of
the solution involves slowing the early rain flush down by using our drains, channels and natural
wetlands differently; I see this as the start of really exciting new chapter."
Mr Calcagno says local growers are already thinking differently about how and when they apply their
urea (nitrogen) fertilisers after seeing from sensor data how significantly nitrate levels in the rivers
close to their farms can vary during the year.
29
Some are now applying fertilisers after cane harvest earlier than before to avoid coinciding with the
first rains of the Wet Season; others are experimenting with lower rates later in the year, or delaying
putting on fertilisers if heavy rain is forecast.
An added bonus of Project 25, with its hi-tech sensors, sophisticated data logging machines, satellite
Internet-of-Things connectivity and phone app capability, has been to engage a younger generation
of canegrowers.
They are already adept at changing their management practices and timeliness of farming decisions
based on the real time data being supplied to their mobile phones - be it about weather, cane prices,
river heights or water nitrate levels - with Mr Calcagno predicting this new generation of farmers can
only lead to even better outcomes for the Great Barrier Reef.
"The vast majority of canegrowers take this issue very seriously, and are doing whatever they can do
deal with the problem, minimise their impact on the environment and help the Great Barrier Reef -
don't forget it is where we and our families live, work and play too," says Steve Calcagno.
"Scientists and Reef decision-makers are smart people but too often they have forgotten to involve
farmers and local communities; Project 25 has shown the benefits for the Reef, North Queensland and
Australia if you take the time and make the effort to bring everyone along with you."
ENDS
Photo: Babinda canegrower Steve Calcagno is delighted with plans to reduce the amount of nitrate
runoff flowing from his farm into nearby Harvey Creek
Interviews: Sheriden Morris, CEO of the RRRC, Steve Calcagno Canegrowers Cairns president and Prof Damien Burrows, James Cook University, are all available for interview.
Media contact: Reef and Rainforest Research Centre Sue Neales 0427 132474 E: [email protected]
30

Section B:
General Reef Articles
31

32
2/9/2021 Great Barrier Reef starts to recover after severe coral bleaching, survey of sites between Cairns and Townsville shows -ABC News
IINEWS
Great Barrier Reef starts to recover after severe coral bleaching, survey of sites between Cairns and Townsville shows
By David Chen
Posted Fri 29 Sep 2017 at 3:34pm, updated Fri 29 Sep 2017 at 3:41pm
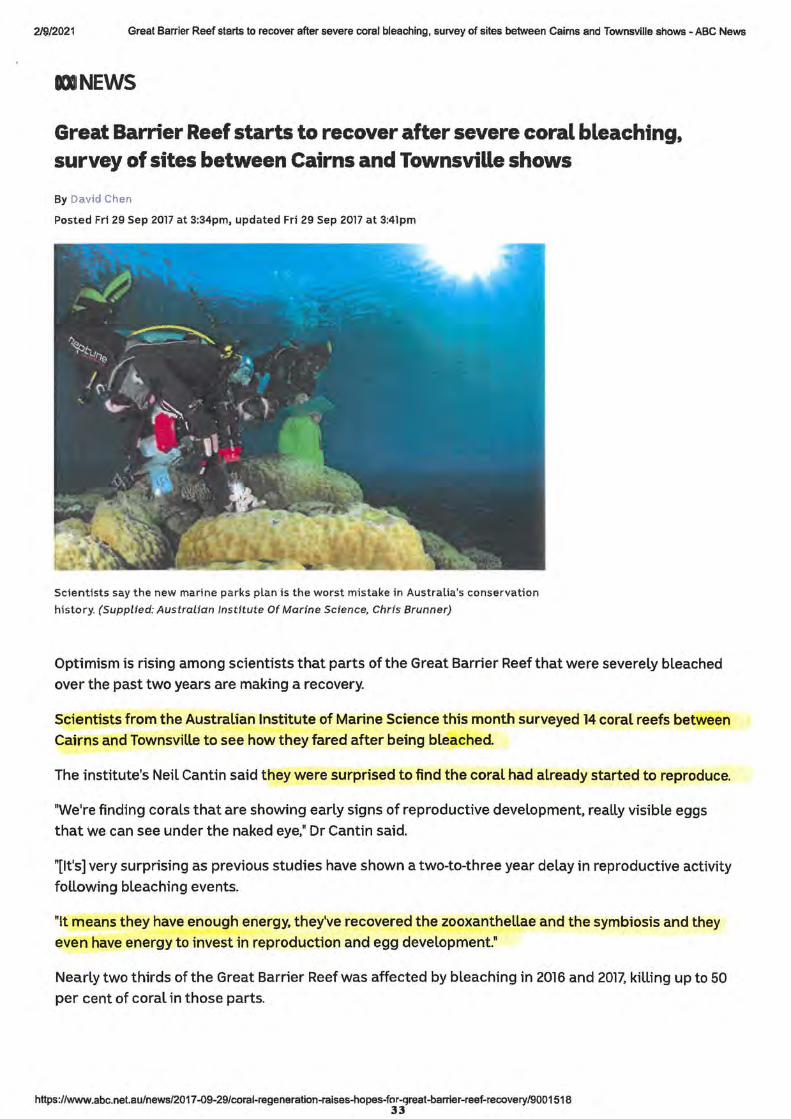
Scientists say the new marine parks plan is the worst mistake in Australia's conservation
history. (Supplied: Australian Institute Of Marine Science, Chris Brunner)
Optimism is rising among scientists that parts of the Great Barrier Reef that were severely bleached over the past two years are making a recovery.
Scientists from the Australian Institute of Marine Science this month surveyed 14 coral reefs between Cairns and Townsville to see how they fared after being bleached.
The institute's Neil Cantin said they were surprised to find the coral had already started to reproduce.
"We're finding corals that are showing early signs of reproductive development, really visible eggs
that we can see under the naked eye," Dr Cantin said.
"[It's] very surprising as previous studies have shown a two-to-three year delay in reproductive activity
following bleaching events.
"It means they have enough energy, they've recovered the zooxanthellae and the symbiosis and they
even have energy to invest in reproduction and egg development."
Nearly two thirds of the Great Barrier Reef was affected by bleaching in 2016 and 2017, killing up to 50 per cent of coral in those parts.
https://www.abc.net.au/news/2017-09-29/coral-regeneration-raises-hopes-for-qreat-barrier-reef-recovery/9001518 33
2/9/2021 Great Barrier Reef starts to recover after severe coral bleaching, survey of sites between Cairns and Townsville shows - ABC News
Severe cornl bleaching hit$ t wo-third s of Great Barri er Re ef
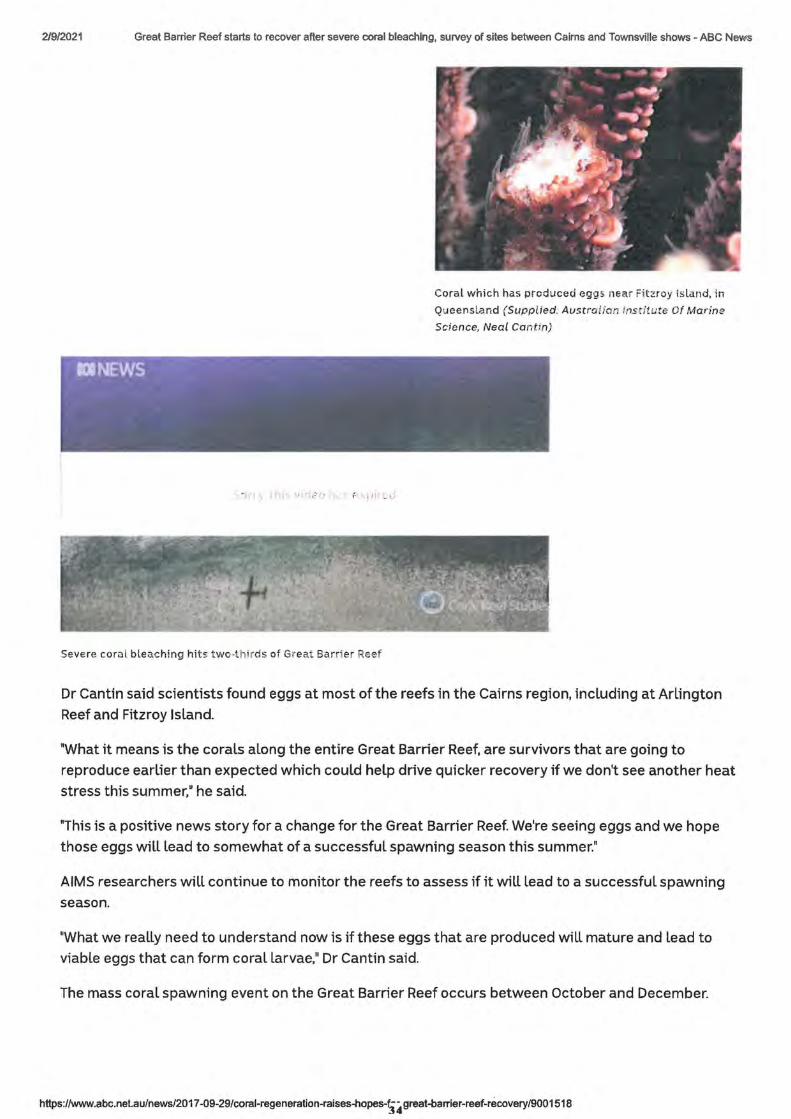
Coral which has produced eggs. near Fitzroy island, in
Queensland (Supplied: Austra lian lnsc/t;.;te Of Marine
Science, Neal Cantin)
Dr Cantin said scientists found eggs at most of the reefs in the Cairns region, including at Arlington
Reef and Fitzroy Island.
"What it means is the corals along the entire Great Barrier Reef, are survivors that are going to
reproduce earlier than expected which could help drive quicker recovery if we don't see another heat
stress this summer," he said.
•rhis is a positive news story for a change for the Great Barrier Reef. We're seeing eggs and we hope
those eggs will lead to somewhat of a successful spawning season this summer."
AIMS researchers will continue to monitor the reefs to assess if it will lead to a successful spawning
season.
"What we really need to understand now is if these eggs that are produced will mature and lead to
viable eggs that can form coral larvae," Dr Cantin said.
The mass coral spawning event on the Great Barrier Reef occurs between October and December.
https://www.abc.net.au/news/2017-09-29/coral-regeneration-raises-hopes-f34 great-barrier-reef-recovery/9001518
2/8/2021 Great Barrier Reef starts to recover after severe coral bleaching, survey of sites between Cairns and Townsville shows - ABC News
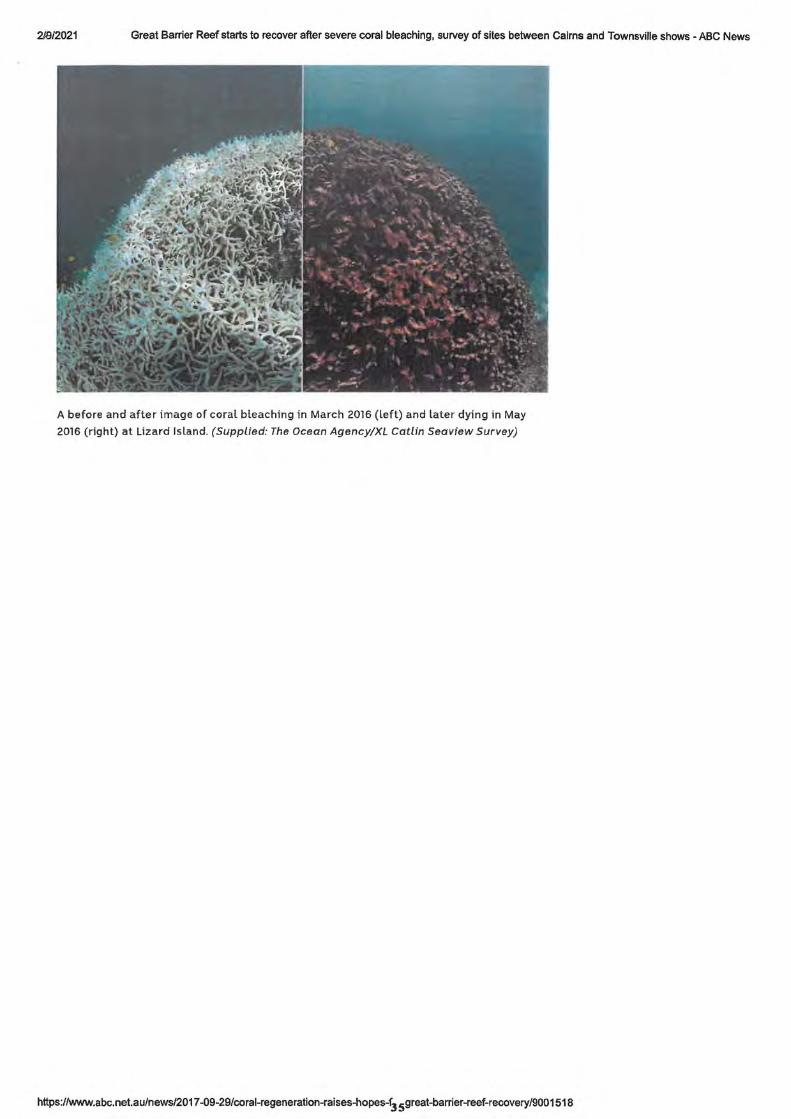
A before and after image of coral bleaching in March 2016 (left) and later dying in May
2016 (right) at Lizard Island. (Supplied: The Ocean Agency/XL Catlin Seaview Survey)
https:/lwww.abc.net.au/news/2017-09-29/coral-regeneration-raises-hopes-f3 5great-barrier-reef-recovery/9001518

2/9/2021 Great Barrier Reef coral bleaching causes numbers of baby coral to plummet - ABC News
IINEWS
SCIENCE
Great Barrier Reef coral bleaching causes numbers of baby coral to plummet
ABC Science / By environment reporter Nick Kilvert
Posted Thu 4 Apr 2019 at 5:05am
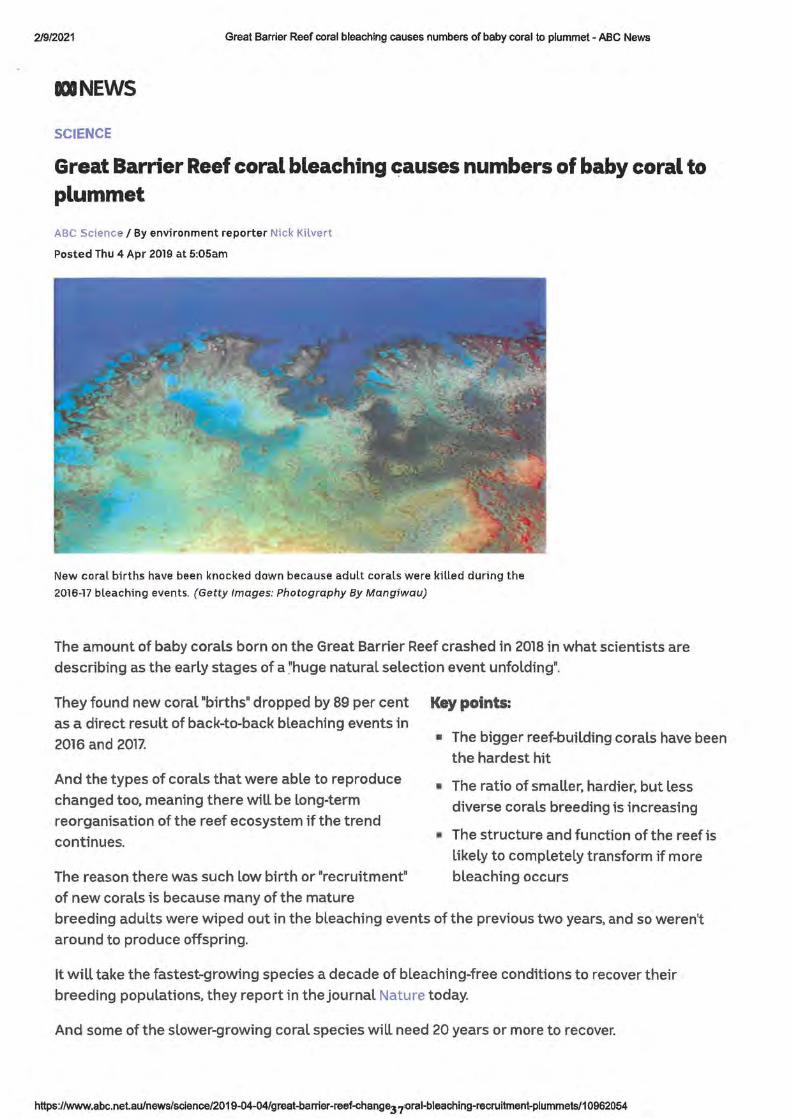
New coral births have been knocked down because adult corals were killed during the
2016-17 bleaching events. (Getty Images: Photography By Mangiwau)
The amount of baby corals born on the Great Barrier Reef crashed in 2018 in what scientists are describing as the early stages of a "huge natural selection event unfolding".
They found new coral "births" dropped by 89 per cent as a direct result of back-to-back bleaching events in 2016 and 2017.
And the types of corals that were able to reproduce changed too, meaning there will be long-term reorganisation of the reef ecosystem if the trend continues.
The reason there was such low birth or "recruitment" of new corals is because many of the mature
Key points:
• The bigger reef-building corals have been the hardest hit
■ The rat;o of smaller, hardier, but less diverse corals breeding is increasing
■ The structure and function of the reef is likely to completely transform if more bleaching occurs
breeding adults were wiped out in the bleaching events of the previous two years, and so weren't around to produce offspring.
It will take the fastest-growing species a decade of bleaching-free conditions to recover their breeding populations, they report in the journal Nature today.
And some of the slower-growing coral species will need 20 years or more to recover.
https://www.abc.net.au/news/science/2019-04-04/great-barrier-reef-change37,oral-bleaching-recruitment-plummets/10962054
2/9/2021 Great Barrier Reef coral bleaching causes numbers of baby coral to plummet - ABC News
But severe bleaching events, which used to occur once every 25 years prior to the 1980s, now occur
on average every 5.9 years, meaning it is statistically likely that another event will hit before the reef
has recovered from the last.
What we're seeing today is likely the early stages of a change to a much flatter, less diverse and
smaller reef, as many fragile species die out and are replaced by fewer, but more robust species
according to Lead researcher Terry Hughes from James Cook University.
"We've always anticipated that global warming would change the mix of species on the Barrier Reef,
but we're surprised by how quickly that's now unfolding," Professor Hughes said.
11 lt1s not something that's Likely to happen in the future, it's exactly what we're measuring right now.11
The middle and northern 1,400 kilometres of reef showed the biggest declines in the most important
reef-building corals, the ecologically dominant Acropora taxon, down to just 7.3 per cent of historical
breeding levels.
The far southern end of the reef, which dodged bleaching in 2016 and 2017, actually showed a very
slight increase in new coral recruitment in the 2018 spawning season.
But the researchers said they found "no evidence• that these southern reefs were helping to
regenerate reefs in the north.
That's because prevailing water currents travel in the opposite direction, said reef scientist Emma
Kennedy from the University of Queensland, who wasn't involved in the study.
'1ust Like the East Australia Current in Finding Nemo where the animals travel down the coast to
Sydney, we know from genetic studies that the corals move from north to south," Dr Kennedy said.
Which corals are surviving and why?
httn .. · //www :.hr. nAt ::i, 1/nP.w"/!;r.iP.nc:e/2019-04-04/areat-barrier-reef-chanae3 Boral-bleachina-recruitment-plummets/10962054
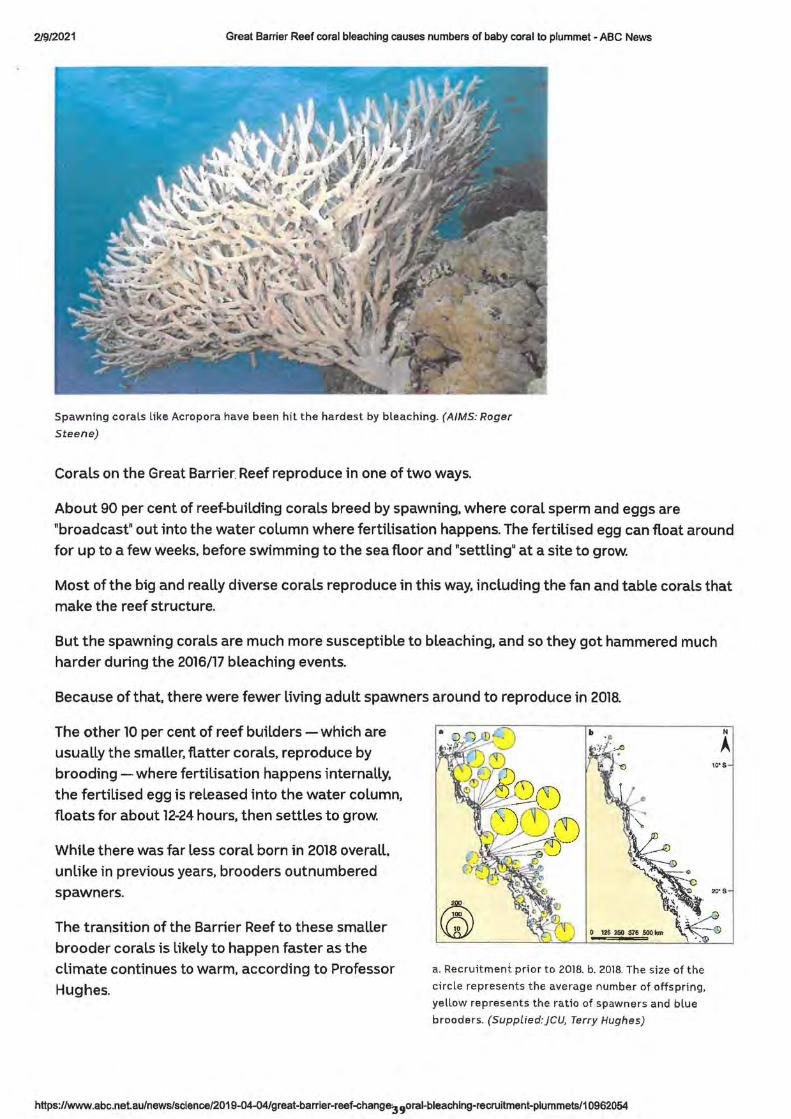
219/2021 Great Barrier Reef coral bleaching causes numbers of baby coral to plummet - ABC News
Spawning corals like Acropora have been hit the hardest by bleaching. (AIMS: Roger
Steene)
Corals on the Great Barrier Reef reproduce in one of two ways.
About 90 per cent of reef-building corals breed by spawning, where coral sperm and eggs are "broadcast" out into the water column where fertilisation happens. The fertilised egg can float around for up to a few weeks, before swimming to the sea floor and "settling" at a site to grow.
Most of the big and really diverse corals reproduce in this way, including the fan and table corals that make the reef structure.
But the spawning corals are much more susceptible to bleaching, and so they got hammered much harder during the 2016/17 bleaching events.
Because of that, there were fewer living adult spawners around to reproduce in 2018.
The other 10 per cent of reef builders - which are usually the smaller, flatter corals, reproduce by brooding - where fertilisation happens internally, the fertilised egg is released into the water column, floats for about 12-24 hours, then settles to grow.
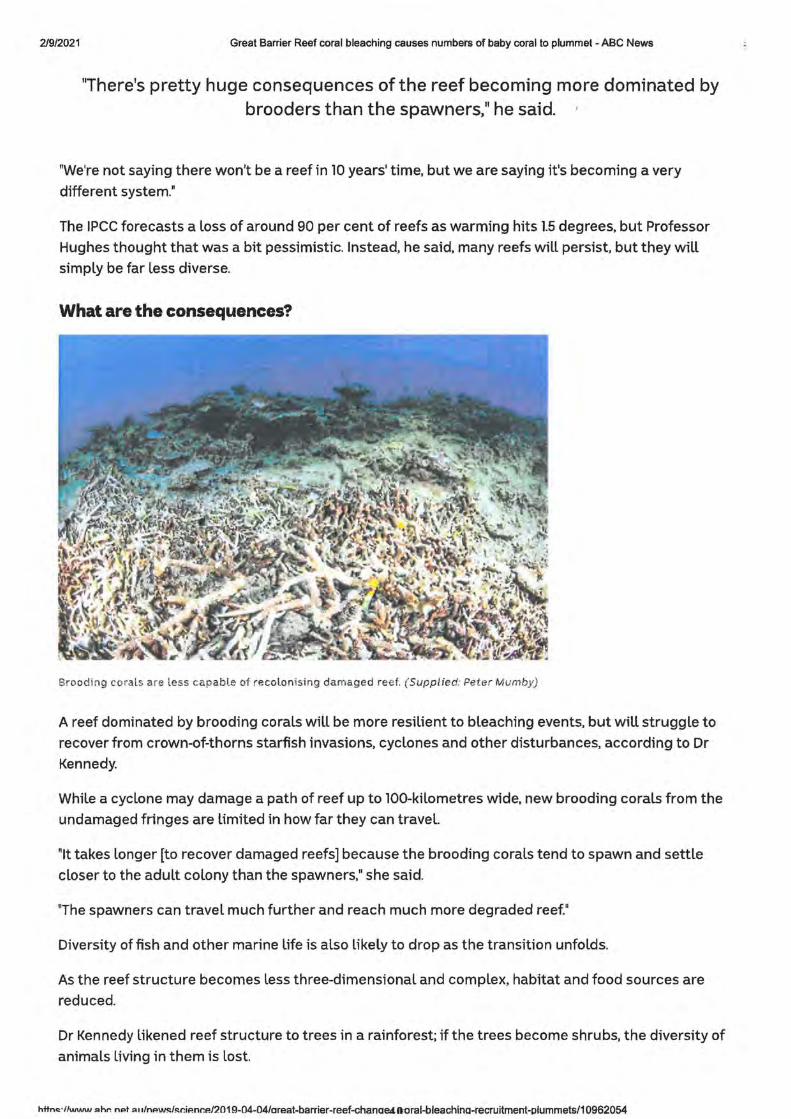
While there was far less coral born in 2018 overall, unlike in previous years, brooders outnumbered spawners.
The transition of the Barrier Reef to these smaller brooder corals is likely to happen faster as the climate continues to warm, according to Professor Hughes.
a. Recruitment. prior to 2018. b. 2018. The size of the
circle represents the average number of offspring,
yellow represents the ratio of spawners and blue
brooders. (Supplied:JCU, Terry Hughes)
https://www.abc.nelau/news/science/2019-04-04/great-barrier-reef-change39oral-bleaching-recruitment-plummets/10962054
2/9/2021 Great Barrier Reef coral bleaching causes numbers of baby coral to plummet - ABC News
"There's pretty huge consequences of the reef becoming more dominated by brooders than the spawners," he said.
"We're not saying there won't be a reef in 10 years' time, but we are saying it's becoming a very
different system."
The IPCC forecasts a loss of around 90 per cent of reefs as warming hits 1.5 degrees, but Professor
Hughes thought that was a bit pessimistic. Instead, he said, many reefs will persist, but they will
simply be far less diverse.
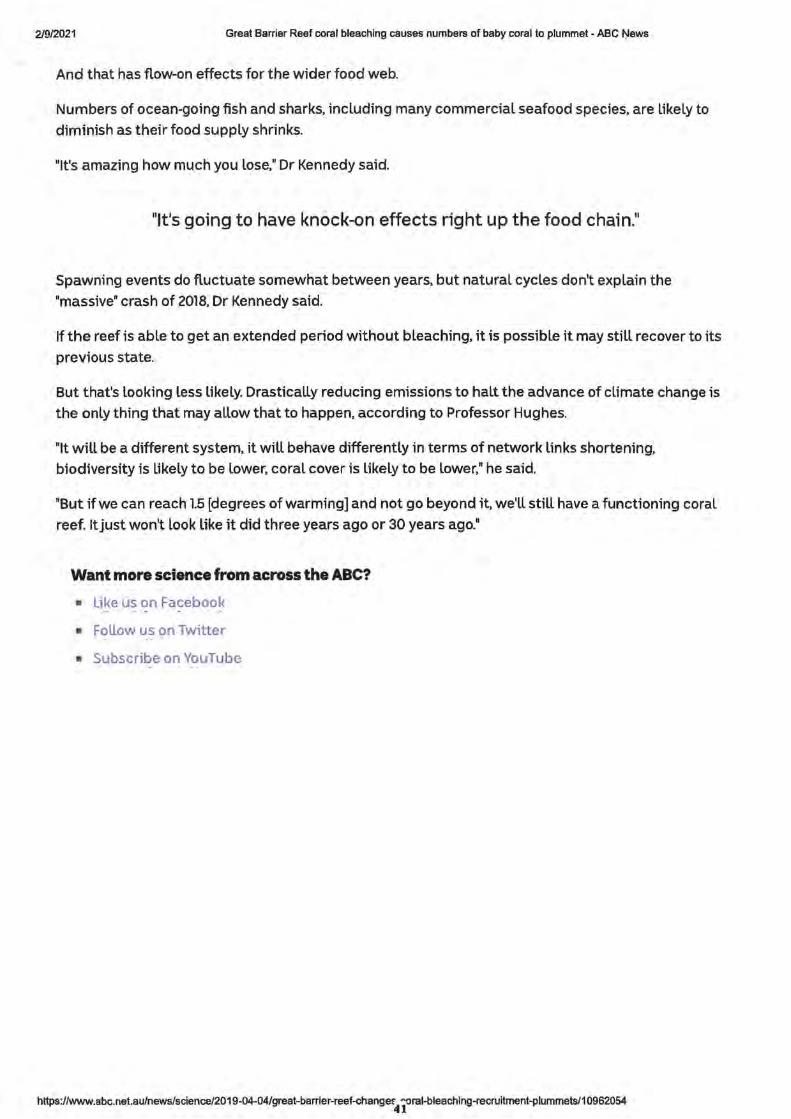
What are the consequences?
Brooding corals a re less capable of recolonising damaged reef. (Supplied: Peter Mumby)
A reef dominated by brooding corals will be more resilient to bleaching events, but will struggle to
recover from crown-of-thorns starfish invasions, cyclones and other disturbances, according to Dr
Kennedy.
While a cyclone may damage a path of reef up to 100-kilometres wide, new brooding corals from the
undamaged fringes are limited in how far they can travel.
"It takes longer [to recover damaged reefs] because the brooding corals tend to spawn and settle
closer to the adult colony than the spawners," she said.
"The spawners can travel much further and reach much more degraded reef."
Diversity of fish and other marine life is also likely to drop as the transition unfolds.
As the reef structure becomes less three-dimensional and complex, habitat and food sources are
reduced.
Dr Kennedy likened reef structure to trees in a rainforest; if the trees become shrubs, the diversity of
animals living in them is lost.
httnc·//www Ahr. npt ,.,,/npwi::/~d,:mr.P./2019-04-04/areat-barrier-reef-chanae.tR:oral-bleachlna-recruitment-plummets/10962054
2/9/2021 Great Barrier Reef coral bleaching causes numbers of baby coral to plummet - ABC l\lews
And that has flow-on effects for the wider food web.
Numbers of ocean-going fish and sharks, including many commercial seafood species, are likely to
diminish as their food supply shrinks.
"It's amazing how much you Lose," Dr Kennedy said.
"Its going to have knock-on effects right up the food chain."
Spawning events do fluctuate somewhat between years, but natural cycles don't explain the
"massive" crash of 2018, Dr Kennedy said.
If the reef is able to get an extended period without bleaching, it is possible it may still recover to its
previous state.
But that's Looking Less likely. Drastically reducing emissions to halt the advance of climate change is
the only thing that may allow that to happen, according to Professor Hughes.
"It will be a different system, it will behave differently in terms of network Links shortening, biodiversity is likely to be Lower, coral cover is Likely to be Lower," he said.
"But if we can reach 1.5 [degrees of warming] and not go beyond it, we'll still have a functioning coral
reef. ltjust won't look Like it did three years ago or 30 years ago."
Want more science from across the ABC?
■ Like us on Facebook
■ Follow us on Twitter
■ Subscribe on YouTube
https://www.abc.net.au/news/science/2019-04-04/great-barrier-reef-changer41oral-bleaching-recruitment-plummets/10962054

42
2/9/2021 Global warming impairs stock-recruitment dynamics of corals I Nature
nature View All Nature Research Journals Search Login
Content v Journal Info v Publish v Sign Up For Alerts .Q RSS Feed
nature > letters > article
Letter I Published: 03 April 2019
Global warming impairs stock-recruitment dynamics of corals
Terry P. Hughes El, James T. Kerry, Andrew H. Baird, Sean R. Connolly, Tory J. Chase, Andreas
Dietzel, Tessa Hill, Andrew S. Hoey, Mia 0. Hoogenboom, Mizue Jacobson, Ailsa Kerswell,
Joshua S. Madin, Abbie Mieog, Allison S. Paley, Morgan S. Pratchett, Gergely Torda & Rachael
M. Woods
Nature 568, 387-390(2019)
12k Accesses I 95 Citations I 4019 Altmetric I Metrics
Abstract
Changes in disturbance regimes due to climate change are increasingly challenging the
capacity of ecosystems to absorb recurrent shocks and reassemble afterwards, escalating the
risk of widespread ecological collapse of current ecosystems and the emergence of novel
assemblages1•2,3. In marine systems, the production of larvae and recruitment of functionally
important species are fundamental processes for rebuilding depleted adult populations,
maintaining resilience and avoiding regime shifts in the face of rising environmental
pressures4•5. Here we document a regional-scale shift in stock-recruitment relationships of
corals along the Great Barrier Reef-the world's largest coral reef system-following
unprecedented back-to-back mass bleaching events caused by global warming. As a
consequence of mass mortality of adult brood stock in 2016 and 2017 owing to heat stress 6,
the amount of larval recruitment declined in 2018 by 89% compared to historical levels. For
the first time, brooding pocilloporids replaced spawning acroporids as the dominant taxon in
the depleted recruitment pool. The collapse in stock-recruitment relationships indicates that
https://www.nature.com/articles/s41586-019-1081-y 43

2/9/2021 Global warming impairs stock-recruitment dynamics of corals I Nature
the low resistance of adult brood stocks to repeated episodes of coral bleaching is inexorably
tied to an impaired capacity for recovery, which highlights the multifaceted processes that
underlie the global decline of coral reefs. The extent to which the Great Barrier Reef will be
able to recover from the collapse in stock-recruitment relationships remains uncertain, given
the projected increased frequency of extreme climate events over the next two decades 7.
a Access through your institution
Buy or subscribe
Access options
Rent or Buy
article
Get time limited or full article
access on ReadCube.
from $8.99
Rent or Buy
All prices are NET prices.
Additional access options:
Login
Access through your institution
Learn about institutional subscriptions
Data availability
Subscribe to
Journal
Get full journal access for
1 year
185,98 € only 3,65 € per issue
All prices are NET prices.
VAT will be added later in the checkout.
Source data on reef locations, adult coral abundance, recruit densities and coral reproductive
condition before and after bleaching are available online at the Tropical Data Hub
(https://tropicaldatahub.org/ with DOI: 10.25903/5c81fc323dl29).
AA
2/9/2021 Global warming impairs stock-recruitment dynamics of corals I Nature
Code availability
Computer code for statistical analyses is available from the corresponding author on request.
References
1. Scheffer, M. et al. Creating a safe operating space for iconic ecosystems. Science 347,
1317-1319 (2015).
2. Johnstone, J. F. et al. Changing disturbance regimes, ecological memory, and forest
resilience. Front. Ecol. Environ. 14, 369-378 (2016).
3. Hughes, T. P. et al. Coral reefs in the Anthropocene. Nature 546, 82-90 (2017).
4. Kleypas, J. A. et al. Larval connectivity across temperature gradients and its potential
effect on heat tolerance in coral populations. Glob. Change Biol. 22, 3539-3549 (2016).
5. Holbrook, S. J. et al. Recruitment drives spatial variation in recovery rates of resilient
coral reefs. Sci Rep. 8, 7338 (2018).
6. Hughes, T. P. et al. Global wanning transforms coral reef assemblages. Nature 556,
492--496 (2018).
7. King, A. D., Karoly, D. J. & Henley, B. J. Australian climate extremes at 1.5 °C and
2 °C of global warming. Nat. Clim. Change 7, 412-416 (2017).
8. Hughes, T. P. et al. Spatial and temporal patterns of mass bleaching of corals in the
Anthropocene. Science 359, 80-83 (2018).
9. Heron, S. F. et al. Impacts of Climate Change on World Heritage Coral Reefs: Update
to the First Global Scientific Assessment. http://whc.unesco.org/en/news/l 878 (UNESCO
World Heritage Centre, 2018).
https://www.nature.com/articles/s41586-019-1081-y 45
2/9/2021 Global warming impairs stock-recruitment dynamics of corals I Nature
10. 10. Figueiredo, J., Baird, A.H. & Connolly, S. R. Synthesizing larval competence
dynamics and reef-scale retention reveals a high potential for self-recruitment in corals.
Ecology 94, 650-659 (2013).
11. Ayre, D. J. & Hughes, T. P. Climate change, genotypic diversity and gene flow in
reef-building corals. Ecol. Lett. 7, 273-278 (2004).
12. Underwood, J. N., Smith, L. D., van Oppen, M. J. H. & Gilmour, J.P. Ecologically
relevant dispersal of corals on isolated reefs: implications for managing resilience. Ecol.
Appl. 19, 18-29 (2009).
13. Baird, A. H., Guest, J. R. & Willis, B. L. Systematic and biogeographical patterns in
the reproductive biology of scleractinian corals. Annu. Rev. Ecol. Evol. Syst. 40, 551-571
(2009).
14. Hughes, T. P. et al. Ecological memory modifies the cumulative impact of recurrent
heatwaves. Nat. Clim. Change 9, 40-43 (2019).
15. Hughes, T. P. et al. Global warming and recurrent mass bleaching of corals. Nature
543, 373-377 (2017).
16. Connell, J. H. Disturbance and recovery of coral assemblages. Coral Reefs 16, S 101-
S 113 (1997).
17. Osborne, K. et al. Delayed coral recovery in a warming ocean. Glob. Change Biol.
23, 3869-3881 (2017).
18. Connolly, S. R. & Baird, A.H. Estimating dispersal potential for marine larvae:
dynamic models applied to scleractinian corals. Ecology 91, 3572-3583 (2010).
19. Figueiredo, J., Baird, A. H. & Connolly, S. R. Increased local retention of reef coral
larvae as a result of ocean warming. Nat. Clim. Change 4, 498-502 (2014).
20.
https://www.nature.com/articles/s41586-019-1081-y 41i
2/9/2021 Global warming impairs stock-recruitment dynamics of corals I Nature
lf.atz, M. V., Treml, E. A., Aglyamova, G. V. & Bay, L. K. Potential and limits for rapid
genetic adaptation to warming in a Great Barrier Reef coral. PLOS Genet. 14, e1007220
(2018).
21. Hock, K. et al. Connectivity networks reveal the risks of crown-of-thorns starfish
outbreaks on the Great Barrier Reef. J. Appl. Ecol. 51, 1188-1196 (2014).
22. Howells, E. J., Berkelmans, R., van Oppen, M. J., Willis, B. L. & Bay, L. K.
Historical thermal regimes define limits to coral acclimatization. Ecology 94, 1078-1088
(2013).
23. Hendry, A. P. Eco-Evolutionary Dynamics (Princeton Univ. Press, New Jersey,
2016).
24. Sweatman, H., Delean, S. & Syms, C. Assessing loss of coral cover on Australia's
Great Barrier Reef over two decades, with implications for longer term-trends. Coral
Reefs 30, 521-531 (2011).
25. Loya, Y. et al. Coral bleaching: the winners and the losers. Ecol. Lett. 4, 122-131
(2001).
26. Alvarez-Noriega, M. et al. Contrasting patterns of changes in abundance following a
bleaching event between juvenile and adult scleractinian corals. Coral Reefs 37, 527-532
(2018).
27. Gilmour, J. P., Smith, L. D., Heyward, A. J., Baird, A. H. & Pratchett, M. S.
Recovery of an isolated coral reef system following severe disturbance. Science 340, 69-
71 (2013).
28. Allen, M. et al. Special Report on Global Warming of 1. 5 °C.
http:/ /www.ipcc.ch/report/srl 5/ (IPCC, 2018).
29. Australian Institute of Marine Science. Long-Term Reef Monitoring Program:
Annual Summary Report on Coral Reef Condition for 2017/18.
https:/lwww.nature.com/articles/s41586-019-1081-y 47
2/9/2021 Global warming impairs stock-recruitment dynamics of corals I Nature
https://www.aims.gov.au/reef-monitoring/gbr-condition-summary-2017-2018 (AIMS,
2018)
30. West, J.M. & Salm, R. V. Resistance and resilience to coral bleaching: implications
for coral reef conservation and management. Conserv. Biol. 17, 956-967 (2003).
31. Hughes, T. P. et al. Patterns of recruitment and abundance of corals along the Great
Barrier Reef. Nature 397, 59-63 (1999).
32. Bates, D., Maechler, M., Balker, B. & Walker, S. Fitting linear mixed-effects models
using lme4. J Stat. Softw. 67, 1-48 (2015).
33. Baird, A. H. et al. Latitudinal variation in reproductive synchrony in Acropora
assemblages: Japan vs Australia. Galaxea 11, 101-108 (2009).
Acknowledgements
We acknowledge support from the Australian Research Council's Centre of Excellence
Program (CE140100020). We thank the many dozens of student volunteers and technicians
who assisted with this research over three decades.
Reviewer information
Nature thanks James Guest, Peter Sale and the other anonymous reviewer(s) for their
contribution to the peer review of this work.
Author information
Affiliations
1. Australian Research Council Centre of Excellence for Coral Reef Studies, James Cook
University, Townsville, Queensland, Australia
https://www.nature.com/articles/s41586-019-1081-y 48
2/9/2021 Global warming impairs stock-recruitment dynamics of corals I Nature
Terry P. Hughes, James T. Kerry, Andrew H. Baird, Sean R. Connolly, Tory J. Chase, Andreas
Dietzel, Tessa Hill, Andrew S. Hoey, Mia 0. Hoogenboom, Mizue Jacobson, Allison S.
Paley, Morgan S. Pratchett & Gergely Torda
2. College of Science and Engineering, James Cook University, Townsville, Queensland,
Australia
Sean R. Connolly, Tory J. Chase, Tessa Hill, Mia 0. Hoogenboom, Mizue Jacobson & Allison
S. Paley
3. Eco-Logical, Brisbane, Queensland, Australia
Ailsa Kerswell
4 . Hawai'i Institute of Marine Biology, University ofHawai'i, Kaneohe, HI, USA
Joshua S. Madin
5. Department of Biological Sciences, Macquarie University, Sydney, New South Wales,
Australia
Joshua S. Madin & Rachael M. Woods
6. Murray-Darling Basin Authority, Canberra City, Australian Capital Territory, Australia
Abbie Mieog
7. Australian Institute of Marine Science, Townsville, Queensland, Australia
Gergely Torda
Contributions
The study was conceptualized by T.P.H., who also wrote the first draft of the paper. All authors
contributed to fieldwork and to writing subsequent drafts. J.T.K. coordinated data compilation,
analyses and graphics. S.R.C. and M.J. provided statistics and modelling advice.
https://www.nature.com/articles/s41586-019-1081-y 49
2/9/2021 Global warming impairs stock-recruitment dynamics of corals I Nature
Corresponding author
Correspondence to Terry P. Hughes.
Ethics declarations
Competing interests
The authors declare no competing interests.
Additional information
Publisher's note: Springer Nature remains neutral with regard to jurisdictional claims in
published maps and institutional affiliations.
Extended data figures and tables
Extended Data Fig. 1 Frequency distribution of the density of coral recruits, before and after mass bleaching in 2016 and 2017. In total, 1,784 settlement panels were deployed before mass bleaching (in 1996, 1997, 1998,
2004 and 2014-2016) on 47 reefs, and 977 panels on 17 reefs after mass bleaching in2017-
2018. Figure I shows the reef locations.
Extended Data Fig. 2 Recruitment of corals over time. The shared lettering (A-C) indicates recruit densities in each year that are statistically
indistinguishable, based on an analysis of variance with Bonferroni-corrected Tukey's post hoc
test. Horizontal lines show the median, boxes indicate the middle two quartiles, vertical lines
indicate the first and fourth quartiles, and data points are outliers. a, Box plots show recruit
density per settlement panel (n = 30, 55, 44, 125, 126 and 118 panels in 1996, 1997, 1998,
2016, 2017 and 2018, respectively) on Lizard Island Reef in the northern Great Barrier Reef,
before and after mass mortality of established corals in March 2016 (after the retrieval of
settlement panels in January 2016). Most values for 2017 are zero, causing the box plots to
so
2/9/2021 Global warming impairs stock-recruitment dynamics of corals I Nature
collapse. b, Box plots show average recruit density per panel on the Great Barrier Reef in
1996, 1997 and 2018 (n = 15 reefs per year, in 5 latitudinal sectors). The same 15 reefs were
resampled in 1996 and 2018; see Fig. le.
Extended Data Fig. 3 Vectors for non-metric multi-dimensional scaling analysis. Related to Fig. 2b, showing the shift in the taxonomic composition of coral recruits.
Extended Data Fig. 4 Changes in the density of coral recruits as a function of the loss or gain of adult corals. Data points represent the change in recruitment and coral cover, shown as log10(change in
recruitment) and log10(change in cover), respectively, on each of five sectors arrayed along the
length of the Great Barrier Reef. Blue lines represent the linear model fits and grey shading
represents 95% confidence intervals. a, Spawners. b, Brooders. Figure 3 shows the reef-scale
relationships.
Extended Data Fig. 5 Coral reproductive condition on the Great Barrier Reef before mass spawning in November 1995 and 2017. Data in each year were collected from the same set of ten reefs in five latitudinal sectors.
Horizontal lines show the median percentage of spawning Acropora corals that were gravid on
each reef. Boxes indicate the middle two quartiles, vertical lines indicate the first and fourth
quartiles. Reef locations are provided in the source data ( available online at the Tropical Data
Hub).
Extended Data Table 1 Model selection results for generalized linear mixed model
analysis of recruitment
Extended Data Table 2 Model estimates of mean recruitment of brooders and
spawners in each latitudinal sector, before and after the mass bleaching
Supplementary information
Reporting Summary
https://www.nature.com/articles/s41586-019-1081-y 51
2/9/2021 Global warming impairs stock-recruitment dynamics of corals I Nature
Rights and permissions
Reprints and Permissions
About this article
Cite this article
Hughes, T.P., Kerry, J.T., Baird, A.H. et al. Global warming impairs stock-recruitment
dynamics of corals. Nature 568, 387-390 (2019). https://doi.org/10.1038/s41586-019-1081-y
Received 05 August 2018 Accepted 08 March 2019 Published 03 April 2019
Issue Date 18 April 2019 DOI https://doi.org/10.1038/s41586-019-1081-y
Subjects Climate-change ecology • Ecosystem ecology
Further reading
• Coral growth, survivorship and return-on-effort within nurseries at
high-value sites on the Great Barrier Reef Lorna Howlett, Emma F. Camp[ ... ] & Sebastian C. A. Ferse
PLOS ONE (2021)
• The projected degradation of subtropical coral assemblages by
recurrent thermal stress James Cant, Roberto Salguero-Gomez[ ... ] & Lise Aubry
Journal of Animal Ecology (2021)
https://www.nature.com/articles/s41586-019-1081-y
2/0/2021 Global warming impairs stock-recruitment dynamics of corals I Nature
, • Heat stress decreases the diversity, abundance and functional
potential of coral gas emissions Caitlin A. Lawson, Jean-Baptiste Raina [ ... ] & David J. Suggett
Global Change Biology (2021)
• Evolutionary developmental biology and sustainability: A biology of
resilience Scott F. Gilbert
Evolution & Development (2021)
• Synergistic effect of catalyst and plasma on CO2 decomposition in a
dielectric barrier discharge plasma reactor Peiyu Wu, Xin Li [ ... ] & Zhenhua Li
Molecular Catalysis (2021)
Nature ISSN 1476-4687 (online)
© 2021 Springer Nature Limited
httos://www.nature.com/articles/s41586-019-1081-v 53

54
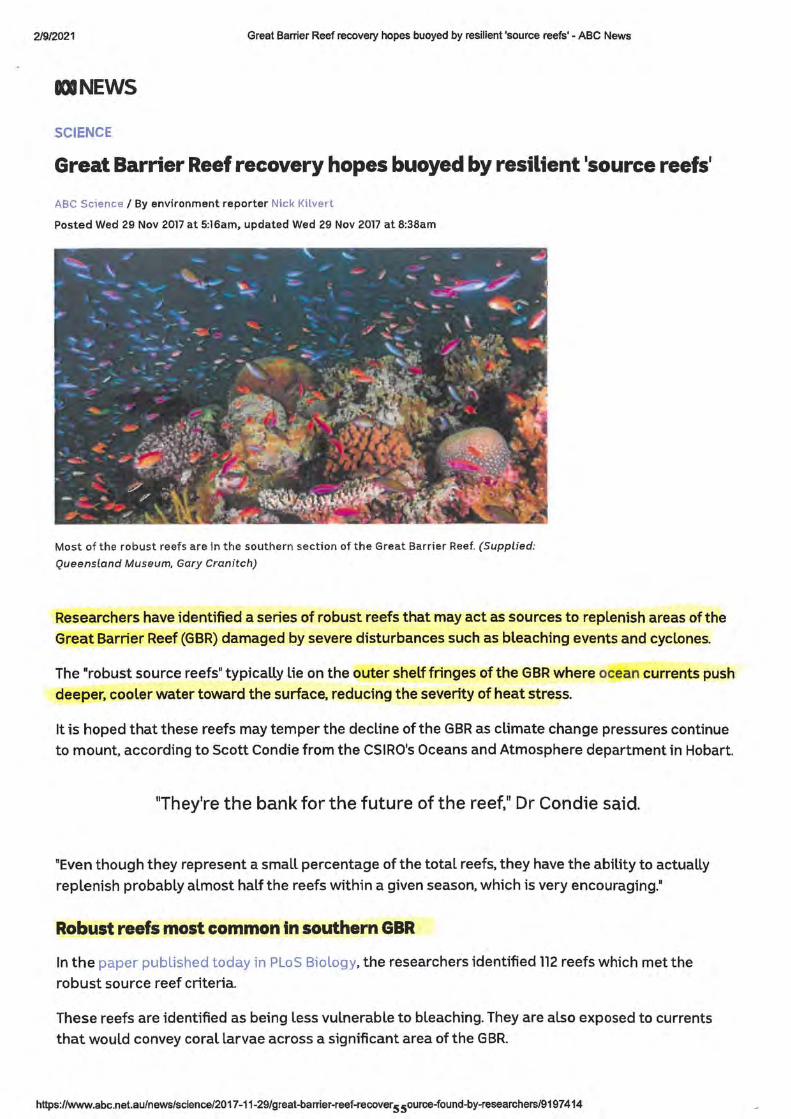
2/9/2021 Great Barrier Reef recovery hopes buoyed by resilient 'source reefs' - ABC News
IXINEWS
SCIENCE
Great Barrier Reef recovery hopes buoyed by resilient 'source reefs'
ABC Science / By environment reporter Nick Kilvert
Posted Wed 29 Nov 2017 at 5:16am, updated Wed 29 Nov 2017 at 8:38am
Most of the robust reefs are in the southern section of the Great Barrier Reef. (Supplied:
Queensland Museum, Gary Cranitch)
Researchers have identified a series of robust reefs that may act as sources to replenish areas of the Great Barrier Reef (GBR) damaged by severe disturbances such as bleaching events and cyclones.
The "robust source reefs" typically lie on the outer shelf fringes of the GBR where ocean currents push
deeper, cooler water toward the surface, reducing the severity of heat stress.
It is hoped that these reefs may temper the decline of the GBR as climate change pressures continue to mount, according to Scott Condie from the CSIRO's Oceans and Atmosphere department in Hobart.
"They're the bank for the future of the reef, 11 Dr Condie said.
"Even though they represent a small percentage of the total reefs, they have the ability to actually
replenish probably almost half the reefs within a given season, which is very encouraging.•
Robust reefs most common In southern GBR 1
In the paper published today in PLoS Biology, the researchers identified 112 reefs which met the
robust source reef criteria.
These reefs are identified as being less vulnerable to bleaching. They are also exposed to currents
that would convey coral larvae across a significant area of the GBR.
https://www.abc.net.au/news/science/2017-11-29/great-barrier-reef-recover 5 5ource-found-by-researchers/9197 414
2/9/2021 Great Barrier Reef recovery hopes buoyed by resilient 'source reefs' - ABC News
Importantly, they also have a "lower risk of conveying
a crown of thorns starfish outbreak".
Spread by larvae carried on ocean currents, similar
to coral, crown of thorns starfish has been
responsible for 50 per cent of the total GBR decline
between 1985 and 2012, according to the Australian
Institute for Marine Science.
Although robust source reefs were identified across
the length of the reef, from just north of Gladstone
to Cape York, they were only sporadically distributed
north of Townsville.
DNEWS
Severe coral bleaching hits two-thirds of Great Barrier
Reef
"There's a particular cluster offshore in the southern part of the GBR that's probably the largest area that has these characteristics," Dr Condie said.
Source reefs 'reassuring' but intervention still needed
The researchers hope their findings may be used to better streamline conservation strategies in the
future, according to lead author Karlo Hock from the University of Queensland (UQ).
"These reefs give some idea of where this local management can be targeted,• Dr Hock said.
Ramping up existing regulations in these areas, such as no-anchor zones and active removal of crown
of thorns starfish. are some management options available.
The starfish is particularly effective at decimating reefs already under stress and can totally denude
a reef of Living coral during an outbreak, UQ researcher Bernie Degnan told the ABC earlier this year.
"It depends on the density of the outbreak [but] under extreme cases you can have 150,000 animals in
a square kilometre of the reef and some of these starfish get to half a metre in diameter," Professor
Degnan said.
Although Dr Condie believes targeting starfish is a good option, he thinks it may be time to look at
more interventionist strategies.
"The situation has gotten bad enough now that we're really being forced to [look at intervention] and
the [Great Barrier Reef Marine Park Authority] is talking about options in this direction." he said.
'They could be engineering solutions like actually pumping colder water from deeper onto these reefs to stop bleaching."
Relying on source reefs to replenish the GBR from increasingly frequent stressors such as bleaching
events is not enough to ensure the long-term health of the GBR, Dr Hock agreed.
"It's reassuring that such reefs exist, but whether they continue to exist in the future is going [to
depend on] reducing carbon emissions, on limiting global effects and local management," he said.
httos://www.abc.net.au/news/science/2017-11-29/great-barrier-reef-recovers ,ource-found-by-researchers/9197 414

2/9/2021 Great Barrier Reef recovery hopes buoyed by resilient 'source reefs' - ABC News
Want more science from across the ABC?
■ Like us on Facebook
• Follow us on Twitter
• Subscribe on YouTube
https://www.abc.netau/news/sclence/2017-11-29/great-barrier-reef-recovers 70urce-found-by-researchers/9197 414

.!ill
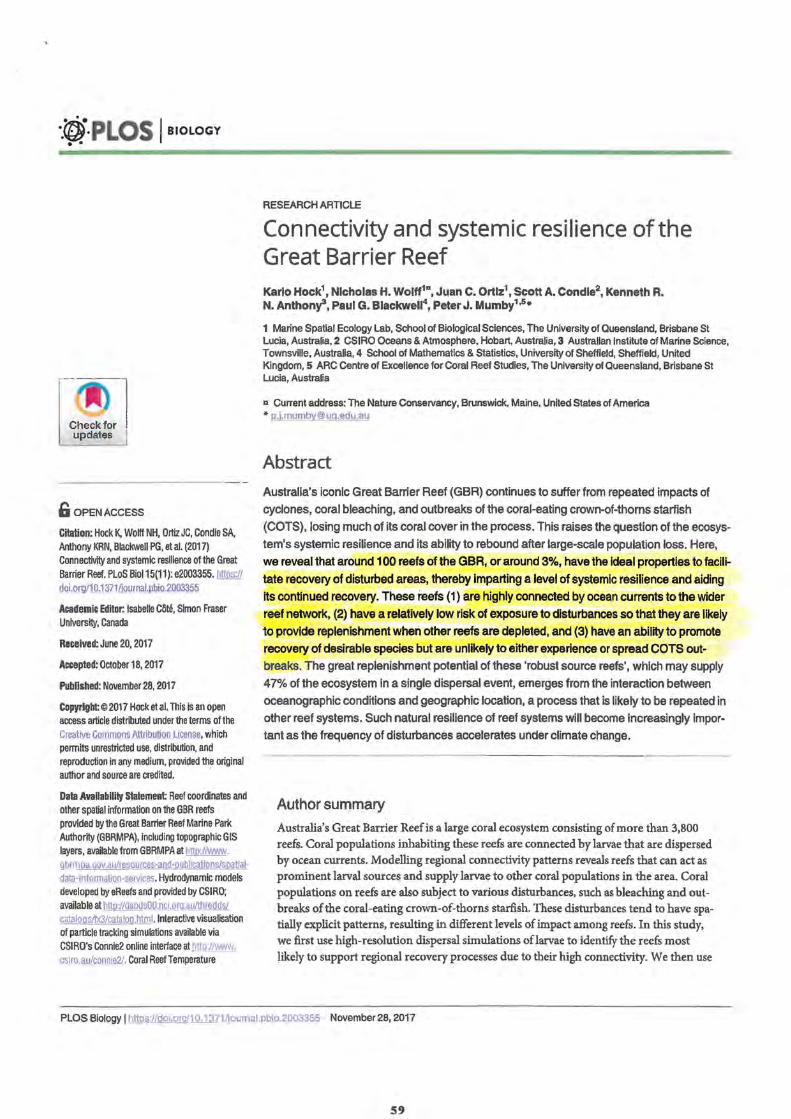
--~·PLOS I BIOLOGY . .
~ OO~fu, I updates I
D OPEN ACCESS
Citation: Hock K, Wolff NH, Ortiz JC, Condie SA, Anthony KRN, Blackwell PG, et al. (2017) Connectivi1y and systemic reslllence of the Great Barrier Reef. PLoS Biol 15(11 ): e2003355. J:!nru;j[ doi.orgf10.1371/joumal.pbio.2003355
Academic Editor: lsabefle Cote, Simon Fraser University, canada
Received: June 20, 2017
Accepted: October 18, 2017
Published: November 28, 2017
Copyright @2017 Hock et al. This is an open access article distributed under the terms of the Creative Commons Attribution License, which pennits unrestricted use, distribution, and reproduction in any medium, provided th~ original author and source are credited.
Data Availability statement: Reel coordinates and other spatial information on the GBR reefs provided by the Great Barrier Reel Marine Park Authority (GBRMPA), including topographic GIS layers, available from GBRMPA at http://www. gbrmpa.gov.au/resources-and-publications/spatialdata-information-services. Hydrodynamic models developed by eReefs and provided by CSIRO; available at http://dapdsOO.nci.org.au/thredds/ catalogs/fx3/catalog.html. Interactive visualisation of particle tracking simulations available via CSIRO's Connle2 online interface at httpJ/www. csiro.au/connie2/. Coral Reef Temperature
RESEARCH ARTICLE
Connectivity and systemic resilience of the Great Barrier Reef Karlo Hock1
, Nicholas H. Wolff1a, Juan C. Ortlz1, Scott A. Condle2, Kenneth R.
N. Anthony3, Paul G. Blackwell4, PeterJ. Mumby1
•5
•
1 Marine Spatial Ecology Lab, School of Biological Sciences, The University of Queensland, Brisbane St Lucia, Australia, 2 CSIRO Oceans & Atmosphere, Hobart, Australia, 3 Australian Institute of Marine Science, Townsville, Australia, 4 School of Mathematics & Statistics, University of Sheffield, Sheffield, United Kingdom, 5 ARC Centre of Excellence for Coral Reef Studies, The University of Queensland, Brisbane St Lucia, Austrafia
a Current address: The Nature Conservancy, Brunswick. Maine, United States of America * [email protected]
Abstract
Australia's iconic Great Barrier Reef (GBR) continues to suffer from repeated impacts of cyclones, coral bleaching, and outbreaks of the coral-eating crown-of-thorns starfish (COTS), losing much of its coral cover in the process. This raises the question of the ecosystem's systemic resilience and its abifity to rebound after large-scale population loss. Here, we reveal that around 100 reefs of the GBR, or around 3%, have the Ideal properties to facilitate recovery of disturbed areas, thereby Imparting a level of systemic resilience and aiding Its continued recovery. These reefs (1) are highly connected by ocean currents to the Wider reef network, (2) have a relatively low risk of exposure to disturbances so that they are likely to provide replenishment when other reefs are depleted, and (3) have an ability to promote recovery of desirable species but are unlikely to either experience or spread COTS outbreaks. The great replenishment potential of these 'robust source reefs', which may supply 47% of the ecosystem In a single dispersal event, emerges from the interaction between oceanographic conditions and geographic location, a process that is likely to be repeated in other reef systems. Such natural resilience of reef systems will become increasingly important as the frequency of disturbances accelerates under climate change.
--------- --
Author summary
Australia's Great Barrier Reef is a large coral ecosystem consisting of more than 3,800 reefs. Coral populations inhabiting these reefs are connected by larvae that are dispersed by ocean currents. Modelling regional connectivity patterns reveals reefs that can act as prominent larval sources and supply larvae to other coral populations in the area. Coral populations on reefs are also subject to various disturbances, such as bleaching and outbreaks of the coral-eating crown-of-thorns starfish. These disturbances tend to have spatially explicit patterns, resulting in different levels of impact among reefs. In this study, we first use high-resolution dispersal simulations oflarvae to identify the reefs most likely to support regional recovery processes due to their high connectivity. We then use
PLO$ Biology I https://doi.Q!9[10.1371/joumal.pbio.2003355 November 28, 2017
59
·."¢JJ·PLOS I BIOLOGY .. Anomaly Database (CoRTAD) available at http:// www.nodc.noaa.gov/cgi-bin/OAS/prd/accession/ details/126774, and ReefTemp data available at http://eree1td1.bom.g0v.au/ereefs/tds/catalog/ereef/ reeflemp/catalog.htm l. Addltional data files used in the mansucript are available from the Zenodo database (DOI: 10.5281/zenodo.1017925). This manuscript incorporates data which is copyright Commonwealth of Australia 2016 (Great Barrier Reef Marine Park Authority). The data has been used in this manuscript with the permission of the Great Barrier Reef Marine Park Authority on behalf of the Commonwealth. The Great Barrier Reef Marine Park Authority has not evaluated the data as altered and incorporated within this manuscript and therefore gives no warranty regarding Its accuracy, completeness, currency or suitability for any particular puJJ)ose and no liability is accepted (including without Hmitation, liability in negligence) for any loss, damage or costs (Including consequential damage) relating to any use of the data.
Funding: National Environmental Science Programme (grant 3.1.1 Implementation of the Crown of Thoms research strategy: regional strategies). Received by PJM, KH, SAC. ARC Linkage Programme (grant number LP160100730). Received by P JM. Queensland Accelerate Partnership (grant Solving Go TS on the GBR). Received by KRNA, PJM. Great barrier Reef Foundation (grant Delivering a reef resilience plan for the cairns management area through an Integrated spatial decision support environment). Received by PJM, KH, KRNA, SAC. Science and Industry Endowment Fund (grant Functioning of coral reef networks under climate change). Received by PJM, KRNA, KH. National Environmental Research Program (grant 9.1 Decision support tools to identify (and map) bleaching resistant areas within the GBRMP). Received by PJM, KRNA. The funders had no role In study design, data collection and analysis, decision to publish, or preparation of the manuscript.
Competing Interests: The authors have declared that no competing Interests exist.
Abbreviations: AMPTO, Association of Marine Park Tourism Operators; CoRTAD, Coral Reef Temperature Anomaly Database; COTS, crown-ofthoms starfish; CPUE, catch-per-unit effort; DHW, degree heating weeks; GBR, Great Barrier Reef; GBRMPA, Great Barrier Reef Marine Park Authority; RTNG, ReefTemp Next Generation.
Systemic resilience of the Great Barrier Reef
oceanographic and climate models to show which reefs are likely to have a lower risk of
exposure to coral bleaching and starfish outbreaks. Finally, we combine these results to
find reefs that are not only likely to be good sources by being well connected but also
more likely to have adult breeding stocks needed to provide the necessary larval supply.
This information can support decision-making that aims to allocate management
resources and prioritise sites important for the resilience of the entire reef system.
Introduction Marine ecosystems are characterised by high levels oflarval connectivity among populations
linked by ocean or coastal currents [JJ. Ensuring functioning and resilient ecosystems requires
that processes of connectivity are maintained, particularly when the metapopulation has been
widely depleted and individual patches must recolonise from neighbours [2]. Circumstances
oflarge-scale metapopulation depletions are commonly found on coral reefs that are vulnera
ble to mass thermal stress events that elicit coral bleaching on scales of hundreds to thousands
of kilometres [J -5]. Yet much of the science of coral reefresilience has focused on reducing
the exposure of reefs to stressful conditions, be they physical pollutants or the impacts of eco
system exploitation [~HH-While the importance of regional connectivity oflarvae is a widely
recognised process of recovery (9,10], it has rarely been operationalised for building resilient
ecosystems, although methods exist I.U ,12]. In principle, marine reserve networks might
incorporate the most important sources of replenishment with a view to promoting region
wide recovery after disturbance [12- 16]. We refer to this process as building systemic resil
ience, in the sense that protecting these sources will promote resilience of a wider system and
facilitate metapopulation recovery after major disturbances [lZ]. Much of the discussion
of systemic resilience has focused on recognizing the cascades of failures that could lead to
catastrophic transitions of the entire system to an undesirable state LIZ]. Here, however, we
focus on the recovery side of the story, looking for potential local refugia that can drive cascad
ing processes oflarge-scale recovery and provide novel intervention points for ecosystem
management.
Three criteria would need to be met to maximise the likelihood that a reef would success
fully contribute to recovery of the wider ecosystem (fig 1). First, a source population should
be able to supply other populations, including other sources, and thus make an exceptional
contribution to the recovery oflarge portions of the system. Moreover, while demographic
connections in marine systems tend to be variable and transient 118], a source should be able
to provide consistent replenishment under a variety of oceanographic conditions. Second, a source should exhibit a lower exposure to disturbances so that it can maintain the adult brood
stock required to initiate the recovery process of affected areas 112,20]. Third, a source that pri
marily helps replenishment should distribute desirable organisms but also not distribute unde
sirable organisms such as pests or invasive species [21]. Simultaneously meeting the first and
third requirements is particularly challenging because the connectivity of multiple marine taxa
is often highly correlated and driven by the same dispersal mechanisms [22], making high levels of oceanic connectivity a 'double-edged sword' that can both help and hinder recovery.
Reefs that meet all 3 criteria would confer resilience to a wider coral reef system by facilitating
rapid large-scale recovery after major disturbances. However, we are unaware of any study
into the relationship between source-sink characteristics of reefs and their exposure to distur
bances. Whereas areas of high flow and upwelling have been associated with lower risks of
coral bleaching (23]. the role of reefs as larval sources is geographically complex, integrating
PLOS Biology I https //doi.or9/10.1371 /Journal.pbio 2003355 November 28, 2017
60
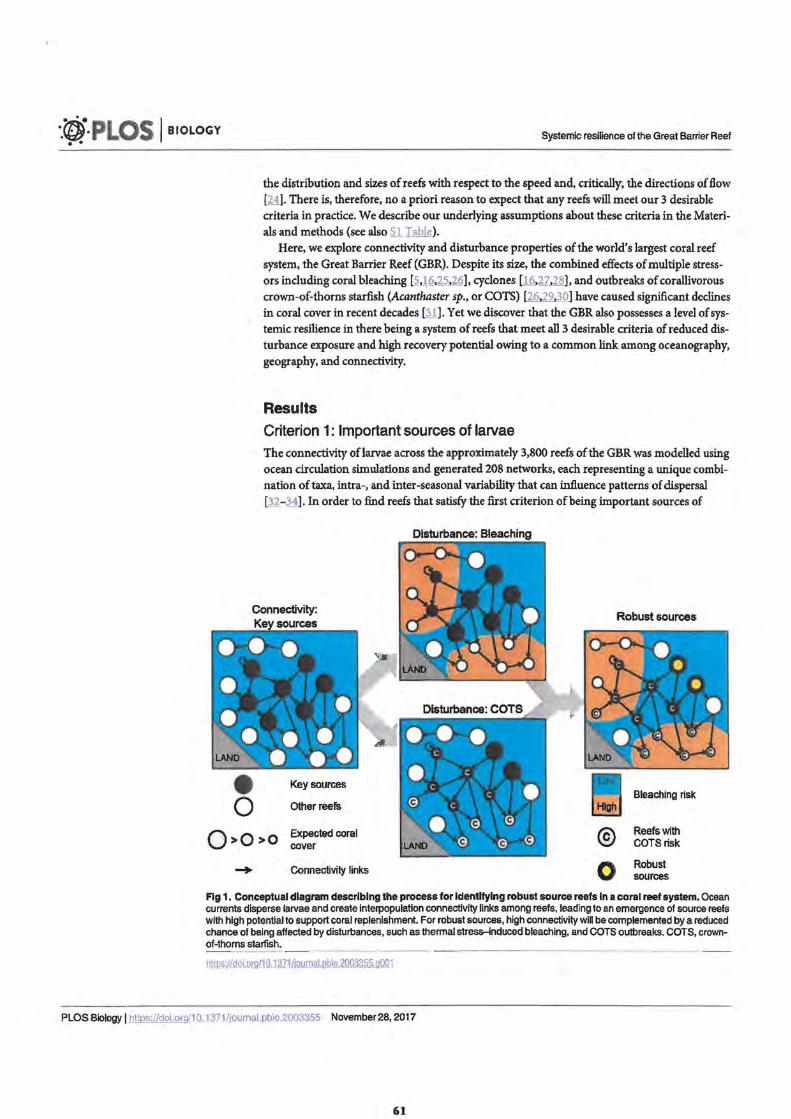
·.rtJi-PLOS I BIOLOGY .. Systemic resilience of the Great Barrier Reef
the distribution and sizes of reefs with respect to the speed and, critically, the directions of flow [24). There is, therefore, no a priori reason to expect that any reefs will meet our 3 desirable criteria in practice. We describe our underlying assumptions about these criteria in the Materials and methods (see also SI Table).
Here, we explore connectivity and disturbance properties of the world's largest coral reef system, the Great Barrier Reef (GBR). Despite its size, the combined effects of multiple stressors including coral bleaching [~,16,25,26), cyclones [l 27,28), and outbreaks ofcorallivorous crown-of-thorns starfish (Acanthaster sp., or COTS) [2.Q.29,30] have caused significant declines in coral cover in recent decades fil). Yet we discover that the GBR also possesses a level of systemic resilience in there being a system of reefs that meet all 3 desirable criteria of reduced disturbance exposure and high recovery potential owing to a common link among oceanography, geography, and connectivity.
Results
Criterion 1: Important sources of larvae The connectivity oflarvae across the approximately 3,800 reefs of the GBR was modelled using ocean circulation simulations and generated 208 networks, each representing a unique combination of taxa, intra-, and inter-seasonal variability that can influence patterns of dispersal [32- 34). In order to find reefs that satisfy the first criterion of being important sources of
Disturbance: Bleaching
Robust sources
Key sources Bleaching risk
Other reefs
O>O>O Expected coral © Reefs with cover COTS risk
-+ Connectivity links 0 Robust sources
Fig 1. Conceptual diagram describing the process for Identifying robust source reefs In a coral reef system. Ocean currents disperse larvae and create lnterpopulation connectivity links among reefs, leading to an emergence of source reefs with high potential to support coral replenishment. For robust sources, high connectivity will be complemented by a reduced chance of being affected by disturbances, such as thermal stress-induced bleaching, and COTS outbreaks. COTS, crownof-thorns starfish.
https://dQl.Jmlilil1371 /iournal.pbio.2003355.o001
PLOS Biology I https://doi.org/10.1371/journal.pbio.2003355 November 28, 2017
61
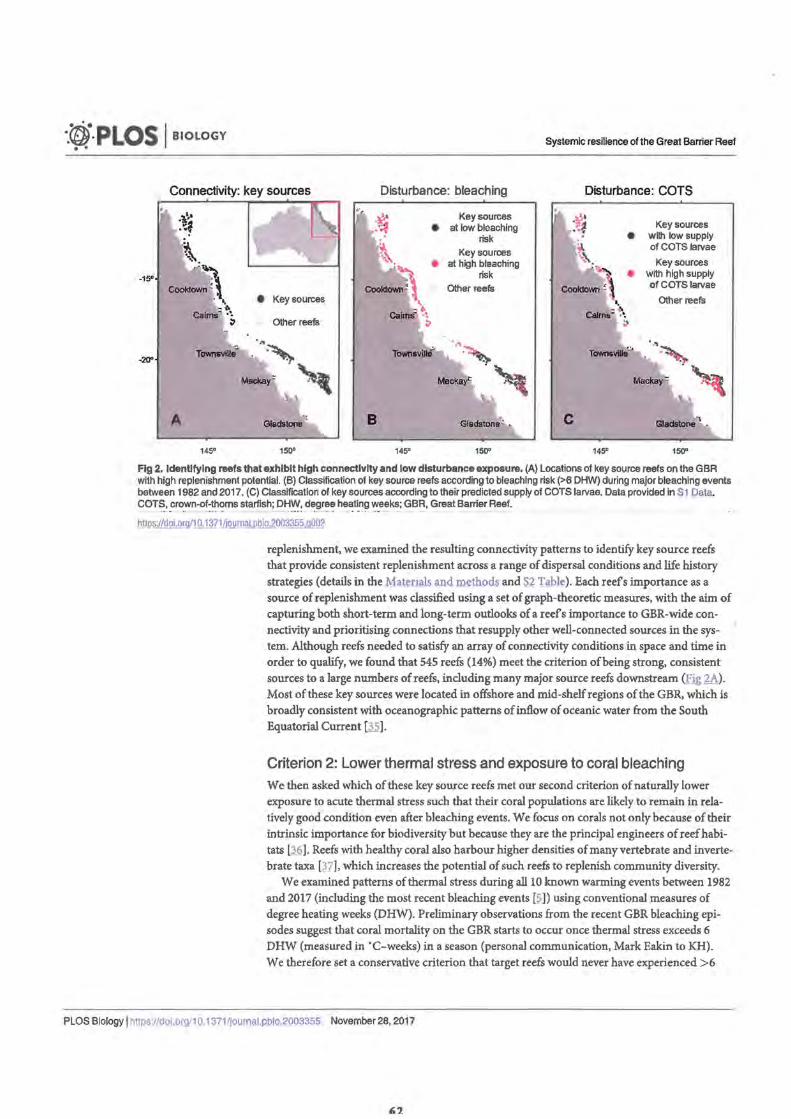
·.<fit PLOS I BIOLOGY Systemic resilience of the Great Barrier Reef
Connectivity: key sources Disturbance: bleaching Disturbance: COTS
A
145°
• Key sources
Other reefs
Glads101111 .
1so•
•· .,;,• :-~ ~ ~~
-~ Coolcaown-' \
~
Calm ~~ ~
Key sources • at low bleaching
risk Key sources
e at high bleaching risk
Other reefs
· ... TownavUl1i ~
Mackay" . • "
B Gladstone'
145° 150"
C
• Key sources
with low supply of COTS larvae
Key sources • with high supply
of COTS larvae
Other reefs
TOW115ville"" • ·" ' '-- ~ Mackay" _ ."'
!31aclllone1.
145° 150"
Fig 2. Identifying reefs that exhibit high connectivity and low disturbance exposure. (A) Locations of key source reefs on the GBR with high replenishment potential. (B) Classification of key source reefs according to bleaching risk (>6 DHW) during major bleaching events between 1982 and 2017. (C) Classification of key sources according to their predicted supply of COTS larvae. Data provided in S1 Data. COTS., _cr~wn-of~th~ms starfish; DH~'. degre~ he~t(ng "'.l'._e_eks; GBR, Great Barrier Reef.
!Jlli!s://doi.orq/10.13?1fiournal.pbio.2003355.g002
replenishment, we examined the resulting connectivity patterns to identify key source reefs that provide consistent replenishment across a range of dispersal conditions and life history strategies (details in the Matenals and method~ and S2 Table). Each reefs importance as a source of replenishment was classified using a set of graph-theoretic measures, with the aim of capturing both short-term and long-term outlooks of a reefs importance to GBR-wide connectivity and prioritising connections that resupply other well-connected sources in the system. Although reefs needed to satisfy an array of connectivity conditions in space and time in order to qualify, we found that 545 reefs {14%) meet the criterion of being strong, consistent sources to a large numbers of reefs, including many major source reefs downstream (Fig 2A). Most of these key sources were located in offshore and mid-shelf regions of the GBR, which is broadly consistent with oceanographic patterns of inflow of oceanic water from the South Equatorial Current [35].
Criterion 2: Lower thermal stress and exposure to coral bleaching We then asked which of these key source reefs met our second criterion of naturally lower exposure to acute thermal stress such that their coral populations are likely to remain in relatively good condition even after bleaching events. We focus on corals not only because of their intrinsic importance for biodiversity but because they are the principal engineers of reef habitats (36]. Reefs with healthy coral also harbour higher densities of many vertebrate and invertebrate taxa [IZ], which increases the potential of such reefs to replenish community diversity.
We examined patterns of thermal stress during all 10 known warming events between 1982 and 2017 (including the most recent bleaching events (51) using conventional measures of degree heating weeks (DHW). Preliminary observations from the recent GBR bleaching episodes suggest that coral mortality on the GBR starts to occur once thermal stress exceeds 6 DHW (measured in "C-weeks) in a season (personal communication, Mark Eakin to KH). We therefore set a conservative criterion that target reefs would never have experienced >6
PLOS Biology I ht!P~fgoi.org_/1 Q.1371 ijoumal.pbio.2003355 November 28, 2017
·.{lji·PLOS ·I BIOLOGY .. Systemic resHlence of the Great Barrier Reef
DHW during the full 36-year time series. Across the entire GBR, 1,258 reefs (33%) met this condition. Of the 545 'key source' reefs identified under the first criterion, 45% (245) also met the second criterion of being a refuge from thermal stress (~ ).
It is worth noting that while elevated sea temperature is the primary cause of coral bleaching, areas that experience eutrophication can also have an elevated risk of bleaching [38), although this will not necessarily always be the case [.!i]. Importantly, the offshore location of the identified 'cool' source reefs would also limit their exposure to terrestrial runoff [J.2.), which reinforces the notion oflow bleaching risk on these reefs.
Criterion 3: Lower risk of conveying COTS outbreaks Our third criterion for an ideal source of coral replenishment is that the reef disperses larvae of desirable species (e.g., coral) rather than pests. COTS are the most important pest on the GBR, and their outbreaks are a system-wide problem [26). Large numbers of adult COTS found during outbreak conditions can strip a reef of its corals (30,40). Ocean currents then spread the starfish larvae from reefs with ongoing outbreaks, causing large-scale outbreak events which eventually lead to widespread decline in coral [JQ,.ll,41 ). Ha reef important for coral replenishment is exposed to COTS larvae and experiences an outbreak, it could simultaneously lose its value as a source of coral larvae and exacerbate the widespread coral loss by serving as a hub for dispersing COTS larvae. Clearly, such characteristics would be at odds with the role oflarval sources important for promoting coral recovery.
To assess the risk that potential sources of coral replenishment might also double as harmful sources of COTS larvae, we began by using recent COTS population surveys to validate the predictions of a COTS connectivity model. Because the dispersal simulated in our models (2008-2013) immediately predates the period of intense COTS surveys (2013-2015), reefs predicted to have received more COTS larvae should have higher population densities of adult COTS owing to progressive buildup of COTS populations (30) and have adult COTS densities that imply an active COTS outbreak [42]. We performed a classification analysis contrasting the predicted larval supply against field survey observations to determine the threshold for influx of COTS larvae below which reefs would be unlikely to experience COTS outbreaks (see Materials and methods; SI Fig). We found that reefs predicted to be consistently in the bottom 30th percentile according to relative larval supply only had an 8% chance of being in an outbreak state. Thus GBR reefs were divided into 2 categories-'low' and 'high' -with respect to the risks of a COTS outbreak linked to relatively high larval supply. As expected, surveyed reefs with high predicted supply of COTS larvae had higher population densities of adult COTS, experiencing on average 4 times higher maximum adult densities (N = 137, t = 4.6, p < 0.0001; Fig 3A and 3B; S3 Table; external import oflarvae was the only significant predictor in the model). Also, the odds ratio that reefs with high import oflarvae will have outbreaks versus those with low import was 14.6. This validation of our models was also supported by analysis of a second dataset from COTS eradication efforts, which showed the same pattern of higher densities of COTS adults on reefs with high predicted supply of COTS larvae {S4 Table). We conclude that the reefs in the bottom 30% in terms of relative larval supply satisfied the third criterion of having low risk of experiencing COTS outbreaks, and therefore also presented a lower risk of becoming sources of COTS larvae in the system.
Given that our model of COTS dispersal has empirical support, we then evaluated the risk that key source reefs that satisfied the first criterion would become supplied with COTS larvae and experience an outbreak. Despite the fact that key sources were identified on account of their high downstream connectivity for multiple taxa, nearly half ( 48%, or 262) of them were found to have low upstream connectivity and therefore a low risk of becoming hubs of COTS
PLOS Biology I https://doi.org/10.1371jjournal.pbio.2003355 November 28, 2017
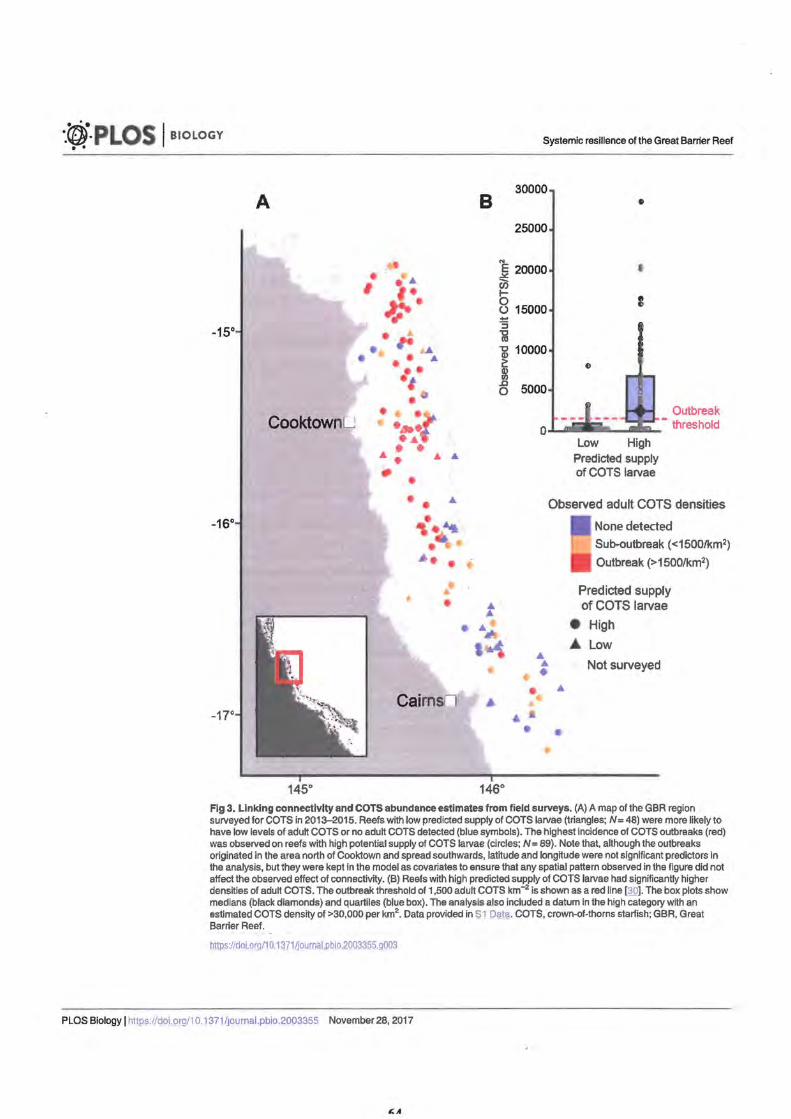
·.@9-PLOS I BIOLOGY .. Systemic resilience of the Great Barrier Reef
30000 A B •
25000
N
~ 20000 • • . .. , en • ~ ~· 8 15000 g ... :!:
-15° :I . .. i . ,. j 10000
• • .. 2: •• 3l ., .c 5000 0 • • • Outbreak
CooktownL; ..... 0 - threshold .... Low High ... . • • .. ... Predicted supply -• of COTS larvae
• • .. Observed adult COTS densities
-16° • ,.~ None detected
• Sub-outbreak ( <1500/km2)
•• • Outbreak (>1500/km2)
"' Predicted supply • • ... of COTS larvae ... • ... e High
'~ A Low ... ... Not surveyed • • ...
Cairn n I,,.
-17° • • • •
145° 146°
Fig 3. Linking connectivity and COTS abundance estimates from field surveys, (A) A map of the GBR region surveyed for COTS in 2013--2015. Reefs with low predicted supply of COTS larvae (triangles; N = 48) were more likely to have low levels of adult COTS or no adult COTS detected (blue symbols). The highest incidence of COTS outbreaks (red) was observed on reefs with high potential supply of COTS larvae (circles; N = 89). Note that, although the outbreaks originated in the area north of Cooktown and spread southwards, latitude and longitude were not significant predictors in the analysis, but they were kept in the model as covariates to ensure that any spatial pattern observed in the figure did not affect the observed effect of connectivity. (B) Reefs with high predicted supply of COTS larvae had significantly higher densities of adult COTS. The outbreak threshold of 1,500 adult COTS km-2 is shown as a red line(~ ]. The box plots show medians (black diamonds) and quartiles (blue box). The analysis also included a datum in the high category with an estimated COTS density of >30,000 per km2
• Data provided in $1 Qata. COTS, crown-of-thorns starfish; GBR, Great Barrier Reef.
h!!J>s://doi. or_g/10.1 :IT1oourna1J)bi o 2003~g_._g_Q03
PLOS Biology I https://d9i,9r.9/10.1371/Journal.pbio.2003355 November 28, 2017
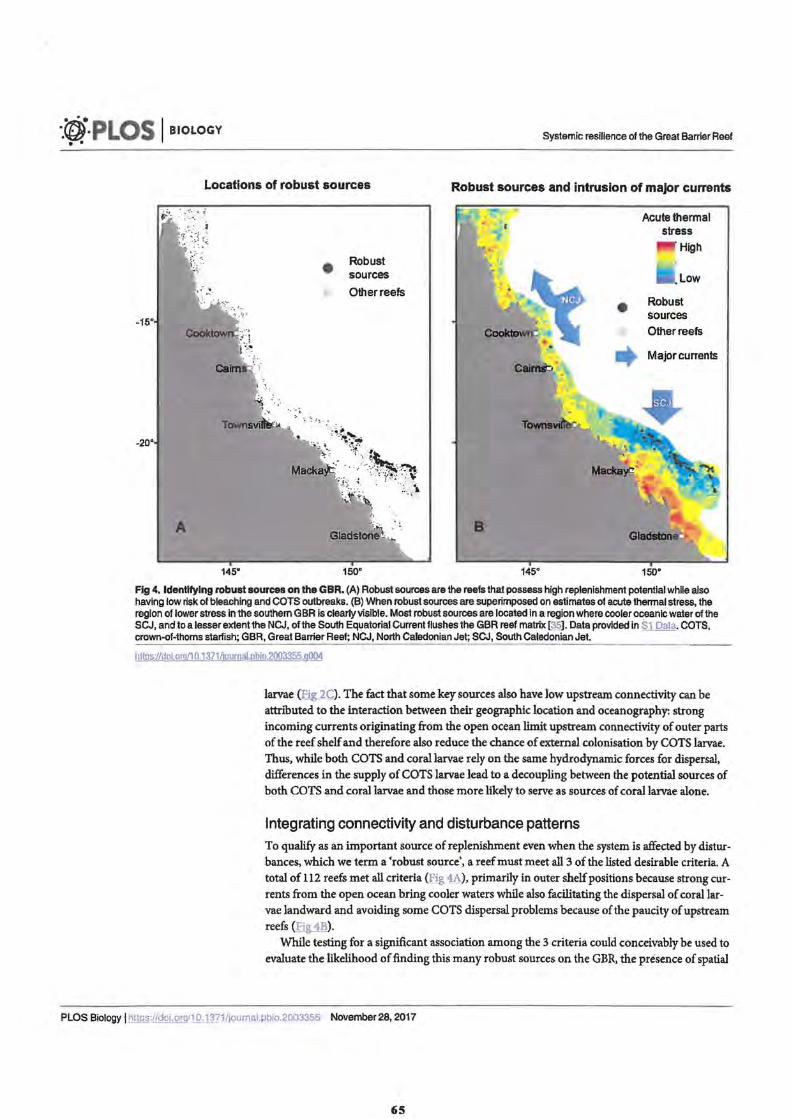
·-~·PLOS I BIOLOGY . . Systemic resilience of the Great Barrier Reef
-15°
-20°
A
Locations of robust sources
145"
• Robust sources
Other reefs
M~:::~u \.~'':\ -
Gladst~ ,~
150°
Robust sources and Intrusion of major currents
145"
•
Acute thermal stress
High
Low
Robust sources
Other reefs
• Majorcurrents
150"
Fig 4. Identifying robust sources on the GBR. (A) Robust sources are the reefs that possess high replenishment potential while also having low risk of bleaching and COTS outbreaks. (B} When robust sources are superimposed on estimates of acute thennal stress, the region of lower stress in the southern GBR is clearly visible. Most robust sources are located in a region where cooler oceanic water of the SCJ, and to a lesser extent the NCJ, of the South Equatorial Currentflushes the GBR reef matrix ~ -Data provided in S1 Data COTS, crown-of-thorns starfish; GBR, Great Barrier Reef; NCJ, North Caledonian Jet; SCJ, South Caledonian Jet.
https://doi.org/10.1371/joumal,pbio.2003355.q004
larvae (Fig 2C). The fact that some key sources also have low upstream connectivity can be attributed to the interaction between their geographic location and oceanography: strong incoming currents originating from the open ocean limit upstream connectivity of outer parts of the reef shelf and therefore also reduce the chance of external colonisation by COTS larvae. Thus, while both COTS and coral larvae rely on the same hydrodynamic forces for dispersal, differences in the supply of COTS larvae lead to a decoupling between the potential sources of both COTS and coral larvae and those more likely to serve as sources of coral larvae alone.
Integrating connectivity and disturbance patterns To qualify as an important source of replenishment even when the system is affected by disturbances, which we term a 'robust source', a reef must meet all 3 of the listed desirable criteria. A total of 112 reefs met all criteria (Fig 4A), primarily in outer shelf positions because strong currents from the open ocean bring cooler waters while also facilitating the dispersal of coral larvae landward and avoiding some COTS dispersal problems because of the paucity of upstream reefs (Fig 4B).
While testing for a significant association among the 3 criteria could conceivably be used to evaluate the likelihood of finding this many robust sources on the GBR, the presence of spatial
PLOS Biology I https://doi.org/10.1371/)ournal.pbio.2003355 November 28, 2017
65
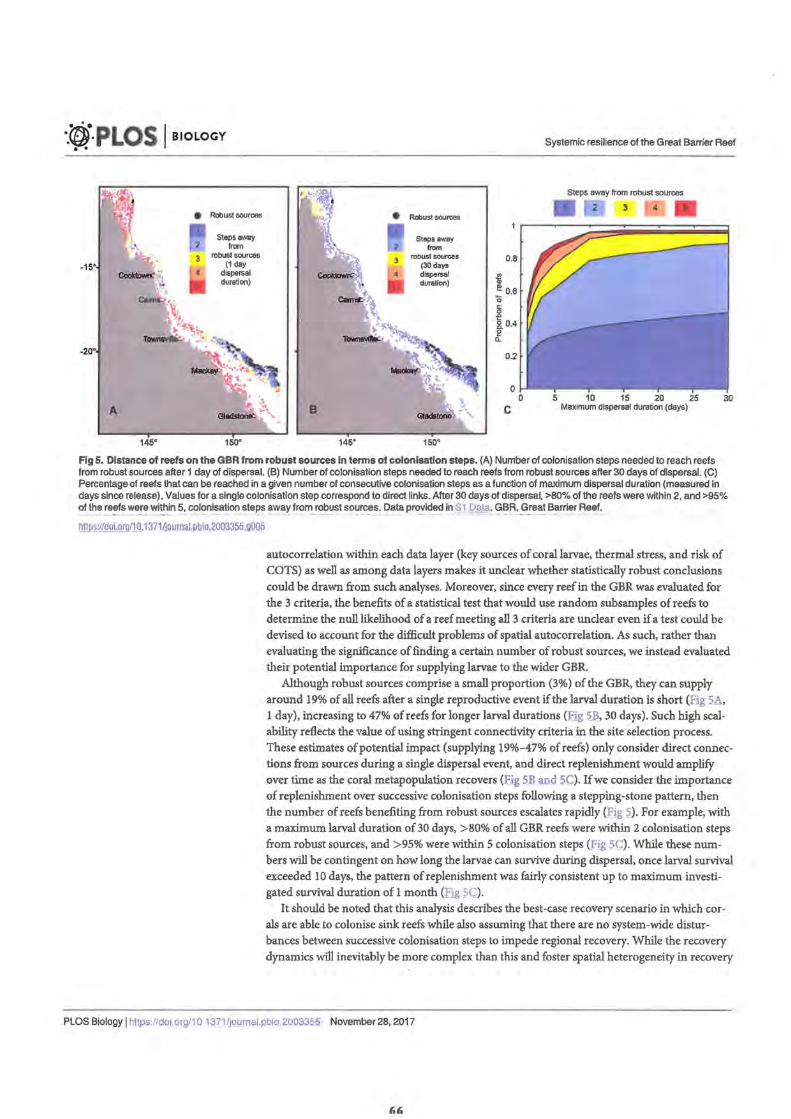
·.@··PLOS I BIOLOGY . .
• Robust sources
steps11YNay 2 from
-15' 3 robust soura>s
(1 day 4 dispel'ial
duration)
-20"
A
145' 150' 145'
• Robust sources
StepsllWSY 2 from
3 robust sources
(30 days dispersal duration)
4
150°
0.8
ls io.4 e Q.
0.2
0
C
Systemic resilience of the Great Barrier Reef
Steps away from robust sources •
0 5 10 15 20 25 30 Maximum dispersal duration (days)
Fig 5. Distance of reefs on the GBR from robust sources In tenns of colonisation steps. (A) Number of colonisation steps needed to reach reefs from robust sources after 1 day of dispersal. (B) Number of colonisation steps needed to reach reefs from robust sources after 30 days of dispersal. (C) Percentage of reefs that can be reached in a given number of consecutive colonisation steps as a function of maximum dispersal duration (measured in days since release). Values for a single colonisation step correspond to direct links. After 30 days of dispersal, >80% of the reefs were within 2, and >95% of the re~fs we.'!. wi~in 5, colonisation steps away from_robust sources. Data provided in S1 Data. G~R, Great Barrier Reef.
!Jlli1s://doi.org/10.1371/journal.pbio.2003355.gOOS
autocorrelation within each data layer (key sources of coral larvae, thermal stress, and risk of COTS) as well as among data layers makes it unclear whether statistically robust conclusions could be drawn from such analyses. Moreover, since every reef in the GBR was evaluated for the 3 criteria, the benefits of a statistical test that would use random subsamples of reefs to determine the null likelihood of a reef meeting all 3 criteria are unclear even if a test could be devised to account for the difficult problems of spatial autocorrelation. As such, rather than evaluating the significance of finding a certain number of robust sources, we instead evaluated their potential importance for supplying larvae to the wider GBR.
Although robust sources comprise a small proportion (3%) of the GBR, they can supply around 19% of all reefs after a single reproductive event if the larval duration is short (Eig 5A, 1 day), increasing to 47% of reefs for longer larval durations (Eig 5B, 30 days). Such high scalability reflects the value of using stringent connectivity criteria in the site selection process. These estimates of potential impact (supplying 19%-47% of reefs) only consider direct connections from sources during a single dispersal event, and direct replenishment would amplify over time as the coral metapopulation recovers (Fig SB and 5C). Ifwe consider the importance of replenishment over successive colonisation steps following a stepping-stone pattern, then the number of reefs benefiting from robust sources escalates rapidly (Eig 2). For example, with a maximum larval duration of 30 days, >80% of all GBR reefs were within 2 colonisation steps from robust sources, and >95% were within 5 colonisation steps (.fig 5C). While these numbers will be contingent on how long the larvae can survive during dispersal, once larval survival exceeded 10 days, the pattern of replenishment was fairly consistent up to maximum investigated survival duration of 1 month (Elg 2C).
It should be noted that this analysis describes the best-case recovery scenario in which corals are able to colonise sink reefs while also assuming that there are no system-wide disturbances between successive colonisation steps to impede regional recovery. While the recovery dynamics will inevitably be more complex than this and foster spatial heterogeneity in recovery
PLOS Biology I 11ttps·//goI org/1 O 1 ~71 /jo_uJnal.pbio 2003355 November 28, 2017
·.~··PLOS I BIOLOGY . . Systemic resilience of the Great Barrier Reef
rates, consistently high connectivity of robust sources across multiple spawning seasons and life history traits makes them the most likely candidates to fulfil this role in the system.
Discussion While the GBR benefits from one of the most ambitious sets of no-take reserves for coral reefs [ 43 ], we find that it also has an inherent level of systemic resilience: a set of robust source reefs that are positioned to facilitate processes of coral recovery throughout much of the wider ecosystem. This list of around 100 reefs is both a tangible and feasible set of intervention points to form part of a strategy for maintaining the systemic resilience of an ecosystem that is thousands of kilometres in scale. While the presence of such reefs on the GBR is encouraging, the fact that only 3% of the reefs meet all 3 criteria underlines the need for effective local protection and reduction of global stressors in order to support their ongoing role in the ecosystem. Given that larval transport and thermal bleaching are important characteristics of coral reef ecosystems worldwide, similar synergistic effects of ocean circulation are likely to be observed in other coral reef systems.
A potential drawback of high flow and advection at source reefs is a reduction in the level of larval retention. Indeed, local retention in 80% of robust sources was lower than the GBR median S2 Fi ). Whether such reductions might compromise the recovery rate of robust sources is unclear, although their relatively low exposure to thermal stress implies that recovery would be required infrequently.
Interestingly, robust sources seem to have relatively little exposure to another major source of disturbance: cyclones. The spatial distribution of robust sources shows little congruence with cyclone risk ~ ]. which is greatest in the central GBR where the density of robust sources is low (S3 Fig). This implies, firstly, that the term 'robust sources' as used here is relevant in the context of cyclone disturbance as well as thermal stress. Secondly, while regions experiencing frequent cyclone damage are associated with fewer robust sources, it is important to bear in mind the large-scale colonisation potential of robust sources for the wider coral reef network, in which only 3% of reefs have the potential to supply 15 times as many reefs in a single dispersal event (Fig 5). Thus, while stochastic cyclones will inevitably 'decommission' several robust sources at any given time, the geographic spread and strength of the network should help mitigate such impacts.
Although robust sources have been identified across the GBR, a distinct cluster occurs in the south. When considering the combined spatial patterns of exposures to multiple stressors, the offshore parts of the southern GBR appear to be a regional refuge, notably from recent bleaching and COTS outbreaks that primarily affected the northern regions [.2_,30], as well as from cyclones S3 Fi ). That this region also possesses many robust sources implies that the southern GBR is likely to be exceptionally resilient and also positioned to stimulate recovery elsewhere (Fig 5). Although not explicitly considered here, this region is also less likely to be affected by local anthropogenic impacts such as decreased water quality caused by agricultural runoffs from rivers, as it tends to be located far offshore where the effects of poor water quality should be less pronounced [39,44-47]. However, global-scale stressors such as changes in carbonate chemistry owing to ocean acidification [48,49] or changes in ocean current patterns [50,51] might yet have a notable effect on the GBR's systemic resilience.
We build on the applications of graph theory in conservation and the role of connectivity in metapopulation persistence. A key focus in many literature examples has been to identify metapopulation network robustness to random perturbations and the identification of cutnodes that maintain system coherence [33,52- 57]. We extend these approaches by proposing specific sites of importance based on spatial heterogeneity in both connection strength and
PLOS Biology I https://doi.org/10.137Moumal.pbio.2003355 November 28, 2017
67
·.~·PLOS I BIOLOGY Systemic resilience of the Great Barrier Reef
stress rather than on random perturbations. Another application of graph theory and connectivity has been to disrupt the spread of pests, pathogens, and invasive species [41 ,!?1!- 62]. We do not address the question of how to disrupt COTS here, but future studies might provide an integrated approach that attempts to optimize the maintenance of system recovery (this paper) while simultaneously attempting to disrupt pests like COTS. In the meantime, it would be prudent to prioritise protection from anthropogenic and other manageable stressors, including fishing [~ ,64], anchoring, and COTS to ensure that the resident coral populations on robust sources continue to play a role in system replenishment Fortunately, robust sources are already overrepresented in the current set of no-take zones of the GBR: the current zoning plan [ 65], which affords no-take status to 33% of reef area and 27% of individual reefs, includes 46% of all robust sources in its no-take regions (S1 Hg).
The approach described here attempts to operationalize the idea of systemic resilience in a marine system [ 17], as failures in recruitment may result in a cascade of failures across the system [ 66]. The science of systemic resilience is fairly young and lacks firm guidelines; here, we opted to use stringent criteria that resulted in 3% of reefs being designated as robust sources. Yet, many reefs will remain moderately functional even if they fail to meet our strict criteria [1,25,27]. Thus, future work will consider how systemic resilience attenuates as the underlying criteria are relaxed. Equally, estimates of systemic resilience will need to consider additional stressors, including water quality, biogeochemistry, and differences in key ecosystem processes (e.g., herbivory) and reef-level coral community composition as such data become available and integrated with ecological models.
Our approach implicitly assumes that coral larvae emanating from reefs that experience relatively low thermal stress are able to replenish populations subjected to higher thermal stress. This assumption has never been tested formally, though it seems reasonable. Supporting evidence includes the fact that coral populations disperse over broad thermal environments on both ecological [12] and evolutionary [67] scales and that juvenile corals appear to be particularly robust to thermal stress [68]. Moreover, transgenerational plasticity may generate hardier offspring, providing that corals can survive long enough to reproduce[@ ). Yet, contrary mechanisms might include genetic adaption to lower stress levels in robust sources [?_Q] and genetic homogenization as total population size declines [21].
That we identified a series of reefs that appear to play a disproportionately important role in driving regional recovery does not imply that the GBR, and its robust sources, will be immune to future disturbances. For example, while robust sources have had demonstrably lower risk of thermal stress over the past 36 years, the efficacy of their role will likely change in the future. The GBR has recently experienced major bleaching events over 2 consecutive years (southern hemisphere summers of2015-2016 and 2016-2017), the first of which had an unprecedented spatial pattern, severely affecting the northern reef for the first time [~]. Indeed, the paucity of robust sources in this region reflects the impact of the anomalous 2016 bleaching event. Thus, a key objective for future analyses is to estimate the spatial patterns and return times of major bleaching events and their potential impact on the functioning of the GBR as a resilient system. This is a daunting challenge, as it requires careful downscaling of global climate models that are currently unable to resolve meaningful spatial patterns of future warming on a GBR scale [72].
Validating predictions of systemic resilience is challenging. Formal tests would require simultaneous data on the dynamics of multiple source-sink reefs, yet less than 3% of reefs are actively monitored (albeit, in the largest monitoring effort of any coral reef system). Rather, we must rely on the efficacy of the inputs-each of which have experienced some level of testing in their own right-and the conservative way in which criteria were applied (see also Sl Ta.bk). Firstly, while there has never been an empirical demonstration of the ability of a coral
PLOS Biology\ https //doi or.9/101371/Journal.pbio.2003355 November 28, 2017
68
·.(Fjf·PLOS I BIOLOGY .. Systemic resmence of the Great Barrier Reef
connectivity model to predict demographic effects and realized larval supply, there have been a number of studies to test the predictions of oceanographic particle dispersal models for predicting coral gene flow (67,Zl], which found high-albeit imperfect-levels of congruence between models and population data, especially in identifying areas of restricted gene flow. Secondly, DHW has been a widely used metric for exploring the effects of thermal stress on coral assemblages and, although low levels ofDHW may be associated with bleaching, they tend to elicit limited coral mortality [1,74- 76]. There is, however, scope to improve the functioning of algorithms to predict the likelihood of coral mortality, such as including the effects of solar radiation and recent thermal trajectories [77]. Finally, in this paper we evaluated the efficacy of connectivity models to predict COTS dispersal dynamics though comparisons with field observations of emergent COTS outbreaks. We point out that advances in the use of machine learning and other tools (e.g., semiautomated image analysis, especially when combined with citizen science initiatives [Zfil), will likely provide a greater opportunity to test model projections in the future.
Our discovery of systemic resilience in the form of reefs with high recovery potential complements another recently discovered resilience mechanism: pulses of warm water that precede major thermal stress and help prepare corals to tolerate heat stress and diminish the impacts of bleaching [77]. Although the protective role of prewarming pulses is projected to weaken and possibly even disappear under business-as-usual greenhouse gas emissions, robust sources are likely to be some of the most persistent sources of replenishment because of their low susceptibility to warming events. Yet, uncertainty about disturbance patterns means that the importance of mitigating greenhouse gas emissions remains vital for ensuring prolific corals in the GBR' s future ~ ]. Furthermore, since reef recovery is not only driven by larval supply, postsettlement processes at sinks may strongly determine successful recruitment and growth [22,80]. Therefore, local practices to improve water quality [~-m. stabilise rubble (81], and avoid ecosystem overfishing of herbivores (63,64,80], as well as global initiatives to reduce the ultimate burdens on reefs, such as human impacts on the environment and climate [Zl,82,83], all have a role to play in assisting successful coral recovery. The importance of supporting such natural recovery processes will likely increase in the future as climate change reduces the average size of coral populations and the need for recolonization becomes more frequent.
Materials and methods
Design of dispersal and connectivity models To obtain patterns of population connectivity across the GBR, Lagrangian dispersal simulations were performed using Connie2, a high-resolution advection/diffusion oceanographic model of the entire GBR region. The technical aspects of the hydrodynamic dispersal model have been previously described in detail and published elsewhere (see also www.csiro.au/ connie2/ for a web interface) [11,84]. In the simulations, individual reefs of the GBR were represented as the convex polygons that encompassed all GIS coordinates that define the actual GBR reefs [11]. To account for inter- and intra-seasonal differences in oceanographic circulation, dispersal was simulated for 16 distinct spawning events (4 spawning events per summer, i.e., December to March, for 2008-2009, 2010-2011, 2011-2012, and 2012-2013). To obtain a connectivity network for a specific spawning event, 10 dispersal simulations of 103 particles each were run for each of the 3,806 reef polygons. Spatial displacement of particles was resolved in hourly intervals using the fourth-order Runge-Kutta scheme that advected the particles across raster grid with 4 km resolution of oceanographic forces. Particles were dispersed passively by the oceanographic forces (complex swimming or homing behaviours were not explicitly modelled) and were also considered to be negatively buoyant (dispersed at a constant
PLOS Biology I https://doi.org/10.1371/journal.pbio.2003355 November 28, 2017
69
·.(til-PLOS I BIOLOGY . . Systemic resilience of the Great Barrier Reef
depth of 0.5 m; although particles remained negatively buoyant during dispersal, the underlying oceanographic model included 3-dimensional representation of currents, e.g., upwelling, that could affect horizontal displacement of particles). This dispersal modelling framework has previously been successfully employed to infer COTS dispersal patterns on the GBR [41 ,61]. The current set of simulations was substantially expanded to cover a much broader range of dispersal characteristics and spawning events.
While the majority of connectivity models have focused on static connectivity relationships, in many ecosystems where dispersal relies on ephemeral forces, such as marine larvae dispersed by ocean currents, connectivity tends to be highly variable and transient [ 18]. In order to identify sources that help with recovery of the wide range of coral reef organisms and conditions, we designed our models to be inclusive of a wide range of life history characteristics. Larval survival and competency can be affected by numerous factors, many of which have only been ascertained in laboratory conditions and may be very different in the field [22,34]. Even within a taxon, dispersal potential can vary both between and within seasons with parameters such as temperature and nutrient availability but also due to more ephemeral conditions like river outflows that dynamically affect larval survival and competency [i9,34]. Using a fixed set of parameters for each species therefore means obtaining a connectivity pattern of a species that may only represent dispersal patterns under a specific set of conditions while ignoring all other possible combinations. To address these complexities with our models, we opted to base our analyses on a wide range of competency curves and spawning times rather than use a few parameter combinations to explicitly characterise individual species (as noted later, we used a certain range of these parameters, rather than specific values, for COTS).
Gamma functions were used to model larval competency (all scale parameters equal to l; see S2_ Table for shape parameters). Three different daily mortality rates (constant rates of0.05, 0.1, and 0.2) were tested to cover a range of empirically determined values for invertebrate larvae [85]. Since most of the connectivity measures were relative (for example, determining whether a reef had stronger or weaker connectivity links than average), connectivity results were found to be robust for the range of mortality rates, with the same reefs being identified as key sources in 95% of the cases. Mortality rate of 0.1/day was used in the presented analyses. Parameter values for larval competency and mortality were then combined to define 13 different survival-competency curves for each of the 16 spawning events. These curves were diverse enough to represent life histories of different organisms, from those whose larvae only remain competent for a few days to those whose larvae can spend weeks in the water column.
Inclusion of competency and mortality made it possible to treat the individual particles not as individual larvae, but rather as a pool oflarvae that were competent and surviving at any point in time that could disperse from the source along the recorded trajectory. The proximity of particles to reefs was checked every 12 hours after release. When a particle was located <1 km away from a reef polygon, it was considered to be 'arrested' by the reef. Particles arrested by a reef did not move any further and instead contributed to the connectivity between reefs proportionally to the amount oflarvae determined to be competent and surviving at the time of arrival. This process continued until the maximum number of days the larvae could survive during dispersal (see S2 Table). Arresting the particles in proximity of reefs also served as a simple proxy for any potential fine-scale hydrodynamics around reefs or short-range homing behaviours [86- 88] and thereby ensured that the reefs were treated as physical obstacles to dispersal.
A combination of competency, survival, and seascape characteristics meant that only about 0.0002% of the larvae in our models settled after day 25. While such low levels of settling larvae as those observed during the later stages of the simulations could be detected with methods examining genetic connectivity and allelic composition of populations (67], they are unlikely
PLOS Biology I httpi,;//cJoi.org/10.1 ~?1/journ_al.Ql;>io.~00335~ November 28, 2017
'70
·.fii·PLOS I BIOLOGY . . Systemic resilience of the Great Barrier Reef
to have a major effect on replenishment of populations after disturbances when many more larvae are generally needed to produce a demographic effect. Although some organisms, including some coral species, are known to have larvae that can survive in the water column for extended periods of time, the focus on demographically relevant connectivity meant that the maximum period during which the larvae could settle in our simulations was therefore limited to 30 days (see S2 Table).
The relative contribution from a specific source reef to a specific sink reef was then used as the strength of a connection between these reefs in a connectivity network. The information on the asymmetry in source-sink exchanges was retained in the networks, resulting in all connectivity networks being directed (digraphs). A set of 208 directed connectivity networks was obtained by combining multiple spawnings and competency curves. Taken together, these connectivity networks were therefore not only capable of representing dispersal of a broad spectrum of coral reef organisms using different spawning regimes and life history strategies but could also emulate cases when local conditions would alter the dispersal pattern of a taxon [29,34). Consistency in connectivity relationships was then used to determine which connectivity links were less likely to be affected by the inherent transience of marine dispersal and empirical uncertainty surrounding dispersal parameters.
Connectivity network analysis A broad spectrum of connectivity patterns represented by the connectivity networks was used to identify key sources that can facilitate the recovery of a wide range of coral reef organisms. Since different graph theory metrics can capture different aspects of source reefs replenishment potential, 5 properties were identified in each connectivity network to make the analysis comprehensive (graph theory analogues provided in parentheses): (1) number of reefs a source supplied (node's out-degree), (2) total amount of supply a source provided (node's strength), (3) number oflinks through which a source provided more than 10% of the relative supply to a sink (node's out-degree when considering only links that provide > 10% of supply to a respective sink) [22], (4) number of other sources a source could supply (node's out-degree when counting only links to major sources that were identified by using the properties 1, 2, and 3), and (5) the number of other reefs in a network that could be reached via a directed path from a source (node's out-component) [41 ). These 5 connectivity properties were measured for all reefs and across 208 scenarios representing multiple life-history characteristics and seasons of dispersal. There are many ways in which these data could be used to identify 'key larval sources', and our decision reflected certainty over their importance. Although a reef could in theory be considered 'well connected' if it only satisfied 4 of the specified criteria, we wanted the identified reefs to exhibit high potential for both short-term and long-term recovery as well as supporting a recovery 'cascade' by supplying other sources. As such, we wanted to be strict in that a reef needed to exhibit all 5 connectivity criteria to meet our aim of being an effective source that is also connected to other major sources, thereby maximising the rate at which replenishment can occur across the reef system. We therefore specified that all 5 connectivity criteria must always be met. This left 2 other decisions: how much should a reef excel within any individual connectivity metric (i.e., where does it rank within the 3,806 GBR reefs?), and over how many of the possible scenarios should it excel? Currently, there is no empirical demographic justification available for selecting a critical threshold because rigorous testing oflarval dispersal models for predicting rates of realised larval supply in the field has never been undertaken anywhere for logistical reasons. Therefore, we specified a somewhat arbitrary threshold in that a reef must have scored above average (top 50th percentile) in all 5 connectivity metrics and do so in above average (top 50th percentile) number of scenarios in
PLOS Biology I https://doi.or_g/10.1371/journal.pbio.2003355 November 28, 2017
71
·.W}l PLOS I BIOLOGY .. Systemic resilience of the Great Barrier Reef
order to qualify as having high potential for recovery of the system. Implementing these criteria served as a strong filter as only 14% ofreefs succeeded in being designated as 'key sources'.
Since demographically relevant levels of connectivity do not tend to occur over the entire length of the GBR, the ranking of the reefs according to their replenishment potential was performed within the natural resource management areas that are used to manage the GBR by the GBR Marine Park Authority [65].
In order to estimate a reefs potential to be supplied by other reefs or through local retention of larvae, we also determined the relative amount of supply a reef received from other reefs as well as the relative level oflocal retention oflarvae (the amount of settled larvae for which the destination reef was the same as the source reef). External supply was used to determine the predicted supply of COTS larvae to the reef Reefs that had low potential oflocal retention in most of the networks could therefore exhibit a reduced potential for recovery. Low local retention oflarvae could also be indicative of high levels of flushing and different flow regimes experienced by reefs (S3 fig).
Thermal stress analysis
Mass coral bleaching has been shown to be caused by prolonged periods of thermal stress which is typically expressed using the DHW metric. DHW is a cwnulative measurement of the intensity and duration of acute thermal stress and is expressed in the unit 'C-weeks. Here, we used 2 satellite sea surface temperature datasets to estimate maximwn annual (1982-2017) DHW across the GBR: For the years 1982-2012, DHW was calculated using Version 5 of the Coral ReefTemperature Anomaly Database (CoRTAD) [75], a weekly 4 km product. CoRTAD DHW was derived using the methods adopted by NOAA Coral Reef Watch that accumulates any hot spots > 1 'Cover a 12-week window. For years 2013 to 2017, we used ReeITemp Next Generation (RTNG), a high resolution (0.02 ') daily product developed by the Australian Government's Bureau of Meteorology as a key component of the Great Barrier Reef Marine Park Authority's (GBRPMA's) Early Warning System [89].
The maximum annual DHW was extracted for each of the pixels from the 2 datasets that intersected GBR reef polygons, corresponding to 5,059 pixels from CoRTAD and 14,324 from RTNG. Next, we defined significant thermal stress events as those years where >50% of all reef pixels experienced DHW > O, which occurred in 10 summers (1982, 1986, 1987, 1992, 1998, 2002, 2010, 2011, 2016, and 2017) of the 36-year time series. Finally, thermal stress refugia reefs (N = 1,258) were defined as those reefs that did not experience a DHW > 6 across 75% of their area during those same 10 years. In other words, ~75% of the reef area did not experience thermal stress associated with bleaching mortality. Although the threshold above which some reefs will bleach is usually taken to be 4 DHW [1,23,?1], during the recent widespread bleaching events on the GBR, significant mortality from bleaching was observed above 6 DHW threshold (personal communication, Mark Eakin to KH).
To estimate the relative levels of thermal stress over time, reef polygons were also ranked by their mean DHW over the same years. These rankings were standardized between 100 (highest DHW) and 1 (lowest DHW), providing a thermal stress ranking index that was used to illustrate the correspondence between the relative levels of acute thermal stress and the approximate locations of major ocean currents that flush the GBR in Fig~-
COTS spatial dynamics and analysis of field surveys
COTS is a corallivorous asteroid native to the GBR whose rapid increase in numbers can lead to reef-damaging outbreaks that can lead to >90% local coral mortality (30]. The GBR undergoes a major spate of COTS outbreaks every 14-17 years. First outbreaks in such large-scale
PLOS Biology\ hltp§:/fg_Qj.org/1 Q, 1~71ljournE.l.p_Qi_9.2003~gg November 28, 2017
·.~·PLOS I BIOLOGY .. Systemic resilience of the Great Barrier Reef
events tend to appear in the Cooktown-Caims region of the northern GBR (see .Bg__1A for the most recent case and the reefs surveyed in response). Outbreak initiation is most likely preceded by a local buildup oflarvae [IQ] and possibly also augmented by favourable nutrient conditions that enhance larval survival [29]. Once initiated, COTS outbreaks then spread through larval transport and eventually end up affecting large portions of the GBR, with prominent effects on the overall health of the ecosystem [.11,90]. As of this writing, the GBR is in the middle of another major COTS outbreak event, with an escalating number of outbreaks since the early 201 Os.
While the larval transport is crucial for the widespread impacts of COTS, the exact parameters of life history traits that define the dispersal of COTS larvae are not only uncertain but also known to vary with local conditions such as temperature and nutrient availability [22,30,34]. In laboratory studies, COTS larvae typically become competent at around 9-11 days, but this period can also be extended in conditions of nutrient scarcity or shortened due to nutrient abundance [30,34]. COTS are also known to spawn several times during the GBR summer months, but with no established regularity in timing of the spawning events [30]. To account for these uncertainties and ensure that the simulations can capture the entire spectrum of possible developmental conditions, we approximated COTS larval supply using an entire range of the simulated networks. Reefs were then classified according to whether they consistently had a high or low supply of COTS larvae in more than half of the 16 simulated spawning events that occurred during the 4 years before the field surveys began. With only 2 categories (high or low predicted supply of COTS larvae, allowing ties), a total of 1,904 reefs had been classified to have low risk of being supplied with COTS larvae.
Extensive field surveys performed in response to the ongoing series of outbreaks made it possible to validate the predictions ofhigh-resolution connectivity models with relevant estimates oflocal population abundances from the field. The first of these surveys were undertaken in 2013; however, COTS populations detected at that time probably underwent a period ofbuildup for several years before that [30]. Modelling connectivity of COTS larvae during 2008-2013, which immediately predates the field surveys of COTS adults, therefore allowed us to estimate levels oflarval transport that would have taken place during that buildup period.
Surveys to estimate the COTS numbers and outbreak locations were performed using a manta tow technique designed for rapid broad-scale surveys of COTS populations, in which towed divers visually assess adult COTS numbers [30,42]. COTS population densities of around 1,500 individuals/km2 were found to have damaging effects on coral cover and are used operationally as an outbreak threshold by both scientists and managers [30]. The manta tow survey data have been provided by the GBRMP A.
Classification of reefs according to outbreak risk We evaluated the performance of different percentiles of relative larval supply with respect to their ability to dichotomously classify risk of COTS outbreaks on reefs. For this, we first ranked the surveyed reefs for each of the 208 networks in terms of the larval supply they received from other reefs. We then classified reefs into 2 groups according to whether they were ranked above or below a certain percentile threshold for a given network. We tested 19 percentile thresholds, from 5% to 95% in 5% intervals. Reefs that exceeded the specific threshold in an above-average number of scenarios (top 50th percentile of observed maximum) were then classified as having 'high' supply for that threshold and the rest as having 'low' supply. Reefs with high supply were predicted to have a higher risk of outbreaks, as they consistently received more larvae across a range of environmental conditions and possible life histories.
PLOS Biology I https://doi.org/10.1371 /Joumal.pbio.2003355 November 28, 2017
73
·.@9•PLOS I BIOLOGY .. Systemic resilience of the Great Barrier Reel
We then evaluated how well each of the percentile thresholds performed in terms of correctly identifying reefs that were determined to have adult COTS population densities below the outbreak level of 1,500 individuals pee km2 in field surveys. Of the 137 surveyed reefs, 61 of them (44.5%) had outbreak densities of adult COTS. After comparing the performance of the classification analysis for different larval supply thresholds [21], we found that only 8.2% of the reefs consistently ranked in the bottom 30th percentile oflarval supply had outbreak densities of adult COTS (Sl F1.g). Based on this result, the 30th percentile was used as a threshold that could reliably identify reefs that are unlikely to have a high supply of COTS larvae and therefore exhibit a lower risk of both experiencing COTS outbreaks and spreading the COTS larvae to other reefs.
Analysis of the CPUE data from COTS eradication efforts To supplement the results of COTS surveys, a second set of analysis was also performed using catch-per-unit effort (CPUE) values from eradication efforts undertaken between 2013 and 2015 by the Association of Marine Park Tourism Operators (AMPTO) aimed at controlling the levels of adult COTS on reefs. Local eradication efforts have been organised and implemented in response to the rising levels of COTS. While the eradication efforts have been implemented in approximately the same region as the manta tow surveys, they were not performed on the same set ofreefs (though there is overlap). In contrast to the rapid broad-scale surveys oflarge areas characteristic of manta tows, eradication efforts used intensive search dives by trained divers to locate adult COTS over a small area. CPUE rates obtained during these dives, especially during an initial visit of the eradication team to a reef, can be used as an estimate of the densities of adult COTS present on a section of a reef; although, unlike for manta tows, no firm threshold exists with regard to the expected CPUEs for outbreak versus nonoutbreak conditions. These density estimates can then be used to evaluate the predictors of COTS larval supply obtained from the connectivity networks. The dataset has been provided byAMPTO.
The potential to receive COTS larvae was again an important predictor of CPUE rates for adult COTS on individual reefs, with significantly higher CPUEs on reefs predicted to have experienced a higher supply of COTS larvae (those above 30th percentile threshold) in the years predating the eradication efforts (N = 94, F = 6.92, p = .01). Moreover, external supply of COTS larvae was the only significant predictor in the statistical model. Test details are provided in S4 Table.
The importance of external supply of COTS as a predictor of subsequent densities of adult COTS was therefore corroborated by 2 separate analyses that used 2 independent datasets derived from different methods to estimate adult COTS numbers on reefs.
Key assumptions regarding 3 criteria for reefs to become robust sources Our 3 criteria involve a number of assumptions that should be made explicit, even if they are not particularly controversial. The main assumptions are listed in SJ Table.
Estimating replenishment potential of the robust sources To assess the potential of robust sources to replenish other parts of the GBR, we have determined the proportion of the GBR that can be supplied by such sources in an average year. We only considered reefs that were directly supplied from robust sources; also, reefs that were supplied from more than I robust source, e.g., in areas where robust sources were close to each other, were only counted once. We further considered how many of the identified key sources were supplied per year in order to emphasize the importance of the supply from robust sources
PLOS Biology I https.//doi org/10.1371/joumal.pbio.2003355 November 28, 2017
74
·.@··PLOS I BIOLOGY . . Systemic resilience of the Great Barrier Reef
on the wider supply cascade. In the context of replenishment and recolonization of disturbed
populations, space and density limitations at sinks should be a minor issue and even small lev
els of supply could end up being locally important. As such, these analyses took into account
links of all strengths (that is, we did not impose an arbitrary demographic threshold on mini
mum link strength). Since the number of reefs that can be supplied from robust sources will also increase with longer dispersal times, we have performed these calculations for all of the
simulated larval survival durations (see S2 Table). The results of the analyses are presented in
Eig..2. We have also examined the relative distance of all reefs on the GBR from the robust sources
in terms of the number of colonisation steps/stepping stones needed to reach them. This was
determined by identifying the directed shortest path from each of the robust sources to all
other reefs and then finding the directed shortest path with the fewest number of colonisation
steps/stepping stones from any robust source to every other reef on the GBR [57]. The results
of this analysis for different larval durations listed (see S2 Table) are shown in different panels
offlg_.2.
Statistical analyses
A linear model was used to determine whether predicted supply of COTS larvae during a puta
tive buildup period can be used to explain the population densities of adult COTS later
observed on reefs during field surveys (N of reefs surveyed= 137). Densities of adult COTS
observed during a survey of each reef when maximum average levels of COTS were recorded
per manta tow were used as field estimates of COTS abundance. The geographical locations of
the individual GBR reefs were represented by the longitude and latitude of the centroids of
reef polygons. Observed coral cover was included as a covariate due to its potential effect on
observing COTS in manta tow surveys. Because COTS were not observed on many reefs, a
Tweedie distribution with a dispersion parameter of 3.58 was fitted to the data using the tweedie package for the R platform (hllps://cran.r-proJect.org/web/packages/tweedie/index.html)
and used to model the zero-inflated frequency distribution of observed COTS densities [92].
The linear part of the model included 7 fixed factors. The factors included 5 continuous pre
dictors: latitude, longitude, date of survey, observed coral cover, and reef size; and 2 categorical
predictors: predicted supply of COTS larvae from external sources and local retention of
COTS larvae with 2 levels for each ('high' and 1ow') based on the relative rank in COTS con
nectivity networks. The interaction between the 2 categorical predictors was also considered,
but was not significant. The analysis was then performed using the GLM package for the R
platform. Test details are provided in S3 Table.
A linear model was used to compare the predicted connectivity of COTS with the CPUE values for adult COTS from the eradication efforts. The factors included 5 continuous predic
tors: latitude, longitude, date of cull, observed coral cover, and reef size; and 2 categorical pre
dictors: predicted supply of COTS larvae from external sources and local retention of COTS larvae with 2 levels for each ('high' and 1ow') based on the relative rank in respective connec
tivity networks. Unlike manta tows during which many surveys did not observe adult COTS
on reefs, in nearly all cases at least some COTS were culled, resulting in a dataset with few
zeros, so a generalized linear model was used in the analysis. Since the culls were performed
using different boats that hosted the divers, boat ID was included in the linear model as a
random factor. Date of cull was added as COTS densities are likely to increase over time.
Observed coral cover was included as a covariate due to its potential effect on observing COTS
during culls. Due to the potential effect of previous eradication efforts on local COTS popula
tion densities, only the CPUE recorded on a first visit to a reef by the divers was used in the
PLOS Biology I https://doi.org'10.1371/ioumal.pbio.2003355 November 28, 2017
·-~-PLOS I BIOLOGY .. Systemic resilience of the Great Barrier Reef
analysis. The interaction between the 2 categorical predictors was also considered but was not significant. Test details are provided in SA Table.
Supporting information SI Fig. Evaluating performance of different larval supply thresholds for predicting adult COTS densities in surveys. The threshold of 30th percentile was found to perform the best as it gives the lowest rate of false negatives (reefs that are classified as low risk due to low supply oflarvae but also had adult COTS outbreaks in the surveys). This percentile was then used as a threshold to classify reefs that will have low risk of COTS outbreaks. COTS, crown-of-thorns starfish. (TIF)
S2 Fig. Classification of robust sources with respect to local retention of larvae. Black circles represent robust sources that have had consistently high local retention oflarvae in dispersal simulations when compared to the GBR-wide average; red circles, well represented in the outer shelf regions, represent robust sources that have had below average local retention levels. The majority (80%) of the robust sources have low levels oflocal retention, possibly due to high flushing regimes. GBR, Great Barrier Reef. (TIF)
S3 Fig. Locations of robust sources and expected annual frequency of category ;::: I cyclones on the GBR. Robust sources tend to be located outside of the regions with high expected cyclone frequency (coloured background; adapted from data presented in Wolff et al. [iim. GBR, Great Barrier Reef. (TIF)
S4 Fig. Classification of robust sources with respect to their placement in no-take zones. Black circles represent robust sources located in no-take zones; red circles represent robust sources that are not located in no-take zones. Nearly half (46%} of the robust sources are already located in no-take zones and awarded the highest level of protection under the current GBR zoning plan [65]. GBR, Great Barrier Reef. (TIF)
SI Table. Key assumptions and rationales behind the 3 criteria used to identify robust sources. COTS, crown-of-thorns starfish; DHW, degree heating weeks; GBR, Great Barrier Reef. (DOCX)
S2 Table. Parameters used for constructing survival-competency curves. All scale parameters were equal to 1. Mortality rate was constant and equal to 0.1 per day in all analyses shown in the text. (DOCX)
S3 Table. Results of a general linear model test that tested the effect of connectivity predictors on adult COTS densities observed in field surveys. Dispersion parameter for the fitted Tweedie distribution was 3.384. COTS, crown-of-thorns starfish. (DOCX)
S4 Table. Results of a general linear model that tested the effect of connectivity predictors on adult COTS densities obtained from CPUE during COTS eradication efforts. Model R2 = 20.82. COTS, crown-of-thorns starfish; CPUE, catch-per-unit effort. (DOCX)
PLOS Biology I tmps:/fdoi.Qrg/1 o. rn11fjQum111.pJ!iQ.200335~ November 28, 2017
'fC
·.(f:J·PLos I BIOLOGY •• Systemic resilience of the Great Barrier Reef
SI Data. Data used to generate the manuscript figures. (XLSX)
Acknowledgments We thank Nils Krueck, Yves-Marie Bozec, George Roff, and Mark Eakin for discussions. Computational analyses were performed with support from Research Computing Centre facilities at the University of Queensland~ The authors thank the Great Barrier Reef Marine Park Authority, the Queensland Government, the Association of Marine Park Tourism Operators, and all contributors to the Integrated Eye on the Reef Program for the provision of data associated with reef health and crown-of-thorns starfish.
Author Contributions Conceptualization: Karlo Hock, Peter J. Mumby.
Data curation: Karlo Hock, Nicholas H. Wolff, Scott A. Condie, Peter J. Mumby.
Formal analysis: Karlo Hock, Nicholas H. Wolff, Juan C. Ortiz, Paul G. Blackwell, Peter J. Mumby.
Funding acquisition: Kenneth R. N. Anthony, Peter J. Mumby.
Investigation: Karlo Hock, Peter J. Mumby.
Methodology: Karlo Hock, Nicholas H. Wolff, Juan C. Ortiz, Scott A. Condie, Kenneth R. N. Anthony, Paul G. Blackwell, Peter J. Mumby.
Project administration: Kenneth R. N. Anthony, Peter J. Mumby.
Resources: Karlo Hock, Kenneth R. N. Anthony, Peter J. Mumby.
Software: Karlo Hock, Scott A. Condie.
Supervision: Kenneth R. N. Anthony, Peter J. Mumby.
Validation: Karlo Hock, Nicholas H. Wolff, Juan C. Ortiz, Peter J. Mumby.
Visualization: Karlo Hock, Nicholas H. Wolff, Juan C. Ortiz, Scott A. Condie, Peter J. Mumby.
Writing - original draft: Karlo Hock, Peter J. Mumby.
Writing - review & editing: Karlo Hock, Nicholas H. Wolff, Juan C. Ortiz, Scott A. Condie, Kenneth R. N. Anthony, Paul G. Blackwell, Peter J. Mumby.
References 1. Carr MH, Neigel JE, Estes JA, Andelman S, Warner RR, Largier JL. Comparing marine and terrestrial
ecosystems: implications for the design of coastal marine reserves. Ecol Appl. 2003; 13(1):S90-S107.
2. Hughes TP, Bellwood DR, Folke C, Steneck RS, Wilson J. New paradigms for supporting the resilience of marine ecosystems. Trends Ecol Evol. 2005; 20(7):380-6. https://doi.org110.1016/j.tree.2005.03.022 PMID: 1670140Q
3. Baker AC, Glynn PW, Riegl B. Clmate change and coral reef bleaching: An ecological assessment of long-term impacts, recovery trends and future outlook. Estuar Coast Shelf Sci. 2008; 80(4):435-71.
4. Eakin CM, Morgan JA, Heron SF, Smith TB, Liu G, Alvarez-Filip L, et al. Caribbean corals in crisis: record thermal stress, bleaching, and mortality in 2005. PLoS ONE. 201 O; 5(11):e13969. https://doi.org/ 10.1371/journal.pone.0013969 PMID: 21125021
PLOS Biology I https://doi.org/10.1371 /joumal.pbio.2003355 November 28, 2017
77
·-~·PLO$ j e10LOGY
5.
6.
7.
8.
Systemic resilience of the Great Barrier Reef
Hughes TP. Kerry JT, Alvarez-Noriega M, Alvarez-Romero JG, Anderson KD, Baird AH, et al. Global warming and recurrent mass bleaching of corals. Nature. 2017; 543(7645):373-7. httJJs.//doi.or.9!1 o. 1038/nature21707 PMID: 2.8300113
Nystrom M, Folke C, Moberg F. Coral reef disturbance and resilience in a human-dominated environment. Trends Ecol Evol. 2000; 15(10):413-7. PMID: 10998519
McClanahan TR, Donner SD, Maynard JA, MacNell MA, Graham NA, Maina J, et al. Prioritizing key resilience indicators to support coral reef management In a changing climate. PLoS ONE. 2012; 7(8): e42884. https://doi.org/10.1371/journal.pone.0042884 PMID: 22952618
Mumby PJ, Wolff NH, Bozec YM, Chollett I, Halloran P. Operationalizing the resilience of coral reefs in an era of climate change. Conserv Lett. 2014; 7(3):176-87.
9. Sale PF, Cowen RK, Danilowicz BS, Jones GP, Kritzer JP, Lindeman KC, et al. Critical science gaps impede use of no-take fishery reserves. Trends Ecol Evol. 2005; 20(2):7~. https://doi.Qig/10.1016fi. tree 2004.11.007 PMID: 16701346
10. Cowen RK, Paris CB, Srinivasan A. Scaling of connectivity in marine populations. Science. 2006; 311 (5760):522-7. https://doi.org/10.1126/science.1122039 PMID: 16357224
11. Beger M, Grantham HS, Pressey RL, Wilson KA, Peterson EL, Dorfman D, et al. Conservation planning for connectivity across marine, freshwater, and terrestrial realms. Biol Conserv. 201 O; 143(3):565-75.
12. Mumby PJ, Elliott IA, Eakin CM, Skirving W, Paris CB, Edwards HJ, et al. Reserve design for uncertain responses of coral reefs to climate change. Ecol Lett. 2011; 14(2): 132-40. h!!J:1§://doi.org/JQ,_1111Li-1461-0248.2010.01562.x PMID: gi~
13. Man A, Law R, Polunin NV. Role of marine reserves in recruitment to reef fisheries: a metapopulation model. Biol Conserv. 1995; 71(2):197-204.
14. Nystrom M, Folke C. Spatial resilience of coral reefs. Ecosystems. 2001; 4(5):406-17.
15. Harrison HB, Williamson DH, Evans RD, Almany GR, Thorrold SR, Russ GR, et al. Larval export from marine reserves and the recruitment benefilfor fish and fisheries. Curr Biol. 2012; 22(11 ):102~. tmP-s://doi.org/10.1016/j.cub.2012.04.008 PMID: 22633811
16. Maynard JA, Beeden R, Puotinen M, Johnson JE, Marshall P, Hooidonk R, et al. Great Barrier Reel notake areas include a range of disturbance regimes. Conserv Lett. 2015; 9(3):191-9.
17. Scheffer M, Carpenter SR, Lenton TM, Bascompte J, Brock W, Dakos V, et al. Anticipating critical transitions. Science. 2012; 338(6105):~. https://doi.org/10.112§/science.1225244 PMID: 23087241
18. Watson JR, Kendall BE, Siegel DA, Milarai S. Changing seascapes, stochastic connectivity, and marine metapopulatlon dynamics. Am Nat. 2012; 180(1):99-112. https·//doi.Qrg/10 1086/665992 PMID: 22673654
19. Keppel G, Van Niel KP, Wardell-Johnson GW, Yates CJ, Byrne M, Mucina L, et al. Refugia: identifying and understanding safe havens for biodiversity under climate change. Glob Ecol Biogeogr. 2012; 21 (4):393-404.
20. Van Hooidonk R, Maynard J, Planes S. Temporary refugia for coral reefs in a warming world. Nat Clim Change. 2013; 3(5):508-11.
21. Hastings A, Cuddington K, Davies KF, Dugaw CJ, Elmendorf S, Freestone A, et al. The spatial spread of invasions: new developments in theory and evidence. Ecol Lett. 2005; 8(1):91-101.
22. Treml EA, Roberts JJ, Chao Y, Halpin PN, Possingham HP, Riginos C. Reproductive output and duration of the pelagic larval stage determine seascape-wide connectivity of marine populations. lntegr Comp Biol. 2012; 52(4):525-37. https://do~Q_rg.fl0.1093/icb/ics1Q1 PMID: 22821585
23. Skirving W, Heron M, Heron S. The hydrodynamics of a bleaching event implications for management and monitoring. In: Phinney JT, Hoegh-Guldberg 0, Kleypas J, Skirving W, Strong A, editors. Coral Reefs and Climate Change: Science and Management. Washington, D. C.: American Geophysical Union; 2006. p.145-61.
24. Chollett I, Mumby PJ, Cortes J. Upwelling areas do not guarantee refuge for coral reefs in a warming ocean. Mar Ecol-Prog Ser. 201 O; 416:47-66.
25. Berkelmans R, De'ath G, Kininmonth S, Skirving WJ. A comparison of the 1998 and 2002 coral bleaching events on the Great Barrier Reef: spatial correlation, patterns, and predictions. Coral Reels. 2004; 23(1):74-83.
26. Sweatman H, Delean S, Syms C. Assessing loss of coral cover on Australia's Great Barrier Reef over two decades, with implications for longer-term trends. Coral Reefs. 2011; 30(2):521-31.
27. Beeden R, Maynard J, Puotinen M, Marshall P, Dryden J, Goldberg J, et al. Impacts and recovery from severe tropical Cyclone Vasi on the Great Barrier Reef. PLoS ONE. 2015; 10(4):e0121272. https://doi org/lit 1371.~ournalpone 0121272 PMID: 25874718
PLOS Biology I https.1£doi.org/1 o 1371 ~ournal ppio 2_0033!:?.!? November 28, 2017
7R
--~·PLOS I BIOLOGY . . Systemic resilience of the Great Barrier Reef
28. Wolff NH, Wong A. Vitolo R, Stolberg K, Anthony KR, Mumby PJ. Temporal clustering of tropical cyclones on the Great Barrier Reef and its ecological importance. Coral Reefs. 2016; 35(2):613-23.
29. Fabricius KE, Okaj K, De'ath G. Three lines of evidence to link outbreaks of the crown-of-thorns seastar Acanthaster plane/lo the release of larval food limitation. Coral Reefs. 201 O; 29(3):593-605.
30. Pratchett MS, Caballes CF, Rivera Posada JA, Sweatman HPA. Limits to understanding and managing outbreaks of crown-of-thorns starfish (Aeanthaster spp.). In: Hughes RN, Hughes DJ, Smith IP, editors. Oceanogr Mar Biol. An Annual Review. 52: CRC Press; 2014. p. 133-200.
31. De'ath G, Fabriclus KE, Sweatman H, Puotinen M. The 27-year decline of coral cover on the Great Barrier Reef and Its causes. Proc Nall Acad Sci U SA. 2012; 109(44):17995-9. https://doi.org/10.1073/ pnas.1208909109 PMID: 23027961
32. Vermeij M, Fogarty ND, Miller M. Pelagic conditions affect larval behavior, survival, and settlement patterns in the Caribbean coral Montastraea faveolata. Mar Ecol-Prog Ser. 2006; 310(11 ):119-28.
33. Treml EA, Halpin PN, Urban DL, Pratson LF. Modeling population connectivity by ocean currents, a graph-theoretic approach for marine conservation. Laoosc Ecol. 2008; 23(Suppl 1 ):19-36.
34. Uthicke S, Logan M, Liddy M, Francis D, Hardy N, Lamere M. C6mate change as an unexpected co-factor promoting coral eating seastar (Acanthaster plane,) outbreaks. Sci Rep. 2015; 5:8402. https://doi. org/10.1038/srep08402 PMID: 25672480
35. Mao Y, Luick JL. Circulation in the southern Great Barrier Reef studied through an integration of multiple remote sensing and in situ measurements. J Geophys Res Oceans. 2014; 119(3): 1621-43.
36. Ortiz JC, Bozec Y-M, Wolff NH, Doropoulos C, Mumby PJ. Global disparity in the ecological benefits of reducing carbon emissions for coral reefs. Nat Clim Change. 2014; 4:1090-4.
37. Pratchett MS, Hoey AS, Wilson SK, Messmer V, Graham NA. Changes In biodiversity and functioning of reef fish assemblages following coral bleaching and coral loss. Diversity. 2011; 3(3):424-52.
38. Wooldridge SA. Water quality and coral bleaching thresholds: Formalising the linkage for the inshore reefs of the Great Barrier Reef, Austijllia. Mar Pollut Bull. 2009; 58(5):745-61. https://doi.org/10.1016/j. marpolbul.2008.12.013 PMID: 19230930
39. Devlin M, McKinna L, Alvarez-Romero J, Petus C, Abolt B, Harkness P, et al. Mapping the pollutants in surface riverine flood plume waters in the Great Barrier Raef, Australia. Mar Pollut Bull. 2012; 65 {4):224-35.
40. Pratchett MS. Dynamics of an outbreak population of Acanthaster planci at Lizard Island, northern Great Barrier Raef (1995-1999). Coral Reefs. 2005; 24(3):453-62.
41. Hock K, Wolff NH, Condie SA, Anthony KAN, Mumby PJ. Comectivity networks reveal the risks of crown-of-thorns starfish outbreaks on the Great Barrier Reef. J Appl Ecol. 2014; 51 (5):1188-96.
42. Moran PJ, De' Ath G. Estimates of the abundance of the crown-of-thorns starfish Acantfiaster planciin outbreaking and non-outbreaking populations on reefs within the Great Barrier Reef. Mar Biol. 1992; 113(3):509-15.
43. McCook W, Ayling T, Cappo M, Choat JH, Evans RD, De Freitas DM, et al. Adaptive management of the Great Barrier Reef: A globally significant demonstration of the benefits of networks of marine reserves. Proc Nad Acad Sci U SA. 201 O; 107(43):1 ~-https:f/doi.org/10.1073/pnas. 0909335107 PMID: 20176947
44. Fabricius KE. Effects of terrestrial runoff on the ecology of corals and coral reefs: review and synthesis. Mar Pollut Bull. 2005; 50(2):125-46. htlP§:f/doi.org/10.1016/j.marpolbul.2004.11.028 PMID: 15737355
45. Fabricius K, De'ath G, McCook L, Turak E, Williams DM. Changes in algal, coral and fish assemblages along water quaUty gradients on the Inshore Great Barrier Reef. Mar Pollut Bull. 2005; 51 (1 ):384-88.
46. De'ath G, Fabricius K. Water quaDty as a regional driver of coral biodiversity and macroalgae on the Great Barrier Reef. Ecol Appl. 201 o; 20(3):840-50. PMID: 20437968
47. Brodie J, Kroon F, Schaffelke B, Wolanski E, Lewis S, Devlin M, et al. Terrestrial pollutant runoff to the Great Barrier Reef: An update of issues, priorities and management responses. Mar Pollut Bull. 2012; 65(4):81-100.
48. Anthony K, Maynard JA, DIAZ-PULIDO G, Mumby PJ, Marshall PA, Cao L, et al. Ocean acidification and wanning will lower coral reef resiience. Glob Change Biol. 2011; 17(5):1798-808.
49. Mongin M, Baird ME, Tilbrook B, Matear RJ, Lenton A, Herzfeld M, et al. The exposure of the Great Barrier Reef to ocean acidification. Nat Commun. 2016; 7.
so. Steinberg C. Impacts of climate change on the physical oceanography of the Great Barrier Reef. In: Johnson JE, Marshall PA, editors. Climate change and the Great Barrier Reef: a vulnerability assessment. Townsville, Australia: The Great Barrier Reef Marine Park Authority; 2007. p. 51-74.
51. Munday P, Leis J, Lough J, Paris C, Kingsford M, Berumen M, et al. Climate change and coral reef connectivity. Coral Reefs. 2009; 28(2):379-S5.
PLOS Biology I bJ!ps://doi.org/10.1371/journal.pblo.2003355 November 28, 2017
79
·.<f)f PLOS I BIOLOGY
52.
Systemic resilience of the Great Barrier Reef
Urban D, Keitt T. Landscape connectivity: a graph-theoretic perspective. Ecology. 2001; 82(5):1205-18.
53. Jordan F, Baldi A, Orci K-M, Racz I, Varga Z. Characterizing the Importance of habitat patches and corridors in maintaining the landscape connectivity of a Pholidoptera transsylvanica (Orthoptera) metapopulation. Landsc Ecol. 2003; 18(1):83-92.
54. Bode M, Burrage K, Possingham HP. Using complex network metrics to predict the persistence of metapopulatlons with asymmetric connectivity patterns. Ecol Modell. 2008; 214(2):201-9.
55. Minor ES, Urban DL. A graph-theory lrarmework for evaluating landscape connectivity and conservation planning. Conserv Biol. 2008; 22(2):297-307. https.//doi org. 1 o 1111/J 1523-1739.2007.00871 .x PMID: 18241238
56. Watson JR, Siegel DA, Kendall BE, Mltarai S, Rassweiller A, Gaines SD. Identifying critical regions in small-world marine metapopulations. Proc Natl Acad Sci US A. 2011; 108(43):E907-E13. https·//do, org/10.1073/pnas.1111461108 PMlD: 21987813
57. Hock K, Mumby PJ. Quantifying the reliability of dispersal paths in connectivity networks. J Roy Soc Interface. 2015; 12(105):20150013.
58. With KA. The landscape ecology of invasive spread. Conserv Biol. 2002; 16(5): 1192'"'203.
59. Chades I, Martin TG, Nicol S, Burgman MA, Possingham HP, Buckley YM. General rules for managing and surveying networks of pests, diseases, and endangered species. Proc Natl Acad Sci U S A. 2011; 108(20):8323-8. https://doi.org/10.1073/pnas.1Q16846108 PMID: 21536884
60. Minor ES, Gardner RH. Landscape connectivity and seed dispersal characteristics inform the best management strategy for exotic plants. Ecol Appl. 2011 ; 21 (3):739-49. PMID: 21639041
61. Hock K, Wolff NH, Beeden R, Hoey J, Condie SA, Anthony KAN, et al. Controlling range expansion in habitat networks by adaptively targeting source populations. Conserv Biol. 2016; 30(4):856-66. ht
·.rti-PLOS I BIOLOGY . . Systemic resilience of the Great Barrier Reef
75. Casey KS, Selig ER, Zhang D, Saha K, Krishnan A, McMlchael E. The Coral Reef Temperature Anomaly Database (CoRTAD) Version 5--Global, 4 km Sea Surface Temperature and Related Thermal Stress Metrics for 1982-2012 (NCEI Accession 0126774). 2015.
76. GBRMPA. Final report: 2016 coral bleaching event on the Great Barrier Reef. Townsville, OLD, Australia: Great Barrier Reef Marine Park Authority, 2017 0995373167.
77. Ainsworth TD, Heron SF, Ortiz JC, Mumby PJ, Grech A, Ogawa D, et al. Climate change disables coral bleaching protection on the Great Barrier Reef. Science. 2016; 352(6283):338-42. https://doi.org/10. 1126/science.aac7125 PMID: 27081069
78. Gonzalez-Rivero M, Beijbom 0, Rodriguez-Ramirez A, Hottrop T, Gonzalez-Marrero Y, Ganase A, et al. Scaling up ecological measurements of coral reefs using semi-automated field image collection and analysis. Rem Sens. 2016; 8(1):30.
79. Caley M, Carr M, Hixon M, Hughes T, Jones G, Menge B. Recruitment and the local dynamics of open marine populations. Annu Rev Ecol Syst. 1996; 27:477-500.
80. Doropoulos C, Roff G, Bozec YM, Zupan M, Werminghausen J, Mumby PJ. Characterizing the ecological trade-offs throughout the early ontogeny of coral recruitment. Ecol Monogr. 2016; 86(1 ):20-44.
81. Fox HE, Mous PJ, Pet JS, Muijadi AH, Caldwell AL. Experimental assessment of coral reef rehabilitation following blastflshlng. Conserv Biol. 2005; 19(1):98-107.
82. Mora C. A clear human footprint in the coral reefs of the Caribbean. Proc R Soc B-Biol Sci. 2008; 275 (1636):767-73.
83. Mora C, Aburto-Oropeza 0, Bocos AA, Ayotte PM, Banks S, Bauman AG, et al. Global human footprint on the linkage between biodiversity and ecosystem functioning in reef fishes. PLoS Biol. 2011; 9(4): e1000606. https://doi.org/10.1371/joumal.pbio.1 Q00606 PMID: 21483714
84. Condie S, Hepburn M, Mansbridge J, editors. Modelling and visualisation of connectivity on the Great Barrier Reef. Proceedings of the 12th International Coral Reef Symposium; 2012 9--13 July 2012; Cairns, Australia.
85. White JW, Morgan SG, Fisher JL. Planktonic larval mortallty rates are lower than widely expected. Ecology. 2014; 95(12):3344-53.
86. Sammarco PW, Andrews JC. The Helix experiment: differential localized dispersal and recruitment patterns in Great Barrier Reef corals. Llmnol Oceanogr. 1989; 34(5):896-912.
87. Andutta FP, Kingsford MJ, Wolanski E. 'Sticky water'enables the retention of larvae in a reef mosaic. Estuar Coast Shell Sci 2012; 101 :54--&.
88. Wolanski E, Kingsford MJ. Oceanographic and behavioural assumptions In models of the fate of coral and coral reef fish larvae. J Roy Soc Interface. 2014; 11 {98):20140209.
89, Garde L, Spillman C, Heron S, Beeden R. Reef Temp Next Generation: A new operational system for monitoring reeltherrnal stress. J Oper Oceanogr. 2014; 7(1):21-33.
90. Harrison HB, Pratchett MS, MessmerV, Saenz-Agudelo P, Berumen ML. Mlcrosatellites reveal genetic homogeneity among outbreak populations of crown-of-thorns starfish (Acanthaster cf. so/aris) on Australia's Great Barrier Reel. Diversity. 2017; 9(1 ):16.
91. Powers OM. Evaluation: from precision, recall and F-measure to AOC, informedness, markedness and correlation. J Mach Learn Tech. 2011; 2(1 ):37-63.
92. Shono H. Application of the Tweedle distribution to zero-catch data in CPUE analysis. Fish Res. 2008; 93(1):154-62.
PLOS Biology I https://doi.o[9[W.1371/journal.pbio.2003355 November 28, 2017
11

. .,.
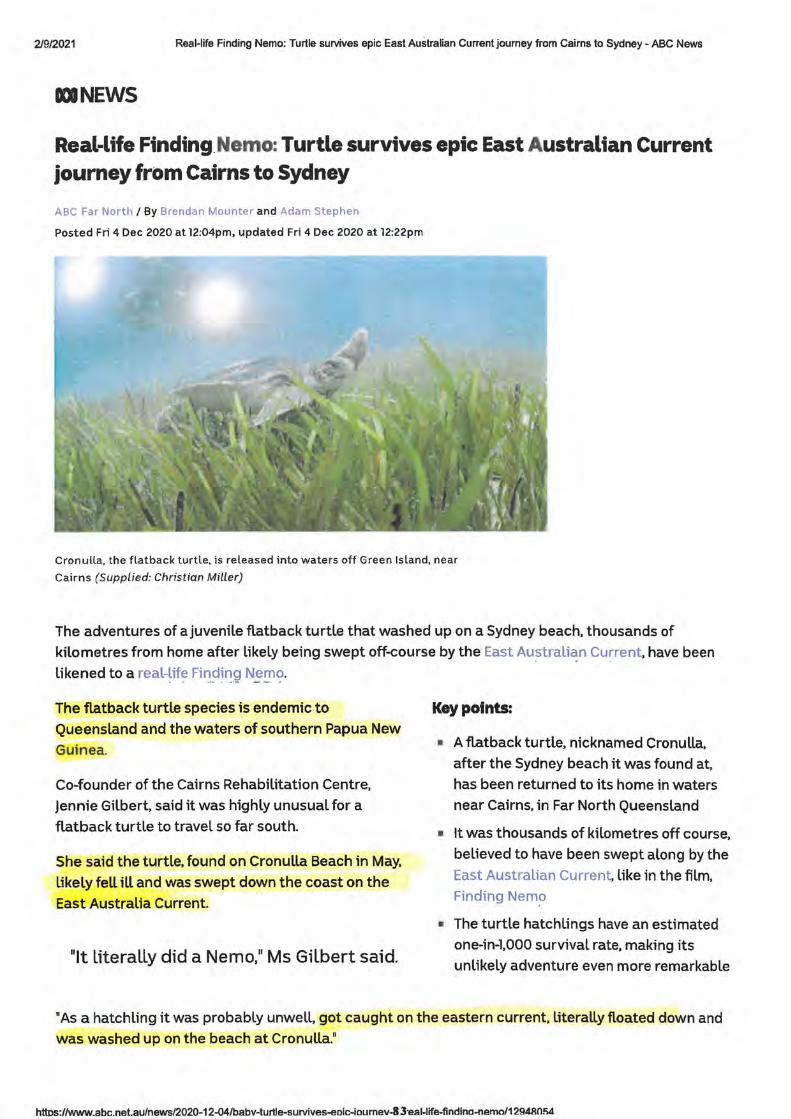
2/9/2021 Real-life Finding Nemo: Turtle survives epic East Australian Current journey from Cairns to Sydney - ABC News
IIINEWS
Real-life Finding_Nemo: Turtle survives epic East Australian Current journey from Cairns to Sydney
ABC Far North / By Brendan Mounter and Adam Stephen
Posted Fri 4 Dec 2020 at 12:04pm, updated Fri 4 Dec 2020 at 12:22pm
Cronulla, the flatback turtle, is released into waters off Green Island, near
Cairns (Supplied: Christian Miller)
The adventures of a juvenile flatback turtle that washed up on a Sydney beach, thousands of
kilometres from home after likely being swept off-course by the East Au~trali~n Current, have been
likened to a real-lif~ Fi~.d~~g N~!!l<?·
The flatback turtle species is endemic to Queensland and the waters of southern Papua New
Guinea.
Co-founder of the Cairns Rehabilitation Centre,
Jennie Gilbert, said it was highly unusual for a
flatback turtle to travel so far south.
She said the turtle, found on Cronulla Beach in May,
likely fell ill and was swept down the coast on the
East Australia Current.
"It literally did a Nemo, 11 Ms Gilbert said.
Key points:
• A flatback turtle, nicknamed Cronulla,
after the Sydney beach it was found at,
has been returned to its home in waters near Cairns, in Far North Queensland
• It was thousands of kilometres off course, believed to have been swept along by the
East Australian Current, like in the film.
Finding Nern~
• The turtle hatchlings have an estimated
one-in-1,000 survival rate, making its unlikely adventure even more remarkable
• As a hatch ling it was probably unwell, got caught on the eastern current, literally floated down and
was washed up on the beach at Cronulla."
httos://www.abc.net.au/news/2020-12-04/babv-turtJe-survives-eoic-loumev-83-eal-life-findlna-nemo/129480"4
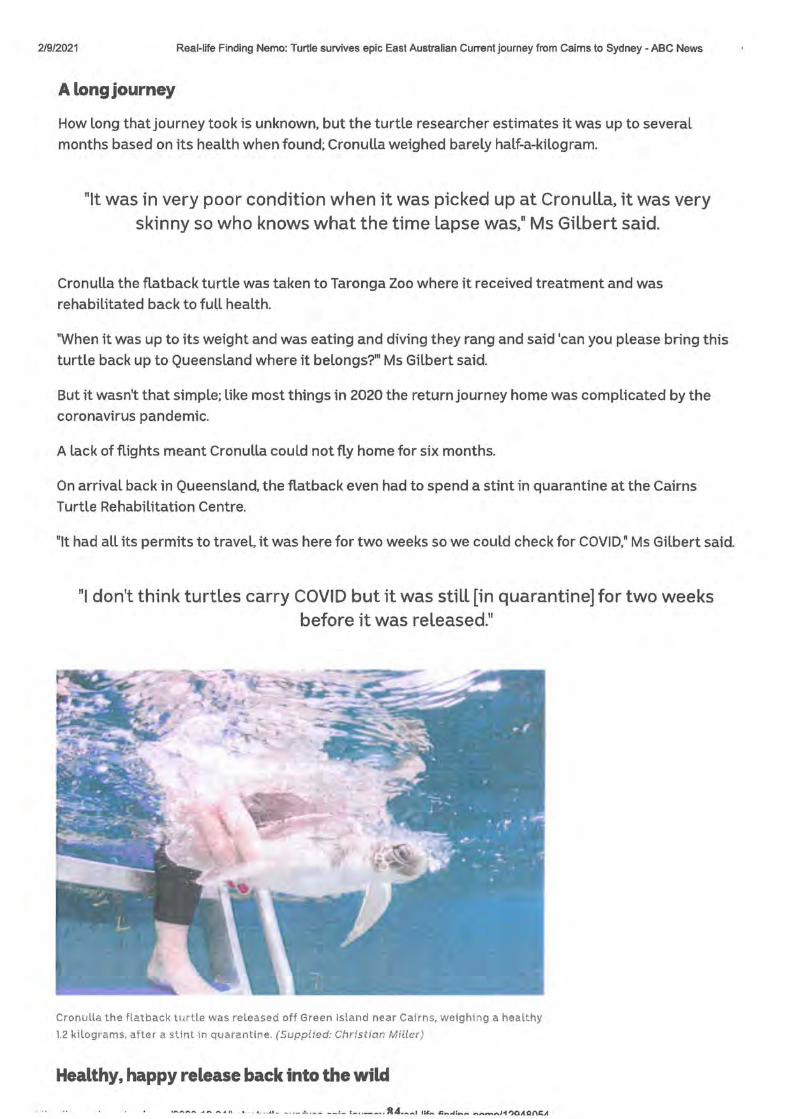
2/9/2021 Real-life Finding Nemo: Turtle survives epic East Australian Current journey from Cairns to Sydney - ABC News
A long journey
How long that journey took is unknown, but the turtle researcher estimates it was up to several months based on its health when found; Cronulla weighed barely half-a-kilogram.
"It was in very poor condition when it was picked up at Cronulla, it was very skinny so who knows what the time lapse was," Ms Gilbert said.
Cronulla the flatback turtle was taken to Taronga Zoo where it received treatment and was rehabilitated back to full health.
"When it was up to its weight and was eating and diving they rang and said 'can you please bring this turtle back up to Queensland where it belongs?"' Ms Gilbert said.
But it wasn't that simple; like most things in 2020 the return journey home was complicated by the coronavirus pandemic.
A lack of flights meant Cronulla could not fly home for six months.
On arrival back in Queensland, the flatback even had to spend a stint in quarantine at the Cairns Turtle Rehabilitation Centre.
"It had all its permits to travel, it was here for two weeks so we could check for COVID," Ms Gilbert said.
"I don't think turtles carry COVID but it was still [in quarantine] for two weeks before it was released."
Cronulla the flatback turtle was released off Green Island near Cairns. weighing a healthy
1.2 kilograms. after a stint in quarantine. (Suppiled: Christian Miller)
Healthy, happy release back into the wild
2/0/2021 Real-life Finding Nemo: Turtle survives epic East Australian Current journey from Cairns to Sydney - ABC News
Cronulla the flatback turtle's epic adventure is even more remarkable given the species' hatchlings have an estimated one-in-1,000 survival rate due to predation, boat strikes and marine debris ingestion, including plastics.
With its quarantine period served, the little flatback turtle was released off Green Island near Cairns this week and will be monitored via a microchip.
Find more local news
• Tell us your location and find more local ABC News an~ information
"It had a fat little belly and was in very good condition, and on release it went off very quickly." Ms Gilbert said.
"It was really healthy; it went down to the bottom and had a look around."
Ms Gilbert is hopeful Cronulla the flatback turtle will live a Long and healthy life at sea with the species' life expectancy estimated at around 100 years.
https:/lwww.abc.netau/news/2020-12-04/baby-turtle-survives-epic-joumey-in-real-life-finding-nemo/12948054 85


Section c:
Crown of Thoms reports
87

oc IIC
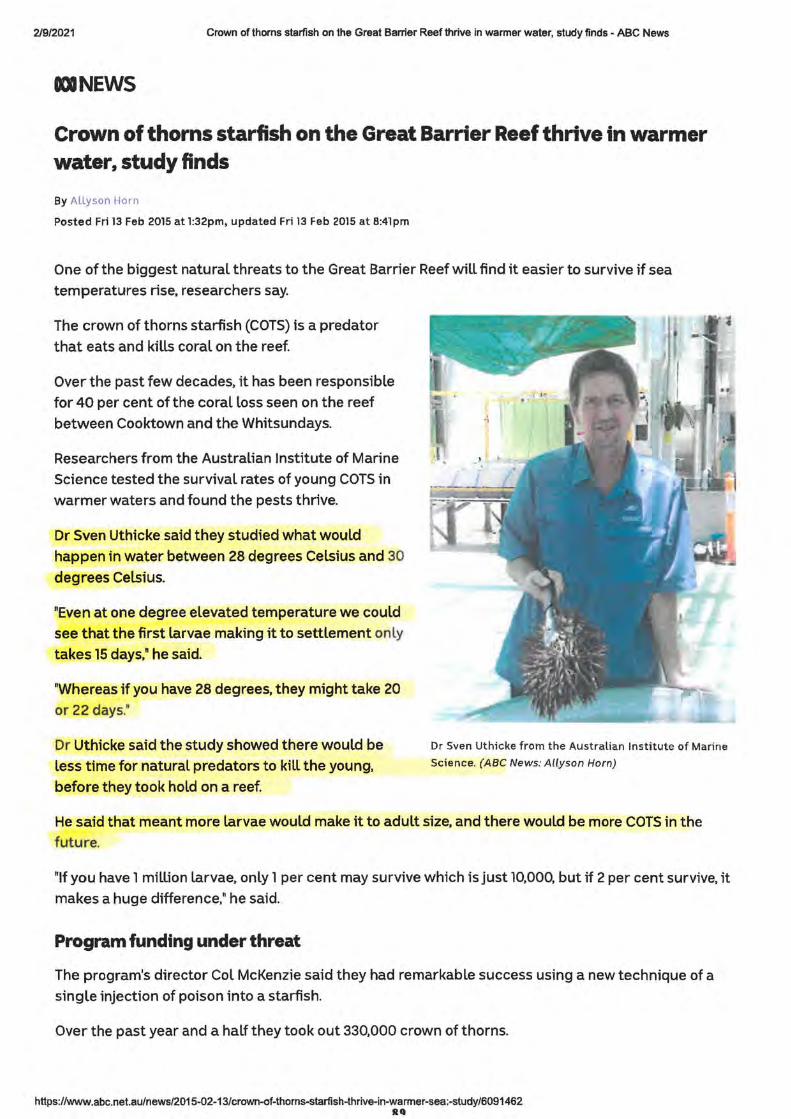
2/9/2021 Crown of thorns starfish on the Great Barrier Reef thrive in warmer water, study finds • ABC News
IDINEWS
Crown of thorns starfish on the Great Barrier Reef thrive in warmer water, study finds
By Allyson Horn
Posted Fri 13 Feb 2015 at 1:32pm, updated Fri 13 Feb 2015 at 8:41pm
One of the biggest natural threats to the Great Barrier Reef will find it easier to survive if sea
temperatures rise, researchers say.
The crown of thorns starfish (COTS) is a predator
that eats and kills coral on the reef.
Over the past few decades, it has been responsible
for 40 per cent of the coral loss seen on the reef
between Cooktown and the Whitsundays.
Researchers from the Australian Institute of Marine
Science tested the survival rates of young COTS in warmer waters and found the pests thrive.
Dr Sven Uthicke said they studied what would
happen in water between 28 degrees Celsius and 30
degrees Celsius.
"Even at one degree elevated temperature we could see that the first larvae making it to settlement only
takes 15 days," he said.
"Whereas if you have 28 degrees, they might take 20 or 22 days.~
Dr Uthicke said the study showed there would be less time for natural predators to kill the young,
before they took hold on a reef.
Dr Sven Uthicke from the Australian Institute of Marine
Science. (ABC News: Allyson Horn)
He said that meant more larvae would make it to adult size, and there would be more COTS in the future.
"If you have l million larvae. only l per cent may survive which is just 10,000, but if 2 per cent survive. it makes a huge difference," he said.
Program fund;ng under threat
The program's director Col McKenzie said they had remarkable success using a new technique of a
single injection of poison into a starfish.
Over the past year and a half they took out 330,000 crown of thorns.
https://www.abc.net.au/news/2015-02-13/crown-of-thorns-starfish-thrive-in-warmer-sea:•study/6091462 RQ
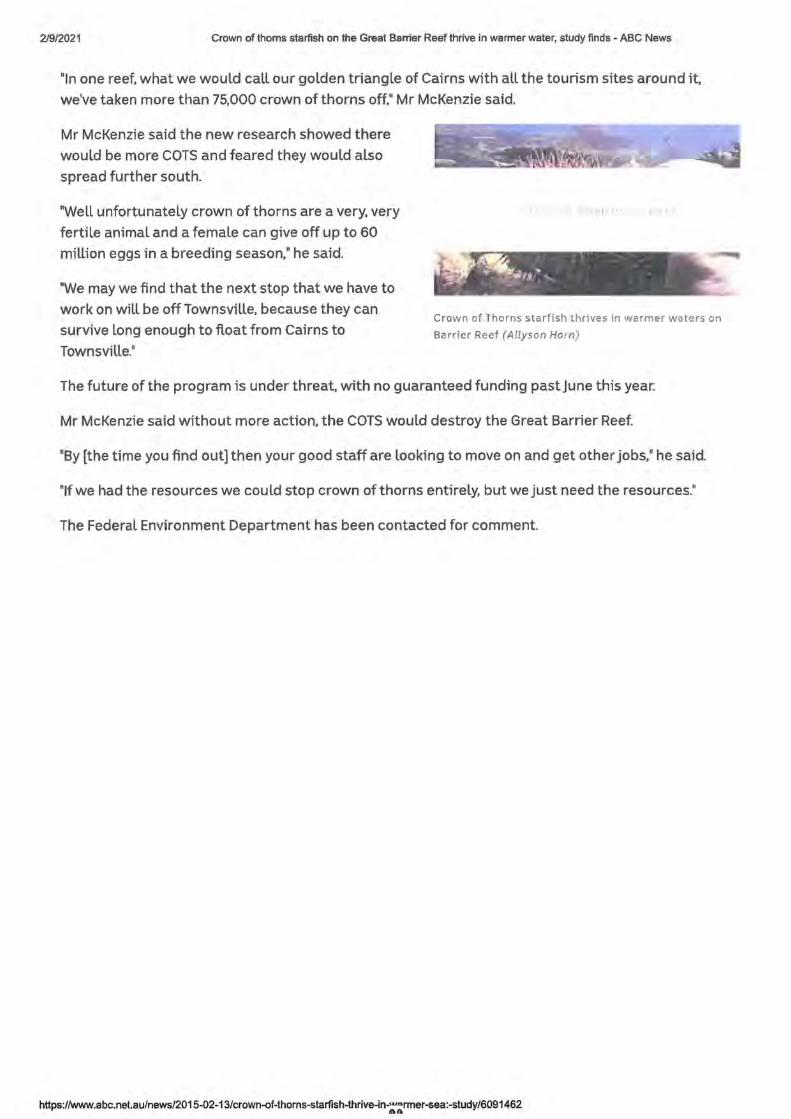
2/9/2021 Crown of thorns starfish on the Great Barrier Reef thrive in warmer water, study finds - ABC News
"In one reef, what we would call our golden triangle of Cairns with all the tourism sites around it,
we've taken more than 75,000 crown of thorns off," Mr McKenzie said.
Mr McKenzie said the new research showed there
would be more COTS and feared they would also
spread further south.
"Well unfortunately crown of thorns are a very, very
fertile animal and a female can give off up to 60
million eggs in a breeding season," he said.
"We may we find that the next stop that we have to
work on will be off Townsville, because they can
survive long enough to float from Cairns to
Townsville."
Crown of Thorns starfish thrives in warmer waters on
Barrier Reef (A llyson Hom)
The future of the program is under threat, with no guaranteed funding past June this year.
Mr McKenzie said without more action, the COTS would destroy the Great Barrier Reef.
"By [the time you find out] then your good staff are looking to move on and get other jobs," he said.
"If we had the resources we could stop crown of thorns entirely, but we just need the resources."
The Federal Environment Department has been contacted for comment.
https://www.abc.nel.au/news/2015-02-13/crown-of-thorns-starfish-thrive-in-;•:rmer-sea:-study/6091462
09/02/2021 12 February: Crown of Thoms thriving as ocean temperatures rise I AIMS
W.
What are you looking for?
Home(/)
/\bout (/docs/«bout/ :1bout.html)
Research (/docs/research/r2search.htm!)
Data (!docs/data/data.html)
Medi;; (ldocs/media/media .htrnl)
Publk.ations (/publi:::cti0ns.html)
12 February: Crown of Thorns thriving as ocean temperatures rise 12 February 2015
Scientists from the Australian Institute of Marine Science (AIMS)* have revealed in a study published in
Scientific Reports today that rising sea surface temperatures are contributing to the survival rate of the coral
eating seastar, Acanthaster planci - better known as the Crown of Thorns {CQIS).
.(bllp://www.ajms.gov,au/cots) ..
Much of the research was carried out in the National Sea Simulator at AIMS. U)igh-tech marine laboratory_
near TownsviUe in Queensland (bllp:/ /www.aims.gov.au/ seasim) ..
"Warmer sea temperatures were found in this study to enhance COTS survival along with other, cumulative
pressures on the reef," said report author and AIMS scientist, Dr Syen Uthjcke
.(bllp://data,aims.gov.au/staffcv/jsf/external/vjew,xhtml;jsessjonjd=S7CD13D591 EESBAC9AA4B6SDBDBE0C7C? JmtY-ld = 100000189)..
Uthicke explained that a 2° C increase in sea temperature can increase the probability of survival of COTS by
240% under certain conditions. These conditions include the availability of nutrients for COTS larvae to feed
on.
"Recognising the role of synergistic effects of increased nutrient flows and sea surface temperatures on C
survival better enables scientists to understand the science behind outbreaks," said Uthicke.
https://www.alms.aov.au/docs/media/media-release-archives/2015/-/asset i9..hlisher/maRoJMb44Yn0/content/12-februarv-crawn-of-thorn!::-thrivin ..
09/02/2021 12 February: Crown of Thorns thriving as ocean temperatures rise I AIMS
COTS outbreaks are a significant stress on the survival of corals on the Great Barrier Reef (GBR). A range of
scientific research indicates that COTS outbreaks are a major contributor to the estimated 50% decline in coral
cover during the period of 1985 and 2012.
"Given that the most moderate climate chang~{b.t:tp://www.ajms.goy.au/research/dimate-changg)_ scenarios
predict a 1-2° C increase in average sea temperatures, the present study further demonstrates the value of
taking a holistic, multi-variable approach to understand better how cumulative factors affect the survival of
species such as COTS," Dr Uthicke concluded.
*Two of the researchers involved in this study are working at the University of Sydney and the University of
Otago.
**The Australian Institute of Marine Science's National Sea Simulator (SeaSim).
.(http://www,ajms.gov,au/seasjm) is a world-class marine research aquarium facility for tropical marine
organisms in which scientists can conduct cutting.:fill.ge research (b..ttp;//www.aims.gov.au/docs/medja/latest
news/-/asset publisher/EnASgMcJvXjd/content/applicatjon-jnformatjon).. Using SeaSim, Australian and
international scientists can research the impact of complex environmental changes with large, long-term,
experiments in which they can manipulate key environmental factors.
00080 !b.nps:/Jtwitfet~&I•• W!MMsMdnnft>e+#ilt : I 1 f '. fzrHr:fhvr:trrlaompovtei,
About Us (!docs/about/about.html). Research <!docs/research/research.html)_ ~ (!docs/data/data.html).
Media (ldocs/medja/medja.html). Publications (Lpublicatjons.html)_ Contact Udocs/about/contacts.htmD.
Newsletter UwaY.P-oint.html}.
FOi Disclosure (/docs/publications/foi-01-statement.html) Information Publication Scheme (lips)
Public Interest Disclosure scheme (lpid) Attributing AIMS (!docs/cc-attribution.html)
Copyright Notice (!docs/cc-copyright.html) Disclaimer (/docs/disclaimer.html)
Privacy Policy (/docs/privacy-policy.html)
© 1996-2021 Australian Institute of Marine Science !(or\.
19'/02/2021 Cfimate change as an unexpected co-factor promoting coral eating seastar (Acanthaster planci) outbreaks
Scj ReQ. 2015; 5: 8402.
SCIENTIFIC REPORTS
natttft.'~ar,h
Published online 2015 Feb 12. doi: 10.1038/sre~
PMCID: PMC4325318
PMID: 25672480
Climate change as an unexpected co-factor promoting coral eating seastar (Acanthaster plane,) outbreaks
S. Uthicke,8 • 1 M. LQgan, 1 M. LiddY., 1 D. Francis, 1 N. Hardy} and M. Lamare3
1Australian Institute of Marine Science, PMB 3, Townsville MC, Townsville 4810, Queensland, Australia 2Schools of Medical and Biological Sciences, F13 - Anderson Stuart Building, University of Sydney, NSW 2006
Australia 3Department of Marine Science, University of Otago, Dunedin, New Zealand
aEmail: [email protected]
Received 2014 Sep 14; Accepted 2015 Jan 16.
COP-Y.ri9b! © 2015, Macmillan Publishers Limited. All rights reserved
This work is licensed under a Creative Commons Attribution 4.0 International License. The images or other
third party material in this article are included in the article's Creative Commons license, unless indicated
otherwise in the credit line; if the material is not included under the Creative Commons license, users will need
to obtain permission from the license holder in order to reproduce the material. To view a copy of this license,
visit http://creativecommons.org/licenses/by/4.0/
Abstract
Coral reefs face a crisis due to local and global anthropogenic stressors. A large proportion of the ~50% coral loss on the Great Barrier Reef has been attributed to outbreaks of the crown-of-thoms-seastar (COTS). A widely assumed cause of primary COTS outbreaks is increased larval survivorship due to higher food availability, linked with anthropogenic runoff. Our experiment using a range of algal food concentrations at three temperatures representing present day average and predicted future increases, demonstrated a strong influence of food concentration on development is modulated by temperature. A 2°C increase in temperature led to a 4.2-4.9 times (at Day 10) or 1.2-1.8 times (Day 17) increase in late development larvae. A model indicated that food was the main driver, but that temperature was an important modulator of development. For instance, at 5000 cells ml-1 food, a 2°C increase may shorten
developmental time by 30% and may increase the probability of survival by 240%. The main contribution of temperature is to 'push' well-fed larvae faster to settlement. We conclude that warmer sea temperature is an important co-factor promoting COTS outbreaks.
Coral reefs world-wide are under pressure because of global stressors such as wanning sea surface temperatures (SST), ocean acidificationl.2. and local disturbances such as eutrophication and
overfishingl. These factors are often investigated in isolation, but the importance of interactions
between local and global stressors is increasingly recognized and of greater relevance under future
climate change scenarios~.
Coral cover on Australia's Great Barrier Reef (GBR) reduced by as much as 50% between 1985 and 2012, with a large proportion (~42%) of this decline attributed to outbreaks of the coral-eating seastar Acanthaster planci (crown-of-thoms-seastar, COTS)~ and coral bleaching (~10%) through increased
SST. Outbreaks of COTS have been recorded on many lndo-Pacific coral reefs and are characterized by rapid adult population increases and associated massive loss of corals (reviewed in 6).
https:/lwww.ncbi.nlm.nih.gov/pmc/articles/PMC4325318/
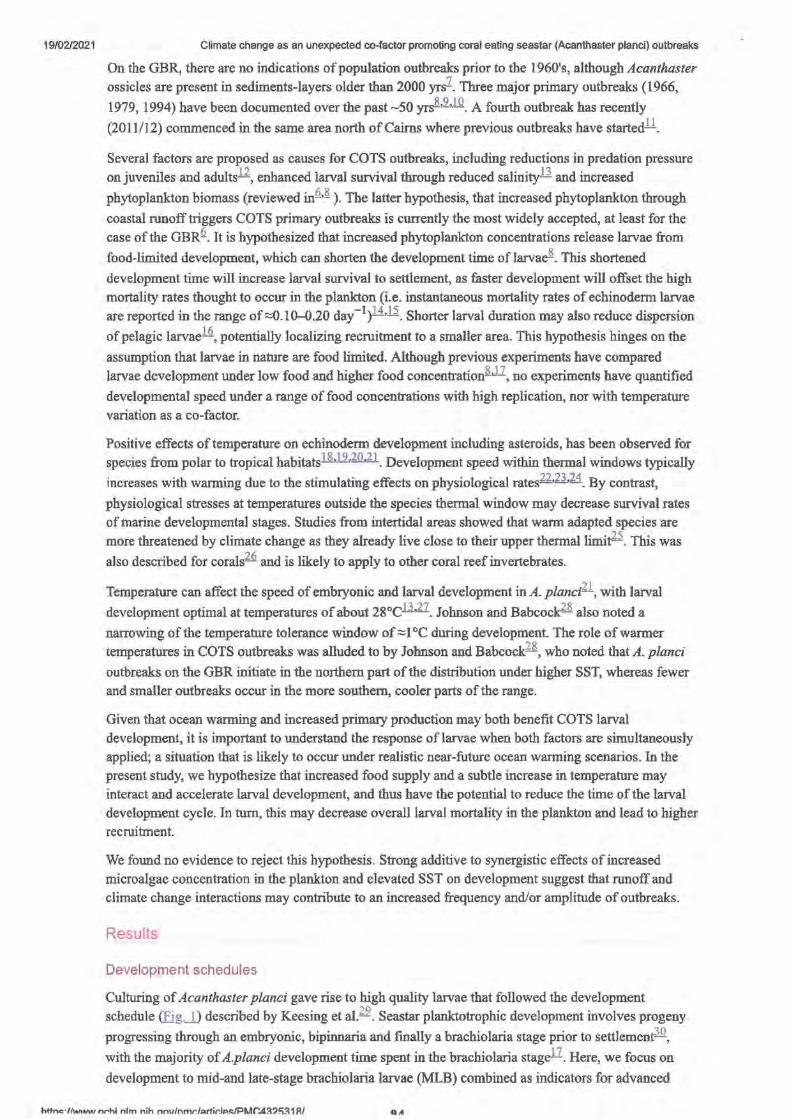
19/02/2021 Climate change as an unexpected co-factor promoting coral eating seastar (Acanthaster planci) outbreaks
On the GBR, there are no indications of population outbreaks prior to the 1960's, although Acanthaster
ossicles are present in sediments-layers older than 2000 yrs1. Three major primary outbreaks (1966,
1979, 1994) have been documented over the past ~50 ~ .2.,lO_ A fourth outbreak has recently
(2011/12) commenced in the same area north of Cairns where previous outbreaks have startedll.
Several factors are proposed as causes for COTS outbreaks, including reductions in predation pressure
on juveniles and adults12, enhanced larval survival through reduced salinity13 and increased
phytoplankton biomass (reviewed in~.S. ). The latter hypothesis, that increased phytoplankton through
coastal runoff triggers COTS primary outbreaks is currently the most widely accepted, at least for the
case of the GBR~. It is hypothesized that increased phytoplankton concentrations release larvae from
food-limited development, which can shorten the development time of larvae.S.. This shortened
development time will increase larval survival to settlement, as faster development will offset the high
mortality rates thought to occur in the plankton (i.e. instantaneous mortality rates of echinoderm larvae are reported in the range of::::::0.10--0.20 day-1# •.li_ Shorter larval duration may also reduce dispersion
of pelagic larvae 16, potentially localizing recruitment to a smaller area. This hypothesis hinges on the
assumption that larvae in nature are food limited. Although previous experiments have compared larvae development under low food and higher food concentration.S..11, no experiments have quantified
developmental speed under a range of food concentrations with high replication, nor with temperature variation as a co-factor.
Positive effects of temperature on echinoderm development including asteroids, has been observed for species from polar to tropical habitatsll,l9,2il.ll_ Development speed within thermal windows typically
increases with warming due to the stimulating effects on physiological rates22•23•24. By contrast,
physiological stresses at temperatures outside the species thermal window may decrease survival rates
of marine developmental stages. Studies from intertidal areas showed that warm adapted species are
more threatened by climate change as they already live close to their upper thennal limi~ . This was
also described for corals22 and is likely to apply to other coral reef invertebrates.
Temperature can affect the speed of embryonic and larval development in A. planci21 , with larval
development optimal at temperatures of about 28°C13.2.Z. Johnson and Babcockf8 also noted a
narrowing of the temperature tolerance window of:::::l °C during development. The role of warmer
temperatures in COTS outbreaks was alluded to by Johnson and Babcockf8, who noted that A. planci
outbreaks on the GBR initiate in the northern part of the distribution under higher SST, whereas fewer
and smaller outbreaks occur in the more southern, cooler parts of the range.
Given that ocean warming and increased primary production may both benefit COTS larval
development, it is important to understand the response of larvae when both factors are simultaneously
applied; a situation that is likely to occur under realistic near-future ocean warming scenarios. In the present study, we hypothesize that increased food supply and a subtle increase in temperature may
interact and accelerate larval development, and thus have the potential to reduce the time of the larval development cycle. In turn, this may decrease overall larval mortality in the plankton and lead to higher
recruitment.
We found no evidence to reject this hypothesis. Strong additive to synergistic effects of increased
microalgae concentration in the plankton and elevated SST on development suggest that runoff and
climate change interactions may contribute to an increased frequency and/or amplitude of outbreaks.
Results
Development schedules
Culturing of Acanthaster planci gave rise to high quality larvae that followed the development schedule (Eig,.l) described by Keesing et al.22. Seastar planktotrophic development involves progeny
progressing through an embryonic, bipinnaria and finally a brachiolaria stage prior to settlemenJ 0,
with the majority of A.planci development time spent in the brachiolaria stageil. Here, we focus on
development to mid-and late-stage brachiolaria larvae (MLB) combined as indicators for advanced
httnc,-/lw,.,.., nr,hl nlm nih nnvlnmd<1rtir.l1>~/PMrA::l?1'::l11l/ OA
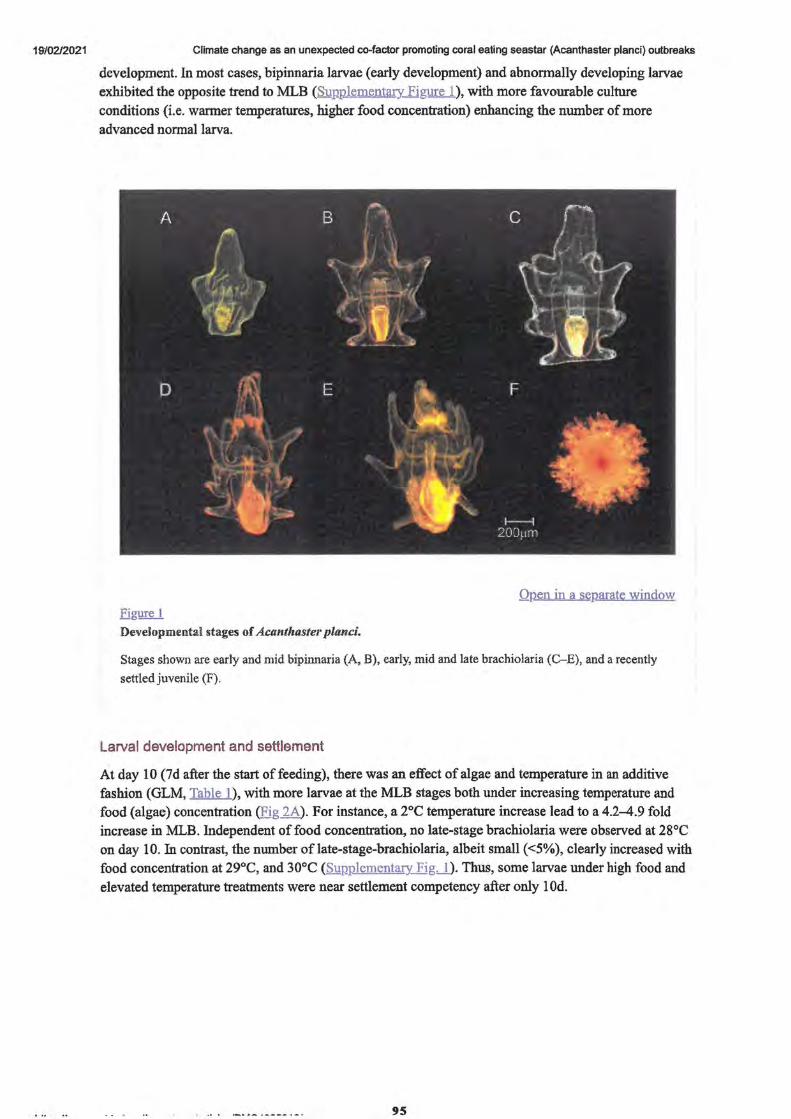
19102/2021 Climate change as an unexpected co-factor promoting coral eating seastar (Acanthaster planci) outbreaks
development. In most cases, bipinnaria larvae (early development) and abnormally developing larvae exhibited the opposite trend to MLB (Supplementary. Figu...Kl), with more favourable culture conditions (i.e. warmer temperatures, higher food concentration) enhancing the number of more advanced normal larva.
Qpen in a separate window Figure l
Developmental stages of Acantliaste,. planci.
Stages shown are early and mid bipinnaria (A, B), early, mid and late brachiolaria (C-E), and a recently
settled juvenile (F).
Larval development and settlement
At day 10 (7d after the start of feeding), there was an effect of algae and temperature in an additive fashion (GLM, Table 1), with more larvae at the MLB stages both under increasing temperature and food (algae) concentration (Fig 2A). For instance, a 2°C temperature increase lead to a 4.2-4.9 fold increase in MLB. Independent of food concentration, no late-stage brachiolaria were observed at 28°C on day 10. In contrast, the number oflate-stage-brachiolaria, albeit small (<5%), clearly increased with food concentration at 29°C, and 30°C (SuP.plementfil)'. FigJ.). Thus, some larvae under high food and elevated temperature treatments were near settlement competency after only 1 Od.
95
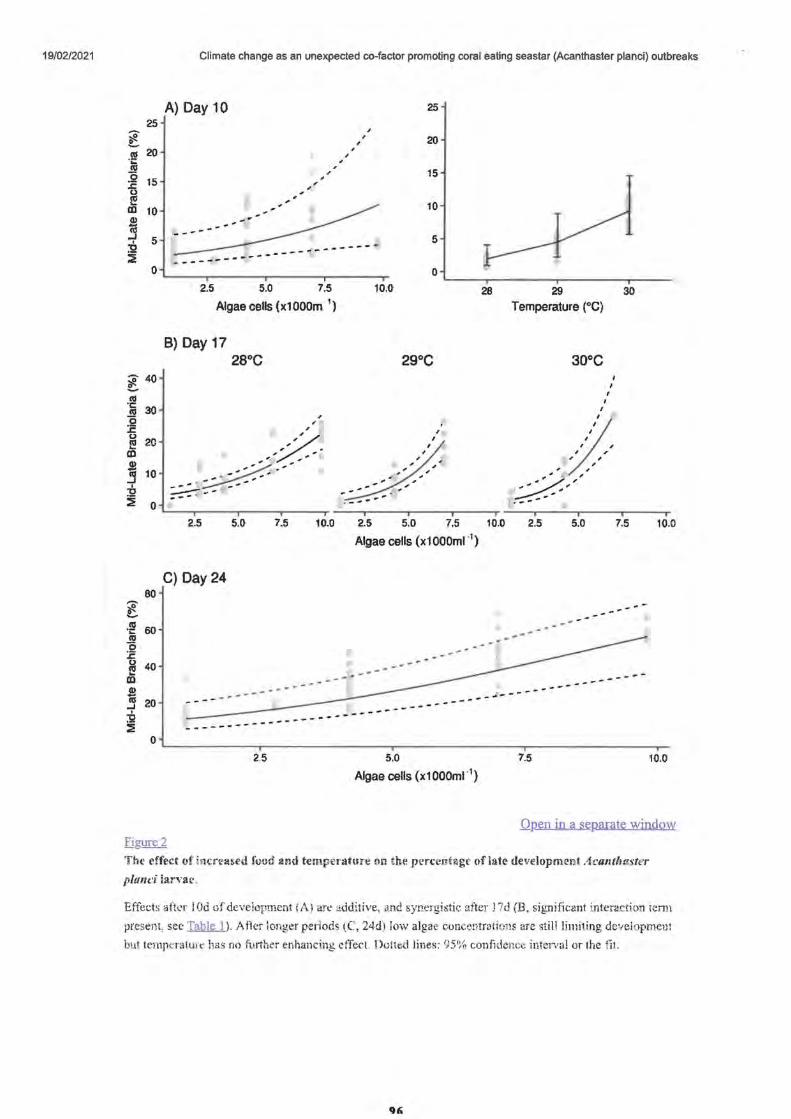
19/02/2021 Climate change as an unexpected co-factor promoting coral eating seastar (Acanthaster planci) outbreaks
25 ,-... ~ ~ CII 20
·i: .!!l .Q 15 .c 0 e m 10 .!l j
5 ll :2
0
t 40
CII ·c 30 CII
£! .c u f! 20 en .!l
10 3 I
"O ~ 0
80
1 ....... IV
60 ·c IV £! J:. 0 40 f!
a:a
~ 20
:2 :E
0
A) Day 10
I , , , , , ,
----2.5 5.0 7.5
Algae cells (x1000m 1)
B) Day 17 28°C
, ,, ,
/. , . ,
~,, . ---. :..:--- · --- -.
2.5 5.0 7.5 10.0
C) Day 24
--- ----------- ----
25
, , , 20 ,
15
10
5
0
10.0 28
2s0 c
2.5 5.0 7.5 10.0
Algae cells (x1000ml '1)
-----------
29
Temperature (°C)
30°c
I I
I I
I
I
'
I I , , , , __ .,:;._ ,,'
:_.-.:-:, -, . -.. -
30
2.5 5.0 7.5
--- -----
- ----- ----------... ..,_ -------------- -------------- -------2.5 5.0 7.5
Algae cells ( x 1 000ml · 1)
10.0
10.0
Open in a separate window Egure 2
The effect of increased food and temperature on the percentage of late de,,elopment Aca11thuster
plund larvae.
Effects after I Od of development (A) an.· additive, and synergistic after 17d (B, significant interaction tenn
present, sec Table 1 ). After longer periods t C, 24d) low algae concentrations are still limiting development
but temperatun: has no further enhancing effect. Dotted lines: 95%, confidence interval or the fit.
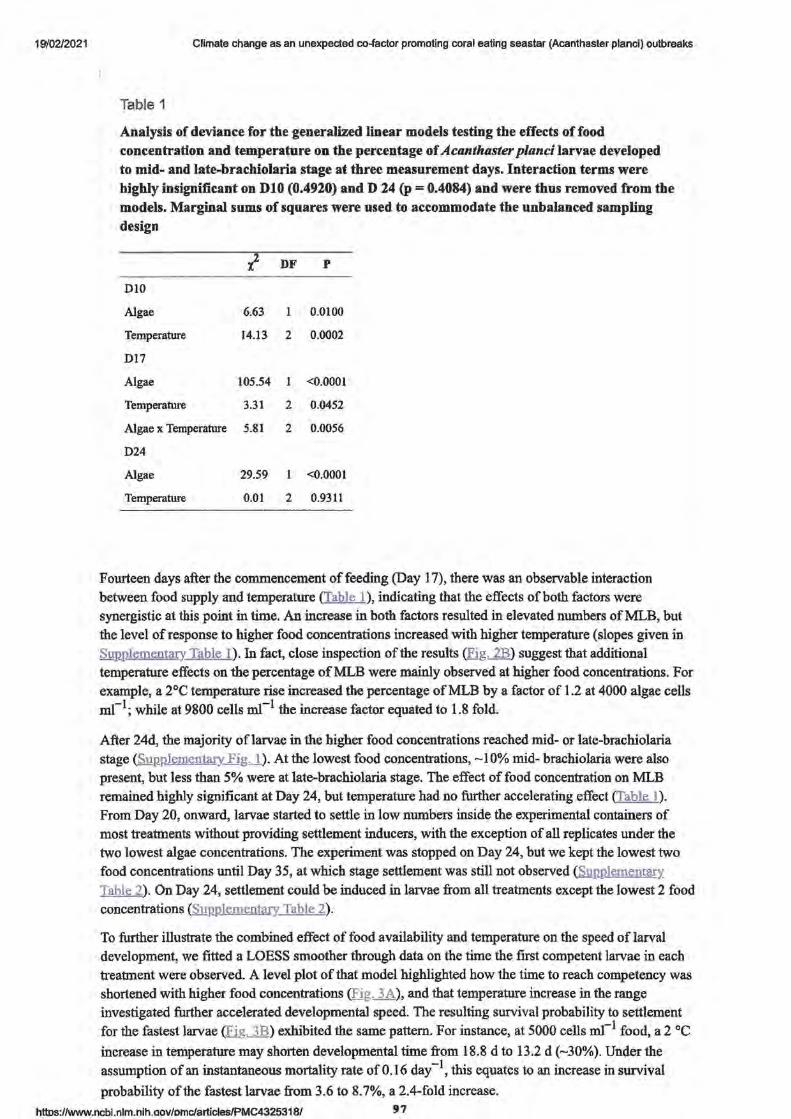
191'02/2021 Climate change as an unexpected co.factor promoting coral eating seastar (Acanthaster planci) outbreaks
Table 1
Analysis of deviance for the generalized linear models testing the effects of food concentration and temperature on the percentage of Acanthaster planci larvae developed to mid- and late-brachiolaria stage at three measurement days. Interaction terms were highly insignificant on DlO (0.4920) and D 24 (p = 0.4084) and were thus removed from the models. Marginal sums of squares were used to accommodate the unbalanced sampling design
X DF p
DlO
Algae 6.63 1 0.0100
Temperature 14.13 2 0.0002
D17
Algae 105.54 1 <0.0001
Temperature 3.31 2 0.0452
Algae x Temperature 5.81 2 0.0056
D24
Algae 29.59 <0.0001
Temperature 0.01 2 0.9311
Fourteen days after the commencement of feeding (Day 17), there was an observable interaction between food supply and temperature (Table 1 ), indicating that the effects of both factors were synergistic at this point in time. An increase in both factors resulted in elevated numbers of MLB, but the level of response to higher food concentrations increased with higher temperature (slopes given in Su1mlementfilY. Table 1). In fact, close inspection of the results (Fig. 2B) suggest that additional temperature effects on the percentage ofMLB were mainly observed at higher food concentrations. For example, a 2°C temperature rise increased the percentage ofMLB by a factor of 1.2 at 4000 algae cells mC1; while at 9800 cells mC1 the increase factor equated to 1.8 fold.
After 24d, the majority oflarvae in the higher food concentrations reached mid- or late-brachiolaria stage (Supplementary FigJ_). At the lowest food concentrations, ~ 10% mid- brachiolaria were also present, but less than 5% were at late-brachiolaria stage. The effect of food concentration on MLB remained highly significant at Day 24, but temperature had no further accelerating effect {Table 1 ). From Day 20, onward, larvae started to settle in low numbers inside the experimental containers of most treatments without providing settlement inducers, with the exception of all replicates under the two lowest algae concentrations. The experiment was stopped on Day 24, but we kept the lowest two food concentrations until Day 35, at which stage settlement was still not observed (ful12P-lementfilY. Table 2). On Day 24, settlement could be induced in larvae from all treatments except the lowest 2 food concentrations (,SypplementaIY. Table 2}.
To further illustrate the combined effect of food availability and temperature on the speed of larval development, we fitted a LOESS smoother through data on the time the first competent larvae in each treatment were observed. A level plot of that model highlighted how the time to reach competency was shortened with higher food concentrations (Eig. 3A), and that temperature increase in the range investigated further accelerated developmental speed. The resulting survival probability to settlement for the fastest larvae (Eig. 3B) exhibited the same pattern. For instance, at 5000 cells mr1 food, a 2 °C
increase in temperature may shorten developmental time from 18.8 d to 13.2 d (~30%). Under the assumption of an instantaneous mortality rate of 0.16 day-1, this equates to an increase in survival
probability of the fastest larvae from 3.6 to 8.7%, a 2.4-fold increase.
httos://www.ncbi.nlm.nih.aov/omc/articles/PMC4325318/ 97
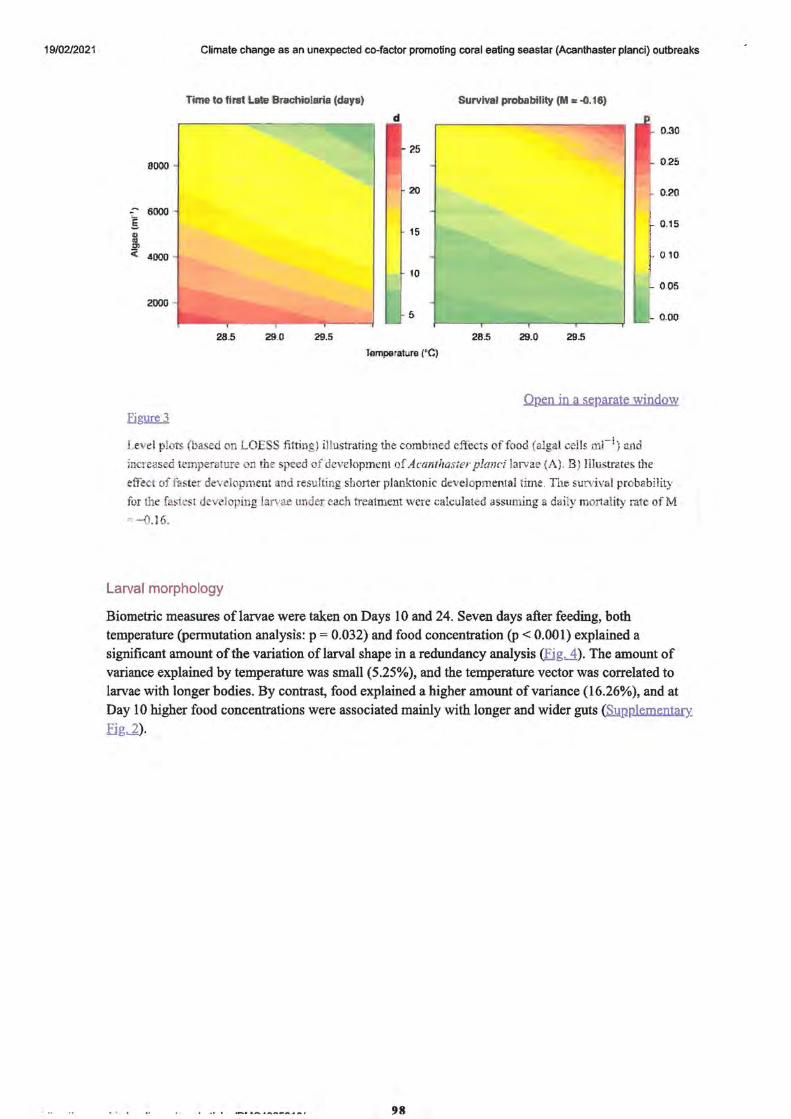
19/02/2021 Climate change as an unexpected co-factor promoting coral eating seastar (Acanthaster planci) outbreaks
Time to first late Brachiolaria (days) Survival probability (M "'-0.16)
d
?.5
8000
20 0.20
g 6000 -
Ill
-15
0.1 5
Cl
< 4000 - o rn 10
005
2000 - --- 5 o.oo I
28.5 29.0 29.5 28.5 29.0 29.5
fompe at re (' C)
Qpen in a separate window .Eigm:e 3
Level plots (based on LOESS fitting) illustrating the combined effects of food (algal cells ml-1) and
increased temperature on the speed of development of Amnthasterplanci larvae (A). B) Illustrates the
effect of faster development and resul ting shorter planktonic developmental time. The survival probability
for the fastest developing larvae under each treatment were calculated assuming a daily mortality rate ofM
= -0.16.
Larval morphology
Biometric measures oflarvae were taken on Days 10 and 24. Seven days after feeding, both temperature (permutation analysis: p = 0.032) and food concentration (p < 0.001) explained a significant amount of the variation oflarval shape in a redundancy analysis (.fig.A). The amount of variance explained by temperature was small (5.25%), and the temperature vector was correlated to larvae with longer bodies. By contrast, food explained a higher amount of variance ( 16.26% ), and at Day 10 higher food concentrations were associated mainly with longer and wider guts (S,ypplementary_
Eig..l).
98
19102/2021 Climate change as an unexpected co-factor promoting coral eating seastar (Acanthaster planci) outbreaks
1.5 • 1100cellsml·1
O 2800
1.0 0 4200
,s. 05
)13 :!! 0.0
N c§ a::-05
-1.0
-1.5
• 1000 • 9800
DaylO
BL
-2.0 -1.S -1.0 -0.S 0.0 0.5 1.0
ROA1 70.79%
Figyre4
Oay24
1.0
0.5
~-0.S
-1.0
-1.S -1.0 -0.S
R0\1 80.09%
Biometric analyses of Acanthaster planci larvae at day 10 and 24 of their development under
different algal concentrations and temperatures.
Food concentrations are indicated by colour (see legend) and samples from the same temperature are
surrounded by red outlines. In addition, temperature treatments are indicated by different symbols (28°C:
circles, 29°C: squares, 28°C: diamonds}. Black vectors are the individual biometric measures (BL: Body
Length, BW: Body Width, GH: Gut Hood, GL: Gut Length, GW: Gut Width, MH: Mouth Hood, MW:
Mouth Width) and green vectors represent the environmental variables. Analyses and plots are based on
average values per replicated experimental container.
After 24d, the effect of temperature was non-significant (p = 0.100) in the redundancy analysis, and no morphometric measures correlated with that factor (Fig.A). By contrast, food concentrations remained a significant environmental variable (P < 0.001) and explained a large amount of the variance in larval morphology observed ( 4 7.48% ). After three weeks of feeding, all biometric measures were positively correlated to food supply. Thus, higher food concentration resulted in larger larvae (SupplementafY. Figure 3). Similar to the analysis of the development stages (see above), we propose that the effects of temperature were reduced at this late stage of development because larvae at lower temperatures have now 'caught up' with development. In addition, settlement of the largest larvae in higher temperatures and potentially mortality will have selectively removed larger larvae.
Larval mortality
On day 24, larval densities remained high (global average: 0.45 larvae ml-1, SD= 0.24 larvae mC1),
with daily mortality rates (average M ;::: -0.07 day-1) resulting in a density of 0.04--0.31 larvae mC 1
after 24d of culturing. A higher mortality was observed in the highest temperature treatment, with 8 out of 18 replicates in that temperature experiencing high mortality. Given that larvae in the remaining replicates of the same temperature did well, we attributed the loss to husbandry issues [i.e. bacterial infections more likely in higher temperatures, e.g.2-1] and not to a direct adverse effect of elevated
temperature on larval physiology.
Discussion
https:/lwww.ncbi.nlm.nih.gov/pmc/articles/PMC4325318/ 99
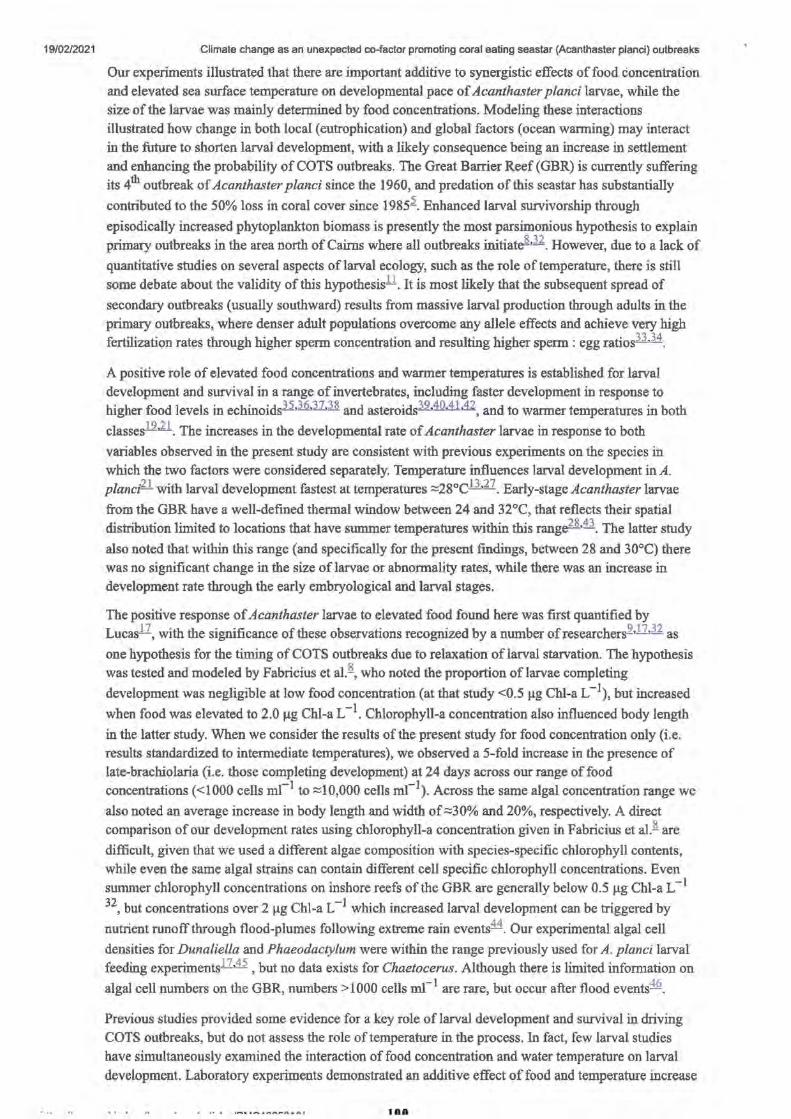
19/02/2021 Climate change as an unexpected co-factor promoting coral eating seastar (Acanthaster planci) outbreaks
Our experiments illustrated that there are important additive to synergistic effects of food concentration and elevated sea surface temperature on developmental pace of Acanthaster planci larvae, while the size of the larvae was mainly determined by food concentrations. Modeling these interactions illustrated how change in both local (eutrophication) and global factors (ocean warming) may interact in the future to shorten larval development, with a likely consequence being an increase in settlement and enhancing the probability of COTS outbreaks. The Great Barrier Reef (GBR) is currently suffering its 4th outbreak of Acanthaster planci since the 1960, and predation of this seastar has substantially
contributed to the 50% loss in coral cover since 1985.1. Enhanced larval survivorship through
episodically increased phytoplankton biomass is presently the most parsimonious hypothesis to explain primary outbreaks in the area north of Cairns where all outbreaks initiat~ '.12.. However, due to a lack of
quantitative studies on several aspects of larval ecology, such as the role of temperature, there is still some debate about the validity of this hypothesisll. It is most likely that the subsequent spread of
secondary outbreaks (usually southward) results from massive larval production through adults in the primary outbreaks, where denser adult populations overcome any allele effects and achieve very high fertilization rates through higher sperm concentration and resulting higher sperm : egg ratios33•34.
A positive role of elevated food concentrations and warmer temperatures is established for larval development and survival in a range of invertebrates, including faster development in response to higher food levels in echinoidsJj,lQ.,TI.3& and asteroidsl2..~.4i .~ , and to warmer temperatures in both
classes-12.21. The increases in the developmental rate of Acanthaster larvae in response to both
variables observed in the present study are consistent with previous experiments on the species in which the two factors were considered separately. Temperature influences larval development in A. planci21 with larval development fastest at temperatures ;:::28°cll,27. Early-stage Acanthaster larvae
from the GBR have a well-defined thermal window between 24 and 32°C, that reflects their spatial distribution limited to locations that have summer temperatures within this rang~ 43. The latter study
also noted that within this range (and specifically for the present findings, between 28 and 30°C) there was no significant change in the size oflarvae or abnormality rates, while there was an increase in development rate through the early embryological and larval stages.
The positive response of Acanthaster larvae to elevated food found here was first quantified by Lucas17, with the significance of these observations recognized by a number ofresearchers2·17•32 as
one hypothesis for the timing of COTS outbreaks due to relaxation of larval starvation. The hypothesis was tested and modeled by Fabricius et al.~, who noted the proportion oflarvae completing
development was negligible at low food concentration (at that study <0.5 µg Chl-a L-1), but increased
when food was elevated to 2.0 µg Chl-a L - l _ Chlorophyll-a concentration also influenced body length
in the latter study. When we consider the results of the present study for food concentration only (i.e. results standardized to intermediate temperatures), we observed a 5-fold increase in the presence of late-brachiolaria (i.e. those completing development) at 24 days across our range of food concentrations (<1000 cells mi-I to ;:::I0,000 cells mC1). Across the same algal concentration range we
also noted an average increase in body length and width of;:::30% and 20%, respectively. A direct comparison of our development rates using chlorophyll-a concentration given in Fabricius et al.~ are
difficult, given that we used a different algae composition with species-specific chlorophyll contents, while even the same algal strains can contain different cell specific chlorophyll concentrations. Even summer chlorophyll concentrations on inshore reefs of the GBR are generally below 0.5 µg Chl-a L-1
32, but concentrations over 2 µg Chi-a L-l which increased larval development can be triggered by
nutrient runoff through flood-plumes following extreme rain events~ . Our experimental algal cell
densities for Dunaliella and Phaeodactylum were within the range previously used for A. planci larval feeding experiments17.45 , but no data exists for Chaetocerus. Although there is limited information on
algal cell numbers on the GBR, numbers> 1000 cells mi-I are rare, but occur after flood events46.
Previous studies provided some evidence for a key role of larval development and survival in driving COTS outbreaks, but do not assess the role of temperature in the process. In fact, few larval studies have simultaneously examined the interaction of food concentration and water temperature on larval
development. Laboratory experiments demonstrated an additive effect of food and temperature increase
100
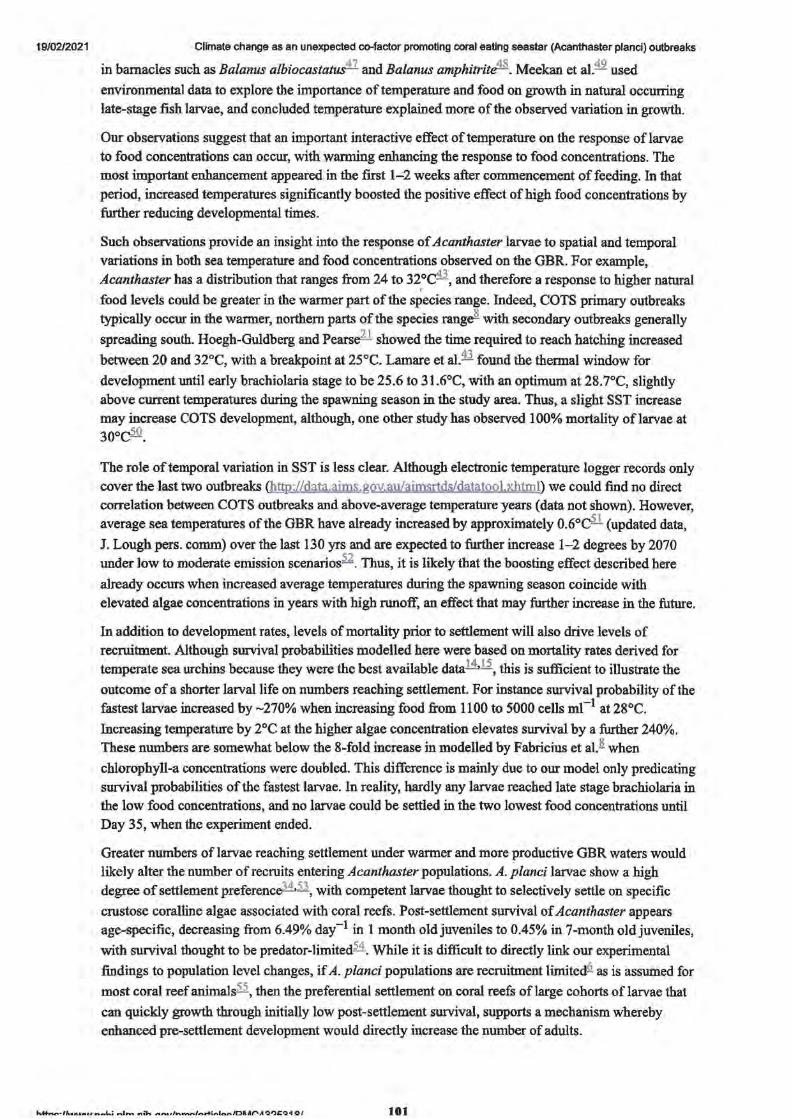
19/02/2021 Climate change as an unexpected co-factor promoting coral eating seastar (Acanthaster planci) outbreaks
in barnacles such as Ba/anus albiocastatusil and Ba/anus amphitrittfoi. Meekan et aI.49 used
environmental data to explore the importance of temperature and food on growth in natural occurring
late-stage fish larvae, and concluded temperature explained more of the observed variation in growth.
Our observations suggest that an important interactive effect of temperature on the response of larvae
to food concentrations can occur, with warming enhancing the response to food concentrations. The
most important enhancement appeared in the first 1-2 weeks after commencement of feeding. In that
period, increased temperatures significantly boosted the positive effect of high food concentrations by
further reducing developmental times.
Such observations provide an insight into the response of Acanthaster larvae to spatial and temporal
variations in both sea temperature and food concentrations observed on the GBR. For example,
Acanthaster has a distribution that ranges from 24 to 32°C43, and therefore a response to higher natural f
food levels could be greater in the warmer part of the species range. Indeed, COTS primary outbreaks
typically occur in the warmer, northern parts of the species rang& with secondary outbreaks generally
spreading south. Hoegh-Guldberg and Pearse21 showed the time required to reach hatching increased
between 20 and 32°C, with a breakpoint at 25°C. Lamare et al.43 found the thermal window for
development until early brachiolaria stage to be 25.6 to 3 l .6°C, with an optimum at 28. 7°C, slightly
above current temperatures during the spawning season in the study area. Thus, a slight SST increase may increase COTS development, although, one other study has observed 100% mortality of larvae at 3ooc50_
The role of temporal variation in SST is less clear. Although electronic temperature logger records only
cover the last two outbreaks (htm://data.aims.gov.au/aimsrtds/datatool.xhtml) we could find no direct
correlation between COTS outbreaks and above-average temperature years (data not shown). However, average sea temperatures of the GBR have already increased by approximately 0.6°Cil (updated data,
J. Lough pers. comm) over the last 130 yrs and are expected to further increase 1-2 degrees by 2070 under low to moderate emission scenarios52. Thus, it is likely that the boosting effect described here
already occurs when increased average temperatures during the spawning season coincide with
elevated algae concentrations in years with high runoff, an effect that may further increase in the future.
In addition to development rates, levels of mortality prior to settlement will also drive levels of
recruitment. Although survival probabilities modelled here were based on mortality rates derived for
temperate sea urchins because they were the best available dataH.15, this is sufficient to illustrate the
outcome of a shorter larval life on numbers reaching settlement. For instance survival probability of the
fastest larvae increased by ~270% when increasing food from 1100 to 5000 cells mi-1 at 28°C.
Increasing temperature by 2°C at the higher algae concentration elevates survival by a further 240%. These numbers are somewhat below the 8-fold increase in modelled by Fabricius et al..8. when
chlorophyll-a concentrations were doubled. This difference is mainly due to our model only predicating
survival probabilities of the fastest larvae. In reality, hardly any larvae reached late stage brachiolaria in
the low food concentrations, and no larvae could be settled in the two lowest food concentrations until Day 35, when the experiment ended.
Greater numbers of larvae reaching settlement under warmer and more productive GBR waters would likely alter the number of recruits entering Acanthaster populations. A. planci larvae show a high
degree of settlement preferenceli•53, with competent larvae thought to selectively settle on specific
crustose coralline algae associated with·coral reefs. Post-settlement survival of Acanthaster appears age-specific, decreasing from 6.49% day-l in 1 month old juveniles to 0.45% in 7-month old juveniles,
with survival thought to be predator-limited54. While it is difficult to directly link our experimental
findings to population level changes, if A. planci populations are recruitment limited§. as is assumed for
most coral reef animals55 , then the preferential settlement on coral reefs of large cohorts of larvae that
can quickly growth through initially low post-settlement survival, supports a mechanism whereby enhanced pre-settlement development would directly increase the number of adults.
kf+n.~~tlt.an.u1.11., -.-a...= .... 1...,, nih .,.,...,/..,."""',.,/~.+1,..1.n.r-/DP.Ar'>Jl'l.'lC':I! ◄ 0/ 101
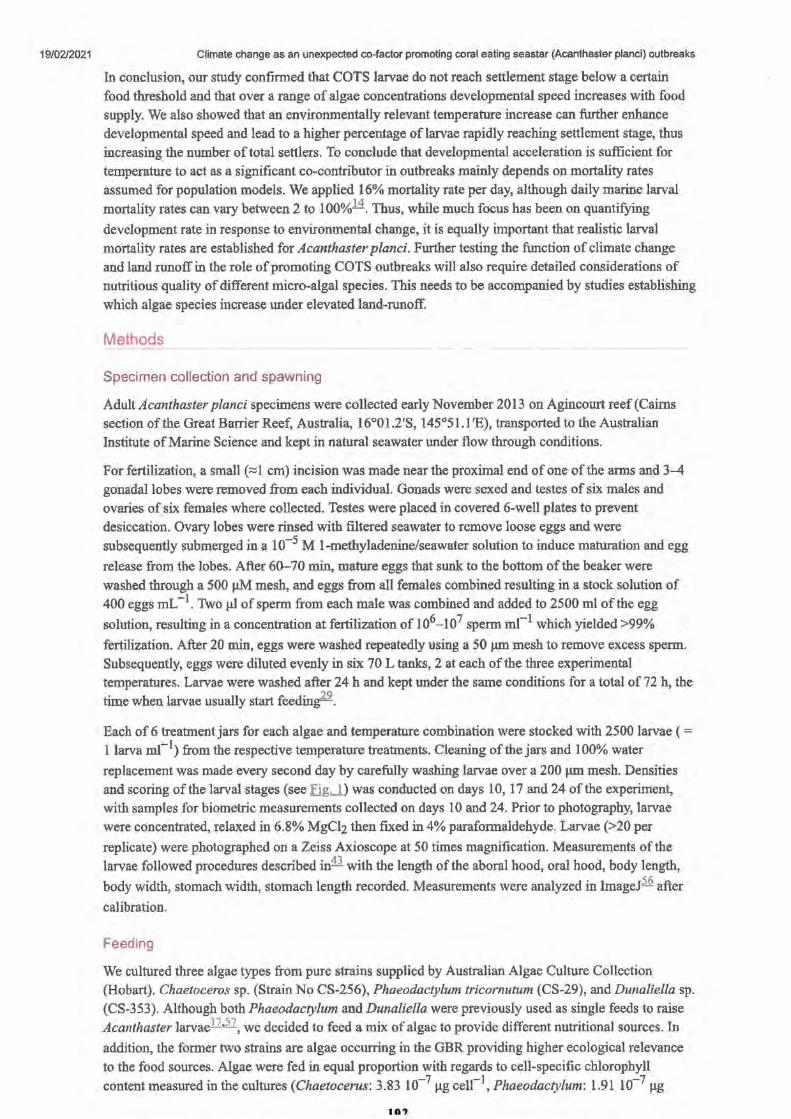
19/02/2021 Climate change as an unexpected co-factor promoting coral eating seastar (Acanthaster planci) outbreaks
In conclusion, our study confirmed that COTS larvae do not reach settlement stage below a certain food threshold and that over a range of algae concentrations developmental speed increases with food supply. We also showed that an environmentally relevant temperature increase can further enhance developmental speed and lead to a higher percentage of larvae rapidly reaching settlement stage, thus increasing the number of total settlers. To conclude that developmental acceleration is sufficient for temperature to act as a significant co-contributor in outbreaks mainly depends on mortality rates assumed for population models. We applied 16% mortality rate per day, although daily marine larval
mortality rates can vary between 2 to 100%14. Thus, while much focus has been on quantifying
development rate in response to environmental change, it is equally important that realistic larval mortality rates are established for Acanthaster planci. Further testing the function of climate change and land runoff in the role of promoting COTS outbreaks will also require detailed considerations of nutritious quality of different micro-algal species. This needs to be accompanied by studies establishing which algae species increase under elevated land-runoff.
Methods
Specimen collection and spawning
Adult Acanthaster planci specimens were collected early November 2013 on Agincourt reef (Cairns section of the Great Barrier Reef, Australia, 16°01.2'S, 145°51.l'E), transported to the Australian Institute of Marine Science and kept in natural seawater under flow through conditions.
For fertilization, a small (::::::1 cm) incision was made near the proximal end of one of the arms and 3-4 gonadal lobes were removed from each individual. Gonads were sexed and testes of six males and ovaries of six females where collected. Testes were placed in covered 6-well plates to prevent desiccation. Ovary lobes were rinsed with filtered seawater to remove loose eggs and were subsequently submerged in a 10-5 M 1-methyladenine/seawater solution to induce maturation and egg
release from the lobes. After 60-70 min, mature eggs that sunk to the bottom of the beaker were washed through a 500 µM mesh, and eggs from all females combined resulting in a stock solution of 400 eggs mL - I. Two µl of sperm from each male was combined and added to 2500 ml of the egg
solution, resulting in a concentration at fertilization of 106-107 sperm mi-1 which yielded >99%
fertilization. After 20 min, eggs were washed repeatedly using a 50 µm mesh to remove excess sperm. Subsequently, eggs were diluted evenly in six 70 L tanks, 2 at each of the three experimental temperatures. Larvae were washed after 24 h and kept under the same conditions for a total of 72 h, the time when larvae usually start feedin!f9.
Each of 6 treatment jars for each algae and temperature combination were stocked with 2500 larvae ( = 1 larva ml-1) from the respective temperature treatments. Cleaning of the jars and 100% water
replacement was made every second day by carefully washing larvae over a 200 µm mesh. Densities and scoring of the larval stages (see FigJ) was conducted on days 10, 17 and 24 of the experiment, with samples for biometric measurements collected on days 10 and 24. Prior to photography, larvae were concentrated, relaxed in 6.8% MgCl2 then fixed in 4% paraformaldehyde. Larvae (>20 per
replicate) were photographed on a Zeiss Axioscope at 50 times magnification. Measurements of the larvae followed procedures described in43 with the length of the aboral hood, oral hood, body length,
body width, stomach width, stomach length recorded. Measurements were analyzed in ImageJ56 after
calibration.
Feeding
We cultured three algae types from pure strains supplied by Australian Algae Culture Collection (Hobart). Chaetoceros sp. (Strain No CS-256), Phaeodactylum tricornutum (CS-29), and Dunaliella sp. (CS-353). Although both Phaeodactylum and Dunaliella were previously used as single feeds to raise Acanthaster larvae11•57, we decided to feed a mix of algae to provide different nutritional sources. In
addition, the former two strains are algae occurring in the GBR providing higher ecological relevance to the food sources. Algae were fed in equal proportion with regards to cell-specific chlorophyll content measured in the cultures (Chaetocerus: 3.83 10-7 µg celC1, Phaeodactylum: 1.91 10-7 µg
18')
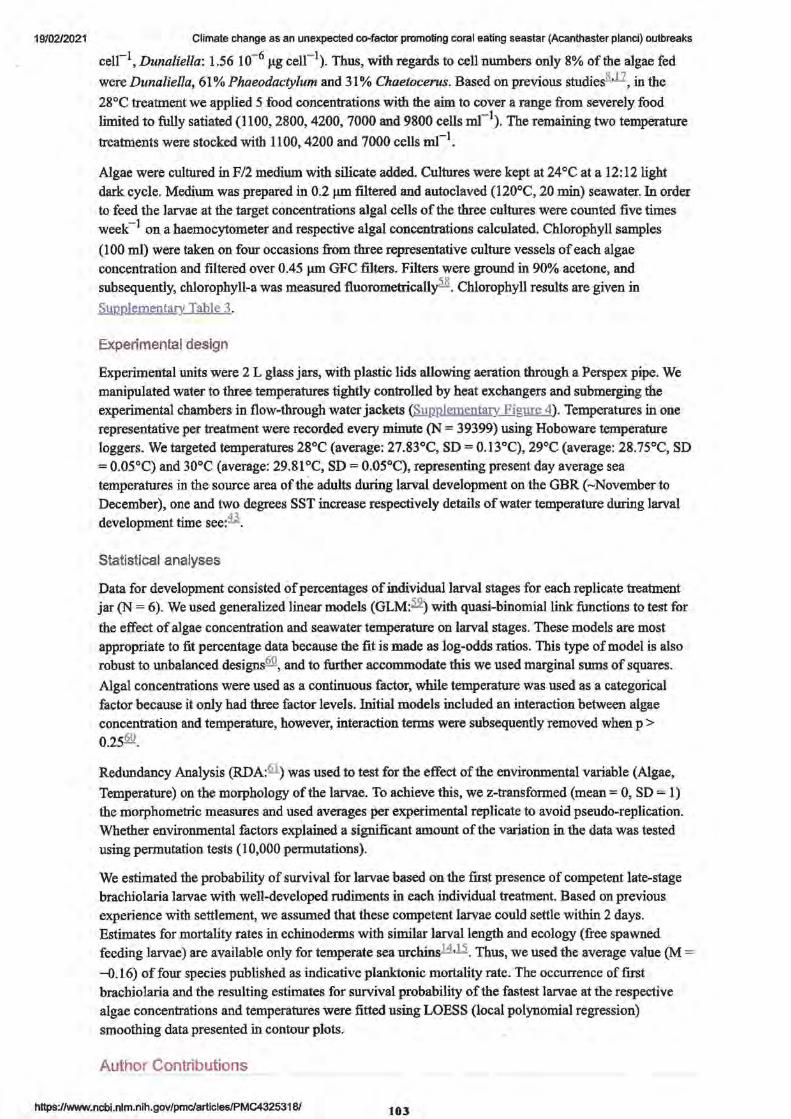
19102/2021 Climate change as an unexpected co-factor promoting coral eating seastar (Acanthaster planci) outbreaks
ceu-1, Dunaliella: 1.56 10-6 µg cell-1). Thus, with regards to cell numbers only 8% of the algae fed
were Dunaliella, 61 % Phaeodactylum and 31 % Chaetocerus. Based on previous studiesll.Jl, in the
28°C treatment we applied 5 food concentrations with the aim to cover a range from severely food limited to fully satiated (1100, 2800, 4200, 7000 and 9800 cells m1-l ). The remaining two temperature
treatments were stocked with 1100, 4200 and 7000 cells m1-1•
Algae were cultured in F/2 medium with silicate added. Cultures were kept at 24°C at a 12:12 light
dark cycle. Medium was prepared in 0.2 µm filtered and autoclaved (120°C, 20 min) seawater. In order to feed the larvae at the target concentrations algal cells of the three cultures were counted five times
week - l on a haemocytometer and respective algal concentrations calculated. Chlorophyll samples
(100 ml) were taken on four occasions from three representative culture vessels of each algae
concentration and filtered over 0.45 µm GFC filters. Filters were ground in 90% acetone, and
subsequently, chlorophyll-a was measured fluorometrically58. Chlorophyll results are given in
SUJ2P-lementarY. Table 3.
Experimental design
Experimental units were 2 L glass jars, with plastic lids allowing aeration through a Perspex pipe. We
manipulated water to three temperatures tightly controlled by heat exchangers and submerging the
experimental chambers in flow-through water jackets (Sugplementazy. FiS!!KA). Temperatures in one
representative per treatment were recorded every minute (N = 39399) using Hoboware temperature loggers. We targeted temperatures 28°C (average: 27.83°C, SD= 0.13°C), 29°C (average: 28.75°C, SD
= 0.05°C) and 30°C (average: 29.81 °C, SD= 0.05°C), representing present day average sea
temperatures in the source area of the adults during larval development on the GBR (~November to December), one and two degrees SST increase respectively details of water temperature during larval
development time see:43 .
Statistical analyses
Data for development consisted of percentages of individual larval stages for each replicate treatment jar (N = 6). We used generalized linear models (GLM:~ ) with quasi-binomial link functions to test for
the effect of algae concentration and seawater temperature on larval stages. These models are most
appropriate to fit percentage data because the fit is made as log-odds ratios. This type of model is also
robust to unbalanced designs60, and to further accommodate this we used marginal sums of squares.
Algal concentrations were used as a continuous factor, while temperature was used as a categorical
factor because it only had three factor levels. Initial models included an interaction between algae
concentration and temperature, however, interaction terms were subsequently removed when p > o.2sfil!.
Redundancy Analysis (RDA:fil) was used to test for the effect of the environmental variable (Algae,
Temperature) on the morphology of the larvae. To achieve this, we z-transformed (mean== 0, SD= 1) the morphometric measures and used averages per experimental replicate to avoid pseudo-replication.
Whether environmental factors explained a significant amount of the variation in the data was tested
using permutation tests (10,000 permutations).
We estimated the probability of survival for larvae based on the first presence of competent late-stage
brachiolaria larvae with well-developed rudiments in each individual treatment. Based on previous experience with settlement, we assumed that these competent larvae could settle within 2 days.
Estimates for mortality rates in echinoderms with similar larval length and ecology (free spawned feeding larvae) are available only for temperate sea urchins14,li. Thus, we used the average value (M =
--0 .16) of four species published as indicative planktonic mortality rate. The occurrence of first brachiolaria and the resulting estimates for survival probability of the fastest larvae at the respective
algae concentrations and temperatures were fitted using LOESS (local polynomial regression)
smoothing data presented in contour plots.
Author Contributions
https://www.ncbi.nlm.nih.gov/pmc/artlcles/PMC4325318/ 103
19/02/2021 Climate change as an unexpected co-factor promoting coral eating seastar (Acanthaster planci) outbreaks
S.U., D.F. and M.L. conducted experiment, analysed data and wrote the MS, M.L. assisted with
statistical analysis and edited the MS, M.L. and N.H. analysed samples and data and maintained the
experiment.
Supplementary Material
Supplementary Information:
Supplementary Tables and Figures
Click here to view.(3SlK, doc)
Acknowledgments
We are very grateful to Steve Moon for organizing Acanthaster planci collections. We are grateful to
Dr Janice Lough for providing updated historic temperatures for the Great Barrier Reef. Funding was
provided by the Australian Institute of Marine Science and the Australian Government's National
Environmental Research Program.
References
1. Fabricius K. E. et al. Losers and winners in coral reefs acclimatized to elevated carbon dioxide
concentrations. Nature Clim. Change 1, 165-169 (2011). [Google Scholar] 2. Hoegh-Guldberg 0. et al. Coral reefs under rapid climate change and ocean acidification.
Science 318, 1737 (2007). [PubMed] [QQQgle Scholar] 3. Pandolfi J.M. et al. Global Trajectories of the Long-Tenn Decline of Coral Reef Ecosystems.
Science 301, 955-958 (2003). [PuhMed] [QQQgle Scholar] 4. Ban S. S., Graham N. A. & Connolly S. R. Evidence for multiple stressor interactions and effects
on coral reefs. Global Change Biol. 20, 681-697 (2014). [PubMed] [Google Scholar] 5. De'ath G., Fabricius K. E., Sweatman H. & Puotinen M. The 27-year decline of coral cover on
the Great Barrier Reef and its causes. Proc. Natl. Acad. Sci. USA 9, 17995-17999 (2012).
[PMC free article] [PubMed] [Google Scholar] 6. Uthicke S., Schaffelke B. & Byrne M. A boom-bust phylum? Ecological and evolutionary
consequences of density variations in echinoderms. Ecol. Mon. 79, 3-24 (2009).
[Google Scholar) 7. Fabricius K. E. & Fabricius F. H. Re-assessment of ossicle frequency patterns in sediment cores:
Rate of sedimentation related to Acanthaster planci. Coral Reefs 11, 109-114 (1992).
[Google Scholar] 8. Fabricius K. E., Okaji K. & De'ath G. Three lines of evidence to link outbreaks of the crown-of
thoms seastar Acanthaster planci to the release of larval food limitation. Coral Reefs 29, 593-
605 (2010). [Google Scholar] 9. Birkeland C. Terrestrial runoff as a cause of outbreaks of Acanthaster planci (Echinodermata:
Asteroidea). Mar. Biol. 69, 175-185 (1982). [Google Scholar] 10. Lourey M. J., Ryan D. A. J. & Miller I. R. Rates of decline and recovery of coral cover on reefs
impacted by, recovering from and unaffected by crown-of-thorns starfish Acanthaster planci: A
regional perspective of the Great Barrier Reef. Mar. Ecol. Prog. Ser. 196, 179-186 (2000).
[Google Scholar) 11. Pratchett M., Caballes C. F., Rivera-Posada J. & Sweatman H. Limits to understanding and
managing outbreaks of crown-of-thorns starfish (Acanthaster spp .). Oceanogr. Mar. Biol. Ann.
Rev. 52, 133-200 (2014). [Google Scholar] 12. McCallum H. I. Predator regulation of Acanthaster planci. J. Theor. Biol. 127, 207-220 (1987).
IQQQgle Scholar] 13. Lucas J. S. Reproductive and larval biology and Acanthaster planci (L.) in Great Barrier Reef.
Micronesica 9, 197-203 (1973). [Google Scholar] 14. Rumrill S.S. Natural mortality of marine invertebrate larvae. Ophelia 32, 163-198 (1990).
[ Google Scholar]
httm::·//wwwnr.hi.nlm.nih.anv/nmc-Jsuticles/PMC4325318/ 10.4
19102/2021 Climate change as an unexpected co-factor promoting coral eating seastar (Acanthaster planci) outbreaks
15. Lam.are M. D. & Barker M. F. In situ estimates oflarval development and mortality in the New
Zealand sea urchin Evechinus chloroticus (Echinodermata: Echinoidea). Mar. Ecol. Prog .. Ser.
180, 197-211 (1999). [Google Scholar]
16. Hedgecock D. Is gene flow from pelagic larval dispersal important in the adaptation and
evolution of marine invertebrates? Bull. Mar. Sci. 39, 550-,-564 (1986). [Google Scholar]
17. Lucas J. S. Quantitative studies on the feeding and nutrition during larval development of the
coral reef asteroid Acanthaster planci (L.). J. Exp. Mar. Biol. Ecol. 65, 173-193 (1982).
[Google Scholar]
18. Lee C.-H., Ryu T.-K. & Choi J.-W. Effects of water temperature on embryonic development in
the northern Pacific asteroid, Asterias amurensis, from the southern coast of Korea. Invert.
Reprod. Devel. 45, 109-116 (2004). [Google Scholar]
19. Stanwell-Smith D. & Peck L. S. Temperature and embryonic development in relation to
spawning and field occurrence oflarvae of three Antarctic echinoderms. Biol. Bull. 194, 44-52
(1998). [PubMed] [Google Scholar]
20. Villalobos F. B., Tyler P. A. & Young C. M. Temperature and pressure tolerance of embryos and
larvae of the Atlantic seastars Asterias rubens and Marthasterias glacialis (Echinodermata:
Asteroidea): potential for deep-sea invasion. Mar. Ecol. Prog. Ser. 314, 109-117 (2006).
[Google Scholar] 21. Hoegh-Guldberg 0. & Pearse J. S. Temperature, food availability, and the development of
marine invertebrate larvae. Am. Zoo/. 35, 415-425 (1995). [Google Scholar]
22. Enquist B. J. et al. Scaling metabolism from organisms to ecosystems. Nature 423, 639-642
(2003). [PubMed] [Google Scholar] 23. Brown J. H., Gillooly J. F., Allen A. P., Savage V. M. & West G. B. Toward a metabolic theory of
ecology. Ecology 85, 1771-1789 (2004). [Google Scholar]
24. Allen A. P., Gillooly J. F., Savage V. M. & Brown J. H. Kinetic effects of temperature on rates of
genetic divergence and speciation. Proc. Natl. Acad. Sci. USA 103, 9130-9135 (2006).
[PMC free articlaj [PubMed] [Google Scholar] 25. Somero G. The physiology of climate change: how potentials for acclimatization and genetic
adaptation will determine 'winners' and 'losers'. J. Exp. Biol. 213, 912-920 (2010). [PubMed]
[Google Scholar] 26. Berkelmans R. & Willis B. L. Seasonal and local patterns in the upper thermal limits of corals on
the inshore Central Great Barrier reef. Coral Reefs 18, 219-228 (1999). [Google Scholar]
27. Henderson J. A. & Lucas J. S. Larval development and metamorphosis of Acanthaster planci
(Asteroidea). Nature 232, 655-657 (1971). [PubMed] [Google Scholar]
28. Johnson L. G. & Babcock R. C. Temperature and the larval ecology of the crown-of-thorns
starfish, Acanthaster planci. Biol. Bull. 187, 304-308 (1994). [PubMed] [Google Scholar] 29. Keesing J. K., Halford A. R., Hall K. C. & Cartwright C. M. Large-scale laboratory culture of the
crown-of-thorns starfish Acanthaster planci (L.) (Echinodermata: Asteroidea). Aquaculture 157, 215-226 (1997). [Google Scholar]
30. Lawrence J.M. Starfish: Biology & Ecology of the Asteroidea. Baltimore, MD, USA: Johns
Hopkins University Press, 2013, 267 pp. ISBN 978-1-424-0787-6 (2013).
31. Diggles B., Moss G., Carson J. & Anderson C. Luminous vibriosis in rock lobster Jasus
verreauxi (Decapoda: Palinuridae) phyllosoma larvae associated with infection by Vibrio
harveyi. Dis. Aquat. Org 43, 127-137 (2000). fPubMed] [Google Scholar] 32. Brodie J., Fabricius K., De'ath G. & Okaji K. Are increased nutrient inputs responsible for more
outbreaks of crown-of-thorns starfish? An appraisal of the evidence. Mar. Pollut. Bull. 51, 266-
278 (2005). [PubMed] [Google Scholar] 33. Babcock R. C., Mundy C. N. & Whitehead D. Sperm diffusion models and in situ confirmation
oflong-distance fertilisation in the free-spawning asteriod Acanthaster planci. Biol. Bull. 186, 17-28 (1994). [P Me [Google Scholar]
34. Uthicke S. et al. Impacts of ocean acidification on early life-history stages and settlement of the
coral-eating sea star Acanthaster planci. PLoS ONE 8, e82938, 10.1371/joumal.pone.0082938
(2013). [PMC free article] [PubMed] [CrossRefl [Google Scholar]
35. Paulay G., Boring L. & Strathmann R. R. Food limited growth and development oflarvae:
experiments with natural sea water. J. Exp. Mar. Biol. Ecol. 93, 1-10 (1985). [Google Scholar]
105
19/02/2021 Climate change as an unexpected co-factor promoting coral eating seastar (Acanthaster planci) outbreaks
36. Boidron-Metairon I. F. Morphological plasticity in laboratory-reared echinoplutei of Dendraster
excentricus (Eschscholtz) and Lytechinus variegatus (Lamarck) in response to food conditions. J. Exp. Mar. Biol. Ecol. 119, 31-41 (1988). [Google Scholar]
37. Fenaux L., Strathmann M. F. & Strathmann R.R. Five tests of food-limited growth oflarvae in
coastal waters by comparisons of rates of development and form of echinoplutei. Limnol. Oceanogr. 39, 84-98 (1994). [Google Scholar]
38. Reitzel A. M., Webb J. & Arellano S. Growth, development and condition of Dendraster excentricus (Eschscholtz) larvae reared on natural and laboratory diets. J. Plankton Res. 26, 901-
908 (2004). (Google Scholar] 39. Poorbagher H., Lamare M. D. & Barker M. F. The relative importance of parental nutrition and
population versus larval diet on development and phenotypic plasticity of Sclerasterias mollis larvae. J. Mar. Biol. Ass. UK 90, 527-536 (2010). (Google Scholar]
40. Poorbagher H., Lamare M. D., Barker M. F. & Rayment W. Relative importance of parental diet versus larval nutrition on development and phenotypic plasticity of Pseudechinus huttoni larvae (Echinodermata: Echinoidea). Mar. Biol. Res. 6, 302-314 (2010). [QQ.Qgle Scholar]
41. Basch L. Effects of algal and larval densities on development and survival of asteroid larvae.
Mar. Biol. 126, 693-701 (1996). [Google Scholar] 42. Vickery M. S. & McClintock J.B. Effects of food concentration and availability on the incidence
of cloning in planktotrophic larvae of the sea star Pisaster ochraceus. Biol. Bull. 199, 298-304
(2000). [PubMed] [Google Scholar] 43. Lamare M. et al. The thermal tolerance of crown-of-thorns (Acanthaster planci) embryos and
bipinnaria larvae: implications for spatial and temporal variation in adult populations. Coral
Reeft 33, 207-219 (2014). [Google Scholar] 44. Devlin M. & Brodie J. Terrestrial discharge into the Great Barrier Reef Lagoon: nutrient
behavior in coastal waters. Mar. Pollut. Bull. 51, 9-22 (2005). [PubMed] [Google Scholar] 45. Okaji K.. Feeding ecology in the early life stages of the crown-of-thorns starfish, Acanthaster
planci (L.). PhD Thesis, James Cook University, Townsville, Australia, pp. 121 (1996). 46. Revelante N. & Gilmartin M. Dynamics of phytoplankton in the Great Barrier Reef lagoon. J.
Plankton Res. 4, 47-76 (1982). [Google Scholar] 47. Desai D., Khandeparker L. & Shirayama Y. Larval development and metamorphosis of Ba/anus
albicostatus (Cirripedia: Thoracica); implications of temperature, food concentration and energetics. J. Mar. Biol. Ass. UK 86, 335-343 (2006). [Google Scholar]
48. Anil A. C., Desai D. & Khandeparker L. Larval development and metamorphosis in Ba/anus amphitrite Darwin (Cirripedia; Thoracica): significance of food concentration, temperature and nucleic acids. J. Exp. Mar. Biol. Ecol. 263, 125-141 (2001). [Google Scholar]
49. Meekan M., Carleton J., McKinnon A., Flynn K. & Furnas M. What determines the growth of tropical reef fish larvae in the plankton: food or temperature? Mar. Ecol. Prog. Ser. 256, 193-204
(2003). [Google Scholar] 50. Kamya P. Z. et al. Larvae of the coral eating crown-of-thorns starfish, Acanthaster planci in a
wanner-high CO2 ocean. Global Change Biol., n/a-n/a, 10.1111/gcb.12530 (2014). [PubMed]
fCrossRefl [Google Scholar] 51. Lough J. Climate and climate change on the Great Barrier Reef. In: Climate Change and the
Great Barrier Reef A vulnerability assessment, Johnson J.E., & Marshall P.A., eds. (eds.), Great Barrier Reef Marine Park Authority 15-50 (2007), URL: http· //elibrary ... gbrm}la,gov.au/j,~pui/handle/11 O 17/535.
52. Hobday A. J. & Lough J.M. Projected climate change in Australian marine and freshwater environments. Mar. Freshw. Res. 62, 1000-1014 (2011). [Google Scholar]
53. Johnson C. R., Sutton D. C., Olson R. R. & Giddings R. Settlement of crown-of-thorns starfish: role of bacteria on surfaces of coralline algae and a hypothesis for deepwater recruitment. Mar. Ecol. Prog. Ser. 71, 143-162 (1991). [Google Scholar]
54. Keesing J. K. & Halford A. R. Field measurement of survival rates of juvenile Acanthaster planci: Techniques and preliminary results. Mar. Ecol. Prog. Ser. 8S, 107-114 (1992). [Google Scholar]
55. Caley M. J. et al. Recruitment and the local dynamics of open marine populations. An.n Rev.
Ecol. Sys. 27, 477-500 (1996). [Google Scholar]
106
f9/02/2021 Climate change as an unexpected co-factor promoting coral eating seastar (Acanthaster planci) outbreaks
56. Schneider C., Rasband W. & Eliceiri K. NIH im;:1.ge to imageJ: 25 years of image analysis. Nat. Methods 9, 671--675 (2012). C free article] [PubMed] [Google Scholar]
57. Okaji K., Ayukai T. & Lucas J. Selective feeding by larvae of the crown-of-thorns starfish, Acanthaster planci (L.). Coral Reefs 16, 47-50 (1997). [Google Scholar]
58. Parsons T. R., Maita Y. & Lalli C. M. A manual of chemical and biological methods for seawater analysis. Oxford, Pergamon Press. (1984).
59. McCullagh P. & Nelder J. Generalized linear models. Monographs on Statistics & Applied Probability 37, (Chapman and Hall, London. 1989) [QQQgle Scholar]
60. Quinn G. P. & Keough M. J. Experimental design and data analysis for biologists. (Cambridge University Press, 2002). [.QQQgle Scholar]
61. Legendre P. & Legendre L. F. Numerical ecology. Vol. 20 (Elsevier, Amsterdam, The Netherlands, 2012). [Google Scholar]
Articles from Scientific Reports are provided here courtesy of Nature Publishing Group
hltnc,•//unuu, n,-hi nlm nih nnv/nmr./,.rtlr.lA<:IPMf'..4'-l?~'-1111/ 117

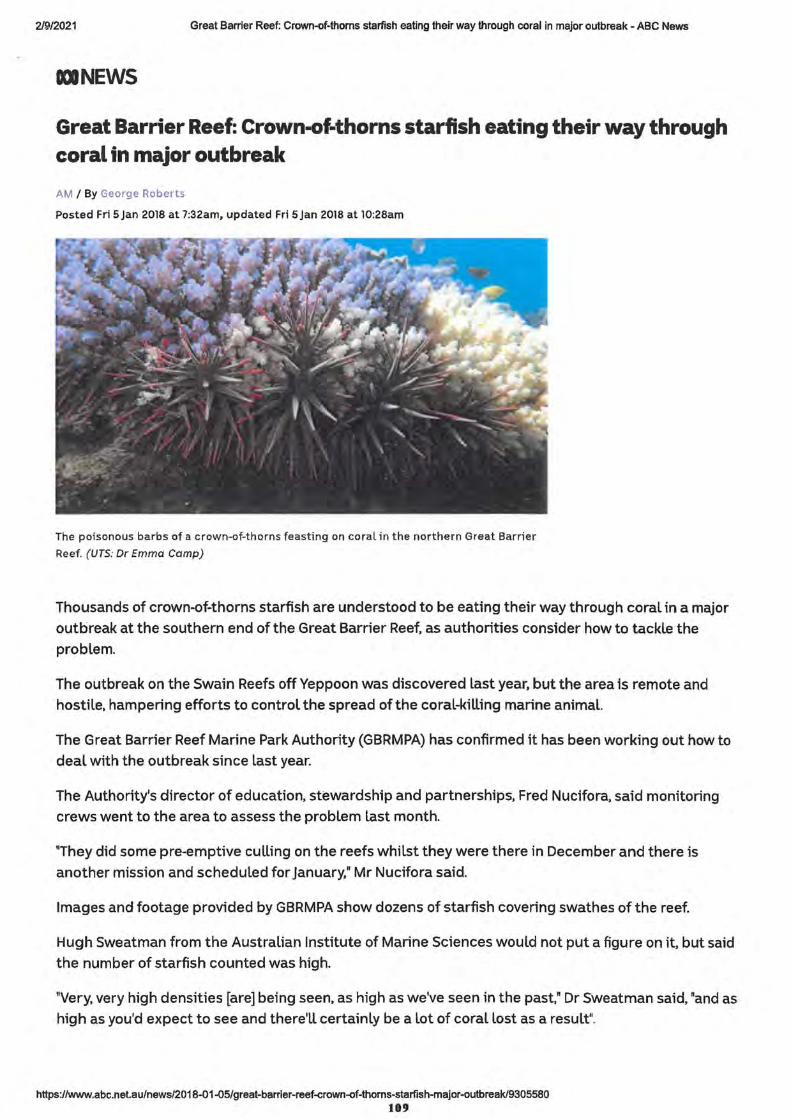
2/9/2021 Great Barrier Reef: Crown-of-thorns starfish eating their way through coral in major outbreak - ABC News
DOINEWS
Great Barrier Reef: Crown-of-thorns starfish eating their way through coral in major outbreak
AM / By George Roberts
Posted Fri 5Jan 2018 at 7:32am, updated Fri 5Jan 2018 at 10:28am
The poisonous barbs of a crown-of-thorns feasting on coral in the northern Great Barrier
Reef. (UTS: Dr Emma Camp)
Thousands of crown-of-thorns starfish are understood to be eating their way through coral in a major
outbreak at the southern end of the Great Barrier Reef, as authorities consider how to tackle the
problem.
The outbreak on the Swain Reefs off Yeppoon was discovered last year, but the area is remote and
hostile, hampering efforts to control the spread of the coral-killing marine animal.
The Great Barrier Reef Marine Park Authority (GBRMPA) has confirmed it has been working out how to
deal with the outbreak since last year.
The Authority's director of education, stewardship and partnerships, Fred Nucifora, said monitoring
crews went to the area to assess the problem last month.
"They did some pre-emptive culling on the reefs whilst they were there in December and there is
another mission and scheduled for January," Mr Nucifora said.
Images and footage provided by GBRMPA show dozens of starfish covering swathes of the reef.
Hugh Sweatman from the Australian Institute of Marine Sciences would not put a figure on it, but said
the number of starfish counted was high.
"Very, very high densities [are] being seen. as high as we've seen in the past." Dr Sweatman said, "and as
high as you'd expect to see and there'll certainly be a Lot of coral lost as a result".
https://www,abc.net.au/news/2018-01-05/great-barrier-reef-crown-of-thoms-starfish-major-outbreak/9305580 109
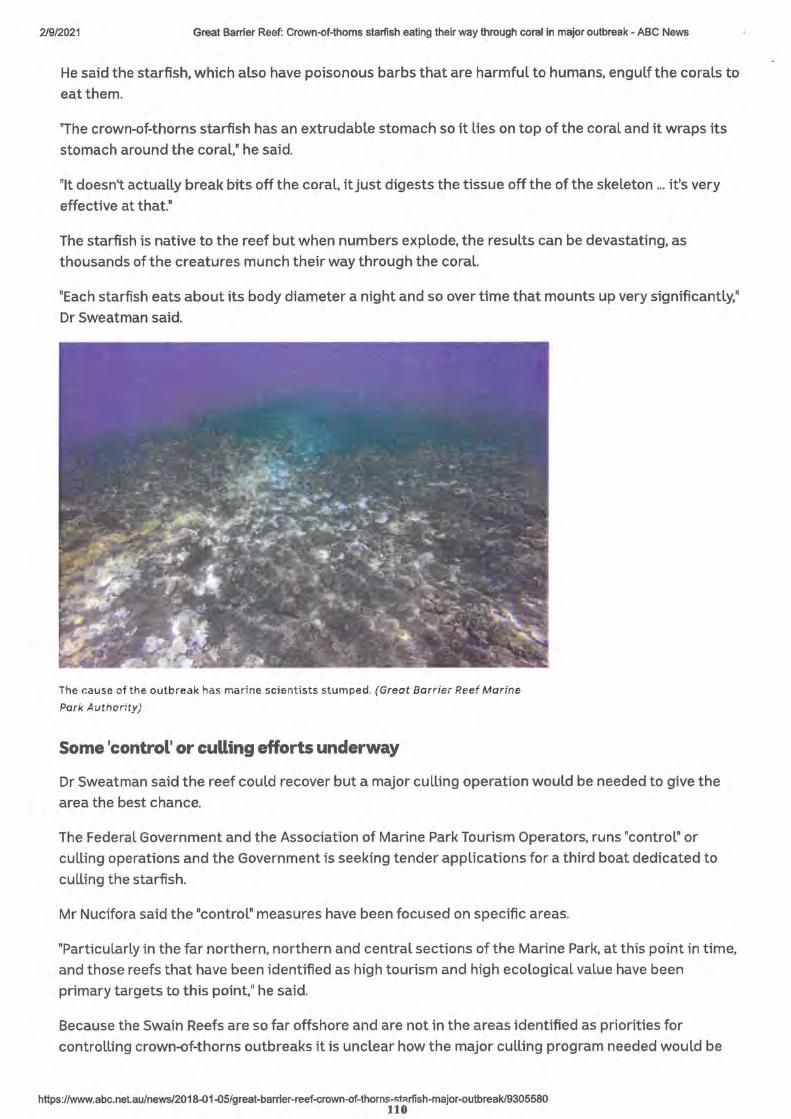
2/9/2021 Great Barrier Reef: Crown-of-thorns starfish eating their way through coral in major outbreak - ABC News
He said the starfish, which also have poisonous barbs that are harmful to humans, engulf the corals to
eat them.
"The crown-of-thorns starfish has an extrudable stomach so it Lies on top of the coral and it wraps its
stomach around the coral," he said.
"It doesn't actually break bits off the coral, it just digests the tissue off the of the skeleton ... it's very
effective at that.•
The starfish is native to the reef but when numbers explode, the results can be devastating, as
thousands of the creatures munch their way through the coral.
"Each starfish eats about its body diameter a night and so over time that mounts up very significantly,"
Dr Sweatman said.
The cause of the outbreak has marine scient ists stumped. (Great Barrier Reef Marine
Park Authority)
Some 'control' or culling efforts underway
Dr Sweatman said the reef could recover but a major culling operation would be needed to give the
area the best chance.
The Federal Government and the Association of Marine Park Tourism Operators, runs "control" or
culling operations and the Government is seeking tender applications for a third boat dedicated to
culling the starfish.
Mr Nucifora said the "control" measures have been focused on specific areas.
"Particularly in the far northern, northern and central sections of the Marine Park. at this point in time,
and those reefs that have been identified as high tourism and high ecological value have been
primary targets to this point," he said.
Because the Swain Reefs are so far offshore and are not in the areas identified as priorities for
controlling crown-of-thorns outbreaks it is unclear how the major culling program needed would be
https://www.abc.net.au/news/2018-01-0S/great-barrier-reef-crown-of-thorns-i::t~rfish-major-outbreak/9305580 110
2/9/2021 Great Barrier Reef: Crown-of-thorns starfish eating their way through coral in major outbreak - ABC News
funded and resourced.
"The complexity with the Swain Reefs location is that they are 100 kilometres to 250 kilometres off the coast between Gladstone and Rockhampton and so they
are logistically difficult to access and it's actually quite a hostile environment to work in," Mr Nucifora said.
Location of the outbreak puzzling but provides hope
The cause of the outbreak has scientists and the Marine Park Authority stumped.
"That's the million dollar question to be perfectly honest," Mr Nucifora said.
Typically scientists link outbreaks of the crown-of-thorns starfish to spikes in ocean nutrients caused
by coastal and agricultural run-off into the ocean.
For that reason outbreaks are usually further north and closer to the coast, but the Swain Reefs are a
long way offshore and on the southern end of the reef, so it is not known what caused the outbreak.
Mr Nucifora said there were some scientific theories.
"It may be caused by nutrient up-welling from deep ocean waters, but that's still yet to be fully
proven," he said.
The Swains Reefs, he said, had been hit by a crown-of-thorns outbreak in the 1990s but had managed
to recover.
He was hopeful the area could survive again, because of its isolated location at the southern end of
the reef system.
"The good thing with respect to that also is that those reefs in the far southern section of the marine
park have escaped the significant pressures that have resulted in the last two years from the mass
bleaching events," Mr Nucifora said.
The type of coral present, he said, also gave it a good chance.
"The coral species that that are primarily present in that area are the faster growing our staghorn and
plate corals," he said.
Biggest threat still coral bleaching
The crown-of-thorns outbreak puts more strain on a Great Barrier Reef system that has seen two
consecutive years of mass coral bleaching from ocean warming.
An international study, published today in the prestigious Science journal. warned that the window of
time for saving the world's reefs from coral bleaching was closing.
Dr Sweatman said that was still the biggest concern.
https://www.abc.net.au/news/2018-01-05/great-barrier-reef-crown-of-thom51111rfish-major-outbreak/9305580

2/9/2021 Great Barrier Reef: Crown-of-thorns starfish eating their way through coral in major outbreak - ABC News
11The biggest threat is a coral bleaching affecting very large areas all at once and so on that affects large areas and kills all the corals, so it's a very serious [threat],11
he said.
hKn~• 11 ....... ah~ n ... "' ,, ..... , .. .,./?n1 R..fl1 ..(l<;/nr"'"'-h"rriAr-rAAf..r,rnwn-nf-lhnm,11 2.rfi!:;h-m~ior-outbreak/9305580
Hindawi Publishing Corporation Journal of Marine Biology Volume 2015,Article ID 809624, 10 pages http://dx.doi.org/ 10. l 155/2015/809624
Research Article
Hindawi
Origins and Implications of a Primary Crown-of-Thorns Starfish Outbreak in the Southern Great Barrier Reef
Ian Miller, Hugh Sweatman, Alistair Cheal, Mike Emslie, Kerryn Johns, Michelle Jonker, and Kate Osborne
Australian Institute of Marine Science, PMB No. 3, Townsville MC, QLD 4810, Australia
Correspondence should be addressed to Ian Miller; [email protected]
Received 16 October 2014; Revised 23 January 2015; Accepted 19 February 2015
Academic Editor: Baruch Rinkevich
Copyright © 2015 Ian Miller et al. This is an open access article distributed under the Creative Commons Attribution License, which permits unrestricted use, distribution, and reproduction in any medium, provided the original work is properly cited.
The crown-of-thorns starfish (COTS) is a major predator of hard corals. Repeated COTS outbreaks in the Cairns and Central sections of the Great Barrier Reef (GBR) have been responsible for greater declines in coral cover than any other type of disturbance, including cyclones, disease, and coral bleaching. Knowledge of the precise timing and location of primary outbreaks could reveal the initial drivers of outbreaks and so could indicate possible management measures. In the central GBR, COTS outbreaks appear to follow major flooding events, but despite many years of observations, no primary outbreak has ever been unequivocally identified in the central and northern GBR. Here we locate a primary outbreak of COTS on the southern GBR which is not correlated with flooding. Instead it appears to have been the result of a combination of life history traits of COTS and prevailing oceanographic conditions. The hydrodynamic setting implies that the outbreak could disperse larvae to other reefs in the region.
I. Introduction
The crown-of-thorns starfish (COTS) (Acanthaster planci) is an obligate corallivore that causes dramatic losses of coral cover at high population densities and is a major challenge in coral reef management [l]. Populations of COTS alternate periods oflow density, when individuals are sparsely distributed across large areas of reef, with briefer periods of much higher densities [ 2]. A single adult starfish can consume approximately 10 m2 of coral per year and large "outbreak" populations have a major impact on local cover [3] that can persist for more than a decade [4]. Surveys on the Great Barrier Reef (GBR) span some 50 years, in which time there have been three series of outbreaks beginning in 1962, 1979, and 1993. Since the advent of systematic monitoring in 1986, two outbreaks have appeared in the Cairns Section of the GBR in 1993 and 2009 before subsequently spreading through the Central Section of the GBR. In 2012, coral cover on the GBR had fallen to half the value when surveys began, and COTS outbreaks have been responsible for a greater proportion of declines in coral cover on reefs in the Cairns and Central sections of the GBR than any other type of
113
disturbance including cyclones, diseases, and coral bleaching [5, 6]. This means that COTS are of critical concern on the GBR; particularly as a new series of outbreaks is currently developing on Cairns Section reefs and following the same pattern [7].
Outbreaks typically begin with an abrupt population increase from very low density. This change in abundance by orders of magnitude is termed a "primary outbreak" if it has not arisen through recruitment from other high-density populations nearby [8]. Explanations for primary outbreaks revolve round two types of drivers: natural (population fluctuations [9], aggregation behaviour of existing populations [10, 11], and/or food limitation [12]) and anthropogenic ( enhanced larval survival due to nutrients in terrestrial runoff [13, 14] and increased postsettlement survival due to the removal of COTS predators [8]). In practice assigning cause(s) for COTS outbreaks is difficult; outbreaks may well result from a combination of factors that vary with time and location [15], or they may simply be an artefact of the dispersal of passive larva in the water column [16]. However primary outbreaks originate; secondary outbreaks are thought to result either from colonisation by immense
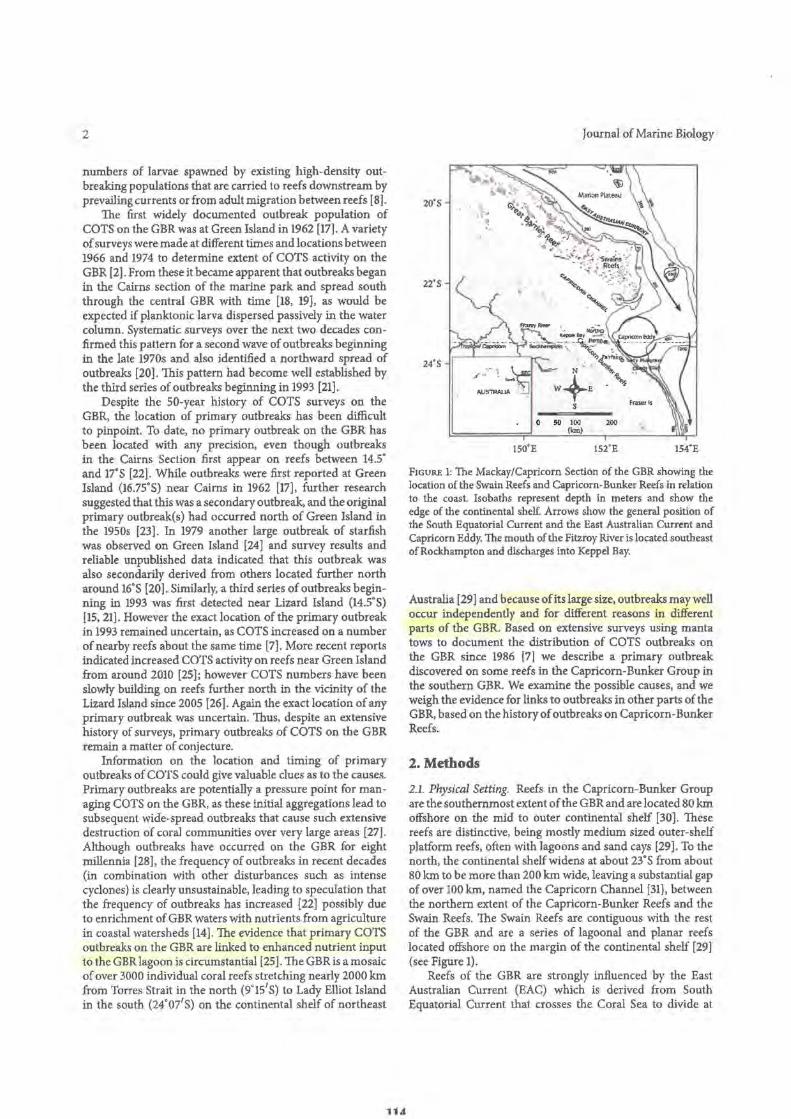
2
numbers of larvae spawned by existing high-density outbreaking populations that are carried to reefs downstream by prevailing currents or from adult migration between reefs [8].
The first widely documented outbreak population of COTS on the GBR was at Green Island in 1962 [17]. A variety of surveys were made at different times and locations between 1966 and 1974 to determine extent of COTS activity on the GBR [2]. From these it became apparent that outbreaks began in the Cairns section of the marine park and spread south through the central GBR with time [18, 19], as would be expected if planktonic larva dispersed passively in the water column. Systematic surveys over the next two decades confirmed this pattern for a second wave of outbreaks beginning in the late 1970s and also identified a northward spread of outbreaks [20]. This pattern had become well established by the third series of outbreaks beginning in 1993 [21].
Despite the SO-year history of COTS surveys on the GBR, the location of primary outbreaks has been difficult to pinpoint. To date, no primary outbreak on the GBR has been located with any precision, even though outbreaks in the Cairns ·Section first appear on reefs between 14.5" and 17°S [22]. While outbreaks were first reported at Green Island (16.75°S) near Cairns in 1962 [17], further research suggested that this was a secondary outbreak, and the original primary outbreak(s) had occurred north of Green Island in the 1950s [23]. In 1979 another large outbreak of starfish was observed on Green Island [24] and survey results and reliable unpublished data indicated that this outbreak was also secondarily derived from others located further north around l6°S [20]. Similarly, a third series of outbreaks beginning in 1993 was first detected near Lizard Island (14.s°S) [15, 21]. However the exact location of the primary outbreak in 1993 remained uncertain, as COTS increased on a number of nearby reefs about the same time [7]. More recent reports indicated increased COTS activity on reefs near Green Island from around 2010 [25]; however COTS numbers have been slowly building on reefs further north in the vicinity of the Lizard Island since 2005 [26]. Again the exact location of any primary outbreak was uncertain. Thus, despite an extensive history of surveys, primary outbreaks of COTS on the GBR remain a matter of conjecture.
Information on the location and timing of primary outbreaks of COTS could give valuable clues as to the causes. Primary outbreaks are potentially a pressure point for managing COTS on the GBR, as these initial aggregations lead to subsequent wide-spread outbreaks that cause such extensive destruction of coral communities over very large areas [27]. Although outbreaks have occurred on the GBR for eight millennia [28], the frequency of outbreaks in recent decades (in combination with other disturbances such as intense cyclones) is dearly unsustainable, leading to speculation that the frequency of outbreaks has increased [22] possibly due to enrichment of GBR waters with nutrients from agriculture in coastal watersheds [14). The evidence that primary COTS outbreaks on the GBR are linked to enhanced nutrient input to the GBR lagoon is circumstantial [25). The GBR is a mosaic of over 3000 individual coral reefs stretching nearly 2000 km from Torres Strait in the north {9"151S) to Lady Elliot Island in the south (24°07'S) on the continental shelf of northeast
11.4
20·s
22·s
24"S
Journal of Marine Biology
0 50 100 200 (km)
150'E 152°E
, ... 154"E
FIGURE 1: The Mackay/Capricorn Section of the GBR showing the location of the Swain Reefs and Capricorn-Bunker Reefs in relation to the coast. Isobaths represent depth in meters and show the edge of the continental shelf. Arrows show the general position of the South Equatorial Current and the East Australian Current and Capricorn Eddy. The mouth of the Fitzroy River is located southeast of Rockhampton and discharges into Keppel Bay.
Australia [29] and because of its large size, outbreaks may well occur independently and for different reasons ii;t different parts of the GBR. Based on extensive surveys using manta tows to document the distribution of COTS outbreaks on the GBR since 1986 17] we describe a primary outbreak discovered on some reefs in the Capricorn-Bunker Group in the southern GBR. We examine the possible causes, and we weigh the evidence for links to outbreaks in other parts of the GBR, based on the history of outbreaks on Capricorn-Bunker Reefs.
2. Methods
2.1. Physical Setting. Reefs in the Capricorn-Bunker Group are the southernmost extent of the GBR and are located 80 km offshore on the mid to outer continental shelf [30]. These reefs are distinctive, being mostly medium sized outer-shelf platform reefs, often with lagoons and sand cays [29). To the north, the continental shelf widens at about 23°S from about 80 km to be more than 200 km wide, leaving a substantial gap of over 100 km, named the Capricorn Channel [31], between the northern extent of the Capricorn-Bunker Reefs and the Swain Reefs. The Swain Reefs are contiguous with the rest of the GBR and are a series of lagoonal and planar reefs located offshore on the margin of the continental shelf [29] (see Figure 1).
Reefs of the GBR are strongly influenced by the East Australian Current (EAC) which is derived from South Equatorial Current that crosses the Coral Sea to divide at
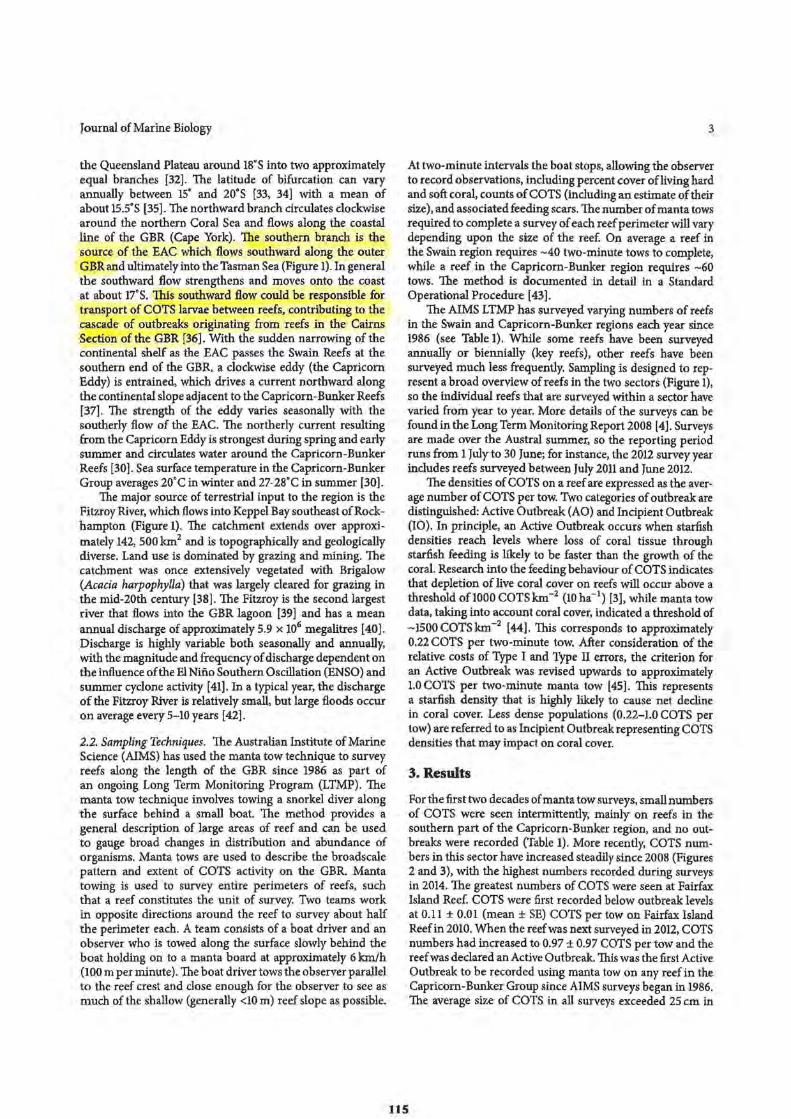
Journal of Marine Biology
the Queensland Plateau around l8°S into two approximately equal branches [32]. The latitude of bifurcation can vary annually between 15' and 2o•s [33, 34] with a mean of about IS.S'S [35]. The northward branch circulates clockwise around the northern Coral Sea and flows along the coastal line of the GBR (Cape York). The southern branchJs the source of the EAC which flows southward along the outer GBR and ultimately into the Tasman Sea (Figure 1). In general the southward flow strengthens and moves onto the coast at about 17°S. This southward flow could be responsible for transport of COTS larvae between reefs, contributing to the cascade of outbreaks originating from reefs in the Cairns Section of the GBR [36]. With the sudden narrowing of the continental shelf as the EAC passes the Swain Reefs at the southern end of the GBR, a clockwise eddy (the Capricorn Eddy) is entrained, which drives a current northward along the continental slope adjacent to the Capricorn-Bunker Reefs [37]. The strength of the eddy varies seasonally with the southerly flow of the EAC. The northerly current resulting from the Capricorn Eddy is strongest during spring and early summer and circulates water around the Capricorn-Bunker Reefs [30]. Sea surface temperature in the Capricorn-Bunker Group averages 20°C in winter and 27-28°C in summer [30].
The major source of terrestrial input to the region is the Fitzroy River, which flows into Keppel Bay southeast ofRockhampton (Figure 1). The catchment extends over approximately 142, 500 km2 and is topographically and geologically diverse. Land use is dominated by grazing and mining. The catchment was once extensively vegetated with Brigalow (Acacia harpophylla) that was largely cleared for grazing in the mid-20th century (38]. The Fitzroy is the second largest river that flows into the GBR lagoon [39] and has a mean annual discharge of approximately 5.9 x 10⁶ megalitres (40). Discharge is highly variable both seasonally and annually, with the magnitude and frequency of discharge dependent on the influence of the El Nino Southern Oscillation (ENSO) and summer cyclone activity [41). In a typical year, the discharge of the Fitzroy River is relatively small, but large floods occur on average every 5-10 years [ 42].
2.2. Sampling Techniques. The Australian Institute of Marine Science (AIMS) has used the manta tow technique to survey reefs along the length of the GBR since 1986 as part of an ongoing Long Term Monitoring Program (LTMP). The manta tow technique involves towing a snorkel diver along the surface behind a small boat. The method provides a general description of large areas of reef and can be used to gauge broad changes in distribution and abundance of organisms. Manta tows are used to describe the broadscale pattern and extent of COTS activity on the GBR. Manta towing is used to survey entire perimeters of reefs, such that a reef constitutes the unit of survey. Two teams work in opposite directions around the reef to survey about half the perimeter each. A team consists of a boat driver and an observer who is towed along the surface slowly behind the boat holding on to a manta board at approximately 6 km/h (100 m per minute). The boat driver tows the observer parallel to the reef crest and close enough for the observer to see as much of the shallow (generally <10 m) reef slope as possible.
3
At two-minute intervals the boat stops, allowing the observer to record observations, including percent cover ofliving hard and soft coral, counts of COTS (including an estimate of their size), and associated feeding scars. The number of manta tows required to complete a survey of each reef perimeter will vary depending upon the size of the reef. On average a reef in the Swain region requires ~40 two-minute tows to complete, while a reef in the Capricorn-Bunker region requires ~60 tows. The method is documented in detail in a Standard Operational Procedure [ 43].
The AIMS LTMP has surveyed varying numbers of reefs in the Swain and Capricorn-Bunker regions each year since 1986 (see Table 1). While some reefs have been surveyed annually or biennially (key reefs), other reefs have been surveyed much less frequently. Sampling is designed to represent a broad overview of reefs in the two sectors (Figure 1), so the individual reefs that are surveyed within a sector have varied from year to year. More details of the surveys can be found in the Long Term Monitoring Report 2008 [ 4). Surveys are made over the Austral summer, so the reporting period runs from 1 July to 30 June; for instance, the 2012 survey year includes reefs surveyed between July 2011 and June 2012.
The densities of COTS on a reef are expressed as the average number of COTS per tow. Two categories of outbreak are distinguished: Active Outbreak (AO) and Incipient Outbreak (IO). In principle, an Active Outbreak occurs when starfish densities reach levels where loss of coral tissue through starfish feeding is likely to be faster than the growth of the coral. Research into the feeding behaviour of COTS indicates that depletion of live coral cover on reefs will occur above a threshold ofl000 COTSkm-2 (10 ha-1
) [3], while manta tow data, taking into account coral cover, indicated a threshold of -1500 COTS km-2
[ 44]. This corresponds to approximately 0.22 COTS per two-minute tow. After consideration of the relative costs of Type I and Type II errors, the criterion for an Active Outbreak was revised upwards to approximately l.0COTS per two-minute manta tow [45]. This represents a starfish density that is highly likely to cause net decline in coral cover. Less dense populations (0.22-1.0 COTS per tow) are referred to as Incipient Outbreak representing COTS densities that may impact on coral cover.
115
3. Results
For the first two decades of manta tow surveys, small numbers of COTS were seen intermittently, mainly on reefs in the southern part of the Capricorn-Bunker region, and no outbreaks were recorded (Table 1). More recently, COTS numbers in this sector have increased steadily since 2008 (Figures 2 and 3), with the highest numbers recorded during surveys in 2014. The greatest numbers of COTS were seen at Fairfax Island Reef. COTS were first recorded below outbreak levels at 0.11 ± 0.01 (mean ± SE) COTS per tow on Fairfax Island Reef in 2010. When the reef was next surveyed in 2012, COTS numbers had increased to 0.97 ± 0.97 COTS per tow and the reef was declared an Active Outbreak. This was the first Active Outbreak to be recorded using manta tow on any reef in the Capricorn-Bunker Group since AIMS surveys began in 1986. The average size of COTS in all surveys exceeded 25 cm in
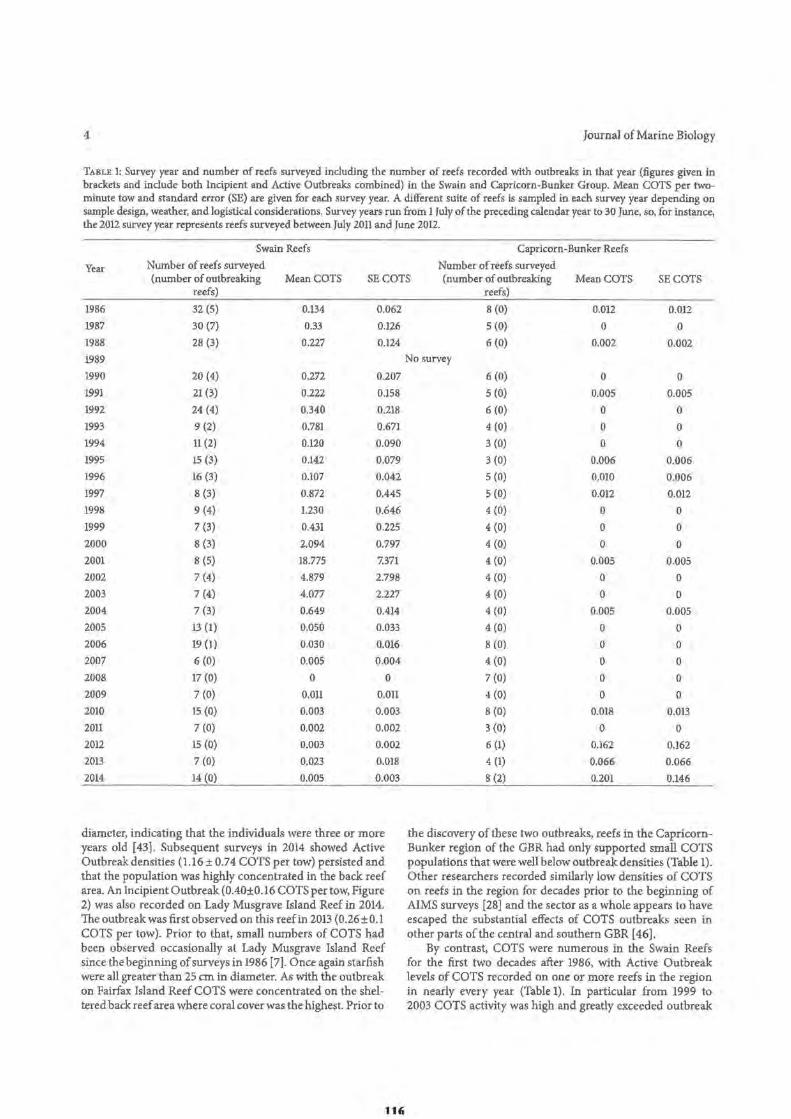
4 Journal of Marine Biology
TABLE 1: Survey year and number of reefs surveyed including the number of reefs recorded with outbreaks in that year (figures given in brackets and include both Incipient and Active Outbreaks combined) in the Swain and Capricorn-Bunker Group. Mean COTS per two-minute tow and standard error (SE) are given for each survey year. A different suite of reefs is sampled in each survey year depending on sample design, weather, and logistical considerations. Survey years run from 1 July of the preceding calendar year to 30 June, so, for instance, the 2012 survey year represents reefs surveyed between July 2011 and June 2012.
Swain Reefs Capricorn-Bunker Reefs
Year Number of reefs surveyed Number of reefs surveyed (number of outbreaking Mean COTS SE COTS (number of outbreaking Mean COTS SE COTS
reefs)
1986 32 (5) 0.134 0.062
1987 30 (7) 0.33 0.126
1988 28 (3) 0.227 0.124
1989
1990 20 (4) 0.272 0.207
1991 21 (3) 0.222 0.158
1992 24 (4) 0.340 0.218
1993 9 (2) 0.781 0.671
1994 11 (2) 0.120 0.090
1995 15 (3) 0.142 0.079
1996 16 (3) 0.107 0.042
1997 8 (3) 0.872 0.445
1998 9 (4) 1.230 0.646
1999 7 (3) 0.431 0.225
2000 8 (3) 2.094 0.797
2001 8 (5) 18.775 7.371
2002 7 (4) 4.879 2.798
2003 7 (4) 4.077 2.227
2004 7 (3) 0.649 0.414
2005 13 (1) 0.050 0.033
2006 19 (1) 0.030 0.016
2007 6 (0) 0.005 0.004
2008 17 (0) 0 0
2009 7 (0) 0.011 0.011
2010 15 (0) 0.003 0.003
2011 7 (0) 0.002 0.002
2012 15 (0) 0.003 0.002
2013 7 (0) 0.023 0.018
2014 14 (0) 0.005 0.003
diameter, indicating that the individuals were three or more years old [43). Subsequent surveys in 2014 showed Active Outbreak densities (1.16 ± 0.74 COTS per tow) persisted and that the population was highly concentrated in the back reef area. An Incipient Outbreak (0.40±0.16 COTS per tow, Figure 2) was also recorded on Lady Musgrave Island Reef in 2014. The outbreak was first observed on this reef in 2013 (0.26±0.l COTS per tow). Prior to that, small numbers of COTS had been observed occasionally at Lady Musgrave Island Reef since the beginning of surveys in 1986 [7]. Once again starfish were all greater than 25 cm in diameter. As with the outbreak on Fairfax Island Reef COTS were concentrated on the sheltered back reef area where coral cover was the highest. Prior to
116
reefs)
8 (0) 0.012 0.012
5 (0) 0 0
6 (0) 0.002 0.002
No survey
6 (0) 0 0
5 (0) 0.005 0.005
6 (0) 0 0
4 (0) 0 0
3 (0) 0 0
3 (0) 0.006 0.006
5 (0) 0.010 0.006
5 (0) 0.012 0.012
4 (0) 0 0
4 (0) 0 0
4 (0) 0 0
4 (0) 0.005 0.005
4 (0) 0 0
4 (0) 0 0
4 (0) Ci.005 0.005
4 (0) 0 0
8 (0) 0 0
4 (0) 0 0
7 (0) 0 0
4 (0) 0 0
8 (0) 0.018 0.013
3 (0) 0 0
6 (1) 0.162 0.162
4 (1) 0.066 0.066
8 (2) 0.201 0.146
the discovery of these two outbreaks, reefs in the CapricornBunker region of the GBR had only supported small COTS populations that were well below outbreak densities (Table 1). Other researchers recorded similarly low densities of COTS on reefs in the region for decades prior to the beginning of AIMS surveys [28] and the sector as a whole appears to have escaped the substantial effects of COTS outbreaks seen in other parts of the central and southern GBR [ 46].
By contrast, COTS were numerous in the Swain Reefs for the first two decades after 1986, with Active Outbreak levels of COTS recorded on one or more reefs in the region in nearly every year (Table 1). In particular from 1999 to 2003 COTS activity was high and greatly exceeded outbreak
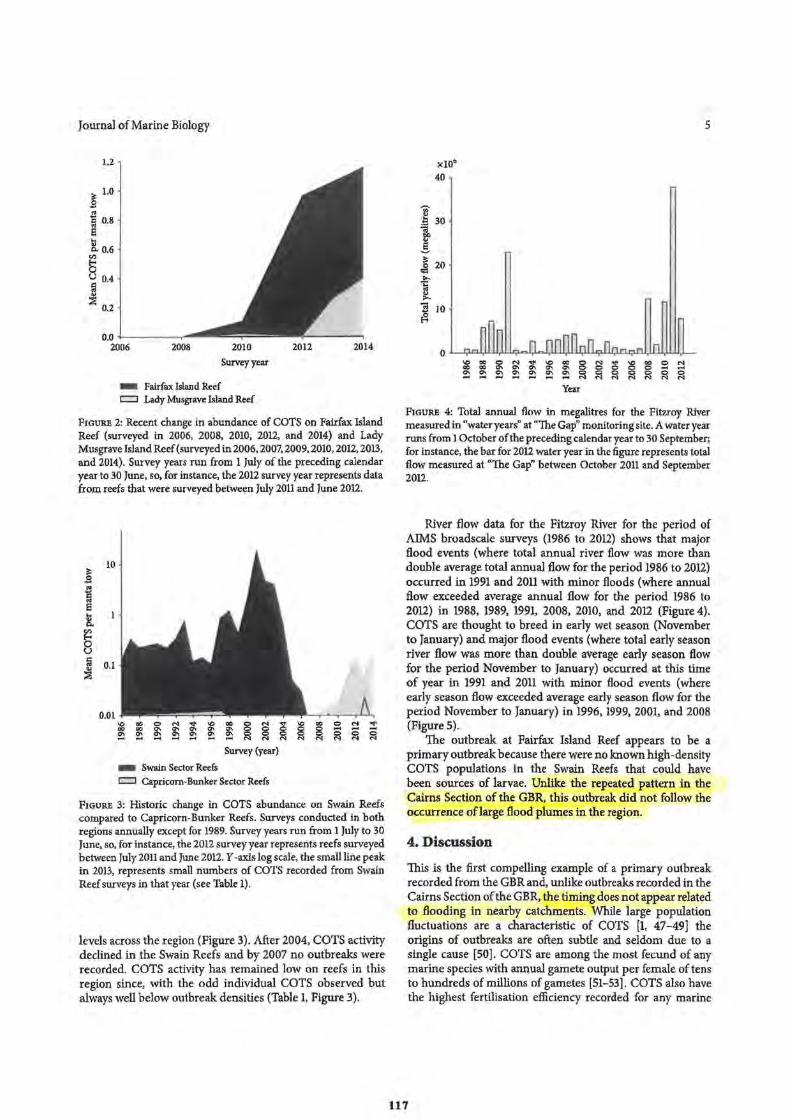
Journal of Marine Biology
1.2
0.0 .j___ _______ !!!!!
2006 2008 2010 2012 2014
Surveyyear
- Fairfax Island Reef C=::J Lady Musgrave Island Reef
FIGURE 2: Recent change in abundance of COTS on Fairfax Island Reef (surveyed in 2006, 2008, 2010, 2012, and 2014) and Lady Musgrave Island Reef (surveyed in 2006, 2007, 2009, 2010, 2012, 2013, and 2014). Survey years run from 1 July of the preceding calendar year to 30 June, so, for instance, the 2012 survey year represents data from reefs that were surveyed between July 2011 and June 2012.
§ i E .. .. I>,
"' 1--0 u la ~
10
0.1
Survey (year}
- Swain Sector Reefs C=::J Capricorn-Bunker Sector Reefs
FIGURE 3: Historic change in COTS abundance on Swain Reefs compared to Capricorn-Bunker Reefs. Surveys conducted in both regions annually except for 1989. Survey years run from 1 July to 30 June, so, for instance, the 2012 survey year represents reefs surveyed between July 2011 and June 2012. Y-axis log scale, the small line peak in 2013, represents small numbers of COTS recorded from Swain Reef surveys in that year ( see Table 1).
levels across the region (Figure 3). After 2004, COTS activity declined in the Swain Reefs and by 2007 no outbreaks were recorded. COTS activity has remained low on reefs in this region since, with the odd individual COTS observed but always well below outbreak densities (Table 1, Figure 3).
xl06
40
E :t:: 30
1 j 20
t 7! 10 ~
GO 0 °' 0 °' 0 - "' Year
5
FIGURE 4: Total annual flow in megalitres for the Fitzroy River measured in "water years" at "The Gap" monitoring site. A water year runs from 1 October of the preceding calendar year to 30 September; for instance, the bar for 2012 water year in the figure represents total flow measured at "The Gap" between October 2011 and September 2012.
River flow data for the Fitzroy River for the period of AIMS broadscale surveys (1986 to 2012) shows that major flood events (where total annual river flow was more than double average total annual flow for the period 1986 to 2012) occurred in 1991 and 2011 with minor floods (where annual flow exceeded average annual flow for the period 1986 to 20U) in 1988, 1989, 1991, 2008, 2010, and 20U (Figure 4) . COTS are thought to breed in early wet season (November to January) and major flood events (where total early season river flow was more than double average early season flow for the period November to January) occurred at this time of year in 1991 and 2011 with minor flood events (where early season fl.ow exceeded average early season fl.ow for the period November to January) in 1996, 1999, 2001, and 2008 (Figures).
The outbreak at Fairfax Island Reef appears to be a primary outbreak because there were no known high-density COTS populations in the Swain Reefs that could have been sources of larvae. Unlike the repeated pattern in the Cairns Section of the GBR, this outbreak did not follow the occurrence oflarge flood plumes in the region.
4. Discussion
This is the first compelling example of a primary outbreak recorded from the GBR and, unlike outbreaks recorded in the Cairns Section of the GBR, the timing does not appear related to flooding in nearby catchments. While large population fluctuations are a characteristic of COTS (1, 47-49] the origins of outbreaks are often subtle and seldom due to a single cause [50]. COTS are among the most fecund of any marine species with annual gamete output per female of tens to hundreds of millions of gametes [51-53]. COTS also have the highest fertilisation efficiency recorded for any marine
117
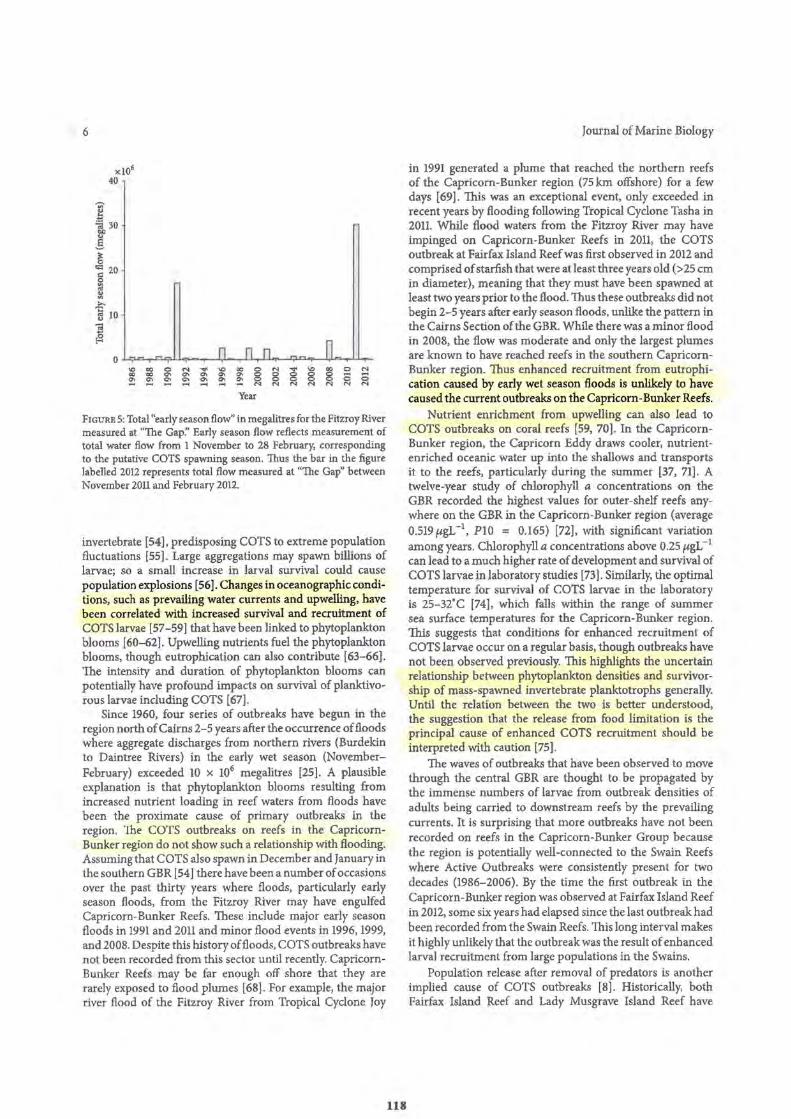
6
-;;;~
xl06 40
130 5 ~
,;:: 20
I 1:! >-;:: I:! 10
'3 ~
Olc;:an 1 □ 9ll"i"' 111 11 1 11,- 9nr;, 1,101 111
\DCCON•\Doo§ COC00\0'\0\0\0\
°'°'°'°'°'°'°' ..-1 ,,.... - ..-I ..... ...,. - N
Year
N~\OOOCN
8 8 8 8 o o N N N N N N
FIGURE 5: Total "early season flow" in megalitres for the Fitzroy River measured at "The Gap:' Early season flow reflects measurement of total water flow from 1 November to 28 February, corresponding to the putative COTS spawning season. Thus the bar in the figure labelled 2012 represents total flow measured at "The Gap" between November 2011 and February 2012.
invertebrate [54], predisposing COTS to extreme population fluctuations [55]. Large aggregations may spawn billions of larvae; so a small increase in larval survival could cause population explosions [56]. Changes in oceanographic conditions, such as prevailing water currents and upwelling, have been correlated with increased survival and recruitment of COTS larvae [ 57-59] that have been linked to phytoplankton blooms [60-62]. Upwelling nutrients fuel the phytoplankton blooms, though eutrophication can also contribute [63-66]. The intensity and duration of phytoplankton blooms can potentially have profound impacts on survival of planktivorous larvae including COTS (67].
Since 1960, four series of outbreaks have begun in the region north of Cairns 2-5 years after the occurrence of floods where aggregate discharges from northern rivers (Burdekin to Daintree Rivers) in the early wet season (NovemberFebruary) exceeded 10 x 106 megalitres (25]. A plausible explanation is that phytoplankton blooms resulting from increased nutrient loading in reef waters from floods have been the proximate cause of primary outbreaks in the region. lhe COTS outbreaks on reefs in the CapricornBunker region do not show such a relationship with flooding. Assuming that COTS also spawn in December and January in the southern G BR [ 54] there have been a number of occasions over the past thirty years where floods, particularly early season floods, from the Fitzroy River may have engulfed Capricorn-Bunker Reefs. These include major early season floods in 1991 and 2011 and minor flood events in 1996, 1999, and 2008. Despite this history offloods, COTS outbreaks have not been recorded from this sector until recently. CapricornBunker Reefs may be far enough off shore that they are rarely exposed to flood plumes [68]. For example, the major river flood of the Fitzroy River from Tropical Cyclone Joy
118
Journal of Marine Biology
in 1991 generated a plume that reached the northern reefs of the Capricorn-Bunker region (75 km offshore) for a few days [69]. This was an exceptional event, only exceeded in recent years by flooding following Tropical Cyclone Tasha in 2011. While flood waters from the Fitzroy River may have impinged on Capricorn-Bunker Reefs in 2011, the COTS outbreak at Fairfax Island Reef was first observed in 2012 and comprised of starfish that were at least three years old ( > 25 cm in diameter), meaning that they must have been spawned at least two years prior to the flood. Thus these outbreaks did not begin 2-5 years after early season floods, unlike the pattern in the Cairns Section of the GBR. While there was a minor flood in 2008, the flow was moderate and only the largest plumes are known to have reached reefs in the southern CapricornBunker region. Thus enhanced recruitment from eutrophication caused by early wet season floods is unlikely to have caused the current outbreaks on the Capricorn-Bunker Reefs.
Nutrient enrichment from upwelling can also lead to COTS outbreaks on coral reefs [59, 70). In the CapricornBunker region, the Capricorn Eddy draws cooler, nutrientenriched oceanic water up into the shallows and transports it to the reefs, particularly during the summer [37, 71]. A twelve-year study of chlorophyll a concentrations on the GBR recorded the highest values for outer-shelf reefs anywhere on the GBR in the Capricorn-Bunker region (average 0.519 µgL- 1
, PIO = 0.165) [72], with significant variation among years. Chlorophyll a concentrations above 0.25 µgL- 1
can lead to a much higher rate of development and survival of COTS larvae in laboratory studies [73]. Similarly, the optimal temperature for survival of COTS larvae in the laboratory is 25-32'C [74], which falls within the range of summer sea surface temperatures for the Capricorn-Bunker region. This suggests that conditions for enhanced recruitment of COTS larvae occur on a regular basis, though outbreaks have not been observed previously. This highlights the uncertain relationship between phytoplankton densities and survivorship of mass-spawned invertebrate planktotrophs generally. Until the relation between the two is better understood, the suggestion that the release from food limitation is the principal cause of enhanced COTS recruitment should be interpreted with caution [75].
Tue waves of outbreaks that have been observed to move through the central GBR are thought to be propagated by the immense numbers of larvae from outbreak densities of adults being carried to downstream reefs by the prevailing currents. It is surprising that more outbreaks have not been recorded on reefs in the Capricorn-Bunker Group because the region is potentially well-connected to the Swain Reefs where Active Outbreaks were consistently present for two decades (1986-2006). By the time the first outbreak in the Capricorn-Bunker region was observed at Fairfax Island Reef in 2012, some six years had elapsed since the last outbreak had been recorded from the Swain Reefs. This long interval makes it highly unlikely that the outbreak was the result of enhanced larval recruitment from large populations in the Swains.
Population release after removal of predators is another implied cause of COTS outbreaks [8]. Historically, both Fairfax Island Reef and Lady Musgrave Island Reef have
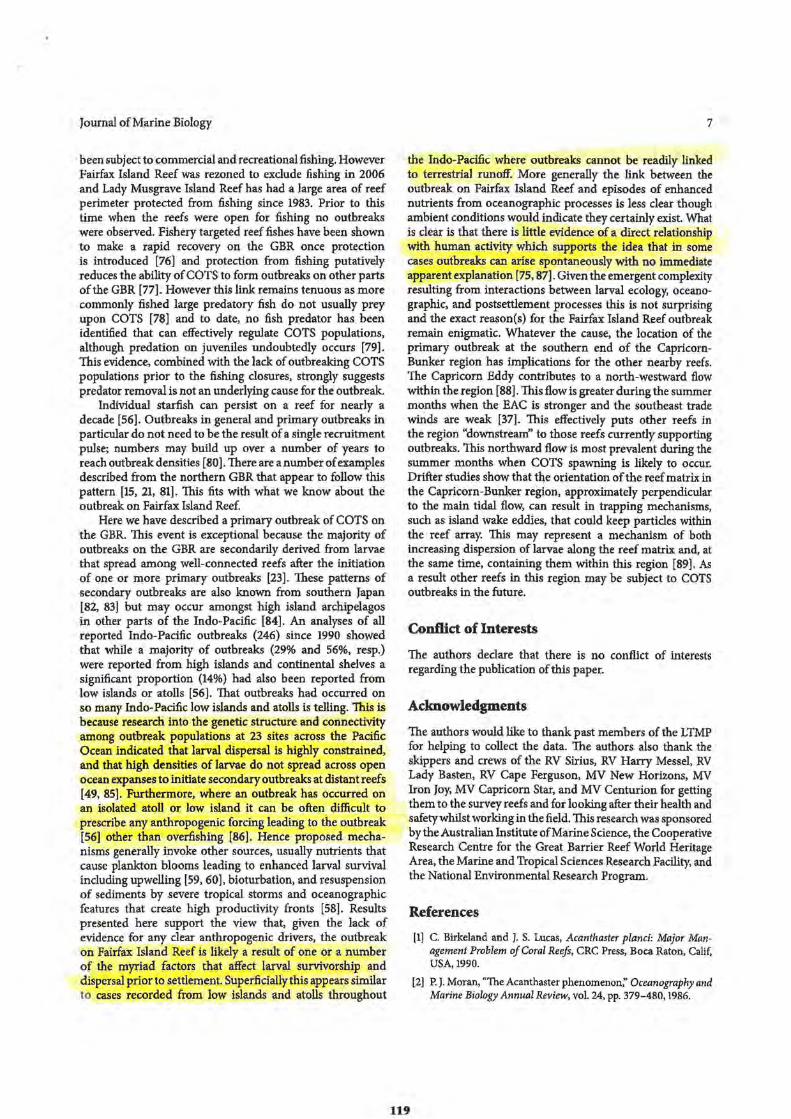
Journal of Marine Biology
been subject to commercial and recreational fishing. However Fairfax Island Reef was rezoned to exclude fishing in 2006 and Lady Musgrave Island Reef has had a large area of reef perimeter protected from fishing since 1983. Prior to this time when the reefs were open for fishing no outbreaks were observed. Fishery targeted reef fishes have been shown to make a rapid recovery on the GBR once protection is introduced [76] and protection from fishing putatively reduces the ability of COTS to form outbreaks on other parts of the GBR [77]. However this link remains tenuous as more commonly fished large predatory fish do not usually prey upon COTS [78] and to date, no fish predator has been identified that can effectively regulate COTS populations, although predation on juveniles undoubtedly occurs [79]. This evidence, combined with the lack of outbreaking COTS populations prior to the fishing closures, strongly suggests predator removal is not an underlying cause for the outbreak.
Individual starfish can persist on a reef for nearly a decade [56). Outbreaks in general and primary outbreaks in particular do not need to be the result of a single recruitment pulse; numbers may build up over a number of years to reach outbreak densities [80). There are a number of examples described from the northern GBR that appear to follow this pattern [15, 21, 81]. This fits with what we know about the outbreak on Fairfax Island Reef.
Here we have described a primary outbreak of COTS on the GBR. This event is exceptional because the majority of outbreaks on the GBR are secondarily derived from larvae that spread among well-connected reefs after the initiation of one or more primary outbreaks [23]. These patterns of secondary outbreaks are also known from southern Japan [82, 83) but may occur amongst high island archipelagos in other parts of the Indo-Pacific [84]. An analyses of all reported Indo-Pacific outbreaks (246) since 1990 showed that while a majority of outbreaks (29% and 56%, resp.) were reported from high islands and continental shelves a significant proportion (14%) had also been reported from low islands or atolls [56]. That outbreaks had occurred on so many Indo-Pacific low islands and atolls is telling. This is because research into the genetic structure and connectivity among outbreak populations at 23 sites across the Pacific Ocean indicated that larval dispersal is highly constrained, and that high densities of larvae do not spread across open ocean expanses to initiate secondary outbreaks at distant reefs [49, 85). Furthermore, where an outbreak has occurred on an isolated atoll or low island it can be often difficult to prescribe any anthropogenic forcing leading to the outbreak [56] other than overfishing [86]. Hence proposed mechanisms generally invoke other sources, usually nutrients that cause plankton blooms leading to enhanced larval survival including upwelling [59, 60], bioturbation, and resuspension of sediments by severe tropical storms and oceanographic features that create high productivity fronts [58]. Results presented here support the view that, given the lack of evidence for any clear anthropogenic drivers, the outbreak on Fairfax Island Reef is likely a result of one or a number of the myriad factors that affect larval survivorship and dispersal prior to settlement. Superficially this appears similar to cases recorded from low islands and atolls throughout
7
the Indo-Pacific where outbreaks cannot be readily linked to terrestrial runoff. More generally the link between the outbreak on Fairfax Island Reef and episodes of enhanced nutrients from oceanographic processes is less clear though ambient conditions would indicate they certainly exist. What is clear is that there is little evidence of a direct relationship with human activity which supports the idea that in some cases outbreaks can arise spontaneously with no immediate apparent explanation [75, 87]. Given the emergent complexity resulting from interactions between larval ecology, oceanographic, and postsettlement processes this is not surprising and the exact reason(s) for the Fairfax Island Reef outbreak remain enigmatic. Whatever the cause, the location of the primary outbreak at the southern end of the CapricornBunker region has implications for the other nearby reefs. The Capricorn Eddy contributes to a north-westward flow within the region [88]. This flow is greater during the summer months when the EAC is stronger and the southeast trade winds are weak [37). This effectively puts other reefs in the region "downstream" to those reefs currently supporting outbreaks. This northward flow is most prevalent during the summer months when COTS spawning is likely to occur. Drifter studies show that the orientation of the reef matrix in the Capricorn-Bunker region, approximately perpendicular to the main tidal flow, can result in trapping mechanisms, such as island wake eddies, that could keep particles within the reef array. This may represent a mechanism of both increasing dispersion of larvae along the reef matrix and, at the same time, containing them within this region [89]. As a result other reefs in this region may be subject to COTS outbreaks in the future.
Conflict of Interests
The authors declare that there is no conflict of interests regarding the publication of this paper.
Acknowledgments
The authors would like to thank past members of the LTMP for helping to collect the data. The authors also thank the skippers and crews of the RV Sirius, RV Harry Messel, RV Lady Basten, RV Cape Ferguson, MV New Horizons, MV Iron Joy, MV Capricorn Star, and MV Centurion for getting them to the survey reefs and for looking after their health and safety whilst working in the field. This research was sponsored by the Australian Institute of Marine Science, the Cooperative Research Centre for the Great Barrier Reef World Heritage Area, the Marine and Tropical Sciences Research Facility, and the National Environmental Research Program.
References
119
[l] C. Birkeland and J. S. Lucas, Acanthaster planci: Major Management Problem of Coral Reefs, CRC Press, Boca Raton, Calif, USA, 1990.
[2] P. J. Moran, "The Acanthaster phenomenon;• Oceanography and Marine Biology Annual Review, vol. 24, pp. 379-480, 1986.
8
[3] J. K. Keesing and J. S. Lucas, "Field measurement of feeding and movement rates of the crown-of-thorns starfish Acanthaster plance (L.)," Journal of Experimental 1\lfarine Biology and Ecology, vol. 156, no. 1, pp. 89-91, 94-104, 1992.
[4] H.P. A. Sweatman, A. J. Cheal, G. J. Coleman et al., "Long-term monitoring of the Great Barrier Reef,' Status Report 8, Australian Institute of Marine Science, Townsville, Australia, 2008, http://www.aims.gov.au/documents/30301/e05Sdf14-24d0-40cab46d-4ae1988da07 c.
[SJ K. Osborne, A. M. Dolman, S. C. Burgess, and K. A. Johns, "Disturbance and the dynamics of coral cover on the Great Barrier Reef (1995-2009)," PLoS ONE, vol. 6, no. 3, Article ID e17516, 2011.
(6) G. De'.A.th,K. E. Fabricius, H. Sweatman, andM. Puotinen, "The 27-year decline of coral cover on the Great Barrier Reef and its causes:• Proceedings of the National Academy of Sciences of the United States of America, vol. 109, no. 44, pp.17995-17999, 2012.
(7) I. R. Miller and H. Sweatman, "The status of crown-of-thorns starfish populations on the Great Barrier Reef from AIMS surveys:' Report to the National Environmental Research Program, Reef and Rainforest Research Centre, Cairns, Australia, 2013, http://www.nerptropicaLedu.au/sites/defaultJfiles/publications/ files/The%20status%20of%20crown-of-thorns%20starfish ... % 20Miller%20et%20al%202013.pdf.
[ 8] R. Ende an, "Acanthaster planci infestations on reefs of the Great Barrier Reef,' in Proceedings of the 3rd International Coral Reef Symposium, D. L. Taylor, Ed., pp.185-191, Miami, Fla, USA, 1977.
[ 9] P. J. Vine, "Densities of Acanthaster p/anci in the Pacific Ocean:' Nature, vol. 228, pp. 341-342, 1970.
[10] J.M. Branham, S. A. Reed, J. H. Bailey, and J. Caperon, "Coraleating sea stars Acanthaster planci in Hawaii;' Science, vol. 172, no. 3988, pp. 1155-1157, 1971.
(11] R. F. G. Ormond and A. C. Campbell, "Observations on Acanthaster planci and other coral reef echinoderms in the Sudanese Red Sea;' in Regional Variation in India11 Ocean Coral Reefs, S. M. Yonge and D. R. Stoddart, Eds., vol. 28 of Symposia of the Zoological Society of London, pp. 433-454, Academic Press, 1971.
[12] T. F. Dana, W. A. Newman, and E.W. Fager, ''Acanthaster aggregations: interpreted as primarily responses to natural phenomena;' Pacific Science, vol. 26, pp. 355-372. 1972.
[13) C. Birkeland, "Terrestrial runoff as a cause of outbreaks of Acanthaster planci (Echinodermata: Asteroidea):' Marine Biology, vol. 69, no. 2, pp. 175-185, 1982.
[14] J. Brodie, K. Fabricius, G. De'ath, and K. Okaji, ''.Are increased nutrient inputs responsible for more outbreaks of crown-ofthorns starfish? An appraisal of the evidence;' Marine Pollution Bulletin, vol. 51, no. 1-4, pp. 266-278, 2005.
(15] M. S. Pratchett, "Dynamics of an outbreak population of Acanthaster planci at Lizard Island, northern Great Barrier Reef (1995-1999);' Coral Reefs, vol. 24, no. 3, pp. 453-462, 2005.
[16] G. L. Eckert, "Effects of the planktonic period on marine population fluctuations:• Ecology, vol. 84, no. 2, pp. 372-383, 2003.
[17] J. H. Barnes, "The crown-of-thorns starfish as a destroyer of coral," Australian Natural History, vol. 15, pp. 257-261, 1966.
(18] F. H. Talbot and M. S. Talbot, "The crown-of-thorns starfish (Acanthaster) and the Great Barrier Reef:' Endeavour, vol. 30, pp. 38-42, 1971.
[19] R. G. Pearson, "Changes in distribution of Acanthaster planci populations on the Great Barrier Reef;' Nature, vol. 237, no. 5351, pp. 175-176, 1972.
1')8
Journal of Marine Biology
(20] P. J. Moran, G. De'ath, V. J. Baker et al., "Pattern of outbreaks of crown-of-thorns starfish (Acanthaster planci L.) along the Great Barrier Reef since 1966," Australian Journal of Marine and Freshwater Research, vol. 43, no. 3, pp. 555-568, 1992.
(21] I. Miller, "Historical patterns and current trends in the broadscale distribution of crown-of-thorns starfish in the northern and central sections of the Great Barrier Reef,' in Proceedings of the 9th International Coral Reef Symposium, vol. 2, pp.1478-1484, Ministry of Environment and the Indonesian Institute of Science, Bali, Indonesia, 2000.
[ 22] K. E. Fabricius, K. Okaji, and G. De'ath, "Three lines of evidence to link outbreaks of the crown-of-thorns seastar Acanthaster planci to the release of larval food limitation;' Coral Reefs, vol. 29, no. 3, pp. 593-605, 2010.
[23] R. A. Kenchington, "Growth and recruitment of Acanthaster planci (L.) on the Great Barrier Reef;' Biological Conservation, vol. 11, no. 2, pp. 103-118, 1977.
[24] R. Endean, "Crown-of-thorns starfish on the Great Barrier Reef," Endeavour, vol. 6, no. l, pp.10-14, 1982.
[25] M. Furnas, R. Brinkman, K. Fabricius, H. Tonin, and B. Schaffelke, "Linkages between river runoff, phytoplankton blooms and primary outbreaks of crown-of-thorns starfish in the Northern GBR," in Assessment of the Relative Risk of Water Quality to Ecosystems of the Great Barrier Reef Supporting Studies, A Report to the Department of the Environment and Heritage Protection, chapter 1, pp. 1-299, Queensland Government, Brisbane, Australia, 2013, TropWATER Report 13/30, Townsville, Australia.
(26] Australian Institute of Marine Science Long Term Monitoring Program, Report on Surveys of the Cooktown-Lizard Island, Cairns and Innisfail Sectors of the Great Barrier Reef, Australian Institute of Marine Science, Townsville, Australia, 2009, http:// www.airns.gov.au/docs/research/monitoring/reefntm20091l-l2 .html.
[27] R. E. Reichelt, W. Greve, R. H. Bradbury, and P. J. Moran, "Acanthaster planci outbreak initiation: a starfish-coral site model;' Ecological Modelling, vol. 49, no. 3-4, pp. 153-177, 1990.
[28] P. D. Walbran, R. A. Henderson, A. J. T. Jull, and J.M. Head, "Evidence from sediments of long-term Acanthaster planci predation on corals of the Great Barrier Reef,' Science, vol. 245, no. 4920, pp. 847-850, 1989.
[29] D. Hopley, The Geomorphology of the Great Barrier Reef Quaternary Development of Coral Reefs, John Wiley & Sons, New York, NY, USA, 1982.
(30) J. S. Jell and G. E. Webb, "Geology of Heron island and adjacent reefs, Great Barrier Reef, Australia;• Episodes, vol. 35, no. 1, pp. 110-119, 2012.
(31] J. H. Middleton, P. Coutis, D. A. Griffin et al., "Circulation and water mass characteristics of the Southern Great Barrier Reef;' Australian Journal of Marine & Freshwater Research, vol. 45, no. 1. pp. 1-18, 1994.
[32] y. C. Andrews and S. Clegg, "Coral Sea circulation and transport deduced from modal information models;' Deep Sea Research Part A, Oceanographic Research Papers, vol. 36, no. 6, pp. 957-974, 1989.
[33] J. A. Church, "East Australian current adjacent to the Great Barrier Reef:' Australian Journal of Marine and Freshwater Research, vol. 38, no. 6, pp. 671-683, 1987.
[34) K. Wyrtki, "Geopotential topographies and associated circulation in the western South Pacific Ocean;• Australian Journal of Marine and Freshwater Research, vol. 13, no. 2, pp. 89-105, 1962.
Journal of Marine Biology
[35] K. R. Ridgway and J. R. Dunn, "Mesoscale structure of the mean East Australian Current System and its relationship with topography;' Progress in Oceanography, vol. 56, no. 2, pp. 189-222, 2003.
[36] I. J. Dight, L. Bode, and M. K. James, "Modelling the larval dispersal of Acanthaster planci. I. Large scale hydrodynamics, Cairns Section, Great Barrier Reef Marine Park," Coral Reefs, vol. 9, no. 3, pp.115-123, 1990.
[37] S. J. Weeks, A. Bakun, C. R. Steinberg, R. Brinkman, and 0. Hoegh-Guldberg, "The Capricorn Eddy: a prominent driver of the ecology and future of the southern Great Barrier Reef;' Coral Reefa,vol.29,no.4,pp.975-985,2010.
[38] H. C. Bostock, B. P. Brooke, D. A. Ryan et al., "Holocene and modern sediment storage in the subtropical macrotidal Fitzroy River estuary, Southeast Queensland, Australia;' Sedimentary Geology, vol. 201, no. 3-4, pp. 321:-340, 2007.
[39] M. Furnas, Catchments and Corals: Terrestrial Runoff to the Great Barrier Reef, Australian Institute of Marine Science and CRC Reef Research Centre, Townville, Australia, 2003.
[40] Queensland Department of Natural Resources and Mines (QDNRM), "Fitzroy basin draft resource operations plan;' Overview Report, 2013, https:/ /www.dnrm.qld.gov.au/ __ data/ assets/pdf_file/0014/104054/fitzroy-draft-rop-overview.pdf.
[ 41] J. M. Lough, "Climate variability and change on the Great Barrier Reef;' in Oceanographic Processes on Coral Reefs: PhysicsBiology Links in the Great Barrier Reef, E. Wolanski, Ed., pp. 269-300, CRC Press, Boca Raton, Fla, USA, 2001.
[42] P. Larcombe and R. M. Carter, "Cyclone pumping, sediment partitioning and the development of the Great Barrier Reef shelf system: a review;' Quaternary Science Reviews, vol. 23, no. 1-2, pp. 107-135, 2004.
[43] I. R. Miller, M. Jonker, and G. Coleman, Crown-of-Thorns Star.fish and Coral Surveys Using the Manta Tow and Scuba Search Techniques Long-Term Monitoring of the Great Barrier Reef Standard Operation Procedure Number 9, Australian Institute of Marine Science, Townsville, Australia, 3rd edition, 2009, http://www.aims.gov.au/documents/30301/20e3bf4f-4b3b-4808-ac02-cl5c29l2c3f2.
[44] P. J. Moran and G. De'ath, "Estimates of the abundance of the crown-of-throns starfish Acanthaster planci in outbreaking and non-outbreaking populations on reefs within the Great Barrier Reef;' Marine Biology, vol. 113, no. 3, pp. 509-515, 1992.
[45] B. R. Lassig and U. Engelhardt, "COTS Comms;' Reef Research, vol. 5, no. 1, pp. 18-23, 1995.
[46] R. A. Henderson, ''Assessment of crown-of-thorns skeletal elements in surface sediment of the Great Barrier Reef,' Coral Reefs, vol.11, no. 2, pp. 103-108, 1992.
[47] S. Uthicke, B. Schaffelke, and M. Byrne, "A boom-bust phylum? Ecological and evolutionary consequences of density variations in echinoderms:• Ecological Monographs, vol. 79, no. 1, pp. 3-24, 2009.
[48] K. Narvaez and F. A. Zapata, "First record and impact of the crown-of-thorns starfish, Acanthaster planci (Spinulosida: Acanthasteridae) on corals of Malpelo Island, Colombian Pacific;' Revista de Biologia Tropical, vol. 58, supplement 1, pp. 139-143, 2010.
[49] M.A. Timmers, C. E. Bird, D. J. Skillings, P. E. Smouse, and R. J. Toonen, "There's no place like home: crown-of-thorns outbreaks in the central pacific are regionally derived and independent events;' PLoS ONE, vol. 7, no. 2, Article ID e31159, 2012.
[50] Australian Academy of Science, ''Acanthaster planci (crownof-thorns starfish) and the Great Barrier Reef;' Reports of
9
the Australian Academy of Science 11, Australian Academy of Science, Canberra, Australia, 1970.
[51] J. S. Lucas, "Reproductive and larval biology of Acanthaster planci (L.) in Great Barrier Reef waters;' Micronesica, vol. 9, pp. 197-203, 1973.
[52] C. Conand, "Distribution, reproductive cycle and morphometric relationship of Acanthaster planci (Echinodermata, Asteroidea) in New Caledonia, western tropical Pacific;' in Proceedings of the 5th International Echinoderm Conference on Echinodermata, B. F. Keegan and B. D. S. O'Connor, Eds., pp. 499-506, Balkema, Rotterdam, The Netherlands, 1985.
[53] E. Ramirez-Llodra, "Fecundity and life-history strategies in marine invertebrates;• Advances in Marine Biology, vol. 43, pp. 88-170, 2002.
[54] R. C. Babcock and C. N. Mundy, "Reproductive biology, spawning and field fertilization rates of Acanthaster planci," Australian Journal of Marine and Freshwater Research, vol. 43, no. 3, pp. 525-534, 1992.
[55] C. Birkeland, "The Faustian traits of the crown-of-thorns starfish;' American Scientist, vol. 77, no. 2, pp.154-163, 1989.
[56] M. S. Pratchett, C. F. Caballes, J. A. Rivera-Posada, and H.P. A. Sweatman, "Limits to understanding and managing outbreaks of crown-of-thorns starfish (Acanthaster spp.};' in Oceanography and Marine Biology: An Annual Review, R. N. Hughes, D. J. Hughes and, and I. P. Smith, Eds., vol. 52, pp. 133-200, CRC Press, Boca Raton, Fla, USA, 2014.
[57] M. Yamaguchi, "Acanthaster planci infestations of reefs and coral assemblages in Japan: a retrospective analysis of control efforts:• Coral Reefs, vol. 5, no. 1, pp. 23-30, 1986.
[58] P. Houk, S. Bograd, and R. van Woesik, "The transition zone chlorophyll front can trigger Acanthaster planci outbreaks in the Pacific Ocean: historical confirmation," Journal of Oceanography, vol. 63, no. 1, pp.149-154, 2007.
[59] P. Houk and J. Raubani, "Acanthaster planci outbreaks in Vanuatu coincide with ocean productivity, furthering trends throughout the pacific ocean;' Journal of Oceanography, vol. 66, no.3,pp.435-438,2010.
[60] V. A. Mendon~a, M. M. Al Jabri, I. AlAjmi, M. Al Muharrami, M. Al Areimiand, and H. A. Al Aghbari, "Persistent and expanding population outbreaks of the corallivorous starfish Acanthaster planci in the North western Indian Ocean: are they really a consequence of unsustainable starfish predator removal through overfishing in coral reefs, or a response to a changing environment?" Zoological Studies, vol. 49, no. 1, pp. 108-123, 2010.
[ 61] J. C. Brock and C.R. McClain, "Interannual variability in phytoplankton blooms observed in the northwestern Arabian Sea during the southwest monsoon;' Journal of Geophysical Research, vol. 97, no. 1, pp. 733-750, 1992.
[62] S. Shang, L. Li, J. Li, Y. Li, G. Lin, and J. Sun, "Phytoplankton bloom during the northeast monsoon in the Luzon Strait bordering the Kuroshio;• Remote Sensing of Environment, vol. 124, pp. 38-48, 2012.
[63] P.R. F. Bell, "Eutrophication and coral reefs-some examples in the Great Barrier Reef lagoon:' Water Research, vol. 26, no. 5, pp. 553-568, 1992.
[64] P. Dufour and B. Berland, "Nutrient control of phytoplanktonic biomass in atoll lagoons and Pacific Ocean waters: studies with factorial enrichment bioassays;' Journal of Experimental Marine Biology and Ecology, vol. 234, no. 2, pp.147-166, 1999.
121
[ 65] P. Douillet, S. Ouillon, and E. Cordier, "A numerical model for fine suspended sediment transport in the southwest lagoon of New Caledonia:' Coral Reefs, vol. 20, no. 4, pp. 361-372, 2001.
[66] J.-P. Torreton, E. Rochelle-Newall, 0. Pringault, S. Jacquet, V. Faure, and E. Briand, "Variability of primary and bacterial production in a coral reef lagoon (New Caledonia);' Marine Pollution Bulletin, vol. 61, no. 7-12, pp. 335-348, 2010.
[67] T. Platt, S. Sathyendranath, G. N. White et al., "Diagnostic properties of phytoplankton time series from remote sensing;' Estuaries and Coasts, vol. 33, no. 2, pp. 428-439, 2010.
[68] M. J. Devlin, L. W McKinna, J. G . .Alvarez-Romero et al., "Mapping the pollutants in surface riverine flood plume waters in the Great Barrier Reef, Australia;' Marine Pollution Bulletin, vol. 65, no. 4-9, pp. 224-235, 2012 . .
[ 69] M. Devlin, J. Waterhouse, J. Taylor, and J. Brodie, "Flood plumes in the Great Barrier Reef: spatial and temporal patterns in composition and distribution;· GBRMPA Research Publication 68, Great Barrier Reef Marine Park Authority, Townsville, Australia, 2001.
[70] V. M. Mendorn;:a, M. M. Al Jabri, I. Al Ajmi, M. Al Muharrami, M. Al Areimi, and H. A. Al Aghbari, "Persistent and expanding population outbreaks of the corallivorous starfish Acanthaster planci in the Northwestern Indian Ocean: are they really a consequence of unsustainable starfish predator removal through overfishing in coral reefs, or a response to a changing environment?" Zoological Studies, vol. 49, no. 1, pp. 108-123, 2010.
[71] J. A. Kleypas and D. M. Burrage, "Satellite observations of circulation in the southern Great Barrier Reef, Australia;• International Journal of Remote Sensing, vol. 15, no. 10, pp. 2051-2063, 1994.
[72] J. Brodie, G. De'ath, M. Devlin, M. Furnas, and M. Wright, "Spatial and temporal patterns of near-surface chlorophyll a in the Great Barrier Reeflagoon:• Marine and Freshwater Research, vol.58,no.4,pp.342-353,200Z
[73] T. Ayukai, K Okaji, and J. Lucas, "Food limitation in the growth and development of crown-of-thorns starfish larvae in the Great Barrier Reef;' in Proceedings of the 8th International Coral Reef Symposium, vol. 1, pp. 621-626, Smithsonian Tropical Research Institute, Panama City, Panama, 199Z
[74] M. Lamare, D. Pecorino, N. Hardy, M. Liddy, M. Byrne, and S. Uthicke, "The thermal tolerance of crown-of-thorns (Acanthaster planci) embryos and bipinnaria larvae: implications for spatial and temporal variation in adult populations:• Coral Reefs, vol. 33, no. 1, pp. 207-219, 2014.
[75] D. J. W Lane, "Acanthaster planci impact on coral communities at permanent transect sites on Bruneian reefs, with a regional overview and a critique on outbreak causes;• Journal of the Marine Biological Association of the United Kingdom, vol. 92, no. 4,pp.803-809,2012.
[76] G. R. Russ, A. J. Chea!, A. M. Dolman et al., "Rapid increase in fish numbers follows creation of world's largest marine reserve network," Current Biology, vol. 18, no. 12, pp. 514-515, 2008.
[77] H. Sweatman, "No-take reserves protect coral reefs from predatory starfish;' Current Biology, vol. 18, no. 14, pp. R598-R599, 2008.
(78) H. P. Sweatman, "A field study of fish predation on juvenile crown-of-thorns starfish," Coral Reefs, vol. 14, no. 1, pp. 47-53, 1995.
[79] J. K. Keesing and A. R. Halford, "Importance ofpostsettlement processes for the population dynamics of Acanthaster planci
Journal of Marine Biology
(L.)," Australian Journal of Marine & Freshwater Research, vol. 43, no. 3, pp. 635-651, 1992.
[80] C. Johnson, "Reproduction, recruitment and hydrodynamics in the crown-of-thorns phenomenon on the Great Barrier Reef: introduction and synthesis;• Australian Journal of Marine and Freshwater Research, vol. 43, pp. 517-523, 1992.
[81] R. Stump, ''.An investigation to describe the population dynamics of Acanthaster planci (L.) around Lizard Island, Cairns Section, Great Barrier Reef Marine Park," CRC Reef Research Centre Technical Report 10, CRC Reef Research Centre, Townsville, Australia, 1996.
[82] N. Yasuda, S. Nagai, M. Hamaguchi, K. Okaji, K. GErard, and K. Nadaoka, "Gene flow of Acanthaster planci (L.) in relation to ocean currents revealed by microsatellite analysis:' Molecular Ecology, vol. 18, no. 8, pp. 1574-1590, 2009.
[83] D. C. Potts, "Crown-of-thorns starfish man induced pest or natural phenomenon?" in The Ecology of Pests: Some Australian Case Histories, R. E. Kitching and R. E. Jones, Eds., pp. 55-86, CSIRO, Melbourne, Australia, 1981.
[84] N. Yasuda, C. Taquet, S. Nagai, T. Yoshida, and M. Adjeroud, "Genetic connectivity of the coral-eating sea star Acanthaster planci during the severe outbreak of2006-2009 in the Society Islands, French Polynesia;' Marine Ecology, 2014.
[85] C. Vogler, J. A. H. Benzie, K. Tenggardjaja, P. H. Barber, and G. Wiirheide, "Phylogeography of the crown-of-thorns starfish: genetic structure within the Pacific species;• Coral Reefs, vol. 32, no. 2, pp. 515-525, 2013.
[86] N. K. Dulvy, R. P. Freckleton, and N. V. C. Polunin, "Coral reef cascades and the indirect effects of predator removal by exploitation," Ecology Letters, vol. 7, no. 5, pp. 410-416, 2004.
[87] M. Kaya!, J. Vercelloni, T. L. de Loma et al., "Predator crown-ofthorns starfish (Acanthaster planci) outbreak, mass mortality of corals, and cascading effects on reef fish and benthic communities," PLoS ONE, vol. 7, no. 10, Article ID e47363, 2012.
[88] D. A. Griffin, J. H. Middleton, and L. Bode, "The tidal and longer-period circulation of Capricornia, Southern Great Barrier Reef;' Australian Journal of Marine and Freshwater Research, vol. 38, no. 4, pp. 461-474, 1987.
[89] A. Mantovanelli, M. L. Heron, S. F. Heron, and C.R. Steinberg, "Relative dispersion of surface drifters in a barrier reef region;• Journal of Geophysical Research C: Oceans, vol. 117, no. 11, Article ID Cll016, 2012.
1.,..,.

JQumalof Signal Transduction ---
Hindawi Submit your manuscripts at
http:/ /www.hindawi.com
International Journal of Microbiology ~~-
The Scientific World Journal

.....
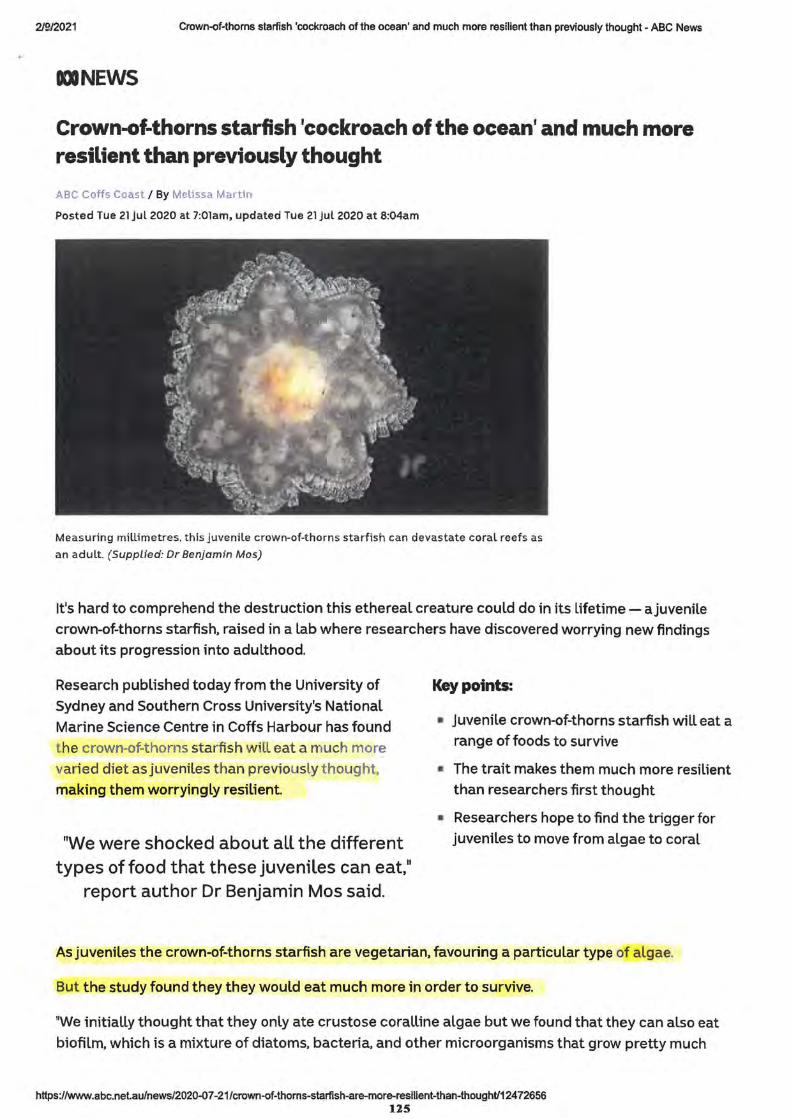
2/9/2021 Crown-of-thorns starfish 'cockroach of the ocean' and much more resilient than previously thought - ABC News
DOINEWS
Crown-of-thorns starfish 'cockroach of the ocean' and much more resilient than previously thought
ABC Coffs Coast / By Melissa Martin
Posted Tue 21 Jul 2020 at 7:01am, updated Tue 21 Jul 2020 at 8:04am
Measuring millimetres, this juvenile c rown-of-thorns starfish can devastate coral reefs as
an adult. (Supplied: Dr Benjamin Mos)
It's hard to comprehend the destruction this ethereal creature could do in its lifetime- a juvenile crown-of-thorns starfish, raised in a lab where researchers have discovered worrying new findings
about its progression into adulthood.
Research published today from the University of
Sydney and Southern Cross University's National
Marine Science Centre in Coffs Harbour has found the crown-of-thorns starfish will eat a much mdre varied diet as juveniles than previously thought.
making them worryingly resilient.
"We were shocked about all the different types of food that these juveniles can eat,"
report author Dr Benjamin Mos said.
Key points:
■ Juvenile crown-of-thorns starfish will eat a range of foods to survive
■ The trait makes them much more resilient than researchers first thought
■ Researchers hope to find the trigger for
juveniles to move from algae to coral
As juveniles the crown-of-thorns starfish are vegetarian, favouring a particular type of algae.
But the study found they they would eat much more in order to survive.
"We initially thought that they only ate crustose coralline algae but we found that they can also eat
biofilm, which is a mixture of diatoms, bacteria, and other microorganisms that grow pretty much
https://www.abc.nelau/news/2020-07-21 /crown-of-thoms-starfish-are-more-reslllent-than-thought/12472656 125
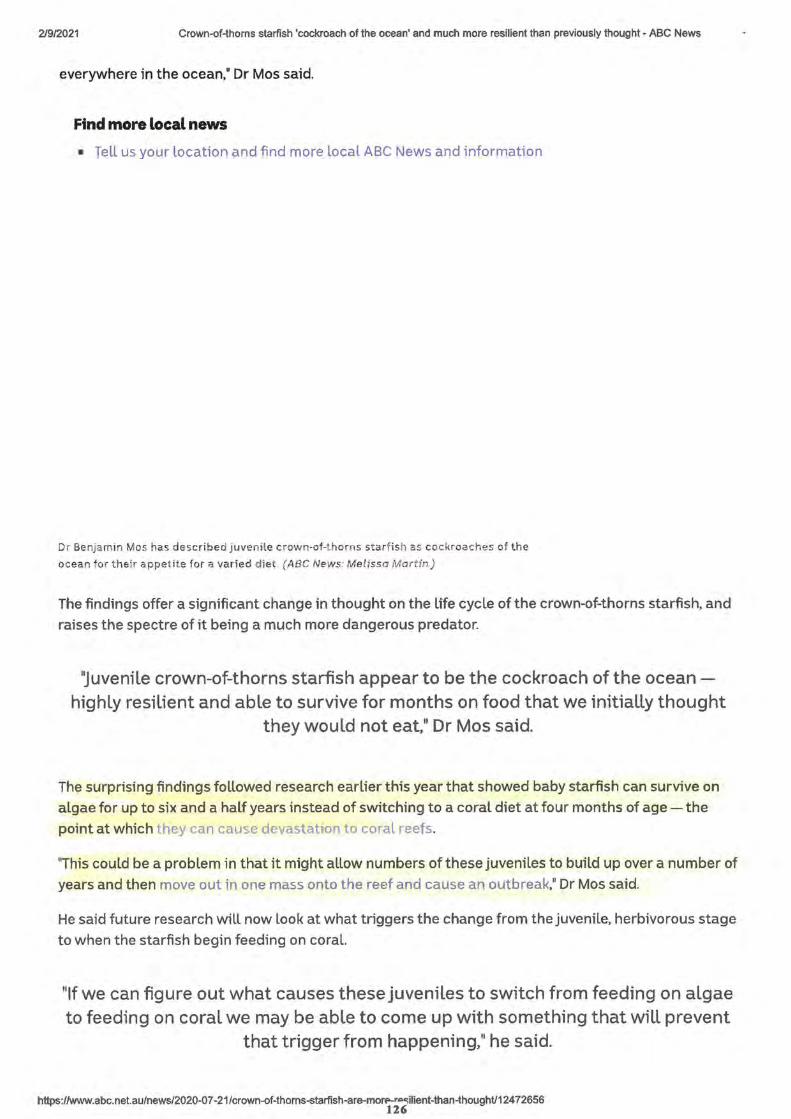
2/9/2021 Crown-of-thorns starfish 'cockroach of the ocean' and much more resilient than previously thought - ABC News
everywhere in the ocean," Dr Mos said.
Find more local news
• Tell us your location and find more local ABC News and information
Dr Benjamin Mos has des cribed juvenile crown-of-t horns starfi s h as cockroaches of the
ocean fo r t he ir appet ite for a varied diet . (ABC News: Melissa Martin.)
The findings offer a significant change in thought on the life cycle of the crown-of-thorns starfish, and
raises the spectre of it being a much more dangerous predator.
'1uvenile crown-of-thorns starfish appear to be the cockroach of the ocean -highly resilient and able to survive for months on food that we initially thought
they would not eat," Dr Mos said.
The surprising findings followed research earlier this year that showed baby starfish can survive on
algae for up to six and a half years instead of switching to a coral diet at four months of age - the
point at which they can cause devastation to coral reefs.
"This could be a problem in that it might allow numbers of these juveniles to build up over a number of
years and then move out in one mass onto the reef and cause an outbreak," Dr Mos said.
He said future research will now look at what triggers the change from the juvenile, herbivorous stage
to when the starfish begin feeding on coral.
"If we can figure out what causes these juveniles to switch from feeding on algae to feeding on coral we may be able to come up with something that will prevent
that trigger from happening," he said.
https://www.abc.net.au/news/2020-07-21/crown-of-thorns-starfish-are-mo!'f'-roc;ilient-than-thoughU12472656 126

219/2021 Crown-of-thorns starfish 'cockroach of the ocean' and much more resilient than previously thought - ABC News
httos://Www.abc.net.au/news/202O-O7-21/crown-of.thoms-starfish-are-martl 2 7:ilient-thim-thn1JOht/1 24 7:1fi!if;

.,..
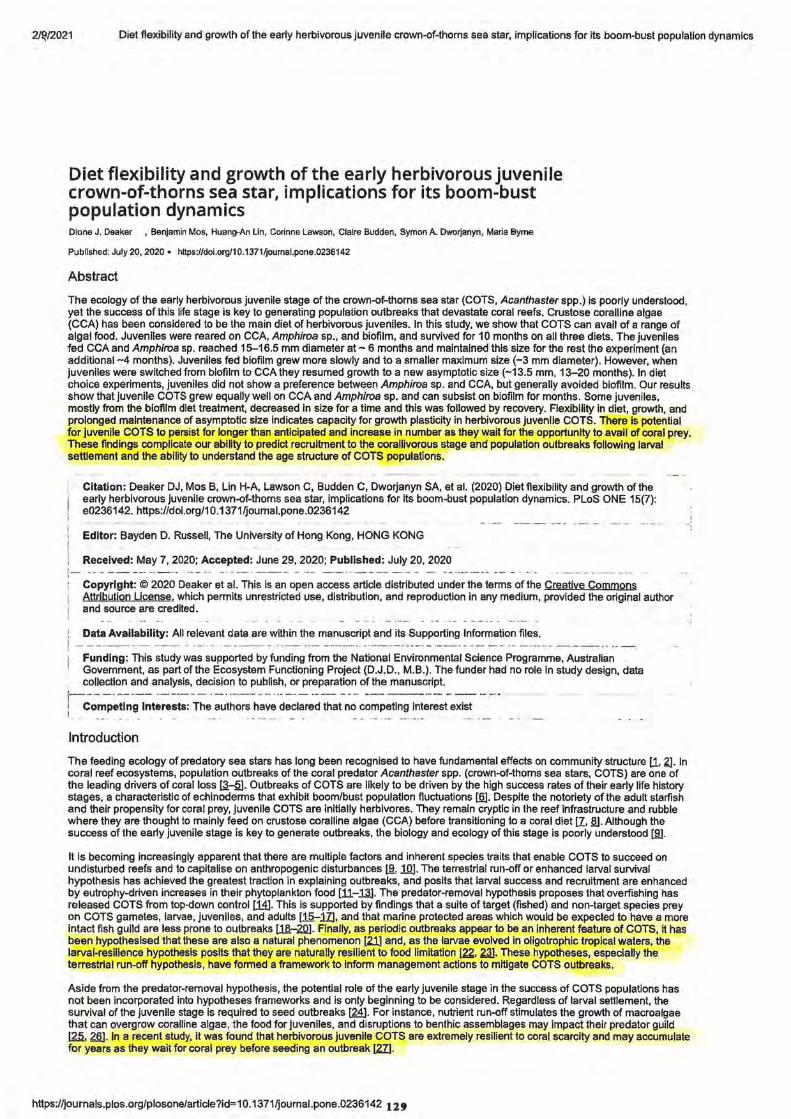
21w2021 Diet flexibility and growth of the early herbivorous juvenile crown-of-thorns sea star, implications for its boom-bust population dynamics
Diet flexibility and growth of the early herbivorous juvenile crown-of-thorns sea star, implications for its boom-bust population dynamics Dione J . Deaker , Benjamin Mos, Huang-An Lin, COl'inne Lawson, Claire Budden, Symon A. Dworjanyn, Maria Byrne
Pubfished: July 20, 2020 • https://doi.org/10.1371/joumal.pone.0236142
Abstract
The ecology of the early herbivorous juvenile stage of the crown-of-thorns sea star (COTS, Acanthaster spp.) is poorly understood, yet the success of this life stage is key to generating population outbreaks that devastate coral reefs. Crustose coralline algae (CCA) has been considered to be the main diet of herbivorous juveniles. In this study, we show that COTS can avail of a range of algal food. Juveniles were reared on CCA, Amphiroa sp., and biofilm, and survived for 10 months on all three diets. The juveniles fed CCA and Amphiroa sp. reached 15-16.5 mm diameter at - 6 months and maintained this size for the rest the experiment (an additional -4 months). Juveniles fed biofilm grew more slowly and to a smaller maximum size (-3 mm diameter). However, when juveniles were switched from blofilm to CCA they resumed growth to a new asymptotic size (-13.5 mm, 13-20 months). In diet choice experiments, juveniles did not show a preference between Amphiroa sp. and CCA, but generally avoided biofilm. Our results show that juvenile COTS grew equally well on CCA and Amphiroa sp. and can subsist on biofilm for months. Some juveniles, mostly from the biofilm diet treatment, decreased in size for a time and this was followed by recovery. Flexibility in diet, growth, and prolonged maintenance of asymptotic size Indicates capacity for growth plasticity in herbivorous juvenile COTS. There is potential for juvenile COTS to persist for longer than anticipated and increase in number as they wait for the opportunity to avail of coral prey. These findings complicate our ability to predict recruitment to the corallivorous stage and population outbreaks following larval settlement and the ability to understand the age structure of COTS populations.
Citation: Deaker DJ, Mos B, Lin H-A, Lawson C, Budden C, Dworjanyn SA, et al. (2020) Diet flexibility and growth of the early herbivorous juvenile crown-of-thorns sea star, implications for its boom-bust population dynamics. PLoS ONE 15(7): e0236142. https://doi.org/10.1371/journal.pone.0236142
Editor: Bayden D. Russell, The University of Hong Kong, HONG KONG
Received: May 7, 2020; Accepted: June 29, 2020; Published: July 20, 2020
Copyright: © 2020 Deaker et al. This is an open access article distributed under the terms of the Creative Commons Attribution License. which permits unrestricted use, distribution, and reproduction in any medium, provided the original author and source are credited.
Data Availability: All relevant data are within the manuscript and its Supporting Information files. ! - _ .. _______ ----- - --··-·· ··--·---·-·----- ------·•··•------·--·-··- ·--•-·•- ·-- -- -- -----·-· --··--- ·- -
Funding: This study was supported by funding from the National Environmental Science Programme, Australian Government, as part of the Ecosystem Functioning Project (D.J.D., M.B.). The funder had no role In study design, data collection and analysis, decision to publish, or preparation of the manuscript.
1·---·- - ·· -- --- ·- ---- -- ··•--. ·-·-- -·- ···-··- ----- -- - -------- --- -- -·-I Competing Interests: The authors have declared that no competing Interest exist I . - - . . . . - .. . . • • . •• . •• . .. ••.. • · -
lntrOdUcttOn
The feeding ecology of predatory sea stars has long been recognised to have fundamental effects on community structure [1, 2]. In coral reef ecosystems, population outbreaks of the coral predator Acanthaster spp. (crown-of-thorns sea stars, COTS) are one of the leading drivers of coral loss ra-fil. Outbreaks of COTS are likely to be driven by the high success rates of their early life history stages, a characteristic of echinoderms that exhibit boom/bust population fluctuations [fil. Despite the notoriety of the adult starfish and their propensity for coral prey, Juvenile COTS are initially herbivores. They remain cryptic in the reef infrastructure and rubble where they are thought to mainly feed on crustose coralline algae (CCA) before transitioning to a coral diet [I, ~- Although the success of the early juvenile stage is key to generate outbreaks, the biology and ecology of this stage is poorly understood [fil.
It is becoming increasingly apparent that there are multiple factors and inherent species traits that enable COTS to succeed on undisturbed reefs and to capitalise on anthropogenic disturbances ffi, l.Q]. The terrestrial run-off or enhanced larval survival hypothesis has achieved the greatest traction in explaining outbreaks, and posits that larval success and recruitment are enhanced by eutrophy-driven increases in their phytoplankton food [11-.lm. The predator-removal hypothesis proposes that overfishing has released COTS from top-down control I.HJ. This is supported by findings that a suite of target (fished) and non-target species prey on COTS gametes, larvae, juveniles, and adults [15-11], and that marine protected areas which would be expected to have a more intact fish guild are less prone to outbreaks [1!!-2.Q.). Finally, as periodic outbreaks appear to be an inherent feature of COTS, it has been hypothesised that these are also a natural phenomenon [21] and, as the larvae evolved in oligotrophlc tropical waters, the larval-resilience hypothesis posits that they are naturally resilient to food limitation [ZZ, 2a]. These hypotheses, especially the terrestrial run-off hypothesis, have formed a framework to inform management actions to mitigate COTS outbreaks.
Aside from the predator-removal hypothesis, the potential role of the early juvenile stage in the success of COTS populations has not been incorporated into hypotheses frameworks and is only beginning to be considered. Regardless of larval settlement, the survival of the Juvenile stage Is required to seed outbreaks ~- For instance, nutrient run-off stimulates the growth of macroalgae that can overgrow coralline algae, the food for juveniles, and disruptions to benthic assemblages may impact their predator guild 1.2,Q, ~- In a recent study, it was found that herbivorous juvenile COTS are extremely resilient to coral scarcity and may accumulate for years as they wait for coral prey before seeding an outbreak 1.21].
https://journals.plos.org/plosone/article?id= 10.1371 ~ournal .pone .0236142 12,
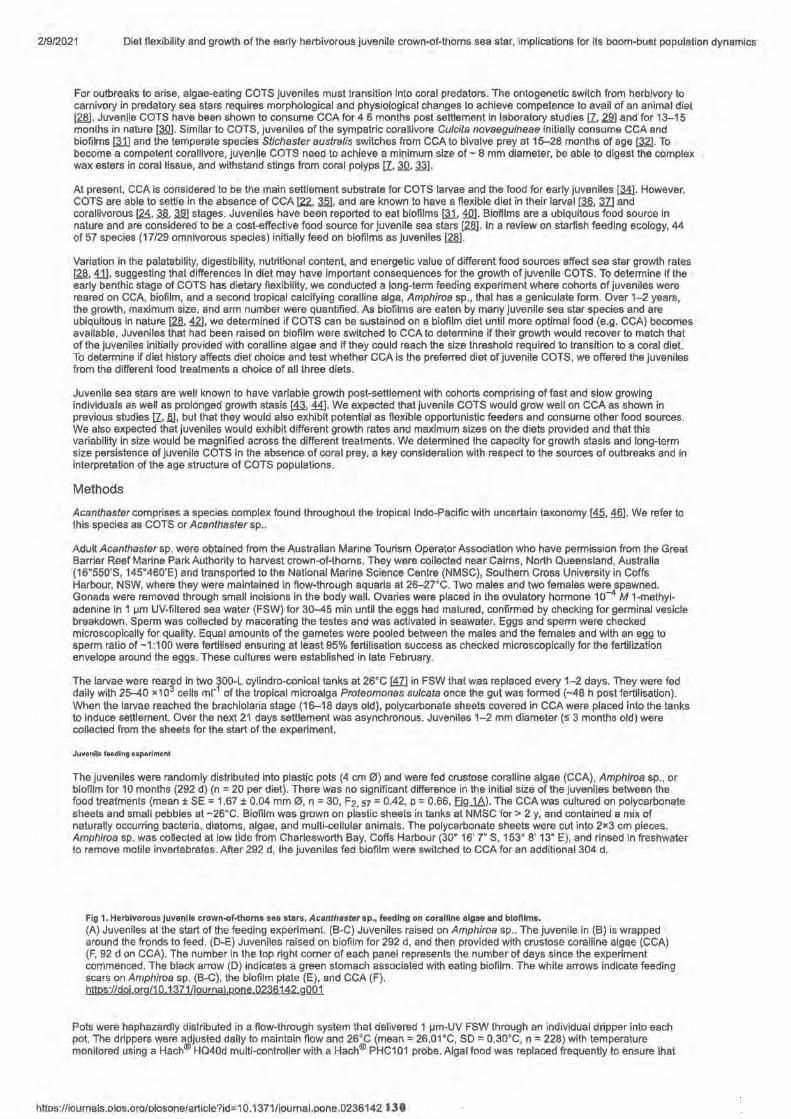
2/9/2021 Diet flexibility and growth of the early herbivorous juvenile crown-of-thorns sea star, implications for its boom-bust population dynamics
For outbreaks to arise, algae-eating COTS juveniles must transition into coral predators. The ontogenetic switch from herbivory to carnivory in predatory sea stars requires morphological and physiological changes to achieve competence to avail of an animal diet [Zfil. Juvenile COTS have been shown to consume CCA for 4 6 months post settlement in laboratory studies [Z, ~ and for 13-15 months in nature ~ - Similar to COTS, juveniles of the sympatric corallivore Cu/cita novaeguineae initially consume CCA and biofilms ra.1] and the temperate species Stichaster australis switches from CCA to bivalve prey at 15-28 months of age ral). To become a competent corallivore, juvenile COTS need to achieve a minimum size of - 8 mm diameter, be able to digest the complex wax esters in coral tissue, and withstand stings from coral polyps [Z, ~. ~-
At present, CCA is considered to be the main settlement substrate for COTS larvae and the food for early juveniles ~- However, COTS are able to settle in the absence of CCA [22., ;mi, and are known to have a flexible diet in their larval [36, W and corallivorous ~. ;3.§., .a9] stages. Juveniles have been reported to eat biofilms [fil, 1Q]. Biofilms are a ubiquitous food source in nature and are considered to be a cost-effective food source for juvenile sea stars (Zfil. In a review on starfish feeding ecology, 44 of 57 species (17/29 omnivorous species) initially feed on biofilms as juveniles [Zfil .
Variation in the palatability, digestibility, nutritional content, and energetic value of different food sources affect sea star growth rates ~. i1], suggesting that differences in diet may have important consequences for the growth of juvenile COTS. To determine if the early benthic stage of COTS has dietary flexibility, we conducted a long-term feeding experiment where cohorts of juveniles were reared on CCA, biofilm, and a second tropical calcifying coralline alga, Amphiroa sp., that has a geniculate form. Over 1-2 years, the growth, maximum size, and arm number were quantified. As biofilms are eaten by many juvenile sea star species and are ubiquitous in nature [2.8., ~. we determined if COTS can be sustained on a biofilm diet until more optimal food (e.g. CCA) becomes available. Juveniles that had been raised on biofilm were switched to CCA to determine if their growth would recover to match that of the juveniles initially provided with coralline algae and if they could reach the size threshold required to transition to a coral diet. To determine if diet history affects diet choice and test whether CCA is the preferred diet of juvenile COTS, we offered the juveniles from the different food treatments a choice of all three diets.
Juvenile sea stars are well known to have variable growth post-settlement with cohorts comprising of fast and slow growing individuals as welt as prolonged growth stasis ~ ~ - We expected that juvenile COTS would grow weft on CCA as shown in previous studies [Z, .8], but that they would also exhibit potential as flexible opportunistic feeders and consume other food sources. We also expected that juveniles would exhibit different growth rates and maximum sizes on the diets provided and that this variability in size would be magnified across the different treatments. We determined the capacity for growth stasis and long-term size persistence of juvenile COTS in the absence of coral prey, a key consideration with respect to the sources of outbreaks and in interpretation of the age structure of COTS populations.
Methods
Acanthaster comprises a species complex found throughout the tropical lndo-Pacific with uncertain taxonomy ~. ~- We refer to this species as COTS or Acanthaster sp ..
Adult Acanthaster sp. were obtained from the Australian Marine Tourism Operator Association who have permission from the Great Barrier Reef Marine Park Authority to harvest crown-of-thorns. They were collected near Cairns, North Queensland, Australia (16°550'S, 145°460'E) and transported to the National Marine Science Centre (NMSC), Southern Cross University in Coffs Harbour, NSW, where they were maintained in flow-through aquaria at 26-27°C. Two males and two females were spawned. Gonads were removed through small Incisions in the body wall. Ovaries were placed in the ovulatory hormone 10-4 M 1-methyladenine in 1 µm UV-filtered sea water (FSW) for 30-45 min until the eggs had matured, confirmed by checking for germinal vesicle breakdown. Sperm was collected by macerating the testes and was activated in seawater. Eggs and sperm were checked microscopically for quality. Equal amounts of the gametes were pooled between the males and the females and with an egg to sperm ratio of ~1:100 were fertilised ensuring at least 95% fertilisation success as checked microscopically for the fertilization envelope around the eggs. These cultures were established in late February.
The larvae were reared in two 300-L cylindro-conical tanks at 26°C [m in FSW that was replaced every 1-2 days. They were fed daily with 25--40 x1Q3 cells mr1 of the tropical microalga Proteomonas su/cata once the gut was formed (~48 h post fertilisation). When the larvae reached the brachiolaria stage (16-18 days old), polycarbonate sheets covered in CCA were placed into the tanks to induce settlement. Over the next 21 days settlement was asynchronous. Juveniles 1-2 mm diameter (S 3 months old) were collected from the sheets for the start of the experiment.
Juvenile feeding experiment
The juveniles were randomly distributed into plastic pots (4 cm 0) and were fed crustose coralline algae (CCA), Amphiroa sp., or biofilm for 10 months (292 d) (n = 20 per diet). There was no significant difference in the initial size of the juveniles between the food treatments (mean± SE= 1.67 ± 0.04 mm 0, n = 30, F2, 57 = 0.42, p = 0.66, Eig...18). The CCA was cultured on polycarbonate sheets and small pebbles at ~26°C. Biofilm was grown on plastic sheets in tanks at NMSC for > 2 y, and contained a mix of naturally occurring bacteria, diatoms, algae, and multi-cellular animals. The polycarbonate sheets were cut into 2x3 cm pieces. Amphiroa sp. was collected at low tide from Charlesworth Bay, Coffs Harbour (30° 16' 7" S, 153° 8' 13" E), and rinsed in freshwater to remove motile invertebrates. After 292 d, the juveniles fed biofilm were switched to CCA for an additional 304 d.
Fig 1. Herbivorous Juvenile crown-of-thorns sea stars, Acanthaster sp., feeding on coralline algae and blofllms. (A) Juveniles at the start of the feeding experiment. (8-C) Juveniles raised on Amphiroa sp .. The juvenile in (8) is wrapped around the fronds to feed . (D-E) Juveniles raised on biofilm for 292 d, and then provided with crustose coralline algae (CCA) (F, 92 d on CCA). The number in the top right corner of each panel represents the number of days since the experiment commenced. The black arrow (D) indicates a green stomach associated with eating biofilm. The white arrows indicate feeding scars on Amphiroa sp. (8-C), the biofilm plate (E), and CCA (F). htt12s://d0Lorg/10 1371/journal.pone 0236142 g001
Pots were haphazardly distributed in a flow-through system that delivered 1 µm-UV FSW through an individual dripper into each pot. The drippers were adjusted daily to maintain flow and 26°C (mean= 26.01°C, SD= 0.30°C, n = 228) with temperature monitored using a Hach® HQ40d multi-controller with a Hach® PHC101 probe. Algal food was replaced frequently to ensure that
httos://iournals.olos.ora/olosone/article?id=10.1371/iournal.pone.0236142 13 0
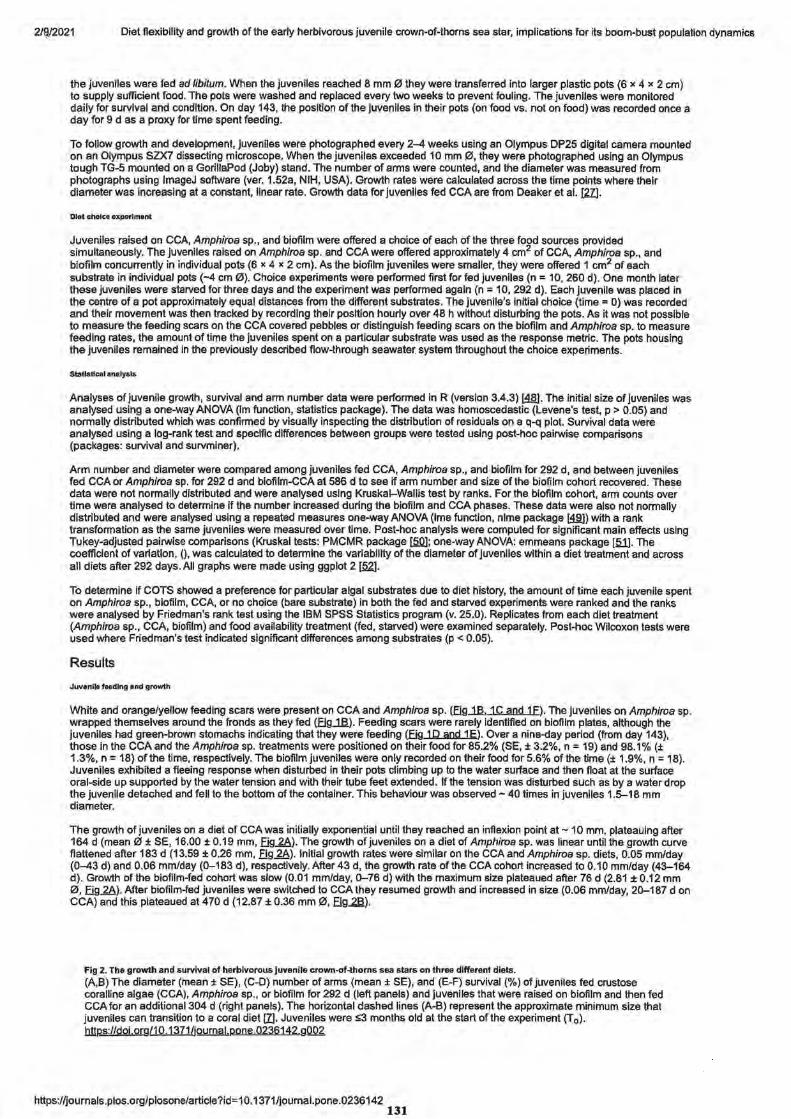
2/9/2021 Diet flexibility and growth of the early herbivorous juvenile crown-of-thorns sea star, implications for its boom-bust population dynamics
the juveniles were fed ad libitum. When the juveniles reached 8 mm 0 they were transferred into larger plastic pots (6 x 4 x 2 cm) to supply sufficient food. The pots were washed and replaced every two weeks to prevent fouling. The juveniles were monitored daily for survival and condition. On day 143, the position of the juveniles in their pots (on food vs. not on food) was recorded once a day for 9 d as a proxy for time spent feeding.
To follow growth and development, juveniles were photographed every 2-4 weeks using an Olympus DP25 digital camera mounted on an Olympus SZX7 dissecting microscope. When the juveniles exceeded 10 mm 0, they were photographed using an Olympus tough TG-5 mounted on a GorillaPod (Joby) stand. The number of arms were counted, and the diameter was measured from photographs using lmageJ software (ver. 1.52a, NIH, USA). Growth rates were calculated across the time points where their diameter was increasing at a constant, linear rate. Growth data for juveniles fed CCA are from Deaker et al. [2Z].
Diet choice experiment
Juveniles raised on CCA, Amphiroa sp., and biofilm were offered a choice of each of the three food sources provided simultaneously. The juveniles raised on Amphiroa sp. and CCA were offered approximately 4 cm2 of CCA, Amphiroa sp., and biofilm concurrently in individual pots (6 x 4 x 2 cm). As the biofilm juveniles were smaller, they were offered 1 cm2 of each substrate in individual pots (~4 cm 0). Choice experiments were performed first for fed juveniles (n = 10, 260 d). One month later these juveniles were starved for three days and the experiment was performed again (n = 10, 292 d). Each juvenile was placed in the centre of a pot approximately equal distances from the different substrates. The juvenile's initial choice (time= 0) was recorded and their movement was then tracked by recording their position hourly over 48 h without disturbing the pots. As it was not possible to measure the feeding scars on the CCA covered pebbles or distinguish feeding scars on the biofilm and Amphiroa sp. to measure feeding rates, the amount of time the juveniles spent on a particular substrate was used as the response metric. The pots housing the juveniles remained in the previously described flow-through seawater system throughout the choice experiments.
Statlsttcal analysis
Analyses of juvenile growth, survival and arm number data were performed in R (version 3.4.3) ~- The initial size of juveniles was analysed using a one-way ANOVA (Im function, statistics package). The data was homoscedastic (Levene's test, p > 0.05) and normally distributed which was confirmed by visually inspecting the distribution of residuals on a q-q plot. Survival data were analysed using a log-rank test and specific differences between groups were tested using post-hoc pairwise comparisons (packages: survival and survminer).
Arm number and diameter were compared among juveniles fed CCA, Amphiroa sp., and biofilm for 292 d, and between juveniles fed CCA or Amphiroa sp. for 292 d and biofilm-CCA at 586 d to see if arm number and size of the biofilm cohort recovered. These data were not normally distributed and were analysed using Kruskal-Wallis test by ranks. For the biofilm cohort, arm counts over time were analysed to determine if the number increased during the biofilm and CCA phases. These data were also not normally distributed and were analysed using a repeated measures one-way ANOVA (lme function, nlme package ~) with a rank transformation as the same juveniles were measured over time. Post-hoc analysis were computed for significant main effects using Tukey-adjusted pairwise comparisons (Kruskal tests: PMCMR package [fill]; one-way ANOVA: emmeans package [fill. The coefficient of variation, (), was calculated to determine the variability of the diameter of juveniles within a diet treatment and across all diets after 292 days. All graphs were made using ggplot 2 ~.
To determine if COTS showed a preference for particular algal substrates due to diet history, the amount of time each juvenile spent on Amphiroa sp., biofilm, CCA, or no choice (bare substrate) in both the fed and starved experiments were ranked and the ranks were analysed by Friedman's rank test using the IBM SPSS Statistics program (v. 25.0). Replicates from each diet treatment (Amphiroa sp., CCA, biofilm) and food availability treatment (fed, starved) were examined separately. Post-hoc Wilcoxon tests were used where Friedman's test indicated significant differences among substrates (p < 0.05).
Results
Juvenile feeding and growth
White and orange/yellow feeding scars were present on CCA and Amphiroa sp. (EigJ..B, 1 C and 1 F). The juveniles on Amphiroa sp. wrapped themselves around the fronds as they fed (Eig...18.). Feeding scars were rarely identified on biofilm plates, although the juveniles had green-brown stomachs indicating that they were feeding (fig 1 D and 1 E). Over a nine-day period (from day 143), those in the CCA and the Amphiroa sp. treatments were positioned on their food for 85.2% (SE,± 3.2%, n = 19) and 98.1% (± 1.3%, n = 18) of the time, respectively. The biofilm juveniles were only recorded on their food for 5.6% of the time (± 1.9%, n = 18). Juveniles exhibited a fleeing response when disturbed in their pots climbing up to the water surface and then float at the surface oral-side up supported by the water tension and with their tube feet extended. If the tension was disturbed such as by a water drop the juvenile detached and fell to the bottom of the container. This behaviour was observed - 40 times in juveniles 1.5-18 mm diameter.
The growth of juveniles on a diet of CCA was initially exponential until they reached an inflexion point at ~ 10 mm, plateauing after 164 d (mean 0 ± SE, 16.00 ± 0.19 mm, Eig 2A). The growth of juveniles on a diet of Amphiroa sp. was linear until the growth curve flattened after 183 d (13.59 ± 0.26 mm, fig 2A). Initial growth rates were similar on the CCA and Amphiroa sp. diets, 0.05 mm/day (0-43 d) and 0.06 mm/day (0-183 d), respectively. After 43 d, the growth rate of the CCA cohort increased to 0.10 mm/day (43-164 d). Growth of the biofilm-fed cohort was slow (0.01 mm/day, 0-76 d) with the maximum size plateaued after 76 d (2.81 ± 0.12 mm 0, fig 2A). After biofilm-fed juveniles were switched to CCA they resumed growth and increased in size (0.06 mm/day, 20-187 don CCA) and this plateaued at 470 d (12.87 ± 0.36 mm 0, fig.la).
Fig 2. The growth and survival of herbivorous juvenile crown-of-thorns sea stars on three different diets.
(A,B) The diameter (mean± SE), (C-0) number of arms (mean ± SE), and (E-F) survival (%) of juveniles fed crustose coralline algae (CCA), Amphiroa sp., or biofilm for 292 d (left panels) and juveniles that were raised on biofilm and then fed CCA for an additional 304 d (right panels). The horizontal dashed lines (A-B) represent the approximate minimum size that juveniles can transition to a coral diet [Z]. Juveniles were S3 months old at the start of the experiment (T 0 ).
httP.s://doi.org/10.1371/journal.pone,0236142 9002
https://journals.plos.org/plosone/article?id= 10.1371 /journal.pone .0236142 131
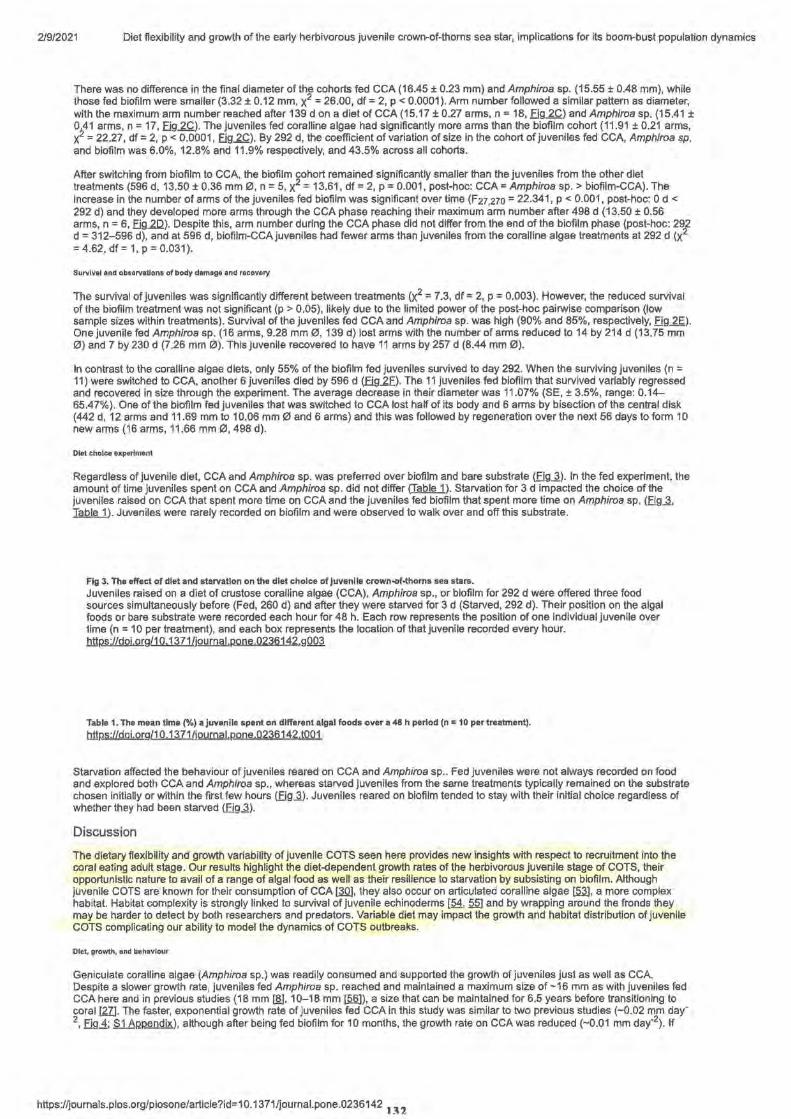
2/9/2021 Diet flexibility and growth of the early herbivorous juvenile crown-of-thorns sea star, implications for its boom-bust population dynamics
There was no difference in the final diameter of the cohorts fed CCA (16.45 ± 0.23 mm} and Amphiroa sp. (15.55 ± 0.48 mm}, while those fed biofilm were smaller (3.32 ± 0.12 mm, x2 = 26.00, df = 2, p < 0.0001 ). Arm number followed a similar pattern as diameter, with the maximum arm number reached after 139 don a diet of CCA (15.17 ± 0.27 arms, n = 18, fig 2C} and Amphiroa sp. (15.41 ± 0741 arms, n = 17, fig 2C). The juveniles fed coralline algae had significantly more arms than the biofilm cohort (11 .91 ± 0.21 arms,
x-- = 22.27, elf= 2, p < 0.0001, Eig..2.Q). By 292 d, the coefficient of variation of size in the cohort of juveniles fed CCA, Amphiroa sp. and biofilm was 6.0%, 12.8% and 11 .9% respectively, and 43.5% across all cohorts.
After switching from biofilm to CCA, the biofilm cohort remained significantly smaller than the juveniles from the other diet treatments (596 d, 13.50 ± 0.36 mm 0 , n = 5, x2 = 13.61 , df = 2, p = 0.001 , post-hoc: CCA = Amphiroa sp. > biofilm-CCA}. The increase in the number of arms of the juveniles fed biofilm was significant over time (F27,270 = 22.341, p < 0.001, post-hoc: 0 d < 292 d} and they developed more arms through the CCA phase reaching their maximum arm number after 498 d (13.50 ± 0.56 arms, n = 6, Eig.2.D.}. Despite this, arm number during the CCA phase did not differ from the end of the biofilm phase (post-hoc: 292 d = 312-596 d}, and at 596 d, biofilm-CCAjuveniles had fewer arms than juveniles from the coralline algae treatments at 292 d (x2
= 4.62, df = 1, p = 0.031 }.
Survival and observations of body damage and recovery
The survival of juveniles was significantly different between treatments (x2 = 7.3, df = 2, p = 0.003). However, the reduced survival of the biofilm treatment was not significant (p > 0.05), likely due to the limited power of the post-hoc pairwise comparison (low sample sizes within treatments). Survival of the juveniles fed CCA and Amphiroa sp. was high (90% and 85%, respectively, Eig~)One juvenile fed Amphiroa sp. (16 arms, 9.28 mm 0, 139 d) lost arms with the number of arms reduced to 14 by 214 d (13.75 mm 0) and 7 by 230 d (7 .26 mm 0). This juvenile recovered to have 11 arms by 257 d (8.44 mm 0).
In contrast to the coralline algae diets, only 55% of the biofilm fed juveniles survived to day 292. When the surviving juveniles (n == 11) were switched to CCA, another 6 juveniles died by 596 d (Eig.2..E). The 11 juveniles fed biofiim that survived variably regressed and recovered in size through the experiment. The average decrease in their diameter was 11 .07% (SE, ± 3.5%, range: 0.14-65.47%). One of the biofilm fed juveniles that was switched to CCA Jost half of its body and 6 arms by bisection of the central disk (442 d, 12 arms and 11.69 mm to 10.06 mm 0 and 6 arms) and this was followed by regeneration over the next 56 days to form 10 new arms (16 arms, 11.66 mm 0, 498 d).
Diet choice ex.,.rlment
Regardless of juvenile diet, CCA and Amphiroa sp. was preferred over biofilm and bare substrate (Eig~)- In the fed experiment, the amount of time juveniles spent on CCA and Amphiroa sp. did not differ (Table 1 ). Starvation for 3 d impacted the choice of the juveniles raised on CCA that spent more time on CCA and the juveniles fed biofilm that spent more time on Amphiroa sp. (Eig~. TuQhl). Juveniles were rarely recorded on biofilm and were observed to walk over and off this substrate.
Fig 3. The effect of diet and starvation on the diet choice of Juvenile crown-of-thorns sea stars.
Juveniles raised on a diet of crustose coralline algae (CCA), Amphiroa sp., or blofilm for 292 d were offered three food sources simultaneously before (Fed, 260 d) and after they were starved for 3 d (Starved, 292 d). Their position on the algal foods or bare substrate were recorded each hour for 48 h. Each row represents the position of one individual juvenile over time (n = 10 per treatment), and each box represents the location of that juvenile recorded every hour. htt12s://d0Lorg/10.1371/journal.pone,0236142 g003
Table 1. The mean time(%) a juvenile spent on different algal foods over a 48 h period (n = 10 per treatment).
l:!nps·//doi,org/10 1371/jo™112one 0236142,t001
Starvation affected the behaviour of juveniles reared on CCA and Amphiroa sp .. Fed juveniles were not always recorded on food and explored both CCA and Amphiroa sp., whereas starved juveniles from the same treatments typically remained on the substrate chosen initially or within the first few hours (Eig.1). Juveniles reared on biofilm tended to stay with their initial choice regardless of whether they had been starved (Eig~).
Discussion
The dietary flexibility and growth variability of juvenile COTS seen here provides new insights with respect to recruitment into the coral eating adult stage. Our results highlight the diet-dependent growth rates of the herbivorous juvenile stage of COTS, their opportunistic nature to avail of a range of algal food as well as their resilience to starvation by subsisting on biofilm. Although juvenile COTS are known for their consumption of CCA [3Q), they also occur on articulated coralline algae l2m, a more complex habitat. Habitat complexity is strongly linked to survival of juvenile echinoderms [M, ~ and by wrapping around the fronds they may be harder to detect by both researchers and predators. Variable diet may impact the growth and habitat distribution of juvenile COTS complicating our ability to model the dynamics of COTS outbreaks.
Diet, growth, and behaviour
Geniculate coralline algae (Amphiroa sp.) was readily consumed and supported the growth of juveniles just as well as CCA. Despite a slower growth rate, juveniles fed Amphiroa sp. reached and maintained a maximum size of -16 mm as with juveniles fed CCA here and in previous studies (18 mm rn.J, 10-18 mm [Qfil), a size that can be maintained for 6.5 years before transitioning to coral [m. The faster, exponential growth rate of juveniles fed CCA in this study was similar to two previous studies (-0.02 mm day-2, Eig..1; S1 A1212endix), although after being fed biofilm for 10 months, the growth rate on CCAwas reduced (-O.Q1 mm day·2). If
https://joumals.plos.org/plosone/article?id=10.1371/joumal.pone.0236142 1 ~ 2
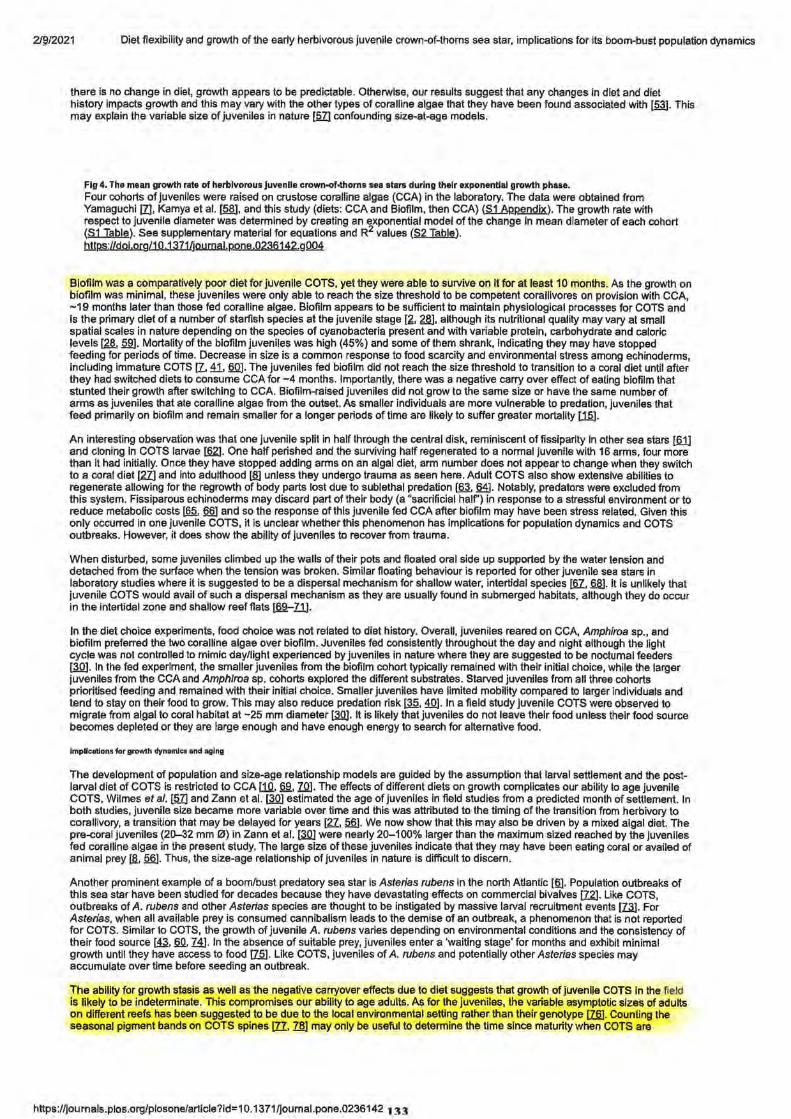
2/~/2021 Diet flexibility and growth of the early herbivorous juvenile crown-of-thorns sea star, implications for its boom-bust population dynamics
there is no change in diet, growth appears to be predictable. Otherwise, our results suggest that any changes in diet and diet history Impacts growth and this may vary with the other types of coralline algae that they have been found associated with ~- This may explain the variable size of juveniles in nature [fil] confounding size-at-age models.
Fig 4. The mean growth rate of herbivorous Juvenile crown-of-thorns sea stars during their exponential growth phase.
Four cohorts of juveniles were raised on crustose coralline algae (CCA) in the laboratory. The data were obtained from Yamaguchi m, Kamya et al. (§fil, and this study (diets: CCA and Biofilm, then CCA) (S 1 AP-P-fillQix.). The growth rate with respect to juvenile diameter was determined by creating an exponential model of the change in mean diameter of each cohort ($1 Table). See supplementary material for equations and R2 values (S2 Table). Wtps://doi.org/10.1371 O!ll.l.mill.pone.0236142 g~
Blofilm was a comparatively poor diet for juvenile COTS, yet they were able to survive on It for at least 10 months. As the growth on biofllm was minimal, these juveniles were only able to reach the size threshold to be competent corallivores on provision with CCA, ~19 months later than those fed coralline algae. Biofilm appears to be sufficient to maintain physiological processes for COTS and is the primary diet of a number of starfish species at the juvenile stage (2., 2fil, although its nutritional quality may vary at small spatial scales in nature depending on the species of cyanobacteria present and with variable protein, carbohydrate and caloric levels~.~- Mortality of the biofilm juveniles was high (45%) and some of them shrank, indicating they may have stopped feeding for periods of time. Decrease in size is a common response to food scarcity and environmental stress among echinoderms, including immature COTS [Z, 41, §QJ. The juveniles fed biofilm did not reach the size threshold to transition to a coral diet until after they had switched diets to consume CCA for -4 months. Importantly, there was a negative carry over effect of eating biofilm that stunted their growth after switching to CCA. Biofilm-raised juveniles did not grow to the same size or have the same number of arms as juveniles that ate coralline algae from the outset. As smaller individuals are more vulnerable to predation, juveniles that feed primarily on biofilm and remain smaller for a longer periods of time are likely to suffer greater mortality l1.§).
An interesting observation was that one juvenile split in half through the central disk, reminiscent of fissiparlty In other sea stars (fil] and cloning in COTS larvae [§.21. One half perished and the surviving half regenerated to a normal juvenile with 16 arms, four more than It had initially. Once they have stopped adding arms on an algal diet, arm number does not appear to change when they switch to a coral diet l2Z] and into adulthood [aJ unless they undergo trauma as seen here. Adult COTS also show extensive abilities to regenerate allowing for the regrowth of body parts lost due to sublethal predation [fil, ~- Notably, predators were excluded from this system. Fissiparous echinoderms may discard part of their body (a "sacrificial half') in response to a stressful environment or to reduce metabolic costs [§Q, §fil and so the response of this juvenile fed CCA after biofilm may have been stress related. Given this only occurred in one juvenile COTS, it is unclear whether this phenomenon has implications for population dynamics and COTS outbreaks. However, it does show the ability of juveniles to recover from trauma.
When disturbed, some juveniles climbed up the walls of their pots and floated oral side up supported by the water tension and detached from the surface when the tension was broken. Similar floating behaviour is reported for other juvenile sea stars in laboratory studies where it is suggested to be a dispersal mechanism for shallow water, intertidal species [61., 6.S). It is unlikely that juvenile COTS would avail of such a dispersal mechanism as they are usually found in submerged habitats, although they do occur in the intertidal zone and shallow reef flats [69.-Z1J.
In the diet choice experiments, food choice was not related to diet history. Overall, juveniles reared on CCA, Amphiroa sp., and biofilm preferred the two coralline algae over biofilm. Juveniles fed consistently throughout the day and night although the light cycle was not controlled to mimic day/light experienced by juveniles in nature where they are suggested to be nocturnal feeders raQ]. In the fed experiment, the smaller juveniles from the biofilm cohort typically remained with their initial choice, while the larger juveniles from the CCA and Amphlroa sp. cohorts explored the different substrates. Starved juveniles from all three cohorts prioritised feeding and remained with their initial choice. Smaller juveniles have limited mobility compared to larger individuals and tend to stay on their food to grow. This may also reduce predation risk~. 4Q). In a field study juvenile COTS were observed to migrate from algal to coral habitat at -25 mm diameter rao:J. It is likely that juveniles do not leave their food unless their food source becomes depleted or they are large enough and have enough energy to search for alternative food.
JmplcatiDns for grDwth dynamics and aging
The development of population and size-age relationship models are guided by the assumption that larval settlement and the postlarval diet of COTS is restricted to CCA [10, 6,!!, ZQl. The effects of different diets on growth complicates our ability to age juvenile COTS, Wilmes et al. [fil] and Zann et al. rao:J estimated the age of juveniles in field studies from a predicted month of settlement. In both studies, juvenile size became more variable over time and this was attributed to the timing of the transition from herbivory to corallivory, a transition that may be delayed for years (2Z, Q§]. We now show that this may also be driven by a mixed algal diet. The pre-coral juveniles (20-32 mm 0) in Zann et al. raQ] were nearly 20-100% larger than the maximum sized reached by the juveniles fed coralline algae in the present study. The large size of these juveniles indicate that they may have been eating coral or availed of animal prey [§., Q§]. Thus, the size-age relationship of juveniles in nature is difficult to discern.
Another prominent example of a boom/bust predatory sea star is Asterias rubens in the north Atlantic (§]. Population outbreaks of this sea star have been studied for decades because they have devastating effects on commercial bivalves [Z2]. Like COTS, outbreaks of A. rubens and other Asterias species are thought to be instigated by massive larval recruitment events (I.3]. For Asterias, when all available prey is consumed cannibalism leads to the demise of an outbreak, a phenomenon that is not reported for COTS. Similar to COTS, the growth of juvenile A. rubens varies depending on environmental conditions and the consistency of their food source ~. 60, Ml In the absence of suitable prey, juveniles enter a 'waiting stage' for months and exhibit minimal growth until they have access to food ~- Like COTS, juveniles of A. rubens and potentially other Asterias species may accumulate over time before seeding an outbreak.
The ability for growth stasis as well as the negative carryover effects due to diet suggests that growth of juvenile COTS In the field is likely to be indeterminate. This compromises our ability to age adults. As for the juveniles, the variable asymptotic sizes of adults on different reefs has been suggested to be due to the local environmental setting rather than their genotype [Z§]. Counting the seasonal pigment bands on COTS spines [ZZ. zru may only be useful to determine the time since maturity when COTS are
https://Journals.plos.org/piosone/article?id=10.1371/journal.pone.0236142 1 :H
2/9/2021 Diet flexibility and growth of the early herbivorous juvenile crown-of-thorns sea star, implications for its boom-bust population dynamics
suggested to start forming these bands [Zfil. Proposed age-growth relationships for COTS currently used for population modelling are likely to be only indicative. A prolonged study is needed to determine if there are carry over effects of the diet of herbivorous juvenile COTS for subsequent life stages and generations [fil.
The variable duration of the herbivorous juvenile stage complicates our understanding of the bottom-up processes that drive population outbreaks. This is a key consideration for models linking outbreaks to terrestrial run-off events[§.,~. zru. as well as models of the population dynamics of COTS that have largely focused on the larval and corallivorous stages [12, ,ffi, .BQJ with few considering the herbivorous juvenile [.1.Q, fill While all stages of the life cycle of COTS have to be successful to generate outbreaks, enhanced survival of the juvenile stage may be the rate determining factor governing recruitment into the adult population [24, .a2].
Our results suggest that the feeding ecology of juvenile COTS exerts a major influence on the timing of population outbreaks. On a favourable diet, juvenile COTS exhibit rapid growth compared to sympatric sea star species due to their large stomach area I.Sal, lower investment in a calcified body (e.g . Linckia /aevigata, Cu/cita noveaguineae), and early ontogenetic diet shift to coral [M_, ,am. These inherent traits of COTS biology may contribute to rapid population expansion. On the other hand, poor food conditions may be associated with slow population expansion of adults and the juveniles that can persist during food scarcity may accumulate in the reef infrastructure. This creates the possibility that reserve populations of juvenile COTS can delay their switch to corallivory as they wait for food conditions to improve, and thereby delay the appearance of an outbreak for years.
Supporting information
S1 AIrnendix, Model of the exponential growth phase of herbivorous Juvenile crown-<>f-thoms sea stars (COTS) on a diet of crustose coralline algae (CCA).
~g/10 1371/jQYilll.l,pone 0236142,s001 (DOCX)
lil.Ial!.IL..Exponentlal models fitted to the growth of four cohorts of Juvenile crown-of-thorns sea stars.
Four cohorts of juveniles were raised on a diet of CCA in this study (CCA and biofilm, then CCA), Yamaguchi W, and Kamya et al. Ill where D = diameter (mm) and t = time (days). The equation was differentiated (D') to determine the equation for the rate of growth. DF, degrees of freedom. https://doi.org/1 O .1371 /j~.pone.0236142 s002 (DOCX)
~The linear relationship between the growth rate (mm/day) and the diameter Juvenile crown-of-thorns sea stars. Four cohorts of juveniles were reared on CCA in this study (CCA, biofilm, then CCA), Yamaguchi ill, and Kamya et al. [2]. DF, degrees of freedom. https://doi.org/10.1371/jQYilll.l.pane 0236142 s003 (DOCX)
ll.!2m. https://doi.org/10 1371/jQlJ.Ill.W.pone 0236142 s004 (XLSX)
Acknowledgments
We thank the Australian Marine Tourist Operators Association for providing adult COTS and the staff at the National Marine Science, Coffs Harbour. In particular, Alex Basford who helped with this project and Stephan Soule at the Solitary Islands Aquarium for providing CCA rocks. We also thank Dr P. Kamya for assistance and Evie Deaker, Dr Januar Harianto and Dr Sam Karelitz for providing advice with statistical analysis.
References
1. Paine RT. Intertidal community structure experimental studies on the relationship between a dominant competitor and its principal predator. Oecologia. 1974; 15(2):93-120. pmid:28308255
Vjew Article • PubMed/NCBI • GQQQ~
2. Sloan NA. Aspects of the feeding biology of asteroids. Oceanogr Mar Biol. 1980; 18:57-124.
Vjew Article • ~g~
3. De'ath G, Fabricius KE, Sweatman H, Puotinen M. The 27-year decline of coral cover on the Great Barrier Reef and its causes. Proc Natl Acad Sci US A. 2012;109(44):17995-9. pmid:23027961
Vjew Article • PubMed/NCBI • Google Scholar
4. Rotjan RD, Lewis SM. Impact of coral predators on tropical reefs. Mar Ecol Prog Ser. 2008;367:73-91.
Yiew Arliofe • ~g~
5. Pratchett MS, Caballes CF, Rivera-Posada JA, Sweatman HPA. Limits to understanding and managing outbreaks of Crown-of-Thoms starfish (Acanthaster spp.). Oceanogr Mar Biol. 2014;52:133-200.
Yiew Article • .!zQQg~
6. Uthicke S, Schaffelke B, Byrne M. A boom-bust phylum? Ecological and evolutionary consequences of density variations in echinoderms. Ecol Monogr. 2009;79(1 ):3-24. View Articie • GQQ9~
7. Yamaguchi M. Growth of juvenile Acanfhaster plane/ (L.) in the laboratory. Pac Sci. 1974;28(2):123-38.
View Article • lli22Pfe Scholar
2/ij/2021 Diet flexibility and growth of the early herbivorous juvenile crown-of-thorns sea star, implications for its boom-bust population dynamics
Lucas JS. Growth, maturation and effects of diet in Acanthaster planci (L.) (Asteroidea) and hybrids reared in the laboratory. J Exp Mar Biol Ecol. 8
• 1984;79(2):129-47.
View Article • Goo9le Scholar
9. Pratchett MS, Caballes CF, Wilmes JC, Matthews S, Mellin C, Sweatman HPA, et al. Thirty years of research on Crown-of-Thorns starfish (1986-2016):
scientific advances and emerging opportunities. Diversity. 2017;9(41).
View Article • Google Scholar
1 O. Babcock RC, Dambacher JM, Morello EB, Plaganyi EE, Hayes KR, Sweatman HPA, et al. Assessing different causes of Crown-of-Thorns Starfish outbreaks and appropriate responses for management on the Great Barrier Reef. PLoS ONE. 2016;11 (12):e0169048. pmld:28036360
Vjew Article • PubMed/NCBI • ~g~
11. Birkeland C. Terrestrial runoff as a cause of outbreaks of Acanthaster p/anci (Echinodermata, Asteroidea). Mar Biol. 1982;69(2):175-85. View Article • Google Scholar
12. Fabricius KE, Okaji K, De'ath G. Three lines of evidence to link outbreaks of the Crown-of-Thorns seastar Acanthaster p/anci to the release of larval food limitation. Coral Reefs. 2010;29(3):593-605.
View Article. • Google Scholar
13. Brodie J, Devlin M, Lewis S. Potential enhanced survivorship of crown of thorns starfish larvae due to near-annual nutrient enrichment during secondary outbreaks on the central mid-shelf of the Great Barrier Reef, Australia. Diversity. 2017;9(17).
Vjew Article • Goog~
14. Endean R, Stablum W. A study of some aspects of the Crown-of-Thoms starfish (Acanthaster plane,) infestations of reefs of Australia's Great Barrier Reef. Atoll Res Bull. 1973;No. 167:1-20.
Vjew Article • !?!JQg~
15. Keesing JK, Halford AR, Hall KC. Mortality rates of small juvenile Crown of Thoms starfish Acanthaster planci on the Great Barrier Reef: implications for population size and larval settlement thresholds for outbreaks. Mar Ecol Prog Ser. 2018;597:179-90.
View Article • Goog!e Scholar
16. Cowan Z-L, Pratchett M, Messmer V, Ling S. Known predators of Crown-of-Thoms starfish (Acanthaster spp.) and their role in mitigating, if not preventing, population outbreaks. Diversity. 2017;9(1 ):7.
Vjew Article • Google Scholar
17. Kroon FJ, Lefevre CD, Doyle JR, Patel F, Milton G, Severati A, et al. DNA-based identification of predators of the corallivorous Crown-of-Thoms Starfish (Acanthaster cf. solaris) from fish faeces and gut contents. Sci Rep. 2020;10(1):8184. pmid:32424321
View Article • pybMed/NCBI • Go!J(lie Scho!ar
18. Sweatman H. No-take reserves protect coral reefs from predatory starfish. Curr Biol. 2008;18(14):R598-R9. pmid:18644332
View Article • PubMed/NCBI • lli!_ogle Scholar
19. Vanhatalo J, Hosack GR, Sweatman H. Spatiotemporal modelling of crown-of-thorns starfish outbreaks on the Great Barrier Reef to inform control
strategies. J Appl Ecol. 2017;54(1):188-97. View Article • Google Scholar
20. Mellin C, MacNeil MA, Cheal AJ, Emslie MJ, Caley MJ. Marine protected areas increase resilience among coral reef communities. Ecol Lett. 2016;19(6):629--37. pmid:27038889
Vjew Article • PubMed/NCBI • ~gle Scholar
21. Vine PJ. Crown-of-Thorns (Acanthaster plane,) plagues: the natural causes theory. Atoll Res Bull. 1973;(166):1-10.
View Article • Goog!e Scholar
22. Wolfe K, Graba-Landry A, Dworjanyn SA, Byrne M. Larval phenotypic plasticity in the boom-and-bust crown-of-thorns seastar, Acanthaster planci. Mar
Ecol Prog Ser. 2015;539:179--89.
View Article • Google Scholar
23. Wolfe K, Graba-Landry A, Dworjanyn SA, Byrne M. Larval starvation to satiation: Influence of nutrient regime on the success of Acanthaster p/anci. PLoS ONE. 2015;10(3):e0122010. pmid:25790074 Vjew Article • PubMed/NCBI • Googie·scholar
24. Keesing JK, Halford AR. Importance of post-settlement processes for the population dynamics of Acanthaster p/anci (L.). Mar Freshwater Res.
1992;43(3):635-51.
View Article • Google Scholar
25. Brodie JE. Enhancement of larval survival and recruitment in Acanthaster p/anci from the effects of terrestrial runoff: a review Aust J Mar Freshw Res.
1992;43(3):539--54. View Article • Google Scholar
26. Mellin C, Lurgi M, Matthews S, MacNeil MA, Caley MJ, Bax N, et al. Forecasting marine invasions under climate change: Biotic interactions and
demographic processes matter. Biol Conserv. 2016;204:459~7.
https:/~ournals.plos.org/plosone/article?id=10.1371/journal.pone.0236142
135
2/9/2021 Diet flexibility and growth of the early herbivorous juvenile crown-of-thorns sea star, implications for its boom-bust population dynam,cs
View Article • ~~
27. Deaker DJ, Aguera A, Lin H-A, Lawson C, Budden C, Dworjanyn SA, et al. The hidden army: corallivorous crown-of-thorns seastars can spend years as herbivorous juveniles. Biol Lett. 2020;16(4):20190849. pmid:32264781
View Article • PybMed/NCBI • ~le Scholar
28. Martinez AS, Byrne M, Coleman RA. Filling in the grazing puzzle: a synthesis of herboviry in starfish. In: Hawkins SJ, Evans AJ, Dale AC, Firth , Hughes
DJ, Smith IP, editors. Oceanogr Mar Biol. 55. Boca Raton: Crc Press-Taylor & Francis Group; 2017. p. 1-34 . .b!!ps·//doi.org/10 1201/b21944-2
29. Kamya PZ, Byrne M, Mos B, Dworjanyn SA. Enhanced performance of juvenile crown-of-thorns starfish in a warm-high CO2 ocean exacerbates poor
growth and survival of their coral prey. Coral Reefs. 2018;37(3):751~2.
ViewArtjcle • ~~
30. Zann L, Brodie J, Berryman C, Naqaslma M. Recruitment, ecology, growth and behavior of juvenile Acanthaster p/anci (L.) (Echinodermata, Asteroidaa).
Bull Mar Sci. 1987;41(2):561-75.
View Article • §QQg~
31. Yamaguchi M. Coral reef asteroids of Guam. Biotropica. 1975;7(1):12-23.
View Article • Goog~
32. Barker MF. Breeding and recruttment in a population of the New Zealand starfish Stichaster australis (Verrill). J Exp Mar Biol Ecol. 1979;41:195--211.
VjewArticle • ~g~
33. Wilmes JC, Caballes CF, Cowan Z-L, Hoey AS, Lang BJ, Messmer V, et al. Contributions of pra- versus post-settlement processes to fluctuating
abundance of Crown-of-Thoms starfishes (Acanlhaster spp.). Mar Pollut Bull. 2018;135:332-45. pmid:30301045
View Article • PybMed/NCBI • ~~
34. Johnson CR, Sutton DC, Olson RR, Giddins R. Settlement of crown-of-thorns starfish: role of bacteria on surfaces of coralline algae and a hypothesis for deep-water recruttment. Mar Ecol Prog Ser. 1991 ;71 (2):14~2.
View Article • §@g~
35. Yamaguchi M. Early life histories of coral reef asteroids, with special reference to Acanthaster planci (L.). Biology and geology of coral reefs Vol 2 Biology
1 1-480: Academic Press, New York & London. ; 1973.
36. Hoegh-Guldberg 0. Uptake of dissolved organic matter by larval stage of crown-of-thorns starfish Acanthaster planci. Mar Biol. 1994; 120(1 ):5~3.
Vjew Article • ~g~
37. Mellin C, Lugrin C, Okaji K, Francis DS, Uthicke S. Selective feeding and microalgal consumption rates by Crown-of-Thorns Seastar (Acanthaster cf.
so/aris) larvae. Diversity. 2017;9(1 ):8-Article No.:.
View Article • §@g~
38. Collins ARS. Biochemical investigation of two responses involved In feeding behaviour of Acanthaster planci (L.). Ill. food preferences. J Exp Mar Biol Ecol. 1975;17(1):87-94.
View Article • Goggle Scholar
39. Johansson CL, Francis DS, Uthicke S. Food preferences of juvenile corallivorous crown-of-thorns (Acanthaster planet) sea stars. Mar Biol. 2016;163(49).
View Article • ~g~
40. Keesing JK, Halford AR. Field measurement of survival rates of juveniles Acanthaster planer. Techniques and preliminary results. Mar Ecol Prog Ser. 1992;85(1 ):107-14.
Vjew Article • ~g~
41. Lawrence JM, Lane JM. The utilization of nutrients by postmetamorphic echinoderms. In: Jangoux M, Lawrence JM, edttors. Echinoderm nutrition. Rotterdam, Netherlands: A.A. Balkema; 1982.
42. Costerton JW, Lewandowski Z, Caldwell DE, Korber DR, Lappinscott HM. Microbial biofilms. Annu Rev Microbial. 1995;49:711-45. pmld:8561477
View Article • PubMed/NCBI • §@g~
43. Barker MF, Nichols D. Reproduction, recruitment and juvenile ecology of the starfish, Asterias rubens and Marthastarias glaslalis. J Mar Biol Assoc UK. 1983;63(4):74~5.
View Article • lli!Qg~
44. Mead AD. On the correlation between growth and food supply in starfish. Am Nat. 1900;34:17-23.
View Article • lli!Qg~
45. Haszprunar G, Vogler C, Worheide G. Persistent gaps of knowledge for naming and distinguishing multiple species of crown-of-thoms-seastar in the Acanthaster planci species complex. Diversity. 2017;9(2).
View Article • Google Scholar
46. Vogler C, Benzie J, Lessios H, Barber PH, Worheide G. A threat to coral reefs multiplied? Four species of crown-of-thorns starfish. Biol Lett. 2008;4(6):696-9. pmld:18832058
View Article • PubMed/NCBI • ~g~
https://joumals.plos.orglplosonelarticle?id= 10.1371 /joumal.pone.0236142 136
21w2021 Diet flexibility and growth of the early herbivorous juvenile crown-of-thorns sea star, implications for its boom-bust population dynamics
47. Lamare M, Pecorino 0, Hardy N, Liddy M, Byrne M, Uthicke S. The thermal tolerance of Crown-of-Thoms (Acanthasterplanc,) embryos and bipinnaria
larvae: Implications for spatial and temporal variation in adult populations. Coral Reefs. 2014;33(1):207-19.
Vjew Article • Goog~
48. R Core Team. R: a language and environment for statistical computing. Vienna, Austria: R Foundation for Statistical Computing; 2017.
49. Pinheiro J, Bales D, OebRoy S, Sarkar 0, R Core Team. (nlme}: Linear and Nonlinear Mixed Effects Models. 2019.
v;ew Article • Goog~
50. Pohlert T. Calculate Pairwise Multiple Comparisons of Mean Rank Sums (PMCMR). R package2014.
Vjew Article • Goog~
51. Lenth RV. Least-Squares Means: The (R} Package {lsmeans}. Journal of Statistical Software. 2016;69(1):1-33.
Vjew Article • G929~
52, Wickham H, Chang WT, Henry L, Pedersen TL, Takahashi K, Wilke K, et al. ggplot2: Create elegant data vlsuallsatlons using the grammar of graphics.
3.0.0 ad. New York: Springer-Verlag; 2018.
53. Wilmes JC, Schultz DJ, Hoey AS, Messmer V, Pratchett MS. Habitat associations of settlement-stage crown-of-thorns starfish on Australia's Great Barrier
Reef. Coral Reefs. 2020:12.
v;ewArticle • yggg~
54. Hereu B, Zabala M, Linares C, Sala E. The effects of predator abundance and habitat structural complexity on survival of juvenile sea urchins. Mar Biol.
2005;146(2):293-9.
Yiew Article • yggg&.Scb!llar
55. Yiu OS, Feehan CJ. Articulated coralline algae provide a spatial refuge to Juvenile sea urchins from predatory crabs. Mar Biol. 2017;164(4}:7.
Vjew Article • Goog~
56. Keeslng JK, Halford AR, Hall KC, Cartwright CM. Large-scale laboratory culture of the crown-of-thorns starfish Acanthaster plane/ (L.) (Echinodermata:
Asteroidea ). Aquaculture. 1997; 157 (3--4 ):215-26.
v;ew Artlcie • ~ogte..S.cb21al:
57. Wilmes J, Matthews S, Schultz 0, Messmer V, Hoey A, Pratchett M. Modelling growth of Juvenile Crown-of-Thorns starfish on the northern Great Barrier
Reef. Diversity. 2017;9(1 ).
Vjew Article • Goog~
58. Kamya PZ, Byrne M, Grabe-Landry A. Dworjanyn SA. Near-Mure ocean acidification enhances the feeding rate and development of the herbivorous
juveniles of the Crown-of-Thorns starfish, Acanthaster planci. Coral Reefs. 2016;35(4):1241-51.
View Article • Goog~
59. Nagarkar S, Williams GA, Subramanian G, Saha SK. Cyanobacterla-dominated biofilms: a high quality food resource for intertidal grazers. Hydrobiologia.
2004;512(1-3):~5.
View Article • Goog~
Nichols 0, Barker MF. Growth of juvenile Aster/as rubens L. (Echinodermata, Asteroidea) on an intertidal reef In southwestern Britain. J Exp Mar Biol Ecol. 60. 1984;78(1-2):157-65.
Vjew Article • Geog~
61. Clements M, Wolfe K, Schwartz K, Byrne M. Forever fissiparous: asexual propagation and stable demography In a tropical and geographically isolated
asterinid sea star. Mar Biol. 2019;166(6):11.
Vjew Article • Goog~
62. Allen JO, Richardson EL, Oeaker 0, Aguera A, Byrne M. Larval cloning In the crown-of-thorns sea star, a keystone coral predator. Mar Ecol Prog Ser.
2019;609:271-o.
View Article • Goog~
63. Messmer V, Pratchett M, Chong-Seng K. Variation in incidence and severity of injuries among Crown-of-Thorns Starfish (Acanthaster cf. solaris) on Australia's Great Barrier Reef. Diversity. 2017;9(12).
v;ew Article • ~gJe..§cbQlfil
64. Budden C, Buder I, Wolfe K, Oeaker D, Sweatman H, Byrne M. Effect of sublethal predation on reproductive output of the crown-of-thorns starfish
Acanthaster sp., with an overview of arm damage. Mar Ecol Prog Ser. 2019;629:103-16.
View Article • Geog~
65. Thorne BV, Byrne M. Survivorship of post-split fission products of Holothuria atra (Holothuroidea: Aspidochirotida) on the southern Great Barrier Reef. lnvertebr Reprod Dev. 2013;57(4):293-300.
View Article • Gggg~
https://joumals.plos.org/plosone/article?id=10.1371/joumal.pone.0236142 137
2/9/2021 Diet flexibility and growth of the early herbivorous juvenile crown-of-thorns sea star, implications for its boom-bust population dynamics
66. Lee J, Byrne M, Uthicke S. The influence of population density on fission and growth of Holothuria atra in natural mesocosms. J Exp Mar Biol Ecol.
2008; 365(2): 126-35.
View Article • fu!Qale Scholar
67. Byrne M. Changes in larval morphology in the evolution of benthic development by Patiriella exigua (Asteroidea, Asterinidae), a comparison with the
larvae of Patiriella species with planktonic development. Biol Bull. 1995;188(3):293-305. pmid:29281334
View Article • PubMed/NCBI • Google Scholar
68. Soliman FES, Nojima S. Some observations on dispersal behaviour of the early Juvenile stage of the sea-star, Asterina minor Hayashi. Publications from
the Amakusa Marine Biological Laboratory Kyushu University. 1984;7(2):81-93.
View Article • gQQg~
69. Nakamura M, Kurnagai NH, Sakal K, Okaji K, Ogasawara K, Mitarai S. Spatial variability in recruitment of acroporid corals and predatory starfish along the
Onna coast, Okinawa, Japan. Mar Ecol Prag Ser. 2015;540:1-12.
View Miele • GoQQle Scholar
70. Wilmes JC, Hoey AS, Messmer V, Pratchett MS. Incidence and severity of injuries among juvenile crown-of-thorns starfish on Australia's Great Barrier
Reef. Coral Reefs. 2019.
View Miele • Goo!lle Scholar
71. Birkeland C, Lucas JS. Acanthaster planci: major management problems of coral reefs. Boca Ranton, Florida: CRC Press Inc.; 1990 1990.
72. Brun E. Extreme population density of the starfish Asterias robens L. on a bed of Iceland scallop, Ch/amys islandica (0. F. MOiier). Astarte. 1968;32:1-3.
View Article • G!WJfe Scholar
73. Witman JD, Genovese SJ, Bruno JF, Mclaughlin JW, Pavlin Bl. Massive prey recruitment and the control of rocky subtidal communities on large spatial
scales. Ecol Monogr. 2003;73(3):441-62.
View Articfe • Google Scholar
74. Guillou M, Joly-Turquin G, Leyzour S, Pernet P, Dubois P. Factors controlling Juvenile growth and population structure of the starfish Asterias robens in intertidal habitats: field and experimental approaches. J Mar Biol Assoc UK. 2012;92(2):367-78.
View Ar1icle • .@291118 Scholar
75, Nauen CE. The growth of the sea star Asterias robens and its role as benthic predator in Kiel Bay. Kieler Meers Sond. 1978:68-81.
Vjew Artfcie • yQQg~
76. MacNeil MA, Chong-Seng KM, Pratchett DJ, Thompson CA, Messmer V, Pratchett MS. Age and growth of an outbreaking Acanthaster cf. solaris
population within the Great Barrier Reef. Diversity. 2017;9(1 ):18.
View Article • yQQ!Jle Scholar
77. Stump RJW, Lucas JS. Linear growth In spines from Acanthastar planci (L.) involving growth lines and periodic pigment bands. Coral Reefs.
1990;9(3):149-54.
View Article • Google Scholar
78. Stump RJW. An investigation to describe the population dynamics of Acanthaster planci (L.) around Lizard Island, Cairns section, Great Barrier Reef
Marine Park (CRC Reef Research Centre: James Cook University, Australia, 1996 CRC reef research technical report, Technical report no. 10.
79. Wooldridge SA, Brodie JE. Environmental triggers for primary outbreaks of crown-of-thorns starfJSh on the Great Barrier Reef, Australia. Mar Pollut Bull.
2015;101 (2):805-15. pmid:26460182
View Article • PubMed/NCBI • yQQg~
80. Hock K, Wolff NH, Condie SA, Anthony KRN, Mumby PJ. Connectivity networks reveal the risks of crown-of-thorns starfish outbreaks on the Great Barrier
Reef. J Appl Ecol. 2014;51(5):1188-96.
View Article • Goople Scholar
81. Reichelt RE, Greve W, Bradbury RH, Moran PJ. Acanthaster planci outbreak initiation: a starfish-coral site model Ecol Model. 1990;49:153-77
View Article • Goo11le Scholar
82. Gosselin LA, Qian PY. Juvenile mortality in benthic marine invertebrates. Mar Ecol Prag Ser. 1997;146(1-3):265-82.
View Artjcle • GQQQle Scholar
83. Lawrence JM, Moran P. Proximate composition and allocation of energy to body components In Acanthaster planci (Linneas)(Echinometra, Asteroidea)
Zoological Science. 1992;9(2):321-8.
Vjew Ar1icle • GQQQ~
84. Yamaguchi M. Population structure, spawning and growth of coral reef asteroid Linckia laevigata (Linneas). Pac Sci. 1977;31(1):13-30.
View Miele • Goople Scholar
85. Birkeland C. The faustian traits of the Crown-of-Thorns starfish. Am Scientist. 1989;77(2):154-63.
View Article • .§QQµle Scholar
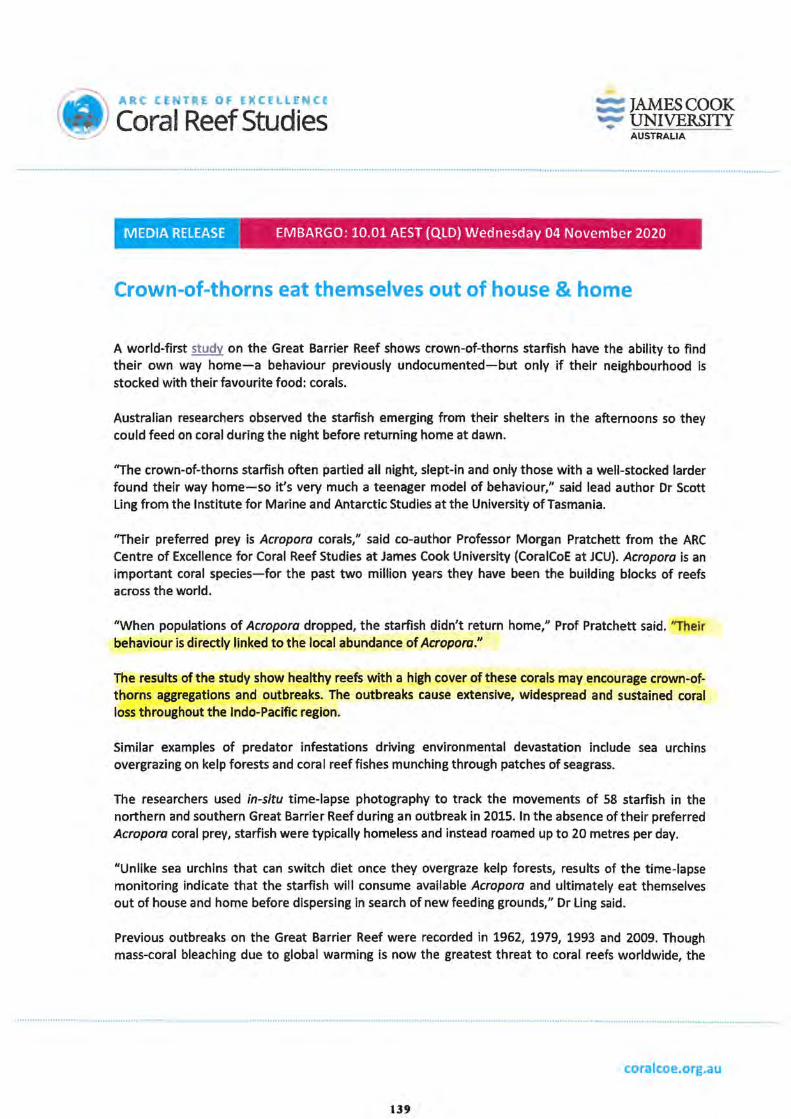
~ , ARC CfNTRE Of £XCELl£NCE
~ Coral Reef Studies = JAMESCOOK ___. UNIVERSITY ...
AUSTRALIA
··························--·······--·················-·····-············--··· ......................................................................................................................................................................................................................... .
MEDIA RELEASE I EMBARGO: 10.01 AEST (QLD) Wednesday 04 November 2020
Crown-of-thorns eat themselves out of house & home
A world-first study on the Great Barrier Reef shows crown-of-thorns starfish have the ability to find their own way home-a behaviour previously undocumented-but only if their neighbourhood is stocked with their favourite food: corals.
Australian researchers observed the starfish emerging from their shelters in the afternoons so they could feed on coral during the night before returning home at dawn.
''The crown-of-thorns starfish often partied all night, slept-in and only those with a well-stocked larder found their way home-so it's very much a teenager model of behaviour," said lead author Dr Scott Ling from the Institute for Marine and Antarctic Studies at the University ofTasmania.
"Their preferred prey is Acropora corals," said co-author Professor Morgan Pratchett from the ARC Centre of Excellence for Coral Reef Studies at James Cook University (CoralCoE at JCU). Acropora is an important coral species-for the past two million years they have been the building blocks of reefs across the world.
"When populations of Acropora dropped, the starfish didn't return home," Prof Pratchett said. ''Their behaviour is directly linked to the local abundance of Acropora."
The results of the study show healthy reefs with a high cover of these corals may encourage crown-ofthorns aggregations and outbreaks. The outbreaks cause extensive, widespread and sustained coral loss throughout the lndo-Pacific region.
Similar examples of predator infestations driving environmental devastation include sea urchins overgrazing on kelp forests and coral reef fishes munching through patches of seagrass.
The researchers used in-situ time-lapse photography to track the movements of 58 starfish in the northern and southern Great Barrier Reef during an outbreak in 2015. In the absence of their preferred Acropora coral prey, starfish were typically homeless and instead roamed up to 20 metres per day.
"Unlike sea urchins that can switch diet once they overgraze kelp forests, results of the time-lapse monitoring indicate that the starfish will consume available Acroporo and ultimately eat themselves out of house and home before dispersing in search of new feeding grounds," Dr Ling said.
Previous outbreaks on the Great Barrier Reef were recorded in 1962, 1979, 1993 and 2009. Though mass-coral bleaching due to global warming is now the greatest threat to coral reefs worldwide, the
, ....... ••••••••••••••••••h• • •••••• .. •••••••••••••• .. • .. •••••••• .. ••••••••••••••••••••••••••••••••• .. ••••••••••••oHOOOOO ■ OOOOOOOOOOOOOUOOOOOOOOOoOOo00000oOOOooooOOOOOOOOOOoOOoooOOOOoOOOOeOoooooooooooooooo,ooooooo00000oooooooooooooooooooooooOOoOooooooooooooooooooooooo .. ,o,oooooOOOOOOOOOOOOOOOooo
coralcoe.org.au
139
Media Release
combined impact of mass-bleaching and crown-of-thorns outbreaks is potentially catastrophic for coral reefs.
"By better understanding the behaviour of these starfish we can help prevent and control their outbreaks, which will help alleviate the pressures on coral reefs," Prof Pratchett said.
PAPER
Ling 5, Cowan Z, Boada J. Flukes B, Pratchett M. (2020). 'Homing behaviour by destructive crown-ofthorns starfish is triggered by local availability of coral prey'. Proceedings of the Royal Society 8. DOI: 10.1098/ rspb.2020.1341
IMAGERY
Photos and video are available for media use here. Please note these are for single use with this story only, not for any other story. Credit must be given to the content owner in the filename. No archival permissions are granted.
CONTACTS
Prof Morgan Pratchett (AEST, Townsville) P: +61 (0)488 112 295 E: [email protected]
Dr Scott Ling (AEDT, Hobart) P: +61 (0)418376240 E: [email protected]
FURTHER INFORMATION
Melissa Lyne/ CoralCoE at JCU (AEDT, Sydney) P: +61 (0) 415 514 328 E: [email protected]
AltC CENTRE Of EXCELLlNCf
Coral Reef Studies
140
Section D:
Articles about Nutrients
141

142
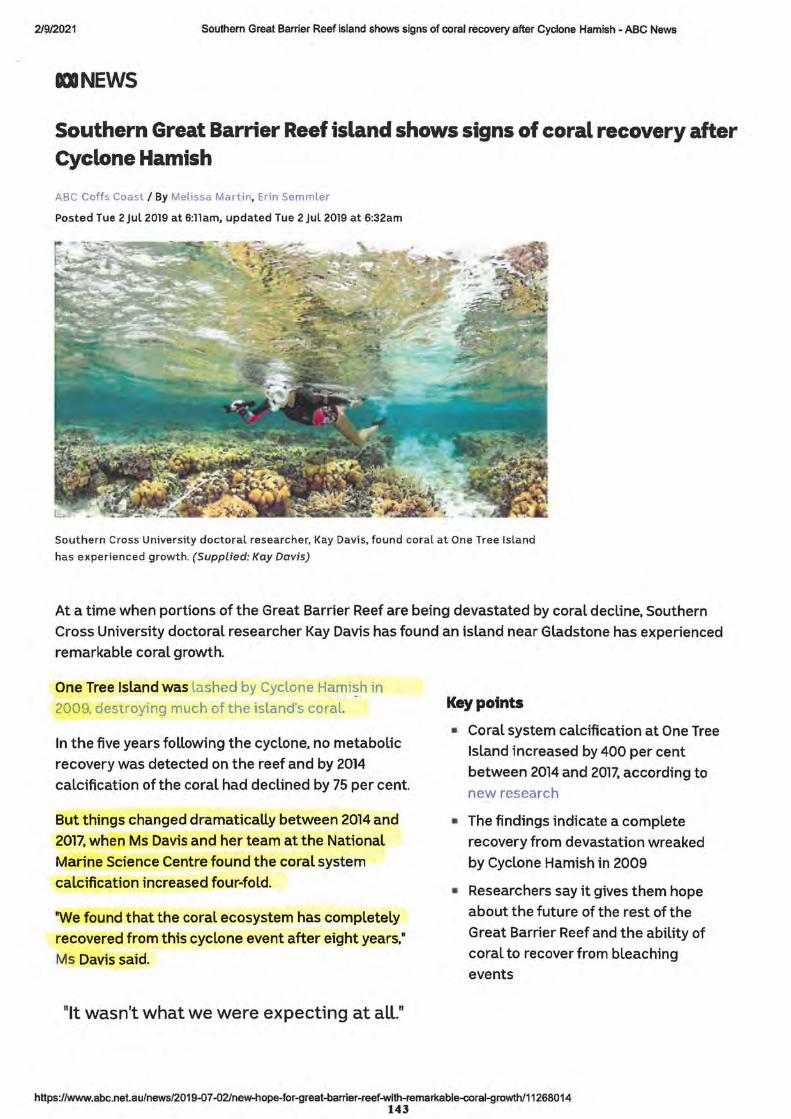
2/9/2021 Southern Great Barrier Reef island shows signs of coral recovery after Cyclone Hamish - ABC News
IINEWS
Southern Great Barrier Reef island shows signs of coral recovery after Cyclone Hamish
ABC Coffs Coast I By Melissa Martin, Erin Semmler
Posted Tue 2 Jul 2019 at 6:11am, updated Tue 2 Jul 2019 at 6:32am
Southern Cross University doctoral researcher, Kay Davis, found coral at One Tree Island
has experienced growth. (Supplied: Kay Davis)
At a time when portions of the Great Barrier Reef are being devastated by coral decline, Southern
Cross University doctoral researcher Kay Davis has found an island near Gladstone has experienced remarkable coral growth.
One Tree Island was lashed by C_yclone Hami~h-in
2009, destroying much of the island's coral.
In the five years following the cyclone. no metabolic recovery was detected on the reef and by 2014
calcification of the coral had declined by 75 per cent.
But things changed dramatically between 2014 and
2017, when Ms Davis and her team at the National
Marine Science Centre found the coral system
calcification increased four-fold.
"We found that the coral ecosystem has completely recovered from this cyclone event after eight years."
Ms Davis said.
"It wasn't what we were expecting at all."
Keypotnts
• Coral system calcification at One Tree Island increased by 400 per cent
between 2014 and 2017, according to new research
■ The findings indicate a complete
recovery from devastation wreaked by Cyclone Hamish in 2009
• Researchers say it gives them hope
about the future of the rest of the Great Barrier Reef and the ability of
coral to recover from bleaching events
https:/fwww.abc.net.au/news/2019-07-02/new-hope-for-great-barrier-reef-with-remarkable-coral-growth/11268014 143
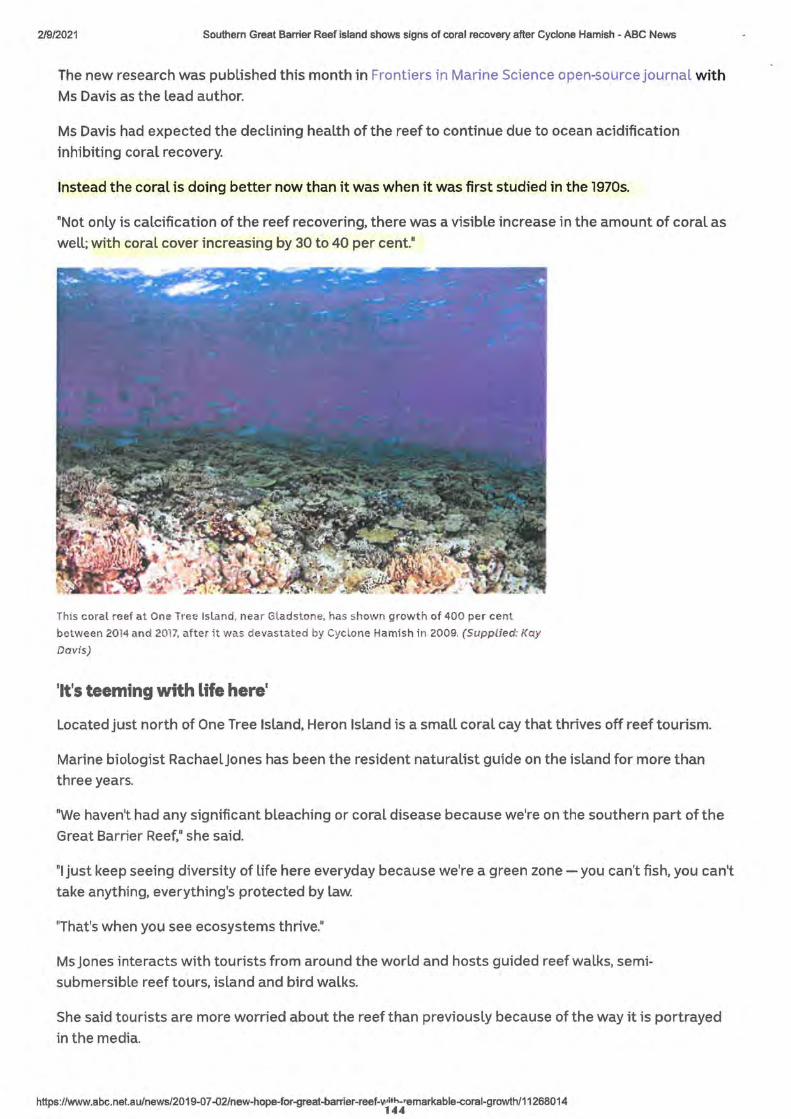
2/9/2021 Southern Great Barrier Reef island shows signs of coral recovery after Cyclone Hamish - ABC News
The new research was published this month in Frontiers in Marine Science open-source journal with
Ms Davis as the lead author.
Ms Davis had expected the declining health of the reef to continue due to ocean acidification
inhibiting coral recovery.
Instead the coral is doing better now than it was when it was first studied in the 1970s.
"Not only is calcification of the reef recovering, there was a visible increase in the amount of coral as
well; with coral cover increasing by 30 to 40 per cent."
Thi s coral reef at One Tree Island, near Gl adstone. has shown growth of 400 per cent
between 2014 and 2017, aft er it was devastated by Cyclone Hami sh i n 2009. (Supplied: Kay
Davis)
'It's teeming with life here'
Located just north of One Tree Island, Heron Island is a small coral cay that thrives off reef tourism.
Marine biologist RachaelJones has been the resident naturalist guide on the island for more than
three years.
"We haven't had any significant bleaching or coral disease because we're on the southern part of the
Great Barrier Reef," she said.
"I just keep seeing diversity of life here everyday because we're a green zone - you can't fish, you can't
take anything, everything's protected by law.
"That's when you see ecosystems thrive."
Ms Jones interacts with tourists from around the world and hosts guided reef walks, semi
submersible reef tours, island and bird walks.
She said tourists are more worried about the reef than previously because of the way it is portrayed
in the media.
https://www.abc.net.au/news/2019-07-02/new-hope-for-great-banier-reef-Vt';th-•emarkable-coral-growth/11268014 144
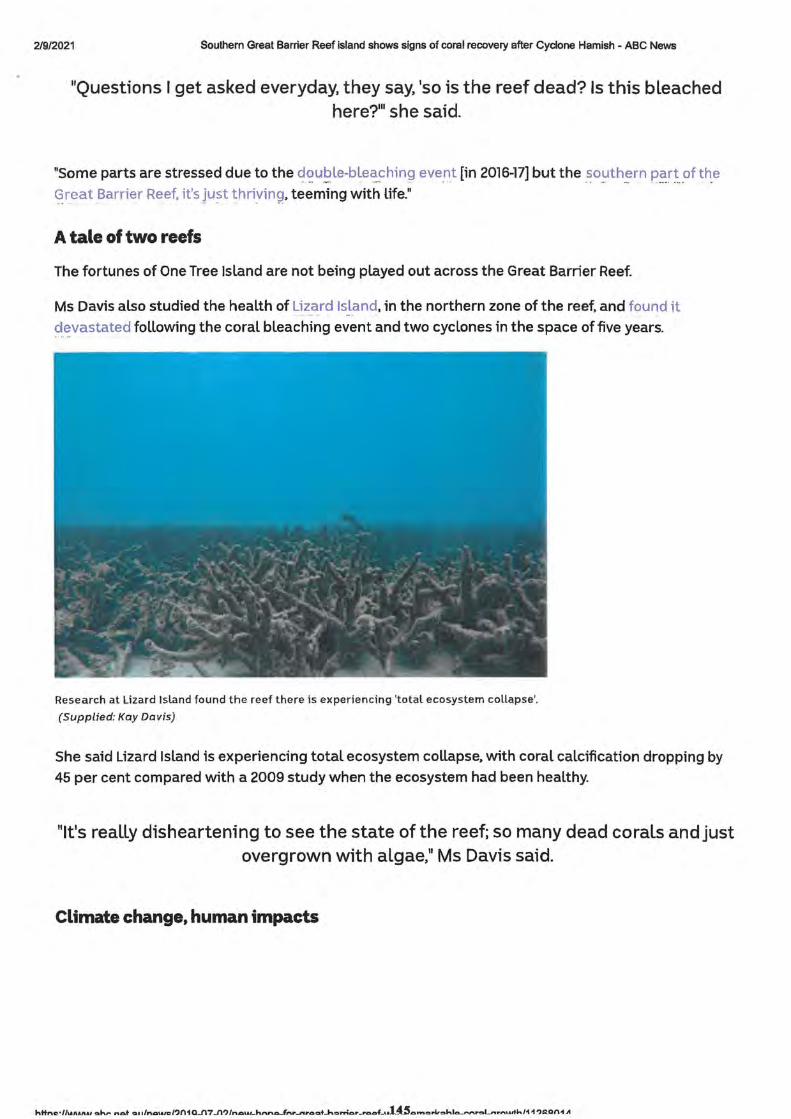
2/9/2021 Southern Great Barrier Reef island shows signs of coral recovery after Cyclone Hamish - ABC News
"Questions I get asked everyday, they say, 'so is the reef dead? Is this bleached here?111 she said.
"Some parts are stressed due to the ~~u-~le-ble~~hing eve_rit [in 2016-17] but the _so~th_~rn p~rt_of th_e
~reat Barrier Reef. it'sJu~t ~hriyin~. teeming with life."
A tale of two reefs
The fortunes of One Tree Island are not being played out across the Great Barrier Reef.
Ms Davis also studied the health of Lizard Island, in the northern zone of the reef, and found it - -~. c:J_~vastated following the coral bleaching event and two cyclones in the space of five years.
Research at Lizard Island found the reef there is experiencing 'total ecosystem collapse'.
(Supplied: Kay Davis)
She said Lizard Island is experiencing total ecosystem collapse, with coral calcification dropping by 45 per cent compared with a 2009 study when the ecosystem had been healthy.
"It's really disheartening to see the state of the reef; so many dead corals and just overgrown with algae," Ms Davis said.
Climate change, human impacts
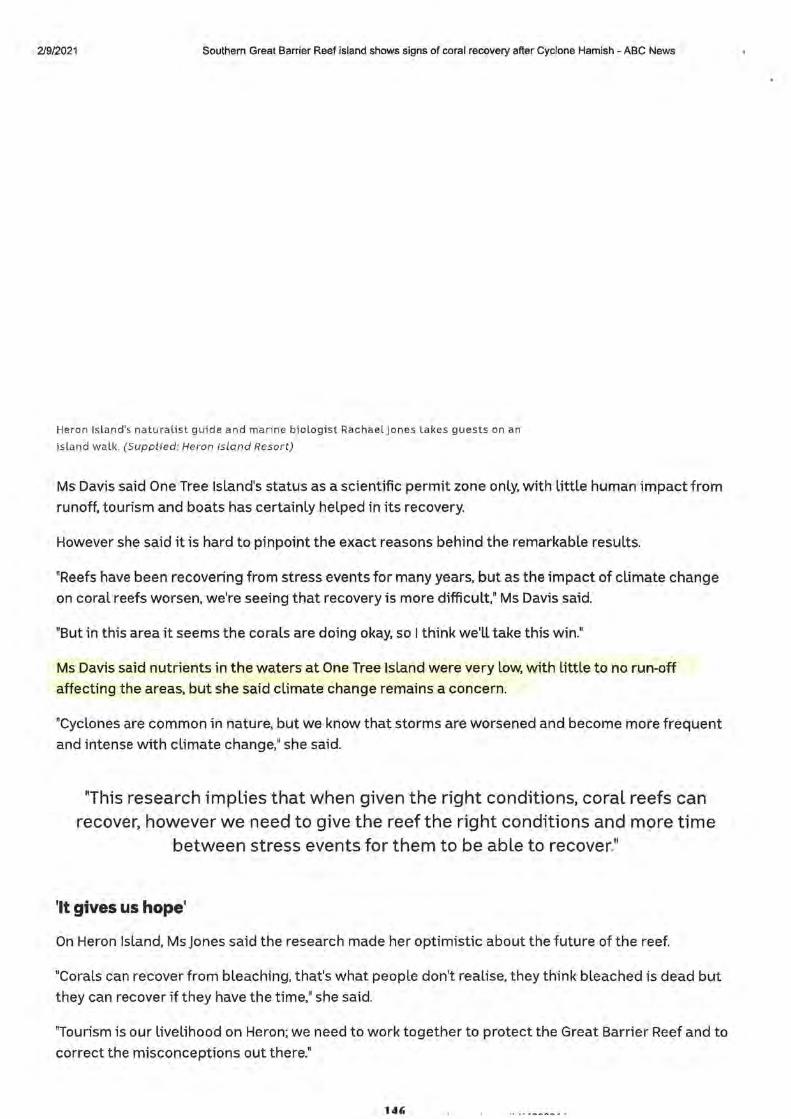
2/9/2021 Southern Great Barrier Reef island shows signs of coral recovery after Cyclone Hamish - ABC News
Heron Island's naturalist guide and marine biologist Rachael Jones takes guests on an
island walk. (Supplied: Heron Island Resort)
Ms Davis said One Tree Island's status as a scientific permit zone only, with little human impact from
runoff, tourism and boats has certainly helped in its recovery.
However she said it is hard to pinpoint the exact reasons behind the remarkable results.
"Reefs have been recovering from stress events for many years, but as the impact of climate change
on coral reefs worsen, we're seeing that recovery is more difficult," Ms Davis said.
"But in this area it seems the corals are doing okay, so I think we'll take this win."
Ms Davis said nutrients in the waters at One Tree Island were very low, with little to no run-off
affecting the areas, but she said climate change remains a concern.
"Cyclones are common in nature, but we know that storms are worsened and become more frequent
and intense with climate change," she said.
"This research implies that when given the right conditions, coral reefs can recover, however we need to give the reef the right conditions and more time
between stress events for them to be able to recover."
'It gives us hope'
On Heron Island, Ms Jones said the research made her optimistic about the future of the reef.
"Corals can recover from bleaching, that's what people don't realise, they think bleached is dead but
they can recover if they have the time," she said.
"Tourism is our livelihood on Heron; we need to work together to protect the Great Barrier Reef and to
correct the misconceptions out there."
141i
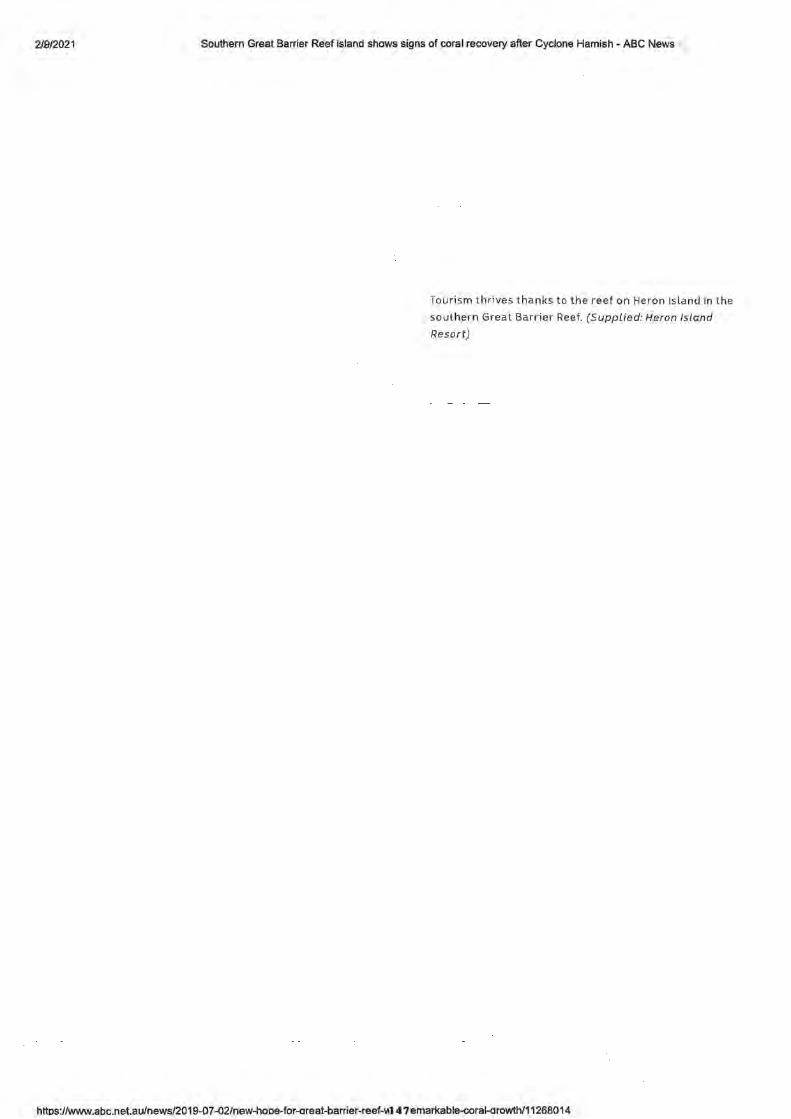
2/B/2021 Southern Great Barrier Reef island shows signs of coral recovery after Cyclone Hamish - ABC News
Tourism thrives thanks to the reef on Heron Island in the
southern Great Barrier Reef. (Supplied: Heron Island
Resort)
httos://www.abc.net.au/news/2019-07--02/new-hooe-for-areat-barrier-reef-Vl1 4 7·emarkable-coral-arowth/11268014

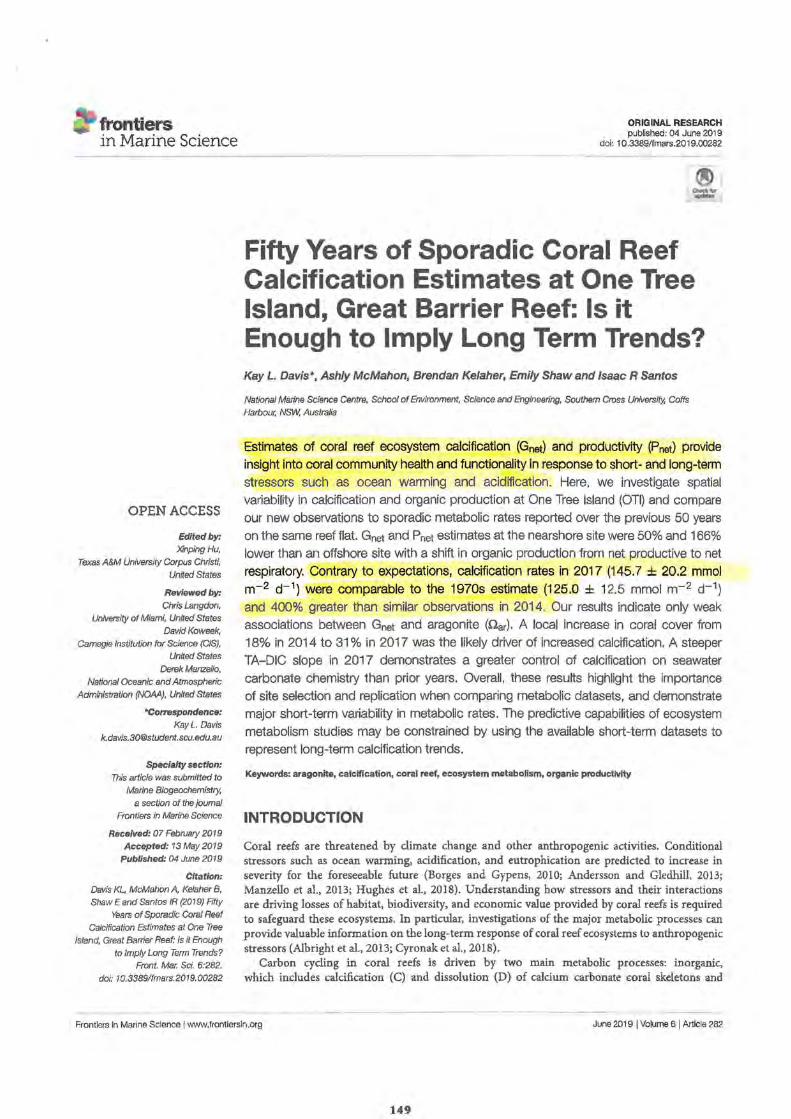
frontiers in Marine Science
OPEN ACCESS
Edited by: XinpingHu,
Texas A&M University Corpus Christi, United States
Reviewed by: Chris Langdon,
University of Miami, United States David Koweek,
Carnegie Institution for Science (CIS), United States
Derek Manzello, National Oceanic and Atmospheric
Administration (NOAA), United States
-Correspondence:
KayL. Davis [email protected]
Specialty section: This article was submitted to
Marine Biogeochemistry, a section of the journal
Frontiers in Marine Science
Received: 07 February 2019 Accepted: 13 May 2019
Published: 04 June 2019
Citation: Davis KL, McMahon A, Kelaher B, Shaw E and Santos IR (2019) Frfty
Years of Sporadic Coral Reef Calcification Estimates at One Tree
Island, Great Barrier Reef: Is it &!ough to Imply Long Term Trends?
Front. Mar. Sci. 6:282. doi: 10.3389/fmars.2019.00282
ORIGINAL RESEARCH publshed: 04 June 2019
doi: 10 .3389/fmars.2019.00282
Fifty Years of Sporadic Coral Reef Calcification Estimates at One Tree Island, Great Barrier Reef: Is it Enough to Imply Long Term Trends? Kay L. Davis", Ashly McMahon, Brendan Ke/aher, Emily Shaw and Isaac R Santos
National Manne Science Centre, School of Environment, Science and Engineering, Southern Cross University, Coffs Harbour, NSW, Australia
Estimates of coral reef ecosystem calcification (Gnet) and productivity (Pnet) provide insight into coral community health and functionality in response to short- and long-term stressors such as ocean warming and acidification. Here, we investigate spatial variability in calcification and organic production at One Tree Island (OTI) and compare
our new observations to sporadic metabolic rates reported over the previous 50 years
on the same reef flat. Gnet and Pnet estimates at the nearshore site were 50% and 166% lower than an offshore site with a shift in organic production from net productive to net respiratory. Contrary to expectations, calcification rates in 2017 (145. 7 ± 20.2 mmol m-2 d-1) were comparable to the 1970s estimate (125.0 ± 12.5 mmol m-2 d-1)
and 400% greater than similar observations in 2014. Our results indicate only weak associations between Gnet and aragonite (Oar), A local increase in coral cover from 18% in 2014 to 31 % in 2017 was the likely driver of increased calcification. A steeper TA-DIC slope in 2017 demonstrates a greater control of calcification on seawater carbonate chemistry than prior years. Overall, these results highlight the importance of site selection and replication when comparing metabolic datasets, and demonstrate major short-term variability in metabolic rates. The predictive capabilities of ecosystem metabolism studies may be constrained by using the available short-term datasets to represent long-term calcification trends.
Keywords: aragonite, calcification, coral reef, ecosystem metabolism, organic productivity
INTRODUCTION
Coral reefs are threatened by climate change and other anthropogenic activities. Conditional stressors such as ocean warming, acidification, and eutrophication are predicted to increase in severity for the foreseeable future (Borges and Gypens, 2010; Andersson and Gledhill, 2013; Manzello et al., 2013; Hughes et al., 2018). Understanding how stressors and their interactions are driving losses of habitat, biodiversity, and economic value provided by coral reefs is required to safeguard these ecosystems. In particular, investigations of the major metabolic processes can provide valuable information on the long-term response of coral reef ecosystems to anthropogenic stressors (Albright et al., 2013; Cyronak. et al., 2018).
Carbon cycling in coral reefs is driven by two main metabolic processes: inorganic, which includes calcification (C) and dissolution (D) of calcium carbonate wral skeletons and
-----------Frontiers in Marine Science I www.lrontiersln.org June 2019 I Volume 6 I Article 282
149
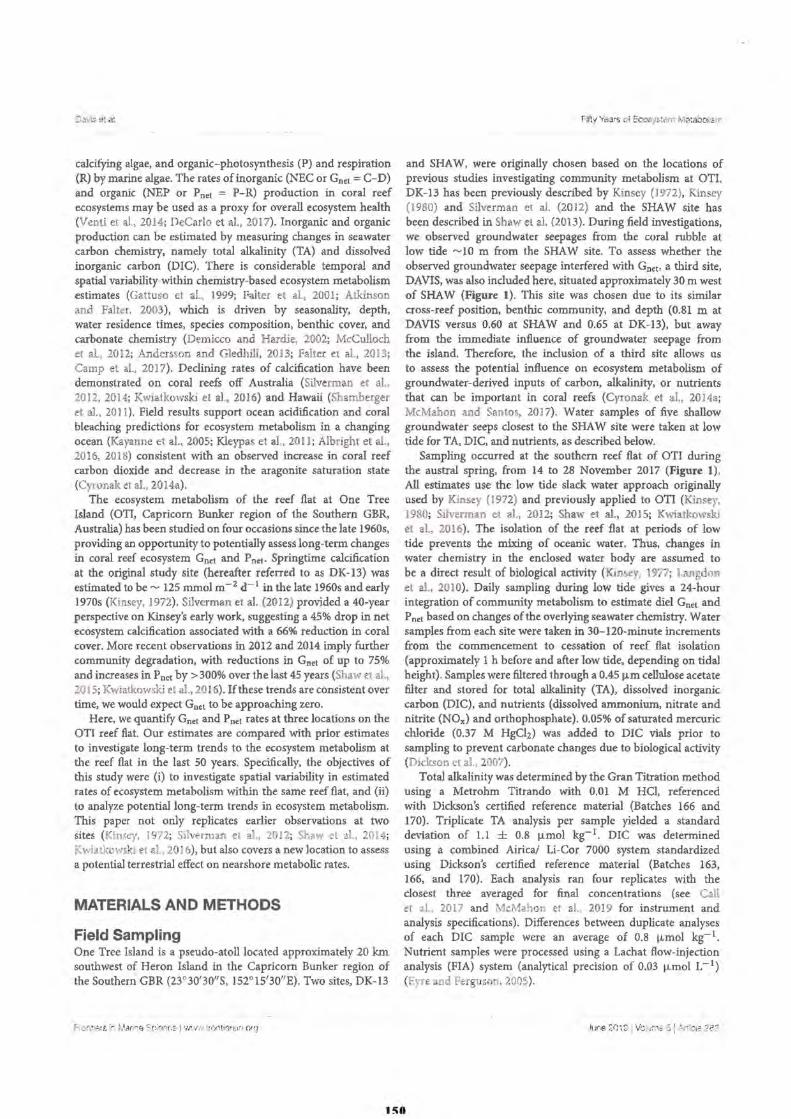
Davis el al.
calcifying algae, and organic-photosynthesis (P) and respjration (R) by marine algae. The rates of inorganic (NEC or Gnet = C-D) and organic (NEP or Pnet = P-R) production in coral reef ecosystems may be used as a proxy for overall ecosystem health (Venti et al., 2014; DeCarlo et al., 2017). Inorganic and organic production can be estimated by measuring changes in seawater carbon chemistry, namely total alkalinity (TA) and dissolved inorganic carbon (DIC). There is considerable temporal and spatial variability within chemistry-based ecosystem metabolism estimates (Gattuso et al., 1999; Falter et al., 2001; Atkinson and Falter, 2003), which is driven by seasonality, depth, water residence times, species composition, benthic cover, and carbonate chemistry (Demicco and Hardie, 2002; McCulloch et al, 2012; Andersson and Gledhill, 2013; Falter et al. , 2013; Camp et al., 2017). Declining rates of calcification have been demonstrated on coral reefs off Australia (Silverman et al., 2012, 2014; Kwiatkowski et al ., 2016) and Hawaii (Shamberger et al ., 201 1). Field results support ocean acidification and coral bleaching predictions for ecosystem metabolism in a changing ocean (Kayanne et al., 2005; Kleypas et al., 2011 ; Albright et al., 2016, 201 8) consistent with an observed increase in coral reef carbon dioxide and decrease in the aragonite saturation state (Cyronak et al., 2014a).
The ecosystem metabolism of the reef flat at One Tree Island (OTI, Capricorn Bunker region of the Southern GBR, Australia) has been studied on four occasions since the late 1960s, providing an opportunity to potentially assess long-term changes in coral reef ecosystem Gnet and Pnet• Springtime calcification at the original study site (hereafter referred to as DK-13) was estimated to be~ 125 mmol m-2 d- 1 in the late 1960s and early 1970s (Kinsey, 1972). Silverman et al. (2012) provided a 40-year perspective on Kinsey's early work, suggesting a 45% drop in net ecosystem calcification associated with a 66% reduction in coral cover. More recent observations in 2012 and 2014 imply further community degradation, with reductions in Gnet of up to 75% and increases in P net by > 300% over the last 45 years (Shaw et al., 2015; Kwiatkowski et al., 2016). If these trends are consistent over time, we would expect Gnet to be approaching zero.
Here, we quantify Gnet and P net rates at three locations on the OTI reef flat. Our estimates are compared with prior estimates to investigate long-term trends to the ecosystem metabolism at the reef flat in the last 50 years. Specifically, the objectives of this study were (i) to investigate spatial variability in estimated rates of ecosystem metabolism within the same reef flat, and (ii) to analyze potential long-term trends in ecosystem metabolism. This paper not only replicates earlier observations at two sites (Kinsey. 1972; Silv~rman et al., 201 2; Shaw et al., 2014; Kwiatkowski et al., 2016), but also covers a new location to assess a potential terrestrial effect on nearshore metabolic rates.
MATERIALS AND METHODS
Field Sampling One Tree Island is a pseudo-atoll located approximately 20 km southwest of Heron Island in the Capricorn Bunker region of the Southern GBR (23°30'3011S, 152°1513011E). Two sites, DK-13
e'ronrr6, o in Manne Sc:ience 1 •.,-.,ww tro,-,tie•sir, .org
Fifty Years of Ecosystem Metabciism
and SHAW, were originally chosen based on the locations of previous studies investigating community metabolism at OTI. DK-13 has been previously described by Kinsey (1972), Kinsey (1980) and Silverman et al. (2012) and the SHAW site has been described in 5haw et al. (2013). During field investigations, we observed groundwater seepages from the coral rubble at low tide ~10 m from the SHAW site. To assess whether the observed groundwater seepage interfered with Gnet, a third site, DAVIS, was also included here, situated approximately 30 m west of SHAW (Figure I). This site was chosen due to its similar cross-reef position, benthic community, and depth (0.81 m at DAVIS versus 0.60 at SHAW and 0.65 at DK-13), but away from the immediate influence of groundwater seepage from the island. Therefore, the inclusion of a third site allows us to assess the potential influence on ecosystem metabolism of groundwater-derived inputs of carbon, alkalinity, or nutrients that can be important in coral reefs (C}TOnak et al., 2014a; McMahon and Santos, 2017). Water samples of five shallow groundwater seeps closest to the SHAW site were taken at low tide for TA, DIC, and nutrients, as described below.
Sampling occurred at the southern reef flat of OTI during the austral spring, from 14 to 28 November 2017 (Figure I) . All estimates use the low tide slack water approach originally used by Kinsey (1972) and previously applied to OTI (Kinsey, 1980; Silverman et al., 2012; Shaw et al., 2015; Kwiatkowski et al, 2016). The isolation of the reef flat at periods of low tide prevents the mixing of oceanic water. Thus, changes in water chemistry in the enclosed water body are assumed to be a direct result of biological activity (Km~ty, 197?; I. angdon et al., 2010). Daily sampling during low tide gives a 24-hour integration of community metabolism to estimate diel Gnet and P net based on changes of the overlying seawater chemistry. Water samples from each site were taken in 30-120-minute increments from the commencement to cessation of reef flat isolation (approximately 1 h before and after low tide, depending on tidal height). Samples were filtered through a 0.45 µm cellulose acetate filter and stored for total alkalinity (TA), dissolved inorganic carbon (DIC), and nutrients (dissolved ammonium, nitrate and nitrite (NOx) and orthophosphate). 0.05% of saturated mercuric chloride (0.37 M HgCli) was added to DIC vials prior to sampling to prevent carbonate changes due to biological activity (Dickson et al., 2007).
Total alkalinity was determined by the Gran Titration method using a Metrohm Titrando with 0.01 M HCl, referenced with Dickson's certified reference material (Batches 166 and 170). Triplicate TA analysis per sample yielded a standard deviation of 1.1 ± 0.8 µmol kg- 1. DIC was determined using a combined Airica/ Li-Cor 7000 system standardized using Dickson's certified reference material (Batches 163, 166, and 170). Each analysis ran four replicates with the closest three averaged for final concentrations (see Call et al., 2017 and McMahon et al., 2019 for instrument and analysis specifications). Differences between duplicate analyses of each DIC sample were an average of 0.8 µmol kg- 1.
Nutrient samples were processed using a Lachat flow-injection analysis (FIA) system (analytical precision of 0.03 µmo! L - I) (Eyre and Ferguson, 2005).
,Ji;r.e 20 : 9 I Voi1JmE1 6 I Article 282
HO
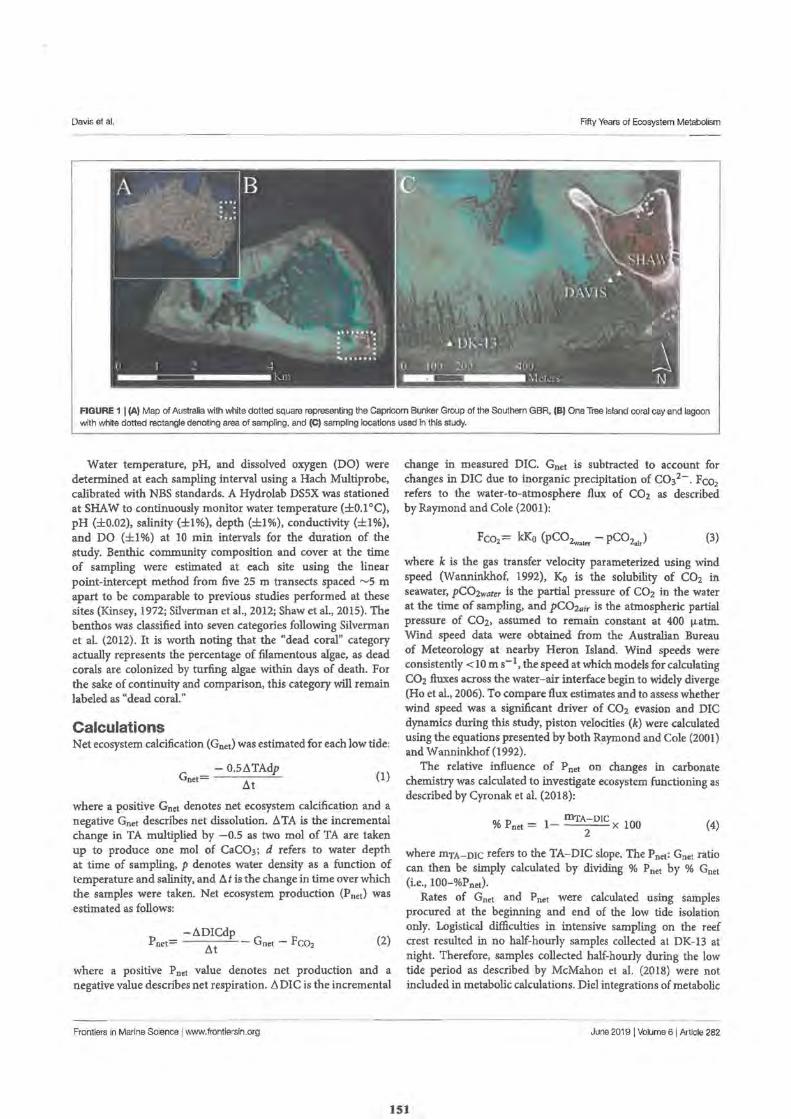
Davis et al. Fifty Years of Ecosystem Metabolism
FIGURE 1 I (AJ Map of Australia with white dotted square representing the Capricorn Bunker Group of the Southern GBR, (BJ One Tree Island coral cay and lagoon with white dotted rectangle denoting area of sampling, and (CJ sampling locations used in this study.
Water temperature, pH, and dissolved oxygen (DO) were determined at each sampling interval using a Hach Multiprobe, calibrated with NBS standards. A Hydrolab DS5X was stationed at SHAW to continuously monitor water temperature (±0.1°C), pH (±0.02), salinity (±1%), depth (±1%), conductivity (±1%), and DO (±1 %} at 10 min intervals for the duration of the study. Benthic community composition and cover at the time of sampling were estimated at each site using the linear point-intercept method from five 25 m transects spaced ~Sm apart to be comparable to previous studies performed at these sites (Kinsey, 1972; Silverman et al., 2012; Shaw et al., 2015). The benthos was classified into seven categories following Silverman et al. (2012). It is worth noting that the "dead coral" category actually represents the percentage of filamentous algae, as dead corals are colonized by turfing algae within days of death. For the sake of continuity and comparison, this category will remain labeled as "dead coral."
Calculations Net ecosystem calcification ( Gnet) was estimated for each low tide:
- 0.SATAdp Gnet= Lit (1)
where a positive Gnet denotes net ecosystem calcification and a negative Gnet describes net dissolution. ii TA is the incremental change in TA multiplied by -0.5 as two mol of TA are taken up to produce one mol of CaCO3; d refers to water depth at time of sampling, p denotes water density as a function of temperature and salinity, and ii tis the change in time over which the samples were taken. Net ecosystem production (Pnet) was estimated as follows:
-ADICdp Pnet= At - Gnet - Fc0i (2)
where a positive P net value denotes net production and a negative value describes net respiration. ~DIC is the incremental
Frontiers in Marine Science I www.trontiersln.org
change in measured DIC. Gnet is subtracted to account for changes in DIC due to inorganic precipitation of coi-. Fco
2
refers to the water-to-atmosphere flux of CO2 as described by Raymond and Cole (2001):
(3)
where k is the gas transfer velocity parameterized using wind speed (Wanninkhof, 1992), Ko is the solubility of CO2 in seawater, pC02water is the partial pressure of CO2 in the water at the time of sampling, and pC02,,;, is the atmospheric partial pressure of CO2, assumed to remain constant at 400 µ,atm. Wind speed data were obtained from the Australian Bureau of Meteorology at nearby Heron Island. Wind speeds were consistently < 10 m s-1, the speed at which models for calculating CO2 fluxes across the water-air interface begin to widely diverge (Ho et ai., 2006). To compare flux estimates and to assess whether wind speed was a significant driver of CO2 evasion and DIC dynamics during this study, piston velocities (k) were calculated using the equations presented by both Raymond and Cole (2001) and Wanninkhof (1992).
The relative influence of P net on changes in carbonate chemistry was calculated to investigate ecosystem functioning as described by Cyronak et al. {2018):
% Pnet = 1- mTA-DIC X 100 2
(4)
where IDTA-DIC refers to the TA-DIC slope. The Pnet: Gnet ratio can then be simply calculated by dividing % Pnet by % Gnet (i.e., 100-%Pnet),
Rates of Gnet and Pnet were calculated using samples procured at the beginning and end of the low tide isolation only. Logistical difficulties in intensive sampling on the reef crest resulted in no half-hourly samples collected at DK-13 at night. Therefore, samples collected half-hourly during the low tide period as described by McMahon et al. (2018) were not included in metabolic calculations. Diel integrations of metabolic
June 2019 I Volume 6 \ Article 282
151
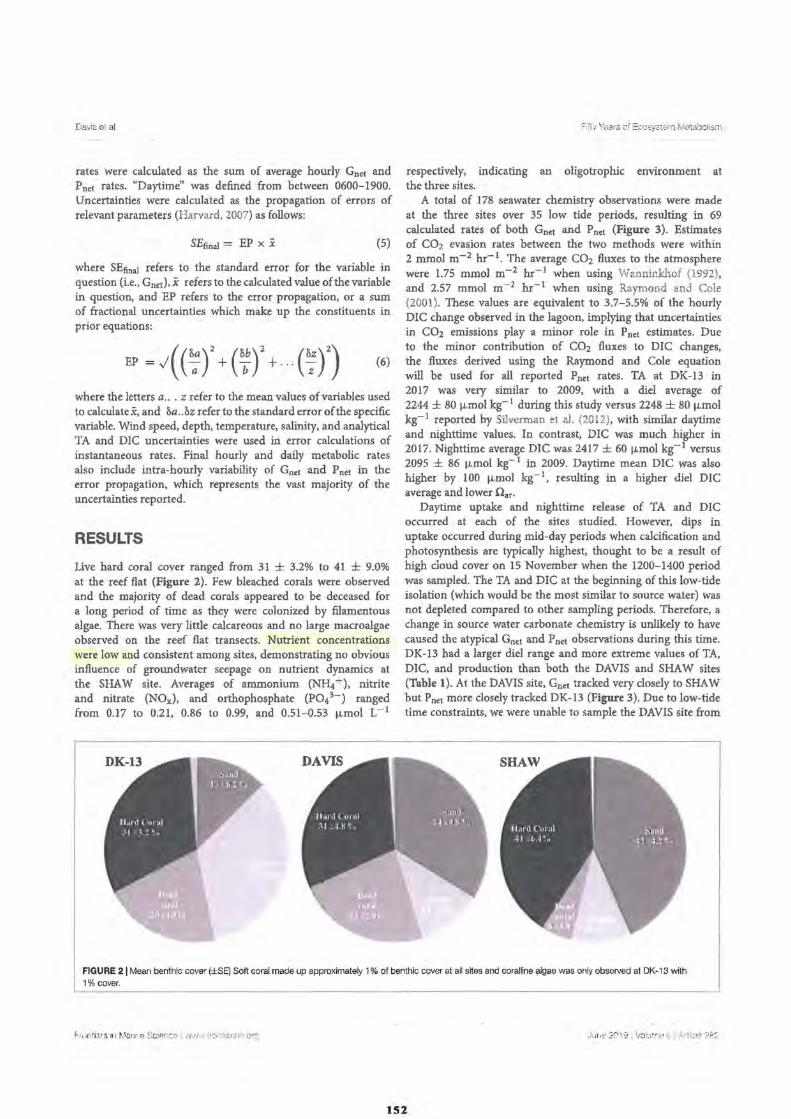
Da is et al
rates were calculated as the sum of average hourly Gnet and Pnet rates. "Daytime" was defined from between 0600-1900. Uncertainties were calculated as the propagation of errors of relevant parameters (Harvard, 2007) as follows:
S.Eiina1 = EP x .x (5)
where SEfinal refers to the standard error for the variable in question (i.e., Gne1), x refers to the calculated value of the variable in question, and EP refers to the error propagation, or a sum of fractional uncertainties which make up the constituents in prior equations:
where the letters a .. . z refer to the mean values of variables used to calculate i, and &a .. &z refer to the standard error of the specific variable. Wind speed, depth, temperature, salinity, and analytical TA and DIC uncertainties were used in error calculations of instantaneous rates. Final hourly and daily metabolic rates also include intra-hourly variability of Gnet and Pnet in the error propagation, which represents the vast majority of the uncertainties reported.
RESULTS
Live hard coral cover ranged from 31 ± 3.2% to 41 ± 9.0% at the reef flat (Figure 2). Few bleached corals were observed and the majority of dead corals appeared to be deceased for a long period of time as they were colonized by filamentous algae. There was very little calcareous and no large macroalgae observed on the reef flat transects. Nutrient concentrations were low and consistent among sites, demonstrating no obvious influence of groundwater seepage on nutrient dynamics at the SHAW site. Averages of ammonium (N~+), nitrite and nitrate (NOx), and orthophosphate (Pol-) ranged from 0.17 to 0.21, 0.86 to 0.99, and 0.51-0.53 µ,mol 1-1
Fifty Years of Ecosyst m Metabolism
respectively, indicating an oligotrophic environment at the three sites.
A total of 178 seawater chemistry observations were made at the three sites over 35 low tide periods, resulting in 69 calculated rates of both Gnet and Pnet (Figure 3). Estimates of CO2 evasion rates between the two methods were within 2 mmol m-2 hr- 1. The average CO2 fluxes to the atmosphere were 1.75 mmol m-2 hr- 1 when using Wanninkhof (1992), and 2.57 mmol m- 2 hr- 1 when using Raymond and Cole (2001). These values are equivalent to 3.7-5.5% of the hourly DIC change observed in the lagoon, implying that uncertainties in CO2 emissions play a minor role in Pnet estimates. Due to the minor contribution of CO2 fluxes to DIC changes, the fluxes derived using the Raymond and Cole equation will be used for all reported Pnet rates. TA at DK-13 in 2017 was very similar to 2009, with a diel average of 2244 ± 80 µmo) kg- 1 during this study versus 2248 ± 80 µmo) kg- 1 reported by Silverman et al. (2012), with similar daytime and nighttime values. In contrast, DIC was much higher in 2017. Nighttime average DIC was 2417 ± 60 µmol kg- 1 versus 2095 ± 86 µ,mol 1cg- 1 in 2009. Daytime mean DIC was also higher by 100 µmol kg- 1, resulting in a higher diel DIC average and lower Oar·
Daytime uptake and nighttime release of TA and DIC occurred at each of the sites studied. However, dips in uptake occurred during mid-day periods when calcification and photosynthesis are typically highest, thought to be a result of high cloud cover on 15 November when the 1200-1400 period was sampled. The TA and DIC at the beginning of this low-tide isolation (which would be the most similar to source water) was not depleted compared to other sampling periods. Therefore, a change in source water carbonate chemistry is unlikely to have caused the atypical Gnet and Pnct observations during this time. DK-13 had a larger diel range and more extreme values of TA, DIC, and production than both the DAVIS and SHAW sites (Table 1). At the DAVIS site, Gnet tracked very closely to SHAW but Pnet more closely tracked DK-13 (Figure 3). Due to low-tide time constraints, we were unable to sample the DAVIS site from
FIGURE 21 Mean benthic cover (±SE) Soft coral made up approximately 1 % of benthic cover at all sites and coralline algae was only observed at DK-13 with
1% cover.
Jt,ne 2019 I Volwne 6 I Article 282
1S2
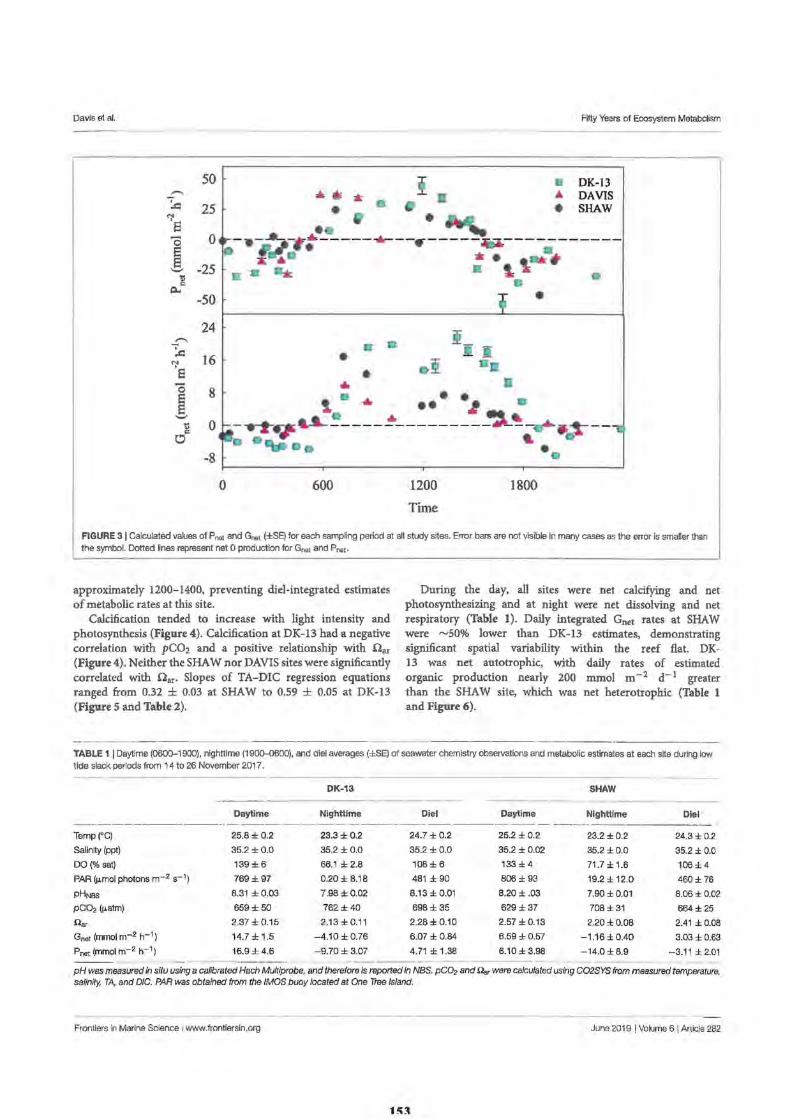
Davis et al.
50 ,-..,
-:.i:: 25
N ·s 0 l -25
'S " ,:lo;
-50
24 -;,-.., :.c
16 N ·e
l 8
0 g C,
-8 I-
0
0 • • * a
.J.. 11
• • .. •
Fifty Years of Ecosystem Metabolism
DK-13 DAVIS SHAW
•a ----- -----------...__.,. _____ ...__ __ ~ ~ . ----,... *. .a. -. ·• • • l a a Ira; 8
• i
• • I ... t . ... • •
m •• ~ - -e-t.-a-----------~----------- ~ -~ -""--~ - .. •
600 1200
Time
1800
.~--FIGURE 3 I Calculated values of Pne1 and Gnat (±SE) for each sampfing period at all study sttes. Error bars are not visible in many cases as the error is smaDer than the symbol. Dotted Ines represent net 0 production for Gnst and Pnet•
approximately 1200-1400, preventing did-integrated estimates of metabolic rates at this site.
Calcification tended to increase with light intensity and photosynthesis (Figure 4). Calcification at DK-13 had a negative correlation with pC02 and a positive relationship with ilu (Figure 4). Neither the SHAW nor DAVIS sites were significantly correlated with Oar• Slopes of TA-DIC regression equations ranged from 0.32 ± 0.03 at SHAW to 0.59 ± 0.05 at DK-13 (Figure 5 and Table 2).
----·-------·
During the day, all sites were net calcifying and net photosynthesizing and at night were net dissolving and net respiratory (Table 1). Daily integrated Gnet rates at SHAW were ~SO% lower than DK-13 estimates, demonstrating significant spatial variability within the reef flat. DK-13 was net autotrophic, with daily rates of estimated organic production nearly 200 mmol m-2 d- 1 greater than the SHAW site, which was net heterotrophic (Table 1 and Figure 6).
TABLE 1 I Daytime (0600-1900), nighttime (1900-0600), and die! averages (±SE) of seawater chemistry observations and metabolic estimates at each site during low tide slack periods from 14 to 26 November 2017.
DK-13 SHAW - - -- --
Daytime Nighttime Diel Daytime Nighttime Diel ----- ·---------- - ------
Temp("C) 25.8±0.2 23.3 ±0.2 24.7 ±0.2 25.2 ± 0.2 23.2 ±0.2 24.3 ± 0.2
Sallnlty(ppt) 35.2 ±0.0 35.2±0.0 35.2±0.0 35.2 ± 0.02 35.2 ±0.0 35.2 ± 0.0
D0(% sat) 139±6 66.1 ± 2.8 108±6 133±4 71.7 ± 1.6 106±4
PAR (µ.mol photons m-2 s- 1) 769±97 0.20±8.18 481 ± 90 806±93 19.2 ± 12.0 460± 76
PHNBS 8.31 ±0.03 7.98±0.02 8.13 ±0.01 8.20± .03 7.90 ± 0.01 8.06 ± 0.02
pC02 (µ.aim) 659±50 762±40 698 ± 35 629±37 708 ± 31 664±25
Oar 2.37 ± 0.15 2.13±0.11 2.28±0.10 2.57 ± 0.13 2.20 ± 0.08 2.41 ± 0.08
Gnst (mmol m-2 h-1) 14.7 ± 1.5 -4.10±0.76 6.07 ± 0.84 6.59 ± 0.57 -1 .16 ± 0.40 3.03 ± 0.63
Pnet (mmo1m- 2 h-1) 16.9 ± 4.6 -9.70± 3.07 4.71 ± 1.38 6.10 ± 3.98 -14.0 ± 8.9 -3.11 ±2.01 ------ ·--------
pH was measured in situ using a calibrated Hach Multiprobe, and therefore is reported In NBS. pC02 and Oar were calculated using C02SYS from measured temperature, salinity, TA, and DIC. PAR was obtained from the /MOS buoy located at One Tree Island.
Frontiers In Marine Science I www.frontiersln.org June 2019 I Volume 6 I Article 282
153
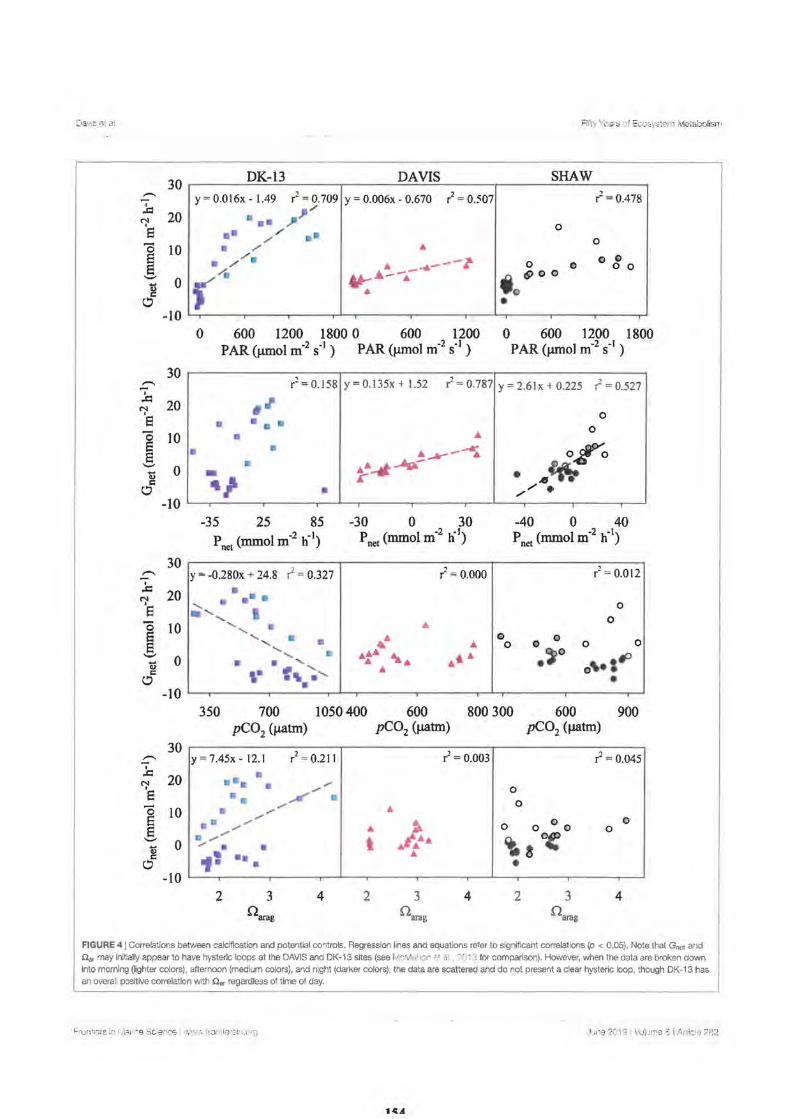
Dav1s et al.
30 ,-., "7 ..c:
20 r;i Ei - 10 0 Ei s __,
0 i
-10
30 ,-., -I ..c:
20 N I
E ] 10
E ._ 0 0
a:: C
-10
30 ,-.,
..i:: 20 N I s 0 10 § __,
0 0 a:: 0
-10
30 ,-.,
I ..c 20 N ·s - 10 l 0 0
0 -10
Fifty Years of Ecosystem Me a.bolism
DK-13 DAVIS SHAW
y = 0.0 I 6x - 1.49 r2 = 0.709 y = 0.006x - 0.670 r2
= 0.507 r2 = 0.478 ~ /
•• ,,, 0 •• / •• / 0 • / ...
• ,,.,✓• ~ ..... ----~ 0 0 0
0 0 0 /. ...,_ ... --...- (9 0 0
( j o ... •
0 600 1200 1800 0 600 1200 0 600 1200 1800 PAR (µmol m-2 s·1 ) PAR (µmo! m·2 s·1
) PAR (µmo! m-2 s-1)
r2 = 0.158 y = 0.135x + l.52 r2 = 0.787 y = 2.6lx + 0.225 r2 =0.527 _,,
0
• • • • 0 • • • • •...--~ o,ro - ...... ~ • .fJ~ ., -.
• .,,..,,. . -35 25 85 -30 0 30 -40 0 40
P l _,, -1) net(mmo m- h p net (mmol m·2 h-1) P net (mmol m·2 b"t)
y = -0.280x + 24.8 r2 = 0.327 r2 = 0.000 r2 = 0.012
• ...... • ••• 0 . ...... ..... 0 ..... • • '- ...... • • .... 0 0 0 ...... ... 0 0 0
'- • ..... 0 ..._ .... ..... ~ • • ' ... ... • o'\•S ,. r .. '- ... ...... • • 350 700
pC02 (µatm) 1050400 600 800 300 600
pC02 (µatm) 900
pC02 (µatm)
y = 7.45x - 12.1 r2 = 0.211 r2 = 0.003 r2 =0.045
•• • • ,,,,,, 0 • ,.At" / • ,,,,,, ... 0 • ,,,,,,
•• ,,,,,,
00 0 ,,,,,, ~ 0 ,,,,,, ... 0 0 ,,,,,,,,,,,,
t j...•• ~ 0~ .,,,, • • 1' •• ... ii!
• • 2 4 2 4 2 4
FIGURE 41 Correlations between calcification and potential controls. Regression lines anc equations reter to significant correlations (p < 0.05). Note that Gne1 and Oa, may initially appear to have hysteric loops at the DAVIS and OK-13 sites (see ivlcMoiion e al. ?013 for comparison). However, when the data are broken down into morning (lighter colors), afternoon (medium colors), and night (darker colors), the data are scattered and do not present a clear hysteric loop, though OK-13 has an overall positive correlation with Oa, regardless of time of day.
June 201 , I VolumEl 6 i Article ?tl2
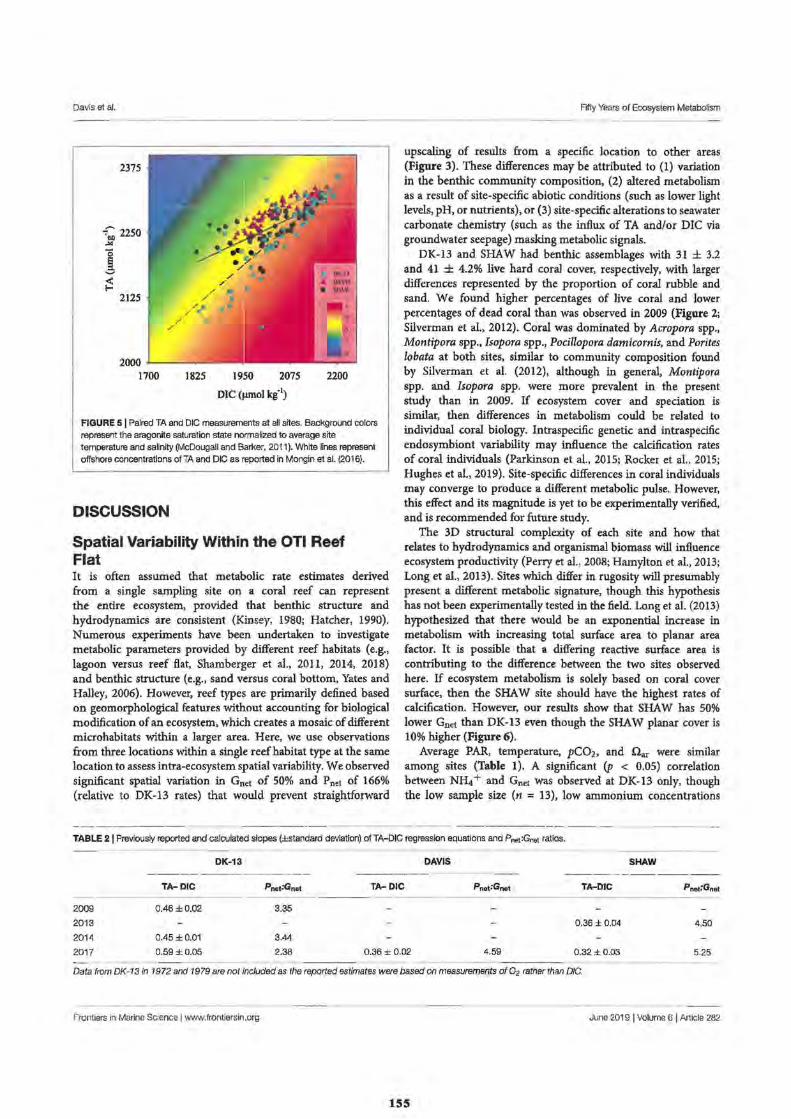
Davis et al.
2375
~ 2250 ."I
1 ;5
2125
2000 -1--------1700 1825 1950 2075 2200
DIC (µmol kg" 1)
FIGURE 5 I Paired TA and DIC measurements at ah sites. Background colors represent the aragonite saturation state normalized to average site temperature and salinity (McDougall and Barker, 2011 ). White lines represent offshore concentrations ofTA and DIC as reported in Mongin et al. (2016).
DISCUSSION
Spatial Variability Within the CTI Reef Flat It is often assumed that metabolic rate estimates derived from a single sampling site on a coral reef can represent the entire ecosystem, provided that benthic structure and hydrodynamics are consistent (Kinsey, 1980; Hatcher, 1990). Numerous experiments have been undertaken to investigate metabolic parameters provided by different reef habitats (e.g., lagoon versus reef flat, Shamberger et al., 2011, 2014, 2018) and benthic structure (e.g., sand versus coral bottom, Yates and Halley, 2006). However, reef types are primarily defined based on geomorphological features without accounting for biological modification of an ecosystem, which creates a mosaic of different microhabitats within a larger area. Here, we use observations from three locations within a single reef habitat type at the same location to assess intra-ecosystem spatial variability. We observed significant spatial variation in Gnet of 50% and Pnet of 166% (relative to DK-13 rates) that would prevent straightforward
Fifty Years of Ecosystem Metabolism
upscaling of results from a specific location to other areas (Figure 3). These differences may be attributed to (1) variation in the benthic community composition, (2) altered metabolism as a result of site-specific abiotic conditions (such as lower light levels, pH, or nutrients), or (3) site-specific alterations to seawater carbonate chemistry (such as the influx of TA and/or DIC via groundwater seepage) masking metabolic signals .
DK-13 and SHAW had benthic assemblages with 31 ± 3.2 and 41 ± 4.2% live hard coral cover, respectively, with larger differences represented by the proportion of coral rubble and sand. We found higher percentages of live coral and lower percentages of dead coral than was observed in 2009 (Figure 2; Silverman et al., 2012). Coral was dominated by Acropora spp., Montipora spp., Isopora spp., Pocillopora damicornis, and Porites lobata at both sites, similar to community composition found by Silverman et al. (2012), although in general, Montipora spp. and Isopora spp. were more prevalent in the present study than in 2009. If ecosystem cover and speciation is similar, then differences in metabolism could be related to individual coral biology. Intraspecific genetic and intraspecific endosymbiont variability may influence the calcification rates of coral individuals (Parkinson et al., 2015; Rocker et al., 2015; Hughes et al., 2019). Site-specific differences in coral individuals may converge to produce a different metabolic pulse. However, this effect and its magnitude is yet to be experimentally verified, and is recommended for future study.
The 3D structural complexity of each site and how that relates to hydrodynamics and organismal biomass will influence ecosystem productivity (Perry et al., 2008; Hamylton et al., 2013; Long et al, 2013). Sites which differ in rugosity will presumably present a different metabolic signature, though this hypothesis has not been experimentally tested in the field. Long et al. (2013) hypothesized that there would be an exponential increase in metabolism with increasing total surface area to planar area factor. It is possible that a differing reactive surface area is contributing to the difference between the two sites observed here. If ecosystem metabolism is solely based on coral cover surface, then the SHAW site should have the highest rates of calcification. However, our results show that SHAW has 50% lower Gnet than DK-13 even though the SHAW planar cover is 10% higher (Figure6).
Average PAR, temperature, pC02, and ilar were similar among sites (Table 1). A significant (p < 0.05) correlation between NI¼+ and Gnet was observed at DK-13 only, though the low sample size (n = 13), low ammonium concentrations
---- ---------TABLE 21 Previously reported and calculated slopes (±standard deviation) ofTA-DIC regression equations and Pnet :Gnet ratios.
DK-13 DAVIS SHAW -----
TA-DIC Pne1:Gne1 TA-DIC TA-DIC
2009 0.46±0.02 3.35
2013 0.36 ± 0.04 4.50
2014 0.45 ±0.01 3.44
2017 0.59±0.05 2.38 0.36 ±0.02 4.59 0.32±0.03 5.25 -------
Data from DK-13 in 1972 and 1979 are not included as the reported estimates were based on measurements of 0 2 rather than DIC.
Frontiers in Marine Science I www.frontiersin.org June 2019 I Volume 6 I Article 282
155
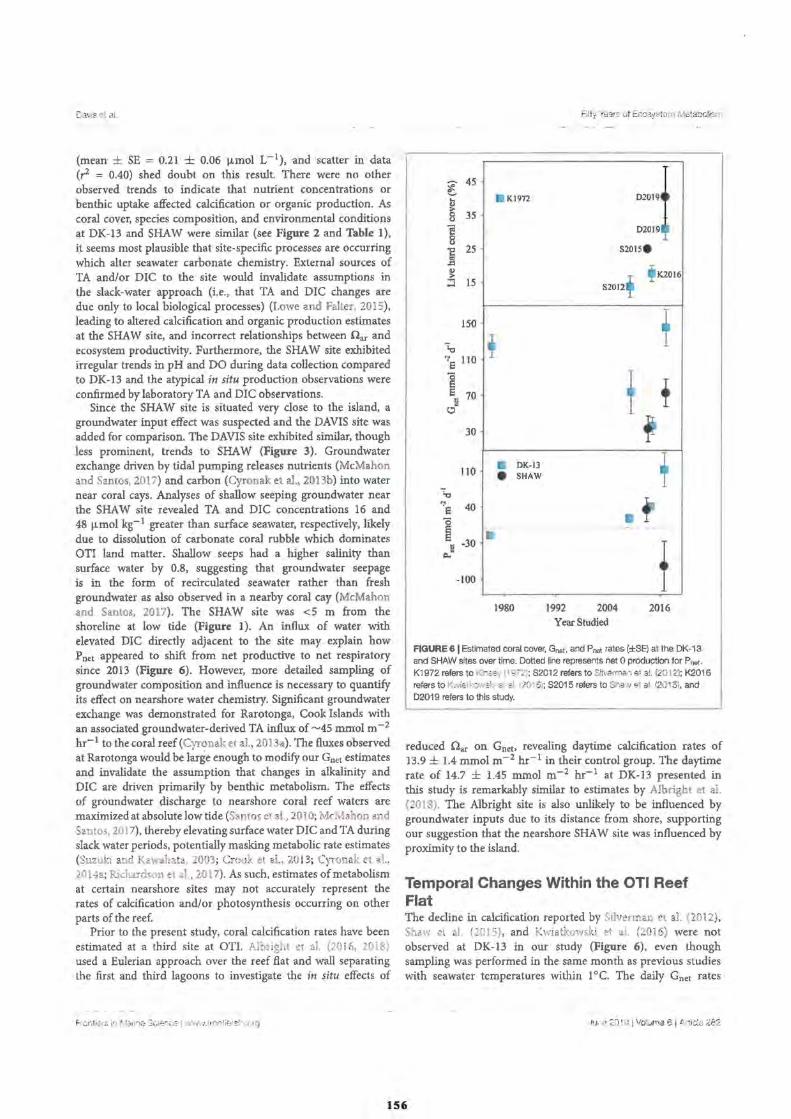
Davise! I.
(mean ± SE = 0.21 ± 0.06 µ,mol 1-1 ), and scatter in data (r2 = 0.40) shed doubt on this result. There were no other observed trends to indicate that nutrient concentrations or benthic uptake affected calcification or organic production. As coral cover, species composition, and environmental conditions at DK-13 and SHAW were similar (see Figure 2 and Table I), it seems most plausible that site-specific processes are occurring which alter seawater carbonate chemistry. External sources of TA and/or DIC to the site would invalidate assumptions in the slack-water approach (i.e., that TA and DIC changes are due only to local biological processes) (Lowe and Falter, 2015), leading to altered calcification and organic production estimates at the SHAW site, and incorrect relationships between Oar and ecosystem productivity. Furthermore, the SHAW site exhibited irregular trends in pH and DO during data collection compared to DK-13 and the atypical in situ production observations were confirmed by laboratory TA and DIC observations.
Since the SHAW site is situated very close to the island, a groundwater input effect was suspected and the DAVIS site was added for comparison. The DAVIS site exhibited similar, though less prominent, trends to SHAW (Figure 3). Groundwater exchange driven by tidal pumping releases nutrients (McMahon and Santos, 2017) and carbon (Cyronak et al., 2013b) into water near coral cays. Analyses of shallow seeping groundwater near the SHAW site revealed TA and DIC concentrations 16 and 48 µ,mol kg- 1 greater than surface seawater, respectively, likely due to dissolution of carbonate coral rubble which dominates OTI land matter. Shallow seeps had a higher salinity than surface water by 0.8, suggesting that groundwater seepage is in the form of recirculated seawater rather than fresh groundwater as also observed in a nearby coral cay (McMahon and Santos, 2017). The SHAW site was <5 m from the shoreline at low tide (Figure 1). An influx of water with elevated DIC directly adjacent to the site may explain how Pnet appeared to shift from net productive to net respiratory since 2013 (Figure 6). However, more detailed sampling of groundwater composition and influence is necessary to quantify its effect on nearshore water chemistry. Significant groundwater exchange was demonstrated for Rarotonga, Cook Islands with an associated groundwater-derived TA influx of ~45 mm:ol m-2
hr-1 to the coral reef(Cyronak et al. , 2013a). The fluxes observed at Rarotonga would be large enough to modify our Gnet estimates and invalidate the assumption that changes in alkalinity and DIC are driven primarily by benthic metabolism. The effects of groundwater discharge to nearshore coral reef waters are maximized at absolute low tide (Santos et al., 201 O; McMahon and Santos, 2017), thereby elevating surface water DIC and TA during slack water periods, potentially masking metabolic rate estimates (Suzuki and Kawahata, 2003; Crook el al., 20 13; Cyronak et al., 2014a; Richardson et al., 2017). As such, estimates of metabolism at certain nearshore sites may not accurately represent the rates of calcification and/or photosynthesis occurring on other parts of the reef.
Prior to the present study, coral calcification rates have been estimated at a third site at OTI. Albtight et al. (20 l fi, 2018) used a Eulerian approach over the reef flat and wall separating the first and third lagoons to investigate the in situ effects of
Fi ly Years ot Ecosystem Metabolism
~ 45 e...
Kl972
="f ~ 0 35 "' f D2019
8 s201se ] 25 .c
' 1<2016 ~ :.:J 15 S2012
150 f -1.c + ':'E 110
l 70 f + ~ c:,
30
110 DK-13 f • SHAW
lo ':'e 40 0 • ~ -30
f tl , .. t
-100
1980 1992 2004 2016 Year Studied
FIGURE 6 I Estimated coral cover, Gnat, and Pnet rates (±SE) at the DK-13 and SHAW sites over time. Dotted line represents net 0 production for P081 .
K1972 refers to Kinsey (1972); S2C12 refers to Silverman et al. (2012); 1<2016 refers to Kwiatkowski et al. (2016); S2015 refers to Shaw et al. (2015), and D2019 refers to this study.
reduced Oar on Gnet, revealing daytime calcification rates of 13.9 ± 1.4 mmol m-2 hr- 1 in their control group. The daytime rate of 14.7 ± 1.45 mmol m-2 hr- 1 at DK-13 presented in this study is remarkably similar to estimates by Albright et al. (2018). The Albright site is also unlikely to be influenced by groundwater inputs due to its distance from shore, supporting our suggestion that the nearshore SHAW site was influenced by proximity to the island.
Temporal Changes Within the OTI Reef Flat The decline in calcification reported by Silverman 1•t al. (2012), Shaw et al. (2015), and Kwiatkowski et al. (2016) were not observed at DK-13 in our study (Figure 6), even though sampling was performed in the same month as previous studies with seawater temperatures within l °C. The daily Gnet rates
156
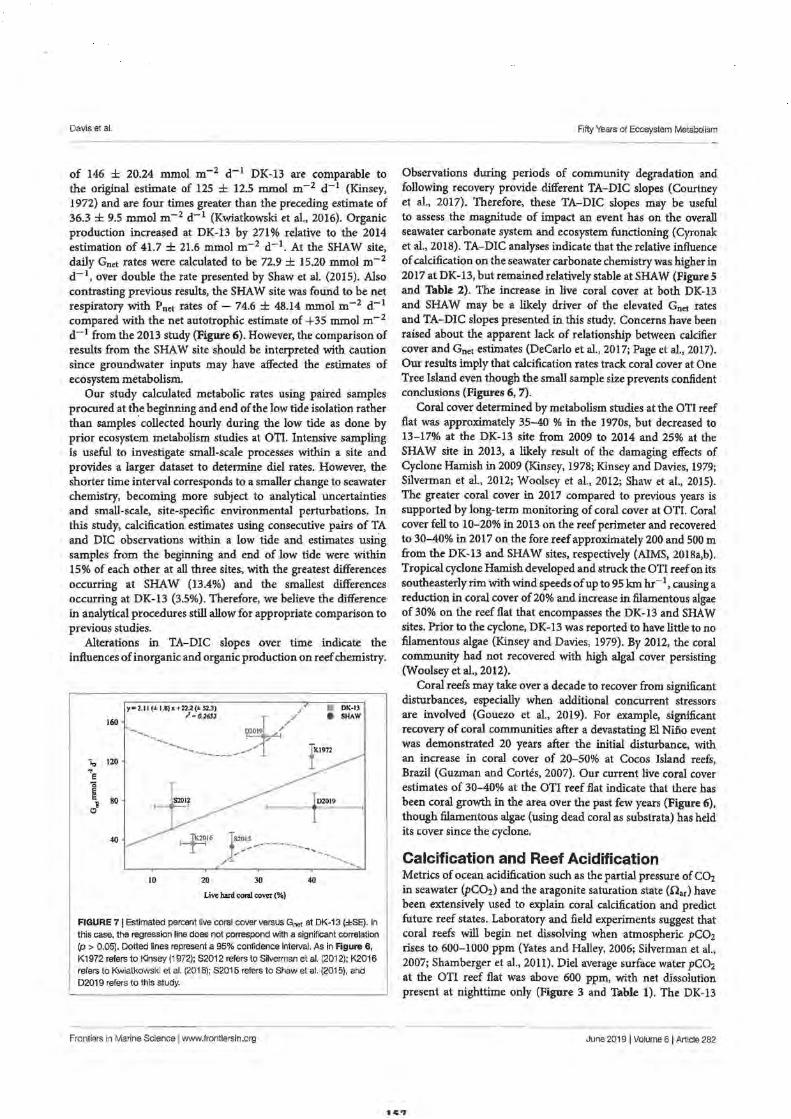
Davis et al.
of 146 ± 20.24 mmol m-2 d-1 DK-13 are comparable to the original estimate of 125 ± 12.5 mmol m-2 d- 1 (Kinsey, 1972) and are four times greater than the preceding estimate of 36.3 ± 9.5 mmol m- 2 d- 1 (Kwiatkowski et al., 2016). Organic production increased at DK-13 by 271 % relative to the 2014 estimation of 41.7 ± 21.6 mmol m-2 d-1. At the SHAW site, daily Gnet rates were calculated to be 72.9 ± 15.20 mmol m-2
d-1, over double the rate presented by Shaw et al. (2015). Also contrasting previous results, the SHAW site was found to be net respiratory with Pnet rates of - 74.6 ± 48.14 mmol m-2 d- 1
compared with the net autotrophic estimate of +35 mmol m-2
d- 1 from the 2013 study (Figure 6). However, the comparison of results from the SHAW site should be interpreted with caution since groundwater inputs may have affected the estimates of ecosystem metabolism.
Our study calculated metabolic rates using paired samples procured at the beginning and end of the low tide isolation rather than samples· collected hourly during the low tide as done by prior ecosystem metabolism studies at OTI. Intensive sampling is useful to investigate small-scale processes within a site and provides a larger dataset to determine diel rates. However, the shorter time interval corresponds to a smaller change to seawater chemistry, becoming more subject to analytical uncertainties and small-scale, site-specific environmental perturbations. In this study, calcification estimates using consecutive pairs of TA and DIC observations within a low tide and estimates using samples from the beginning and end of low tide were within 15% of each other at all three sites, with the greatest differences occurring at SHAW (13.4%) and the smallest differences occurring at DK-13 (3.5%). Therefore, we believe the difference in analytical procedures still allow for appropriate comparison to previous studies.
Alterations in TA-DIC slopes over time indicate the influences of inorganic and organic production on reef chemistry.
160
-.., 120
"e 1 80 o"
40
y=2.II (± l.8)>+22.2(±52.3) /
l=0.2652 :t"/ -, .... _ , 019 / _________________ ..,,..,,..
S2012
20 30
Live hard coral cover(%)
40
■ DK-13 • SHAW
D2019
FIGURE 7 I Estimated percent live coral cover versus Gnat at DK-13 (±SE). In this case, the regression line does not porrespond with a significant correlation
(p > 0.05). Dotted lines represent a 95% confidence Interval. As in Figure 6, K1972 refers to Kinsey (1972); S2012 refers to Silverman et al, (2012); K2016
refers to Kwiatkowski et al. (2016); S2015 refers to Shaw et al. (2015), and
D2019 refers to this study.
Frontiers in Marine Science I www.frontiersin.org
Fifty Years of Ecosystem Metabolism
Observations during periods of community degradation and following recovery provide different TA-DIC slopes (Courtney et al., 2017). Therefore, these TA-DIC slopes may be useful to assess the magnitude of impact an event has on the overall seawater carbonate system and ecosystem functioning (Cyronak et al., 2018). TA-DIC analyses indicate that the relative influence of calcification on the seawater carbonate chemistry was higher in 2017 at DK-13, but remained relatively stable at SHAW (Figure 5 and Table 2). The increase in live coral cover at both DK-13 and SHAW may be a likely driver of the elevated Gnet rates and TA-DIC slopes presented in this study. Concerns have been raised about the apparent lack of relationship between calcifier cover and Gnet estimates (DeCarlo et al., 2017; Page et al., 2017). Our results imply that calcification rates track coral cover at One Tree Island even though the small sample size prevents confident conclusions (Figures 6, 7).
Coral cover determined by metabolism studies at the OTI reef flat was approximately 35-40 % in the 1970s, but decreased to 13-17% at the DK-13 site from 2009 to 2014 and 25% at the SHAW site in 2013, a likely result of the damaging effects of Cyclone Hamish in 2009 (Kinsey, 1978; Kinsey and Davies, 1979; Silverman et al., 2012; Woolsey et al., 2012; Shaw et al., 2015). The greater coral cover in 2017 compared to previous years is supported by long-term monitoring of coral cover at OTI. Coral cover fell to 10-20% in 2013 on the reef perimeter and recovered to 30-40% in 2017 on the fore reef approximately 200 and 500 m from the DK-13 and SHAW sites, respectively (AIMS, 2018a,b). Tropical cyclone Hamish developed and struck the OTI reef on its southeasterly rim with wind speeds of up to 95 km hr-1, causing a reduction in coral cover of 20% and increase in filamentous algae of30% on the reef flat that encompasses the DK-13 and SHAW sites. Prior to the cyclone, DK-13 was reported to have little to no filamentous algae (Kinsey and Davies, 1979). By 2012, the coral community had not recovered with high algal cover persisting (Woolsey et al., 2012).
Coral reefs may take over a decade to recover from significant disturbances, especially when additional concurrent stressors are involved (Gouezo et al., 2019). For example, significant recovery of coral communities after a devastating El Nifio event was demonstrated 20 years after the initial disturbance, with an increase in coral cover of 20-50% at Cocos Island reefs, Brazil (Guzman and Cortes, 2007). Our current live coral cover estimates of 30-40% at the OTI reef flat indicate that there has been coral growth in the area over the past few years (Figure 6), though filamentous algae (using dead coral as substrata) has held its cover since the cyclone.
Calcification and Reef Acidification Metrics of ocean acidification such as the partial pressure of CO2
in seawater (pCO2) and the aragonite saturation state (Oar) have been extensively used to explain coral calcification and predict future reef states. Laboratory and field experiments suggest that coral reefs will begin net dissolving when atmospheric pC02
rises to 600-1000 ppm (Yates and Halley, 2006; Silverman et al., 2007; Shamberger et al., 2011). Diel average surface water pC02
at the OTI reef flat was above 600 ppm, with net dissolution present at nighttime only (Figure 3 and Table 1). The DK-13
----~-----June 2019 I Volume 6 I Article 282
Davis et al.
site had the highest pC02, with a maximum value of 1534 ppm versus a maximum of 1000 ppm at the SHAW site (Figure 4). The CO2 concentrations observed here are higher than most other coral reefs studied (Cyronak et al., 2014b), but have been consistent over the past decade, with Silverman et al. (2012) reporting a diel average of 591 ± 288 ppm and a maximum pC02 of 1697 ppm, which occurred during the day. There is the commonly observed, albeit noisy, negative trend between Gnet and pC02 at the DK-13 site only (Figure 4), though this correlation may not be representative of the processes driving Gnet at One Tree Island. Several investigations suggest that the effects of CO2 and/ or ilar on calcification is not necessarily causal (Anthony et al. , 2011; Comeau et al., 2018; McMahon et al., 2018).
In contrast, the relatively high CO2 concentrations and low ilar here may be a product of calcification itself (Gattuso et al., 1996; Jokiel et al., 2014). Cyronak et al. (2014b) developed a model using metabolic data from nearby Heron Island to examine how coral ecosystems modify the pC02 of their surrounding waters. Increasing calcification by 10% from a "baseline" rate will increase in situ CO2 by 12 µatrn, which could explain the increase in die! pC02 at DK-13 from 591 ± 288 in 2009 to 698 ± 49.6 in 2017 concurrent with an increase in calcification of 84% since 2009 (Table 1). Longhini et al. (2015) also observed high pC02 in coral reef flat waters in Brazil even though the ecosystem is net productive and no external sources were located. The authors concluded that the carbonate chemistry of reef waters during daytime low tide is related to ( 1) super-saturation of CO2 at high tide during the previous night, and (2) net calcification occurring in nearby waters, which may also be the mechanisms driving high CO2 observed in this study. We highlight that our CO2 values are averaged over low tide periods only, and total diel CO2 may differ as offshore water flowing over the reef flat during high tide is likely to lower local CO2 concentrations.
Previously, Gnet at the OT! reef flat has been significantly correlated with ilar (Shaw et al., 2015). Our results indicate only weak associations between Gnet and ilar at one site, with no clear influence presented at either of the other sites (Figure 4). Net dissolution was predicted to occur at the OTI reef flat when ilar fell to ~2.5 (Shaw et al. , 2015). The die! ilar average during this study of 2.28 and 2.41 at DK-13 and SHAW, respectively, correspond with the highest observed Gnet rates ever estimated at these sites (Figure 6). Among all sites, Oar only elevated above the reported dissolution threshold during the daytime at SHAW with an average of 2.57 (Table 1). However, we found no significant correlation between ilar and Gnet at the SH.AW site (Figure 4). Hysteresis in the relationship between the effect on calcification of co-varied light, temperature, Pnet and n., has been observed at nearby Heron Island (McMahon et al., 2013; Albright et al., 2015). Here, Gnet closely tracked Pnet throughout the entire diel cycle (Figure 3), and hysteresis was not observed at SHAW or DK-13 when calcification and n., were split into morning, afternoon, and nightly time frames. Net dissolution only occurred when PAR was negligible and when Pnet was <0, as observed elsewhere (M~Mahon et al. , 2013; Muehllehne1 et al. , 2016). Therefore, changes in ilar as a result of Pnet shifting carbonate equilibria were not the driver of calcification at
Fifly Years of Ec.osystem Metabolisni
these sites as previously demonstrated in mesocosm experiments (Jokiel et al., 2014).
If we use the regression equation describing the relationship between calcification and ilar at DK-13 (Figure 4), a net dissolution threshold value of 1.20-1.62 would be estimated. This is lower than previous estimates for the southern GBR and similar to predictions made for Hawaiian coral reefs (see McMahon et al., 2013; Table I, and Shamberger et al. , 2011, respectively). Since the 2009 study at OTI, diel !lar has fallen by an average of ~29%, with a disproportionate influence on daytime ilar {37.6% lower versus 12.8% lower at nighttime in 2017), yet daytime calcification has increased and nighttime dissolution has decreased in relation to Silverman et al. (2014). Results from the 2014 study at DK-13 indicate that ilar only weakly influences short-term variabilities in calcification estimates at DK-13 (Kwiatkowski et .tl., 2016), supporting our new results obtained in 2017.
Andersson and Gledhill (2013), McMahon et al. (2013), and Cyronak et al. (2015) caution against using linear il0,-Gnet relationships solely to predict bottom-up ecosystem collapse via coral dissolution, as many factors contribute to influence metabolic rates. For example, water residence times and light availability may more accurately and consistently predict calcification rates in coral reefs (Demicco and Hardie, 2002; Falter et al., 2013). The variability in reported impacts of ocean acidification and warming highlights the importance of taking the magnitude of stress and interactive factors into consideration when predicting future reef calcification (Komder et al., 2018). Multiple factors, such as increased coral cover and/or external TA sources, may have driven the increase in calcification at OT!, which offset the proposed negative effects of declining aragonite saturation states.
The increase in coral cover is the most likely cause of the elevated calcification rates during the day (Page et al., 20 I 7; Figure 7), yet the cause of the de-coupled relationship between Gnet and ilar and the underlying mechanism of coral growth remains unclear. Recovery of the benthic community after severe storms in the last two decades would be expected, but reduced n., should have inhibited this recovery. However, examples of coral reefs thriving and even recovering in low ilar are not uncommon ( Guzman and Cortes, 2007; Sham berger et al., 2011 ). Coral reefs in areas of Palau sustain a high coral cover regardless of waters having average pCO2 of > 1400 ppm and !lar < 3 (Camp et al., 2017). Since the methodologies, interpretation, and geochemical conditions were similar between our study and the previous studies at OTI, predictions of long term Gnet based on short term Gnet and n., correlations are likely invalid for this reef flat in line with the early suggestion by Andersson and Gledhill {201 3). Long-term estimates of calcification and a clearer understanding about the role of local processes would be required to make predictions on when coral reefs may become net dissolving.
Comparisons to Other Reefs Gnet at DK-13 was within the range of estimates produced from nearby islands in the southern GBR. Calcification rates at Lady Elliot Island ranged from 73 mmol m- 2 d- 1 in summer to
June ?O 19 I Volu<ne 6 i Anic-lP 21:l?
Davis et al.
123 mmol m-2 d- 1 during winter, with ~ 40% coral cover (Shaw et al., 2012, 2016). Gnet around Heron Island is estimated to be ~160 mmol m-2 d-1 during autumn. Both of these studies collected data using low-tide slack water sampling on reef flats (Shaw et al., 2012; McMahon et aL, 2018). Pnet at the Heron Island reef flat in 2014 was estimated to be ~585 mmol m-2 d-1, much higher than our estimates for OTI. However, the Heron Island lagoon in autumn of 2012 was net respiratory, with Pnet estimates of -6 mmol m-2 d- 1
(Albright et al., 2015), indicating high variability between reef types. The differences in benthic metabolism around OTI and Heron Island are apparent in metrics often used to determine the relative control that organic and inorganic productivity have on the carbonate system. The organic to inorganic production ratio (Pne1: Gnet ) around Heron Island of 3.65-4.0 (McMahon et al., 2013; Albright et al., 2015, respectively) compared with 2.38 at DK-13 is reflected in the relatively lower TA-DIC slope (0.33 versus 0.59, respectively), indicating that these two ecosystems differ in their benthic functioning, despite being less than 20 km apart. Our results show that organic production is responsible for 70.5% of the changes in DIC at OTI (Table 2). This value falls well within the range of 32-88% reported for all coral reefs that have been studied using similar approaches, though it is on the low end for reefs in the Great Barrier Reef Marine Park and the larger Indo-Pacific region (Cyronak et aL, 2018). ·
Calcification estimates have declined since the 1970s in the northern GBR, Hawai'i, and southern GBR (prior to this study). Gnet has dropped 46% around Lizard Island and 40% at Kane' ohe Bay from 1977 to 2009 (Kinsey, 1980; Shamberger et al., 2011; Silverman et al., 2014), and calcification at OTI dropped 70% from 1975 to 2014 (Kinsey, 1977; Kwiatkowski et al., 2016; Figure 6). Field results support ocean acidification and bleaching predictions for ecosystem metabolism in a changing ocean (Watanabe et al., 2006; Albright et al., 2016, 2018). However, caution should be used when employing short-term datasets to predict long-term variability in benthic structure and productivity, especially if those datasets used different methodologies over different seasons or sites (Falter et al., 2001; Courtney et al., 2016). Observations made by Kinsey in the 1970s provide seasonal and annual estimates at each of the three locations mentioned above. However, the more recent studies around Lizard Island and in Kane' ohe Bay were performed over a period of a few days in a season. Estimates at OTI in the 1970s included 36 estimates from November-January (Kinsey, 1980), the 2009 study included 59 estimates (Silverman et al., 2012), in 2014 the use of autosamplers provided 273 estimates (Kwiatkowski et al., 2016), and our study provides 69 estimates. The more recent studies use longer collection periods over consecutive days to allow for overlaps in sample times and more certainty in estimated metabolic rates. The major short-term variability and the lack of continous, long-term datasets prevent the
Frontiers in Marine Science I www.frontiersin.org
Fifty Years of Ecosystem Metabolism
separation of overlapping drivers over time scales of hours, days, seasons, and decades, supporting claims by Falter et al. (2001). Though we have confidence that the rates reported here and in previous studies are representative of the specific time period being sampled, short-term datasets may not provide the information necessary to predict long-term changes in reef ecosystem functioning.
CONCLUSION
The OTI reef has had sporadic ecosystem metabolism studies in the last 50 years. We report relatively high calcification at the OTI reef flat in 2017 compared to earlier observations. We also highlight the natural spatial variability within estimated rates of ecosystem metabolism using seawater carbonate chemistry analyses and that care should be taken when comparing study results across sites within an ecosystem. The understanding we have of coral reef calcification .rates is often based on an assumption that investigations capture the main drivers of short- and long-term variability within the benthic community, and that linkages between Gnet, Oar, and atmospheric CO2 are well established. Nonetheless, our data compared to earlier work implies that sporadic short-term datasets may not necessarily be used to represent long-term trends in coral reef calcification. Our capacity to understand the underlying mechanisms of ecosystem metabolism and predict future reef states will require us to continue building detailed and uninterrupted longer-term datasets that can separate drivers and rates occurring on time scales of hours to decades.
AUTHOR CONTRIBUTIONS
KD, BK, and IS designed and planned the study. All authors contributed to data collection and fieldwork. KD and AM processed samples in the laboratory. KD and ES assisted with data calculations and comparisons to prior studies. KD and IS were the primary writers of the manuscript with additions and edits offered by the remainder of the authors.
FUNDING
Field work and analytical instrumentation were funded by the Australian Academy of Science and the Australian Research Council (FT170100327, LE170100007, and LE120100156).
ACKNOWLEDGMENTS
We thank the staff at One Tree Island Research Station, James Archibald and Tom Glaze, for support during field investigations, and Kai Schulz for support with DIC analyses.
June 2019 I Volume 6 I Article 282
15'
Davis ei al
REFERENCES
AIMS (2018a). Ot1eTreeIS Reef Available at: http://data.aims.gov.au/reefpage2/ rpdetail.jsp?fullReetlD=23055S&sampleType=VPOJNT (accessed September, 2018).
AIMS (2018b). One Tree Reef Monitoring. Available at: http://apps.aims.gov.au/ reef-monitoringlreef/23055S (accessed September 2018)
Albright, R., Benthuysen, J., Cantin, N., Caldeira, K., and Anthony, K. (2015). Coral reef metabolism and carbon chemistry dynamics of a coral reef flat. Geophys. Res. Lett. 42, 3980-3988. doi: 10.1002/2015gl063488
Albright, R., Caldeira, L., Hosfelt, ]., Kwiatkowski, L., Maclaren, J. K., Mason, B. M., et al. (2016). Reversal of ocean acidification enhances net coral reef calcification. Nature 531, 362-365. doi: 10.1038/naturel7155
Albright, R., Langdon, C., and Anthony, K. (2013). Dynamics of seawater carbonate chemistry, production, and calcification of a coral reef flat, central Great Barrier Reef. Biogeosciences 10, 6747-6758. doi: 10.5194/bg-10-6747-2013
Albright, R., Takeshita, Y., Koweek, D. A., Ninokawa, A., Wolfe, K., Rivlin, T., et al. (2018). Carbon dioxide addition to coral reef waters suppresses net community calcification. Nature 555, 516-519. doi: 10.J038/nature25968
Andersson, A.}., and Gledhill, D. (2013). Ocean acidification and coral reefs: effects on breakdown, dissolution, and net ecosystem calcification. Ann. Rev. Mar. Sci. 5, 1-28.
Anthony, K. R., Kleypas, J. A., and Gattuso, J.P. (2011). Coral reefs modify their seawater carbon chemistry-implications for impacts of ocean acidification. Glob. Change Biol. 17, 3655-3666. doi: 10.llil/j.1365-2486.2011.02510.x
Atkinson, M. }., and Falter, J. L. (2003). Coral Reefs. Biogeod,emistry of marine systems. Oxford: Blackwell.
Borges, A. V., and Gypens, N. (2010). Carbonate chemistry in the coastal zone responds more strongly to eutrophication than ocean acidification. Limnol. Oceanogr. 55, 346-353. doi: 10.4319/lo.2010.55.1.0346
Call, M., Schulz, K. G., Carvalho, M. C., Santos, I. R., and Maher, D. T. (2017). Coupling infrared gas analysis and cavity ring down spectroscopy for autonomous, high-temporal-resolution measurements of DIC and &13C-DIC. Biogeosciences 14, 1305-1313. doi: 10.5194/bg-14-1305-2017
Camp, E. F., Nitschke, M. R., Rodolfo-Metalpa, R., Houlbreque, F., Gardner, S. G., Smith, D. J., et al. (2017). Reef-building corals thrive within hot-acidified and deoxygenated waters. Sd. Rep. 7:2434. doi: 10.1038/s41598-017-02383-y
Comeau, S., Cornwall, C. E., Decarlo, T. M., Krieger, E., and McCulloch, M. T. (2018). Similar controls on calcification under ocean acidification across unrelated coral reeftaxa. Glob. Change Biol. 24, 4857-4868. doi: 10.1111/gcb. 14379
Courtney, T., De Carlo, E., Page, H., Bahr, K., Barro, A., Howins, N., et al. (2017). Recovery of reef-scale calcification following a bleaching event in Kane'ohe Bay, Hawai'i. Limnol. Oceanogr. Lett. 3, 1-9. doi: I0.1002/lol2.10056
Courtney, T. A., Andersson, A. J., Bates, N. R., Collins, A., Cyronak, T., De Putron, S. )., et al. (2016). Comparing chemistry and census-based estimates of net ecosystem calcification on a rim reef in Bermuda. Front. Mar. Sci. 3:181. doi: 10.3389/fmars.2016.00181
Crook, E. D., Cohen, A. L., Rebolledo-Vieyra, M., Hernandez. L., and Paytan, A. (2013). Reduced calcification and lack of acclimatization by coral colonies growing in areas of persistent natural acidification. Proc. Natl. Acad. Sci. 110, 11044-11049. doi: I0.1073/pnas.1301589110
Cyronak, T., Andersson, A. J., Langdon, C., Albright, R., Bates, N. R .. Caldeira, K., et al. (2018), Taking the metabolic pulse of the world's coral reefs. PLoS One
13:e0190872. doi: 10.1371/journal.pone.0190872 Cyronak, T., Santos, I. R., Erler, D. V., and Eyre, B. D. (2013a). Groundwater and
porewater as major sources of alkalinity to a fringing coral reef lagoon (Muri Lagoon, Cook Islands). Biogeosciences 10, 2467-2480. doi: 10.5194/bg- 10-2467-2013
Cyronak, T., Santos, I. R., McMahon, A., and Eyre, B. D. (2013b). Carbon cycling hysteresis in permeable carbonate sands over a die] cycle: implications for ocean acidification. Limno/. Oceanogr. 58, 131-143. doi: 10.4319/lo.2013.58.1.0131
Cyronak, T., Santos, I. R., Erler, D. V., Maher, D. T., and Eyre, B. D. (2014a). Drivers of pCO2 variability in two contrasting coral reef lagoons: the influence of submarine groundwater discharge. Glob. Biogeochem. Cycles 28, 398-414. doi: 10.1002/2013gb004598
Cyronak, T., Schulz, K. G., Santos, I. R., and Eyre, B. D. (2014b) . Enhanced acidification of global coral reefs driven by regional biogeochemical
Fifty Y ar of Ecosystem Me.abo!is1,
feedbacks. Geophys. Res. Lett. 41, 5538-5546. doi: 10.1002/2014gl06 0849
Cyronak, T., Schulz, K. G., and Jok.iel, P. L. (2015). The Omega myth: what really drives lower calcification rates in an acidifying ocean. ICES J. Mar. Sci. 73, 558-562. doi: 10.1093/icesjms/fsv075
DeCarlo, T. M., Cohen, A. L., Wong, G. T., Shiah, F. K., Lentz, S. J., Davis, K. A., et al. (2017). Community production modulates coral reef pH and the sensitivity of ecosystem calcification lo ocean acidification. /. Geophys. Res. Oceans 122, 745-761. doi: 10.!002/2016jc012326
Demicco, R. V., and Hardie, L. A. (2002). The "carbonate factory'' revisited: a reexamination of sediment production functions used to model deposition on carbonate platforms. /. Sediment. Res. 72, 849-857. doi: 10.1306/041502720849
Dickson, A. G., Sabine, C. L., and Christian, ). R. (2007). Guide to Best Practices For Ocean CO2 Measurements. Sidney, BC: North Pacific Marine Science Organization.
Eyre, B. D., and Ferguson, A. J.P. (2005). Benthic metabolism and nitrogen cycling in a subtropical east Australian estuary (Brunswick): temporal variability and controlling factors. Limnol. Oceanogr. 50, 86-96.
Falter, J. L., Atkinson, M. )., and Langdon, C. (2001). Production-respiration relationships al different timescales within the Biosphere 2 coral reef biome. Limnol. Oceanogr. 46, 1653-1660. doi: 10.43!9/lo.2001.46.7.1653
Falter, J. L., Lowe, R. J., Zhang, Z., and McCulloch, M. (2013). Physical and biological controls on the carbonate chemistry of coral reef waters: effects of metabolism, wave forcing, sea level, and geomorphology. PLoS One 8:e53303. doi: I0.1371/joumal.pone.0053303
Gattuso, J. P., Frankignoulle, M., and Smith, S. V. (1999). Measurement of community metabolism and significance in the coral reef CO2 source-sink debate. Proc. Natl. Acad. Sci. U.S.A. 96, 1317-1322.
Gattuso, ). P., Pichon, M., Delesalle, B., Canon, C., and Frankignoulle, M. (1996). Carbon fluxes in coral reefs. I. Lagrangian measurement of community metabolism and resulting air-sea CO2 disequilibrium. Mar. Ecol. Prag. Ser. 145, 109-121. doi: 10.3354/mepsl45109
Gouezo, M., Golbuu, Y., Fabricius, K., Olsudong, D., Mereb, G., Nestor, V., et al. (2019). Drivers of recovery and reassembly of coral reef communities. Proc. R Soc. B 286:20182908. doi: 10.1098/rspb.2018.2908
Guzman, H. M., and Cortes, J. (2007). Reef recovery 20 years after the 1982-1983 El Niiio massive mortality. Mor. Biol. 151, 401-411. doi: I0.1007/s00227-006-0495-x
Hamylton, S. M., Pescud, A., Leon, J. X., and Callaghan, D. P. (2013). A geospatial assessment of the relationship between reef flat community calcium carbonate production and wave energy. Coral Reefs 32, 1025-1039. doi: 10.1007/s00338-013-1074-5
Harvard (2007). A Summary of Error Propagation. Cambridge, MA: Harvard University Press.
Hatcher, B. G. (1990). Coral reef primary productivity. A hierarchy of pattern and process. Trends Ecol. Evol. 5, 149-155. doi: I0.1016/0169-5347{90) 90221-X
Ho, D. T., Law, C. S., Smith, M. J., Schlosser, P., Harvey, M., and Hill, P. (2006). Measurements of air-sea gas exchange at high wind speeds in the Southern Ocean: implications for global parameterizations. Geophys. Res. Lett. 33:L1661 l.
Hughes, T., Kerry, }., and Simpson, T. (2018). Large-scale bleaching of corals on the Great Barrier Reef. Ecology 99, 501-501. doi: 10.1002/ecy.2092
Hughes, T. P., Kerry, J. T., Connolly, S. R., Baird, A.H., Eakin, C. M., Heron, S. F., et al. (2019). Ecological memory modifies the cumulative impact of recurrent climate extremes. Nat. Clim. Change 9, 40-43. doi: 10.1038/s41558-018-0351-2
Jokiel, P. L., Jury, C. P., and Rodgers, K. S. (2014). Coral-algae metabolism and diurnal changes in the CO2-carbonate system of bulk sea water. Peer/ 2:e378. doi: 10.7717/peerj.378
Kayanne, H., Hata, H., Kudo, S., Yamana, H., Watanabe, A., Ikeda, Y., et al. (2005). Seasonal and bleaching-induced changes in coral reef metabolism and CO2 flux. Glob. Biogeochem. Cycles. 19:GB3015.
Kinsey, D. (1972). "Preliminary observations on community metabolism and primary productivity of the pseudo-atoll reef at One Tree Island. Great Barrier Reef,' in Proceedings of the First International Symposium on Corals and C,,ral Reefs, eds C. Munkundan and C. S. Gopinadha Pillai (Ernakulum: Marine Biological Association of!ndia).
Jur,e 2019 i Vol<Jme 6 Arlie e 28?
Davis et al.
Kinsey, D. (1978). Productivity and calcification estimates using slack-waterperiod and fidd enclosures, in Coral Reef Research Methods, UNESCO Monographs on Oceanographic Methodology, eds D. R. Stoddart and R. E. Johannes (Paris: UNESCO), 439-468.
Kinsey, D. W. (1980). Carbon Turnover and Accumulation by Coral Reefs. Ph.D. thesis, University of Hawaii, Honolulu, HI.
Kinsey, D., and Davies, P. (1979). Carbon Turnover, Calcification and Growth in Coral Reefs, Studies in Environmental Science. Amsterdam: Elsevier, 131-162.
Kinsey, D. W. (1977)). "Seasonal and zonation in coral reef productivity and calcification:' in Proceedings of the Third International Coral Reef Symposium, (Miami, FL), 383-388.
Kleypas, J. A., Anthony, K. R., and Gattuso, J. P. (2011). Coral reefs modify their seawater carbon chemistry-case study from a barrier reef (Moorea. French Polynesia). Glob. Change Biol. 17, 3667-3678. doi: 10.llll/j.1365-2486.2011. 02530.x
Kornder, N. A., Rieg], B. M., and Figueiredo, J. (2018). Thresholds and drivers of coral calcification responses to climate change. Glob. Change Biol. 24, 5084-5095. doi: 10.1111/gcb.14431
Kwiatkowski, L., Albright, R., Hosfelt, J., Nebuchina, Y., Ninokawa, A., Rivlin, T., et al. (2016). Interannual stability of organic to inorganic carbon production on a coral atoll. Geophys. Res. Lett. 43, 3880-3888. doi: 10.1002/2016gl068723
Langdon, C., Gattuso, J. P., and Andersson, A. (2010). "Measurements of calcification and dissolution of benthic organisms and 13 communities; in Guide to best practices for ocean acidification research and data reporting, eds U. Riebesell, V. J. Fabry, L. Hansson and J.-P. Gattuso (Luxembourg: Publications Office of the European Union).
Long, M. H., Berg, P., de Beer, D., and Zieman, J. C. (2013). In situ coral reef oxygen metabolism: an eddy correlation study. PLoS One 8:e5858 I. doi: 10. 1371/journal.pone.0058581
Longhini, C. M., Souza, M. F., and Silva, A. M. (2015). Net ecosystem production, calcification and CO2 fluxes on a reef flat in Northeastern Brazil. Estuar. Coast. Shelf Sci. 166, 13-23. doi: I0.1016/j.ecss.2014.12.034
Lowe, R. )., and Falter, J. L. (2015). Oceanic forcing of coral reefs. Ann. Rev. Mar. Sci. 7, 43-66. doi: I0.1146/annurev-marine-010814-015834
Manzello, D., Enochs, I., Musielewicz, S., Carlton, R., and Gledhill, D. (2013). Tropical cyclones cause CaCO3 undersaturation of coral reef seawater in a high-CO2 world. J. Geophys. Res. Oceans. ll8, 5312-5321. doi: 10.1002/jgrc. 20378
McCulloch, M., Falter, J., Trotter, J., and Montagna, P. (2012). Coral resilience to ocean acidification and global warming through pH up-regulation. Nat. Clim. Change. 2, 623-627. doi: 10.1038/srep42405
McDougall, T. J., and Barker, P. M. (2011). Getting started with TEOS-10 and the Gibbs Seawater (GSW) oceanographic toolbox. London: SCOR/IAPSO WG 127, 1-28.
McMahon, A., and Santos, I. R. (2017). Nitrogen enrichment and speciation in a coral reef lagoon driven by groundwater inputs of bird guano. J. Geophys. Res. Oceans. 122, 7218-7236. doi: 10.1002/2017jc012929
McMahon, A., Santos, I. R., Cyronak, T., and Eyre, B. D. (2013). Hysteresis between coral reef calcification and the seawater aragonite saturation state. Geophys. Res. Lett. 40, 4675-4679. doi: 10.7717/peetj.378
McMahon, A., Santos, I. R., Schulz, K. G., Cyronak, T., and Maher, D. T. (2018). Determining coral reef calcification and primary production using automated alkalinity, pH and pCO2 measurements at high temporal resolution. Estuar. Coast. Shelf Sci. 209, 80-88. doi: 10.1016/j.ecss.2018.04.041
McMahon, A., Santos, I. R., Schulz, K. G., Scott, A., Silverman, )., Davis, K. L., et al. (2019). Coral reef calcification and production after the 2016 bleaching event at Lizard Island, Great Barrier Reef. J. Geophys. Res. 124. doi: 10.1029/ 2018JC014698
Mongin, M., Baird, M. E., Tilbrook, B., Matear, R. J., Lenton, A., Herzfeld, M., et al. (2016). The exposure of the Great Barrier Reef to ocean acidification. Nat. Commun. 7:10732. doi: 10.l038/ncommsl0732
Muehllehner, N., Langdon, C., Venti, A., and Kadko, D. (2016). Dynamics of carbonate chemistry, production, and calcification of the Florida reef tract (2009-2010): evidence for seasonal dissolution. Glob. Biogeocl,em. Cycles 30, 661-688. doi: 10.1002/2015gb005327
Page, H. N., Courtney, T. A., Collins, A., De Carlo, E. H., and Andersson, A. J. (2017). Net community metabolism and seawater carbonate chemistry scale
Frontiers in Marine Science I www.frontiersin.org
Fifty Years of Ecosystem Metabolism
non-intuitivelywith coral cover. Front. Mar. Sci. 4:161. doi: 10.3389/fmars.2017. 00161
Parkinson, J, E., Banaszak, A. T., Altman, N. S., La)eunesse, T. C., and Baurns, I. B. {2015). Intraspecific diversity among partners drives functional variation in coral symbioses. Sci. Rep. 5:15667. doi: 10.1038/srepl5667
Perry, C. T., Spencer, T., and Kench, P. S. (2008). Carbonate budgets and reef production states: a geomorphic perspective on the ecological phase-shift concept. Coral Reefs 27, 853-866. doi: 10.1007/s00338-008-0418-z
Raymond, P. A., and Cole, J. J. {2001). Gas exchange in rivers and estuaries: choosing.a gas transfer velocity. Estuaries 24, 312-317.
Richardson, L. E., Graham, N. A., Pratchett, M. S., and Hoey, A. S. (2017). Structural complexity mediates functional structure of reef fish assemblages among coral habitats. Environ. Biol. Fish. 100, 193-207. doi: 10.1007/sl0641-016-0571-0
Rocker, M. M., Noonan, S., Humphrey, C., Moya, A., Willis, B. L., and Bay, L. K. (2015). Expression of calcification and metabolism-related genes in response to elevated pCO2 and temperature in the reef-building coral Acropora millepora. Mar. Genom. 24, 313-318. doi: 10.1016/j.margen.2015.08.001
Santos, I. R., Erler, D., Tait, D., and Eyre, B. D. (2010). Breathing of a coral cay: tracing tidally driven seawater recirculation in permeable coral reef sediments. ]. Geophys. Res ll5:Cl2010. doi: l0.1029/2010JC006510
Shamberger, K. E., Cohen, A. L., Golbuu, Y., Mccorkle, D. C., Lentz, S. J., and Barkley, H. C. (2014). Diverse coral communities in naturally acidified waters of a Western Pacific reef. Geophys. Res. Lett. 41, 499-504. doi: 10.1002/ 2013gl058489
Shamberger, K. E., Lentz, S. J ., and Cohen, A. L. (2018 ). Low and variable ecosystem calcification in a coral reef lagoon under natural acidification. Limnol. Oceanogr. 63, 714-730. doi: 10.1002/lno.10662
Shamberger, K. E. F., Feely, R. A., Sabine, C. L., Atkinson, M. J., DeCarlo, E. H., Mackenzie, F. T., et al. (20ll). Calcification and organic production on a Hawaiian coral reef. Mar. Chem. 127, 64-75. doi: 10.1016/j.marchem.201 l. 08.003
Shaw, E. C., Hamylton, S. M., and Phinn, S. R. (2016). Incorporating benthic community changes into hydrochemical-based projections of coral reef calcium carbonate production under ocean acidification. Coral Reefs 35, 739-750. doi: 10.l007/s00338-016-1407-2
Shaw, E. C., McNeil, B. I., and Tilbrook, B. (2012). Impacts of ocean acidification in naturally variable coral reefflat ecosystems. J. Geophys. Res. 117:C03038.
Shaw, E. C., Mcneil, B. I., Tilbrook, B., Matear, R., and Bates, M. L. (2013). Anthropogenic changes to seawater buffer capacity combined with natural reef metabolism induce extreme future coral reef CO2 conditions. Glob. Change Biol 19, 1632-1641. doi: 10.1111/gcb.12154
Shaw, E. C., Phinn, S. R., Tilbrook, B., and Steven, A. (2014). Comparability of slack water and Lagrangian flow respirometry methods for community metabolic measurements. PLoS One 9:ell2161. doi: 10.1371/journal.pone. 0112161
Shaw, E. C., Phinn, S. R., Tilbrook, B., and Steven, A. (2015). Natural in situ relationships suggest coral reef calcium carbonate production will decline with ocean acidification. Limnol. Oceanogr. 60, 777-788. doi: 10.1002/lno.10048
Silverman, J., Kline, D. I., Johnson, L., Rivlin, T., Schneider, K., Erez, )., et al. (2012). Carbon turnover rates in the One Tree Island reef: a 40-year perspective. ]. Geophys. Res. 117:G03023.
Silverman, J., Lazar, B., and Erez, J. (2007). Effect of aragonite saturation, temperature, and nutrients on the community calcification rate of a coral reef. ]. Geophys. Res. ll2:C05004.
Silverman, J., Schneider, K., Kline, D. I., Rivlin, T., Rivlin, A., Hamylton, S., et al. (2014). Community calcification in Lizard Island, Great Barrier Reef: a 40-year perspective. Geochim. Cosmochim. Acta. 144, 72-81. doi: 10.1016/j.gca.2014.09.011
Suzuki, A., and Kawabata, H. (2003). Carbon budget of coral reef systems: an overview of observations in fringing reefs, barrier reefs and atolls in the IndoPacific regions. Tel/us B 55, 428-444. doi: 10.1034/j.1600-0889.2003.01442.x
Venti, A., Kadko, D., Andersson, A. J., Langdon, C., and Bates, N. R. (2014). A multi-tracer model approach to estimate reef water residence times. Limnol. Oceanogr Methods 10, 1078-1095. doi: 10.431Mom.2012.10.1078
Wanninkhof, R. (1992). Relationship between wind speed and gas exchange over the ocean. J. Geophys. Res. Oceans. 97, 7373-7382.
- -------June 2019 I Volume 6 I Article 282

0 v,s e! al.
Watanabe, A., Kayanne, H., Hata, H., Kudo, S., Nozaki, K., Kato, K., et al. (2006). Analysis of the seawater CO2 system in the barrier reef-lagoon system of Palau using total alkalinity-dissolved inorganic carbon diagrams. Limnol. Oceanogr. 51, 1614-1628. doi: 10.4319/lo.2006.51.4.1614
Woolsey, E., Bainbridge, S. J., Kingsford, M. J., and Byrne, M. (2012). Impacts of cyclone hamish at one tree reef: integrating environmental and benthic habitat data. Mar. Biol. 159, 793-803. doi: I0.1007/s00227-0l l-1855-8
Yates, K. K., and Halley, R. B. (2006). coi- concentration and pCO2 thresholds for calcification and dissolution on the molokai reef flat, Hawaii. Biogeosci. Discuss. 3, 123-154. doi: 10.5194/bgd-3-123-2006
Fronu~, ~- in tvlan ... ir:, Science VJWw frontie sin or
Fifty Years or Ecosystem Metabolism
Conflict of Interest Statement: The authors declare that the research was conducted in the absence of any commercial or financial relationships that could be construed as a potential conflict of interest.
Copyright© 2019 Davis, McMahon, Kelaher, Shaw and Santos. This is an openaccess article distributed under the terms of the Creative Commons Attribution License (CC BY). The use, distribution or reproduction in other forums is permitted, provided the original author(s) and the copyright owner(s) are credited and that the original publication in this journal is cited, i11 accorda11ce with accepted academic practice. No use, distribution or reproduction is permitted which does not comply with these terms.
June 2O19 I Vol~rne 6 ! Article 213?
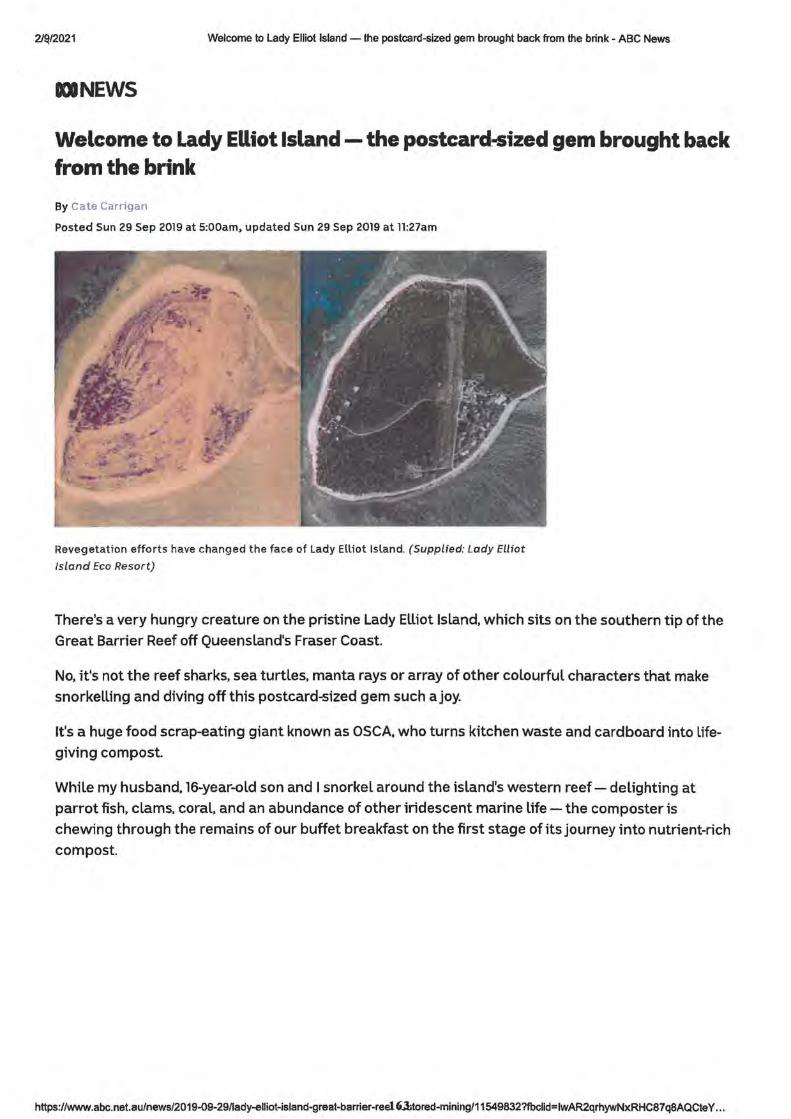
2/Q/2021 Welcome to Lady Elliot Island - the postcard-sized gem brought back from the brink - ABC News
DNEWS
Welcome to Lady Elliot Island - the postcard~ized gem brought back from the brink
By Cate Carrigan
Posted Sun 29 Sep 2019 at 5:00am, updated Sun 29 Sep 2019 at 11:27am
Revegetation efforts have changed the face of Lady Elliot Island. (Supplied: Lady Elliot
Island Eco Resort)
There's a very hungry creature on the pristine Lady Elliot Island, which sits on the southern tip of the Great Barrier Reef off Queensland's Fraser Coast.
No, it's not the reef sharks, sea turtles, manta rays or array of other colourful characters that make
snorkelling and diving off this postcard-sized gem such a joy.
It's a huge food scrap-eating giant known as OSCA, who turns kitchen waste and cardboard into life
giving compost.
While my husband, 16-year-old son and I snorkel around the island's western reef- delighting at
parrot fish, clams, coral, and an abundance of other iridescent marine life - the com poster is
chewing through the remains of our buffet breakfast on the first stage of its journey into nutrient-rich compost.
https:l/www.abc.net.au/news/2019-09-29/lady-elliot-island-great-barrier-ree1Utored-mining/11549832?fbclid=lwAR2qrhywNxRHC87q8AQCteY ...
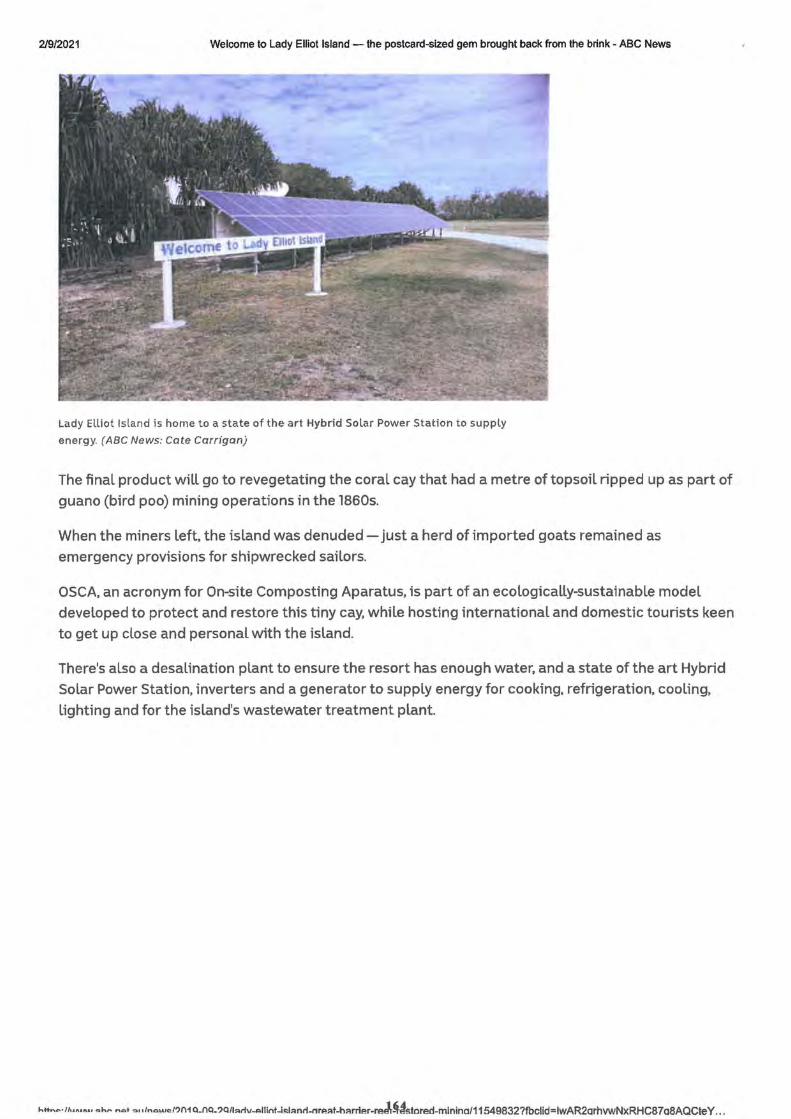
2/9/2021 Welcome to Lady Elliot Island - the postcard-sized gem brought back from the brink - ABC News
Lady Elliot Island is home to a state of the art Hybrid Solar Power Station to supply
energy. (ABC News: Cate Carrigan)
The final product will go to revegetating the coral cay that had a metre of topsoil ripped up as part of guano (bird poo) mining operations in the 1860s.
When the miners left. the island was denuded - just a herd of imported goats remained as emergency provisions for shipwrecked sailors.
OSCA, an acronym for On-site Composting Aparatus, is part of an ecologically-sustainable model developed to protect and restore this tiny cay, while hosting international and domestic tourists keen to get up close and personal with the island.
There's also a desalination plant to ensure the resort has enough water, and a state of the art Hybrid Solar Power Station, inverters and a generator to supply energy for cooking, refrigeration, cooling, lighting and for the island's wastewater treatment plant.
._..__~. ,h ... n .. Glv- .... + ,,., , 1 ...... ,.,1?01 o_no.?on,.rtv-Allint-i"l"nrl.nrP."t-h"rrier..retlUstored-minina/11549832?fbclid=lwAR2arhvwNxRHC87a8AQCte Y .. .
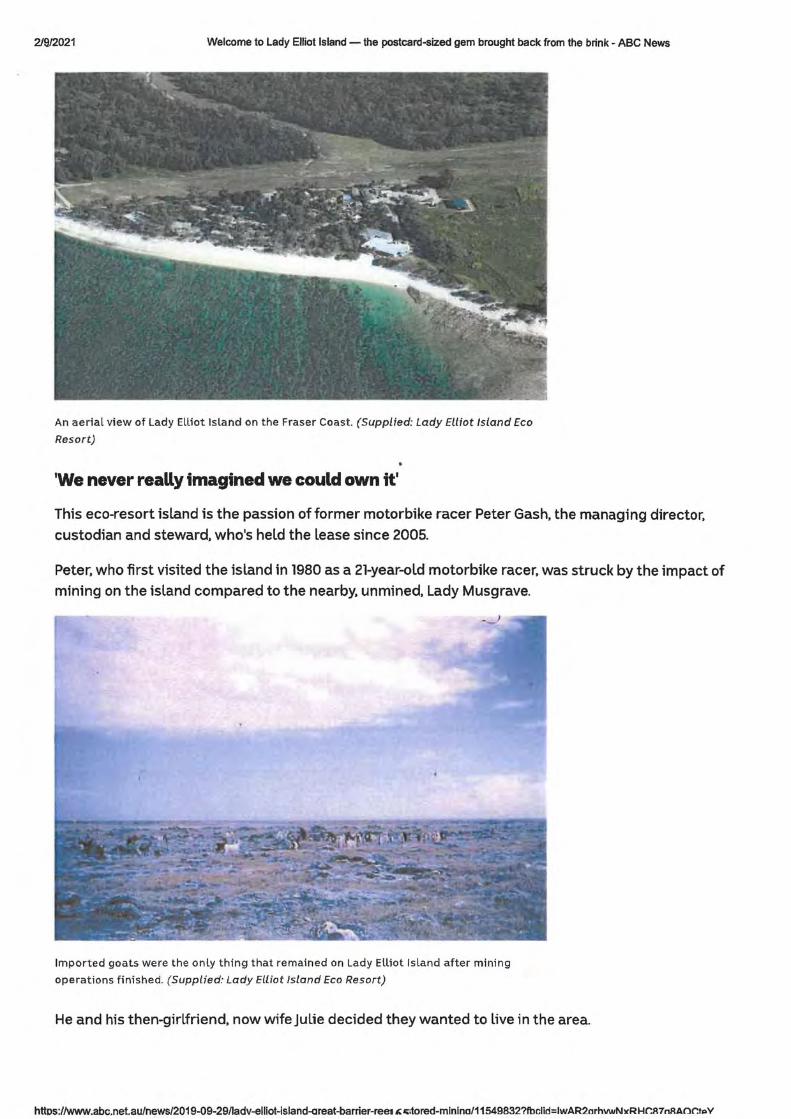
2/9/2021 Welcome to Lady Elliot Island - the postcard-sized gem brought back from the brink - ABC News
An aerial view of Lady Elliot Island on the Fraser Coast. (Supplied: Lady Elliot Island Eco
Resort)
'We never really ;mag;ned we could own ;t•
This eco-resort island is the passion of former motorbike racer Peter Gash, the managing director, custodian and steward, who's held the lease since 2005.
Peter. who first visited the island in 1980 as a 21-year-old motorbike racer. was struck by the impact of mining on the island compared to the nearby, unmined, Lady Musgrave.
Imported goats were the only thing that remained on Lady Elliot Island after mining
operations finished. (Supplied: Lady Elliot Island Eco Resort)
He and his then-girlfriend, now wife Julie decided they wanted to live in the area.
httos://www.abc.net.au/news/2019-09-29/ladv-elllot-island-areat-barrier-reew ~ .11;;;tored-mlnina/11549832?fbclid=lwAR2orhvwN)(RHCR7nRAOr.t .. v
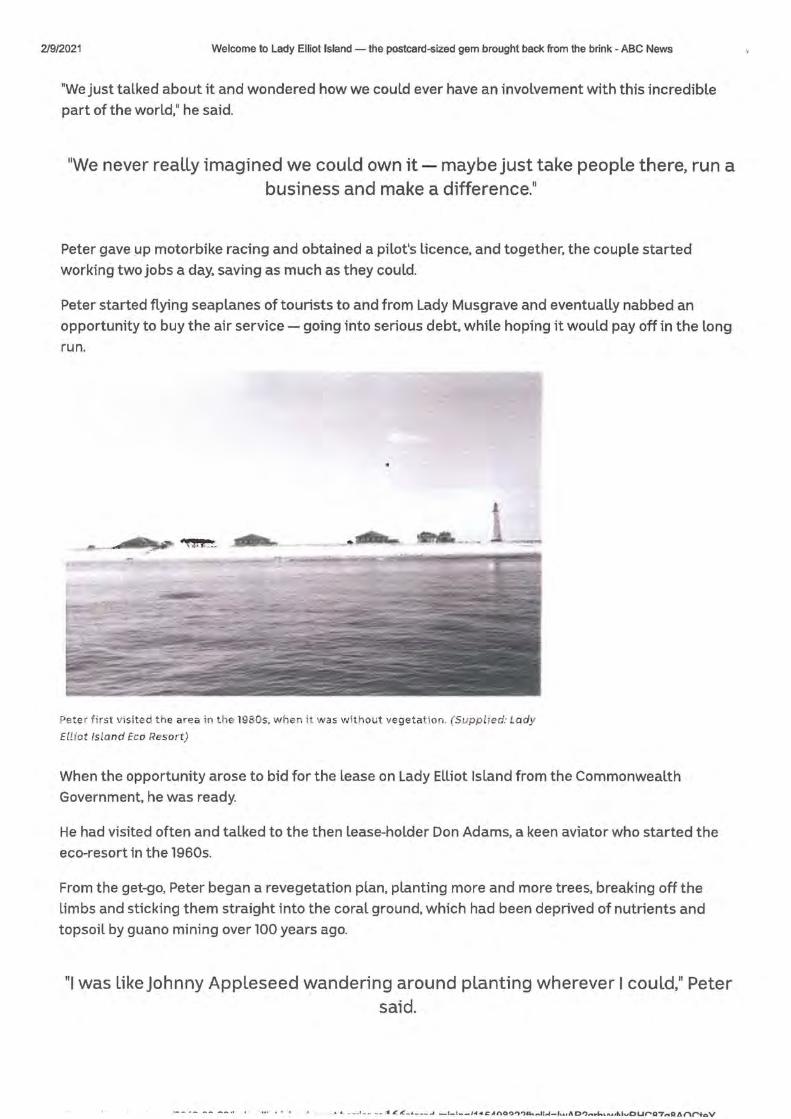
2/9/2021 Welcome to Lady Elliot Island - the postcard-sized gem brought back from the brink - ABC News
"We just talked about it and wondered how we could ever have an involvement with this incredible part of the world," he said.
11We never really imagined we could own it - maybe just take people there, run a business and make a difference. 11
Peter gave up motorbike racing and obtained a pilot's licence, and together, the couple started working two jobs a day, saving as much as they could.
Peter started flying seaplanes of tourists to and from Lady Musgrave and eventually nabbed an opportunity to buy the air service - going into serious debt, while hoping it would pay off in the long run.
Pete r first vi sited the a rea in t he 1980s, when it was wit hout vegetation. (S uppl ied: Lady
Elliot Is land Eco Resort)
When the opportunity arose to bid for the lease on Lady Elliot Island from the Commonwealth Government, he was ready.
He had visited often and talked to the then lease-holder Don Adams, a keen aviator who started the eco-resort in the 1960s.
From the get-go, Peter began a revegetation plan, planting more and more trees, breaking off the Limbs and sticking them straight into the coral ground, which had been deprived of nutrients and topsoil by guano mining over 100 years ago.
111 was like Johnny Appleseed wandering around planting wherever I could, 11 Peter said.
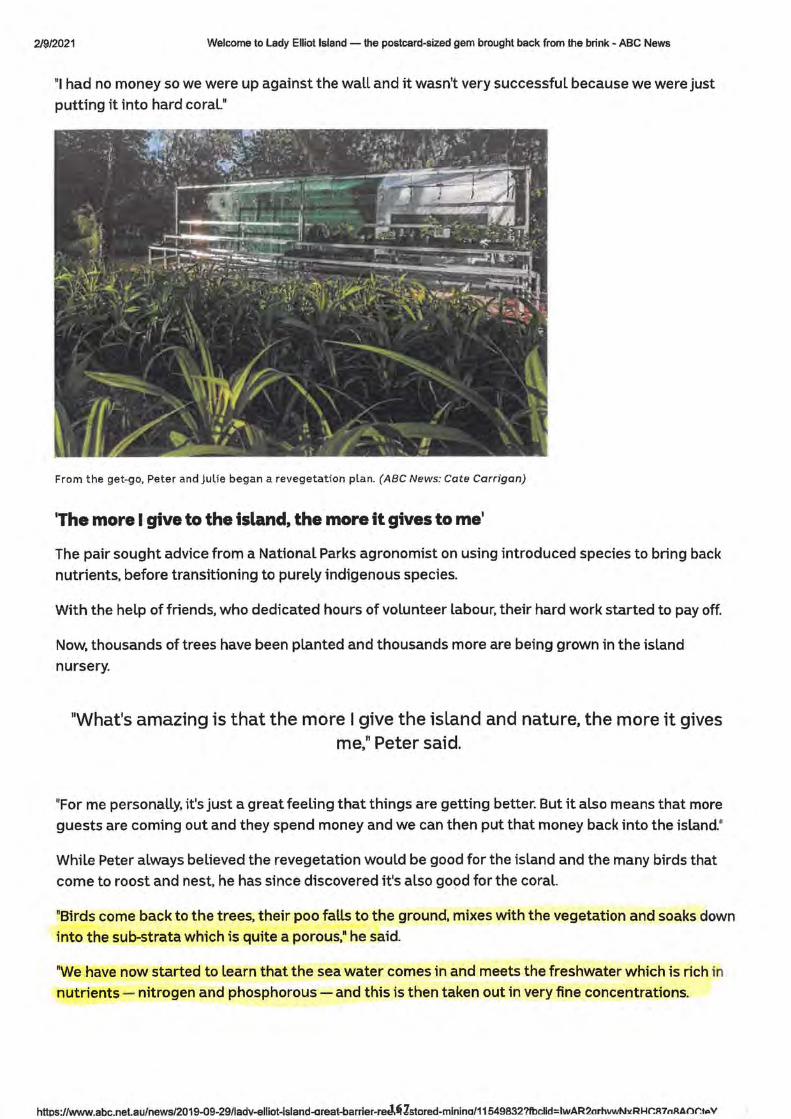
2/9/2021 Welcome to Lady Elliot Island - the postcard-sized gem brought back from the brink - ABC News
"I had no money so we were up against the wall and it wasn't very successful because we were just
putting it into hard coral"
From the get-go, Peter and Julie began a revegetation plan. (ABC News: Cate Carrigan)
'The more I give to the island, the more it gives to me'
The pair sought advice from a National Parks agronomist on using introduced species to bring back nutrients, before transitioning to purely indigenous species.
With the help of friends, who dedicated hours of volunteer labour, their hard work started to pay off.
Now, thousands of trees have been planted and thousands more are being grown in the island
nursery.
"What's amazing is that the more I give the island and nature, the more it gives me," Peter said.
"For me personally, it1s just a great feeling that things are getting better. But it also means that more
guests are coming out and they spend money and we can then put that money back into the island."
While Peter always believed the revegetation would be good for the island and the many birds that
come to roost and nest, he has since discovered it1s also good for the coral.
"Birds come back to the trees, their poo falls to the ground, mixes with the vegetation and soaks down
into the sub-strata which is quite a porous," he said.
"We have now started to Learn that the sea water comes in and meets the freshwater which is rich in
nutrients - nitrogen and phosphorous - and this is then taken out in very fine concentrations.
httos://www.abc.nelau/news/2019-09-29Radv-elliot-island-areat-barrier-red.~Zstored-minina/11549832?fbclid=lwAR2arhvwNllRl-lr.R7nRAO~t .. v
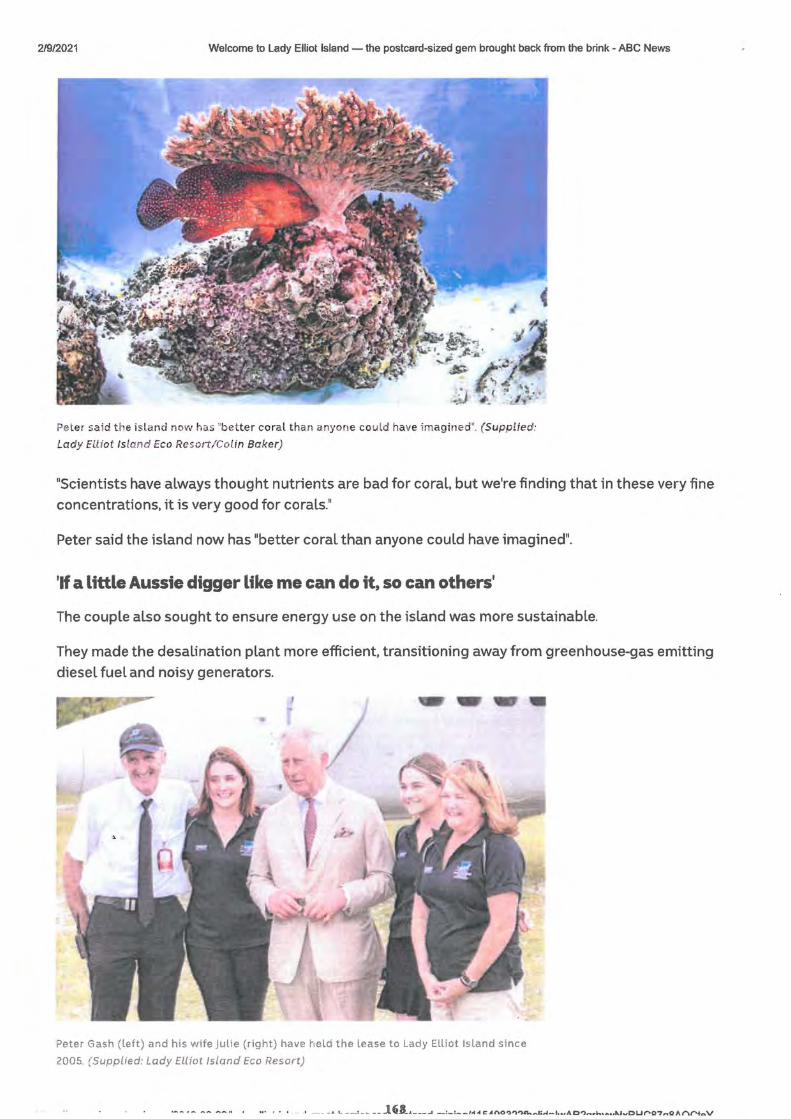
2/9/2021 Welcome to Lady Elliot Island - the postcard-sized gem brought back from the brink - ABC News
Pete r sa id t he is la nd now has "better cora l than anyone could have imagi ned•. (Supplied:
Lady Elliot Is land Eco Resort/Colin Baker)
"Scientists have always thought nutrients are bad for coral. but we're finding that in these very fine
concentrations, it is very good for corals."
Peter said the island now has "better coral than anyone could have imagined".
'If a little Aussie digger like me can do it, so can others'
The couple also sought to ensure energy use on the island was more sustainable.
They made the desalination plant more efficient, transitioning away from greenhouse-gas emitting
diesel fuel and noisy generators.
Peter Gash (left) and his wife Julie (right) have held the lease to Lady Elliot Island since
2005. (Supplied: Lady Elliot Island Eco Resort)
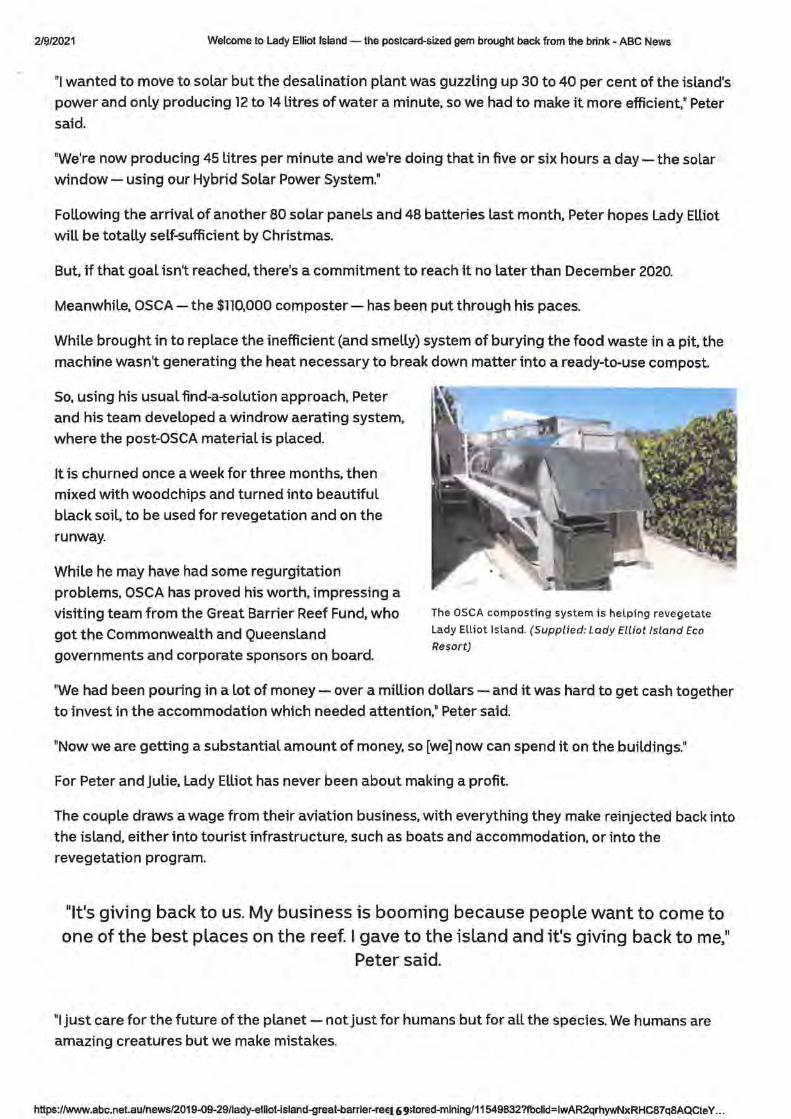
2/9/2021 Welcome to Lady Elliot Island - the postcard-sized gem brought back from the brink - ABC News
"I wanted to move to solar but the oesalination plant was guzzling up 30 to 40 per cent of the island's
power and only producing 12 to 14 litres of water a minute, so we had to make it more efficient," Peter
said.
"We're now producing 45 litres per minute and we're doing that in five or six hours a day - the solar
window - using our Hybrid Solar Power System."
Following the arrival of another 80 solar panels and 48 batteries last month, Peter hopes Lady Elliot
will be totally self-sufficient by Christmas.
But, if that goal isn't reached, there's a commitment to reach it no later than December 2020.
Meanwhile, OSCA- the $110,000 composter - has been put through his paces.
While brought in to replace the inefficient (and smelly) system of burying the food waste in a pit, the
machine wasn't generating the heat necessary to break down matter into a ready-to-use compost.
So, using his usual find-a-solution approach, Peter
and his team developed a windrow aerating system,
where the post-OSCA material is placed.
It is churned once a week for three months, then
mixed with woodchips and turned into beautiful
black soil, to be used for revegetation and on the
runway.
While he may have had some regurgitation
problems, OSCA has proved his worth, impressing a
visiting team from the Great Barrier Reef Fund, who
got the Commonwealth and Queensland
governments and corporate sponsors on board.
The OSCA composting system is helping revegetate
Lady Elliot Island. (Supplied: lady Elliot Island Eco
Resort)
"We had been pouring in a lot of money - over a million dollars - and it was hard to get cash together
to invest in the accommodation which needed attention," Peter said.
"Now we are getting a substantial amount of money, so [we] now can spend it on the buildings."
For Peter and Julie, Lady Elliot has never been about making a profit.
The couple draws a wage from their aviation business, with everything they make reinjected back into
the island, either into tourist infrastructure, such as boats and accommodation, or into the
revegetation program.
"It's giving back to us. My business is booming because people want to come to one of the best places on the reef. I gave to the island and it's giving back to me,"
Peter said.
"I just care for the future of the planet - not just for humans but for all the species. We humans are
amazing creatures but we make mistakes.
https://www.abc.net.au/news/2019-09-29/lady-elliot-island-great-barrier-reEJ. 6 91tored-mining/11549832?fbclid=lwAR2qrhywNxRHC87q8AQCteY ...
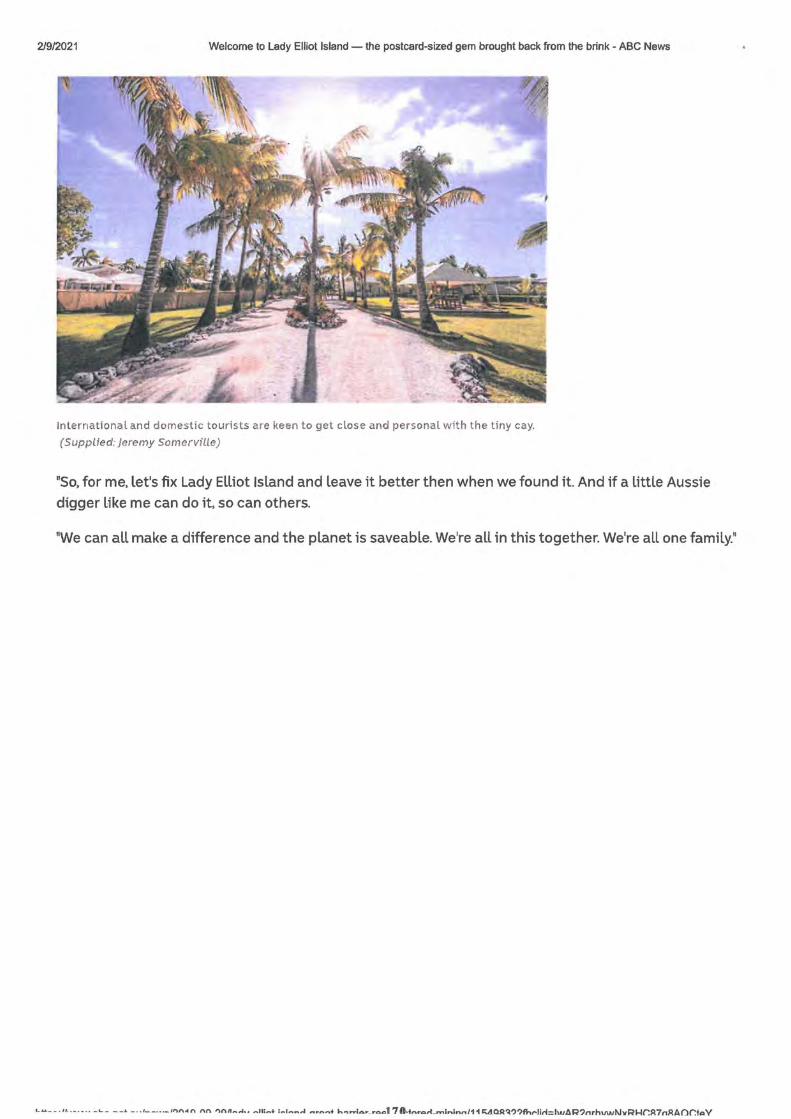
2/9/2021 Welcome to Lady Elliot Island - the postcard-sized gem brought back from the brink - ABC News
International and domestic tourists are keen to get close and personal with the tiny cay.
(Supplied: Jeremy Somerville)
"So, for me, let's fix Lady Elliot Island and leave it better then when we found it. And if a little Aussie digger like me can do it, so can others.
"We can all make a difference and the planet is saveable. We're all in this together. We're all one family."
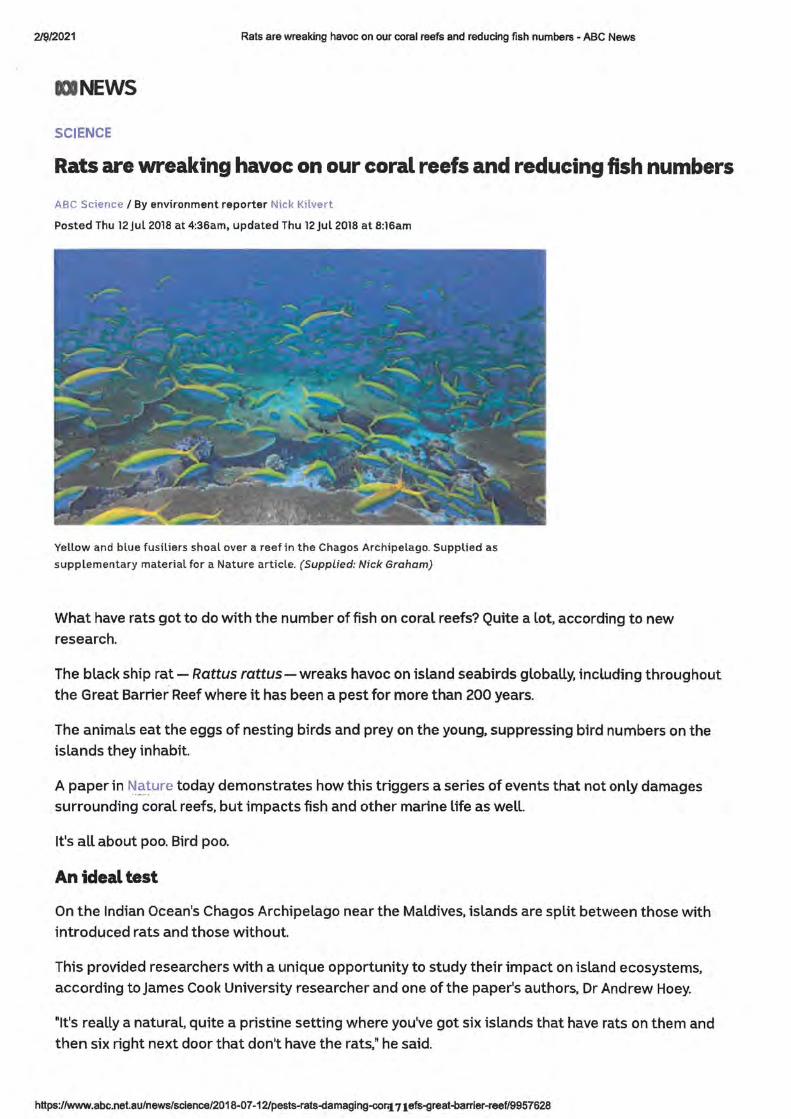
21e12021 Rats are wreaking havoc on our coral reefs and reducing fish numbers - ABC News
IINEWS
SCIENCE
Rats are wreaking havoc on our coral reefs and reducing fish numbers
ABC Science / By environment reporter Nick Kilvert
Posted Thu 12Jul 2018 at 4:36am, updated Thu 12Jul 2018 at 8:16am
Yellow and blue fusiliers shoal over a reef in the Chagos Archipelago. Supplied as
supplementary material for a Nature article. (Supplied: Nick Graham)
What have rats got to do with the number of fish on coral reefs? Quite a lot, according to new
research.
The black ship rat-Rattus rattus-wreaks havoc on island seabirds globally, including throughout
the Great Barrier Reef where it has been a pest for more than 200 years.
The animals eat the eggs of nesting birds and prey on the young, suppressing bird numbers on the
islands they inhabit.
A paper in t\l~ture today demonstrates how this triggers a series of events that not only damages surrounding coral reefs, but impacts fish and other marine Life as well.
It's all about poo. Bird poo.
An ideal test
On the Indian Ocean's Chagos Archipelago near the Maldives, islands are split between those with
introduced rats and those without.
This provided researchers with a unique opportunity to study their impact on island ecosystems,
according to James Cook University researcher and one of the paper's authors, Dr Andrew Hoey.
"It's really a natural, quite a pristine setting where you've got six islands that have rats on them and
then six right next door that don't have the rats," he said.
https://www.abc.net.au/news/science/2018-07-12/pests-rats-damaging-corq 71 efs-great-barrier-reef/9957628
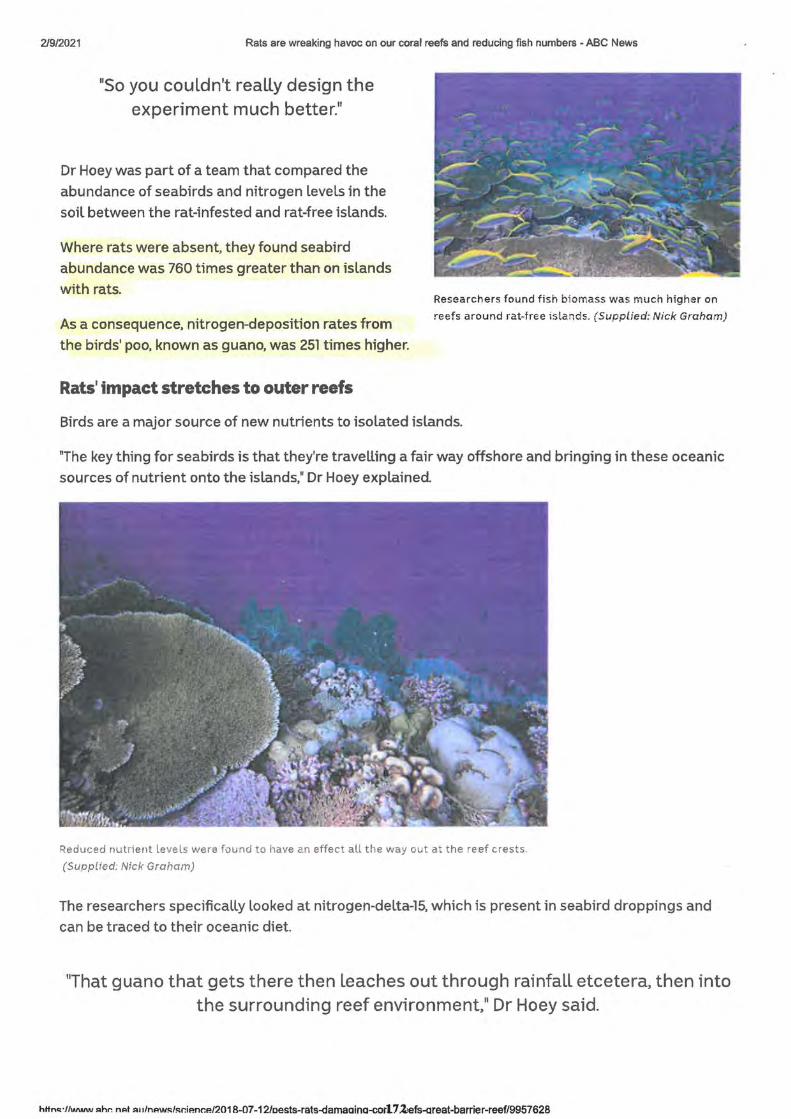
2/9/2021 Rats are wreaking havoc on our coral reefs and reducing fish numbers - ABC News
11S0 you couldn't really design the experiment much better."
Dr Hoey was part of a team that compared the
abundance of seabirds and nitrogen levels in the
soil between the rat-infested and rat-free islands.
Where rats were absent, they found seabird
abundance was 760 times greater than on islands
with rats.
As a consequence, nitrogen-deposition rates from
the birds' poo. known as guano, was 251 times higher.
Rats' impact stretches to outer reefs
Researchers found fi s h biomass was much highe r on
reefs around rat-free islands. (Supplied: Nick Graham)
Birds are a major source of new nutrients to isolated islands.
"The key thing for seabirds is that they're travelling a fair way offshore and bringing in these oceanic
sources of nutrient onto the islands," Dr Hoey explained.
Reduced nutrient levels were found to have an effect all the way out at the reef crests.
(Supplied: Nick Graham)
The researchers specifically looked at nitrogen-delta-15, which is present in seabird droppings and
can be traced to their oceanic diet.
'That guano that gets there then leaches out through rainfall etcetera, then into the surrounding reef environment," Dr Hoey said.
httnc:: · //wurw "hr. nAt "' 1/nP.wi:./i:.r.i1mc:e/2018-07-12/oests-rats-damaoino-cor11.liefs-areat-barrier-reef/9957628
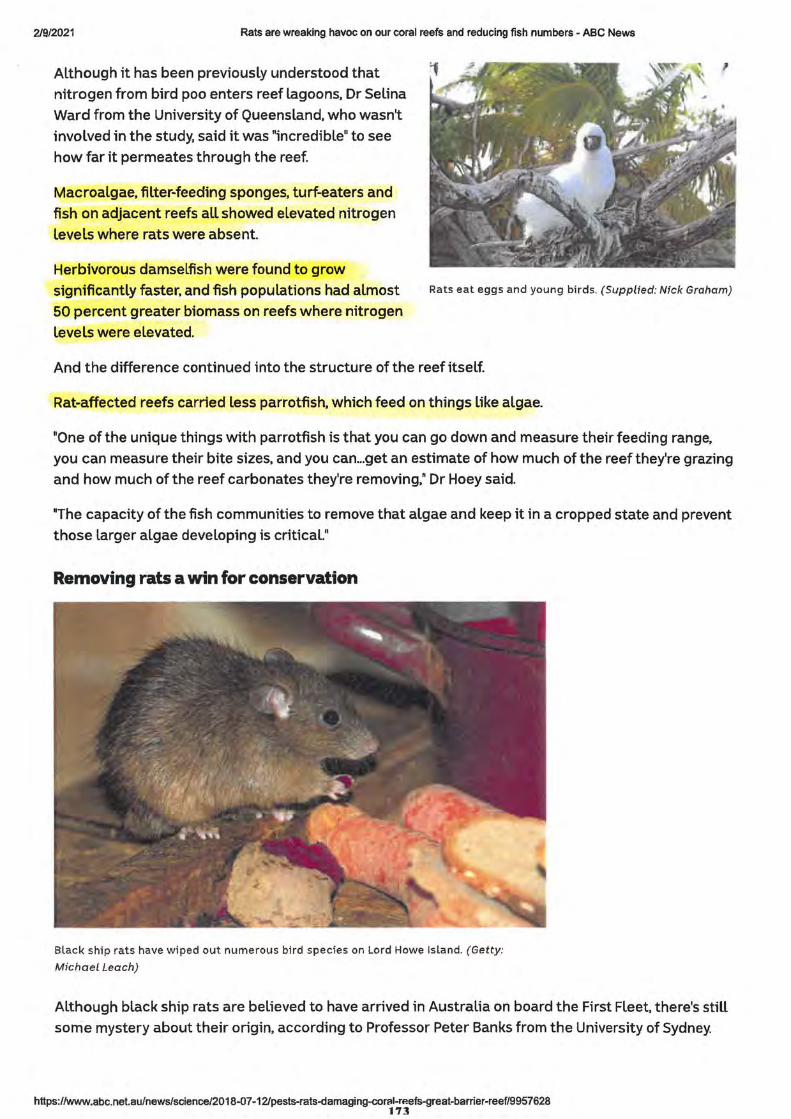
2/9/2021 Rats are wreaking havoc on our coral reefs and reducing fish numbers - ABC News
Although it has been previously understood that nitrogen from bird poo enters reef lagoons, Dr Selina
Ward from the University of Queensland, who wasn't involved in the study, said it was "incredible" to see
how far it permeates through the reef.
Macroalgae, filter-feeding sponges, turf-eaters and fish on adjacent reefs all showed elevated nitrogen
levels where rats were absent.
Herbivorous damselfish were found to grow
significantly faster, and fish populations had almost 50 percent greater biomass on reefs where nitrogen
Levels were elevated.
Rats eat eggs and young birds. (Supplied: Nick Graham)
And the difference continued into the structure of the reef itself.
Rat-affected reefs carried Less parrotfish. which feed on things Like algae.
"One of the unique things with parrotfish is that you can go down and measure their feeding range, you can measure their bite sizes, and you can ... get an estimate of how much of the reef they're grazing and how much of the reef carbonates they're removing," Dr Hoey said.
"The capacity of the fish communities to remove that algae and keep it in a cropped state and prevent
those larger algae developing is critical"
Removing rats a win for conservat;on
Black ship rats have wiped out numerous bird species on Lord Howe Island. (Getty:
Michael Leach)
Although black ship rats are believed to have arrived in Australia on board the First Fleet, there's still some mystery about their origin, according to Professor Peter Banks from the University of Sydney.
https://www.abc.net.au/news/science/2018-07-12/pests-rats-damaging-coritl-n~efs-great-barrier-reef/9957628 17]
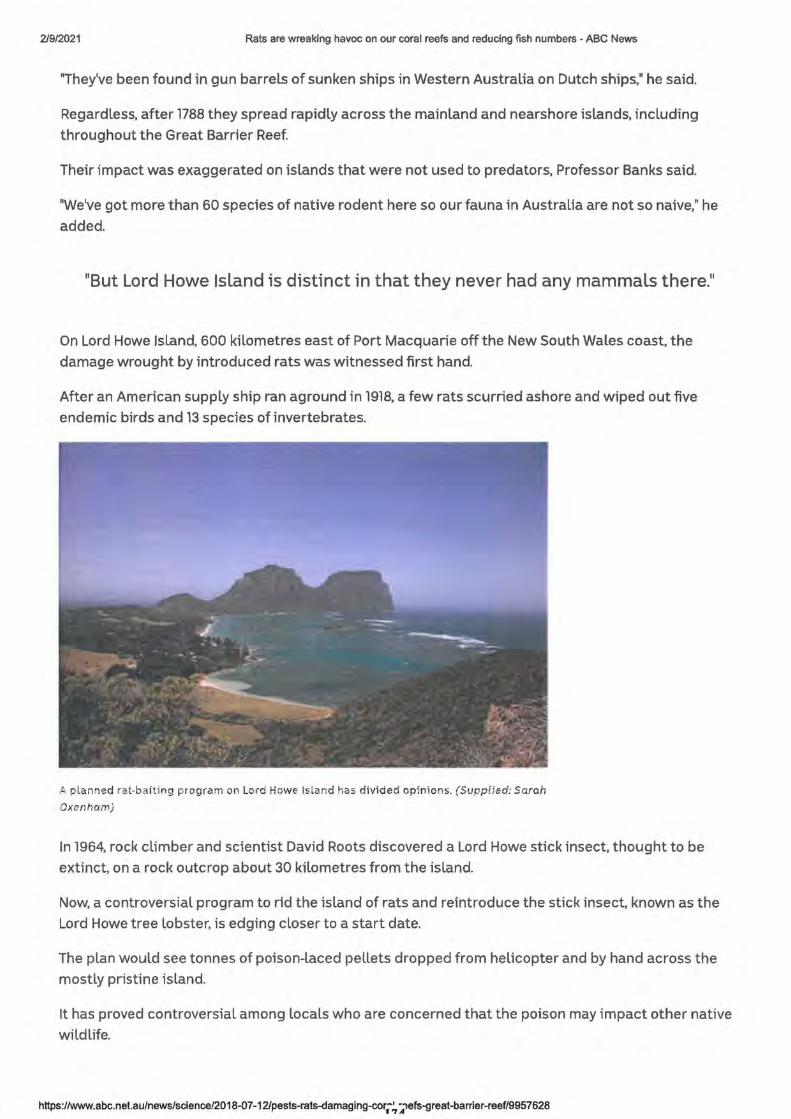
2/9/2021 Rats are wreaking havoc on our coral reefs and reducing fish numbers - ABC News
"They've been found in gun barrels of sunken ships in Western Australia on Dutch ships," he said.
Regardless, after 1788 they spread rapidly across the mainland and nearshore islands, including
throughout the Great Barrier Reef.
Their impact was exaggerated on islands that were not used to predators, Professor Banks said.
"We've got more than 60 species of native rodent here so our fauna in Australia are not so naive," he
added.
"But Lord Howe Island is distinct in that they never had any mammals there."
On Lord Howe Island, 600 kilometres east of Port Macquarie off the New South Wales coast, the
damage wrought by introduced rats was witnessed first hand.
After an American supply ship ran aground in 1918, a few rats scurried ashore and wiped out five
endemic birds and 13 species of invertebrates.
A planned ra t-bait ing program on lo rd Howe Isla nd has divided opinions. (Supp lied: Sarah
Oxenham)
In 1964, rock climber and scientist David Roots discovered a Lord Howe stick insect, thought to be
extinct, on a rock outcrop about 30 kilometres from the island.
Now, a controversial program to rid the island of rats and reintroduce the stick insect, known as the
Lord Howe tree lobster, is edging closer to a start date.
The plan would see tonnes of poison-laced pellets dropped from helicopter and by hand across the
mostly pristine island.
It has proved controversial among locals who are concerned that the poison may impact other native
wildlife.
https://www.abc.nel.au/news/science/2018-07-12/pests-rats-damaging-cor1-~ :;.-,efs-great-barrier-reef/9957628

2/9/2021 Rats are wreaking havoc on our coral reefs and reducing fish numbers - ABC News
Researchers will be watching the program closely. If it works, it could serve as a model for similar
ventures on other Australian islands.
In the case of uninhabited islands, getting rid of rats
should be a focus of conservation in the near future,
according to Dr Hoey.
"There's growing evidence, Like down on Macquarie
Island right down near Antarctica, where they've had successful eradication of things like rats and foxes
as well," he said.
11lf you can do it, and you can specifically target rats and get rid of them without harming the rest of the ecosystem, then
great."
Want more science from across the ABC?
■ Like us on Facebook
■ Follow us on Twitter
• Subscribe on YouTube
Bird droppings or guano provide high Levels of nitrogen
to island ecosystems. (Supplied: Guy Stevens)
https://www.abc.net.au/news/science/2018-07-12/pests-rats-damaging-cor175,efs-great-barrier-reef/9957628

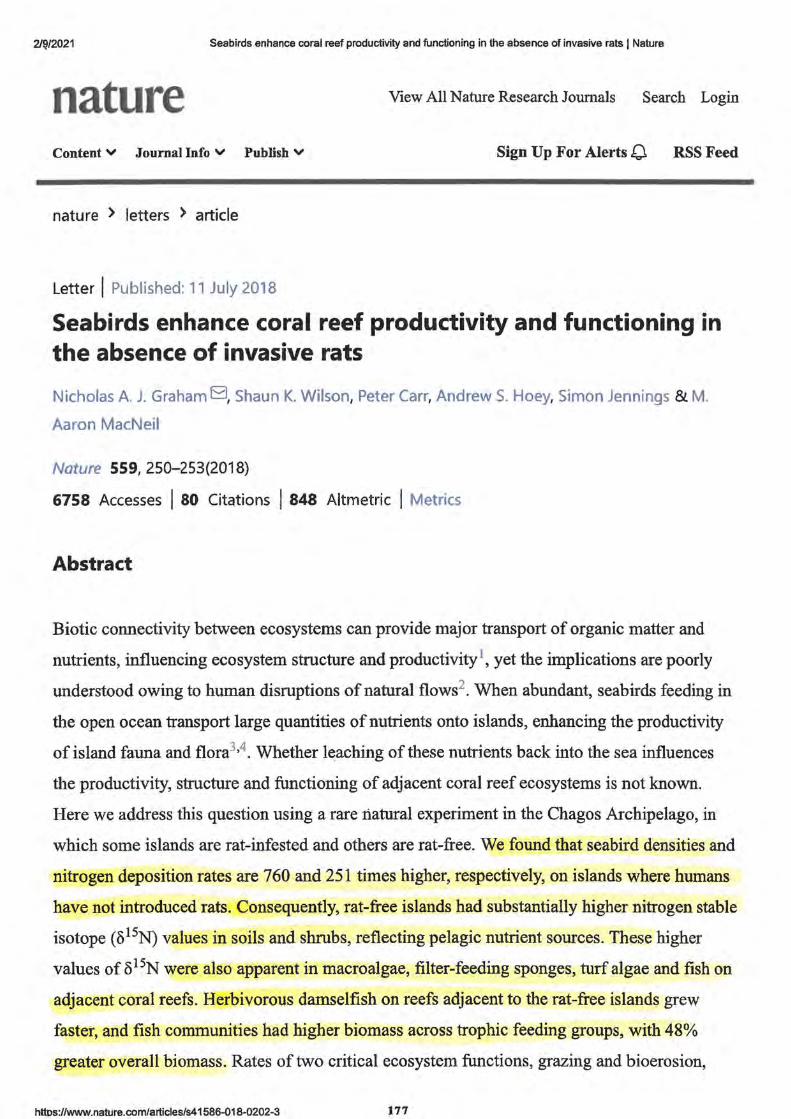
21$12021 Seabirds enhance coral reef productivity and functioning in the absence of invasive rats I Nature
nature View All Nature Research Journals Search Login
Content v Journal Info v Pub1ish v Sign Up For Alerts O RSS Feed
nature > letters > article
Letter I Published: 11 July 2018
Seabirds enhance coral reef productivity and functioning in the absence of invasive rats
Nicholas A. J. Graham El, Shaun K. Wilson, Peter Carr, Andrew S. Hoey, Simon Jennings & M.
Aaron MacNeil
Nature 559, 250-253(2018)
6758 Accesses I 80 Citations I 848 Altmetric I Metrics
Abstract
Biotic connectivity between ecosystems can provide major transport of organic matter and
nutrients, influencing ecosystem structure and productivity1, yet the implications are poorly
understood owing to human disruptions of natural · flows2. When abundant, seabirds feeding in
the open ocean transport large quantities of nutrients onto islands, enhancing the productivity
of island fauna and flora3•4. Whether leaching of these nutrients back into the sea influences
the productivity, structure and functioning of adjacent coral reef ecosystems is not known.
Here we address this question using a rare natural experiment in the Chagos Archipelago, in
which some islands are rat-infested and others are rat-free. We found that seabird densities and
nitrogen deposition rates are 760 and 251 times higher, respectively, on islands where humans
have not introduced rats. Consequently, rat-free islands had substantially higher nitrogen stable
isotope (o15N) values in soils and shrubs, reflecting pelagic nutrient sources. These higher
values of o15N were also apparent in macroalgae, filter-feeding sponges, turf algae and fish on
adjacent coral reefs. Herbivorous damselfish on reefs adjacent to the rat-free islands grew
faster, and fish communities had higher biomass across trophic feeding groups, with 48%
greater overall biomass. Rates of two critical ecosystem functions, grazing and bioerosion,
httos://www.nature.com/articles/s41586-018-0202-3 177

2/9/2021 Seabirds enhance coral reef productivity and functioning in the absence of invasive rats I Nature
were 3.2 and 3.8 times higher, respectively, adjacent to rat-free islands. Collectively, these
results reveal how rat introductions disrupt nutrient flows among pelagic, island and coral reef
ecosystems. Thus, rat eradication on oceanic islands should be a high conservation priority as
it is likely to benefit terrestrial ecosystems and enhance coral reef productivity and functioning
by restoring seabird-derived nutrient subsidies from large areas of ocean.
fa Access through your institution
Buy or subscribe
Access options
Rent or Buy
article
Get time limited or full article
access on ReadCube.
from $8.99
Rent or Buy
All prices are NET prices ..
Additional access options:
Login
Access through your institution
Learn about institutional subscriptions
References
Subscribe to
Journal
Get full journal access for
1 year
185,98 € only 3,65 € per issue
All prices are NET prices.
VAT will be added later in the checkout.
1. Polis, G. A., Anderson, W. B. & Holt, R. D. Toward an integration of landscape and
food web ecology: the dynamics of spatially subsidized food webs. Annu. Rev. Ecol. Syst.
28, 289-316 (1997).
178
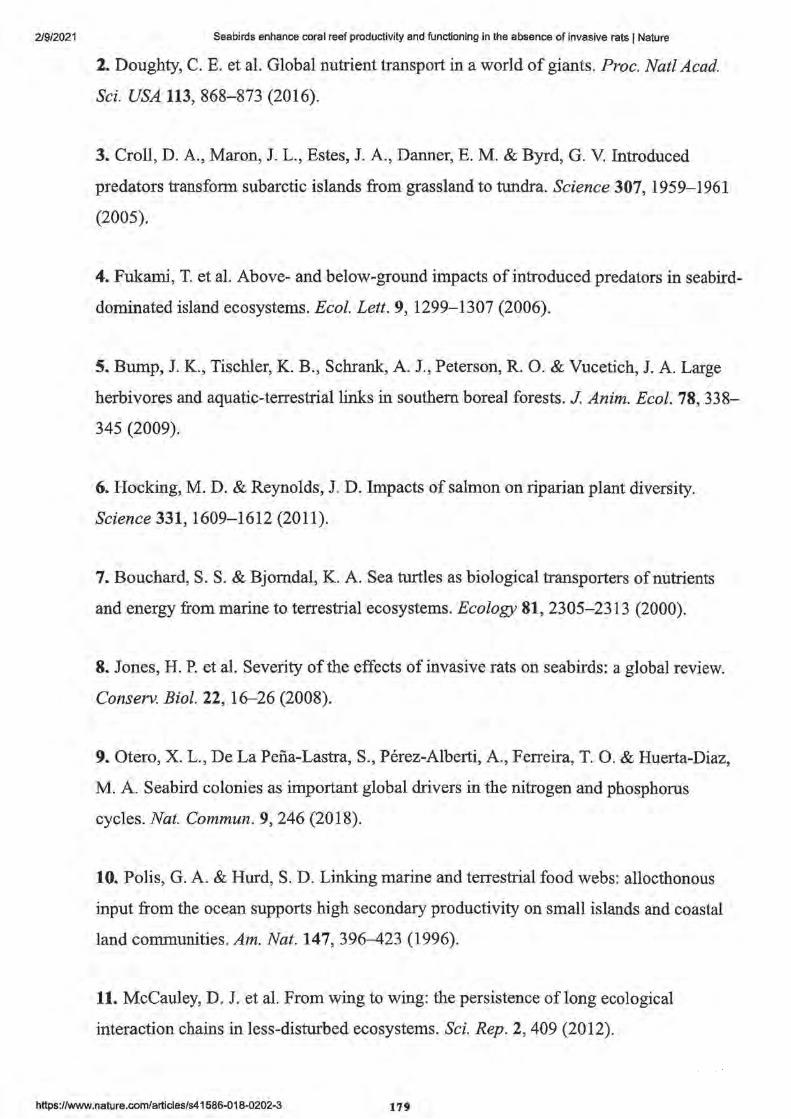
2/{l/2021 Seabirds enhance coral reef productivity and functioning in the absence of invasive rats I Nature
2. Doughty, C. E. et al. Global nutrient transport in a world of giants. Proc. Natl Acad.
Sci. USA 113, 868-873 (2016).
3. Croll, D. A., Maron, J. L., Estes, J. A., Danner, E. M. & Byrd, G. V. Introduced
predators transform subarctic islands from grassland to tundra. Science 307, 1959-1961
(2005).
4. Fukami, T. et al. Above- and below-ground impacts of introduced predators in seabird
dominated island ecosystems. Ecol. Lett. 9, 1299-1307 (2006).
5. Bump, J. K., Tischler, K. B., Schrank, A. J., Peterson, R. 0. & Vucetich, J. A. Large
herbivores and aquatic-terrestrial links in southern boreal forests. J Anim. Ecol. 78, 338-
345 (2009).
6. Hocking, M. D. & Reynolds, J. D. Impacts of salmon on riparian plant diversity.
Science 331, 1609-1612 (2011).
7. Bouchard, S.S. & Bjomdal, K. A. Sea turtles as biological transporters of nutrients
and energy from marine to terrestrial ecosystems. Ecology 81, 2305-2313 (2000).
8. Jones, H. P. et al. Severity of the effects of invasive rats on seabirds: a global review.
Conserv. Biol. 22, 16--26 (2008).
9. Otero, X. L., De La Pena-Lastra, S., Perez-Alberti, A., Ferreira, T. 0. & Huerta-Diaz,
M. A. Seabird colonies as important global drivers in the nitrogen and phosphorus
cycles. Nat. Commun. 9,246 (2018).
10. Polis, G. A. & Hurd, S. D. Linking marine and terrestrial food webs: allocthonous
input from the ocean supports high secondary productivity on small islands and coastal
land communities. Am. Nat. 147, 396--423 (1996).
11. McCauley, D. J. et al. From wing to wing: the persistence of long ecological
interaction chains in less-disturbed ecosystems. Sci. Rep. 2, 409 (2012).
https://www.nature.com/articles/s41586-018-0202-3 179
2/9/2021 Seabirds enhance coral reef productivity and functioning in the absence of invasive rats I Nature
12. 12. Shatova, 0., Wing, S. R., Gault-Ringold, M., Wing, L. & Hoffmann, L. J. Seabird
guano enhances phytoplankton production in the Southern Ocean. J Exp. Mar. Biol.
Ecol. 483, 74-87 (2016).
13. MacNeil, M.A. et al. Recovery potential of the world's coral reef fishes. Nature 520,
341-344 (2015).
14. Carr, P. in Important Bird Areas in the United Kingdom Overseas Territories (ed.
Sanders, S. M.) 37-55 (Royal Society for the Protection of Birds, Sandy, 2006).
15. Young, H. S., McCauley, D. J., Dunbar, R. B. & Dirzo, R. Plants cause ecosystem
nutrient depletion via the interruption of bird-derived spatial subsidies. Proc. Natl Acad.
Sci. USA 107, 2072-2077 (2010).
16. Szpak, P., Longstaffe, F. J., Millaire, J.-F. & White, C. D. Stable isotope
biogeochemistry of seabird guano fertilization: results from growth chamber studies with
maize (Zea mays). PLoS ONE 7, e33741 (2012).
17. Lorrain, A. et al. Seabirds supply nitrogen to reef-building corals on remote Pacific
islets. Sci. Rep. 7, 3721 (2017).
18. MaMahon. K. W., Johnson, B. J., Ambrose, W. G. Ocean Ecogeochemistry: a review.
Oceanogr. Mar. Biol. Annu. Rev. 51, 327-374 (2013).
19. Mora, C. Ecology of Fishes on Coral Reefs (Cambridge Univ. Press, Cambridge,
2015).
20. Bellwood, D. R., Hughes, T. P., Folke, C. & Nystrom, M. Confronting the coral reef
crisis. Nature 429, 827-833 (2004).
21. Hoey, A. S. & Bellwood, D.R. Cross-shelf variation in the role of parrotfishes on the
Great Barrier Reef. Coral Reefs 27, 37-47 (2008).
22.
httnc,-//IAI\A/\AI n:,h ,,., r,nm/,.rtir:IP.,::/,::41 !'illfi-01 R-0202-3 180
2/~/2021 Seabirds enhance coral reef productivity and functioning in the absence of invasive rats I Nature
Elrry, C. T., Kench, P. S., O'Leary, M. J., Morgan, K. M. & Januchowski-Hartley, F.
Linking reef ecology to island building: parrotfish identified as major producers of
island-building sediment in the Maldives. Geology 43, 503-506 (2015).
23. Sheppard, C.R. C. et al. Coral bleaching and mortality in the Chagos Archipelago.
Atoll Res. Bull. 613, 1-26 (2017).
24. Shantz, A. A. & Burkepile, D. E. Context-dependent effects of nutrient loading on
the coral-algal mutualism. Ecology 95, 1995-2005 (2014).
25. D' Angelo, C. & Wiedenmann, J. Impacts of nutrient enrichment on coral reefs: new
perspectives and implications for coastal management and reef survival. Curr. Opin.
Environ. Sustain. 7, 82-93 (2014).
26. Graham, N. A. J., Jennings, S., MacNeil, M.A., Mouillot, D. & Wilson, S. K.
Predicting climate-driven regime shifts versus rebound potential in coral reefs. Nature
518, 94-97 (2015).
27. Gove, J.M. et al. Near-island biological hotspots in barren ocean basins. Nature
Commun. 7, 10581 (2016).
28. Keitt, B. et al. Best practice guidelines for rat eradication on tropical islands. Biol.
Conserv. 185, 17-26 (2015).
29. Brooke, M. de L. et al. Seabird population changes following mammal eradications
on islands. Anim. Conserv. 21, 3-12 (2018).
30. Hughes, T. P. et al. Spatial and temporal patterns of mass bleaching of corals in the
Anthropocene. Science 359, 80-83 (2018).
31. Wenban-Smith, N. & Carter, M. Chagos: a History: Exploration, Exploitation,
Expulsion (Chagos Conservation Trust, London, 2016).
32.
https://www.nature.com/articles/s41586-018-0202-3 181
2/9/2021 Seabirds enhance coral reef productivity and functioning in the absence of invasive rats I Nature
S:Reppard, C.R. C. et al. Reefs and islands of the Chagos Archipelago, Indian Ocean:
why it is the world's largest no-take marine protected area. Aquat. Conse~. 22, 232-261
(2012).
33. Graham, N. A. J. et al. Human disruption of coral reef trophic structure. Curr. Biol.
27, 231-236 (2017).
34 . . Readman, J. W. et al. in Coral Reefs of the United Kingdom Overseas Territories
(ed. Sheppard, C.R. C.) 283-298 (Springer, Dordrecht, 2013).
35. Bibby, C. J., Burgess, N. B. & Hill, D. A. Bird Census Techniques (Academic,
London, 1992).
36. McGowan, A., Broderick, A. C. & Godley, B. J. Seabird populations of the Chagos
Archipelago: an evaluation of IBA sites. Oryx 42, 424-429 (2008).
37. del Hoyo, J., Elliott, A., Sargatal, J., Christie, D. A. & de Juana, E. (eds) Handbook
of the Birds of the World Alive (Lynx Edicions, Barcelona, 2017).
38. Krzywinski, M. & Altman, N. Visualizing samples with box plots. Nat. Methods 11,
119-120 (2014).
39. Jennings, S. & Collingridge, K. Predicting consumer biomass, size-structure,
production, catch potential, responses to fishing and associated uncertainties in the
world's marine ecosystems. PLoS ONE 10, e0133794 (2015).
40. Aumont, 0. & Bopp, L. Globalizing results from ocean in situ iron fertilization
studies. Glob. Biogeochem. Cycles 20, GB2017 (2006).
41. Mendez, L. et al. Geographical variation in the foraging behaviour of the pantropical
red-footed booby. Mar. Ecol. Prog. Ser. 568, 217-230 (2017).
42. Schmidtka, S., Johnson, G. C. & Lyman, J.M. MIMOC: A global monthly isopycnal
upper-ocean climatology with mixed layers. J Geophys. Res. 118, 1658-1672 (2013).
https://www.nature.com/articles/s41586-018-0202-3
2/~/2021 Seabirds enhance coral reef productivity and functioning in the absence of invasive rats I Nature
43. IOC, IHC, BODC. The GEBCO Digital Atlas. (BODC, 2008).
44. Ashmole, N. P. Body size, prey size, and ecological segregation in five sympatric
tropical terns (Aves: Laridae). Syst. Zoo!. 17, 292-304 (1968).
45. Harrison, C. S., Hida, T. S. & Seki, M. P. Hawaiian seabird feeding ecology. Wild!.
Monogr. 85, 3-71 (1983).
46. Wiebe, P. H., Boyd, S. H. & Cox, J. L. Relationships between zooplankton
displacement volume, wet weight, dry weight and carbon. Fish Bull. 73, 777-786 (1975).
47. Jennings, S. & Cogan, S. M. Nitrogen and carbon stable isotope variation in
northeast Atlantic fishes and squids. Ecology 96, 2568 (2015).
48. Martiny, A. C., Vrugt, J. A. & Lomas, M. W. Concentrations and ratios of particulate
organic carbon, nitrogen, and phosphorus in the global ocean. Sci. Data l, 140048
(2014).
49. Martiny, A. C., Vrugt, J. A., Primeau, F. W. & Lomas, M. W. Regional variation in
the particulate organic carbon to nitrogen ratio in the surface ocean. Glob. Biogeochem.
Cycles 27, 723-731 (2013).
50. Crossland, C. J., Hatcher, B. G. & Smith, S. V. Role of coral reefs in global ocean
production. Coral Reefs 10, 55---64 (1991).
51. Hatcher, B. G. Coral reef primary productivity. A hierarchy of pattern and process.
Trends Ecol. Evol. 5, 149-155 (1990).
52. Salvatier, J., Wiecki, T. V. & Fonnesbeck, C. Probabilistic programming in Python
using PyMC3. PeerJ Comput. Sci. 2, e55 (2016).
53. Gelman, A. et al. Bayesian Data Analysis Vol. 2 (CRC, Boca Raton 2014).
54.
https://www.nature.com/articles/s41586-018-0202-3 183
2/9/2021 Seabirds enhance coral reef productivity and functioning in the absence of invasive rats I Nature
6'Aimpana, S. E. Otolith science entering the 21st century. Mar. Freshw. Res. 56, 485--495
(2005).
55. Pardo, S. A., Cooper, A. B. & Dulvy, N. K. Avoiding fishy growth curves. Methods
Ecol. Evol. 4, 353-360 (2013).
56. Wilson, S. K., Graham, N. A. J. & Polunin, N. V. C. Appraisal of visual assessments
of habitat complexity and benthic composition on coral reefs. Mar. Biol. 151, 1069-1076
(2007).
57. Letoumeur, Y. Length-weight relationships of some marine fish species in Reunion
Island, Indian Ocean. Naga 21, 37-39 (1998).
58. Wilson, S. K. et al. Exploitation and habitat degradation as agents of change within
coral reef fish communities. Glob. Chang. Biol. 14, 2796-2809 (2008).
59. Ong, L. & Holland, K. N. Bioerosion of coral reefs by two Hawaiian parrotfishes:
species, size differences and fishery implications. Mar. Biol. 157, 1313-1323 (2010).
60. McDuie, F., Weeks, S. J., Miller, M. G. R. & Congdon, B. C. Breeding tropical
shearwaters use distant foraging sites when self-provisioning. Mar. Ornithol. 43, 123-
129 (2015).
61. Calabrese, L. Foraging Ecology and Breeding Biology of Wedge-Tailed Shearwater
(Puffinus Pacificus) and Tropical Shearwater (Puffinus Bailloni) on Aride Island Nature
Reserve, Seychelles : Tools for Conservation. PhD thesis, Universite Pierre et Marie
Curie-Paris VI (2015).
62. Pennycuick, C. J., Schaffner, F. C., Fuller, M. R., Obrecht, H. H. III & Sternberg, L.
Foraging flights of the white-tailed tropicbird (Phaethon lepturus): radiotracking and
doubly-labelled water. Colon. Waterbirds 13, 96-102 (1990).
63. Jaquemet, S., Le Corre, M., Marsac, F., Potier, M. & Weimerskirch, H. Foraging
habitats of the seabird community of Europa Island (Mozambique Channel). Mar. Biol.
https://www.nature.com/articles/s41586-018-0202-3 1114
2/~/2021 Seabirds enhance coral reef productivity and functioning in the absence of invasive rats I Nature
147, 573-582 (2005).
64. Gilardi, J. D. Sex-specific foraging distributions of brown boobies in the eastern
tropical Pacific. Colon. Waterbirds 15, 148-151 (1992).
65. Weimerskirch, H., Le Corre, M., Jaquemet, S. & Marsac, F. Foraging strategy of a
tropical seabird, the red-footed booby, in a dynamic marine environment. Mar. Ecol.
Prog. Ser. 288, 251-261 (2005).
66. Surman, C. A. & Wooller, R. D. Comparative foraging ecology of five sympatric
terns at a sub-tropical island in the eastern Indian Ocean. J Zoo!. (Lond.) 259, 219-230
(2003).
67. Bourne, W.R. P. & Simmons, K. E. L. The distribution and breeding success of
seabirds on and around Ascension in the tropical Atlantic Ocean. Atl. Seabirds 3, 187-
202 (2001).
68. Dunlop, J. N. Foraging range, marine habitat and diet of bridled terns breeding in
Western Australia. Corella 21, 77-82 (1997).
69. Hulsman, K. & Smith, G. Biology and growth of the black-naped tern (Sterna
sumatrana): A hypothesis to explain the relative growth rates of inshore, offshore and
pelagic feeders. Emu 88, 234-242 (1988).
Acknowledgements
This research was supported by the Australian Research Council's Centre of Excellence
Program (CE140100020), a Royal Society University Research Fellowship awarded to
N.A.J.G. (UF140691), and a Tier II NSERC Canada Research Chair awarded to M.A.M. We
thank the British Indian Ocean Territory section of the British Foreign and Commonwealth
Office for permission to conduct the study, and J. Turner for organizing the expedition. Animal
ethics for fish collection were approved by James Cook University (approval number A2166).
httmd/www_n,.t,m:.,_r.om/articles/s41586-018-0202-3 185
2/9/2021 Seabirds enhance coral reef productivity and functioning in the absence of invasive rats I Nature
Thanks to J. Lokrantz for graphics help with Figs. 1, 2, and J. Barlow, S. Keith, and R. Evans
for comments on the manuscript.
Reviewer information
Nature thanks Y. Cherel, N. Knowlton and S. Wing for their contribution to the peer review of
this work.
Author information
Affiliations
1. Lancaster Environment Centre, Lancaster University, Lancaster, UK
Nicholas A. J. Graham
2. ARC Centre of Excellence for Coral Reef Studies, James Cook University, Townsville,
Queensland, Australia
Nicholas A. J. Graham & Andrew S. Hoey
3. Department of Biodiversity, Conservation and Attractions, Perth, Western Australia,
Australia
Shaun K. Wilson
4. Oceans Institute, University of Western Australia, Crawley, Western Australia, Australia
Shaun K. Wilson
5. Institute of Zoology, Zoological Society of London, London, UK
Peter Carr
186
2/9/2021 Seabirds enhance coral reef productivity and functioning in the absence of invasive rats I Nature
6. College of Life and Environmental Sciences, University of Exeter, Exeter, UK
Peter Carr
7. International Council for the Exploration of the Sea, Copenhagen, Denmark
Simon Jennings
8. Department of Biology, Dalhousie University, Halifax, Nova Scotia, Canada
M. Aaron MacNeil
Contributions
N.A.J.G. conceived the study with S.K.W.; N.A.J.G., S.K.W. and P.C. collected the data;
N.A.J.G., M.A.M., S.J. and A.S.H. developed and implemented the analyses; N.A.J.G. led the
writing of the manuscript with S.K.W., M.A.M., S.J., A.S.H. and P.C.
Corresponding author
Correspondence to Nicholas A. J. Graham.
Ethics declarations
Competing interests
The authors declare no competing interests.
Additional information
Publisher's note: Springer Nature remains neutral with regard to jurisdictional claims in
published maps and institutional affiliations.
https://www.nature.com/articles/s41586-018-0202-3 187
2/9/2021 Seabirds enhance coral reef productivity and functioning in the absence of invasive rats I Nature
Extended data figures and tables
Extended Data Fig. 1 Primary production and potential prey biomass and production in areas accessible to seabirds foraging around the Chagos Islands. a, Recorded foraging ranges for seabird species that feed on smaller prey (light tone, 0.1-9 g
individual wet weight) or larger prey (dark tone, 1-50 g individual wet weight; broken lines
indicate that greater ranges are expected for two of the species thus foraging area calculations
assumed that the foraging range is the radius of the foraging area). b, Primary production in
the foraging area. c, Modelled biomass. d, Production of fauna in the foraging area. Median
and 90% uncertainty intervals on the basis of 10,000 simulations to assess the effects of
parameter uncertainty39 on biomass or production estimates are shown. Biomass and
production were estimated for fauna in the prey size ranges consumed by each bird species,
and expressed as wet and nitrogen (N) weight, respectively.
Extended Data Table 1 Species-specific foraging locations, foraging distances and
foraging observations from Cbagos
Extended Data Table 2 Islands used in the study
Supplementary information
Reporting Summary
Rights and permissions
Reprints and Permissions
About this article
https://www.nature.com/articles/s41586-018-0202-3 lllX
2/9/2021 Seabirds enhance coral reef productivity and functioning in the absence of invasive rats I Nature
Cite this article
Graham, N.A.J., Wilson, S.K., Carr, P. et al. Seabirds enhance coral reef productivity and
functioning in the absence of invasive rats. Nature 559, 250-253 (2018).
https://doi.org/10.1038/s41586-018-0202-3
Received 16 January 2018 Accepted 09 May 2018 Published 11 July 2018
Issue Date 12 July 2018 DOI https://doi.org/10.1038/s41586-018-0202-3
Subjects Conservation biology • Ecosystem ecology • Invasive species • Marine biology
Further reading
• Variability in coral reef fish baseline and benchmark biomass in the
central and western Indian Ocean provinces Timothy R. Mcclanahan, Alan M. Friedlander[ ... ] & J. Henrich Bruggemann
Aquatic Conservation: Marine and Freshwater Ecosystems (2021)
• Risks to future atoll habitability from climate-driven environmental
changes Virginie K. E. Duvat, Alexandre K. Magnan[ ... ] & Goneri Le Cozannet
WIREs Climate Change (2021)
• Persistent organic pollutants in sea bird eggs from the Indian
Ocean's Mascarene Basin Veronica van der Schyff, Nee Sun Choong Kwet Vive[ ... ] & Hindrik Bouwman
Science of The Total Environment (2021)
https://www,nature.com/articles/s41586-018-0202-3 189
2/9/2021 Seabirds enhance coral reef productivity and functioning in the absence of invasive rats I Nature
• Seabird droppings: Effects on a global and local level
Saul De La Pena-Lastra
Science of The Total Environment (2021)
• Surface slicks are pelagic nurseries for diverse ocean fauna
Jonathan L. Whitney, Jamison M. Gove[ ... ] & Gregory P. Asner
Scientific Reports (2021)
Nature ISSN 1476-4687 (online)
© 2021 Springer Nature Limited
190
Section E:
Impact of Climate reports
191

2/9/2021 The Coral Bleaching Debate: Is Bleaching the Legacy of a Marvelous Adaptation Mechanism or A Prelude
Home AMS Editors Justify Half-truth Climate
Sck,nce
Wildlife, Plants and Climc1te
Ocean~, Ice, Fire & Extreme Weather
The Coral Bleaching Debate: Is Bleaching the Legag. of a
Marvelous Adantation Mechanism or A Prelude to Extirpation?
AWarm Evolutionary...l&g~
Greatest Climate Myths
Despite increasing confirmation of the Adaptive Bleaching Hypothesis and its ability to explain coral resilience, most people are unaware of its debate within the scientific community. The ability to rapidly adjust to changing environments by modifying their symbiotic partnerships has been the key to their success · for millions of years. As one e.xpert wrote, the "flexibility in coral-algal symbiosis is likely to be a principal factor underlying the evolutionary success of these organisms".
Our modem day reef-building corals first evolved in exceedingly warm and stable climates when deep ocean temperatures were 10°C higher than today and palm trees dotted the Antarctic coast. As ice caps began to form in Antarctica -35 million years ago sea levels fell and warm epi-continental seas dried. After ocean depths had cooled for another 30 million years, Arctic ice caps began to form and the earth entered an age with multiple episodes of glacier advances and retreats causing sea levels to rise and fall. Just eighteen thousand years ago during the last glacial maximum, all our shallow reefs did not exist, as sea levels were 400 feet lower than today.
The 35 million year cooling trend increasinglY- restricted reef-building corals to more tropical latitudes where winter water temperatures remain above 16 to 18 °C. As their evolutionary history would predict, today's greatest concentrations and greatest diversity of corals are found in the earth's persistently warmer waters, like the Indo-Pacific Warm Pool. Likewise species inhabiting our warmest waters have undergone the fewest episodes of severe coral bleaching. Given their evolutionary history, coral's greatest achievement has been enduring bouts of sustained climate cooling and rapid temperature swings. Even during warm interglacials coral battled cold temperatures dips. Studies of 7000-year-old fossil coral reefs in the South China Sea revealed high coral mortality every 50 years due to winter cooling events. Indeed most researchers believe past coral extinctions were most commonly due to cold events. Accordingly research has estimated that during the cold nadir of each ice age, coral reef extent was reduced by 80% and carbonate production was reduced by 73% relative to today.
landscapesandcycles.net/coral-bleaching-debate.html 193
Free Educational Resources About Jirr, Steele
Based on my writings on penguins I was honored by Australia's Institute of Public Affairs to contribute a chapter on the current state of the Emperor Penguins in the IPA's new book Climate Change: The Facts 2020. https://climatechangethefacts.org..fil!.
My interview with the Cornwall Alliance for the Stewardshi12 of Creation: Ocean Acidification: Real Threat or Fake News
Is there a Climate Crisis? My interview on "Ask John"
$1000 Student Climate Challenge ~
Book Reviews
Interviews and Presentation,
Clarifying Lies from Internet Snipell
Daily Kos Eschews Anthrax Basic Epidemiology. Embraces Climate Fear Mongcring
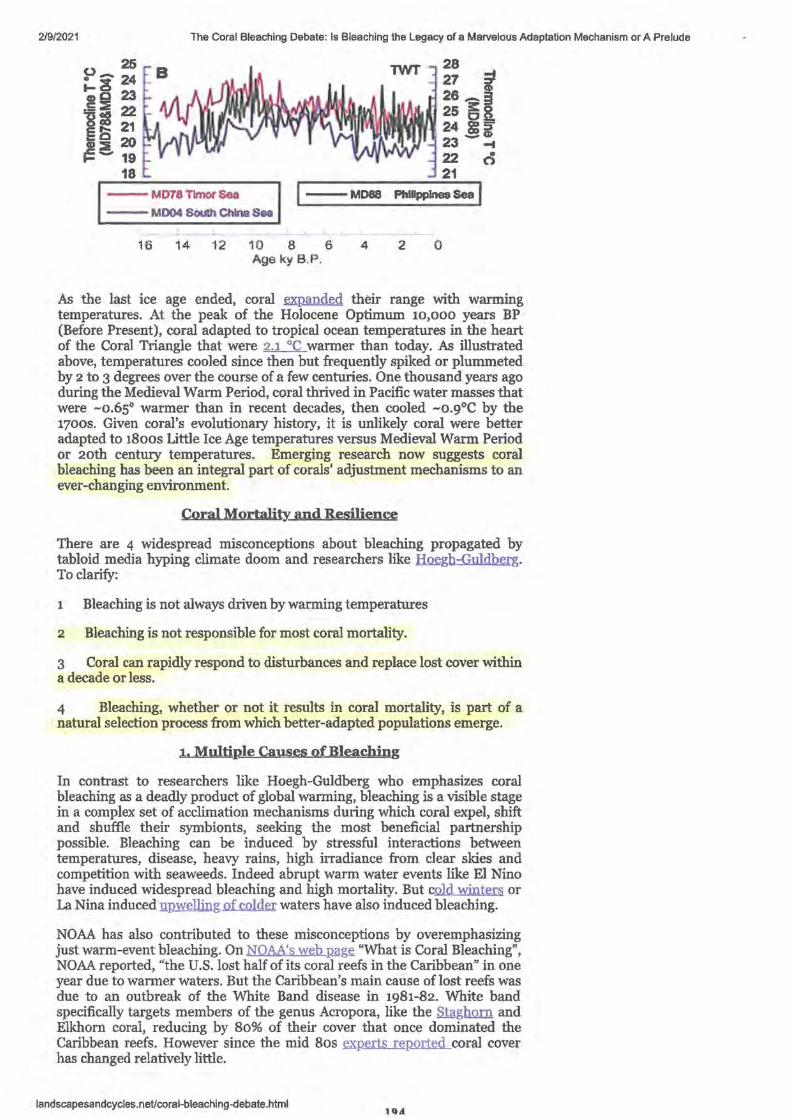
2/9/2021 The Coral Bleaching Debate: Is Bleaching the Legacy of a Marvelous Adaptation Mechanism or A Prelude
25 P- 24 1-c!J 23 Ii 22 1 ~ 21 lo 20 ~e 19
18
28 27 ';}.
CD 2a_ 3 25 ~8.. 24 ~i 23-_, 22 d 21
MD78 Timor sea I ---MD04 SOUth China Sea .
--M088 Phlllpplne8 Sea I
16 14 12 10 8 6 4 2 0 Ageky B.P.
As the last ice age ended, coral ~xpanded their range with warming temperatures. At the peak of the Holocene Optimum 10,000 years BP (Before Present), coral adapted to tropical ocean temperatures in the heart of the Coral Triangle that were 2.1 °C warmer than today. As illustrated above, temperatures cooled since then but frequently spiked or plummeted by 2 to 3 degrees over the course of a few centuries. One thousand years ago during the Medieval Warm Period, coral thrived in Pacific water masses that were -0.65° warmer than in recent decades, then cooled -o.9°C by the 1700s. Given coral's evolutionary history, it is unlikely coral were better adapted to 1800s Little Ice Age temperatures versus Medieval Warm Period or 20th century temperatures. Emerging research now suggests coral bleaching has been an integral part of corals' adjustment mechanisms to an ever-changing environment.
Coral MortalitY- and Resilience
There are 4 widespread misconceptions about bleaching propagated by tabloid media hyping climate doom and researchers like ~gh--Guldberg. To clarify:
1 Bleaching is not always driven by warming temperatures
2 Bleaching is not responsible for most coral mortality.
3 Coral can rapidly respond to disturbances and replace lost cover within a decade or less.
4 Bleaching, whether or not it results in coral mortality, is part of a natural selection process from which better-adapted populations emerge.
1. Multiple Causes of Bleaching
In contrast to researchers like Hoegh-Guldberg who emphasizes coral bleaching as a deadly product of global warming, bleaching is a visible stage in a complex set of acclimation mechanisms during which coral expel, shift and shuffle their symbionts, seeking the most beneficial partnership possible. Bleaching can be induced by stressful interactions between temperatures, disease, heavy rains, high irradiance from clear skies and competition with seaweeds. Indeed abrupt warm water events like El Nino have induced widespread bleaching and high mortality. But cold winters or La Nina induced l!P-Welling of colder waters have also induced bleaching.
NOAA has also contributed to these misconceptions by overemphasizing just warm-event bleaching. On NOAA's web ll!lge "What is Coral Bleaching", NOAA reported, "the U.S. lost half of its coral reefs in the Caribbean" in one year due to warmer waters. But the Caribbean's main cause oflost reefs was due to an outbreak of the White Band disease in 1981-82. White band specifically targets members of the genus Acropora, like the Staghorn and Elkhorn coral, reducing by 80% of their cover that once dominated the Caribbean reefs. However since the mid Sos ~perts reP-orted coral cover has changed relatively little.
landscapesandcycles.net/coral-bleaching-debate.html
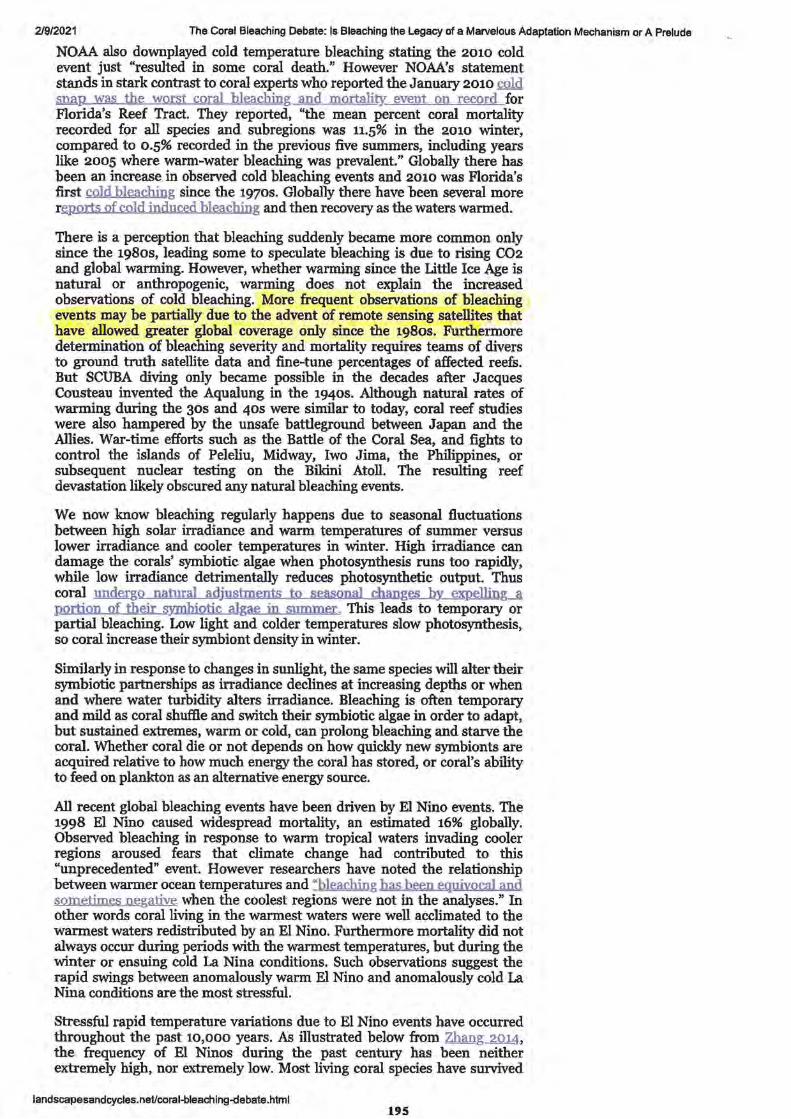
2/9/2021 The Coral Bleaching Debate: Is Bleaching the Legacy of a Marvelous Adaptation Mechanism or A Prelude
NOAA also downplayed cold temperature bleaching stating the 2010 cold event just "resulted in some coral death." However NOAA's statement stands in stark contrast to coral experts who reported the January 2010 cold filli!P was the worst coral bleaching and mortality, event on record for Florida's Reef Tract. They reported, "the mean percent coral mortality recorded for all species and subregions was 11.5% in the 2010 winter, compared to 0.5% recorded in the previous five summers, including years like 2005 where warm-water bleaching was prevalent." Globally there has been an increase in observed cold bleaching events and 2010 was Florida's first cold bleaching since the 1970s. Globally there have been several more reports of cold induced bleaching and then recovery as the waters warmed.
There is a perception that bleaching suddenly became more common only since the 1980s, leading some to speculate bleaching is due to rising CO2 and global warming. However, whether warming since the Little Ice Age is natural or anthropogenic, warming does not explain the increased observations of cold bleaching. More frequent observations of bleaching events may be partially due to the advent of remote sensing satellites that have allowed greater global coverage only since the 1980s. Furthermore determination of bleaching severity and mortality requires teams of divers to ground truth satellite data and fine-tune percentages of affected reefs. But SCUBA diving only became possible in the decades after Jacques Cousteau invented the Aqualung in the 1940s. Although natural rates of warming during the 30s and 40s were similar to today, coral reef studies were also hampered by the unsafe battleground between Japan and the Allies. War-time efforts such as the Battle of the Coral Sea, and fights to control the islands of Peleliu, Midway, lwo Jima, the Philippines, or subsequent nuclear testing on the Bikini Atoll. The resulting reef devastation likely obscured any natural bleaching events.
We now know bleaching regularly happens due to seasonal fluctuations between high solar irradiance and warm temperatures of summer versus lower irradiance and cooler temperatures in winter. High irradiance can damage the corals' symbiotic algae when photosynthesis runs too rapidly, while low irradiance detrimentally reduces photosynthetic output. Thus coral undergo natural adjustments to seasonal chang~Y. ~elling.....a portion of their ~biotic algae in summer. This leads to temporary or partial bleaching. Low light and colder temperatures slow photosynthesis, so coral increase their symbiont density in winter.
Similarly in response to changes in sunlight, the same species will alter their symbiotic partnerships as irradiance declines at increasing depths or when and where water turbidity alters irradiance. Bleaching is often temporary and mild as coral shuffle and switch their symbiotic algae in order to adapt, but sustained extremes, warm or cold, can prolong bleaching and starve the coral. Whether coral die or not depends on how quickly new symbionts are acquired relative to how much energy the coral has stored, or coral's ability to feed on plankton as an alternative energy source.
All recent global bleaching events have been driven by El Nino events. The 1998 El Nino caused widespread mortality, an estimated 16% globally. Observed bleaching in response to warm tropical waters invading cooler regions aroused fears that climate change had contributed to this "unprecedented" event. However researchers have noted the relationship between warmer ocean temperatures and "bleaching has been equivocal and sometimes negative when the coolest regions were not in the analyses." In other words coral living in the warmest waters were well acclimated to the warmest waters redistributed by an El Nino. Furthermore mortality did not always occur during periods with the warmest temperatures, but during the winter or ensuing cold La Nina conditions. Such observations suggest the rapid swings between anomalously warm El Nino and anomalously cold La Nina conditions are the most stressful.
Stressful rapid temperature variations due to El Nino events have occurred throughout the past 10,000 years. As illustrated below from Zhfil!g...2.Q.1_4, the frequency of El Ninos during the past century has been neither extremely high, nor extremely low. Most living coral species have survived
landscapesandcycles.net/coral-bleaching-debate.html 195
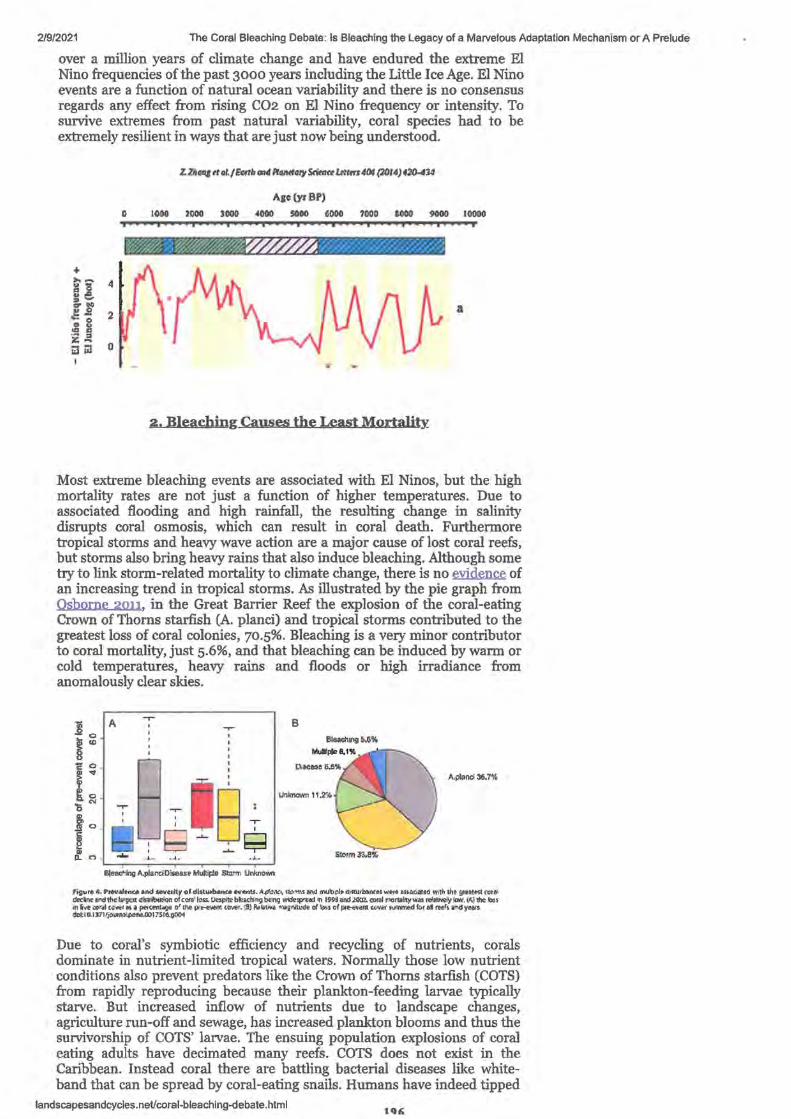
2/9/2021 The Coral Bleaching Debate: Is Bleaching the Legacy of a Marvelous Adaptation Mechanism or A Prelude
over a million years of climate change and have endured the extreme El Nino frequencies of the past 3000 years including the Little Ice Age. El Nino events are a function of natural ocean variability and there is no consensus regards any effect from rising CO2 on El Nino frequency or intensity. To survive extremes from past natural variability, coral species had to be extremely resilient in ways that are just now being understood.
ZZilaq rt al. /Ettnh tal4 PIOMto~ Srimff uttm404 (2014)420-4'4
AJc(yrBP)
0 1000 2000 SOOCI 4000 5000 6000 7000 JOOO 9000 10000 e I I ;
+
(\ >, .....
4 ll ... ~ a !- 2 0 8
!!:! ~ .z -i3 iil 0
2. Bleaching Causes the Least MortalitY-
Most extreme bleaching events are associated with El Ninos, but the high mortality rates are not just a function of higher temperatures. Due to associated flooding and high rainfall, the resulting change in salinity disrupts coral osmosis, which can result in coral death. Furthermore tropical storms and heavy wave action are a major cause of lost coral reefs, but storms also bring heavy rains that also induce bleaching. Although some try to link storm-related mortality to climate change, there is no evidence of an increasing trend in tropical storms. As illustrated by the pie graph from Osborne 2011, in the Great Barrier Reef the explosion of the coral-eating Crown of Thorns starfish (A. planci) and tropical storms contributed to the greatest loss of coral colonies, 70.5%. Bleaching is a very minor contributor to coral mortality, just 5.6%, and that bleaching can be induced by warm or cold temperatures, heavy rains and floods or high irradiance from anomalously clear skies.
B
A.pland 36.7%
Unknown 11.2'-A
Eleao"lng A.plar.clD'saast Multi¢• Sl:L-m Unknown
ftgure 4, P..vafenta and sevedt,, of dkl~ evenu. A..(I01"t:1, lh.'-'"'\\S and mult1d!- dlffi.ltMnciK 'A'M 6U,OC,attd with th! {f1Ht"1 coral dec~n• 1"<1 tt,c largest 11..-on of ccia' ~ ... Oapiu, bt:ach "9 b<ng w,1,,,,.,..,. ., 199hncl.!OIXI. ..,,., nonal1ty ws 1<11..,.1/ law. ,,._, 1hc io,, 41 live mr•I ,~...e, as ii peicftlt.;e a' the pr~t'lt ,ow-.... !9) R.litrw• "'lll'fl'YlL-dt of -lbs cf p,HN'oent wver turntr.ed fat al reef, 1--d )'HB-:iotl 0.117Jt;~u,n,l~.OOl 7SC6.9()04
Due to coral's symbiotic efficiency and recycling of nutrients, corals dominate in nutrient-limited tropical waters. Normally those low nutrient conditions also prevent predators like the Crown of Thorns starfish (COTS) from rapidly reproducing because their plankton-feeding larvae typically starve. But increased inflow of nutrients due to landscape changes, agriculture run-off and sewage, has increased plankton blooms and thus the survivorship of COTS' larvae. The ensuing population explosions of coral eating adults have decimated many reefs. COTS does not exist in the Caribbean. Instead coral there are battling bacterial diseases like whiteband that can be spread by coral-eating snails. Humans have indeed tipped
landscapesandcycles.net/coral-bleaching-debate.html
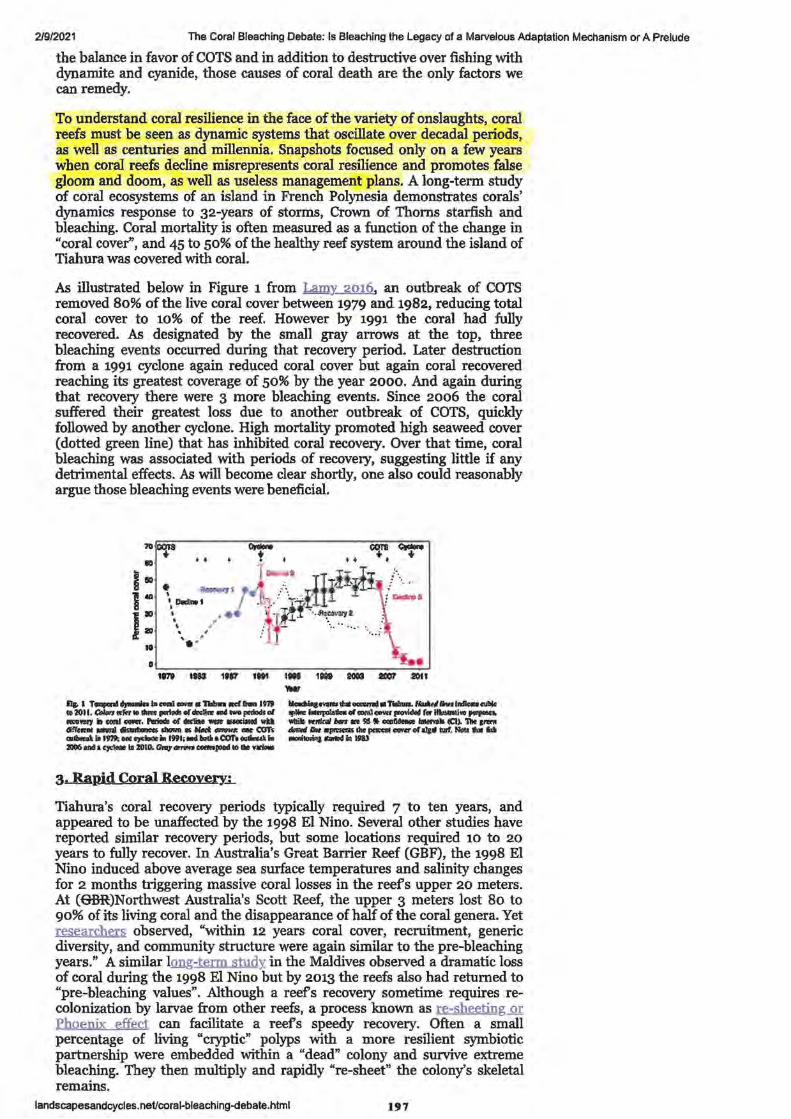
2/9/2021 The Coral Bleaching Debate: Is Bleaching the Legacy of a Marvelous Adaptation Mechanism or A Prelude
the balance in favor of COTS and in addition to destructive over fishing with dynamite and cyanide, those causes of coral death are the only factors we can remedy.
To understand coral resilience in the face of the variety of onslaughts, coral reefs must be seen as dynamic systems that oscillate over decadal periods, as well as centuries and millennia. Snapshots focused only on a few years when coral reefs decline misrepresents coral resilience and promotes false gloom and doom, as well as useless management plans. A long-term study of coral ecosystems of an island in French Polynesia demonstrates corals' dynamics response to 32-years of storms, Crown of Thorns starfish and bleaching. Coral mortality is often measured as a function of the change in "coral cover", and 45 to 50% of the healthy reef system around the island of Tiahura was covered with coral.
As illustrated below in Figure 1 from LwnY. 2016, an outbreak of COTS removed 80% of the live coral cover between 1979 and 1982, reducing total coral cover to 10% of the reef. However by 1991 the coral had fully recovered. As designated by the small gray arrows at the top, three bleaching events occurred during that recovery period. Later destruction from a 1991 cyclone again reduced coral cover but again coral recovered reaching its greatest coverage of 50% by the year 2000. And again during that recovery there were 3 more bleaching events. Since 2006 the coral suffered their greatest loss due to another outbreak of COTS, quickly followed by another cyclone. High mortality promoted high seaweed cover (dotted green line) that has inhibited coral recovery. Over that time, coral bleaching was associated with periods of recovery, suggesting little if any detrimental effects. As will become clear shortly, one also could reasonably argue those bleaching events were beneficial.
17c,l T ............ la-1-a'll,lnq!fflO-ln, ......, __ _.._~~--1 ..... «ullla I02011;(Wo,,:,.,rc,ioMCpcri,ldsof~-,-ptlblsof IPlfoc~of-1-p..w.lf«""-1•,..._.. ..,._,Ii_. _, l'mads of diclilll -~ fll 1llllill Rlllal!Nrnts•_,.... ....._«:I). 'Ille,,_ __ .-111....._._ • .,,... ___ ccm .. 1111.,__..,.,...__.,alsAI_,,,.....,. .. ......... ,,,.. ... ~-·"'·• .... •CiCmoodioeA.. -----, ....,ii\ 191) 2006&Dd a q,:i- la 2010. 0.,-~ IO 1k YIIIM
3....Rapid Coral Recovery_;_
Tiahura's coral recovery periods typically required 7 to ten years, and appeared to be unaffected by the 1998 El Nino. Several other studies have reported similar recovery periods, but some locations required 10 to 20 years to fully recover. In Australia's Great Barrier Reef (GBF), the 1998 El Nino induced above average sea surface temperatures and salinity changes for 2 months triggering massive coral losses in the reefs upper 20 meters. At (GBR:)Northwest Australia's Scott Reef, the upper 3 meters lost 80 to 90% of its living coral and the disappearance of half of the coral genera. Yet researchers observed, "within 12 years coral cover, recruitment, generic diversity, and community structure were again similar to the pre-bleaching years." A similar loog-term study in the Maldives observed a dramatic loss of coral during the 1998 El Nino but by 2013 the reefs also had returned to "pre-bleaching values". Although a reefs recovery sometime requires recolonization by larvae from other reefs, a process known as re-sheeting or Phoenix effect can facilitate a reefs speedy recovery. Often a small percentage of living "cryptic" polyps with a more resilient symbiotic partnership were embedded within a "dead" colony and survive extreme bleaching. They then multiply and rapidly "re-sheet" the colony's skeletal remains.
landscapesandcycles.net/coral-bleaching-debate.html 197
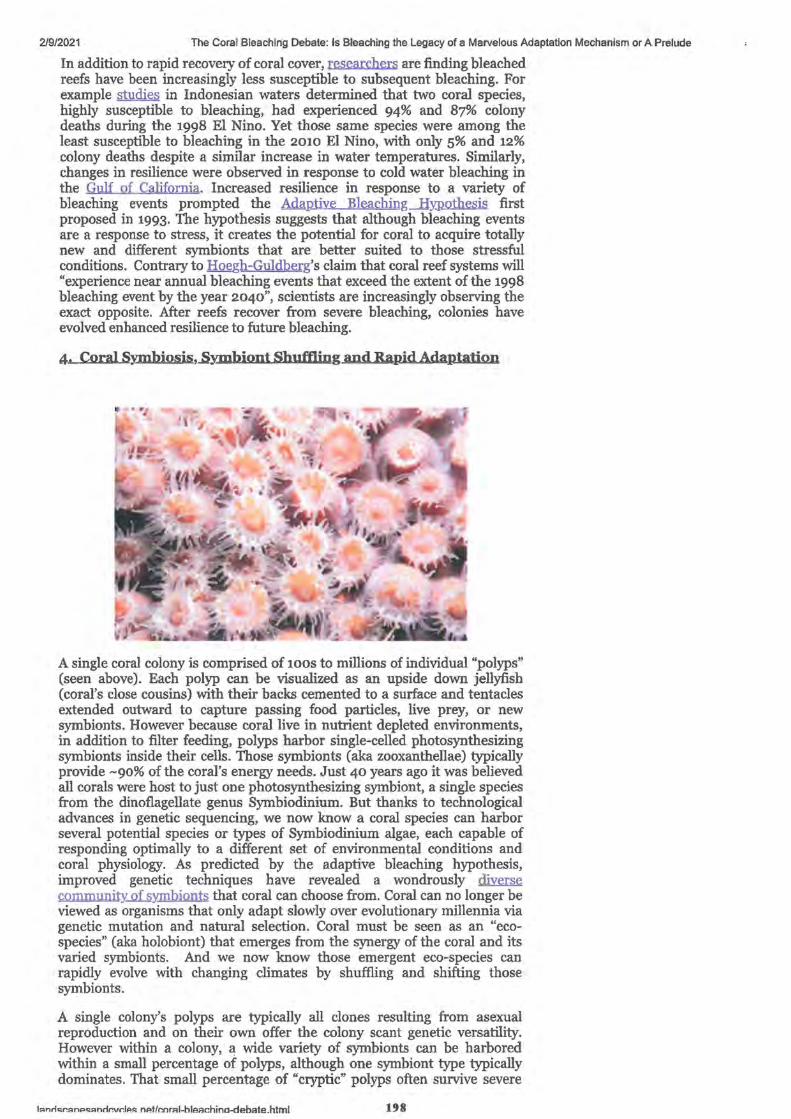
2/9/2021 The Cora! Bleaching Debate: Is Bleaching the Legacy of a Marvelous Adaptation Mechanism or A Prelude
In addition to rapid recovery of coral cover, researchers are finding bleached reefs have been increasingly less susceptible to subsequent bleaching. For example studies in Indonesian waters determined that two coral species, highly susceptible to bleaching, had experienced 94% and 87% colony deaths during the 1998 El Nino. Yet those same species were among the least susceptible to bleaching in the 2010 El Nino, with only 5% and 12% colony deaths despite a similar increase in water temperatures. Similarly, changes in resilience were observed in response to cold water bleaching in the Gulf of California. Increased resilience in response to a variety of bleaching events prompted the Adaptive Bleaching_HY.Pothesis first proposed in 1993. The hypothesis suggests that although bleaching events are a response to stress, it creates the potential for coral to acquire totally new and different symbionts that are better suited to those stressful conditions. Contrary to Hoegh-Guldberg's claim that coral reef systems will "experience near annual bleaching events that exceed the extent of the 1998 bleaching event by the year 2040", scientists are increasingly observing the exact opposite. After reefs recover from severe bleaching, colonies have evolved enhanced resilience to future bleaching.
4. Coral Symbiosis, Symbiont Shuffling and Rapid Adaptation
A single coral colony is comprised of 100s to millions of individual "polyps" (seen above). Each polyp can be visualized as an upside down jellyfish (coral's close cousins) with their backs cemented to a surface and tentacles extended outward to capture passing food particles, live prey, or new symbionts. However because coral live in nutrient depleted environments, in addition to filter feeding, polyps harbor single-celled photosynthesizing symbionts inside their cells. Those symbionts (aka zooxanthellae) typically provide ~90% of the coral's energy needs. Just 40 years ago it was believed all corals were host to just one photosynthesizing symbiont, a single species from the dinoflagellate genus Symbiodinium. But thanks to technological advances in genetic sequencing, we now know a coral species can harbor several potential species or types of Symbiodinium algae, each capable of responding optimally to a different set of environmental conditions and coral physiology. As predicted by the adaptive bleaching hypothesis, improved genetic techniques have revealed a wondrously diverse community....Qf.sY.1I1bionts that coral can choose from. Coral can no longer be viewed as organisms that only adapt slowly over evolutionary millennia via genetic mutation and natural selection. Coral must be seen as an "ecospecies" (aka holobiont) that emerges from the synergy of the coral and its varied syrnbionts. And we now know those emergent eco-species can rapidly evolve with changing climates by shuffling and shifting those symbionts.
A single colony's polyps are typically all clones resulting from asexual reproduction and on their own offer the colony scant genetic versatility. However within a colony, a wide variety of symbionts can be harbored within a small percentage of polyps, although one symbiont type typically dominates. That small percentage of "cryptic" polyps often survive severe
'""""""nR<:<1nrlr,vdA<: .nP.t/r.nml-hleRchino-debate.html 198
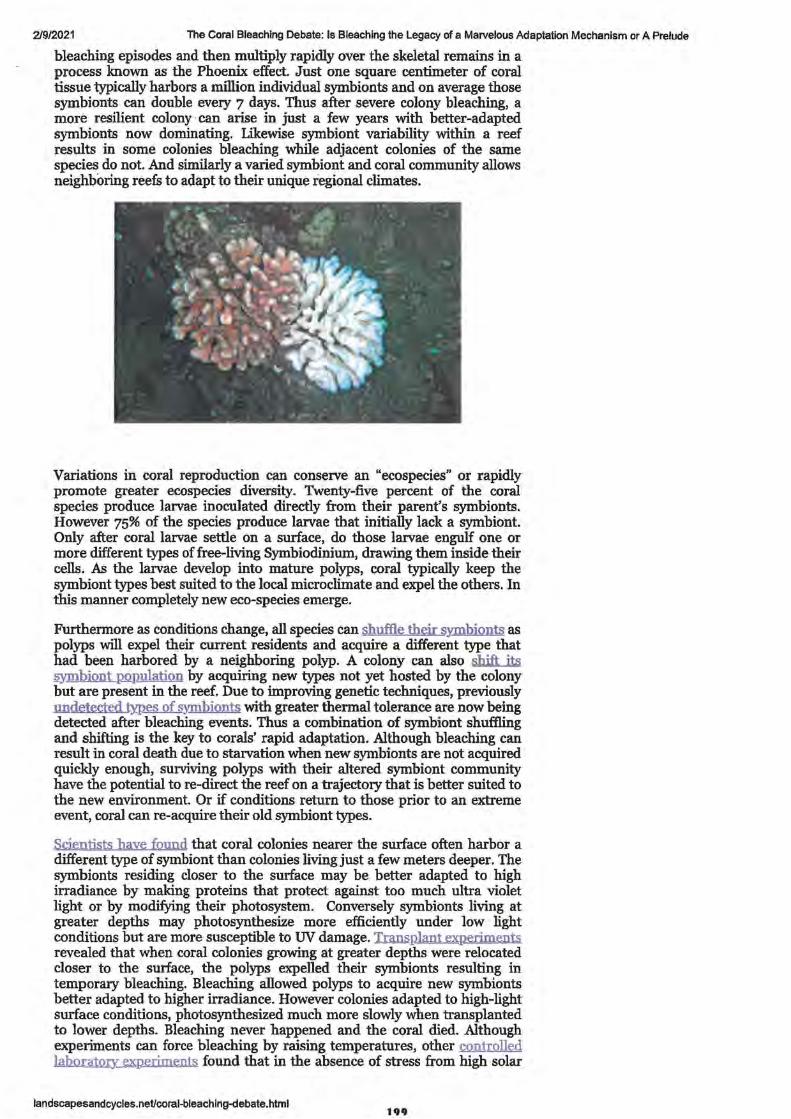
2/9/2021 The Coral Bleaching Debate: Is Bleaching the Legacy of a Marvelous Adaptation Mechanism or A Prelude
bleaching episodes and then multiply rapidly over the skeletal remains in a process known as the Phoenix effect. Just one square centimeter of coral tissue typically harbors a million individual symbionts and on average those symbionts can double evecy 7 days. Thus after severe colony bleaching, a more resilient colony· can arise in just a few years with better-adapted symbionts now dominating. Likewise symbiont variability within a reef results in some colonies bleaching while adjacent colonies of the same species do not. And similarly a varied symbiont and coral community allows neighboring reefs to adapt to their unique regional climates.
Variations in coral reproduction can conserve an "ecospecies" or rapidly promote greater ecospecies diversity. Twenty-five percent of the coral species produce larvae inoculated directly from their parent's symbionts. However 75% of the species produce larvae that initially lack a symbiont. Only after coral larvae settle on a surface, do those larvae engulf one or more different types of free-living Symbiodinium, drawing them inside their cells. As the larvae develop into mature polyps, coral typically keep the symbiont types best suited to the local microclimate and expel the others. In this manner completely new eco-species emerge.
Furthermore as conditions change, all species can shuffle their symbionts as polyps will expel their current residents and acquire a different type that had been harbored by a neighboring polyp. A colony can also shift its ~biont p_opulation by acquiring new types not yet hosted by the colony but are present in the reef. Due to improving genetic techniques, previously undetected wes of SY.II1bionts with greater thermal tolerance are now being detected after bleaching events. Thus a combination of symbiont shuffling and shifting is the key to corals' rapid adaptation. Although bleaching can result in coral death due to starvation when new symbionts are not acquired quickly enough, surviving polyps with their altered symbiont community have the potential to re-direct the reef on a trajectocy that is better suited to the new environment. Or if conditions return to those prior to an extreme event, coral can re-acquire their old symbiont types.
Scientists have found that coral colonies nearer the surface often harbor a different type of symbiont than colonies living just a few meters deeper. The symbionts residing closer to the surface may be better adapted to high irradiance by making proteins that protect against too much ultra violet light or by modifying their photosystem. Conversely symbionts living at greater depths may photosynthesize more efficiently under low light conditions but are more susceptible to lN damage. Transplant experiments revealed that when coral colonies growing at greater depths were relocated closer to the surface, the polyps expelled their symbionts resulting in temporacy bleaching. Bleaching allowed polyps to acquire new symbionts better adapted to higher irradiance. However colonies adapted to high-light surface conditions, photosynthesized much more slowly when transplanted to lower depths. Bleaching never happened and the coral died. Although experiments can force bleaching by raising temperatures, other controlled laborato!Y- experiments found that in the absence of stress from high solar
landscapesandcycles.net/coral-bleaching-debate.html 199
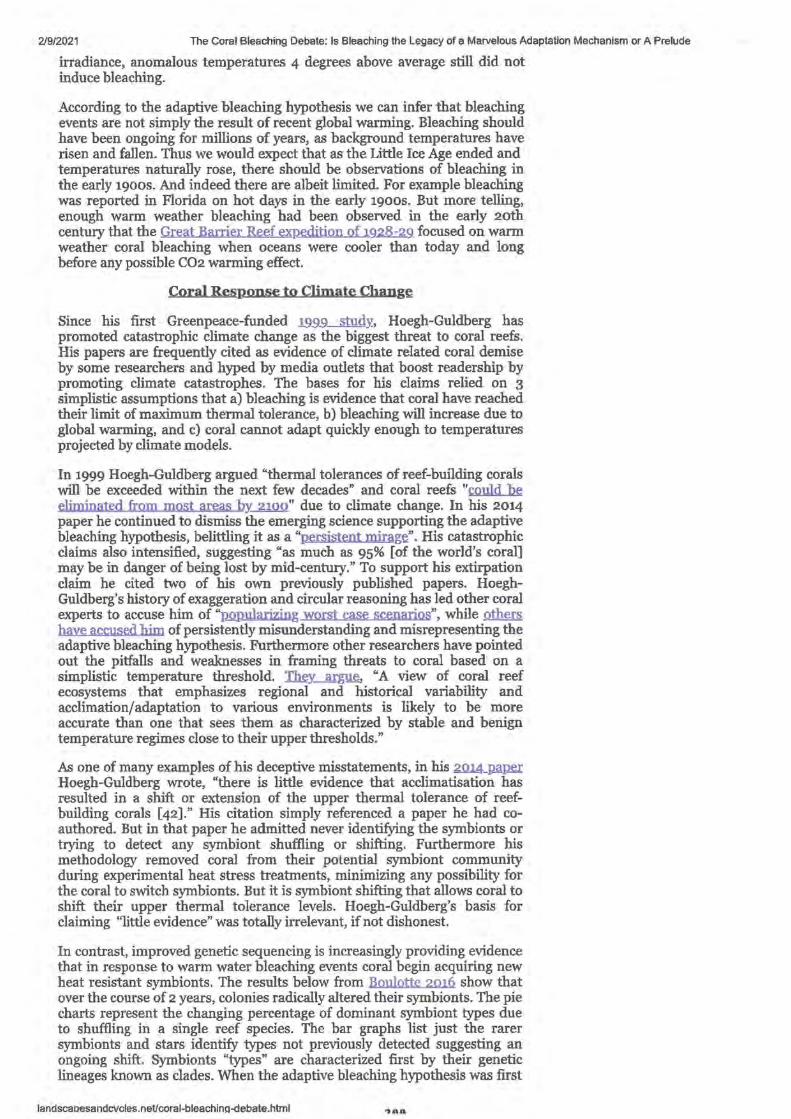
2/9/2021 The Coral Bleaching Debate: Is Bleaching the Legacy of a Marvelous Adaptation Mechanism or A Prelude
irradiance, anomalous temperatures 4 degrees above average still did not induce bleaching.
According to the adaptive bleaching hypothesis we can infer that bleaching events are not simply the result of recent global warming. Bleaching should have been ongoing for millions of years, as background temperatures have risen and fallen. Thus we would expect that as the Little Ice Age ended and temperatures naturally rose, there should be observations of bleaching in the early 1900s. And indeed there are albeit limited. For example bleaching was reported in Florida on hot days in the early 1900s. But more telling, enough warm weather bleaching had been observed in the early 20th century that the Great Barrier Reef expedition of 19..2&2_9. focused on warm weather coral bleaching when oceans were cooler than today and long before any possible CO2 warming effect.
Coral Response to Climate Chang~
Since his first Greenpeace-funded 1.99_9 studY., Hoegh-Guldberg has promoted catastrophic climate change as the biggest threat to coral reefs. His papers are frequently cited as evidence of climate related coral demise by some researchers and hyped by media outlets that boost readership by promoting climate catastrophes. The bases for his claims relied on 3 simplistic assumptions that a) bleaching is evidence that coral have reached their limit of maximum thermal tolerance, b) bleaching will increase due to global warming, and c) coral cannot adapt quickly enough to temperatures projected by climate models.
In 1999 Hoegh-Guldberg argued "thermal tolerances of reef-building corals will be exceeded within the next few decades" and coral reefs "could be eliminated from most areas by 2100" due to climate change. In his 2014 paper he continued to dismiss the emerging science supporting the adaptive bleaching hypothesis, belittling it as a "persistent mirage". His catastrophic claims also intensified, suggesting "as much as 95% [of the world's coral] may be in danger of being lost by mid-century." To support his extirpation claim he cited two of his own previously published papers. HoeghGuldberg's history of exaggeration and circular reasoning has led other coral experts to accuse him of "nopularizing worst case scenarios", while others have accused him of persistently misunderstanding and misrepresenting the adaptive bleaching hypothesis. Furthermore other researchers have pointed out the pitfalls and weaknesses in framing threats to coral based on a simplistic temperature threshold. IheY. ar~ "A view of coral reef ecosystems that emphasizes regional and historical variability and acclimation/adaptation to various environments is likely to be more accurate than one that sees them as characterized by stable and benign temperature regimes close to their upper thresholds."
As one of many examples of his deceptive misstatements, in his .2Q1..4_p,apei: Hoegh-Guldberg wrote, "there is little evidence that acclimatisation has resulted in a shift or extension of the upper thermal tolerance of reefbuilding corals [42]." His citation simply referenced a paper he had coauthored. But in that paper he admitted never identifying the symbionts or trying to detect any symbiont shuffling or shifting. Furthermore his methodology removed coral from their potential symbiont community during experimental heat stress treatments, minimizing any possibility for the coral to switch symbionts. But it is symbiont shifting that allows coral to shift their upper thermal tolerance levels. Hoegh-Guldberg's basis for claiming "little evidence" was totally irrelevant, if not dishonest.
In contrast, improved genetic sequencing is increasingly providing evidence that in response to warm water bleaching events coral begin acquiring new heat resistant symbionts. The results below from Boulotte 2016 show that over the course of 2 years, colonies radically altered their symbionts. The pie charts represent the changing percentage of dominant symbiont types due to shuffling in a single reef species. The bar graphs list just the rarer symbionts and stars identify types not previously detected suggesting an ongoing shift. Symbionts "types" are characterized first by their genetic lineages known as clades. When the adaptive bleaching hypothesis was first
landscaoesandcvcles.net/coral-bleachina-debate.html
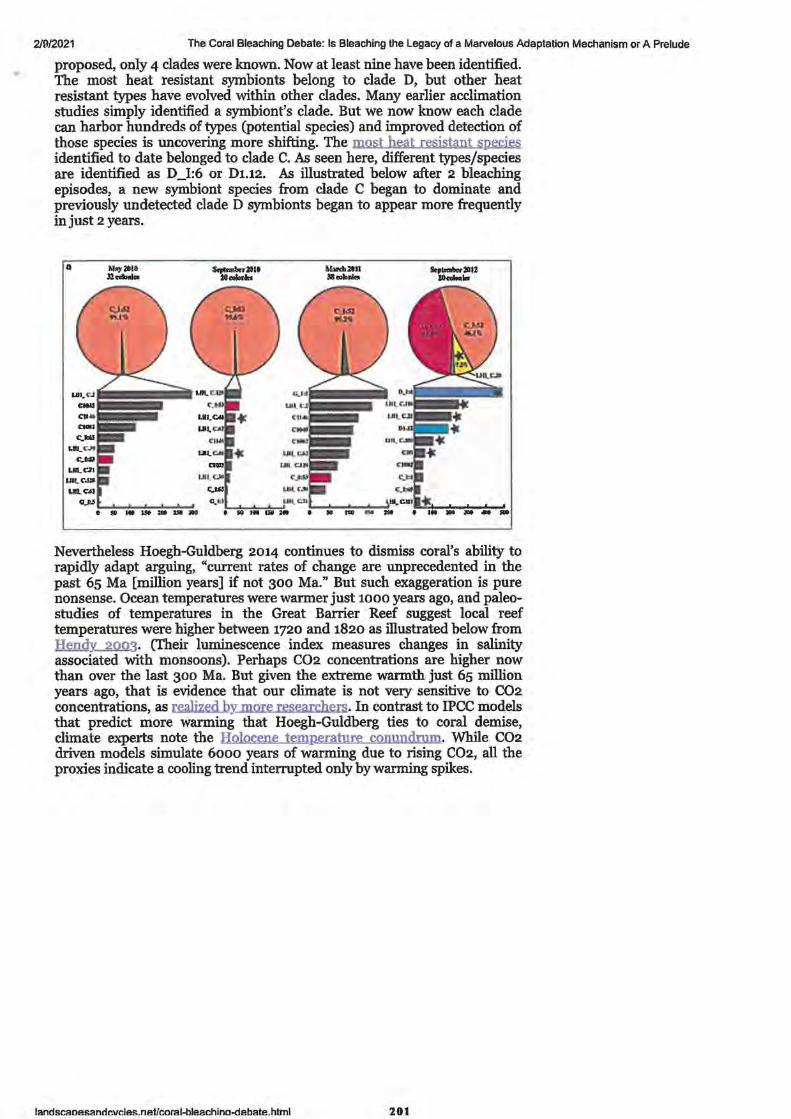
2/9/2021 The Coral Bleaching Debate: Is Bleaching the Legacy of a Marvelous Adaptation Mechanism or A Prelude
proposed, only 4 clades were known. Now at least nine have been identified. The most heat resistant symbionts belong to clade D, but other heat resistant types have evolved within other clades. Many earlier acclimation studies simply identified a symbiont's clade. But we now know each clade can harbor hundreds of types (potential species) and improved detection of those species is uncovering more shifting. The most heat resistant sp.e,cies identified to date belonged to clade C. As seen here, different types/species are identified as D_I:6 or D1.12. As illustrated below after 2 bleaching episodes, a new symbiont species from clade C began to dominate and previously undetected clade D symbionts began to appear more frequently in just 2 years.
a
e ~ IN W at Ill IDO
Sr,lanb.rJfll ......... Mo,.h2'11 allouloni<o
Nevertheless Hoegh-Guldberg 2014 continues to dismiss coral's ability to rapidly adapt arguing, "current rates of change are unprecedented in the past 65 Ma [million years] if not 300 Ma." But such exaggeration is pure nonsense. Ocean temperatures were warmer just 1000 years ago, and paleostudies of temperatures in the Great Barrier Reef suggest local reef temperatures were higher between 1720 and 1820 as illustrated below from Hendy~3. (Their luminescence index measures changes in salinity associated with monsoons). Perhaps CO2 concentrations are higher now than over the last 300 Ma. But given the extreme warmth just 65 million years ago, that is evidence that our climate is not very sensitive to CO2 concentrations, as realized by more researchers. In contrast to IPCC models that predict more warming that Hoegh-Guldberg ties to coral demise, climate experts note the Holocene temperature conundrum. While CO2 driven models simulate 6000 years of warming due to rising CO2, all the proxies indicate a cooling trend interrupted only by warming spikes.
landscaoesandr.vcles.net/coral-bleachina-debate.html 201
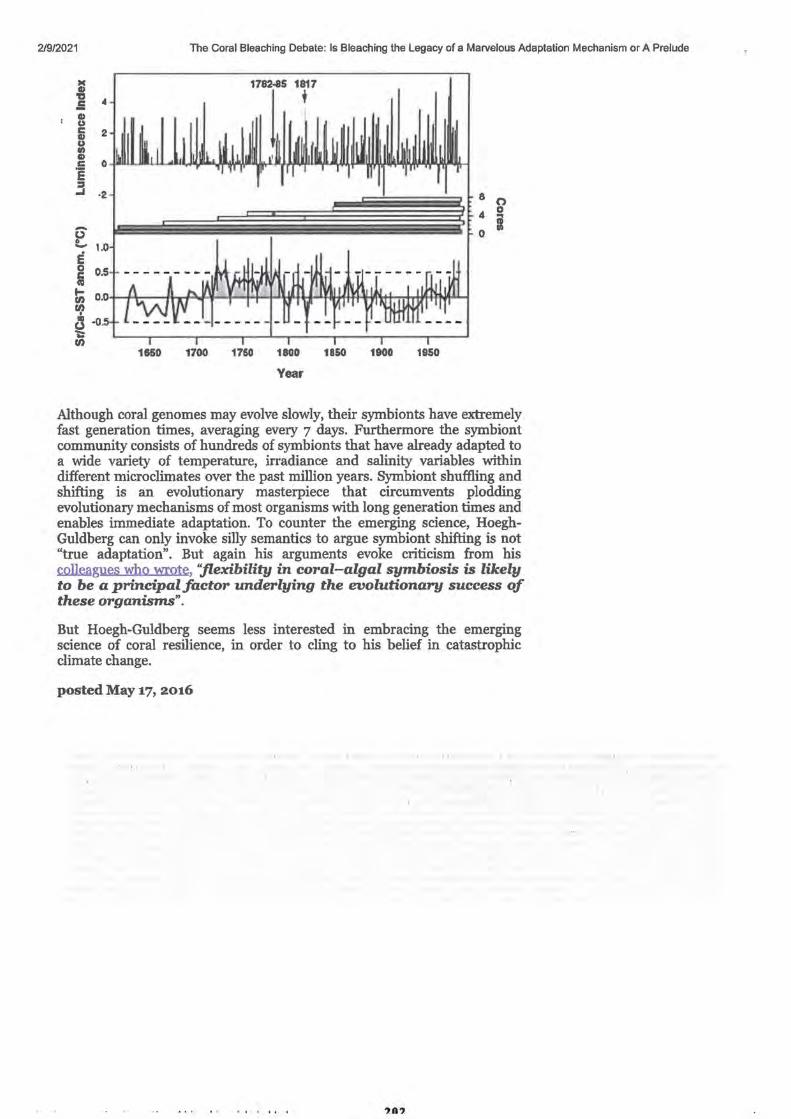
2/9/2021 The Coral Bleaching Debate: Is Bleaching the Legacy of a Marvelous Adaptation Mechanism or A Prelude
1650 1700 1760 1800
Year
1850 1900 1950
8 ~
4 i 0
Although coral genomes may evolve slowly, their symbionts have extremely fast generation times, averaging every 7 days. Furthermore the symbiont community consists of hundreds of symbionts that have already adapted to a wide variety of temperature, irradiance and salinity variables within different microclimates over the past million years. Symbiont shuffling and shifting is an evolutionary masterpiece that circumvents plodding evolutionary mechanisms of most organisms with long generation times and enables immediate adaptation. To counter the emerging science, HoeghGuldberg can only invoke silly semantics to argue symbiont shifting is not "true adaptation". But again his arguments evoke criticism from his ~gues who wrote, "flexibility in coral-algal symbiosis is likely to be a principal factor underlying the evolutionary success of these organisms".
But Hoegh-Guldberg seems less interested in embracing the emerging science of coral resilience, in order to cling to his belief in catastrophic climate change.
posted May 17, 2016
').ft').
2/9/2021 Climate science: Does the Great Barrier Reef affect rainfall in north Queensland? - Environment - ABC News
[ome
iiiiiiiia QP-en Sites menu - use enter keY. to OP-en and tab keY. to navigate
• ABCHome • News • 1v1ew • TV • Radio • Kids • Shon • More
Close menu
Log In
Search Q;
Environment
Does coral create rain? Climate scientists aboard the CSIRO's research vessel are leading a world-first study to
understand how the Great Barrier Reef influences rainfall. The team of international scientists will also examine whether a dying reef will affect weather in north
Queensland.
Reporting by Kathy Mcleish. photos by Dean Caton
Updated 14 October 2016 at 9:55 am
First posted 14 October 2016 at 5:32 am
CHAPTER I
Coral's effect on weather patterns
https:ffwww.abc.net.au/news/2016-10-14/how-the-Qreat-barrier-reef-coral-i12 O 3::ts-rainfall/7928714?section=environment&nw=O
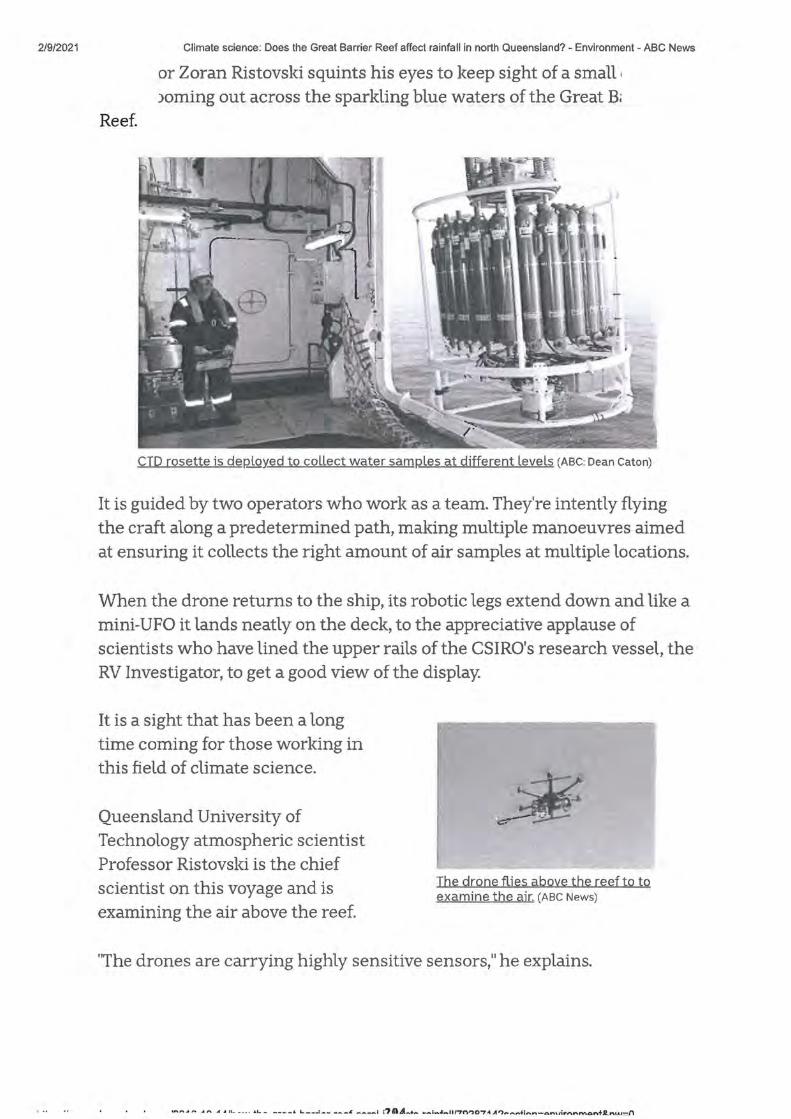
2/9/2021 Climate science: Does the Great Barrier Reef affect rainfall in north Queensland? - Environment - ABC News
or Zoran Ristovski squints his eyes to keep sight of a small , )Oming out across the sparkling blue waters of the Great B,
Reef.
CTD rosette is derJlOY.ed to collect water samrJles at different levels (ABC: Dean Caton)
It is guided by two operators who work as a team. They're intently flying the craft along a predetermined path, making multiple manoeuvres aimed at ensuring it collects the right amount of air samples at multiple locations.
When the drone returns to the ship, its robotic legs extend down and like a mini-UFO it lands neatly on the deck, to the appreciative applause of scientists who have lined the upper rails of the CSIRO's research vessel, the RV Investigator, to get a good view of the display.
It is a sight that has been a long time coming for those working in this field of climate science.
Queensland University of Technology atmospheric scientist Professor Ristovski is the chief scientist on this voyage and is examining the air above the reef.
The drone flies above the reef to to examine the air. (ABC News)
"The drones are carrying highly sensitive sensors," he explains.
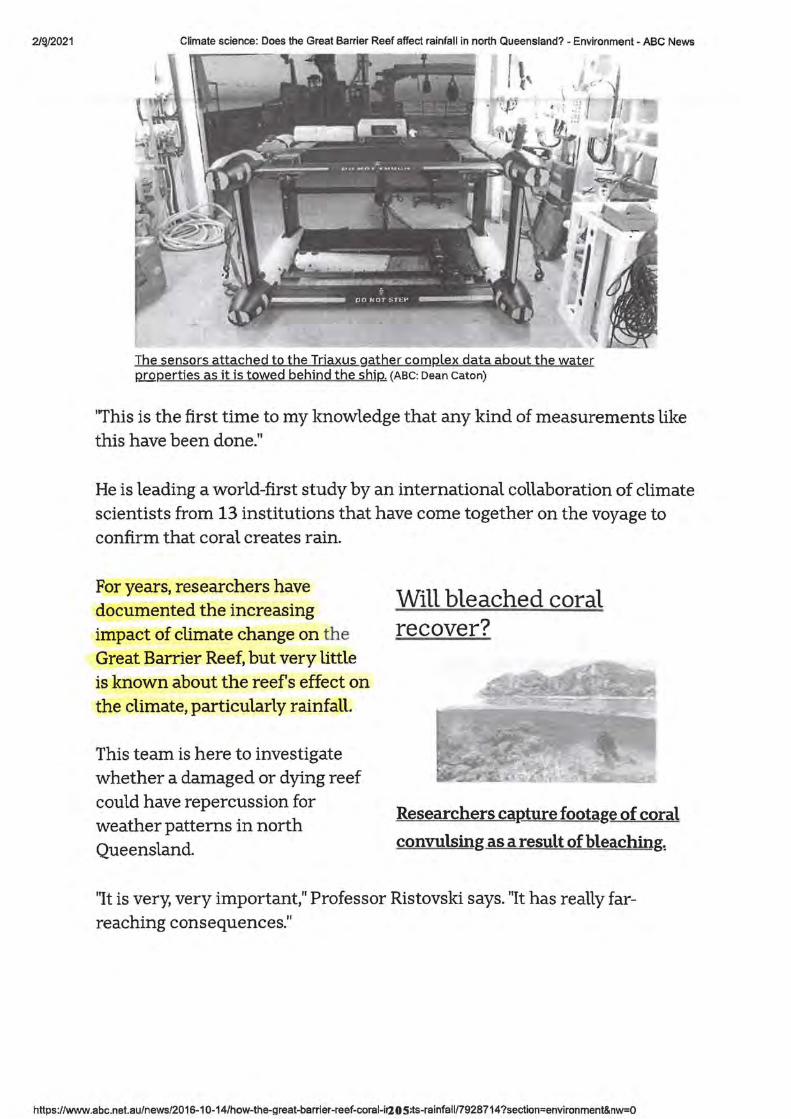
2/!l/2021 Climate science: Does the Great Barrier Reef affect rainfall in north Queensland? - Environment - ABC News
The sensors attached to the Triaxus gather comP-lex data about the water P-rOP-erties as it is towed behind the shiP-, (ABC: Dean Caton)
''This is the first time to my knowledge that any kind of measurements like this have been done."
He is leading a world-first study by an international collaboration of climate scientists from 13 institutions that have come together on the voyage to confirm that coral creates rain.
For years, researchers have documented the increasing impact of climate change on the Great Barrier Reef, but very little is known about the reef's effect on the climate, particularly rainfall.
This team is here to investigate whether a damaged or dying reef could have repercussion for weather patterns in north Queensland.
Will bleached coral recover?
Researchers caP-ture footage of coral
convulsing as a result of bleaching~
"It is very, very important," Professor Ristovski says. "It has really farreaching consequences."
https:/twww.abc.net.au/news/2016-10-14/how-the-great-barrier-reef-coral-ir2 o s:ts-rainfall/7928714 ?section=environment&nw=O
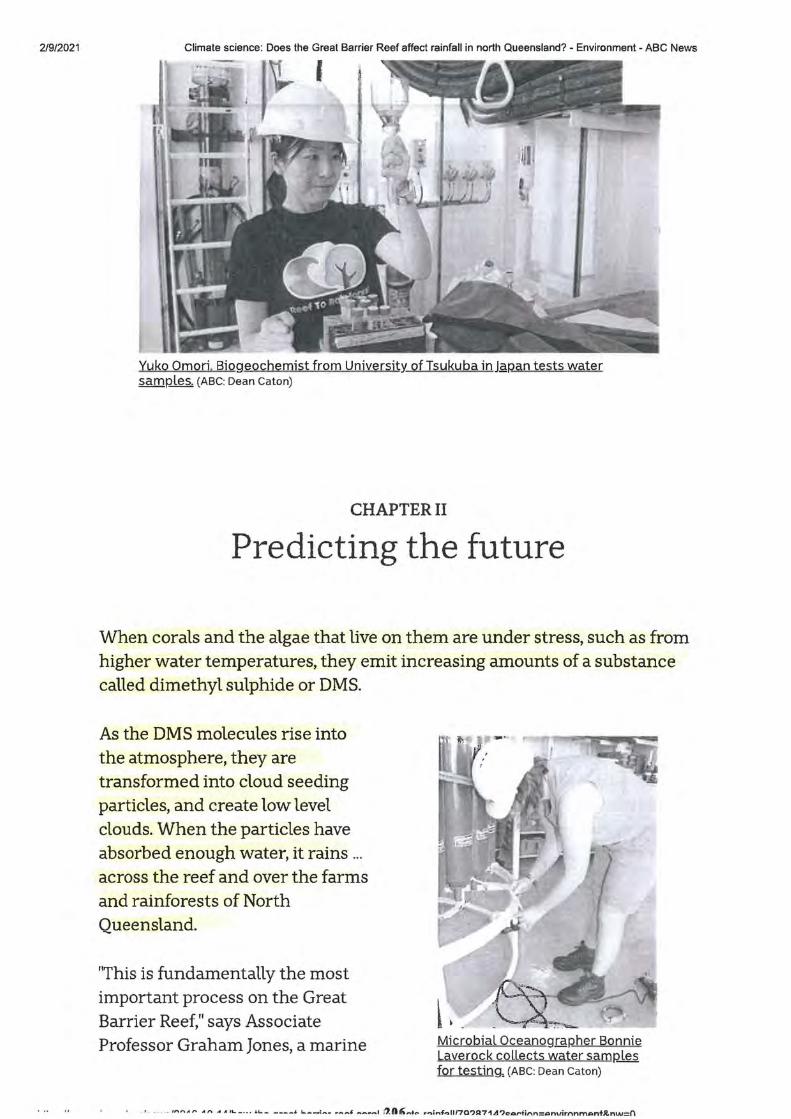
2/9/2021 Climate science: Does the Great Barrier Reef affect rainfall in north Queensland? - Environment - ABC News
Yuko Omori, Biogeochemist from University of Tsukuba in Jgpan tests water samP-les. (ABC: Dean Caton)
CHAPTER II
Predicting the future
When corals and the algae that live on them are under stress, such as from higher water temperatures, they emit increasing amounts of a substance called dimethyl sulphide or DMS.
As the DMS molecules rise into the atmosphere, they are transformed into cloud seeding particles, and create low level clouds. When the particles have absorbed enough water, it rains ... across the reef and over the farms and rainforests of North Queensland.
"This is fundamentally the most important process on the Great Barrier Reef," says Associate Professor Graham Jones, a marine
A~ ~ I • _'--,A-~-Microbial OceanograP-her Bonnie Laverock collects water samP-les for testing, (ABC: Dean Caton)
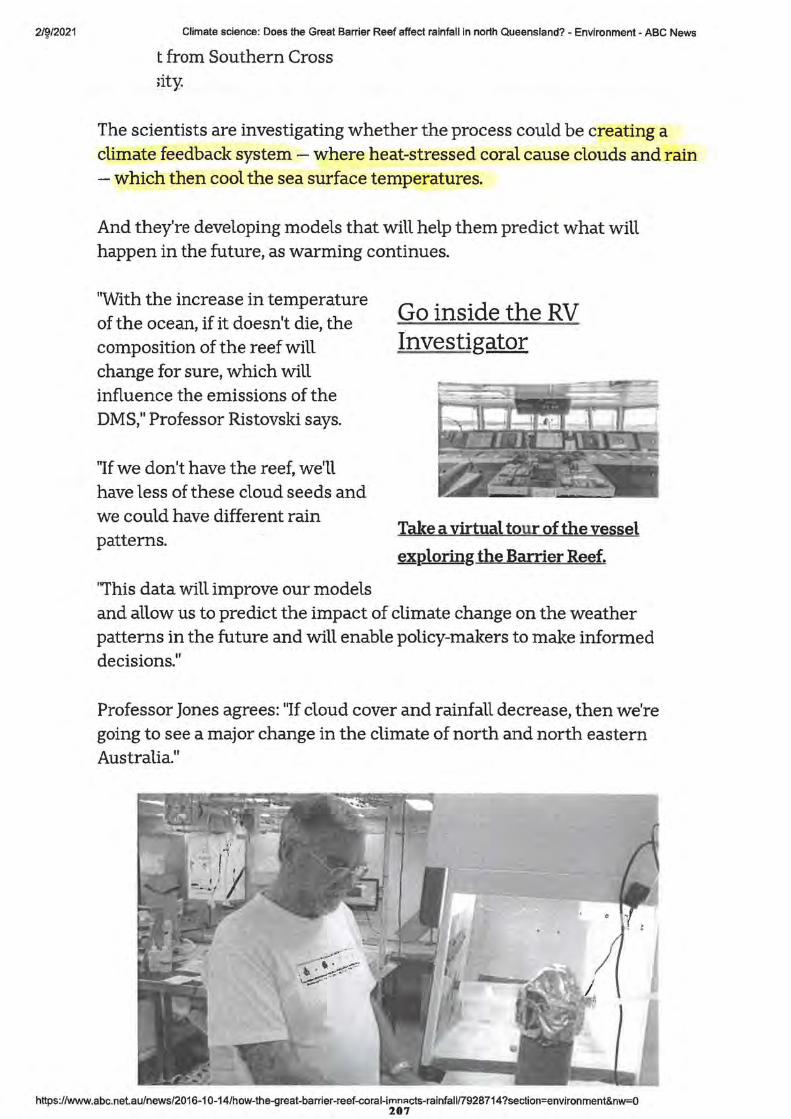
2/~/2021 Climate science: Does the Great Barrier Reef affect rainfall in north Queensland? - Environment - ABC News
t from Southern Cross ,ity.
The scientists are investigating whether the process could be creating a climate feedback system - where heat-stressed coral cause clouds and rain - which then cool the sea surface temperatures.
And they're developing models that will help them predict what will happen in the future, as warming continues.
"With the increase in temperature of the ocean, if it doesn't die, the composition of the reef will change for sure, which will influence the emissions of the DMS," Professor Ristovski says.
"If we don't have the reef, we'll have less of these cloud seeds and we could have different rain patterns.
'ihis data will improve our models
Go inside the RV Investigator
Take a virtual tour of the vessel
~ploring the Barrier Reef.
and allow us to predict the impact of climate change on the weather patterns in the future and will enable policy-makers to make informed decisions."
Professor Jones agrees: "If cloud cover and rainfall decrease, then we're going to see a major change in the climate of north and north eastern Australia."
https://www.abc.net.au/news/2016-10-14/how-the-great-barrier-reef-coral-irnn::icts-rainfall/7928714 ?section=environment&nw=O 207
2/9/2021 Climate science: Does the Great Barrier Reef affect rainfall in north Queensland? - Environment - ABC News
;ociate Professor Graham Jones. PrinciRal Investigator on this voy.,gge is am ~mist with Southern Cross University. (ABC: Dean Caton)
CHAPTER III
Linl{s to El Nino and La Nina
And the researchers believe the impacts could be far-reaching.
"The western Pacific has the highest biomass of coral reef on the planet, so if these coral reefs produce low level cloud as we suspect, then it has a major impact," Professor Jones says.
Scientists were on location at the Great Barrier Reef to com12Lete their research. (ABC: Kathy Mcleish)
"There is a potential link between the severity of El Nino and La Nina.
"That is extremely important but at this point in time, we know nothing about that, or extremely little."
The climate scientists on this voyage of discovery are working to increase that level of knowledge.
They will spend this month, dipping instruments and sensors into the water and raising them in the air in search of answers, but their efforts to
https://www.abc.net.au/news/2016-10-14/how-the-great-barrier-reef-coral-i;-8;cts-rainfall/7928714 ?section=environment&nw=O
2/~/2021 Climate science: Does the Great Barrier Reef affect rainfall in north Queensland? - Environment - ABC News
:>re up the future of the reef and the rainforests of north :land will continµe long after they are back to being land lu·
GIP: Dolphins swim in front of the Triaxus
The research
Australia's national research vessel, the RV Investigator was commissioned about 18 months ago and has been helping scientists gather data since then.
Scientists meet everY. evening...t2..P-lan the next daY.'s movements and scientific activities. (ABC: Dean Caton)
Twelve organisations are taking part in this four week research voyage, titled The Great Barrier Reef as a significant source of climatically relevant
https:/lwww.abc.net.au/news/2016-10-14/how-the-great-barrier-reef-coral-imoacts-rainfall/7928714 ?section=environment&nw=O 209
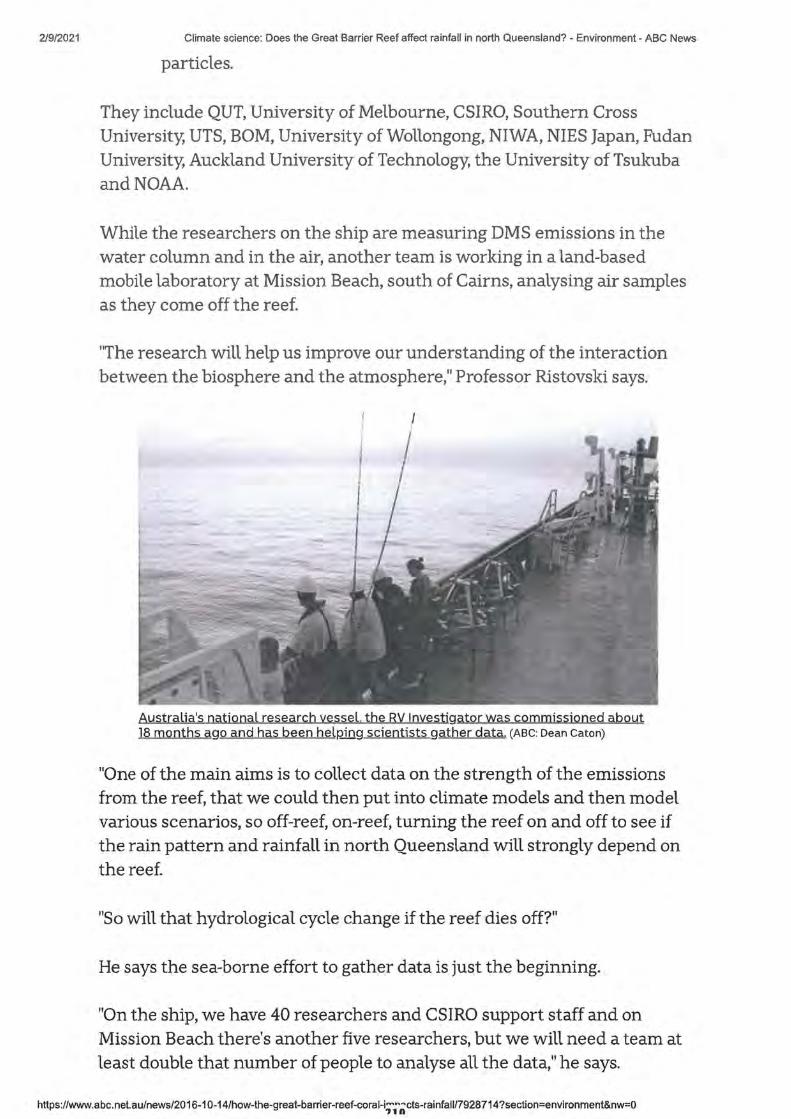
2/9/2021 Climate science: Does the Great Barrier Reef affect rainfall in north Queensland? - Environment - ABC News
particles.
They include QUT, University of Melbourne, CSIRO, Southern Cross University; UTS, BOM, University of Wollongong, NIWA, NIES Japan, Fudan University; Auckland University of Technology; the University of Tsukuba and NOAA.
While the researchers on the ship are measuring DMS emissions in the water column and in the air, another team is working in a land-based mobile laboratory at Mission Beach, south of Cairns, analysing air samples as they come off the reef.
"The research will help us improve our understanding of the interaction between the biosphere and the atmosphere," Professor Ristovski says.
Australia's national research vessel. the RV Investigator was commissioned about 18 months ago and has been helP-ing scientists gather data. (ABC: Dean Caton)
"One of the main aims is to collect data on the strength of the emissions from the reef, that we could then put into climate models and then model various scenarios, so off-reef, on-reef, turning the reef on and off to see if the rain pattern and rainfall in north Queensland will strongly depend on the reef.
"So will that hydrological cycle change if the reef dies off?"
He says the sea-borne effort to gather data is just the beginning.
"On the ship, we have 40 researchers and CSIRO support staff and on Mission Beach there's another five researchers, but we will need a team at least double that number of people to analyse all the data," he says.
https://www.abc.net.au/news/2016-10-14/how-the-great-barrier-reef-coral-i_;1~.:;cts-rainfall/7928714 ?section=environment&nw=O
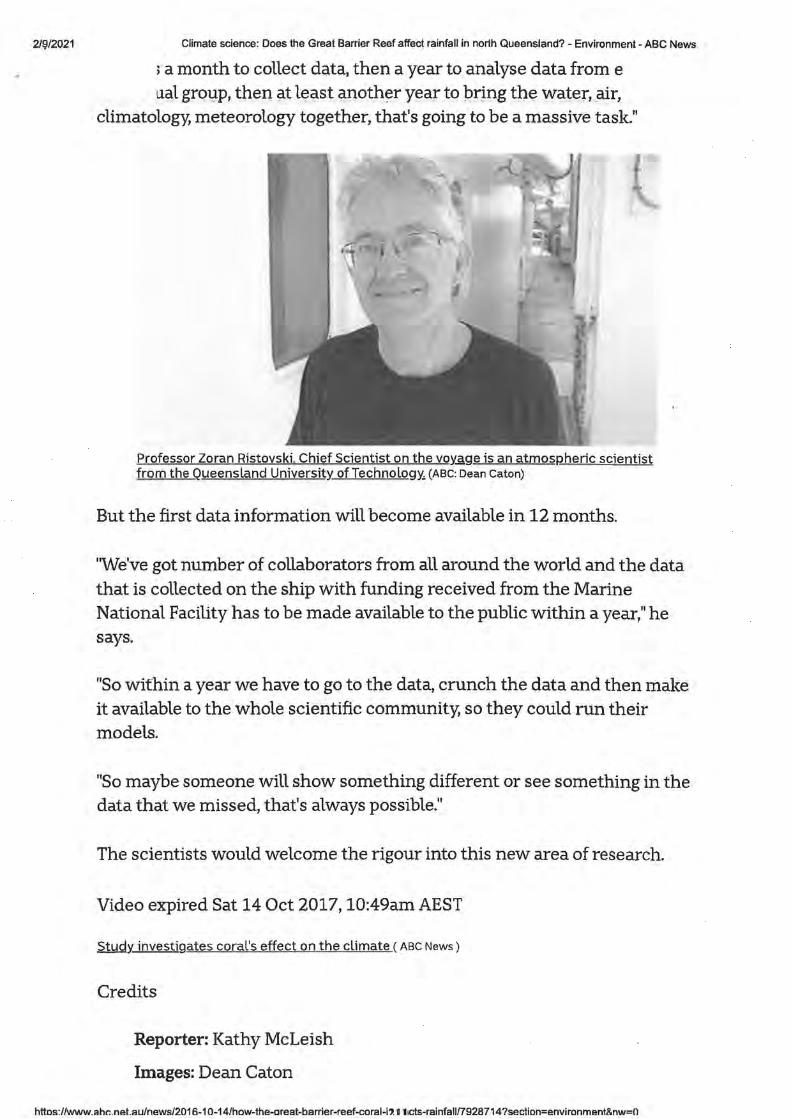
2/!;l/2021 Climate science: Does the Great Barrier Reef affect rainfall in north Queensland? - Environment - ABC News
; a month to collect data, then a year to analyse data from e L1al gr01,1.p, then at least another year to bring the water, air,
climatology, meteorology together, that's going to be a massive task."
Professor Zoran Ristovski, Chief Scientist on the voy.,gge is an atmosi:2heric scientist from the Queensland UniversitY. of Technology, (ABC: Dean Caton)
But the first data information will become available in 12 months.
"We've got number of collaborators from all around the world and the data that is collected on the ship with funding received from the Marine National Facility has to be made available to the public within a year," he says.
"So within a year we have to go to the data, crunch the data and then make it available to the whole scientific community, so they could run their models.
"So maybe someone will show something different or see something in the data that we missed, that's always possible."
The scientists would welcome the rigour into this new area of research.
Video expired Sat 14 Oct 2017, 10:49am AEST
StudY. investigates coral's effect on the climate ( ABC News)
Credits
Reporter: Kathy McLeish
Images: Dean Caton
httos://www_ahr,_netau/news/2016-10-14/how-the-areat-barrier-reef-coral-i711icis-rainfall/7928714 ?section=environment&nw=O
2/9/2021 Climate science: Does the Great Barrier Reef affect rainfall in north Queensland? - Environment - ABC News
>duction: Heidi Davoren
Topics
Science and TechnologY. Weather Environment Environmental Impact QLD
I • "11 'I ,
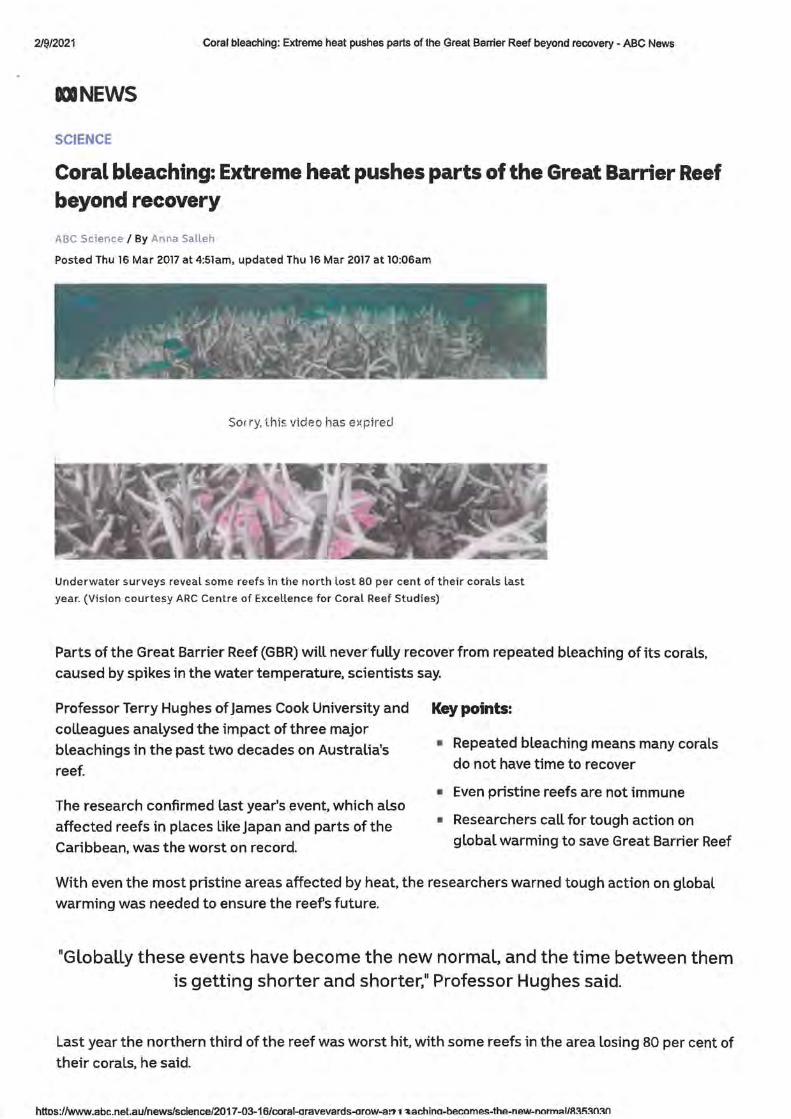
2/!]/2021 Coral bleaching: Extreme heat pushes parts of the Great Barrier Reef beyond recovery - ABC News
DNEWS
SCIENCE
Coral bleaching: Extreme heat pushes parts of the Great Barrier Reef beyond recovery
ABC Science I By Anna Salleh
Posted Thu 16 Mar 2017 at 4:51am, updated Thu 16 Mar 2017 at 10:06am
Sorry, this video has el!pirec.l
Underwater surveys reveal some reefs in the north lost 80 per cent of their corals Last
year. (Vision courtesy ARC Centre of Excellence for Coral Reef Studies)
Parts of the Great Barrier Reef (GBR) will neverfully recover from repeated bleaching of its corals,
caused by spikes in the water temperature, scientists say.
Professor Terry Hughes of James Cook University and
colleagues analysed the impact of three major
bleachings in the past two decades on Australia's
reef.
The research confirmed last year's event, which also
affected reefs in places Like Japan and parts of the
Caribbean, was the worst on record.
Key points:
• Repeated bleaching means many corals
do not have time to recover
• Even pristine reefs are not immune
• Researchers call for tough action on
global warming to save Great Barrier Reef
With even the most pristine areas affected by heat, the researchers warned tough action on global
warming was needed to ensure the reefs future.
"Globally these events have become the new normal, and the time between them is getting shorter and shorter," Professor Hughes said.
Last year the northern third of the reef was worst hit, with some reefs in the area losing 80 per cent of
their corals, he said.
httos://www.abc.net.au/news/science/2017-03-16/coral-oravevards-arow-a!'J 1 -i-achlno-becomes-the-new-norm::11/83!'i303n
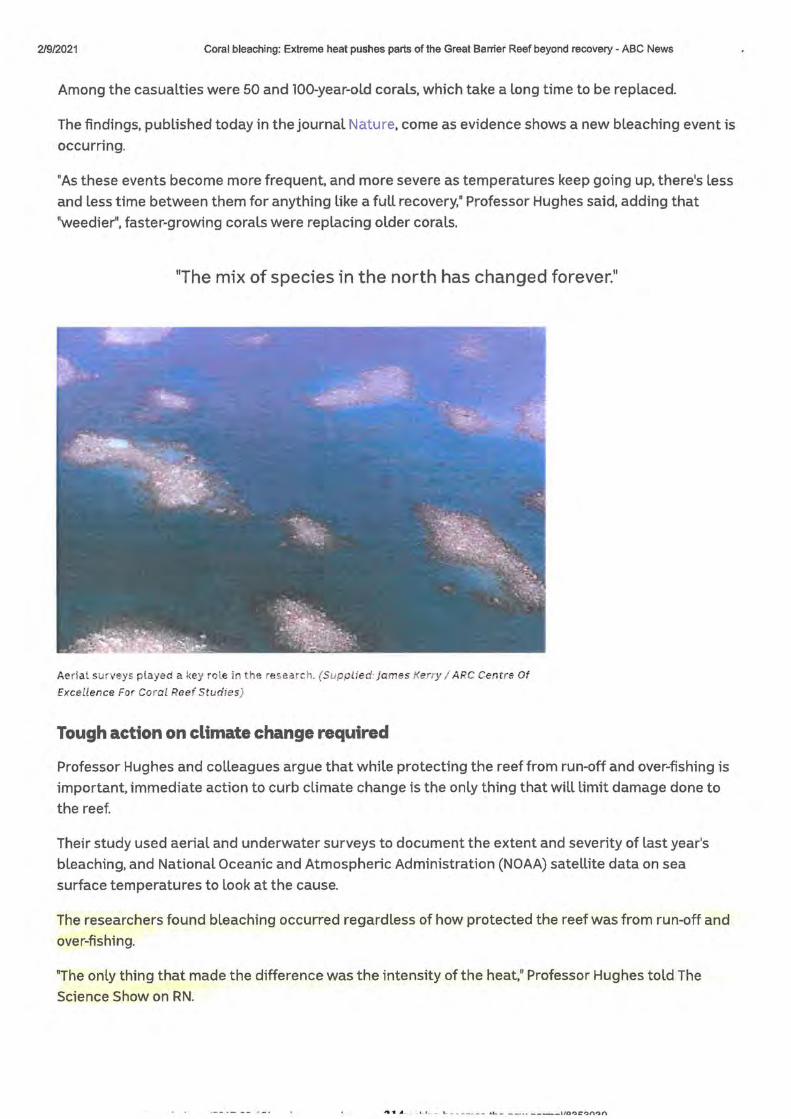
2/9/2021 Coral bleaching: Extreme heat pushes parts of the Great Barrier Reef beyond recovery - ABC News
Among the casualties were 50 and 100-year-old corals, which take a long time to be replaced.
The findings, published today in the journal Nature, come as evidence shows a new bleaching event is
occurring.
"As these events become more frequent, and more severe as temperatures keep going up. there's less
and less time between them for anything like a full recovery," Professor Hughes said, adding that
"weedier", faster-growing corals were replacing older corals.
"The mix of species in the north has changed forever."
Aerial surveys pl ayed a key role in the research. (Supplied: James Kerry I ARC Cen tre Of
Excellence For Cora l Reef Studies)
Tough action on climate change required
Professor Hughes and colleagues argue that while protecting the reef from run-off and over-fishing is
important, immediate action to curb climate change is the only thing that will limit damage done to
the reef.
Their study used aerial and underwater surveys to document the extent and severity of last year's
bleaching, and National Oceanic and Atmospheric Administration (NOAA) satellite data on sea
surface temperatures to look at the cause.
The researchers found bleaching occurred regardless of how protected the reef was from run-off and
over-fishing.
"The only thing that made the difference was the intensity of the heat," Professor Hughes told The
Science Show on RN.
.. .. A _ . Lt __ L _ _ _____ j,L- - -·- · - ---IIOi,r,:,n-,n
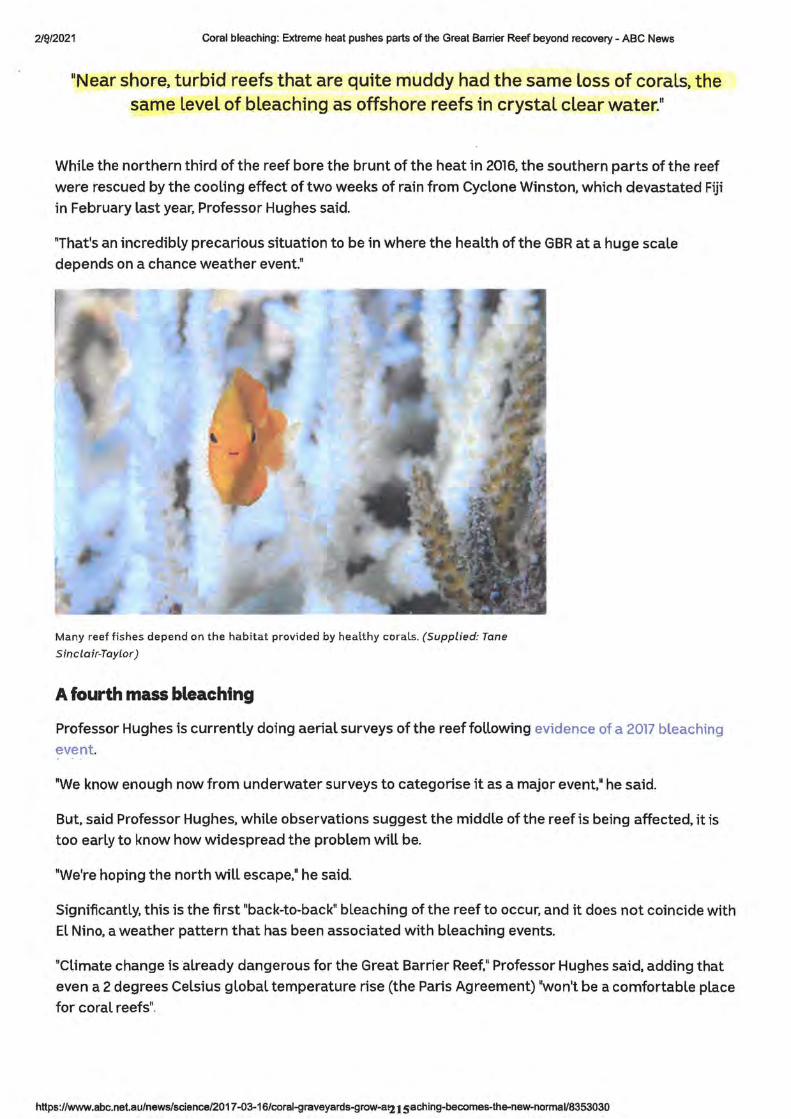
2/Q/2021 Coral bleaching: Extreme heat pushes parts of the Great Barrier Reef beyond recovery - ABC News
"Near shore, turbid reefs that are quite rriuddy had the same Loss of corals, the same level of bleaching as offshore reefs in crystal clear water."
While the northern third of the reef bore the brunt of the heat in 2016, the southern parts of the reef were rescued by the cooling effect of two weeks of rain from Cyclone Winston, which devastated Fiji in February last year. Professor Hughes said.
"That's an incredibly precarious situation to be in where the health of the GBR at a huge scale depends on a chance weather event."
Many reef fishes depend on the habitat provided by healthy corals. (Supplied: Tane
Sinclair-Taylor)
A fourth mass bleaching
Professor Hughes is currently doing aerial surveys of the reef following evidence of a 2017 bleaching event.
"We know enough now from underwater surveys to categorise it as a major event." he said.
But, said Professor Hughes, while observations suggest the middle of the reef is being affected, it is too early to know how widespread the problem will be.
"We're hoping the north will escape,' he said.
Significantly, this is the first "back-to-back" bleaching of the reef to occur. and it does not coincide with EL Nino. a weather pattern that has been associated with bleaching events.
"Climate change is already dangerous for the Great Barrier Reef," Professor Hughes said. adding that even a 2 degrees Celsius global temperature rise (the Paris Agreement) "won't be a comfortable place for coral reefs".
https:/twww.abc.net.au/news/science/2017-03-16/coral-graveyards-grow-aiz 15-aching-becomes-the-new-normal/8353030
2/9/2021 Coral bleaching: Extreme heat pushes parts of the Great Barrier Reef beyond recovery - ABC News
"We've got a window of opportunity. but it's getting narrower and narrower to quickly move away from fossil fuels and curb emissions," he said.
,, I . ) ; , .
Ae ria l surveys he lp revea l how e xtensive coral bleaching is on t he Great Ba rri e r Reef.
(ARC Centre Of Exce l lence For Cora l Ree f Studiesj
Dr Andrew King, a climate scientist from the University of Melbourne who studies climate extremes
and variability, said Professor Hughes' research established just how strong the link was between
coral bleaching and warmer water.
"These findings, in conjunction with other studies, point to the fact that warmer waters are damaging
the reef and climate change means that large parts of the reef won't recover," he said.
Dr King said recent research looking at the frequency of bleaching events emphasised the need for strong action.
He said even if global temperature rise was limited to l.5C, corals were in for a tough time, with
bleaching set to occur every second year on average.
I don't think people are aware just how bad it is, 11 he said.
Hear the interview with Professor Terry Hughes this Saturday on The Science Show.
Listen to The Science Show
Want more science from across the ABC?
• Like us on Facebook
with Robyn Williams
hl+n.,•//un,n., .. h,. ..... 1 "' ,, ....... ,.,,.,,.;,...,,..,./?017.0'-t-11'/r.nr,:il.nr,:ivP.v,:irri!':-arow-a216!achina-becomes-the-new-normal/8353030

2/9/2021 Coral bleaching: Extreme heat pushes parts of the Great Barrier Reef beyond recovery - ABC News
■ Follow us on Twitter
■ Subscribe on YouTube
https:l/www.abc.net.au/news/science/2017-03-16/coral-graveyards-grow-a2 i 71aching-becomes-the-new-normal/8353030

218
2/$l/2021 Global warming and recurrent mass bleaching of corals I Nature
nature View All Nature Research Journals Search Login
Content v Journal Info v Publish v Sign Up For Alerts O RSS Feed
nature > articles > article
Published: 16 March 2017
Global warming and recurrent mass bleaching of corals
Terry P. Hughes B , James T. Kerry, [ ... ]Shaun K. Wilson
Nature 543, 373-377(2017}
20k Accesses I 1109 Citations I ~572 Altmetric I Metrics
Abstract
During 2015-2016, record temperatures triggered a pan-tropical episode of coral bleaching,
the third global-scale event since mass bleaching was first documented in the 1980s. Here we
examine how and why the severity of recurrent major bleaching events has varied at multiple
scales, using aerial and underwater surveys of Australian reefs combined with satellite-derived
sea surface temperatures. The distinctive geographic footprints of recurrent bleaching on the
Great Barrier Reef in 1998, 2002 and 2016 were determined by the spatial pattern of sea
temperatures in each year. Water quality and fishing pressure had minimal effect on the
unprecedented bleaching in 2016, suggesting that local protection of reefs affords little or no
resistance to extreme heat. Similarly, past exposure to bleaching in 1998 and 2002 did not
lessen the severity of bleaching in 2016. Consequently, immediate global action to curb future
warming is essential to secure a future for coral reefs.
ft Access through your institution
Buy or subscribe
Access options
httos://www.nature.com/articles/nature21707 219
2/9/2021 Global warming and recurrent mass bleaching of corals I Nature
Rent or Buy Subscribe to article J oumal
Get time limited or full article Get full journal access for
access on ReadCube. 1 year
from $8.99 185,98 € only 3,65 € per issue
Rent or Buy
All prices are NET prices. All prices are NET prices.
VAT will be added later in the checkout.
Additional access options:
Login
Access through your institution
Learn about institutional subscriptions
References
11 Heron, S. F., Maynard, J. A., van Hooidonk, R. & Eakin, C. M. Warming trends and
bleaching stress of the World's coral reefs 1985-2012. Sci. Rep. 6, 38402 (2016)
Ji Spalding, M. D. & Brown, B. E. Warm-water coral reefs and climate change. Science
350, 769-771 (2015)
~ Baker, A. C., Glynn, P. W. & Riegl, B. Climate change and coral reef bleaching: An
ecological assessment of long-term impacts, recovery trends and future outlook. Estuar.
Coast. Shelf Sci. 80, 435-471 (2008)
4' Hughes, T. P. et al. Climate change, human impacts, and the resilience of coral reefs.
Science 301, 929-933 (2003)
$ Glynn, P. W. Widespread coral mortality and the 1982-83 El Nino Warming Events.
Environ. Conserv. 11, 133-146 (1984)
~/2021 Global warming and recurrent mass bleaching of corals I Nature
(fi Oliver, J. K., Berkelmans, R. & Eakin, C. M. in Ecological Studies: Analysis and
Synthesis (eds van Oppen, M. J. H. & Lough, J.M.) 21-39 (2009)
77. Eakin, C. M. et al. Global coral bleaching 2014-2017. Reef Currents 31, 1 (2016)
!8 Berkelmans, R., De'ath, G., Kininmonth, S. & Skirving, W. J. A comparison of the
1998 and 2002 coral bleaching events on the Great Barrier Reef: spatial correlation,
patterns, and predictions. Coral Reefs 23, 74-83 (2004)
g). Carrigan, A. D. & Puotinen, M. Tropical cyclone cooling combats region-wide coral
bleaching. Glob. Change Biol. 20, 1604-1613 (2014)
11D Leahy, S. M., Kingsford, M. J. & Steinberg, C.R. Do clouds save the great barrier
reef? Satellite imagery elucidates the cloud-SST relationship at the local scale. PLoS One
8, e70400 (2013)
1IR Australian Bureau of Meteorology (BOM). Tropical Cyclone Stan Track.
http:/ /www.australiasevereweather.com/cyclones/2016/bom/tropical _cyclone_ stan.png
(2016)
D Feng, M., Meyeres, G., Pearce, A. & Wijffels, S. Annual and interannual variations of
the Leeuwin Current at 32°S. J. Geophys. Res. 108, 2156-2202 (2003)
B31 Wooldridge, S. A. et al. Excess seawater nutrients, enlarged algal symbiont densities
and bleaching sensitive reef locations: 2. A regional-scale predictive model for the Great
Barrier Reef, Australia. Mar. Pollut. Bull. 114, 343-354 (2016)
1lfl Carilli, J., Donner, S. D. & Hartmann, A. C. Historical temperature variability affects
coral response to heat stress. PLoS One 7, e34418 (2012)
11$ Guest, J. R. et al. Contrasting patterns of coral bleaching susceptibility in 2010
suggest an adaptive response to thermal stress. PLoS One 7, e33353 (2012)
16
https://www.nature.com/articles/nature21707 221
2/9/2021 Global warming and recurrent mass bleaching of corals I Nature
JRratchett, M. S., Mccowan, D., Maynard, J. A. & Heron, S. F. Changes in bleaching
susceptibility among corals subject to ocean warming and recurrent bleaching in Moorea,
French Polynesia. PLoS One 8, e70443 (2013)
1I77. Ainsworth, T. D. et al. Climate change disables coral bleaching protection on the
Great Barrier Reef. Science 352, 338-342 (2016)
1ffl Loya, Y. et al. Coral bleaching: the winners and the losers. Ecol. Lett. 4, 122-131
(2001)
:tm Swain, T. D. et al. Coral bleaching response index: a new tool to standardize and
compare susceptibility to thermal bleaching. Glob. Change Biol. 22, 2475-2488 (2016)
2!D Baird, A. H. & Marshall, P. A. Mortality, growth and reproduction in scleractinian
corals following bleaching on the Great Barrier Reef. Mar. Ecol. Prog. Ser. 237, 133-141
(2002)
?l1I. Marshall, P. A. & Baird, A. H. Bleaching of corals on the Great Barrier Reef:
differential susceptibilities among taxa. Coral Reefs 19, 155-163 (2000)
n Connell, J. H., Hughes, T. P. & Wallace, C. C. A 30-year study of coral community
dynamics: influence of disturbance and recruitment on abundance, at several scales in
space and time. Ecol. Monogr. 67, 461-488 (1997)
ml Kayanne, H., Harii, S., Ide, Y. & Akimoto, F. Recovery of coral populations after the
1998 bleaching on Shiraho Reef, in the southern Ryukyus, NW Pacific. Mar. Ecol. Prog.
Ser. 239, 93-103 (2002)
2m Gilmour, J.P., Smith, L. D., Heyward, A. J., Baird, A.H. & Pratchett, M. S. Recovery
of an isolated coral reef system following severe disturbance. Science 340, 69-71 (2013)
1Zl5 van Hooidonk, R. et al. Local-scale projections of coral reef futures and implications
of the Paris Agreement. Sci. Rep. 6, 39666 (2016)
https://www.nature.com/articles/nature21707 222
219/2021 Global warming and recurrent mass bleaching of corals I Nature
26. 26 Scheffer, M. et al. Climate and conservation. Creating a safe operating space for
iconic ecosystems. Science 347, 1317-1319 (2015)
'lJJ!. van de Leemput, I. A., Hughes, T. P., van Nes, E. H. & Scheffer, M. Multiple
feedbacks and the prevalence of alternate stable states on coral reefs. Coral Reefs 35,
857-865 (2016)
B Hughes, T. P., Graham, N. A. J., Jackson, J.B. C., Mumby, P. J. & Steneck, R. S.
Rising to the challenge of sustaining coral reef resilience. Trends Ecol. Evol. 25, 633-642
(2010)
D Graham, N. A., Jennings, S., MacNeil, M.A., Mouillot, D. & Wilson, S. K.
Predicting climate-driven regime shifts versus rebound potential in coral reefs. Nature
518, 94--97 (2015)
31D West, J. M. & Salm, R. V. Resistance and resilience to coral bleaching: implications
for coral reef conservation and management. Conserv. Biol. 17, 956-967 (2003)
3m. Eakin, C. M. et al. Caribbean corals in crisis: record thermal stress, bleaching, and
mortality in 2005. PLoS One 5, e13969 (2010)
3m Reynolds, R. W. et al. Daily high-resolution-blended analyses for sea surface
temperature. J. Clim. 20, 5473-5496 (2007)
3m Heron, S.F., et al. Climatology development for NOAA Coral ReefWatch's 5-km
product suite. NOAA Technical Report NESDIS 145 (NOAA/NESDIS, 2015)
3ffl Rayner, N. et al. Global analyses of sea surface temperature, sea ice, and night marine
air temperature since the late nineteenth century. J. Geophys. Res. 108, 4407 (2003)
3Hi Globcolour. Remotely-sensed chlorophyll concentration (mg/m3) and Secchi Disk
depth (m) based on Sea-Viewing Wide Field of View Sensor (SeaWIFS) imagery.
http://hermes.acri.fr/ (2016)
https://www.nature.com/articles/nature21707 223
2/9/2021 Global warming and recurrent mass bleaching of corals I Nature
Acknowledgements
The authors acknowledge the 21 institutions that supported this research, in Australia, the UK,
and the USA. Twenty-six of the authors are supported by funding from the Australian
Research Council's Centre of Excellence Program. Other funding support includes the
Australian Commonwealth Government, the European Union, the USA National
Oceanographic & Atmospheric Administration, and USA National Science Foundation.
GlobColour data (http://globcolour.info) used in this study has been developed, validated, and
distributed by ACRI-ST, France. The contents in this manuscript are solely the opinions of the
authors and do not constitute a statement of policy, decision or position on behalf of NOAA or
the US Government. We thank the many student volunteers who participated in field studies.
Author information
1. 24 Hanwood Court, Gilston, Queensland 4211, Australia
Affiliations
1. Australian Research Council Centre of Excellence for Coral Reef Studies, James Cook
University, Townsville, 4811, Queensland, Australia
Terry P. Hughes, James T. Kerry, Mariana Alvarez-Noriega, Jorge G. Alvarez-
Romero, Kristen D. Anderson, Andrew H. Baird, David R. Bellwood, Tom C. Bridge, Sean R.
Connolly, Graeme S. Cumming, Hugo B. Harrison, Andrew S. Hoey, Mia 0.
Hoogenboom, Chao-yang Kuo, Janice M. Lough, Michael J. McWilliam, Morgan S.
Pratchett, Gergely Torda & Bette L. Willis
2. College of Science and Engineering, James Cook University, Townsville, 4811,
Queensland, Australia
Mariana Alvarez-Noriega, David R. Bellwood, Ray Berkelmans, Sean R. Connolly, Mia 0.
Hoogenboom & Bette L. Willis
https://www.nature.com/artides/nature21707 .,., ..
2/9/2021 Global warming and recurrent mass bleaching of corals I Nature
3. Commonwealth Science and Industry Research Organization, GPO Box 2583, Brisbane,
4001, Queensland, Australia
Russell C. Babcock
4. School of Biology, University of Leeds, Leeds, LS2 9JT, UK
Maria Beger
5. Queensland Museum, 70-102 Flinders St, Townsville, 4810, Queensland, Australia
Tom C. Bridge
6. Australian Research Council, Centre of Excellence for Coral Reef Studies, School of
Biological Sciences, University of Queensland, Brisbane, 4072, Queensland, Australia
Ian R. Butler, John M. Pandolfi & Brigitte Sommer
7. School of Medical Sciences, University of Sydney, Sydney, New South Wales, 2006,
Australia
Maria Byrne
8. Australian Institute of Marine Science, PMB 3, Townsville, 4810, Queensland, Australia
Neal E. Cantin, Janice M. Lough & Gergely Torda
9. Australian Research Council Centre of Excellence in Coral Reef Studies, Oceans
Institute and School of Earth and Environment, University of Western Australia,
Crawley, Western Australia, 6009, Australia
Steeve Comeau, Ryan J. Lowe, Malcolm T. McCulloch & Verena Schoepf
10. Department of Primary Industries, Fisheries Research, PO Box 4291, Coffs Harbour,
2450, New South Wales, Australia
https://www.nature.com/articles/nature21707 225
2/9/2021 Global warming and recurrent mass bleaching of corals I Nature
Steven J. Dalton & Hamish A Malcolm
11. School of Environment, and Australian Rivers Institute, Griffith University, Brisbane,
4111, Queensland, Australia
Guillermo Diaz-Pulido & Emma V. Kennedy
12. Coral Reef Watch, US National Oceanic and Atmospheric Administration, College Park,
Maryland, 20740, USA
C. Mark Eakin, Scott F. Heron, Gang Liu & William J. Skirving
13. School of Biological Sciences, University of Sydney, Sydney, 2006, New South Wales,
Australia
Will F. Figueira
14. Australian Institute of Marine Science, Indian Oceans Marine Research Centre,
University of Western Australia, Crawley, 6009, Western Australia, Australia
James P. Gilmour
15. Global Science & Technology, Inc., Greenbelt, 20770, Maryland, USA
Scott F. Heron, Gang Liu & William J. Skirving
16. Marine Geophysical Laboratory, College of Science, Technology and Engineering, James
Cook University, Townsville, 4811, Queensland, Australia
Scott F. Heron
17. Department of Environment and Agriculture, Curtin University, Perth, 6845, Western
Australia, Australia
Jean-Paul A Hobbs
219/2021 Global wanning and recurrent mass bleaching of corals I Nature
18. Great Barrier Reef Marine Park Authority, PO Box 1379, Townsville, 4810, Queensland,
Australia
Rachel J. Pears & David R. Wachenfeld
19. Torres Strait Regional Authority, PO Box 261, Thursday Island, 4875, Queensland,
Australia
Tristan Simpson
20. Department of Parks and Wildlife, Kensington, Perth, 6151, Western Australia, Australia
Shaun K. Wilson
Contributions
The study was conceptualized by T.P.H. who wrote the first draft of the paper. All authors
contributed to writing subsequent drafts. J.T.K. coordinated data compilation, analysis and
graphics. Aerial bleaching surveys in 2016 of the Great Barrier Reef and Torres Strait were
executed by J.T.K., T.P.H. and T.S., and in 1998 and 2002 by R.B. and D.R.W. Underwater
bleaching censuses in 2016 were undertaken on the Great Barrier Reef by M.A.-N., A.H.B.,
D.R.B., M.B., N.E.C., C.Y.K., G.D.-P., A.S.H., M.O.H., E.V.K., M.J.M., R.J.P., M.S.P., G.T.
and B.L.W., in the Coral Sea by T.C.B. and H.B.H., in subtropical Queensland and New South
Wales by M.B., I.R.B., R.C.B., S.J.D., W.F.F., H.A.M., J.M.P. and B.S., off western Australia
by R.C.B., S.C., J.P.G., J.-P.A.H., M.T.M., V.S. and S.K.W. J.G.A.-R., S.R.C., C.M.E., S.F.H.,
G.L., J.M.L. and W.J.S. undertook the analysis matching satellite data to the bleaching
footprints on the Great Barrier Reef.
Corresponding author
Correspondence to Terry P. Hughes.
Ethics declarations
https://www.nature.com/articles/nature21707 227
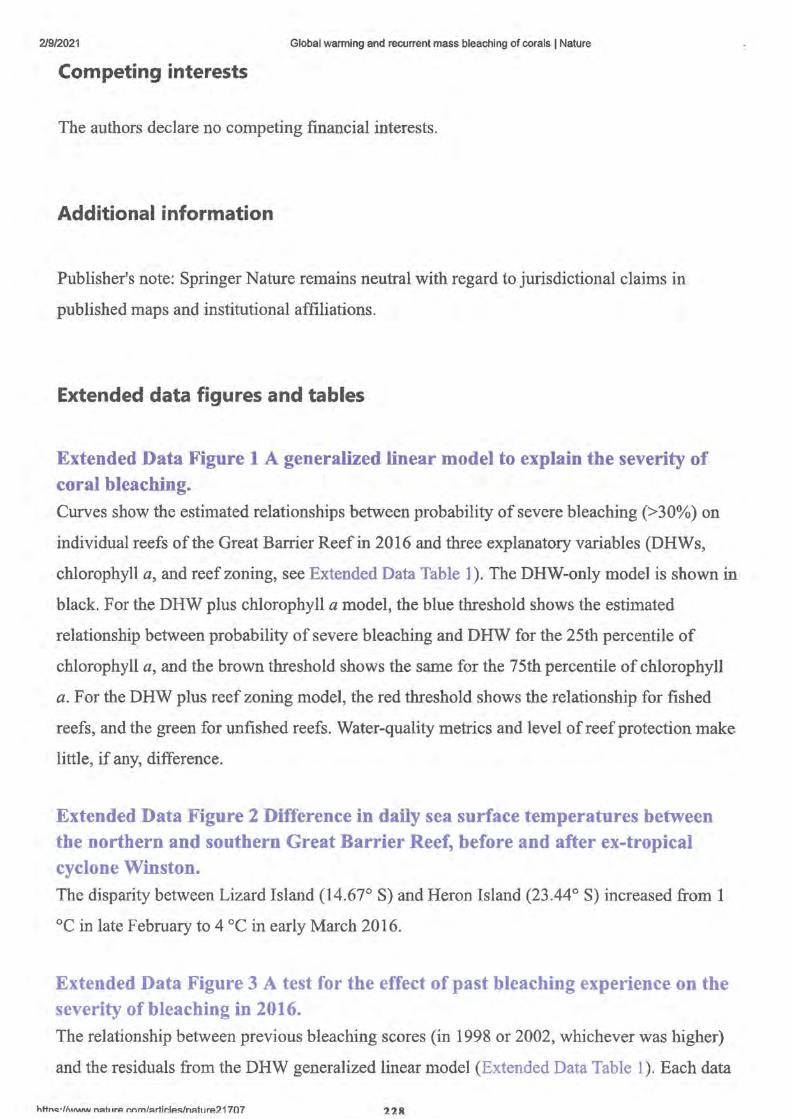
2/9/2021 Global warming and recurrent mass bleaching of corals I Nature
Competing interests
The authors declare no competing financial interests.
Additional information
Publisher's note: Springer Nature remains neutral with regard to jurisdictional claims in
published maps and institutional affiliations.
Extended data figures and tables
Extended Data Figure 1 A generalized linear model to explain the severity of coral bleaching. Curves show the estimated relationships between probability of severe bleaching (> 30%) on
individual reefs of the Great Barrier Reef in 2016 and three explanatory variables (DHWs,
chlorophyll a, and reef zoning, see Extended Data Table I ). The DHW-only model is shown in
black. For the DHW plus chlorophyll a model, the blue threshold shows the estimated
relationship between probability of severe bleaching and DHW for the 25th percentile of
chlorophyll a, and the brown threshold shows the same for the 75th percentile of chlorophyll
a. For the DHW plus reef zoning model, the red threshold shows the relationship for fished
reefs, and the green for unfished reefs. Water-quality metrics and level of reef protection make
little, if any, difference.
Extended Data Figure 2 Difference in daily sea surface temperatures between the northern and southern Great Barrier Reef, before and after ex-tropical cyclone Winston. The disparity between Lizard Island (14.67° S) and Heron Island (23.44° S) increased from I
°C in late February to 4 °C in early March 2016.
Extended Data Figure 3 A test for the effect of past bleaching experience on the severity of bleaching in 2016. The relationship between previous bleaching scores (in 1998 or 2002, whichever was higher)
and the residuals from the DHW generalized linear model (Extended Data Table 1 ). Each data
httnc,•1/uMIW nAh irA r-.nm/::.rli~IA~/n::.turP.21707 22K
mi12021 Global warming and recurrent mass bleaching of corals I Nature
point represents an individual reef that was scored repeatedly. There is no negative relationship
to support acclimation or adaptation.
Extended Data Figure 4 Flight tracks of aerial surveys of coral bleaching, conducted along and across the Great Barrier Reef and Torres Strait in March and April 2016. Blue colour represents land, white colour represents open water.
Extended Data Figure 5 Ground-trothing comparisons of aerial and underwater bleaching scores. Aerial scores are: 0 (<l % of colonies bleached), 1 (1-10%), 2 (10-30%), 3 (30-60%) and 4
(60-100%) on the Great Barrier Reef in 2016 (Fig. la). Continuous (0-100%) underwater
scores are based on in situ observations from 259 sites (104 reefs). Error bars indicate two
standard errors both above and below the median underwater score, separately for each aerial
category.
Extended Data Table 1 A test for the causes of coral bleaching
Extended Data Table 2 Winners and losers
PowerPoint slides
PowerPoint slide for Fig. 1 PowerPoint slide for Fig. 2 PowerPoint slide for Fig. 3 PowerPoint slide for Fig. 4
Rights and permissions
Reprints and Permissions
https://www.nature.com/articles/nature21_707 229
2/9/2021 Global warming and recurrent mass bleaching of corals I Nature
About this article
Cite this article
Hughes, T., Kerry, J., Alvarez-Noriega, M. et al. Global warming and recurrent mass
bleaching of corals. Nature 543, 373-377 (2017). https://doi.org/10.1038/nature21707
Received 07 October 2016 Accepted 16 February 2017 Published 16 March 2017
Issue Date 16 March 2017 DOI https://doi.org/10.1038/nature21707
Subjects Climate-change ecology • Marine biology
Further reading
• Interactive effects of increased temperature and gadolinium
pollution in Paracentrotus lividus sea urchin embryos: a climate change perspective Chiara Martino, Maria Byrne[ ... ] & Roberto Chiarelli
Aquatic Toxicology (2021)
• Turbulence and Coral Reefs
Kristen A Davis, Geno Pawlak & Stephen G. Monismith
Annual Review of Marine Science (2021)
• Future thermal regimes for epaulette sharks {Hemiscyllium
ocellatum): growth and metabolic performance cease to be optimal Carolyn R. Wheeler, Jodie L. Rummer[ ... ] & John W. Mandelman
Scientific Reports (2021)
https://www.nature.com/articles/nature21707 230
2/9/2021 Global warming and recurrent mass bleaching of corals I Nature
~ • Assessing the feasibility of the 228Th/228Ra dating method for
young corals ( < 10 a} by gamma spectrometry Wuhui Lin, Kefu Yu [ ... ] & Hao Ma
Quaternary Geochronology (2021)
• Untangling ITS2 genotypes of algal symbionts in zooxanthellate
corals Tuo Shi, Gaofeng Niu[ ... ] & Dan Tchernov
Molecular Ecology Resources (2021)
Nature ISSN 1476-4687 (online)
© 2021 Springer Nature Limited
https:/lwww.nature.com/articles/nature21707 231

Section F:
Impact of Floods and Sediment reports
233

234
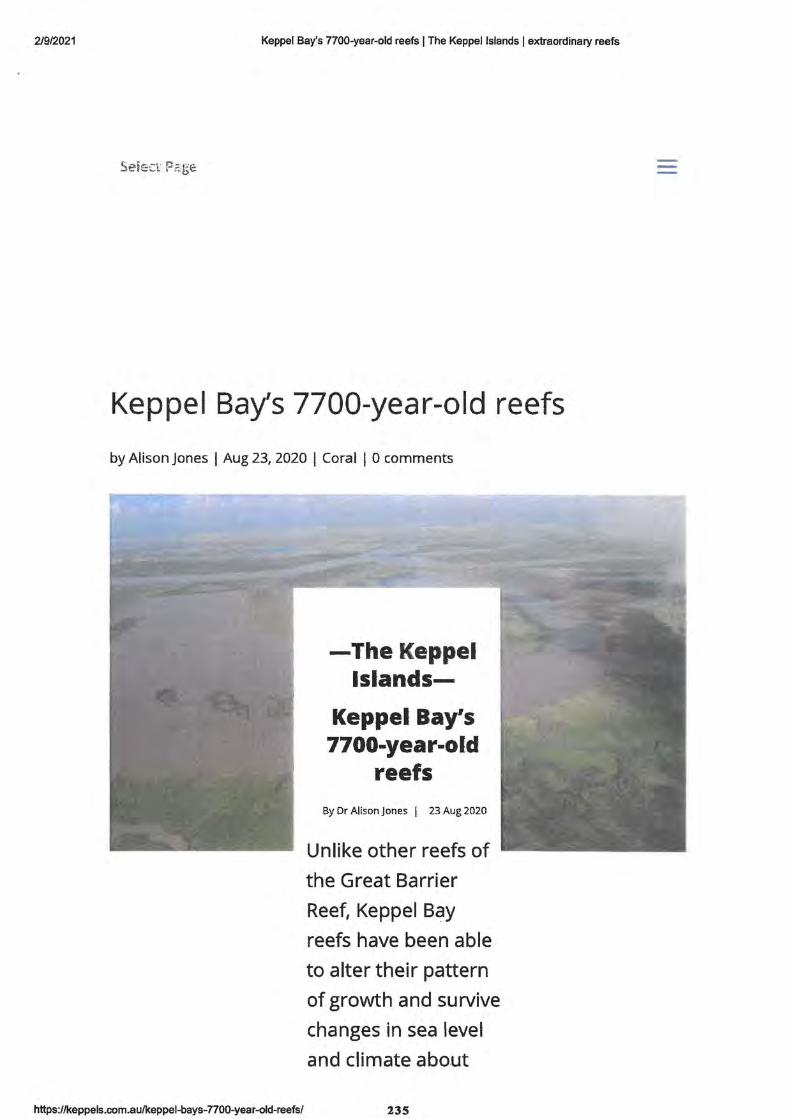
2/9/2021 Keppel Bay's 7700-year-old reefs I The Keppel Islands I extraordinary reefs
Keppel Bay's 7700-year-old reefs
by Alison Jones I Aug 23, 2020 I Coral I O comments
-The Keppel Islands-
Keppel Bay's 7700-year-old
reefs By Dr Alison Jones I 23 Aug 2020
Unlike other reefs of
the Great Barrier
Reef, Keppel Bay
reefs have been able
to alter their pattern
of growth and survive
changes in sea level
and climate about
https://keppels.com.au/keppel-bays-7700-year-old-reefs/ 13 5
2/9/2021 Keppel Bay's 7700-year-old reefs I The Keppel Islands I extraordinary reefs
every 1000-2000
years, a new study
has revealed [1 ].
Approximately 5500
years ago, when sea
levels fell, all the
reefs of the 8000
year old Great Barrier
Reef slowed down to
almost zero vertical
growth, but the study
found, the reefs of
Halfway Island and
North Keppel Island
started growing
sideways at an
astonishing rate.
North Keppel
Island
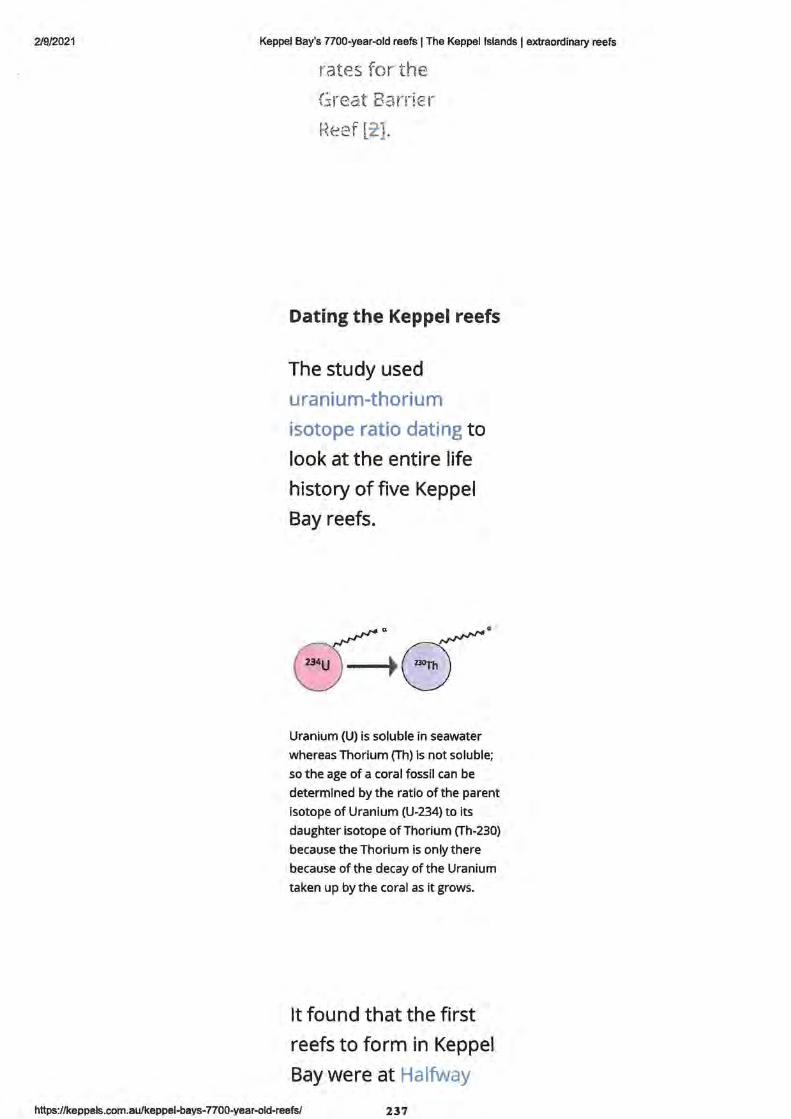
2/9/2021 Keppel Bay's 7700-year-old reefs I The Keppel Islands I extraordinary reefs
rates for the
Great Ba!T!E::r t) ·. ·• r.:r i-,.eer lz:].
Dating the Keppel reefs
The study used
uranium-thorium
isotope ratio dating to
look at the entire life
history of five Keppel
Bay reefs.
Uranium (U) is soluble in seawater
whereas Thorium (Th) is not soluble;
so the age of a coral fossil can be
determined by the ratio of the parent
isotope of Uranium (U-234) to its
daughter isotope ofThorium (Th-230)
because the Thorium is only there
because of the decay of the Uranium
taken up by the coral as it grows.
It found that the first
reefs to form in Keppel
Bay were at Halfway
https://keppels.com.au/keppel-bays-7700-year-old-reefs/ 237
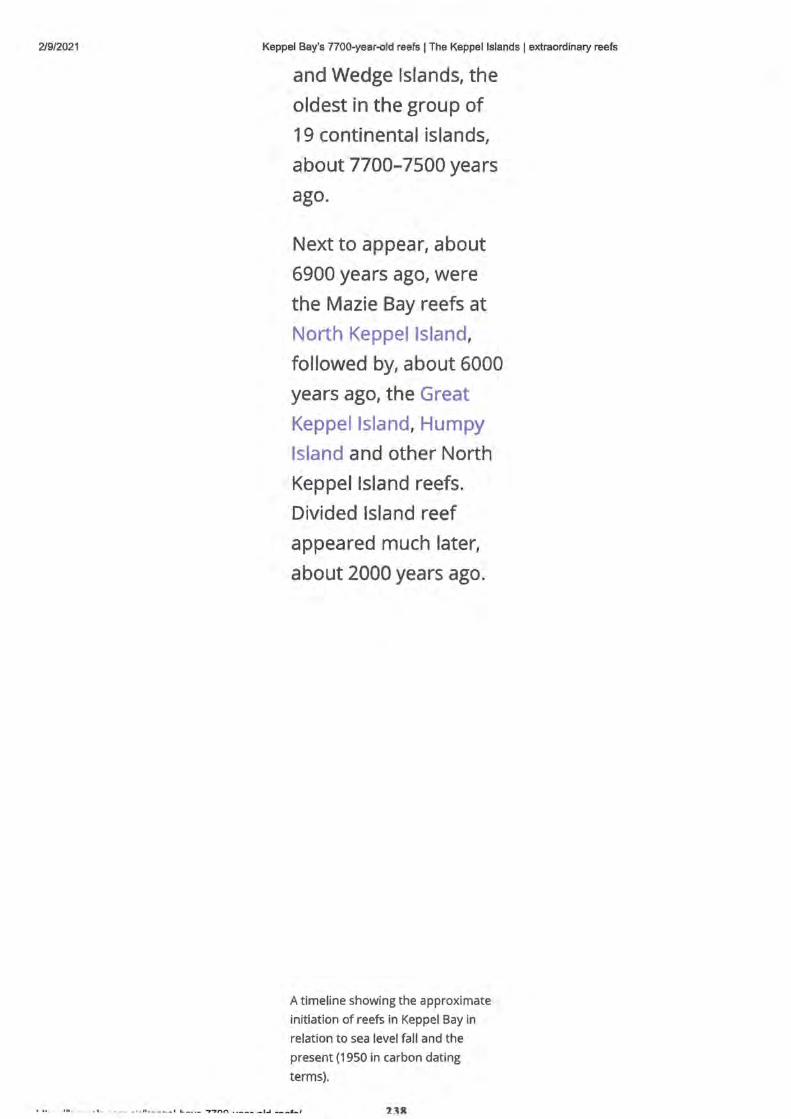
2/9/2021 Keppel Bay's 7700-year-old reefs I The Keppel Islands I extraordinary reefs
and Wedge Islands, the
oldest in the group of
19 continental islands,
about 7700-7500 years
ago.
Next to appear, about
6900 years ago, were
the Mazie Bay reefs at
North Keppel Island,
followed by, about 6000
years ago, the Great
Keppel Island, Humpy
Island and other North
Keppel Island reefs.
Divided Island reef
appeared 1much later,
about 2000 years ago.
A timeline showing the approximate
initiation of reefs in Keppel Bay in
relation to sea level fall and the
present (1950 in carbon dating
terms).
• •• -''" --·-·- - •- -- - -·· " -----• L-· ·- -,.-,.nn ··--- -•~ ---1-1 2'.lll
2~/2021 Keppel Bay's 7700-year-old reefs I The Keppel Islands I extraordinary reefs
Mud may have protected the coral structures from erosion
The scientists think
such high growth rates
and the survival of
Keppel Bay reefs in a
muddy bay were made
possible because:
• sediment transported by the mighty Fitzroy River into KeppeJ Bay quickly buries and preserves the coral framework, reducing coral erosion and bioerosion (by marine creatures), and providing a substrate for new coral to grow on and
~ tI·.c 1-::':·> ··,n•.::·1 ;·•pef·.-., 1,-·1 ~\;,: .,:-... ,,_1..., 1-..c, 1 •••• ~-. c, •~
!'r,r, nf h-~·r -,,,.·>r-..... ,,._.,._- ....... , • \ 1. , Uf·--'"·~ ~ a
https://keppels.com.au/keppel-bays-7700-year-old-reefs/ 239
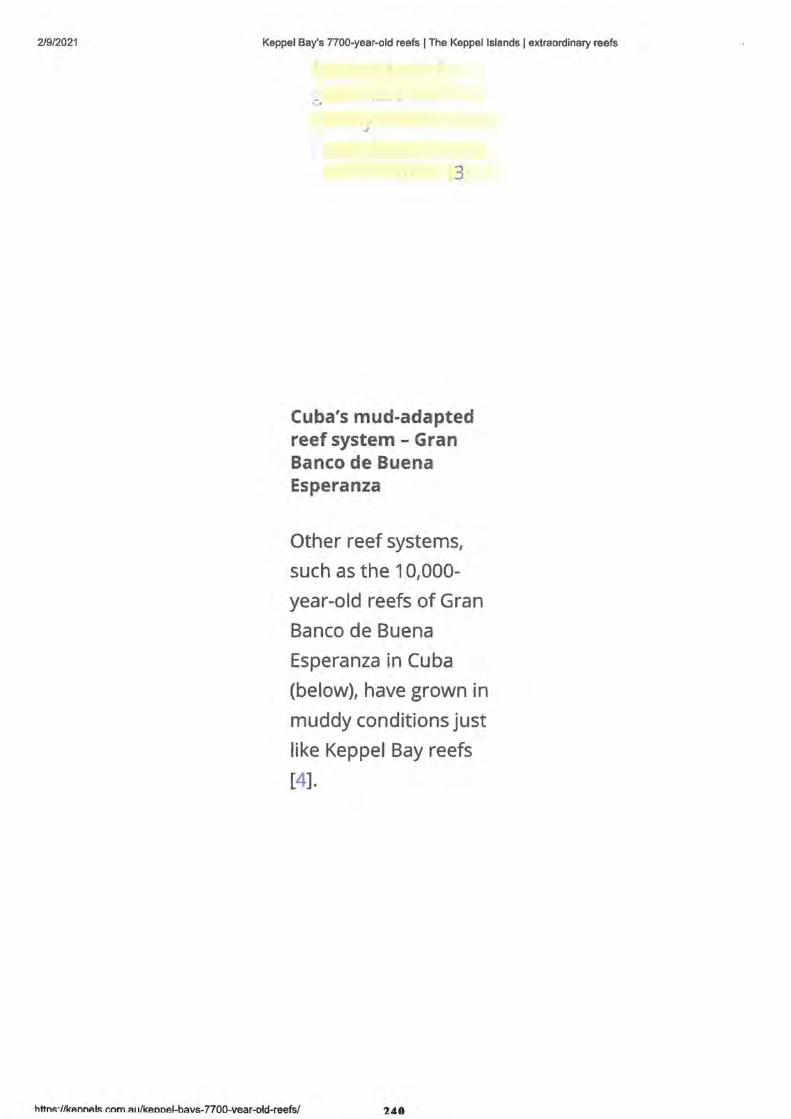
2/9/2021 Keppel Bay's 7700-year-old reefs I The Keppel Islands I extraordinary reefs
.,
3
Cuba's mud-adapted reef system - Gran Banco de Buena Esperanza
Other reef systems,
such as the 1 0,000-
year-old reefs of Gran
Banco de Buena
Esperanza in Cuba
(below), have grown in
muddy conditions just
like Keppel Bay reefs
[4].
httm::• //lcAnnAI~ .r.nm.au/kennel-bavs-7700-vear-old-reefs/ 240
2/9/2021 Keppel Bay's 7700-year-old reefs I The Keppel Islands I extraordinary reefs
Located at the mouth
of the Rf o Cauto
Cuba's longest river
Gran Banco de Buena
Esperanza spans 25 by
40 kilometres of the
central part of the bay.
The corals here have
grown into a maze-like
network of ridges
interspersed with
ponds and channels,
and reaching 25
metres above the
seafloor.
The reefs actually
extend another 50
metres below, buried
in mud, sand and
compacted red clay.
The reef system
sustains coral species
https://keppels.com.au/keppel-bays-7700-year-old-reefs/ 241
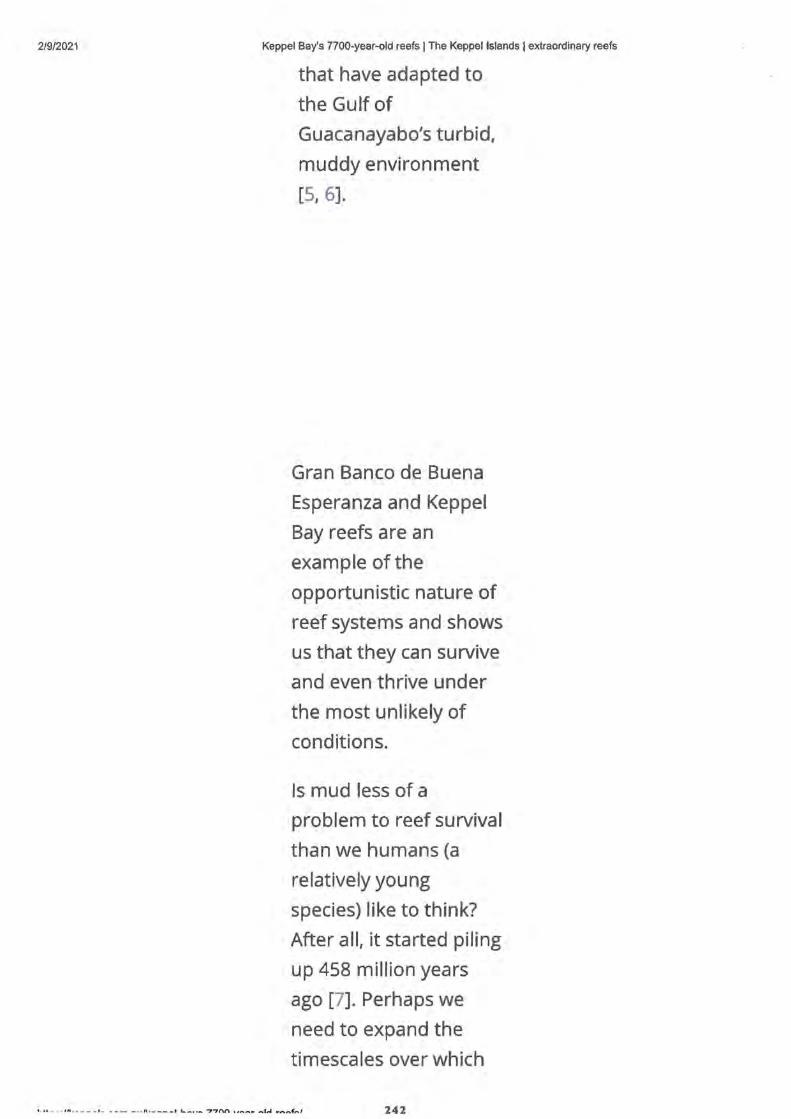
2/9/2021 Keppel Bay's 7700-year-old reefs I The Keppel Islands I extraordinary reefs
that have adapted to
the Gulf of
Guacanayabo's turbid,
muddy environment
[5, 6].
Gran Banco de Buena
Esperanza and Keppel
Bay reefs a re an
example of the
opportunistic nature of
reef systems and shows
us that they can survive
and even thrive under
the most unlikely of
conditions.
Is mud less of a
problem to reef survival
than we humans (a
relatively young
species) like to think?
After all, it started piling
up 458 million years
ago [7]. Perhaps we
need to expand the
timescales over which
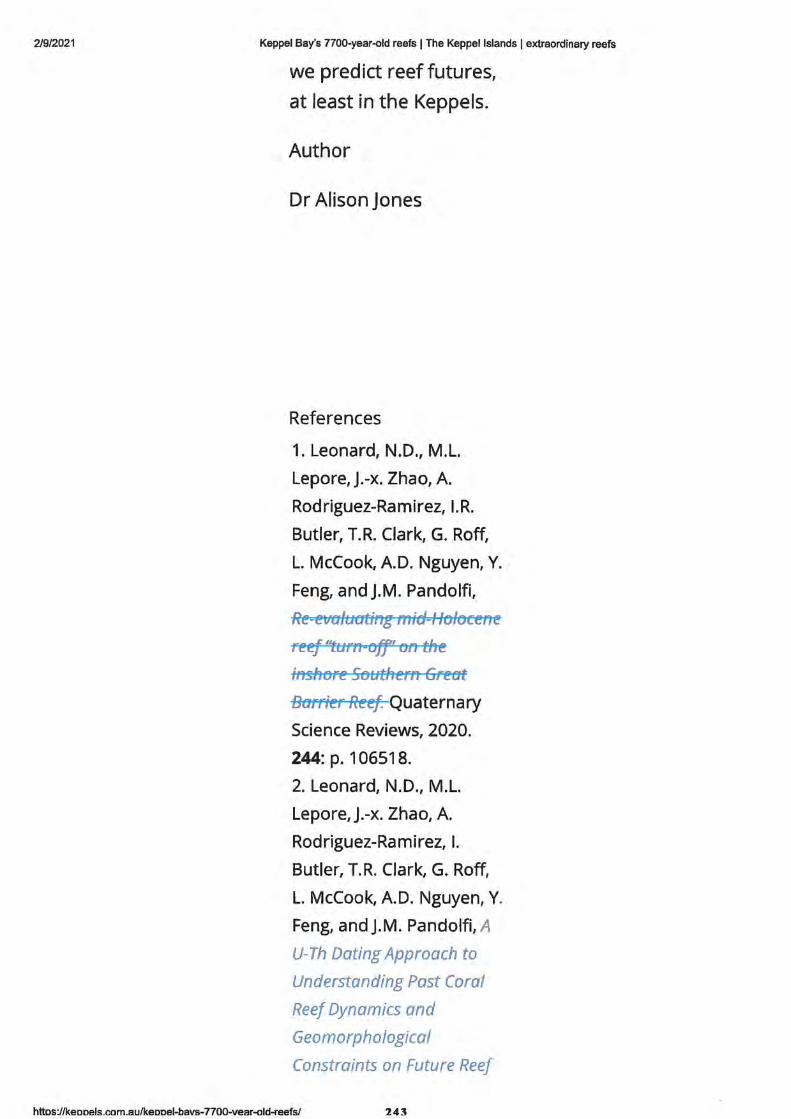
2/9/2021 Keppel Bay's 7700-year-old reefs I The Keppel Islands I extraordinary reefs
we predict reef futures,
at least in the Keppels.
Author
Dr Alison Jones
References
1. Leonard, N.D., M.L.
Lepore, J.-x. Zhao, A.
Rodriguez-Ramirez, I.R.
Butler, T.R. Clark, G. Roff,
L. McCook, AD. Nguyen, Y.
Feng, and J.M. Pandolfi,
Re-evaluatirtg mid-1.'-olocene
reef ''turn-off' on the
inshore Southern Great
Barrier Reef. Quaternary
Science Reviews, 2020.
244: p. 106518.
2. Leonard, N.D., M.L.
Lepore, J.-x. Zhao, A.
Rodriguez-Ramirez, I.
Butler, T.R. Clark, G. Roff,
L. McCook, A.O. Nguyen, Y.
Feng, and J.M. Pandolfi, A
U-Th Dating Approach to
Understanding Past Coral
Reef Dynamics and
Geomorphological
Constraints on Future Reef
httos://keooels.com.au/keooel-bavs-7700-vear-old-reefs/ 243
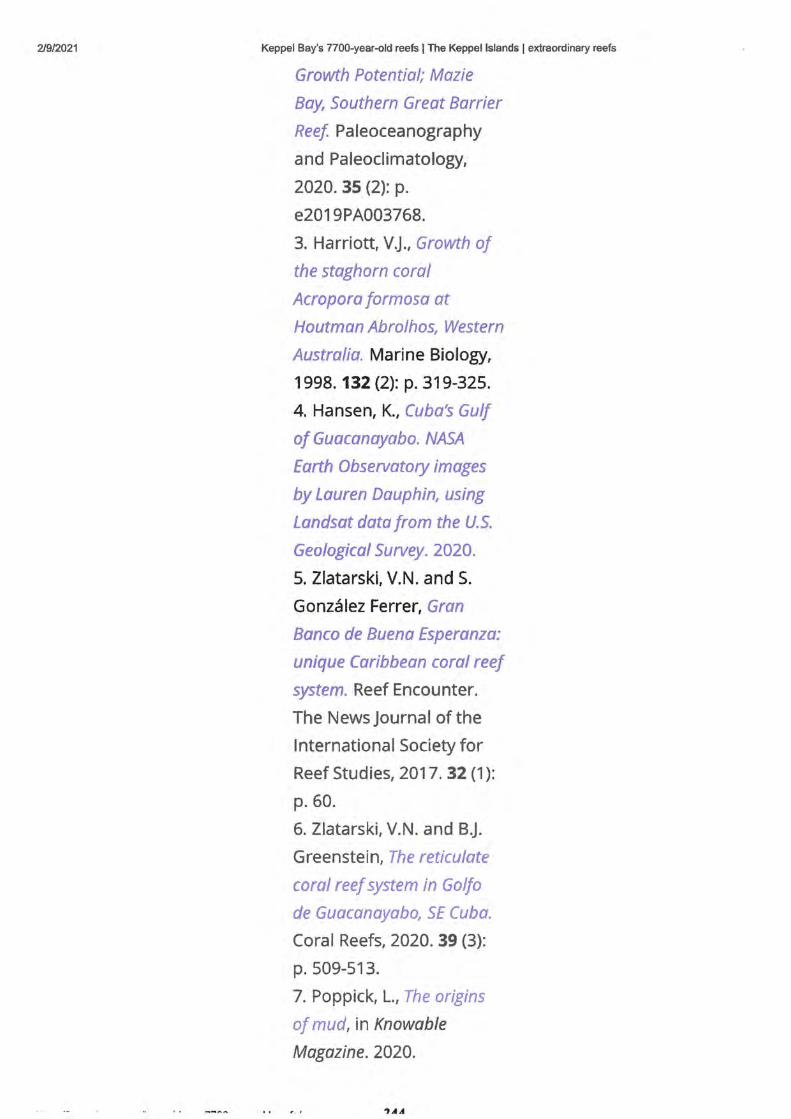
2/9/2021 Keppel Bay's 7700-year-old reefs I The Keppel Islands I extraordinary reefs
Growth Potential; Mazie
Bay, Southern Great Barrier
Reef Paleoceanography
and Paleoclimatology,
2020. 35 (2): p.
e2019PA003768.
3. Harriott, V.J., Growth of
the staghorn coral
Acropora formosa at
Houtman Abrolhos, Western
Australia. Marine Biology,
1998. 132 (2): p. 319-325.
4. Hansen, K., Cuba's Gulf
of Guacanayabo. NASA
Earth Observatory images
by Lauren Dauphin, using
Landsat data from the U.S.
Geological Survey. 2020.
5. Zlatarski, V.N. and S.
Gonzalez Ferrer, Gran
Banco de Buena Esperanza:
unique Caribbean coral reef
system. Reef Encounter.
The News Journal of the
International Society for
Reef Studies, 2017. 32 (1 ):
p. 60.
6. Zlatarski, V.N. and B.J.
Greenstein, The reticulate
coral reef system in Golfo
de Guacanayabo, SE Cuba.
Coral Reefs, 2020. 39 (3):
p. 509-513.
7. Poppick, L., The origins
of mud, in Knowable
Magazine. 2020.
2/9/2021 Keppel Bay's 7700-year-old reefs I The Keppel Islands I extraordinary reefs
Share this:
tm rp
Recent Posts
The Gordon La Praik Soft Coral Collection
Keppel Bay's 7700-year-old reefs
Keppels first bleaching in 14 years
Keppels bleaching 2020
Patchy coral bleaching observed Monkey Reef
Recent Comments
Alison Jones on From dive-shop girl to research scientist
Cyprus diving on From dive-shop girl to research scientist
Willa on From dive-shop girl to research scientist
Jude on Tuskfish uses rock to crack open cockle shell
Ann on Ferocious Pufferfish filmed at Pelican Island
Archives
November 2020
August 2020
April 2020
https://keppels.com .au/keppel-bays-7700-year-old-reefs/ 245
Search
2/9/2021 Keppel Bay's 7700-year-old reefs I The Keppel Islands I extraordinary reefs
March 2020
January 2020
November 2019
September 2019
June 2019
May 2019
April 2019
Categories
Coral
Everything else
People and places
Meta
Login
Entries feed
Comments feed
WordPress.org
246

2/9/2021
Like Page
The Keppel Islands about 3 months ago
Keppel Bay's 7700-year-old reefs I The Keppel Islands I extraordinary reefs
f @
Designed by Elegant Themes I Powered by Word Press
https://keppels.com.au/keppel-bays-7700-year-old-reefs/ 247

248
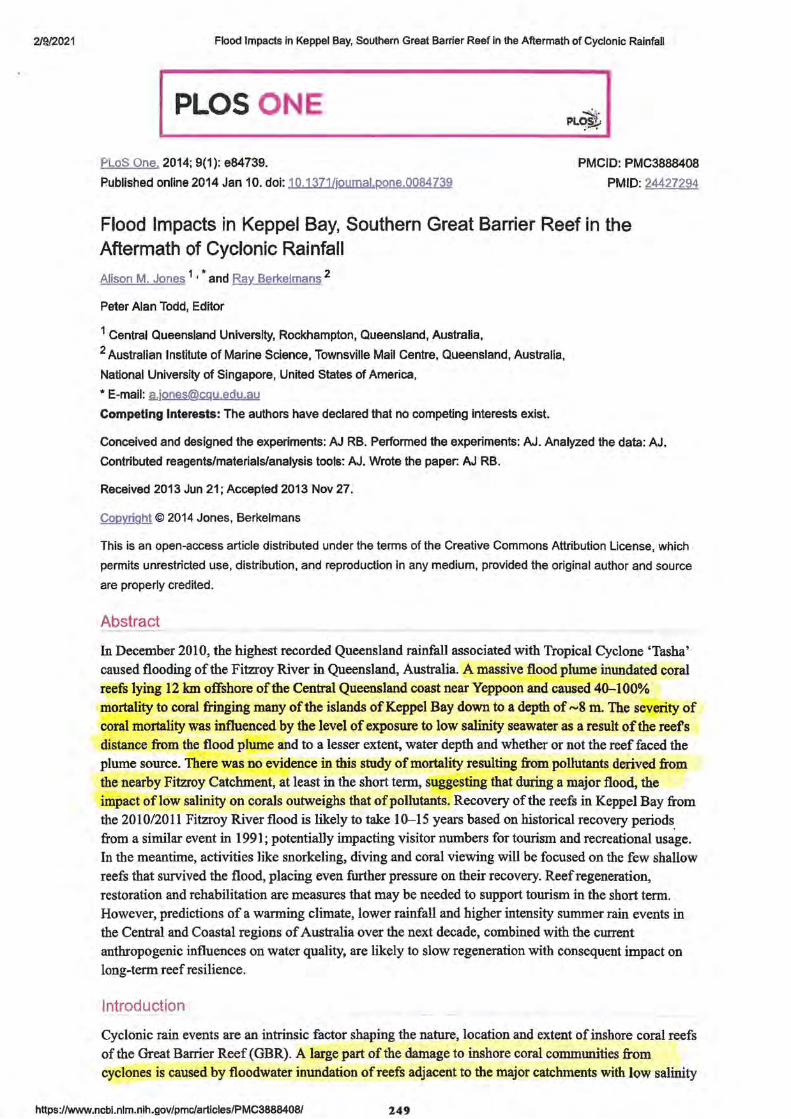
2/9./2021 Flood Impacts in Keppel Bay, Southern Great Barrier Reef in the Aftermath of Cyclonic Rainfall
I PLOS O E
PLoS One. 2014; 9(1): e84739.
Published online 2014 Jan 10. doi: 10.1371/journal.J:lone.0084739
PMCID: PMC3888408
PMID: 24427294
Flood Impacts in Keppel Bay, Southern Great Barrier Reef in the Aftermath of Cyclonic Rainfall
Alison M. Jones 1 • * and RaY. Berkelmans 2
Peter Alan Todd, Editor
1 Central Queensland University, Rockhampton, Queensland, Australia, 2 Australian Institute of Marine Science, Townsville Mail Centre, Queensland, Australia,
National University of Singapore, United States of America,
* E-mail: g,[email protected]
Competing Interests: The authors have declared that no competing interests exist.
Conceived and designed the experiments: AJ RB. Performed the experiments: AJ. Analyzed the data: AJ.
Contributed reagents/materials/analysis tools: AJ. Wrote the paper: AJ RB.
Received 2013 Jun 21; Accepted 2013 Nov 27.
CoJ,!yJ:ight © 2014 Jones, Berkelmans
This is an open-access article distributed under the terms of the Creative Commons Attribution License, which
permits unrestricted use, distribution, and reproduction in any medium, provided the original author and source
are properly credited.
Abstract
In December 2010, the highest recorded Queensland rainfall associated with Tropical Cyclone 'Tasha'
caused flooding of the Fitzroy River in Queensland, Australia. A massive flood plume inundated coral reefs lying 12 km offshore of the Central Queensland coast near Yeppoon and caused 40-100%
mortality to coral fringing many of the islands of Keppel Bay down to a depth of ~8 m. The severity of coral mortality was influenced by the level of exposure to low salinity seawater as a result of the reefs distance :from the flood plume and to a lesser extent, water depth and whether or not the reef faced the plume source. There was no evidence in this study of mortality resulting from pollutants derived from the nearby Fitzroy Catchment, at least in the short term, suggesting that during a major flood, the impact of low salinity on corals outweighs that of pollutants. Recovery of the reefs in Keppel Bay from the 2010/2011 Fitzroy River flood is likely to take 10-15 years based on historical recovery periods_ from a similar event in 1991; potentially impacting visitor numbers for tourism and recreational usage. In the meantime, activities like snorkeling, diving and coral viewing will be focused on the few shallow reefs that swvived the flood, placing even further pressure on their recovery. Reef regeneration, restoration and rehabilitation are measures that may be needed to support tourism in the short term. However, predictions of a wanning climate, lower rainfall and higher intensity summer rain events in the Central and Coastal regions of Australia over the next decade, combined with the current anthropogenic influences on water quality, are likely to slow regeneration with consequent impact on long-term reef resilience.
Introduction
Cyclonic rain events are an intrinsic factor shaping the nature, location and extent of inshore coral reefs of the Great Barrier Reef (GBR). A large part of the damage to inshore coral communities from cyclones is caused by floodwater inundation of reefs adjacent to the major catchments with low salinity
https://www.ncbl.nlm.nih.gov/pmc/articles/PMC3888408/ 249
2/9/2021 Flood Impacts in Keppel Bay, Southern Great Barrier Reef in the Aftermath of Cyclonic Rainfall
exposure influenced largely by the dynamic movement of the flood plume as a result of wind-derived currents and tides [l] . Large loads of suspended sediment and particulate nutrients are also discharged in high flow events from erosion in grazing lands and dissolved inorganic nutrients from fertilised cropping lands in adjacent catchments [l] . It seems logical that the pattern of coral mortality caused by these events correlates strongly with the extent of a reefs exposure to freshwater [II in the short term and exposure to pollutants in the longer term. In fact, it can be said that the spatial patterns of coastal and inshore reef development on the GBR is largely determined by their distance from the source of runoff and floodwaters. Because of the inherent difficulties in monitoring reefs during conditions of high turbidity caused by sediment re-suspension, few studies have investigated the spatial pattern and extent of their short term impact. Natural disturbance events such as floods are not currently incorporated into reef management decisions but given their potential for shaping the nature of inshore reefs, understanding the patterns and severity of flood impacts can inform predictions of recovery that then help assess the potential effects on industries such as local tourism as well as conservation efforts.
The summer of 2010-11 brought with it heavy rain from Cyclones 'Tasha' and 'Yasi' that resulted in flooding of several major catchments along the Queensland coast. Tropical Cyclone 'Tasha' crossed the coast near Babinda in North Queensland on 24 December 2010. The worst coral mortality occurred in the southern GBR (Keppel Bay Islands) and ~300 km south in the Sandy Straits Marine Park between Fraser Island and Hervey Bay [11 whereas most other inshore GBR reefs escaped severe impacts [.5]. In the Central Queensland region, between December 2010 and February 2011 the Fitzroy River reached a peak mean daily discharge of 1.16 million mega-litres day -I [fil over a period of~ 18 days, resulting
in a large flood plume entering the adjacent Keppel Bay (Eig.1.,2) and causing extensive coral mortality on reefs fringing the islands [11, I]]. Agricultural herbicides such as tebuthiuron, atrazine and diuron that are capable of inhibiting photosynthesis in marine benthic organisms were found in discharges from the Fitzroy River in 2011 I]]; mirroring a previous high flow event in 2008 [2], [1.Q]. A similar flood event occurred in the Fitzroy in 1991 as a result of Cyclone 'Joy'. The peak mean daily discharge for the 1991 event was 1.14 million ML day -I with the event lasting ,.., 13 days. The 1991 flood resulted
in 30-90% coral mortality to depths of 0.5-2.3 m below chart datum (2.9-4. 7 m below mean sea level for Keppel Bay) in a pattern consistent with distance from, and exposure to, the plume [.2], [ill, [U] . By 2008, the reefs had recovered to ~52% overall hard coral cover, 17 years after the flood U1J. Such major floods can have devastating impacts on the regional economy because of the loss to tourism and infrastructure [H]. While tourist visitation does not depend entirely on the existence of healthy coral reefs, recovery to their pre-flood state, or better, is critical in supporting reef-based tourism, recreation and the resilience of the reef system as a whole.
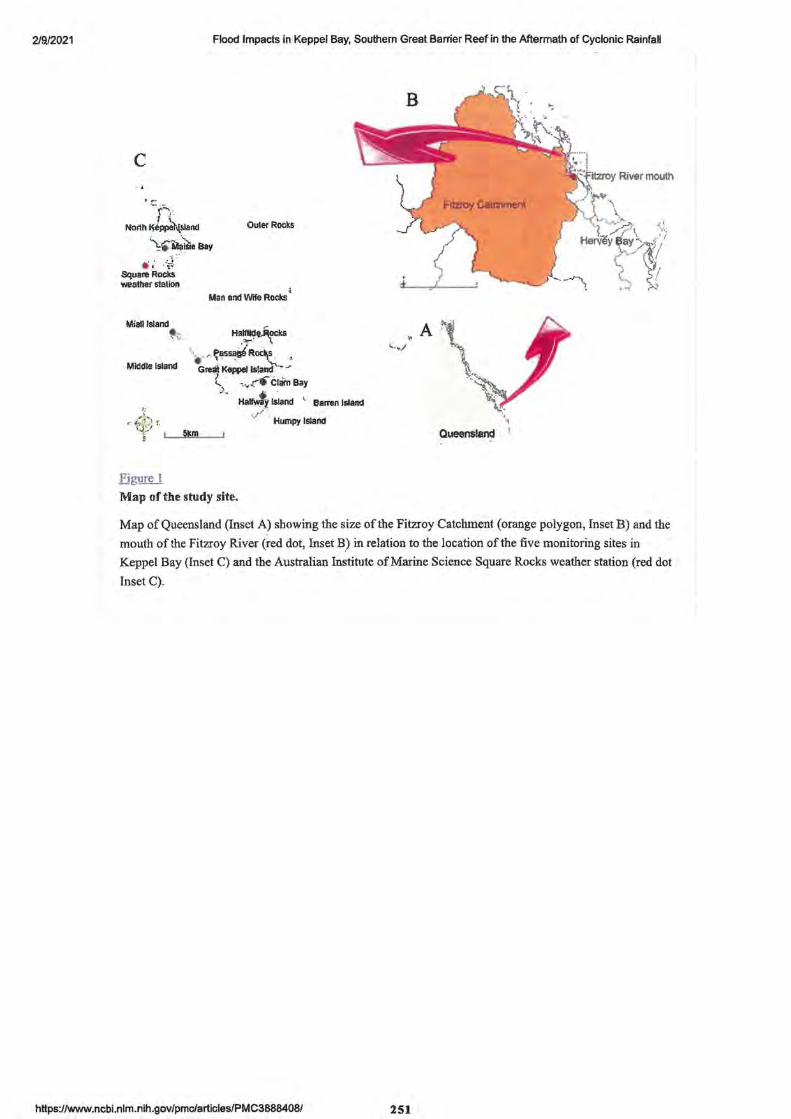
2/9/2021 Flood Impacts in Keppel Bay, Southern Great Barrier Reef in the Aftermath of Cyclonic RainfaN
C
. ~ ... r"" , Notth ~ippe\tsland
\ - ~~eBay OuterRoeks
. , .... I~,
Square RoekS weather station
I Man and Wife RockS
Mlalllsland ~
Middle Island
Figyre 1
Map of the study site.
A~\. \ ~ .. - ....... -.
· .. ·.'
' Queensland !
Map of Queensland (Inset A} showing the size of the Fitzroy Catchment (orange polygon, Inset B) and the
mouth of the Fitzroy River (red dot, Inset B) in relation to the location of the five monitoring sites in
Keppel Bay (Inset C) and the Australian Institute of Marine Science Square Rocks weather station (red dot
Inset C),
https:/lwww.ncbi.nlm.nih.gov/pmc/articles/PMC3888408/ 251
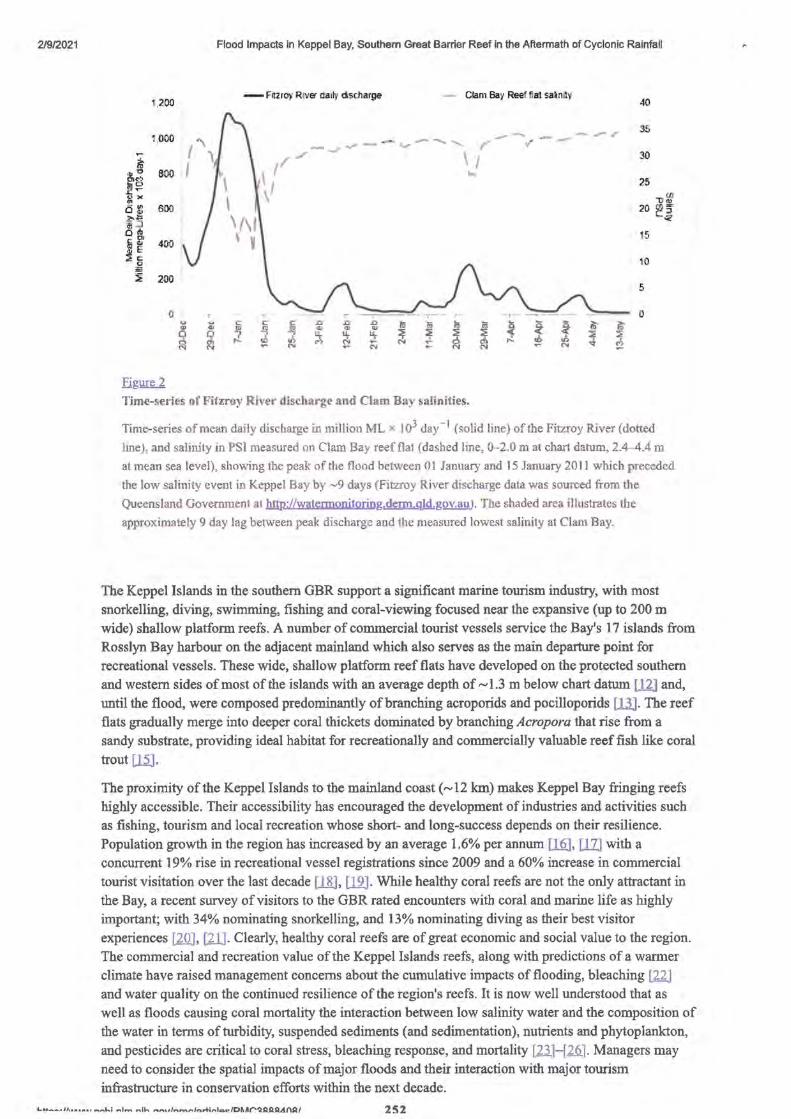
2/9/2021
1,200
1,0ll0
:i f~ 800 s ....
(\ I
l;l )( 0 ~ 600
'~ Q Cl
15 ~ 400 ~ c
C -~ 200
0 T .. u
~ ... q f!l
.Ei~
Flood Impacts in Keppel Bay, Southern Great Barrier Reef in the Aftermath of Cyclonic Rainfall
- Fitzroy River daily d sthi\!rge - Clam Bay Reef ftat saiMy 40
35
30
25 \ \ \/\I ' V
C
"' ;?.
~J....,,,,,._ ......... v...,..---., /.-/ ....... I'
\ I \ I ,, '""
--T ,.. .0
'T _ __
C
~ .0 .0 Ill oi Ill ! "' ., ., .,
J J, u,. ~ tt ~ ~ ~ (') .... N .. .. N ... N ... N N
-- _""""'_,..,.,,.,,,
l)~ 20 00 ;:;i·
c:~
15
\0
5
- -o - ,-- -----·------·~
! ! ! /6' f ~ ..; ... N
Time-series of Fitzroy Rh·er discharge and Clam Bay salinities.
Time-series of mean daily discharge in million ML x I o3 day- 1 ( solid line) of the Fitzroy River ( dotted
line), and salinity in PSI measured on Clam Bay reef flat (dashed line, 0--2.0 mat chart datum, 2.4-4.4 m
at mean sea level), showing the peak of the flood between O 1 January and 15 January 2011 which preceded
the low salinity event in Keppel Bay by ~9 days (Fitzroy River discharge data was sourced from the
Queensland Government at hllP.://watennonitoring.derm.gld.gov.au J. The shaded area illustrates the
approximately 9 day lag between peak discharge and the measured lowest salinity at Clam Bay.
The Keppel Islands in the southern GBR support a significant marine tourism industry, with most
snorkelling, diving, swimming, fishing and coral-viewing focused near the expansive (up to 200 m
wide) shallow platform reefs. A number of commercial tourist vessels service the Bay's 17 islands from
Rosslyn Bay harbour on the adjacent mainland which also serves as the main departure point for
recreational vessels. These wide, shallow platform reef flats have developed on the protected southern
and western sides of most of the islands with an average depth of~ 1.3 m below chart datum 1111 and,
until the flood, were composed predominantly of branching acroporids and pocilloporids [U]. The reef
flats gradually merge into deeper coral thickets dominated by branching Acropora that rise from a
sandy substrate, providing ideal habitat for recreationally and commercially valuable reef fish like coral
trout U2.J.
The proximity of the Keppel Islands to the mainland coast ( ~ 12 km) makes Keppel Bay fringing reefs
highly accessible. Their accessibility has encouraged the development of industries and activities such
as fishing, tourism and local recreation whose short- and long-success depends on their resilience.
Population growth in the region has increased by an average 1.6% per annum [lfil, [l1] with a
concurrent 19% rise in recreational vessel registrations since 2009 and a 60% increase in commercial
tourist visitation over the last decade [.lfil, [12] . While healthy coral reefs are not the only attractant in
the Bay, a recent survey of visitors to the GBR rated encounters with coral and marine life as highly
important; with 34% nominating snorkelling, and 13% nominating diving as their best visitor
experiences [20] , 111]. Clearly, healthy coral reefs are of great economic and social value to the region.
The commercial and recreation value of the Keppel Islands reefs, along with predictions of a wanner
climate have raised management concerns about the cumulative impacts of flooding, bleaching [22]
and water quality on the continued resilience of the region's reefs. It is now well understood that as
well as floods causing coral mortality the interaction between low salinity water and the composition of
the water in terms of turbidity, suspended sediments (and sedimentation), nutrients and phytoplankton,
and pesticides are critical to coral stress, bleaching response, and mortality [D.]- [2.Q.] . Managers may
need to consider the spatial impacts of major floods and their interaction with major tourism
infrastructure in conservation efforts within the next decade.
11,,....., __ .,,. ............... 1,.,: -·- ... 11-. ... ,., .. ,,.,,,,_..,.,Grti,-.loe!-IDPtAr'=lf:IAA.AnA/ 2S2
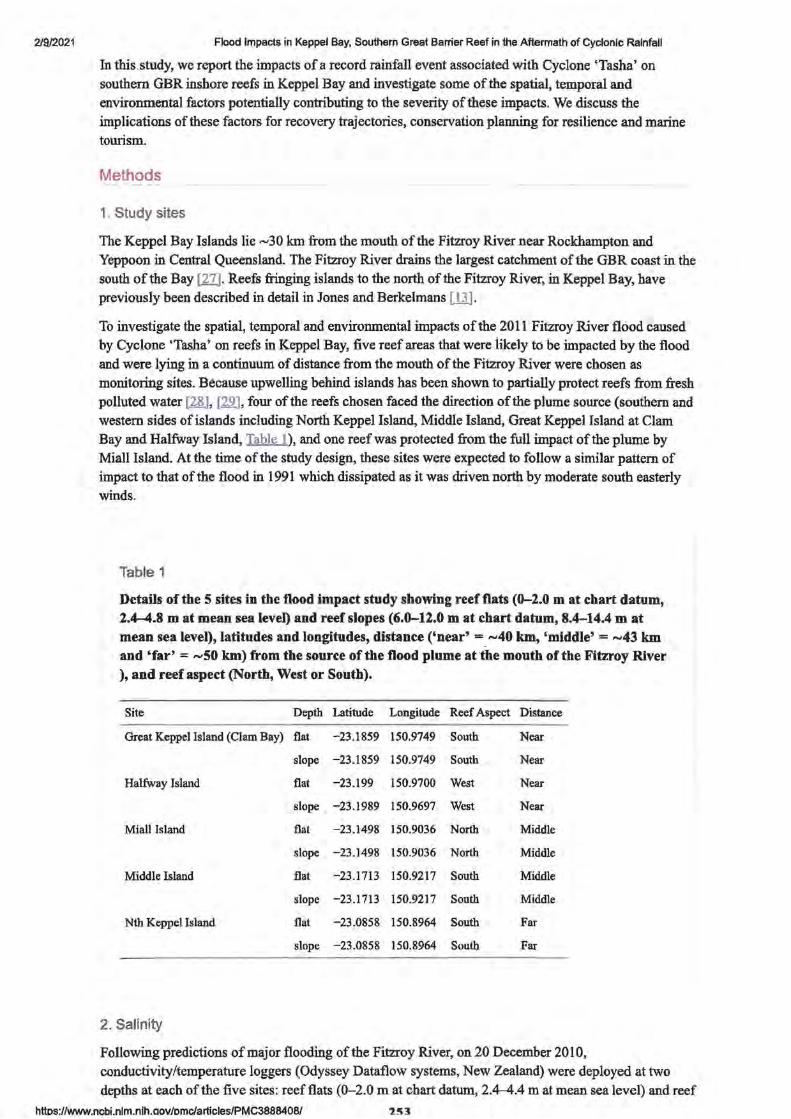
2/9/2021 Flood Impacts in Keppel Bay, Southern Great Barrier Reef in the Aftermath of Cyclonic Rainfall
In this .study, we report the impacts of a record rainfall event associated with Cyclone 'Tasha' on southern GBR inshore reefs in Keppel Bay and investigate some of the spatial, temporal and environmental factors potentially contributing to the severity of these impacts. We discuss the implications of these factors for recovery trajectories, conservation planning for resilience and marine tourism.
Methods
1. Study sites
The Keppel Bay Islands lie ~30 km from the mouth of the Fitzroy River near Rockhampton and Yeppoon in Central Queensland. The Fitzroy River drains the largest catchment of the GBR coast in the south of the Bay [27]. Reefs fringing islands to the north of the Fitzroy River, in Keppel Bay, have previously been described in detail in Jones and Berkelmans 1111-
To investigate the spatial, temporal and environmental impacts of the 2011 Fitzroy River flood caused by Cyclone 'Tasha' on reefs in Keppel Bay, five reef areas that were iikely to be impacted by the flood and were lying in a continuum of distance from the mouth of the Fitzroy River were chosen as monitoring sites. Because upwelling behind islands has been shown to partially protect reefs from fresh polluted water [2[1, [22], four of the reefs chosen faced the direction of the plume source (southern and western sides of islands including North Keppel Island, Middle Island, Great Keppel Island at Clam Bay and Halfway Island, Table 1). and one reef was protected from the full impact of the plume by Miall Island. At the time of the study design, these sites were expected to follow a similar pattern of impact to that of the flood in 1991 which dissipated as it was driven north by moderate south easterly winds.
Table 1
Details of the 5 sites in the flood impact study showing reef flats (0-2.0 m at chart datum, 2.4--4.8 mat mean sea level) and reef slopes (6.0-12.0 mat chart datum, 8.4-14.4 m at mean sea level), latitudes and longitudes, distance ('near' = ~40 km, 'middle' = ~43 km and 'far' = ~50 km) from the source of the flood plume at the mouth of the Fitzroy River ), and reef aspect (North, West or South).
Site Depth Latitude Longitude Reef Aspect Distance
Great Keppel Island (Clam Bay) flat -23.1859 150.9749 South Near
slope -23.1859 150.9749 South Near
Halfway Island flat -23.199 150.9700 West Near
slope -23.1989 150.9697 West Near
Miall Island flat -23.1498 150.9036 North Middle
slope -23.1498 150.9036 North Middle
Middle Island flat -23.1713 150.9217 South Middle
slope -23.1713 150.9217 South Middle
Nth Keppel Island flat -23.0858 150.8964 South Far
slope -23.0858 150.8964 South Far
2. Salinity
Following predictions of major flooding of the Fitzroy River, on 20 December 2010, conductivity/temperature loggers (Odyssey Dataflow systems, New Zealand) were deployed at two depths at each of the five sites: reef flats (0-2.0 mat chart datum, 2.4--4.4 mat mean sea level) and reef
httos:l/www.ncbi.nlm.nih.aov/omc/articles/PMC3888408/
2/9/2021 Flood Impacts in Keppel Bay, Southern Great Barrier Reef in the Aftermath of Cyclonic Rainfall
slopes (6.0-12.0 mat chart datum, 8.4-14.4 mat mean sea level). Time-series of mean daily water discharge at the Gap Gauging Station along the Fitzroy River was determined from data sourced from the Queensland Government (b!!P-://watermonitoring.derm.Qld.gov.au). This station is ~ 100 km upstream from the mouth of the Fitzroy River. Conductivity (mS cm -l) measurements loggers
deployed at the study sites were converted to practical salinity units (PSU) using the using the UNESCO-adopted algorithm of Lewis [30] . Technically, the converted salinity values are dimensionless but for the sake of clarity they are hereafter followed by the "PSU" abbreviation.
3. Coral condition
At each of the five study sites, changes in coral condition and cover were recorded along three 20 m long x 1 m wide transects at on reef flats and slopes at the same depths and locations as the salinity loggers. The percentage of living coral cover was recorded before the flood on 20-21 December 2010 and again, after salinities had returned to normal on 15 May 2011. In between these surveys, on 2 January, 21 February, 3-4 March when the flood plume had enveloped the Keppels, general notes on the condition of the coral communities were recorded as visibility allowed. At the time of the last survey most corals had either recovered from bleaching or died. Mortality data only included colonies where death was assumed to be recent and flood-related. Recent death was attributed based on changes from previous surveys and the presence of coral skeletons recently colonised by macro algae.
For the mortality surveys, at each time point, site and depth, three replicate transects were photographed using a 4 mega-pixel digital camera fitted with a 16 mm wide-angle lens at 1 m intervals. Geo-referenced images were obtained for each transect with a towed GPS using the methods of Roelfsema and Phinn Ill] which enabled repeat surveys to be conducted within a few metres of their original location. Digital still images were analysed using 10 random points per image with the program CPCe™ v3.1 [32] .
4. Flood imagery and weather
To assess the impact of the flood against environmental conditions, Moderate Resolution Imaging Spectroradiometer (MODIS) Aqua true colour satellite images of the Fitzroy flood plume were downloaded from the NASA website at (250 m resolution -http://lancemodis.eosdis.nasa.gov/imag~ryjsubsets/?P-roject=other&subset=Austra1ia3). Wind conditions, tides and water temperatures for the 2011 flood were sourced from the Australian Institute of Marine Science Square Rocks weather station [33].
5. Photosystem II inhibiting herbicide concentrations
PSII herbicides are plastoquinone analogs that inhibit photosynthesis by reversibly binding to the Quinone-B binding site on the D1 protein [3!). To assess the impact of exposure to 12 PSII herbicides on coral communities at four of the five sites, passive samplers were deployed between 2 January and the 8 February 2011 (excluding Miall Island). Full details of the entire suite of pesticides samples can be found in Kennedy et al. [[I . Only herbicides found in significant concentrations and with the potential for PSII inhibition are included in this study because of their relevance to scleractinian coralsymbiont photosynthesis [23] and reproduction Q.il, [36]. Time-integrated concentrations (ng.L-1) for
9 of the herbicides were converted to PSII-HEq (equivalent to diuron concentrations derived using average relative potencies) for each site (Table 2) as outlined in Kennedy et al. [[I, [37], Ll8]. Maximum PSII-HEq is an index widely accepted on the GBR for potential for photosynthetic inhibition of diatoms, seagrass and coral-symbionts with respect to the effects of diuron [.3.2] .
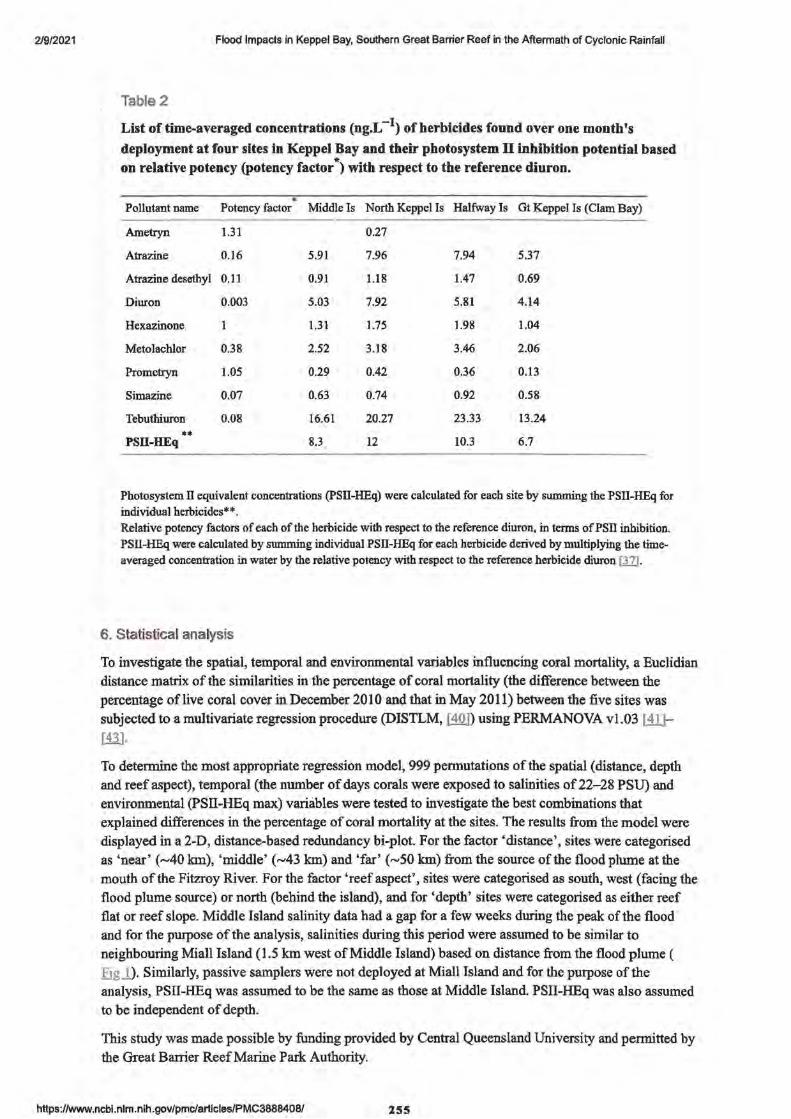
2/9/2021 Flood Impacts in Keppel Bay, Southern Great Barrier Reef in the Aftermath of Cyclonic Rainfall
Table2
List of time-averaged concentrations (ng.L-1) of herbicides found over one month's
deployment at four sites in Keppel Bay and their photosystem II inhibition potential based on relative potency (potency factor*> with respect to the reference diuron.
Pollutant name Potency factor Middle Is North Keppel Is Halfway ls Gt Keppel Is (Clam Bay)
Ametryn 1.31 0.27
Atrazine 0.16 5.91 7.96 7.94 5.37
Atrazine desethyl 0.11 0.91 1.18 1.47 0.69
Diuron 0.003 5.03 7.92 5.81 4.14
Hexazinone 1.31 1.75 1.98 1.04
Metolachlor 0.38 2.52 3.18 3.46 2.06
Prometryn 1.05 0.29 0.42 0.36 0.13
Simazine 0.07 0.63 0.74 0.92 0.58
Tebuthiuron 0.08 16.61 20.27 23.33 13.24
"'"' PSII-HEq 8.3 12 10.3 6.7
Photosystem II equivalent concentrations (PSII-HEq) were calculated for each site by summing the PSII-HEq for individual herbicides*"'. Relative potency factors of each of the herbicide with respect to the reference diuron, in terms of PSil inhibition. PSII-HEq were calculated by summing individual PSII-HEq for each herbicide derived by multiplying the timeaveraged concentration in water by the relative potency with respect to the reference herbicide diuron [lZ].
6. Statistical analysis
To investigate the spatial, temporal and environmental variables influencing coral mortality, a Euclidian distance matrix of the similarities in the percentage of coral mortality (the difference between the
percentage of live coral cover in December 2010 and that in May 2011) between the five sites was subjected to a multivariate regression procedure (DISTLM, [40]) using PERMANOVA vl.03 [il]-[m.
To determine the most appropriate regression model, 999 permutations of the spatial ( distance, depth
and reef aspect), temporal (the number of days corals were exposed to salinities of 22-28 PSU) and
environmental (PSII-HEq max) variables were tested to investigate the best combinations that explained differences in the percentage of coral mortality at the sites. The results from the model were
displayed in a 2-D, distance-based redundancy bi-plot. For the factor 'distance', sites were categorised
as 'near' (~40 km), 'middle' (~43 km) and 'far' (~SO km) from the source of the flood plwne at the
mouth of the Fitzroy River. For the factor 'reef aspect', sites were categorised as south, west ( facing the
flood plume source) or north (behind the island), and for 'depth' sites were categorised as either reef
flat or reef slope. Middle Island salinity data had a gap for a few weeks during the peak of the flood and for the purpose of the analysis, salinities during this period were assumed to be similar to
neighbouring Miall Island (1.5 km west of Middle Island) based on distance from the flood plume ( Fig_l). Similarly, passive samplers were not deployed at Miall Island and for the purpose of the
analysis, PSII-HEq was assumed to be the same as those at Middle Island. PSII-HEq was also assumed
to be independent of depth.
This study was made possible by funding provided by Central Queensland University and permitted by
the Great Barrier Reef Marine Park Authority.
https://www.ncbl.nlm.nih.gov/pmc/articles/PMC3888408/ 255
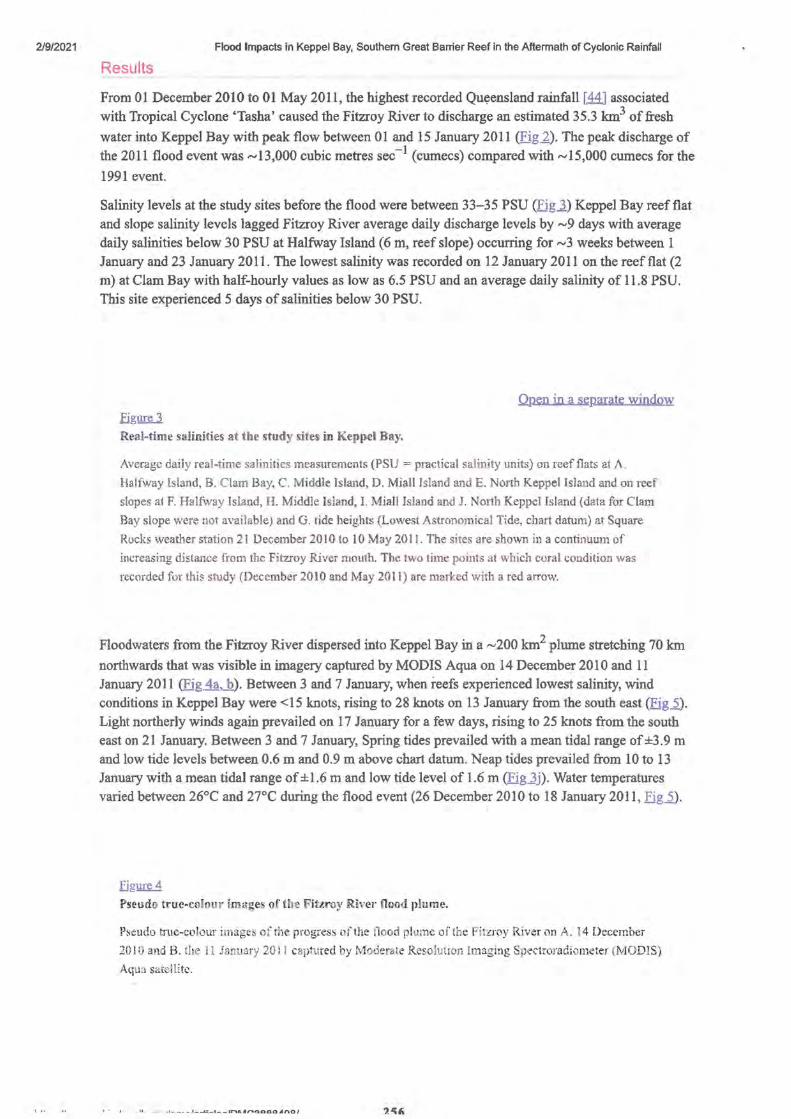
2/9/2021 Flood Impacts in Keppel Bay, Southern Great Barrier Reef in the Aftermath of Cyclonic Rainfall
Results
From O I December 2010 to O I May 2011 , the highest recorded Qu~ensland rainfall [ 44] associated with Tropical Cyclone 'Tasha' caused the Fitzroy River to discharge an estimated 35.3 km3 of fresh
water into Keppel Bay with peak flow between 01 and 15 January 2011 (Fig.2). The peak discharge of the 2011 flood event was~ 13,000 cubic metres sec-1 (cumecs) compared with~ 15,000 cumecs for the
1991 event.
Salinity levels at the study sites before the flood were between 33-35 PSU (Eig].) Keppel Bay reef flat and slope salinity levels lagged Fitzroy River average daily discharge levels by ~9 days with average daily salinities below 30 PSU at Halfway Island (6 m, reef slope) occurring for ~3 weeks between I January and 23 January 2011 . The lowest salinity was recorded on 12 January 2011 on the reef flat (2 m) at Clam Bay with half-hourly values as low as 6.5 PSU and an average daily salinity of 11.8 PSU. This site experienced 5 days of salinities below 30 PSU.
Open in a separate window
Eifil!I!Ll Real-time salinities at the study sites in Keppel Bay.
Average daily real-time salinities measurements (PSU = practical salinity units) on reef flats at A.
Halfway Island, B. Clam Bay, C. Middle Island, D. Miall Island and E. North Keppel Island and on reef
slopes at F. Halfway Island, H. Middle Island, I. Miall Island and J. North Keppel Island (data for Clam
Bay slope were not available} and G. tide heights (Lowest Astronomical Tide, chart datum) at Square
Rocks weather station 21 December 20 IO to IO May 201 1. The sites are shown in a continuum of
increasing distance from the Fitzroy River mouth. The two time points at which coral condition was
recorded for this study (December 2010 and May 2011) are marked with a red arrow.
Floodwaters from the Fitzroy River dispersed into Keppel Bay in a ~200 km2 plume stretching 70 km northwards that was visible in imagery captured by MODIS Aqua on 14 December 2010 and 11 January 2011 (fig 4a,..h). Between 3 and 7 January, when reefs experienced lowest salinity, wind conditions in Keppel Bay were <15 knots, rising to 28 knots on 13 January from the south east (Fig2). Light northerly winds again prevailed on 1 7 January for a few days, rising to 25 knots from the south east on 21 January. Between 3 and 7 January, Spring tides prevailed with a mean tidal range of ±3.9 m and low tide levels between 0.6 m and 0.9 m above chart datum. Neap tides prevailed from 10 to 13 January with a mean tidal range of ±1.6 m and low tide level of 1.6 m (Fig]j). Water temperatures varied between 26°C and 27°C during the flood event (26 December 2010 to 18 January 2011, Fig2).
figumA Pseudo true-colour images of the Fitzroy River flood plume.
Pseudo true-colour images of the progress of the llood plume of the Fitzroy River on A. 14 December
20 IO and B. the 11 January 20 l l captured by Moderate Resolution Imaging Spectroradiometer (MO DIS)
Aqu:i satelli te.
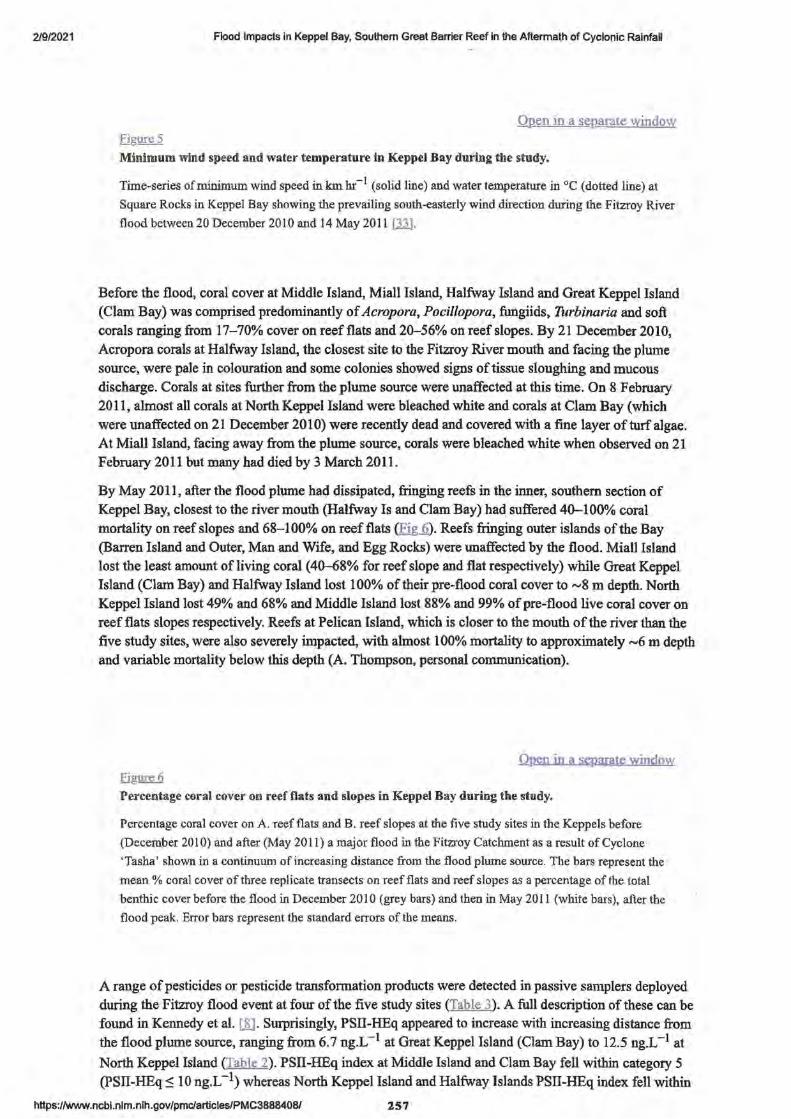
2/9/2021 Flood Impacts in Keppel Bay, Southern Great Barrier Reef in the Aftermath of Cyclonic Rainfal
OP-en in a sq~arate window Eiwe 5 Minimum wi.nd speed! and water temperature in Keppel Bay during the study.
Time-series of minimum wind speed in km hr - I (solid line) and water temperature in °C ( dotted line) at
Square Rocks in Keppel Bay showing the prevailing south-easterly wind direction during the Fitzroy River
flood between20 December 2010 and 14 May 2011 Ill] .
Before the flood, coral cover at Middle Island, Miall Island, Halfway Island and Great Keppel Island
(Clam Bay) was comprised predominantly of Acropora, Pocillopora, fungiids, Turbinaria and soft
corals ranging from 17-70% cover on reef flats and 20-56% on reef slopes. By 21 December 2010,
Acropora corals at Halfway Island, the closest site to the Fitzroy River mouth and facing the plume
source, were pale in colouration and some colonies showed signs of tissue sloughing and mucous
discharge. Corals at sites further from the plume source were unaffected at this time. On 8 February
2011, almost all corals at North Keppel Island were bleached white and corals at Clam Bay (which
were unaffected on 21 December 2010) were recently dead and covered with a fine layer of turf algae. At Miall Island, facing away from the plume source, corals were bleached white when observed on 21
February 2011 but many had died by 3 March 2011.
By May 2011, after the flood plume had dissipated, fringing reefs in the inner, southern section of
Keppel Bay, closest to the river mouth (Halfway Is and Clam Bay) had suffered 40-100% coral
mortality on reef slopes and 68-100% on reef flats (Eg..6). Reefs fringing outer islands of the Bay
(Barren Island and Outer, Man and Wife, and Egg Rocks) were unaffected by the flood. Miall Island lost the least amount of living coral (40-68% for reef slope and flat respectively) while Great Keppel
Island (Clam Bay) and Halfway Island lost 100% of their pre-flood coral cover to ~8 m depth. North
Keppel Island lost 49% and 68% and Middle Island lost 88% and 99% of pre-flood live coral cover on
reef flats slopes respectively. Reefs at Pelican Island, which is closer to the mouth of the river than the
five study sites, were also severely impacted, with almost 100% mortality to approximately ~6 m depth and variable mortality below this depth (A. Thompson, personal communication).
Open in a separate window Fiwe6 Percentage coral cover on reef flats and slopes in Keppel Bay during the study.
Percentage coral cover on A. reef flats and B. reef slopes at the five study sites in the Keppels before
(December 20 l 0) and after (May 2011) a major flood in the Fitzroy Catchment as a result of Cyclone
'Tasha' shown in a continuum of increasing distance from the flood plume source. The bars represent the
mean % coral cover of three replicate transects on reef flats and reef slopes as a percentage of the total
benthic cover before the flood in December 2010 (grey bars) and then in May 2011 (white bars), after the
flood peak. Error bars represent the standard errors of the means.
A range of pesticides or pesticide transformation products were detected in passive samplers deployed
during the Fitzroy flood event at four of the five study sites (Table 3). A full description of these can be found in Kennedy et al. I]] . Surprisingly, PSII-HEq appeared to increase with increasing distance from the flood plume source, ranging from 6.7 ng.L-1 at Great Keppel Island (Clam Bay) to 12.5 ng.L-1 at
North Keppel Island (Table 2). PSII-HEq index at Middle Island and Clam Bay fell within category 5 (PSII-HEq::; 10 ng.L-1) whereas North Keppel Island and Halfway Islands PSII-HEq index fell within
https://www.ncbi.nlm.nih.gov/pmcJarticles/PMC3888408/ 257
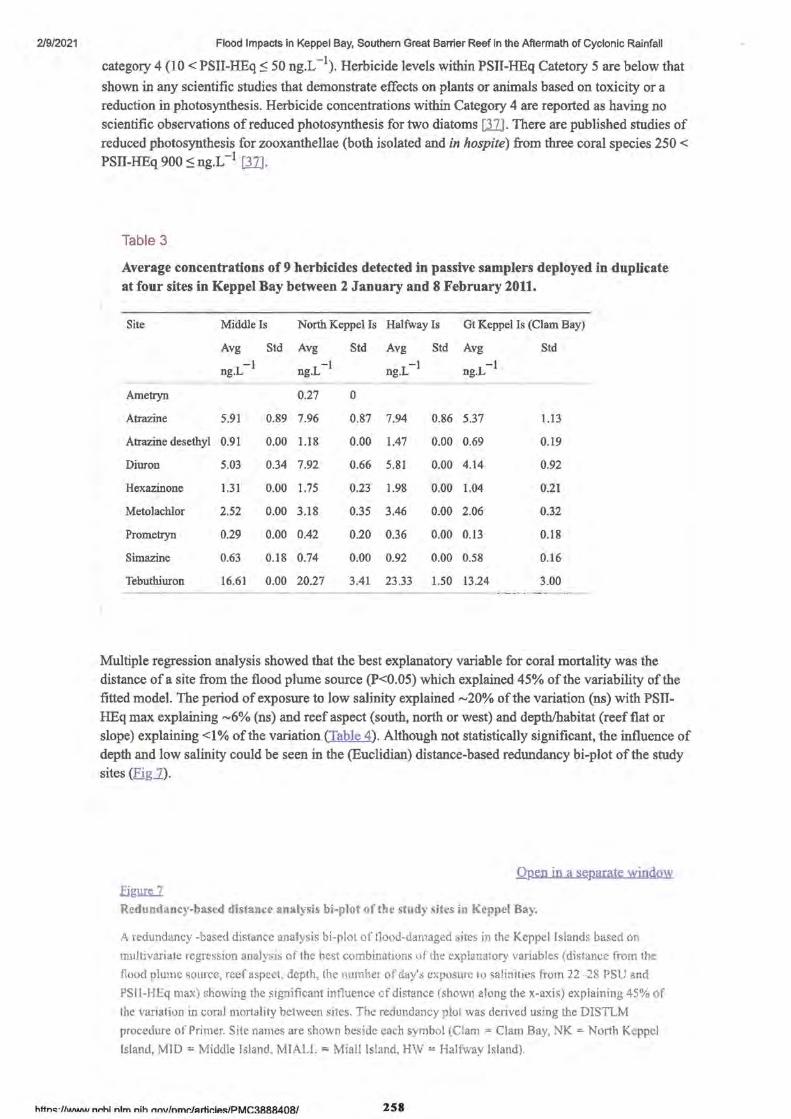
2/9/2021 Flood Impacts in Keppel Bay, Southern Great Barrier Reef in the Aftermath of Cyclonic Rainfall
category 4 (10 < PSII-HEq ~ 50 ng.L -l). Herbicide levels within PSII-HEq Catetory 5 are below that
shown in any scientific studies that demonstrate effects on plants or animals based on toxicity or a reduction in photosynthesis. Herbicide concentrations within Category 4 are reported as having no scientific observations of reduced photosynthesis for two diatoms Q1] . There are published studies of reduced photosynthesis for zooxanthellae (both isolated and in hospite) from three coral species 250 < PSII-HEq 900 ~ ng.L-l Q.1] .
Table 3
Average concentrations of 9 herbicides detected in passive samplers deployed in duplicate at four sites in Keppel Bay between 2 January and 8 February 2011.
Site Middle Is North Keppel Is Halfway Is Gt Keppel Is (Clam Bay)
Avg Std Avg Std Avg Std Avg Std
ng.L -1
ng.L -1
ng.L -1 -1
ng.L
Ametryn 0.27 0
Atrazine 5.91 0.89 7.96 0.87 7.94 0.86 5.37 l.13
Atrazine desethyl 0.91 0.00 1.18 0.00 1.47 0.00 0.69 0.19
Diuron 5.03 0.34 7.92 0.66 5.81 0.00 4.14 0.92
Hexazinone 1.31 0.00 1.75 0.23 1.98 0.00 1.04 0.21
Metolachlor 2.52 0.00 3.18 0.35 3.46 0.00 2.06 0.32
Prometryn 0.29 0.00 0.42 0.20 0.36 0.00 0.13 0.18
Simazine 0.63 0.18 0.74 0.00 0.92 0.00 0.58 0.16
Tebuthiuron 16.61 0.00 20.27 3.41 23.33 1.50 13.24 3.00
Multiple regression analysis showed that the best explanatory variable for coral mortality was the distance of a site from the flood plume source (P<0.05) which explained 45% of the variability of the fitted model. The period of exposure to low salinity explained ~20% of the variation (ns) with PSIIHEq max explaining ~6% (ns) and reef aspect (south, north or west) and depth/habitat (reef flat or slope) explaining <l % of the variation (Table 4). Although not statistically significant, the influence of depth and low salinity could be seen in the (Euclidian) distance-based redundancy bi-plot of the study sites (Fig.1).
Open in a separate window figure 7
Redundancy-based distanct> analysis bi-plot of the study sites in Keppel Bay.
A redundancy -based distance analysis bi-plot of flood-damaged sites in the Keppel Islands based on
multivariate regression analysis of the best combinations of the explanatory variables ( distance from the
flood plume source, reef aspect, depth, the number of day's exposure to salinities from 22 --28 PSU and
PSJI-HEq max) showing the significant influence of distance (shown along the x-axis) explaining 45% of
the variation in coral mortality between sites. The redundancy plot was derived using the DISTLM
procedure of Primer. Site names are shown beside each symbol (Clam = Clam Bay, NK =- North Keppel
Island, MID = Middle Island, MIALL = Miall lsland, HW z= Halfway Island).
hltnc,-//www nr,hi nlm nih nnv/nmr-hlrtir.ift!':/PMC3888408/ 258
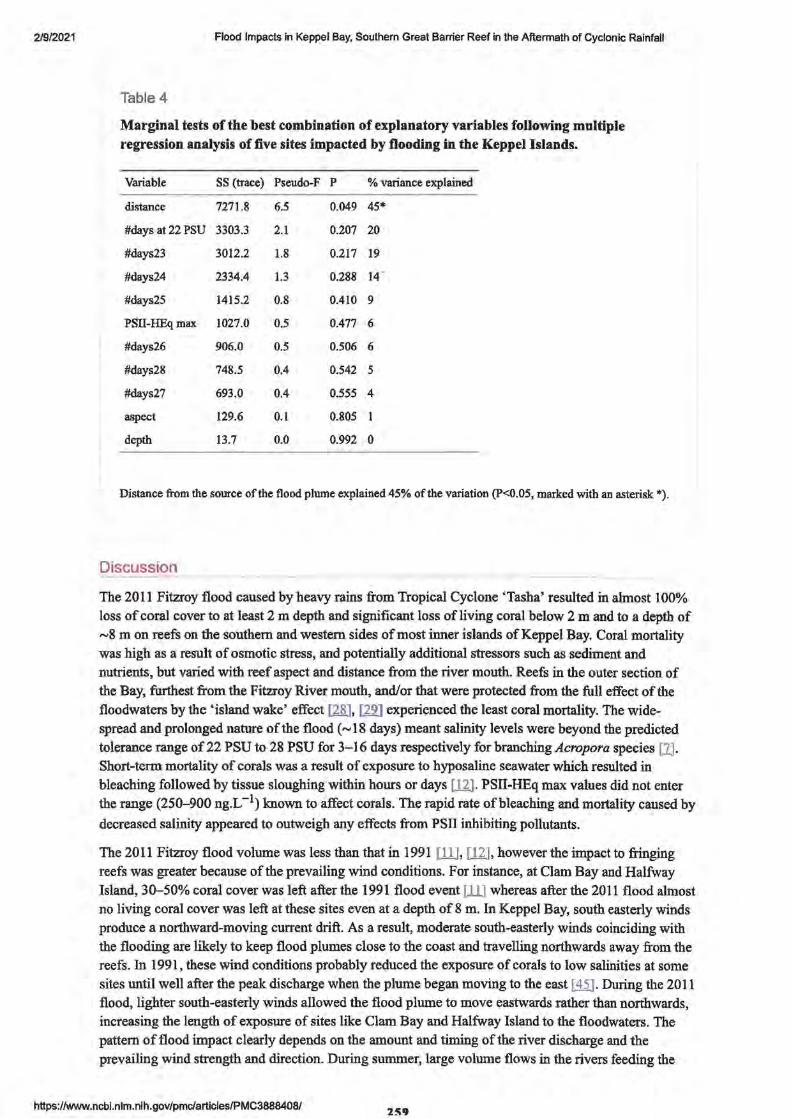
2/9/2021 Flood Impacts in Keppel Bay, Southern Great Barrier Reef in the Aftermath of Cyclonic Rainfall
Table 4
Marginal tests of the best combination of explanatory variables following multiple regression analysis of five sites impacted by flooding in the Keppel Islands.
Variable SS (trace) Pseudo-F p % variance explained
distance 7271.8 6.5 0.049 45*
#days at 22 PSU 3303.3 2.1 0.207 20
#days23 3012.2 1.8 0.217 19
#days24 2334.4 1.3 0.288 14·
#days25 1415.2 0.8 0.410 9
PSII-HEq max 1027.0 0.5 0.477 6
#days26 906.0 0.5 0.506 6
#days28 748.5 0.4 0.542 5
#days27 693.0 0.4 0.555 4
aspect 129.6 0.1 0.805
depth 13.7 0.0 0.992 0
Distance from the source of the flood plume explained 45% of the variation (P<0.05, marked with an asterisk*).
Discussion
The 2011 Fitzroy flood caused by heavy rains from Tropical Cyclone 'Tasha' resulted in almost 100% loss of coral cover to at least 2 m depth and significant loss of living coral below 2 m and to a depth of
~8 m on reefs on the southern and western sides of most inner islands of Keppel Bay. Coral mortality was high as a result of osmotic stress, and potentially additional stressors such as sediment and
nutrients, but varied with reef aspect and distance from the river mouth. Reefs in the outer section of the Bay, furthest from the Fitzroy River mouth, and/or that were protected from the full effect of the
floodwaters by the 'island wake' effect 118], [29] experienced the least coral mortality. The wide
spread and prolonged nature of the flood ( ~ 18 days) meant salinity levels were beyond the predicted tolerance range of 22 PSU to 28 PSU for 3-16 days respectively for branching Acropora species [1].
Short-term mortality of corals was a result of exposure to hyposaline seawater which resulted in
bleaching followed by tissue sloughing within hours or days [.U]. PSII-HEq max values did not enter the range (250-900 ng.L-1) known to affect corals. The rapid rate of bleaching and mortality caused by
decreased salinity appeared to outweigh any effects from PSII inhibiting pollutants.
The 2011 Fitzroy flood volume was less than that in 1991 [ll], [12] , however the impact to fringing
reefs was greater because of the prevailing wind conditions. For instance, at Clam Bay and Halfway
Island, 30-50% coral cover was left after the 1991 flood event [ill whereas after the 2011 flood almost no living coral cover was left at these sites even at a depth of 8 m. In Keppel Bay, south easterly winds
produce a northward-moving current drift. As a result, moderate south-easterly winds coinciding with
the flooding are likely to keep flood plumes close to the coast and travelling northwards away from the reefs. In 1991, these wind conditions probably reduced the exposure of corals to low salinities at some
sites until well after the peak discharge when the plume began moving to the east [45] . During the 2011 flood, lighter south-easterly winds allowed the flood plume to move eastwards rather than northwards, increasing the length of exposure of sites like Clam Bay and Halfway Island to the floodwaters. The
pattern of flood impact clearly depends on the amount and timing of the river discharge and the
prevailing wind strength and direction. During summer, large volume flows in the rivers feeding the
https://www.ncbi.nlm.nih.gov/pmc/articles/PMC3888408/ 259
2/9/2021 Flood Impacts in Keppel Bay, Southern Great Barrier Reef in the Aftermath of Cyclonic Rainfall
Fitzroy River caused by monsoonal low pressure systems or cyclones typically bring with them high
winds from the south east and heavy seas which, if they coincide with the peak discharge, will naturally
limit the amount of impact to the reefs by pushing the plume northwards along the coast.
In the Keppels, the pattern of flood impact appears to explain the geomorphology of the reefs. The
buoyant nature of plumes limits the amount of damage to deeper coral communities at sites towards the
edge of the plume but severely impacts the expansive shallow reef platforms on southern and western
shores of many of the islands. Following flooding, deep reefs that survive the flood event would act as
reservoirs of coral larvae that would re-populate denuded reefs during subsequent spawning events. As
suggested by Brown et al. [ 46], shallow platform reefs may be continually in early successional stages
with low species diversity but possibly high genetic heterogeneity because they are composed of
relatively young populations of principally broadcast spawning corals recruited from multiple adjacent
populations. Over time, the mortality caused by the episodic flooding leaves an accumulation of coral
rubble on the shores facing the source of the flood plume, forming an ideal substrate for recruitment.
After floods these shallow platforms of coral rubble are quickly re-populated by the fast-growing and
highly abundant Acropora and Pocillopora species. Mass mortality from episodic flooding may thus
represent a raison d' etre for the wide, shallow platform reef flats that are typical of the Keppel Bay
Islands and that would otherwise be limited by sea level.
The time-frame for recovery of Keppel reefs from the 2011 flood is expected to take ~ 10-15 years
based on that of the recovery from the 1991 floods. This timeframe is similar to the recovery ofmid
shelf GBR reefs from extensive cyclone damage [fl] whereas regeneration of coral cover from
bleaching in the Keppels in 2006 was ~ 1 year ( 48]. Such dramatic differences in recovery times are
influenced by the level of damage to the reef structure, the persistence of coral tissue that survived the
disturbance and to the connectivity of impacted reefs to healthy nearby, or deeper, reefs. For instance,
another flood or bleaching event in quick succession could delay recovery, allowing macro-algal
species to take hold and potentially tipping the balance towards permanent phase shifts [ 49]. Critically,
unlike regeneration after bleaching, when recovery was predominantly from the remaining living coral
tissue in a landscape of patchy mortality [A.8] , regeneration from floods relies much more on
recruitment when mortality is near total. Until the flood plume dissipates and water quality returns to
normal, subsequent spawning events may be affected by poor water quality [.iQI- ~ . some aspects of
which can reduce fertilisation [24], [53] and effect recruitment success ljfl-[56]. As has occurred in
the past, successful and timely regeneration of the Keppel Bay Islands reefs will be dependent on a
period of low disturbance, regrowth of coral colonies from surviving tissue and recruitment from
adjoining coral communities, particularly those located at connected sites in waters deeper than ~6 m;
suggesting that conservation efforts should be focused on protecting these areas and on improving
water quality.
The influence of changing climate patterns on the frequency and size of major floods in the Fitzroy
catchment and others like it has implications for the resilience of inshore reefs in the southern GBR.
Shallow platform reefs that are typical of the southern and western shores of islands in the Keppels
may play an important role in supporting wider resilience because the high light levels common on
these reefs supports rapid coral growth and promotes high fecundity, providing an abundant source of
new coral recruits once the colonies reach reproductive maturity. In addition, a variety of marine
organisms depend on their dense communities of fast-growing and structurally complex acroporid
corals for habitat and food [21). Even the temporary loss of these coral communities would
significantly reduce coral recruitment in the years after a flood however there are also likely to be
impacts on the fecundity and competitive capacity of surviving coral communities from lingering post
flood hyposaline seawater [2.[] , sediment and nutrients [fil . Fine sediments and nutrients can be easily
re-suspended by strong winds and big tides for some time after a major flood until subsequent
exchanges with offshore water masses eventually renew the water in the system. It is therefore likely
that regeneration will only occur some years after a flood, affecting the resilience of the entire region
during that time. A warming climate could mean an increase in the intensity of monsoonal lows [59],
decreased annual rainfall and increased summer rainfall intensities [60]. Higher summer rainfall
anomalies (So+ mm) are already evident for Australia over the last 100 years [44] . Lower overall
annual rainfall followed by intense rain events during summer in GBR catchments such as the Fitzroy
httno:•//www nr.hi nlm nih nnv/nmc-J::utir.le!:/PMC3888408/
2/9/2021 Flood Impacts in Keppel Bay, Southern Great Barrier Reef in the Aftermath of Cyclonic Rainfall
may lead to increased sediment runoff due to overall reduced vegetation, potentially increasing the sediment threat to reefs [[), [2] . Imposed over the episodic impacts of flooding is the threat of summer bleaching events [22]. If climate predictions are realised there are likely to be negative consequences on inter-disturbance regeneration of some reefs over time, weakening reef resilience as a whole.
Conclusions
In Keppel Bay, in the southern GBR, expansive shallow reefs on the leeward sides of the islands are of great importance to tourism because they typically provide easy access for reef-based activities. Because of the episodic nature of cyclonic rain events in the region, the business success of tourism
infrastructure established in between flood events can be heavily impacted by the temporary loss of corals after flooding. Meanwhile, the surviving incipient fringing reefs comprised mainly of much slower growing but sediment- and salinity-tolerant non-acroporids become the focus of tourism activities until the platform reefs recover. In order to support tourism in reef regions such as the Keppel Islands it may be necessary to consider human intervention to support the regeneration of the coral cover on high value reefs after major floods. Methods such as ex-situ coral culture and transplantation
and assisted recruitment [fil] could prove critical in the recovery of some reef areas and could support tourism in the short term. However, it must be accepted that such attempts can only be temporary until the next majo_r disturbance. In the long term, it is clear from this study that to support reef resilience, management and conservation efforts should be focused on areas of reef that can survive intermittent natural disturbances rather than only on those that are under pressure from anthropogenic impacts.
Acknowledgments
We acknowledge the use of data products or imagery from the Land Atmosphere Near-real time Capability for EOS (LANCE) system operated by the NASA/GSFC Earth Science Data and
Information System (ESDIS).
Fundin_g Statement
This study was made possible by funding provided by the Centre for Environmental Management at Central Queensland University and permitted by the Great Barrier Reef Marine Park Authority. The funders had no role in study design, data collection and analysis, decision to publish, or preparation of the manuscript.
References
1. Bostock H, Ryan D, Brooke B, Skene D, Hancock G, et al .. (2006) Holocene evolution and modem sediment accumulation on a tropical macro-tidal coast: Keppel Bay, central Queensland, Australia. Technical Report 50. Indooroopilly, Australia: Cooperative Research Centre for Coastal Zone, Estuary and Waterway Management (Coastal CRC). Available:
h!tp://www.ozcoasts.org.au/P.df/CRC/50 Holocene=accumulation macrotidal.ndf. Accessed 2013 Feb 15.
2. Devlin MJ, McKinna LW, Alvarez-Romero JG, Petus C, Abott B, et al. (2012) Mapping the pollutants in surface riverine flood plume waters in the Great Barrier Reef, Australia. Mar Pollut Bull
65: 224-235. [PubMed] [Google Scholar]
3. Brodie JE, Schroeder T, Rohde K, Faithful JW, Masters B, et al. (2010) Dispersal of suspended sediments and nutrients in the Great Barrier Reeflagoon during river discharge events: conclusions from satellite remote sensing and concurrent flood plume sampling. Marine and Freshwater Research 61: 651-664. [Google Scholar]
4. Butler IR, Sommer B, Zann M, Zhao J, Pandolfi JM (2013) The impacts of flooding on the highlatitude, terrigenoclastic influenced coral reefs of Hervey Bay, Queensland, Australia. Coral Reefs 32:
1149-1163. [Google Scholar]
https:/Jwww.ncbi.nlm.nih.gov/pmc/articles/PMC3888408/ 2,1
2/9/2021 Flood Impacts in Keppel Bay, Southern Great Barrier Reef in the Aftermath of Cyclonic Rainfall
5. Anonymous (2011) Extreme weather and the Great Barrier Reef. Townsville, Australia: Great
Barrier Reef Marine Park Authority. Available: http://www.gbrmP-a.gov.au/outlook-for-thereef/extreme-weather/extreme-weather-and-the-great-barrier-reef-reP-ort.
6. Fitroy River discharge data. Available: httP-://watennonitoring.dnrm.qld.gov.au. Accessed: 15
Februaiy 2013. Queensland, Australia: State of Queensland Department of Natural Resources and Mines.
7. Berkelmans R, Jones AM, Schaffelke B (2012) Salinity thresholds of Acropora spp. on the Great
Barrier Reef. Coral Reefs 31: 1103-1110. [Google Scholar]
8. Kennedy K, Devlin M, Bentley C, Lee-Chue K, Paxman C, et al. (2012) The influence of a season of extreme wet weather events on exposure of the World Heritage Area Great Barrier Reef to pesticides.
Mar Pollut Bull 64: 1495-1507. [PubMed] [Google Scholar]
9. Packett B (2007) A mouthful of mud: the fate of contaminants from the Fitzroy River, Queensland,
Australia and implications for reef water policy. In: Wilson AL, Dehaan RL, Watts RJ, Page KJ,
Bowmer KH and Curtis A, editors. Proceedings of the 5th Australian Stream Management Conference.
Australian Rivers: Making a Difference Thurgoona, New South Wales, Australia: Charles Sturt University. pp. 294-299.
10. Packett B, Dougall C, Rohde K, Noble R (2009) Agricultural lands are hotspots for annual runoff
polluting the southern Great Barrier Reeflagoon. Mar Pollut Bull 58: 976-986. [PubMed]
[Google Scholar]
11. Byron GT, O'Neill JP (1992) Flood induced coral mortality on fringing reefs in Keppel Bay.
Workshop on the Impact of Flooding. Townsville, Australia: Great Barrier Reef Marine Park Authority.
12. van Woesik R, DeVantier LM, Glazebrook JS (1995) Effects of Cyclone 'Joy' on nearshore coral
communities of the Great Barrier Reef. Mar Ecol Prog Ser 128: 261-270. [Google Scholar]
13. Jones AM, Berkelmans R, Houston W (2011) Species richness and community structure on a high
latitude reef: Implications for conservation and management. Diversity 3: 329-355. [Google Scholar]
14. IBISWorld (2011) Queensland floods: the economic impact, Special report. Melbourne, Australia:
IBISWorld. Available: www.ibisworld.com.au/ .. ./pdf/QLD%20floods%20special%20report.pdf. Accessed 2013 Feb 15.
15. Harrison HB, Williamson DH, Evans RD, Almany GR, Thorrold SR, et al. (2012) Larval export
from marine reserves and the recruitment benefit for fish and fisheries. Curr Biol 22: 1023-1028.
[PubMe<l] [ Google Scholar]
16. ABS (2006) Australian Bureau of Statistics: Queensland 2006 Census Quickstats. Available:
http://www.censusdata,abs,gov.au/ABSNavigation/prenav/ProductSearch? &areacode=3&P-roduc11Y.P-e=QuickStats&action=401. Accessed 2013 Feb 4.
17. ABS (2011) Australian Bureau of Statistics: Queensland 2011 Census Quickstats. Available:
httP-:/ /www.censusdata.abs.gov.au/census services/getproduct/census/2011 l!J.uickstat/LGA36360?
opendocument&naYP-os=220. Accessed 2013 Feb 4.
18. GBRMPA (2013) Environmental management charge (EMC) data. Townsville, Australia: Great Barrier Reef Marine Park Authority.
19. GBRMPA (2013) Vessel registration levels for Great Barrier Reef Marine Park coastal
communities. Townsville, Australia: Great Barrier Reef Marine Park Authority. Available:
httP-://www.gbrmpa.gov.au/visit-the-reef/visitorcontributions/gbr visitation/vessel-registration-levelsfor-great-barrier-reef-coastalcommunities . Accessed 2013 Feb 15.
20. Saltzer R (2002) Understanding Great Barrier Reef visitors: factors that contribute to visitor satisfaction. CRC Reef Project B211 Understanding tourist use of the Great Barrier Reef World
Heritage Area. Townsville, Australia: School of Business, James Cook University .
... ....__ . ,,, ...... , --L.: -•- _;s.,. --..,J.-..-,..J,.,..+t .... l.ac /D~Ar'2AAAAOAI
2/9/2021 Flood Impacts in Keppel Bay, Southern Great Barrier Reef in the Aftermath of Cyclonic Rainfall
21. Saltzer R (2002) Understanding Great Barrier Reef visitors: preliminary results: data summary
report 1. CRC Reef Project B211 Understanding tourist use of the Great Barrier Reef World Heritage Area. Townsville, Australia: School of Business, James Cook University.
22. Jones AM, Berkelmans R, Mieog JC, van Oppen MJH, Sinclair W (2008) A community change in the symbionts of a scleractinian coral following a natural bleaching event: field evidence of acclimatization. Proc Biol Sci 275: 1359-1365. [PMC free article] [PubMed] [Google Scholar]
23. Jones R (2005) The ecotoxicological effects of Photosystem II herbicides on corals. Mar Pollut Bu/151: 495-506. [PubMed] [QQQgle Scholar]
24. Humphrey C, Weber M, Lott C, Cooper T, Fabricius K (2008) Effects of suspended sediments, dissolved inorganic nutrients and salinity on fertilisation and embryo development in the coral Acropora mi/lepora; (Ehrenberg, 1834). Coral Reefs 27: 837-850. [Google Scholar]
25. Coles SL, Jokiel PL (1978) Synergistic effects of temperature, salinity and light on the hermatypic coral Montipora verrucosa . Mar Biol 49: 187-195. [Google Scholar]
26. Scott A, Harrison PL, Brooks LO (2013) Reduced salinity decreases the fertilization success and larval survival of two scleractinian coral species. Mar Environ Res 92: 10--14. [PubMed] [Google Scholar]
27. Furnas M (2003) Catchment and corals: Terrestrial runoff to the Great Barrier Reef. Townsville: Australian Institute of Marine Science & CRC Reef Research Centre. 334 p. [QQQgle Scholar]
28. Ayling AL, Ayling AM (1998) The effect of the Daintree River flood plume on Snapper Island coral reefs: a report to the Great Barrier Reef Marine Park Authority. Townsville, Australia: Great Barrier Reef Marine Park Authority.
29. Wolanski E, Asaeda T, Tanaka A, Deleersnijder E (1996) Three-dimensional island wakes in the field, laboratory experiments and numerical models. Cont Shelf Res 16: 1437-1452. [QQQgle Scholar]
30. Lewis EL (1980) The practical salinity scale 1978 and its antecedents. IEEE Journal of Oceanic Engineering OE5: 3-8. [QQQgle Scholar]
31. Roelfsema C, Phinn S (20 I 0) Integrating field data with high spatial resolution multispectral satellite imagery for calibration and validation of coral reef benthic community maps. J Appl Remote Sens 4: 28. [Google Scholar]
32. Kohler KE, Gill SM (2006) Coral Point Count with Excel extensions (CPCe): A Visual Basic program for the determination of coral and substrate coverage using random point count methodology. Comput Geosci 32: 1259-1269. [Google Scholar]
33. AIMS (2011) Australian Institute of Marine Science Square Rocks weather station data. Townsville, Australia. Available: h_ttp://data.aims.gov.au/aimsrtds/datatool. Accessed 2013 Feb 15.
34. Tischer W, Strotmann H (1977) Relationship between inhibitor binding by chloroplasts and inhibition of photosynthetic electron transport. Biochim Biophys Acta 460: 113-125. [PubMed] [ Google Scholar]
35. Cantin NE, Negri A, Willis BL (2007) Photoinhibition from chronic herbicide exposures reduce reproductive output of reef-building corals. Mar Ecol Prog Ser 344: 81-93. [Google Scholar]
36. Harrington L, Fabricius K, Eaglesham G, Negri A (2005) Synergistic effects of diuron and sedimentation on photosynthesis and survival of crustose coralline algae. Mar Pollut Bull 51: 415-427. [PubMed] [Google Scholar]
37. Kennedy K, Bentley C, Paxman C, Dunn A, Heffernan A, et al... (2010) Monitoring of organic chemicals in the Great Barrier Reef using time integrated monitoring tools (2009-2010). Reef Rescue Marine Monitoring Program, Project 3.7.8..: Inshore Marine Water Quality Monitoring. National Research for Environmental Toxicity (Entox).
https://www.ncbi.nlm.nih.gov/pmc/articles/PMC3888408/ 263
2/9/2021 Flood Impacts in Keppel Bay, Southern Great Barrier Reef in the Aftermath of Cyclonic Rainfall
38. Kennedy K, Schroeder T, Shaw M, Haynes D, Lewis S, et al. (2012) Long term monitoring of photosystem II herbicides - Correlation with remotely sensed freshwater extent to monitor changes in the quality of water entering the Great Barrier Reef, Australia. Mar Pollut Bull 65: 292-305. [PubMed] [Google Scholar]
39. Magnusson M, Heimann K, Quayle P, Negri AP (2010) Additive toxicity of herbicide mixtures and comparative sensitivity of tropical benthic microalgae. Mar Pollut Bull 60: 1978-1987. [PubMed]
[Google Scholar]
40. Anderson MJ, Gorley RN, Clarke KR (2008) PERMANOVA+ for PRIMER: Guide to software and
statistical methods. Plymouth, UK: PRIMER-E.
41. Clarke K, Warwick R (2001) Change in marine communities: an approach to statistical analysis and interpretation. PRIMER-E. Plymouth.
42. Clarke KR (1993) Non-parametric multivariate analyses of changes in community structure. Aust J
Ecol 18: 117-143. [Google Scholar]
43. Clarke KR, Ainsworth M (1993) A method oflinking multivariate community structure to environmental variables. Mar Ecol Prog Ser 92: 205-219. [QQ.ogle Scholar]
44. Australian Bureau of Meteorology. Available: http://www.bom.gov,au/climate/mwr/ and hJ:tp://www.bom.gov,au/climate/data/. Accessed 2013 Feb 15.
45. O'Neill JP, Byron GT, Wright SC (1992) Some physical characteristics and movement of the 1991 Fitzroy River flood plume. Workshop Series No. 17 on the impacts of flooding. Townsville, Australia: Great Barrier Reef Marine Park Authority. pp. 36-51.
46. Brown BE, Clarke KR, Warwick RM (2002) Serial patterns of biodiversity change in corals across
shallow reef flats in Ko Phuket, Thailand, due to the effects oflocal (sedimentation) and regional (climatic) perturbations. Mar Biol 141: 21-29. [Google Scholar]
47. Halford A, Cheal AJ, Ryan D, McB WD (2004) Resilience to large-scale disturbance in coral and fish assemblages on the Great Barrier Reef. Ecology 85: 1892-1905. [Google Scholar]
48. Diaz-Pulido G, McCook LJ, Dove S, Berkelmans R, RoffG, et al. (2009) Doom and boom on a resilient reef: Climate change, algal overgrowth and coral recovery. PLoS ONE 4: e5239.
[PMC free article] [PubMed] [Google Scholar]
49. Done T (1992) Phase shifts in coral reef communities and their ecological significance.
Hydrobiologia 247: 121-132. [Google Scholar]
50. Wooldridge S, Brodie J, Furnas M (2006) Exposure of inner-shelf reefs to nutrient enriched runoff entering the Great Barrier Reef Lagoon: post European changes and the design of water quality targets.
Mar Pollut Bull 52: 1467-1479. [PubMed] fGoogle Scholar]
51. Schaffelke B, Carleton J, Skuza M, Zagorskis I, Furnas MJ (2012) Water quality in the inshore Great Barrier Reef lagoon: Implications for long-term monitoring and management. Mar Pollut Bull
65: 249-260. [PuhMedl [Google Scholar]
52. Thompson A, Costello P, Davidson J, ML, Schaffelke B, et al... (2011) Reef Rescue Marine Monitoring Program. Report of AIMS Activities - Inshore coral reef monitoring 2011: Report for the Great Barrier Reef Marine Park Authority. Townsville, Queensland, Australia: Australian Institute of Marine Science. pp. 127.
53. Koop K, Booth D, Broadbent A, Brodie J, Bucher D, et al. (2001) ENCORE: The effect of nutrient enrichment on coral reefs. synthesis ofresults and conclusions. Mar Pollut Bull 42: 91-120. [PubMed]
[Google Scholar]
54. Tamelander J (2002) Coral recruitment following a mass mortality event. Ambio 31: 551-557.
[PubMed] [Google Scholar]
~H ... ll'•lh1111 .. ,1a, n,-hi '"''""' nih 1"11'\\l/nmr/~rtirlAc/Drt.Ar.~RRR.d.nA/ 264
2/9/2021 Flood Impacts in Keppel Bay, Southern Great Barrier Reef in the Aftermath of Cyclonic Rainfall
55. Erftemeijer PLA, Riegl B, Hoeksema BW, Todd PA (2012) Environmental impacts of dredging and other sediment disturbances on corals: A review. Mar Pollut Bull. (PubMedJ
56. Birrell CL, McCook LJ, Willis BL (2005) Effects of algal turfs and sediment on coral settlement. Mar Pollut Bull 51: 408-414. (PubMed] [Google Scholar]
57. Pratchett MS, Hoey AS, Wilson SK, Messmer V, Graham NAJ {2011) Changes in biodiversity and functioning ofreeffish assemblages following coral bleaching and coral loss. Diversity 3: 424-452.
[Google Scholar]
58. Herzfeld M, Andrewartha JR, Sakov P, Webster I (2006) Numerical hydrodynamic modelling of the Fitzroy Estuary. Technical Report 38. Queensland, Australia: CRC for Coastal Zone, Estuary & Waterway Management. Available: www.ozcoasts.org.au/search data/ere ~j~~- Accessed 2013 Feb 5.
59. Walsh KJE, Nguyen KC, McGregor JL (2004) Finer-resolution regional climate model simulations of the impact of climate change on tropical cyclones near Australia. Climate Dynamics 22: 4 7-56. [Google Scholar]
60. Gallant A, Hennessy K, Risbey J (2007) Trends in rainfall indices for six Australian regions: 1910-2005. Australian Meteorological Magazine 56: 223-239. (Google Scholar]
61. Heyward AJ, Smith LD, Rees M, Field SN (2002) Enhancement of coral recruitment by in situ mass culture of coral larvae. Mar Ecol Prog Ser 230: 113-118. (Google Scholar]
Articles from PloS ONE are provided here courtesy of Public Library of Science
https:/twww.ncbi.nlm.nih.gov/pmc/articles/PMC38B8408/ 265

,,i
Section G:
AIMS coral reports Showing good growth in Southern GBR
267

'tl!t
2/9/2021 Cyclone Hamish reef damage 'worst in 30 years' - ABC News
DNEWS
Cyclone Hamish reef damage 'worst in 30 years'
Sarah West
Posted Wed 25 Mar 2009 at 9:34am, updated Wed 25 Mar 2009 at 9:35am
The Great Barrier Reef Marine Park Authority (GBRMPA) says it still does not know exactly how much
damage Cyclone Hamish did to southern parts of the reef, but it is the worst cyclone damage in more
than 30 years.
The Queensland Seafood Industry Association has asked the Queensland Government to declare the
reef between Bowen and Wide Bay a disaster zone, saying fish stocks have disappeared since the
cyclone.
The Government has not made a decision on the matter.
The GBRMPA's chairman Russel Reicheldt says it will be weeks before the full extent of the damage is
known.
He says it is likely the fish fled to deeper water and it could be a while before they return.
"I would expect the fish populations to settle within - this is imprecise science I'm talking here, but in
general terms - a matter of months up to perhaps a year," Mr Reicheldt said.
He says Hamish did more damage to the reef than any other natural disaster in recent history.
"ln my 30 or 40 years of working on the reef there's been half a dozen major cyclones," Mr Reicheldt
said.
"Hamish was very big and it tracked along the reef, [while] Larry tracked quite quickly across the reef.
"[Hamish] is certainly the most extreme cyclonic event in terms of impact on the reef in my
experience."
https://www.abc.net.au/news/2009-03-25/cyclone-hamish-reef-damage-wo26·9-30-years/1629978

278
2/9/2021 2 October 2012 - The Great Barrier Reef has lost half of its coral in the last 27 years I AIMS
W.
What are you looking for?
Hl)me (/}
About (/docs/about/about.html)
Research (/docs/research/resEa1·(h.html)
D:1ta (/docs/data/data.html)
Publications (/publications.h'~ml)
Media (/docs/media/media.html).
Latest releases Udocs/media/latest-releases).
Latest news Udocs/media/latest-news)
Featured Content Udocs/medja/featured-content.htmll.
Marine Science Factsheets l/factsheets)
~point Newsletter {/waY.P-Oint-subscrjption.html),
Release Archives Udocs/media/medja-archives.htmll
2 October 2012 - The Great Barrier Reef has lost half of its coral in the last 27 years 2 October 2012
Embargo: 5 am, tuesday 2 October 2012
https://www.alms.gov.au/docs/medla/latest-releases/-/asset_publisher/8Kf'27 1ntent/2-october-2012-th91;1reat-barrier-reef-has-lost-half-of-its-coral ..
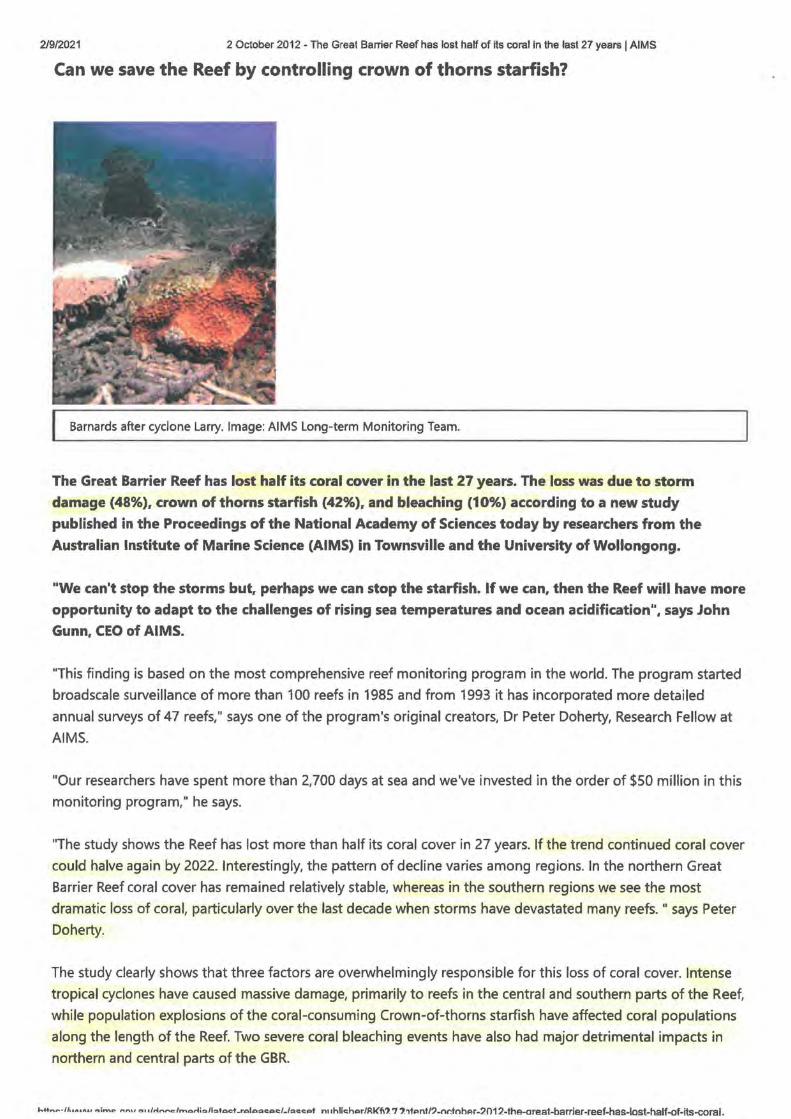
2/9/2021 2 October 2012 - The Great Barrier Reef has lost half of its coral in the last 27 years I AIMS
Can we save the Reef by controlling crown of thorns starfish?
Barnards after cyclone Larry. Image: AIMS Long-term Monitoring Team.
The Great Barrier Reef has lost half its coral cover in the last 27 years. The loss was due to storm
damage (48%), crown of thorns starfish (42%), and bleaching (10%) according to a new study
published in the Proceedings of the National Academy of Sciences today by researchers from the
Australian Institute of Marine Science (AIMS) in Townsville and the University of Wollongong.
"We can't stop the storms but, perhaps we can stop the starfish. If we can, then the Reef will have more
opportunity to adapt to the challenges of rising sea temperatures and ocean acidification", says John
Gunn, CEO of AIMS.
"This finding is based on the most comprehensive reef monitoring program in the world. The program started
broadscale surveillance of more than 100 reefs in 1985 and from 1993 it has incorporated more detailed
annual surveys of 47 reefs," says one of the program's original creators, Dr Peter Doherty, Research Fellow at
AIMS.
"Our researchers have spent more than 2,700 days at sea and we've invested in the order of $50 million in this
monitoring program," he says.
"The study shows the Reef has lost more than half its coral cover in 27 years. If the trend continued coral cover
could halve again by 2022. Interestingly, the pattern of decline varies among regions. In the northern Great
Barrier Reef coral cover has remained relatively stable, whereas in the southern regions we see the most
dramatic loss of coral, particularly over the last decade when storms have devastated many reefs. " says Peter
Doherty.
The study clearly shows that three factors are overwhelmingly responsible for this loss of coral cover. Intense
tropical cyclones have caused massive damage, primarily to reefs in the central and southern parts of the Reef,
while population explosions of the coral-consuming Crown-of-thorns starfish have affected coral populations
along the length of the Reef. Two severe coral bleaching events have also had major detrimental impacts in
northern and central parts of the GBR.
'-"-~.,, ....... ~;m~ n~" "'' ,un-ln-.o..l;,,.11,,.toct., ....... ., .. .,,., .. .,.,.,t n, 1hlic,h,.r/Rl<f\'>. 7 '>.~hant/?.ndnhiu-2012-the-oreat-barrier-reef-has-lost-half-of-its-coral.
2/~/2021 2 October 2012 - The Great Barrier Reef has lost half of its coral in the last 27 years I AIMS
"Our data show that the reefs can regain their coral cover after such disturbances, but recovery takes 10-20
years. At present, the intervals between the disturbances are generally too short for full recovery and that's
causing the long-term losses," says Dr Hugh Sweatman, one of the study's authors.
"We can't stop the storms, and ocean warming (the_ primary cause of coral bleaching) is one of the critical
impacts of the global climate change," says AIMS CEO, John Gunn. "However, we can act to reduce the impact
of crown of thorns," he says. "The study shows that in the absence of crown of thorns, coral cover would
increase at 0.89% per year, so even with losses due to cyclones and bleaching there should be slow recovery.
"We at AIMS will be redoubling our efforts to understand the life cycle of crown of thorns so we can better
predict and reduce the periodic population explosions of crown of thorns. It's already clear that one important
factor is water quality, and we plan to explore options for more direct intervention on this native pest."
The analysis presented in the paper was conducted with partial support from the Australian Government's
National Environmental Research Program.
Media contacts
Steve Clarke, AIMS Communication Manager, 07 4753 4264; 0419 668 497; [email protected]
.(mailto:[email protected]).
Niall Byrne, Science in Public, 0417 131 977, njall@scienceinpub!ic.com.au
.(mailto:niall@scjenceinpub!ic.com.au).
Background information including the paper, fact sheets on the study, the Great Barrier Reef and Crown-of
thorns; photos and video etc available at www.sciencejnpublic.eom.au/ marine
!http://www.sciencejnpublic,com.au/ marine)
Background information
List of materials available:
• The paper
• About the project
• About Crown-of-thorns starfish
• About the Great Barrier Reef
• Photo and video resources.
Abstract
The world's coral reefs are being degraded, and the need to reduce local pressures to offset the effects of
increasing global pressures is now widely recognized. This study investigates the spatial and temporal
dynamics of coral cover, identifies the main drivers of coral mortality, and quantifies the rates of potentia 1
recovery of the Great Barrier Reef. Based on the world's most extensive time series data on reef conditior.
https:l/www.aims.gov.au/docs/media/latest-releases/-/asset_publisher/8Kfv21
73,tenV2-october-2012-the-great-barrier-reef-has-lost-half-of-its-coral ..
2/9/2021 2 October 2012 - The Great Barrier Reef has lost half of its coral in the last 27 years I AIMS
(2,258 surveys of 214 reefs over 1985-2012), we show a major decline in coral cover from 28.0%to 13.8%
(0.53%y-\ a loss of 50.7% of initial coral cover. Tropical cyclones, coral predation by Crown-of-thorns starfish
(COTS), and coral bleaching accounted for 48%, 42%,and 10%of the respective estimated losses, amounting to
3.38% y- 1 mortality rate. Importantly, the relatively pristine northern region showed no overall decline. The
estimated rate of increase in coral cover in the absence of cyclones, COTS, and bleaching was 2.85%y-1,
demonstrating substantial capacity for recovery of reefs. In the absence of COTS, coral cover would increase at
0.89% y-1, despite ongoing losses due to cyclones and bleaching. Thus, reducing COTS populations, by
improving water quality and developing alternative control measures, could prevent further coral decline and
improve the outlook for the Great Barrier Reef. Such strategies can, however, only be successful if climatic
conditions are stabilized, as losses due to bleaching and cyclones will otherwise increase.
Authors and key contacts
Dr Glenn De'ath
Role
Principal Research Scientist at AIMS
Background
Dr De'ath's primary focus is on the statistical analyses of marine biological and environmental data,
development of ecological methods, ecological modeling, deveiopment of software tools and systems for
data analysis and spatial modeling and mapping.
Dr Katharina Fabricius
Role
Principal Research Scientist at AIMS
Background
Dr Fabricius has worked as a coral reef ecologist since 1988, and presently holds the position of Principal
Research Scientist at the Australian Institute of Marine Science. Her main research interests are to better
understand roles and consequences of disturbances {especially ocean acidification, climate change and
terrestrial run-off) on ecological processes in coral reefs. Within this framework, she has worked across a very
broad range of scientific questions and organism groups, including corals, octocorals, crown-of-thorns
starfish, coralline algae, sedimentation, marine snow, organic enrichment, water clarity, storms, bleaching,
zooxanthellae, thermal tolerance, biodiversity, bioindicators, calcification, and the interactive effects of
multiple stressors.
Dr Hugh Sweatman
https://www.aims.gov.au/docs/media/latest-releases/-/asset_publisher/8Ktv2·741tenV2-october-2012-the-great-barrier-reef-has-lost-half-of-its-coral.
2/9/2021
Role
2 October 2012 - The Great Barrier Reef has lost half of its coral in the last 27 years I AIMS
Senior Research Scientist and Leader of AIMS Long-term Monitoring Program for coral reefs of the Great
Barrier Reef
Background
Dr Sweatman trained as a behavioural ecologist working on reef fishes and has worked on the GBR and in the
Caribbean (Panama). His research interests have broadened to processes of disturbance and recovery on reefs,
particularly as applied to the GBR. After graduating, he worked briefly at University of Sydney, then spent
three years as a post-doc at the Smithsonian Tropical Research Institute in Panama. From 1990 he was a post
doc at James Cook University, initially studying fish predators of Acanthaster planci, then the effects of feeding
fishes around tourist pontoons (Reef CRC). In 1995 he came to AIMS to lead the Long-term Monitoring
Program.
Dr Marji Puotinen
Role
Honorary Fellow, University of Wollongong and Ohio State University
Background
Dr. Puotinen is a geographer using expertise in Geographic Information Science (GIS) to model tropical
cyclone (hurricane) impacts on coral reefs worldwide. Her PhD work at James Cook University reconstructed a
cyclone disturbance history for the Great Barrier Reef over the recent past (1969-2003) using a combination of
meteorological models implemented in GIS and field survey data of coral wave damage from cyclones. She
continues to refine this approach as well as apply it to characterise the timing, frequency and intensity of
cyclone disturbance to reefs both globally and locally.
Dr Peter Doherty
Role
AIMS Research Fellow
Background
After becoming expert on living brachiopods, Dr Doherty migrated from New Zealand to Australia where he
also switched focus to the ecology and genetics of coral reef fishes, emphasizing processes driving the
connectivity, replenishment and dynamics of their populations. After completing a PhD, he took a Queens
Fellowship in Marine Science at AIMS - moving on a year later to join the School of Australian Environmental
Studies, Griffith University. After teaching ecology and natural resource management for six years, he ret1 ····· d
to AIMS as a staff scientist; eventually leading the Tropical Fisheries Ecology group. In 1999, he became a
https:/lwww.aims.gov.au/docs/medla/latest-releases/-/asset publisher/8Kfl215.1tent/2-october-2012-the-areat-barrier-reef-has-lost-hatf-of-its-coral .. .
2/9/2021 2 October 2012 - The Great Barrier Reef has lost half of its coral in the last 27 years I AIMS
Program Leader in CRC Reef and soon after AIMS Research Director. In this role he facilitated significant
collaborations between AIMS and external partners through joint ventures like the "Great Barrier Reef Seabed
Biodiversity Project", the Marine and Tropical Sciences Research Facility, the CERF Marine Biodiversity Hub, and
the Integrated Marine Observing System.
Dr Jamie Oliver
Role
AIMS Research Director
Background
Dr Oliver joined AIMS in September 2009. Prior to this he worked for the World Fish Center from 2000, first as
senior scientist in charge of coral reef projects (including the Center's ReefBase information system} and then
as Director of Science Coordination and Secretary for the WorldFish Board of Trustees. He has also served as
the Chair of the International Coral Reef Action Network Steering Committee and co-chair of the Global Coral
Reef Monitoring Network Management Committee. Prior to World Fish he was the Director of Information
Support at the Great Barrier Reef Marine Park Authority and a senior scientist at the Australian Institute of
Marine Science. During this period he conceived, and led the production of the first State of the Great Barrier
Reef World Heritage Area Report and edited the first AIMS Long-term Monitoring Report for the GBR. He has
carried out consultancy work on coral reef monitoring and management in many countries throughout Asia
and the Pacific.
John Gunn
Role
AIMS Chief Executive Officer
Background
John Gunn is the Chief Executive Officer of AIMS. John has significant experience in leading development of
strategy, scientific research and capability, and stakeholder engagement across a research portfolio
encompassing marine ecology, fisheries, coastal systems, physical and chemical oceanography, atmospheric
chemistry and climate science. He joined AIMS from the position of Chief Scientist of the Australian Antarctic
Program, where he played a key role in developing the new Australian Antarctic Science Strategy Plan: 2011 -
2021 . Prior to this, he was Deputy Chief of CSIRO's Marine and Atmospheric Research Division, the
culmination of 29 year career with the Commonwealth Scientific and Industrial Research Organisation.
John Gunn has held a number of important advisory and policy development roles through his membership of
the Scientific Steering Committee for the Global Ocean Observing System, the Australian Academy of Science
National Committee for Antarctic Research, the Antarctic Climate and Ecosystems Co-Operative Researc~
2/!il/2021 2 October 2012 - The Great Barrier Reef has lost half of its coral in the last 27 years I AIMS
Centre Board, the Oceans Policy Science Advisory Group (OPSAG), the Commonwealth Government's High
Level Coordination Group on Climate Change Science, and Australia's Integrated Marine Observing System
Board.
About AIM S:
The Australian Institute of Marine Science (AIMS) is a Commonwealth Government organisation and a leader
in tropical marine science.
The Institute is consistently ranked among the top one per cent of specialist research institutions
internationally and is known for its unique capacity to investigate topics from broad-scale ecology to
microbiology.
AIMS is committed to the protection and sustainable use of Australia's marine resources. Its research
programs support the management of tropical marine environments around the world, with a primary focus
on the Great Barrier Reef World Heritage Area, the pristine Ningaloo Marine Park in Western Australia and
northwest Australia.
For more information, see http://www,ajms.g™(b.ttp://www.ajms.gov.au)
00090 !bnps:lltwitfet~pCi•60e!tetit...-,,,c~1oro,liin!i,ai,
About Us (/docs/ about/about.html) Research (/docs/ research/ research.html) Data 1/docs/data/data,html).
Media Vdocs/ medja/ media.html)_ Publications (Lpublications.html) Contact (!docs/about/contacts.html)_
Newsletter 1/waypoint.html).
FOi Disclosure (ldocs/publications/foi-01-statement.html) Information Publication Scheme (lips)
Public Interest Disclosure scheme (/pid) Attributing AIMS (/docs/cc-attribution.html)
Copyright Notice (!docs/cc-copyright.html) Disclaimer (/docs/disclaimer.html)
Privacy Policy (/docs/privacy-policy.html)
© 1996-2021 Australian Institute of Marine Science 1<1111:I
https://www.aims.gov.au/docs/media/latest-releases/-/asset_publisher/8KfVZ 771tent/2-october-2012-the-great-barrier-reef-has-lost-half-of-its-coral ..

2'1K
J
2/912021 08 December: Latest field survey results show strong coral recovery in the southern reefs of the GBR J AIMS
.([).
What are you looking for?
Home(/)
About (/doc~/about/abcut.htrnl)
Research (jdocs/rcse;;rch/rt0search.html)
Data (/docs/data/data.html)
Publiczfons (/publications.htrni)
Media (/docs/media/media.html)
Latest releases Udocs/media/ latest-re!eases)
Latest news Udocs/medja/ latest-newsJ
Featured Content Udocs/medja/featured-content.html)
Marine Science Factsheets l/factsheets).
Waypoint Newsletter f/waypoint-subscriptjon.html).
Release Archives Udocs/media/media-archives.htmD.
08 December: Latest field survey results show strong coral recovery in the southern reefs of the GBR 8 December 2015
https://www.aims.gov.au/docs/media/1atest-news/-/asset_publisher/EnA5gl2791Xjd/content/08-clecember-latest-field-survey-results-show-strong-c ...
2/9/2021 08 December: Latest field survey results show strong coral recovery in the southern reefs of the GBR I AIMS
The Capricorn-Bunker region in the south of the Great Barrier Reef (GBR) is showing excellent signs of coral
recovery, according to the latest results of the AIMS Long Term Monjtorjng Progrrun
.{http:llwww.aims.gov.au/docs/research/monitoring/reef/reef-monitoring.html). Coral cover for the area has
more than doubled since being dramatically reduced during severe storms in 2008 and ImP-ical Cyclone
Hamish in 2009 (httP-:l/www.aims.gov.au/docs/media/news2009/20090820.html)_.
Despite the improvements to the regions' coral cover in recent years, hot conditions are forecasted for this
summer and a coral bleaching event is predicted (bnp:llwww.aims.gov.au/docs/media/featured
content.html/-/asset publisher/Ydkl 8I5iDwF7/content/widespread-coral-bleaching-in-the-northern-
hem isphere-co ra I-reef-reg ions-provides-an-early-warning-that-au stra I ia n-reefs-a re-Ii kely-at-rjs k-i n-the-su m} .
A bleaching event would likely halt further recovery, or cause widespread coral death.
Disturbance events such as cyclones and storms are natural processes for coral reef communities, however
there is concern that cumulative imRam...Usites/default!files/State%20of%20the%20GBR.R@. are reducing
'reef resilience', or 'the ability of reefs to recover from such disturbances'. Pressures such as reduced water
.QY.filllY (/sites/defaultlfiles/Water%20~Y.fility .. pd_f), increased water temperatures and crown-of-thorns starfish
Usites/default/files/cots.12@. are all straining the ability of coral reefs to recover from disturbance events such
as cyclones.
With reef data extending over 20 years, the AIMS Long Term Monitoring Progrrun
.{http:llwww.aims,gov.au/docs/research/monitoring/reef/reef-monitoring.btml)_ provides an invaluable record
of change in coral reef communities over a large geographic area. Several trips are completed each year and
full reports are available M[e_(b.:tJ:p://www.ajms,gov.au/docs/research/monitoring/reef/latest-surveys.html}.
For access to the October 2015 survey report for the Capricorn-Bunker sector, dick here
.(http://www.ajms.gov.au/reef-monitoring&pricorn-bunker-sector-of-the-great-barrier-reef-2015}.
Visit here (bttp://www.aims.gov.au/docs/research/monitoring/monitorjng.html) for more information about
AIMS monitoring programs on the Great Barrier Reef and other tropical marine ecosystems.
Reef survey report: Capricorn-Bunker sector
a
00090 .Cb.ttP-s:11twiUe~l,,vMd••lwf6i.t!':'1 : '. U: 5:ta\dhtmmi'apmpm,tei,
2/9/2021 08 December: Latest field survey results show strong coral recovery in the southern reefs of the GBR I AIMS
About Us Udocs/about/about.html} Research {/docs/ research/ research.html}_ Qata.Uclocs/data/data,html)
Media (!docs/ media/media.html) Publications <LP-ublications.html). Contact (!docs/ about/contacts.html).
Newsletter ~point.html}.
FOi Disclosure (/docs/publications/foi-01 -statement.html) Information Publication Scheme (lips)
Public Interest Disclosure scheme (lpid) Attributing AIMS (/docs/cc-attribution.html}
Copyright Notice (/docs/cc-copyright.html} Disclaimer (/docs/disclaimer.html}
Privacy Policy (/docs/privacy-policy.html)
© 1996-2021 Australian Institute of Marine Science I {ac: i
https://www.alms.gov.au/docs/media/latest-news/-/asset_publisher/EnA5gl"28l'Xjd/content/08-december-1atest-fleld-survey-results-show-strong-c ...

282
2/El/2021 Report on surveys of the Capricorn-Bunker sector of the Great Barrier Reef I AIMS
fj).
What are you looking for?
l:ome (/i
.i.bou1 (ldoc$/abouVabuut.h1 ml)
Dat2 (/d0i::s/d21-3/dnl a.htr,1!)
Medi& (/docs/media/media.html)
Publications (lpubl:caiions.html)
Research (/docs/research/research.html).
Cumulative lmP-acts Ucumulative-impacts).
Marine and Coastal Industries Umarine-industries)
Measuring.£hfillge C/measurjng-change).
Monitoring_(/docs/research/monjtorjng/monjtoring.bttnl)_
Reef Monitoring Udocs/research/monjtorjng/reef/reef-monjtorjng.h1ml}_
Survey reRQ.[L'i f/docs/resea rch/monjtorjng/reefllatest-survey,s.html)
Ss.!nP-ling Methods (/docs/research/monitoring/reef/samP-fulg-methods html)_
Standard PP-erational procedures Udocs/research/monitorjng/reef/soP-s,htmll
Reefs under survey ChttP-s:llaP-P-S,aims.gov,au/ reef-monitoring/l.
Monitoring Inshore Reefs Udocs/research/water-qualit;y/inshore-reefs/monjtorjng-inshore-reefs.htmll.
Search for reef on roaP- (http·//data.ajms gov.au/monmap3/crujsereport.jsp?cruise=all)_
Crown-of-thorns surveys (httP-:lldata.aims.gov.au/waCOTSPage/cotsP-s,ggj:;,P-l
MaP.,P-ing_Udocs/research/biodiversitY.-ecology/maP.,Pjrl9/map_p.i.o.g.htmll
Queensland's Integrated Marine Observing2Y.stem Udocs/research/research-higblights/imos}
https://www.aims.gov.au/reef-monitoring/capricorn-bunker-sector-2017 2 8 3
2/9/2021 Report on surveys of the Capricorn-Bunker sector of the Great Barrier Reef I AIMS
weather Udocs/ research/monjtorjng/weather/weather html\
Water OuaHty Monitoring Umonitorjngl_
Reef Recovery (!reef-recovery).
Reef spawning research 2020 Uresearch/sPfilY!ling-research-2020).
Species at Risk (!species-at-risk).
Technological Solutions Utechnologjcal-solutionsl
Research Programs 1/resea rch/research-p...!Qg~).
Research partnerships Uresearch-12artnershi~).
Staff (!:ll.tps;//www aims.gov au/our-rum_~
Report on surveys of the Capricorn-Bunker secto,r of the Great Barrier Reef 15 March 2017
Summary
• Strong recovery in hard coral cover on most reefs since storms and Cyclone Hamish in 2008/09
• Little evidence of significant impact of the 2016 bleaching event
• One coral feeding crown-of-thorns starfish. Acanthaster planci observed at one reef
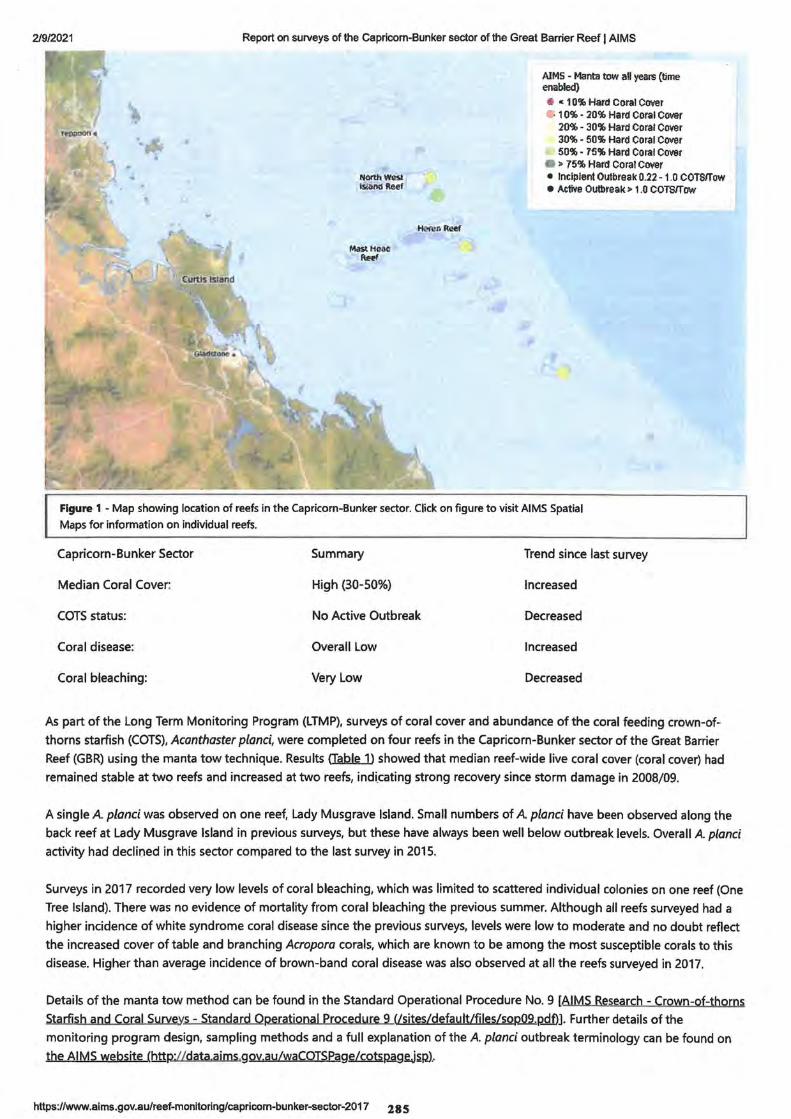
2/9/2021 Report on surveys of the Capricorn-Bunker sector of the Great Barrier Reef I AIMS
Milstli(!ilC Afff
AIMS • Manta tow all years (time enabled) • ,. 10% Hard coral Cover
1 0% • 20% Hard coral Cover 20% • 30% Hard Coral Cover 30% • 501tJ. H11rd coral cover 50'1o • 751Ji Hard Coral Cover
• > 75% Hard coral cover • Incipient Outbreak 0.22 - 1.0 COTSfTow • Active Outbreak> 1.0 corsrrow
Figure 1 - Map showing location of reefs in the Capricorn-Bunker sector. Click on figure to visit AIMS Spatial
Maps for information on individual reefs.
Capricorn-Bunker Sector Summary Trend since last survey
Median Coral Cover: High (30-50%) Increased
COTS status: No Active Outbreak Decreased
Coral disease: Overall Low Increased
Coral bleaching: Very Low Decreased
As part of the Long Term Monitoring Program (LTMP), surveys of coral cover and abundance of the coral feeding crown-of
thorns starfish (COTS), Acanthaster planci, were completed on four reefs in the Capricorn-Bunker sector of the Great Barrier
Reef (GBR) using the manta tow technique. Results CTable 1) showed that median reef-wide live coral cover (coral cover) had
remained stable at two reefs and increased at two reefs, indicating strong recovery since storm damage in 2008/09.
A single A plonci was observed on one reef, Lady Musgrave Island. Small numbers of A plonci have been observed along the
back reef at Lady Musgrave Island in previous surveys, but these have always been well below outbreak levels. Overall A planci
activity had declined in this sector compared to the last survey in 2015.
Surveys in 2017 recorded very low levels of coral bleaching, which was limited to scattered individual colonies on one reef (One
Tree Island). There was no evidence of mortality from coral bleaching the previous summer. Although all reefs surveyed had a
higher incidence of white syndrome coral disease since the previous surveys, levels were low to moderate and no doubt reflect
the increased cover of table and branching Acroporo corals, which are known to be among the most susceptible corals to this
disease. Higher than average incidence of brown-band coral disease was also observed at all the reefs surveyed in 2017.
Details of the manta tow method can be found in the Standard Operational Procedure No. 9 [AIMS Research - Crown-of-thorns
Starfish and Coral Surveys - Standard Operational Procedure 9 Usjtes/default/files/sopQi.P-Qf)J. Further details of the
monitoring program design, sampling methods and a full explanation of the A plonci outbreak terminology can be found on
the AIMS website (http·//data ajms,gov,au/waCOTSPagfilQts.pagejsp) ..
https://www.alms.gov.au/reef-monitoring/capricom-bunker-sector-2017 2 8 5
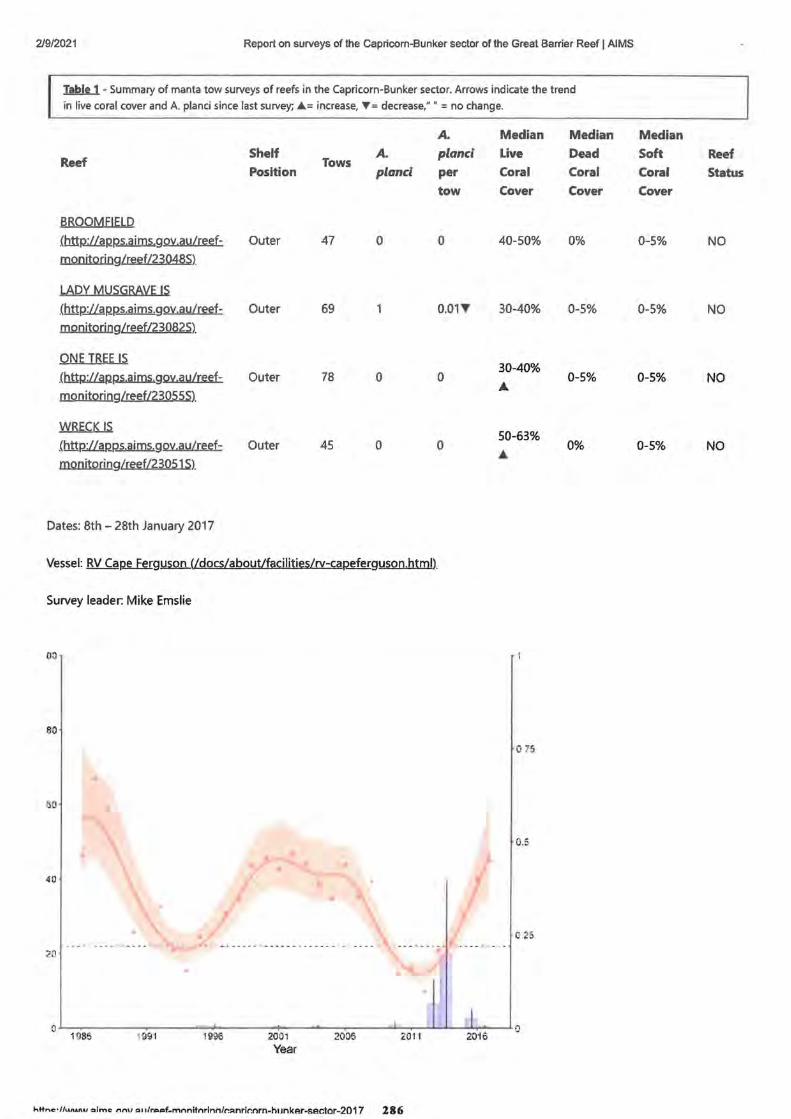
2/9/2021 Report on surveys of the Capricorn-Bunker sector of the Great Barrier Reef I AIMS
Ilhltl - Summary of manta tow surveys of reefs in the Capricorn-Bunker sector. Arrows indicate the trend
in live coral cover and A. planci since last survey; A= increase, T= decrease," • = no change.
A. Median Median Median
Reef Shelf A. planci Live Dead Soft Reef
Tows Position planci per Coral Coral Coral Status
tow Cover Cover Cover
BROOMFIELD
{bnfti&p~goy,au/reef- Outer 47 0 0 40-50% 0% 0-5% NO
monjtoringtreef/230485)
LADY MUS~RA~E IS
.(htt~pP-s.aj ms.gay.au/reef- Outer 69 1 O.Q1~ 30-40% 0-5% 0-5% NO
monjtoring/reef/230825)
ONE TREE IS 30-40%
.(b!trtifapps,a i ms.gay.au/reef- Outer 78 0 0 0-5% 0-5% NO
monitorjng/reef/230555) A
WRECK rs 50-63%
.(b!t12:lla12~goy.au/reef- Outer 45 0 0 0% 0-5% NO
monjtoring/reef/23051 S) ..
Dates: 8th - 28th January 2017
Vessel: RV Cap_e_ferg.Y.SQD..Udocs/aboutlfaciljtjes/rv-capeferguson.htmll.
Survey leader: Mike Emslie
00
80
0 75
0
0.5
40
70
o~--r---- -.---........ -----....... - - -~-.---~~-........ _._-...,... _ _._o ~ 986 Hl91 1996 2001 2006 Wt 1 2016
Year
htt ... c•//••n•nu .. imc nn\l """""f-mnnitnrinn/r.:>nrir.nrn-hunkAr-sector-2017 286
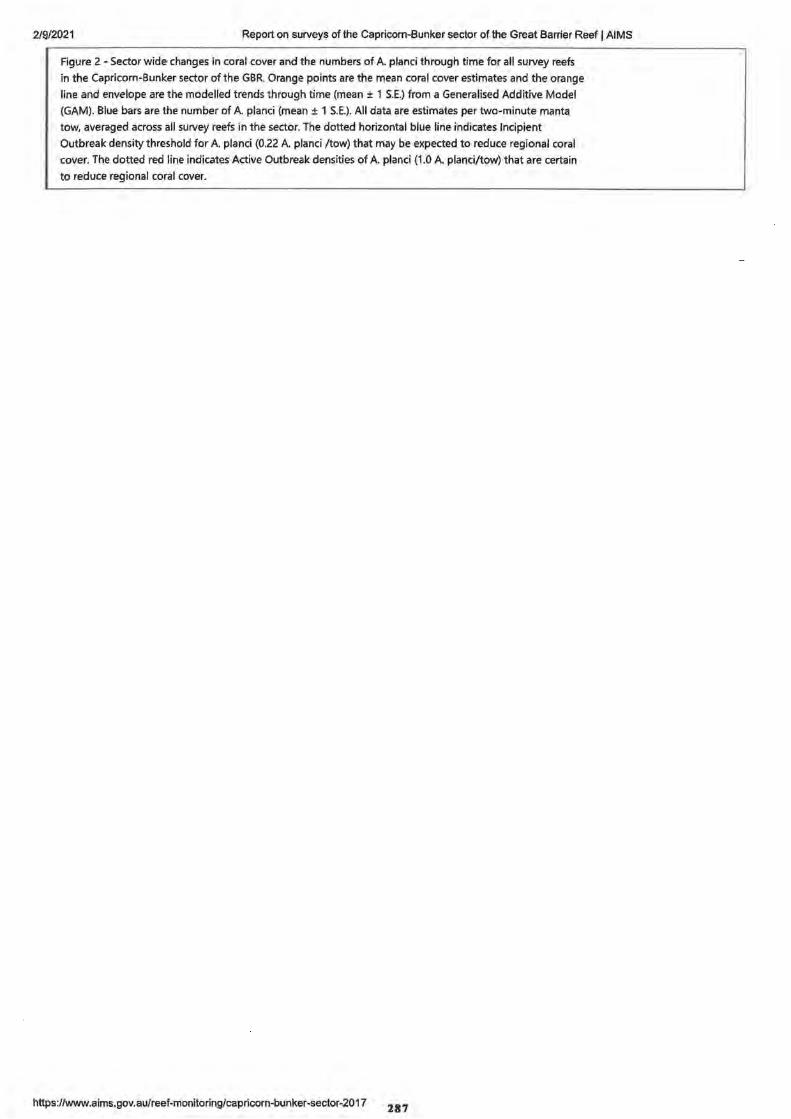
2/9/2021 Report on surveys of the Capricorn-Bunker sector of the Great Barrier Reef I AIMS
Figure 2 - Sector wide changes in coral cover and the numbers of A. planci through time for all survey reefs
in the Capricorn-Bunker sector of the GBR. Orange points are the mean coral cover estimates and the orange
line and envelope are the modelled trends through time (mean ± 1 S.E.) from a Generalised Additive Model
{GAM). Blue bars are the number of A. planci {mean ± 1 S.E.). All data are estimates per two-minute manta
tow, averaged across all survey reefs in the sector. The dotted horizontal blue line indicates Incipient
Outbreak density threshold for A. planci (0.22 A. planci /tow) that may be expected to reduce regional coral
cover. The dotted red line indicates Active Outbreak densities of A. planci {1 .0 A. planci/tow) that are certain
to reduce regional coral cover.
https://www.aims.gov.au/reef-monitoring/capricorn-bunker-sector-2017 287
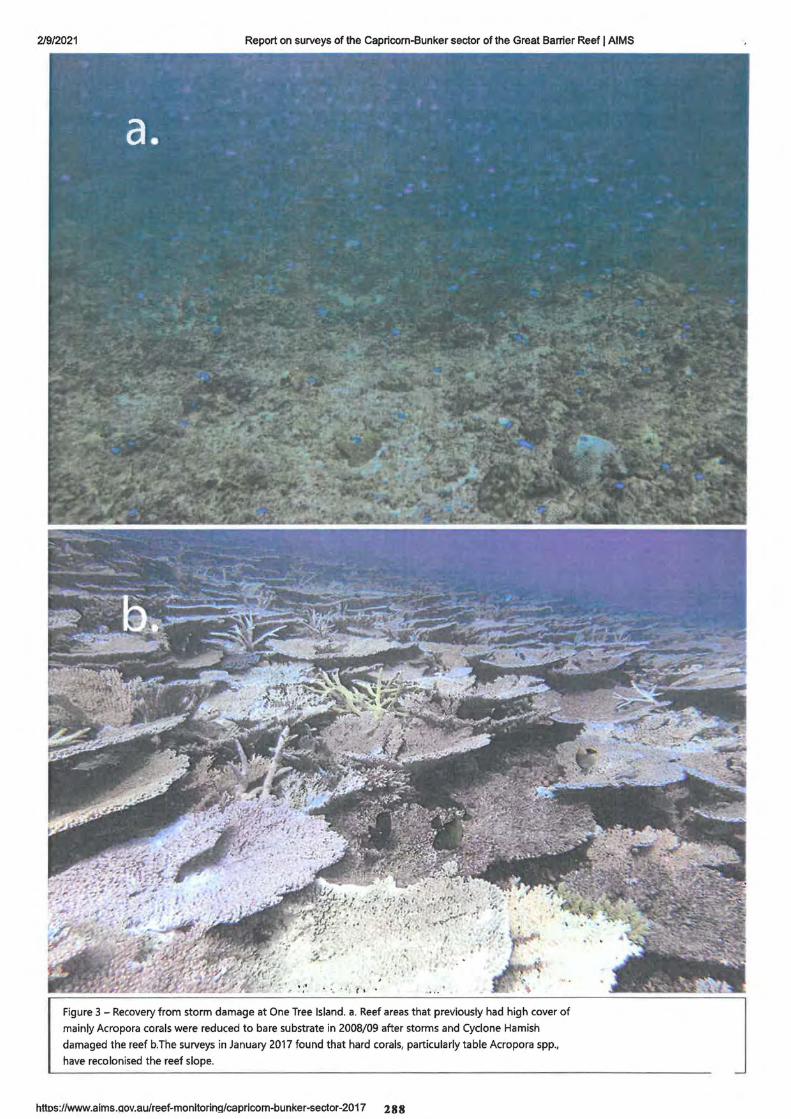
2/9/2021 Report on surveys of the Capricorn-Bunker sector of the Great Barrier Reef I AIMS
... I • ( t
Figure 3 - Recovery from storm damage at One Tree Island. a. Reef areas that previously had high cover of
mainly Acropora corals were reduced to bare substrate in 2008/09 after storms and Cyclone Hamish
damaged the reef b.The surveys in January 2017 found that hard corals, particularly table Acropora spp.,
have recolonised the reef slope.
httos://www.aims.aov.au/reef-monitoring/capricom-bunker-sector-2017 2 8 8
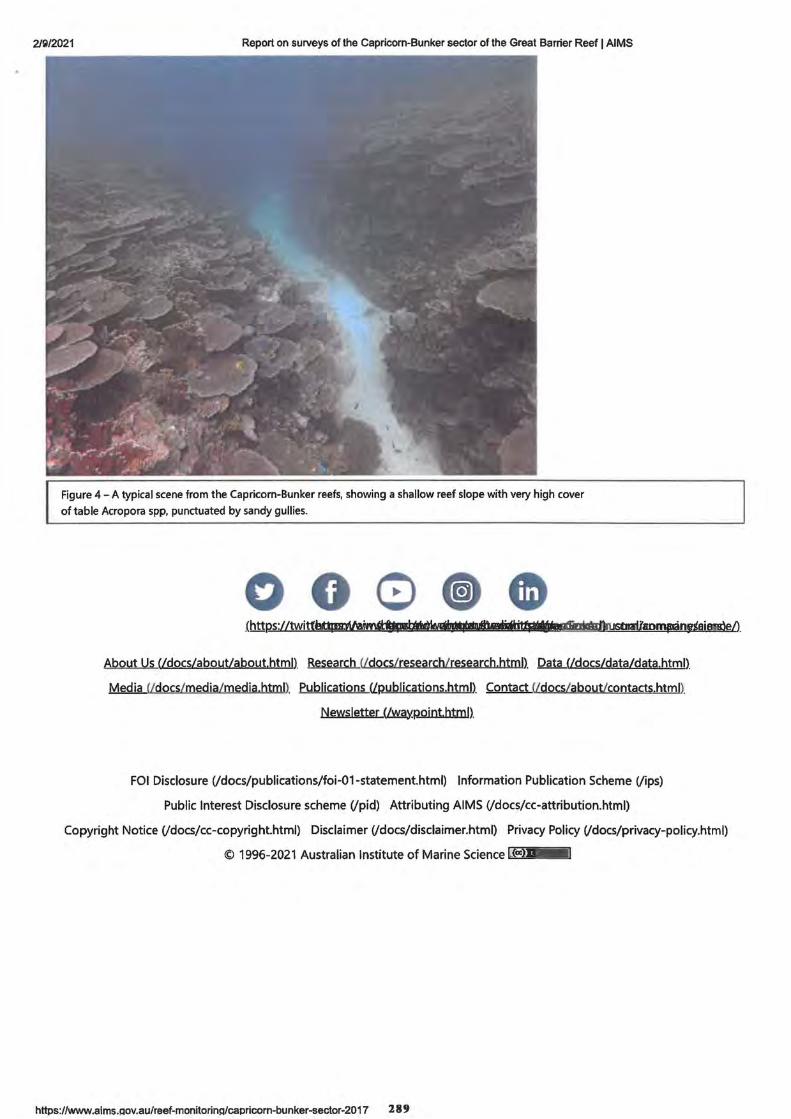
2/!il/2021 Report on surveys of the Capricorn-Bunker sector of the Great Barrier Reef I AIMS
Figure 4 -A typical scene from the Capricorn-Bunker reefs, showing a shallow reef slope with very high cover
of table Acropora spp, punctuated by sandy gullies.
00080 .(httP-s://twitf~itrpw~aom,an,teiemr:)eD
About Us ({docs/abouUabout.html). Research ({docs/research/ research.html)_ Qm (/docs/data/data.html}
.M.ed.ia.(ldocs/medja/media,html). Publications (!publications.html) Contact Udocs/abouUcontacts,html).
Newsletter (Lwaypojnt,html).
FOi Disclosure (/docs/publications/foi-01 -statement.html) Information Publication Scheme (lips}
Public Interest Disclosure scheme (/pid) Attributing AIMS (/docs/cc-attribution.html}
Copyright Notice (/docs/cc-copyright.html) Disclaimer (!docs/disclaimer.html) Privacy Policy (/docs/privacy-policy.html}
© 1996-2021 Australian Institute of Marine SciencP L<"'21
https://www.aims.aov.au/reef-monitorina/caprlcorn-bunker-sector-2017 2 8 9

291
2/~/2021 Long-term Reef Monitoring Program - Annual Summary Report on coral reef condition for 2018/19 I AIMS
.W.
What are you looking for?
Home(/)
About (idoc:;/ahout/about.html)
Data (/doc:;/da,z/data.html)
Media (!dccs/rnedia/meoia.html)
Fub!ic..atirms (/pl.:biications.html)
Research {/docs/research/research.html)_
Cumulative lmP.acts Ucumulative-jmpacts).
Marine and Coastal Industries Umarjne-jndustries).
Measuring Change Umeasurjng.:mange).
Monitoring Udocs/ research/ monjtoring/ monjtoring.b!mD.
Reef MonitoringJ/docs/ research/monitoring/reef/ reef-monitoring.html).
SurveY. reP-orts {/docs/ research/ monitoring/ reef/latest-surveys.html).
SamP-ling Methods Udocs/ research/monitorjng/reef/sampJing-methods,htmll
Standard operational procedures Udocs/ research/monjtorjng/reef/so~.
Reefs under suryey (b!tP-s://apps.aims.gov.au/ reef-monitoringl)_
Monitoring Inshore Reefs Udocs/ research/water-quality/ inshore-reefs/ monitoring-inshore-reefs.htmll
Search for reef on map_(b!tp:l/data.aims.gov.au/ monmap3/cruisereP-ort.j~?cruise=aU),
https://www.aims.gov.au/reef-monitoring/gbr-condition-summary-2018-201!i91
2/9/2021 Long-term Reef Monitoring Program - Annual Summary Report on coral reef condition for 2018/19 I AIMS
Crown-of-thorns suryeyL(http://data.aims.gov.au/waCOTSPag~12aggj~P-).
MaP-P-ing l/docs/ research/biodiversity-ecology/maRP-in.9L!Il2RP-ing.html).
Queensland's Integrated Marine Observing..S,V.stem Udocs/ research/research-highlights/imos).
Weather l/docs/ research/mooitoring/weather/weather,html).
Water Quality Monitoring Umonjtoring).
Reef Recovery (!reef-recovery).
Reef s™11ing research 2020 Uresearch/sP.awning-research-2020).
~pecjes at Risk ~pecjes-at-risk).
Technological Solutions (/technological-solutions).
Research Programs Ure sea rch/ resea rch-P.rog@.!lli).
Research partnershiP-s Uresearch-partnershi~).
Staff (h.llps://www,aims.gov,au/our-P-eople/researcher-P-rofiles)
Long-term Reef Monitoring Program -Annual Summary Report on coral reef condition for 2018/ 19
Mixed bill of health for the Great Barrier Reef
Summary
• Coral reefs are impacted by numerous disturbances including outbreaks of the corallivorous crown-of
thorns starfish (Acanthaster c.f. solaris), tropical cyclones and coral bleaching.
• Over the last five years, these collective disturbances have caused declines in hard coral cover to
moderate (10-30%) levels across much of the Great Barrier Reef (GBR).
• Reef condition was variable both within and among regions.
• Reefs in the Northern and Central GBR have sustained impacts from multiple severe disturbances
including mass coral bleaching, cyclones and crown-of-thorns starfish outbreaks.
httnc ·//uri,,.,,., ~irnc nn\1 ~• 1/r,:1,,:1,f_mnnitnrinn/nhr-r.nnriitinn-~11mm~rv-?.01 R-201.J9 l
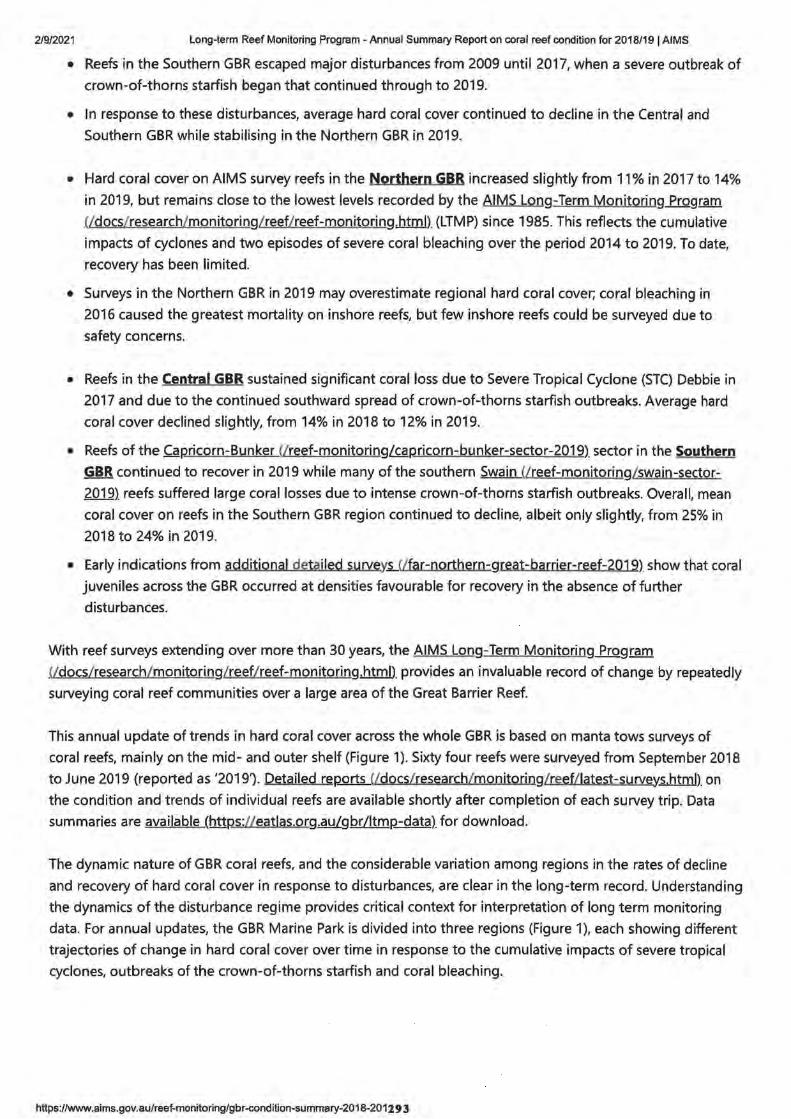
2/9/2021 Long-term Reef Monitoring Program - Annual Summary Report on coral reef condition for 2018/191 AIMS
• Reefs in the Southern GBR escaped major disturbances from 2009 until 2017, when a severe outbreak of
crown-of-thorns starfish began that continued through to 2019.
• In response to these disturbances, average hard coral cover continued to decline in the Central and
Southern GBR while stabilising in the Northern GBR in 2019.
• Hard coral cover on AIMS survey reefs in the Northern GBR increased slightly from 11 % in 2017 to 14%
in 2019, but remains close to the lowest levels recorded by the AIMS Long-Term Monitoring Program
{/docs/ research/monitoring/ reef/ reef-monitoringJitmD. {LTMP) since 1985. This reflects the cumulative
impacts of cyclones and two episodes of severe coral bleaching over the period 2014 to 2019. To date,
recovery has been limited.
• Surveys in the Northern GBR in 2019 may overestimate regional hard coral cover; coral bleaching in
2016 caused the greatest mortality on inshore reefs, but few inshore reefs could be surveyed due to
safety concerns.
• Reefs in the Central GBR sustained significant coral loss due to Severe Tropical Cyclone (ST() Debbie in
2017 and due to the continued southward spread of crown-of-thorns starfish outbreaks. Average hard
coral cover declined slightly, from 14% in 2018 to 12% in 2019.
• Reefs of the Capricorn-Bunker Ureef-monitoringfg_pricorn-bunker-sector-2019) sector in the Southern
GBR continued to recover in 2019 while many of the southern Swain Ureef-monitoring/ swain-sector-
2019). reefs suffered large coral losses due to intense crown-of-thorns starfish outbreaks. Overall, mean
coral cover on reefs in the Southern GBR region continued to decline, albeit only slightly, from 25% in
2018 to 24% in 2019.
• Early indications from additional detailed surveys_(/far-northern-great-barrier-reef-2019) show that coral
juveniles across the GBR occurred at densities favourable for recovery in the absence of further
disturbances.
With reef surveys extending over more than 30 years, the AIMS Long-Term Monitoring Program
.(!docs/ research/ monitoring/ reef/ reef-monitoring.b1ml)_ provides an invaluable record of change by repeatedly
surveying coral reef communities over a large area of the Great Barrier Reef.
This annual update of trends in hard coral cover across the whole GBR is based on manta tows surveys of
coral reefs, mainly on the mid- and outer shelf (Figure 1). Sixty four reefs were surveyed from September 2018
to June 2019 {reported as '2019'). Detailed reP-orts {ldocs/ research/monitoring/ reef/latest-survey..s..b1ml)_ on
the condition and trends of individual reefs are available shortly after completion of each survey trip. Data
summaries are available (bnP-s://eatlas.org.au/gbr/ltmP--data). for download.
The dynamic nature of GBR coral reefs, and the considerable variation among regions in the rates of decline
and recovery of hard coral cover in response to disturbances, are clear in the long-term record. Understanding
the dynamics of the disturbance regime provides critical context for interpretation of long term monitoring
data. For annual updates, the GBR Marine Park is divided into three regions (Figure 1), each showing different
trajectories of change in hard coral cover over time in response to the cumulative impacts of severe tropical
cyclones, outbreaks of the crown-of-thorns starfish and coral bleaching.
https://www.aims.gov.au/reef-monitoring/gbr-condition-summary-2018-2012 9 3
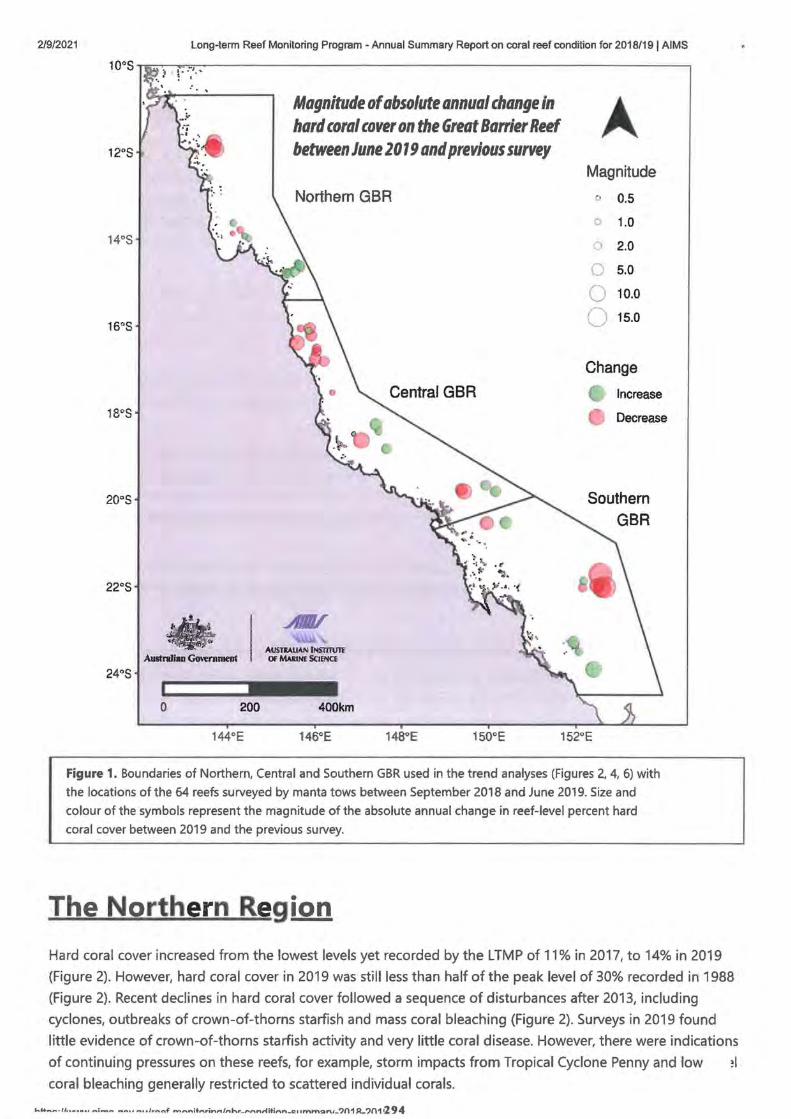
2/9/2021
12°s
14°S
16°S
18°S
20°s
22°s
Long-term Reef Monitoring Program -Annual Summary Report on coral reef condition for 2018/19 I AIMS
• . .
> Australian Gm-emment
0 200
144°E
Magnitude of absolute annual change in hard coral cover on the Great Barrier Reef between June 2019 and previous survey
Northern GBR
.AJIIV AUSTv.UAN INSllTUTf or MARINE SCIENCE
400km
Central GBR
A Magnitude
0.5
o 1.0
0 2.0
0 5.0
0 10.0
0 15.0
Change
Increase
Decrease
Southern GBR
146°E 148°E 150°E 152°E
Figure 1. Boundaries of Northern, Central and Southern GBR used in the trend analyses (Figures 2, 4, 6) with
the locations of the 64 reefs surveyed by manta tows between September 2018 and June 2019. Size and
colour of the symbols represent the magnitude of the absolute annual change in reef-level percent hard
coral cover between 2019 and the previous survey.
The Northern Region
Hard coral cover increased from the lowest levels yet recorded by the LTMP of 11% in 2017, to 14% in 2019
(Figure 2). However, hard coral cover in 2019 was still less than half of the peak level of 30% recorded in 1988
(Figure 2). Recent declines in hard coral cover followed a sequence of disturbances after 2013, including
cyclones, outbreaks of crown-of-thorns starfish and mass coral bleaching (Figure 2). Surveys in 2019 found
little evidence of crown-of-thorns starfish activity and very little coral disease. However, there were indications
of continuing pressures on these reefs, for example, storm impacts from Tropical Cyclone Penny and low ?I
coral bleaching generally restricted to scattered individual corals.
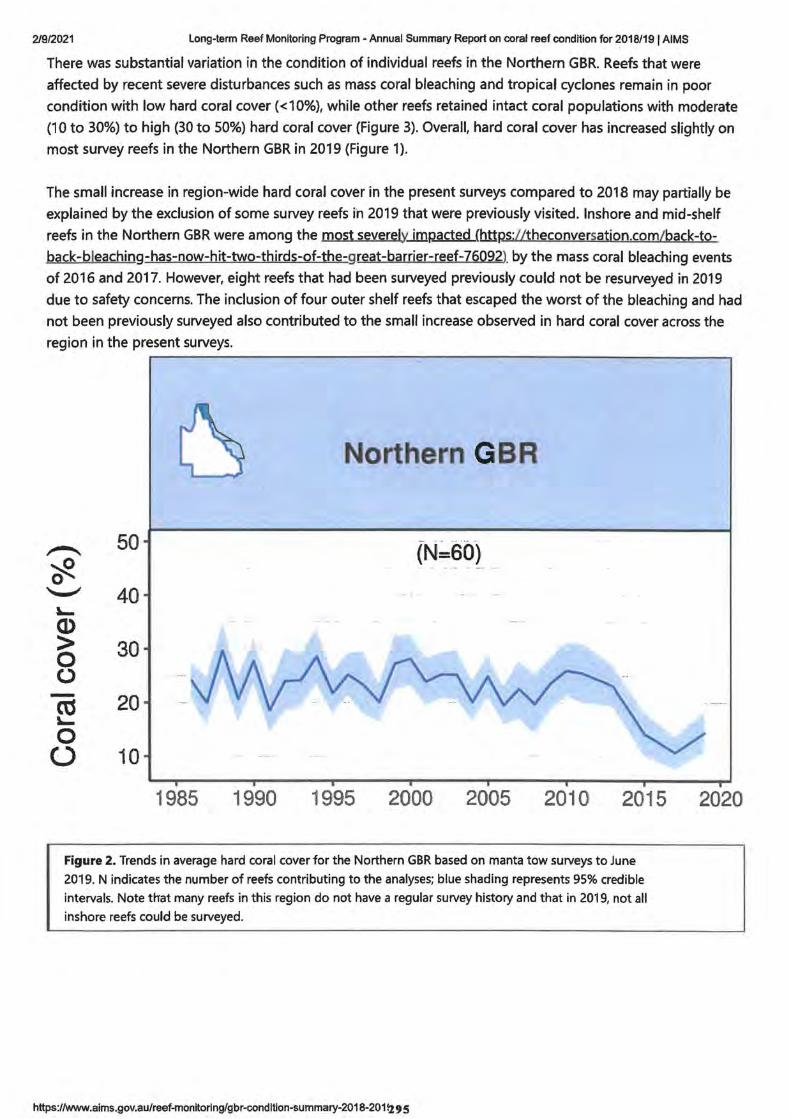
2/9/2021 Long-term Reef Monitoring Program - Annual Summary Report on coral reef condition for 2018/191 AIMS
There was substantial variation in the condition of individual reefs in the Northern GBR. Reefs that were
affected by recent severe disturbances such as mass coral bleaching and tropical cyclones remain in poor
condition with low hard coral cover (<10%}, while other reefs retained intact coral populations with moderate
(1 Oto 30%) to high (30 to 50%) hard coral cover (Figure 3). Overall, hard coral cover has increased slightly on
most survey reefs in the Northern GBR in 2019 (Figure 1).
The small increase in region-wide hard coral cover in the present surveys compared to 2018 may partially be
explained by the exclusion of some survey reefs in 2019 that were previously visited. Inshore and mid-shelf
reefs in the Northern GBR were among the most severelylm.pacted {https:Utheconversatjon.com/back-to
back-bleaching-has-now-hit-two-thirds-of-the-great-barrjer-reef-76092} by the mass coral bleaching events
of 2016 and 2017. However, eight reefs that had been surveyed previously could not be resurveyed in 2019
due to safety concerns. The inclusion of four outer shelf reefs that escaped the worst of the bleaching and had
not been previously surveyed also contributed to the small increase observed in hard coral cover across the
region in the present surveys.
Northern GBR
50 -- - -.. ·- -,,-...... (N=60) 0 ~
.. ... •· · -·- ....
'--" 40 '-Q) > 30 0 0 - 20 cu '-0 0 10
1985 1990 1995 2000 2005 2010 2015
Figure 2. Trends in average hard coral cover for the Northern GBR based on manta tow surveys to June
2019. N indicates the number of reefs contributing to the analyses; blue shading represents 95% credible
intervals. Note that many reefs in this region do not have a regular survey history and that in 2019, not all
inshore reefs could be surveyed.
https://www,aims.gov.au/reef-monitorlng/gbr-condltion-summary-2018-201!z95
2020
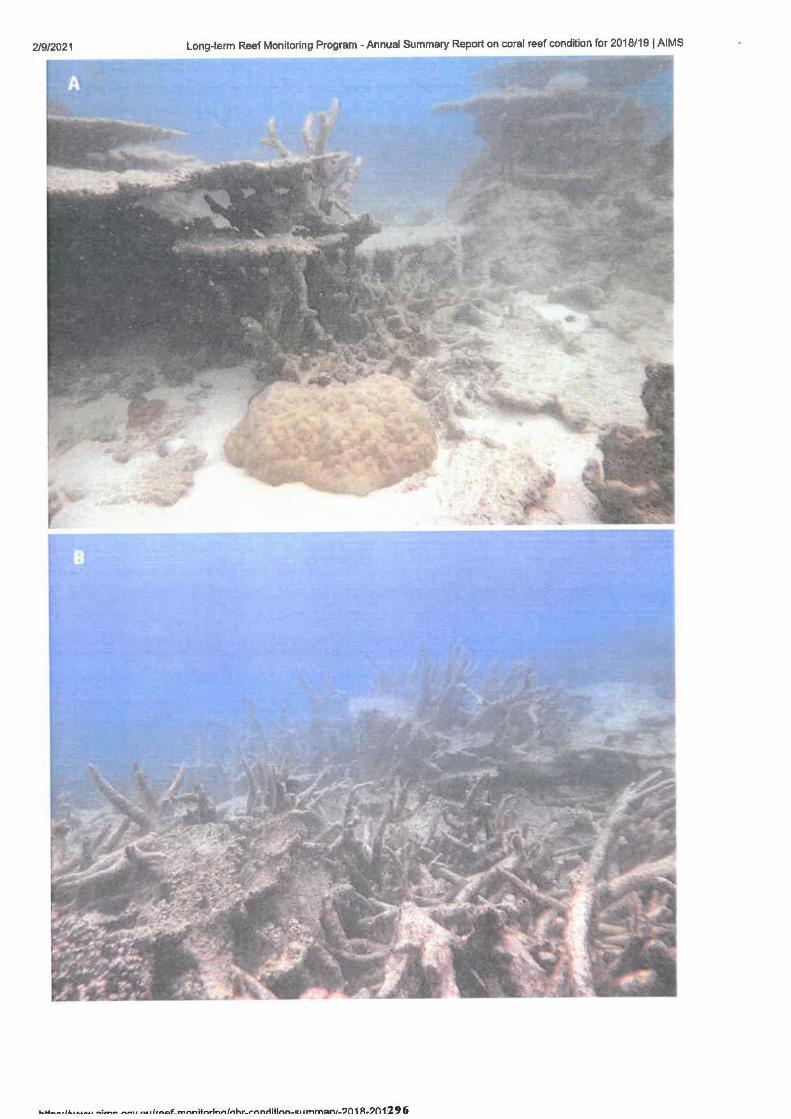
2/9/2021 Long-term Reef Monitoring Program -Annual Summary Report on coral reef condition for 2018/19 j AIMS
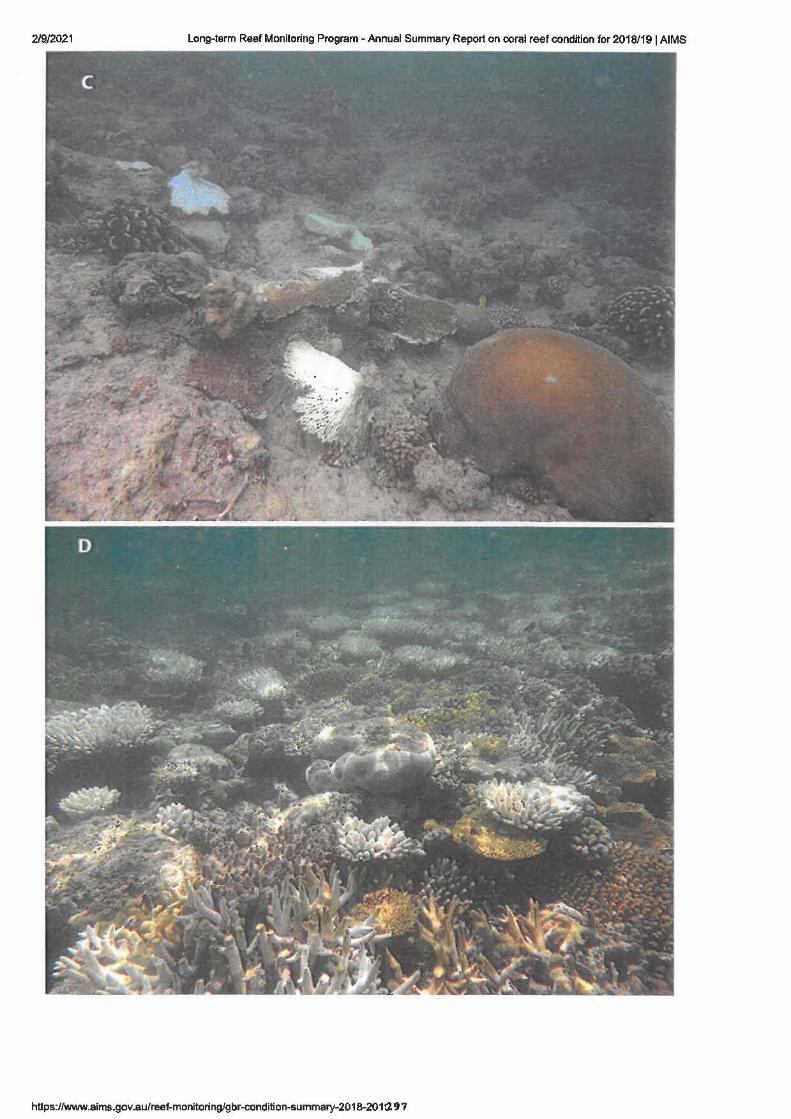
2/912021 Long-term Reef Monitoring Program -Annual Summary Report on coral reef condition for 2018/19 I AIMS
https:/fwww.aims.gov.au/reef-monitoring.lgbr-condition-summary-2018-201!2 9 7
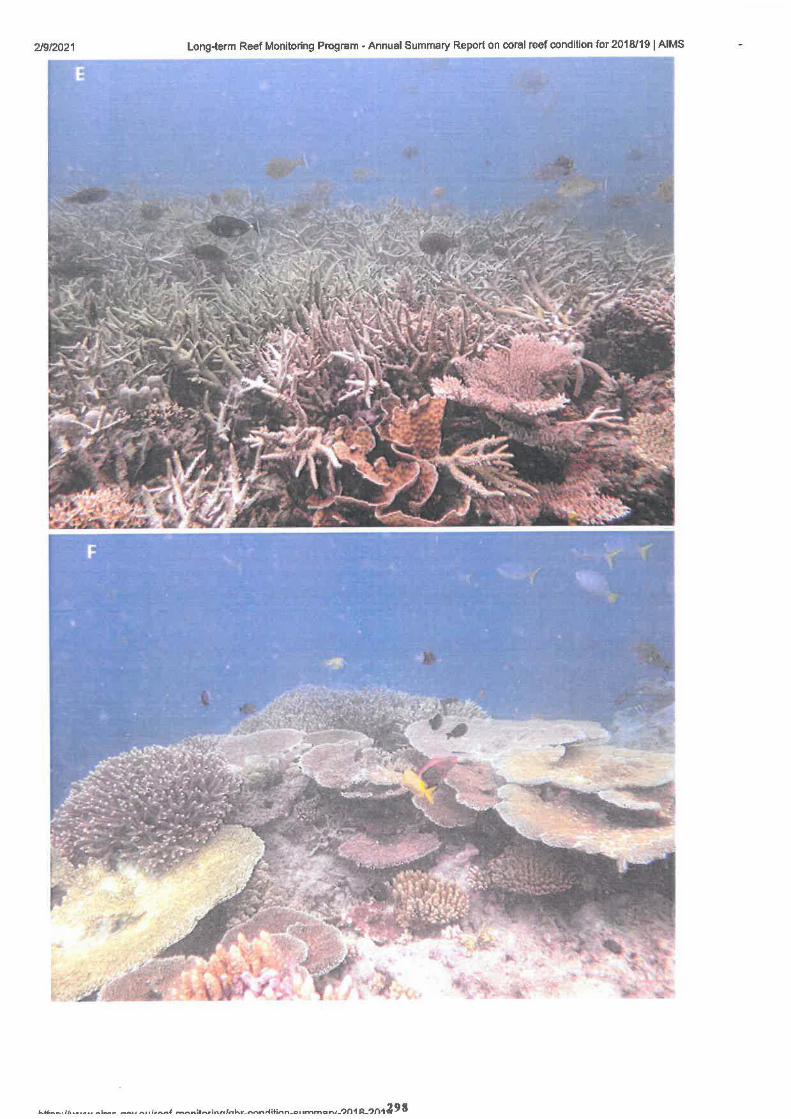
2/9/2021 Long-term Reef Monitoring Program - Annual Summary Report on ooral reef condition for 2018/191 AIMS
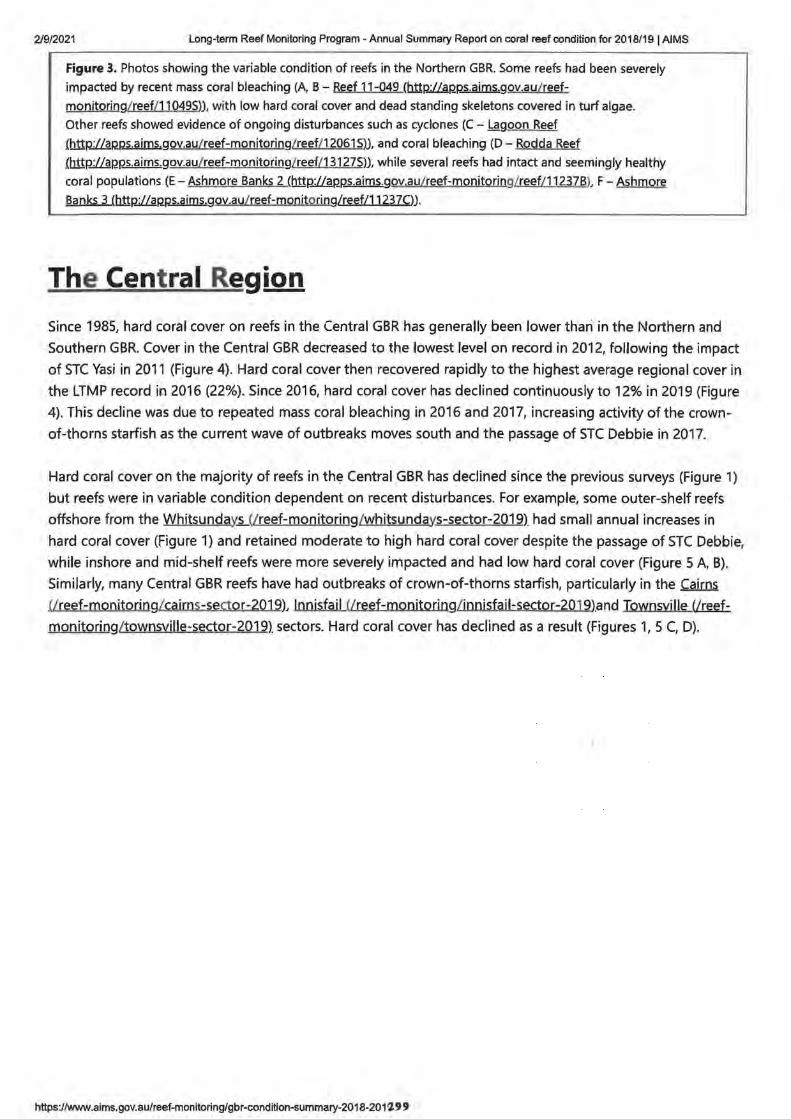
2/9/2021 Long-term Reef Monitoring Program -Annual Summary Report on coral reef condition for 2018/191 AIMS
Figure 3. Photos showing the variable condition of reefs in the Northern GBR. Some reefs had been severely
impacted by recent mass coral bleaching (A, B - Reef 11-049 (bttitLLru:ms.aims.gov.au/ reef
monitoring/ reef/ 11049S)), with low hard coral cover and dead standing skeletons covered in turf algae.
Other reefs showed evidence of ongoing disturbances such as cyclones (C - Lagoon Reef
.(!l1tR,;[email protected]/reef-monitoring/reef/12061 S)), and coral bleaching (D - Rodda Reef
.(b.:ttP-:/laP-P-S.aims.gov.au/reef-monitoring/reef/13127S)), while several reefs had intact and seemingly healthy
coral populations (E -Ashmore Banks 2 (bllP-:LLaP-P-S.ajms.gov.au/ reef-monjtorjng/reef/ 11237B). F -Ashmore
Banks 3 <http://aP-~gov.au/ reef-monitoring/reef/11237C)).
The Central Region
Since 1985, hard coral cover on reefs in the Central GBR has generally been lower thari in the Northern and
Southern GBR. Cover in the Central GBR decreased to the lowest level on record in 2012, following the impact
of STC Vasi in 2011 (Figure 4). Hard coral cover then recovered rapidly to the highest average regional cover in
the LTMP record in 2016 (22%). Since 2016, hard coral cover has declined continuously to 12% in 2019 (Figure
4). This decline was due to repeated mass coral bleaching in 2016 and 2017, increasing activity of the crown
of-thorns starfish as the current wave of outbreaks moves south and the passage of STC Debbie in 2017.
Hard coral cover on the majority of reefs in th«;! Central GBR has declined since the previous surveys (Figure 1)
but reefs were in variable condition dependent on recent disturbances. For example, some outer-shelf reefs
offshore from the WhitsundaY.S C/reef-monitoring /whitsundays-sector-2019). had small annual increases in
hard coral cover (Figure 1) and retained moderate to high hard coral cover despite the passage of STC Debbie,
while inshore and mid-shelf reefs were more severely impacted and had low hard coral cover (Figure 5 A, B).
Similarly, many Central GBR reefs have had outbreaks of crown-of-thorns starfish, particularly in the ~
Ureef-monitoring/cairns-sector-2019). lonisfail Ureef-monjtoring/ iooisfail-sector-2019).and Townsville ~
monitoring/ townsviUe-sector-2019) sectors. Hard coral cover has declined as a result (Figures 1, 5 C, D).
https:/fwww.alms.gov.au/reef-monitoring/gbr-condition-summary-2018-2012 9 9
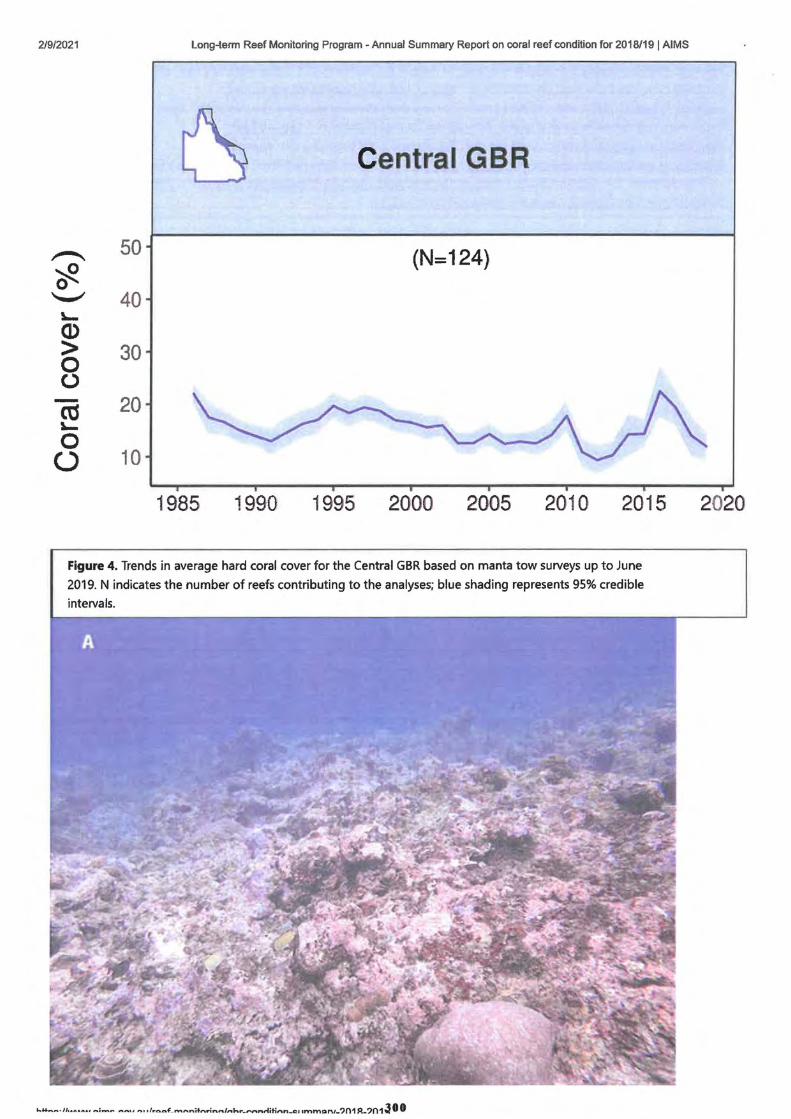
2/9/2021 Long-term Reef Monitoring Program - Annual Summary Report on coral reef condition for 2018/191 AIMS
Central GBR
.,,-..... 50 (N=124) ~ 0 "-"' 40 ~
Cl) > 30 0 0 - 20 Cd ~
0 (.) 10
1985 1990 1995 2000 2005 2010 2015
Figure 4. Trends in average hard coral cover for the Central GBR based on manta tow surveys up to June
2019. N indicates the number of reefs contributing to the analyses; blue shading represents 95% credible
intervals.
2020
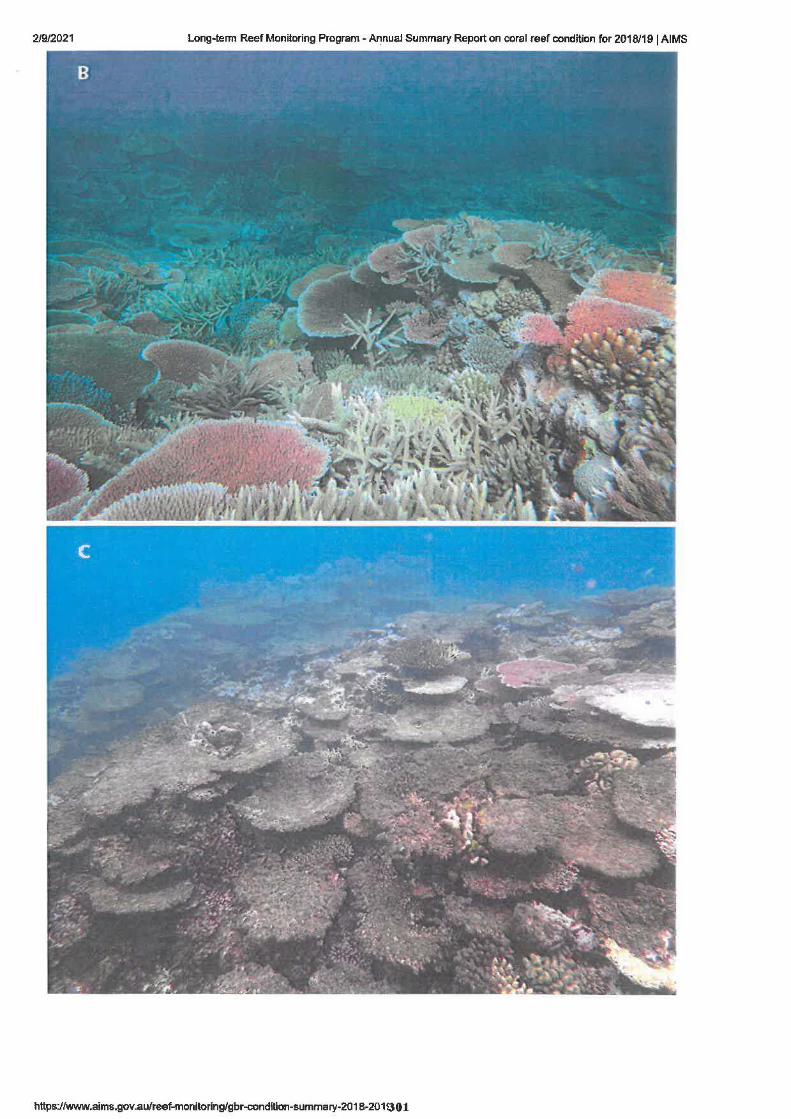
2/9/2021 Long-term Reef Monitoring Program • Annual Summary Report on coral reef condition for 2018/19 I AIMS
https:/fwww.aims.gov.au/reef-monitorlng/gbr-condlllon-summary-2018-2011301
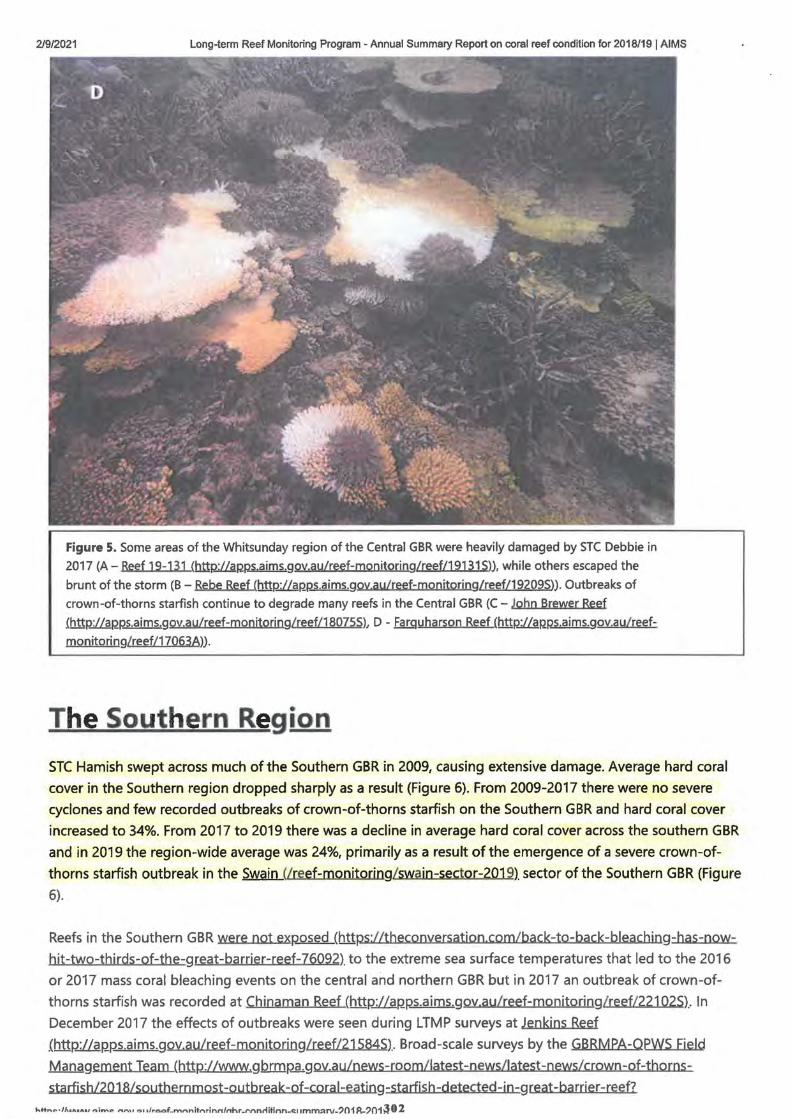
2/9/2021 Long-term Reef Monitoring Program - Annual Summary Report on coral reef condition for 2018/19 I AIMS
Figure 5. Some areas of the Whitsunday region of the Central GBR were heavily damaged by STC Debbie in
2017 (A-Reef 19-131 (bnJtiLspps.aims,goy,au/reef-monitoring/reef/19131S}). while others escaped the
brunt of the storm (B - Rebe Reef (http://a1:;,ps.aims.g0v.au/reef-monjtoring/reef/19209S)). Outbreaks of
crown-of-thorns starfish continue to degrade many reefs in the Central GBR (C - John Brewer Reef
{http://apps.aims.gov.au/reef-monjtoring/reef/18075S), D - Farguharson Reef (httP.:llaIws,aims.gov.au/reef
monitoring/reef/17063A)).
The Southern Region
STC Hamish swept across much of the Southern GBR in 2009, causing extensive damage. Average hard coral
cover in the Southern region dropped sharply as a result (Figure 6). From 2009-2017 there were no severe
cyclones and few recorded outbreaks of crown-of-thorns starfish on the Southern GBR and hard coral cover
increased to 34%. From 2017 to 2019 there was a decline in average hard coral cover across the southern GBR
and in 2019 the region-wide average was 24%, primarily as a result of the emergence of a severe crown-of
thorns starfish outbreak in the Swain Ureef-monjtorjng/ swajn-sector-201 9). sector of the Southern GBR {Figure
6).
Reefs in the Southern GBR were not ex~(https://theconversatjon.com/back-to-back-bleaching-has-now
hit-two-thirds-of-the-great-barrier-reef-76092)_ to the extreme sea surface temperatures that led to the 2016
or 2017 mass coral bleaching events on the central and northern GBR but in 2017 an outbreak of crown-of
thorns starfish was recorded at Chinaman Reef (htt12://a12ps.aims.gov.au/reef-monitoring/reef/22102S) .. In
December 2017 the effects of outbreaks were seen during LTMP surveys at Jenkins Reef
_(http;ligpP-s,aims.gov.au/reef-monitoring/reef/21584S)_. Broad-scale surveys by the GBRMPA-OPWS Field
Management Team (bnp:/lwww.gbrmRs,,gov.au/news-room/latest-news/latest-news/crown-of-thorns
starfish/2018/southern m ost-o utbrea k-of-cora 1-eati ng-sta rfis b-detected-i o-g reat-ba rrjer-reef? ht+ .... r-•/1...,,.,.,u, oi""'-~ nnu 011/r60.f_mnnitnrinn/nhr...t"'!nnrtitinn-~11mm::1rv-?01R-?01J02
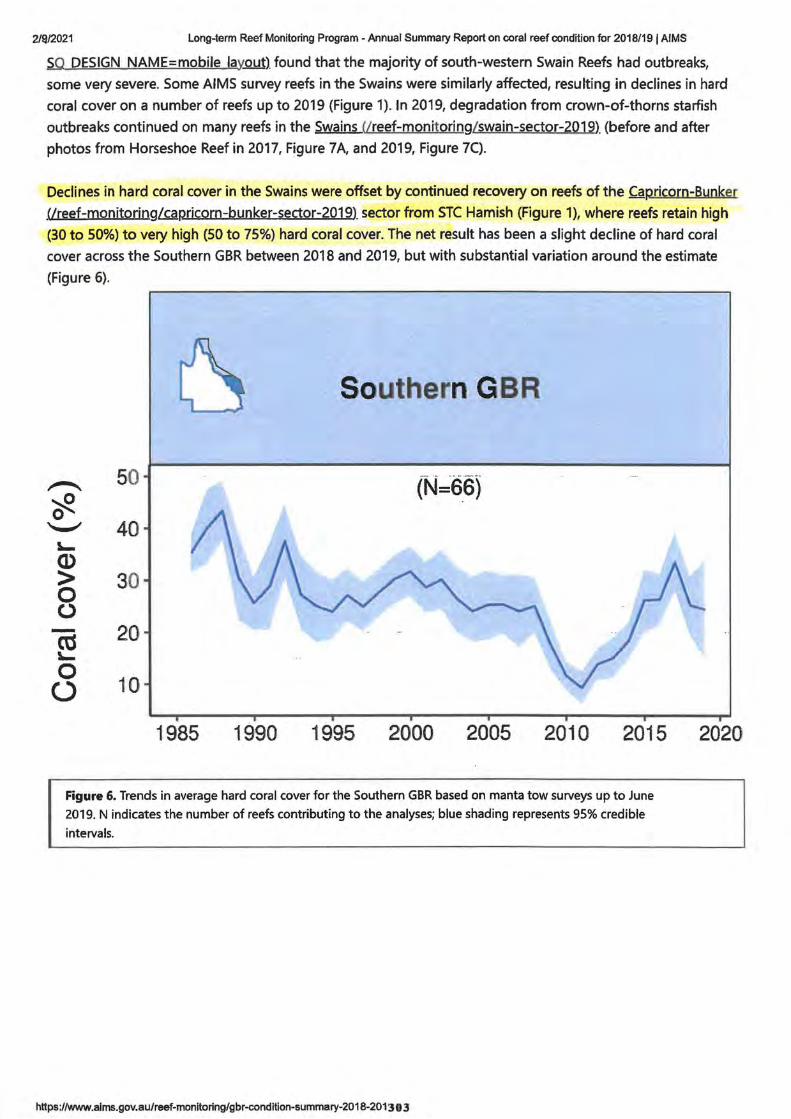
2/Q/2021 Long-term Reef Monitoring Program -Annual Summary Report on coral reef condition for 2018/191 AIMS
SQ DESIGN NAME=mobile layQY.t). found that the majority of south-western Swain Reefs had outbreaks,
some very severe. Some AIMS survey reefs in the Swains were similarly affected, resulting in declines in hard
coral cover on a number of reefs up to 2019 (Figure 1). In 2019, degradation from crown-of-thorns starfish
outbreaks continued on many reefs in the Swains Ureef-monitoring/swain-sector-2019) (before and after
photos from Horseshoe Reef in 2017, Figure 7A, and 2019, Figure 7().
Declines in hard coral cover in the Swains were offset by continued recovery on reefs of the Capricorn-Bunker
Ureef-monjtoringft_a,pricorn-bunker-sector-2019) sector from STC Hamish (Figure 1), where reefs retain high
(30 to 50%) to very high (50 to 75%) hard coral cover. The net result has been a slight decline of hard coral
cover across the Southern GBR between 2018 and 2019, but with substantial variation around the estimate
(Figure 6).
Southern GBR
.,,--.._ 50 (N=66) ~ 0 "--"' 40
11... Q) > 30 0 0 - 20 ro 11... 0
10 0
1985 1990 1995 2000 2005 2010 2015
Figure 6. Trends in average hard coral cover for the Southern GBR based on manta tow surveys up to June
2019. N indicates the number of reefs contributing to the analyses; blue shading represents 95% credible
intervals.
https://Www.alms.gov.au/reef-monitoring/gbr-condltion-summary-2018-2013 o 3
2020
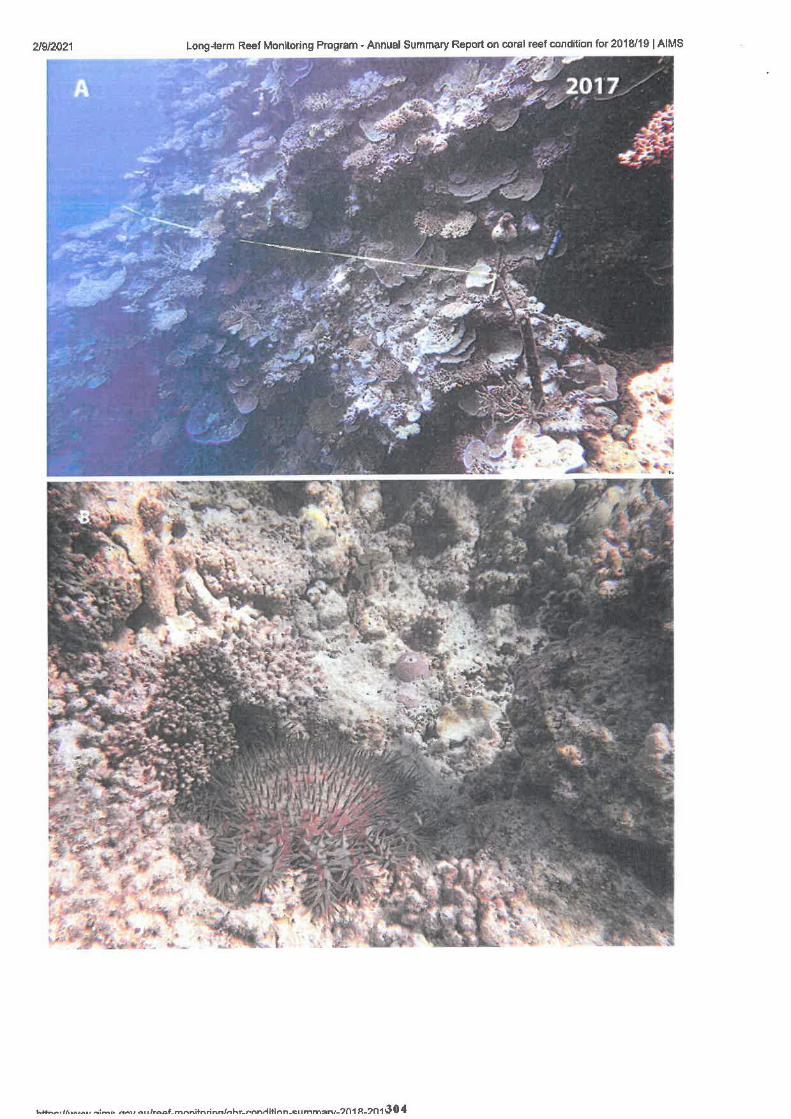
2/9/2021 Long-term Reef Monitoring Program • Annual Summary Report on coral reef condition for 2018/19 I AIMS
s.,.,_,t,,, ,,_,.,..,,,,.,, .,,:"".,, ,.,..__,, ~1 ,Jrat::1,.f _mnnit,-,.rinn/nhr_,..nn.rtitinn_.c:11mm::::11n.o-?n1 R-?n1~04
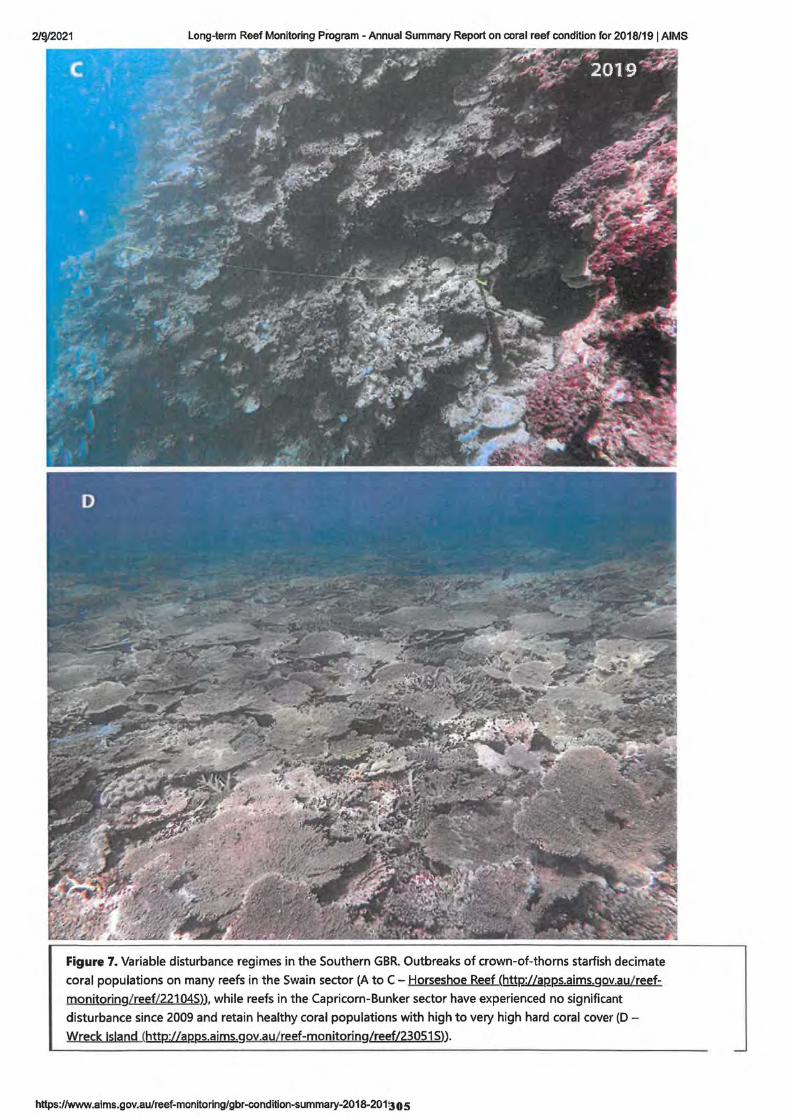
21W2021 Long-term Reef Monitoring Program -Annual Summary Report on coral reef condition for 2018/191 AIMS
Figure 7. Variable disturbance regimes in the Southern GBR. Outbreaks of crown-of-thorns starfish decimate
coral populations on many reefs in the Swain sector (A to C - Horseshoe Reef (httftiaP-P-S.aims.gov.au/ reef
monitoring/ reef/22104S)), while reefs in the Capricorn-Bunker sector have experienced no significant
disturbance since 2009 and retain healthy coral populations with high to very high hard coral cover (D -
Wreck !stand (http://aP-J;!s,ajms,gov.au/ reef-monitoring/reef/23051 S)).
https://www.aims.gov.au/reef-monitoring/gbr-condition-summary-2018-201 !] o 5
2/9/2021 Long-term Reef Monitoring Program - Annual Summary Report on coral reef condition for 2018/191 AIMS
Assessing the long-term health of the Great Barrier Reef
The GBR has been subjected to a period of intense disturbance activity in the last five years. A fourth wave of
crown-of-thorns starfish, coupled with a cluster of severe tropical cyclones and major bleaching events have
caused widespread coral declines on a spatial scale which is unparalleled in the history of LTMP surveys. Over
the 30+ years of monitoring by AIMS, GBR reefs have shown their ability to recover after disturbances, but
such 'resilience' clearly has limits. The predicted consequences of climate change include more powerful
storms and more frequent, more intense mass coral bleaching events. More intense disturbances result in
greater damage to reefs, so recovery must take longer even if the growth rate remains the same. At the same
time, chronic stressors such as high turbidity (httP-:l/www.nature.com/artides/sreP-44101), higher ocean
temperatures (https://online!ibrary.wiley.com/doi/10, 1111 /gcb.13707). and changing ocean chemistry can all
negatively affect rates of recovery, while more frequent acute disturbances mean that the intervals for
recovery are becoming shorter.
The geographic scale of recent mass coral bleaching and crown-of-thorns starfish outbreaks means that
breeding_populatjons of corals (b...ttps://www.nature.com/articles/s41586-019-1081-y?stream=sdence). have
been decimated over large areas, reducing the potential sources of larvae to recolonise reefs in the near
future.
Hard coral cover in the Northern and Central GBR continues to be close to, or at, the lowest levels recorded in
the 30+ years of the LTMP. Reefs in the Southern GBR have moderate hard coral cover but have limited
genetic connection (bnps://oolioelibrarywiley.com/doi/pdf/10.1111/mec.13649). to reefs further north. This
limits their capacity to serve as a major source of coral larvae to support reef recovery elsewhere.
The prognosis of more frequent disturbances, each causing greater damage to reefs, combined with slower
rates of recovery will inevitably lead to less living coral on reefs of the GBR.
Measuring and understanding the process of coral reef recovery will be a major focus of AIMS' research and
monitoring over the next years.
Enquiries and further information
Dr Mike Emslie
Acting Team Leader, Long Term Monitoring Program
Email: [email protected] (mailto:[email protected]).
This report is available for download (~) (lsites/default/ files/ Sbd92d3f-a313-4ecc-943e
de8f2a212cd6).
littmd/www ,iim!>. nnv ,i11/rP.P.f-mnnilorina/abr-condition-summarv-2018-201110 6
2/8/2021 Long-term Reef Monitoring Program - Annual Summary Report on coral reef condition for 2018/191 AIMS
000@0 .(httP-s://twjtfe~t-iuffu ... Mti1!Jt M !WMfflr•~aompinpejc
About Us (!docs/about/about.html). Research (!docs/research/research.html) Data I/docs/data/data.html).
Media (/docs/media/media.html). Publications (Lpubtications.html) Contact (!docs/about/contacts.html).
Newsletter (LwayP-oint.html)_
FOi Disclosure (ldocs/publications/foi-01-statement.html) Information Publication Scheme (lips)
Public Interest Disclosure scheme (/pid) Attributing AIMS (!docs/cc-attribution.html)
Copyright Notice (/docs/cc-copyright.html) Disclaimer (/docs/disclaimer.html)
Privacy Policy (/docs/privacy-policy.html)
© 1996-2021 Australian Institute of Marine Science IC~ ■f
https://www.aims.gov.aulreef-monltoring/gbr-condllion-summary-2018-2011307

303
Section H:
Local Inshore Corals
309

3111
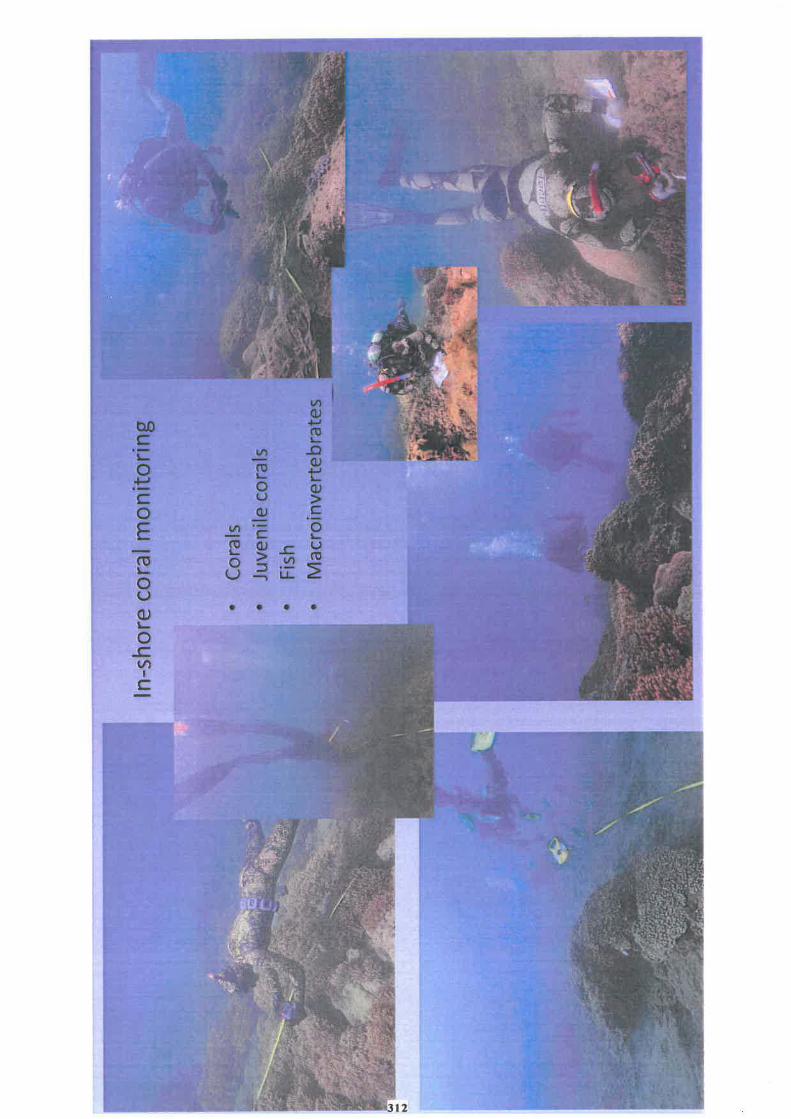
Vl (l)
tl.O C
+-'
·-ro
s,_
0 V')
t....
..0
+-' ro (l)
·-L.
C 0
t: u (l)
> 0 Cl) C ·-E V'I C
0
C'O ro OJ
,,_ L. ..c. u
L-0 >
0 ::J
V') ro u ~ Ll.. ~
u (lJ ~
• • • • 0 .c
V') I
C
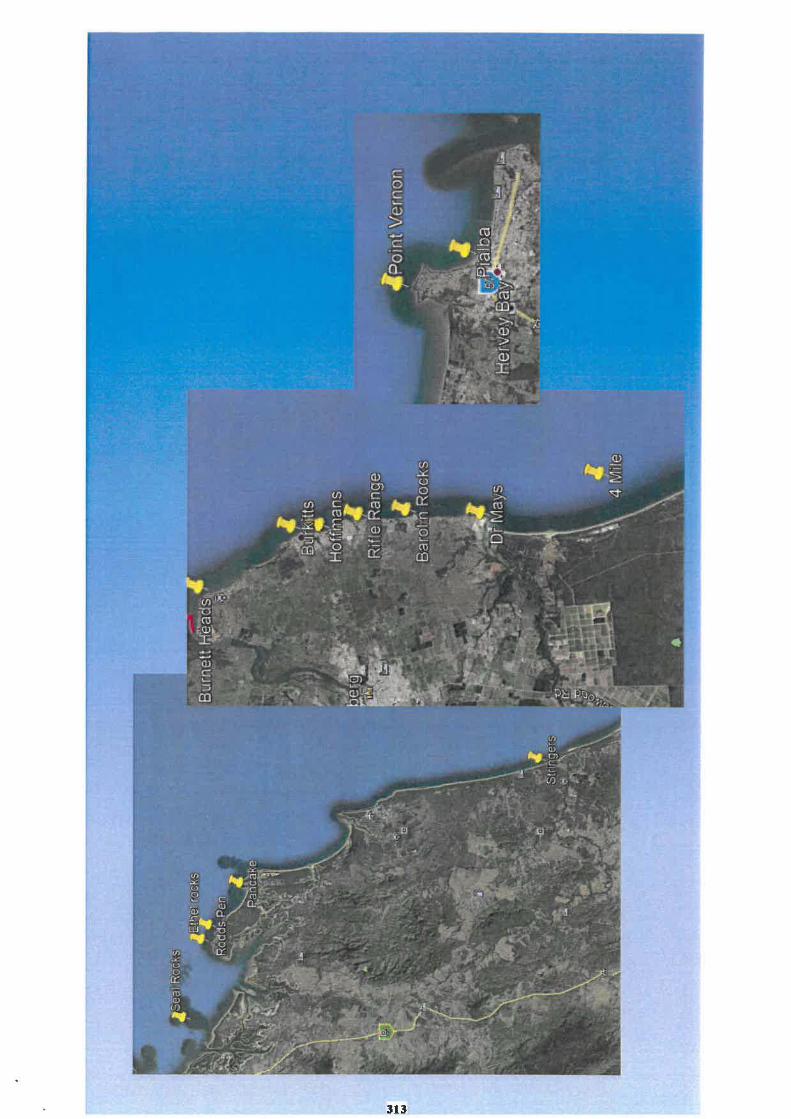
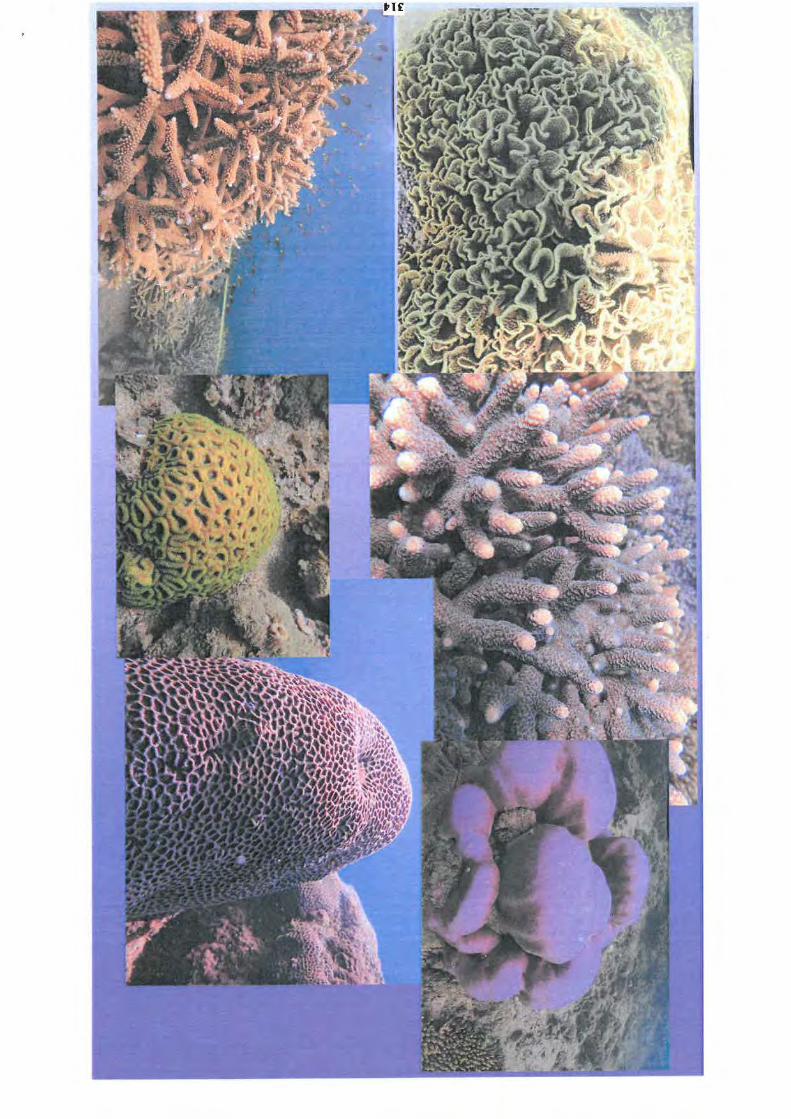
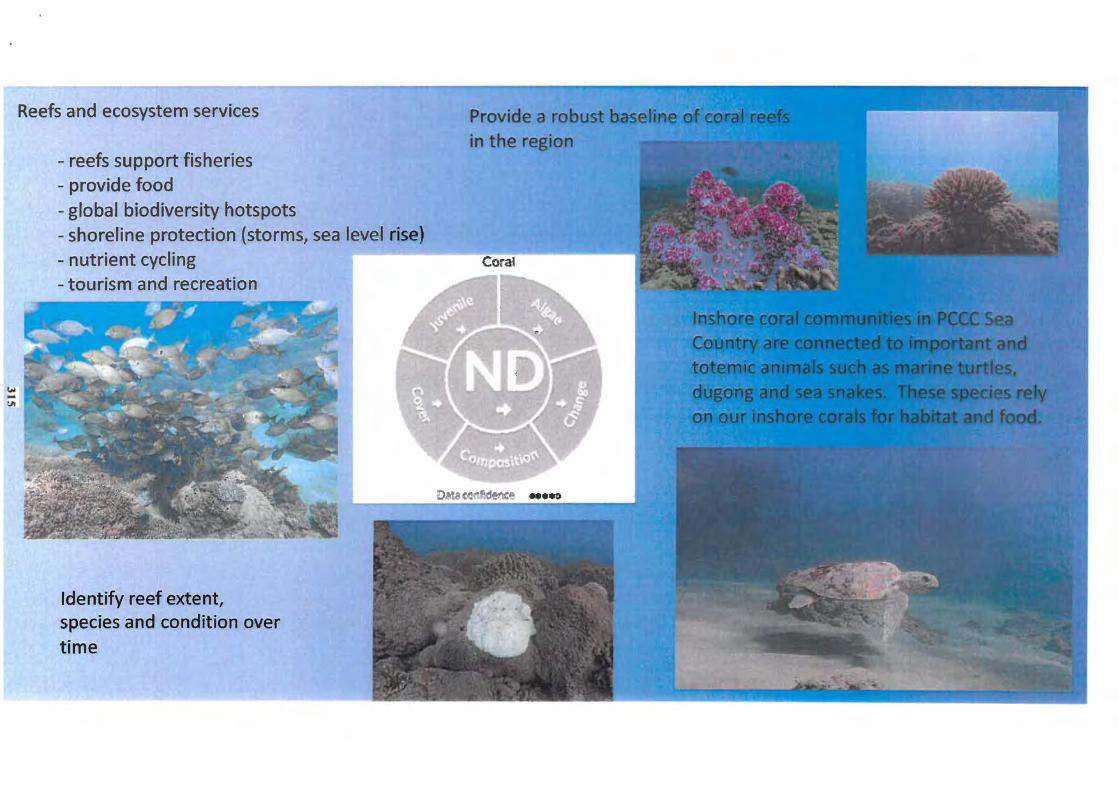
... ... u,
Reefs and ecosystem services
- reefs support fisheries - provide food - global biodiversity hotspots - shoreline protection (storms, sea level rise) - nutrient cycling - tourism and recreation
Identify reef extent, species and condition over time
Coral
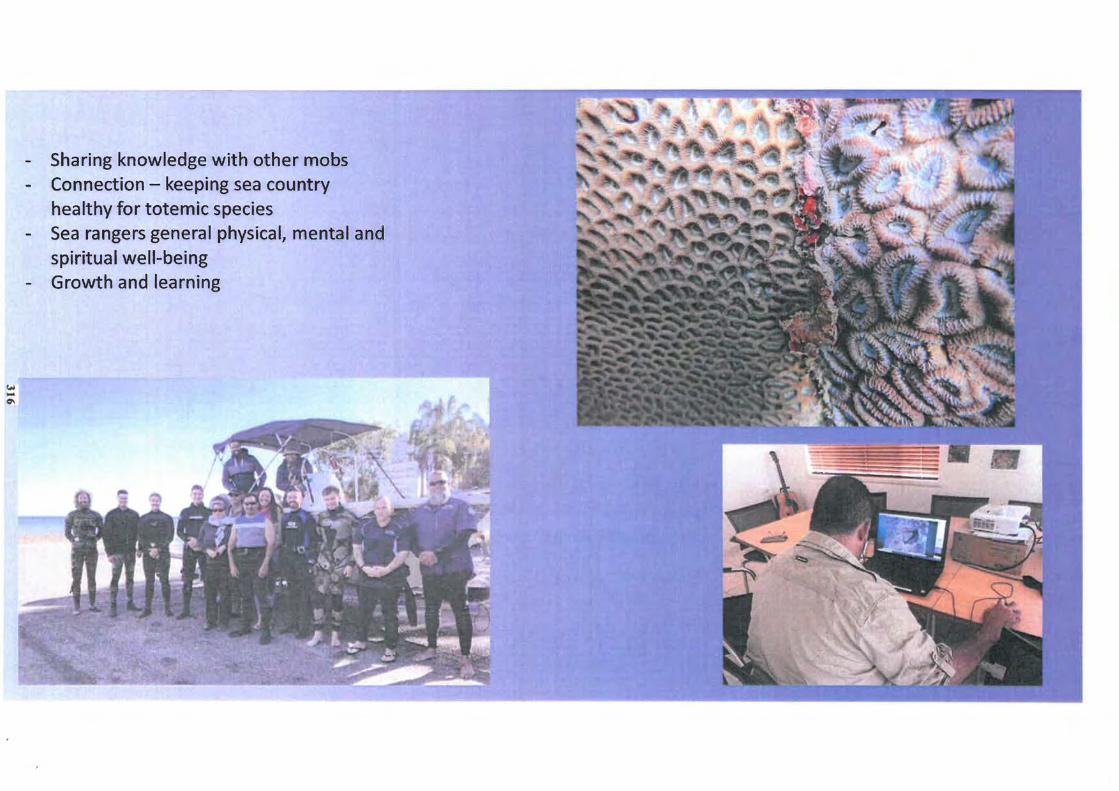
- Sharing knowledge with other mobs - Connection - keeping sea country
healthy for totemic species - Sea rangers general physical, mental and
spiritual well-being - Growth and learning
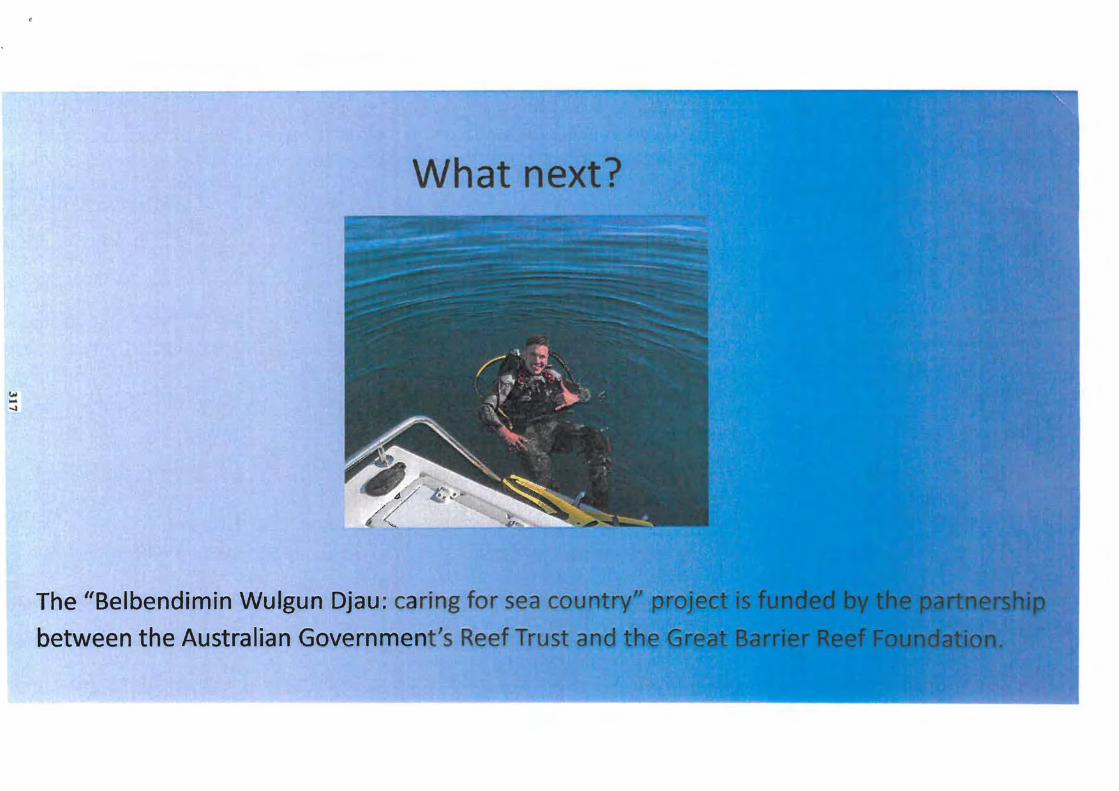
What next?
The "Belbendimin Wulgun Djau: caring for sea coun ry
between the Australian Government's Reef Trust an

ns