samarium(iii) and praseodymium(iii) biosorption on sargassum sp.: batch study
TRANSCRIPT
This article appeared in a journal published by Elsevier. The attachedcopy is furnished to the author for internal non-commercial researchand education use, including for instruction at the authors institution
and sharing with colleagues.
Other uses, including reproduction and distribution, or selling orlicensing copies, or posting to personal, institutional or third party
websites are prohibited.
In most cases authors are permitted to post their version of thearticle (e.g. in Word or Tex form) to their personal website orinstitutional repository. Authors requiring further information
regarding Elsevier’s archiving and manuscript policies areencouraged to visit:
http://www.elsevier.com/copyright
Author's personal copy
Process Biochemistry 46 (2011) 736–744
Contents lists available at ScienceDirect
Process Biochemistry
journa l homepage: www.e lsev ier .com/ locate /procbio
Samarium(III) and praseodymium(III) biosorption on Sargassum sp.: Batch study
Robson C. Oliveiraa,∗, Claire Jouanninb, Eric Guibalb, Oswaldo Garcia Jr. a
a Departamento de Bioquímica e Tecnologia Química, Instituto de Química, UNESP – Univ Estadual Paulista, Rua Prof. Francisco Degni, s/n, C. P. 14800-900, Araraquara, SP, Brazilb Laboratoire Génie de l’Environnement Industriel, Ecole des Mines d’Alès (EMA), 6, avenue de Clavières, F-30319 Alès Cedex, France
a r t i c l e i n f o
Article history:Received 24 September 2010Received in revised form 9 November 2010Accepted 25 November 2010
Keywords:Sargassum sp.BiosorptionPhysicochemical modelingSamariumPraseodymiumSelectivity
a b s t r a c t
This work evaluates the potential of a Sargassum biomass for the biosorption of Sm(III) and Pr(III) usingsynthetic solutions. Under selected experimental conditions (excess of sorbent), the biosorption kineticswere fast: 30–40 min were sufficient for the complete recovery of the metals. The kinetic profiles weremodeled using the pseudo-second order rate equation. The second objective of this study was to evaluatethe possibility to separate these metals. Biosorption isotherms and uptake kinetics for the two metals (inbinary component solutions) were almost overlapped. The biomass did not show significant selectivityfor any of these two metals, in batch reactor.
© 2010 Elsevier Ltd. All rights reserved.
1. Introduction
The recovery of heavy metals removal from dilute aqueoussystems has required the development of new technologies fortheir concentration and separation [1,2]. Biosorption is a promis-ing biotechnological alternative to conventional physicochemicalprocesses such as: chemical precipitation, electrochemical sepa-ration, membrane separation, reverse osmosis, ion-exchange oradsorption resins [3–6]. Conventional methods involve either cap-ital or high operational costs. They can also be associated toproduction of secondary residues that may cause environmentalhazards or complexity in treatment or valorization [6,7]. The ini-tial incentives for biosorption development in industrial processare the low cost of biosorbents, their high efficiency for metalremoval (especially in low-concentration solutions), the biosor-bent regeneration (and the potential metal recovery), the fastkinetics of adsorption and desorption, and the non-generation ofsecondary residues (or at least their limited environmental impact)[8].
Biosorption is a term that describes metal removal by passivebinding in living and dead biomass from aqueous solutions in amechanism that is not controlled by metabolic steps. The metallinkage is based on the chemical properties of the cellular enve-lope without requiring biologic activity [9–11]. The process occursthrough interactions between metal species and actives sites (car-
∗ Corresponding author.E-mail addresses: [email protected], [email protected] (R.C. Oliveira),
[email protected] (E. Guibal).
boxyl, amino, sulfate, etc.) present on the cell wall [12]. Deadbiomass is generally preferred since it limits the toxicity effectsof heavy metals (which may accumulate at the surface of cell wallsand/or in the cytoplasm) and the necessity to provide nutrients[2,13,14]. Alternatively, other biomaterials can be used for thesepurposes as biopolymers, activated sludge, agriculture wastes, etc.[15].
The mechanisms involved in metal accumulation on biosorp-tion sites are numerous and their interpretation is made difficultthe complexity of the biologic systems (presence of various reac-tive groups, interactions between the compounds, etc.). However,in most cases, metal binding proceeds through electrostatic interac-tion, surface complexation, ion-exchange, and precipitation, whichcan occur individually or combined [5,16].
Sargassum sp. biomass used in this work belongs to Phaeophytagroup (brown seaweed). This alga is very abundant on the coastsof Brazil, Cuba, Australia, USA, and Asian Southeast [17]. Generallythe cellular walls of Phaeophyta are constituted of a fibrillar skeletonand an amorphous matrix. The outer layer is an amorphous matrixthat is linked to the fibrillar skeleton (mainly cellulose) via hydro-gen bonding. The amorphous matrix is predominately formed byalginate, besides little amounts of fucoidan have been identified[18]. The alginate contributes to cellular wall resistance and flexibil-ity [18,19]. Alginate carboxyl groups are the most abundant acidicgroups (involved in metal binding): they represent approximately70% of the titrated sites. The biosorption uptake is directly asso-ciated to the presence of carboxyl groups in the alginate polymer.The second functional group of the brown seaweed is constitutedof sulfonic acid, present in the fucoidan: these groups may also con-tribute to biosorption [18]. Numerous studies have recently focused
1359-5113/$ – see front matter © 2010 Elsevier Ltd. All rights reserved.doi:10.1016/j.procbio.2010.11.021
Author's personal copy
R.C. Oliveira et al. / Process Biochemistry 46 (2011) 736–744 737
on the use of Sargassum biomass for the binding of several metalsincluding Ni(II) [20], Cu(II) [21,22], and Zn(II) [23].
The group of rare earth metals (REs) comprises scandium,yttrium, and lanthanide series. The RE application fields are exten-sive, as a consequence of their peculiar spectroscopic and magneticproperties [23]. REs are of major interest for the development ofseveral disciplines: coordination chemistry, organometallic com-pounds, luminescent compounds, catalysis, solid state chemistry,analytical and environmental chemistry, industrial applications,biology, and medicine. These metals are essential for man-ufacturing products such as lasers, superconductors, crackingcatalysts for petroleum, miniaturized equipments, fluorescentslamps, satellites, phosphorus, ultraviolet radiation absorbers, per-manent magnets, and electronic information storages [24,25].
Although REs are very abundant in the Nature, they present highmarket values due to expensive and complex processes for theirseparation and purification from mixtures because of their chem-ical similarities. These processes involve several steps of solventextraction and/or ion-exchange resins, both with high costs [12,17].The RE chemical similarities result from their electronic configura-tions: the trivalent state is the more stable thermodynamically inaqueous solution. Each lanthanide element has in its electronic con-figuration an inner shell with electrons in the 4fn orbital shieldedby an outer shell composed of electrons in orbitals 5s2, 5p6, 5d1–10,and 6s2. The differences among lanthanides elements are caused byelectrostatic effect associated with the increase of shielded nuclearcharge through electrons partial supply of 4f orbital (which resultson lanthanide contraction of atomic and ionic radius along lan-thanide series). This contraction is responsible for low differenceson lanthanide chemical properties that allow metals separation byfractionating methods [23]. Only a few countries and multinationalcorporations have the complete technology for separation processof RE at industrial scale. For this reason despite their abundance,these metals have a considerable strategic value [25].
RE trivalent ions (Pearson hard acids: alkaline ions, alkalineearth ions, high oxidation state ions, species with low electronega-tivity and small size) tend to readily react with oxygen, sulfur, andphosphorus atoms (Pearson hard bases: electron donors, with highelectronegativity and low polarizability), such as those found in thecarboxyl groups of the cell wall of algae. Thereby it is important toestablish the affinity differences among selected elements to pro-pose a process for lanthanide separation and purification throughbiosorption [13,26].
This study is structured in three parts: (a) acid–basecharacterization of the biomass (potentiometric titration), (b) char-acterization of the biosorption kinetics (for single and binarysolutions), and (c) determination of biosorption isotherms (for sin-gle and binary solutions). The final objective is to conclude onthe efficiency of Sargassum sp. biomass to recover and separatesamarium (Sm(III)) from praseodymium (Pr(III)) in dilute solutions.Previous investigation of REs biosorption on Sargassum biomasshave shown that pH 5 is a good compromise for the sorption of thesemetals ions [10], based on metal speciation, and the deprotonationof the carboxylic groups present at the surface of the biosorbent.Though very slight variations can be observed around this targetpH value for the different metal ions, selecting this pH facilitatesthe comparison of sorption behavior.
2. Materials and methods
2.1. Biomass pretreatment
Sargassum sp. biomass was collected on the coast of Rio Grande do Norte, Brazil.The biomass was grounded in a blender and the particles greater than 0.50 mm wereselected. The biomass was washed three times for 1 h with demineralized water.The biomass was protonated with two washings in 0.020 mol L−1 HCl solutions for1 h. The biosorbent was washed with demineralized water to remove the excess ofH3O+, until reaching a pH close to 5.0. Finally, the biomass was dried overnight at
50 ◦C. The slightly acidic washing contributes to stabilize the biomass and preventfurther leaching of organic compounds. In addition, this stabilization contributes toreduce pH variation that may occur during metal sorption. Strong pH variations maycause difficulties in the comparison of experimental results when different amountsof sorbent (which may interact with the solution through proton binding or protonrelease) are used. The conditions for acidic pre-treatment are soft enough to preventa degradation of the biosorbent.
2.2. Rare earth solutions
RE stock solutions were prepared from Sm(III) and Pr(III,IV) oxides (both AldrichChemical Company 99.9%). The metal oxides were burned off at 900 ◦C for 3 h.They were subsequently dissolved in small amounts of concentrated HCl underheating before being diluted with demineralized water until final concentration of∼5.0 g L−1. For these solutions, the RE concentrations were standardized by tripli-cate analysis using the complexometric titration with a standard solution of EDTA.The titration was carried out in buffer solution of acetate/acetic acid at pH 6.0 ± 0.2using xylenol orange as the titration indicator (prepared in ethanol/water solution).
For metal biosorption experiments, the solutions used were prepared from dilu-tions of stock solutions and pH adjustment to 5.0 ± 0.1 with diluted HCl or NaOHsolutions. The metal concentrations in both initial and withdrawn samples weredetermined by an Inductively Coupled Plasma Atomic Emission Spectrometer (ICP-AES JY 2000, Jobin-Yvon, Longjumeau, France). The ICP calibration was done utilizingRE standard solutions with three different concentrations and emission lines at359.260 and 414.311 nm for Sm(III) and Pr(III), respectively.
2.3. Batch experiments
The biosorption experiments in batch systems were carried out in flasks contain-ing 0.100 ± 0.020 g of biomass and 50 mL of RE solution for kinetics and isotherm,and 0.220 ± 0.040 g of biomass and 100 mL of RE solution for acid–base characteri-zation. The flasks were maintained under agitation at 150 rpm and temperature of20 ◦C (kinetics and isotherms) or 30 ◦C (acid–base characterization). All batch exper-iments were performed at least in triplicates. The calculation of the biosorptionuptake (q) is given by the mass balance equation, Eq. (1).
q = (C0 − CF )M
V (1)
where V (L) is the volume of metal solution in contact with the sorbent; C0 andCF (both in mmol L−1) are the initial and final concentrations of the metal in thesolution, respectively; and M (g) is the dry mass of the biosorbent.
2.4. Acid–base characterization of the biomass
The biomass was analyzed before and after metal biosorption. The pretreatedbiomass was protonated with HCl 0.10 mol L−1 (sorbent dosage, SD: 20.0 g L−1), at150 rpm and 20 ◦C for 1 h. The biomass was then filtered, washed with small vol-umes of demineralized water, and dried at 50 ◦C. The biosorption took place for 3 h.The initial metal concentrations of the RE solutions were 464 and 448 mg L−1 forSm(III) and Pr(III), respectively. After being loaded with target metals the biomasswas filtered, washed with small volumes of distilled water, and dried at 50 ◦C.
For each titration 0.200 ± 0.020 g of protonated or loaded biomass was dis-persed in flasks with 100 mL of 1.0 mmol L−1 NaCl solution. Titration was carriedout by addition of successive increments of standardized NaOH to the flask whilethe suspension was stirred under argon atmosphere. After each addition, the sys-tem was allowed to equilibrate until stable pH. The pH measurements were recordedusing a Corning 430 pH meter. Potentiometric titrations were performed at least intriplicates.
Each endpoint of the potentiometric titration curves pH = f (NaOH) correspondsto a binding site in which protons are removed from the acidic functional groups toreact with the hydroxyl ions added in solution. Thus, the acid dissociation constantof each functional group can be determined by the pKa obtained from equivalentpoints through the determination of inflexion points. These points are determinedplotting the first derivative curves of average pH titration data in function of themidpoint of successive amounts of NaOH added per mass of biomass (mmol g−1).Each maximum peak of the curve dpH/dV = f (NaOH) corresponds to an inflexionpoint of the potentiometric titration curves. This procedure is used for evaluatingthe number of acidic groups present at the surface of the biomass [27].
The number of strong acid groups is determined from the first peak of the deriva-tive curves while the total number of acid groups is determined from the final peak.The number of weak acid groups is then calculated by difference. The occupation ofbinding sites by metal ions after biosorption is calculated taking into account thetotal numbers of acid groups in the titration of biomass with and without metalbinding.
2.5. Biosorption kinetics
For uptake kinetics (in mono-component solutions) the initial metal concen-trations were 82 mg L−1 and 99 mg L−1 for Sm(III) and Pr(III), respectively. Foruptake kinetics in binary component solutions, the initial metal concentrations
Author's personal copy
738 R.C. Oliveira et al. / Process Biochemistry 46 (2011) 736–744
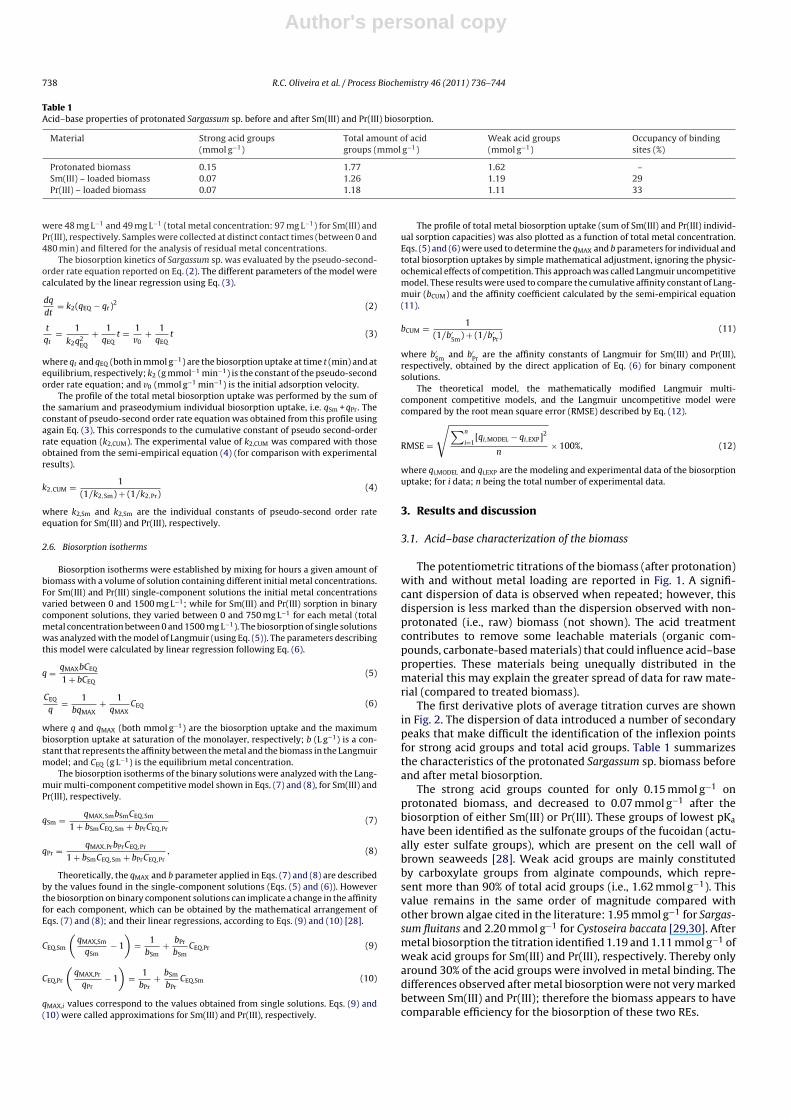
Table 1Acid–base properties of protonated Sargassum sp. before and after Sm(III) and Pr(III) biosorption.
Material Strong acid groups(mmol g−1)
Total amount of acidgroups (mmol g−1)
Weak acid groups(mmol g−1)
Occupancy of bindingsites (%)
Protonated biomass 0.15 1.77 1.62 –Sm(III) – loaded biomass 0.07 1.26 1.19 29Pr(III) – loaded biomass 0.07 1.18 1.11 33
were 48 mg L−1 and 49 mg L−1 (total metal concentration: 97 mg L−1) for Sm(III) andPr(III), respectively. Samples were collected at distinct contact times (between 0 and480 min) and filtered for the analysis of residual metal concentrations.
The biosorption kinetics of Sargassum sp. was evaluated by the pseudo-second-order rate equation reported on Eq. (2). The different parameters of the model werecalculated by the linear regression using Eq. (3).
dq
dt= k2(qEQ − qt )
2 (2)
t
qt= 1
k2q2EQ
+ 1qEQ
t = 1v0
+ 1qEQ
t (3)
where qt and qEQ (both in mmol g−1) are the biosorption uptake at time t (min) and atequilibrium, respectively; k2 (g mmol−1 min−1) is the constant of the pseudo-secondorder rate equation; and v0 (mmol g−1 min−1) is the initial adsorption velocity.
The profile of the total metal biosorption uptake was performed by the sum ofthe samarium and praseodymium individual biosorption uptake, i.e. qSm + qPr. Theconstant of pseudo-second order rate equation was obtained from this profile usingagain Eq. (3). This corresponds to the cumulative constant of pseudo second-orderrate equation (k2,CUM). The experimental value of k2,CUM was compared with thoseobtained from the semi-empirical equation (4) (for comparison with experimentalresults).
k2,CUM = 1(1/k2,Sm) + (1/k2,Pr)
(4)
where k2,Sm and k2,Sm are the individual constants of pseudo-second order rateequation for Sm(III) and Pr(III), respectively.
2.6. Biosorption isotherms
Biosorption isotherms were established by mixing for hours a given amount ofbiomass with a volume of solution containing different initial metal concentrations.For Sm(III) and Pr(III) single-component solutions the initial metal concentrationsvaried between 0 and 1500 mg L−1; while for Sm(III) and Pr(III) sorption in binarycomponent solutions, they varied between 0 and 750 mg L−1 for each metal (totalmetal concentration between 0 and 1500 mg L−1). The biosorption of single solutionswas analyzed with the model of Langmuir (using Eq. (5)). The parameters describingthis model were calculated by linear regression following Eq. (6).
q = qMAXbCEQ
1 + bCEQ(5)
CEQ
q= 1
bqMAX+ 1
qMAXCEQ (6)
where q and qMAX (both mmol g−1) are the biosorption uptake and the maximumbiosorption uptake at saturation of the monolayer, respectively; b (L g−1) is a con-stant that represents the affinity between the metal and the biomass in the Langmuirmodel; and CEQ (g L−1) is the equilibrium metal concentration.
The biosorption isotherms of the binary solutions were analyzed with the Lang-muir multi-component competitive model shown in Eqs. (7) and (8), for Sm(III) andPr(III), respectively.
qSm = qMAX,SmbSmCEQ,Sm
1 + bSmCEQ,Sm + bPrCEQ,Pr(7)
qPr = qMAX,PrbPrCEQ,Pr
1 + bSmCEQ,Sm + bPrCEQ,Pr, (8)
Theoretically, the qMAX and b parameter applied in Eqs. (7) and (8) are describedby the values found in the single-component solutions (Eqs. (5) and (6)). Howeverthe biosorption on binary component solutions can implicate a change in the affinityfor each component, which can be obtained by the mathematical arrangement ofEqs. (7) and (8); and their linear regressions, according to Eqs. (9) and (10) [28].
CEQ,Sm
(qMAX,Sm
qSm− 1
)= 1
bSm+ bPr
bSmCEQ,Pr (9)
CEQ,Pr
(qMAX,Pr
qPr− 1
)= 1
bPr+ bSm
bPrCEQ,Sm (10)
qMAX,i values correspond to the values obtained from single solutions. Eqs. (9) and(10) were called approximations for Sm(III) and Pr(III), respectively.
The profile of total metal biosorption uptake (sum of Sm(III) and Pr(III) individ-ual sorption capacities) was also plotted as a function of total metal concentration.Eqs. (5) and (6) were used to determine the qMAX and b parameters for individual andtotal biosorption uptakes by simple mathematical adjustment, ignoring the physic-ochemical effects of competition. This approach was called Langmuir uncompetitivemodel. These results were used to compare the cumulative affinity constant of Lang-muir (bCUM) and the affinity coefficient calculated by the semi-empirical equation(11).
bCUM = 1(1/b′
Sm) + (1/b′Pr)
(11)
where b′Sm and b′
Pr are the affinity constants of Langmuir for Sm(III) and Pr(III),respectively, obtained by the direct application of Eq. (6) for binary componentsolutions.
The theoretical model, the mathematically modified Langmuir multi-component competitive models, and the Langmuir uncompetitive model werecompared by the root mean square error (RMSE) described by Eq. (12).
RMSE =
√∑n
i=1[qi,MODEL − qi,EXP]2
n× 100%, (12)
where qi,MODEL and qi,EXP are the modeling and experimental data of the biosorptionuptake; for i data; n being the total number of experimental data.
3. Results and discussion
3.1. Acid–base characterization of the biomass
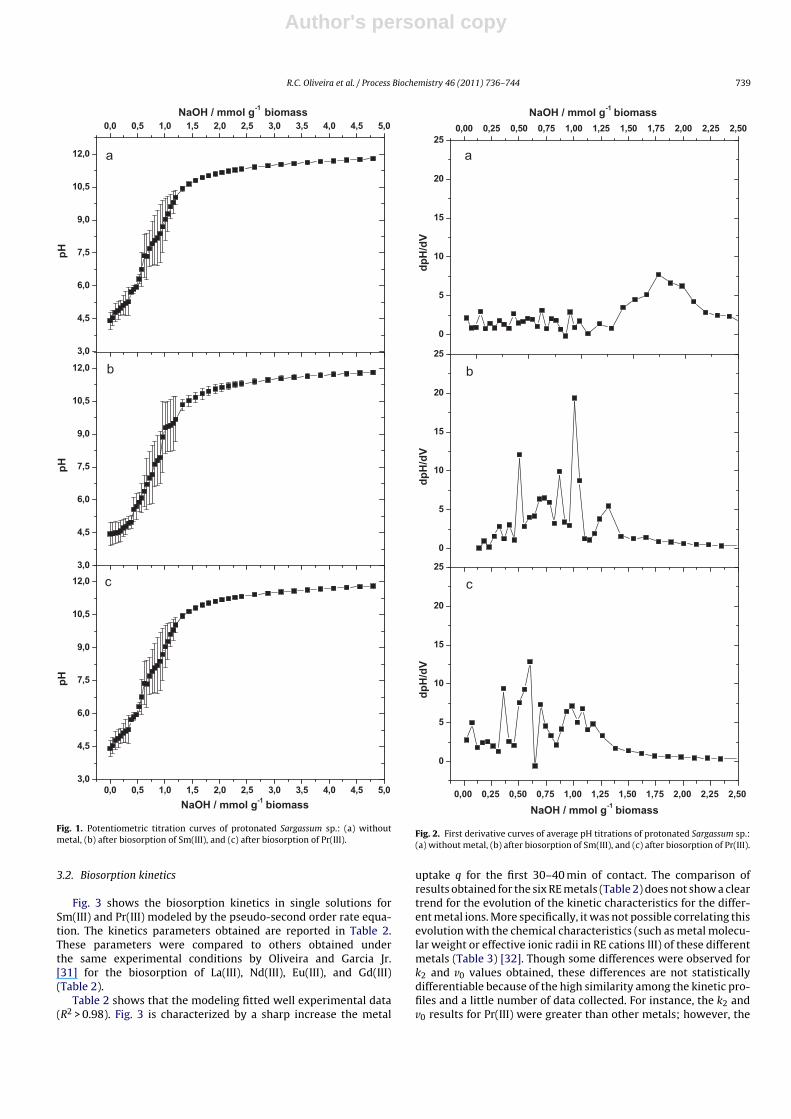
The potentiometric titrations of the biomass (after protonation)with and without metal loading are reported in Fig. 1. A signifi-cant dispersion of data is observed when repeated; however, thisdispersion is less marked than the dispersion observed with non-protonated (i.e., raw) biomass (not shown). The acid treatmentcontributes to remove some leachable materials (organic com-pounds, carbonate-based materials) that could influence acid–baseproperties. These materials being unequally distributed in thematerial this may explain the greater spread of data for raw mate-rial (compared to treated biomass).
The first derivative plots of average titration curves are shownin Fig. 2. The dispersion of data introduced a number of secondarypeaks that make difficult the identification of the inflexion pointsfor strong acid groups and total acid groups. Table 1 summarizesthe characteristics of the protonated Sargassum sp. biomass beforeand after metal biosorption.
The strong acid groups counted for only 0.15 mmol g−1 onprotonated biomass, and decreased to 0.07 mmol g−1 after thebiosorption of either Sm(III) or Pr(III). These groups of lowest pKa
have been identified as the sulfonate groups of the fucoidan (actu-ally ester sulfate groups), which are present on the cell wall ofbrown seaweeds [28]. Weak acid groups are mainly constitutedby carboxylate groups from alginate compounds, which repre-sent more than 90% of total acid groups (i.e., 1.62 mmol g−1). Thisvalue remains in the same order of magnitude compared withother brown algae cited in the literature: 1.95 mmol g−1 for Sargas-sum fluitans and 2.20 mmol g−1 for Cystoseira baccata [29,30]. Aftermetal biosorption the titration identified 1.19 and 1.11 mmol g−1 ofweak acid groups for Sm(III) and Pr(III), respectively. Thereby onlyaround 30% of the acid groups were involved in metal binding. Thedifferences observed after metal biosorption were not very markedbetween Sm(III) and Pr(III); therefore the biomass appears to havecomparable efficiency for the biosorption of these two REs.
Author's personal copy
R.C. Oliveira et al. / Process Biochemistry 46 (2011) 736–744 739
3,0
4,5
6,0
7,5
9,0
10,5
12,0
pH
a
b
c
0,0 0,5 1,0 1,5 2,0 2,5 3,0 3,5 4,0 4,5 5,03,0
4,5
6,0
7,5
9,0
10,5
12,0
pH
NaOH / mmol g-1 biomass
3,0
4,5
6,0
7,5
9,0
10,5
12,0
0,0 0,5 1,0 1,5 2,0 2,5 3,0 3,5 4,0 4,5 5,0
NaOH / mmol g-1 biomass
pH
Fig. 1. Potentiometric titration curves of protonated Sargassum sp.: (a) withoutmetal, (b) after biosorption of Sm(III), and (c) after biosorption of Pr(III).
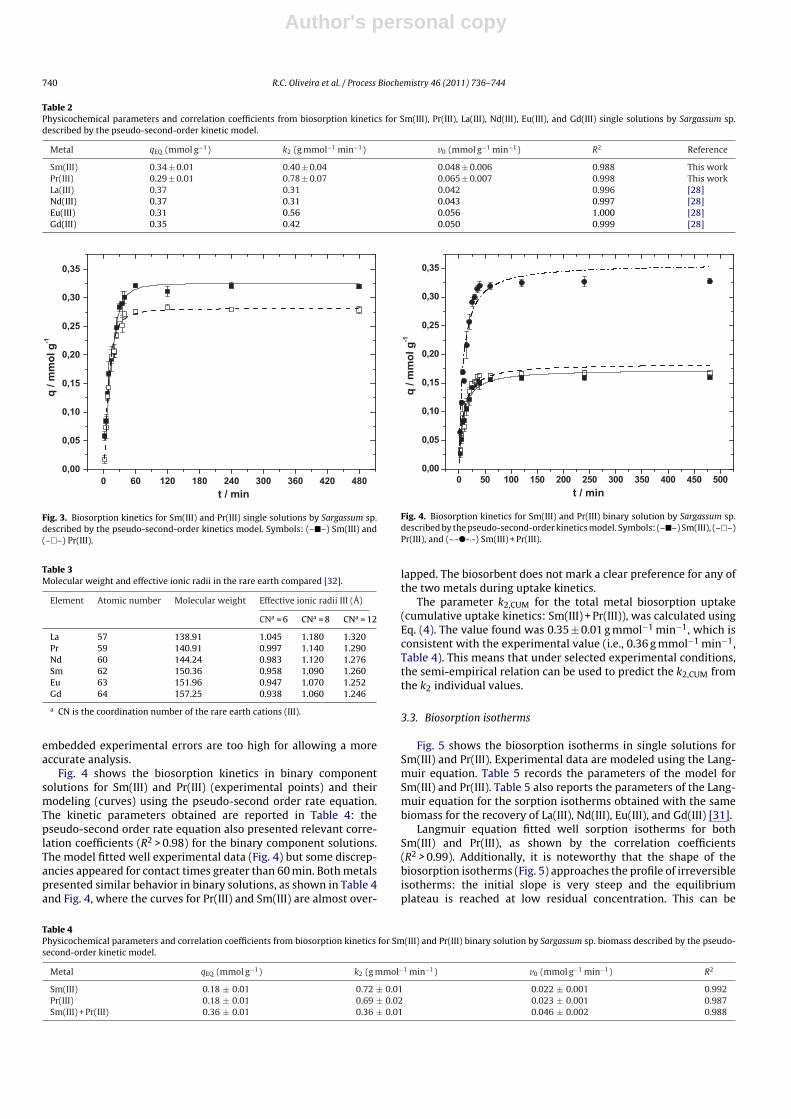
3.2. Biosorption kinetics
Fig. 3 shows the biosorption kinetics in single solutions forSm(III) and Pr(III) modeled by the pseudo-second order rate equa-tion. The kinetics parameters obtained are reported in Table 2.These parameters were compared to others obtained underthe same experimental conditions by Oliveira and Garcia Jr.[31] for the biosorption of La(III), Nd(III), Eu(III), and Gd(III)(Table 2).
Table 2 shows that the modeling fitted well experimental data(R2 > 0.98). Fig. 3 is characterized by a sharp increase the metal
0
5
10
15
20
25
dp
H/d
V
2,502,252,001,751,501,251,000,750,500,250,00
0
5
10
15
20
25
dp
H/d
V
NaOH / mmol g-1 biomass
0
5
10
15
20
250,00 0,25 0,50 0,75 1,00 1,25 1,50 1,75 2,00 2,25 2,50
NaOH / mmol g-1 biomass
dp
H/d
V
a
c
b
Fig. 2. First derivative curves of average pH titrations of protonated Sargassum sp.:(a) without metal, (b) after biosorption of Sm(III), and (c) after biosorption of Pr(III).
uptake q for the first 30–40 min of contact. The comparison ofresults obtained for the six RE metals (Table 2) does not show a cleartrend for the evolution of the kinetic characteristics for the differ-ent metal ions. More specifically, it was not possible correlating thisevolution with the chemical characteristics (such as metal molecu-lar weight or effective ionic radii in RE cations III) of these differentmetals (Table 3) [32]. Though some differences were observed fork2 and v0 values obtained, these differences are not statisticallydifferentiable because of the high similarity among the kinetic pro-files and a little number of data collected. For instance, the k2 andv0 results for Pr(III) were greater than other metals; however, the
Author's personal copy
740 R.C. Oliveira et al. / Process Biochemistry 46 (2011) 736–744
Table 2Physicochemical parameters and correlation coefficients from biosorption kinetics for Sm(III), Pr(III), La(III), Nd(III), Eu(III), and Gd(III) single solutions by Sargassum sp.described by the pseudo-second-order kinetic model.
Metal qEQ (mmol g−1) k2 (g mmol−1 min−1) v0 (mmol g−1 min−1) R2 Reference
Sm(III) 0.34 ± 0.01 0.40 ± 0.04 0.048 ± 0.006 0.988 This workPr(III) 0.29 ± 0.01 0.78 ± 0.07 0.065 ± 0.007 0.998 This workLa(III) 0.37 0.31 0.042 0.996 [28]Nd(III) 0.37 0.31 0.043 0.997 [28]Eu(III) 0.31 0.56 0.056 1.000 [28]Gd(III) 0.35 0.42 0.050 0.999 [28]
4804203603002401801206000,00
0,05
0,10
0,15
0,20
0,25
0,30
0,35
q /
mm
ol g
-1
t / min
Fig. 3. Biosorption kinetics for Sm(III) and Pr(III) single solutions by Sargassum sp.described by the pseudo-second-order kinetics model. Symbols: (–�–) Sm(III) and(–�–) Pr(III).
Table 3Molecular weight and effective ionic radii in the rare earth compared [32].
Element Atomic number Molecular weight Effective ionic radii III (A)
CNa = 6 CNa = 8 CNa = 12
La 57 138.91 1.045 1.180 1.320Pr 59 140.91 0.997 1.140 1.290Nd 60 144.24 0.983 1.120 1.276Sm 62 150.36 0.958 1.090 1.260Eu 63 151.96 0.947 1.070 1.252Gd 64 157.25 0.938 1.060 1.246
a CN is the coordination number of the rare earth cations (III).
embedded experimental errors are too high for allowing a moreaccurate analysis.
Fig. 4 shows the biosorption kinetics in binary componentsolutions for Sm(III) and Pr(III) (experimental points) and theirmodeling (curves) using the pseudo-second order rate equation.The kinetic parameters obtained are reported in Table 4: thepseudo-second order rate equation also presented relevant corre-lation coefficients (R2 > 0.98) for the binary component solutions.The model fitted well experimental data (Fig. 4) but some discrep-ancies appeared for contact times greater than 60 min. Both metalspresented similar behavior in binary solutions, as shown in Table 4and Fig. 4, where the curves for Pr(III) and Sm(III) are almost over-
0 50 100 150 200 250 300 350 400 450 5000,00
0,05
0,10
0,15
0,20
0,25
0,30
0,35
q /
mm
ol g
-1
t / min
Fig. 4. Biosorption kinetics for Sm(III) and Pr(III) binary solution by Sargassum sp.described by the pseudo-second-order kinetics model. Symbols: (–�–) Sm(III), (–�–)Pr(III), and (-·-�-·-) Sm(III) + Pr(III).
lapped. The biosorbent does not mark a clear preference for any ofthe two metals during uptake kinetics.
The parameter k2,CUM for the total metal biosorption uptake(cumulative uptake kinetics: Sm(III) + Pr(III)), was calculated usingEq. (4). The value found was 0.35 ± 0.01 g mmol−1 min−1, which isconsistent with the experimental value (i.e., 0.36 g mmol−1 min−1,Table 4). This means that under selected experimental conditions,the semi-empirical relation can be used to predict the k2,CUM fromthe k2 individual values.
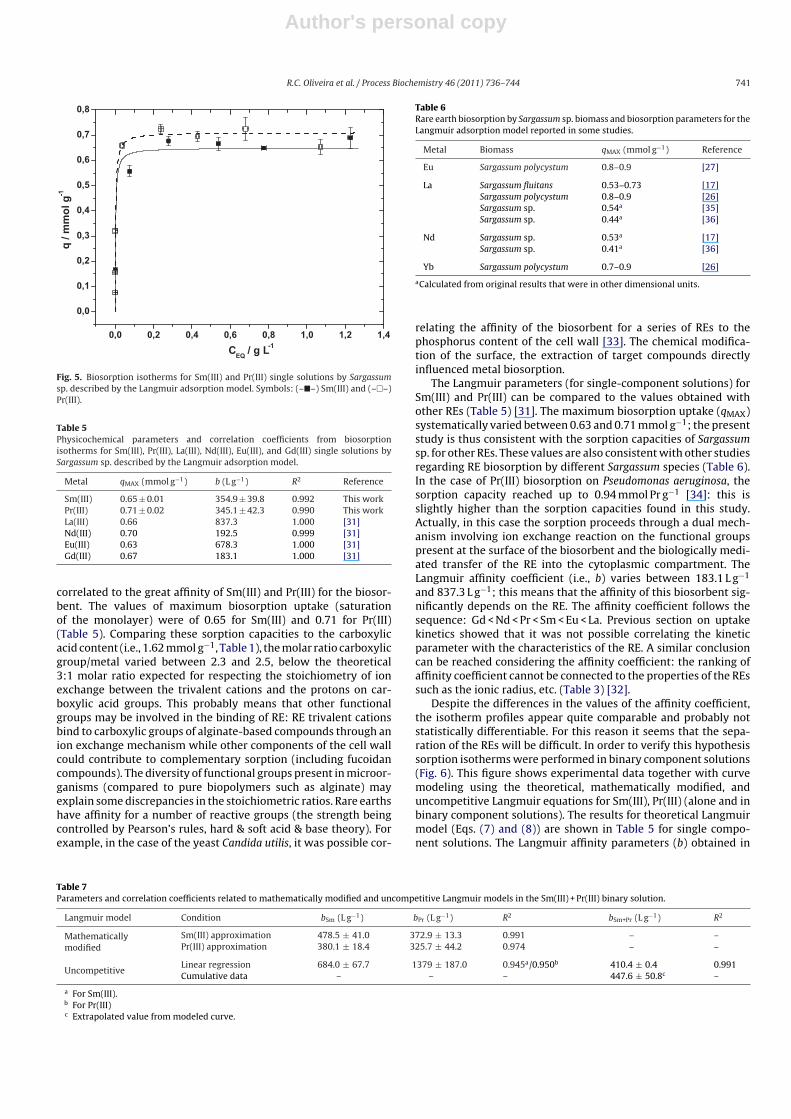
3.3. Biosorption isotherms
Fig. 5 shows the biosorption isotherms in single solutions forSm(III) and Pr(III). Experimental data are modeled using the Lang-muir equation. Table 5 records the parameters of the model forSm(III) and Pr(III). Table 5 also reports the parameters of the Lang-muir equation for the sorption isotherms obtained with the samebiomass for the recovery of La(III), Nd(III), Eu(III), and Gd(III) [31].
Langmuir equation fitted well sorption isotherms for bothSm(III) and Pr(III), as shown by the correlation coefficients(R2 > 0.99). Additionally, it is noteworthy that the shape of thebiosorption isotherms (Fig. 5) approaches the profile of irreversibleisotherms: the initial slope is very steep and the equilibriumplateau is reached at low residual concentration. This can be
Table 4Physicochemical parameters and correlation coefficients from biosorption kinetics for Sm(III) and Pr(III) binary solution by Sargassum sp. biomass described by the pseudo-second-order kinetic model.
Metal qEQ (mmol g−1) k2 (g mmol−1 min−1) v0 (mmol g−1 min−1) R2
Sm(III) 0.18 ± 0.01 0.72 ± 0.01 0.022 ± 0.001 0.992Pr(III) 0.18 ± 0.01 0.69 ± 0.02 0.023 ± 0.001 0.987Sm(III) + Pr(III) 0.36 ± 0.01 0.36 ± 0.01 0.046 ± 0.002 0.988
Author's personal copy
R.C. Oliveira et al. / Process Biochemistry 46 (2011) 736–744 741
1,41,21,00,80,60,40,20,0
0,0
0,1
0,2
0,3
0,4
0,5
0,6
0,7
0,8
q /
mm
ol g
-1
CEQ
/ g L-1
Fig. 5. Biosorption isotherms for Sm(III) and Pr(III) single solutions by Sargassumsp. described by the Langmuir adsorption model. Symbols: (–�–) Sm(III) and (–�–)Pr(III).
Table 5Physicochemical parameters and correlation coefficients from biosorptionisotherms for Sm(III), Pr(III), La(III), Nd(III), Eu(III), and Gd(III) single solutions bySargassum sp. described by the Langmuir adsorption model.
Metal qMAX (mmol g−1) b (L g−1) R2 Reference
Sm(III) 0.65 ± 0.01 354.9 ± 39.8 0.992 This workPr(III) 0.71 ± 0.02 345.1 ± 42.3 0.990 This workLa(III) 0.66 837.3 1.000 [31]Nd(III) 0.70 192.5 0.999 [31]Eu(III) 0.63 678.3 1.000 [31]Gd(III) 0.67 183.1 1.000 [31]
correlated to the great affinity of Sm(III) and Pr(III) for the biosor-bent. The values of maximum biosorption uptake (saturationof the monolayer) were of 0.65 for Sm(III) and 0.71 for Pr(III)(Table 5). Comparing these sorption capacities to the carboxylicacid content (i.e., 1.62 mmol g−1, Table 1), the molar ratio carboxylicgroup/metal varied between 2.3 and 2.5, below the theoretical3:1 molar ratio expected for respecting the stoichiometry of ionexchange between the trivalent cations and the protons on car-boxylic acid groups. This probably means that other functionalgroups may be involved in the binding of RE: RE trivalent cationsbind to carboxylic groups of alginate-based compounds through anion exchange mechanism while other components of the cell wallcould contribute to complementary sorption (including fucoidancompounds). The diversity of functional groups present in microor-ganisms (compared to pure biopolymers such as alginate) mayexplain some discrepancies in the stoichiometric ratios. Rare earthshave affinity for a number of reactive groups (the strength beingcontrolled by Pearson’s rules, hard & soft acid & base theory). Forexample, in the case of the yeast Candida utilis, it was possible cor-
Table 6Rare earth biosorption by Sargassum sp. biomass and biosorption parameters for theLangmuir adsorption model reported in some studies.
Metal Biomass qMAX (mmol g−1) Reference
Eu Sargassum polycystum 0.8–0.9 [27]
La Sargassum fluitans 0.53–0.73 [17]Sargassum polycystum 0.8–0.9 [26]Sargassum sp. 0.54a [35]Sargassum sp. 0.44a [36]
Nd Sargassum sp. 0.53a [17]Sargassum sp. 0.41a [36]
Yb Sargassum polycystum 0.7–0.9 [26]
aCalculated from original results that were in other dimensional units.
relating the affinity of the biosorbent for a series of REs to thephosphorus content of the cell wall [33]. The chemical modifica-tion of the surface, the extraction of target compounds directlyinfluenced metal biosorption.
The Langmuir parameters (for single-component solutions) forSm(III) and Pr(III) can be compared to the values obtained withother REs (Table 5) [31]. The maximum biosorption uptake (qMAX)systematically varied between 0.63 and 0.71 mmol g−1; the presentstudy is thus consistent with the sorption capacities of Sargassumsp. for other REs. These values are also consistent with other studiesregarding RE biosorption by different Sargassum species (Table 6).In the case of Pr(III) biosorption on Pseudomonas aeruginosa, thesorption capacity reached up to 0.94 mmol Pr g−1 [34]: this isslightly higher than the sorption capacities found in this study.Actually, in this case the sorption proceeds through a dual mech-anism involving ion exchange reaction on the functional groupspresent at the surface of the biosorbent and the biologically medi-ated transfer of the RE into the cytoplasmic compartment. TheLangmuir affinity coefficient (i.e., b) varies between 183.1 L g−1
and 837.3 L g−1; this means that the affinity of this biosorbent sig-nificantly depends on the RE. The affinity coefficient follows thesequence: Gd < Nd < Pr < Sm < Eu < La. Previous section on uptakekinetics showed that it was not possible correlating the kineticparameter with the characteristics of the RE. A similar conclusioncan be reached considering the affinity coefficient: the ranking ofaffinity coefficient cannot be connected to the properties of the REssuch as the ionic radius, etc. (Table 3) [32].
Despite the differences in the values of the affinity coefficient,the isotherm profiles appear quite comparable and probably notstatistically differentiable. For this reason it seems that the sepa-ration of the REs will be difficult. In order to verify this hypothesissorption isotherms were performed in binary component solutions(Fig. 6). This figure shows experimental data together with curvemodeling using the theoretical, mathematically modified, anduncompetitive Langmuir equations for Sm(III), Pr(III) (alone and inbinary component solutions). The results for theoretical Langmuirmodel (Eqs. (7) and (8)) are shown in Table 5 for single compo-nent solutions. The Langmuir affinity parameters (b) obtained in
Table 7Parameters and correlation coefficients related to mathematically modified and uncompetitive Langmuir models in the Sm(III) + Pr(III) binary solution.
Langmuir model Condition bSm (L g−1) bPr (L g−1) R2 bSm+Pr (L g−1) R2
Mathematicallymodified
Sm(III) approximation 478.5 ± 41.0 372.9 ± 13.3 0.991 – –Pr(III) approximation 380.1 ± 18.4 325.7 ± 44.2 0.974 – –
UncompetitiveLinear regression 684.0 ± 67.7 1379 ± 187.0 0.945a/0.950b 410.4 ± 0.4 0.991Cumulative data – – – 447.6 ± 50.8c –
a For Sm(III).b For Pr(III)c Extrapolated value from modeled curve.
Author's personal copy
742 R.C. Oliveira et al. / Process Biochemistry 46 (2011) 736–744
0,00
0,15
0,30
0,45
0,60
0,75
0,901,41,21,00,80,60,40,20,0
CEQ
/ g L-1
q /
mm
ol g
-1
0,00
0,15
0,30
0,45
0,60
0,75
0,90
q /
mm
ol g
-1
a
b
1,41,21,00,80,60,40,20,0
0,00
0,15
0,30
0,45
0,60
0,75
0,90
q /
mm
ol g
-1
CEQ
/ g L-1
c
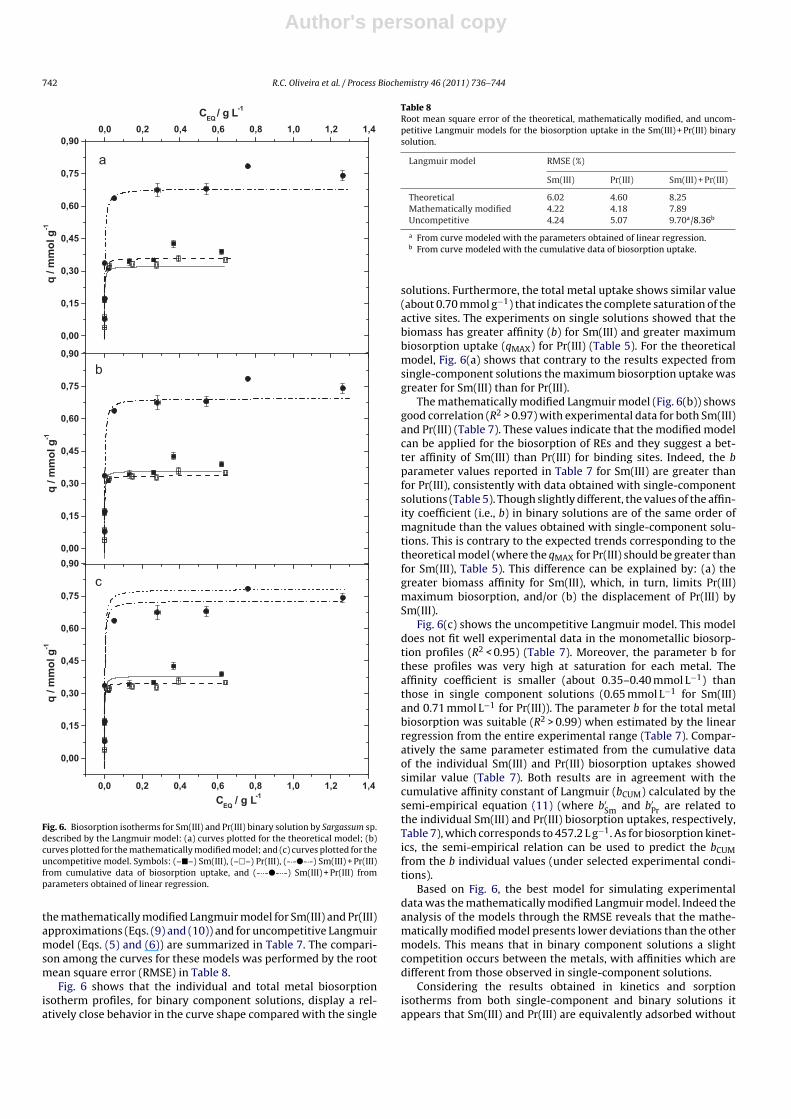
Fig. 6. Biosorption isotherms for Sm(III) and Pr(III) binary solution by Sargassum sp.described by the Langmuir model: (a) curves plotted for the theoretical model; (b)curves plotted for the mathematically modified model; and (c) curves plotted for theuncompetitive model. Symbols: (–�–) Sm(III), (–�–) Pr(III), (-·-�-·-) Sm(III) + Pr(III)from cumulative data of biosorption uptake, and (-··-�-··-) Sm(III) + Pr(III) fromparameters obtained of linear regression.
the mathematically modified Langmuir model for Sm(III) and Pr(III)approximations (Eqs. (9) and (10)) and for uncompetitive Langmuirmodel (Eqs. (5) and (6)) are summarized in Table 7. The compari-son among the curves for these models was performed by the rootmean square error (RMSE) in Table 8.
Fig. 6 shows that the individual and total metal biosorptionisotherm profiles, for binary component solutions, display a rel-atively close behavior in the curve shape compared with the single
Table 8Root mean square error of the theoretical, mathematically modified, and uncom-petitive Langmuir models for the biosorption uptake in the Sm(III) + Pr(III) binarysolution.
Langmuir model RMSE (%)
Sm(III) Pr(III) Sm(III) + Pr(III)
Theoretical 6.02 4.60 8.25Mathematically modified 4.22 4.18 7.89Uncompetitive 4.24 5.07 9.70a/8.36b
a From curve modeled with the parameters obtained of linear regression.b From curve modeled with the cumulative data of biosorption uptake.
solutions. Furthermore, the total metal uptake shows similar value(about 0.70 mmol g−1) that indicates the complete saturation of theactive sites. The experiments on single solutions showed that thebiomass has greater affinity (b) for Sm(III) and greater maximumbiosorption uptake (qMAX) for Pr(III) (Table 5). For the theoreticalmodel, Fig. 6(a) shows that contrary to the results expected fromsingle-component solutions the maximum biosorption uptake wasgreater for Sm(III) than for Pr(III).
The mathematically modified Langmuir model (Fig. 6(b)) showsgood correlation (R2 > 0.97) with experimental data for both Sm(III)and Pr(III) (Table 7). These values indicate that the modified modelcan be applied for the biosorption of REs and they suggest a bet-ter affinity of Sm(III) than Pr(III) for binding sites. Indeed, the bparameter values reported in Table 7 for Sm(III) are greater thanfor Pr(III), consistently with data obtained with single-componentsolutions (Table 5). Though slightly different, the values of the affin-ity coefficient (i.e., b) in binary solutions are of the same order ofmagnitude than the values obtained with single-component solu-tions. This is contrary to the expected trends corresponding to thetheoretical model (where the qMAX for Pr(III) should be greater thanfor Sm(III), Table 5). This difference can be explained by: (a) thegreater biomass affinity for Sm(III), which, in turn, limits Pr(III)maximum biosorption, and/or (b) the displacement of Pr(III) bySm(III).
Fig. 6(c) shows the uncompetitive Langmuir model. This modeldoes not fit well experimental data in the monometallic biosorp-tion profiles (R2 < 0.95) (Table 7). Moreover, the parameter b forthese profiles was very high at saturation for each metal. Theaffinity coefficient is smaller (about 0.35–0.40 mmol L−1) thanthose in single component solutions (0.65 mmol L−1 for Sm(III)and 0.71 mmol L−1 for Pr(III)). The parameter b for the total metalbiosorption was suitable (R2 > 0.99) when estimated by the linearregression from the entire experimental range (Table 7). Compar-atively the same parameter estimated from the cumulative dataof the individual Sm(III) and Pr(III) biosorption uptakes showedsimilar value (Table 7). Both results are in agreement with thecumulative affinity constant of Langmuir (bCUM) calculated by thesemi-empirical equation (11) (where b′
Sm and b′Pr are related to
the individual Sm(III) and Pr(III) biosorption uptakes, respectively,Table 7), which corresponds to 457.2 L g−1. As for biosorption kinet-ics, the semi-empirical relation can be used to predict the bCUMfrom the b individual values (under selected experimental condi-tions).
Based on Fig. 6, the best model for simulating experimentaldata was the mathematically modified Langmuir model. Indeed theanalysis of the models through the RMSE reveals that the mathe-matically modified model presents lower deviations than the othermodels. This means that in binary component solutions a slightcompetition occurs between the metals, with affinities which aredifferent from those observed in single-component solutions.
Considering the results obtained in kinetics and sorptionisotherms from both single-component and binary solutions itappears that Sm(III) and Pr(III) are equivalently adsorbed without
Author's personal copy
R.C. Oliveira et al. / Process Biochemistry 46 (2011) 736–744 743
0,000,15
0,300,45
0,60
0,75
0,0
0,1
0,2
0,3
0,4
0,00
0,15
0,300,45
0,600,75
q /
mm
ol g
-1
C EQ,Pr/ g L
-1
CEQ,Sm / g L -1
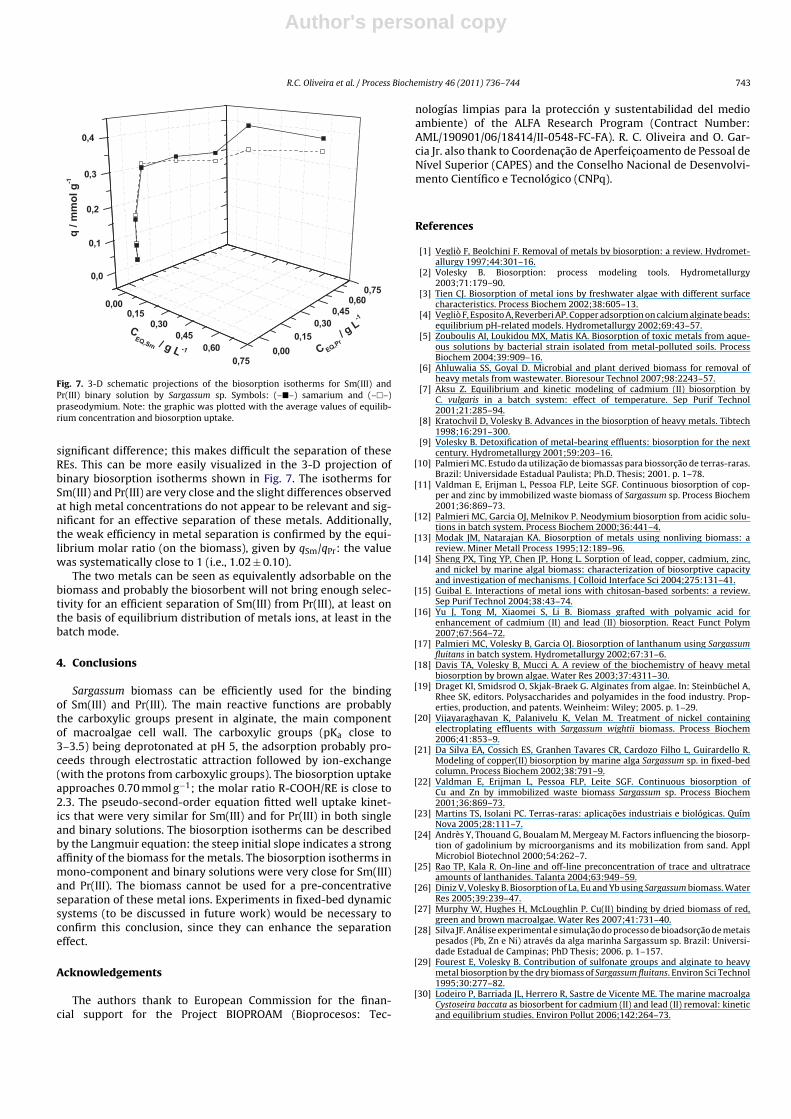
Fig. 7. 3-D schematic projections of the biosorption isotherms for Sm(III) andPr(III) binary solution by Sargassum sp. Symbols: (–�–) samarium and (–�–)praseodymium. Note: the graphic was plotted with the average values of equilib-rium concentration and biosorption uptake.
significant difference; this makes difficult the separation of theseREs. This can be more easily visualized in the 3-D projection ofbinary biosorption isotherms shown in Fig. 7. The isotherms forSm(III) and Pr(III) are very close and the slight differences observedat high metal concentrations do not appear to be relevant and sig-nificant for an effective separation of these metals. Additionally,the weak efficiency in metal separation is confirmed by the equi-librium molar ratio (on the biomass), given by qSm/qPr: the valuewas systematically close to 1 (i.e., 1.02 ± 0.10).
The two metals can be seen as equivalently adsorbable on thebiomass and probably the biosorbent will not bring enough selec-tivity for an efficient separation of Sm(III) from Pr(III), at least onthe basis of equilibrium distribution of metals ions, at least in thebatch mode.
4. Conclusions
Sargassum biomass can be efficiently used for the bindingof Sm(III) and Pr(III). The main reactive functions are probablythe carboxylic groups present in alginate, the main componentof macroalgae cell wall. The carboxylic groups (pKa close to3–3.5) being deprotonated at pH 5, the adsorption probably pro-ceeds through electrostatic attraction followed by ion-exchange(with the protons from carboxylic groups). The biosorption uptakeapproaches 0.70 mmol g−1; the molar ratio R-COOH/RE is close to2.3. The pseudo-second-order equation fitted well uptake kinet-ics that were very similar for Sm(III) and for Pr(III) in both singleand binary solutions. The biosorption isotherms can be describedby the Langmuir equation: the steep initial slope indicates a strongaffinity of the biomass for the metals. The biosorption isotherms inmono-component and binary solutions were very close for Sm(III)and Pr(III). The biomass cannot be used for a pre-concentrativeseparation of these metal ions. Experiments in fixed-bed dynamicsystems (to be discussed in future work) would be necessary toconfirm this conclusion, since they can enhance the separationeffect.
Acknowledgements
The authors thank to European Commission for the finan-cial support for the Project BIOPROAM (Bioprocesos: Tec-
nologías limpias para la protección y sustentabilidad del medioambiente) of the ALFA Research Program (Contract Number:AML/190901/06/18414/II-0548-FC-FA). R. C. Oliveira and O. Gar-cia Jr. also thank to Coordenacão de Aperfeicoamento de Pessoal deNível Superior (CAPES) and the Conselho Nacional de Desenvolvi-mento Científico e Tecnológico (CNPq).
References
[1] Vegliò F, Beolchini F. Removal of metals by biosorption: a review. Hydromet-allurgy 1997;44:301–16.
[2] Volesky B. Biosorption: process modeling tools. Hydrometallurgy2003;71:179–90.
[3] Tien CJ. Biosorption of metal ions by freshwater algae with different surfacecharacteristics. Process Biochem 2002;38:605–13.
[4] Vegliò F, Esposito A, Reverberi AP. Copper adsorption on calcium alginate beads:equilibrium pH-related models. Hydrometallurgy 2002;69:43–57.
[5] Zouboulis AI, Loukidou MX, Matis KA. Biosorption of toxic metals from aque-ous solutions by bacterial strain isolated from metal-polluted soils. ProcessBiochem 2004;39:909–16.
[6] Ahluwalia SS, Goyal D. Microbial and plant derived biomass for removal ofheavy metals from wastewater. Bioresour Technol 2007;98:2243–57.
[7] Aksu Z. Equilibrium and kinetic modeling of cadmium (II) biosorption byC. vulgaris in a batch system: effect of temperature. Sep Purif Technol2001;21:285–94.
[8] Kratochvil D, Volesky B. Advances in the biosorption of heavy metals. Tibtech1998;16:291–300.
[9] Volesky B. Detoxification of metal-bearing effluents: biosorption for the nextcentury. Hydrometallurgy 2001;59:203–16.
[10] Palmieri MC. Estudo da utilizacão de biomassas para biossorcão de terras-raras.Brazil: Universidade Estadual Paulista; Ph.D. Thesis; 2001. p. 1–78.
[11] Valdman E, Erijman L, Pessoa FLP, Leite SGF. Continuous biosorption of cop-per and zinc by immobilized waste biomass of Sargassum sp. Process Biochem2001;36:869–73.
[12] Palmieri MC, Garcia OJ, Melnikov P. Neodymium biosorption from acidic solu-tions in batch system. Process Biochem 2000;36:441–4.
[13] Modak JM, Natarajan KA. Biosorption of metals using nonliving biomass: areview. Miner Metall Process 1995;12:189–96.
[14] Sheng PX, Ting YP, Chen JP, Hong L. Sorption of lead, copper, cadmium, zinc,and nickel by marine algal biomass: characterization of biosorptive capacityand investigation of mechanisms. J Colloid Interface Sci 2004;275:131–41.
[15] Guibal E. Interactions of metal ions with chitosan-based sorbents: a review.Sep Purif Technol 2004;38:43–74.
[16] Yu J, Tong M, Xiaomei S, Li B. Biomass grafted with polyamic acid forenhancement of cadmium (II) and lead (II) biosorption. React Funct Polym2007;67:564–72.
[17] Palmieri MC, Volesky B, Garcia OJ. Biosorption of lanthanum using Sargassumfluitans in batch system. Hydrometallurgy 2002;67:31–6.
[18] Davis TA, Volesky B, Mucci A. A review of the biochemistry of heavy metalbiosorption by brown algae. Water Res 2003;37:4311–30.
[19] Draget KI, Smidsrod O, Skjak-Braek G. Alginates from algae. In: Steinbüchel A,Rhee SK, editors. Polysaccharides and polyamides in the food industry. Prop-erties, production, and patents. Weinheim: Wiley; 2005. p. 1–29.
[20] Vijayaraghavan K, Palanivelu K, Velan M. Treatment of nickel containingelectroplating effluents with Sargassum wightii biomass. Process Biochem2006;41:853–9.
[21] Da Silva EA, Cossich ES, Granhen Tavares CR, Cardozo Filho L, Guirardello R.Modeling of copper(II) biosorption by marine alga Sargassum sp. in fixed-bedcolumn. Process Biochem 2002;38:791–9.
[22] Valdman E, Erijman L, Pessoa FLP, Leite SGF. Continuous biosorption ofCu and Zn by immobilized waste biomass Sargassum sp. Process Biochem2001;36:869–73.
[23] Martins TS, Isolani PC. Terras-raras: aplicacões industriais e biológicas. QuímNova 2005;28:111–7.
[24] Andrès Y, Thouand G, Boualam M, Mergeay M. Factors influencing the biosorp-tion of gadolinium by microorganisms and its mobilization from sand. ApplMicrobiol Biotechnol 2000;54:262–7.
[25] Rao TP, Kala R. On-line and off-line preconcentration of trace and ultratraceamounts of lanthanides. Talanta 2004;63:949–59.
[26] Diniz V, Volesky B. Biosorption of La, Eu and Yb using Sargassum biomass. WaterRes 2005;39:239–47.
[27] Murphy W, Hughes H, McLoughlin P. Cu(II) binding by dried biomass of red,green and brown macroalgae. Water Res 2007;41:731–40.
[28] Silva JF. Análise experimental e simulacão do processo de bioadsorcão de metaispesados (Pb, Zn e Ni) através da alga marinha Sargassum sp. Brazil: Universi-dade Estadual de Campinas; PhD Thesis; 2006. p. 1–157.
[29] Fourest E, Volesky B. Contribution of sulfonate groups and alginate to heavymetal biosorption by the dry biomass of Sargassum fluitans. Environ Sci Technol1995;30:277–82.
[30] Lodeiro P, Barriada JL, Herrero R, Sastre de Vicente ME. The marine macroalgaCystoseira baccata as biosorbent for cadmium (II) and lead (II) removal: kineticand equilibrium studies. Environ Pollut 2006;142:264–73.

Author's personal copy
744 R.C. Oliveira et al. / Process Biochemistry 46 (2011) 736–744
[31] Oliveira RC, Garcia Jr O. Study of biosorption of rare earth metals (La, Nd, Eu,Gd) by Sargassum sp. biomass in batch systems: physicochemical evaluation ofkinetics and adsorption models. Adv Mater Res 2009;71–73:605–8.
[32] Gschneidner Jr KA. Physical properties of the rare earth metals. In: Lide DR,editor. CRC Handbook of Chemistry and Physics. 88th ed. Boca Raton: CRC;2007–2008. p. 4119–24.
[33] Korenevskii AA, Sorokin VV, Karavaiko GI. Biosorption of rare earth elements.Process Metall 1999;9C:299–306.
[34] Philip L, Iyengar L, Venkobachar C. Biosorption of U, La, Pr, Nd, Eu and Dy byPseudomonas aeruginosa. J Ind Microbiol Biotechnol 2000;25:1–7.
[35] Tsui MTK, Cheung KC, Tam NFY, Weng MH. A comparative study on metalsorption by brown seaweed. Chemosphere 2006;65:51–7.
[36] Oliveira RC. Estudo da concentracão e recuperacão de íons lantânio e neodímiopor biossorcão em coluna com a biomassa Sargassum sp. Brazil: UniversidadeEstadual Paulista; M.Sc. Thesis; 2007. p. 1–61.