russian-holidays-predict-troll-activity-2015-2017.pdf - textore
TRANSCRIPT
CEEP WORKING PAPER SERIES WORKING PAPER NUMBER 12
OCTOBER 2020
Russian Holidays Predict Troll Activity 2015-2017
Douglas Almond, Xinming Du, and Alana Vogel
https://ceep.columbia.edu/sites/default/files/content/papers/n12.pdf
Russian Holidays Predict
Troll Activity 2015-2017⇤
Douglas Almond†, Xinming Du
‡, and Alana Vogel
§
October 29, 2020
Abstract
While international election interference is not new, Russia is credited with “in-dustrializing” trolling on English-language social media platforms. In October 2018,Twitter retrospectively identified 2.9 million English-language tweets as covertly writ-ten by trolls from Russia’s Internet Research Agency. Most active 2015-2017, theseRussian trolls generally supported the Trump campaign (Senate Intelligence Commit-tee, 2019) and researchers have traced how this content disseminated across Twitter.Here, we take a di↵erent tack and seek exogenous drivers of Russian troll activity. Wefind that trolling fell 35% on Russian holidays and to a lesser extent, when tempera-tures were cold in St. Petersburg. More recent trolls released by Twitter do not showany systematic relationship to holidays and temperature, although substantially fewerof these that have been made public to date. Our finding for the pre-2018 interferenceperiod may furnish a natural experiment for evaluating the causal e↵ect of Russiantrolling on indirectly-a↵ected outcomes and political behaviors – outcomes that areless traceable to troll content and potentially more important to policymakers thanthe direct dissemination activities previously studied. As a case in point, we describesuggestive evidence that Russian holidays impacted daily trading prices in 2016 electionbetting markets.
Keywords: Russian trolling, natural experiment, holidays, Presidential elections
⇤We thank Joseph Doyle, Olle Folke, Parijat Lal, Bhashkar Mazumder, and Koleman Strumpf for helpfulcomments and Solveig Asplund for proof reading. We thank Suresh Naidu for suggesting we look at onlinebetting markets in related work. All errors are our own.
†Columbia University and NBER: [email protected]‡Columbia University: [email protected]§Columbia University: [email protected]
1
Professional Russian trolling is malevolent and murky. The February 2018 USgrand-jury indictment states that the Internet Research Agency (IRA) in St. Peters-burg conducted “information warfare against the United State of America” by using“fictitious U.S. personas on social media platforms....” (US Department of Justice,2018). These fake personas communicated with “unwitting” members of the public tosow distrust in the US political system, discourage minorities from voting, make asser-tions of voter fraud, organize political rallies, stoke racial divisions,1 assist the Trumpcampaign,2 and other illicit activities.3 Employees used an Internet proxy service toconceal their I.P. addresses (Chen, 2015) and “covering tracks” was a goal of the IRAoperation (US Department of Justice, 2018). As has been widely reported, Russianinterference is believed by many to continue during the current election cycle.
In October 2018, Twitter released 2.9 million English-language tweets from 3,841accounts as “a�liated with the IRA”, which we refer to as “Wave 1” tweets. Twitter’sstated goal was to “enable independent academic research and investigation”. SinceJanuary 2019, Twitter has blocked an additional 770,000 English-language tweets ofsurreptitiously Russian origin, without explicitly attributing them to the IRA. Whatcaused Twitter’s suspicions of particular accounts and tweets they have flagged wasnot disclosed.4 Nevertheless, Twitter’s disclosure of the suspicious Twitter accountsand tweets they think are tied to professional Russian trolling provides the requisitedata for our empirical analysis.5
Empirically, Russian trolling activity is correlated with the timing of other legit-imate activities, including breaking news stories6 and overall internet tra�c levels.Additionally, trolling activity exhibits time trends, seasonality, and the influence of theday of the week. This can make it di�cult to ascribe time-series variation in trollingintensity and its e↵ects to the work of trolls per se, as opposed to other factors.
Here we explore factors behind Russian trolling activity in the US that are likelyspecific to Russia. This forensic exercise may be useful for shedding light on the pro-duction function of Russian trolling (Zitzewitz, 2012). To the extent they are indeedcoordinated in Russia, this would be consistent with Twitter’s identification of particu-lar English-language tweets as of surreptitiously Russian-origin. Furthermore, it might
1According to the Senate Intelligence Committee’s bipartisan report in 2019, “The Committee found theIRA targeted African-Americans more than any other group or demographic. Through individual posts,location targeting, Facebook pages, Instagram accounts, and Twitter trends, the IRA focused much of itse↵orts on stoking divisions around hot-button issues with racial undertones.”
2The Senate Intelligence Committee’s bipartisan report stated: “The Committee found that the IRAsought to influence the 2016 U.S. presidential election by harming Hillary Clinton’s chances of success andsupporting Donald Trump at the direction of the Kremlin. The Committee found that IRA social mediaactivity was overtly and almost invariably supportive of then-candidate Trump to the detriment of SecretaryClinton’s campaign.”
3The Federal Election Campaign Act “prohibits foreign nationals from making any contributions, expen-ditures, independent expenditures, or disbursements for electioneering communications” (US Department ofJustice, 2018).
4In June 2019, Twitter stated: “...we employ a range of open-source and proprietary signals and toolsto identify when attempted coordinated manipulation may be taking place, as well as the actors responsiblefor it.”
5Twitter blocking occurs after a substantial period of unchecked online activity, which is what we analyze.6For example, Russian troll accounts “respond to shifts in political circumstances”, e.g. “the well-known
faint/stumble by Hillary Clinton leaving a 9/11 commemoration event, followed by her pausing the campaignwith an announcement of pneumonia.” (Linvill and Warren, 2020)
2
help social media, cybersecurity firms, and government agencies to identify ongoinginterference activities. Finally, and most important for future research, our approachmight allow researchers to isolate exogenous drivers of trolling activity in the US –neglected by research to date – and thereby its true and full e↵ect.
We find that Russian holidays decrease trolling by 35% in the corpus of Twitter’sprimary data release on October 2018 of 2.9 million tweets. The decrease in overallholiday tweeting is largest for original tweets, which may be more impactful thanretweets. To a lesser extent, warmer temperatures in St. Petersburg also increasedtrolling.
From January 2019 to June 2020, Twitter released another 770,000 English languagetweets as of surreptitiously Russian origin, but without explicitly attributing them tothe IRA in St. Petersburg.7 The reduced number of recently-released trolls couldindicate: 1) less trolling recently on Twitter by Russians, 2) that Twitter is holding onto this “wave 5” information so as not to compromise its defensive methods in the run-up to the 2020 election, or 3) Russians have gotten better at “covering their tracks”.Indeed, following the glare of publicity their trolling received around the February 2018US indictment of the IRA, Russians may have adopted new methods of interference.While we have less statistical power to detect e↵ects in the 2018-2020 period becausethere are far fewer suspicious tweets to analyze, we see no relationship between Russianholidays or St. Petersburg’s temperature in the most recent period. Power issues aside,this null finding is consistent with Russia getting better at “‘covering its tracks”.
Despite its importance and popular interest, little is known about the causal ef-fects of Russian trolling on outcomes politicians and policymakers actually care about,such as campaign donations or election probabilities. Arguably, these outcomes aremore important than the direct observed dissemination of troll content itself that haspreviously been studied. Such indirect e↵ects would include the downstream impactof Russian trolls on unwitting internet users who do not retweet the (surreptitiously)Russian tweet or its content and how they and their US compatriots behave when o↵Twitter. This is where exogenous variation in Russian trolling could be useful in forg-ing a link. To the extent local Russian factors drive English-language trolling, this mayprovide a natural experiment for considering impacts on higher-stakes, election-relatedbehaviors.
Instead, previous research has focused on persons who had direct interactions withRussian trolls and automated bots and how trolling content disseminated. Importantly,this direct dissemination can and has been observed.
Bail et al. (2020) surveyed Twitter users in the fall of 2017 and observed in longi-tudinal data whether they directly accessed content from IRA accounts, the true IRAidentities of which had not been disclosed to the public at that time. Bail et al. (2020)note that prior to their paper:
Yet, to our knowledge, no studies have examined whether these e↵orts actu-
ally impacted the attitudes and behaviors of the American public.
At follow-up, Bail et al. (2020) found “no evidence that interacting with these accountssubstantially impacted 6 political attitudes and behaviors.” They reason that IRA ac-tivity may not show its intended e↵ect because it was accessed disproportionately
7For waves 2 and 4, Twitter noted: “We cannot render definitive attribution to the IRA for these (418)accounts, although most appear to originate in Russia”, and “accounts are associated with Current Policy,engaging in state-backed political propaganda within Russia”. See link1, link2.
3
by (US) Twitter users who were already polarized. Bail et al. (2020) also note that“[s]tudies of political communications and campaigns, for example, have repeatedlydemonstrated that it is very di�cult to change people’s views”. In contrast, a workingpaper by Dutta et al. (2020) analyzes Twitter behavior of those users who were activelycontacted by IRA bots and provide “some of the first evidence that contacted Twitterusers’ behavior underwent significant changes...following interactions with Russia’s In-ternet Research Agency.” They characterize their working paper’s findings of changesin tweeting frequency and tweet sentiment as correlational: “The intent of this paperis not to establish causality” (Dutta et al., 2020). Focussing on Russian bots, Gorod-nichenko et al. (2018) find that “di↵usion of information on Twitter is largely completewithin 1-2 hours” and have a “tangible e↵ect on the tweeting activity of humans”. Aworking paper by Im et al. (2020) builds a machine learning algorithm to predict thelikelihood that an account is a Russian troll, unbeknownst to other Twitter users. Theythen see to what extent these likely-troll accounts di↵use content to journalists.8
All of these findings are for observed and direct links to trolling content. For socialmedia content more broadly, impacts on “downstream” political outcomes like streetprotests or voter turnout have been shown using natural experiments, e.g. within Russiaitself (Enikolopov, Makarin, and Petrova, 2020). In terms of content disseminationvia social media, Zhuravskaya, Petrova, and Enikolopov (2020) note: “As immediatereactions are often based on emotions rather than reason, fake news, which evokes fearor anger, may spread faster than real news, which is often less emotionally charged.”
For Russian trolling specifically, we know of no natural experiment-based evidencethat it has a↵ected the more important downstream outcomes that may not be directlylinkable with tweet- or account-level trolling data. To capture the full downstream im-pacts of trolling, such outcomes also need to be considered alongside the more “trace-able” ones. As a case in point, we describe suggestive evidence that Russian holidaysimpacted daily trading prices in 2016 election betting markets in the Discussion section.
1 Methods and Research Design
1.1 Data
1.1.1 Russian Tweets
According to the federal indictment, IRA began its interference in the US around 2014with its English-language “translator project” (US Department of Justice, 2018).9 ThisEnglish-language group was “elite and secretive” (Chen, 2015). In July 2016, more thaneighty IRA employees were assigned to this covert e↵ort.
In October 2018, Twitter announced:
[W]e are releasing the full, comprehensive archives of the Tweets and media
that are connected with these two previously disclosed and potentially state-
backed operations on our service. We are making this data available with the
goal of encouraging open research and investigation of these behaviors from
8Anecdotally, the Washington Post noted that Eric Trump, Donald Trump Jr., and Kellyanne Conway allposted information from a likely Russian troll @TEN GOP in the run-up to the 2016 presidential election.
9Bail et al. (2020) cite a US Senate Intelligence Committee that IRA has been active since 2013. Twitterblocked suspicious tweets posted back to 2009.
4
researchers and academics around the world. These large datasets comprise
3,841 accounts a�liated with the IRA, originating in Russia, and 770 other
accounts, potentially originating in Iran. They include more than 10 million
Tweets and more than 2 million images, GIFs, videos, and Periscope broad-
casts, including the earliest on-Twitter activity from accounts connected with
these campaigns, dating back to 2009.
Among these were 2.9 million English-language tweets from the 3,841 IRA-a�liatedaccounts. Since October 2018, Twitter has been detecting and suspending accountswith known state-backed information operations. As of October 2020, Twitter released418, 4 and 1,152 blocked accounts linked with Russia in January 2019, June 2019 andJune 2020, respectively. We refer to these releases as “waves” 2-4. Unfortunately, thedate/time at which the individual account was blocked or removed is not disclosed byTwitter.10 Nor do we know whether the suspect accounts disclosed in the same blockingannouncement were blocked simultaneously or separately. We focus on English tweetson the “day shift”: 9am-9pm Russia time.11 Finally and descriptively, Linvill andWarren (2020) document “enormous heterogeneity in theme and approach across IRAaccounts”. For example, some tweets appear targeted at right-wing followers and othersto sow discord on the left.
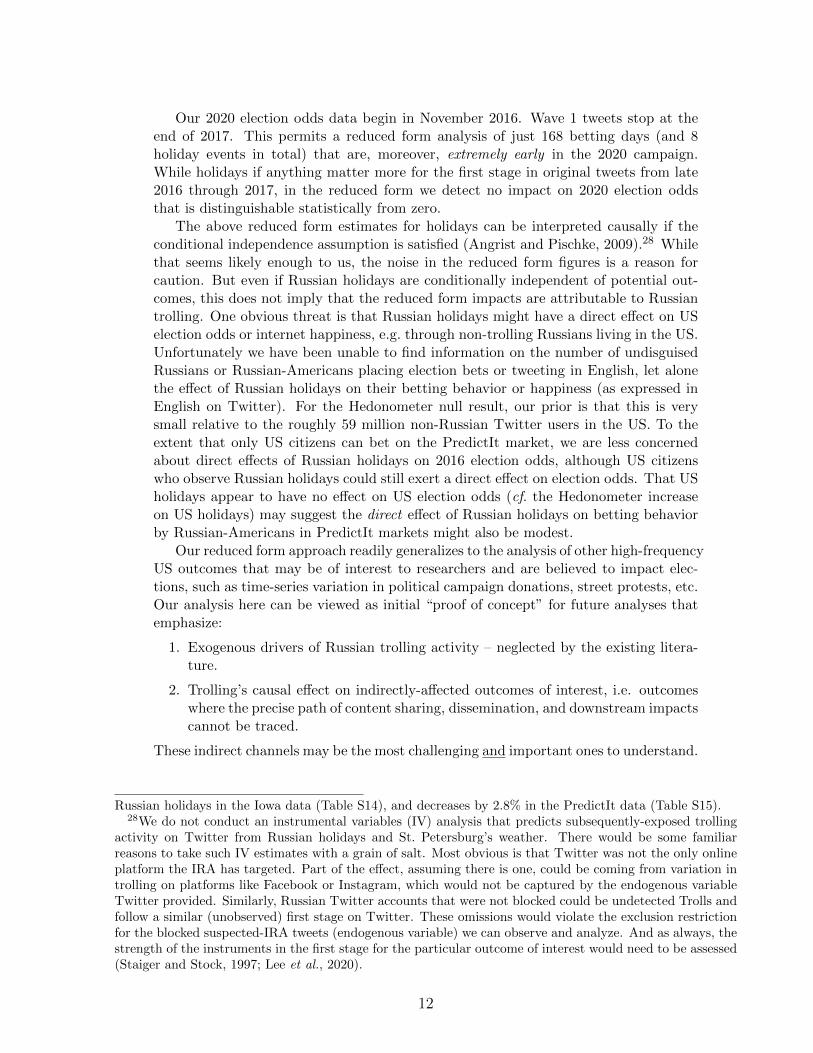
The time series of Russian trolling activities by wave is shown in Figure 1. We seevery little (unmasked) trolling activity after the fall of 2018. Also, the vast majorityof English tweets – some 80% – come from wave 1, which were most active from late2014 through the end of 2017.
1.1.2 Downstream outcomes
According to February 2018 indictment, IRA sought to develop “certain fictitious U.S.personas into “leader[s] of public opinion in the United States” (US Department ofJustice, 2018). Therefore, we look at the Hedonometer, a summary, widely-referenced12
metric of “average happiness” of English tweets on Twitter. Hedonometer notes on itswebsite: “Our Hedonometer is based on people’s online expressions, capitalizing ondata-rich social media, and we’re measuring how people present themselves to theoutside world”. Dodds et al. (2011) provide detailed information on their scoringalgorithm. An advantage to analyzing these downstream data is that they are availablefor all the initial posting dates of the subsequently-blocked accounts and tweets. Asonly 1,702 tweets posted before 2012 were subsequently blocked, we use 2012 as thestart year of our study period.
Rhode and Strumpf (2004) note there have been “large and well-organized marketsfor betting on presidential elections” stretching back to at least 1868. 2020 Electionodds come from BetData, which tracks odds for 105 potential candidates beginning in
10See supplementary material section 4 for an attempt at analyzing inferred blocking dates. We thank JoeDoyle for a conversation that spurred this RD-style investigation.
11Chen (2015) notes that IRA work shifts began at 9am and finished at 9pm. Linvill and Warren (2020)likewise note: “IRA employees tasked with making social media posts are reported to have been organizedinto 12-hour shifts, a day shift and night shift, and instructed to make posts at times appropriate to U.S.time zones.”
12On October 3, Google scholar showed 680 citations of Dodds et al. (2011). The popular press has alsofrequently invoked the Hedonometer, e.g. The Washington Post in August 2019 and The New York Times
in February 2015.
5
November 2016. Because the identified trolls were most active before the November2016 election, we have less overlap between our election odds data and observed trollactivity. 2016 Presidential election betting data come from Iowa Election Markets(IEM) and PredictIt, which both begin in November 2014. Since we observe dailyprice for 2016 Election odds and hourly price for 2020 Election odds, we use the dailyclosing price for 2016 election odds and hourly price at 2pm EST (9pm Russian time) for2020 odds. We use the implied probability of winning for Republican’s and Democrat’scandidates as outcome variables. A key di↵erence of these markets is that PredictItonly allows traders in the US, BetData (Betfair) forbids US traders.13 IEM is open totraders worldwide.14
1.2 Research Design
1.2.1 Russian Holidays
We define Russian holidays using the eight Federal holidays enumerated within theLabor Code of the Russian Federation. The eight Russian holidays are:
New Years (January 1)Eastern Orthodox Christmas (January 7)Defender of the Fatherland Day (February 25)International Women’s Day (March 8)Labor Day (May 1)Victory Day (May 9)Russia Day (June 12)Unity Day (November 4).
We do not use January 1 because it coincides with a US holiday (which we also controlfor).
We are not the first to notice a relationship between Russian holidays and Russianmalfeasance in the US. In 2015, a cybersecurity firm in California was studying “anadvanced persistent threat group that we suspect the Russian government sponsors”,which they referred to as APT29. Their focus was not on Russian trolling by theIRA, but instead non-public actions by Russian intelligence itself. Released in July2015, the “Hamertoss” threat intelligence report by Fireeye Inc. noted in passing that“APT29 appeared to cease operations on Russian holidays....”. They did not presentany additional details or empirical evidence. To our knowledge, this holiday e↵ecthas not been picked up in the academic literature studying Russian interference. Andfortunately for us, Russian holidays di↵er from US holidays, which may have distincte↵ects on outcomes of interest.
13From Betfair: “You will not bet or attempt to bet with us if you are located in the United States ofAmerica or in any other country with a comparable legal situation. These countries will be determined byBetfair from time to time.”
14From the IEM Trader’s Manual: “Participation in the IEM is open to students, faculty, and sta↵ atcolleges and universities worldwide; IEM political markets are also open to non-academic participants.”
6
1.2.2 Ambient Temperature
Daily temperature data is from the National Climatic Data Center Global Summaryof the Day (GSOD) dataset.15 We use mean temperature from weather stations in St.Petersburg 2012-2019 for the main result, and add London and other cities in U.S. inSupplementary Material Section 1.3.
1.2.3 Wave-specific Factors
Figure 1 shows that the level of tweeting di↵ers markedly by wave of release. Ad-ditionally, Wave 1 was specifically attributed to the Internet Research Agency, whilesubsequent waves of blocked Russian tweets were not. Trolling tactics and practicesevolved over time and it is possible that di↵erent groups of actors in di↵ering locationswithin Russia were involved in di↵erent waves. For these reasons, our regression spec-ifications include wave-specific fixed e↵ects and allow the e↵ect of temperature andholiday to vary by wave:
Ywt =4X
w=1
�wHoliday RUt ⇥Wavew +4X
w=1
�wTemperaturet ⇥Wavew
+✓tHoliday USt +DOWt + (Wave ⇤ Y ear)wt + (Wave ⇤Month)wt + "wt
(1)
where Ywt denotes the number of wave w tweets posted 9am-9pm Russian time on dayt.16 Coe�cients �1 to �4 capture wave-specific impacts of Russian holidays, and �1 to �4capture temperature impacts. We also include a Holiday USt dummy and day of weekfixed e↵ects that are common across waves. (Wave ⇤ Y ear)wt and (Wave ⇤Month)wt
denote year and month FE that are interacted with the wave dummies.
2 Results
2.1 Wave by Day Results
In Table 1, we analyze how Russian holidays and temperature in St. Petersburg a↵ectthe total number of suspect (i.e. subsequently-blocked) tweets at the wave-day level.To isolate the holiday e↵ect, we control for day-of-week fixed e↵ects (FE), wave byyear FE, and wave-specific seasonality (wave by calendar month FE). The number ofblocked tweets released in the first wave during Russian holidays decreases by 0.29standard deviations or 35.1% relative to the mean, as compared with non-holidays.The .29 point estimate is fairly precise, with a standard error of .09 to .10. Also on thefirst wave, a one standard deviation increase in temperature more modestly increasesblocked tweets by 0.056 standard deviations, or 6.8% relative to the mean. Holiday andtemperature estimates appear driven by the subset of original tweets (Panel B), which
15https://www.ncei.noaa.gov/access/search/data-search/global-summary-of-the-day16We drop tweets with blank tweet text for further analysis. Among non-blank tweets, we consider pure
retweets without comments as retweets, non-retweets or retweets with comments as original tweets. Inpractice, we label tweet as retweet if it starts with “RT” and its field is retweet is true. In Appendix Section6, we add back blank tweets and only use field is retweet to label retweets. Results are very similar to mainresults without blank tweets.
7
might be expected to have a greater impact on downstream outcomes than retweets(Panel C).
In Column (2)-(4), we add linear, quadratic, and cubic day trends in the regressionto allow for the nonlinear time trend in Russian trolling activity. Since we alreadycontrol for wave by year FE, we assume the same within-year trends for the four wavesafter controlling wave-specific seasonality. R2s are similar in Column (1)-(4), indicatinga poor explanatory contribution from the time trends. Estimates on holidays andtemperature remain stable with these additional controls. In Column (5) and (6), weconduct a more aggressive control strategy, leveraging within year-by-month-by-wavecomparisons. Adding these fixed e↵ects increases the R2 from .36 to .5.17 The impactestimate for Russian holidays is highly robust, the point estimate remaining at -.29standard deviations. Though estimates on temperature are not significant, we thinkseasonality of temperature in St. Petersburg is su�ciently controlled with calendarmonth FE and we will only use Column (1)-(4) estimates to gauge the impact of localtemperature fluctuations. Adding year-month FE may absorb temperature fluctuationsthat last for several days and are registered by the year by month FE.
In contrast to the first wave, the impact of holiday or temperature on tweets releasedin other three waves is not significantly di↵erent from 0. As mentioned above, the latterthree releases together contain 20% of the total English-language troll tweets Twitterhas tied to Russia to date.
2.2 Wave 1 Event Study
We show the holiday impact on the first wave “mother lode” of tweets in Figure 2.Over the 2012-2017 activity period for wave 1 accounts, we use 42 holidays for originaltweets and 44 holidays for retweets. Without any control variables, the number oftweets decreases by roughly 200 on day 0 and the magnitude is very similar to ourpoint estimates in Table 1 Panel A, which includes a more extensive set of controls.In the event that holidays coincide with weekends or are otherwise correlated with theday of the week, we add day-of-week FE (only, no other control variables) in the middlepanel. The pattern is quite similar and the trough on day 0 (the holiday itself) is moreobvious.
In addition to day of the week FE, Appendix Table S6 adds additional controlvariables and shows that the holiday e↵ect is robust and statistically significant. Theseregression controls include year and month FE, and even year by month FE, therebyrestricting comparisons to be within the same month. The bottom panel of Figure 2displays the same-month comparisons. Residuals with day-of-week and year-month FEdecrease by 85 original tweets and 70 retweets on day 0.
Figure 3 focusses on the sub-period of the 2016 election campaign: November 2014-November 2016. The holiday pattern is if anything more pronounced during thesetwo years, this despite using only 11 holidays for original tweets and 15 holidays forretweets. Again, this pattern is highly robust to regression controls.
17R2s are higher for the retweeting operations than original tweets.
8
2.3 Robustness
First stage estimates are robust when we drop the top 10 busiest days for each wave2012-2019 (SI Section 1.2). The magnitude of holiday e↵ect is somewhat smaller thanthat in Table 1. Although very busy trolling days contribute some to the estimatedholiday e↵ect, we still see a qualitatively-similar decrease in the number of tweetson holidays as compared with the non-busiest days.18 Dropping the temperature inSt. Petersburg variable, i.e. only focussing on holiday, also yields similar first stageestimates (SI Section 1.1). We also control for daily temperature in other major Amer-ican/English cities: London, New York, Los Angeles, and Washington DC (SI Section1.3). The first stage point estimates have slightly larger magnitudes with the inclusionof temperature controls in the four Western cities.
2.4 First Stage Mechanism
Holiday timing is an intuitive and common natural experiment in economics. For exam-ple, avoidance by physicians of holiday deliveries creates a pronounced dip in induceddeliveries, which can be used to evaluate health impacts of induction on surroundingdays (Jacobson et al., 2020). Part of the reason is that the shadow cost of leisure in-creases markedly on holidays. This is a fairly straight-forward mechanism for reducedRussian trolling activity on Russian holidays.
Turning to temperature, St. Petersburg is cold. In July, the average daily high tem-perature is 72 �F and daily high temperatures in January are typically below freezing.IRA work has been characterized as occurring indoors and concentrated for a time atan o�ce building at 55 Savushkina Street in St. Petersburg. In an o�ce environment,task productivity peaks around 72 �F (Seppanen et al., 2006; Heal et al., 2017). To theextent that indoor climate control is imperfect at trolling workplaces, warmer ambienttemperatures may bring the indoor temperature closer to the productivity optimum.Alternatively, it could be that cold experienced outside of work has a persistent e↵ecton productivity while at work. Finally, colder temperatures may be associated withfactors like ice that make it more di�cult to get to work.
For completeness, we note factors that did not appear to a↵ect trolling activity.Domestic Russian protests may have distracted IRA workers from the US-interferenceoperation. Motivated by the observation that “Employees were mostly in their 20s”(Chen, 2015), we considered the schedule of local hockey games. Neither appearedto a↵ect the intensity of English-language trolling activity. Finally, increased Brexittrolling did not appear to decrease non-Brexit trolling (through a trolling supply con-straint).
3 Discussion
International political interference is anything but new. Britain interfered in the 1940U.S. election to support Roosevelt. The CIA covertly placed ideological content in EastGerman media (Ya↵a, 2020) and orchestrated the overthrow of Iran’s democratically-elected prime minister Mohammad Mossadeqin in 1953. The CIA also interfered in the1996 Russian election. Scott Shane (The New York Times) noted in a 2018 interview:
18Busiest days may also be an outcome of the Russian holiday schedule.
9
But we have certainly put our thumb on the scales in elections once in Rus-
sia, trying to prevent the election of a communist in 1996 who was leading
in the polls against Boris Yeltsin. And so we, you know, we intervened in a
significant way to help Yeltsin’s re-election.
What is more novel about election interference by the IRA is that it “industrialized theart of trolling” (Chen, 2015). Indeed, a former IRA employee relayed to theWashington
Post : “Your first feeling, when you ended up there, was that you were in some kind offactory that turned lying, telling untruths, into an industrial assembly line....”
The null findings in Bail et al. (2020) resonate with a broader suspicion that whilesalacious, Russian trolling does not have important “downstream” e↵ects, say to elec-tion outcomes. As the New Yorker recently put it, the impactful IRA narrative maybe an “overly convenient” explanation for our home-grown problems and:
What if, to borrow an old horror-movie trope, the call is coming from inside
the house? (Ya↵a, 2020)
That is, domestic election interference by the President, news media disinformation,domestic conspiracy theories, etc. may be more consequential. President Trump himselfhas repeatedly questioned the integrity of mail-in voting and the Director of the USPostal Service has been accused of deliberately slowing mail deliveries. Switching toCOVID-19, Bursztyn et al. (2020) attribute higher mortality to watching Sean Hannityon Fox, who has consistently downplayed the risks of infection. These culprits are alldomestic.
Our novel approach to trolling attempts to isolate variation in disinformation com-ing from abroad. We find that Russian holidays and temperatures in St. Petersburghelp predict daily variation in Russian trolling activity. That is, we argue a phone callis indeed also coming from “outside the house”.
Moreover, if Russian holidays and temperature are exogenous, then they may helpaddress the issue for causal inference posed by endogenous selection into who accesses(Bail et al., 2020) or is the target of (Dutta et al., 2020) IRA content. And if additionalexogenous factors can be identified, this could be a powerful approach for assessingtrolling impacts. As troll tweets include a time stamp, this might include utilizingvariation at a higher frequency than the daily variation we consider.19 When Twitterdiscloses more recent Troll activity – perhaps after the November 2020 election – theseagain can be explored for their relationship to exogenous drivers and thereby theirpotential causal e↵ect on recent election-related outcomes. Twitter accounts fromTurkey, China, Iran, and Venezuela have also been blocked by Twitter alongside thosefrom Russia, so our approach could be extended to consider other source country-specific factors behind trolling.
To illustrate both “proof of concept” as well as some limitations, the appendixsections 2.2, 3.2, and 3.3 consider two downstream outcomes: daily Hedonometer andelection odds. The Hedonometer measures sentiment and inferred happiness of English-language tweets. Reduced form impacts for Russian holidays are not distinguishablefrom 0, implying no detectable impact on happiness. Standard errors are similar topoint estimates. If we take double the point estimates, we can reject impacts of around.01. For comparison, we see that the Hedonometer increases .056 on US holidays, fell0.06 when Brett Kavanaugh was confirmed for the Supreme Court, and fell .2 on the
19For example, election odds are available from BetData by the hour.
10
day of the mass shooting in Dayton (SI Table S16). Analyzing the Hedonometer hasthe advantage of leveraging daily variation across the full time period of wave 1 tweets.
We can also consider daily presidential election odds as inferred from betting mar-kets. A drawback in considering election odds is that we are forced to analyze a shortertime period, which renders our reduced form (but not the first stage) noisier. Consid-ering the 2016 election odds, Iowa Election Markets data began November 17, 2014and ended November 10, 2016. This means we can analyze 2016 odds around just 15holiday events20 and 315 betting days in total.21 The reduced form event study figuresare shown in Figures S1. Democratic odds peak on Russian holidays, while Republicanodds hit their nadir. Unadjusted event study estimates (top panel, Figure S1) are verysimilar to the regression-adjusted ones (middle and bottom panels, Figure S1). TablesS13 and S14 show a statistically significant increase in 2016 Democratic odds on Rus-sian holidays when trolling fell by around a third (Figure 3).22 Conversely, odds forRepublicans fell by a similar amount on the 15 Russian holidays. Notably, the reducedform estimates do not change at all with alternative sets of control variable in TablesS13 and S14 – including month by year fixed e↵ects – suggesting a robust relationship.
We repeat the analysis of 2016 election odds using data from the PredictIt bettingmarket.23 While newer, the PredictIt market is likely thicker than the Iowa ElectionMarket.24 Additionally, only US Citizens may bet on the PredictIt market for presiden-tial candidates,25 appealing for a reason we note below. The unadjusted reduced formfor 2016 again shows a Democratic peak in odds on Russian holidays and a Republicanminimum (Figure S2). This basic pattern persists with regression adjustment.26 Thereduced form e↵ect of holidays is distinguishable from 0 at the 5% significance level,as show in Table S15. E↵ect magnitudes are around .01. If in Instrumental-Variablesfashion one is willing to scale this by the first stage to extrapolate to the eliminationof Russian trolling (see Footnote 28), 2016 odds move by around .03. In contrast,US holidays show no impact on election odds (Table S15). Finally, we note Russianholidays have similar-sized e↵ects in the Iowa and PredictIt data.27
20There are 16 Russian holidays over this period. The last holiday, Nov 4, 2016, is dropped due toincomplete “post” betting data.
21Using a 21 day window around each holiday. If we drop the busiest trolling days and events, we analyzeonly 11 holidays and 231 days for all and original tweets, and 15 holidays and 315 days for retweeted tweets.
22Appendix Table S11 shows first stage in tables for the November 2014-November 2016 period. If anything,the holiday-indued reduction is more obvious than in the full sample.
23We sum prices from the candidate-specific market as it permits analysis of more holidays and morebetting days (315 betting days, same as with the the Iowa data). The candidate-specific PredictIt market issubstantially thicker than the political party PredictIt market, the former having nine times more tradingvolume over our sample period.
24Indeed, the trading volume over our 315 day period is two orders of magnitude higher on PredictIt thanIowa Election Markets. We thank Koleman Strumpf for flagging the di↵erences in thickness/liquidity acrossexchanges.
25 PredictIt’s Parker Howell emailed us on October 19, 2020: “All traders on PredictIt have to be Americancitizens who have passed ID verification. Anyone trying to trade from a Russian IP address would have beenblocked in 2016. If ever we suspect a trader of fraud their account is frozen until they can upload a US-issuedphoto ID.”
26The vertical scale makes the regression-adjusted pattern appear noisier than the unadjusted reducedform (Figure S2).
27The Democrats’ probability increases by 2.5% on Russian holidays in the Iowa data (Table S14) andincreases 2.1% in the PredictIt data (Table S15). Conversely, Republicans’ probability decreases by 1.7% on
11
Our 2020 election odds data begin in November 2016. Wave 1 tweets stop at theend of 2017. This permits a reduced form analysis of just 168 betting days (and 8holiday events in total) that are, moreover, extremely early in the 2020 campaign.While holidays if anything matter more for the first stage in original tweets from late2016 through 2017, in the reduced form we detect no impact on 2020 election oddsthat is distinguishable statistically from zero.
The above reduced form estimates for holidays can be interpreted causally if theconditional independence assumption is satisfied (Angrist and Pischke, 2009).28 Whilethat seems likely enough to us, the noise in the reduced form figures is a reason forcaution. But even if Russian holidays are conditionally independent of potential out-comes, this does not imply that the reduced form impacts are attributable to Russiantrolling. One obvious threat is that Russian holidays might have a direct e↵ect on USelection odds or internet happiness, e.g. through non-trolling Russians living in the US.Unfortunately we have been unable to find information on the number of undisguisedRussians or Russian-Americans placing election bets or tweeting in English, let alonethe e↵ect of Russian holidays on their betting behavior or happiness (as expressed inEnglish on Twitter). For the Hedonometer null result, our prior is that this is verysmall relative to the roughly 59 million non-Russian Twitter users in the US. To theextent that only US citizens can bet on the PredictIt market, we are less concernedabout direct e↵ects of Russian holidays on 2016 election odds, although US citizenswho observe Russian holidays could still exert a direct e↵ect on election odds. That USholidays appear to have no e↵ect on US election odds (cf. the Hedonometer increaseon US holidays) may suggest the direct e↵ect of Russian holidays on betting behaviorby Russian-Americans in PredictIt markets might also be modest.
Our reduced form approach readily generalizes to the analysis of other high-frequencyUS outcomes that may be of interest to researchers and are believed to impact elec-tions, such as time-series variation in political campaign donations, street protests, etc.Our analysis here can be viewed as initial “proof of concept” for future analyses thatemphasize:
1. Exogenous drivers of Russian trolling activity – neglected by the existing litera-ture.
2. Trolling’s causal e↵ect on indirectly-a↵ected outcomes of interest, i.e. outcomeswhere the precise path of content sharing, dissemination, and downstream impactscannot be traced.
These indirect channels may be the most challenging and important ones to understand.
Russian holidays in the Iowa data (Table S14), and decreases by 2.8% in the PredictIt data (Table S15).28We do not conduct an instrumental variables (IV) analysis that predicts subsequently-exposed trolling
activity on Twitter from Russian holidays and St. Petersburg’s weather. There would be some familiarreasons to take such IV estimates with a grain of salt. Most obvious is that Twitter was not the only onlineplatform the IRA has targeted. Part of the e↵ect, assuming there is one, could be coming from variation introlling on platforms like Facebook or Instagram, which would not be captured by the endogenous variableTwitter provided. Similarly, Russian Twitter accounts that were not blocked could be undetected Trolls andfollow a similar (unobserved) first stage on Twitter. These omissions would violate the exclusion restrictionfor the blocked suspected-IRA tweets (endogenous variable) we can observe and analyze. And as always, thestrength of the instruments in the first stage for the particular outcome of interest would need to be assessed(Staiger and Stock, 1997; Lee et al., 2020).
12
References
Angrist, J. D. and Pischke, J.-S. (2009). Mostly Harmless Econometrics: An Empiri-
cist’s Companion. Princeton University Press, Princeton, New Jersey.
Bail, C. A., Guay, B., Maloney, E., Combs, A., Hillygus, D. S., Merhout, F., Freelon,D., and Volfovsky, A. (2020). Assessing the russian internet research agency’s im-pact on the political attitudes and behaviors of american twitter users in late 2017.Proceedings of the National Academy of Sciences, 117(1), 243–250.
Bursztyn, L., Rao, A., Roth, C. P., and Yanagizawa-Drott, D. H. (2020). Misinfor-mation during a pandemic. Working Paper 27417, National Bureau of EconomicResearch.
Chen, A. (2015). The agency. The New York Times Magazine.
Dodds, P., Harris, K., Kloumann, I., Bliss, C., and Danforth, C. (2011). Temporalpatterns of happiness and information in a global social network: Hedonometricsand twitter. PloS one, 6, e26752.
Dutta, U., Hanscom, R., Zhang, J. S., Han, R., Lehman, T., Lv, Q., and Mishra, S.(2020). Analyzing twitter users’ behavior before and after contact by the internetresearch agency.
Enikolopov, R., Makarin, A., and Petrova, M. (2020). Social media and protest par-ticipation: Evidence from russia. Econometrica, 88(4), 1479–1514.
Gorodnichenko, Y., Pham, T., and Talavera, O. (2018). Social media, sentiment andpublic opinions: Evidence from #brexit and #uselection. Working Paper 24631,National Bureau of Economic Research.
Heal, G., sung Park, J., and Zhong, N. (2017). Labor productivity and temperature.Columbia University School of Business.
Im, J., Chandrasekharan, E., Sargent, J., Lighthammer, P., Denby, T., Bhargava, A.,Hemphill, L., Jurgens, D., and Gilbert, E. (2020). Still out there: Modeling andidentifying russian troll accounts on twitter. 12th ACM Conference on Web Science.
Jacobson, M., Kogelnik, M., and Royer, H. (2020). Holiday, just one day out of life:Birth timing and post-natal outcomes. Working Paper 27326, National Bureau ofEconomic Research.
Lee, D. S., McCrary, J., Moreira, M. J., and Porter, J. (2020). Valid t-ratio inferencefor IV. Princeton University working paper.
Linvill, D. and Warren, P. (2020). Troll factories: Manufacturing specialized disinfor-mation on twitter. Political Communication, pages 1–21.
Rhode, P. W. and Strumpf, K. S. (2004). Historical presidential betting markets.Journal of Economic Perspectives, 18(2), 127–141.
13
Seppanen, O., Fisk, W., and Lei, Q. (2006). E↵ect of temperature on task performancein o�ce environment. Ernest Orlando Lawrence Berkeley National Lab.
Staiger, D. and Stock, J. H. (1997). Instrumental variables regression with weak in-struments. Econometrica, 65(3), 557–586.
Ya↵a, J. (2020). Is Russian meddling as dangerous as we think? The New Yorker .
Zhuravskaya, E., Petrova, M., and Enikolopov, R. (2020). Political e↵ects of the inter-net and social media. Annual Review of Economics, 12(1), 415–438.
Zitzewitz, E. (2012). Forensic economics. Journal of Economic Literature, 50(3),731–69.
Figure 1: Time series of tweet activity by wave of public release.
(We drop top 10 busiest days for wave 1, 2, 4 2012-2019 and calculate monthly sum of all tweets.)
040
000
8000
012
0000
1600
00#T
weet
s m
onth
ly
2012m1 2014m1 2016m1 2018m1 2020m1ym
Wave 1 (released in Oct 2018) Wave 2 (Jan 2019)Wave 3 (Jun 2019) Wave 4 (Jun 2020)
14
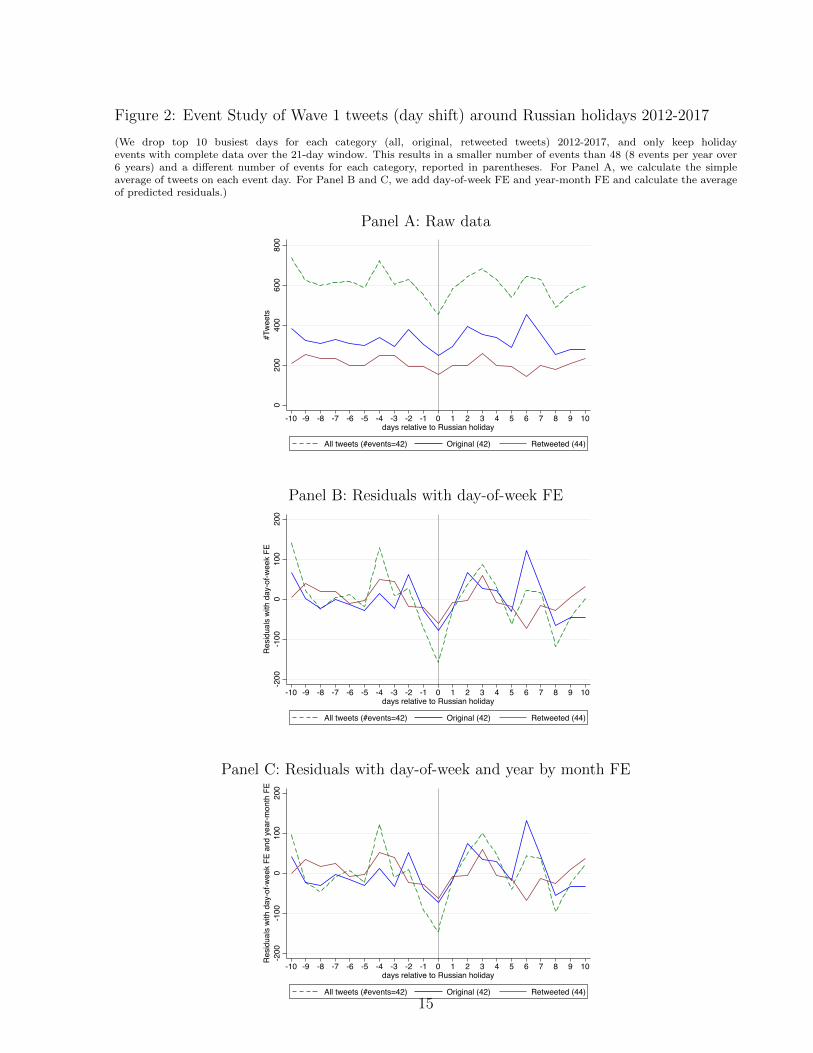
Figure 2: Event Study of Wave 1 tweets (day shift) around Russian holidays 2012-2017
(We drop top 10 busiest days for each category (all, original, retweeted tweets) 2012-2017, and only keep holidayevents with complete data over the 21-day window. This results in a smaller number of events than 48 (8 events per year over6 years) and a di↵erent number of events for each category, reported in parentheses. For Panel A, we calculate the simpleaverage of tweets on each event day. For Panel B and C, we add day-of-week FE and year-month FE and calculate the averageof predicted residuals.)
Panel A: Raw data
020
040
060
080
0#T
weet
s
-10 -9 -8 -7 -6 -5 -4 -3 -2 -1 0 1 2 3 4 5 6 7 8 9 10days relative to Russian holiday
All tweets (#events=42) Original (42) Retweeted (44)
Panel B: Residuals with day-of-week FE
-200
-100
010
020
0Re
sidua
ls wi
th d
ay-o
f-wee
k FE
-10 -9 -8 -7 -6 -5 -4 -3 -2 -1 0 1 2 3 4 5 6 7 8 9 10days relative to Russian holiday
All tweets (#events=42) Original (42) Retweeted (44)
Panel C: Residuals with day-of-week and year by month FE
-200
-100
010
020
0Re
sidua
ls wi
th d
ay-o
f-wee
k FE
and
yea
r-mon
th F
E
-10 -9 -8 -7 -6 -5 -4 -3 -2 -1 0 1 2 3 4 5 6 7 8 9 10days relative to Russian holiday
All tweets (#events=42) Original (42) Retweeted (44)15
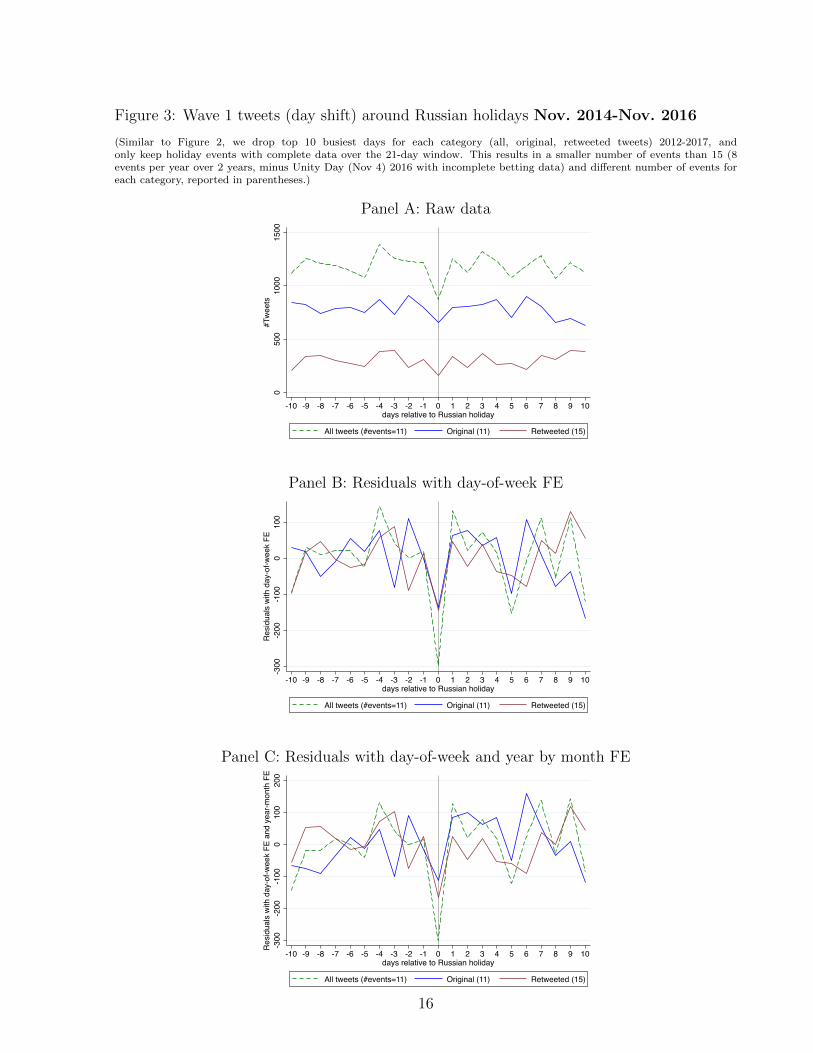
Figure 3: Wave 1 tweets (day shift) around Russian holidays Nov. 2014-Nov. 2016
(Similar to Figure 2, we drop top 10 busiest days for each category (all, original, retweeted tweets) 2012-2017, andonly keep holiday events with complete data over the 21-day window. This results in a smaller number of events than 15 (8events per year over 2 years, minus Unity Day (Nov 4) 2016 with incomplete betting data) and di↵erent number of events foreach category, reported in parentheses.)
Panel A: Raw data
050
010
0015
00#T
weet
s
-10 -9 -8 -7 -6 -5 -4 -3 -2 -1 0 1 2 3 4 5 6 7 8 9 10days relative to Russian holiday
All tweets (#events=11) Original (11) Retweeted (15)
Panel B: Residuals with day-of-week FE
-300
-200
-100
010
0Re
sidua
ls wi
th d
ay-o
f-wee
k FE
-10 -9 -8 -7 -6 -5 -4 -3 -2 -1 0 1 2 3 4 5 6 7 8 9 10days relative to Russian holiday
All tweets (#events=11) Original (11) Retweeted (15)
Panel C: Residuals with day-of-week and year by month FE
-300
-200
-100
010
020
0Re
sidua
ls wi
th d
ay-o
f-wee
k FE
and
yea
r-mon
th F
E
-10 -9 -8 -7 -6 -5 -4 -3 -2 -1 0 1 2 3 4 5 6 7 8 9 10days relative to Russian holiday
All tweets (#events=11) Original (11) Retweeted (15)
16
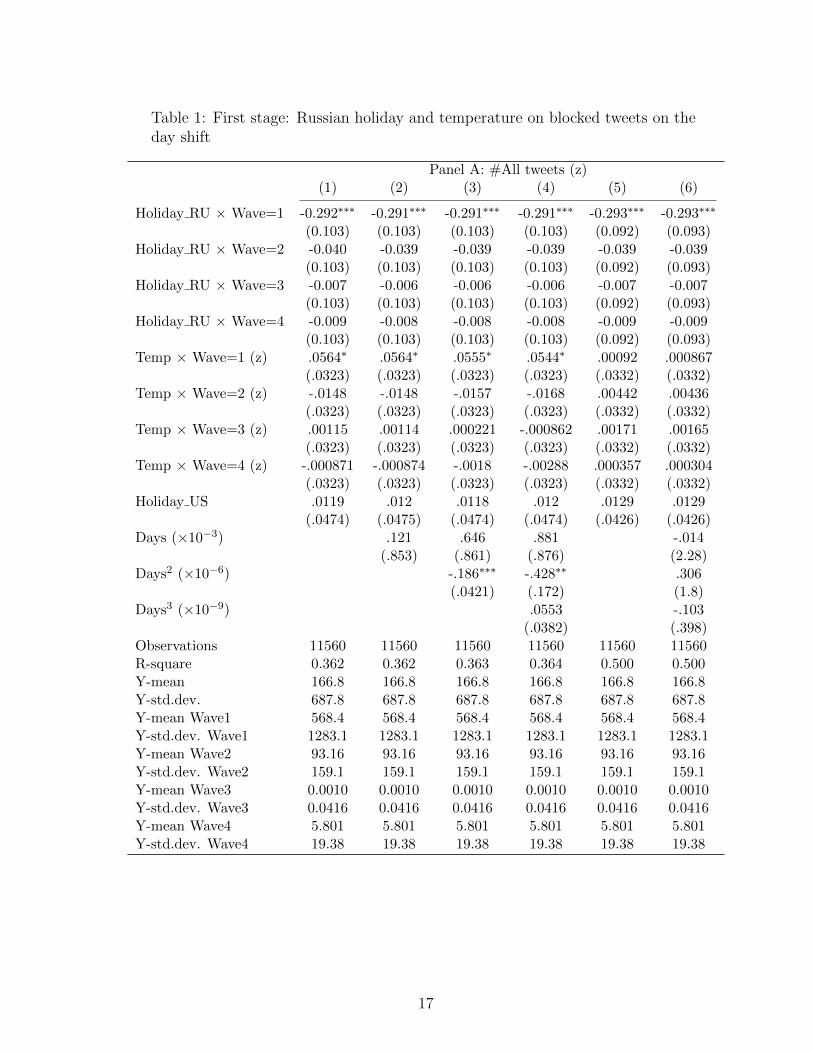
Table 1: First stage: Russian holiday and temperature on blocked tweets on the
day shift
Panel A: #All tweets (z)(1) (2) (3) (4) (5) (6)
Holiday RU ⇥ Wave=1 -0.292⇤⇤⇤ -0.291⇤⇤⇤ -0.291⇤⇤⇤ -0.291⇤⇤⇤ -0.293⇤⇤⇤ -0.293⇤⇤⇤
(0.103) (0.103) (0.103) (0.103) (0.092) (0.093)Holiday RU ⇥ Wave=2 -0.040 -0.039 -0.039 -0.039 -0.039 -0.039
(0.103) (0.103) (0.103) (0.103) (0.092) (0.093)Holiday RU ⇥ Wave=3 -0.007 -0.006 -0.006 -0.006 -0.007 -0.007
(0.103) (0.103) (0.103) (0.103) (0.092) (0.093)Holiday RU ⇥ Wave=4 -0.009 -0.008 -0.008 -0.008 -0.009 -0.009
(0.103) (0.103) (0.103) (0.103) (0.092) (0.093)Temp ⇥ Wave=1 (z) .0564⇤ .0564⇤ .0555⇤ .0544⇤ .00092 .000867
(.0323) (.0323) (.0323) (.0323) (.0332) (.0332)Temp ⇥ Wave=2 (z) -.0148 -.0148 -.0157 -.0168 .00442 .00436
(.0323) (.0323) (.0323) (.0323) (.0332) (.0332)Temp ⇥ Wave=3 (z) .00115 .00114 .000221 -.000862 .00171 .00165
(.0323) (.0323) (.0323) (.0323) (.0332) (.0332)Temp ⇥ Wave=4 (z) -.000871 -.000874 -.0018 -.00288 .000357 .000304
(.0323) (.0323) (.0323) (.0323) (.0332) (.0332)Holiday US .0119 .012 .0118 .012 .0129 .0129
(.0474) (.0475) (.0474) (.0474) (.0426) (.0426)Days (⇥10�3) .121 .646 .881 -.014
(.853) (.861) (.876) (2.28)Days2 (⇥10�6) -.186⇤⇤⇤ -.428⇤⇤ .306
(.0421) (.172) (1.8)Days3 (⇥10�9) .0553 -.103
(.0382) (.398)Observations 11560 11560 11560 11560 11560 11560R-square 0.362 0.362 0.363 0.364 0.500 0.500Y-mean 166.8 166.8 166.8 166.8 166.8 166.8Y-std.dev. 687.8 687.8 687.8 687.8 687.8 687.8Y-mean Wave1 568.4 568.4 568.4 568.4 568.4 568.4Y-std.dev. Wave1 1283.1 1283.1 1283.1 1283.1 1283.1 1283.1Y-mean Wave2 93.16 93.16 93.16 93.16 93.16 93.16Y-std.dev. Wave2 159.1 159.1 159.1 159.1 159.1 159.1Y-mean Wave3 0.0010 0.0010 0.0010 0.0010 0.0010 0.0010Y-std.dev. Wave3 0.0416 0.0416 0.0416 0.0416 0.0416 0.0416Y-mean Wave4 5.801 5.801 5.801 5.801 5.801 5.801Y-std.dev. Wave4 19.38 19.38 19.38 19.38 19.38 19.38
17
Panel B: #Original tweets (z)(1) (2) (3) (4) (5) (6)
Holiday RU ⇥ Wave=1 -0.266⇤⇤ -0.265⇤⇤ -0.265⇤⇤ -0.265⇤⇤ -0.267⇤⇤⇤ -0.266⇤⇤⇤
(0.109) (0.109) (0.109) (0.109) (0.100) (0.100)Holiday RU ⇥ Wave=2 -0.016 -0.015 -0.015 -0.015 -0.016 -0.016
(0.109) (0.109) (0.109) (0.109) (0.100) (0.100)Holiday RU ⇥ Wave=3 -0.006 -0.005 -0.005 -0.005 -0.006 -0.006
(0.109) (0.109) (0.109) (0.109) (0.100) (0.100)Holiday RU ⇥ Wave=4 -0.008 -0.007 -0.007 -0.007 -0.008 -0.008
(0.109) (0.109) (0.109) (0.109) (0.100) (0.100)Temp ⇥ Wave=1 (z) .0957⇤⇤⇤ .0957⇤⇤⇤ .0951⇤⇤⇤ .0916⇤⇤⇤ .0293 .0293
(.0342) (.0342) (.0342) (.0342) (.0358) (.0358)Temp ⇥ Wave=2 (z) .00619 .00619 .0056 .00216 .00942 .0094
(.0342) (.0342) (.0342) (.0342) (.0358) (.0358)Temp ⇥ Wave=3 (z) .000539 .000536 -.0000525 -.0035 .000916 .000892
(.0342) (.0342) (.0342) (.0342) (.0358) (.0358)Temp ⇥ Wave=4 (z) -.00182 -.00182 -.00241 -.00585 -.000759 -.000783
(.0342) (.0342) (.0342) (.0342) (.0358) (.0358)Holiday US .0267 .0268 .0266 .0272 .0289 .029
(.0502) (.0502) (.0502) (.0502) (.046) (.046)Days (⇥10�3) .12 .454 1.2 .136
(.903) (.912) (.927) (2.46)Days2 (⇥10�6) -.119⇤⇤⇤ -.889⇤⇤⇤ .123
(.0446) (.182) (1.94)Days3 (⇥10�9) .176⇤⇤⇤ -.0514
(.0404) (.43)Observations 11560 11560 11560 11560 11560 11560R-square 0.283 0.283 0.284 0.285 0.415 0.415Y-mean 98.98 98.98 98.98 98.98 98.98 98.98Y-std.dev. 563.6 563.6 563.6 563.6 563.6 563.6Y-mean Wave1 370.4 370.4 370.4 370.4 370.4 370.4Y-std.dev. Wave1 1081.3 1081.3 1081.3 1081.3 1081.3 1081.3Y-mean Wave2 21.04 21.04 21.04 21.04 21.04 21.04Y-std.dev. Wave2 55.05 55.05 55.05 55.05 55.05 55.05Y-mean Wave3 0.0010 0.0010 0.0010 0.0010 0.0010 0.0010Y-std.dev. Wave3 0.0416 0.0416 0.0416 0.0416 0.0416 0.0416Y-mean Wave4 4.449 4.449 4.449 4.449 4.449 4.449Y-std.dev. Wave4 18.92 18.92 18.92 18.92 18.92 18.92
18

Panel C: #Retweeted tweets (z)(1) (2) (3) (4) (5) (6)
Holiday RU ⇥ Wave=1 -0.178⇤ -0.178⇤ -0.177⇤ -0.178⇤ -0.179⇤⇤ -0.180⇤⇤
(0.103) (0.103) (0.103) (0.102) (0.085) (0.085)Holiday RU ⇥ Wave=2 -0.065 -0.065 -0.064 -0.065 -0.063 -0.064
(0.103) (0.103) (0.103) (0.102) (0.085) (0.085)Holiday RU ⇥ Wave=3 -0.005 -0.004 -0.004 -0.004 -0.004 -0.005
(0.103) (0.103) (0.103) (0.102) (0.085) (0.085)Holiday RU ⇥ Wave=4 -0.006 -0.006 -0.006 -0.006 -0.006 -0.007
(0.103) (0.103) (0.103) (0.102) (0.085) (0.085)Temp ⇥ Wave=1 (z) -.0535⇤ -.0535⇤ -.0546⇤ -.0503 -.056⇤ -.0561⇤
(.0322) (.0322) (.0321) (.0321) (.0304) (.0304)Temp ⇥ Wave=2 (z) -.0481 -.0481 -.0492 -.0449 -.00802 -.0081
(.0322) (.0322) (.0321) (.0321) (.0304) (.0304)Temp ⇥ Wave=3 (z) .0017 .0017 .000639 .00486 .00231 .00223
(.0322) (.0322) (.0321) (.0321) (.0304) (.0304)Temp ⇥ Wave=4 (z) .0015 .0015 .000433 .00466 .00237 .00229
(.0322) (.0322) (.0321) (.0321) (.0304) (.0304)Holiday US -.0242 -.0241 -.0244 -.0251 -.0263 -.0264
(.0472) (.0472) (.0472) (.0471) (.039) (.039)Days (⇥10�3) .0542 .659 -.26 -.304
(.849) (.857) (.871) (2.08)Days2 (⇥10�6) -.214⇤⇤⇤ .73⇤⇤⇤ .496
(.0419) (.171) (1.65)Days3 (⇥10�9) -.216⇤⇤⇤ -.147
(.038) (.364)Observations 11560 11560 11560 11560 11560 11560R-square 0.373 0.373 0.374 0.376 0.584 0.584Y-mean 67.87 67.87 67.87 67.87 67.87 67.87Y-std.dev. 285.6 285.6 285.6 285.6 285.6 285.6Y-mean Wave1 198.0 198.0 198.0 198.0 198.0 198.0Y-std.dev. Wave1 532.7 532.7 532.7 532.7 532.7 532.7Y-mean Wave2 72.11 72.11 72.11 72.11 72.11 72.11Y-std.dev. Wave2 128.2 128.2 128.2 128.2 128.2 128.2Y-mean Wave3 0 0 0 0 0 0Y-std.dev. Wave3 0 0 0 0 0 0Y-mean Wave4 1.351 1.351 1.351 1.351 1.351 1.351Y-std.dev. Wave4 2.663 2.663 2.663 2.663 2.663 2.663DOW FEs Y Y Y Y Y YWave-Month FEs Y Y Y YWave-Year FEs Y Y Y YWave-Year-Month FEs Y YNotes: The smaller sample size than four times #days 2012-2019 is due to 32 days with no temperaturedata. * significant 10% level; ** significant at 5% level; *** significant at 1% level.
19