russell investment company ii plc
TRANSCRIPT
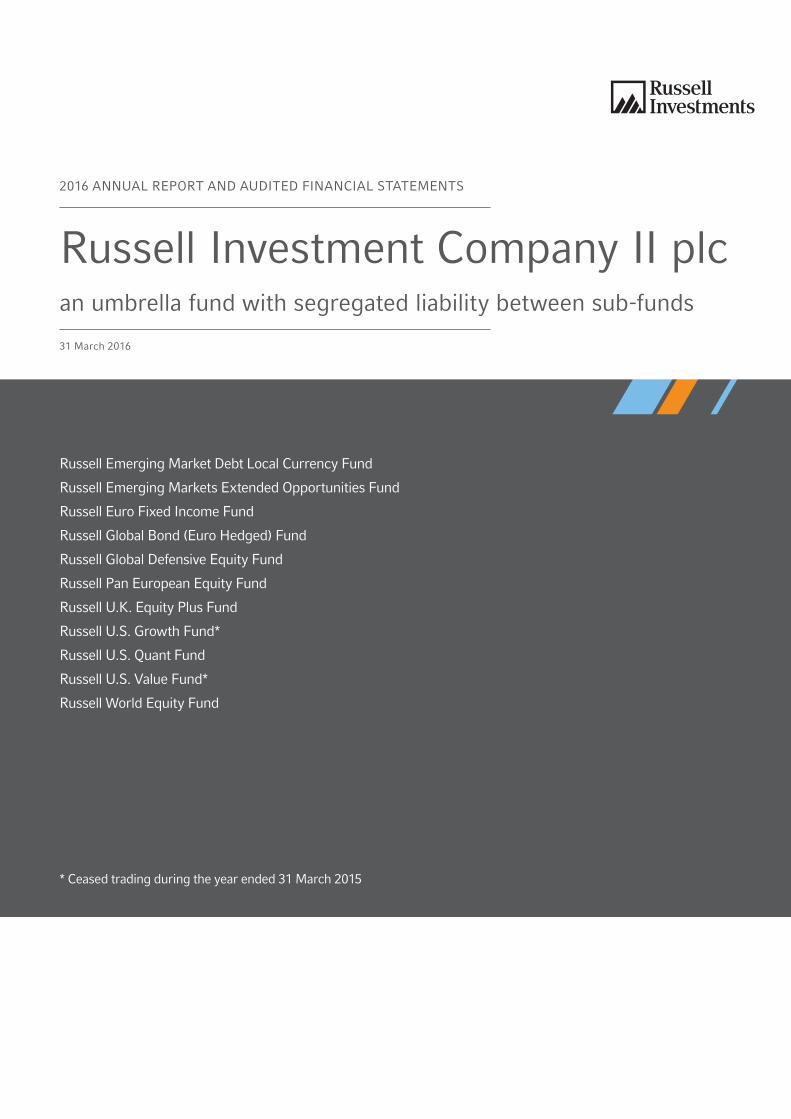
2016 ANNUAL REPORT AND AUDITED FINANCIAL STATEMENTS
31 March 2016
Russell Investment Company II plcan umbrella fund with segregated liability between sub-funds
Russell Emerging Market Debt Local Currency Fund
Russell Emerging Markets Extended Opportunities Fund
Russell Euro Fixed Income Fund
Russell Global Bond (Euro Hedged) Fund
Russell Global Defensive Equity Fund
Russell Pan European Equity Fund
Russell U.K. Equity Plus Fund
Russell U.S. Growth Fund*
Russell U.S. Quant Fund
Russell U.S. Value Fund*
Russell World Equity Fund
* Ceased trading during the year ended 31 March 2015

Russell Investment Company II plc
Contents
Contents
Administration of the Company .............................................................................................................................. 2 Background to the Company ................................................................................................................................. 4 Directors’ Report .................................................................................................................................................... 5 Custodian and Trustee’s Report ............................................................................................................................ 7 Independent Auditors’ Report ................................................................................................................................ 8 Combined Statements ........................................................................................................................................... 11 Russell Emerging Market Debt Local Currency Fund ........................................................................................... 14 Russell Emerging Markets Extended Opportunities Fund ..................................................................................... 29 Russell Euro Fixed Income Fund ........................................................................................................................... 50 Russell Global Bond (Euro Hedged) Fund ............................................................................................................ 73 Russell Global Defensive Equity Fund .................................................................................................................. 122 Russell Pan European Equity Fund ....................................................................................................................... 139 Russell U.K. Equity Plus Fund ............................................................................................................................... 155 Russell U.S. Growth Fund* .................................................................................................................................... 165 Russell U.S. Quant Fund ....................................................................................................................................... 168 Russell U.S. Value Fund* ...................................................................................................................................... 182 Russell World Equity Fund .................................................................................................................................... 185 Notes to the Financial Statements ......................................................................................................................... 208
* Ceased trading during the year ended 31 March 2015.
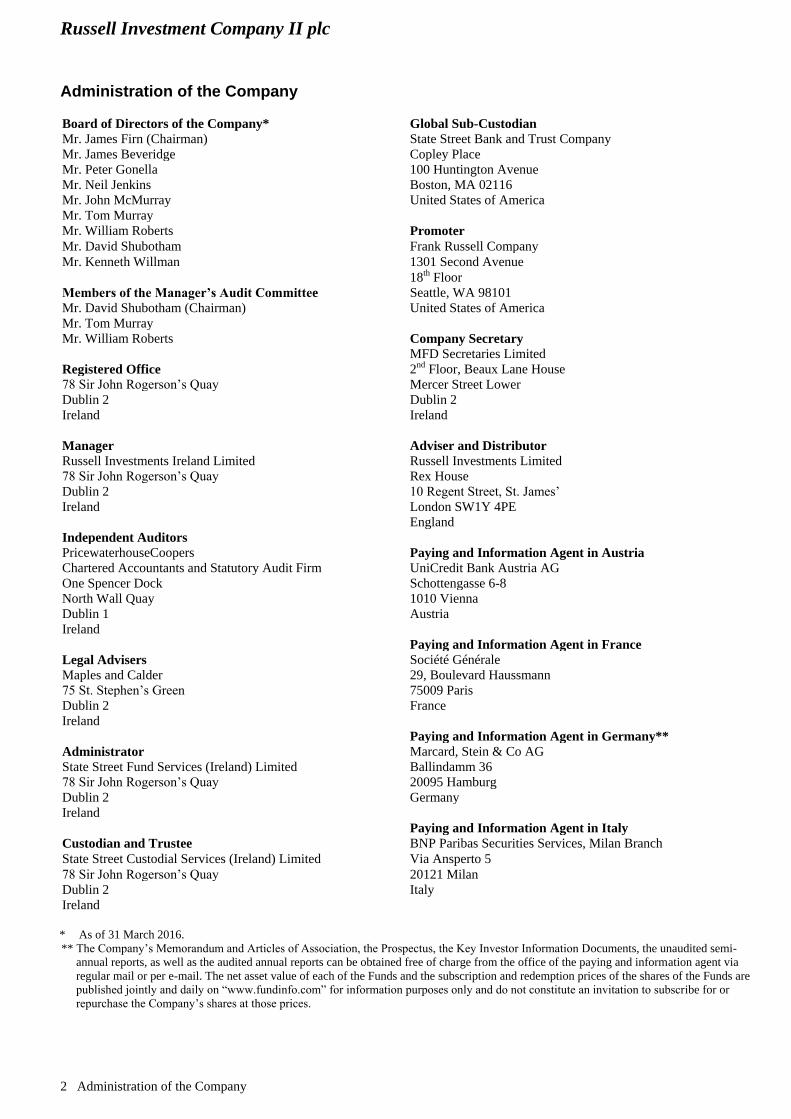
Russell Investment Company II plc
Administration of the Company
2 Administration of the Company
Board of Directors of the Company* Global Sub-Custodian
Mr. James Firn (Chairman) State Street Bank and Trust Company
Mr. James Beveridge Copley Place
Mr. Peter Gonella 100 Huntington Avenue
Mr. Neil Jenkins Boston, MA 02116
Mr. John McMurray United States of America
Mr. Tom Murray
Mr. William Roberts Promoter
Mr. David Shubotham Frank Russell Company
Mr. Kenneth Willman 1301 Second Avenue
18th Floor
Members of the Manager’s Audit Committee Seattle, WA 98101
Mr. David Shubotham (Chairman) United States of America
Mr. Tom Murray
Mr. William Roberts Company Secretary
MFD Secretaries Limited
Registered Office 2nd Floor, Beaux Lane House
78 Sir John Rogerson’s Quay Mercer Street Lower
Dublin 2 Dublin 2
Ireland Ireland
Manager Adviser and Distributor
Russell Investments Ireland Limited Russell Investments Limited
78 Sir John Rogerson’s Quay Rex House
Dublin 2 10 Regent Street, St. James’
Ireland London SW1Y 4PE
England
Independent Auditors
PricewaterhouseCoopers Paying and Information Agent in Austria
Chartered Accountants and Statutory Audit Firm UniCredit Bank Austria AG
One Spencer Dock Schottengasse 6-8
North Wall Quay 1010 Vienna
Dublin 1 Austria
Ireland
Paying and Information Agent in France
Legal Advisers Société Générale
Maples and Calder 29, Boulevard Haussmann
75 St. Stephen’s Green 75009 Paris
Dublin 2 France
Ireland
Paying and Information Agent in Germany**
Administrator Marcard, Stein & Co AG
State Street Fund Services (Ireland) Limited Ballindamm 36
78 Sir John Rogerson’s Quay 20095 Hamburg
Dublin 2 Germany
Ireland
Paying and Information Agent in Italy
Custodian and Trustee BNP Paribas Securities Services, Milan Branch
State Street Custodial Services (Ireland) Limited Via Ansperto 5
78 Sir John Rogerson’s Quay 20121 Milan
Dublin 2 Italy
Ireland
* As of 31 March 2016.
** The Company’s Memorandum and Articles of Association, the Prospectus, the Key Investor Information Documents, the unaudited semi-
annual reports, as well as the audited annual reports can be obtained free of charge from the office of the paying and information agent via
regular mail or per e-mail. The net asset value of each of the Funds and the subscription and redemption prices of the shares of the Funds are
published jointly and daily on “www.fundinfo.com” for information purposes only and do not constitute an invitation to subscribe for or
repurchase the Company’s shares at those prices.
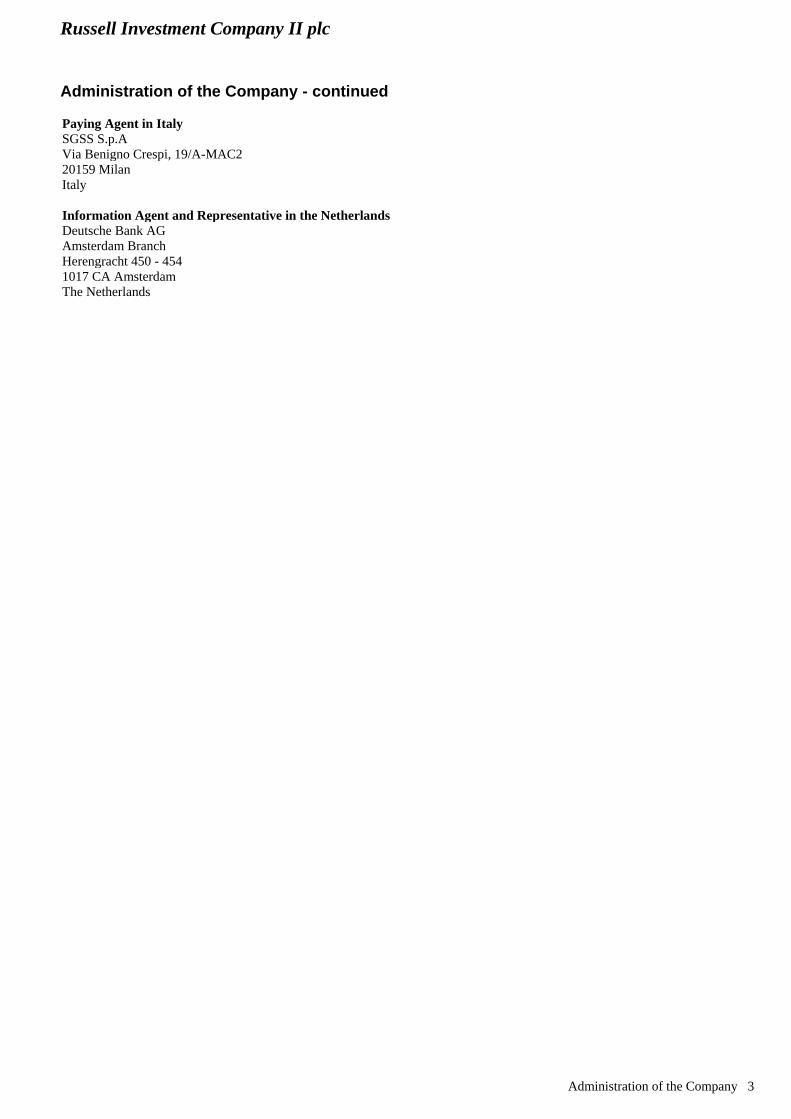
Russell Investment Company II plc
Administration of the Company - continued
Administration of the Company 3
Paying Agent in Italy
SGSS S.p.A
Via Benigno Crespi, 19/A-MAC2
20159 Milan
Italy
Information Agent and Representative in the Netherlands
Deutsche Bank AG
Amsterdam Branch
Herengracht 450 - 454
1017 CA Amsterdam
The Netherlands
Russell Investment Company II plc
Background to the Company
4 Background to the Company
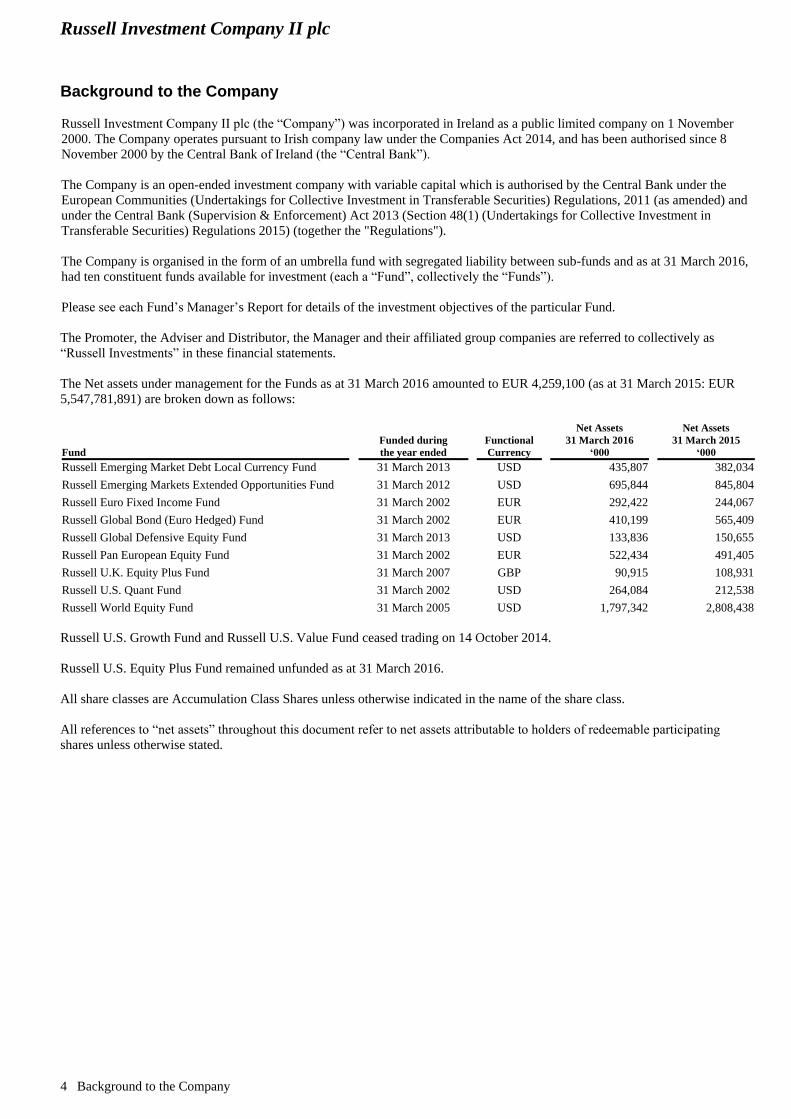
Russell Investment Company II plc (the “Company”) was incorporated in Ireland as a public limited company on 1 November
2000. The Company operates pursuant to Irish company law under the Companies Act 2014, and has been authorised since 8
November 2000 by the Central Bank of Ireland (the “Central Bank”).
The Company is an open-ended investment company with variable capital which is authorised by the Central Bank under the
European Communities (Undertakings for Collective Investment in Transferable Securities) Regulations, 2011 (as amended) and
under the Central Bank (Supervision & Enforcement) Act 2013 (Section 48(1) (Undertakings for Collective Investment in
Transferable Securities) Regulations 2015) (together the "Regulations").
The Company is organised in the form of an umbrella fund with segregated liability between sub-funds and as at 31 March 2016,
had ten constituent funds available for investment (each a “Fund”, collectively the “Funds”).
Please see each Fund’s Manager’s Report for details of the investment objectives of the particular Fund.
The Promoter, the Adviser and Distributor, the Manager and their affiliated group companies are referred to collectively as
“Russell Investments” in these financial statements.
The Net assets under management for the Funds as at 31 March 2016 amounted to EUR 4,259,100 (as at 31 March 2015: EUR
5,547,781,891) are broken down as follows:
Fund
Funded during
the year ended
Functional
Currency
Net Assets
31 March 2016
‘000
Net Assets
31 March 2015
‘000
Russell Emerging Market Debt Local Currency Fund 31 March 2013 USD 435,807 382,034
Russell Emerging Markets Extended Opportunities Fund 31 March 2012 USD 695,844 845,804
Russell Euro Fixed Income Fund 31 March 2002 EUR 292,422 244,067
Russell Global Bond (Euro Hedged) Fund 31 March 2002 EUR 410,199 565,409
Russell Global Defensive Equity Fund 31 March 2013 USD 133,836 150,655
Russell Pan European Equity Fund 31 March 2002 EUR 522,434 491,405
Russell U.K. Equity Plus Fund 31 March 2007 GBP 90,915 108,931
Russell U.S. Quant Fund 31 March 2002 USD 264,084 212,538
Russell World Equity Fund 31 March 2005 USD 1,797,342 2,808,438
Russell U.S. Growth Fund and Russell U.S. Value Fund ceased trading on 14 October 2014.
Russell U.S. Equity Plus Fund remained unfunded as at 31 March 2016.
All share classes are Accumulation Class Shares unless otherwise indicated in the name of the share class.
All references to “net assets” throughout this document refer to net assets attributable to holders of redeemable participating
shares unless otherwise stated.
Russell Investment Company II plc
Directors’ Report
Directors’ Report 5
The Directors submit their report together with the audited financial statements for the year ended 31 March 2016.
Directors’ responsibilities
The Directors are responsible for preparing the Directors’ report and the financial statements in accordance with Irish law.
Irish law requires the Directors to prepare financial statements for each financial year that give a true and fair view of the
Company’s assets, liabilities and financial position as at the end of the financial year and of the profit or loss of the Company for
the financial year. Under that law the Directors have prepared the financial statements in accordance with Generally Accepted
Accounting Practice in Ireland (accounting standards issued by the Financial Reporting Council and promulgated by the Institute
of Chartered Accountants in Ireland) and Irish law. Under Irish law, the Directors shall not approve the financial statements unless they are satisfied that they give a true and fair
view of the Company’s assets, liabilities and financial position as at the end of the financial year and the profit or loss of the
Company for the financial year.
In preparing these financial statements, the Directors are required to:
select suitable accounting policies and then apply them consistently;
make estimates and judgements that are reasonable and prudent,
state whether the financial statements have been prepared in accordance with applicable accounting standards and
identify the standards in question, subject to any material departures from those standards being disclosed and explained
in the notes to the financial statements; and
prepare the financial statements on a going concern basis unless it is inappropriate to presume that the Company will
continue in business. The Directors are responsible for keeping adequate accounting records that are sufficient to:
correctly record and explain the transactions of the Company;
enable, at any time, the assets, liabilities, financial position and profit or loss of the Company to be determined with
reasonable accuracy; and
enable the Directors to ensure that the financial statements comply with the Companies Act 2014 and enable those
financial statements to be audited. The Directors confirm that they believe that they have complied with the above requirements in preparing the financial
statements. The Directors are responsible for the maintenance and integrity of the corporate and financial information relating to the
Company which may be included on Russell Investments Limited’s (the “Adviser”) website. Legislation in the Republic of
Ireland governing the preparation and dissemination of financial statements may differ from legislation in other jurisdictions. In carrying out the above requirements, the Directors have appointed Russell Investments Ireland Limited as manager (the
“Manager”) and the Manager has appointed State Street Fund Services (Ireland) Limited to act as administrator (the
“Administrator”) of the Company. The Directors are also responsible for safeguarding the assets of the Company. In this regard they have appointed State Street
Custodial Services (Ireland) Limited (the “Custodian and Trustee”) as custodian and trustee to the Company pursuant to the terms
of a custodian agreement. The Directors have a responsibility for taking such steps as are reasonably open to them to prevent and
detect fraud and other irregularities. The Directors believe that they have complied with the requirements of the Companies Act
2014, with regard to accounting records by employing an experienced administrator with appropriate expertise and by providing
adequate resources to the financial function. The accounting records of the Company are maintained by the Administrator at 78
Sir John Rogerson’s Quay, Dublin 2, Ireland. Distribution policy Please refer to note 8 to the financial statements for details of the distribution policy of the Funds. Connected party transactions
Regulation 41 of the UCITS Regulations “Restrictions of transactions with connected persons” states that “A responsible person
shall ensure that any transaction between a UCITS and a connected person conducted a) at arm’s length; and b) in the best interest
of the unit-holders of the UCITS”.
Russell Investment Company II plc
Directors’ Report - continued
6 Directors’ Report
As required under UCITS Regulation 78.4, the Directors, as responsible persons are satisfied that there are in place arrangements,
evidenced by written procedures, to ensure that the obligations that are prescribed by Regulation 41(1) are applied to all
transactions with a connected party; and all transactions with a connected parties that were entered into during the period to which
the report relates complied with the obligations that are prescribed by Regulation 41(1).
Review of performance of the business, principal activities and future developments of the business
A detailed performance review of the business, principal activities and future developments is included in the Manager’s Report
for each Fund.
Principal risks
A detailed analysis of the risks facing each Fund is included in Note 12 of the financial statements.
Results and dividends
The results and dividends declared for the year are set out in the Profit and Loss Account for each Fund.
Significant events during the year
Significant events during the year are disclosed in Note 16 of the financial statements.
Significant events since the year end
Significant events since the year end are disclosed in Note 17 of the financial statements.
Voluntary adoption of the Corporate Governance Code
The Irish Funds (“IF”) in association with the Central Bank has published a corporate governance code (the “IFIA Code”) that
may be adopted on a voluntary basis by Irish authorised investment funds. The Board of Directors voluntarily adopted the IFIA
Code as the Company’s corporate governance code effective from 31 December 2012. The Company has been in compliance
with the IFIA Code since its adoption.
Directors
The name and nationality of persons who were Directors at any time during the year ended 31 March 2016 are set out below. All
Directors are non-executive directors. Except where indicated, all acted as Directors for the year.
Mr. James Firn (American and British) (Chairman)
Mr. James Beveridge (British)
Mr. Peter Gonella (British)
Mr. Neil Jenkins (British)
Mr. John McMurray (American)
Mr. Tom Murray (Irish)
Mr. William Roberts (British and Irish resident)
Mr. David Shubotham (Irish)
Mr. Kenneth Willman (American and British)
Directors’ and Company Secretary’s interests
None of the Directors or the Company Secretary hold or held any beneficial interest in the shares of the Company during the year.
Each of the Directors is employed by Russell Investments entities except for Mr. Tom Murray, Mr. William Roberts, Mr. David
Shubotham and Mr. James Firn. Mr. Firn is a former employee of Russell Investments who retired in June 2014. He continues to
act as a director of Russell Investments Ireland Limited and the funds managed by Russell Investments Ireland Limited.
No Director had at any time during the year or at the year end, a material interest in any contract of significance, in relation to the
business of the Company.
Independent Auditors
The Auditors, PricewaterhouseCoopers, will be re-appointed in accordance with section 383 the Companies Act 2014.
On behalf of the Board
Mr. William Roberts Mr. Tom Murray
12 July 2016
Russell Investment Company II plc
Custodian and Trustee’s Report
Custodian and Trustee’s Report 7
We have enquired into the conduct of Russell Investment Company II plc (the “Company”) for the year ended 31 March 2016, in
our capacity as Custodian and Trustee to the Company.
This report including the opinion has been prepared for and solely for the shareholders in the Company as a body, in accordance
with the Part 5 of the European Communities (Undertakings for Collective Investment in Transferable Securities) Regulations
2011 as amended, (the “UCITS Regulations”) and for no other purpose. We do not, in giving this opinion, accept or assume
responsibility for any other purpose or to any other person to whom this report is shown.
Responsibilities of the Custodian and Trustee
Our duties and responsibilities are outlined in Part 5 of the UCITS Regulations. One of those duties is to enquire into the conduct
of the Company in each accounting year and report thereon to the shareholders.
Our report shall state whether, in our opinion, the Company has been managed in that year in accordance with the provisions of
the Company’s Memorandum and Articles of Association and the UCITS Regulations. It is the overall responsibility of the
Company to comply with these provisions. If the Company has not so complied, we as Custodian must state why this is the case
and outline the steps which we have taken to rectify the situation.
Basis of Custodian and Trustee Opinion
The Custodian conducts such reviews as it, in its reasonable opinion, considers necessary in order to comply with its duties as
outlined in Part 5 of the UCITS Regulations and to ensure that, in all material respects, the Company has been managed (i) in
accordance with the limitations imposed on its investment and borrowing powers by the provisions of its constitutional
documentation and the appropriate regulations and (ii) otherwise in accordance with the Company’s constitutional documentation
and the appropriate regulations.
Opinion In our opinion, the Company has been managed during the year, in all material respects:
(i) in accordance with the limitations imposed on the investment and borrowing powers of the Company by the
Memorandum & Articles of Association, the UCITS Regulations and the Central Bank (Supervision and Enforcement)
Act 2013 (Section 48(1); (Undertakings for Collective Investment in Transferable Securities) Regulations 2015 (the
“Central Bank UCITS Regulations”) and
(ii) otherwise in accordance with the provisions of the Memorandum & Articles of Association and the Central Bank UCITS
Regulations.
State Street Custodial Services (Ireland) Limited
78 Sir John Rogerson’s Quay
Dublin 2
Ireland
12 July 2016
PricewaterhouseCoopers, One Spencer Dock, North Wall Quay, Dublin 1, Ireland, I.D.E. Box No. 137
T: +353 (0) 1 792 6000, F: +353 (0) 1 792 6200, www.pwc.ie Chartered Accountants
8 Independent Auditors’ Report
Independent auditors’ report to the members of Russell Investment Company
II plc
Report on the financial statements
Our opinion
In our opinion, Russell Investment Company II plc’s financial statements (the “financial statements”):
give a true and fair view of the company’s and funds’ assets, liabilities and financial position as at 31 March 2016 and of
their results for the year then ended;
have been properly prepared in accordance with Generally Accepted Accounting Practice in Ireland; and
have been properly prepared in accordance with the requirements of the Companies Act 2014 and the European Communities
(Undertakings for Collective Investment in Transferable Securities) Regulations 2011 (as amended).
What we have audited
The financial statements comprise:
the balance sheet as at 31 March 2016;
the profit and loss account for the year then ended;
the statement of changes in net assets attributable to redeemable participating shareholders for the year then ended;
the schedule of investments for each of the funds as at 31 March 2016; and
the notes to the financial statements for the company and for each of its funds which include a summary of significant
accounting policies and other explanatory information.
The financial reporting framework that has been applied in the preparation of the financial statements is Irish law and accounting
standards issued by the Financial Reporting Council and promulgated by the Institute of Chartered Accountants in Ireland
(Generally Accepted Accounting Practice in Ireland).
In applying the financial reporting framework, the directors have made a number of subjective judgements, for example in respect
of significant accounting estimates. In making such estimates, they have made assumptions and considered future events.
PricewaterhouseCoopers, One Spencer Dock, North Wall Quay, Dublin 1, Ireland, I.D.E. Box No. 137
T: +353 (0) 1 792 6000, F: +353 (0) 1 792 6200, www.pwc.ie Chartered Accountants
Independent Auditors’ Report 9
Independent auditors’ report to the members of Russell Investment Company
II plc - continued
Matters on which we are required to report by the Companies Act 2014
We have obtained all the information and explanations which we consider necessary for the purposes of our audit.
In our opinion the accounting records of the company were sufficient to permit the financial statements to be readily and
properly audited.
The financial statements are in agreement with the accounting records.
In our opinion the information given in the Directors' Report is consistent with the financial statements.
Matter on which we are required to report by exception
Directors’ remuneration and transactions
Under the Companies Act 2014 we are required to report to you if, in our opinion, the disclosures of directors’ remuneration and
transactions specified by sections 305 to 312 of that Act have not been made. We have no exceptions to report arising from this
responsibility.
Responsibilities for the financial statements and the audit
Our responsibilities and those of the directors
As explained more fully in the Directors’ Responsibilities set out on page 5, the directors are responsible for the preparation of the
financial statements and for being satisfied that they give a true and fair view.
Our responsibility is to audit and express an opinion on the financial statements in accordance with Irish law and International
Standards on Auditing (UK and Ireland). Those standards require us to comply with the Auditing Practices Board’s Ethical
Standards for Auditors.
This report, including the opinions, has been prepared for and only for the company’s members as a body in accordance with
section 391 of the Companies Act 2014 and for no other purpose. We do not, in giving these opinions, accept or assume
responsibility for any other purpose or to any other person to whom this report is shown or into whose hands it may come save
where expressly agreed by our prior consent in writing.
PricewaterhouseCoopers, One Spencer Dock, North Wall Quay, Dublin 1, Ireland, I.D.E. Box No. 137
T: +353 (0) 1 792 6000, F: +353 (0) 1 792 6200, www.pwc.ie Chartered Accountants
10 Independent Auditors’ Report
Independent auditors’ report to the members of Russell Investment Company
II plc - continued
What an audit of financial statements involves
We conducted our audit in accordance with International Standards on Auditing (UK and Ireland). An audit involves obtaining
evidence about the amounts and disclosures in the financial statements sufficient to give reasonable assurance that the financial
statements are free from material misstatement, whether caused by fraud or error. This includes an assessment of:
whether the accounting policies are appropriate to the company’s circumstances and have been consistently applied and
adequately disclosed;
the reasonableness of significant accounting estimates made by the directors; and
the overall presentation of the financial statements.
We primarily focus our work in these areas by assessing the directors’ judgements against available evidence, forming our own
judgements, and evaluating the disclosures in the financial statements.
We test and examine information, using sampling and other auditing techniques, to the extent we consider necessary to provide a
reasonable basis for us to draw conclusions. We obtain audit evidence through testing the effectiveness of controls, substantive
procedures or a combination of both.
In addition, we read all the financial and non-financial information in the annual report to identify material inconsistencies with
the audited financial statements and to identify any information that is apparently materially incorrect based on, or materially
inconsistent with, the knowledge acquired by us in the course of performing the audit. If we become aware of any apparent
material misstatements or inconsistencies we consider the implications for our report.
Patricia Johnston
for and on behalf of PricewaterhouseCoopers
Chartered Accountants and Statutory Audit Firm
Dublin
12 July 2016
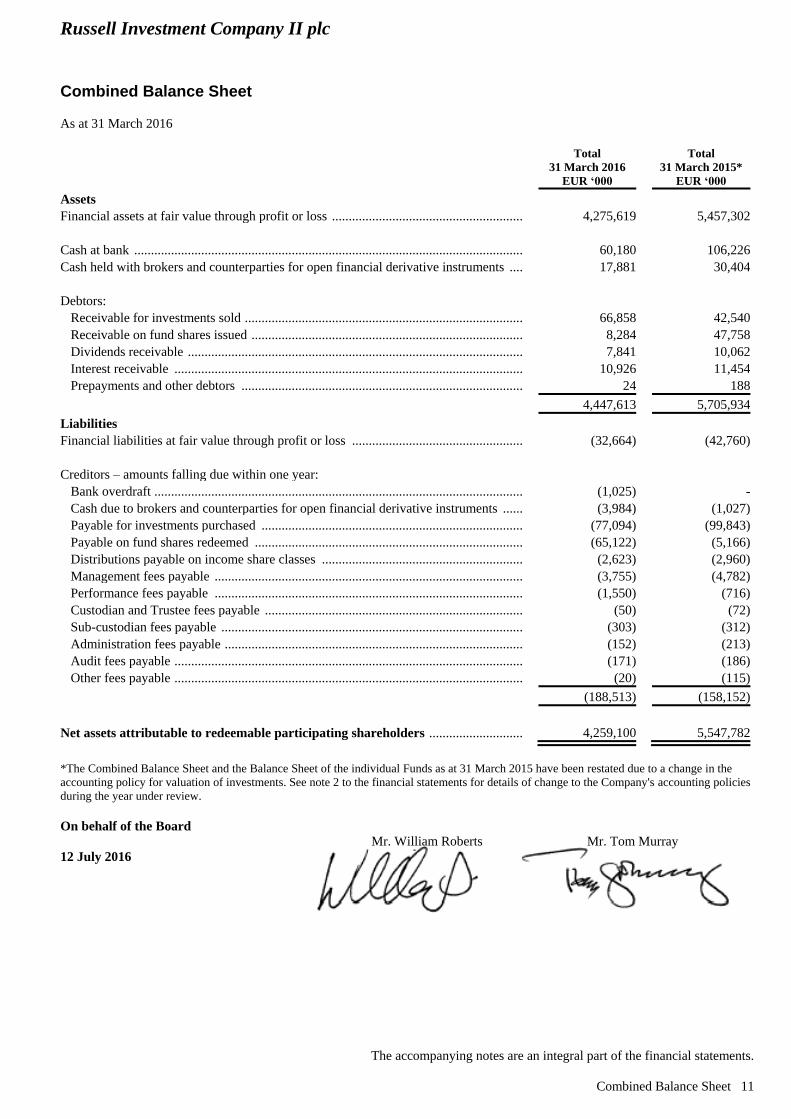
Russell Investment Company II plc
Combined Balance Sheet
As at 31 March 2016
The accompanying notes are an integral part of the financial statements.
Combined Balance Sheet 11
Total
31 March 2016
EUR ‘000
Total
31 March 2015*
EUR ‘000
Assets
Financial assets at fair value through profit or loss ........................................................... 4,275,619 5,457,302
Cash at bank ........................................................................................................................... 60,180 106,226
Cash held with brokers and counterparties for open financial derivative instruments ........... 17,881 30,404
Debtors:
Receivable for investments sold ............................................................................................ 66,858 42,540
Receivable on fund shares issued .......................................................................................... 8,284 47,758
Dividends receivable ............................................................................................................. 7,841 10,062
Interest receivable ................................................................................................................. 10,926 11,454
Prepayments and other debtors ............................................................................................. 24 188
4,447,613 5,705,934
Liabilities
Financial liabilities at fair value through profit or loss .......................................................... (32,664) (42,760)
Creditors – amounts falling due within one year:
Bank overdraft ....................................................................................................................... (1,025) -
Cash due to brokers and counterparties for open financial derivative instruments ............... (3,984) (1,027)
Payable for investments purchased ....................................................................................... (77,094) (99,843)
Payable on fund shares redeemed ......................................................................................... (65,122) (5,166)
Distributions payable on income share classes ..................................................................... (2,623) (2,960)
Management fees payable ..................................................................................................... (3,755) (4,782)
Performance fees payable ..................................................................................................... (1,550) (716)
Custodian and Trustee fees payable ...................................................................................... (50) (72)
Sub-custodian fees payable ................................................................................................... (303) (312)
Administration fees payable .................................................................................................. (152) (213)
Audit fees payable ................................................................................................................. (171) (186)
Other fees payable ................................................................................................................. (20) (115)
(188,513) (158,152)
Net assets attributable to redeemable participating shareholders .............................. 4,259,100 5,547,782
*The Combined Balance Sheet and the Balance Sheet of the individual Funds as at 31 March 2015 have been restated due to a change in the
accounting policy for valuation of investments. See note 2 to the financial statements for details of change to the Company's accounting policies
during the year under review.
On behalf of the Board
Mr. William Roberts Mr. Tom Murray
12 July 2016
Russell Investment Company II plc
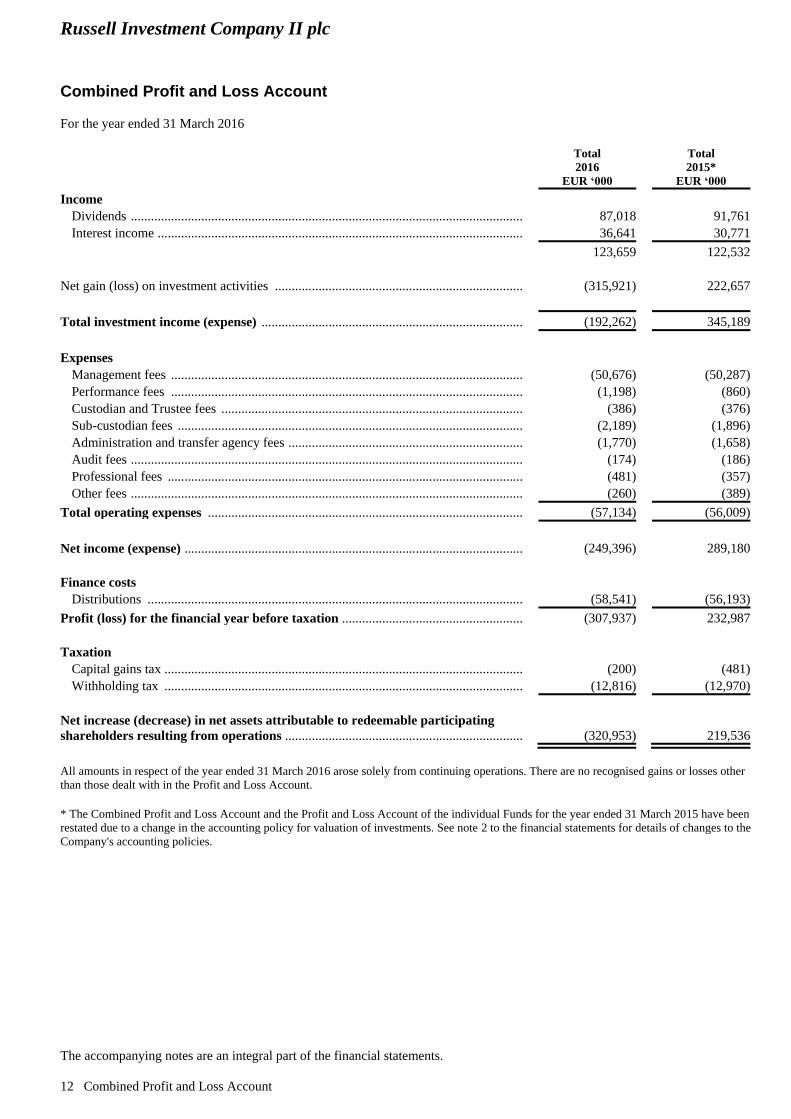
Combined Profit and Loss Account
For the year ended 31 March 2016
The accompanying notes are an integral part of the financial statements.
12 Combined Profit and Loss Account
Total
2016
EUR ‘000
Total
2015*
EUR ‘000
Income
Dividends .............................................................................................................................. 87,018 91,761
Interest income ...................................................................................................................... 36,641 30,771
123,659 122,532
Net gain (loss) on investment activities ............................................................................... (315,921) 222,657
Total investment income (expense) ................................................................................... (192,262) 345,189
Expenses
Management fees .................................................................................................................. (50,676) (50,287)
Performance fees .................................................................................................................. (1,198) (860)
Custodian and Trustee fees ................................................................................................... (386) (376)
Sub-custodian fees ................................................................................................................ (2,189) (1,896)
Administration and transfer agency fees ............................................................................... (1,770) (1,658)
Audit fees .............................................................................................................................. (174) (186)
Professional fees ................................................................................................................... (481) (357)
Other fees .............................................................................................................................. (260) (389)
Total operating expenses ................................................................................................... (57,134) (56,009)
Net income (expense) .......................................................................................................... (249,396) 289,180
Finance costs
Distributions ......................................................................................................................... (58,541) (56,193)
Profit (loss) for the financial year before taxation ........................................................... (307,937) 232,987
Taxation
Capital gains tax .................................................................................................................... (200) (481)
Withholding tax .................................................................................................................... (12,816) (12,970)
Net increase (decrease) in net assets attributable to redeemable participating
shareholders resulting from operations ............................................................................ (320,953) 219,536
All amounts in respect of the year ended 31 March 2016 arose solely from continuing operations. There are no recognised gains or losses other
than those dealt with in the Profit and Loss Account.
* The Combined Profit and Loss Account and the Profit and Loss Account of the individual Funds for the year ended 31 March 2015 have been
restated due to a change in the accounting policy for valuation of investments. See note 2 to the financial statements for details of changes to the
Company's accounting policies.
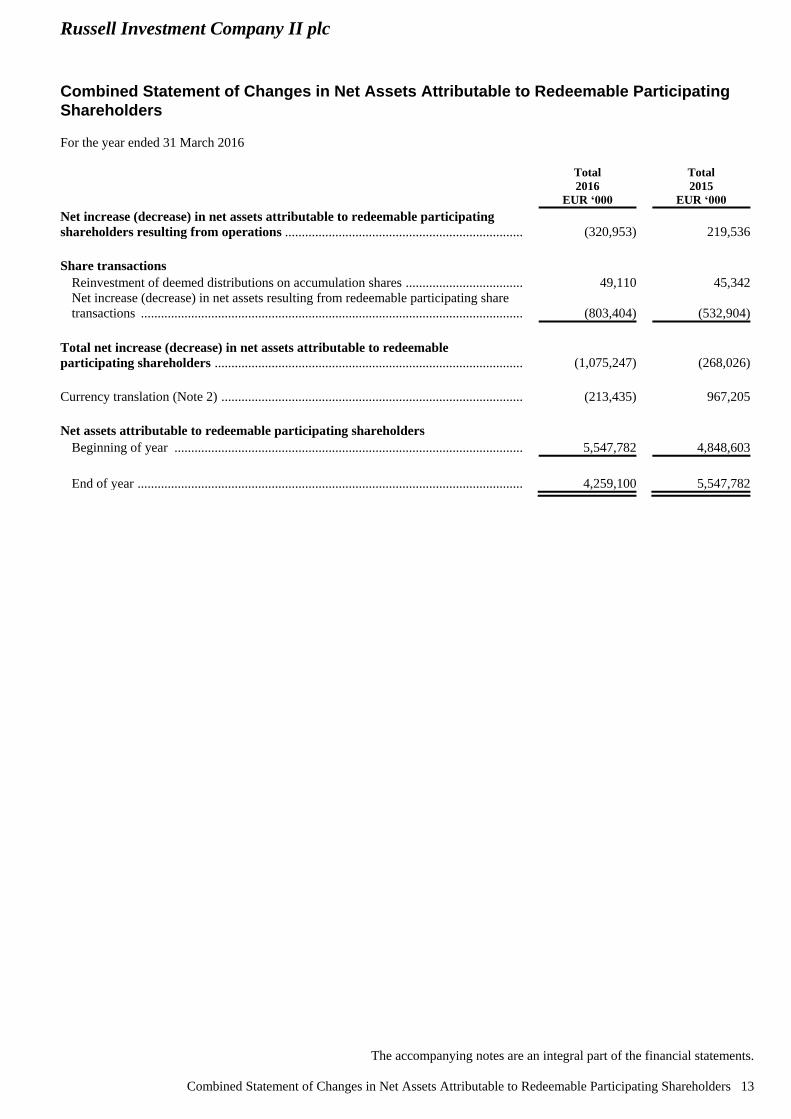
Russell Investment Company II plc
Combined Statement of Changes in Net Assets Attributable to Redeemable Participating
Shareholders
For the year ended 31 March 2016
The accompanying notes are an integral part of the financial statements.
Combined Statement of Changes in Net Assets Attributable to Redeemable Participating Shareholders 13
Total
2016
EUR ‘000
Total
2015
EUR ‘000
Net increase (decrease) in net assets attributable to redeemable participating
shareholders resulting from operations ....................................................................... (320,953) 219,536
Share transactions
Reinvestment of deemed distributions on accumulation shares ............................................ 49,110 45,342
Net increase (decrease) in net assets resulting from redeemable participating share
transactions ........................................................................................................................... (803,404) (532,904)
Total net increase (decrease) in net assets attributable to redeemable
participating shareholders ............................................................................................ (1,075,247) (268,026)
Currency translation (Note 2) ............................................................................................... (213,435) 967,205
Net assets attributable to redeemable participating shareholders
Beginning of year ................................................................................................................. 5,547,782 4,848,603
End of year ............................................................................................................................ 4,259,100 5,547,782
Russell Investment Company II plc
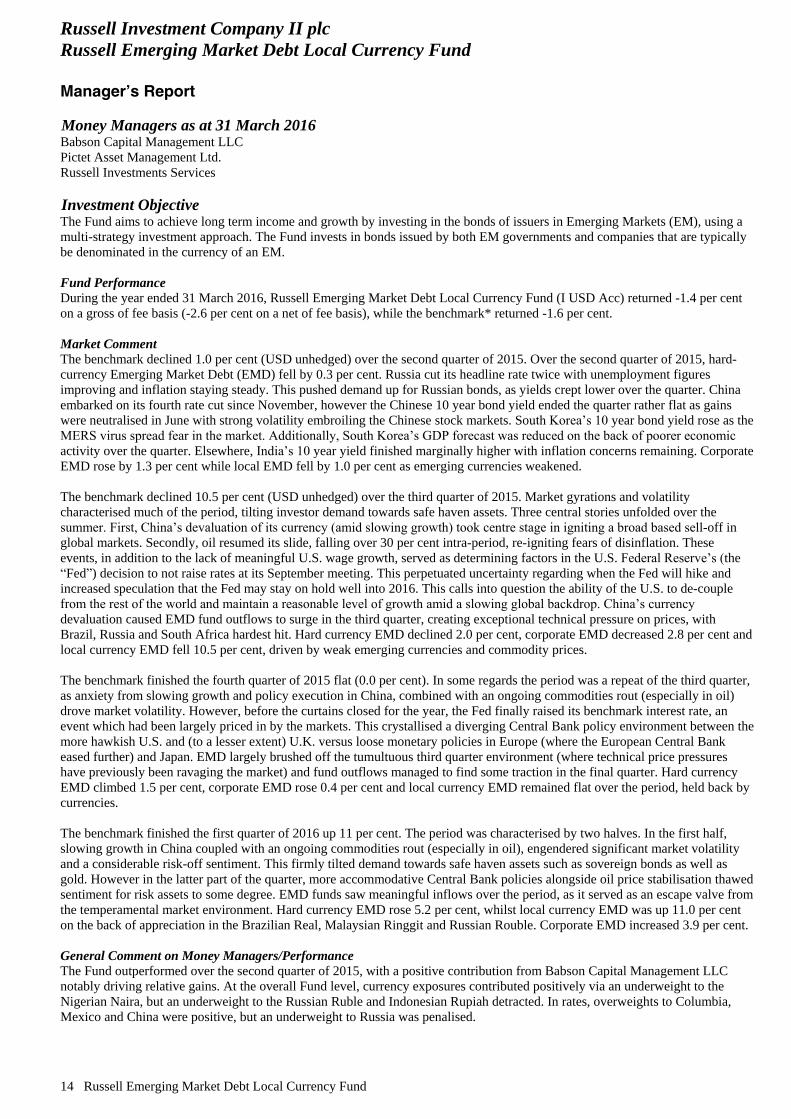
Russell Emerging Market Debt Local Currency Fund
Manager’s Report
14 Russell Emerging Market Debt Local Currency Fund
Money Managers as at 31 March 2016 Babson Capital Management LLC
Pictet Asset Management Ltd.
Russell Investments Services
Investment Objective The Fund aims to achieve long term income and growth by investing in the bonds of issuers in Emerging Markets (EM), using a
multi-strategy investment approach. The Fund invests in bonds issued by both EM governments and companies that are typically
be denominated in the currency of an EM.
Fund Performance
During the year ended 31 March 2016, Russell Emerging Market Debt Local Currency Fund (I USD Acc) returned -1.4 per cent
on a gross of fee basis (-2.6 per cent on a net of fee basis), while the benchmark* returned -1.6 per cent.
Market Comment
The benchmark declined 1.0 per cent (USD unhedged) over the second quarter of 2015. Over the second quarter of 2015, hard-
currency Emerging Market Debt (EMD) fell by 0.3 per cent. Russia cut its headline rate twice with unemployment figures
improving and inflation staying steady. This pushed demand up for Russian bonds, as yields crept lower over the quarter. China
embarked on its fourth rate cut since November, however the Chinese 10 year bond yield ended the quarter rather flat as gains
were neutralised in June with strong volatility embroiling the Chinese stock markets. South Korea’s 10 year bond yield rose as the
MERS virus spread fear in the market. Additionally, South Korea’s GDP forecast was reduced on the back of poorer economic
activity over the quarter. Elsewhere, India’s 10 year yield finished marginally higher with inflation concerns remaining. Corporate
EMD rose by 1.3 per cent while local EMD fell by 1.0 per cent as emerging currencies weakened.
The benchmark declined 10.5 per cent (USD unhedged) over the third quarter of 2015. Market gyrations and volatility
characterised much of the period, tilting investor demand towards safe haven assets. Three central stories unfolded over the
summer. First, China’s devaluation of its currency (amid slowing growth) took centre stage in igniting a broad based sell-off in
global markets. Secondly, oil resumed its slide, falling over 30 per cent intra-period, re-igniting fears of disinflation. These
events, in addition to the lack of meaningful U.S. wage growth, served as determining factors in the U.S. Federal Reserve’s (the
“Fed”) decision to not raise rates at its September meeting. This perpetuated uncertainty regarding when the Fed will hike and
increased speculation that the Fed may stay on hold well into 2016. This calls into question the ability of the U.S. to de-couple
from the rest of the world and maintain a reasonable level of growth amid a slowing global backdrop. China’s currency
devaluation caused EMD fund outflows to surge in the third quarter, creating exceptional technical pressure on prices, with
Brazil, Russia and South Africa hardest hit. Hard currency EMD declined 2.0 per cent, corporate EMD decreased 2.8 per cent and
local currency EMD fell 10.5 per cent, driven by weak emerging currencies and commodity prices.
The benchmark finished the fourth quarter of 2015 flat (0.0 per cent). In some regards the period was a repeat of the third quarter,
as anxiety from slowing growth and policy execution in China, combined with an ongoing commodities rout (especially in oil)
drove market volatility. However, before the curtains closed for the year, the Fed finally raised its benchmark interest rate, an
event which had been largely priced in by the markets. This crystallised a diverging Central Bank policy environment between the
more hawkish U.S. and (to a lesser extent) U.K. versus loose monetary policies in Europe (where the European Central Bank
eased further) and Japan. EMD largely brushed off the tumultuous third quarter environment (where technical price pressures
have previously been ravaging the market) and fund outflows managed to find some traction in the final quarter. Hard currency
EMD climbed 1.5 per cent, corporate EMD rose 0.4 per cent and local currency EMD remained flat over the period, held back by
currencies.
The benchmark finished the first quarter of 2016 up 11 per cent. The period was characterised by two halves. In the first half,
slowing growth in China coupled with an ongoing commodities rout (especially in oil), engendered significant market volatility
and a considerable risk-off sentiment. This firmly tilted demand towards safe haven assets such as sovereign bonds as well as
gold. However in the latter part of the quarter, more accommodative Central Bank policies alongside oil price stabilisation thawed
sentiment for risk assets to some degree. EMD funds saw meaningful inflows over the period, as it served as an escape valve from
the temperamental market environment. Hard currency EMD rose 5.2 per cent, whilst local currency EMD was up 11.0 per cent
on the back of appreciation in the Brazilian Real, Malaysian Ringgit and Russian Rouble. Corporate EMD increased 3.9 per cent.
General Comment on Money Managers/Performance
The Fund outperformed over the second quarter of 2015, with a positive contribution from Babson Capital Management LLC
notably driving relative gains. At the overall Fund level, currency exposures contributed positively via an underweight to the
Nigerian Naira, but an underweight to the Russian Ruble and Indonesian Rupiah detracted. In rates, overweights to Columbia,
Mexico and China were positive, but an underweight to Russia was penalised.
Russell Investment Company II plc
Russell Emerging Market Debt Local Currency Fund
Manager’s Report - continued
Russell Emerging Market Debt Local Currency Fund 15
The Fund outperformed the benchmark over the third quarter of 2015. In rates, an overweight to Columbia, Indonesia and South
Africa detracted from relative performance, while an underweight to Brazil was rewarded. In currencies, an overweight to the
U.S. Dollar was beneficial as emerging currencies underperformed. Pictet Asset Management Ltd drove positive performance,
due to an underweight to the Brazilian Real, which suffered a steep quarterly loss. With geopolitical risk at high levels we remain
cautious on the outlook in the short-term but expect investor demand to return as countries take policy action to address macro
imbalances.
The Fund outperformed its benchmark over the final quarter of 2015, with two of the three Money Managers finishing in positive
territory – Pictet Asset Management Ltd. and Babson Capital Management LLC. An overweight to Indonesia contributed, as well
as an underweight to South Africa. However, an underweight to Poland detracted. While an overweight to the U.S. Dollar and
Turkish Lira was positive, an underweight to the Indonesian Rupiah and Thai Baht held back further gains, as well as an
overweight to the South African Rand. The Fund benefited from an overweight to AAA and AA-rated issues, while an
underweight to A and BBB-rated issues held back further gains.
The Fund underperformed its benchmark over the first quarter of 2016. All Money Managers finished in negative territory. Whilst
an overweight to Indonesia and an underweight to Poland, Romania and Hong Kong made a positive contribution, an underweight
to Brazil and an overweight to Malaysia detracted. An overweight to the U.S. Dollar proved the most detrimental, along with an
underweight to the Brazilian Real and Indonesian Rupiah. The Fund’s overweight to AAA-rated issues detracted, along with an
underweight to A and BBB-rated issues.
Outlook
Global markets got off to a rough start in 2016. By mid-February global developed equities had lost nearly 20 per cent from their
2015 peak. They rebounded by around 10 per cent by mid-March, but we expect volatility to be a headline throughout 2016. This
volatility will continue to be driven by China fears, the Fed monetary tightening, U.S. recession concerns, bank balance sheet
worries, and soft corporate profits. Moreover, the move to negative interest rates in Europe and Japan has triggered fears that
Central Banks have run out of easing options. Negative rates also tend to squeeze the margin between banks’ borrowing and
lending rates. This squeeze could, in turn, hurt bank profitability, and end up making things worse for the markets. In our 2016
Global Market Outlook Annual report, we forecast mid to low single digit returns for global equities, along with a gradual rise in
long-term interest rates. We’re holding to that view, with the exception we think equity growth is more likely to be in the low
single digits. Moreover, we’re now seeing corporate profits weakening, softness in global trade and manufacturing, and slightly
higher risks for EM. These elements all contribute to a less supportive environment for equities. That said, we’re not forecasting a
sustained bear market, provided the U.S. does not fall into recession. Right now we see recession as a low probability over the
next several years. It’s true we’re deep into the current business cycle, but we’re not seeing excesses in the U.S. economy that
could trigger recession.
Past performance is no indication of current or future performance.
* Benchmark Source: JPMorgan GBI-EM Global Diversified Index
Russell Investments Ireland Limited
May 2016
Russell Investment Company II plc
Russell Emerging Market Debt Local Currency Fund
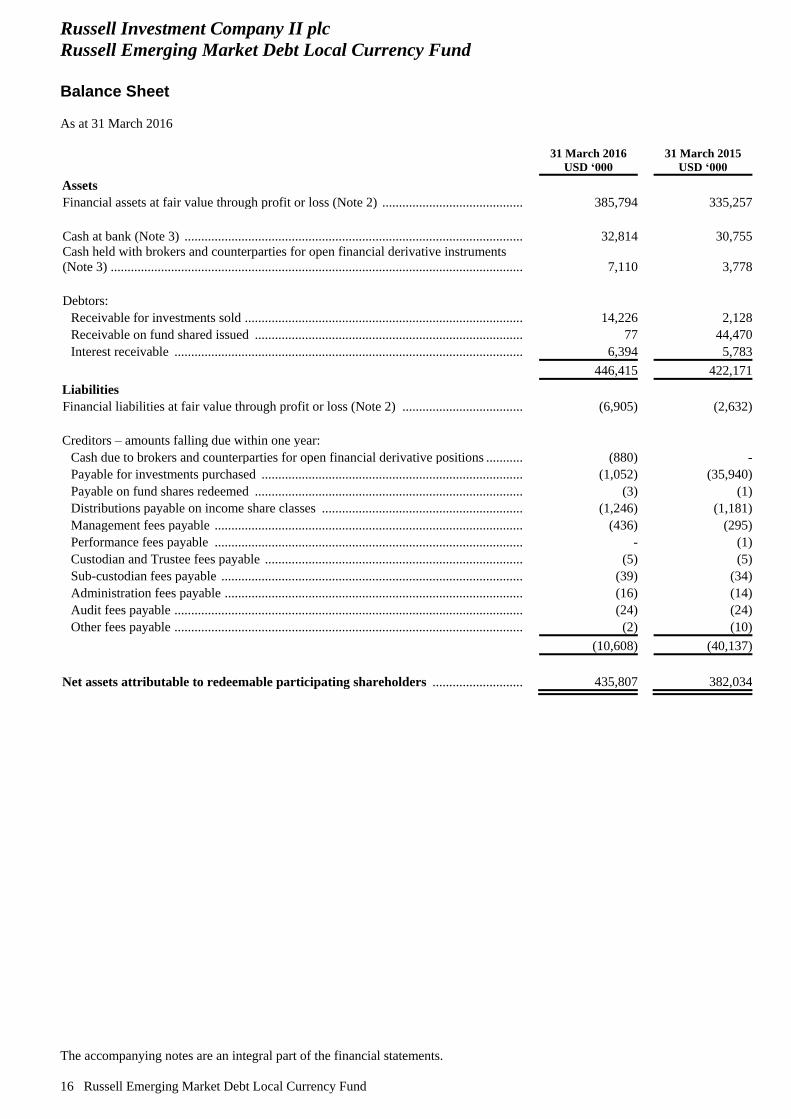
Balance Sheet
As at 31 March 2016
The accompanying notes are an integral part of the financial statements.
16 Russell Emerging Market Debt Local Currency Fund
31 March 2016
USD ‘000 31 March 2015
USD ‘000
Assets
Financial assets at fair value through profit or loss (Note 2) ........................................... 385,794 335,257
Cash at bank (Note 3) ...................................................................................................... 32,814 30,755
Cash held with brokers and counterparties for open financial derivative instruments
(Note 3) ............................................................................................................................ 7,110 3,778
Debtors:
Receivable for investments sold .................................................................................... 14,226 2,128
Receivable on fund shared issued ................................................................................. 77 44,470
Interest receivable ......................................................................................................... 6,394 5,783
446,415 422,171
Liabilities
Financial liabilities at fair value through profit or loss (Note 2) ..................................... (6,905) (2,632)
Creditors – amounts falling due within one year:
Cash due to brokers and counterparties for open financial derivative positions ............ (880) -
Payable for investments purchased ............................................................................... (1,052) (35,940)
Payable on fund shares redeemed ................................................................................. (3) (1)
Distributions payable on income share classes ............................................................. (1,246) (1,181)
Management fees payable ............................................................................................. (436) (295)
Performance fees payable ............................................................................................. - (1)
Custodian and Trustee fees payable .............................................................................. (5) (5)
Sub-custodian fees payable ........................................................................................... (39) (34)
Administration fees payable .......................................................................................... (16) (14)
Audit fees payable ......................................................................................................... (24) (24)
Other fees payable ......................................................................................................... (2) (10)
(10,608) (40,137)
Net assets attributable to redeemable participating shareholders ............................ 435,807 382,034
Russell Investment Company II plc
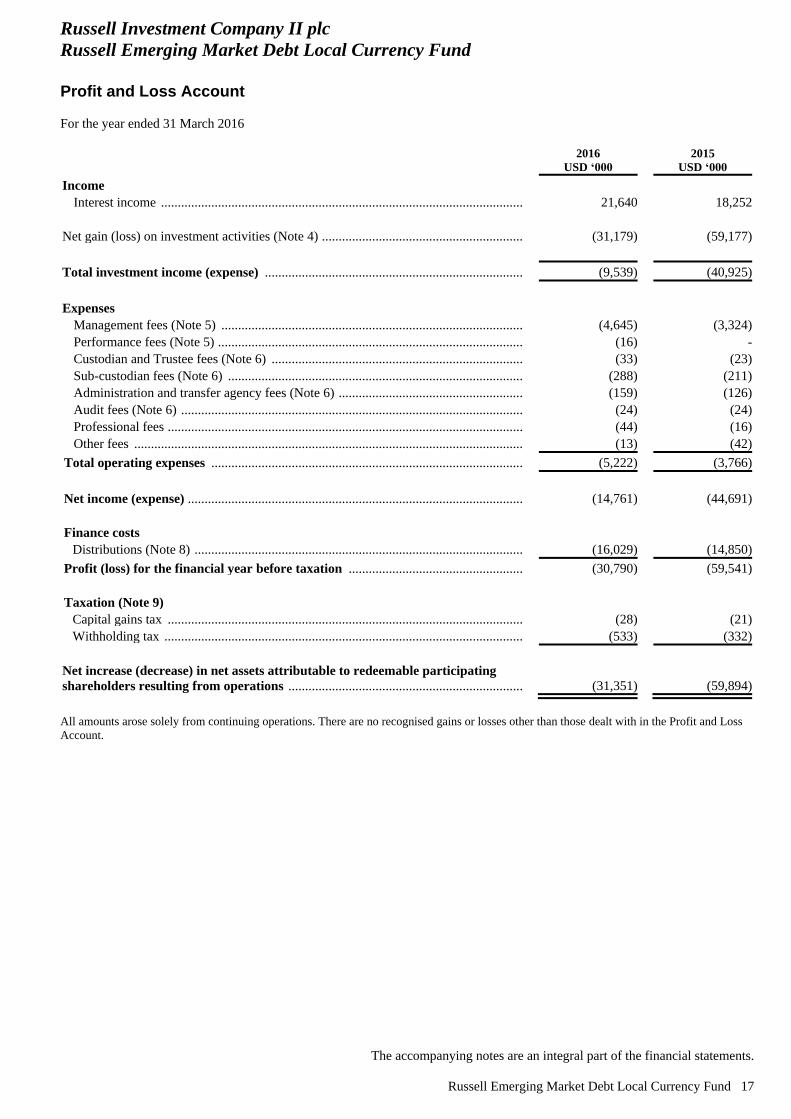
Russell Emerging Market Debt Local Currency Fund
Profit and Loss Account
For the year ended 31 March 2016
The accompanying notes are an integral part of the financial statements.
Russell Emerging Market Debt Local Currency Fund 17
2016
USD ‘000
2015
USD ‘000
Income
Interest income ............................................................................................................. 21,640 18,252
Net gain (loss) on investment activities (Note 4) ............................................................. (31,179) (59,177)
Total investment income (expense) .............................................................................. (9,539) (40,925)
Expenses
Management fees (Note 5) ........................................................................................... (4,645) (3,324)
Performance fees (Note 5) ............................................................................................ (16) -
Custodian and Trustee fees (Note 6) ............................................................................ (33) (23)
Sub-custodian fees (Note 6) ......................................................................................... (288) (211)
Administration and transfer agency fees (Note 6) ........................................................ (159) (126)
Audit fees (Note 6) ....................................................................................................... (24) (24)
Professional fees ........................................................................................................... (44) (16)
Other fees ..................................................................................................................... (13) (42)
Total operating expenses .............................................................................................. (5,222) (3,766)
Net income (expense) ..................................................................................................... (14,761) (44,691)
Finance costs
Distributions (Note 8) ................................................................................................... (16,029) (14,850)
Profit (loss) for the financial year before taxation ..................................................... (30,790) (59,541)
Taxation (Note 9)
Capital gains tax ........................................................................................................... (28) (21)
Withholding tax ............................................................................................................ (533) (332)
Net increase (decrease) in net assets attributable to redeemable participating
shareholders resulting from operations ....................................................................... (31,351) (59,894)
All amounts arose solely from continuing operations. There are no recognised gains or losses other than those dealt with in the Profit and Loss
Account.
Russell Investment Company II plc
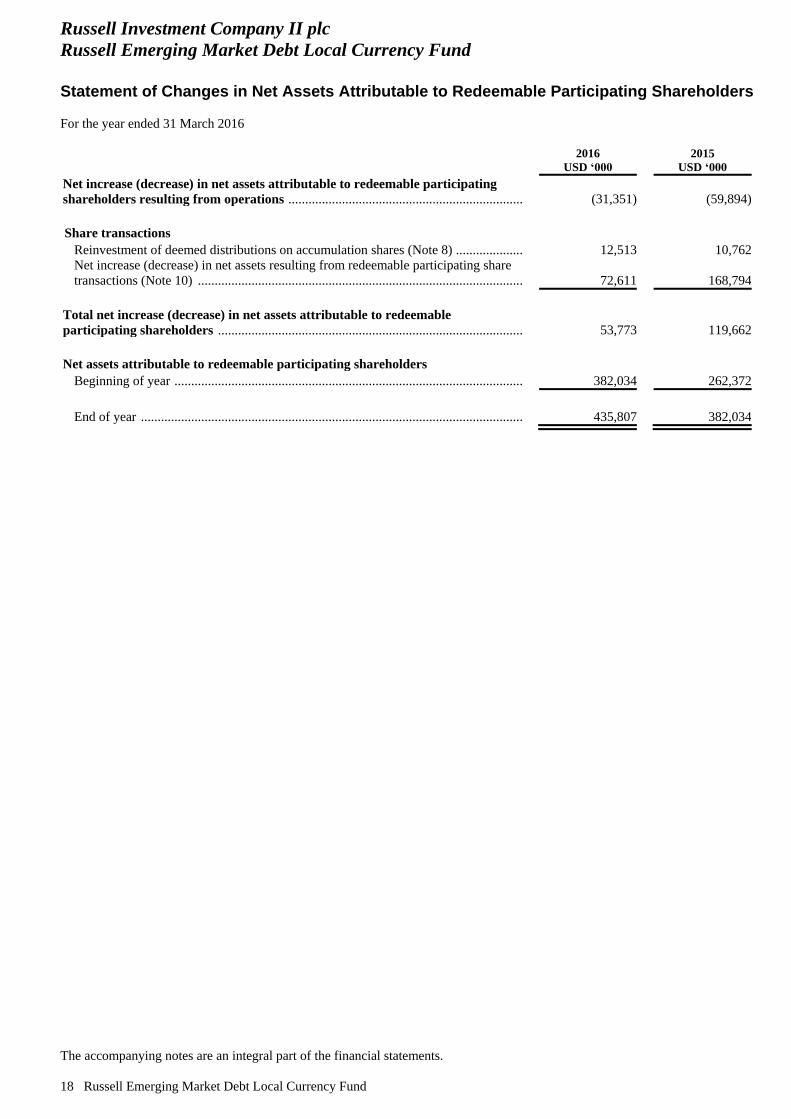
Russell Emerging Market Debt Local Currency Fund
Statement of Changes in Net Assets Attributable to Redeemable Participating Shareholders
For the year ended 31 March 2016
The accompanying notes are an integral part of the financial statements.
18 Russell Emerging Market Debt Local Currency Fund
2016
USD ‘000
2015
USD ‘000
Net increase (decrease) in net assets attributable to redeemable participating
shareholders resulting from operations ....................................................................... (31,351) (59,894)
Share transactions
Reinvestment of deemed distributions on accumulation shares (Note 8) ..................... 12,513 10,762
Net increase (decrease) in net assets resulting from redeemable participating share
transactions (Note 10) .................................................................................................. 72,611 168,794
Total net increase (decrease) in net assets attributable to redeemable
participating shareholders ............................................................................................ 53,773 119,662
Net assets attributable to redeemable participating shareholders
Beginning of year ......................................................................................................... 382,034 262,372
End of year ................................................................................................................... 435,807 382,034
Russell Investment Company II plc
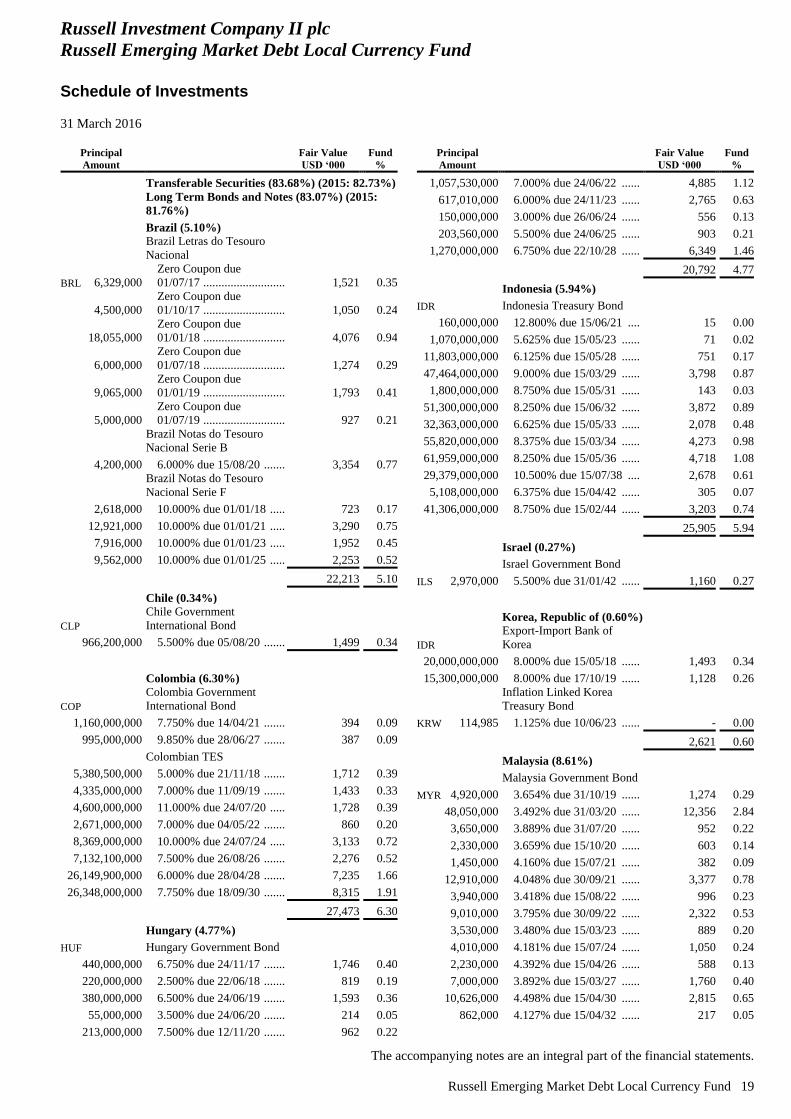
Russell Emerging Market Debt Local Currency Fund
Schedule of Investments
31 March 2016
The accompanying notes are an integral part of the financial statements.
Russell Emerging Market Debt Local Currency Fund 19
Principal
Amount
Fair Value
USD ‘000
Fund
%
Transferable Securities (83.68%) (2015: 82.73%)
Long Term Bonds and Notes (83.07%) (2015:
81.76%)
Brazil (5.10%)
Brazil Letras do Tesouro
Nacional
BRL 6,329,000
Zero Coupon due
01/07/17 ........................... 1,521 0.35
4,500,000
Zero Coupon due
01/10/17 ........................... 1,050 0.24
18,055,000
Zero Coupon due
01/01/18 ........................... 4,076 0.94
6,000,000
Zero Coupon due
01/07/18 ........................... 1,274 0.29
9,065,000
Zero Coupon due
01/01/19 ........................... 1,793 0.41
5,000,000
Zero Coupon due
01/07/19 ........................... 927 0.21
Brazil Notas do Tesouro
Nacional Serie B
4,200,000 6.000% due 15/08/20 ....... 3,354 0.77
Brazil Notas do Tesouro
Nacional Serie F
2,618,000 10.000% due 01/01/18 ..... 723 0.17
12,921,000 10.000% due 01/01/21 ..... 3,290 0.75
7,916,000 10.000% due 01/01/23 ..... 1,952 0.45
9,562,000 10.000% due 01/01/25 ..... 2,253 0.52
22,213 5.10
Chile (0.34%)
CLP
Chile Government
International Bond
966,200,000 5.500% due 05/08/20 ....... 1,499 0.34
Colombia (6.30%)
COP
Colombia Government
International Bond
1,160,000,000 7.750% due 14/04/21 ....... 394 0.09
995,000,000 9.850% due 28/06/27 ....... 387 0.09
Colombian TES
5,380,500,000 5.000% due 21/11/18 ....... 1,712 0.39
4,335,000,000 7.000% due 11/09/19 ....... 1,433 0.33
4,600,000,000 11.000% due 24/07/20 ..... 1,728 0.39
2,671,000,000 7.000% due 04/05/22 ....... 860 0.20
8,369,000,000 10.000% due 24/07/24 ..... 3,133 0.72
7,132,100,000 7.500% due 26/08/26 ....... 2,276 0.52
26,149,900,000 6.000% due 28/04/28 ....... 7,235 1.66
26,348,000,000 7.750% due 18/09/30 ....... 8,315 1.91
27,473 6.30
Hungary (4.77%)
HUF Hungary Government Bond
440,000,000 6.750% due 24/11/17 ....... 1,746 0.40
220,000,000 2.500% due 22/06/18 ....... 819 0.19
380,000,000 6.500% due 24/06/19 ....... 1,593 0.36
55,000,000 3.500% due 24/06/20 ....... 214 0.05
213,000,000 7.500% due 12/11/20 ....... 962 0.22
Principal
Amount
Fair Value
USD ‘000
Fund
%
1,057,530,000 7.000% due 24/06/22 ...... 4,885 1.12
617,010,000 6.000% due 24/11/23 ...... 2,765 0.63
150,000,000 3.000% due 26/06/24 ...... 556 0.13
203,560,000 5.500% due 24/06/25 ...... 903 0.21
1,270,000,000 6.750% due 22/10/28 ...... 6,349 1.46
20,792 4.77
Indonesia (5.94%)
IDR Indonesia Treasury Bond
160,000,000 12.800% due 15/06/21 .... 15 0.00
1,070,000,000 5.625% due 15/05/23 ...... 71 0.02
11,803,000,000 6.125% due 15/05/28 ...... 751 0.17
47,464,000,000 9.000% due 15/03/29 ...... 3,798 0.87
1,800,000,000 8.750% due 15/05/31 ...... 143 0.03
51,300,000,000 8.250% due 15/06/32 ...... 3,872 0.89
32,363,000,000 6.625% due 15/05/33 ...... 2,078 0.48
55,820,000,000 8.375% due 15/03/34 ...... 4,273 0.98
61,959,000,000 8.250% due 15/05/36 ...... 4,718 1.08
29,379,000,000 10.500% due 15/07/38 .... 2,678 0.61
5,108,000,000 6.375% due 15/04/42 ...... 305 0.07
41,306,000,000 8.750% due 15/02/44 ...... 3,203 0.74
25,905 5.94
Israel (0.27%)
Israel Government Bond
ILS 2,970,000 5.500% due 31/01/42 ...... 1,160 0.27
Korea, Republic of (0.60%)
IDR
Export-Import Bank of
Korea
20,000,000,000 8.000% due 15/05/18 ...... 1,493 0.34
15,300,000,000 8.000% due 17/10/19 ...... 1,128 0.26
Inflation Linked Korea
Treasury Bond
KRW 114,985 1.125% due 10/06/23 ...... - 0.00
2,621 0.60
Malaysia (8.61%)
Malaysia Government Bond
MYR 4,920,000 3.654% due 31/10/19 ...... 1,274 0.29
48,050,000 3.492% due 31/03/20 ...... 12,356 2.84
3,650,000 3.889% due 31/07/20 ...... 952 0.22
2,330,000 3.659% due 15/10/20 ...... 603 0.14
1,450,000 4.160% due 15/07/21 ...... 382 0.09
12,910,000 4.048% due 30/09/21 ...... 3,377 0.78
3,940,000 3.418% due 15/08/22 ...... 996 0.23
9,010,000 3.795% due 30/09/22 ...... 2,322 0.53
3,530,000 3.480% due 15/03/23 ...... 889 0.20
4,010,000 4.181% due 15/07/24 ...... 1,050 0.24
2,230,000 4.392% due 15/04/26 ...... 588 0.13
7,000,000 3.892% due 15/03/27 ...... 1,760 0.40
10,626,000 4.498% due 15/04/30 ...... 2,815 0.65
862,000 4.127% due 15/04/32 ...... 217 0.05
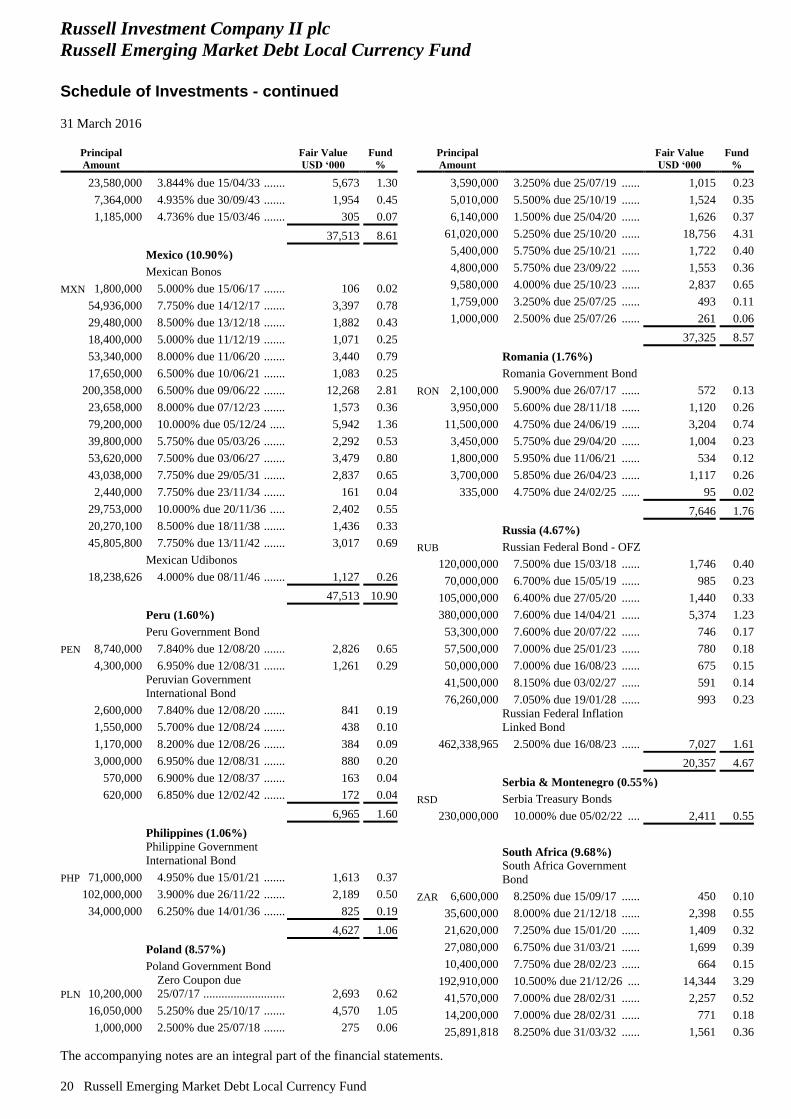
Russell Investment Company II plc
Russell Emerging Market Debt Local Currency Fund
Schedule of Investments - continued
31 March 2016
The accompanying notes are an integral part of the financial statements.
20 Russell Emerging Market Debt Local Currency Fund
Principal
Amount
Fair Value
USD ‘000
Fund
%
23,580,000 3.844% due 15/04/33 ....... 5,673 1.30
7,364,000 4.935% due 30/09/43 ....... 1,954 0.45
1,185,000 4.736% due 15/03/46 ....... 305 0.07
37,513 8.61
Mexico (10.90%)
Mexican Bonos
MXN 1,800,000 5.000% due 15/06/17 ....... 106 0.02
54,936,000 7.750% due 14/12/17 ....... 3,397 0.78
29,480,000 8.500% due 13/12/18 ....... 1,882 0.43
18,400,000 5.000% due 11/12/19 ....... 1,071 0.25
53,340,000 8.000% due 11/06/20 ....... 3,440 0.79
17,650,000 6.500% due 10/06/21 ....... 1,083 0.25
200,358,000 6.500% due 09/06/22 ....... 12,268 2.81
23,658,000 8.000% due 07/12/23 ....... 1,573 0.36
79,200,000 10.000% due 05/12/24 ..... 5,942 1.36
39,800,000 5.750% due 05/03/26 ....... 2,292 0.53
53,620,000 7.500% due 03/06/27 ....... 3,479 0.80
43,038,000 7.750% due 29/05/31 ....... 2,837 0.65
2,440,000 7.750% due 23/11/34 ....... 161 0.04
29,753,000 10.000% due 20/11/36 ..... 2,402 0.55
20,270,100 8.500% due 18/11/38 ....... 1,436 0.33
45,805,800 7.750% due 13/11/42 ....... 3,017 0.69
Mexican Udibonos
18,238,626 4.000% due 08/11/46 ....... 1,127 0.26
47,513 10.90
Peru (1.60%)
Peru Government Bond
PEN 8,740,000 7.840% due 12/08/20 ....... 2,826 0.65
4,300,000 6.950% due 12/08/31 ....... 1,261 0.29
Peruvian Government
International Bond
2,600,000 7.840% due 12/08/20 ....... 841 0.19
1,550,000 5.700% due 12/08/24 ....... 438 0.10
1,170,000 8.200% due 12/08/26 ....... 384 0.09
3,000,000 6.950% due 12/08/31 ....... 880 0.20
570,000 6.900% due 12/08/37 ....... 163 0.04
620,000 6.850% due 12/02/42 ....... 172 0.04
6,965 1.60
Philippines (1.06%)
Philippine Government
International Bond
PHP 71,000,000 4.950% due 15/01/21 ....... 1,613 0.37
102,000,000 3.900% due 26/11/22 ....... 2,189 0.50
34,000,000 6.250% due 14/01/36 ....... 825 0.19
4,627 1.06
Poland (8.57%)
Poland Government Bond
PLN 10,200,000
Zero Coupon due
25/07/17 ........................... 2,693 0.62
16,050,000 5.250% due 25/10/17 ....... 4,570 1.05
1,000,000 2.500% due 25/07/18 ....... 275 0.06
Principal
Amount
Fair Value
USD ‘000
Fund
%
3,590,000 3.250% due 25/07/19 ...... 1,015 0.23
5,010,000 5.500% due 25/10/19 ...... 1,524 0.35
6,140,000 1.500% due 25/04/20 ...... 1,626 0.37
61,020,000 5.250% due 25/10/20 ...... 18,756 4.31
5,400,000 5.750% due 25/10/21 ...... 1,722 0.40
4,800,000 5.750% due 23/09/22 ...... 1,553 0.36
9,580,000 4.000% due 25/10/23 ...... 2,837 0.65
1,759,000 3.250% due 25/07/25 ...... 493 0.11
1,000,000 2.500% due 25/07/26 ...... 261 0.06
37,325 8.57
Romania (1.76%)
Romania Government Bond
RON 2,100,000 5.900% due 26/07/17 ...... 572 0.13
3,950,000 5.600% due 28/11/18 ...... 1,120 0.26
11,500,000 4.750% due 24/06/19 ...... 3,204 0.74
3,450,000 5.750% due 29/04/20 ...... 1,004 0.23
1,800,000 5.950% due 11/06/21 ...... 534 0.12
3,700,000 5.850% due 26/04/23 ...... 1,117 0.26
335,000 4.750% due 24/02/25 ...... 95 0.02
7,646 1.76
Russia (4.67%)
RUB Russian Federal Bond - OFZ
120,000,000 7.500% due 15/03/18 ...... 1,746 0.40
70,000,000 6.700% due 15/05/19 ...... 985 0.23
105,000,000 6.400% due 27/05/20 ...... 1,440 0.33
380,000,000 7.600% due 14/04/21 ...... 5,374 1.23
53,300,000 7.600% due 20/07/22 ...... 746 0.17
57,500,000 7.000% due 25/01/23 ...... 780 0.18
50,000,000 7.000% due 16/08/23 ...... 675 0.15
41,500,000 8.150% due 03/02/27 ...... 591 0.14
76,260,000 7.050% due 19/01/28 ...... 993 0.23
Russian Federal Inflation
Linked Bond
462,338,965 2.500% due 16/08/23 ...... 7,027 1.61
20,357 4.67
Serbia & Montenegro (0.55%)
RSD Serbia Treasury Bonds
230,000,000 10.000% due 05/02/22 .... 2,411 0.55
South Africa (9.68%)
South Africa Government
Bond
ZAR 6,600,000 8.250% due 15/09/17 ...... 450 0.10
35,600,000 8.000% due 21/12/18 ...... 2,398 0.55
21,620,000 7.250% due 15/01/20 ...... 1,409 0.32
27,080,000 6.750% due 31/03/21 ...... 1,699 0.39
10,400,000 7.750% due 28/02/23 ...... 664 0.15
192,910,000 10.500% due 21/12/26 .... 14,344 3.29
41,570,000 7.000% due 28/02/31 ...... 2,257 0.52
14,200,000 7.000% due 28/02/31 ...... 771 0.18
25,891,818 8.250% due 31/03/32 ...... 1,561 0.36
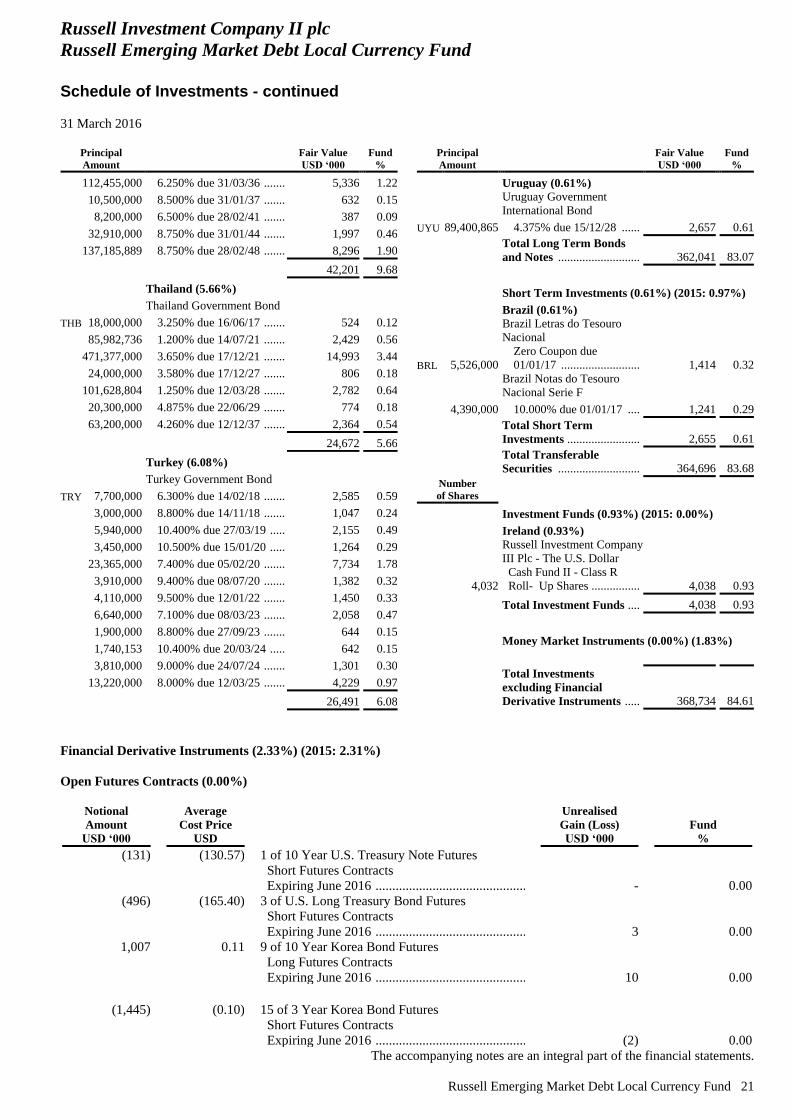
Russell Investment Company II plc
Russell Emerging Market Debt Local Currency Fund
Schedule of Investments - continued
31 March 2016
The accompanying notes are an integral part of the financial statements.
Russell Emerging Market Debt Local Currency Fund 21
Principal
Amount
Fair Value
USD ‘000
Fund
%
112,455,000 6.250% due 31/03/36 ....... 5,336 1.22
10,500,000 8.500% due 31/01/37 ....... 632 0.15
8,200,000 6.500% due 28/02/41 ....... 387 0.09
32,910,000 8.750% due 31/01/44 ....... 1,997 0.46
137,185,889 8.750% due 28/02/48 ....... 8,296 1.90
42,201 9.68
Thailand (5.66%)
Thailand Government Bond
THB 18,000,000 3.250% due 16/06/17 ....... 524 0.12
85,982,736 1.200% due 14/07/21 ....... 2,429 0.56
471,377,000 3.650% due 17/12/21 ....... 14,993 3.44
24,000,000 3.580% due 17/12/27 ....... 806 0.18
101,628,804 1.250% due 12/03/28 ....... 2,782 0.64
20,300,000 4.875% due 22/06/29 ....... 774 0.18
63,200,000 4.260% due 12/12/37 ....... 2,364 0.54
24,672 5.66
Turkey (6.08%)
Turkey Government Bond
TRY 7,700,000 6.300% due 14/02/18 ....... 2,585 0.59
3,000,000 8.800% due 14/11/18 ....... 1,047 0.24
5,940,000 10.400% due 27/03/19 ..... 2,155 0.49
3,450,000 10.500% due 15/01/20 ..... 1,264 0.29
23,365,000 7.400% due 05/02/20 ....... 7,734 1.78
3,910,000 9.400% due 08/07/20 ....... 1,382 0.32
4,110,000 9.500% due 12/01/22 ....... 1,450 0.33
6,640,000 7.100% due 08/03/23 ....... 2,058 0.47
1,900,000 8.800% due 27/09/23 ....... 644 0.15
1,740,153 10.400% due 20/03/24 ..... 642 0.15
3,810,000 9.000% due 24/07/24 ....... 1,301 0.30
13,220,000 8.000% due 12/03/25 ....... 4,229 0.97
26,491 6.08
Principal
Amount
Fair Value
USD ‘000
Fund
%
Uruguay (0.61%)
Uruguay Government
International Bond
UYU 89,400,865 4.375% due 15/12/28 ...... 2,657 0.61
Total Long Term Bonds
and Notes ........................... 362,041 83.07
Short Term Investments (0.61%) (2015: 0.97%)
Brazil (0.61%)
Brazil Letras do Tesouro
Nacional
BRL 5,526,000
Zero Coupon due
01/01/17 .......................... 1,414 0.32
Brazil Notas do Tesouro
Nacional Serie F
4,390,000 10.000% due 01/01/17 .... 1,241 0.29
Total Short Term
Investments ........................ 2,655 0.61
Total Transferable
Securities ........................... 364,696 83.68
Number
of Shares
Investment Funds (0.93%) (2015: 0.00%)
Ireland (0.93%)
4,032
Russell Investment Company
III Plc - The U.S. Dollar
Cash Fund II - Class R
Roll- Up Shares ................ 4,038 0.93
Total Investment Funds .... 4,038 0.93
Money Market Instruments (0.00%) (1.83%)
Total Investments
excluding Financial
Derivative Instruments ..... 368,734 84.61
Financial Derivative Instruments (2.33%) (2015: 2.31%)
Open Futures Contracts (0.00%)
Notional
Amount
USD ‘000
Average
Cost Price
USD
Unrealised
Gain (Loss)
USD ‘000
Fund
%
(131)
(130.57)
1 of 10 Year U.S. Treasury Note Futures
Short Futures Contracts
Expiring June 2016 ........................................................................................................... - 0.00
(496)
(165.40)
3 of U.S. Long Treasury Bond Futures
Short Futures Contracts
Expiring June 2016 ........................................................................................................... 3 0.00
1,007
0.11
9 of 10 Year Korea Bond Futures
Long Futures Contracts
Expiring June 2016 ........................................................................................................... 10 0.00
(1,445)
(0.10)
15 of 3 Year Korea Bond Futures
Short Futures Contracts
Expiring June 2016 ........................................................................................................... (2) 0.00
Russell Investment Company II plc
Russell Emerging Market Debt Local Currency Fund
Schedule of Investments - continued
31 March 2016
The accompanying notes are an integral part of the financial statements.
22 Russell Emerging Market Debt Local Currency Fund
Notional
Amount
USD ‘000
Average
Cost Price
USD
Unrealised
Gain (Loss)
USD ‘000
Fund
%
Unrealised gain on open futures contracts ......................................................................... 13 0.00
Unrealised loss on open futures contracts .......................................................................... (2) (0.00)
Net unrealised gain (loss) on open futures contracts .................................................... 11 0.00
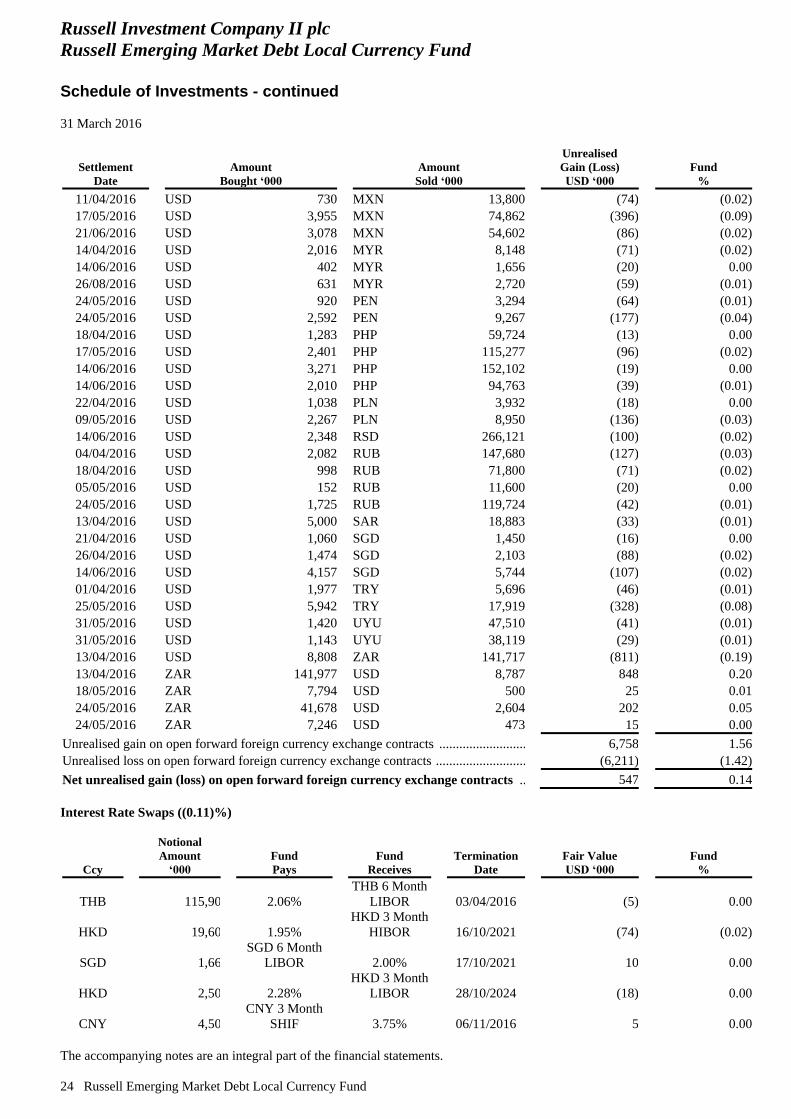
Open Forward Foreign Currency Exchange Contracts (0.14%)
Settlement
Date
Amount
Bought ‘000
Amount
Sold ‘000
Unrealised
Gain (Loss)
USD ‘000
Fund
%
31/05/2016 ARS 42,764 USD 2,630 176 0.04
04/04/2016 BRL 42,424 USD 11,721 250 0.06
21/06/2016 BRL 29,414 USD 7,596 529 0.12
18/04/2016 CLP 956,000 USD 1,417 10 0.00
21/06/2016 CLP 342,000 USD 507 1 0.00
31/03/2017 CNH 132,806 USD 20,000 142 0.03
31/03/2017 CNY 2,984 USD 449 8 0.00
04/04/2016 COP 21,236,040 USD 6,960 111 0.03
06/04/2016 COP 6,027,797 USD 1,810 196 0.04
22/06/2016 COP 6,350,000 USD 2,044 53 0.01
09/05/2016 EUR 377 PLN 1,640 (10) 0.00
26/04/2016 EUR 595 RON 2,708 (12) 0.00
21/04/2016 EUR 449 SGD 690 - 0.00
21/04/2016 EUR 2,254 SGD 3,450 8 0.00
20/04/2016 EUR 900 USD 1,010 16 0.00
21/04/2016 EUR 1,053 USD 1,179 22 0.01
09/05/2016 EUR 2,578 USD 2,886 55 0.01
24/05/2016 HRK 17,044 EUR 2,232 38 0.01
14/06/2016 HUF 1,360,917 EUR 4,377 (68) (0.02)
01/04/2016 HUF 97,406 USD 344 9 0.00
04/04/2016 HUF 575,000 USD 2,073 13 0.00
14/06/2016 HUF 357,583 USD 1,270 26 0.01
18/04/2016 IDR 24,494,881 USD 1,840 3 0.00
20/04/2016 INR 18,400 USD 272 5 0.00
03/05/2016 INR 194,279 USD 2,866 52 0.01
24/05/2016 KRW 4,885,357 USD 4,038 229 0.05
07/04/2016 MXN 114,428 USD 6,547 128 0.03
11/04/2016 MXN 11,600 USD 636 41 0.01
17/05/2016 MXN 14,781 USD 827 32 0.01
25/04/2016 MYR 4,140 USD 1,035 24 0.01
26/08/2016 MYR 31,634 USD 7,394 629 0.15
01/04/2016 PHP 24,208 USD 522 3 0.00
18/04/2016 PHP 4,034 USD 86 1 0.00
09/05/2016 PLN 8,230 EUR 1,929 10 0.00
14/06/2016 PLN 2,848 EUR 666 4 0.00
14/06/2016 PLN 33,588 EUR 7,761 153 0.04
14/06/2016 PLN 26,170 USD 6,660 365 0.08
26/04/2016 RON 2,708 EUR 599 8 0.00
03/05/2016 RON 6,469 EUR 1,430 19 0.00
09/05/2016 RON 2,181 USD 532 24 0.01
17/05/2016 RON 12,483 USD 3,158 27 0.01
12/04/2016 RSD 36,195 EUR 293 1 0.00
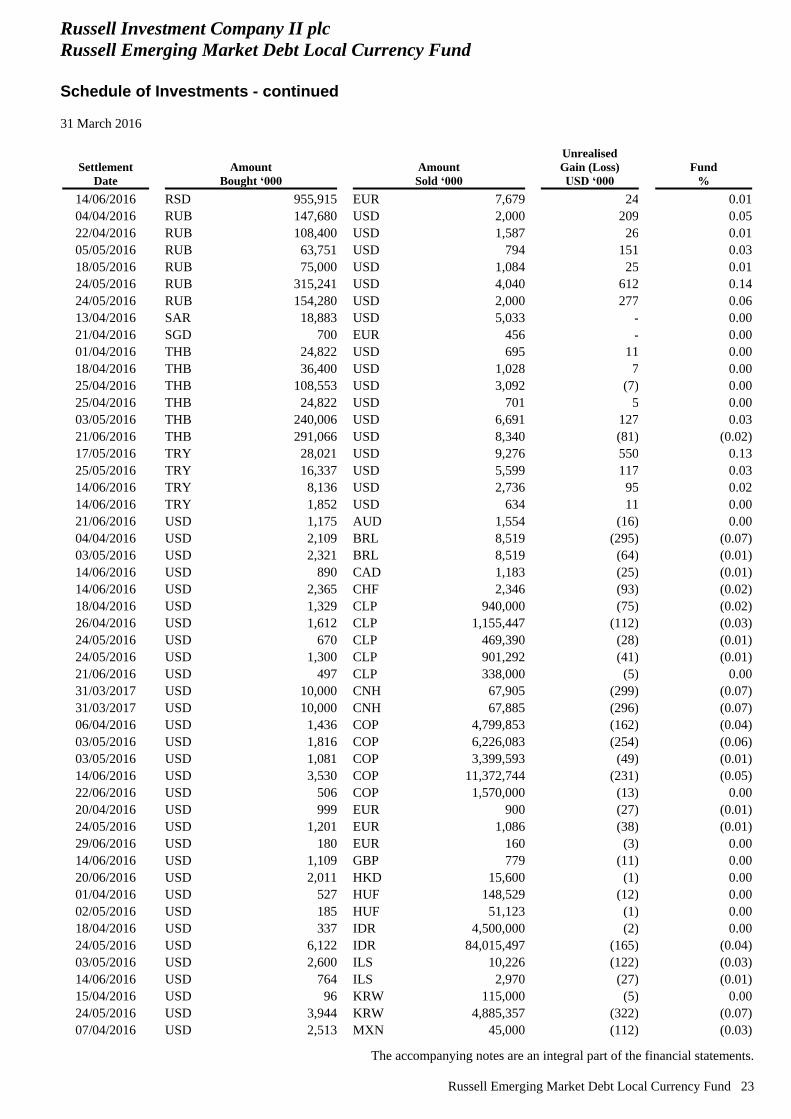
Russell Investment Company II plc
Russell Emerging Market Debt Local Currency Fund
Schedule of Investments - continued
31 March 2016
The accompanying notes are an integral part of the financial statements.
Russell Emerging Market Debt Local Currency Fund 23
Settlement
Date
Amount
Bought ‘000
Amount
Sold ‘000
Unrealised
Gain (Loss)
USD ‘000
Fund
%
14/06/2016 RSD 955,915 EUR 7,679 24 0.01
04/04/2016 RUB 147,680 USD 2,000 209 0.05
22/04/2016 RUB 108,400 USD 1,587 26 0.01
05/05/2016 RUB 63,751 USD 794 151 0.03
18/05/2016 RUB 75,000 USD 1,084 25 0.01
24/05/2016 RUB 315,241 USD 4,040 612 0.14
24/05/2016 RUB 154,280 USD 2,000 277 0.06
13/04/2016 SAR 18,883 USD 5,033 - 0.00
21/04/2016 SGD 700 EUR 456 - 0.00
01/04/2016 THB 24,822 USD 695 11 0.00
18/04/2016 THB 36,400 USD 1,028 7 0.00
25/04/2016 THB 108,553 USD 3,092 (7) 0.00
25/04/2016 THB 24,822 USD 701 5 0.00
03/05/2016 THB 240,006 USD 6,691 127 0.03
21/06/2016 THB 291,066 USD 8,340 (81) (0.02)
17/05/2016 TRY 28,021 USD 9,276 550 0.13
25/05/2016 TRY 16,337 USD 5,599 117 0.03
14/06/2016 TRY 8,136 USD 2,736 95 0.02
14/06/2016 TRY 1,852 USD 634 11 0.00
21/06/2016 USD 1,175 AUD 1,554 (16) 0.00
04/04/2016 USD 2,109 BRL 8,519 (295) (0.07)
03/05/2016 USD 2,321 BRL 8,519 (64) (0.01)
14/06/2016 USD 890 CAD 1,183 (25) (0.01)
14/06/2016 USD 2,365 CHF 2,346 (93) (0.02)
18/04/2016 USD 1,329 CLP 940,000 (75) (0.02)
26/04/2016 USD 1,612 CLP 1,155,447 (112) (0.03)
24/05/2016 USD 670 CLP 469,390 (28) (0.01)
24/05/2016 USD 1,300 CLP 901,292 (41) (0.01)
21/06/2016 USD 497 CLP 338,000 (5) 0.00
31/03/2017 USD 10,000 CNH 67,905 (299) (0.07)
31/03/2017 USD 10,000 CNH 67,885 (296) (0.07)
06/04/2016 USD 1,436 COP 4,799,853 (162) (0.04)
03/05/2016 USD 1,816 COP 6,226,083 (254) (0.06)
03/05/2016 USD 1,081 COP 3,399,593 (49) (0.01)
14/06/2016 USD 3,530 COP 11,372,744 (231) (0.05)
22/06/2016 USD 506 COP 1,570,000 (13) 0.00
20/04/2016 USD 999 EUR 900 (27) (0.01)
24/05/2016 USD 1,201 EUR 1,086 (38) (0.01)
29/06/2016 USD 180 EUR 160 (3) 0.00
14/06/2016 USD 1,109 GBP 779 (11) 0.00
20/06/2016 USD 2,011 HKD 15,600 (1) 0.00
01/04/2016 USD 527 HUF 148,529 (12) 0.00
02/05/2016 USD 185 HUF 51,123 (1) 0.00
18/04/2016 USD 337 IDR 4,500,000 (2) 0.00
24/05/2016 USD 6,122 IDR 84,015,497 (165) (0.04)
03/05/2016 USD 2,600 ILS 10,226 (122) (0.03)
14/06/2016 USD 764 ILS 2,970 (27) (0.01)
15/04/2016 USD 96 KRW 115,000 (5) 0.00
24/05/2016 USD 3,944 KRW 4,885,357 (322) (0.07)
07/04/2016 USD 2,513 MXN 45,000 (112) (0.03)
Russell Investment Company II plc
Russell Emerging Market Debt Local Currency Fund
Schedule of Investments - continued
31 March 2016
The accompanying notes are an integral part of the financial statements.
24 Russell Emerging Market Debt Local Currency Fund
Settlement
Date
Amount
Bought ‘000
Amount
Sold ‘000
Unrealised
Gain (Loss)
USD ‘000
Fund
%
11/04/2016 USD 730 MXN 13,800 (74) (0.02)
17/05/2016 USD 3,955 MXN 74,862 (396) (0.09)
21/06/2016 USD 3,078 MXN 54,602 (86) (0.02)
14/04/2016 USD 2,016 MYR 8,148 (71) (0.02)
14/06/2016 USD 402 MYR 1,656 (20) 0.00
26/08/2016 USD 631 MYR 2,720 (59) (0.01)
24/05/2016 USD 920 PEN 3,294 (64) (0.01)
24/05/2016 USD 2,592 PEN 9,267 (177) (0.04)
18/04/2016 USD 1,283 PHP 59,724 (13) 0.00
17/05/2016 USD 2,401 PHP 115,277 (96) (0.02)
14/06/2016 USD 3,271 PHP 152,102 (19) 0.00
14/06/2016 USD 2,010 PHP 94,763 (39) (0.01)
22/04/2016 USD 1,038 PLN 3,932 (18) 0.00
09/05/2016 USD 2,267 PLN 8,950 (136) (0.03)
14/06/2016 USD 2,348 RSD 266,121 (100) (0.02)
04/04/2016 USD 2,082 RUB 147,680 (127) (0.03)
18/04/2016 USD 998 RUB 71,800 (71) (0.02)
05/05/2016 USD 152 RUB 11,600 (20) 0.00
24/05/2016 USD 1,725 RUB 119,724 (42) (0.01)
13/04/2016 USD 5,000 SAR 18,883 (33) (0.01)
21/04/2016 USD 1,060 SGD 1,450 (16) 0.00
26/04/2016 USD 1,474 SGD 2,103 (88) (0.02)
14/06/2016 USD 4,157 SGD 5,744 (107) (0.02)
01/04/2016 USD 1,977 TRY 5,696 (46) (0.01)
25/05/2016 USD 5,942 TRY 17,919 (328) (0.08)
31/05/2016 USD 1,420 UYU 47,510 (41) (0.01)
31/05/2016 USD 1,143 UYU 38,119 (29) (0.01)
13/04/2016 USD 8,808 ZAR 141,717 (811) (0.19)
13/04/2016 ZAR 141,977 USD 8,787 848 0.20
18/05/2016 ZAR 7,794 USD 500 25 0.01
24/05/2016 ZAR 41,678 USD 2,604 202 0.05
24/05/2016 ZAR 7,246 USD 473 15 0.00
Unrealised gain on open forward foreign currency exchange contracts ............................... 6,758 1.56
Unrealised loss on open forward foreign currency exchange contracts ................................ (6,211) (1.42)
Net unrealised gain (loss) on open forward foreign currency exchange contracts ....... 547 0.14
Interest Rate Swaps ((0.11)%)
Ccy
Notional
Amount
‘000
Fund
Pays
Fund
Receives
Termination
Date
Fair Value
USD ‘000
Fund
%
THB 115,900 2.06%
THB 6 Month
LIBOR 03/04/2016 (5) 0.00
HKD 19,600 1.95%
HKD 3 Month
HIBOR 16/10/2021 (74) (0.02)
SGD 1,663
SGD 6 Month
LIBOR 2.00% 17/10/2021 10 0.00
HKD 2,500 2.28%
HKD 3 Month
LIBOR 28/10/2024 (18) 0.00
CNY 4,500
CNY 3 Month
SHIF 3.75% 06/11/2016 5 0.00
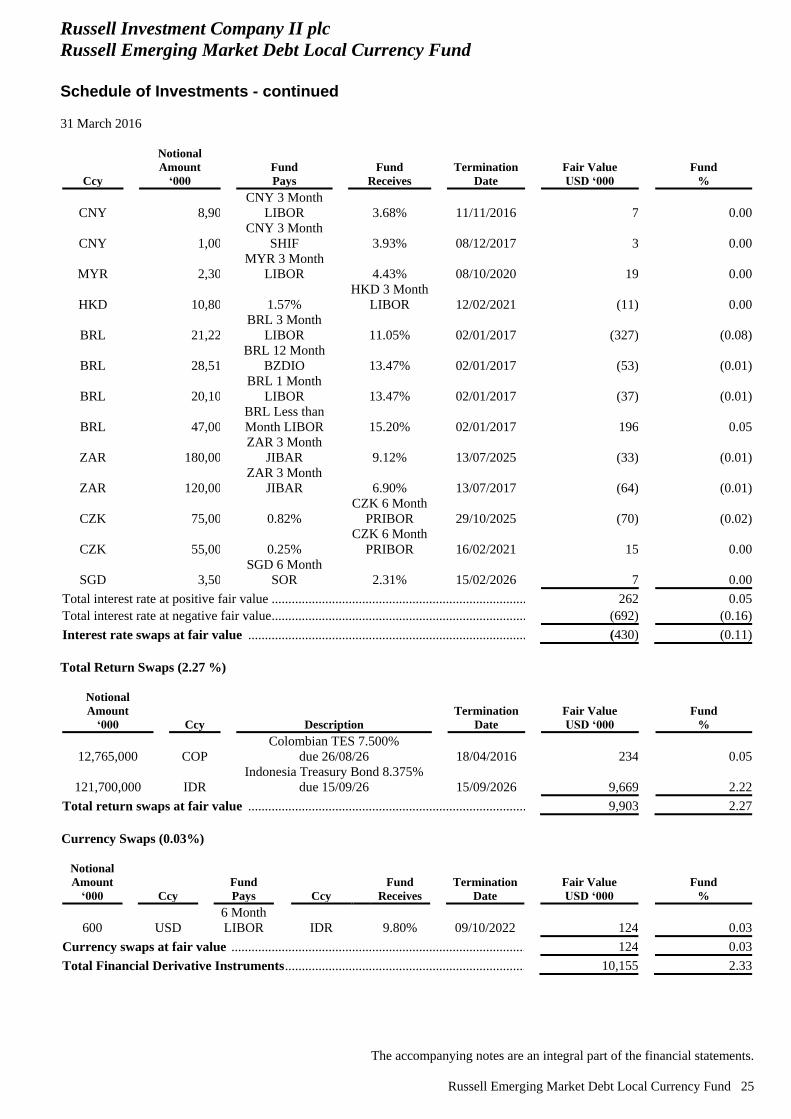
Russell Investment Company II plc
Russell Emerging Market Debt Local Currency Fund
Schedule of Investments - continued
31 March 2016
The accompanying notes are an integral part of the financial statements.
Russell Emerging Market Debt Local Currency Fund 25
Ccy
Notional
Amount
‘000
Fund
Pays
Fund
Receives
Termination
Date
Fair Value
USD ‘000
Fund
%
CNY 8,900
CNY 3 Month
LIBOR 3.68% 11/11/2016 7 0.00
CNY 1,000
CNY 3 Month
SHIF 3.93% 08/12/2017 3 0.00
MYR 2,300
MYR 3 Month
LIBOR 4.43% 08/10/2020 19 0.00
HKD 10,800 1.57%
HKD 3 Month
LIBOR 12/02/2021 (11) 0.00
BRL 21,226
BRL 3 Month
LIBOR 11.05% 02/01/2017 (327) (0.08)
BRL 28,510
BRL 12 Month
BZDIO 13.47% 02/01/2017 (53) (0.01)
BRL 20,102
BRL 1 Month
LIBOR 13.47% 02/01/2017 (37) (0.01)
BRL 47,000
BRL Less than
Month LIBOR 15.20% 02/01/2017 196 0.05
ZAR 180,000
ZAR 3 Month
JIBAR 9.12% 13/07/2025 (33) (0.01)
ZAR 120,000
ZAR 3 Month
JIBAR 6.90% 13/07/2017 (64) (0.01)
CZK 75,000 0.82%
CZK 6 Month
PRIBOR 29/10/2025 (70) (0.02)
CZK 55,000 0.25%
CZK 6 Month
PRIBOR 16/02/2021 15 0.00
SGD 3,500
SGD 6 Month
SOR 2.31% 15/02/2026 7 0.00
Total interest rate at positive fair value ...................................................................................................................................... 262 0.05
Total interest rate at negative fair value ...................................................................................................................................... (692) (0.16)
Interest rate swaps at fair value ............................................................................................................................................. (430) (0.11)
Total Return Swaps (2.27 %)
Notional
Amount
‘000 Ccy Description
Termination
Date
Fair Value
USD ‘000
Fund
%
12,765,000 COP
Colombian TES 7.500%
due 26/08/26 18/04/2016 234 0.05
121,700,000 IDR
Indonesia Treasury Bond 8.375%
due 15/09/26 15/09/2026 9,669 2.22
Total return swaps at fair value ............................................................................................................................................. 9,903 2.27
Currency Swaps (0.03%)
Notional
Amount
‘000 Ccy
Fund
Pays Ccy
Fund
Receives
Termination
Date
Fair Value
USD ‘000
Fund
%
600 USD
6 Month
LIBOR IDR 9.80% 09/10/2022 124 0.03
Currency swaps at fair value .................................................................................................................................................. 124 0.03
Total Financial Derivative Instruments .................................................................................................................................. 10,155 2.33
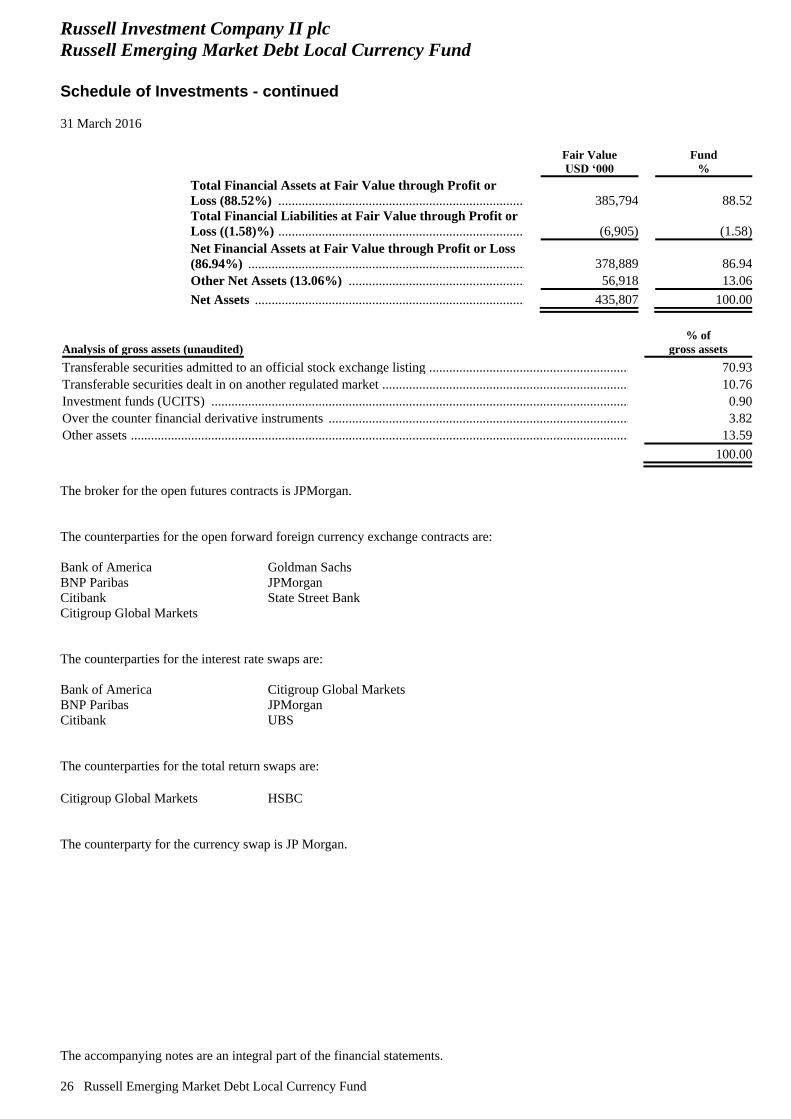
Russell Investment Company II plc
Russell Emerging Market Debt Local Currency Fund
Schedule of Investments - continued
31 March 2016
The accompanying notes are an integral part of the financial statements.
26 Russell Emerging Market Debt Local Currency Fund
Fair Value
USD ‘000
Fund
%
Total Financial Assets at Fair Value through Profit or
Loss (88.52%) ...................................................................................................................... 385,794 88.52
Total Financial Liabilities at Fair Value through Profit or
Loss ((1.58)%) ...................................................................................................................... (6,905) (1.58)
Net Financial Assets at Fair Value through Profit or Loss
(86.94%) .................................................................................................................................................... 378,889 86.94
Other Net Assets (13.06%) ...................................................................................................................... 56,918 13.06
Net Assets .................................................................................................................................................. 435,807 100.00
Analysis of gross assets (unaudited)
% of
gross assets
Transferable securities admitted to an official stock exchange listing ..................................................................... 70.93
Transferable securities dealt in on another regulated market ................................................................................... 10.76
Investment funds (UCITS) ...................................................................................................................................... 0.90
Over the counter financial derivative instruments ................................................................................................... 3.82
Other assets .............................................................................................................................................................. 13.59
100.00
The broker for the open futures contracts is JPMorgan.
The counterparties for the open forward foreign currency exchange contracts are:
Bank of America
BNP Paribas
Citibank
Citigroup Global Markets
Goldman Sachs
JPMorgan
State Street Bank
The counterparties for the interest rate swaps are:
Bank of America
BNP Paribas
Citibank
Citigroup Global Markets
JPMorgan
UBS
The counterparties for the total return swaps are:
Citigroup Global Markets HSBC
The counterparty for the currency swap is JP Morgan.
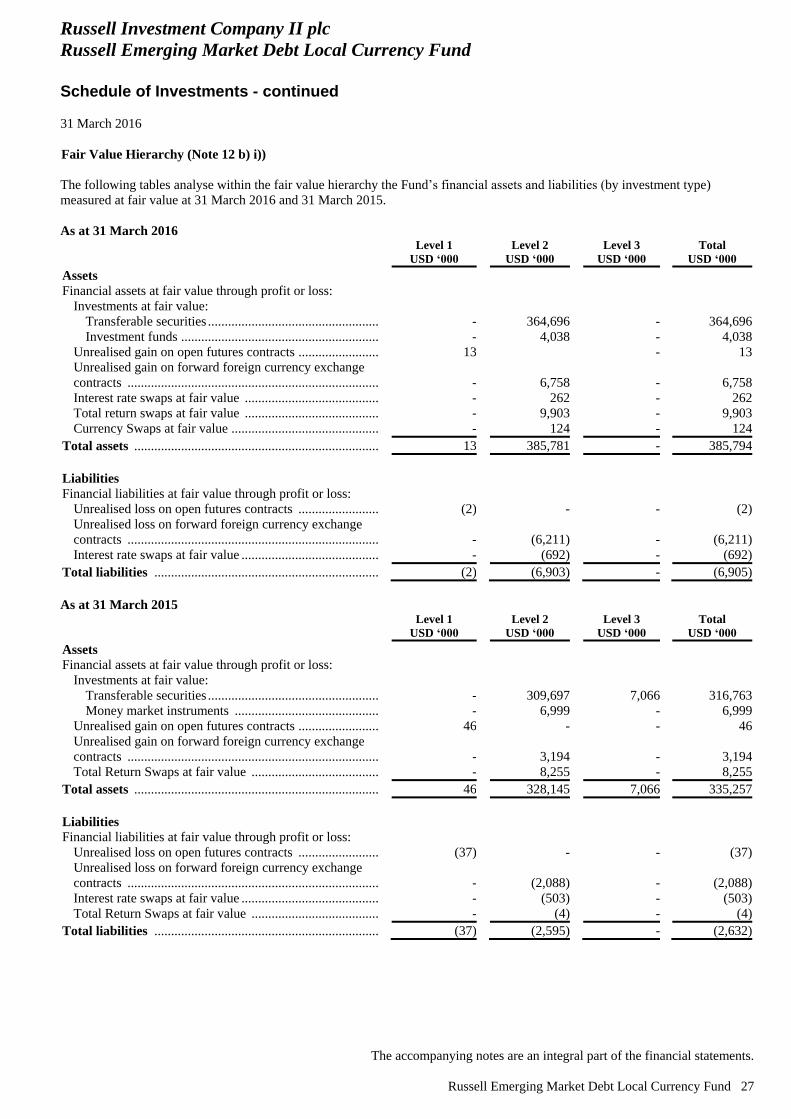
Russell Investment Company II plc
Russell Emerging Market Debt Local Currency Fund
Schedule of Investments - continued
31 March 2016
The accompanying notes are an integral part of the financial statements.
Russell Emerging Market Debt Local Currency Fund 27
Fair Value Hierarchy (Note 12 b) i))
The following tables analyse within the fair value hierarchy the Fund’s financial assets and liabilities (by investment type)
measured at fair value at 31 March 2016 and 31 March 2015.
As at 31 March 2016
Level 1
USD ‘000
Level 2
USD ‘000
Level 3
USD ‘000
Total
USD ‘000
Assets
Financial assets at fair value through profit or loss:
Investments at fair value:
Transferable securities ................................................................ - 364,696 - 364,696
Investment funds ........................................................................ - 4,038 - 4,038
Unrealised gain on open futures contracts ................................. 13 - 13
Unrealised gain on forward foreign currency exchange
contracts .................................................................................... - 6,758 - 6,758
Interest rate swaps at fair value ................................................. - 262 - 262
Total return swaps at fair value ................................................. - 9,903 - 9,903
Currency Swaps at fair value ..................................................... - 124 - 124
Total assets ...................................................................................... 13 385,781 - 385,794
Liabilities
Financial liabilities at fair value through profit or loss:
Unrealised loss on open futures contracts ..................................... (2) - - (2)
Unrealised loss on forward foreign currency exchange
contracts ........................................................................................ - (6,211) - (6,211)
Interest rate swaps at fair value ...................................................... - (692) - (692)
Total liabilities ................................................................................ (2) (6,903) - (6,905)
As at 31 March 2015
Level 1
USD ‘000
Level 2
USD ‘000
Level 3
USD ‘000
Total
USD ‘000
Assets
Financial assets at fair value through profit or loss:
Investments at fair value:
Transferable securities ................................................................ - 309,697 7,066 316,763
Money market instruments ........................................................ - 6,999 - 6,999
Unrealised gain on open futures contracts ................................. 46 - - 46
Unrealised gain on forward foreign currency exchange
contracts .................................................................................... - 3,194 - 3,194
Total Return Swaps at fair value ............................................... - 8,255 - 8,255
Total assets ...................................................................................... 46 328,145 7,066 335,257
Liabilities
Financial liabilities at fair value through profit or loss:
Unrealised loss on open futures contracts ..................................... (37) - - (37)
Unrealised loss on forward foreign currency exchange
contracts ........................................................................................ - (2,088) - (2,088)
Interest rate swaps at fair value ...................................................... - (503) - (503)
Total Return Swaps at fair value ................................................... - (4) - (4)
Total liabilities ................................................................................ (37) (2,595) - (2,632)
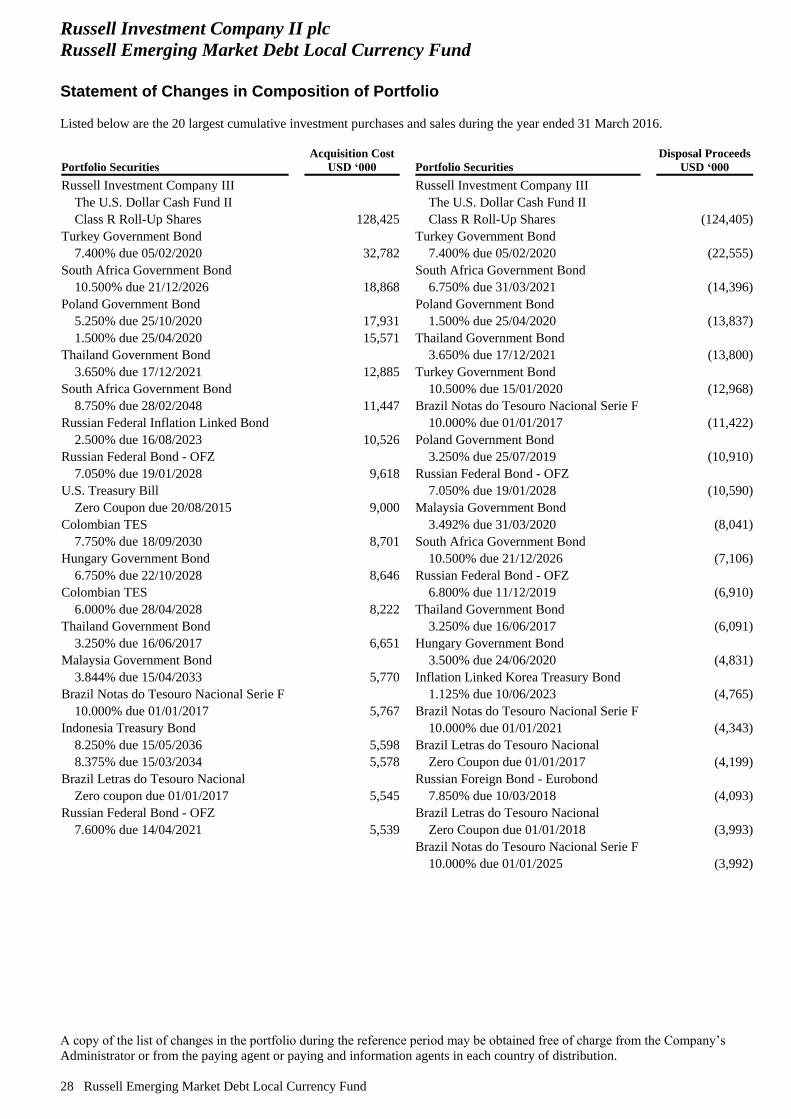
Russell Investment Company II plc
Russell Emerging Market Debt Local Currency Fund
Statement of Changes in Composition of Portfolio
Listed below are the 20 largest cumulative investment purchases and sales during the year ended 31 March 2016.
A copy of the list of changes in the portfolio during the reference period may be obtained free of charge from the Company’s
Administrator or from the paying agent or paying and information agents in each country of distribution.
28 Russell Emerging Market Debt Local Currency Fund
Portfolio Securities
Acquisition Cost
USD ‘000 Portfolio Securities
Disposal Proceeds
USD ‘000
Russell Investment Company III Russell Investment Company III
The U.S. Dollar Cash Fund II The U.S. Dollar Cash Fund II
Class R Roll-Up Shares 128,425 Class R Roll-Up Shares (124,405)
Turkey Government Bond Turkey Government Bond
7.400% due 05/02/2020 32,782 7.400% due 05/02/2020 (22,555)
South Africa Government Bond South Africa Government Bond
10.500% due 21/12/2026 18,868 6.750% due 31/03/2021 (14,396)
Poland Government Bond Poland Government Bond
5.250% due 25/10/2020 17,931 1.500% due 25/04/2020 (13,837)
1.500% due 25/04/2020 15,571 Thailand Government Bond
Thailand Government Bond 3.650% due 17/12/2021 (13,800)
3.650% due 17/12/2021 12,885 Turkey Government Bond
South Africa Government Bond 10.500% due 15/01/2020 (12,968)
8.750% due 28/02/2048 11,447 Brazil Notas do Tesouro Nacional Serie F
Russian Federal Inflation Linked Bond 10.000% due 01/01/2017 (11,422)
2.500% due 16/08/2023 10,526 Poland Government Bond
Russian Federal Bond - OFZ 3.250% due 25/07/2019 (10,910)
7.050% due 19/01/2028 9,618 Russian Federal Bond - OFZ
U.S. Treasury Bill 7.050% due 19/01/2028 (10,590)
Zero Coupon due 20/08/2015 9,000 Malaysia Government Bond
Colombian TES 3.492% due 31/03/2020 (8,041)
7.750% due 18/09/2030 8,701 South Africa Government Bond
Hungary Government Bond 10.500% due 21/12/2026 (7,106)
6.750% due 22/10/2028 8,646 Russian Federal Bond - OFZ
Colombian TES 6.800% due 11/12/2019 (6,910)
6.000% due 28/04/2028 8,222 Thailand Government Bond
Thailand Government Bond 3.250% due 16/06/2017 (6,091)
3.250% due 16/06/2017 6,651 Hungary Government Bond
Malaysia Government Bond 3.500% due 24/06/2020 (4,831)
3.844% due 15/04/2033 5,770 Inflation Linked Korea Treasury Bond
Brazil Notas do Tesouro Nacional Serie F 1.125% due 10/06/2023 (4,765)
10.000% due 01/01/2017 5,767 Brazil Notas do Tesouro Nacional Serie F
Indonesia Treasury Bond 10.000% due 01/01/2021 (4,343)
8.250% due 15/05/2036 5,598 Brazil Letras do Tesouro Nacional
8.375% due 15/03/2034 5,578 Zero Coupon due 01/01/2017 (4,199)
Brazil Letras do Tesouro Nacional Russian Foreign Bond - Eurobond
Zero coupon due 01/01/2017 5,545 7.850% due 10/03/2018 (4,093)
Russian Federal Bond - OFZ Brazil Letras do Tesouro Nacional
7.600% due 14/04/2021 5,539 Zero Coupon due 01/01/2018 (3,993)
Brazil Notas do Tesouro Nacional Serie F
10.000% due 01/01/2025 (3,992)
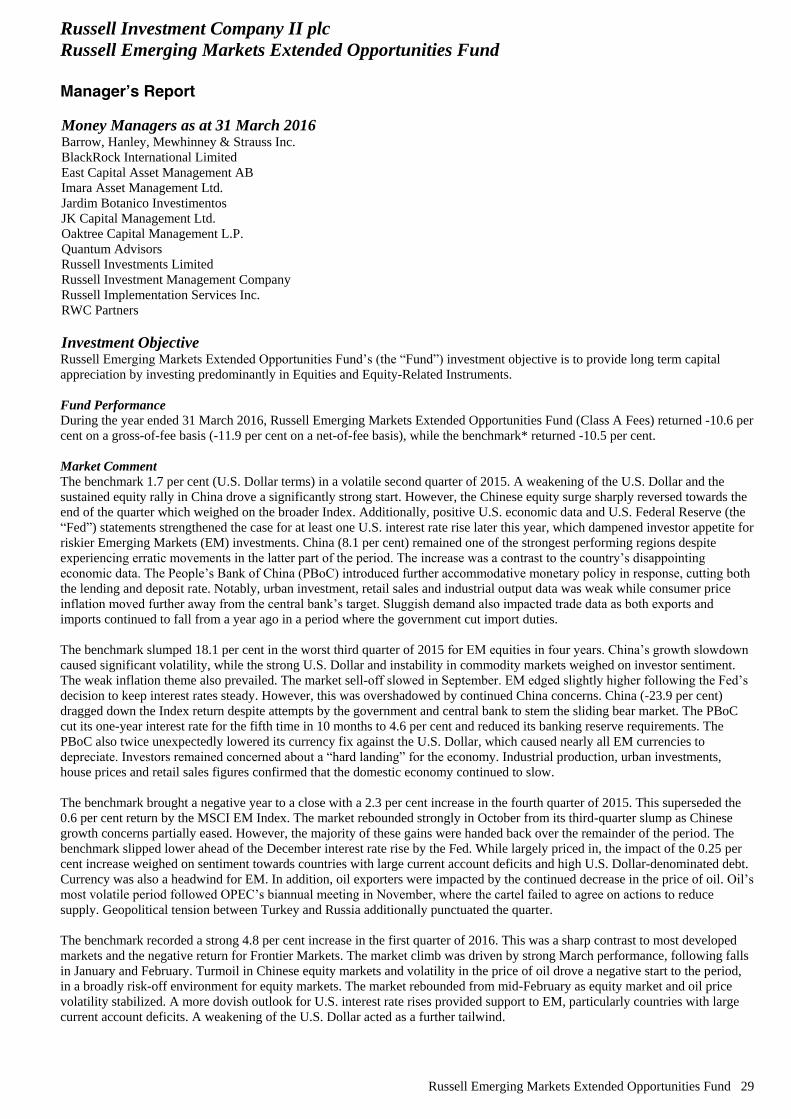
Russell Investment Company II plc
Russell Emerging Markets Extended Opportunities Fund
Manager’s Report
Russell Emerging Markets Extended Opportunities Fund 29
Money Managers as at 31 March 2016 Barrow, Hanley, Mewhinney & Strauss Inc.
BlackRock International Limited
East Capital Asset Management AB
Imara Asset Management Ltd.
Jardim Botanico Investimentos
JK Capital Management Ltd.
Oaktree Capital Management L.P.
Quantum Advisors
Russell Investments Limited
Russell Investment Management Company
Russell Implementation Services Inc.
RWC Partners
Investment Objective Russell Emerging Markets Extended Opportunities Fund’s (the “Fund”) investment objective is to provide long term capital
appreciation by investing predominantly in Equities and Equity-Related Instruments.
Fund Performance
During the year ended 31 March 2016, Russell Emerging Markets Extended Opportunities Fund (Class A Fees) returned -10.6 per
cent on a gross-of-fee basis (-11.9 per cent on a net-of-fee basis), while the benchmark* returned -10.5 per cent.
Market Comment
The benchmark 1.7 per cent (U.S. Dollar terms) in a volatile second quarter of 2015. A weakening of the U.S. Dollar and the
sustained equity rally in China drove a significantly strong start. However, the Chinese equity surge sharply reversed towards the
end of the quarter which weighed on the broader Index. Additionally, positive U.S. economic data and U.S. Federal Reserve (the
“Fed”) statements strengthened the case for at least one U.S. interest rate rise later this year, which dampened investor appetite for
riskier Emerging Markets (EM) investments. China (8.1 per cent) remained one of the strongest performing regions despite
experiencing erratic movements in the latter part of the period. The increase was a contrast to the country’s disappointing
economic data. The People’s Bank of China (PBoC) introduced further accommodative monetary policy in response, cutting both
the lending and deposit rate. Notably, urban investment, retail sales and industrial output data was weak while consumer price
inflation moved further away from the central bank’s target. Sluggish demand also impacted trade data as both exports and
imports continued to fall from a year ago in a period where the government cut import duties.
The benchmark slumped 18.1 per cent in the worst third quarter of 2015 for EM equities in four years. China’s growth slowdown
caused significant volatility, while the strong U.S. Dollar and instability in commodity markets weighed on investor sentiment.
The weak inflation theme also prevailed. The market sell-off slowed in September. EM edged slightly higher following the Fed’s
decision to keep interest rates steady. However, this was overshadowed by continued China concerns. China (-23.9 per cent)
dragged down the Index return despite attempts by the government and central bank to stem the sliding bear market. The PBoC
cut its one-year interest rate for the fifth time in 10 months to 4.6 per cent and reduced its banking reserve requirements. The
PBoC also twice unexpectedly lowered its currency fix against the U.S. Dollar, which caused nearly all EM currencies to
depreciate. Investors remained concerned about a “hard landing” for the economy. Industrial production, urban investments,
house prices and retail sales figures confirmed that the domestic economy continued to slow.
The benchmark brought a negative year to a close with a 2.3 per cent increase in the fourth quarter of 2015. This superseded the
0.6 per cent return by the MSCI EM Index. The market rebounded strongly in October from its third-quarter slump as Chinese
growth concerns partially eased. However, the majority of these gains were handed back over the remainder of the period. The
benchmark slipped lower ahead of the December interest rate rise by the Fed. While largely priced in, the impact of the 0.25 per
cent increase weighed on sentiment towards countries with large current account deficits and high U.S. Dollar-denominated debt.
Currency was also a headwind for EM. In addition, oil exporters were impacted by the continued decrease in the price of oil. Oil’s
most volatile period followed OPEC’s biannual meeting in November, where the cartel failed to agree on actions to reduce
supply. Geopolitical tension between Turkey and Russia additionally punctuated the quarter.
The benchmark recorded a strong 4.8 per cent increase in the first quarter of 2016. This was a sharp contrast to most developed
markets and the negative return for Frontier Markets. The market climb was driven by strong March performance, following falls
in January and February. Turmoil in Chinese equity markets and volatility in the price of oil drove a negative start to the period,
in a broadly risk-off environment for equity markets. The market rebounded from mid-February as equity market and oil price
volatility stabilized. A more dovish outlook for U.S. interest rate rises provided support to EM, particularly countries with large
current account deficits. A weakening of the U.S. Dollar acted as a further tailwind.
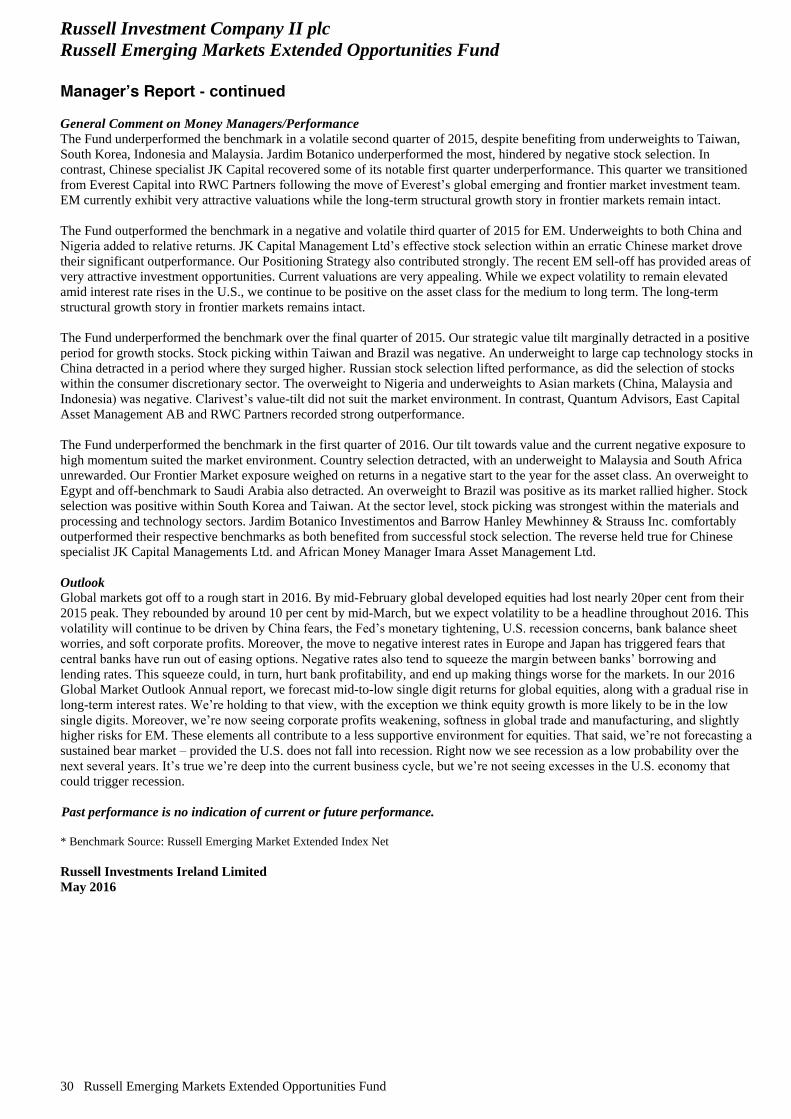
Russell Investment Company II plc
Russell Emerging Markets Extended Opportunities Fund
Manager’s Report - continued
30 Russell Emerging Markets Extended Opportunities Fund
General Comment on Money Managers/Performance
The Fund underperformed the benchmark in a volatile second quarter of 2015, despite benefiting from underweights to Taiwan,
South Korea, Indonesia and Malaysia. Jardim Botanico underperformed the most, hindered by negative stock selection. In
contrast, Chinese specialist JK Capital recovered some of its notable first quarter underperformance. This quarter we transitioned
from Everest Capital into RWC Partners following the move of Everest’s global emerging and frontier market investment team.
EM currently exhibit very attractive valuations while the long-term structural growth story in frontier markets remain intact.
The Fund outperformed the benchmark in a negative and volatile third quarter of 2015 for EM. Underweights to both China and
Nigeria added to relative returns. JK Capital Management Ltd’s effective stock selection within an erratic Chinese market drove
their significant outperformance. Our Positioning Strategy also contributed strongly. The recent EM sell-off has provided areas of
very attractive investment opportunities. Current valuations are very appealing. While we expect volatility to remain elevated
amid interest rate rises in the U.S., we continue to be positive on the asset class for the medium to long term. The long-term
structural growth story in frontier markets remains intact.
The Fund underperformed the benchmark over the final quarter of 2015. Our strategic value tilt marginally detracted in a positive
period for growth stocks. Stock picking within Taiwan and Brazil was negative. An underweight to large cap technology stocks in
China detracted in a period where they surged higher. Russian stock selection lifted performance, as did the selection of stocks
within the consumer discretionary sector. The overweight to Nigeria and underweights to Asian markets (China, Malaysia and
Indonesia) was negative. Clarivest’s value-tilt did not suit the market environment. In contrast, Quantum Advisors, East Capital
Asset Management AB and RWC Partners recorded strong outperformance.
The Fund underperformed the benchmark in the first quarter of 2016. Our tilt towards value and the current negative exposure to
high momentum suited the market environment. Country selection detracted, with an underweight to Malaysia and South Africa
unrewarded. Our Frontier Market exposure weighed on returns in a negative start to the year for the asset class. An overweight to
Egypt and off-benchmark to Saudi Arabia also detracted. An overweight to Brazil was positive as its market rallied higher. Stock
selection was positive within South Korea and Taiwan. At the sector level, stock picking was strongest within the materials and
processing and technology sectors. Jardim Botanico Investimentos and Barrow Hanley Mewhinney & Strauss Inc. comfortably
outperformed their respective benchmarks as both benefited from successful stock selection. The reverse held true for Chinese
specialist JK Capital Managements Ltd. and African Money Manager Imara Asset Management Ltd.
Outlook
Global markets got off to a rough start in 2016. By mid-February global developed equities had lost nearly 20per cent from their
2015 peak. They rebounded by around 10 per cent by mid-March, but we expect volatility to be a headline throughout 2016. This
volatility will continue to be driven by China fears, the Fed’s monetary tightening, U.S. recession concerns, bank balance sheet
worries, and soft corporate profits. Moreover, the move to negative interest rates in Europe and Japan has triggered fears that
central banks have run out of easing options. Negative rates also tend to squeeze the margin between banks’ borrowing and
lending rates. This squeeze could, in turn, hurt bank profitability, and end up making things worse for the markets. In our 2016
Global Market Outlook Annual report, we forecast mid-to-low single digit returns for global equities, along with a gradual rise in
long-term interest rates. We’re holding to that view, with the exception we think equity growth is more likely to be in the low
single digits. Moreover, we’re now seeing corporate profits weakening, softness in global trade and manufacturing, and slightly
higher risks for EM. These elements all contribute to a less supportive environment for equities. That said, we’re not forecasting a
sustained bear market – provided the U.S. does not fall into recession. Right now we see recession as a low probability over the
next several years. It’s true we’re deep into the current business cycle, but we’re not seeing excesses in the U.S. economy that
could trigger recession.
Past performance is no indication of current or future performance.
* Benchmark Source: Russell Emerging Market Extended Index Net
Russell Investments Ireland Limited
May 2016
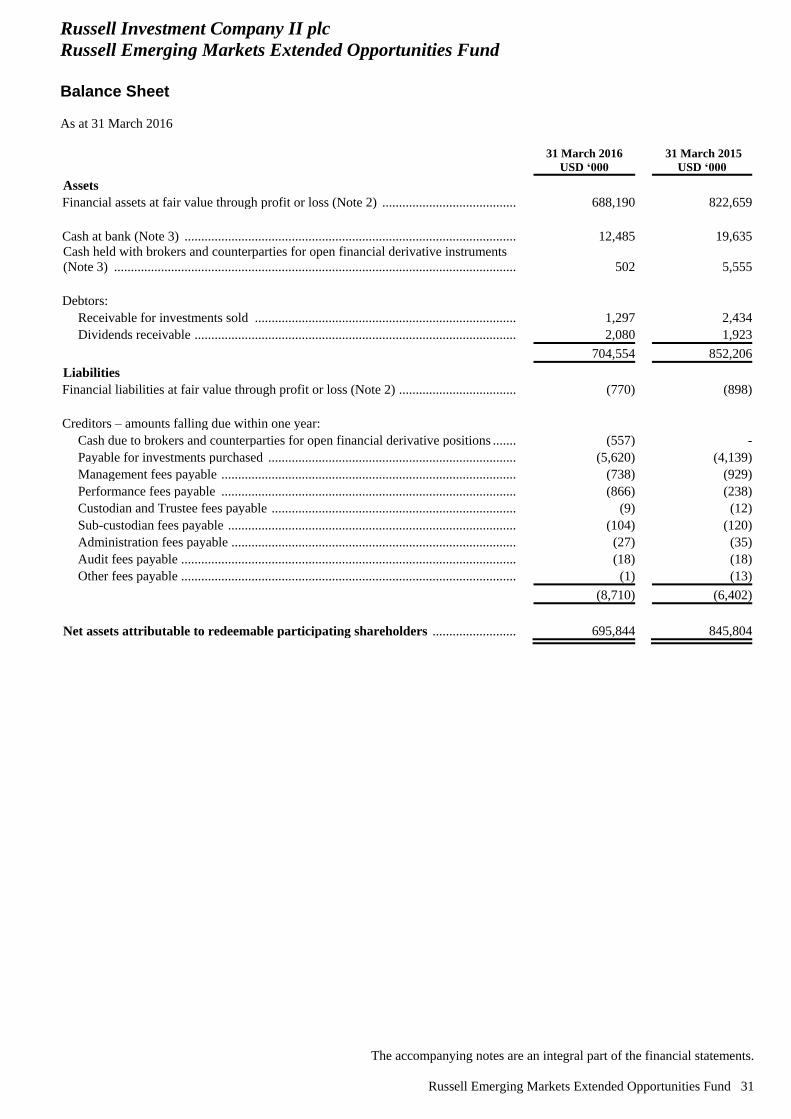
Russell Investment Company II plc
Russell Emerging Markets Extended Opportunities Fund
Balance Sheet
As at 31 March 2016
The accompanying notes are an integral part of the financial statements.
Russell Emerging Markets Extended Opportunities Fund 31
31 March 2016
USD ‘000
31 March 2015
USD ‘000
Assets
Financial assets at fair value through profit or loss (Note 2) ................................................................................................................ 688,190 822,659
Cash at bank (Note 3) ........................................................................................................................................................................... 12,485 19,635
Cash held with brokers and counterparties for open financial derivative instruments
(Note 3) ...................................................................................................................................................................... 502 5,555
Debtors:
Receivable for investments sold .................................................................................................................... 1,297 2,434
Dividends receivable ...................................................................................................................................... 2,080 1,923
704,554 852,206
Liabilities
Financial liabilities at fair value through profit or loss (Note 2) ........................................................................................................... (770) (898)
Creditors – amounts falling due within one year:
Cash due to brokers and counterparties for open financial derivative positions ............................................. (557) -
Payable for investments purchased ................................................................................................................ (5,620) (4,139)
Management fees payable .............................................................................................................................. (738) (929)
Performance fees payable .............................................................................................................................. (866) (238)
Custodian and Trustee fees payable ............................................................................................................... (9) (12)
Sub-custodian fees payable ............................................................................................................................ (104) (120)
Administration fees payable ........................................................................................................................... (27) (35)
Audit fees payable .......................................................................................................................................... (18) (18)
Other fees payable .......................................................................................................................................... (1) (13)
(8,710) (6,402)
Net assets attributable to redeemable participating shareholders ....................................................................... 695,844 845,804
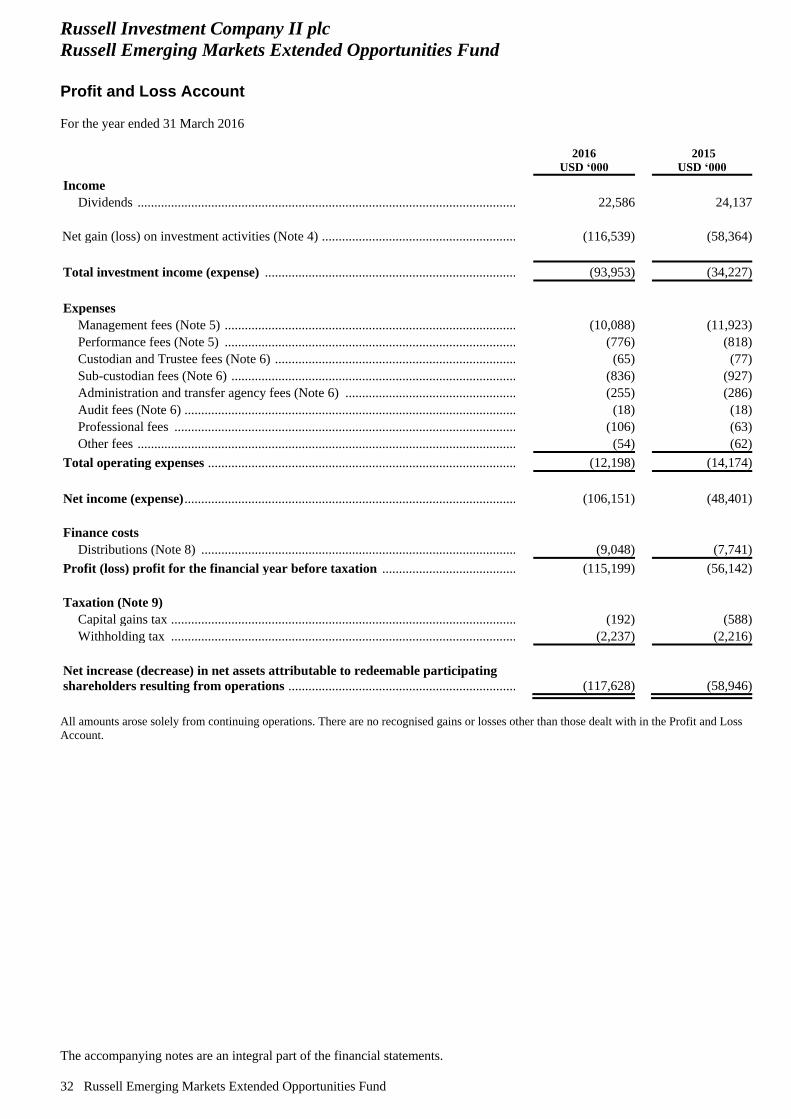
Russell Investment Company II plc
Russell Emerging Markets Extended Opportunities Fund
Profit and Loss Account
For the year ended 31 March 2016
The accompanying notes are an integral part of the financial statements.
32 Russell Emerging Markets Extended Opportunities Fund
2016
USD ‘000
2015
USD ‘000
Income
Dividends ....................................................................................................................................................... 22,586 24,137
Net gain (loss) on investment activities (Note 4) ...................................................................................................... (116,539) (58,364)
Total investment income (expense) ......................................................................................................................... (93,953) (34,227)
Expenses
Management fees (Note 5) ............................................................................................................................. (10,088) (11,923)
Performance fees (Note 5) ............................................................................................................................. (776) (818)
Custodian and Trustee fees (Note 6) .............................................................................................................. (65) (77)
Sub-custodian fees (Note 6) ........................................................................................................................... (836) (927)
Administration and transfer agency fees (Note 6) ......................................................................................... (255) (286)
Audit fees (Note 6) ......................................................................................................................................... (18) (18)
Professional fees ............................................................................................................................................ (106) (63)
Other fees ....................................................................................................................................................... (54) (62)
Total operating expenses .......................................................................................................................................... (12,198) (14,174)
Net income (expense) ................................................................................................................................................. (106,151) (48,401)
Finance costs
Distributions (Note 8) .................................................................................................................................... (9,048) (7,741)
Profit (loss) profit for the financial year before taxation ...................................................................................... (115,199) (56,142)
Taxation (Note 9)
Capital gains tax ............................................................................................................................................. (192) (588)
Withholding tax ............................................................................................................................................. (2,237) (2,216)
Net increase (decrease) in net assets attributable to redeemable participating
shareholders resulting from operations .................................................................................................................. (117,628) (58,946)
All amounts arose solely from continuing operations. There are no recognised gains or losses other than those dealt with in the Profit and Loss
Account.
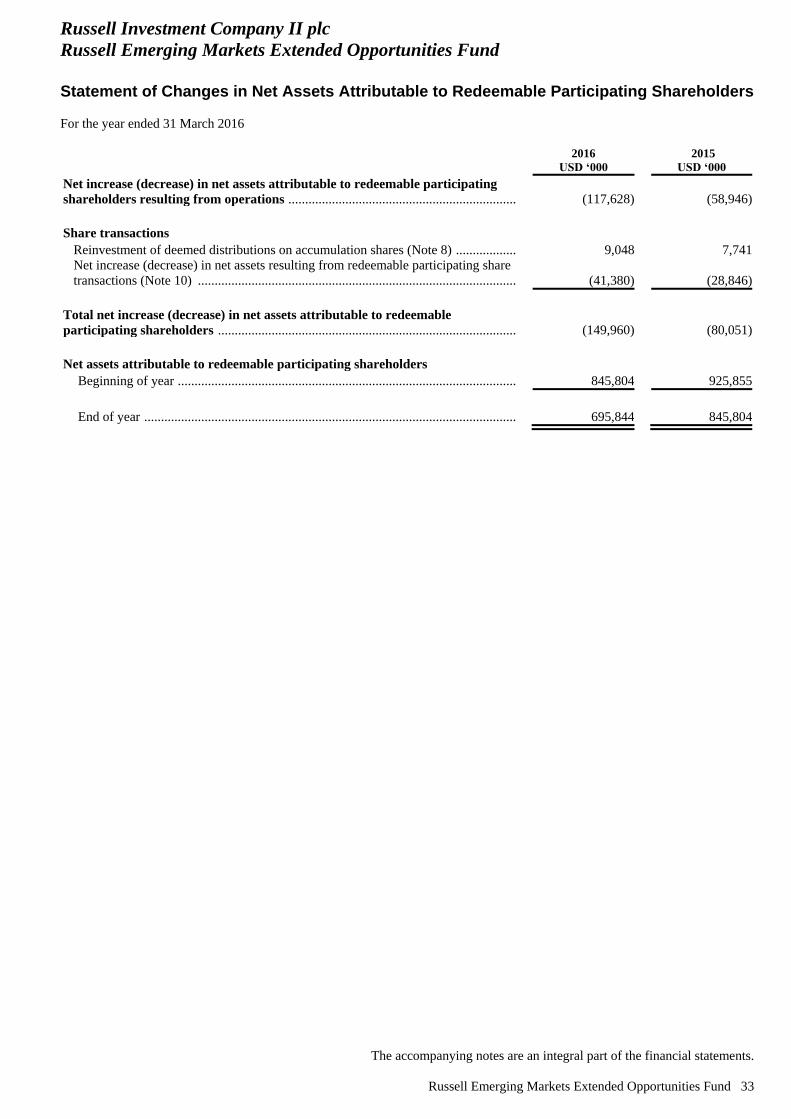
Russell Investment Company II plc
Russell Emerging Markets Extended Opportunities Fund
Statement of Changes in Net Assets Attributable to Redeemable Participating Shareholders
For the year ended 31 March 2016
The accompanying notes are an integral part of the financial statements.
Russell Emerging Markets Extended Opportunities Fund 33
2016
USD ‘000
2015
USD ‘000
Net increase (decrease) in net assets attributable to redeemable participating
shareholders resulting from operations .................................................................................................................. (117,628) (58,946)
Share transactions
Reinvestment of deemed distributions on accumulation shares (Note 8) ..................... 9,048 7,741
Net increase (decrease) in net assets resulting from redeemable participating share
transactions (Note 10) .................................................................................................. (41,380) (28,846)
Total net increase (decrease) in net assets attributable to redeemable
participating shareholders ....................................................................................................................................... (149,960) (80,051)
Net assets attributable to redeemable participating shareholders
Beginning of year ........................................................................................................................................... 845,804 925,855
End of year ..................................................................................................................................................... 695,844 845,804
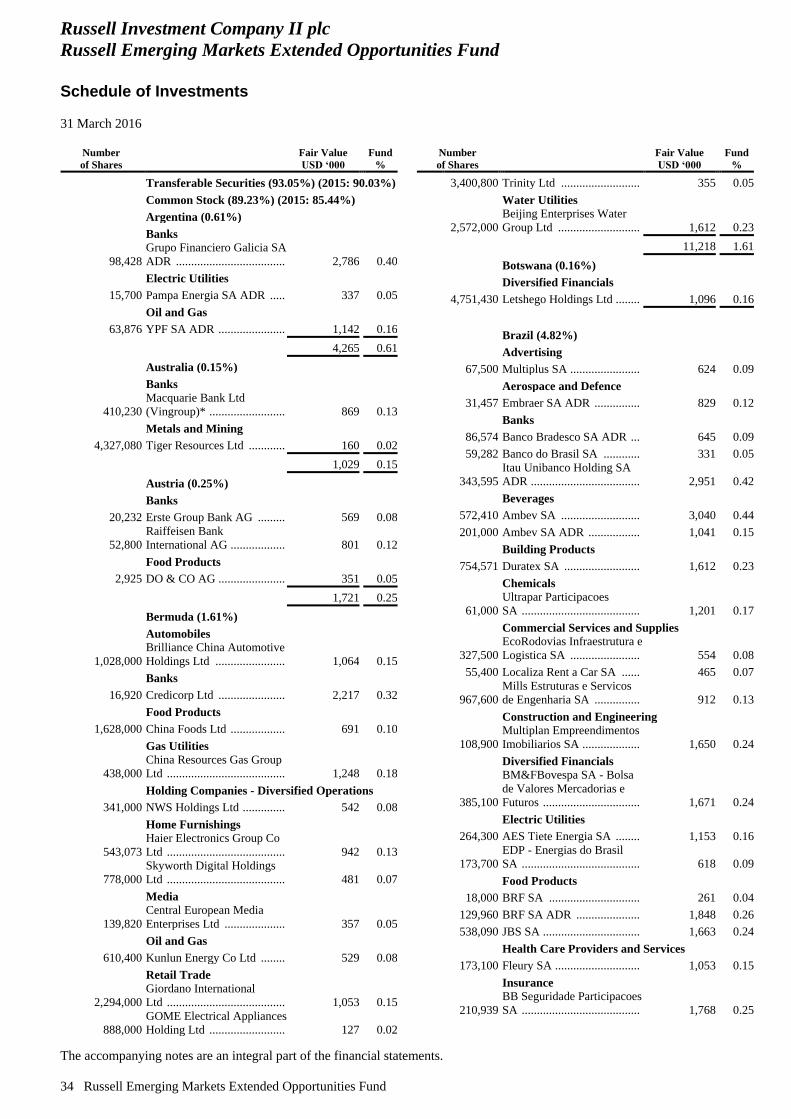
Russell Investment Company II plc
Russell Emerging Markets Extended Opportunities Fund
Schedule of Investments
31 March 2016
The accompanying notes are an integral part of the financial statements.
34 Russell Emerging Markets Extended Opportunities Fund
Number
of Shares
Fair Value
USD ‘000
Fund
%
Transferable Securities (93.05%) (2015: 90.03%)
Common Stock (89.23%) (2015: 85.44%)
Argentina (0.61%)
Banks
98,428
Grupo Financiero Galicia SA
ADR .................................... 2,786 0.40
Electric Utilities
15,700 Pampa Energia SA ADR ..... 337 0.05
Oil and Gas
63,876 YPF SA ADR ...................... 1,142 0.16
4,265 0.61
Australia (0.15%)
Banks
410,230
Macquarie Bank Ltd
(Vingroup)* ......................... 869 0.13
Metals and Mining
4,327,080 Tiger Resources Ltd ............ 160 0.02
1,029 0.15
Austria (0.25%)
Banks
20,232 Erste Group Bank AG ......... 569 0.08
52,800
Raiffeisen Bank
International AG .................. 801 0.12
Food Products
2,925 DO & CO AG ...................... 351 0.05
1,721 0.25
Bermuda (1.61%)
Automobiles
1,028,000
Brilliance China Automotive
Holdings Ltd ....................... 1,064 0.15
Banks
16,920 Credicorp Ltd ...................... 2,217 0.32
Food Products
1,628,000 China Foods Ltd .................. 691 0.10
Gas Utilities
438,000
China Resources Gas Group
Ltd ....................................... 1,248 0.18
Holding Companies - Diversified Operations
341,000 NWS Holdings Ltd .............. 542 0.08
Home Furnishings
543,073
Haier Electronics Group Co
Ltd ....................................... 942 0.13
778,000
Skyworth Digital Holdings
Ltd ....................................... 481 0.07
Media
139,820
Central European Media
Enterprises Ltd .................... 357 0.05
Oil and Gas
610,400 Kunlun Energy Co Ltd ........ 529 0.08
Retail Trade
2,294,000
Giordano International
Ltd ....................................... 1,053 0.15
888,000
GOME Electrical Appliances
Holding Ltd ......................... 127 0.02
Number
of Shares
Fair Value
USD ‘000
Fund
%
3,400,800 Trinity Ltd .......................... 355 0.05
Water Utilities
2,572,000
Beijing Enterprises Water
Group Ltd ........................... 1,612 0.23
11,218 1.61
Botswana (0.16%)
Diversified Financials
4,751,430 Letshego Holdings Ltd ........ 1,096 0.16
Brazil (4.82%)
Advertising
67,500 Multiplus SA ....................... 624 0.09
Aerospace and Defence
31,457 Embraer SA ADR ............... 829 0.12
Banks
86,574 Banco Bradesco SA ADR ... 645 0.09
59,282 Banco do Brasil SA ............ 331 0.05
343,595
Itau Unibanco Holding SA
ADR .................................... 2,951 0.42
Beverages
572,410 Ambev SA .......................... 3,040 0.44
201,000 Ambev SA ADR ................. 1,041 0.15
Building Products
754,571 Duratex SA ......................... 1,612 0.23
Chemicals
61,000
Ultrapar Participacoes
SA ....................................... 1,201 0.17
Commercial Services and Supplies
327,500
EcoRodovias Infraestrutura e
Logistica SA ....................... 554 0.08
55,400 Localiza Rent a Car SA ...... 465 0.07
967,600
Mills Estruturas e Servicos
de Engenharia SA ............... 912 0.13
Construction and Engineering
108,900
Multiplan Empreendimentos
Imobiliarios SA ................... 1,650 0.24
Diversified Financials
385,100
BM&FBovespa SA - Bolsa
de Valores Mercadorias e
Futuros ................................ 1,671 0.24
Electric Utilities
264,300 AES Tiete Energia SA ........ 1,153 0.16
173,700
EDP - Energias do Brasil
SA ....................................... 618 0.09
Food Products
18,000 BRF SA .............................. 261 0.04
129,960 BRF SA ADR ..................... 1,848 0.26
538,090 JBS SA ................................ 1,663 0.24
Health Care Providers and Services
173,100 Fleury SA ............................ 1,053 0.15
Insurance
210,939
BB Seguridade Participacoes
SA ....................................... 1,768 0.25
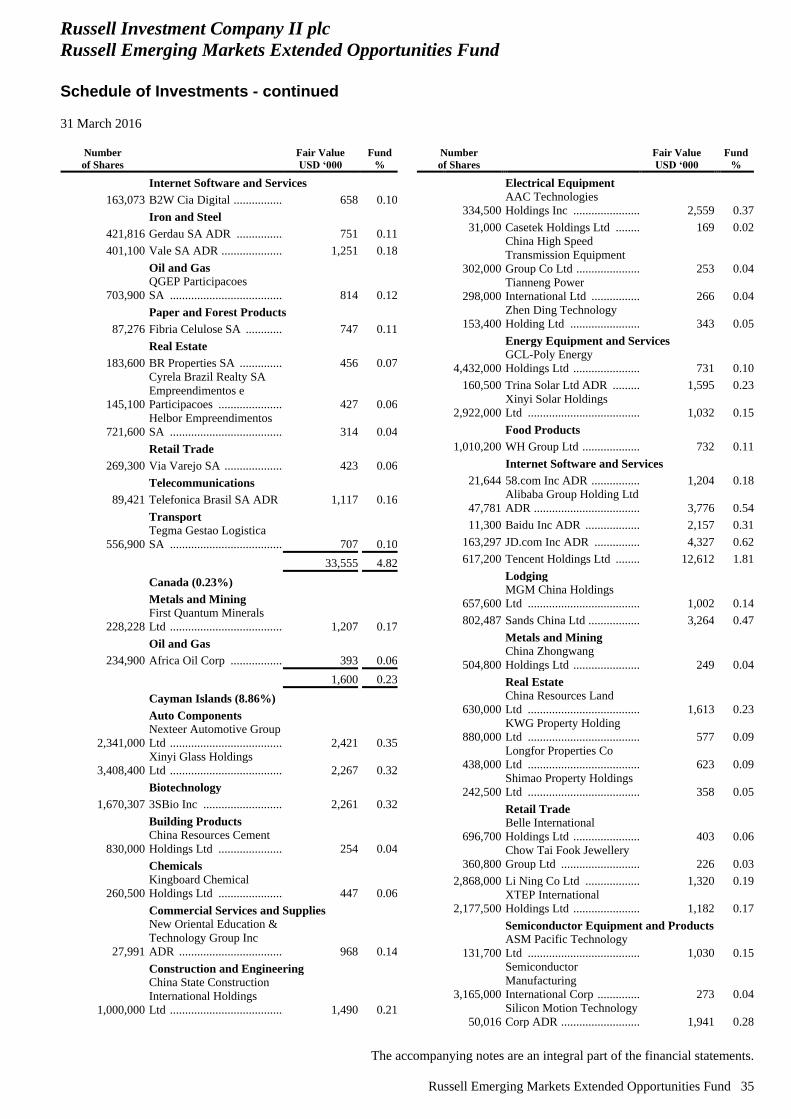
Russell Investment Company II plc
Russell Emerging Markets Extended Opportunities Fund
Schedule of Investments - continued
31 March 2016
The accompanying notes are an integral part of the financial statements.
Russell Emerging Markets Extended Opportunities Fund 35
Number
of Shares
Fair Value
USD ‘000
Fund
%
Internet Software and Services
163,073 B2W Cia Digital .................. 658 0.10
Iron and Steel
421,816 Gerdau SA ADR ................. 751 0.11
401,100 Vale SA ADR ...................... 1,251 0.18
Oil and Gas
703,900
QGEP Participacoes
SA ....................................... 814 0.12
Paper and Forest Products
87,276 Fibria Celulose SA .............. 747 0.11
Real Estate
183,600 BR Properties SA ................ 456 0.07
145,100
Cyrela Brazil Realty SA
Empreendimentos e
Participacoes ....................... 427 0.06
721,600
Helbor Empreendimentos
SA ....................................... 314 0.04
Retail Trade
269,300 Via Varejo SA ..................... 423 0.06
Telecommunications
89,421 Telefonica Brasil SA ADR .. 1,117 0.16
Transport
556,900
Tegma Gestao Logistica
SA ....................................... 707 0.10
33,555 4.82
Canada (0.23%)
Metals and Mining
228,228
First Quantum Minerals
Ltd ....................................... 1,207 0.17
Oil and Gas
234,900 Africa Oil Corp ................... 393 0.06
1,600 0.23
Cayman Islands (8.86%)
Auto Components
2,341,000
Nexteer Automotive Group
Ltd ....................................... 2,421 0.35
3,408,400
Xinyi Glass Holdings
Ltd ....................................... 2,267 0.32
Biotechnology
1,670,307 3SBio Inc ............................ 2,261 0.32
Building Products
830,000
China Resources Cement
Holdings Ltd ....................... 254 0.04
Chemicals
260,500
Kingboard Chemical
Holdings Ltd ....................... 447 0.06
Commercial Services and Supplies
27,991
New Oriental Education &
Technology Group Inc
ADR .................................... 968 0.14
Construction and Engineering
1,000,000
China State Construction
International Holdings
Ltd ....................................... 1,490 0.21
Number
of Shares
Fair Value
USD ‘000
Fund
%
Electrical Equipment
334,500
AAC Technologies
Holdings Inc ....................... 2,559 0.37
31,000 Casetek Holdings Ltd ......... 169 0.02
302,000
China High Speed
Transmission Equipment
Group Co Ltd ...................... 253 0.04
298,000
Tianneng Power
International Ltd ................. 266 0.04
153,400
Zhen Ding Technology
Holding Ltd ........................ 343 0.05
Energy Equipment and Services
4,432,000
GCL-Poly Energy
Holdings Ltd ....................... 731 0.10
160,500 Trina Solar Ltd ADR .......... 1,595 0.23
2,922,000
Xinyi Solar Holdings
Ltd ...................................... 1,032 0.15
Food Products
1,010,200 WH Group Ltd .................... 732 0.11
Internet Software and Services
21,644 58.com Inc ADR ................. 1,204 0.18
47,781
Alibaba Group Holding Ltd
ADR .................................... 3,776 0.54
11,300 Baidu Inc ADR ................... 2,157 0.31
163,297 JD.com Inc ADR ................ 4,327 0.62
617,200 Tencent Holdings Ltd ......... 12,612 1.81
Lodging
657,600
MGM China Holdings
Ltd ...................................... 1,002 0.14
802,487 Sands China Ltd .................. 3,264 0.47
Metals and Mining
504,800
China Zhongwang
Holdings Ltd ....................... 249 0.04
Real Estate
630,000
China Resources Land
Ltd ...................................... 1,613 0.23
880,000
KWG Property Holding
Ltd ...................................... 577 0.09
438,000
Longfor Properties Co
Ltd ...................................... 623 0.09
242,500
Shimao Property Holdings
Ltd ...................................... 358 0.05
Retail Trade
696,700
Belle International
Holdings Ltd ....................... 403 0.06
360,800
Chow Tai Fook Jewellery
Group Ltd ........................... 226 0.03
2,868,000 Li Ning Co Ltd ................... 1,320 0.19
2,177,500
XTEP International
Holdings Ltd ....................... 1,182 0.17
Semiconductor Equipment and Products
131,700
ASM Pacific Technology
Ltd ...................................... 1,030 0.15
3,165,000
Semiconductor
Manufacturing
International Corp ............... 273 0.04
50,016
Silicon Motion Technology
Corp ADR ........................... 1,941 0.28
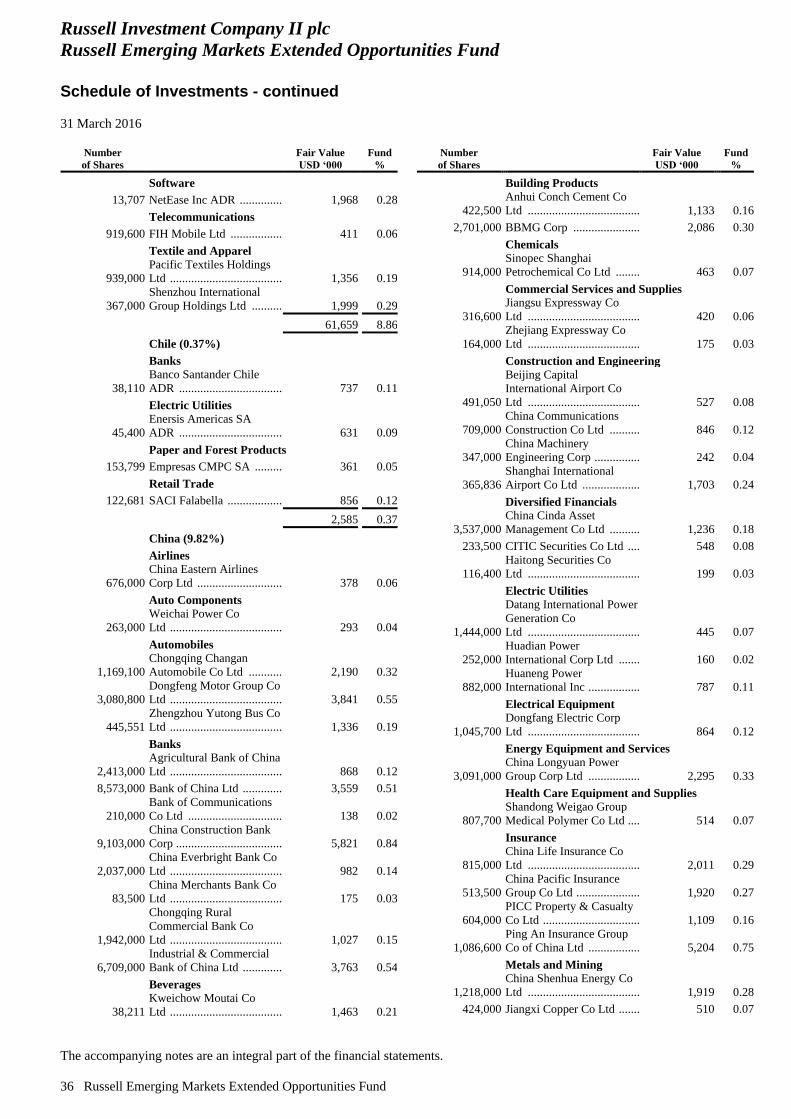
Russell Investment Company II plc
Russell Emerging Markets Extended Opportunities Fund
Schedule of Investments - continued
31 March 2016
The accompanying notes are an integral part of the financial statements.
36 Russell Emerging Markets Extended Opportunities Fund
Number
of Shares
Fair Value
USD ‘000
Fund
%
Software
13,707 NetEase Inc ADR ................ 1,968 0.28
Telecommunications
919,600 FIH Mobile Ltd ................... 411 0.06
Textile and Apparel
939,000
Pacific Textiles Holdings
Ltd ....................................... 1,356 0.19
367,000
Shenzhou International
Group Holdings Ltd ............ 1,999 0.29
61,659 8.86
Chile (0.37%)
Banks
38,110
Banco Santander Chile
ADR .................................... 737 0.11
Electric Utilities
45,400
Enersis Americas SA
ADR .................................... 631 0.09
Paper and Forest Products
153,799 Empresas CMPC SA ........... 361 0.05
Retail Trade
122,681 SACI Falabella .................... 856 0.12
2,585 0.37
China (9.82%)
Airlines
676,000
China Eastern Airlines
Corp Ltd .............................. 378 0.06
Auto Components
263,000
Weichai Power Co
Ltd ....................................... 293 0.04
Automobiles
1,169,100
Chongqing Changan
Automobile Co Ltd ............. 2,190 0.32
3,080,800
Dongfeng Motor Group Co
Ltd ....................................... 3,841 0.55
445,551
Zhengzhou Yutong Bus Co
Ltd ....................................... 1,336 0.19
Banks
2,413,000
Agricultural Bank of China
Ltd ....................................... 868 0.12
8,573,000 Bank of China Ltd ............... 3,559 0.51
210,000
Bank of Communications
Co Ltd ................................. 138 0.02
9,103,000
China Construction Bank
Corp ..................................... 5,821 0.84
2,037,000
China Everbright Bank Co
Ltd ....................................... 982 0.14
83,500
China Merchants Bank Co
Ltd ....................................... 175 0.03
1,942,000
Chongqing Rural
Commercial Bank Co
Ltd ....................................... 1,027 0.15
6,709,000
Industrial & Commercial
Bank of China Ltd ............... 3,763 0.54
Beverages
38,211
Kweichow Moutai Co
Ltd ....................................... 1,463 0.21
Number
of Shares
Fair Value
USD ‘000
Fund
%
Building Products
422,500
Anhui Conch Cement Co
Ltd ...................................... 1,133 0.16
2,701,000 BBMG Corp ....................... 2,086 0.30
Chemicals
914,000
Sinopec Shanghai
Petrochemical Co Ltd ......... 463 0.07
Commercial Services and Supplies
316,600
Jiangsu Expressway Co
Ltd ...................................... 420 0.06
164,000
Zhejiang Expressway Co
Ltd ...................................... 175 0.03
Construction and Engineering
491,050
Beijing Capital
International Airport Co
Ltd ...................................... 527 0.08
709,000
China Communications
Construction Co Ltd ........... 846 0.12
347,000
China Machinery
Engineering Corp ................ 242 0.04
365,836
Shanghai International
Airport Co Ltd .................... 1,703 0.24
Diversified Financials
3,537,000
China Cinda Asset
Management Co Ltd ........... 1,236 0.18
233,500 CITIC Securities Co Ltd ..... 548 0.08
116,400
Haitong Securities Co
Ltd ...................................... 199 0.03
Electric Utilities
1,444,000
Datang International Power
Generation Co
Ltd ...................................... 445 0.07
252,000
Huadian Power
International Corp Ltd ........ 160 0.02
882,000
Huaneng Power
International Inc .................. 787 0.11
Electrical Equipment
1,045,700
Dongfang Electric Corp
Ltd ...................................... 864 0.12
Energy Equipment and Services
3,091,000
China Longyuan Power
Group Corp Ltd .................. 2,295 0.33
Health Care Equipment and Supplies
807,700
Shandong Weigao Group
Medical Polymer Co Ltd ..... 514 0.07
Insurance
815,000
China Life Insurance Co
Ltd ...................................... 2,011 0.29
513,500
China Pacific Insurance
Group Co Ltd ...................... 1,920 0.27
604,000
PICC Property & Casualty
Co Ltd ................................. 1,109 0.16
1,086,600
Ping An Insurance Group
Co of China Ltd .................. 5,204 0.75
Metals and Mining
1,218,000
China Shenhua Energy Co
Ltd ...................................... 1,919 0.28
424,000 Jiangxi Copper Co Ltd ........ 510 0.07
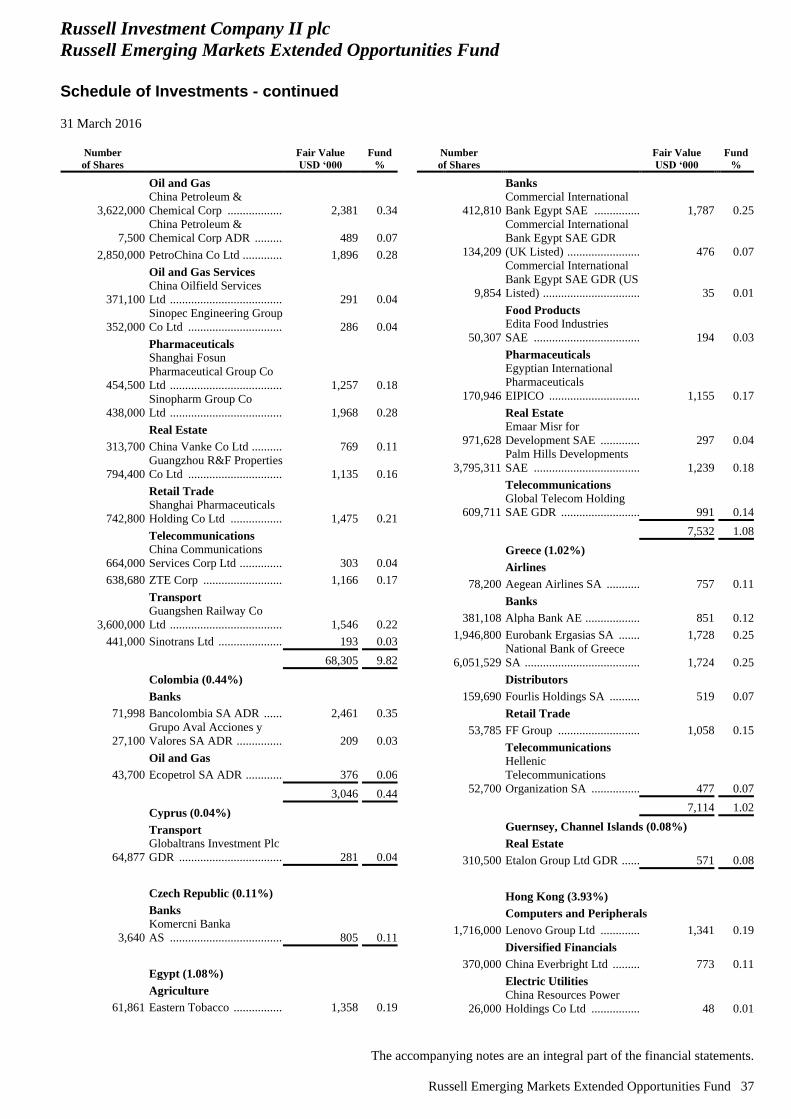
Russell Investment Company II plc
Russell Emerging Markets Extended Opportunities Fund
Schedule of Investments - continued
31 March 2016
The accompanying notes are an integral part of the financial statements.
Russell Emerging Markets Extended Opportunities Fund 37
Number
of Shares
Fair Value
USD ‘000
Fund
%
Oil and Gas
3,622,000
China Petroleum &
Chemical Corp .................... 2,381 0.34
7,500
China Petroleum &
Chemical Corp ADR ........... 489 0.07
2,850,000 PetroChina Co Ltd ............... 1,896 0.28
Oil and Gas Services
371,100
China Oilfield Services
Ltd ....................................... 291 0.04
352,000
Sinopec Engineering Group
Co Ltd ................................. 286 0.04
Pharmaceuticals
454,500
Shanghai Fosun
Pharmaceutical Group Co
Ltd ....................................... 1,257 0.18
438,000
Sinopharm Group Co
Ltd ....................................... 1,968 0.28
Real Estate
313,700 China Vanke Co Ltd ............ 769 0.11
794,400
Guangzhou R&F Properties
Co Ltd ................................. 1,135 0.16
Retail Trade
742,800
Shanghai Pharmaceuticals
Holding Co Ltd ................... 1,475 0.21
Telecommunications
664,000
China Communications
Services Corp Ltd ................ 303 0.04
638,680 ZTE Corp ............................ 1,166 0.17
Transport
3,600,000
Guangshen Railway Co
Ltd ....................................... 1,546 0.22
441,000 Sinotrans Ltd ....................... 193 0.03
68,305 9.82
Colombia (0.44%)
Banks
71,998 Bancolombia SA ADR ........ 2,461 0.35
27,100
Grupo Aval Acciones y
Valores SA ADR ................. 209 0.03
Oil and Gas
43,700 Ecopetrol SA ADR .............. 376 0.06
3,046 0.44
Cyprus (0.04%)
Transport
64,877
Globaltrans Investment Plc
GDR .................................... 281 0.04
Czech Republic (0.11%)
Banks
3,640
Komercni Banka
AS ....................................... 805 0.11
Egypt (1.08%)
Agriculture
61,861 Eastern Tobacco .................. 1,358 0.19
Number
of Shares
Fair Value
USD ‘000
Fund
%
Banks
412,810
Commercial International
Bank Egypt SAE ................ 1,787 0.25
134,209
Commercial International
Bank Egypt SAE GDR
(UK Listed) ......................... 476 0.07
9,854
Commercial International
Bank Egypt SAE GDR (US
Listed) ................................. 35 0.01
Food Products
50,307
Edita Food Industries
SAE .................................... 194 0.03
Pharmaceuticals
170,946
Egyptian International
Pharmaceuticals
EIPICO ............................... 1,155 0.17
Real Estate
971,628
Emaar Misr for
Development SAE .............. 297 0.04
3,795,311
Palm Hills Developments
SAE .................................... 1,239 0.18
Telecommunications
609,711
Global Telecom Holding
SAE GDR ........................... 991 0.14
7,532 1.08
Greece (1.02%)
Airlines
78,200 Aegean Airlines SA ............ 757 0.11
Banks
381,108 Alpha Bank AE ................... 851 0.12
1,946,800 Eurobank Ergasias SA ........ 1,728 0.25
6,051,529
National Bank of Greece
SA ....................................... 1,724 0.25
Distributors
159,690 Fourlis Holdings SA ........... 519 0.07
Retail Trade
53,785 FF Group ............................ 1,058 0.15
Telecommunications
52,700
Hellenic
Telecommunications
Organization SA ................. 477 0.07
7,114 1.02
Guernsey, Channel Islands (0.08%)
Real Estate
310,500 Etalon Group Ltd GDR ....... 571 0.08
Hong Kong (3.93%)
Computers and Peripherals
1,716,000 Lenovo Group Ltd .............. 1,341 0.19
Diversified Financials
370,000 China Everbright Ltd .......... 773 0.11
Electric Utilities
26,000
China Resources Power
Holdings Co Ltd ................. 48 0.01
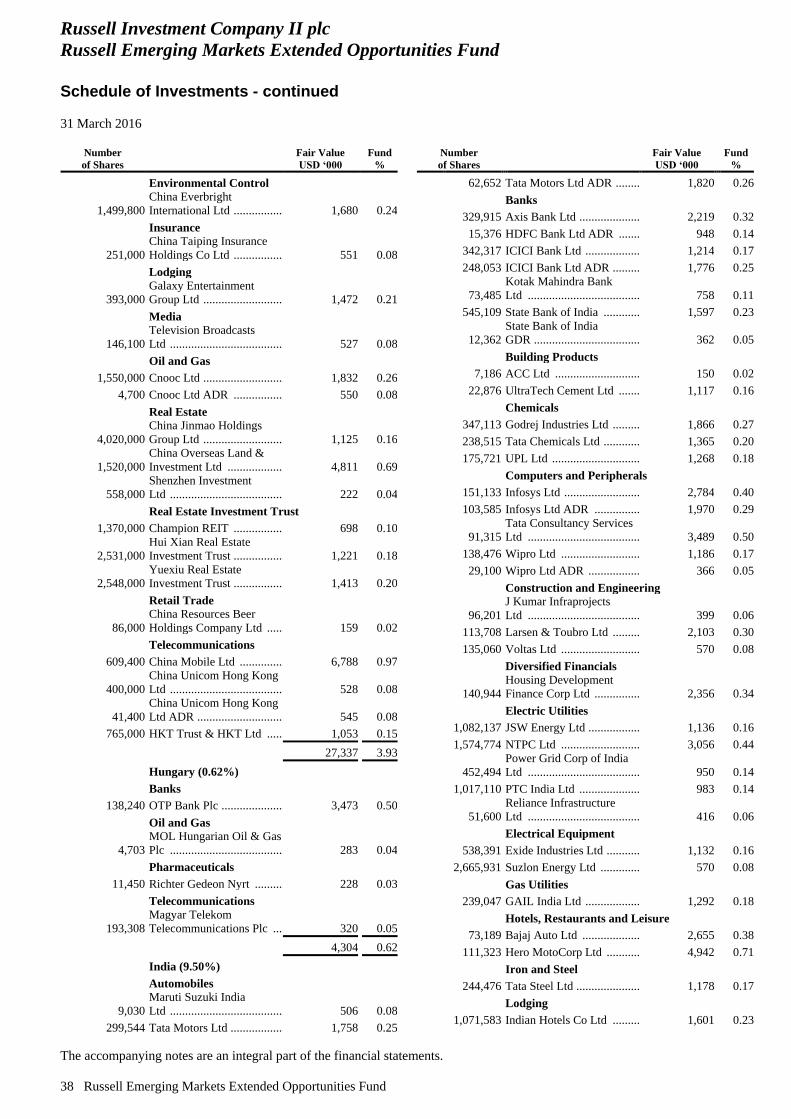
Russell Investment Company II plc
Russell Emerging Markets Extended Opportunities Fund
Schedule of Investments - continued
31 March 2016
The accompanying notes are an integral part of the financial statements.
38 Russell Emerging Markets Extended Opportunities Fund
Number
of Shares
Fair Value
USD ‘000
Fund
%
Environmental Control
1,499,800
China Everbright
International Ltd .................. 1,680 0.24
Insurance
251,000
China Taiping Insurance
Holdings Co Ltd .................. 551 0.08
Lodging
393,000
Galaxy Entertainment
Group Ltd ............................ 1,472 0.21
Media
146,100
Television Broadcasts
Ltd ....................................... 527 0.08
Oil and Gas
1,550,000 Cnooc Ltd ............................ 1,832 0.26
4,700 Cnooc Ltd ADR .................. 550 0.08
Real Estate
4,020,000
China Jinmao Holdings
Group Ltd ............................ 1,125 0.16
1,520,000
China Overseas Land &
Investment Ltd .................... 4,811 0.69
558,000
Shenzhen Investment
Ltd ....................................... 222 0.04
Real Estate Investment Trust
1,370,000 Champion REIT .................. 698 0.10
2,531,000
Hui Xian Real Estate
Investment Trust .................. 1,221 0.18
2,548,000
Yuexiu Real Estate
Investment Trust .................. 1,413 0.20
Retail Trade
86,000
China Resources Beer
Holdings Company Ltd ....... 159 0.02
Telecommunications
609,400 China Mobile Ltd ................ 6,788 0.97
400,000
China Unicom Hong Kong
Ltd ....................................... 528 0.08
41,400
China Unicom Hong Kong
Ltd ADR .............................. 545 0.08
765,000 HKT Trust & HKT Ltd ....... 1,053 0.15
27,337 3.93
Hungary (0.62%)
Banks
138,240 OTP Bank Plc ...................... 3,473 0.50
Oil and Gas
4,703
MOL Hungarian Oil & Gas
Plc ....................................... 283 0.04
Pharmaceuticals
11,450 Richter Gedeon Nyrt ........... 228 0.03
Telecommunications
193,308
Magyar Telekom
Telecommunications Plc ..... 320 0.05
4,304 0.62
India (9.50%)
Automobiles
9,030
Maruti Suzuki India
Ltd ....................................... 506 0.08
299,544 Tata Motors Ltd ................... 1,758 0.25
Number
of Shares
Fair Value
USD ‘000
Fund
%
62,652 Tata Motors Ltd ADR ......... 1,820 0.26
Banks
329,915 Axis Bank Ltd ..................... 2,219 0.32
15,376 HDFC Bank Ltd ADR ........ 948 0.14
342,317 ICICI Bank Ltd ................... 1,214 0.17
248,053 ICICI Bank Ltd ADR .......... 1,776 0.25
73,485
Kotak Mahindra Bank
Ltd ...................................... 758 0.11
545,109 State Bank of India ............. 1,597 0.23
12,362
State Bank of India
GDR .................................... 362 0.05
Building Products
7,186 ACC Ltd ............................. 150 0.02
22,876 UltraTech Cement Ltd ........ 1,117 0.16
Chemicals
347,113 Godrej Industries Ltd .......... 1,866 0.27
238,515 Tata Chemicals Ltd ............. 1,365 0.20
175,721 UPL Ltd .............................. 1,268 0.18
Computers and Peripherals
151,133 Infosys Ltd .......................... 2,784 0.40
103,585 Infosys Ltd ADR ................ 1,970 0.29
91,315
Tata Consultancy Services
Ltd ...................................... 3,489 0.50
138,476 Wipro Ltd ........................... 1,186 0.17
29,100 Wipro Ltd ADR .................. 366 0.05
Construction and Engineering
96,201
J Kumar Infraprojects
Ltd ...................................... 399 0.06
113,708 Larsen & Toubro Ltd .......... 2,103 0.30
135,060 Voltas Ltd ........................... 570 0.08
Diversified Financials
140,944
Housing Development
Finance Corp Ltd ................ 2,356 0.34
Electric Utilities
1,082,137 JSW Energy Ltd .................. 1,136 0.16
1,574,774 NTPC Ltd ........................... 3,056 0.44
452,494
Power Grid Corp of India
Ltd ...................................... 950 0.14
1,017,110 PTC India Ltd ..................... 983 0.14
51,600
Reliance Infrastructure
Ltd ...................................... 416 0.06
Electrical Equipment
538,391 Exide Industries Ltd ............ 1,132 0.16
2,665,931 Suzlon Energy Ltd .............. 570 0.08
Gas Utilities
239,047 GAIL India Ltd ................... 1,292 0.18
Hotels, Restaurants and Leisure
73,189 Bajaj Auto Ltd .................... 2,655 0.38
111,323 Hero MotoCorp Ltd ............ 4,942 0.71
Iron and Steel
244,476 Tata Steel Ltd ...................... 1,178 0.17
Lodging
1,071,583 Indian Hotels Co Ltd .......... 1,601 0.23
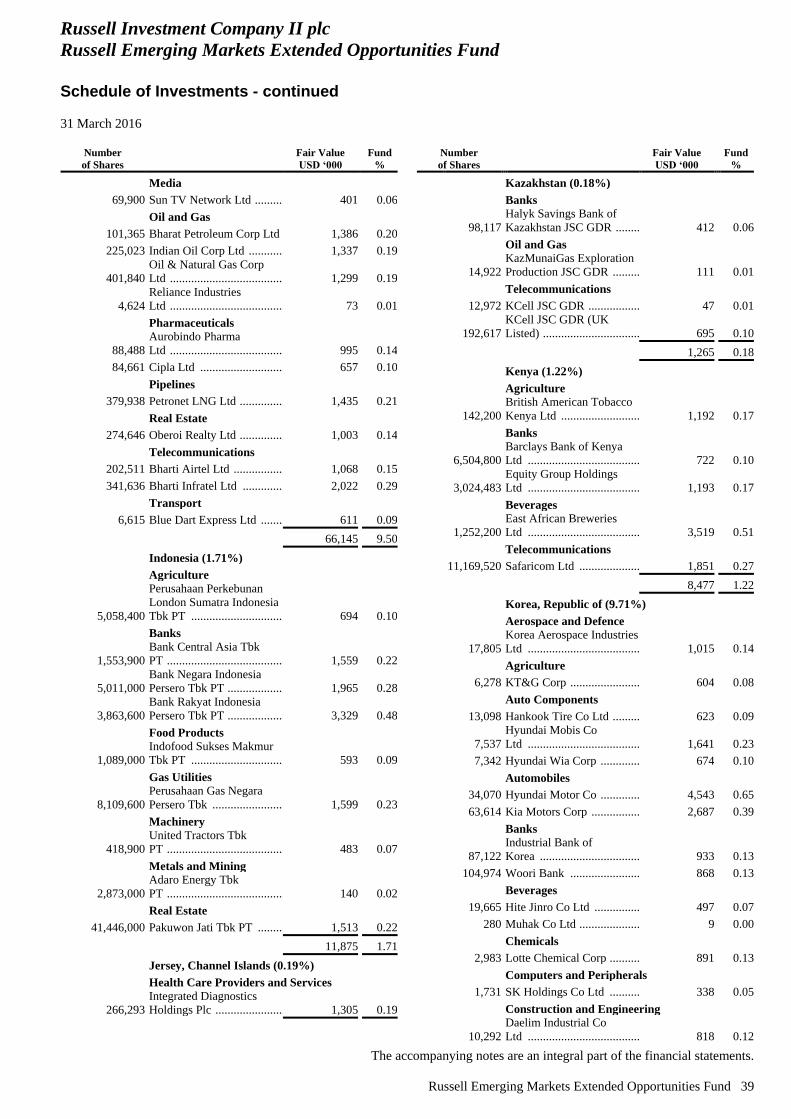
Russell Investment Company II plc
Russell Emerging Markets Extended Opportunities Fund
Schedule of Investments - continued
31 March 2016
The accompanying notes are an integral part of the financial statements.
Russell Emerging Markets Extended Opportunities Fund 39
Number
of Shares
Fair Value
USD ‘000
Fund
%
Media
69,900 Sun TV Network Ltd ........... 401 0.06
Oil and Gas
101,365 Bharat Petroleum Corp Ltd . 1,386 0.20
225,023 Indian Oil Corp Ltd ............. 1,337 0.19
401,840
Oil & Natural Gas Corp
Ltd ....................................... 1,299 0.19
4,624
Reliance Industries
Ltd ....................................... 73 0.01
Pharmaceuticals
88,488
Aurobindo Pharma
Ltd ....................................... 995 0.14
84,661 Cipla Ltd ............................. 657 0.10
Pipelines
379,938 Petronet LNG Ltd ................ 1,435 0.21
Real Estate
274,646 Oberoi Realty Ltd ................ 1,003 0.14
Telecommunications
202,511 Bharti Airtel Ltd .................. 1,068 0.15
341,636 Bharti Infratel Ltd ............... 2,022 0.29
Transport
6,615 Blue Dart Express Ltd ......... 611 0.09
66,145 9.50
Indonesia (1.71%)
Agriculture
5,058,400
Perusahaan Perkebunan
London Sumatra Indonesia
Tbk PT ................................ 694 0.10
Banks
1,553,900
Bank Central Asia Tbk
PT ........................................ 1,559 0.22
5,011,000
Bank Negara Indonesia
Persero Tbk PT .................... 1,965 0.28
3,863,600
Bank Rakyat Indonesia
Persero Tbk PT .................... 3,329 0.48
Food Products
1,089,000
Indofood Sukses Makmur
Tbk PT ................................ 593 0.09
Gas Utilities
8,109,600
Perusahaan Gas Negara
Persero Tbk ......................... 1,599 0.23
Machinery
418,900
United Tractors Tbk
PT ........................................ 483 0.07
Metals and Mining
2,873,000
Adaro Energy Tbk
PT ........................................ 140 0.02
Real Estate
41,446,000 Pakuwon Jati Tbk PT .......... 1,513 0.22
11,875 1.71
Jersey, Channel Islands (0.19%)
Health Care Providers and Services
266,293
Integrated Diagnostics
Holdings Plc ........................ 1,305 0.19
Number
of Shares
Fair Value
USD ‘000
Fund
%
Kazakhstan (0.18%)
Banks
98,117
Halyk Savings Bank of
Kazakhstan JSC GDR ......... 412 0.06
Oil and Gas
14,922
KazMunaiGas Exploration
Production JSC GDR .......... 111 0.01
Telecommunications
12,972 KCell JSC GDR .................. 47 0.01
192,617
KCell JSC GDR (UK
Listed) ................................. 695 0.10
1,265 0.18
Kenya (1.22%)
Agriculture
142,200
British American Tobacco
Kenya Ltd ........................... 1,192 0.17
Banks
6,504,800
Barclays Bank of Kenya
Ltd ...................................... 722 0.10
3,024,483
Equity Group Holdings
Ltd ...................................... 1,193 0.17
Beverages
1,252,200
East African Breweries
Ltd ...................................... 3,519 0.51
Telecommunications
11,169,520 Safaricom Ltd ..................... 1,851 0.27
8,477 1.22
Korea, Republic of (9.71%)
Aerospace and Defence
17,805
Korea Aerospace Industries
Ltd ...................................... 1,015 0.14
Agriculture
6,278 KT&G Corp ........................ 604 0.08
Auto Components
13,098 Hankook Tire Co Ltd .......... 623 0.09
7,537
Hyundai Mobis Co
Ltd ...................................... 1,641 0.23
7,342 Hyundai Wia Corp .............. 674 0.10
Automobiles
34,070 Hyundai Motor Co .............. 4,543 0.65
63,614 Kia Motors Corp ................. 2,687 0.39
Banks
87,122
Industrial Bank of
Korea .................................. 933 0.13
104,974 Woori Bank ........................ 868 0.13
Beverages
19,665 Hite Jinro Co Ltd ................ 497 0.07
280 Muhak Co Ltd ..................... 9 0.00
Chemicals
2,983 Lotte Chemical Corp ........... 891 0.13
Computers and Peripherals
1,731 SK Holdings Co Ltd ........... 338 0.05
Construction and Engineering
10,292
Daelim Industrial Co
Ltd ...................................... 818 0.12
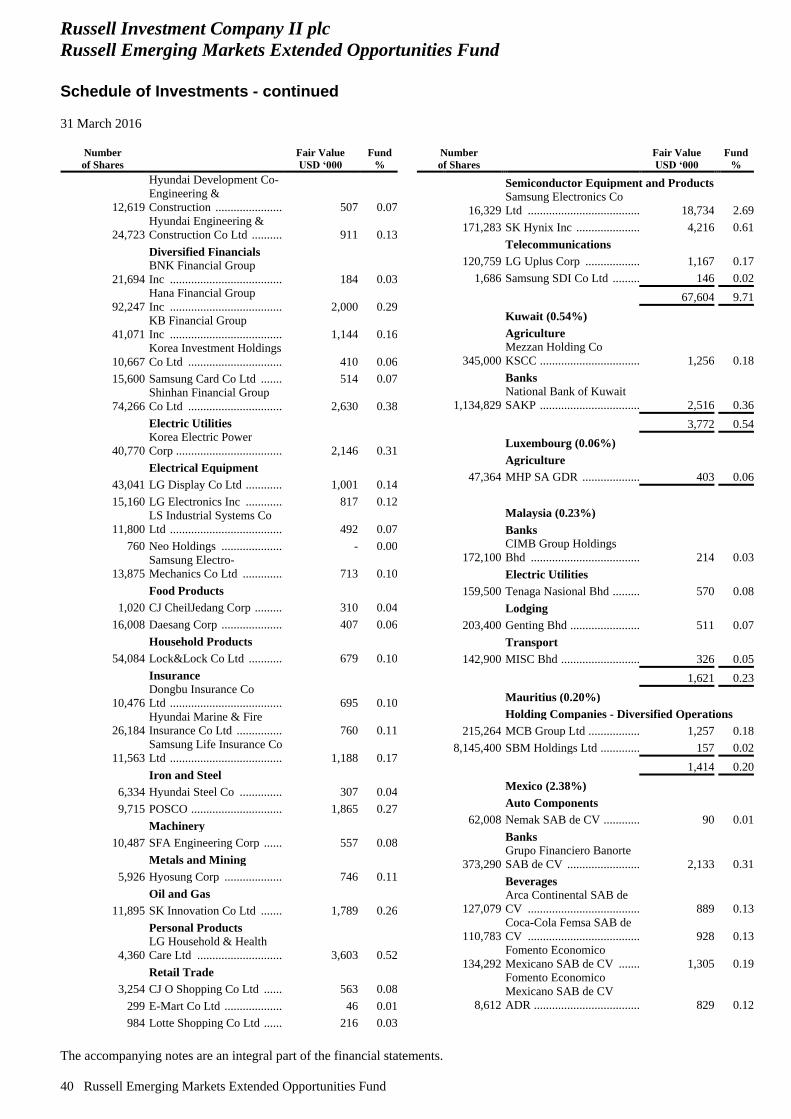
Russell Investment Company II plc
Russell Emerging Markets Extended Opportunities Fund
Schedule of Investments - continued
31 March 2016
The accompanying notes are an integral part of the financial statements.
40 Russell Emerging Markets Extended Opportunities Fund
Number
of Shares
Fair Value
USD ‘000
Fund
%
12,619
Hyundai Development Co-
Engineering &
Construction ........................ 507 0.07
24,723
Hyundai Engineering &
Construction Co Ltd ............ 911 0.13
Diversified Financials
21,694
BNK Financial Group
Inc ....................................... 184 0.03
92,247
Hana Financial Group
Inc ....................................... 2,000 0.29
41,071
KB Financial Group
Inc ....................................... 1,144 0.16
10,667
Korea Investment Holdings
Co Ltd ................................. 410 0.06
15,600 Samsung Card Co Ltd ......... 514 0.07
74,266
Shinhan Financial Group
Co Ltd ................................. 2,630 0.38
Electric Utilities
40,770
Korea Electric Power
Corp ..................................... 2,146 0.31
Electrical Equipment
43,041 LG Display Co Ltd .............. 1,001 0.14
15,160 LG Electronics Inc .............. 817 0.12
11,800
LS Industrial Systems Co
Ltd ....................................... 492 0.07
760 Neo Holdings ...................... - 0.00
13,875
Samsung Electro-
Mechanics Co Ltd ............... 713 0.10
Food Products
1,020 CJ CheilJedang Corp ........... 310 0.04
16,008 Daesang Corp ...................... 407 0.06
Household Products
54,084 Lock&Lock Co Ltd ............. 679 0.10
Insurance
10,476
Dongbu Insurance Co
Ltd ....................................... 695 0.10
26,184
Hyundai Marine & Fire
Insurance Co Ltd ................. 760 0.11
11,563
Samsung Life Insurance Co
Ltd ....................................... 1,188 0.17
Iron and Steel
6,334 Hyundai Steel Co ................ 307 0.04
9,715 POSCO ................................ 1,865 0.27
Machinery
10,487 SFA Engineering Corp ........ 557 0.08
Metals and Mining
5,926 Hyosung Corp ..................... 746 0.11
Oil and Gas
11,895 SK Innovation Co Ltd ......... 1,789 0.26
Personal Products
4,360
LG Household & Health
Care Ltd .............................. 3,603 0.52
Retail Trade
3,254 CJ O Shopping Co Ltd ........ 563 0.08
299 E-Mart Co Ltd ..................... 46 0.01
984 Lotte Shopping Co Ltd ........ 216 0.03
Number
of Shares
Fair Value
USD ‘000
Fund
%
Semiconductor Equipment and Products
16,329
Samsung Electronics Co
Ltd ...................................... 18,734 2.69
171,283 SK Hynix Inc ...................... 4,216 0.61
Telecommunications
120,759 LG Uplus Corp ................... 1,167 0.17
1,686 Samsung SDI Co Ltd .......... 146 0.02
67,604 9.71
Kuwait (0.54%)
Agriculture
345,000
Mezzan Holding Co
KSCC .................................. 1,256 0.18
Banks
1,134,829
National Bank of Kuwait
SAKP .................................. 2,516 0.36
3,772 0.54
Luxembourg (0.06%)
Agriculture
47,364 MHP SA GDR .................... 403 0.06
Malaysia (0.23%)
Banks
172,100
CIMB Group Holdings
Bhd ..................................... 214 0.03
Electric Utilities
159,500 Tenaga Nasional Bhd .......... 570 0.08
Lodging
203,400 Genting Bhd ........................ 511 0.07
Transport
142,900 MISC Bhd ........................... 326 0.05
1,621 0.23
Mauritius (0.20%)
Holding Companies - Diversified Operations
215,264 MCB Group Ltd .................. 1,257 0.18
8,145,400 SBM Holdings Ltd .............. 157 0.02
1,414 0.20
Mexico (2.38%)
Auto Components
62,008 Nemak SAB de CV ............. 90 0.01
Banks
373,290
Grupo Financiero Banorte
SAB de CV ......................... 2,133 0.31
Beverages
127,079
Arca Continental SAB de
CV ...................................... 889 0.13
110,783
Coca-Cola Femsa SAB de
CV ...................................... 928 0.13
134,292
Fomento Economico
Mexicano SAB de CV ........ 1,305 0.19
8,612
Fomento Economico
Mexicano SAB de CV
ADR .................................... 829 0.12
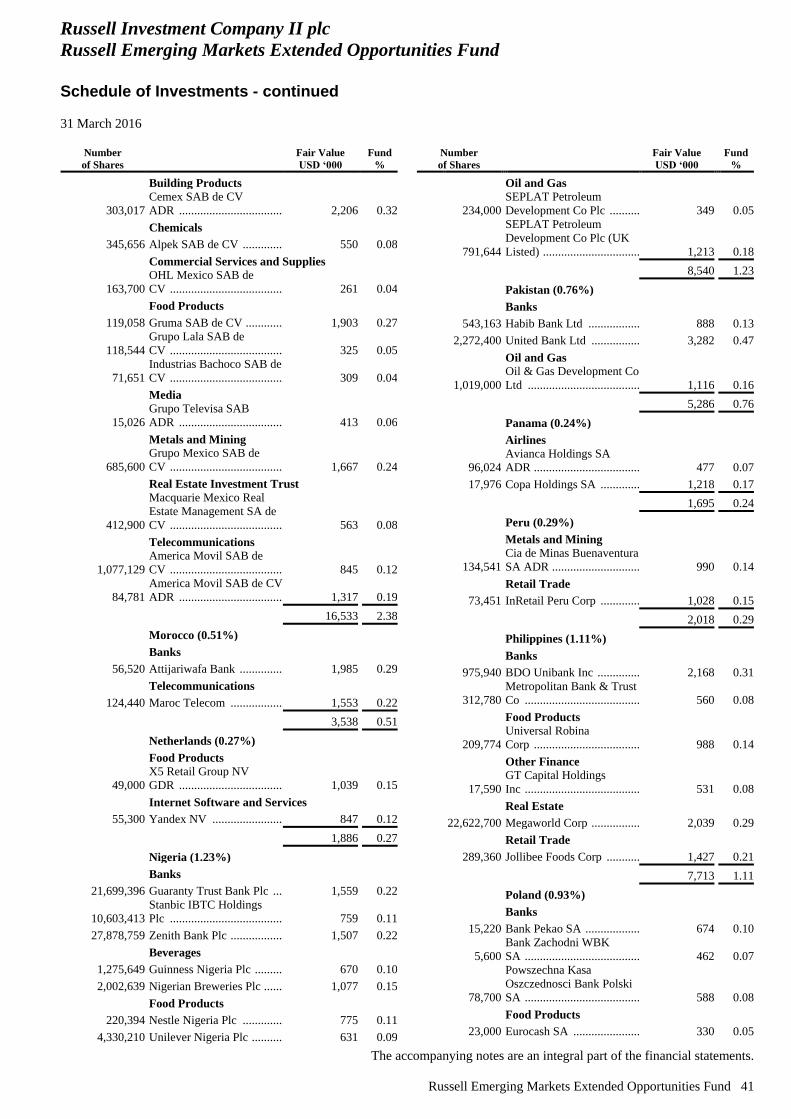
Russell Investment Company II plc
Russell Emerging Markets Extended Opportunities Fund
Schedule of Investments - continued
31 March 2016
The accompanying notes are an integral part of the financial statements.
Russell Emerging Markets Extended Opportunities Fund 41
Number
of Shares
Fair Value
USD ‘000
Fund
%
Building Products
303,017
Cemex SAB de CV
ADR .................................... 2,206 0.32
Chemicals
345,656 Alpek SAB de CV ............... 550 0.08
Commercial Services and Supplies
163,700
OHL Mexico SAB de
CV ....................................... 261 0.04
Food Products
119,058 Gruma SAB de CV .............. 1,903 0.27
118,544
Grupo Lala SAB de
CV ....................................... 325 0.05
71,651
Industrias Bachoco SAB de
CV ....................................... 309 0.04
Media
15,026
Grupo Televisa SAB
ADR .................................... 413 0.06
Metals and Mining
685,600
Grupo Mexico SAB de
CV ....................................... 1,667 0.24
Real Estate Investment Trust
412,900
Macquarie Mexico Real
Estate Management SA de
CV ....................................... 563 0.08
Telecommunications
1,077,129
America Movil SAB de
CV ....................................... 845 0.12
84,781
America Movil SAB de CV
ADR .................................... 1,317 0.19
16,533 2.38
Morocco (0.51%)
Banks
56,520 Attijariwafa Bank ................ 1,985 0.29
Telecommunications
124,440 Maroc Telecom ................... 1,553 0.22
3,538 0.51
Netherlands (0.27%)
Food Products
49,000
X5 Retail Group NV
GDR .................................... 1,039 0.15
Internet Software and Services
55,300 Yandex NV ......................... 847 0.12
1,886 0.27
Nigeria (1.23%)
Banks
21,699,396 Guaranty Trust Bank Plc ..... 1,559 0.22
10,603,413
Stanbic IBTC Holdings
Plc ....................................... 759 0.11
27,878,759 Zenith Bank Plc ................... 1,507 0.22
Beverages
1,275,649 Guinness Nigeria Plc ........... 670 0.10
2,002,639 Nigerian Breweries Plc ........ 1,077 0.15
Food Products
220,394 Nestle Nigeria Plc ............... 775 0.11
4,330,210 Unilever Nigeria Plc ............ 631 0.09
Number
of Shares
Fair Value
USD ‘000
Fund
%
Oil and Gas
234,000
SEPLAT Petroleum
Development Co Plc ........... 349 0.05
791,644
SEPLAT Petroleum
Development Co Plc (UK
Listed) ................................. 1,213 0.18
8,540 1.23
Pakistan (0.76%)
Banks
543,163 Habib Bank Ltd .................. 888 0.13
2,272,400 United Bank Ltd ................. 3,282 0.47
Oil and Gas
1,019,000
Oil & Gas Development Co
Ltd ...................................... 1,116 0.16
5,286 0.76
Panama (0.24%)
Airlines
96,024
Avianca Holdings SA
ADR .................................... 477 0.07
17,976 Copa Holdings SA .............. 1,218 0.17
1,695 0.24
Peru (0.29%)
Metals and Mining
134,541
Cia de Minas Buenaventura
SA ADR .............................. 990 0.14
Retail Trade
73,451 InRetail Peru Corp .............. 1,028 0.15
2,018 0.29
Philippines (1.11%)
Banks
975,940 BDO Unibank Inc ............... 2,168 0.31
312,780
Metropolitan Bank & Trust
Co ....................................... 560 0.08
Food Products
209,774
Universal Robina
Corp .................................... 988 0.14
Other Finance
17,590
GT Capital Holdings
Inc ....................................... 531 0.08
Real Estate
22,622,700 Megaworld Corp ................. 2,039 0.29
Retail Trade
289,360 Jollibee Foods Corp ............ 1,427 0.21
7,713 1.11
Poland (0.93%)
Banks
15,220 Bank Pekao SA ................... 674 0.10
5,600
Bank Zachodni WBK
SA ....................................... 462 0.07
78,700
Powszechna Kasa
Oszczednosci Bank Polski
SA ....................................... 588 0.08
Food Products
23,000 Eurocash SA ....................... 330 0.05
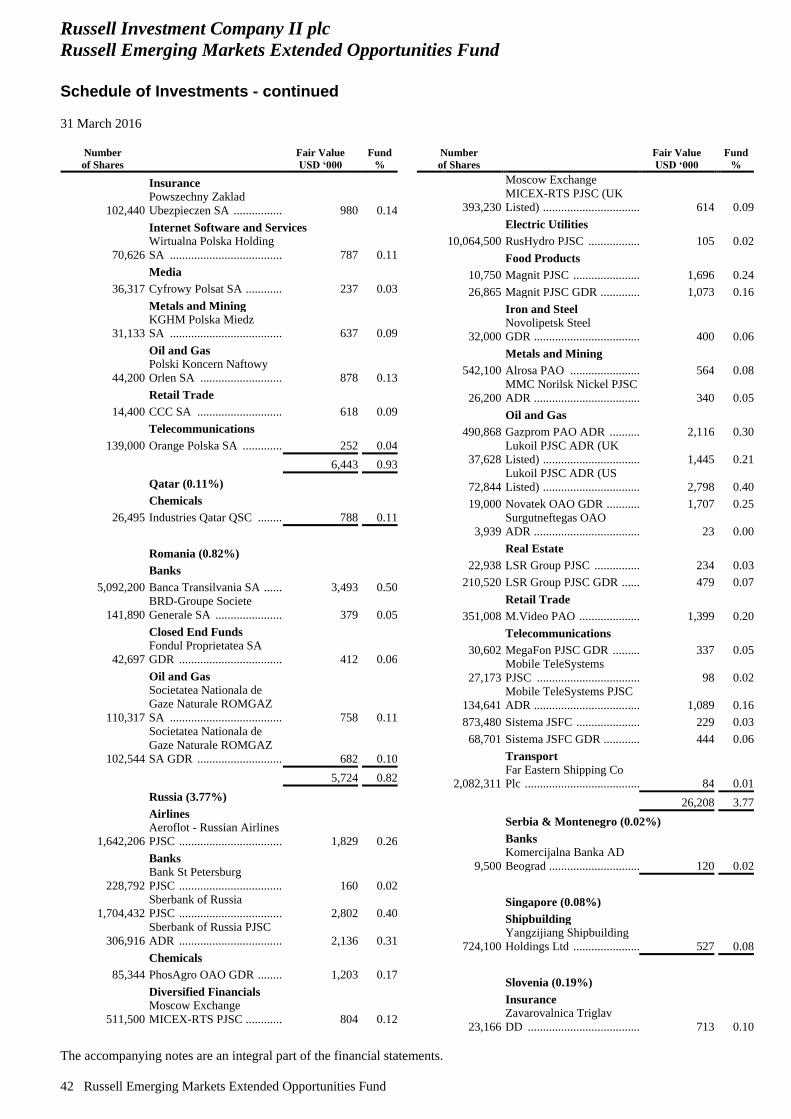
Russell Investment Company II plc
Russell Emerging Markets Extended Opportunities Fund
Schedule of Investments - continued
31 March 2016
The accompanying notes are an integral part of the financial statements.
42 Russell Emerging Markets Extended Opportunities Fund
Number
of Shares
Fair Value
USD ‘000
Fund
%
Insurance
102,440
Powszechny Zaklad
Ubezpieczen SA .................. 980 0.14
Internet Software and Services
70,626
Wirtualna Polska Holding
SA ....................................... 787 0.11
Media
36,317 Cyfrowy Polsat SA .............. 237 0.03
Metals and Mining
31,133
KGHM Polska Miedz
SA ....................................... 637 0.09
Oil and Gas
44,200
Polski Koncern Naftowy
Orlen SA ............................. 878 0.13
Retail Trade
14,400 CCC SA .............................. 618 0.09
Telecommunications
139,000 Orange Polska SA ............... 252 0.04
6,443 0.93
Qatar (0.11%)
Chemicals
26,495 Industries Qatar QSC .......... 788 0.11
Romania (0.82%)
Banks
5,092,200 Banca Transilvania SA ........ 3,493 0.50
141,890
BRD-Groupe Societe
Generale SA ........................ 379 0.05
Closed End Funds
42,697
Fondul Proprietatea SA
GDR .................................... 412 0.06
Oil and Gas
110,317
Societatea Nationala de
Gaze Naturale ROMGAZ
SA ....................................... 758 0.11
102,544
Societatea Nationala de
Gaze Naturale ROMGAZ
SA GDR .............................. 682 0.10
5,724 0.82
Russia (3.77%)
Airlines
1,642,206
Aeroflot - Russian Airlines
PJSC .................................... 1,829 0.26
Banks
228,792
Bank St Petersburg
PJSC .................................... 160 0.02
1,704,432
Sberbank of Russia
PJSC .................................... 2,802 0.40
306,916
Sberbank of Russia PJSC
ADR .................................... 2,136 0.31
Chemicals
85,344 PhosAgro OAO GDR .......... 1,203 0.17
Diversified Financials
511,500
Moscow Exchange
MICEX-RTS PJSC .............. 804 0.12
Number
of Shares
Fair Value
USD ‘000
Fund
%
393,230
Moscow Exchange
MICEX-RTS PJSC (UK
Listed) ................................. 614 0.09
Electric Utilities
10,064,500 RusHydro PJSC .................. 105 0.02
Food Products
10,750 Magnit PJSC ....................... 1,696 0.24
26,865 Magnit PJSC GDR .............. 1,073 0.16
Iron and Steel
32,000
Novolipetsk Steel
GDR .................................... 400 0.06
Metals and Mining
542,100 Alrosa PAO ........................ 564 0.08
26,200
MMC Norilsk Nickel PJSC
ADR .................................... 340 0.05
Oil and Gas
490,868 Gazprom PAO ADR ........... 2,116 0.30
37,628
Lukoil PJSC ADR (UK
Listed) ................................. 1,445 0.21
72,844
Lukoil PJSC ADR (US
Listed) ................................. 2,798 0.40
19,000 Novatek OAO GDR ............ 1,707 0.25
3,939
Surgutneftegas OAO
ADR .................................... 23 0.00
Real Estate
22,938 LSR Group PJSC ................ 234 0.03
210,520 LSR Group PJSC GDR ....... 479 0.07
Retail Trade
351,008 M.Video PAO ..................... 1,399 0.20
Telecommunications
30,602 MegaFon PJSC GDR .......... 337 0.05
27,173
Mobile TeleSystems
PJSC ................................... 98 0.02
134,641
Mobile TeleSystems PJSC
ADR .................................... 1,089 0.16
873,480 Sistema JSFC ...................... 229 0.03
68,701 Sistema JSFC GDR ............. 444 0.06
Transport
2,082,311
Far Eastern Shipping Co
Plc ....................................... 84 0.01
26,208 3.77
Serbia & Montenegro (0.02%)
Banks
9,500
Komercijalna Banka AD
Beograd ............................... 120 0.02
Singapore (0.08%)
Shipbuilding
724,100
Yangzijiang Shipbuilding
Holdings Ltd ....................... 527 0.08
Slovenia (0.19%)
Insurance
23,166
Zavarovalnica Triglav
DD ...................................... 713 0.10
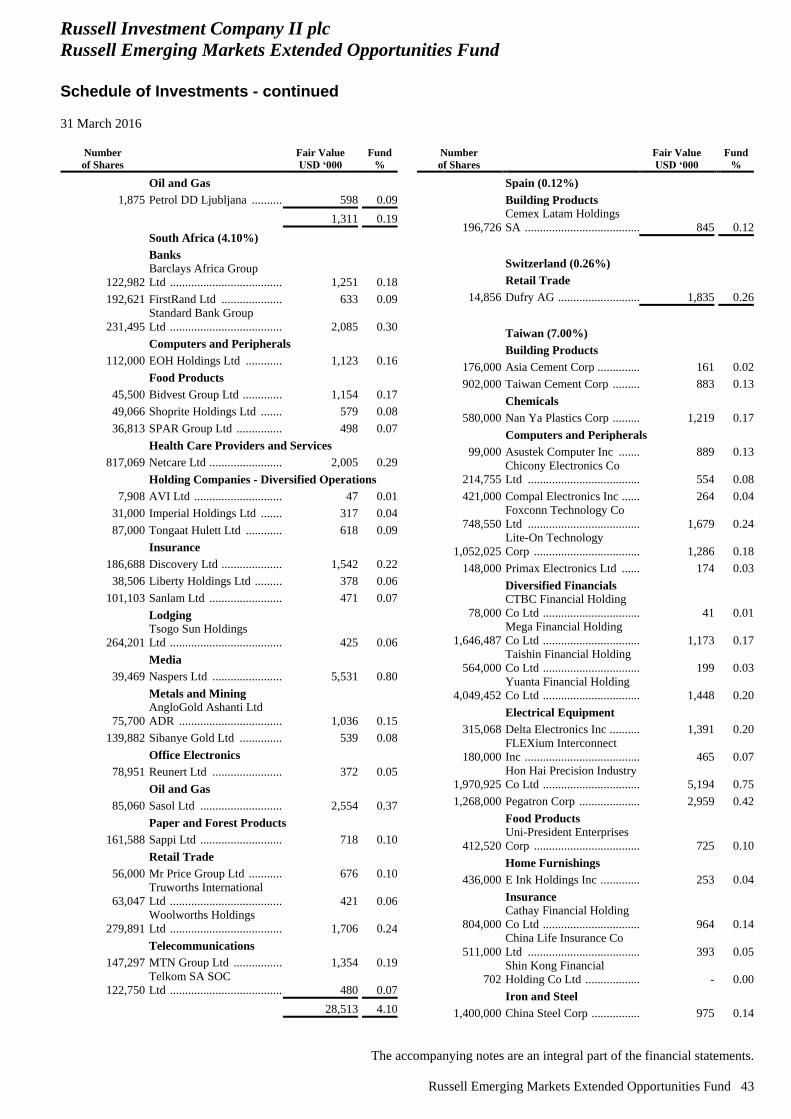
Russell Investment Company II plc
Russell Emerging Markets Extended Opportunities Fund
Schedule of Investments - continued
31 March 2016
The accompanying notes are an integral part of the financial statements.
Russell Emerging Markets Extended Opportunities Fund 43
Number
of Shares
Fair Value
USD ‘000
Fund
%
Oil and Gas
1,875 Petrol DD Ljubljana ............ 598 0.09
1,311 0.19
South Africa (4.10%)
Banks
122,982
Barclays Africa Group
Ltd ....................................... 1,251 0.18
192,621 FirstRand Ltd ...................... 633 0.09
231,495
Standard Bank Group
Ltd ....................................... 2,085 0.30
Computers and Peripherals
112,000 EOH Holdings Ltd .............. 1,123 0.16
Food Products
45,500 Bidvest Group Ltd ............... 1,154 0.17
49,066 Shoprite Holdings Ltd ......... 579 0.08
36,813 SPAR Group Ltd ................. 498 0.07
Health Care Providers and Services
817,069 Netcare Ltd .......................... 2,005 0.29
Holding Companies - Diversified Operations
7,908 AVI Ltd ............................... 47 0.01
31,000 Imperial Holdings Ltd ......... 317 0.04
87,000 Tongaat Hulett Ltd .............. 618 0.09
Insurance
186,688 Discovery Ltd ...................... 1,542 0.22
38,506 Liberty Holdings Ltd ........... 378 0.06
101,103 Sanlam Ltd .......................... 471 0.07
Lodging
264,201
Tsogo Sun Holdings
Ltd ....................................... 425 0.06
Media
39,469 Naspers Ltd ......................... 5,531 0.80
Metals and Mining
75,700
AngloGold Ashanti Ltd
ADR .................................... 1,036 0.15
139,882 Sibanye Gold Ltd ................ 539 0.08
Office Electronics
78,951 Reunert Ltd ......................... 372 0.05
Oil and Gas
85,060 Sasol Ltd ............................. 2,554 0.37
Paper and Forest Products
161,588 Sappi Ltd ............................. 718 0.10
Retail Trade
56,000 Mr Price Group Ltd ............. 676 0.10
63,047
Truworths International
Ltd ....................................... 421 0.06
279,891
Woolworths Holdings
Ltd ....................................... 1,706 0.24
Telecommunications
147,297 MTN Group Ltd .................. 1,354 0.19
122,750
Telkom SA SOC
Ltd ....................................... 480 0.07
28,513 4.10
Number
of Shares
Fair Value
USD ‘000
Fund
%
Spain (0.12%)
Building Products
196,726
Cemex Latam Holdings
SA ....................................... 845 0.12
Switzerland (0.26%)
Retail Trade
14,856 Dufry AG ............................ 1,835 0.26
Taiwan (7.00%)
Building Products
176,000 Asia Cement Corp ............... 161 0.02
902,000 Taiwan Cement Corp .......... 883 0.13
Chemicals
580,000 Nan Ya Plastics Corp .......... 1,219 0.17
Computers and Peripherals
99,000 Asustek Computer Inc ........ 889 0.13
214,755
Chicony Electronics Co
Ltd ...................................... 554 0.08
421,000 Compal Electronics Inc ....... 264 0.04
748,550
Foxconn Technology Co
Ltd ...................................... 1,679 0.24
1,052,025
Lite-On Technology
Corp .................................... 1,286 0.18
148,000 Primax Electronics Ltd ....... 174 0.03
Diversified Financials
78,000
CTBC Financial Holding
Co Ltd ................................. 41 0.01
1,646,487
Mega Financial Holding
Co Ltd ................................. 1,173 0.17
564,000
Taishin Financial Holding
Co Ltd ................................. 199 0.03
4,049,452
Yuanta Financial Holding
Co Ltd ................................. 1,448 0.20
Electrical Equipment
315,068 Delta Electronics Inc ........... 1,391 0.20
180,000
FLEXium Interconnect
Inc ....................................... 465 0.07
1,970,925
Hon Hai Precision Industry
Co Ltd ................................. 5,194 0.75
1,268,000 Pegatron Corp ..................... 2,959 0.42
Food Products
412,520
Uni-President Enterprises
Corp .................................... 725 0.10
Home Furnishings
436,000 E Ink Holdings Inc .............. 253 0.04
Insurance
804,000
Cathay Financial Holding
Co Ltd ................................. 964 0.14
511,000
China Life Insurance Co
Ltd ...................................... 393 0.05
702
Shin Kong Financial
Holding Co Ltd ................... - 0.00
Iron and Steel
1,400,000 China Steel Corp ................. 975 0.14
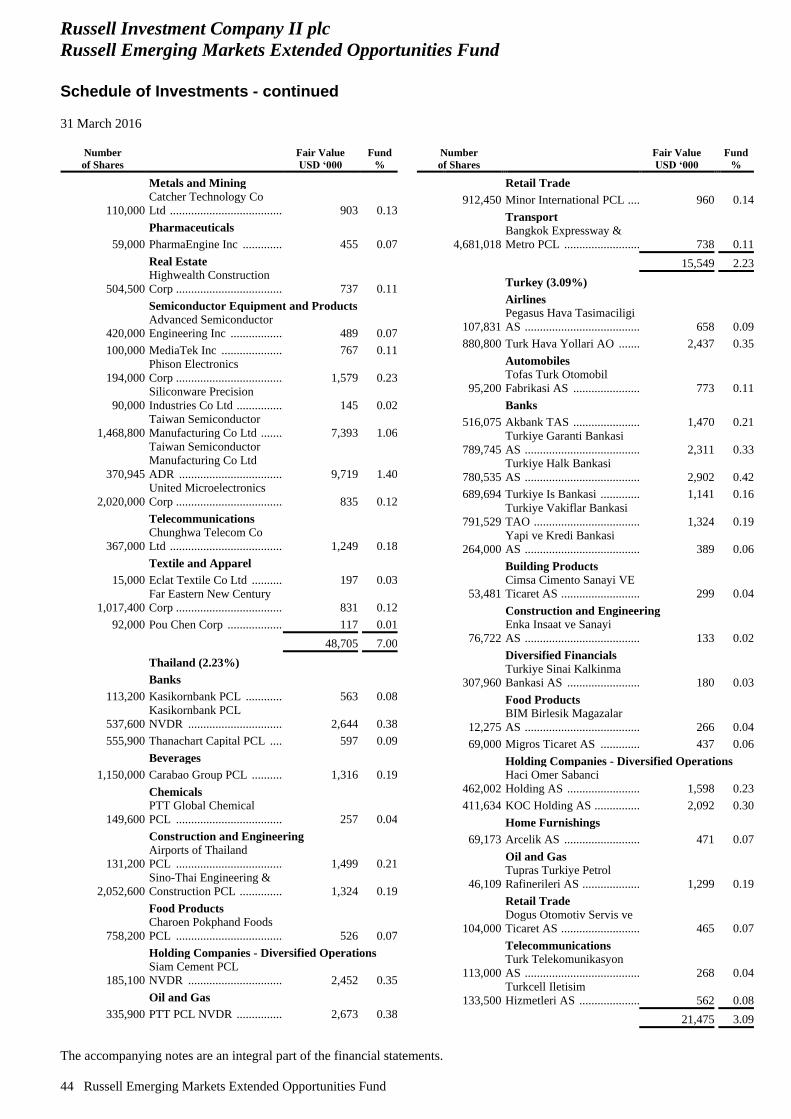
Russell Investment Company II plc
Russell Emerging Markets Extended Opportunities Fund
Schedule of Investments - continued
31 March 2016
The accompanying notes are an integral part of the financial statements.
44 Russell Emerging Markets Extended Opportunities Fund
Number
of Shares
Fair Value
USD ‘000
Fund
%
Metals and Mining
110,000
Catcher Technology Co
Ltd ....................................... 903 0.13
Pharmaceuticals
59,000 PharmaEngine Inc ............... 455 0.07
Real Estate
504,500
Highwealth Construction
Corp ..................................... 737 0.11
Semiconductor Equipment and Products
420,000
Advanced Semiconductor
Engineering Inc ................... 489 0.07
100,000 MediaTek Inc ...................... 767 0.11
194,000
Phison Electronics
Corp ..................................... 1,579 0.23
90,000
Siliconware Precision
Industries Co Ltd ................. 145 0.02
1,468,800
Taiwan Semiconductor
Manufacturing Co Ltd ......... 7,393 1.06
370,945
Taiwan Semiconductor
Manufacturing Co Ltd
ADR .................................... 9,719 1.40
2,020,000
United Microelectronics
Corp ..................................... 835 0.12
Telecommunications
367,000
Chunghwa Telecom Co
Ltd ....................................... 1,249 0.18
Textile and Apparel
15,000 Eclat Textile Co Ltd ............ 197 0.03
1,017,400
Far Eastern New Century
Corp ..................................... 831 0.12
92,000 Pou Chen Corp .................... 117 0.01
48,705 7.00
Thailand (2.23%)
Banks
113,200 Kasikornbank PCL .............. 563 0.08
537,600
Kasikornbank PCL
NVDR ................................. 2,644 0.38
555,900 Thanachart Capital PCL ...... 597 0.09
Beverages
1,150,000 Carabao Group PCL ............ 1,316 0.19
Chemicals
149,600
PTT Global Chemical
PCL ..................................... 257 0.04
Construction and Engineering
131,200
Airports of Thailand
PCL ..................................... 1,499 0.21
2,052,600
Sino-Thai Engineering &
Construction PCL ................ 1,324 0.19
Food Products
758,200
Charoen Pokphand Foods
PCL ..................................... 526 0.07
Holding Companies - Diversified Operations
185,100
Siam Cement PCL
NVDR ................................. 2,452 0.35
Oil and Gas
335,900 PTT PCL NVDR ................. 2,673 0.38
Number
of Shares
Fair Value
USD ‘000
Fund
%
Retail Trade
912,450 Minor International PCL ..... 960 0.14
Transport
4,681,018
Bangkok Expressway &
Metro PCL .......................... 738 0.11
15,549 2.23
Turkey (3.09%)
Airlines
107,831
Pegasus Hava Tasimaciligi
AS ....................................... 658 0.09
880,800 Turk Hava Yollari AO ........ 2,437 0.35
Automobiles
95,200
Tofas Turk Otomobil
Fabrikasi AS ....................... 773 0.11
Banks
516,075 Akbank TAS ....................... 1,470 0.21
789,745
Turkiye Garanti Bankasi
AS ....................................... 2,311 0.33
780,535
Turkiye Halk Bankasi
AS ....................................... 2,902 0.42
689,694 Turkiye Is Bankasi .............. 1,141 0.16
791,529
Turkiye Vakiflar Bankasi
TAO .................................... 1,324 0.19
264,000
Yapi ve Kredi Bankasi
AS ....................................... 389 0.06
Building Products
53,481
Cimsa Cimento Sanayi VE
Ticaret AS ........................... 299 0.04
Construction and Engineering
76,722
Enka Insaat ve Sanayi
AS ....................................... 133 0.02
Diversified Financials
307,960
Turkiye Sinai Kalkinma
Bankasi AS ......................... 180 0.03
Food Products
12,275
BIM Birlesik Magazalar
AS ....................................... 266 0.04
69,000 Migros Ticaret AS .............. 437 0.06
Holding Companies - Diversified Operations
462,002
Haci Omer Sabanci
Holding AS ......................... 1,598 0.23
411,634 KOC Holding AS ................ 2,092 0.30
Home Furnishings
69,173 Arcelik AS .......................... 471 0.07
Oil and Gas
46,109
Tupras Turkiye Petrol
Rafinerileri AS .................... 1,299 0.19
Retail Trade
104,000
Dogus Otomotiv Servis ve
Ticaret AS ........................... 465 0.07
Telecommunications
113,000
Turk Telekomunikasyon
AS ....................................... 268 0.04
133,500
Turkcell Iletisim
Hizmetleri AS ..................... 562 0.08
21,475 3.09
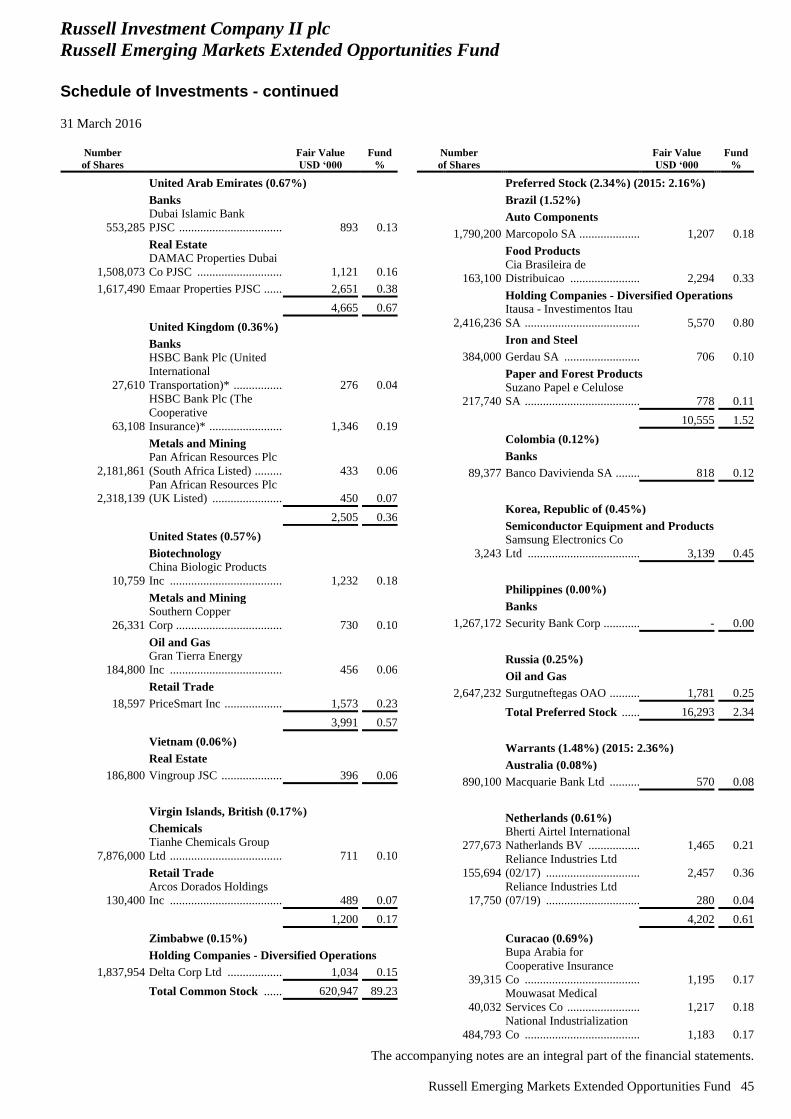
Russell Investment Company II plc
Russell Emerging Markets Extended Opportunities Fund
Schedule of Investments - continued
31 March 2016
The accompanying notes are an integral part of the financial statements.
Russell Emerging Markets Extended Opportunities Fund 45
Number
of Shares
Fair Value
USD ‘000
Fund
%
United Arab Emirates (0.67%)
Banks
553,285
Dubai Islamic Bank
PJSC .................................... 893 0.13
Real Estate
1,508,073
DAMAC Properties Dubai
Co PJSC .............................. 1,121 0.16
1,617,490 Emaar Properties PJSC ........ 2,651 0.38
4,665 0.67
United Kingdom (0.36%)
Banks
27,610
HSBC Bank Plc (United
International
Transportation)* .................. 276 0.04
63,108
HSBC Bank Plc (The
Cooperative
Insurance)* .......................... 1,346 0.19
Metals and Mining
2,181,861
Pan African Resources Plc
(South Africa Listed) ........... 433 0.06
2,318,139
Pan African Resources Plc
(UK Listed) ......................... 450 0.07
2,505 0.36
United States (0.57%)
Biotechnology
10,759
China Biologic Products
Inc ....................................... 1,232 0.18
Metals and Mining
26,331
Southern Copper
Corp ..................................... 730 0.10
Oil and Gas
184,800
Gran Tierra Energy
Inc ....................................... 456 0.06
Retail Trade
18,597 PriceSmart Inc ..................... 1,573 0.23
3,991 0.57
Vietnam (0.06%)
Real Estate
186,800 Vingroup JSC ...................... 396 0.06
Virgin Islands, British (0.17%)
Chemicals
7,876,000
Tianhe Chemicals Group
Ltd ....................................... 711 0.10
Retail Trade
130,400
Arcos Dorados Holdings
Inc ....................................... 489 0.07
1,200 0.17
Zimbabwe (0.15%)
Holding Companies - Diversified Operations
1,837,954 Delta Corp Ltd .................... 1,034 0.15
Total Common Stock ........ 620,947 89.23
Number
of Shares
Fair Value
USD ‘000
Fund
%
Preferred Stock (2.34%) (2015: 2.16%)
Brazil (1.52%)
Auto Components
1,790,200 Marcopolo SA ..................... 1,207 0.18
Food Products
163,100
Cia Brasileira de
Distribuicao ........................ 2,294 0.33
Holding Companies - Diversified Operations
2,416,236
Itausa - Investimentos Itau
SA ....................................... 5,570 0.80
Iron and Steel
384,000 Gerdau SA .......................... 706 0.10
Paper and Forest Products
217,740
Suzano Papel e Celulose
SA ....................................... 778 0.11
10,555 1.52
Colombia (0.12%)
Banks
89,377 Banco Davivienda SA ......... 818 0.12
Korea, Republic of (0.45%)
Semiconductor Equipment and Products
3,243
Samsung Electronics Co
Ltd ...................................... 3,139 0.45
Philippines (0.00%)
Banks
1,267,172 Security Bank Corp ............. - 0.00
Russia (0.25%)
Oil and Gas
2,647,232 Surgutneftegas OAO ........... 1,781 0.25
Total Preferred Stock ....... 16,293 2.34
Warrants (1.48%) (2015: 2.36%)
Australia (0.08%)
890,100 Macquarie Bank Ltd ........... 570 0.08
Netherlands (0.61%)
277,673
Bherti Airtel International
Natherlands BV .................. 1,465 0.21
155,694
Reliance Industries Ltd
(02/17) ................................ 2,457 0.36
17,750
Reliance Industries Ltd
(07/19) ................................ 280 0.04
4,202 0.61
Curacao (0.69%)
39,315
Bupa Arabia for
Cooperative Insurance
Co ....................................... 1,195 0.17
40,032
Mouwasat Medical
Services Co ......................... 1,217 0.18
484,793
National Industrialization
Co ....................................... 1,183 0.17
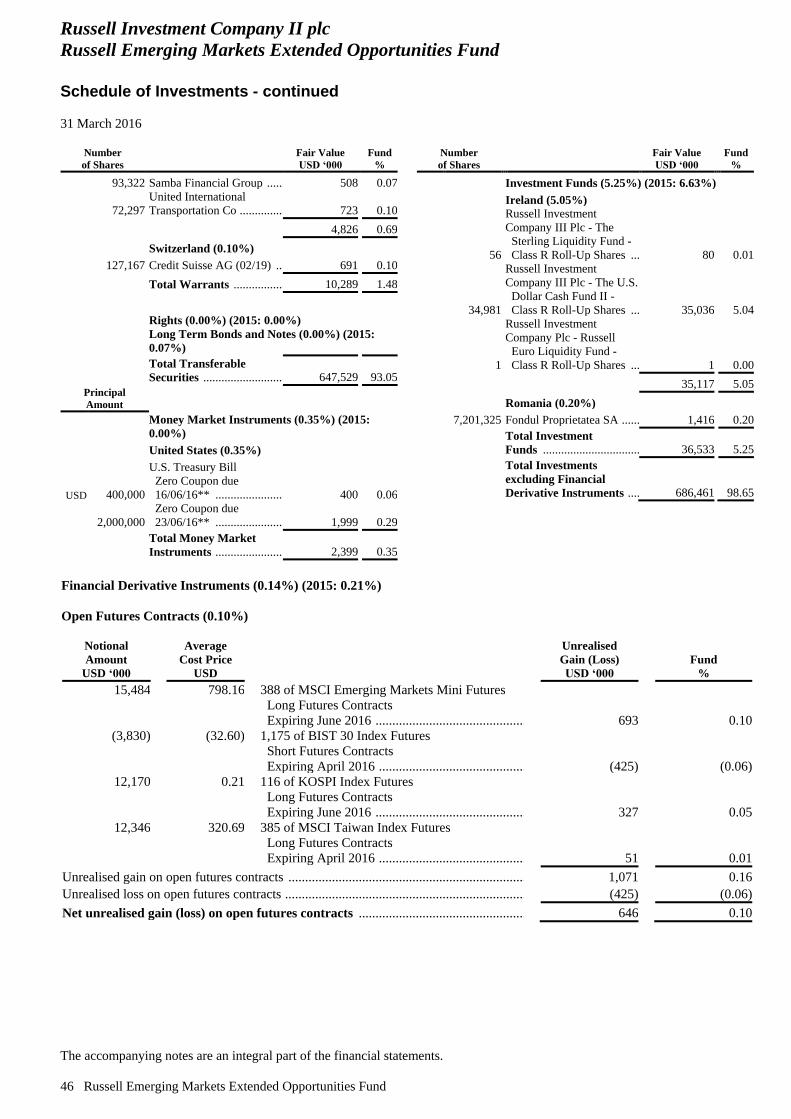
Russell Investment Company II plc
Russell Emerging Markets Extended Opportunities Fund
Schedule of Investments - continued
31 March 2016
The accompanying notes are an integral part of the financial statements.
46 Russell Emerging Markets Extended Opportunities Fund
Number
of Shares
Fair Value
USD ‘000
Fund
%
93,322 Samba Financial Group ....... 508 0.07
72,297
United International
Transportation Co ................ 723 0.10
4,826 0.69
Switzerland (0.10%)
127,167 Credit Suisse AG (02/19) .... 691 0.10
Total Warrants .................. 10,289 1.48
Rights (0.00%) (2015: 0.00%)
Long Term Bonds and Notes (0.00%) (2015:
0.07%)
Total Transferable
Securities ............................ 647,529 93.05
Principal
Amount
Money Market Instruments (0.35%) (2015:
0.00%)
United States (0.35%)
U.S. Treasury Bill
USD 400,000
Zero Coupon due
16/06/16** ........................ 400 0.06
2,000,000
Zero Coupon due
23/06/16** ........................ 1,999 0.29
Total Money Market
Instruments ........................ 2,399 0.35
Number
of Shares
Fair Value
USD ‘000
Fund
%
Investment Funds (5.25%) (2015: 6.63%)
Ireland (5.05%)
56
Russell Investment
Company III Plc - The
Sterling Liquidity Fund -
Class R Roll-Up Shares .... 80 0.01
34,981
Russell Investment
Company III Plc - The U.S.
Dollar Cash Fund II -
Class R Roll-Up Shares .... 35,036 5.04
1
Russell Investment
Company Plc - Russell
Euro Liquidity Fund -
Class R Roll-Up Shares .... 1 0.00
35,117 5.05
Romania (0.20%)
7,201,325 Fondul Proprietatea SA ....... 1,416 0.20
Total Investment
Funds ................................. 36,533 5.25
Total Investments
excluding Financial
Derivative Instruments ..... 686,461 98.65
Financial Derivative Instruments (0.14%) (2015: 0.21%)
Open Futures Contracts (0.10%)
Notional
Amount
USD ‘000
Average
Cost Price
USD
Unrealised
Gain (Loss)
USD ‘000
Fund
%
15,484
798.16
388 of MSCI Emerging Markets Mini Futures
Long Futures Contracts
Expiring June 2016 ........................................................................................................... 693 0.10
(3,830)
(32.60)
1,175 of BIST 30 Index Futures
Short Futures Contracts
Expiring April 2016 .......................................................................................................... (425) (0.06)
12,170
0.21
116 of KOSPI Index Futures
Long Futures Contracts
Expiring June 2016 ........................................................................................................... 327 0.05
12,346
320.69
385 of MSCI Taiwan Index Futures
Long Futures Contracts
Expiring April 2016 .......................................................................................................... 51 0.01
Unrealised gain on open futures contracts ......................................................................... 1,071 0.16
Unrealised loss on open futures contracts .......................................................................... (425) (0.06)
Net unrealised gain (loss) on open futures contracts .................................................... 646 0.10
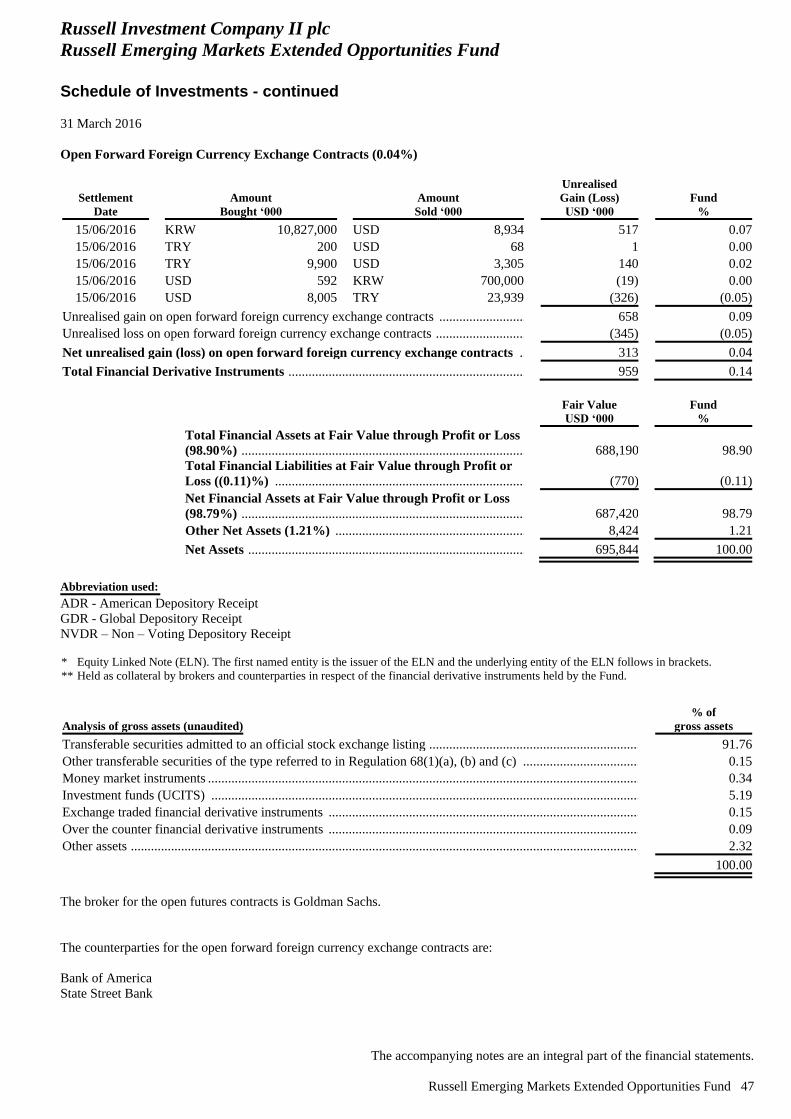
Russell Investment Company II plc
Russell Emerging Markets Extended Opportunities Fund
Schedule of Investments - continued
31 March 2016
The accompanying notes are an integral part of the financial statements.
Russell Emerging Markets Extended Opportunities Fund 47
Open Forward Foreign Currency Exchange Contracts (0.04%)
Settlement
Date
Amount
Bought ‘000
Amount
Sold ‘000
Unrealised
Gain (Loss)
USD ‘000
Fund
%
15/06/2016 KRW 10,827,000 USD 8,934 517 0.07
15/06/2016 TRY 200 USD 68 1 0.00
15/06/2016 TRY 9,900 USD 3,305 140 0.02
15/06/2016 USD 592 KRW 700,000 (19) 0.00
15/06/2016 USD 8,005 TRY 23,939 (326) (0.05)
Unrealised gain on open forward foreign currency exchange contracts ............................... 658 0.09
Unrealised loss on open forward foreign currency exchange contracts ................................ (345) (0.05)
Net unrealised gain (loss) on open forward foreign currency exchange contracts ....... 313 0.04
Total Financial Derivative Instruments ............................................................................ 959 0.14
Fair Value
USD ‘000
Fund
%
Total Financial Assets at Fair Value through Profit or Loss
(98.90%) ....................................................................................................................................................... 688,190 98.90
Total Financial Liabilities at Fair Value through Profit or
Loss ((0.11)%) ............................................................................................................................................. (770) (0.11)
Net Financial Assets at Fair Value through Profit or Loss
(98.79%) .................................................................................................................................................... 687,420 98.79
Other Net Assets (1.21%) ........................................................................................................................ 8,424 1.21
Net Assets .................................................................................................................................................. 695,844 100.00
Abbreviation used:
ADR - American Depository Receipt
GDR - Global Depository Receipt
NVDR – Non – Voting Depository Receipt
* Equity Linked Note (ELN). The first named entity is the issuer of the ELN and the underlying entity of the ELN follows in brackets.
** Held as collateral by brokers and counterparties in respect of the financial derivative instruments held by the Fund.
Analysis of gross assets (unaudited)
% of
gross assets
Transferable securities admitted to an official stock exchange listing ...................................................................... 91.76
Other transferable securities of the type referred to in Regulation 68(1)(a), (b) and (c) .......................................... 0.15
Money market instruments ........................................................................................................................................ 0.34
Investment funds (UCITS) ....................................................................................................................................... 5.19
Exchange traded financial derivative instruments .................................................................................................... 0.15
Over the counter financial derivative instruments .................................................................................................... 0.09
Other assets ............................................................................................................................................................... 2.32
100.00
The broker for the open futures contracts is Goldman Sachs.
The counterparties for the open forward foreign currency exchange contracts are:
Bank of America
State Street Bank
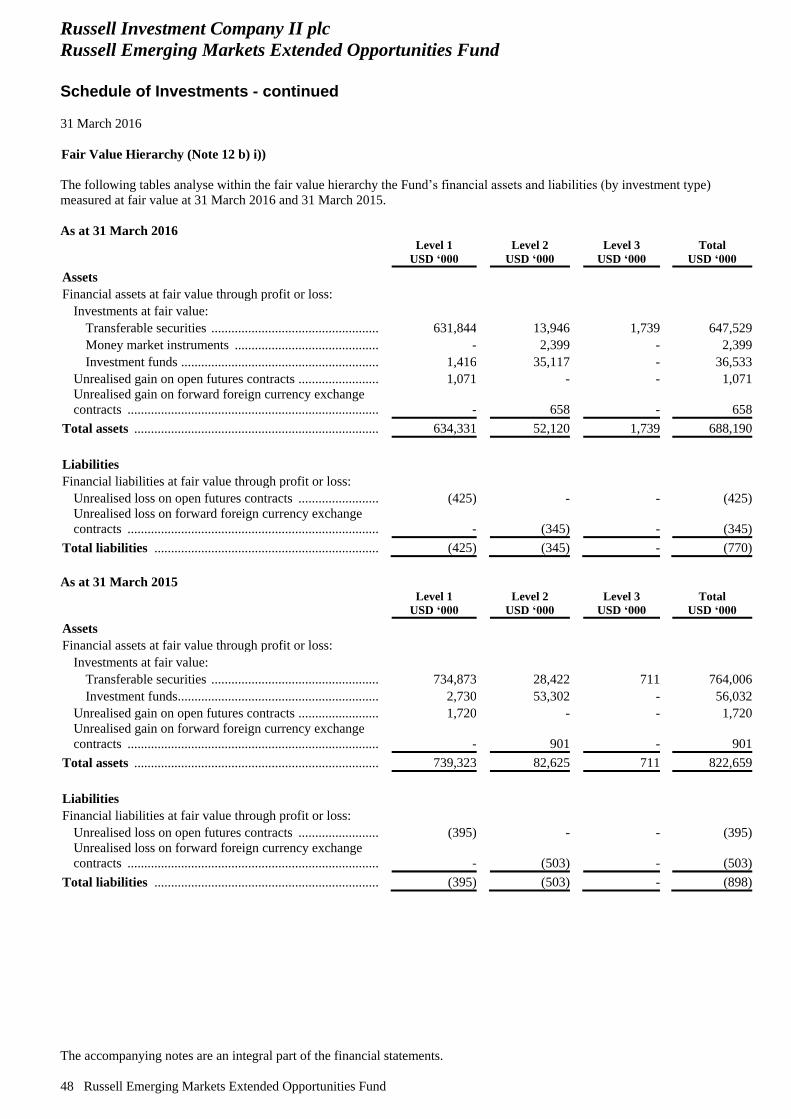
Russell Investment Company II plc
Russell Emerging Markets Extended Opportunities Fund
Schedule of Investments - continued
31 March 2016
The accompanying notes are an integral part of the financial statements.
48 Russell Emerging Markets Extended Opportunities Fund
Fair Value Hierarchy (Note 12 b) i))
The following tables analyse within the fair value hierarchy the Fund’s financial assets and liabilities (by investment type)
measured at fair value at 31 March 2016 and 31 March 2015.
As at 31 March 2016
Level 1
USD ‘000
Level 2
USD ‘000
Level 3
USD ‘000
Total
USD ‘000
Assets
Financial assets at fair value through profit or loss:
Investments at fair value:
Transferable securities ............................................................... 631,844 13,946 1,739 647,529
Money market instruments ........................................................ - 2,399 - 2,399
Investment funds ........................................................................ 1,416 35,117 - 36,533
Unrealised gain on open futures contracts ................................... 1,071 - - 1,071
Unrealised gain on forward foreign currency exchange
contracts ...................................................................................... - 658 - 658
Total assets ...................................................................................... 634,331 52,120 1,739 688,190
Liabilities
Financial liabilities at fair value through profit or loss:
Unrealised loss on open futures contracts ................................... (425) - - (425)
Unrealised loss on forward foreign currency exchange
contracts ...................................................................................... - (345) - (345)
Total liabilities ................................................................................ (425) (345) - (770)
As at 31 March 2015
Level 1
USD ‘000
Level 2
USD ‘000
Level 3
USD ‘000
Total
USD ‘000
Assets
Financial assets at fair value through profit or loss:
Investments at fair value:
Transferable securities ............................................................... 734,873 28,422 711 764,006
Investment funds ......................................................................... 2,730 53,302 - 56,032
Unrealised gain on open futures contracts ................................... 1,720 - - 1,720
Unrealised gain on forward foreign currency exchange
contracts ...................................................................................... - 901 - 901
Total assets ...................................................................................... 739,323 82,625 711 822,659
Liabilities
Financial liabilities at fair value through profit or loss:
Unrealised loss on open futures contracts ................................... (395) - - (395)
Unrealised loss on forward foreign currency exchange
contracts ...................................................................................... - (503) - (503)
Total liabilities ................................................................................ (395) (503) - (898)
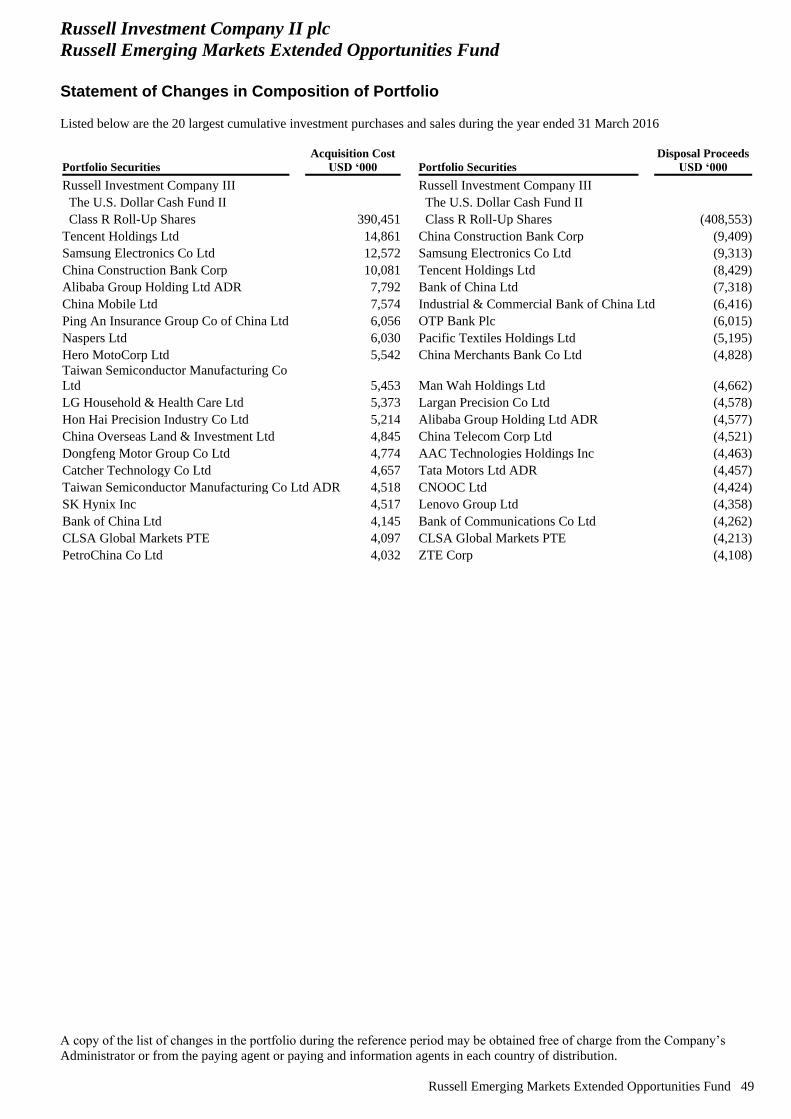
Russell Investment Company II plc
Russell Emerging Markets Extended Opportunities Fund
Statement of Changes in Composition of Portfolio
Listed below are the 20 largest cumulative investment purchases and sales during the year ended 31 March 2016
A copy of the list of changes in the portfolio during the reference period may be obtained free of charge from the Company’s
Administrator or from the paying agent or paying and information agents in each country of distribution.
Russell Emerging Markets Extended Opportunities Fund 49
Portfolio Securities
Acquisition Cost
USD ‘000 Portfolio Securities
Disposal Proceeds
USD ‘000
Russell Investment Company III Russell Investment Company III
The U.S. Dollar Cash Fund II The U.S. Dollar Cash Fund II
Class R Roll-Up Shares 390,451 Class R Roll-Up Shares (408,553)
Tencent Holdings Ltd 14,861 China Construction Bank Corp (9,409)
Samsung Electronics Co Ltd 12,572 Samsung Electronics Co Ltd (9,313)
China Construction Bank Corp 10,081 Tencent Holdings Ltd (8,429)
Alibaba Group Holding Ltd ADR 7,792 Bank of China Ltd (7,318)
China Mobile Ltd 7,574 Industrial & Commercial Bank of China Ltd (6,416)
Ping An Insurance Group Co of China Ltd 6,056 OTP Bank Plc (6,015)
Naspers Ltd 6,030 Pacific Textiles Holdings Ltd (5,195)
Hero MotoCorp Ltd 5,542 China Merchants Bank Co Ltd (4,828)
Taiwan Semiconductor Manufacturing Co
Ltd 5,453 Man Wah Holdings Ltd (4,662)
LG Household & Health Care Ltd 5,373 Largan Precision Co Ltd (4,578)
Hon Hai Precision Industry Co Ltd 5,214 Alibaba Group Holding Ltd ADR (4,577)
China Overseas Land & Investment Ltd 4,845 China Telecom Corp Ltd (4,521)
Dongfeng Motor Group Co Ltd 4,774 AAC Technologies Holdings Inc (4,463)
Catcher Technology Co Ltd 4,657 Tata Motors Ltd ADR (4,457)
Taiwan Semiconductor Manufacturing Co Ltd ADR 4,518 CNOOC Ltd (4,424)
SK Hynix Inc 4,517 Lenovo Group Ltd (4,358)
Bank of China Ltd 4,145 Bank of Communications Co Ltd (4,262)
CLSA Global Markets PTE 4,097 CLSA Global Markets PTE (4,213)
PetroChina Co Ltd 4,032 ZTE Corp (4,108)
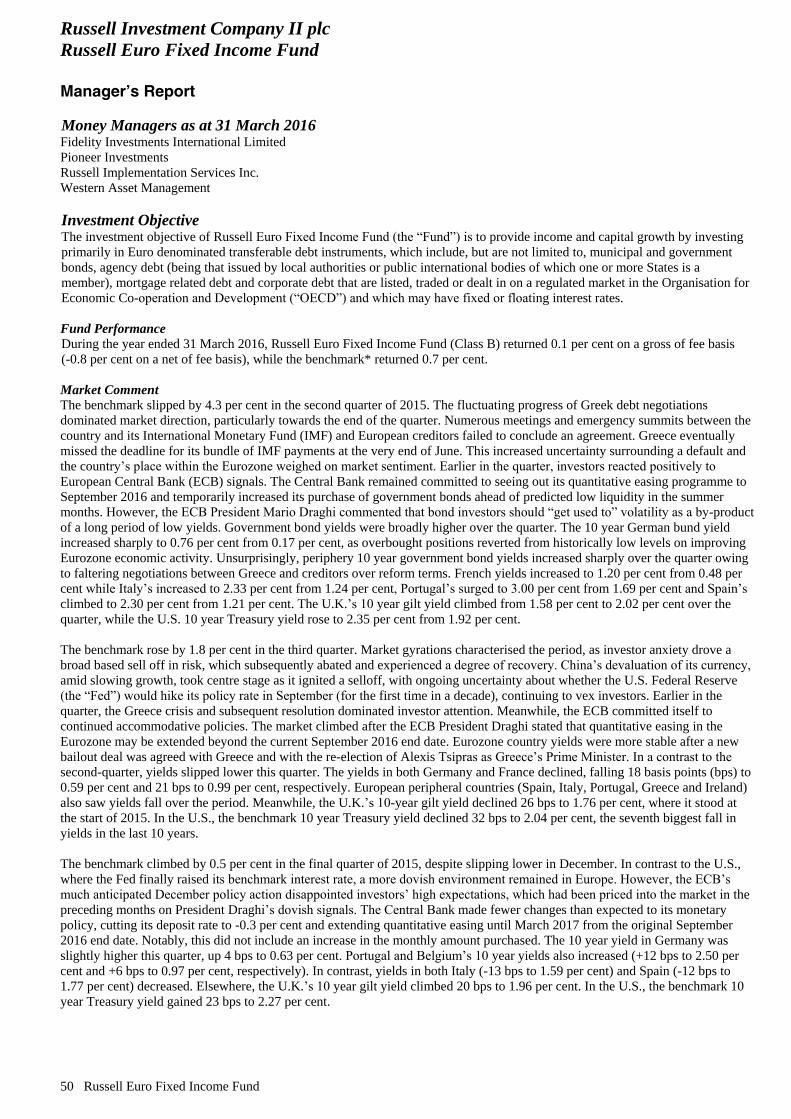
Russell Investment Company II plc
Russell Euro Fixed Income Fund
Manager’s Report
50 Russell Euro Fixed Income Fund
Money Managers as at 31 March 2016 Fidelity Investments International Limited
Pioneer Investments
Russell Implementation Services Inc.
Western Asset Management
Investment Objective The investment objective of Russell Euro Fixed Income Fund (the “Fund”) is to provide income and capital growth by investing
primarily in Euro denominated transferable debt instruments, which include, but are not limited to, municipal and government
bonds, agency debt (being that issued by local authorities or public international bodies of which one or more States is a
member), mortgage related debt and corporate debt that are listed, traded or dealt in on a regulated market in the Organisation for
Economic Co-operation and Development (“OECD”) and which may have fixed or floating interest rates.
Fund Performance
During the year ended 31 March 2016, Russell Euro Fixed Income Fund (Class B) returned 0.1 per cent on a gross of fee basis
(-0.8 per cent on a net of fee basis), while the benchmark* returned 0.7 per cent.
Market Comment
The benchmark slipped by 4.3 per cent in the second quarter of 2015. The fluctuating progress of Greek debt negotiations
dominated market direction, particularly towards the end of the quarter. Numerous meetings and emergency summits between the
country and its International Monetary Fund (IMF) and European creditors failed to conclude an agreement. Greece eventually
missed the deadline for its bundle of IMF payments at the very end of June. This increased uncertainty surrounding a default and
the country’s place within the Eurozone weighed on market sentiment. Earlier in the quarter, investors reacted positively to
European Central Bank (ECB) signals. The Central Bank remained committed to seeing out its quantitative easing programme to
September 2016 and temporarily increased its purchase of government bonds ahead of predicted low liquidity in the summer
months. However, the ECB President Mario Draghi commented that bond investors should “get used to” volatility as a by-product
of a long period of low yields. Government bond yields were broadly higher over the quarter. The 10 year German bund yield
increased sharply to 0.76 per cent from 0.17 per cent, as overbought positions reverted from historically low levels on improving
Eurozone economic activity. Unsurprisingly, periphery 10 year government bond yields increased sharply over the quarter owing
to faltering negotiations between Greece and creditors over reform terms. French yields increased to 1.20 per cent from 0.48 per
cent while Italy’s increased to 2.33 per cent from 1.24 per cent, Portugal’s surged to 3.00 per cent from 1.69 per cent and Spain’s
climbed to 2.30 per cent from 1.21 per cent. The U.K.’s 10 year gilt yield climbed from 1.58 per cent to 2.02 per cent over the
quarter, while the U.S. 10 year Treasury yield rose to 2.35 per cent from 1.92 per cent.
The benchmark rose by 1.8 per cent in the third quarter. Market gyrations characterised the period, as investor anxiety drove a
broad based sell off in risk, which subsequently abated and experienced a degree of recovery. China’s devaluation of its currency,
amid slowing growth, took centre stage as it ignited a selloff, with ongoing uncertainty about whether the U.S. Federal Reserve
(the “Fed”) would hike its policy rate in September (for the first time in a decade), continuing to vex investors. Earlier in the
quarter, the Greece crisis and subsequent resolution dominated investor attention. Meanwhile, the ECB committed itself to
continued accommodative policies. The market climbed after the ECB President Draghi stated that quantitative easing in the
Eurozone may be extended beyond the current September 2016 end date. Eurozone country yields were more stable after a new
bailout deal was agreed with Greece and with the re-election of Alexis Tsipras as Greece’s Prime Minister. In a contrast to the
second-quarter, yields slipped lower this quarter. The yields in both Germany and France declined, falling 18 basis points (bps) to
0.59 per cent and 21 bps to 0.99 per cent, respectively. European peripheral countries (Spain, Italy, Portugal, Greece and Ireland)
also saw yields fall over the period. Meanwhile, the U.K.’s 10-year gilt yield declined 26 bps to 1.76 per cent, where it stood at
the start of 2015. In the U.S., the benchmark 10 year Treasury yield declined 32 bps to 2.04 per cent, the seventh biggest fall in
yields in the last 10 years.
The benchmark climbed by 0.5 per cent in the final quarter of 2015, despite slipping lower in December. In contrast to the U.S.,
where the Fed finally raised its benchmark interest rate, a more dovish environment remained in Europe. However, the ECB’s
much anticipated December policy action disappointed investors’ high expectations, which had been priced into the market in the
preceding months on President Draghi’s dovish signals. The Central Bank made fewer changes than expected to its monetary
policy, cutting its deposit rate to -0.3 per cent and extending quantitative easing until March 2017 from the original September
2016 end date. Notably, this did not include an increase in the monthly amount purchased. The 10 year yield in Germany was
slightly higher this quarter, up 4 bps to 0.63 per cent. Portugal and Belgium’s 10 year yields also increased (+12 bps to 2.50 per
cent and +6 bps to 0.97 per cent, respectively). In contrast, yields in both Italy (-13 bps to 1.59 per cent) and Spain (-12 bps to
1.77 per cent) decreased. Elsewhere, the U.K.’s 10 year gilt yield climbed 20 bps to 1.96 per cent. In the U.S., the benchmark 10
year Treasury yield gained 23 bps to 2.27 per cent.
Russell Investment Company II plc
Russell Euro Fixed Income Fund
Manager’s Report - continued
Russell Euro Fixed Income Fund 51
The benchmark rose by 3.0 per cent in the first quarter of 2016. Having signaled in January that further supportive stimulus was
forthcoming, the ECB introduced a raft of new accommodative stimulus measures in March. The Central Bank reduced its main
refinancing rate to 0.0 per cent, cut its deposit facility rate to -0.4 per cent and also reduced its marginal lending facility rate to
0.25 per cent from 0.30 per cent. Quantitative easing was expanded by EUR 20 billion a month to EUR 80 billion to also include
the purchase of investment-grade corporate bonds. In addition, the ECB initiated another targeted longer-term refinancing
operation (TLTRO II). The provision of cheap liquidity to banks, at a rate as low as the deposit facility, appears to offset the
impact of negative interest rates. More accommodative central bank policy pushed yields in both Germany and France lower by
48 bps to 0.15 per cent and 50 bps to 0.49 per cent, respectively. Yields also declined in Belgium (-46 bps to 0.51 per cent), Spain
(-33 bps to 1.43 per cent) and Italy (-37 bps to 1.22 per cent). Meanwhile, Portugal’s yield increased 43 bps to 2.93 per cent.
Elsewhere, the U.K.’s benchmark 10 year gilt declined 55 bps to 1.42 per cent. In the U.S., the benchmark 10 year Treasury
rallied with its yield decreasing 50 bps to 1.77 per cent.
General Comment on Money Managers/Performance
The Fund underperformed the benchmark over the quarter the second quarter of 2015, with all three Money Managers finishing
behind the benchmark. While an overweight to financials was rewarded, an underweight to government-related issues proved
detrimental. A duration and peripheral overweight detracted from performance as yields moved higher over the quarter. From a
quality perspective, while an underweight to AA-rated issues was rewarded, an overweight to AAA, A and BBB-rated issues
detracted.
The Fund underperformed the benchmark over the third quarter of 2015, with all three Money Managers finishing behind the
benchmark. Underperformance was driven by negative credit positioning, primarily the overweights to Investment Grade (IG)
financials and corporate high yield. However, a duration and peripheral overweight added to performance as yields moved lower
over the quarter. We expect continued positive rhetoric and action from the ECB to provide support to European bond markets.
The Fund outperformed the benchmark in the fourth quarter of 2015. Credit positioning was a key driver of excess returns, having
detracted over the previous quarter. This included the overweights to IG financials and corporate high yield. An underweight to
the Euro underpinned gains. Individual stock selection marginally added to relative returns.
The Fund performed in line with the benchmark in the first quarter of 2016. On the sector side an overweight to IG financials was
negative but an overweight to corporate high yield was additive. Country allocation was positive; driven by overweights to
Belgium and Italy. At the Money Manager level, Pioneer Investments suffered from a short duration position in its first full
quarter within the Fund. In contrast, both Fidelity Investments International Limited and Western Asset Management
outperformed.
Outlook
Global markets got off to a rough start in 2016. By mid-February global developed equities had lost nearly 20 per cent from their
2015 peak. They rebounded by around 10 per cent by mid-March, but we expect volatility to be a headline throughout 2016. This
volatility will continue to be driven by China fears, the Fed’s monetary tightening, U.S. recession concerns, bank balance sheet
worries, and soft corporate profits. Moreover, the move to negative interest rates in Europe and Japan has triggered fears that
Central Banks have run out of easing options. Negative rates also tend to squeeze the margin between banks’ borrowing and
lending rates. This squeeze could, in turn, hurt bank profitability, and end up making things worse for the markets. In our 2016
Global Market Outlook Annual report, we forecast mid-to-low single digit returns for global equities, along with a gradual rise in
long-term interest rates. We’re holding to that view, with the exception we think equity growth is more likely to be in the low
single digits. Moreover, we’re now seeing corporate profits weakening, softness in global trade and manufacturing, and slightly
higher risks for Emerging Markets. These elements all contribute to a less supportive environment for equities. That said, we’re
not forecasting a sustained bear market, provided the U.S. does not fall into recession. Right now we see recession as a low
probability over the next several years. It’s true we’re deep into the current business cycle, but we’re not seeing excesses in the
U.S. economy that could trigger recession.
Past performance is no indication of current or future performance.
* Benchmark Source: Citigroup EuroBig Index
Russell Investments Ireland Limited
May 2016
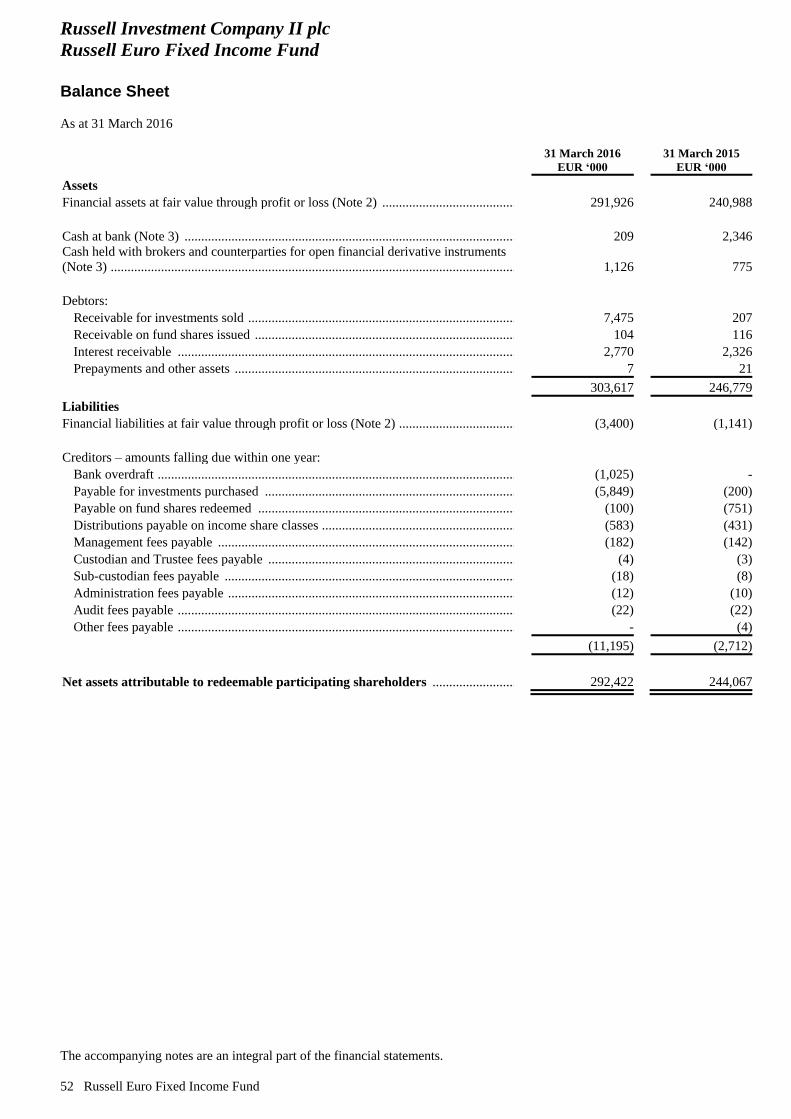
Russell Investment Company II plc
Russell Euro Fixed Income Fund
Balance Sheet
As at 31 March 2016
The accompanying notes are an integral part of the financial statements.
52 Russell Euro Fixed Income Fund
31 March 2016
EUR ‘000
31 March 2015
EUR ‘000
Assets
Financial assets at fair value through profit or loss (Note 2) .................................................. 291,926 240,988
Cash at bank (Note 3) ............................................................................................................... 209 2,346
Cash held with brokers and counterparties for open financial derivative instruments
(Note 3) ..................................................................................................................................... 1,126 775
Debtors:
Receivable for investments sold ............................................................................................ 7,475 207
Receivable on fund shares issued .......................................................................................... 104 116
Interest receivable ................................................................................................................. 2,770 2,326
Prepayments and other assets ................................................................................................ 7 21
303,617 246,779
Liabilities
Financial liabilities at fair value through profit or loss (Note 2) ............................................... (3,400) (1,141)
Creditors – amounts falling due within one year:
Bank overdraft ....................................................................................................................... (1,025) -
Payable for investments purchased ....................................................................................... (5,849) (200)
Payable on fund shares redeemed ......................................................................................... (100) (751)
Distributions payable on income share classes ...................................................................... (583) (431)
Management fees payable ..................................................................................................... (182) (142)
Custodian and Trustee fees payable ...................................................................................... (4) (3)
Sub-custodian fees payable ................................................................................................... (18) (8)
Administration fees payable .................................................................................................. (12) (10)
Audit fees payable ................................................................................................................. (36,600) - (22) (22)
Other fees payable ................................................................................................................. - (4)
(11,195) (2,712)
Net assets attributable to redeemable participating shareholders ..................................... 292,422 244,067
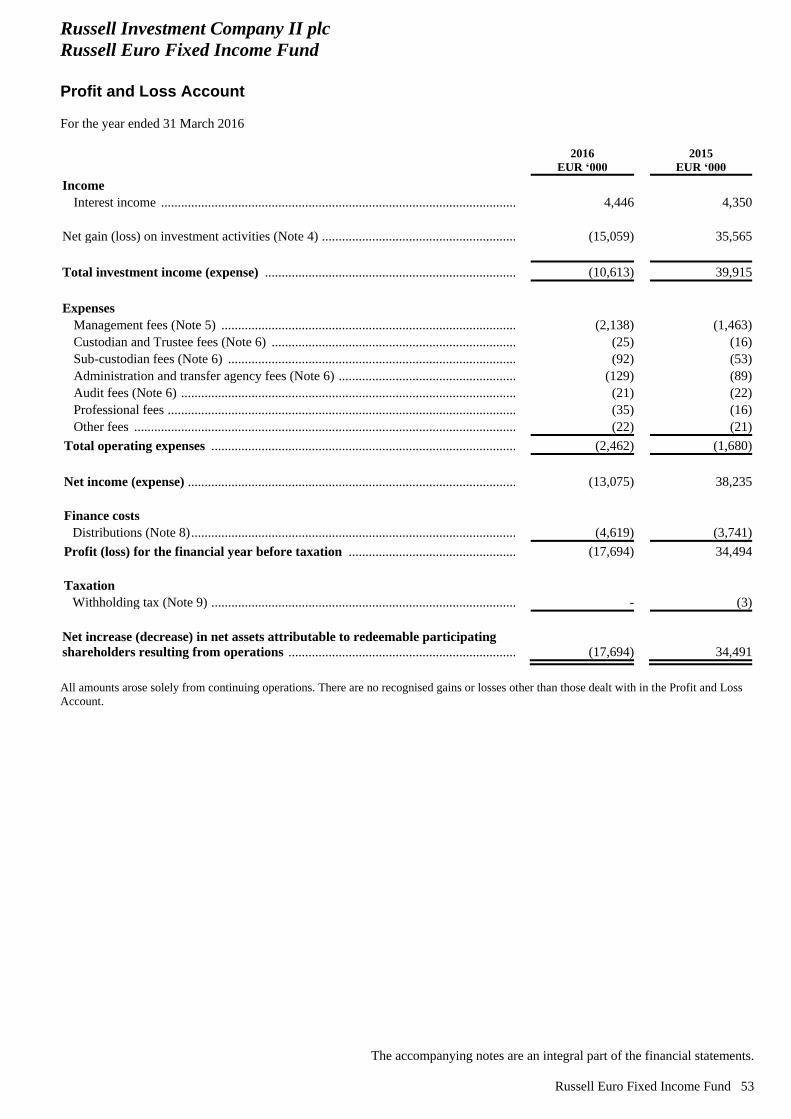
Russell Investment Company II plc
Russell Euro Fixed Income Fund
Profit and Loss Account
For the year ended 31 March 2016
The accompanying notes are an integral part of the financial statements.
Russell Euro Fixed Income Fund 53
2016
EUR ‘000
2015
EUR ‘000
Income
Interest income ............................................................................................................. 4,446 4,350
Net gain (loss) on investment activities (Note 4) ............................................................. (15,059) 35,565
Total investment income (expense) .............................................................................. (10,613) 39,915
Expenses
Management fees (Note 5) ........................................................................................... (2,138) (1,463)
Custodian and Trustee fees (Note 6) ............................................................................ (25) (16)
Sub-custodian fees (Note 6) ......................................................................................... (92) (53)
Administration and transfer agency fees (Note 6) ........................................................ (129) (89)
Audit fees (Note 6) ....................................................................................................... (21) (22)
Professional fees ........................................................................................................... (35) (16)
Other fees ..................................................................................................................... (22) (21)
Total operating expenses .............................................................................................. (2,462) (1,680)
Net income (expense) ..................................................................................................... (13,075) 38,235
Finance costs
Distributions (Note 8) .................................................................................................... (4,619) (3,741)
Profit (loss) for the financial year before taxation ..................................................... (17,694) 34,494
Taxation
Withholding tax (Note 9) .............................................................................................. - (3)
Net increase (decrease) in net assets attributable to redeemable participating
shareholders resulting from operations ....................................................................... (17,694) 34,491
All amounts arose solely from continuing operations. There are no recognised gains or losses other than those dealt with in the Profit and Loss
Account.
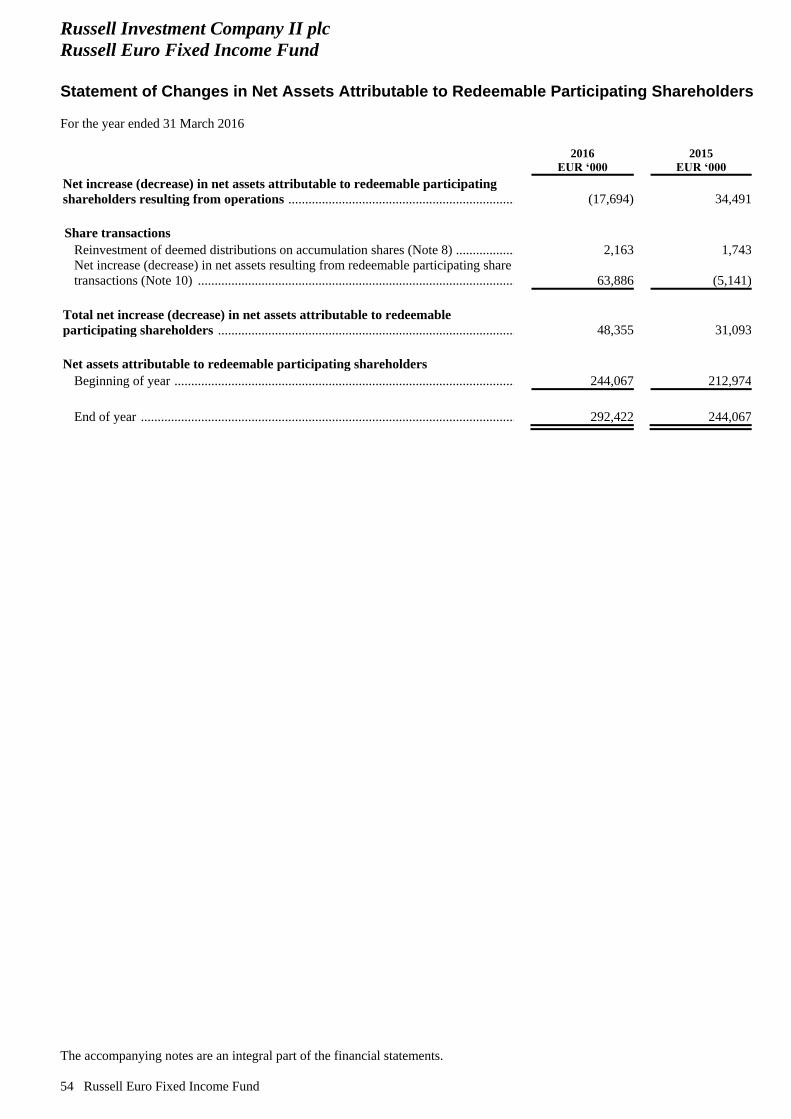
Russell Investment Company II plc
Russell Euro Fixed Income Fund
Statement of Changes in Net Assets Attributable to Redeemable Participating Shareholders
For the year ended 31 March 2016
The accompanying notes are an integral part of the financial statements.
54 Russell Euro Fixed Income Fund
2016
EUR ‘000
2015
EUR ‘000
Net increase (decrease) in net assets attributable to redeemable participating
shareholders resulting from operations ....................................................................... (17,694) 34,491
Share transactions
Reinvestment of deemed distributions on accumulation shares (Note 8) ..................... 2,163 1,743
Net increase (decrease) in net assets resulting from redeemable participating share
transactions (Note 10) .................................................................................................. 63,886 (5,141)
Total net increase (decrease) in net assets attributable to redeemable
participating shareholders ............................................................................................ 48,355 31,093
Net assets attributable to redeemable participating shareholders
Beginning of year ......................................................................................................... 244,067 212,974
End of year ................................................................................................................... 292,422 244,067
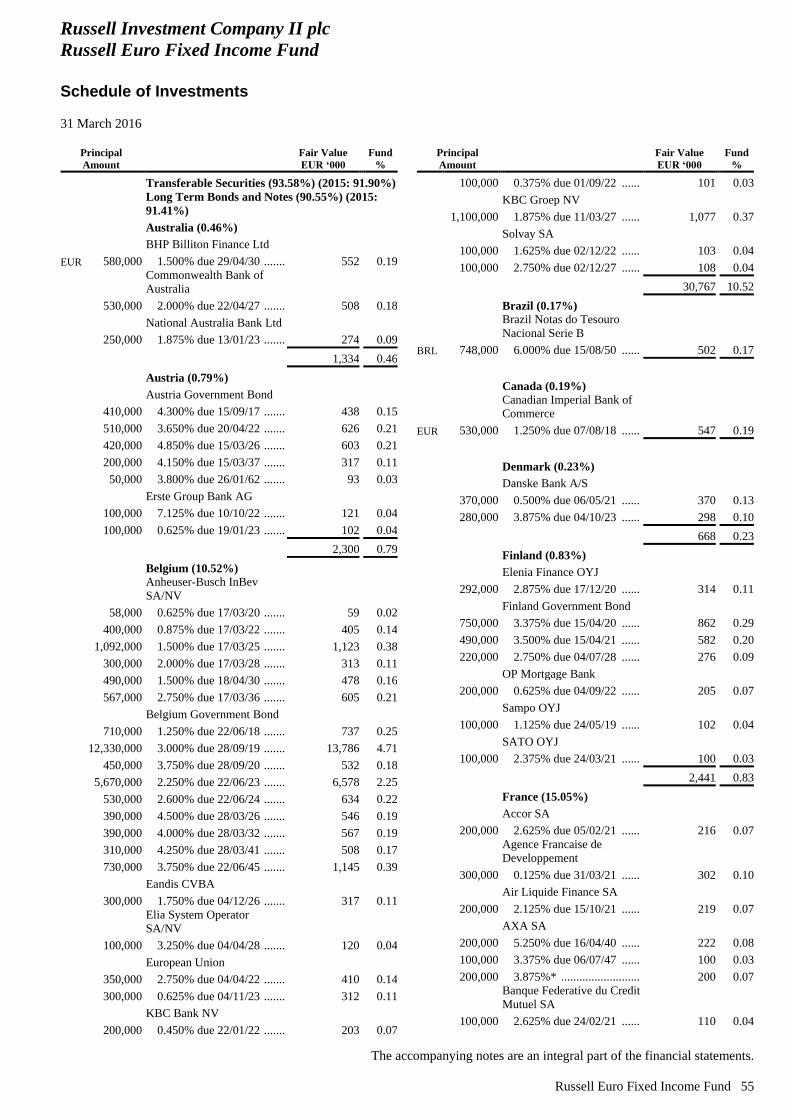
Russell Investment Company II plc
Russell Euro Fixed Income Fund
Schedule of Investments
31 March 2016
The accompanying notes are an integral part of the financial statements.
Russell Euro Fixed Income Fund 55
Principal
Amount
Fair Value
EUR ‘000
Fund
%
Transferable Securities (93.58%) (2015: 91.90%)
Long Term Bonds and Notes (90.55%) (2015:
91.41%)
Australia (0.46%)
BHP Billiton Finance Ltd
EUR 580,000 1.500% due 29/04/30 ....... 552 0.19
Commonwealth Bank of
Australia
530,000 2.000% due 22/04/27 ....... 508 0.18
National Australia Bank Ltd
250,000 1.875% due 13/01/23 ....... 274 0.09
1,334 0.46
Austria (0.79%)
Austria Government Bond
410,000 4.300% due 15/09/17 ....... 438 0.15
510,000 3.650% due 20/04/22 ....... 626 0.21
420,000 4.850% due 15/03/26 ....... 603 0.21
200,000 4.150% due 15/03/37 ....... 317 0.11
50,000 3.800% due 26/01/62 ....... 93 0.03
Erste Group Bank AG
100,000 7.125% due 10/10/22 ....... 121 0.04
100,000 0.625% due 19/01/23 ....... 102 0.04
2,300 0.79
Belgium (10.52%)
Anheuser-Busch InBev
SA/NV
58,000 0.625% due 17/03/20 ....... 59 0.02
400,000 0.875% due 17/03/22 ....... 405 0.14
1,092,000 1.500% due 17/03/25 ....... 1,123 0.38
300,000 2.000% due 17/03/28 ....... 313 0.11
490,000 1.500% due 18/04/30 ....... 478 0.16
567,000 2.750% due 17/03/36 ....... 605 0.21
Belgium Government Bond
710,000 1.250% due 22/06/18 ....... 737 0.25
12,330,000 3.000% due 28/09/19 ....... 13,786 4.71
450,000 3.750% due 28/09/20 ....... 532 0.18
5,670,000 2.250% due 22/06/23 ....... 6,578 2.25
530,000 2.600% due 22/06/24 ....... 634 0.22
390,000 4.500% due 28/03/26 ....... 546 0.19
390,000 4.000% due 28/03/32 ....... 567 0.19
310,000 4.250% due 28/03/41 ....... 508 0.17
730,000 3.750% due 22/06/45 ....... 1,145 0.39
Eandis CVBA
300,000 1.750% due 04/12/26 ....... 317 0.11
Elia System Operator
SA/NV
100,000 3.250% due 04/04/28 ....... 120 0.04
European Union
350,000 2.750% due 04/04/22 ....... 410 0.14
300,000 0.625% due 04/11/23 ....... 312 0.11
KBC Bank NV
200,000 0.450% due 22/01/22 ....... 203 0.07
Principal
Amount
Fair Value
EUR ‘000
Fund
%
100,000 0.375% due 01/09/22 ...... 101 0.03
KBC Groep NV
1,100,000 1.875% due 11/03/27 ...... 1,077 0.37
Solvay SA
100,000 1.625% due 02/12/22 ...... 103 0.04
100,000 2.750% due 02/12/27 ...... 108 0.04
30,767 10.52
Brazil (0.17%)
Brazil Notas do Tesouro
Nacional Serie B
BRL 748,000 6.000% due 15/08/50 ...... 502 0.17
Canada (0.19%)
Canadian Imperial Bank of
Commerce
EUR 530,000 1.250% due 07/08/18 ...... 547 0.19
Denmark (0.23%)
Danske Bank A/S
370,000 0.500% due 06/05/21 ...... 370 0.13
280,000 3.875% due 04/10/23 ...... 298 0.10
668 0.23
Finland (0.83%)
Elenia Finance OYJ
292,000 2.875% due 17/12/20 ...... 314 0.11
Finland Government Bond
750,000 3.375% due 15/04/20 ...... 862 0.29
490,000 3.500% due 15/04/21 ...... 582 0.20
220,000 2.750% due 04/07/28 ...... 276 0.09
OP Mortgage Bank
200,000 0.625% due 04/09/22 ...... 205 0.07
Sampo OYJ
100,000 1.125% due 24/05/19 ...... 102 0.04
SATO OYJ
100,000 2.375% due 24/03/21 ...... 100 0.03
2,441 0.83
France (15.05%)
Accor SA
200,000 2.625% due 05/02/21 ...... 216 0.07
Agence Francaise de
Developpement
300,000 0.125% due 31/03/21 ...... 302 0.10
Air Liquide Finance SA
200,000 2.125% due 15/10/21 ...... 219 0.07
AXA SA
200,000 5.250% due 16/04/40 ...... 222 0.08
100,000 3.375% due 06/07/47 ...... 100 0.03
200,000 3.875%* .......................... 200 0.07
Banque Federative du Credit
Mutuel SA
100,000 2.625% due 24/02/21 ...... 110 0.04
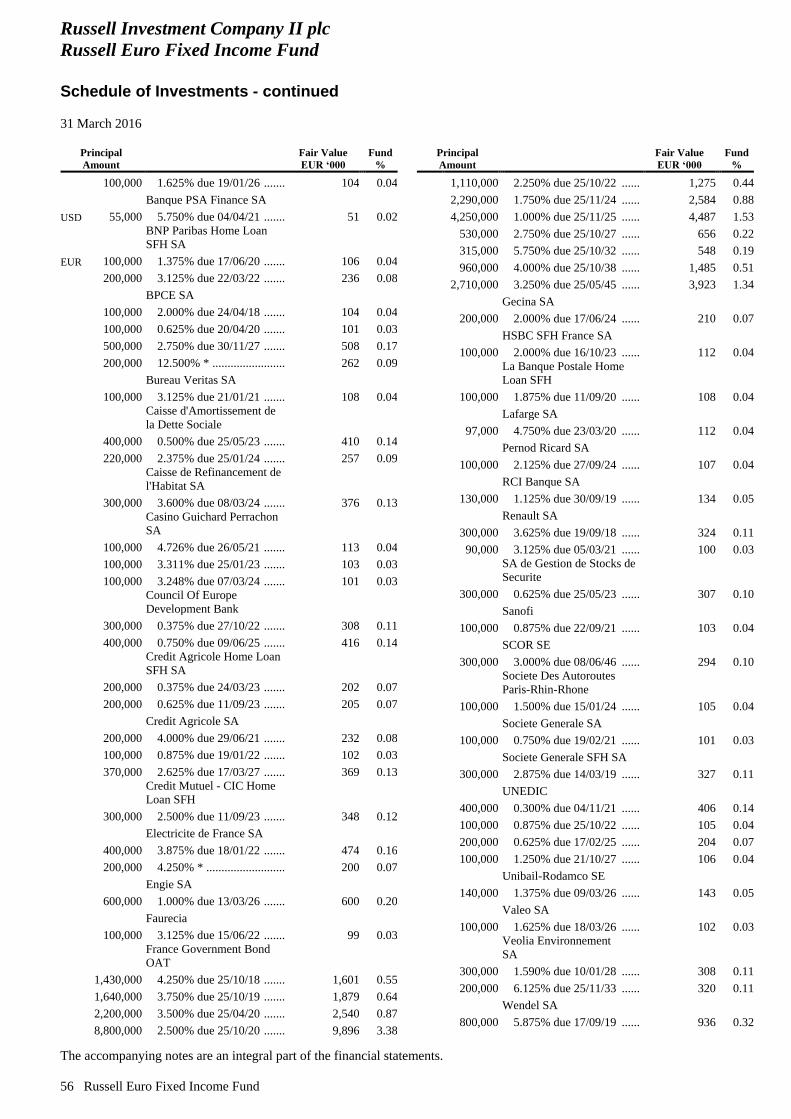
Russell Investment Company II plc
Russell Euro Fixed Income Fund
Schedule of Investments - continued
31 March 2016
The accompanying notes are an integral part of the financial statements.
56 Russell Euro Fixed Income Fund
Principal
Amount
Fair Value
EUR ‘000
Fund
%
100,000 1.625% due 19/01/26 ....... 104 0.04
Banque PSA Finance SA
USD 55,000 5.750% due 04/04/21 ....... 51 0.02
BNP Paribas Home Loan
SFH SA
EUR 100,000 1.375% due 17/06/20 ....... 106 0.04
200,000 3.125% due 22/03/22 ....... 236 0.08
BPCE SA
100,000 2.000% due 24/04/18 ....... 104 0.04
100,000 0.625% due 20/04/20 ....... 101 0.03
500,000 2.750% due 30/11/27 ....... 508 0.17
200,000 12.500% * ........................ 262 0.09
Bureau Veritas SA
100,000 3.125% due 21/01/21 ....... 108 0.04
Caisse d'Amortissement de
la Dette Sociale
400,000 0.500% due 25/05/23 ....... 410 0.14
220,000 2.375% due 25/01/24 ....... 257 0.09
Caisse de Refinancement de
l'Habitat SA
300,000 3.600% due 08/03/24 ....... 376 0.13
Casino Guichard Perrachon
SA
100,000 4.726% due 26/05/21 ....... 113 0.04
100,000 3.311% due 25/01/23 ....... 103 0.03
100,000 3.248% due 07/03/24 ....... 101 0.03
Council Of Europe
Development Bank
300,000 0.375% due 27/10/22 ....... 308 0.11
400,000 0.750% due 09/06/25 ....... 416 0.14
Credit Agricole Home Loan
SFH SA
200,000 0.375% due 24/03/23 ....... 202 0.07
200,000 0.625% due 11/09/23 ....... 205 0.07
Credit Agricole SA
200,000 4.000% due 29/06/21 ....... 232 0.08
100,000 0.875% due 19/01/22 ....... 102 0.03
370,000 2.625% due 17/03/27 ....... 369 0.13
Credit Mutuel - CIC Home
Loan SFH
300,000 2.500% due 11/09/23 ....... 348 0.12
Electricite de France SA
400,000 3.875% due 18/01/22 ....... 474 0.16
200,000 4.250% * .......................... 200 0.07
Engie SA
600,000 1.000% due 13/03/26 ....... 600 0.20
Faurecia
100,000 3.125% due 15/06/22 ....... 99 0.03
France Government Bond
OAT
1,430,000 4.250% due 25/10/18 ....... 1,601 0.55
1,640,000 3.750% due 25/10/19 ....... 1,879 0.64
2,200,000 3.500% due 25/04/20 ....... 2,540 0.87
8,800,000 2.500% due 25/10/20 ....... 9,896 3.38
Principal
Amount
Fair Value
EUR ‘000
Fund
%
1,110,000 2.250% due 25/10/22 ...... 1,275 0.44
2,290,000 1.750% due 25/11/24 ...... 2,584 0.88
4,250,000 1.000% due 25/11/25 ...... 4,487 1.53
530,000 2.750% due 25/10/27 ...... 656 0.22
315,000 5.750% due 25/10/32 ...... 548 0.19
960,000 4.000% due 25/10/38 ...... 1,485 0.51
2,710,000 3.250% due 25/05/45 ...... 3,923 1.34
Gecina SA
200,000 2.000% due 17/06/24 ...... 210 0.07
HSBC SFH France SA
100,000 2.000% due 16/10/23 ...... 112 0.04
La Banque Postale Home
Loan SFH
100,000 1.875% due 11/09/20 ...... 108 0.04
Lafarge SA
97,000 4.750% due 23/03/20 ...... 112 0.04
Pernod Ricard SA
100,000 2.125% due 27/09/24 ...... 107 0.04
RCI Banque SA
130,000 1.125% due 30/09/19 ...... 134 0.05
Renault SA
300,000 3.625% due 19/09/18 ...... 324 0.11
90,000 3.125% due 05/03/21 ...... 100 0.03
SA de Gestion de Stocks de
Securite
300,000 0.625% due 25/05/23 ...... 307 0.10
Sanofi
100,000 0.875% due 22/09/21 ...... 103 0.04
SCOR SE
300,000 3.000% due 08/06/46 ...... 294 0.10
Societe Des Autoroutes
Paris-Rhin-Rhone
100,000 1.500% due 15/01/24 ...... 105 0.04
Societe Generale SA
100,000 0.750% due 19/02/21 ...... 101 0.03
Societe Generale SFH SA
300,000 2.875% due 14/03/19 ...... 327 0.11
UNEDIC
400,000 0.300% due 04/11/21 ...... 406 0.14
100,000 0.875% due 25/10/22 ...... 105 0.04
200,000 0.625% due 17/02/25 ...... 204 0.07
100,000 1.250% due 21/10/27 ...... 106 0.04
Unibail-Rodamco SE
140,000 1.375% due 09/03/26 ...... 143 0.05
Valeo SA
100,000 1.625% due 18/03/26 ...... 102 0.03
Veolia Environnement
SA
300,000 1.590% due 10/01/28 ...... 308 0.11
200,000 6.125% due 25/11/33 ...... 320 0.11
Wendel SA
800,000 5.875% due 17/09/19 ...... 936 0.32
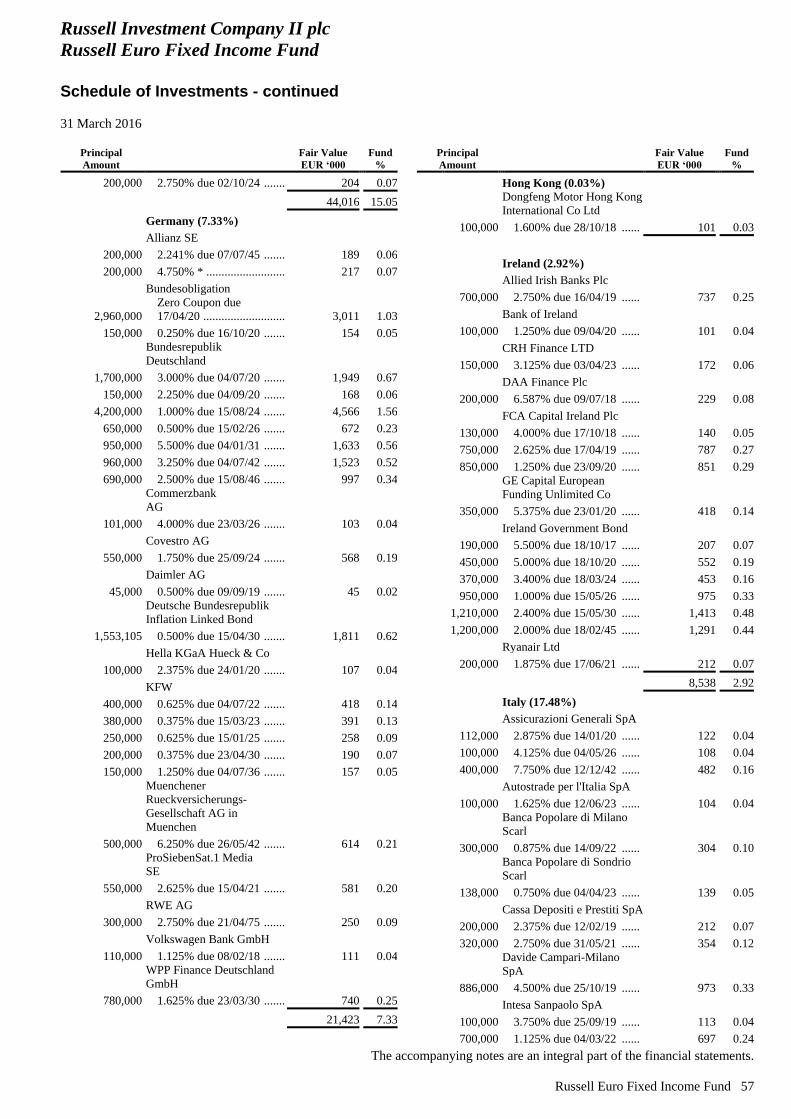
Russell Investment Company II plc
Russell Euro Fixed Income Fund
Schedule of Investments - continued
31 March 2016
The accompanying notes are an integral part of the financial statements.
Russell Euro Fixed Income Fund 57
Principal
Amount
Fair Value
EUR ‘000
Fund
%
200,000 2.750% due 02/10/24 ....... 204 0.07
44,016 15.05
Germany (7.33%)
Allianz SE
200,000 2.241% due 07/07/45 ....... 189 0.06
200,000 4.750% * .......................... 217 0.07
Bundesobligation
2,960,000
Zero Coupon due
17/04/20 ........................... 3,011 1.03
150,000 0.250% due 16/10/20 ....... 154 0.05
Bundesrepublik
Deutschland
1,700,000 3.000% due 04/07/20 ....... 1,949 0.67
150,000 2.250% due 04/09/20 ....... 168 0.06
4,200,000 1.000% due 15/08/24 ....... 4,566 1.56
650,000 0.500% due 15/02/26 ....... 672 0.23
950,000 5.500% due 04/01/31 ....... 1,633 0.56
960,000 3.250% due 04/07/42 ....... 1,523 0.52
690,000 2.500% due 15/08/46 ....... 997 0.34
Commerzbank
AG
101,000 4.000% due 23/03/26 ....... 103 0.04
Covestro AG
550,000 1.750% due 25/09/24 ....... 568 0.19
Daimler AG
45,000 0.500% due 09/09/19 ....... 45 0.02
Deutsche Bundesrepublik
Inflation Linked Bond
1,553,105 0.500% due 15/04/30 ....... 1,811 0.62
Hella KGaA Hueck & Co
100,000 2.375% due 24/01/20 ....... 107 0.04
KFW
400,000 0.625% due 04/07/22 ....... 418 0.14
380,000 0.375% due 15/03/23 ....... 391 0.13
250,000 0.625% due 15/01/25 ....... 258 0.09
200,000 0.375% due 23/04/30 ....... 190 0.07
150,000 1.250% due 04/07/36 ....... 157 0.05
Muenchener
Rueckversicherungs-
Gesellschaft AG in
Muenchen
500,000 6.250% due 26/05/42 ....... 614 0.21
ProSiebenSat.1 Media
SE
550,000 2.625% due 15/04/21 ....... 581 0.20
RWE AG
300,000 2.750% due 21/04/75 ....... 250 0.09
Volkswagen Bank GmbH
110,000 1.125% due 08/02/18 ....... 111 0.04
WPP Finance Deutschland
GmbH
780,000 1.625% due 23/03/30 ....... 740 0.25
21,423 7.33
Principal
Amount
Fair Value
EUR ‘000
Fund
%
Hong Kong (0.03%)
Dongfeng Motor Hong Kong
International Co Ltd
100,000 1.600% due 28/10/18 ...... 101 0.03
Ireland (2.92%)
Allied Irish Banks Plc
700,000 2.750% due 16/04/19 ...... 737 0.25
Bank of Ireland
100,000 1.250% due 09/04/20 ...... 101 0.04
CRH Finance LTD
150,000 3.125% due 03/04/23 ...... 172 0.06
DAA Finance Plc
200,000 6.587% due 09/07/18 ...... 229 0.08
FCA Capital Ireland Plc
130,000 4.000% due 17/10/18 ...... 140 0.05
750,000 2.625% due 17/04/19 ...... 787 0.27
850,000 1.250% due 23/09/20 ...... 851 0.29
GE Capital European
Funding Unlimited Co
350,000 5.375% due 23/01/20 ...... 418 0.14
Ireland Government Bond
190,000 5.500% due 18/10/17 ...... 207 0.07
450,000 5.000% due 18/10/20 ...... 552 0.19
370,000 3.400% due 18/03/24 ...... 453 0.16
950,000 1.000% due 15/05/26 ...... 975 0.33
1,210,000 2.400% due 15/05/30 ...... 1,413 0.48
1,200,000 2.000% due 18/02/45 ...... 1,291 0.44
Ryanair Ltd
200,000 1.875% due 17/06/21 ...... 212 0.07
8,538 2.92
Italy (17.48%)
Assicurazioni Generali SpA
112,000 2.875% due 14/01/20 ...... 122 0.04
100,000 4.125% due 04/05/26 ...... 108 0.04
400,000 7.750% due 12/12/42 ...... 482 0.16
Autostrade per l'Italia SpA
100,000 1.625% due 12/06/23 ...... 104 0.04
Banca Popolare di Milano
Scarl
300,000 0.875% due 14/09/22 ...... 304 0.10
Banca Popolare di Sondrio
Scarl
138,000 0.750% due 04/04/23 ...... 139 0.05
Cassa Depositi e Prestiti SpA
200,000 2.375% due 12/02/19 ...... 212 0.07
320,000 2.750% due 31/05/21 ...... 354 0.12
Davide Campari-Milano
SpA
886,000 4.500% due 25/10/19 ...... 973 0.33
Intesa Sanpaolo SpA
100,000 3.750% due 25/09/19 ...... 113 0.04
700,000 1.125% due 04/03/22 ...... 697 0.24
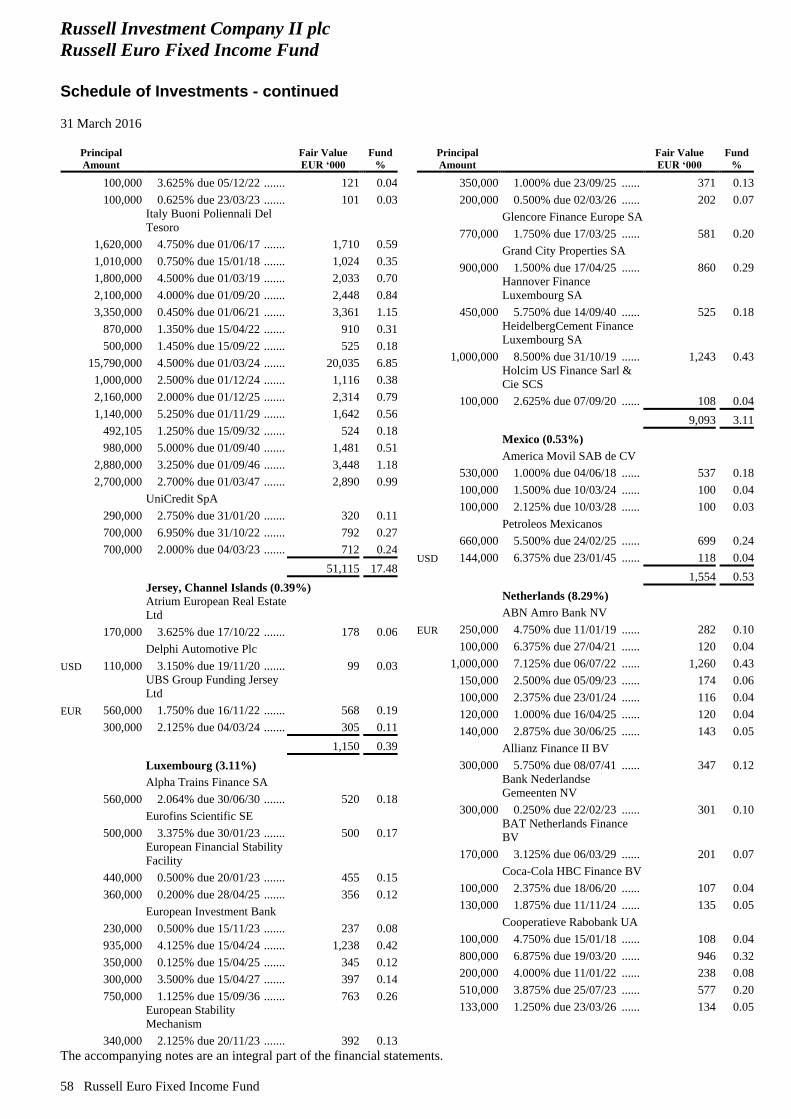
Russell Investment Company II plc
Russell Euro Fixed Income Fund
Schedule of Investments - continued
31 March 2016
The accompanying notes are an integral part of the financial statements.
58 Russell Euro Fixed Income Fund
Principal
Amount
Fair Value
EUR ‘000
Fund
%
100,000 3.625% due 05/12/22 ....... 121 0.04
100,000 0.625% due 23/03/23 ....... 101 0.03
Italy Buoni Poliennali Del
Tesoro
1,620,000 4.750% due 01/06/17 ....... 1,710 0.59
1,010,000 0.750% due 15/01/18 ....... 1,024 0.35
1,800,000 4.500% due 01/03/19 ....... 2,033 0.70
2,100,000 4.000% due 01/09/20 ....... 2,448 0.84
3,350,000 0.450% due 01/06/21 ....... 3,361 1.15
870,000 1.350% due 15/04/22 ....... 910 0.31
500,000 1.450% due 15/09/22 ....... 525 0.18
15,790,000 4.500% due 01/03/24 ....... 20,035 6.85
1,000,000 2.500% due 01/12/24 ....... 1,116 0.38
2,160,000 2.000% due 01/12/25 ....... 2,314 0.79
1,140,000 5.250% due 01/11/29 ....... 1,642 0.56
492,105 1.250% due 15/09/32 ....... 524 0.18
980,000 5.000% due 01/09/40 ....... 1,481 0.51
2,880,000 3.250% due 01/09/46 ....... 3,448 1.18
2,700,000 2.700% due 01/03/47 ....... 2,890 0.99
UniCredit SpA
290,000 2.750% due 31/01/20 ....... 320 0.11
700,000 6.950% due 31/10/22 ....... 792 0.27
700,000 2.000% due 04/03/23 ....... 712 0.24
51,115 17.48
Jersey, Channel Islands (0.39%)
Atrium European Real Estate
Ltd
170,000 3.625% due 17/10/22 ....... 178 0.06
Delphi Automotive Plc
USD 110,000 3.150% due 19/11/20 ....... 99 0.03
UBS Group Funding Jersey
Ltd
EUR 560,000 1.750% due 16/11/22 ....... 568 0.19
300,000 2.125% due 04/03/24 ....... 305 0.11
1,150 0.39
Luxembourg (3.11%)
Alpha Trains Finance SA
560,000 2.064% due 30/06/30 ....... 520 0.18
Eurofins Scientific SE
500,000 3.375% due 30/01/23 ....... 500 0.17
European Financial Stability
Facility
440,000 0.500% due 20/01/23 ....... 455 0.15
360,000 0.200% due 28/04/25 ....... 356 0.12
European Investment Bank
230,000 0.500% due 15/11/23 ....... 237 0.08
935,000 4.125% due 15/04/24 ....... 1,238 0.42
350,000 0.125% due 15/04/25 ....... 345 0.12
300,000 3.500% due 15/04/27 ....... 397 0.14
750,000 1.125% due 15/09/36 ....... 763 0.26
European Stability
Mechanism
340,000 2.125% due 20/11/23 ....... 392 0.13
Principal
Amount
Fair Value
EUR ‘000
Fund
%
350,000 1.000% due 23/09/25 ...... 371 0.13
200,000 0.500% due 02/03/26 ...... 202 0.07
Glencore Finance Europe SA
770,000 1.750% due 17/03/25 ...... 581 0.20
Grand City Properties SA
900,000 1.500% due 17/04/25 ...... 860 0.29
Hannover Finance
Luxembourg SA
450,000 5.750% due 14/09/40 ...... 525 0.18
HeidelbergCement Finance
Luxembourg SA
1,000,000 8.500% due 31/10/19 ...... 1,243 0.43
Holcim US Finance Sarl &
Cie SCS
100,000 2.625% due 07/09/20 ...... 108 0.04
9,093 3.11
Mexico (0.53%)
America Movil SAB de CV
530,000 1.000% due 04/06/18 ...... 537 0.18
100,000 1.500% due 10/03/24 ...... 100 0.04
100,000 2.125% due 10/03/28 ...... 100 0.03
Petroleos Mexicanos
660,000 5.500% due 24/02/25 ...... 699 0.24
USD 144,000 6.375% due 23/01/45 ...... 118 0.04
1,554 0.53
Netherlands (8.29%)
ABN Amro Bank NV
EUR 250,000 4.750% due 11/01/19 ...... 282 0.10
100,000 6.375% due 27/04/21 ...... 120 0.04
1,000,000 7.125% due 06/07/22 ...... 1,260 0.43
150,000 2.500% due 05/09/23 ...... 174 0.06
100,000 2.375% due 23/01/24 ...... 116 0.04
120,000 1.000% due 16/04/25 ...... 120 0.04
140,000 2.875% due 30/06/25 ...... 143 0.05
Allianz Finance II BV
300,000 5.750% due 08/07/41 ...... 347 0.12
Bank Nederlandse
Gemeenten NV
300,000 0.250% due 22/02/23 ...... 301 0.10
BAT Netherlands Finance
BV
170,000 3.125% due 06/03/29 ...... 201 0.07
Coca-Cola HBC Finance BV
100,000 2.375% due 18/06/20 ...... 107 0.04
130,000 1.875% due 11/11/24 ...... 135 0.05
Cooperatieve Rabobank UA
100,000 4.750% due 15/01/18 ...... 108 0.04
800,000 6.875% due 19/03/20 ...... 946 0.32
200,000 4.000% due 11/01/22 ...... 238 0.08
510,000 3.875% due 25/07/23 ...... 577 0.20
133,000 1.250% due 23/03/26 ...... 134 0.05
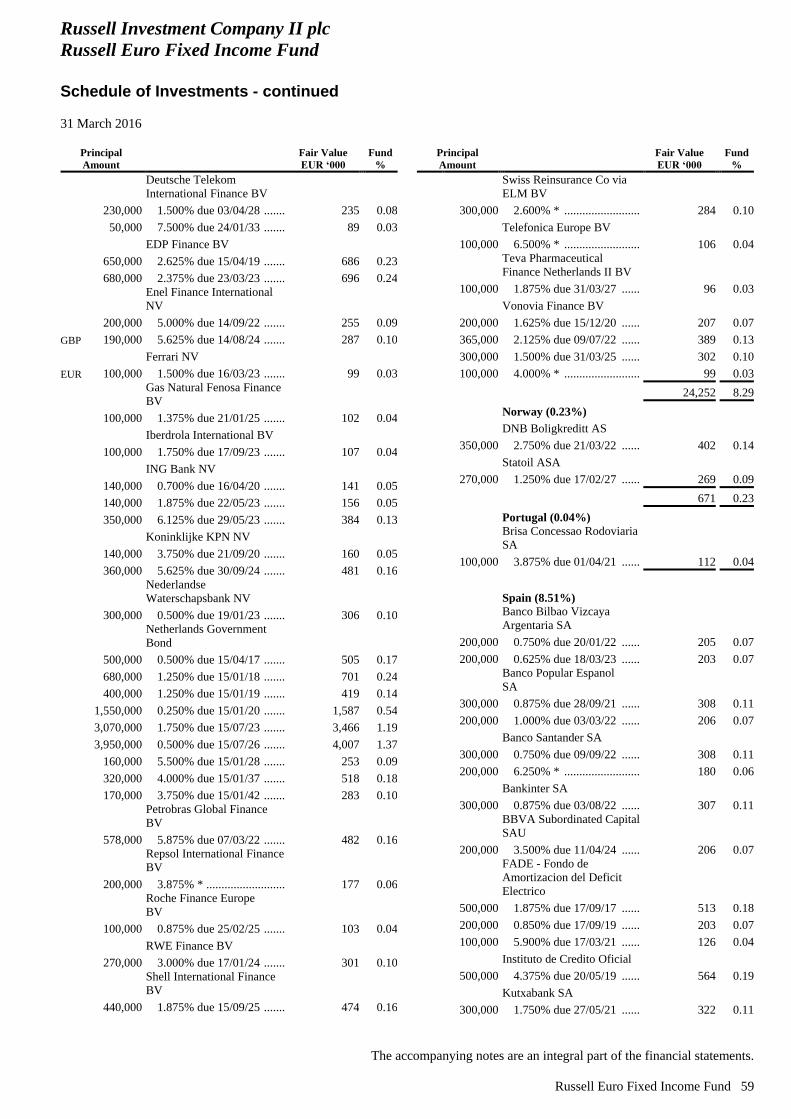
Russell Investment Company II plc
Russell Euro Fixed Income Fund
Schedule of Investments - continued
31 March 2016
The accompanying notes are an integral part of the financial statements.
Russell Euro Fixed Income Fund 59
Principal
Amount
Fair Value
EUR ‘000
Fund
%
Deutsche Telekom
International Finance BV
230,000 1.500% due 03/04/28 ....... 235 0.08
50,000 7.500% due 24/01/33 ....... 89 0.03
EDP Finance BV
650,000 2.625% due 15/04/19 ....... 686 0.23
680,000 2.375% due 23/03/23 ....... 696 0.24
Enel Finance International
NV
200,000 5.000% due 14/09/22 ....... 255 0.09
GBP 190,000 5.625% due 14/08/24 ....... 287 0.10
Ferrari NV
EUR 100,000 1.500% due 16/03/23 ....... 99 0.03
Gas Natural Fenosa Finance
BV
100,000 1.375% due 21/01/25 ....... 102 0.04
Iberdrola International BV
100,000 1.750% due 17/09/23 ....... 107 0.04
ING Bank NV
140,000 0.700% due 16/04/20 ....... 141 0.05
140,000 1.875% due 22/05/23 ....... 156 0.05
350,000 6.125% due 29/05/23 ....... 384 0.13
Koninklijke KPN NV
140,000 3.750% due 21/09/20 ....... 160 0.05
360,000 5.625% due 30/09/24 ....... 481 0.16
Nederlandse
Waterschapsbank NV
300,000 0.500% due 19/01/23 ....... 306 0.10
Netherlands Government
Bond
500,000 0.500% due 15/04/17 ....... 505 0.17
680,000 1.250% due 15/01/18 ....... 701 0.24
400,000 1.250% due 15/01/19 ....... 419 0.14
1,550,000 0.250% due 15/01/20 ....... 1,587 0.54
3,070,000 1.750% due 15/07/23 ....... 3,466 1.19
3,950,000 0.500% due 15/07/26 ....... 4,007 1.37
160,000 5.500% due 15/01/28 ....... 253 0.09
320,000 4.000% due 15/01/37 ....... 518 0.18
170,000 3.750% due 15/01/42 ....... 283 0.10
Petrobras Global Finance
BV
578,000 5.875% due 07/03/22 ....... 482 0.16
Repsol International Finance
BV
200,000 3.875% * .......................... 177 0.06
Roche Finance Europe
BV
100,000 0.875% due 25/02/25 ....... 103 0.04
RWE Finance BV
270,000 3.000% due 17/01/24 ....... 301 0.10
Shell International Finance
BV
440,000 1.875% due 15/09/25 ....... 474 0.16
Principal
Amount
Fair Value
EUR ‘000
Fund
%
Swiss Reinsurance Co via
ELM BV
300,000 2.600% * ......................... 284 0.10
Telefonica Europe BV
100,000 6.500% * ......................... 106 0.04
Teva Pharmaceutical
Finance Netherlands II BV
100,000 1.875% due 31/03/27 ...... 96 0.03
Vonovia Finance BV
200,000 1.625% due 15/12/20 ...... 207 0.07
365,000 2.125% due 09/07/22 ...... 389 0.13
300,000 1.500% due 31/03/25 ...... 302 0.10
100,000 4.000% * ......................... 99 0.03
24,252 8.29
Norway (0.23%)
DNB Boligkreditt AS
350,000 2.750% due 21/03/22 ...... 402 0.14
Statoil ASA
270,000 1.250% due 17/02/27 ...... 269 0.09
671 0.23
Portugal (0.04%)
Brisa Concessao Rodoviaria
SA
100,000 3.875% due 01/04/21 ...... 112 0.04
Spain (8.51%)
Banco Bilbao Vizcaya
Argentaria SA
200,000 0.750% due 20/01/22 ...... 205 0.07
200,000 0.625% due 18/03/23 ...... 203 0.07
Banco Popular Espanol
SA
300,000 0.875% due 28/09/21 ...... 308 0.11
200,000 1.000% due 03/03/22 ...... 206 0.07
Banco Santander SA
300,000 0.750% due 09/09/22 ...... 308 0.11
200,000 6.250% * ......................... 180 0.06
Bankinter SA
300,000 0.875% due 03/08/22 ...... 307 0.11
BBVA Subordinated Capital
SAU
200,000 3.500% due 11/04/24 ...... 206 0.07
FADE - Fondo de
Amortizacion del Deficit
Electrico
500,000 1.875% due 17/09/17 ...... 513 0.18
200,000 0.850% due 17/09/19 ...... 203 0.07
100,000 5.900% due 17/03/21 ...... 126 0.04
Instituto de Credito Oficial
500,000 4.375% due 20/05/19 ...... 564 0.19
Kutxabank SA
300,000 1.750% due 27/05/21 ...... 322 0.11
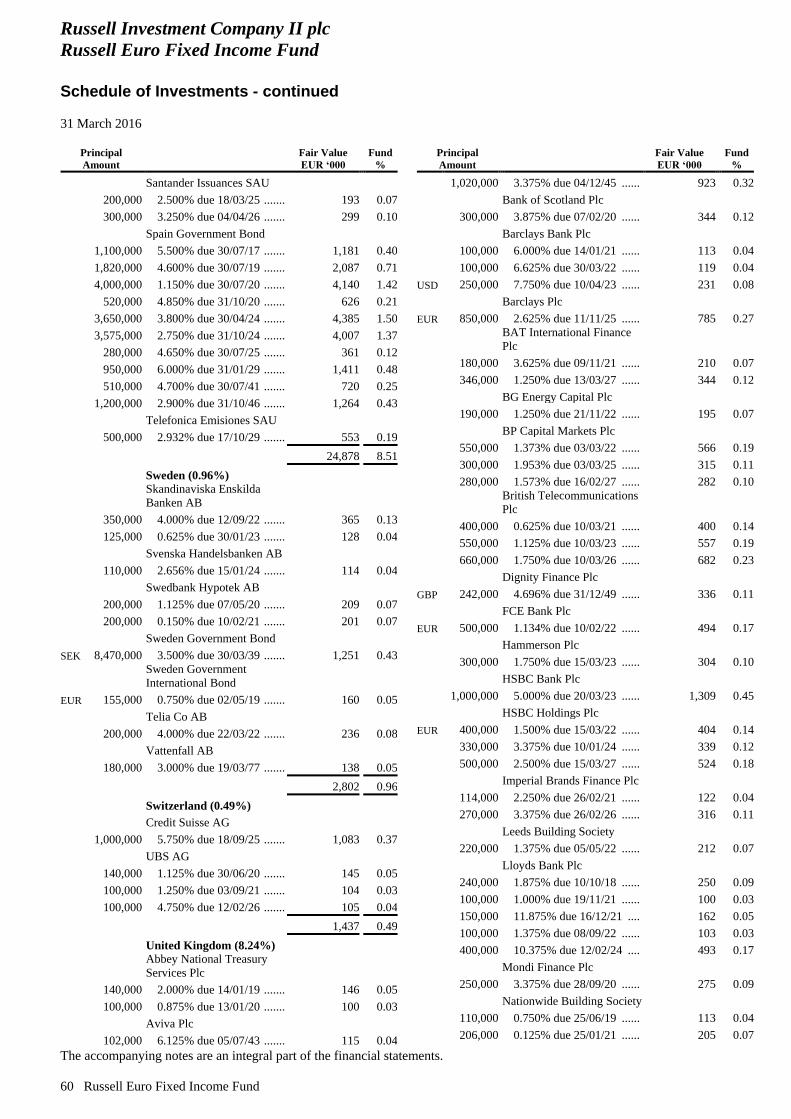
Russell Investment Company II plc
Russell Euro Fixed Income Fund
Schedule of Investments - continued
31 March 2016
The accompanying notes are an integral part of the financial statements.
60 Russell Euro Fixed Income Fund
Principal
Amount
Fair Value
EUR ‘000
Fund
%
Santander Issuances SAU
200,000 2.500% due 18/03/25 ....... 193 0.07
300,000 3.250% due 04/04/26 ....... 299 0.10
Spain Government Bond
1,100,000 5.500% due 30/07/17 ....... 1,181 0.40
1,820,000 4.600% due 30/07/19 ....... 2,087 0.71
4,000,000 1.150% due 30/07/20 ....... 4,140 1.42
520,000 4.850% due 31/10/20 ....... 626 0.21
3,650,000 3.800% due 30/04/24 ....... 4,385 1.50
3,575,000 2.750% due 31/10/24 ....... 4,007 1.37
280,000 4.650% due 30/07/25 ....... 361 0.12
950,000 6.000% due 31/01/29 ....... 1,411 0.48
510,000 4.700% due 30/07/41 ....... 720 0.25
1,200,000 2.900% due 31/10/46 ....... 1,264 0.43
Telefonica Emisiones SAU
500,000 2.932% due 17/10/29 ....... 553 0.19
24,878 8.51
Sweden (0.96%)
Skandinaviska Enskilda
Banken AB
350,000 4.000% due 12/09/22 ....... 365 0.13
125,000 0.625% due 30/01/23 ....... 128 0.04
Svenska Handelsbanken AB
110,000 2.656% due 15/01/24 ....... 114 0.04
Swedbank Hypotek AB
200,000 1.125% due 07/05/20 ....... 209 0.07
200,000 0.150% due 10/02/21 ....... 201 0.07
Sweden Government Bond
SEK 8,470,000 3.500% due 30/03/39 ....... 1,251 0.43
Sweden Government
International Bond
EUR 155,000 0.750% due 02/05/19 ....... 160 0.05
Telia Co AB
200,000 4.000% due 22/03/22 ....... 236 0.08
Vattenfall AB
180,000 3.000% due 19/03/77 ....... 138 0.05
2,802 0.96
Switzerland (0.49%)
Credit Suisse AG
1,000,000 5.750% due 18/09/25 ....... 1,083 0.37
UBS AG
140,000 1.125% due 30/06/20 ....... 145 0.05
100,000 1.250% due 03/09/21 ....... 104 0.03
100,000 4.750% due 12/02/26 ....... 105 0.04
1,437 0.49
United Kingdom (8.24%)
Abbey National Treasury
Services Plc
140,000 2.000% due 14/01/19 ....... 146 0.05
100,000 0.875% due 13/01/20 ....... 100 0.03
Aviva Plc
102,000 6.125% due 05/07/43 ....... 115 0.04
Principal
Amount
Fair Value
EUR ‘000
Fund
%
1,020,000 3.375% due 04/12/45 ...... 923 0.32
Bank of Scotland Plc
300,000 3.875% due 07/02/20 ...... 344 0.12
Barclays Bank Plc
100,000 6.000% due 14/01/21 ...... 113 0.04
100,000 6.625% due 30/03/22 ...... 119 0.04
USD 250,000 7.750% due 10/04/23 ...... 231 0.08
Barclays Plc
EUR 850,000 2.625% due 11/11/25 ...... 785 0.27
BAT International Finance
Plc
180,000 3.625% due 09/11/21 ...... 210 0.07
346,000 1.250% due 13/03/27 ...... 344 0.12
BG Energy Capital Plc
190,000 1.250% due 21/11/22 ...... 195 0.07
BP Capital Markets Plc
550,000 1.373% due 03/03/22 ...... 566 0.19
300,000 1.953% due 03/03/25 ...... 315 0.11
280,000 1.573% due 16/02/27 ...... 282 0.10
British Telecommunications
Plc
400,000 0.625% due 10/03/21 ...... 400 0.14
550,000 1.125% due 10/03/23 ...... 557 0.19
660,000 1.750% due 10/03/26 ...... 682 0.23
Dignity Finance Plc
GBP 242,000 4.696% due 31/12/49 ...... 336 0.11
FCE Bank Plc
EUR 500,000 1.134% due 10/02/22 ...... 494 0.17
Hammerson Plc
300,000 1.750% due 15/03/23 ...... 304 0.10
HSBC Bank Plc
1,000,000 5.000% due 20/03/23 ...... 1,309 0.45
HSBC Holdings Plc
EUR 400,000 1.500% due 15/03/22 ...... 404 0.14
330,000 3.375% due 10/01/24 ...... 339 0.12
500,000 2.500% due 15/03/27 ...... 524 0.18
Imperial Brands Finance Plc
114,000 2.250% due 26/02/21 ...... 122 0.04
270,000 3.375% due 26/02/26 ...... 316 0.11
Leeds Building Society
220,000 1.375% due 05/05/22 ...... 212 0.07
Lloyds Bank Plc
240,000 1.875% due 10/10/18 ...... 250 0.09
100,000 1.000% due 19/11/21 ...... 100 0.03
150,000 11.875% due 16/12/21 .... 162 0.05
100,000 1.375% due 08/09/22 ...... 103 0.03
400,000 10.375% due 12/02/24 .... 493 0.17
Mondi Finance Plc
250,000 3.375% due 28/09/20 ...... 275 0.09
Nationwide Building Society
110,000 0.750% due 25/06/19 ...... 113 0.04
206,000 0.125% due 25/01/21 ...... 205 0.07
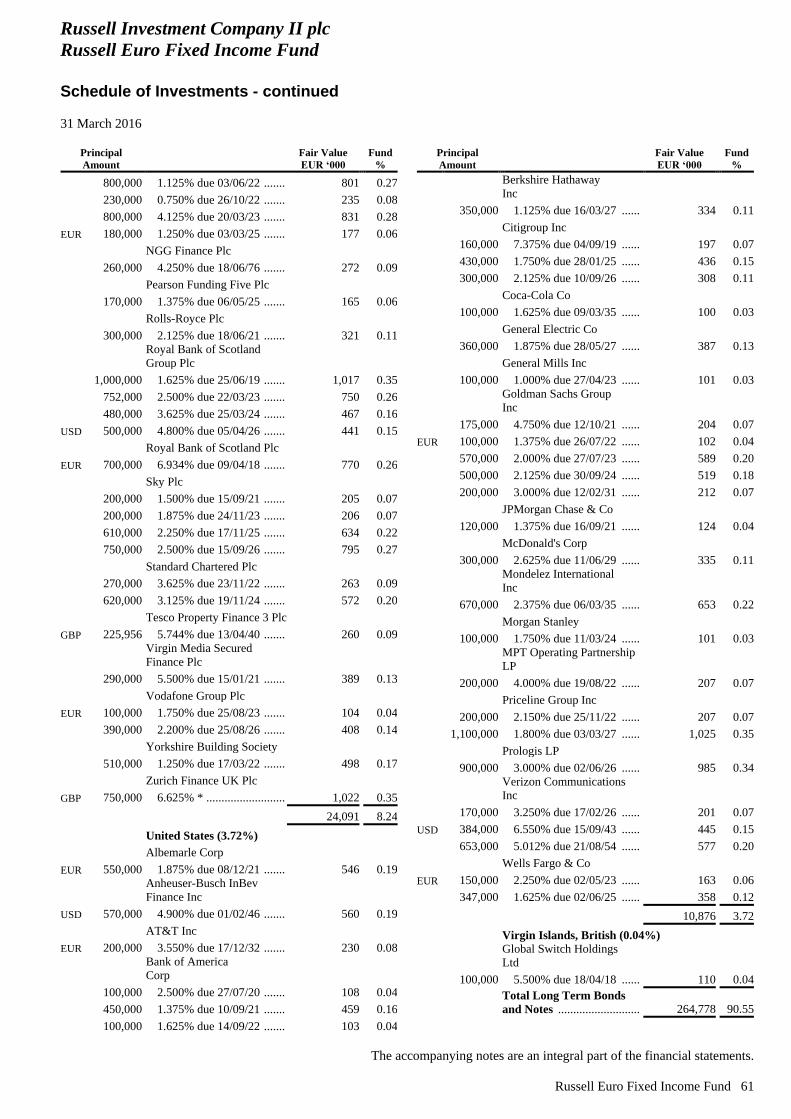
Russell Investment Company II plc
Russell Euro Fixed Income Fund
Schedule of Investments - continued
31 March 2016
The accompanying notes are an integral part of the financial statements.
Russell Euro Fixed Income Fund 61
Principal
Amount
Fair Value
EUR ‘000
Fund
%
800,000 1.125% due 03/06/22 ....... 801 0.27
230,000 0.750% due 26/10/22 ....... 235 0.08
800,000 4.125% due 20/03/23 ....... 831 0.28
EUR 180,000 1.250% due 03/03/25 ....... 177 0.06
NGG Finance Plc
260,000 4.250% due 18/06/76 ....... 272 0.09
Pearson Funding Five Plc
170,000 1.375% due 06/05/25 ....... 165 0.06
Rolls-Royce Plc
300,000 2.125% due 18/06/21 ....... 321 0.11
Royal Bank of Scotland
Group Plc
1,000,000 1.625% due 25/06/19 ....... 1,017 0.35
752,000 2.500% due 22/03/23 ....... 750 0.26
480,000 3.625% due 25/03/24 ....... 467 0.16
USD 500,000 4.800% due 05/04/26 ....... 441 0.15
Royal Bank of Scotland Plc
EUR 700,000 6.934% due 09/04/18 ....... 770 0.26
Sky Plc
200,000 1.500% due 15/09/21 ....... 205 0.07
200,000 1.875% due 24/11/23 ....... 206 0.07
610,000 2.250% due 17/11/25 ....... 634 0.22
750,000 2.500% due 15/09/26 ....... 795 0.27
Standard Chartered Plc
270,000 3.625% due 23/11/22 ....... 263 0.09
620,000 3.125% due 19/11/24 ....... 572 0.20
Tesco Property Finance 3 Plc
GBP 225,956 5.744% due 13/04/40 ....... 260 0.09
Virgin Media Secured
Finance Plc
290,000 5.500% due 15/01/21 ....... 389 0.13
Vodafone Group Plc
EUR 100,000 1.750% due 25/08/23 ....... 104 0.04
390,000 2.200% due 25/08/26 ....... 408 0.14
Yorkshire Building Society
510,000 1.250% due 17/03/22 ....... 498 0.17
Zurich Finance UK Plc
GBP 750,000 6.625% * .......................... 1,022 0.35
24,091 8.24
United States (3.72%)
Albemarle Corp
EUR 550,000 1.875% due 08/12/21 ....... 546 0.19
Anheuser-Busch InBev
Finance Inc
USD 570,000 4.900% due 01/02/46 ....... 560 0.19
AT&T Inc
EUR 200,000 3.550% due 17/12/32 ....... 230 0.08
Bank of America
Corp
100,000 2.500% due 27/07/20 ....... 108 0.04
450,000 1.375% due 10/09/21 ....... 459 0.16
100,000 1.625% due 14/09/22 ....... 103 0.04
Principal
Amount
Fair Value
EUR ‘000
Fund
%
Berkshire Hathaway
Inc
350,000 1.125% due 16/03/27 ...... 334 0.11
Citigroup Inc
160,000 7.375% due 04/09/19 ...... 197 0.07
430,000 1.750% due 28/01/25 ...... 436 0.15
300,000 2.125% due 10/09/26 ...... 308 0.11
Coca-Cola Co
100,000 1.625% due 09/03/35 ...... 100 0.03
General Electric Co
360,000 1.875% due 28/05/27 ...... 387 0.13
General Mills Inc
100,000 1.000% due 27/04/23 ...... 101 0.03
Goldman Sachs Group
Inc
175,000 4.750% due 12/10/21 ...... 204 0.07
EUR 100,000 1.375% due 26/07/22 ...... 102 0.04
570,000 2.000% due 27/07/23 ...... 589 0.20
500,000 2.125% due 30/09/24 ...... 519 0.18
200,000 3.000% due 12/02/31 ...... 212 0.07
JPMorgan Chase & Co
120,000 1.375% due 16/09/21 ...... 124 0.04
McDonald's Corp
300,000 2.625% due 11/06/29 ...... 335 0.11
Mondelez International
Inc
670,000 2.375% due 06/03/35 ...... 653 0.22
Morgan Stanley
100,000 1.750% due 11/03/24 ...... 101 0.03
MPT Operating Partnership
LP
200,000 4.000% due 19/08/22 ...... 207 0.07
Priceline Group Inc
200,000 2.150% due 25/11/22 ...... 207 0.07
1,100,000 1.800% due 03/03/27 ...... 1,025 0.35
Prologis LP
900,000 3.000% due 02/06/26 ...... 985 0.34
Verizon Communications
Inc
170,000 3.250% due 17/02/26 ...... 201 0.07
USD 384,000 6.550% due 15/09/43 ...... 445 0.15
653,000 5.012% due 21/08/54 ...... 577 0.20
Wells Fargo & Co
EUR 150,000 2.250% due 02/05/23 ...... 163 0.06
347,000 1.625% due 02/06/25 ...... 358 0.12
10,876 3.72
Virgin Islands, British (0.04%)
Global Switch Holdings
Ltd
100,000 5.500% due 18/04/18 ...... 110 0.04
Total Long Term Bonds
and Notes ........................... 264,778 90.55
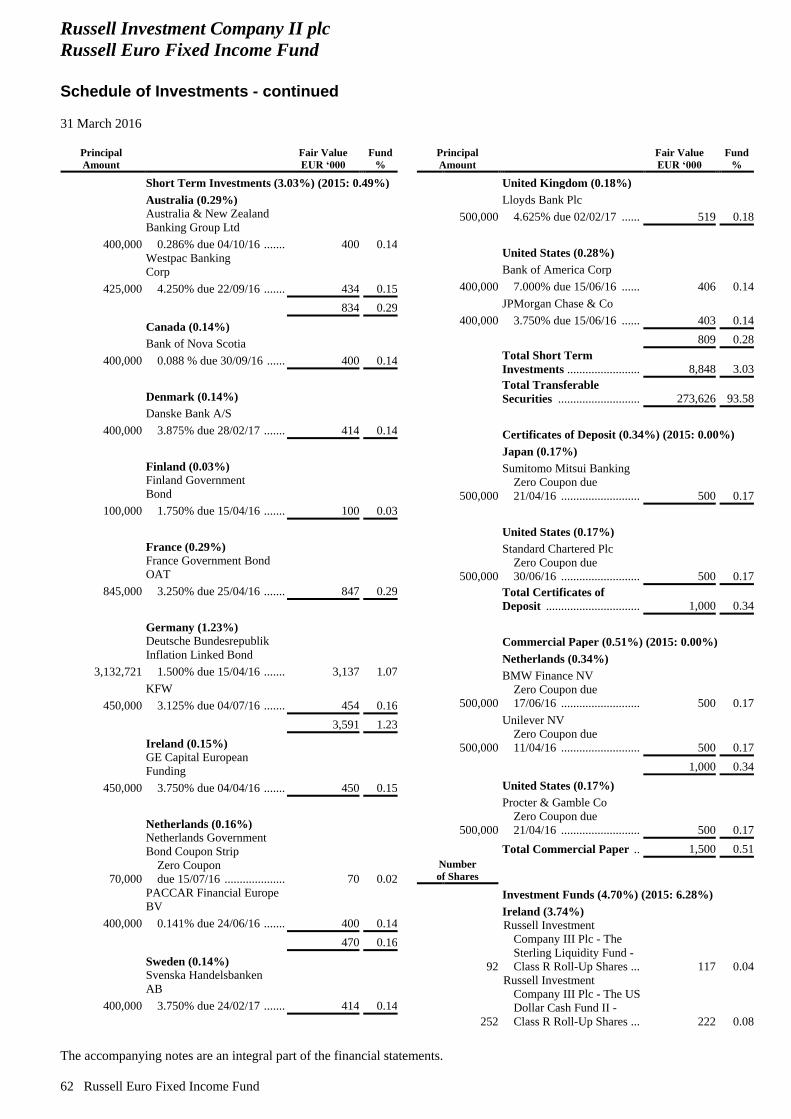
Russell Investment Company II plc
Russell Euro Fixed Income Fund
Schedule of Investments - continued
31 March 2016
The accompanying notes are an integral part of the financial statements.
62 Russell Euro Fixed Income Fund
Principal
Amount
Fair Value
EUR ‘000
Fund
%
Short Term Investments (3.03%) (2015: 0.49%)
Australia (0.29%)
Australia & New Zealand
Banking Group Ltd
400,000 0.286% due 04/10/16 ....... 400 0.14
Westpac Banking
Corp
425,000 4.250% due 22/09/16 ....... 434 0.15
834 0.29
Canada (0.14%)
Bank of Nova Scotia
400,000 0.088 % due 30/09/16 ...... 400 0.14
Denmark (0.14%)
Danske Bank A/S
400,000 3.875% due 28/02/17 ....... 414 0.14
Finland (0.03%)
Finland Government
Bond
100,000 1.750% due 15/04/16 ....... 100 0.03
France (0.29%)
France Government Bond
OAT
845,000 3.250% due 25/04/16 ....... 847 0.29
Germany (1.23%)
Deutsche Bundesrepublik
Inflation Linked Bond
3,132,721 1.500% due 15/04/16 ....... 3,137 1.07
KFW
450,000 3.125% due 04/07/16 ....... 454 0.16
3,591 1.23
Ireland (0.15%)
GE Capital European
Funding
450,000 3.750% due 04/04/16 ....... 450 0.15
Netherlands (0.16%)
Netherlands Government
Bond Coupon Strip
70,000
Zero Coupon
due 15/07/16 .................... 70 0.02
PACCAR Financial Europe
BV
400,000 0.141% due 24/06/16 ....... 400 0.14
470 0.16
Sweden (0.14%)
Svenska Handelsbanken
AB
400,000 3.750% due 24/02/17 ....... 414 0.14
Principal
Amount
Fair Value
EUR ‘000
Fund
%
United Kingdom (0.18%)
Lloyds Bank Plc
500,000 4.625% due 02/02/17 ...... 519 0.18
United States (0.28%)
Bank of America Corp
400,000 7.000% due 15/06/16 ...... 406 0.14
JPMorgan Chase & Co
400,000 3.750% due 15/06/16 ...... 403 0.14
809 0.28
Total Short Term
Investments ........................ 8,848 3.03
Total Transferable
Securities ........................... 273,626 93.58
Certificates of Deposit (0.34%) (2015: 0.00%)
Japan (0.17%)
Sumitomo Mitsui Banking
500,000
Zero Coupon due
21/04/16 .......................... 500 0.17
United States (0.17%)
Standard Chartered Plc
500,000
Zero Coupon due
30/06/16 .......................... 500 0.17
Total Certificates of
Deposit ............................... 1,000 0.34
Commercial Paper (0.51%) (2015: 0.00%)
Netherlands (0.34%)
BMW Finance NV
500,000
Zero Coupon due
17/06/16 .......................... 500 0.17
Unilever NV
500,000
Zero Coupon due
11/04/16 .......................... 500 0.17
1,000 0.34
United States (0.17%)
Procter & Gamble Co
500,000
Zero Coupon due
21/04/16 .......................... 500 0.17
Total Commercial Paper .. 1,500 0.51
Number
of Shares
Investment Funds (4.70%) (2015: 6.28%)
Ireland (3.74%)
92
Russell Investment
Company III Plc - The
Sterling Liquidity Fund -
Class R Roll-Up Shares ... 117 0.04
252
Russell Investment
Company III Plc - The US
Dollar Cash Fund II -
Class R Roll-Up Shares ... 222 0.08
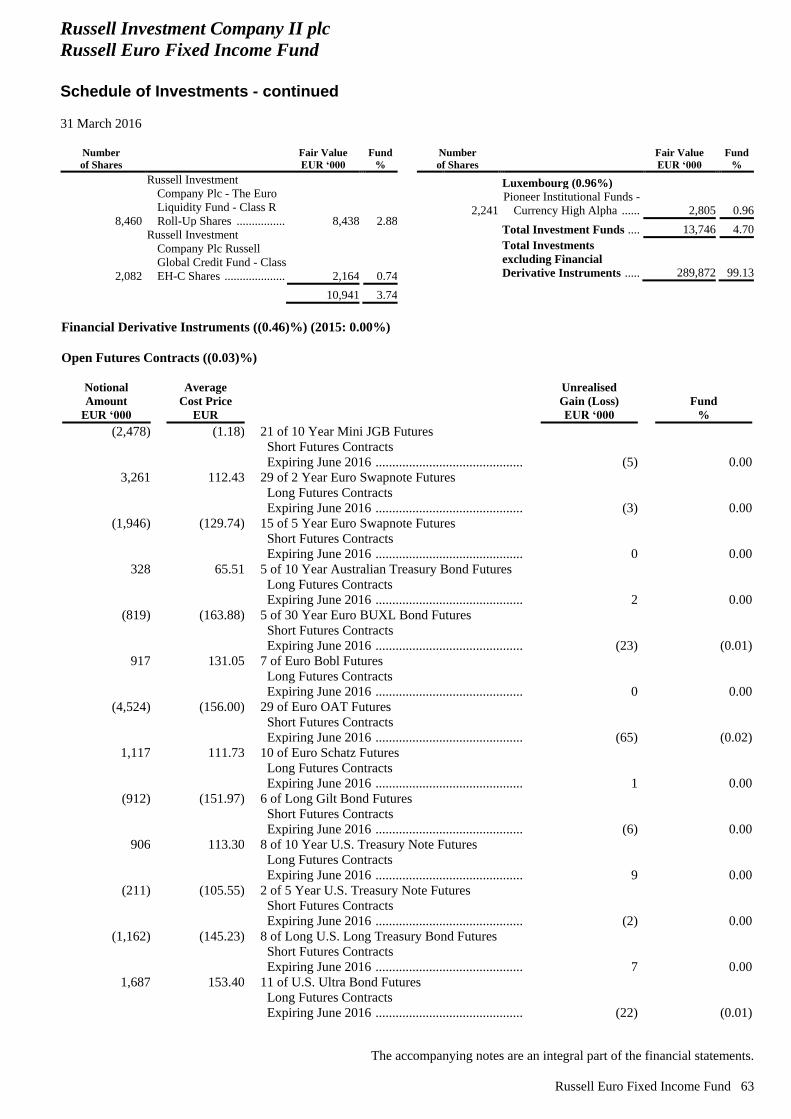
Russell Investment Company II plc
Russell Euro Fixed Income Fund
Schedule of Investments - continued
31 March 2016
The accompanying notes are an integral part of the financial statements.
Russell Euro Fixed Income Fund 63
Number
of Shares
Fair Value
EUR ‘000
Fund
%
8,460
Russell Investment
Company Plc - The Euro
Liquidity Fund - Class R
Roll-Up Shares ................ 8,438 2.88
2,082
Russell Investment
Company Plc Russell
Global Credit Fund - Class
EH-C Shares .................... 2,164 0.74
10,941 3.74
Number
of Shares
Fair Value
EUR ‘000
Fund
%
Luxembourg (0.96%)
2,241
Pioneer Institutional Funds -
Currency High Alpha ...... 2,805 0.96
Total Investment Funds .... 13,746 4.70
Total Investments
excluding Financial
Derivative Instruments ..... 289,872 99.13
Financial Derivative Instruments ((0.46)%) (2015: 0.00%)
Open Futures Contracts ((0.03)%)
Notional
Amount
EUR ‘000
Average
Cost Price
EUR
Unrealised
Gain (Loss)
EUR ‘000
Fund
%
(2,478)
(1.18)
21 of 10 Year Mini JGB Futures
Short Futures Contracts
Expiring June 2016 ...........................................................................................................
(5) 0.00
3,261
112.43
29 of 2 Year Euro Swapnote Futures
Long Futures Contracts
Expiring June 2016 ...........................................................................................................
(3) 0.00
(1,946)
(129.74)
15 of 5 Year Euro Swapnote Futures
Short Futures Contracts
Expiring June 2016 ...........................................................................................................
0 0.00
328
65.51
5 of 10 Year Australian Treasury Bond Futures
Long Futures Contracts
Expiring June 2016 ...........................................................................................................
2 0.00
(819)
(163.88)
5 of 30 Year Euro BUXL Bond Futures
Short Futures Contracts
Expiring June 2016 ...........................................................................................................
(23) (0.01)
917
131.05
7 of Euro Bobl Futures
Long Futures Contracts
Expiring June 2016 ...........................................................................................................
0 0.00
(4,524)
(156.00)
29 of Euro OAT Futures
Short Futures Contracts
Expiring June 2016 ...........................................................................................................
(65) (0.02)
1,117
111.73
10 of Euro Schatz Futures
Long Futures Contracts
Expiring June 2016 ...........................................................................................................
1 0.00
(912)
(151.97)
6 of Long Gilt Bond Futures
Short Futures Contracts
Expiring June 2016 ...........................................................................................................
(6) 0.00
906
113.30
8 of 10 Year U.S. Treasury Note Futures
Long Futures Contracts
Expiring June 2016 ...........................................................................................................
9 0.00
(211)
(105.55)
2 of 5 Year U.S. Treasury Note Futures
Short Futures Contracts
Expiring June 2016 ...........................................................................................................
(2) 0.00
(1,162)
(145.23)
8 of Long U.S. Long Treasury Bond Futures
Short Futures Contracts
Expiring June 2016 ...........................................................................................................
7 0.00
1,687
153.40
11 of U.S. Ultra Bond Futures
Long Futures Contracts
Expiring June 2016 ...........................................................................................................
(22) (0.01)
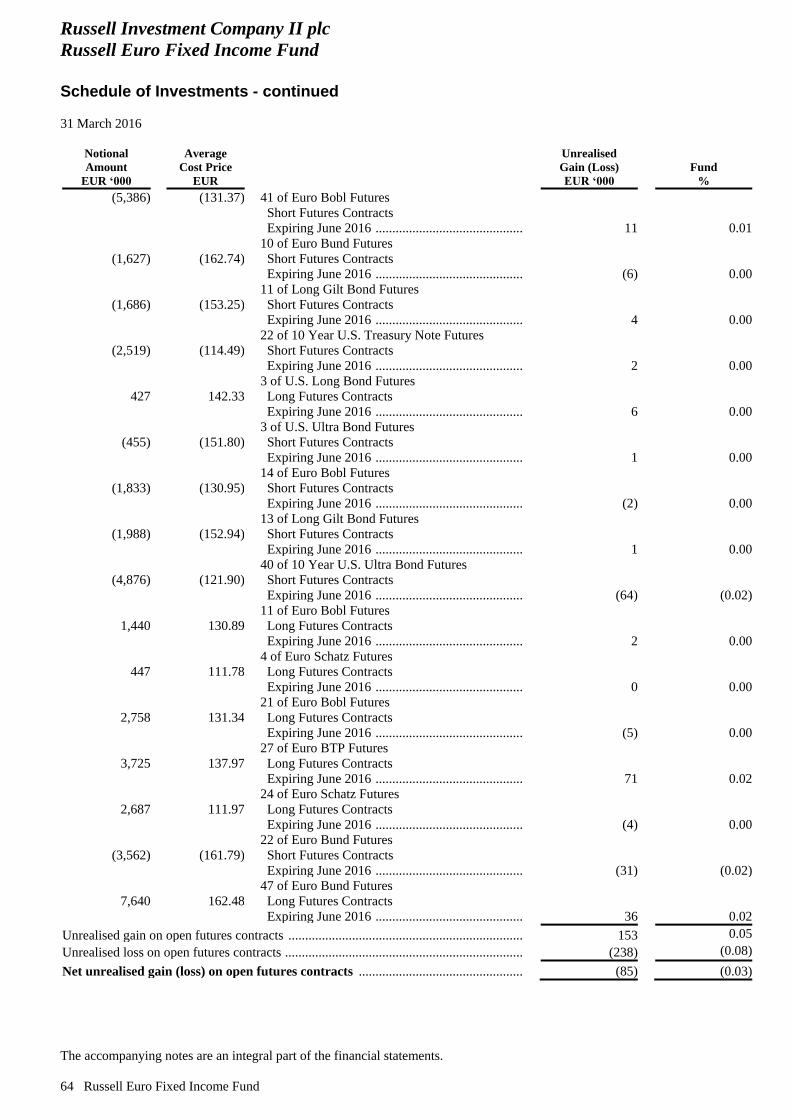
Russell Investment Company II plc
Russell Euro Fixed Income Fund
Schedule of Investments - continued
31 March 2016
The accompanying notes are an integral part of the financial statements.
64 Russell Euro Fixed Income Fund
Notional
Amount
EUR ‘000
Average
Cost Price
EUR
Unrealised
Gain (Loss)
EUR ‘000
Fund
%
(5,386)
(131.37)
41 of Euro Bobl Futures
Short Futures Contracts
Expiring June 2016 ...........................................................................................................
11 0.01
(1,627)
(162.74)
10 of Euro Bund Futures
Short Futures Contracts
Expiring June 2016 ...........................................................................................................
(6) 0.00
(1,686)
(153.25)
11 of Long Gilt Bond Futures
Short Futures Contracts
Expiring June 2016 ...........................................................................................................
4 0.00
(2,519)
(114.49)
22 of 10 Year U.S. Treasury Note Futures
Short Futures Contracts
Expiring June 2016 ...........................................................................................................
2 0.00
427
142.33
3 of U.S. Long Bond Futures
Long Futures Contracts
Expiring June 2016 ...........................................................................................................
6 0.00
(455)
(151.80)
3 of U.S. Ultra Bond Futures
Short Futures Contracts
Expiring June 2016 ...........................................................................................................
1 0.00
(1,833)
(130.95)
14 of Euro Bobl Futures
Short Futures Contracts
Expiring June 2016 ...........................................................................................................
(2) 0.00
(1,988)
(152.94)
13 of Long Gilt Bond Futures
Short Futures Contracts
Expiring June 2016 ...........................................................................................................
1 0.00
(4,876)
(121.90)
40 of 10 Year U.S. Ultra Bond Futures
Short Futures Contracts
Expiring June 2016 ...........................................................................................................
(64) (0.02)
1,440
130.89
11 of Euro Bobl Futures
Long Futures Contracts
Expiring June 2016 ...........................................................................................................
2 0.00
447
111.78
4 of Euro Schatz Futures
Long Futures Contracts
Expiring June 2016 ...........................................................................................................
0 0.00
2,758
131.34
21 of Euro Bobl Futures
Long Futures Contracts
Expiring June 2016 ...........................................................................................................
(5) 0.00
3,725
137.97
27 of Euro BTP Futures
Long Futures Contracts
Expiring June 2016 ...........................................................................................................
71 0.02
2,687
111.97
24 of Euro Schatz Futures
Long Futures Contracts
Expiring June 2016 ...........................................................................................................
(4) 0.00
(3,562)
(161.79)
22 of Euro Bund Futures
Short Futures Contracts
Expiring June 2016 ...........................................................................................................
(31) (0.02)
7,640
162.48
47 of Euro Bund Futures
Long Futures Contracts
Expiring June 2016 ...........................................................................................................
36 0.02
Unrealised gain on open futures contracts ......................................................................... 153 0.05
Unrealised loss on open futures contracts .......................................................................... (238) (0.08)
Net unrealised gain (loss) on open futures contracts .................................................... (85) (0.03)
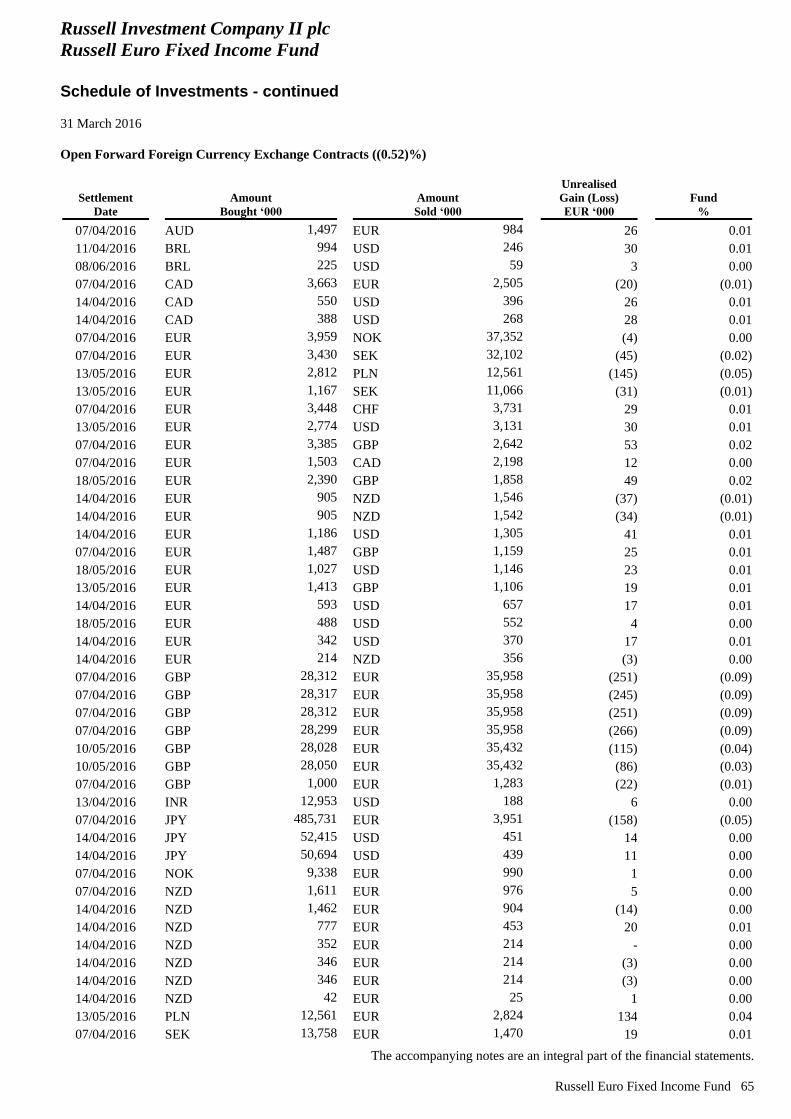
Russell Investment Company II plc
Russell Euro Fixed Income Fund
Schedule of Investments - continued
31 March 2016
The accompanying notes are an integral part of the financial statements.
Russell Euro Fixed Income Fund 65
Open Forward Foreign Currency Exchange Contracts ((0.52)%)
Settlement
Date
Amount
Bought ‘000
Amount
Sold ‘000
Unrealised
Gain (Loss)
EUR ‘000
Fund
%
07/04/2016 AUD 1,497 EUR 984 26 0.01
11/04/2016 BRL 994 USD 246 30 0.01
08/06/2016 BRL 225 USD 59 3 0.00
07/04/2016 CAD 3,663 EUR 2,505 (20) (0.01)
14/04/2016 CAD 550 USD 396 26 0.01
14/04/2016 CAD 388 USD 268 28 0.01
07/04/2016 EUR 3,959 NOK 37,352 (4) 0.00
07/04/2016 EUR 3,430 SEK 32,102 (45) (0.02)
13/05/2016 EUR 2,812 PLN 12,561 (145) (0.05)
13/05/2016 EUR 1,167 SEK 11,066 (31) (0.01)
07/04/2016 EUR 3,448 CHF 3,731 29 0.01
13/05/2016 EUR 2,774 USD 3,131 30 0.01
07/04/2016 EUR 3,385 GBP 2,642 53 0.02
07/04/2016 EUR 1,503 CAD 2,198 12 0.00
18/05/2016 EUR 2,390 GBP 1,858 49 0.02
14/04/2016 EUR 905 NZD 1,546 (37) (0.01)
14/04/2016 EUR 905 NZD 1,542 (34) (0.01)
14/04/2016 EUR 1,186 USD 1,305 41 0.01
07/04/2016 EUR 1,487 GBP 1,159 25 0.01
18/05/2016 EUR 1,027 USD 1,146 23 0.01
13/05/2016 EUR 1,413 GBP 1,106 19 0.01
14/04/2016 EUR 593 USD 657 17 0.01
18/05/2016 EUR 488 USD 552 4 0.00
14/04/2016 EUR 342 USD 370 17 0.01
14/04/2016 EUR 214 NZD 356 (3) 0.00
07/04/2016 GBP 28,312 EUR 35,958 (251) (0.09)
07/04/2016 GBP 28,317 EUR 35,958 (245) (0.09)
07/04/2016 GBP 28,312 EUR 35,958 (251) (0.09)
07/04/2016 GBP 28,299 EUR 35,958 (266) (0.09)
10/05/2016 GBP 28,028 EUR 35,432 (115) (0.04)
10/05/2016 GBP 28,050 EUR 35,432 (86) (0.03)
07/04/2016 GBP 1,000 EUR 1,283 (22) (0.01)
13/04/2016 INR 12,953 USD 188 6 0.00
07/04/2016 JPY 485,731 EUR 3,951 (158) (0.05)
14/04/2016 JPY 52,415 USD 451 14 0.00
14/04/2016 JPY 50,694 USD 439 11 0.00
07/04/2016 NOK 9,338 EUR 990 1 0.00
07/04/2016 NZD 1,611 EUR 976 5 0.00
14/04/2016 NZD 1,462 EUR 904 (14) 0.00
14/04/2016 NZD 777 EUR 453 20 0.01
14/04/2016 NZD 352 EUR 214 - 0.00
14/04/2016 NZD 346 EUR 214 (3) 0.00
14/04/2016 NZD 346 EUR 214 (3) 0.00
14/04/2016 NZD 42 EUR 25 1 0.00
13/05/2016 PLN 12,561 EUR 2,824 134 0.04
07/04/2016 SEK 13,758 EUR 1,470 19 0.01
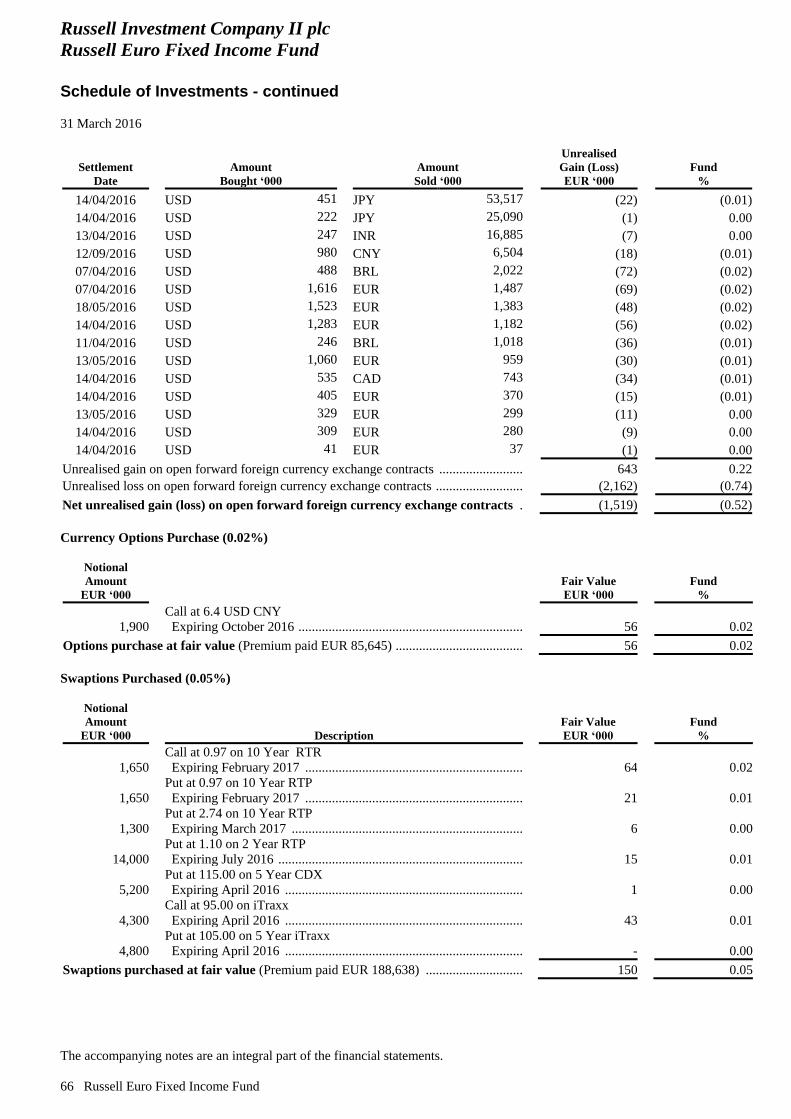
Russell Investment Company II plc
Russell Euro Fixed Income Fund
Schedule of Investments - continued
31 March 2016
The accompanying notes are an integral part of the financial statements.
66 Russell Euro Fixed Income Fund
Settlement
Date
Amount
Bought ‘000
Amount
Sold ‘000
Unrealised
Gain (Loss)
EUR ‘000
Fund
%
14/04/2016 USD 451 JPY 53,517 (22) (0.01)
14/04/2016 USD 222 JPY 25,090 (1) 0.00
13/04/2016 USD 247 INR 16,885 (7) 0.00
12/09/2016 USD 980 CNY 6,504 (18) (0.01)
07/04/2016 USD 488 BRL 2,022 (72) (0.02)
07/04/2016 USD 1,616 EUR 1,487 (69) (0.02)
18/05/2016 USD 1,523 EUR 1,383 (48) (0.02)
14/04/2016 USD 1,283 EUR 1,182 (56) (0.02)
11/04/2016 USD 246 BRL 1,018 (36) (0.01)
13/05/2016 USD 1,060 EUR 959 (30) (0.01)
14/04/2016 USD 535 CAD 743 (34) (0.01)
14/04/2016 USD 405 EUR 370 (15) (0.01)
13/05/2016 USD 329 EUR 299 (11) 0.00
14/04/2016 USD 309 EUR 280 (9) 0.00
14/04/2016 USD 41 EUR 37 (1) 0.00
Unrealised gain on open forward foreign currency exchange contracts ............................... 643 0.22
Unrealised loss on open forward foreign currency exchange contracts ................................ (2,162) (0.74)
Net unrealised gain (loss) on open forward foreign currency exchange contracts ....... (1,519) (0.52)
Currency Options Purchase (0.02%)
Notional
Amount
EUR ‘000
Fair Value
EUR ‘000
Fund
%
1,900
Call at 6.4 USD CNY
Expiring October 2016 ................................................................................................................ 56 0.02
Options purchase at fair value (Premium paid EUR 85,645) ..................................................... 56 0.02
Swaptions Purchased (0.05%)
Notional
Amount
EUR ‘000 Description
Fair Value
EUR ‘000
Fund
%
1,650
Call at 0.97 on 10 Year RTR
Expiring February 2017 .............................................................................................................. 64 0.02
1,650
Put at 0.97 on 10 Year RTP
Expiring February 2017 .............................................................................................................. 21 0.01
1,300
Put at 2.74 on 10 Year RTP
Expiring March 2017 .................................................................................................................. 6 0.00
14,000
Put at 1.10 on 2 Year RTP
Expiring July 2016 ...................................................................................................................... 15 0.01
5,200
Put at 115.00 on 5 Year CDX
Expiring April 2016 .................................................................................................................... 1 0.00
4,300
Call at 95.00 on iTraxx
Expiring April 2016 .................................................................................................................... 43 0.01
4,800
Put at 105.00 on 5 Year iTraxx
Expiring April 2016 .................................................................................................................... - 0.00
Swaptions purchased at fair value (Premium paid EUR 188,638) ............................................ 150 0.05
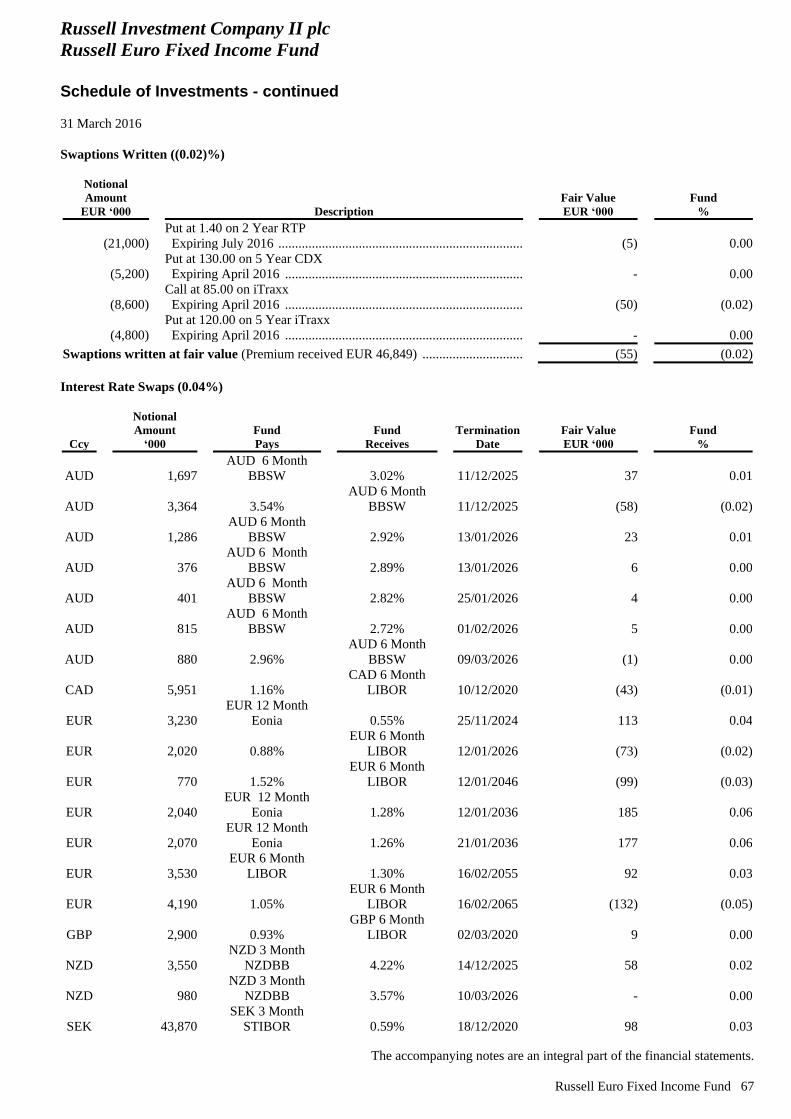
Russell Investment Company II plc
Russell Euro Fixed Income Fund
Schedule of Investments - continued
31 March 2016
The accompanying notes are an integral part of the financial statements.
Russell Euro Fixed Income Fund 67
Swaptions Written ((0.02)%)
Notional
Amount
EUR ‘000 Description
Fair Value
EUR ‘000
Fund
%
(21,000)
Put at 1.40 on 2 Year RTP
Expiring July 2016 ...................................................................................................................... (5) 0.00
(5,200)
Put at 130.00 on 5 Year CDX
Expiring April 2016 .................................................................................................................... - 0.00
(8,600)
Call at 85.00 on iTraxx
Expiring April 2016 .................................................................................................................... (50) (0.02)
(4,800)
Put at 120.00 on 5 Year iTraxx
Expiring April 2016 .................................................................................................................... - 0.00
Swaptions written at fair value (Premium received EUR 46,849) ............................................. (55) (0.02)
Interest Rate Swaps (0.04%)
Ccy
Notional
Amount
‘000
Fund
Pays
Fund
Receives
Termination
Date
Fair Value
EUR ‘000
Fund
%
AUD
1,697 AUD 6 Month
BBSW 3.02% 11/12/2025 37 0.01
AUD
3,364 3.54% AUD 6 Month
BBSW 11/12/2025 (58) (0.02)
AUD
1,286 AUD 6 Month
BBSW 2.92% 13/01/2026 23 0.01
AUD
376 AUD 6 Month
BBSW 2.89% 13/01/2026 6 0.00
AUD
401 AUD 6 Month
BBSW 2.82% 25/01/2026 4 0.00
AUD
815 AUD 6 Month
BBSW 2.72% 01/02/2026 5 0.00
AUD
880 2.96% AUD 6 Month
BBSW 09/03/2026 (1) 0.00
CAD
5,951 1.16% CAD 6 Month
LIBOR 10/12/2020 (43) (0.01)
EUR
3,230 EUR 12 Month
Eonia 0.55% 25/11/2024 113 0.04
EUR
2,020 0.88% EUR 6 Month
LIBOR 12/01/2026 (73) (0.02)
EUR
770 1.52% EUR 6 Month
LIBOR 12/01/2046 (99) (0.03)
EUR
2,040 EUR 12 Month
Eonia 1.28% 12/01/2036 185 0.06
EUR
2,070 EUR 12 Month
Eonia 1.26% 21/01/2036 177 0.06
EUR
3,530 EUR 6 Month
LIBOR 1.30% 16/02/2055 92 0.03
EUR
4,190 1.05% EUR 6 Month
LIBOR 16/02/2065 (132) (0.05)
GBP
2,900 0.93% GBP 6 Month
LIBOR 02/03/2020 9 0.00
NZD
3,550 NZD 3 Month
NZDBB 4.22% 14/12/2025 58 0.02
NZD
980 NZD 3 Month
NZDBB 3.57% 10/03/2026 - 0.00
SEK
43,870 SEK 3 Month
STIBOR 0.59% 18/12/2020 98 0.03
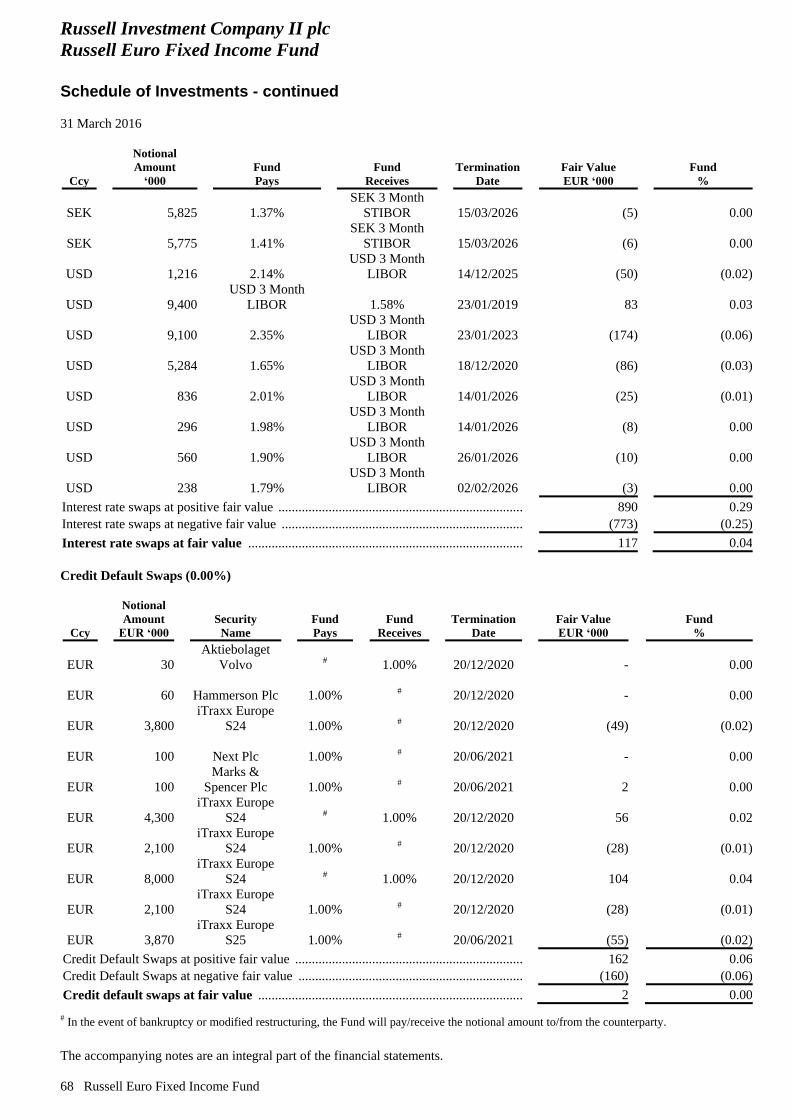
Russell Investment Company II plc
Russell Euro Fixed Income Fund
Schedule of Investments - continued
31 March 2016
The accompanying notes are an integral part of the financial statements.
68 Russell Euro Fixed Income Fund
Ccy
Notional
Amount
‘000
Fund
Pays
Fund
Receives
Termination
Date
Fair Value
EUR ‘000
Fund
%
SEK
5,825 1.37% SEK 3 Month
STIBOR 15/03/2026 (5) 0.00
SEK
5,775 1.41% SEK 3 Month
STIBOR 15/03/2026 (6) 0.00
USD
1,216 2.14% USD 3 Month
LIBOR 14/12/2025 (50) (0.02)
USD
9,400 USD 3 Month
LIBOR 1.58% 23/01/2019 83 0.03
USD
9,100 2.35% USD 3 Month
LIBOR 23/01/2023 (174) (0.06)
USD
5,284 1.65% USD 3 Month
LIBOR 18/12/2020 (86) (0.03)
USD
836 2.01% USD 3 Month
LIBOR 14/01/2026 (25) (0.01)
USD
296 1.98% USD 3 Month
LIBOR 14/01/2026 (8) 0.00
USD
560 1.90% USD 3 Month
LIBOR 26/01/2026 (10) 0.00
USD
238 1.79% USD 3 Month
LIBOR 02/02/2026 (3) 0.00
Interest rate swaps at positive fair value ........................................................................................ 890 0.29
Interest rate swaps at negative fair value ....................................................................................... (773) (0.25)
Interest rate swaps at fair value ................................................................................................. 117 0.04
Credit Default Swaps (0.00%)
Ccy
Notional
Amount
EUR ‘000
Security
Name
Fund
Pays
Fund
Receives
Termination
Date
Fair Value
EUR ‘000
Fund
%
EUR
30 Aktiebolaget
Volvo # 1.00% 20/12/2020 - 0.00
EUR
60 Hammerson Plc 1.00% # 20/12/2020 - 0.00
EUR
3,800 iTraxx Europe
S24 1.00% # 20/12/2020 (49) (0.02)
EUR
100 Next Plc 1.00% # 20/06/2021 - 0.00
EUR
100 Marks &
Spencer Plc 1.00% # 20/06/2021 2 0.00
EUR
4,300 iTraxx Europe
S24 # 1.00% 20/12/2020 56 0.02
EUR
2,100 iTraxx Europe
S24 1.00% # 20/12/2020 (28) (0.01)
EUR
8,000 iTraxx Europe
S24 # 1.00% 20/12/2020 104 0.04
EUR
2,100 iTraxx Europe
S24 1.00% # 20/12/2020 (28) (0.01)
EUR
3,870 iTraxx Europe
S25 1.00% # 20/06/2021 (55) (0.02)
Credit Default Swaps at positive fair value .................................................................................................. 162 0.06
Credit Default Swaps at negative fair value ................................................................................................. (160) (0.06)
Credit default swaps at fair value ............................................................................................................. 2 0.00 # In the event of bankruptcy or modified restructuring, the Fund will pay/receive the notional amount to/from the counterparty.
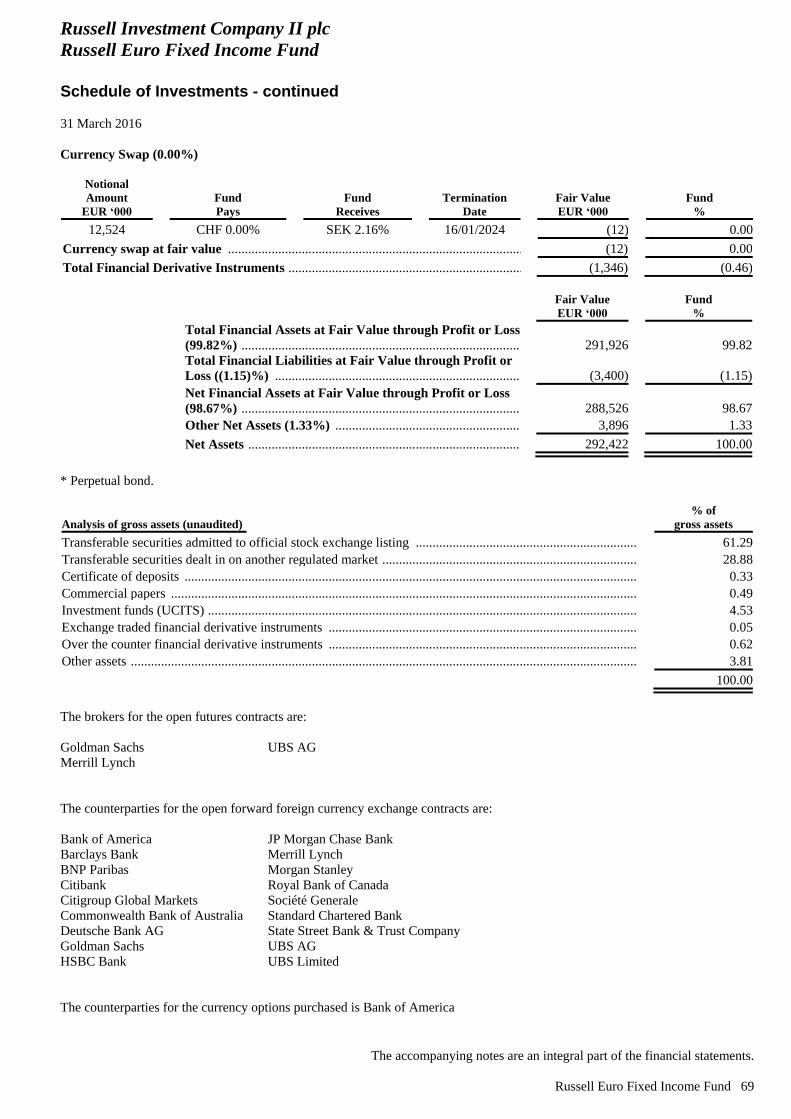
Russell Investment Company II plc
Russell Euro Fixed Income Fund
Schedule of Investments - continued
31 March 2016
The accompanying notes are an integral part of the financial statements.
Russell Euro Fixed Income Fund 69
Currency Swap (0.00%)
Notional
Amount
EUR ‘000
Fund
Pays
Fund
Receives
Termination
Date
Fair Value
EUR ‘000
Fund
%
12,524 CHF 0.00% SEK 2.16% 16/01/2024 (12) 0.00
Currency swap at fair value ...................................................................................................................... (12) 0.00
Total Financial Derivative Instruments .................................................................................................... (1,346) (0.46)
Fair Value
EUR ‘000
Fund
%
Total Financial Assets at Fair Value through Profit or Loss
(99.82%) .................................................................................................................................................... 291,926 99.82
Total Financial Liabilities at Fair Value through Profit or
Loss ((1.15)%) .......................................................................................................................................... (3,400) (1.15)
Net Financial Assets at Fair Value through Profit or Loss
(98.67%) .................................................................................................................................................... 288,526 98.67
Other Net Assets (1.33%) ........................................................................................................................ 3,896 1.33
Net Assets .................................................................................................................................................. 292,422 100.00
* Perpetual bond.
Analysis of gross assets (unaudited)
% of
gross assets
Transferable securities admitted to official stock exchange listing ............................................................................ 61.29
Transferable securities dealt in on another regulated market ...................................................................................... 28.88
Certificate of deposits ................................................................................................................................................. 0.33
Commercial papers ..................................................................................................................................................... 0.49
Investment funds (UCITS) .......................................................................................................................................... 4.53
Exchange traded financial derivative instruments ...................................................................................................... 0.05
Over the counter financial derivative instruments ...................................................................................................... 0.62
Other assets ................................................................................................................................................................. 3.81
100.00
The brokers for the open futures contracts are:
Goldman Sachs
Merrill Lynch
UBS AG
The counterparties for the open forward foreign currency exchange contracts are:
Bank of America
Barclays Bank
BNP Paribas
Citibank
Citigroup Global Markets
Commonwealth Bank of Australia
Deutsche Bank AG
Goldman Sachs
HSBC Bank
JP Morgan Chase Bank
Merrill Lynch
Morgan Stanley
Royal Bank of Canada
Société Generale
Standard Chartered Bank
State Street Bank & Trust Company
UBS AG
UBS Limited
The counterparties for the currency options purchased is Bank of America
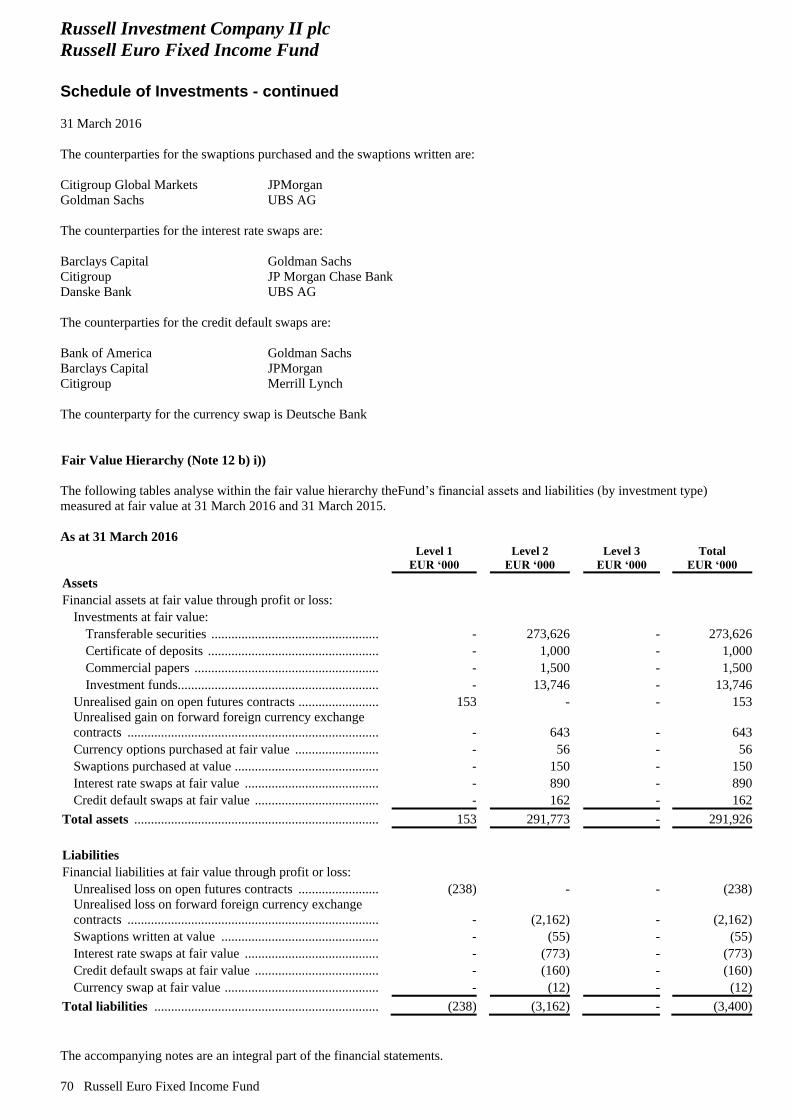
Russell Investment Company II plc
Russell Euro Fixed Income Fund
Schedule of Investments - continued
31 March 2016
The accompanying notes are an integral part of the financial statements.
70 Russell Euro Fixed Income Fund
The counterparties for the swaptions purchased and the swaptions written are:
Citigroup Global Markets
Goldman Sachs
JPMorgan
UBS AG
The counterparties for the interest rate swaps are:
Barclays Capital
Citigroup
Danske Bank
Goldman Sachs
JP Morgan Chase Bank
UBS AG
The counterparties for the credit default swaps are:
Bank of America
Barclays Capital
Citigroup
Goldman Sachs
JPMorgan
Merrill Lynch
The counterparty for the currency swap is Deutsche Bank
Fair Value Hierarchy (Note 12 b) i))
The following tables analyse within the fair value hierarchy theFund’s financial assets and liabilities (by investment type)
measured at fair value at 31 March 2016 and 31 March 2015.
As at 31 March 2016
Level 1
EUR ‘000
Level 2
EUR ‘000
Level 3
EUR ‘000
Total
EUR ‘000
Assets
Financial assets at fair value through profit or loss:
Investments at fair value:
Transferable securities ............................................................... - 273,626 - 273,626
Certificate of deposits ................................................................ - 1,000 - 1,000
Commercial papers .................................................................... - 1,500 - 1,500
Investment funds ......................................................................... - 13,746 - 13,746
Unrealised gain on open futures contracts ................................. 153 - - 153
Unrealised gain on forward foreign currency exchange
contracts .................................................................................... - 643 - 643
Currency options purchased at fair value .................................. - 56 - 56
Swaptions purchased at value .................................................... - 150 - 150
Interest rate swaps at fair value ................................................. - 890 - 890
Credit default swaps at fair value .............................................. - 162 - 162
Total assets ...................................................................................... 153 291,773 - 291,926
Liabilities
Financial liabilities at fair value through profit or loss:
Unrealised loss on open futures contracts ................................. (238) - - (238)
Unrealised loss on forward foreign currency exchange
contracts .................................................................................... - (2,162) - (2,162)
Swaptions written at value ........................................................ - (55) - (55)
Interest rate swaps at fair value ................................................. - (773) - (773)
Credit default swaps at fair value .............................................. - (160) - (160)
Currency swap at fair value ....................................................... - (12) - (12)
Total liabilities ................................................................................ (238) (3,162) - (3,400)
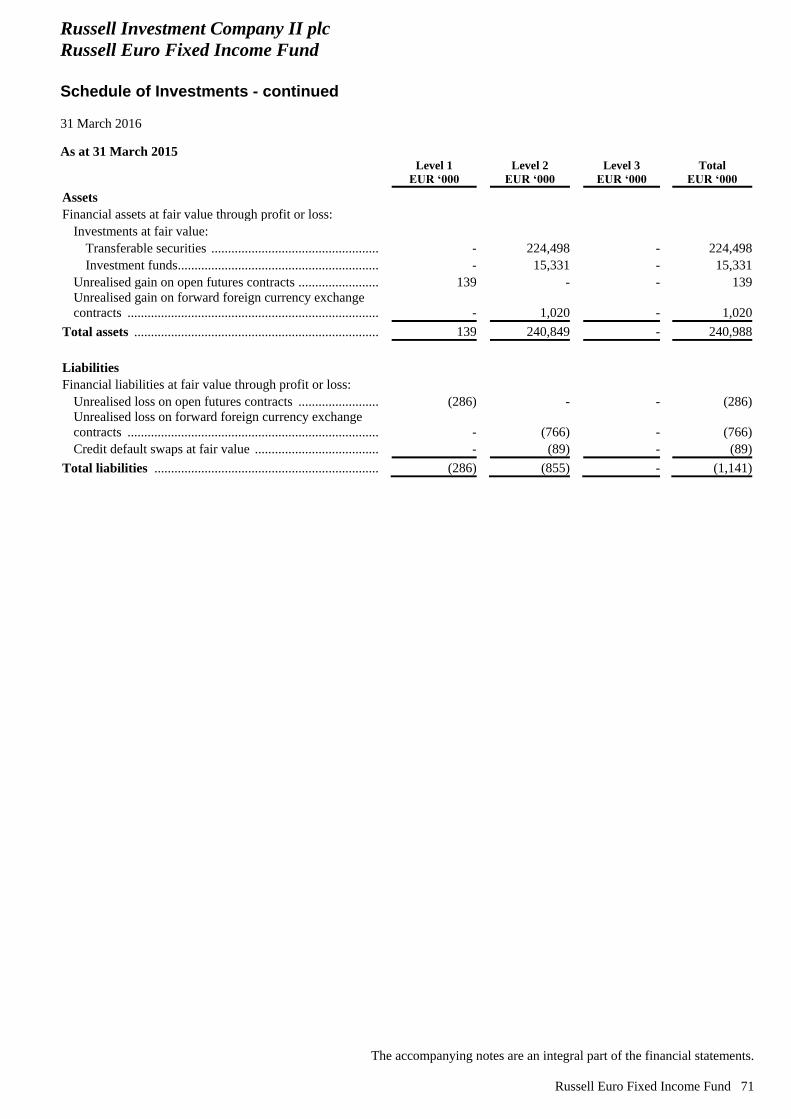
Russell Investment Company II plc
Russell Euro Fixed Income Fund
Schedule of Investments - continued
31 March 2016
The accompanying notes are an integral part of the financial statements.
Russell Euro Fixed Income Fund 71
As at 31 March 2015
Level 1
EUR ‘000
Level 2
EUR ‘000
Level 3
EUR ‘000
Total
EUR ‘000
Assets
Financial assets at fair value through profit or loss:
Investments at fair value:
Transferable securities ............................................................... - 224,498 - 224,498
Investment funds ......................................................................... - 15,331 - 15,331
Unrealised gain on open futures contracts ................................. 139 - - 139
Unrealised gain on forward foreign currency exchange
contracts .................................................................................... - 1,020 - 1,020
Total assets ...................................................................................... 139 240,849 - 240,988
Liabilities
Financial liabilities at fair value through profit or loss:
Unrealised loss on open futures contracts ................................. (286) - - (286)
Unrealised loss on forward foreign currency exchange
contracts .................................................................................... - (766) - (766)
Credit default swaps at fair value .............................................. - (89) - (89)
Total liabilities ................................................................................ (286) (855) - (1,141)
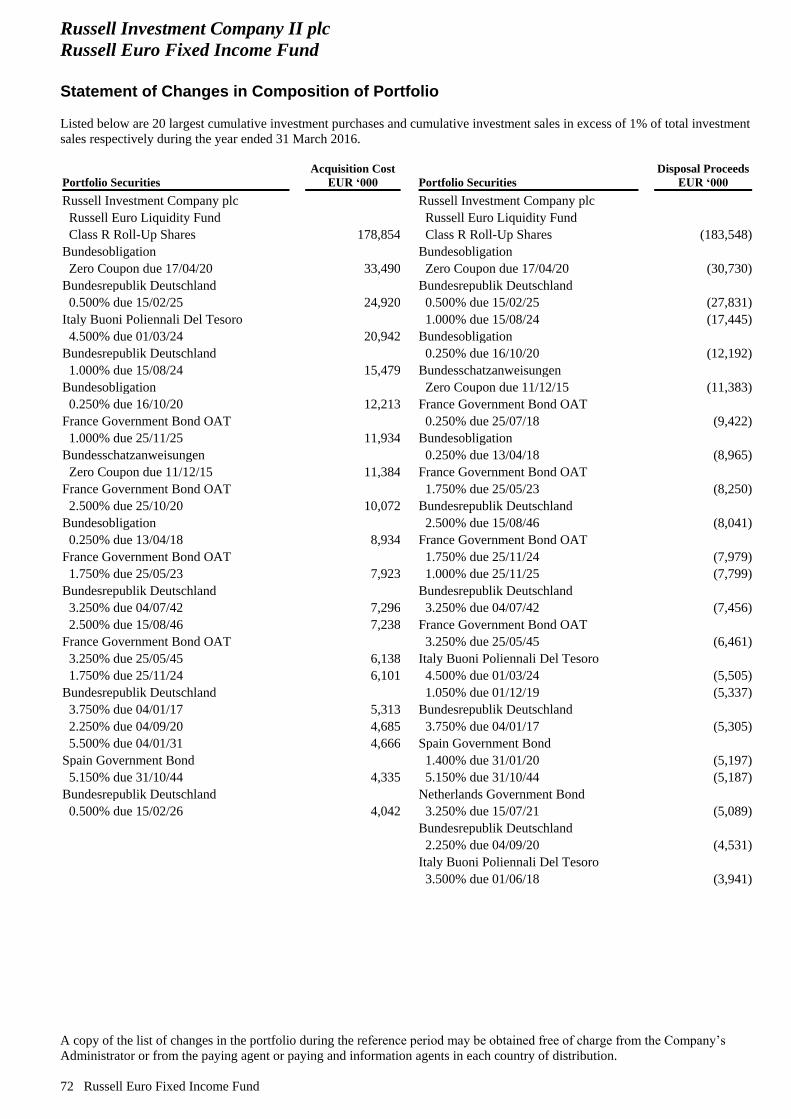
Russell Investment Company II plc
Russell Euro Fixed Income Fund
Statement of Changes in Composition of Portfolio
Listed below are 20 largest cumulative investment purchases and cumulative investment sales in excess of 1% of total investment
sales respectively during the year ended 31 March 2016.
A copy of the list of changes in the portfolio during the reference period may be obtained free of charge from the Company’s
Administrator or from the paying agent or paying and information agents in each country of distribution.
72 Russell Euro Fixed Income Fund
Portfolio Securities
Acquisition Cost
EUR ‘000 Portfolio Securities
Disposal Proceeds
EUR ‘000
Russell Investment Company plc Russell Investment Company plc
Russell Euro Liquidity Fund Russell Euro Liquidity Fund
Class R Roll-Up Shares 178,854 Class R Roll-Up Shares (183,548)
Bundesobligation Bundesobligation
Zero Coupon due 17/04/20 33,490 Zero Coupon due 17/04/20 (30,730)
Bundesrepublik Deutschland Bundesrepublik Deutschland
0.500% due 15/02/25 24,920 0.500% due 15/02/25 (27,831)
Italy Buoni Poliennali Del Tesoro 1.000% due 15/08/24 (17,445)
4.500% due 01/03/24 20,942 Bundesobligation
Bundesrepublik Deutschland 0.250% due 16/10/20 (12,192)
1.000% due 15/08/24 15,479 Bundesschatzanweisungen
Bundesobligation Zero Coupon due 11/12/15 (11,383)
0.250% due 16/10/20 12,213 France Government Bond OAT
France Government Bond OAT 0.250% due 25/07/18 (9,422)
1.000% due 25/11/25 11,934 Bundesobligation
Bundesschatzanweisungen 0.250% due 13/04/18 (8,965)
Zero Coupon due 11/12/15 11,384 France Government Bond OAT
France Government Bond OAT 1.750% due 25/05/23 (8,250)
2.500% due 25/10/20 10,072 Bundesrepublik Deutschland
Bundesobligation 2.500% due 15/08/46 (8,041)
0.250% due 13/04/18 8,934 France Government Bond OAT
France Government Bond OAT 1.750% due 25/11/24 (7,979)
1.750% due 25/05/23 7,923 1.000% due 25/11/25 (7,799)
Bundesrepublik Deutschland Bundesrepublik Deutschland
3.250% due 04/07/42 7,296 3.250% due 04/07/42 (7,456)
2.500% due 15/08/46 7,238 France Government Bond OAT
France Government Bond OAT 3.250% due 25/05/45 (6,461)
3.250% due 25/05/45 6,138 Italy Buoni Poliennali Del Tesoro
1.750% due 25/11/24 6,101 4.500% due 01/03/24 (5,505)
Bundesrepublik Deutschland 1.050% due 01/12/19 (5,337)
3.750% due 04/01/17 5,313 Bundesrepublik Deutschland
2.250% due 04/09/20 4,685 3.750% due 04/01/17 (5,305)
5.500% due 04/01/31 4,666 Spain Government Bond
Spain Government Bond 1.400% due 31/01/20 (5,197)
5.150% due 31/10/44 4,335 5.150% due 31/10/44 (5,187)
Bundesrepublik Deutschland Netherlands Government Bond
0.500% due 15/02/26 4,042 3.250% due 15/07/21 (5,089)
Bundesrepublik Deutschland
2.250% due 04/09/20 (4,531)
Italy Buoni Poliennali Del Tesoro
3.500% due 01/06/18 (3,941)
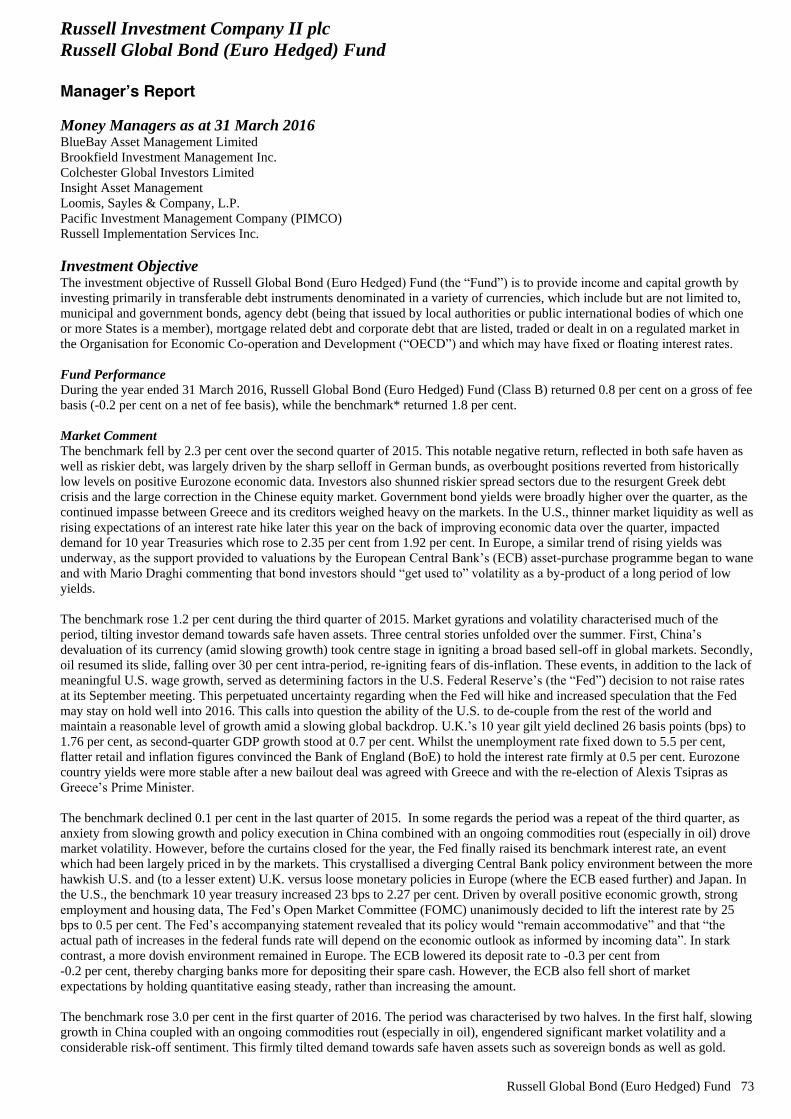
Russell Investment Company II plc
Russell Global Bond (Euro Hedged) Fund
Manager’s Report
Russell Global Bond (Euro Hedged) Fund 73
Money Managers as at 31 March 2016 BlueBay Asset Management Limited
Brookfield Investment Management Inc.
Colchester Global Investors Limited
Insight Asset Management
Loomis, Sayles & Company, L.P.
Pacific Investment Management Company (PIMCO)
Russell Implementation Services Inc.
Investment Objective The investment objective of Russell Global Bond (Euro Hedged) Fund (the “Fund”) is to provide income and capital growth by
investing primarily in transferable debt instruments denominated in a variety of currencies, which include but are not limited to,
municipal and government bonds, agency debt (being that issued by local authorities or public international bodies of which one
or more States is a member), mortgage related debt and corporate debt that are listed, traded or dealt in on a regulated market in
the Organisation for Economic Co-operation and Development (“OECD”) and which may have fixed or floating interest rates.
Fund Performance
During the year ended 31 March 2016, Russell Global Bond (Euro Hedged) Fund (Class B) returned 0.8 per cent on a gross of fee
basis (-0.2 per cent on a net of fee basis), while the benchmark* returned 1.8 per cent.
Market Comment
The benchmark fell by 2.3 per cent over the second quarter of 2015. This notable negative return, reflected in both safe haven as
well as riskier debt, was largely driven by the sharp selloff in German bunds, as overbought positions reverted from historically
low levels on positive Eurozone economic data. Investors also shunned riskier spread sectors due to the resurgent Greek debt
crisis and the large correction in the Chinese equity market. Government bond yields were broadly higher over the quarter, as the
continued impasse between Greece and its creditors weighed heavy on the markets. In the U.S., thinner market liquidity as well as
rising expectations of an interest rate hike later this year on the back of improving economic data over the quarter, impacted
demand for 10 year Treasuries which rose to 2.35 per cent from 1.92 per cent. In Europe, a similar trend of rising yields was
underway, as the support provided to valuations by the European Central Bank’s (ECB) asset-purchase programme began to wane
and with Mario Draghi commenting that bond investors should “get used to” volatility as a by-product of a long period of low
yields.
The benchmark rose 1.2 per cent during the third quarter of 2015. Market gyrations and volatility characterised much of the
period, tilting investor demand towards safe haven assets. Three central stories unfolded over the summer. First, China’s
devaluation of its currency (amid slowing growth) took centre stage in igniting a broad based sell-off in global markets. Secondly,
oil resumed its slide, falling over 30 per cent intra-period, re-igniting fears of dis-inflation. These events, in addition to the lack of
meaningful U.S. wage growth, served as determining factors in the U.S. Federal Reserve’s (the “Fed”) decision to not raise rates
at its September meeting. This perpetuated uncertainty regarding when the Fed will hike and increased speculation that the Fed
may stay on hold well into 2016. This calls into question the ability of the U.S. to de-couple from the rest of the world and
maintain a reasonable level of growth amid a slowing global backdrop. U.K.’s 10 year gilt yield declined 26 basis points (bps) to
1.76 per cent, as second-quarter GDP growth stood at 0.7 per cent. Whilst the unemployment rate fixed down to 5.5 per cent,
flatter retail and inflation figures convinced the Bank of England (BoE) to hold the interest rate firmly at 0.5 per cent. Eurozone
country yields were more stable after a new bailout deal was agreed with Greece and with the re-election of Alexis Tsipras as
Greece’s Prime Minister.
The benchmark declined 0.1 per cent in the last quarter of 2015. In some regards the period was a repeat of the third quarter, as
anxiety from slowing growth and policy execution in China combined with an ongoing commodities rout (especially in oil) drove
market volatility. However, before the curtains closed for the year, the Fed finally raised its benchmark interest rate, an event
which had been largely priced in by the markets. This crystallised a diverging Central Bank policy environment between the more
hawkish U.S. and (to a lesser extent) U.K. versus loose monetary policies in Europe (where the ECB eased further) and Japan. In
the U.S., the benchmark 10 year treasury increased 23 bps to 2.27 per cent. Driven by overall positive economic growth, strong
employment and housing data, The Fed’s Open Market Committee (FOMC) unanimously decided to lift the interest rate by 25
bps to 0.5 per cent. The Fed’s accompanying statement revealed that its policy would “remain accommodative” and that “the
actual path of increases in the federal funds rate will depend on the economic outlook as informed by incoming data”. In stark
contrast, a more dovish environment remained in Europe. The ECB lowered its deposit rate to -0.3 per cent from
-0.2 per cent, thereby charging banks more for depositing their spare cash. However, the ECB also fell short of market
expectations by holding quantitative easing steady, rather than increasing the amount.
The benchmark rose 3.0 per cent in the first quarter of 2016. The period was characterised by two halves. In the first half, slowing
growth in China coupled with an ongoing commodities rout (especially in oil), engendered significant market volatility and a
considerable risk-off sentiment. This firmly tilted demand towards safe haven assets such as sovereign bonds as well as gold.
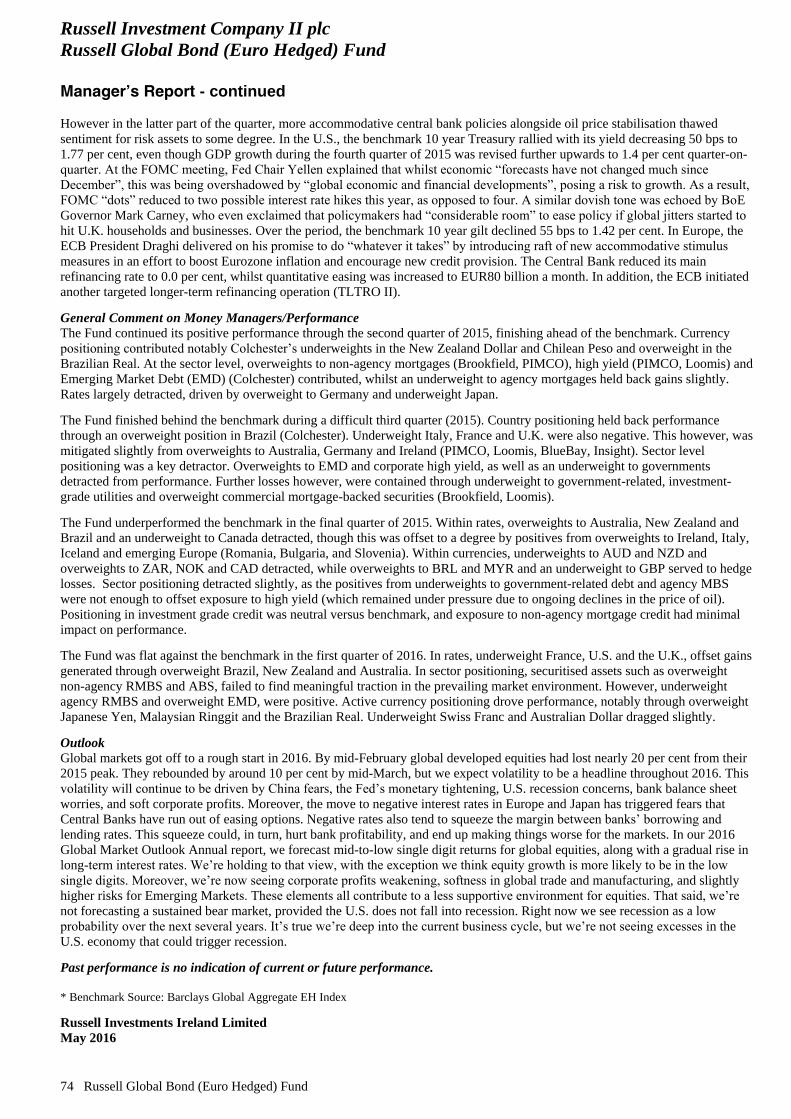
Russell Investment Company II plc
Russell Global Bond (Euro Hedged) Fund
Manager’s Report - continued
74 Russell Global Bond (Euro Hedged) Fund
However in the latter part of the quarter, more accommodative central bank policies alongside oil price stabilisation thawed
sentiment for risk assets to some degree. In the U.S., the benchmark 10 year Treasury rallied with its yield decreasing 50 bps to
1.77 per cent, even though GDP growth during the fourth quarter of 2015 was revised further upwards to 1.4 per cent quarter-on-
quarter. At the FOMC meeting, Fed Chair Yellen explained that whilst economic “forecasts have not changed much since
December”, this was being overshadowed by “global economic and financial developments”, posing a risk to growth. As a result,
FOMC “dots” reduced to two possible interest rate hikes this year, as opposed to four. A similar dovish tone was echoed by BoE
Governor Mark Carney, who even exclaimed that policymakers had “considerable room” to ease policy if global jitters started to
hit U.K. households and businesses. Over the period, the benchmark 10 year gilt declined 55 bps to 1.42 per cent. In Europe, the
ECB President Draghi delivered on his promise to do “whatever it takes” by introducing raft of new accommodative stimulus
measures in an effort to boost Eurozone inflation and encourage new credit provision. The Central Bank reduced its main
refinancing rate to 0.0 per cent, whilst quantitative easing was increased to EUR80 billion a month. In addition, the ECB initiated
another targeted longer-term refinancing operation (TLTRO II). General Comment on Money Managers/Performance
The Fund continued its positive performance through the second quarter of 2015, finishing ahead of the benchmark. Currency
positioning contributed notably Colchester’s underweights in the New Zealand Dollar and Chilean Peso and overweight in the
Brazilian Real. At the sector level, overweights to non-agency mortgages (Brookfield, PIMCO), high yield (PIMCO, Loomis) and
Emerging Market Debt (EMD) (Colchester) contributed, whilst an underweight to agency mortgages held back gains slightly.
Rates largely detracted, driven by overweight to Germany and underweight Japan. The Fund finished behind the benchmark during a difficult third quarter (2015). Country positioning held back performance
through an overweight position in Brazil (Colchester). Underweight Italy, France and U.K. were also negative. This however, was
mitigated slightly from overweights to Australia, Germany and Ireland (PIMCO, Loomis, BlueBay, Insight). Sector level
positioning was a key detractor. Overweights to EMD and corporate high yield, as well as an underweight to governments
detracted from performance. Further losses however, were contained through underweight to government-related, investment-
grade utilities and overweight commercial mortgage-backed securities (Brookfield, Loomis). The Fund underperformed the benchmark in the final quarter of 2015. Within rates, overweights to Australia, New Zealand and
Brazil and an underweight to Canada detracted, though this was offset to a degree by positives from overweights to Ireland, Italy,
Iceland and emerging Europe (Romania, Bulgaria, and Slovenia). Within currencies, underweights to AUD and NZD and
overweights to ZAR, NOK and CAD detracted, while overweights to BRL and MYR and an underweight to GBP served to hedge
losses. Sector positioning detracted slightly, as the positives from underweights to government-related debt and agency MBS
were not enough to offset exposure to high yield (which remained under pressure due to ongoing declines in the price of oil).
Positioning in investment grade credit was neutral versus benchmark, and exposure to non-agency mortgage credit had minimal
impact on performance. The Fund was flat against the benchmark in the first quarter of 2016. In rates, underweight France, U.S. and the U.K., offset gains
generated through overweight Brazil, New Zealand and Australia. In sector positioning, securitised assets such as overweight
non-agency RMBS and ABS, failed to find meaningful traction in the prevailing market environment. However, underweight
agency RMBS and overweight EMD, were positive. Active currency positioning drove performance, notably through overweight
Japanese Yen, Malaysian Ringgit and the Brazilian Real. Underweight Swiss Franc and Australian Dollar dragged slightly. Outlook
Global markets got off to a rough start in 2016. By mid-February global developed equities had lost nearly 20 per cent from their
2015 peak. They rebounded by around 10 per cent by mid-March, but we expect volatility to be a headline throughout 2016. This
volatility will continue to be driven by China fears, the Fed’s monetary tightening, U.S. recession concerns, bank balance sheet
worries, and soft corporate profits. Moreover, the move to negative interest rates in Europe and Japan has triggered fears that
Central Banks have run out of easing options. Negative rates also tend to squeeze the margin between banks’ borrowing and
lending rates. This squeeze could, in turn, hurt bank profitability, and end up making things worse for the markets. In our 2016
Global Market Outlook Annual report, we forecast mid-to-low single digit returns for global equities, along with a gradual rise in
long-term interest rates. We’re holding to that view, with the exception we think equity growth is more likely to be in the low
single digits. Moreover, we’re now seeing corporate profits weakening, softness in global trade and manufacturing, and slightly
higher risks for Emerging Markets. These elements all contribute to a less supportive environment for equities. That said, we’re
not forecasting a sustained bear market, provided the U.S. does not fall into recession. Right now we see recession as a low
probability over the next several years. It’s true we’re deep into the current business cycle, but we’re not seeing excesses in the
U.S. economy that could trigger recession. Past performance is no indication of current or future performance.
* Benchmark Source: Barclays Global Aggregate EH Index Russell Investments Ireland Limited
May 2016
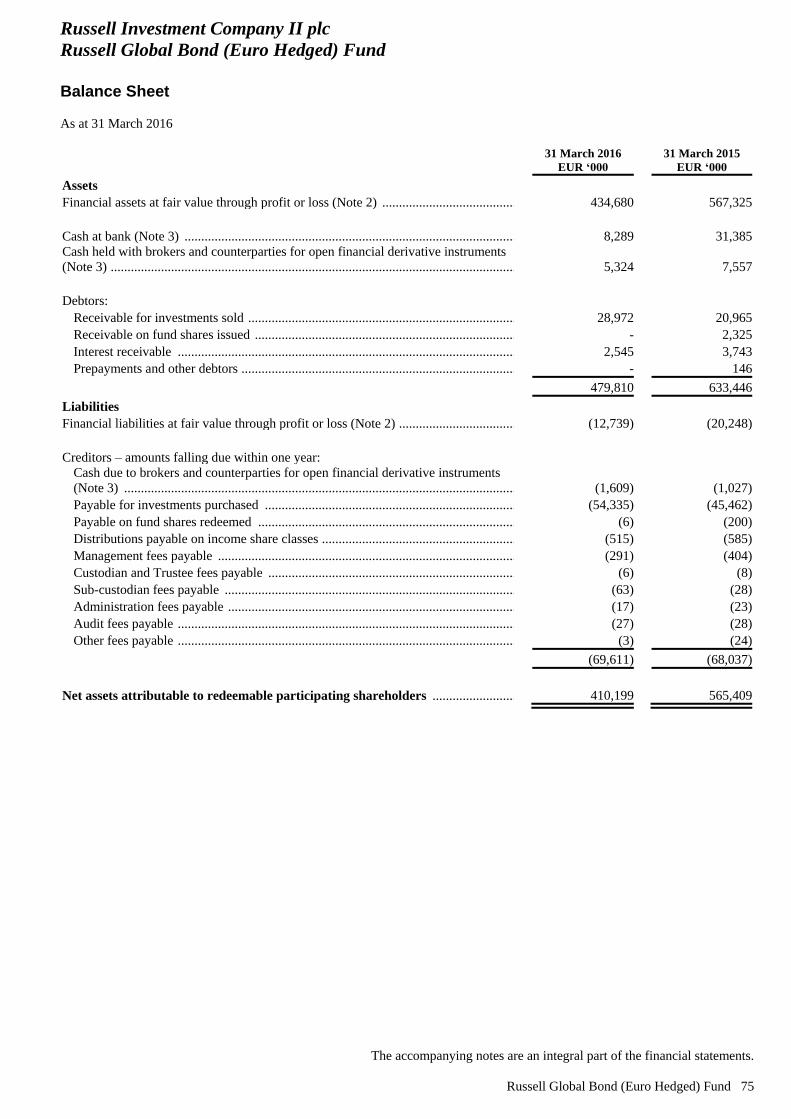
Russell Investment Company II plc
Russell Global Bond (Euro Hedged) Fund
Balance Sheet
As at 31 March 2016
The accompanying notes are an integral part of the financial statements.
Russell Global Bond (Euro Hedged) Fund 75
31 March 2016
EUR ‘000 31 March 2015
EUR ‘000
Assets
Financial assets at fair value through profit or loss (Note 2) ..................................................... 434,680 567,325
Cash at bank (Note 3) ................................................................................................................ 8,289 31,385
Cash held with brokers and counterparties for open financial derivative instruments
(Note 3) ................................................................................................................................... 5,324 7,557
Debtors:
Receivable for investments sold ............................................................................................. 28,972 20,965
Receivable on fund shares issued ........................................................................................... - 2,325
Interest receivable .................................................................................................................. 2,545 3,743
Prepayments and other debtors ............................................................................................... - 146
479,810 633,446
Liabilities
Financial liabilities at fair value through profit or loss (Note 2) ................................................ (12,739) (20,248)
Creditors – amounts falling due within one year:
Cash due to brokers and counterparties for open financial derivative instruments
(Note 3) .................................................................................................................................. (1,609) (1,027)
Payable for investments purchased ........................................................................................ (54,335) (45,462)
Payable on fund shares redeemed .......................................................................................... (6) (200)
Distributions payable on income share classes ....................................................................... (515) (585)
Management fees payable ...................................................................................................... (291) (404)
Custodian and Trustee fees payable ....................................................................................... (6) (8)
Sub-custodian fees payable .................................................................................................... (63) (28)
Administration fees payable ................................................................................................... (17) (23)
Audit fees payable .................................................................................................................. (27) (28)
Other fees payable .................................................................................................................. (3) (24)
(69,611) (68,037)
Net assets attributable to redeemable participating shareholders ...................................... 410,199 565,409
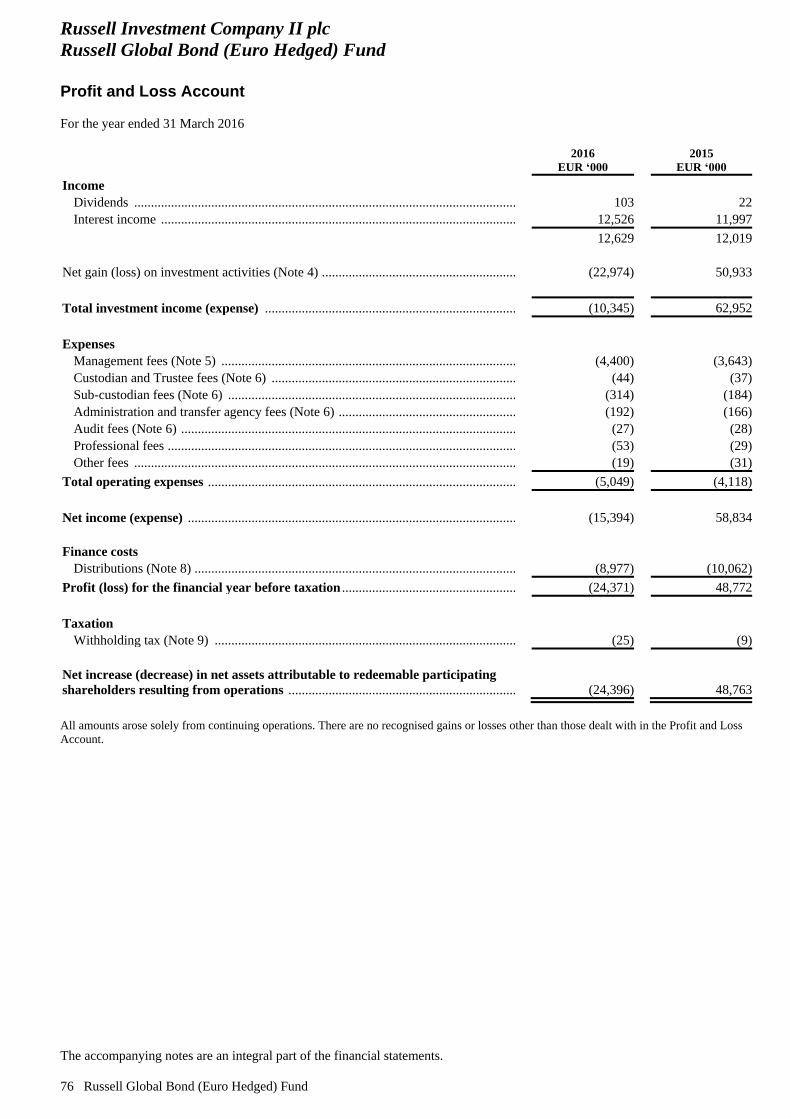
Russell Investment Company II plc
Russell Global Bond (Euro Hedged) Fund
Profit and Loss Account
For the year ended 31 March 2016
The accompanying notes are an integral part of the financial statements.
76 Russell Global Bond (Euro Hedged) Fund
2016
EUR ‘000
2015
EUR ‘000
Income
Dividends ..................................................................................................................... 103 22
Interest income ............................................................................................................. 12,526 11,997
12,629 12,019
Net gain (loss) on investment activities (Note 4) ............................................................. (22,974) 50,933
Total investment income (expense) .............................................................................. (10,345) 62,952
Expenses
Management fees (Note 5) ........................................................................................... (4,400) (3,643)
Custodian and Trustee fees (Note 6) ............................................................................ (44) (37)
Sub-custodian fees (Note 6) ......................................................................................... (314) (184)
Administration and transfer agency fees (Note 6) ........................................................ (192) (166)
Audit fees (Note 6) ....................................................................................................... (27) (28)
Professional fees ........................................................................................................... (53) (29)
Other fees ..................................................................................................................... (19) (31)
Total operating expenses ............................................................................................... (5,049) (4,118)
Net income (expense) ..................................................................................................... (15,394) 58,834
Finance costs
Distributions (Note 8) ................................................................................................... (8,977) (10,062)
Profit (loss) for the financial year before taxation ....................................................... (24,371) 48,772
Taxation
Withholding tax (Note 9) ............................................................................................. (25) (9)
Net increase (decrease) in net assets attributable to redeemable participating
shareholders resulting from operations ....................................................................... (24,396) 48,763
All amounts arose solely from continuing operations. There are no recognised gains or losses other than those dealt with in the Profit and Loss
Account.
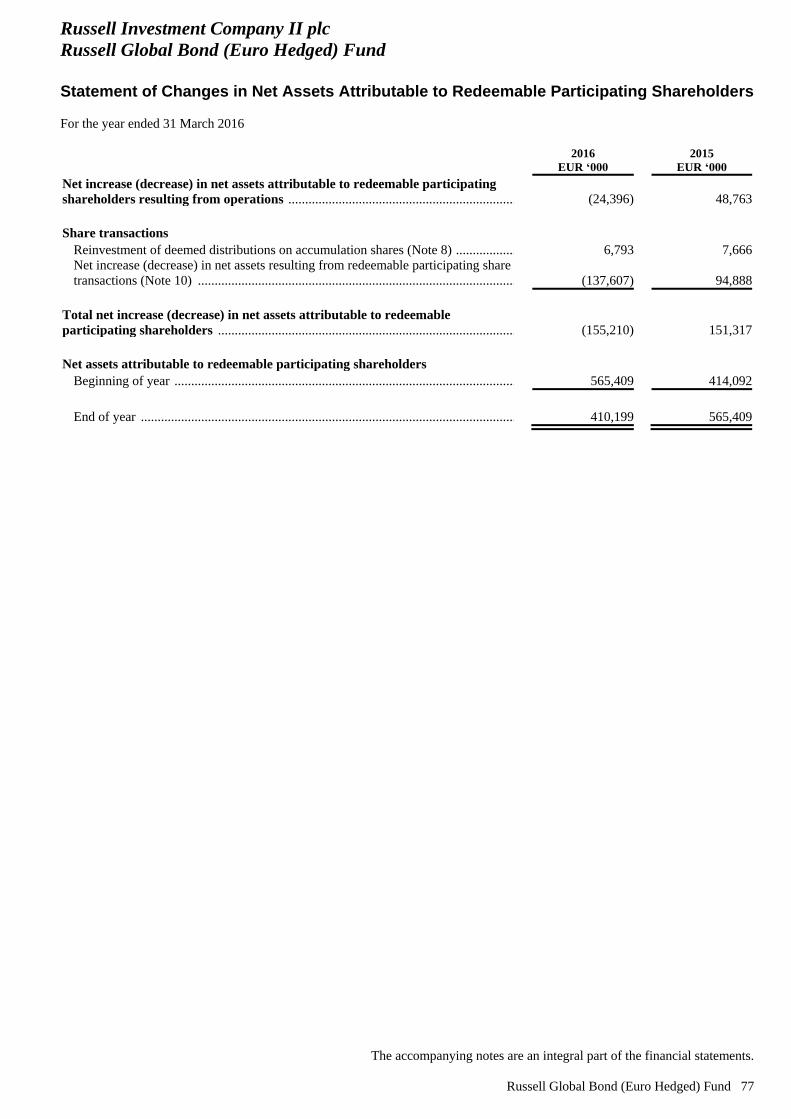
Russell Investment Company II plc
Russell Global Bond (Euro Hedged) Fund
Statement of Changes in Net Assets Attributable to Redeemable Participating Shareholders
For the year ended 31 March 2016
The accompanying notes are an integral part of the financial statements.
Russell Global Bond (Euro Hedged) Fund 77
2016
EUR ‘000
2015
EUR ‘000
Net increase (decrease) in net assets attributable to redeemable participating
shareholders resulting from operations ....................................................................... (24,396) 48,763
Share transactions
Reinvestment of deemed distributions on accumulation shares (Note 8) ..................... 6,793 7,666
Net increase (decrease) in net assets resulting from redeemable participating share
transactions (Note 10) .................................................................................................. (137,607) 94,888
Total net increase (decrease) in net assets attributable to redeemable
participating shareholders ............................................................................................ (155,210) 151,317
Net assets attributable to redeemable participating shareholders
Beginning of year ......................................................................................................... 565,409 414,092
End of year ................................................................................................................... 410,199 565,409
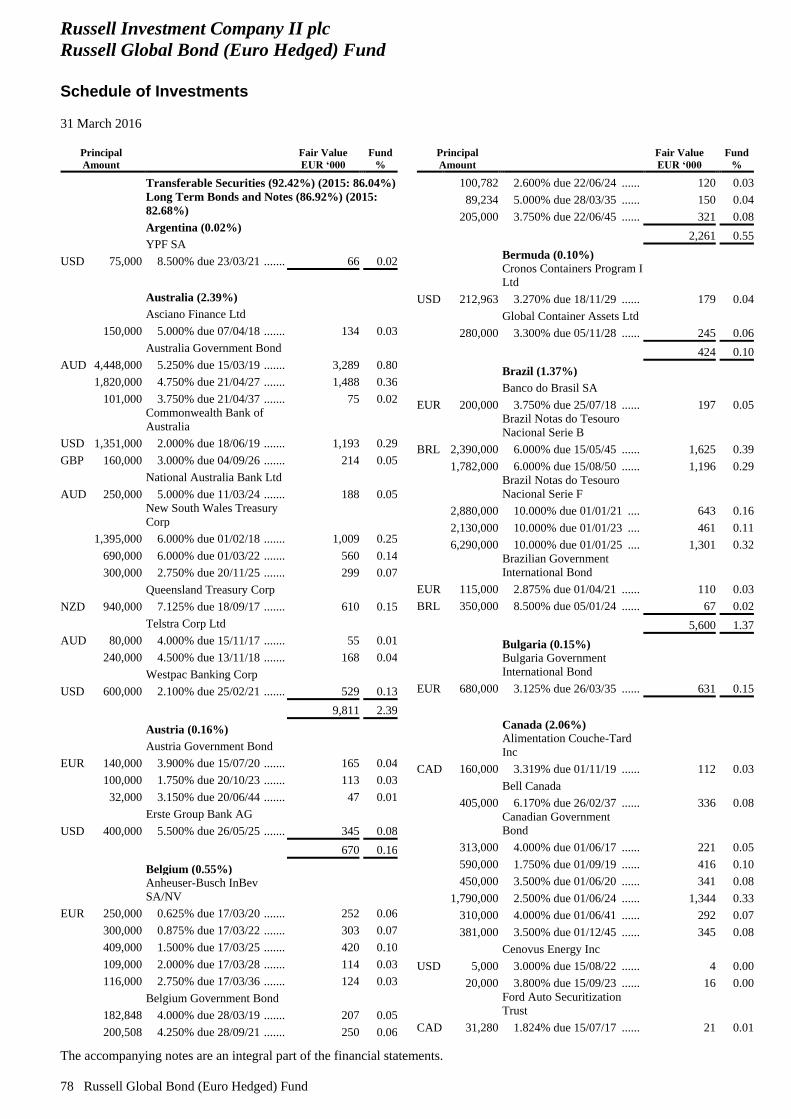
Russell Investment Company II plc
Russell Global Bond (Euro Hedged) Fund
Schedule of Investments
31 March 2016
The accompanying notes are an integral part of the financial statements.
78 Russell Global Bond (Euro Hedged) Fund
Principal
Amount
Fair Value
EUR ‘000
Fund
%
Transferable Securities (92.42%) (2015: 86.04%)
Long Term Bonds and Notes (86.92%) (2015:
82.68%)
Argentina (0.02%)
YPF SA
USD 75,000 8.500% due 23/03/21 ....... 66 0.02
Australia (2.39%)
Asciano Finance Ltd
150,000 5.000% due 07/04/18 ....... 134 0.03
Australia Government Bond
AUD 4,448,000 5.250% due 15/03/19 ....... 3,289 0.80
1,820,000 4.750% due 21/04/27 ....... 1,488 0.36
101,000 3.750% due 21/04/37 ....... 75 0.02
Commonwealth Bank of
Australia
USD 1,351,000 2.000% due 18/06/19 ....... 1,193 0.29
GBP 160,000 3.000% due 04/09/26 ....... 214 0.05
National Australia Bank Ltd
AUD 250,000 5.000% due 11/03/24 ....... 188 0.05
New South Wales Treasury
Corp
1,395,000 6.000% due 01/02/18 ....... 1,009 0.25
690,000 6.000% due 01/03/22 ....... 560 0.14
300,000 2.750% due 20/11/25 ....... 299 0.07
Queensland Treasury Corp
NZD 940,000 7.125% due 18/09/17 ....... 610 0.15
Telstra Corp Ltd
AUD 80,000 4.000% due 15/11/17 ....... 55 0.01
240,000 4.500% due 13/11/18 ....... 168 0.04
Westpac Banking Corp
USD 600,000 2.100% due 25/02/21 ....... 529 0.13
9,811 2.39
Austria (0.16%)
Austria Government Bond
EUR 140,000 3.900% due 15/07/20 ....... 165 0.04
100,000 1.750% due 20/10/23 ....... 113 0.03
32,000 3.150% due 20/06/44 ....... 47 0.01
Erste Group Bank AG
USD 400,000 5.500% due 26/05/25 ....... 345 0.08
670 0.16
Belgium (0.55%)
Anheuser-Busch InBev
SA/NV
EUR 250,000 0.625% due 17/03/20 ....... 252 0.06
300,000 0.875% due 17/03/22 ....... 303 0.07
409,000 1.500% due 17/03/25 ....... 420 0.10
109,000 2.000% due 17/03/28 ....... 114 0.03
116,000 2.750% due 17/03/36 ....... 124 0.03
Belgium Government Bond
182,848 4.000% due 28/03/19 ....... 207 0.05
200,508 4.250% due 28/09/21 ....... 250 0.06
Principal
Amount
Fair Value
EUR ‘000
Fund
%
100,782 2.600% due 22/06/24 ...... 120 0.03
89,234 5.000% due 28/03/35 ...... 150 0.04
205,000 3.750% due 22/06/45 ...... 321 0.08
2,261 0.55
Bermuda (0.10%)
Cronos Containers Program I
Ltd
USD 212,963 3.270% due 18/11/29 ...... 179 0.04
Global Container Assets Ltd
280,000 3.300% due 05/11/28 ...... 245 0.06
424 0.10
Brazil (1.37%)
Banco do Brasil SA
EUR 200,000 3.750% due 25/07/18 ...... 197 0.05
Brazil Notas do Tesouro
Nacional Serie B
BRL 2,390,000 6.000% due 15/05/45 ...... 1,625 0.39
1,782,000 6.000% due 15/08/50 ...... 1,196 0.29
Brazil Notas do Tesouro
Nacional Serie F
2,880,000 10.000% due 01/01/21 .... 643 0.16
2,130,000 10.000% due 01/01/23 .... 461 0.11
6,290,000 10.000% due 01/01/25 .... 1,301 0.32
Brazilian Government
International Bond
EUR 115,000 2.875% due 01/04/21 ...... 110 0.03
BRL 350,000 8.500% due 05/01/24 ...... 67 0.02
5,600 1.37
Bulgaria (0.15%)
Bulgaria Government
International Bond
EUR 680,000 3.125% due 26/03/35 ...... 631 0.15
Canada (2.06%)
Alimentation Couche-Tard
Inc
CAD 160,000 3.319% due 01/11/19 ...... 112 0.03
Bell Canada
405,000 6.170% due 26/02/37 ...... 336 0.08
Canadian Government
Bond
313,000 4.000% due 01/06/17 ...... 221 0.05
590,000 1.750% due 01/09/19 ...... 416 0.10
450,000 3.500% due 01/06/20 ...... 341 0.08
1,790,000 2.500% due 01/06/24 ...... 1,344 0.33
310,000 4.000% due 01/06/41 ...... 292 0.07
381,000 3.500% due 01/12/45 ...... 345 0.08
Cenovus Energy Inc
USD 5,000 3.000% due 15/08/22 ...... 4 0.00
20,000 3.800% due 15/09/23 ...... 16 0.00
Ford Auto Securitization
Trust
CAD 31,280 1.824% due 15/07/17 ...... 21 0.01
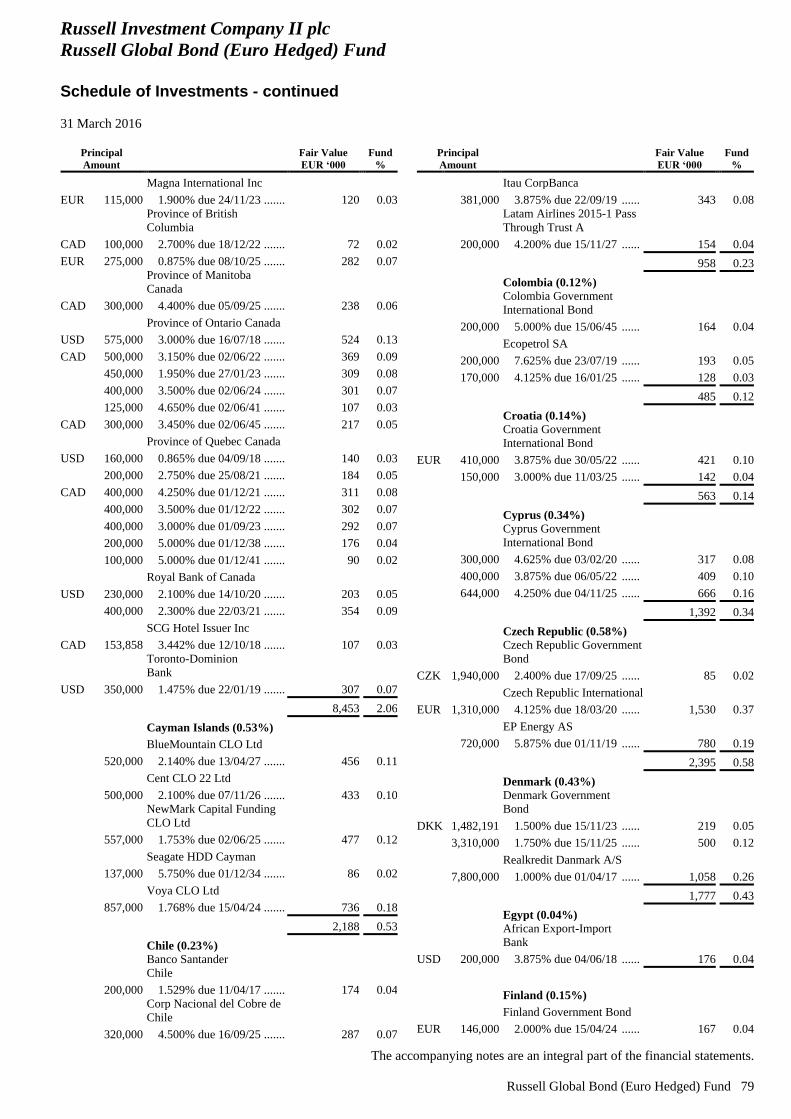
Russell Investment Company II plc
Russell Global Bond (Euro Hedged) Fund
Schedule of Investments - continued
31 March 2016
The accompanying notes are an integral part of the financial statements.
Russell Global Bond (Euro Hedged) Fund 79
Principal
Amount
Fair Value
EUR ‘000
Fund
%
Magna International Inc
EUR 115,000 1.900% due 24/11/23 ....... 120 0.03
Province of British
Columbia
CAD 100,000 2.700% due 18/12/22 ....... 72 0.02
EUR 275,000 0.875% due 08/10/25 ....... 282 0.07
Province of Manitoba
Canada
CAD 300,000 4.400% due 05/09/25 ....... 238 0.06
Province of Ontario Canada
USD 575,000 3.000% due 16/07/18 ....... 524 0.13
CAD 500,000 3.150% due 02/06/22 ....... 369 0.09
450,000 1.950% due 27/01/23 ....... 309 0.08
400,000 3.500% due 02/06/24 ....... 301 0.07
125,000 4.650% due 02/06/41 ....... 107 0.03
CAD 300,000 3.450% due 02/06/45 ....... 217 0.05
Province of Quebec Canada
USD 160,000 0.865% due 04/09/18 ....... 140 0.03
200,000 2.750% due 25/08/21 ....... 184 0.05
CAD 400,000 4.250% due 01/12/21 ....... 311 0.08
400,000 3.500% due 01/12/22 ....... 302 0.07
400,000 3.000% due 01/09/23 ....... 292 0.07
200,000 5.000% due 01/12/38 ....... 176 0.04
100,000 5.000% due 01/12/41 ....... 90 0.02
Royal Bank of Canada
USD 230,000 2.100% due 14/10/20 ....... 203 0.05
400,000 2.300% due 22/03/21 ....... 354 0.09
SCG Hotel Issuer Inc
CAD 153,858 3.442% due 12/10/18 ....... 107 0.03
Toronto-Dominion
Bank
USD 350,000 1.475% due 22/01/19 ....... 307 0.07
8,453 2.06
Cayman Islands (0.53%)
BlueMountain CLO Ltd
520,000 2.140% due 13/04/27 ....... 456 0.11
Cent CLO 22 Ltd
500,000 2.100% due 07/11/26 ....... 433 0.10
NewMark Capital Funding
CLO Ltd
557,000 1.753% due 02/06/25 ....... 477 0.12
Seagate HDD Cayman
137,000 5.750% due 01/12/34 ....... 86 0.02
Voya CLO Ltd
857,000 1.768% due 15/04/24 ....... 736 0.18
2,188 0.53
Chile (0.23%)
Banco Santander
Chile
200,000 1.529% due 11/04/17 ....... 174 0.04
Corp Nacional del Cobre de
Chile
320,000 4.500% due 16/09/25 ....... 287 0.07
Principal
Amount
Fair Value
EUR ‘000
Fund
%
Itau CorpBanca
381,000 3.875% due 22/09/19 ...... 343 0.08
Latam Airlines 2015-1 Pass
Through Trust A
200,000 4.200% due 15/11/27 ...... 154 0.04
958 0.23
Colombia (0.12%)
Colombia Government
International Bond
200,000 5.000% due 15/06/45 ...... 164 0.04
Ecopetrol SA
200,000 7.625% due 23/07/19 ...... 193 0.05
170,000 4.125% due 16/01/25 ...... 128 0.03
485 0.12
Croatia (0.14%)
Croatia Government
International Bond
EUR 410,000 3.875% due 30/05/22 ...... 421 0.10
150,000 3.000% due 11/03/25 ...... 142 0.04
563 0.14
Cyprus (0.34%)
Cyprus Government
International Bond
300,000 4.625% due 03/02/20 ...... 317 0.08
400,000 3.875% due 06/05/22 ...... 409 0.10
644,000 4.250% due 04/11/25 ...... 666 0.16
1,392 0.34
Czech Republic (0.58%)
Czech Republic Government
Bond
CZK 1,940,000 2.400% due 17/09/25 ...... 85 0.02
Czech Republic International
EUR 1,310,000 4.125% due 18/03/20 ...... 1,530 0.37
EP Energy AS
720,000 5.875% due 01/11/19 ...... 780 0.19
2,395 0.58
Denmark (0.43%)
Denmark Government
Bond
DKK 1,482,191 1.500% due 15/11/23 ...... 219 0.05
3,310,000 1.750% due 15/11/25 ...... 500 0.12
Realkredit Danmark A/S
7,800,000 1.000% due 01/04/17 ...... 1,058 0.26
1,777 0.43
Egypt (0.04%)
African Export-Import
Bank
USD 200,000 3.875% due 04/06/18 ...... 176 0.04
Finland (0.15%)
Finland Government Bond
EUR 146,000 2.000% due 15/04/24 ...... 167 0.04
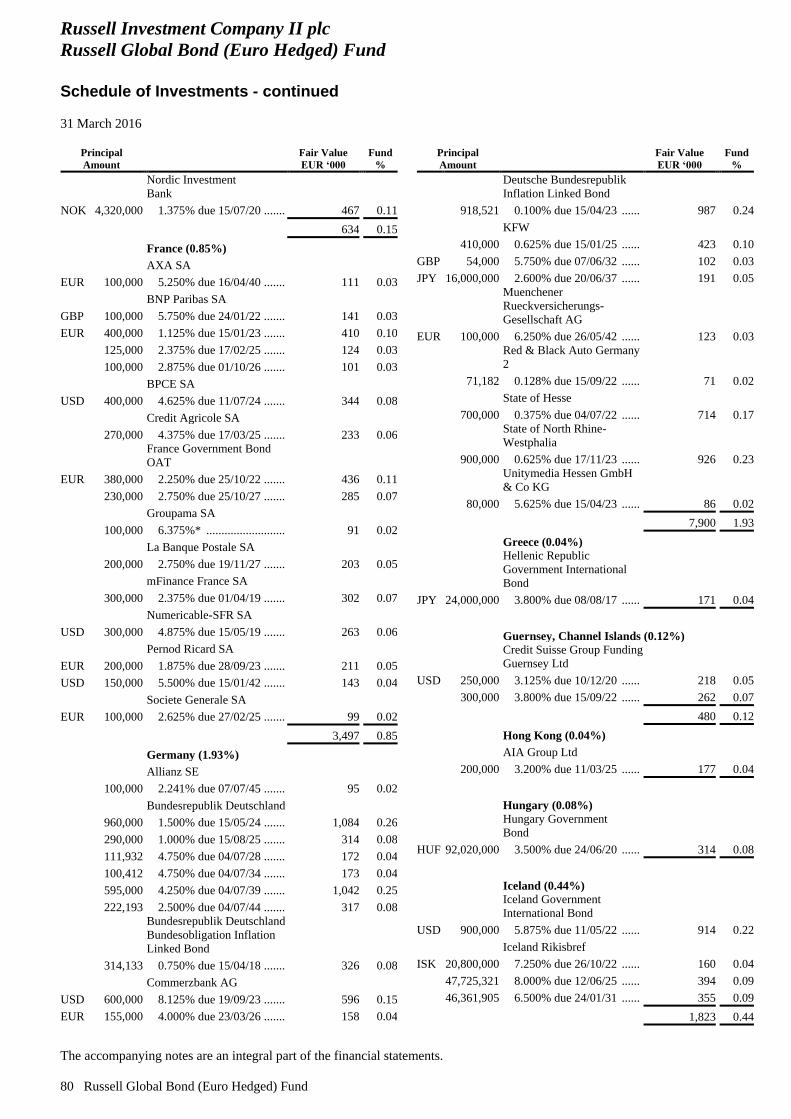
Russell Investment Company II plc
Russell Global Bond (Euro Hedged) Fund
Schedule of Investments - continued
31 March 2016
The accompanying notes are an integral part of the financial statements.
80 Russell Global Bond (Euro Hedged) Fund
Principal
Amount
Fair Value
EUR ‘000
Fund
%
Nordic Investment
Bank
NOK 4,320,000 1.375% due 15/07/20 ....... 467 0.11
634 0.15
France (0.85%)
AXA SA
EUR 100,000 5.250% due 16/04/40 ....... 111 0.03
BNP Paribas SA
GBP 100,000 5.750% due 24/01/22 ....... 141 0.03
EUR 400,000 1.125% due 15/01/23 ....... 410 0.10
125,000 2.375% due 17/02/25 ....... 124 0.03
100,000 2.875% due 01/10/26 ....... 101 0.03
BPCE SA
USD 400,000 4.625% due 11/07/24 ....... 344 0.08
Credit Agricole SA
270,000 4.375% due 17/03/25 ....... 233 0.06
France Government Bond
OAT
EUR 380,000 2.250% due 25/10/22 ....... 436 0.11
230,000 2.750% due 25/10/27 ....... 285 0.07
Groupama SA
100,000 6.375%* .......................... 91 0.02
La Banque Postale SA
200,000 2.750% due 19/11/27 ....... 203 0.05
mFinance France SA
300,000 2.375% due 01/04/19 ....... 302 0.07
Numericable-SFR SA
USD 300,000 4.875% due 15/05/19 ....... 263 0.06
Pernod Ricard SA
EUR 200,000 1.875% due 28/09/23 ....... 211 0.05
USD 150,000 5.500% due 15/01/42 ....... 143 0.04
Societe Generale SA
EUR 100,000 2.625% due 27/02/25 ....... 99 0.02
3,497 0.85
Germany (1.93%)
Allianz SE
100,000 2.241% due 07/07/45 ....... 95 0.02
Bundesrepublik Deutschland
960,000 1.500% due 15/05/24 ....... 1,084 0.26
290,000 1.000% due 15/08/25 ....... 314 0.08
111,932 4.750% due 04/07/28 ....... 172 0.04
100,412 4.750% due 04/07/34 ....... 173 0.04
595,000 4.250% due 04/07/39 ....... 1,042 0.25
222,193 2.500% due 04/07/44 ....... 317 0.08
Bundesrepublik Deutschland
Bundesobligation Inflation
Linked Bond
314,133 0.750% due 15/04/18 ....... 326 0.08
Commerzbank AG
USD 600,000 8.125% due 19/09/23 ....... 596 0.15
EUR 155,000 4.000% due 23/03/26 ....... 158 0.04
Principal
Amount
Fair Value
EUR ‘000
Fund
%
Deutsche Bundesrepublik
Inflation Linked Bond
918,521 0.100% due 15/04/23 ...... 987 0.24
KFW
410,000 0.625% due 15/01/25 ...... 423 0.10
GBP 54,000 5.750% due 07/06/32 ...... 102 0.03
JPY 16,000,000 2.600% due 20/06/37 ...... 191 0.05
Muenchener
Rueckversicherungs-
Gesellschaft AG
EUR 100,000 6.250% due 26/05/42 ...... 123 0.03
Red & Black Auto Germany
2
71,182 0.128% due 15/09/22 ...... 71 0.02
State of Hesse
700,000 0.375% due 04/07/22 ...... 714 0.17
State of North Rhine-
Westphalia
900,000 0.625% due 17/11/23 ...... 926 0.23
Unitymedia Hessen GmbH
& Co KG
80,000 5.625% due 15/04/23 ...... 86 0.02
7,900 1.93
Greece (0.04%)
Hellenic Republic
Government International
Bond
JPY 24,000,000 3.800% due 08/08/17 ...... 171 0.04
Guernsey, Channel Islands (0.12%)
Credit Suisse Group Funding
Guernsey Ltd
USD 250,000 3.125% due 10/12/20 ...... 218 0.05
300,000 3.800% due 15/09/22 ...... 262 0.07
480 0.12
Hong Kong (0.04%)
AIA Group Ltd
200,000 3.200% due 11/03/25 ...... 177 0.04
Hungary (0.08%)
Hungary Government
Bond
HUF 92,020,000 3.500% due 24/06/20 ...... 314 0.08
Iceland (0.44%)
Iceland Government
International Bond
USD 900,000 5.875% due 11/05/22 ...... 914 0.22
Iceland Rikisbref
ISK 20,800,000 7.250% due 26/10/22 ...... 160 0.04
47,725,321 8.000% due 12/06/25 ...... 394 0.09
46,361,905 6.500% due 24/01/31 ...... 355 0.09
1,823 0.44
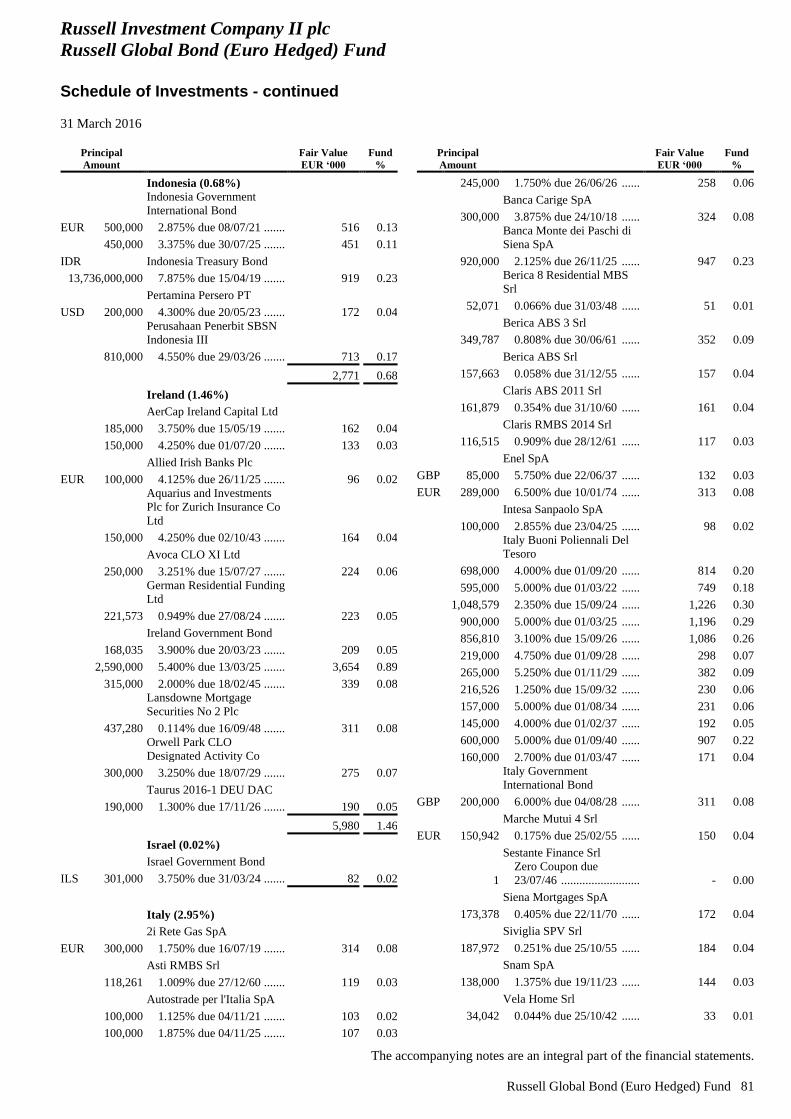
Russell Investment Company II plc
Russell Global Bond (Euro Hedged) Fund
Schedule of Investments - continued
31 March 2016
The accompanying notes are an integral part of the financial statements.
Russell Global Bond (Euro Hedged) Fund 81
Principal
Amount
Fair Value
EUR ‘000
Fund
%
Indonesia (0.68%)
Indonesia Government
International Bond
EUR 500,000 2.875% due 08/07/21 ....... 516 0.13
450,000 3.375% due 30/07/25 ....... 451 0.11
IDR Indonesia Treasury Bond
13,736,000,000 7.875% due 15/04/19 ....... 919 0.23
Pertamina Persero PT
USD 200,000 4.300% due 20/05/23 ....... 172 0.04
Perusahaan Penerbit SBSN
Indonesia III
810,000 4.550% due 29/03/26 ....... 713 0.17
2,771 0.68
Ireland (1.46%)
AerCap Ireland Capital Ltd
185,000 3.750% due 15/05/19 ....... 162 0.04
150,000 4.250% due 01/07/20 ....... 133 0.03
Allied Irish Banks Plc
EUR 100,000 4.125% due 26/11/25 ....... 96 0.02
Aquarius and Investments
Plc for Zurich Insurance Co
Ltd
150,000 4.250% due 02/10/43 ....... 164 0.04
Avoca CLO XI Ltd
250,000 3.251% due 15/07/27 ....... 224 0.06
German Residential Funding
Ltd
221,573 0.949% due 27/08/24 ....... 223 0.05
Ireland Government Bond
168,035 3.900% due 20/03/23 ....... 209 0.05
2,590,000 5.400% due 13/03/25 ....... 3,654 0.89
315,000 2.000% due 18/02/45 ....... 339 0.08
Lansdowne Mortgage
Securities No 2 Plc
437,280 0.114% due 16/09/48 ....... 311 0.08
Orwell Park CLO
Designated Activity Co
300,000 3.250% due 18/07/29 ....... 275 0.07
Taurus 2016-1 DEU DAC
190,000 1.300% due 17/11/26 ....... 190 0.05
5,980 1.46
Israel (0.02%)
Israel Government Bond
ILS 301,000 3.750% due 31/03/24 ....... 82 0.02
Italy (2.95%)
2i Rete Gas SpA
EUR 300,000 1.750% due 16/07/19 ....... 314 0.08
Asti RMBS Srl
118,261 1.009% due 27/12/60 ....... 119 0.03
Autostrade per l'Italia SpA
100,000 1.125% due 04/11/21 ....... 103 0.02
100,000 1.875% due 04/11/25 ....... 107 0.03
Principal
Amount
Fair Value
EUR ‘000
Fund
%
245,000 1.750% due 26/06/26 ...... 258 0.06
Banca Carige SpA
300,000 3.875% due 24/10/18 ...... 324 0.08
Banca Monte dei Paschi di
Siena SpA
920,000 2.125% due 26/11/25 ...... 947 0.23
Berica 8 Residential MBS
Srl
52,071 0.066% due 31/03/48 ...... 51 0.01
Berica ABS 3 Srl
349,787 0.808% due 30/06/61 ...... 352 0.09
Berica ABS Srl
157,663 0.058% due 31/12/55 ...... 157 0.04
Claris ABS 2011 Srl
161,879 0.354% due 31/10/60 ...... 161 0.04
Claris RMBS 2014 Srl
116,515 0.909% due 28/12/61 ...... 117 0.03
Enel SpA
GBP 85,000 5.750% due 22/06/37 ...... 132 0.03
EUR 289,000 6.500% due 10/01/74 ...... 313 0.08
Intesa Sanpaolo SpA
100,000 2.855% due 23/04/25 ...... 98 0.02
Italy Buoni Poliennali Del
Tesoro
698,000 4.000% due 01/09/20 ...... 814 0.20
595,000 5.000% due 01/03/22 ...... 749 0.18
1,048,579 2.350% due 15/09/24 ...... 1,226 0.30
900,000 5.000% due 01/03/25 ...... 1,196 0.29
856,810 3.100% due 15/09/26 ...... 1,086 0.26
219,000 4.750% due 01/09/28 ...... 298 0.07
265,000 5.250% due 01/11/29 ...... 382 0.09
216,526 1.250% due 15/09/32 ...... 230 0.06
157,000 5.000% due 01/08/34 ...... 231 0.06
145,000 4.000% due 01/02/37 ...... 192 0.05
600,000 5.000% due 01/09/40 ...... 907 0.22
160,000 2.700% due 01/03/47 ...... 171 0.04
Italy Government
International Bond
GBP 200,000 6.000% due 04/08/28 ...... 311 0.08
Marche Mutui 4 Srl
EUR 150,942 0.175% due 25/02/55 ...... 150 0.04
Sestante Finance Srl
1
Zero Coupon due
23/07/46 .......................... - 0.00
Siena Mortgages SpA
173,378 0.405% due 22/11/70 ...... 172 0.04
Siviglia SPV Srl
187,972 0.251% due 25/10/55 ...... 184 0.04
Snam SpA
138,000 1.375% due 19/11/23 ...... 144 0.03
Vela Home Srl
34,042 0.044% due 25/10/42 ...... 33 0.01
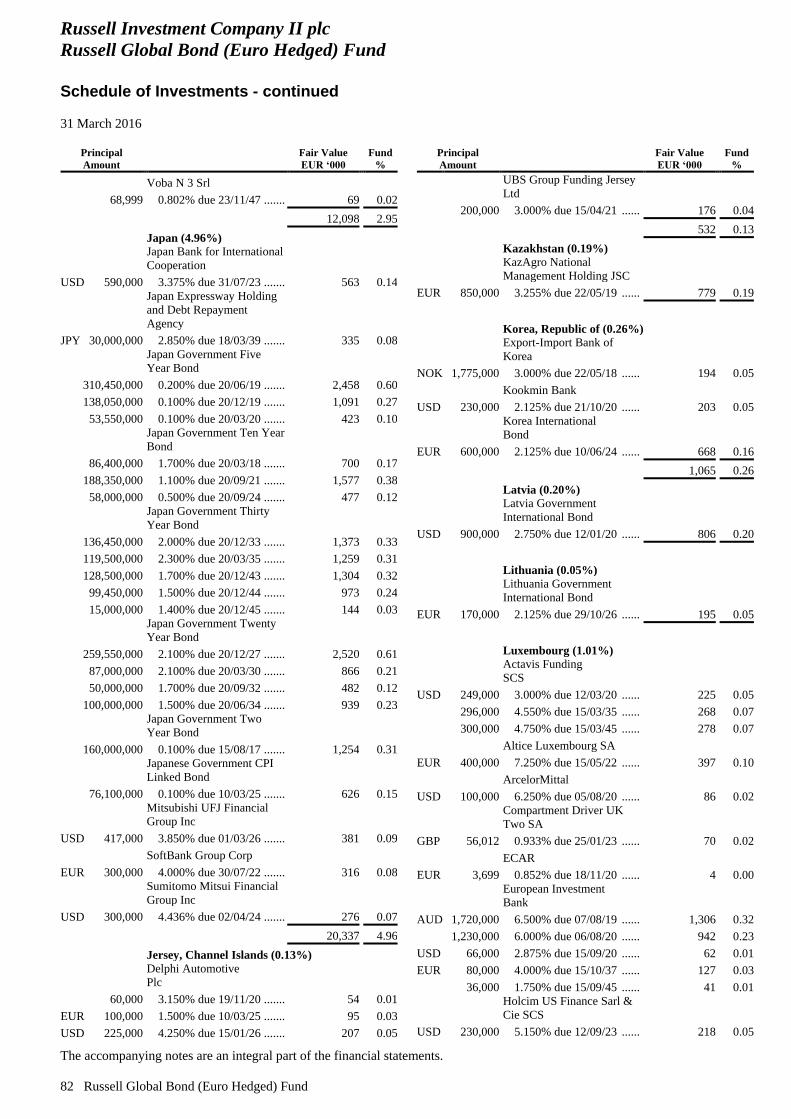
Russell Investment Company II plc
Russell Global Bond (Euro Hedged) Fund
Schedule of Investments - continued
31 March 2016
The accompanying notes are an integral part of the financial statements.
82 Russell Global Bond (Euro Hedged) Fund
Principal
Amount
Fair Value
EUR ‘000
Fund
%
Voba N 3 Srl
68,999 0.802% due 23/11/47 ....... 69 0.02
12,098 2.95
Japan (4.96%)
Japan Bank for International
Cooperation
USD 590,000 3.375% due 31/07/23 ....... 563 0.14
Japan Expressway Holding
and Debt Repayment
Agency
JPY 30,000,000 2.850% due 18/03/39 ....... 335 0.08
Japan Government Five
Year Bond
310,450,000 0.200% due 20/06/19 ....... 2,458 0.60
138,050,000 0.100% due 20/12/19 ....... 1,091 0.27
53,550,000 0.100% due 20/03/20 ....... 423 0.10
Japan Government Ten Year
Bond
86,400,000 1.700% due 20/03/18 ....... 700 0.17
188,350,000 1.100% due 20/09/21 ....... 1,577 0.38
58,000,000 0.500% due 20/09/24 ....... 477 0.12
Japan Government Thirty
Year Bond
136,450,000 2.000% due 20/12/33 ....... 1,373 0.33
119,500,000 2.300% due 20/03/35 ....... 1,259 0.31
128,500,000 1.700% due 20/12/43 ....... 1,304 0.32
99,450,000 1.500% due 20/12/44 ....... 973 0.24
15,000,000 1.400% due 20/12/45 ....... 144 0.03
Japan Government Twenty
Year Bond
259,550,000 2.100% due 20/12/27 ....... 2,520 0.61
87,000,000 2.100% due 20/03/30 ....... 866 0.21
50,000,000 1.700% due 20/09/32 ....... 482 0.12
100,000,000 1.500% due 20/06/34 ....... 939 0.23
Japan Government Two
Year Bond
160,000,000 0.100% due 15/08/17 ....... 1,254 0.31
Japanese Government CPI
Linked Bond
76,100,000 0.100% due 10/03/25 ....... 626 0.15
Mitsubishi UFJ Financial
Group Inc
USD 417,000 3.850% due 01/03/26 ....... 381 0.09
SoftBank Group Corp
EUR 300,000 4.000% due 30/07/22 ....... 316 0.08
Sumitomo Mitsui Financial
Group Inc
USD 300,000 4.436% due 02/04/24 ....... 276 0.07
20,337 4.96
Jersey, Channel Islands (0.13%)
Delphi Automotive
Plc
60,000 3.150% due 19/11/20 ....... 54 0.01
EUR 100,000 1.500% due 10/03/25 ....... 95 0.03
USD 225,000 4.250% due 15/01/26 ....... 207 0.05
Principal
Amount
Fair Value
EUR ‘000
Fund
%
UBS Group Funding Jersey
Ltd
200,000 3.000% due 15/04/21 ...... 176 0.04
532 0.13
Kazakhstan (0.19%)
KazAgro National
Management Holding JSC
EUR 850,000 3.255% due 22/05/19 ...... 779 0.19
Korea, Republic of (0.26%)
Export-Import Bank of
Korea
NOK 1,775,000 3.000% due 22/05/18 ...... 194 0.05
Kookmin Bank
USD 230,000 2.125% due 21/10/20 ...... 203 0.05
Korea International
Bond
EUR 600,000 2.125% due 10/06/24 ...... 668 0.16
1,065 0.26
Latvia (0.20%)
Latvia Government
International Bond
USD 900,000 2.750% due 12/01/20 ...... 806 0.20
Lithuania (0.05%)
Lithuania Government
International Bond
EUR 170,000 2.125% due 29/10/26 ...... 195 0.05
Luxembourg (1.01%)
Actavis Funding
SCS
USD 249,000 3.000% due 12/03/20 ...... 225 0.05
296,000 4.550% due 15/03/35 ...... 268 0.07
300,000 4.750% due 15/03/45 ...... 278 0.07
Altice Luxembourg SA
EUR 400,000 7.250% due 15/05/22 ...... 397 0.10
ArcelorMittal
USD 100,000 6.250% due 05/08/20 ...... 86 0.02
Compartment Driver UK
Two SA
GBP 56,012 0.933% due 25/01/23 ...... 70 0.02
ECAR
EUR 3,699 0.852% due 18/11/20 ...... 4 0.00
European Investment
Bank
AUD 1,720,000 6.500% due 07/08/19 ...... 1,306 0.32
1,230,000 6.000% due 06/08/20 ...... 942 0.23
USD 66,000 2.875% due 15/09/20 ...... 62 0.01
EUR 80,000 4.000% due 15/10/37 ...... 127 0.03
36,000 1.750% due 15/09/45 ...... 41 0.01
Holcim US Finance Sarl &
Cie SCS
USD 230,000 5.150% due 12/09/23 ...... 218 0.05
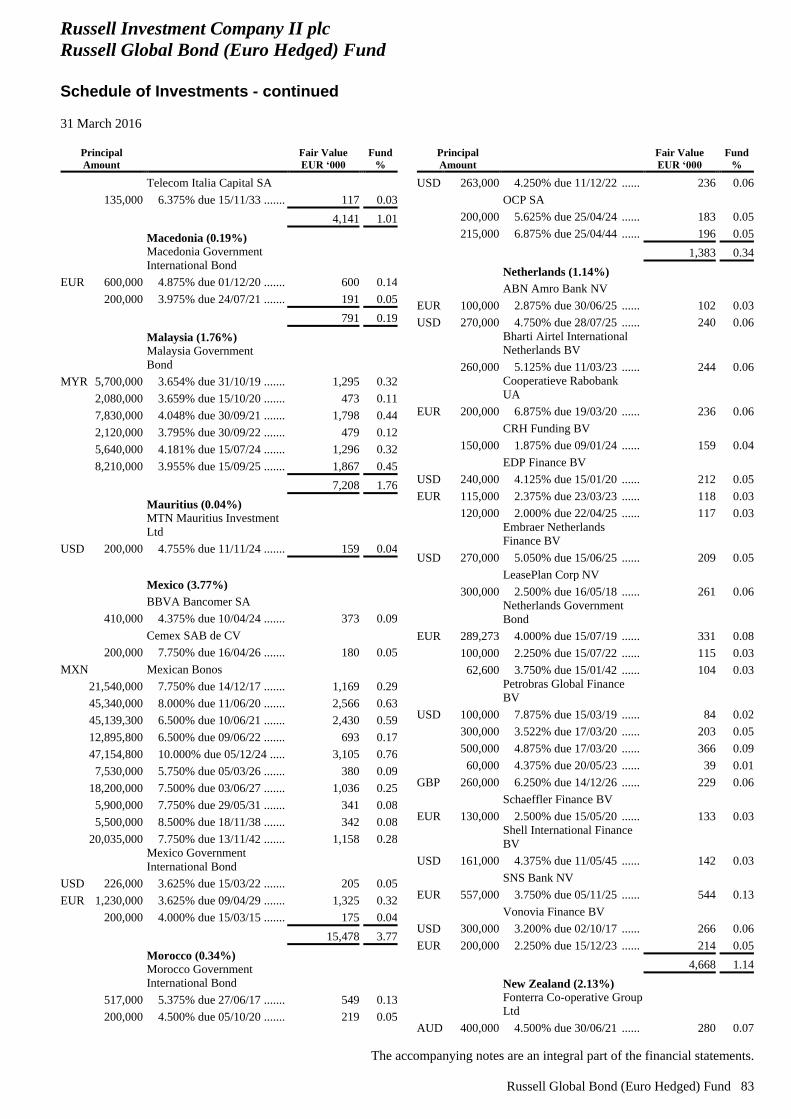
Russell Investment Company II plc
Russell Global Bond (Euro Hedged) Fund
Schedule of Investments - continued
31 March 2016
The accompanying notes are an integral part of the financial statements.
Russell Global Bond (Euro Hedged) Fund 83
Principal
Amount
Fair Value
EUR ‘000
Fund
%
Telecom Italia Capital SA
135,000 6.375% due 15/11/33 ....... 117 0.03
4,141 1.01
Macedonia (0.19%)
Macedonia Government
International Bond
EUR 600,000 4.875% due 01/12/20 ....... 600 0.14
200,000 3.975% due 24/07/21 ....... 191 0.05
791 0.19
Malaysia (1.76%)
Malaysia Government
Bond
MYR 5,700,000 3.654% due 31/10/19 ....... 1,295 0.32
2,080,000 3.659% due 15/10/20 ....... 473 0.11
7,830,000 4.048% due 30/09/21 ....... 1,798 0.44
2,120,000 3.795% due 30/09/22 ....... 479 0.12
5,640,000 4.181% due 15/07/24 ....... 1,296 0.32
8,210,000 3.955% due 15/09/25 ....... 1,867 0.45
7,208 1.76
Mauritius (0.04%)
MTN Mauritius Investment
Ltd
USD 200,000 4.755% due 11/11/24 ....... 159 0.04
Mexico (3.77%)
BBVA Bancomer SA
410,000 4.375% due 10/04/24 ....... 373 0.09
Cemex SAB de CV
200,000 7.750% due 16/04/26 ....... 180 0.05
MXN Mexican Bonos
21,540,000 7.750% due 14/12/17 ....... 1,169 0.29
45,340,000 8.000% due 11/06/20 ....... 2,566 0.63
45,139,300 6.500% due 10/06/21 ....... 2,430 0.59
12,895,800 6.500% due 09/06/22 ....... 693 0.17
47,154,800 10.000% due 05/12/24 ..... 3,105 0.76
7,530,000 5.750% due 05/03/26 ....... 380 0.09
18,200,000 7.500% due 03/06/27 ....... 1,036 0.25
5,900,000 7.750% due 29/05/31 ....... 341 0.08
5,500,000 8.500% due 18/11/38 ....... 342 0.08
20,035,000 7.750% due 13/11/42 ....... 1,158 0.28
Mexico Government
International Bond
USD 226,000 3.625% due 15/03/22 ....... 205 0.05
EUR 1,230,000 3.625% due 09/04/29 ....... 1,325 0.32
200,000 4.000% due 15/03/15 ....... 175 0.04
15,478 3.77
Morocco (0.34%)
Morocco Government
International Bond
517,000 5.375% due 27/06/17 ....... 549 0.13
200,000 4.500% due 05/10/20 ....... 219 0.05
Principal
Amount
Fair Value
EUR ‘000
Fund
%
USD 263,000 4.250% due 11/12/22 ...... 236 0.06
OCP SA
200,000 5.625% due 25/04/24 ...... 183 0.05
215,000 6.875% due 25/04/44 ...... 196 0.05
1,383 0.34
Netherlands (1.14%)
ABN Amro Bank NV
EUR 100,000 2.875% due 30/06/25 ...... 102 0.03
USD 270,000 4.750% due 28/07/25 ...... 240 0.06
Bharti Airtel International
Netherlands BV
260,000 5.125% due 11/03/23 ...... 244 0.06
Cooperatieve Rabobank
UA
EUR 200,000 6.875% due 19/03/20 ...... 236 0.06
CRH Funding BV
150,000 1.875% due 09/01/24 ...... 159 0.04
EDP Finance BV
USD 240,000 4.125% due 15/01/20 ...... 212 0.05
EUR 115,000 2.375% due 23/03/23 ...... 118 0.03
120,000 2.000% due 22/04/25 ...... 117 0.03
Embraer Netherlands
Finance BV
USD 270,000 5.050% due 15/06/25 ...... 209 0.05
LeasePlan Corp NV
300,000 2.500% due 16/05/18 ...... 261 0.06
Netherlands Government
Bond
EUR 289,273 4.000% due 15/07/19 ...... 331 0.08
100,000 2.250% due 15/07/22 ...... 115 0.03
62,600 3.750% due 15/01/42 ...... 104 0.03
Petrobras Global Finance
BV
USD 100,000 7.875% due 15/03/19 ...... 84 0.02
300,000 3.522% due 17/03/20 ...... 203 0.05
500,000 4.875% due 17/03/20 ...... 366 0.09
60,000 4.375% due 20/05/23 ...... 39 0.01
GBP 260,000 6.250% due 14/12/26 ...... 229 0.06
Schaeffler Finance BV
EUR 130,000 2.500% due 15/05/20 ...... 133 0.03
Shell International Finance
BV
USD 161,000 4.375% due 11/05/45 ...... 142 0.03
SNS Bank NV
EUR 557,000 3.750% due 05/11/25 ...... 544 0.13
Vonovia Finance BV
USD 300,000 3.200% due 02/10/17 ...... 266 0.06
EUR 200,000 2.250% due 15/12/23 ...... 214 0.05
4,668 1.14
New Zealand (2.13%)
Fonterra Co-operative Group
Ltd
AUD 400,000 4.500% due 30/06/21 ...... 280 0.07
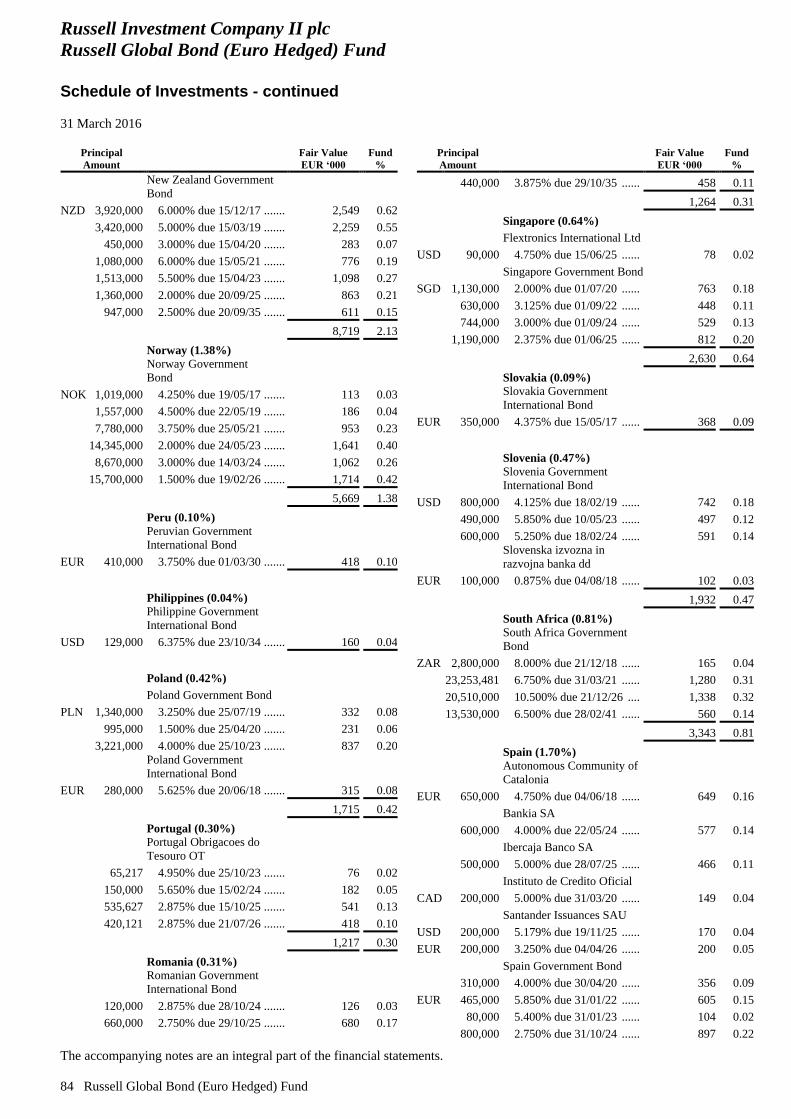
Russell Investment Company II plc
Russell Global Bond (Euro Hedged) Fund
Schedule of Investments - continued
31 March 2016
The accompanying notes are an integral part of the financial statements.
84 Russell Global Bond (Euro Hedged) Fund
Principal
Amount
Fair Value
EUR ‘000
Fund
%
New Zealand Government
Bond
NZD 3,920,000 6.000% due 15/12/17 ....... 2,549 0.62
3,420,000 5.000% due 15/03/19 ....... 2,259 0.55
450,000 3.000% due 15/04/20 ....... 283 0.07
1,080,000 6.000% due 15/05/21 ....... 776 0.19
1,513,000 5.500% due 15/04/23 ....... 1,098 0.27
1,360,000 2.000% due 20/09/25 ....... 863 0.21
947,000 2.500% due 20/09/35 ....... 611 0.15
8,719 2.13
Norway (1.38%)
Norway Government
Bond
NOK 1,019,000 4.250% due 19/05/17 ....... 113 0.03
1,557,000 4.500% due 22/05/19 ....... 186 0.04
7,780,000 3.750% due 25/05/21 ....... 953 0.23
14,345,000 2.000% due 24/05/23 ....... 1,641 0.40
8,670,000 3.000% due 14/03/24 ....... 1,062 0.26
15,700,000 1.500% due 19/02/26 ....... 1,714 0.42
5,669 1.38
Peru (0.10%)
Peruvian Government
International Bond
EUR 410,000 3.750% due 01/03/30 ....... 418 0.10
Philippines (0.04%)
Philippine Government
International Bond
USD 129,000 6.375% due 23/10/34 ....... 160 0.04
Poland (0.42%)
Poland Government Bond
PLN 1,340,000 3.250% due 25/07/19 ....... 332 0.08
995,000 1.500% due 25/04/20 ....... 231 0.06
3,221,000 4.000% due 25/10/23 ....... 837 0.20
Poland Government
International Bond
EUR 280,000 5.625% due 20/06/18 ....... 315 0.08
1,715 0.42
Portugal (0.30%)
Portugal Obrigacoes do
Tesouro OT
65,217 4.950% due 25/10/23 ....... 76 0.02
150,000 5.650% due 15/02/24 ....... 182 0.05
535,627 2.875% due 15/10/25 ....... 541 0.13
420,121 2.875% due 21/07/26 ....... 418 0.10
1,217 0.30
Romania (0.31%)
Romanian Government
International Bond
120,000 2.875% due 28/10/24 ....... 126 0.03
660,000 2.750% due 29/10/25 ....... 680 0.17
Principal
Amount
Fair Value
EUR ‘000
Fund
%
440,000 3.875% due 29/10/35 ...... 458 0.11
1,264 0.31
Singapore (0.64%)
Flextronics International Ltd
USD 90,000 4.750% due 15/06/25 ...... 78 0.02
Singapore Government Bond
SGD 1,130,000 2.000% due 01/07/20 ...... 763 0.18
630,000 3.125% due 01/09/22 ...... 448 0.11
744,000 3.000% due 01/09/24 ...... 529 0.13
1,190,000 2.375% due 01/06/25 ...... 812 0.20
2,630 0.64
Slovakia (0.09%)
Slovakia Government
International Bond
EUR 350,000 4.375% due 15/05/17 ...... 368 0.09
Slovenia (0.47%)
Slovenia Government
International Bond
USD 800,000 4.125% due 18/02/19 ...... 742 0.18
490,000 5.850% due 10/05/23 ...... 497 0.12
600,000 5.250% due 18/02/24 ...... 591 0.14
Slovenska izvozna in
razvojna banka dd
EUR 100,000 0.875% due 04/08/18 ...... 102 0.03
1,932 0.47
South Africa (0.81%)
South Africa Government
Bond
ZAR 2,800,000 8.000% due 21/12/18 ...... 165 0.04
23,253,481 6.750% due 31/03/21 ...... 1,280 0.31
20,510,000 10.500% due 21/12/26 .... 1,338 0.32
13,530,000 6.500% due 28/02/41 ...... 560 0.14
3,343 0.81
Spain (1.70%)
Autonomous Community of
Catalonia
EUR 650,000 4.750% due 04/06/18 ...... 649 0.16
Bankia SA
600,000 4.000% due 22/05/24 ...... 577 0.14
Ibercaja Banco SA
500,000 5.000% due 28/07/25 ...... 466 0.11
Instituto de Credito Oficial
CAD 200,000 5.000% due 31/03/20 ...... 149 0.04
Santander Issuances SAU
USD 200,000 5.179% due 19/11/25 ...... 170 0.04
EUR 200,000 3.250% due 04/04/26 ...... 200 0.05
Spain Government Bond
310,000 4.000% due 30/04/20 ...... 356 0.09
EUR 465,000 5.850% due 31/01/22 ...... 605 0.15
80,000 5.400% due 31/01/23 ...... 104 0.02
800,000 2.750% due 31/10/24 ...... 897 0.22
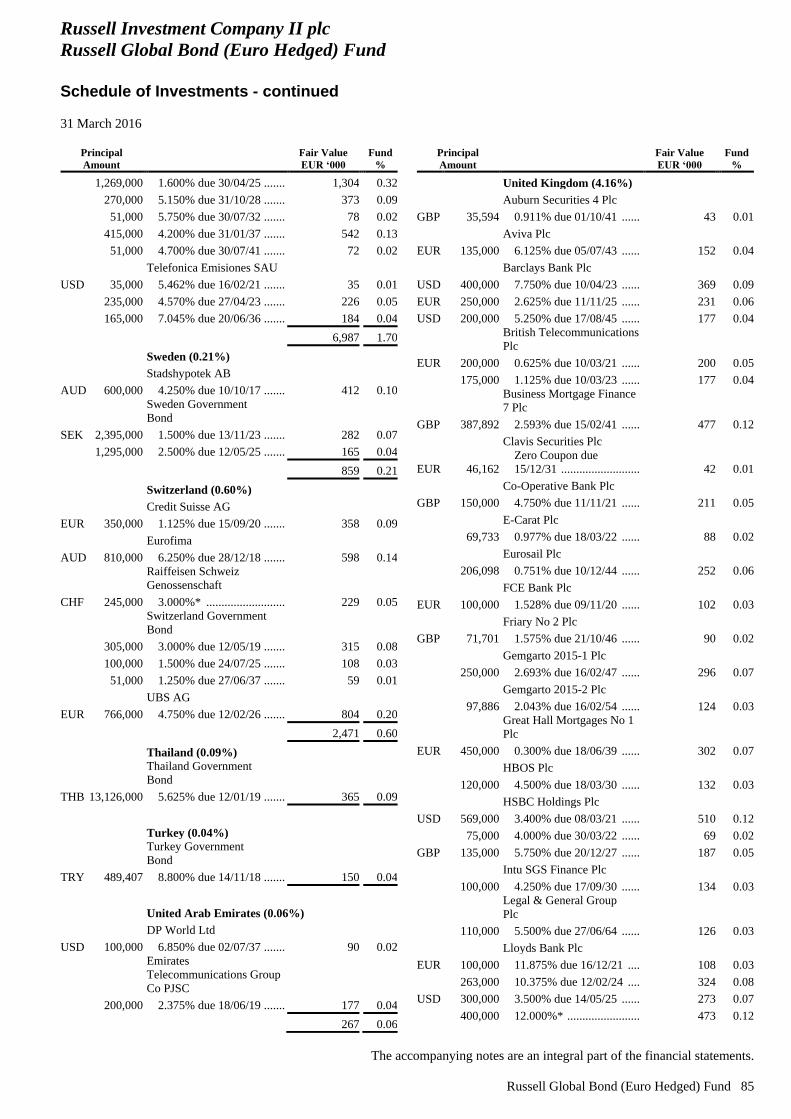
Russell Investment Company II plc
Russell Global Bond (Euro Hedged) Fund
Schedule of Investments - continued
31 March 2016
The accompanying notes are an integral part of the financial statements.
Russell Global Bond (Euro Hedged) Fund 85
Principal
Amount
Fair Value
EUR ‘000
Fund
%
1,269,000 1.600% due 30/04/25 ....... 1,304 0.32
270,000 5.150% due 31/10/28 ....... 373 0.09
51,000 5.750% due 30/07/32 ....... 78 0.02
415,000 4.200% due 31/01/37 ....... 542 0.13
51,000 4.700% due 30/07/41 ....... 72 0.02
Telefonica Emisiones SAU
USD 35,000 5.462% due 16/02/21 ....... 35 0.01
235,000 4.570% due 27/04/23 ....... 226 0.05
165,000 7.045% due 20/06/36 ....... 184 0.04
6,987 1.70
Sweden (0.21%)
Stadshypotek AB
AUD 600,000 4.250% due 10/10/17 ....... 412 0.10
Sweden Government
Bond
SEK 2,395,000 1.500% due 13/11/23 ....... 282 0.07
1,295,000 2.500% due 12/05/25 ....... 165 0.04
859 0.21
Switzerland (0.60%)
Credit Suisse AG
EUR 350,000 1.125% due 15/09/20 ....... 358 0.09
Eurofima
AUD 810,000 6.250% due 28/12/18 ....... 598 0.14
Raiffeisen Schweiz
Genossenschaft
CHF 245,000 3.000%* .......................... 229 0.05
Switzerland Government
Bond
305,000 3.000% due 12/05/19 ....... 315 0.08
100,000 1.500% due 24/07/25 ....... 108 0.03
51,000 1.250% due 27/06/37 ....... 59 0.01
UBS AG
EUR 766,000 4.750% due 12/02/26 ....... 804 0.20
2,471 0.60
Thailand (0.09%)
Thailand Government
Bond
THB 13,126,000 5.625% due 12/01/19 ....... 365 0.09
Turkey (0.04%)
Turkey Government
Bond
TRY 489,407 8.800% due 14/11/18 ....... 150 0.04
United Arab Emirates (0.06%)
DP World Ltd
USD 100,000 6.850% due 02/07/37 ....... 90 0.02
Emirates
Telecommunications Group
Co PJSC
200,000 2.375% due 18/06/19 ....... 177 0.04
267 0.06
Principal
Amount
Fair Value
EUR ‘000
Fund
%
United Kingdom (4.16%)
Auburn Securities 4 Plc
GBP 35,594 0.911% due 01/10/41 ...... 43 0.01
Aviva Plc
EUR 135,000 6.125% due 05/07/43 ...... 152 0.04
Barclays Bank Plc
USD 400,000 7.750% due 10/04/23 ...... 369 0.09
EUR 250,000 2.625% due 11/11/25 ...... 231 0.06
USD 200,000 5.250% due 17/08/45 ...... 177 0.04
British Telecommunications
Plc
EUR 200,000 0.625% due 10/03/21 ...... 200 0.05
175,000 1.125% due 10/03/23 ...... 177 0.04
Business Mortgage Finance
7 Plc
GBP 387,892 2.593% due 15/02/41 ...... 477 0.12
Clavis Securities Plc
EUR 46,162
Zero Coupon due
15/12/31 .......................... 42 0.01
Co-Operative Bank Plc
GBP 150,000 4.750% due 11/11/21 ...... 211 0.05
E-Carat Plc
69,733 0.977% due 18/03/22 ...... 88 0.02
Eurosail Plc
206,098 0.751% due 10/12/44 ...... 252 0.06
FCE Bank Plc
EUR 100,000 1.528% due 09/11/20 ...... 102 0.03
Friary No 2 Plc
GBP 71,701 1.575% due 21/10/46 ...... 90 0.02
Gemgarto 2015-1 Plc
250,000 2.693% due 16/02/47 ...... 296 0.07
Gemgarto 2015-2 Plc
97,886 2.043% due 16/02/54 ...... 124 0.03
Great Hall Mortgages No 1
Plc
EUR 450,000 0.300% due 18/06/39 ...... 302 0.07
HBOS Plc
120,000 4.500% due 18/03/30 ...... 132 0.03
HSBC Holdings Plc
USD 569,000 3.400% due 08/03/21 ...... 510 0.12
75,000 4.000% due 30/03/22 ...... 69 0.02
GBP 135,000 5.750% due 20/12/27 ...... 187 0.05
Intu SGS Finance Plc
100,000 4.250% due 17/09/30 ...... 134 0.03
Legal & General Group
Plc
110,000 5.500% due 27/06/64 ...... 126 0.03
Lloyds Bank Plc
EUR 100,000 11.875% due 16/12/21 .... 108 0.03
263,000 10.375% due 12/02/24 .... 324 0.08
USD 300,000 3.500% due 14/05/25 ...... 273 0.07
400,000 12.000%* ........................ 473 0.12
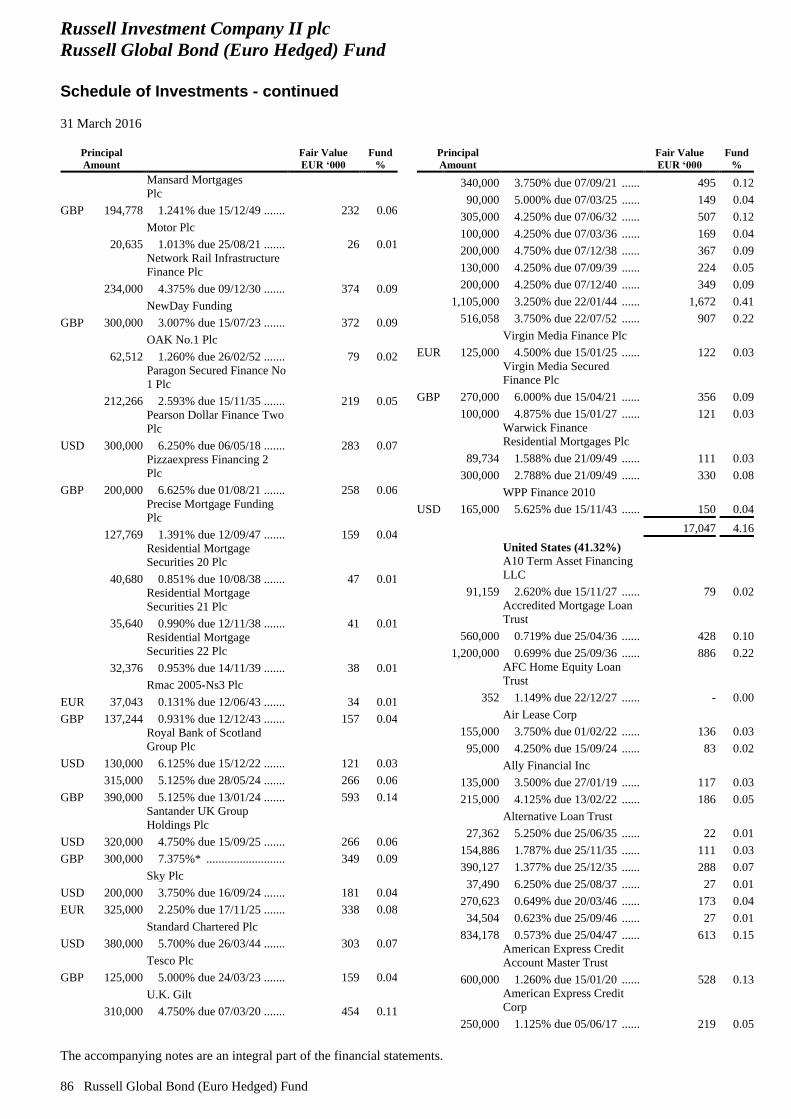
Russell Investment Company II plc
Russell Global Bond (Euro Hedged) Fund
Schedule of Investments - continued
31 March 2016
The accompanying notes are an integral part of the financial statements.
86 Russell Global Bond (Euro Hedged) Fund
Principal
Amount
Fair Value
EUR ‘000
Fund
%
Mansard Mortgages
Plc
GBP 194,778 1.241% due 15/12/49 ....... 232 0.06
Motor Plc
20,635 1.013% due 25/08/21 ....... 26 0.01
Network Rail Infrastructure
Finance Plc
234,000 4.375% due 09/12/30 ....... 374 0.09
NewDay Funding
GBP 300,000 3.007% due 15/07/23 ....... 372 0.09
OAK No.1 Plc
62,512 1.260% due 26/02/52 ....... 79 0.02
Paragon Secured Finance No
1 Plc
212,266 2.593% due 15/11/35 ....... 219 0.05
Pearson Dollar Finance Two
Plc
USD 300,000 6.250% due 06/05/18 ....... 283 0.07
Pizzaexpress Financing 2
Plc
GBP 200,000 6.625% due 01/08/21 ....... 258 0.06
Precise Mortgage Funding
Plc
127,769 1.391% due 12/09/47 ....... 159 0.04
Residential Mortgage
Securities 20 Plc
40,680 0.851% due 10/08/38 ....... 47 0.01
Residential Mortgage
Securities 21 Plc
35,640 0.990% due 12/11/38 ....... 41 0.01
Residential Mortgage
Securities 22 Plc
32,376 0.953% due 14/11/39 ....... 38 0.01
Rmac 2005-Ns3 Plc
EUR 37,043 0.131% due 12/06/43 ....... 34 0.01
GBP 137,244 0.931% due 12/12/43 ....... 157 0.04
Royal Bank of Scotland
Group Plc
USD 130,000 6.125% due 15/12/22 ....... 121 0.03
315,000 5.125% due 28/05/24 ....... 266 0.06
GBP 390,000 5.125% due 13/01/24 ....... 593 0.14
Santander UK Group
Holdings Plc
USD 320,000 4.750% due 15/09/25 ....... 266 0.06
GBP 300,000 7.375%* .......................... 349 0.09
Sky Plc
USD 200,000 3.750% due 16/09/24 ....... 181 0.04
EUR 325,000 2.250% due 17/11/25 ....... 338 0.08
Standard Chartered Plc
USD 380,000 5.700% due 26/03/44 ....... 303 0.07
Tesco Plc
GBP 125,000 5.000% due 24/03/23 ....... 159 0.04
U.K. Gilt
310,000 4.750% due 07/03/20 ....... 454 0.11
Principal
Amount
Fair Value
EUR ‘000
Fund
%
340,000 3.750% due 07/09/21 ...... 495 0.12
90,000 5.000% due 07/03/25 ...... 149 0.04
305,000 4.250% due 07/06/32 ...... 507 0.12
100,000 4.250% due 07/03/36 ...... 169 0.04
200,000 4.750% due 07/12/38 ...... 367 0.09
130,000 4.250% due 07/09/39 ...... 224 0.05
200,000 4.250% due 07/12/40 ...... 349 0.09
1,105,000 3.250% due 22/01/44 ...... 1,672 0.41
516,058 3.750% due 22/07/52 ...... 907 0.22
Virgin Media Finance Plc
EUR 125,000 4.500% due 15/01/25 ...... 122 0.03
Virgin Media Secured
Finance Plc
GBP 270,000 6.000% due 15/04/21 ...... 356 0.09
100,000 4.875% due 15/01/27 ...... 121 0.03
Warwick Finance
Residential Mortgages Plc
89,734 1.588% due 21/09/49 ...... 111 0.03
300,000 2.788% due 21/09/49 ...... 330 0.08
WPP Finance 2010
USD 165,000 5.625% due 15/11/43 ...... 150 0.04
17,047 4.16
United States (41.32%)
A10 Term Asset Financing
LLC
91,159 2.620% due 15/11/27 ...... 79 0.02
Accredited Mortgage Loan
Trust
560,000 0.719% due 25/04/36 ...... 428 0.10
1,200,000 0.699% due 25/09/36 ...... 886 0.22
AFC Home Equity Loan
Trust
352 1.149% due 22/12/27 ...... - 0.00
Air Lease Corp
155,000 3.750% due 01/02/22 ...... 136 0.03
95,000 4.250% due 15/09/24 ...... 83 0.02
Ally Financial Inc
135,000 3.500% due 27/01/19 ...... 117 0.03
215,000 4.125% due 13/02/22 ...... 186 0.05
Alternative Loan Trust
27,362 5.250% due 25/06/35 ...... 22 0.01
154,886 1.787% due 25/11/35 ...... 111 0.03
390,127 1.377% due 25/12/35 ...... 288 0.07
37,490 6.250% due 25/08/37 ...... 27 0.01
270,623 0.649% due 20/03/46 ...... 173 0.04
34,504 0.623% due 25/09/46 ...... 27 0.01
834,178 0.573% due 25/04/47 ...... 613 0.15
American Express Credit
Account Master Trust
600,000 1.260% due 15/01/20 ...... 528 0.13
American Express Credit
Corp
250,000 1.125% due 05/06/17 ...... 219 0.05
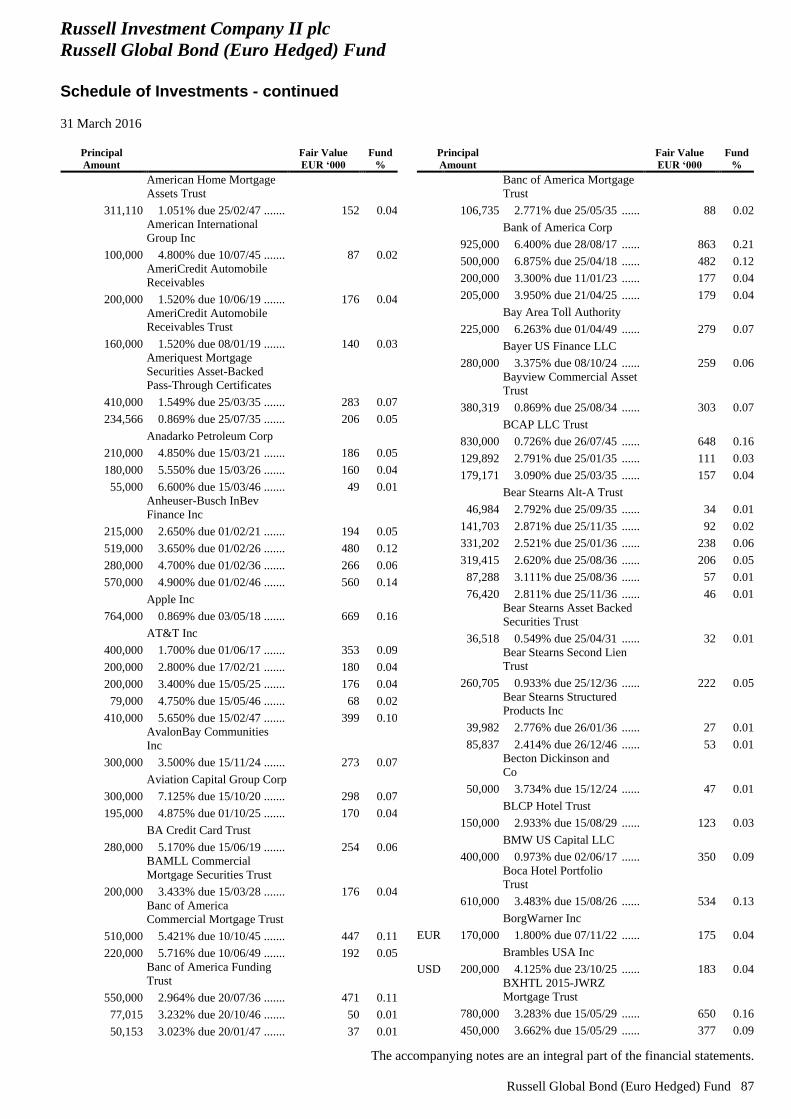
Russell Investment Company II plc
Russell Global Bond (Euro Hedged) Fund
Schedule of Investments - continued
31 March 2016
The accompanying notes are an integral part of the financial statements.
Russell Global Bond (Euro Hedged) Fund 87
Principal
Amount
Fair Value
EUR ‘000
Fund
%
American Home Mortgage
Assets Trust
311,110 1.051% due 25/02/47 ....... 152 0.04
American International
Group Inc
100,000 4.800% due 10/07/45 ....... 87 0.02
AmeriCredit Automobile
Receivables
200,000 1.520% due 10/06/19 ....... 176 0.04
AmeriCredit Automobile
Receivables Trust
160,000 1.520% due 08/01/19 ....... 140 0.03
Ameriquest Mortgage
Securities Asset-Backed
Pass-Through Certificates
410,000 1.549% due 25/03/35 ....... 283 0.07
234,566 0.869% due 25/07/35 ....... 206 0.05
Anadarko Petroleum Corp
210,000 4.850% due 15/03/21 ....... 186 0.05
180,000 5.550% due 15/03/26 ....... 160 0.04
55,000 6.600% due 15/03/46 ....... 49 0.01
Anheuser-Busch InBev
Finance Inc
215,000 2.650% due 01/02/21 ....... 194 0.05
519,000 3.650% due 01/02/26 ....... 480 0.12
280,000 4.700% due 01/02/36 ....... 266 0.06
570,000 4.900% due 01/02/46 ....... 560 0.14
Apple Inc
764,000 0.869% due 03/05/18 ....... 669 0.16
AT&T Inc
400,000 1.700% due 01/06/17 ....... 353 0.09
200,000 2.800% due 17/02/21 ....... 180 0.04
200,000 3.400% due 15/05/25 ....... 176 0.04
79,000 4.750% due 15/05/46 ....... 68 0.02
410,000 5.650% due 15/02/47 ....... 399 0.10
AvalonBay Communities
Inc
300,000 3.500% due 15/11/24 ....... 273 0.07
Aviation Capital Group Corp
300,000 7.125% due 15/10/20 ....... 298 0.07
195,000 4.875% due 01/10/25 ....... 170 0.04
BA Credit Card Trust
280,000 5.170% due 15/06/19 ....... 254 0.06
BAMLL Commercial
Mortgage Securities Trust
200,000 3.433% due 15/03/28 ....... 176 0.04
Banc of America
Commercial Mortgage Trust
510,000 5.421% due 10/10/45 ....... 447 0.11
220,000 5.716% due 10/06/49 ....... 192 0.05
Banc of America Funding
Trust
550,000 2.964% due 20/07/36 ....... 471 0.11
77,015 3.232% due 20/10/46 ....... 50 0.01
50,153 3.023% due 20/01/47 ....... 37 0.01
Principal
Amount
Fair Value
EUR ‘000
Fund
%
Banc of America Mortgage
Trust
106,735 2.771% due 25/05/35 ...... 88 0.02
Bank of America Corp
925,000 6.400% due 28/08/17 ...... 863 0.21
500,000 6.875% due 25/04/18 ...... 482 0.12
200,000 3.300% due 11/01/23 ...... 177 0.04
205,000 3.950% due 21/04/25 ...... 179 0.04
Bay Area Toll Authority
225,000 6.263% due 01/04/49 ...... 279 0.07
Bayer US Finance LLC
280,000 3.375% due 08/10/24 ...... 259 0.06
Bayview Commercial Asset
Trust
380,319 0.869% due 25/08/34 ...... 303 0.07
BCAP LLC Trust
830,000 0.726% due 26/07/45 ...... 648 0.16
129,892 2.791% due 25/01/35 ...... 111 0.03
179,171 3.090% due 25/03/35 ...... 157 0.04
Bear Stearns Alt-A Trust
46,984 2.792% due 25/09/35 ...... 34 0.01
141,703 2.871% due 25/11/35 ...... 92 0.02
331,202 2.521% due 25/01/36 ...... 238 0.06
319,415 2.620% due 25/08/36 ...... 206 0.05
87,288 3.111% due 25/08/36 ...... 57 0.01
76,420 2.811% due 25/11/36 ...... 46 0.01
Bear Stearns Asset Backed
Securities Trust
36,518 0.549% due 25/04/31 ...... 32 0.01
Bear Stearns Second Lien
Trust
260,705 0.933% due 25/12/36 ...... 222 0.05
Bear Stearns Structured
Products Inc
39,982 2.776% due 26/01/36 ...... 27 0.01
85,837 2.414% due 26/12/46 ...... 53 0.01
Becton Dickinson and
Co
50,000 3.734% due 15/12/24 ...... 47 0.01
BLCP Hotel Trust
150,000 2.933% due 15/08/29 ...... 123 0.03
BMW US Capital LLC
400,000 0.973% due 02/06/17 ...... 350 0.09
Boca Hotel Portfolio
Trust
610,000 3.483% due 15/08/26 ...... 534 0.13
BorgWarner Inc
EUR 170,000 1.800% due 07/11/22 ...... 175 0.04
Brambles USA Inc
USD 200,000 4.125% due 23/10/25 ...... 183 0.04
BXHTL 2015-JWRZ
Mortgage Trust
780,000 3.283% due 15/05/29 ...... 650 0.16
450,000 3.662% due 15/05/29 ...... 377 0.09
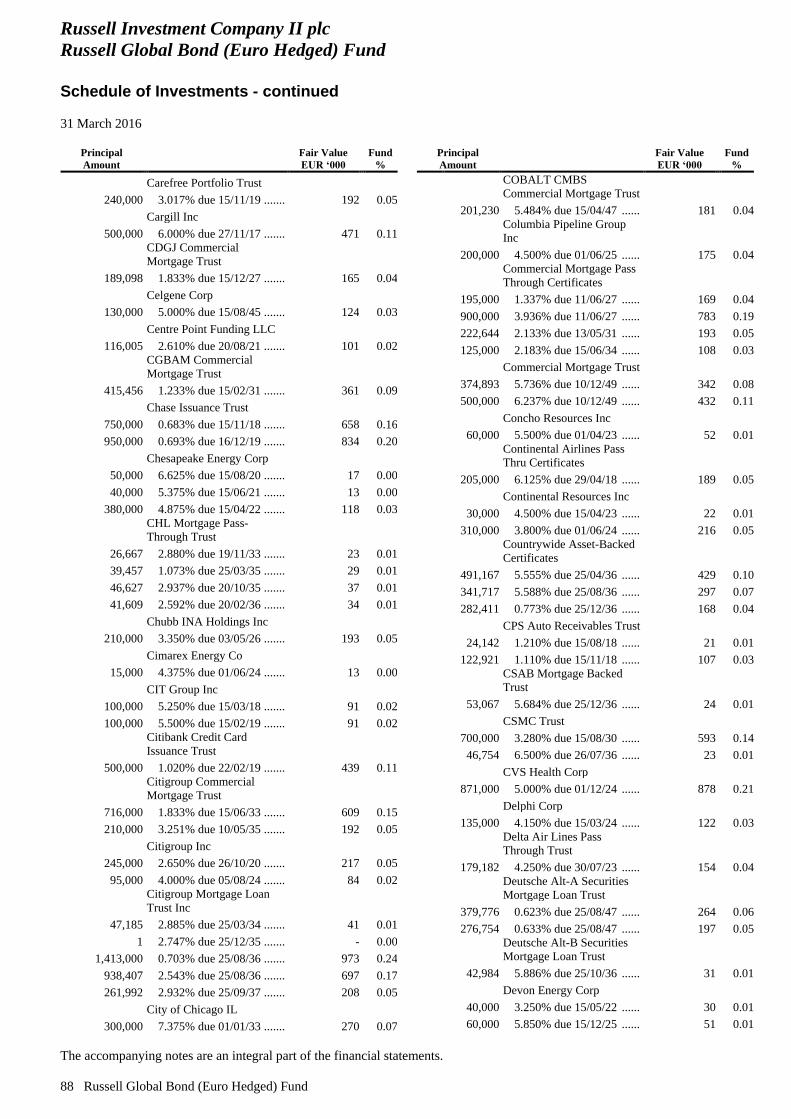
Russell Investment Company II plc
Russell Global Bond (Euro Hedged) Fund
Schedule of Investments - continued
31 March 2016
The accompanying notes are an integral part of the financial statements.
88 Russell Global Bond (Euro Hedged) Fund
Principal
Amount
Fair Value
EUR ‘000
Fund
%
Carefree Portfolio Trust
240,000 3.017% due 15/11/19 ....... 192 0.05
Cargill Inc
500,000 6.000% due 27/11/17 ....... 471 0.11
CDGJ Commercial
Mortgage Trust
189,098 1.833% due 15/12/27 ....... 165 0.04
Celgene Corp
130,000 5.000% due 15/08/45 ....... 124 0.03
Centre Point Funding LLC
116,005 2.610% due 20/08/21 ....... 101 0.02
CGBAM Commercial
Mortgage Trust
415,456 1.233% due 15/02/31 ....... 361 0.09
Chase Issuance Trust
750,000 0.683% due 15/11/18 ....... 658 0.16
950,000 0.693% due 16/12/19 ....... 834 0.20
Chesapeake Energy Corp
50,000 6.625% due 15/08/20 ....... 17 0.00
40,000 5.375% due 15/06/21 ....... 13 0.00
380,000 4.875% due 15/04/22 ....... 118 0.03
CHL Mortgage Pass-
Through Trust
26,667 2.880% due 19/11/33 ....... 23 0.01
39,457 1.073% due 25/03/35 ....... 29 0.01
46,627 2.937% due 20/10/35 ....... 37 0.01
41,609 2.592% due 20/02/36 ....... 34 0.01
Chubb INA Holdings Inc
210,000 3.350% due 03/05/26 ....... 193 0.05
Cimarex Energy Co
15,000 4.375% due 01/06/24 ....... 13 0.00
CIT Group Inc
100,000 5.250% due 15/03/18 ....... 91 0.02
100,000 5.500% due 15/02/19 ....... 91 0.02
Citibank Credit Card
Issuance Trust
500,000 1.020% due 22/02/19 ....... 439 0.11
Citigroup Commercial
Mortgage Trust
716,000 1.833% due 15/06/33 ....... 609 0.15
210,000 3.251% due 10/05/35 ....... 192 0.05
Citigroup Inc
245,000 2.650% due 26/10/20 ....... 217 0.05
95,000 4.000% due 05/08/24 ....... 84 0.02
Citigroup Mortgage Loan
Trust Inc
47,185 2.885% due 25/03/34 ....... 41 0.01
1 2.747% due 25/12/35 ....... - 0.00
1,413,000 0.703% due 25/08/36 ....... 973 0.24
938,407 2.543% due 25/08/36 ....... 697 0.17
261,992 2.932% due 25/09/37 ....... 208 0.05
City of Chicago IL
300,000 7.375% due 01/01/33 ....... 270 0.07
Principal
Amount
Fair Value
EUR ‘000
Fund
%
COBALT CMBS
Commercial Mortgage Trust
201,230 5.484% due 15/04/47 ...... 181 0.04
Columbia Pipeline Group
Inc
200,000 4.500% due 01/06/25 ...... 175 0.04
Commercial Mortgage Pass
Through Certificates
195,000 1.337% due 11/06/27 ...... 169 0.04
900,000 3.936% due 11/06/27 ...... 783 0.19
222,644 2.133% due 13/05/31 ...... 193 0.05
125,000 2.183% due 15/06/34 ...... 108 0.03
Commercial Mortgage Trust
374,893 5.736% due 10/12/49 ...... 342 0.08
500,000 6.237% due 10/12/49 ...... 432 0.11
Concho Resources Inc
60,000 5.500% due 01/04/23 ...... 52 0.01
Continental Airlines Pass
Thru Certificates
205,000 6.125% due 29/04/18 ...... 189 0.05
Continental Resources Inc
30,000 4.500% due 15/04/23 ...... 22 0.01
310,000 3.800% due 01/06/24 ...... 216 0.05
Countrywide Asset-Backed
Certificates
491,167 5.555% due 25/04/36 ...... 429 0.10
341,717 5.588% due 25/08/36 ...... 297 0.07
282,411 0.773% due 25/12/36 ...... 168 0.04
CPS Auto Receivables Trust
24,142 1.210% due 15/08/18 ...... 21 0.01
122,921 1.110% due 15/11/18 ...... 107 0.03
CSAB Mortgage Backed
Trust
53,067 5.684% due 25/12/36 ...... 24 0.01
CSMC Trust
700,000 3.280% due 15/08/30 ...... 593 0.14
46,754 6.500% due 26/07/36 ...... 23 0.01
CVS Health Corp
871,000 5.000% due 01/12/24 ...... 878 0.21
Delphi Corp
135,000 4.150% due 15/03/24 ...... 122 0.03
Delta Air Lines Pass
Through Trust
179,182 4.250% due 30/07/23 ...... 154 0.04
Deutsche Alt-A Securities
Mortgage Loan Trust
379,776 0.623% due 25/08/47 ...... 264 0.06
276,754 0.633% due 25/08/47 ...... 197 0.05
Deutsche Alt-B Securities
Mortgage Loan Trust
42,984 5.886% due 25/10/36 ...... 31 0.01
Devon Energy Corp
40,000 3.250% due 15/05/22 ...... 30 0.01
60,000 5.850% due 15/12/25 ...... 51 0.01
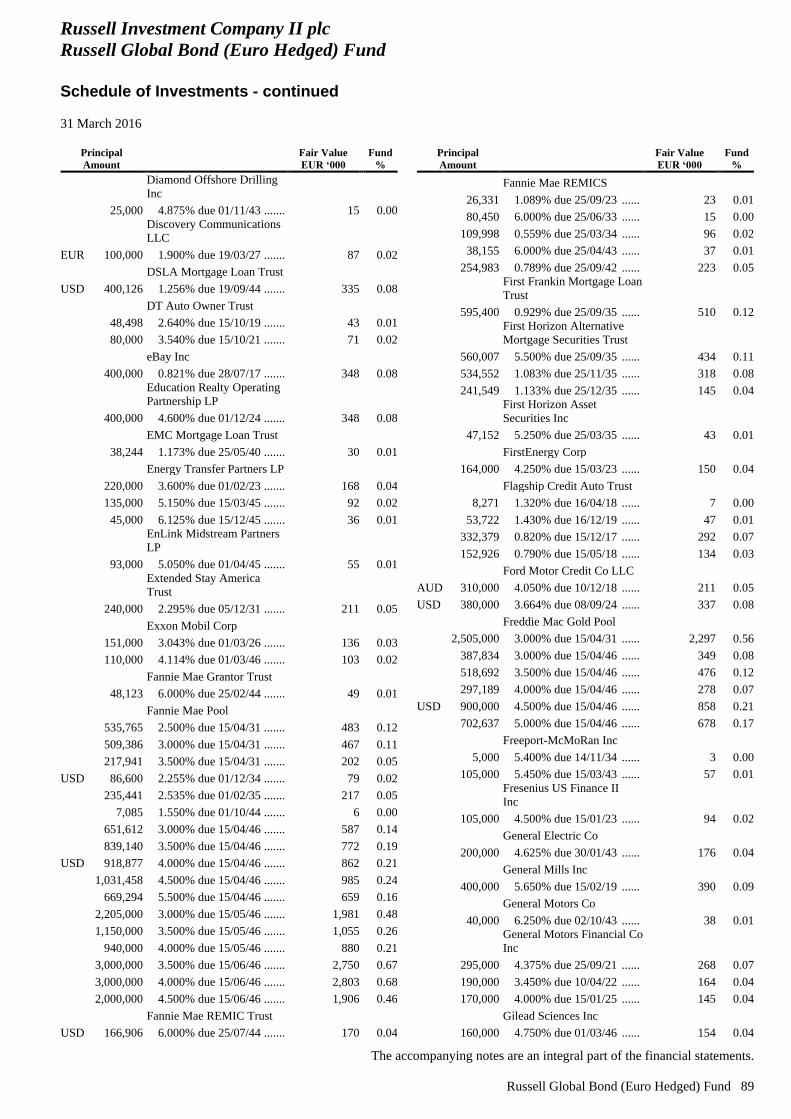
Russell Investment Company II plc
Russell Global Bond (Euro Hedged) Fund
Schedule of Investments - continued
31 March 2016
The accompanying notes are an integral part of the financial statements.
Russell Global Bond (Euro Hedged) Fund 89
Principal
Amount
Fair Value
EUR ‘000
Fund
%
Diamond Offshore Drilling
Inc
25,000 4.875% due 01/11/43 ....... 15 0.00
Discovery Communications
LLC
EUR 100,000 1.900% due 19/03/27 ....... 87 0.02
DSLA Mortgage Loan Trust
USD 400,126 1.256% due 19/09/44 ....... 335 0.08
DT Auto Owner Trust
48,498 2.640% due 15/10/19 ....... 43 0.01
80,000 3.540% due 15/10/21 ....... 71 0.02
eBay Inc
400,000 0.821% due 28/07/17 ....... 348 0.08
Education Realty Operating
Partnership LP
400,000 4.600% due 01/12/24 ....... 348 0.08
EMC Mortgage Loan Trust
38,244 1.173% due 25/05/40 ....... 30 0.01
Energy Transfer Partners LP
220,000 3.600% due 01/02/23 ....... 168 0.04
135,000 5.150% due 15/03/45 ....... 92 0.02
45,000 6.125% due 15/12/45 ....... 36 0.01
EnLink Midstream Partners
LP
93,000 5.050% due 01/04/45 ....... 55 0.01
Extended Stay America
Trust
240,000 2.295% due 05/12/31 ....... 211 0.05
Exxon Mobil Corp
151,000 3.043% due 01/03/26 ....... 136 0.03
110,000 4.114% due 01/03/46 ....... 103 0.02
Fannie Mae Grantor Trust
48,123 6.000% due 25/02/44 ....... 49 0.01
Fannie Mae Pool
535,765 2.500% due 15/04/31 ....... 483 0.12
509,386 3.000% due 15/04/31 ....... 467 0.11
217,941 3.500% due 15/04/31 ....... 202 0.05
USD 86,600 2.255% due 01/12/34 ....... 79 0.02
235,441 2.535% due 01/02/35 ....... 217 0.05
7,085 1.550% due 01/10/44 ....... 6 0.00
651,612 3.000% due 15/04/46 ....... 587 0.14
839,140 3.500% due 15/04/46 ....... 772 0.19
USD 918,877 4.000% due 15/04/46 ....... 862 0.21
1,031,458 4.500% due 15/04/46 ....... 985 0.24
669,294 5.500% due 15/04/46 ....... 659 0.16
2,205,000 3.000% due 15/05/46 ....... 1,981 0.48
1,150,000 3.500% due 15/05/46 ....... 1,055 0.26
940,000 4.000% due 15/05/46 ....... 880 0.21
3,000,000 3.500% due 15/06/46 ....... 2,750 0.67
3,000,000 4.000% due 15/06/46 ....... 2,803 0.68
2,000,000 4.500% due 15/06/46 ....... 1,906 0.46
Fannie Mae REMIC Trust
USD 166,906 6.000% due 25/07/44 ....... 170 0.04
Principal
Amount
Fair Value
EUR ‘000
Fund
%
Fannie Mae REMICS
26,331 1.089% due 25/09/23 ...... 23 0.01
80,450 6.000% due 25/06/33 ...... 15 0.00
109,998 0.559% due 25/03/34 ...... 96 0.02
38,155 6.000% due 25/04/43 ...... 37 0.01
254,983 0.789% due 25/09/42 ...... 223 0.05
First Frankin Mortgage Loan
Trust
595,400 0.929% due 25/09/35 ...... 510 0.12
First Horizon Alternative
Mortgage Securities Trust
560,007 5.500% due 25/09/35 ...... 434 0.11
534,552 1.083% due 25/11/35 ...... 318 0.08
241,549 1.133% due 25/12/35 ...... 145 0.04
First Horizon Asset
Securities Inc
47,152 5.250% due 25/03/35 ...... 43 0.01
FirstEnergy Corp
164,000 4.250% due 15/03/23 ...... 150 0.04
Flagship Credit Auto Trust
8,271 1.320% due 16/04/18 ...... 7 0.00
53,722 1.430% due 16/12/19 ...... 47 0.01
332,379 0.820% due 15/12/17 ...... 292 0.07
152,926 0.790% due 15/05/18 ...... 134 0.03
Ford Motor Credit Co LLC
AUD 310,000 4.050% due 10/12/18 ...... 211 0.05
USD 380,000 3.664% due 08/09/24 ...... 337 0.08
Freddie Mac Gold Pool
2,505,000 3.000% due 15/04/31 ...... 2,297 0.56
387,834 3.000% due 15/04/46 ...... 349 0.08
518,692 3.500% due 15/04/46 ...... 476 0.12
297,189 4.000% due 15/04/46 ...... 278 0.07
USD 900,000 4.500% due 15/04/46 ...... 858 0.21
702,637 5.000% due 15/04/46 ...... 678 0.17
Freeport-McMoRan Inc
5,000 5.400% due 14/11/34 ...... 3 0.00
105,000 5.450% due 15/03/43 ...... 57 0.01
Fresenius US Finance II
Inc
105,000 4.500% due 15/01/23 ...... 94 0.02
General Electric Co
200,000 4.625% due 30/01/43 ...... 176 0.04
General Mills Inc
400,000 5.650% due 15/02/19 ...... 390 0.09
General Motors Co
40,000 6.250% due 02/10/43 ...... 38 0.01
General Motors Financial Co
Inc
295,000 4.375% due 25/09/21 ...... 268 0.07
190,000 3.450% due 10/04/22 ...... 164 0.04
170,000 4.000% due 15/01/25 ...... 145 0.04
Gilead Sciences Inc
160,000 4.750% due 01/03/46 ...... 154 0.04
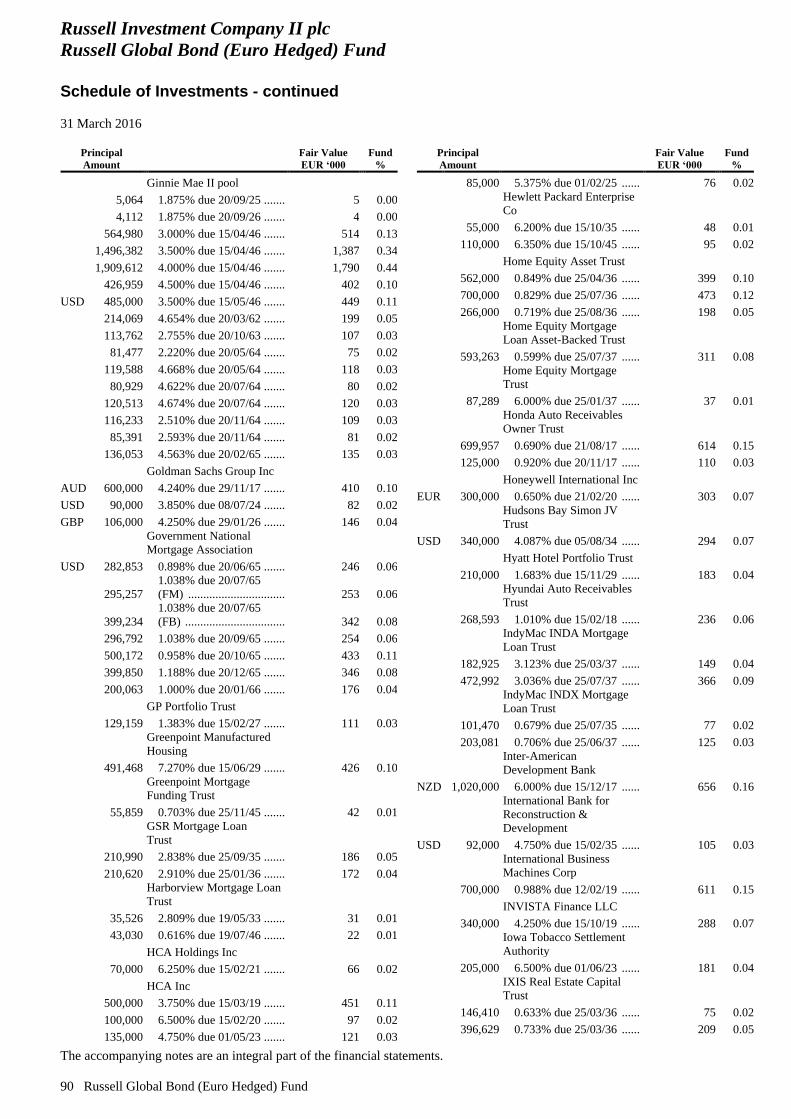
Russell Investment Company II plc
Russell Global Bond (Euro Hedged) Fund
Schedule of Investments - continued
31 March 2016
The accompanying notes are an integral part of the financial statements.
90 Russell Global Bond (Euro Hedged) Fund
Principal
Amount
Fair Value
EUR ‘000
Fund
%
Ginnie Mae II pool
5,064 1.875% due 20/09/25 ....... 5 0.00
4,112 1.875% due 20/09/26 ....... 4 0.00
564,980 3.000% due 15/04/46 ....... 514 0.13
1,496,382 3.500% due 15/04/46 ....... 1,387 0.34
1,909,612 4.000% due 15/04/46 ....... 1,790 0.44
426,959 4.500% due 15/04/46 ....... 402 0.10
USD 485,000 3.500% due 15/05/46 ....... 449 0.11
214,069 4.654% due 20/03/62 ....... 199 0.05
113,762 2.755% due 20/10/63 ....... 107 0.03
81,477 2.220% due 20/05/64 ....... 75 0.02
119,588 4.668% due 20/05/64 ....... 118 0.03
80,929 4.622% due 20/07/64 ....... 80 0.02
120,513 4.674% due 20/07/64 ....... 120 0.03
116,233 2.510% due 20/11/64 ....... 109 0.03
85,391 2.593% due 20/11/64 ....... 81 0.02
136,053 4.563% due 20/02/65 ....... 135 0.03
Goldman Sachs Group Inc
AUD 600,000 4.240% due 29/11/17 ....... 410 0.10
USD 90,000 3.850% due 08/07/24 ....... 82 0.02
GBP 106,000 4.250% due 29/01/26 ....... 146 0.04
Government National
Mortgage Association
USD 282,853 0.898% due 20/06/65 ....... 246 0.06
295,257
1.038% due 20/07/65
(FM) ................................ 253 0.06
399,234
1.038% due 20/07/65
(FB) ................................. 342 0.08
296,792 1.038% due 20/09/65 ....... 254 0.06
500,172 0.958% due 20/10/65 ....... 433 0.11
399,850 1.188% due 20/12/65 ....... 346 0.08
200,063 1.000% due 20/01/66 ....... 176 0.04
GP Portfolio Trust
129,159 1.383% due 15/02/27 ....... 111 0.03
Greenpoint Manufactured
Housing
491,468 7.270% due 15/06/29 ....... 426 0.10
Greenpoint Mortgage
Funding Trust
55,859 0.703% due 25/11/45 ....... 42 0.01
GSR Mortgage Loan
Trust
210,990 2.838% due 25/09/35 ....... 186 0.05
210,620 2.910% due 25/01/36 ....... 172 0.04
Harborview Mortgage Loan
Trust
35,526 2.809% due 19/05/33 ....... 31 0.01
43,030 0.616% due 19/07/46 ....... 22 0.01
HCA Holdings Inc
70,000 6.250% due 15/02/21 ....... 66 0.02
HCA Inc
500,000 3.750% due 15/03/19 ....... 451 0.11
100,000 6.500% due 15/02/20 ....... 97 0.02
135,000 4.750% due 01/05/23 ....... 121 0.03
Principal
Amount
Fair Value
EUR ‘000
Fund
%
85,000 5.375% due 01/02/25 ...... 76 0.02
Hewlett Packard Enterprise
Co
55,000 6.200% due 15/10/35 ...... 48 0.01
110,000 6.350% due 15/10/45 ...... 95 0.02
Home Equity Asset Trust
562,000 0.849% due 25/04/36 ...... 399 0.10
700,000 0.829% due 25/07/36 ...... 473 0.12
266,000 0.719% due 25/08/36 ...... 198 0.05
Home Equity Mortgage
Loan Asset-Backed Trust
593,263 0.599% due 25/07/37 ...... 311 0.08
Home Equity Mortgage
Trust
87,289 6.000% due 25/01/37 ...... 37 0.01
Honda Auto Receivables
Owner Trust
699,957 0.690% due 21/08/17 ...... 614 0.15
125,000 0.920% due 20/11/17 ...... 110 0.03
Honeywell International Inc
EUR 300,000 0.650% due 21/02/20 ...... 303 0.07
Hudsons Bay Simon JV
Trust
USD 340,000 4.087% due 05/08/34 ...... 294 0.07
Hyatt Hotel Portfolio Trust
210,000 1.683% due 15/11/29 ...... 183 0.04
Hyundai Auto Receivables
Trust
268,593 1.010% due 15/02/18 ...... 236 0.06
IndyMac INDA Mortgage
Loan Trust
182,925 3.123% due 25/03/37 ...... 149 0.04
472,992 3.036% due 25/07/37 ...... 366 0.09
IndyMac INDX Mortgage
Loan Trust
101,470 0.679% due 25/07/35 ...... 77 0.02
203,081 0.706% due 25/06/37 ...... 125 0.03
Inter-American
Development Bank
NZD 1,020,000 6.000% due 15/12/17 ...... 656 0.16
International Bank for
Reconstruction &
Development
USD 92,000 4.750% due 15/02/35 ...... 105 0.03
International Business
Machines Corp
700,000 0.988% due 12/02/19 ...... 611 0.15
INVISTA Finance LLC
340,000 4.250% due 15/10/19 ...... 288 0.07
Iowa Tobacco Settlement
Authority
205,000 6.500% due 01/06/23 ...... 181 0.04
IXIS Real Estate Capital
Trust
146,410 0.633% due 25/03/36 ...... 75 0.02
396,629 0.733% due 25/03/36 ...... 209 0.05
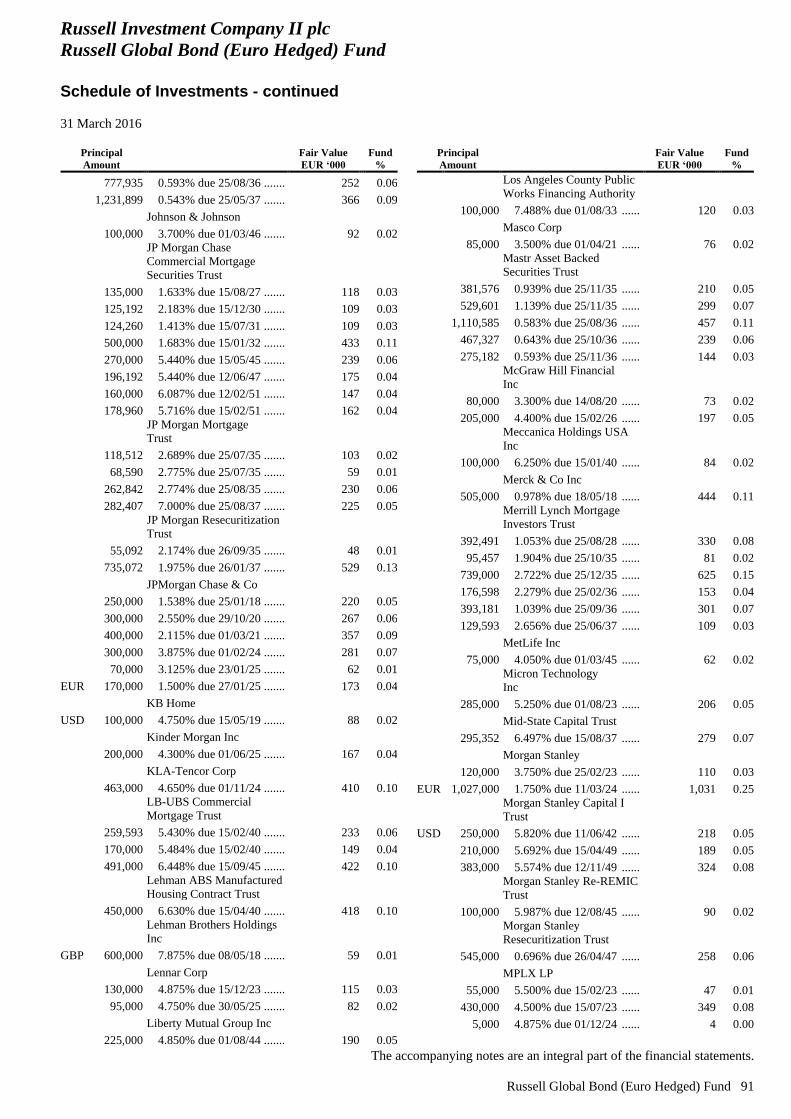
Russell Investment Company II plc
Russell Global Bond (Euro Hedged) Fund
Schedule of Investments - continued
31 March 2016
The accompanying notes are an integral part of the financial statements.
Russell Global Bond (Euro Hedged) Fund 91
Principal
Amount
Fair Value
EUR ‘000
Fund
%
777,935 0.593% due 25/08/36 ....... 252 0.06
1,231,899 0.543% due 25/05/37 ....... 366 0.09
Johnson & Johnson
100,000 3.700% due 01/03/46 ....... 92 0.02
JP Morgan Chase
Commercial Mortgage
Securities Trust
135,000 1.633% due 15/08/27 ....... 118 0.03
125,192 2.183% due 15/12/30 ....... 109 0.03
124,260 1.413% due 15/07/31 ....... 109 0.03
500,000 1.683% due 15/01/32 ....... 433 0.11
270,000 5.440% due 15/05/45 ....... 239 0.06
196,192 5.440% due 12/06/47 ....... 175 0.04
160,000 6.087% due 12/02/51 ....... 147 0.04
178,960 5.716% due 15/02/51 ....... 162 0.04
JP Morgan Mortgage
Trust
118,512 2.689% due 25/07/35 ....... 103 0.02
68,590 2.775% due 25/07/35 ....... 59 0.01
262,842 2.774% due 25/08/35 ....... 230 0.06
282,407 7.000% due 25/08/37 ....... 225 0.05
JP Morgan Resecuritization
Trust
55,092 2.174% due 26/09/35 ....... 48 0.01
735,072 1.975% due 26/01/37 ....... 529 0.13
JPMorgan Chase & Co
250,000 1.538% due 25/01/18 ....... 220 0.05
300,000 2.550% due 29/10/20 ....... 267 0.06
400,000 2.115% due 01/03/21 ....... 357 0.09
300,000 3.875% due 01/02/24 ....... 281 0.07
70,000 3.125% due 23/01/25 ....... 62 0.01
EUR 170,000 1.500% due 27/01/25 ....... 173 0.04
KB Home
USD 100,000 4.750% due 15/05/19 ....... 88 0.02
Kinder Morgan Inc
200,000 4.300% due 01/06/25 ....... 167 0.04
KLA-Tencor Corp
463,000 4.650% due 01/11/24 ....... 410 0.10
LB-UBS Commercial
Mortgage Trust
259,593 5.430% due 15/02/40 ....... 233 0.06
170,000 5.484% due 15/02/40 ....... 149 0.04
491,000 6.448% due 15/09/45 ....... 422 0.10
Lehman ABS Manufactured
Housing Contract Trust
450,000 6.630% due 15/04/40 ....... 418 0.10
Lehman Brothers Holdings
Inc
GBP 600,000 7.875% due 08/05/18 ....... 59 0.01
Lennar Corp
130,000 4.875% due 15/12/23 ....... 115 0.03
95,000 4.750% due 30/05/25 ....... 82 0.02
Liberty Mutual Group Inc
225,000 4.850% due 01/08/44 ....... 190 0.05
Principal
Amount
Fair Value
EUR ‘000
Fund
%
Los Angeles County Public
Works Financing Authority
100,000 7.488% due 01/08/33 ...... 120 0.03
Masco Corp
85,000 3.500% due 01/04/21 ...... 76 0.02
Mastr Asset Backed
Securities Trust
381,576 0.939% due 25/11/35 ...... 210 0.05
529,601 1.139% due 25/11/35 ...... 299 0.07
1,110,585 0.583% due 25/08/36 ...... 457 0.11
467,327 0.643% due 25/10/36 ...... 239 0.06
275,182 0.593% due 25/11/36 ...... 144 0.03
McGraw Hill Financial
Inc
80,000 3.300% due 14/08/20 ...... 73 0.02
205,000 4.400% due 15/02/26 ...... 197 0.05
Meccanica Holdings USA
Inc
100,000 6.250% due 15/01/40 ...... 84 0.02
Merck & Co Inc
505,000 0.978% due 18/05/18 ...... 444 0.11
Merrill Lynch Mortgage
Investors Trust
392,491 1.053% due 25/08/28 ...... 330 0.08
95,457 1.904% due 25/10/35 ...... 81 0.02
739,000 2.722% due 25/12/35 ...... 625 0.15
176,598 2.279% due 25/02/36 ...... 153 0.04
393,181 1.039% due 25/09/36 ...... 301 0.07
129,593 2.656% due 25/06/37 ...... 109 0.03
MetLife Inc
75,000 4.050% due 01/03/45 ...... 62 0.02
Micron Technology
Inc
285,000 5.250% due 01/08/23 ...... 206 0.05
Mid-State Capital Trust
295,352 6.497% due 15/08/37 ...... 279 0.07
Morgan Stanley
120,000 3.750% due 25/02/23 ...... 110 0.03
EUR 1,027,000 1.750% due 11/03/24 ...... 1,031 0.25
Morgan Stanley Capital I
Trust
USD 250,000 5.820% due 11/06/42 ...... 218 0.05
210,000 5.692% due 15/04/49 ...... 189 0.05
383,000 5.574% due 12/11/49 ...... 324 0.08
Morgan Stanley Re-REMIC
Trust
100,000 5.987% due 12/08/45 ...... 90 0.02
Morgan Stanley
Resecuritization Trust
545,000 0.696% due 26/04/47 ...... 258 0.06
MPLX LP
55,000 5.500% due 15/02/23 ...... 47 0.01
430,000 4.500% due 15/07/23 ...... 349 0.08
5,000 4.875% due 01/12/24 ...... 4 0.00
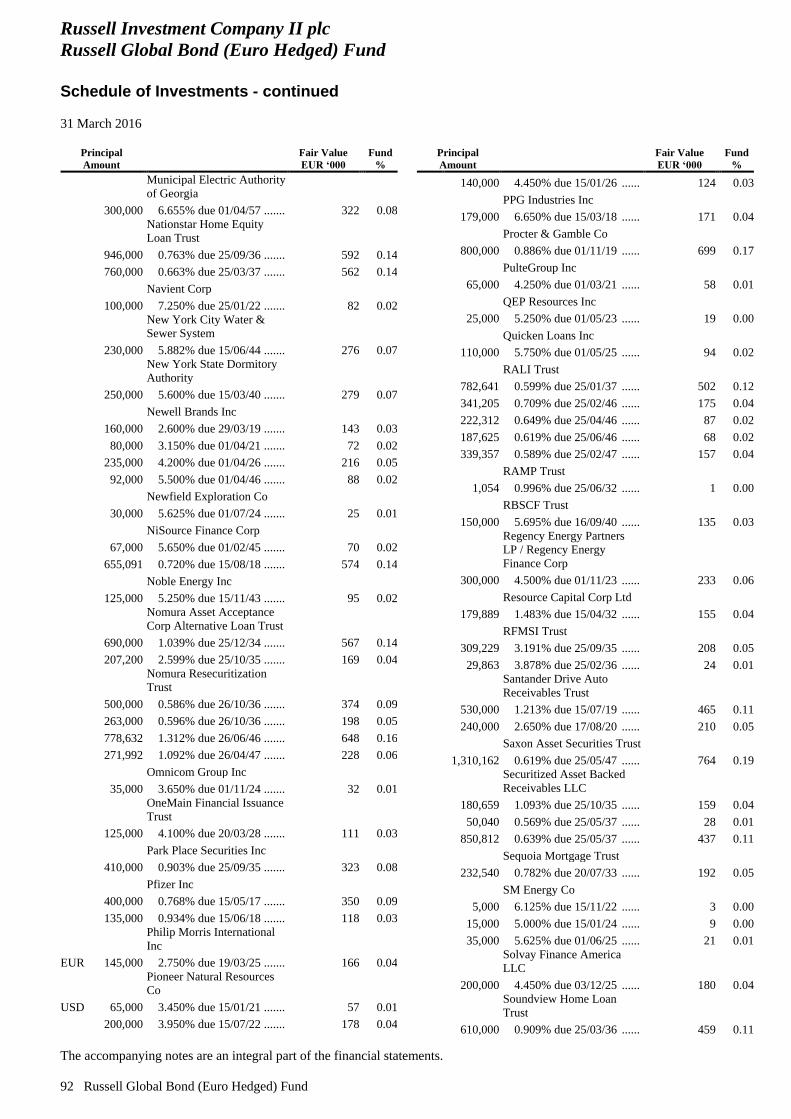
Russell Investment Company II plc
Russell Global Bond (Euro Hedged) Fund
Schedule of Investments - continued
31 March 2016
The accompanying notes are an integral part of the financial statements.
92 Russell Global Bond (Euro Hedged) Fund
Principal
Amount
Fair Value
EUR ‘000
Fund
%
Municipal Electric Authority
of Georgia
300,000 6.655% due 01/04/57 ....... 322 0.08
Nationstar Home Equity
Loan Trust
946,000 0.763% due 25/09/36 ....... 592 0.14
760,000 0.663% due 25/03/37 ....... 562 0.14
Navient Corp
100,000 7.250% due 25/01/22 ....... 82 0.02
New York City Water &
Sewer System
230,000 5.882% due 15/06/44 ....... 276 0.07
New York State Dormitory
Authority
250,000 5.600% due 15/03/40 ....... 279 0.07
Newell Brands Inc
160,000 2.600% due 29/03/19 ....... 143 0.03
80,000 3.150% due 01/04/21 ....... 72 0.02
235,000 4.200% due 01/04/26 ....... 216 0.05
92,000 5.500% due 01/04/46 ....... 88 0.02
Newfield Exploration Co
30,000 5.625% due 01/07/24 ....... 25 0.01
NiSource Finance Corp
67,000 5.650% due 01/02/45 ....... 70 0.02
655,091 0.720% due 15/08/18 ....... 574 0.14
Noble Energy Inc
125,000 5.250% due 15/11/43 ....... 95 0.02
Nomura Asset Acceptance
Corp Alternative Loan Trust
690,000 1.039% due 25/12/34 ....... 567 0.14
207,200 2.599% due 25/10/35 ....... 169 0.04
Nomura Resecuritization
Trust
500,000 0.586% due 26/10/36 ....... 374 0.09
263,000 0.596% due 26/10/36 ....... 198 0.05
778,632 1.312% due 26/06/46 ....... 648 0.16
271,992 1.092% due 26/04/47 ....... 228 0.06
Omnicom Group Inc
35,000 3.650% due 01/11/24 ....... 32 0.01
OneMain Financial Issuance
Trust
125,000 4.100% due 20/03/28 ....... 111 0.03
Park Place Securities Inc
410,000 0.903% due 25/09/35 ....... 323 0.08
Pfizer Inc
400,000 0.768% due 15/05/17 ....... 350 0.09
135,000 0.934% due 15/06/18 ....... 118 0.03
Philip Morris International
Inc
EUR 145,000 2.750% due 19/03/25 ....... 166 0.04
Pioneer Natural Resources
Co
USD 65,000 3.450% due 15/01/21 ....... 57 0.01
200,000 3.950% due 15/07/22 ....... 178 0.04
Principal
Amount
Fair Value
EUR ‘000
Fund
%
140,000 4.450% due 15/01/26 ...... 124 0.03
PPG Industries Inc
179,000 6.650% due 15/03/18 ...... 171 0.04
Procter & Gamble Co
800,000 0.886% due 01/11/19 ...... 699 0.17
PulteGroup Inc
65,000 4.250% due 01/03/21 ...... 58 0.01
QEP Resources Inc
25,000 5.250% due 01/05/23 ...... 19 0.00
Quicken Loans Inc
110,000 5.750% due 01/05/25 ...... 94 0.02
RALI Trust
782,641 0.599% due 25/01/37 ...... 502 0.12
341,205 0.709% due 25/02/46 ...... 175 0.04
222,312 0.649% due 25/04/46 ...... 87 0.02
187,625 0.619% due 25/06/46 ...... 68 0.02
339,357 0.589% due 25/02/47 ...... 157 0.04
RAMP Trust
1,054 0.996% due 25/06/32 ...... 1 0.00
RBSCF Trust
150,000 5.695% due 16/09/40 ...... 135 0.03
Regency Energy Partners
LP / Regency Energy
Finance Corp
300,000 4.500% due 01/11/23 ...... 233 0.06
Resource Capital Corp Ltd
179,889 1.483% due 15/04/32 ...... 155 0.04
RFMSI Trust
309,229 3.191% due 25/09/35 ...... 208 0.05
29,863 3.878% due 25/02/36 ...... 24 0.01
Santander Drive Auto
Receivables Trust
530,000 1.213% due 15/07/19 ...... 465 0.11
240,000 2.650% due 17/08/20 ...... 210 0.05
Saxon Asset Securities Trust
1,310,162 0.619% due 25/05/47 ...... 764 0.19
Securitized Asset Backed
Receivables LLC
180,659 1.093% due 25/10/35 ...... 159 0.04
50,040 0.569% due 25/05/37 ...... 28 0.01
850,812 0.639% due 25/05/37 ...... 437 0.11
Sequoia Mortgage Trust
232,540 0.782% due 20/07/33 ...... 192 0.05
SM Energy Co
5,000 6.125% due 15/11/22 ...... 3 0.00
15,000 5.000% due 15/01/24 ...... 9 0.00
35,000 5.625% due 01/06/25 ...... 21 0.01
Solvay Finance America
LLC
200,000 4.450% due 03/12/25 ...... 180 0.04
Soundview Home Loan
Trust
610,000 0.909% due 25/03/36 ...... 459 0.11
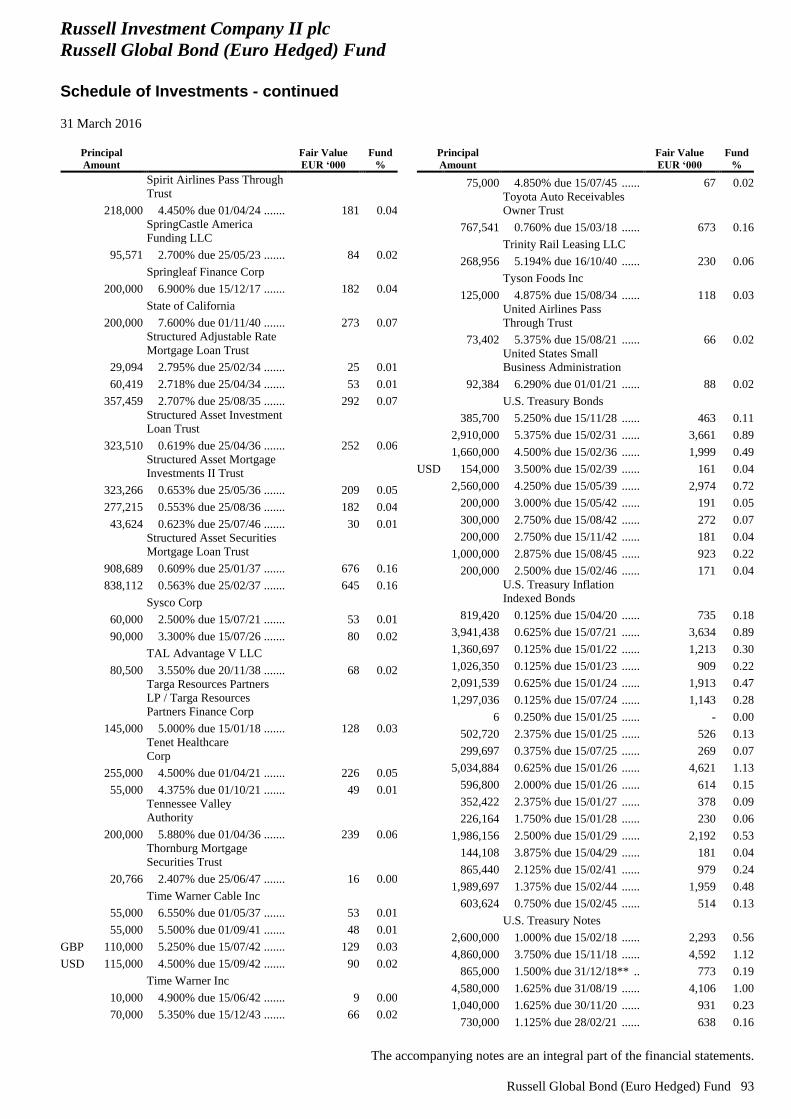
Russell Investment Company II plc
Russell Global Bond (Euro Hedged) Fund
Schedule of Investments - continued
31 March 2016
The accompanying notes are an integral part of the financial statements.
Russell Global Bond (Euro Hedged) Fund 93
Principal
Amount
Fair Value
EUR ‘000
Fund
%
Spirit Airlines Pass Through
Trust
218,000 4.450% due 01/04/24 ....... 181 0.04
SpringCastle America
Funding LLC
95,571 2.700% due 25/05/23 ....... 84 0.02
Springleaf Finance Corp
200,000 6.900% due 15/12/17 ....... 182 0.04
State of California
200,000 7.600% due 01/11/40 ....... 273 0.07
Structured Adjustable Rate
Mortgage Loan Trust
29,094 2.795% due 25/02/34 ....... 25 0.01
60,419 2.718% due 25/04/34 ....... 53 0.01
357,459 2.707% due 25/08/35 ....... 292 0.07
Structured Asset Investment
Loan Trust
323,510 0.619% due 25/04/36 ....... 252 0.06
Structured Asset Mortgage
Investments II Trust
323,266 0.653% due 25/05/36 ....... 209 0.05
277,215 0.553% due 25/08/36 ....... 182 0.04
43,624 0.623% due 25/07/46 ....... 30 0.01
Structured Asset Securities
Mortgage Loan Trust
908,689 0.609% due 25/01/37 ....... 676 0.16
838,112 0.563% due 25/02/37 ....... 645 0.16
Sysco Corp
60,000 2.500% due 15/07/21 ....... 53 0.01
90,000 3.300% due 15/07/26 ....... 80 0.02
TAL Advantage V LLC
80,500 3.550% due 20/11/38 ....... 68 0.02
Targa Resources Partners
LP / Targa Resources
Partners Finance Corp
145,000 5.000% due 15/01/18 ....... 128 0.03
Tenet Healthcare
Corp
255,000 4.500% due 01/04/21 ....... 226 0.05
55,000 4.375% due 01/10/21 ....... 49 0.01
Tennessee Valley
Authority
200,000 5.880% due 01/04/36 ....... 239 0.06
Thornburg Mortgage
Securities Trust
20,766 2.407% due 25/06/47 ....... 16 0.00
Time Warner Cable Inc
55,000 6.550% due 01/05/37 ....... 53 0.01
55,000 5.500% due 01/09/41 ....... 48 0.01
GBP 110,000 5.250% due 15/07/42 ....... 129 0.03
USD 115,000 4.500% due 15/09/42 ....... 90 0.02
Time Warner Inc
10,000 4.900% due 15/06/42 ....... 9 0.00
70,000 5.350% due 15/12/43 ....... 66 0.02
Principal
Amount
Fair Value
EUR ‘000
Fund
%
75,000 4.850% due 15/07/45 ...... 67 0.02
Toyota Auto Receivables
Owner Trust
767,541 0.760% due 15/03/18 ...... 673 0.16
Trinity Rail Leasing LLC
268,956 5.194% due 16/10/40 ...... 230 0.06
Tyson Foods Inc
125,000 4.875% due 15/08/34 ...... 118 0.03
United Airlines Pass
Through Trust
73,402 5.375% due 15/08/21 ...... 66 0.02
United States Small
Business Administration
92,384 6.290% due 01/01/21 ...... 88 0.02
U.S. Treasury Bonds
385,700 5.250% due 15/11/28 ...... 463 0.11
2,910,000 5.375% due 15/02/31 ...... 3,661 0.89
1,660,000 4.500% due 15/02/36 ...... 1,999 0.49
USD 154,000 3.500% due 15/02/39 ...... 161 0.04
2,560,000 4.250% due 15/05/39 ...... 2,974 0.72
200,000 3.000% due 15/05/42 ...... 191 0.05
300,000 2.750% due 15/08/42 ...... 272 0.07
200,000 2.750% due 15/11/42 ...... 181 0.04
1,000,000 2.875% due 15/08/45 ...... 923 0.22
200,000 2.500% due 15/02/46 ...... 171 0.04
U.S. Treasury Inflation
Indexed Bonds
819,420 0.125% due 15/04/20 ...... 735 0.18
3,941,438 0.625% due 15/07/21 ...... 3,634 0.89
1,360,697 0.125% due 15/01/22 ...... 1,213 0.30
1,026,350 0.125% due 15/01/23 ...... 909 0.22
2,091,539 0.625% due 15/01/24 ...... 1,913 0.47
1,297,036 0.125% due 15/07/24 ...... 1,143 0.28
6 0.250% due 15/01/25 ...... - 0.00
502,720 2.375% due 15/01/25 ...... 526 0.13
299,697 0.375% due 15/07/25 ...... 269 0.07
5,034,884 0.625% due 15/01/26 ...... 4,621 1.13
596,800 2.000% due 15/01/26 ...... 614 0.15
352,422 2.375% due 15/01/27 ...... 378 0.09
226,164 1.750% due 15/01/28 ...... 230 0.06
1,986,156 2.500% due 15/01/29 ...... 2,192 0.53
144,108 3.875% due 15/04/29 ...... 181 0.04
865,440 2.125% due 15/02/41 ...... 979 0.24
1,989,697 1.375% due 15/02/44 ...... 1,959 0.48
603,624 0.750% due 15/02/45 ...... 514 0.13
U.S. Treasury Notes
2,600,000 1.000% due 15/02/18 ...... 2,293 0.56
4,860,000 3.750% due 15/11/18 ...... 4,592 1.12
865,000 1.500% due 31/12/18** .. 773 0.19
4,580,000 1.625% due 31/08/19 ...... 4,106 1.00
1,040,000 1.625% due 30/11/20 ...... 931 0.23
730,000 1.125% due 28/02/21 ...... 638 0.16
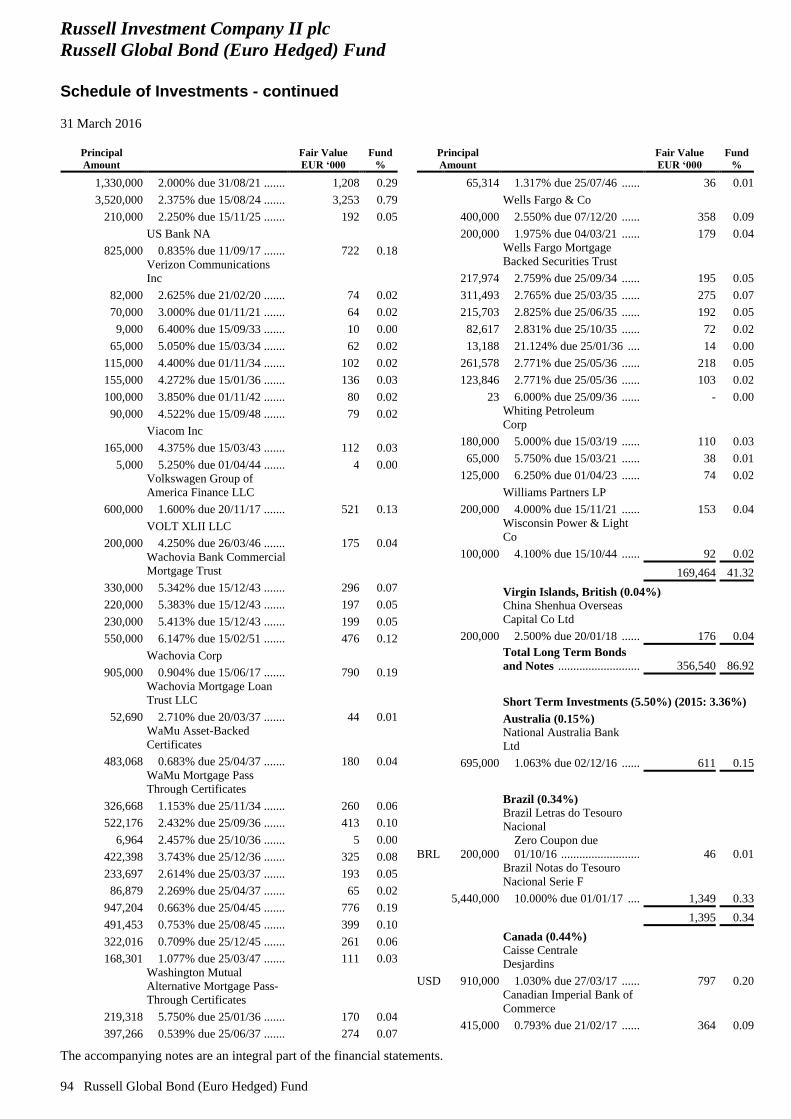
Russell Investment Company II plc
Russell Global Bond (Euro Hedged) Fund
Schedule of Investments - continued
31 March 2016
The accompanying notes are an integral part of the financial statements.
94 Russell Global Bond (Euro Hedged) Fund
Principal
Amount
Fair Value
EUR ‘000
Fund
%
1,330,000 2.000% due 31/08/21 ....... 1,208 0.29
3,520,000 2.375% due 15/08/24 ....... 3,253 0.79
210,000 2.250% due 15/11/25 ....... 192 0.05
US Bank NA
825,000 0.835% due 11/09/17 ....... 722 0.18
Verizon Communications
Inc
82,000 2.625% due 21/02/20 ....... 74 0.02
70,000 3.000% due 01/11/21 ....... 64 0.02
9,000 6.400% due 15/09/33 ....... 10 0.00
65,000 5.050% due 15/03/34 ....... 62 0.02
115,000 4.400% due 01/11/34 ....... 102 0.02
155,000 4.272% due 15/01/36 ....... 136 0.03
100,000 3.850% due 01/11/42 ....... 80 0.02
90,000 4.522% due 15/09/48 ....... 79 0.02
Viacom Inc
165,000 4.375% due 15/03/43 ....... 112 0.03
5,000 5.250% due 01/04/44 ....... 4 0.00
Volkswagen Group of
America Finance LLC
600,000 1.600% due 20/11/17 ....... 521 0.13
VOLT XLII LLC
200,000 4.250% due 26/03/46 ....... 175 0.04
Wachovia Bank Commercial
Mortgage Trust
330,000 5.342% due 15/12/43 ....... 296 0.07
220,000 5.383% due 15/12/43 ....... 197 0.05
230,000 5.413% due 15/12/43 ....... 199 0.05
550,000 6.147% due 15/02/51 ....... 476 0.12
Wachovia Corp
905,000 0.904% due 15/06/17 ....... 790 0.19
Wachovia Mortgage Loan
Trust LLC
52,690 2.710% due 20/03/37 ....... 44 0.01
WaMu Asset-Backed
Certificates
483,068 0.683% due 25/04/37 ....... 180 0.04
WaMu Mortgage Pass
Through Certificates
326,668 1.153% due 25/11/34 ....... 260 0.06
522,176 2.432% due 25/09/36 ....... 413 0.10
6,964 2.457% due 25/10/36 ....... 5 0.00
422,398 3.743% due 25/12/36 ....... 325 0.08
233,697 2.614% due 25/03/37 ....... 193 0.05
86,879 2.269% due 25/04/37 ....... 65 0.02
947,204 0.663% due 25/04/45 ....... 776 0.19
491,453 0.753% due 25/08/45 ....... 399 0.10
322,016 0.709% due 25/12/45 ....... 261 0.06
168,301 1.077% due 25/03/47 ....... 111 0.03
Washington Mutual
Alternative Mortgage Pass-
Through Certificates
219,318 5.750% due 25/01/36 ....... 170 0.04
397,266 0.539% due 25/06/37 ....... 274 0.07
Principal
Amount
Fair Value
EUR ‘000
Fund
%
65,314 1.317% due 25/07/46 ...... 36 0.01
Wells Fargo & Co
400,000 2.550% due 07/12/20 ...... 358 0.09
200,000 1.975% due 04/03/21 ...... 179 0.04
Wells Fargo Mortgage
Backed Securities Trust
217,974 2.759% due 25/09/34 ...... 195 0.05
311,493 2.765% due 25/03/35 ...... 275 0.07
215,703 2.825% due 25/06/35 ...... 192 0.05
82,617 2.831% due 25/10/35 ...... 72 0.02
13,188 21.124% due 25/01/36 .... 14 0.00
261,578 2.771% due 25/05/36 ...... 218 0.05
123,846 2.771% due 25/05/36 ...... 103 0.02
23 6.000% due 25/09/36 ...... - 0.00
Whiting Petroleum
Corp
180,000 5.000% due 15/03/19 ...... 110 0.03
65,000 5.750% due 15/03/21 ...... 38 0.01
125,000 6.250% due 01/04/23 ...... 74 0.02
Williams Partners LP
200,000 4.000% due 15/11/21 ...... 153 0.04
Wisconsin Power & Light
Co
100,000 4.100% due 15/10/44 ...... 92 0.02
169,464 41.32
Virgin Islands, British (0.04%)
China Shenhua Overseas
Capital Co Ltd
200,000 2.500% due 20/01/18 ...... 176 0.04
Total Long Term Bonds
and Notes ........................... 356,540 86.92
Short Term Investments (5.50%) (2015: 3.36%)
Australia (0.15%)
National Australia Bank
Ltd
695,000 1.063% due 02/12/16 ...... 611 0.15
Brazil (0.34%)
Brazil Letras do Tesouro
Nacional
BRL 200,000
Zero Coupon due
01/10/16 .......................... 46 0.01
Brazil Notas do Tesouro
Nacional Serie F
5,440,000 10.000% due 01/01/17 .... 1,349 0.33
1,395 0.34
Canada (0.44%)
Caisse Centrale
Desjardins
USD 910,000 1.030% due 27/03/17 ...... 797 0.20
Canadian Imperial Bank of
Commerce
415,000 0.793% due 21/02/17 ...... 364 0.09
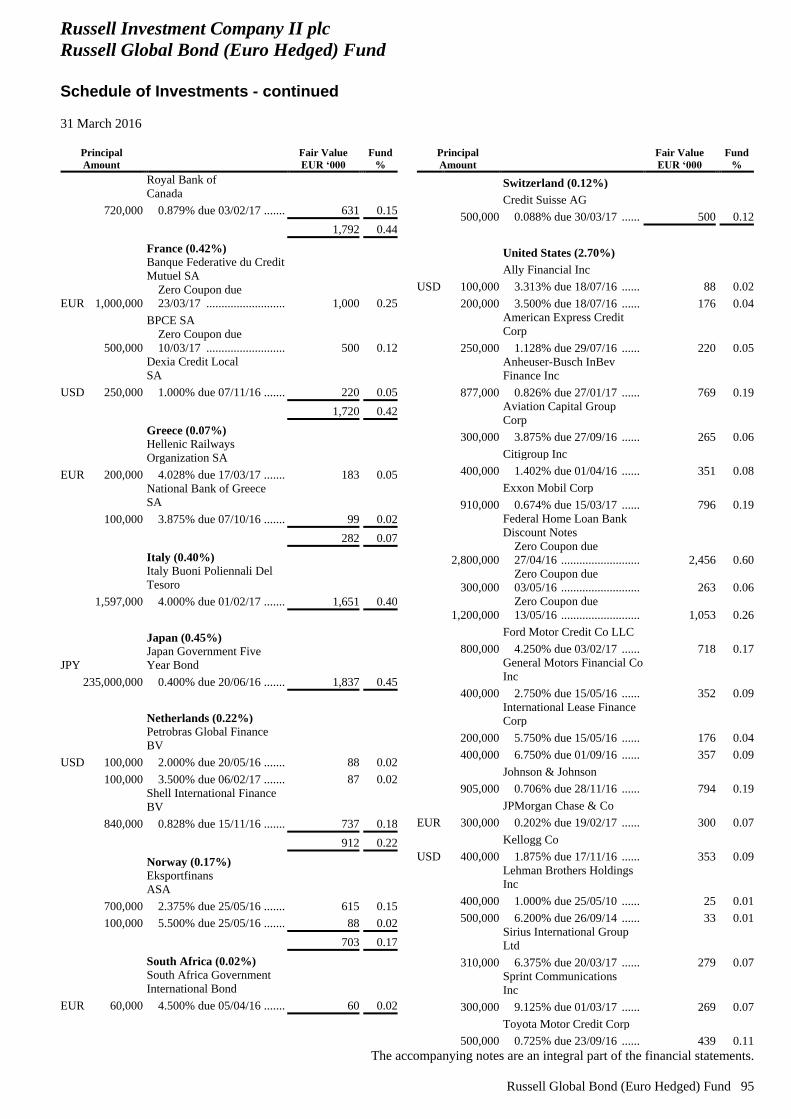
Russell Investment Company II plc
Russell Global Bond (Euro Hedged) Fund
Schedule of Investments - continued
31 March 2016
The accompanying notes are an integral part of the financial statements.
Russell Global Bond (Euro Hedged) Fund 95
Principal
Amount
Fair Value
EUR ‘000
Fund
%
Royal Bank of
Canada
720,000 0.879% due 03/02/17 ....... 631 0.15
1,792 0.44
France (0.42%)
Banque Federative du Credit
Mutuel SA
EUR 1,000,000
Zero Coupon due
23/03/17 .......................... 1,000 0.25
BPCE SA
500,000
Zero Coupon due
10/03/17 .......................... 500 0.12
Dexia Credit Local
SA
USD 250,000 1.000% due 07/11/16 ....... 220 0.05
1,720 0.42
Greece (0.07%)
Hellenic Railways
Organization SA
EUR 200,000 4.028% due 17/03/17 ....... 183 0.05
National Bank of Greece
SA
100,000 3.875% due 07/10/16 ....... 99 0.02
282 0.07
Italy (0.40%)
Italy Buoni Poliennali Del
Tesoro
1,597,000 4.000% due 01/02/17 ....... 1,651 0.40
Japan (0.45%)
JPY
Japan Government Five
Year Bond
235,000,000 0.400% due 20/06/16 ....... 1,837 0.45
Netherlands (0.22%)
Petrobras Global Finance
BV
USD 100,000 2.000% due 20/05/16 ....... 88 0.02
100,000 3.500% due 06/02/17 ....... 87 0.02
Shell International Finance
BV
840,000 0.828% due 15/11/16 ....... 737 0.18
912 0.22
Norway (0.17%)
Eksportfinans
ASA
700,000 2.375% due 25/05/16 ....... 615 0.15
100,000 5.500% due 25/05/16 ....... 88 0.02
703 0.17
South Africa (0.02%)
South Africa Government
International Bond
EUR 60,000 4.500% due 05/04/16 ....... 60 0.02
Principal
Amount
Fair Value
EUR ‘000
Fund
%
Switzerland (0.12%)
Credit Suisse AG
500,000 0.088% due 30/03/17 ...... 500 0.12
United States (2.70%)
Ally Financial Inc
USD 100,000 3.313% due 18/07/16 ...... 88 0.02
200,000 3.500% due 18/07/16 ...... 176 0.04
American Express Credit
Corp
250,000 1.128% due 29/07/16 ...... 220 0.05
Anheuser-Busch InBev
Finance Inc
877,000 0.826% due 27/01/17 ...... 769 0.19
Aviation Capital Group
Corp
300,000 3.875% due 27/09/16 ...... 265 0.06
Citigroup Inc
400,000 1.402% due 01/04/16 ...... 351 0.08
Exxon Mobil Corp
910,000 0.674% due 15/03/17 ...... 796 0.19
Federal Home Loan Bank
Discount Notes
2,800,000
Zero Coupon due
27/04/16 .......................... 2,456 0.60
300,000
Zero Coupon due
03/05/16 .......................... 263 0.06
1,200,000
Zero Coupon due
13/05/16 .......................... 1,053 0.26
Ford Motor Credit Co LLC
800,000 4.250% due 03/02/17 ...... 718 0.17
General Motors Financial Co
Inc
400,000 2.750% due 15/05/16 ...... 352 0.09
International Lease Finance
Corp
200,000 5.750% due 15/05/16 ...... 176 0.04
400,000 6.750% due 01/09/16 ...... 357 0.09
Johnson & Johnson
905,000 0.706% due 28/11/16 ...... 794 0.19
JPMorgan Chase & Co
EUR 300,000 0.202% due 19/02/17 ...... 300 0.07
Kellogg Co
USD 400,000 1.875% due 17/11/16 ...... 353 0.09
Lehman Brothers Holdings
Inc
400,000 1.000% due 25/05/10 ...... 25 0.01
500,000 6.200% due 26/09/14 ...... 33 0.01
Sirius International Group
Ltd
310,000 6.375% due 20/03/17 ...... 279 0.07
Sprint Communications
Inc
300,000 9.125% due 01/03/17 ...... 269 0.07
Toyota Motor Credit Corp
500,000 0.725% due 23/09/16 ...... 439 0.11
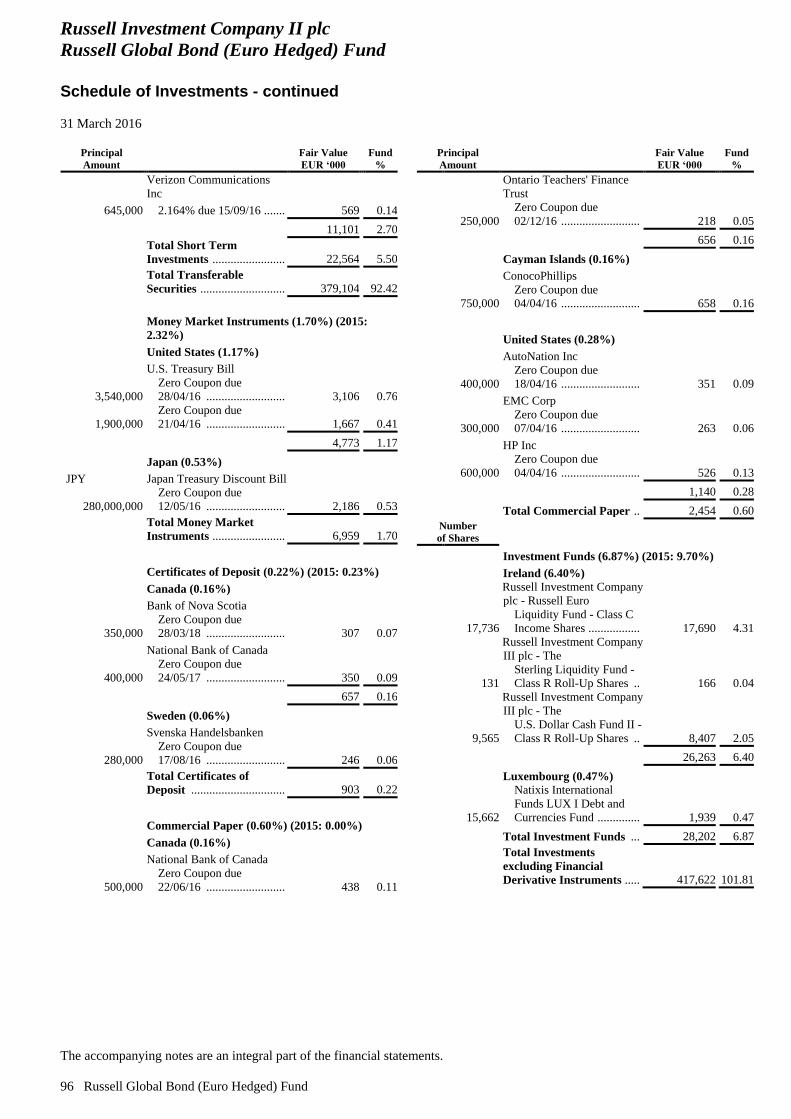
Russell Investment Company II plc
Russell Global Bond (Euro Hedged) Fund
Schedule of Investments - continued
31 March 2016
The accompanying notes are an integral part of the financial statements.
96 Russell Global Bond (Euro Hedged) Fund
Principal
Amount
Fair Value
EUR ‘000
Fund
%
Verizon Communications
Inc
645,000 2.164% due 15/09/16 ....... 569 0.14
11,101 2.70
Total Short Term
Investments ........................ 22,564 5.50
Total Transferable
Securities ............................ 379,104 92.42
Money Market Instruments (1.70%) (2015:
2.32%)
United States (1.17%)
U.S. Treasury Bill
3,540,000
Zero Coupon due
28/04/16 .......................... 3,106 0.76
1,900,000
Zero Coupon due
21/04/16 .......................... 1,667 0.41
4,773 1.17
Japan (0.53%)
JPY Japan Treasury Discount Bill
280,000,000
Zero Coupon due
12/05/16 .......................... 2,186 0.53
Total Money Market
Instruments ........................ 6,959 1.70
Certificates of Deposit (0.22%) (2015: 0.23%)
Canada (0.16%)
Bank of Nova Scotia
350,000
Zero Coupon due
28/03/18 .......................... 307 0.07
National Bank of Canada
400,000
Zero Coupon due
24/05/17 .......................... 350 0.09
657 0.16
Sweden (0.06%)
Svenska Handelsbanken
280,000
Zero Coupon due
17/08/16 .......................... 246 0.06
Total Certificates of
Deposit ............................... 903 0.22
Commercial Paper (0.60%) (2015: 0.00%)
Canada (0.16%)
National Bank of Canada
500,000
Zero Coupon due
22/06/16 .......................... 438 0.11
Principal
Amount
Fair Value
EUR ‘000
Fund
%
Ontario Teachers' Finance
Trust
250,000
Zero Coupon due
02/12/16 .......................... 218 0.05
656 0.16
Cayman Islands (0.16%)
ConocoPhillips
750,000
Zero Coupon due
04/04/16 .......................... 658 0.16
United States (0.28%)
AutoNation Inc
400,000
Zero Coupon due
18/04/16 .......................... 351 0.09
EMC Corp
300,000
Zero Coupon due
07/04/16 .......................... 263 0.06
HP Inc
600,000
Zero Coupon due
04/04/16 .......................... 526 0.13
1,140 0.28
Total Commercial Paper .. 2,454 0.60
Number
of Shares
Investment Funds (6.87%) (2015: 9.70%)
Ireland (6.40%)
17,736
Russell Investment Company
plc - Russell Euro
Liquidity Fund - Class C
Income Shares ................. 17,690 4.31
131
Russell Investment Company
III plc - The
Sterling Liquidity Fund -
Class R Roll-Up Shares .. 166 0.04
9,565
Russell Investment Company
III plc - The
U.S. Dollar Cash Fund II -
Class R Roll-Up Shares .. 8,407 2.05
26,263 6.40
Luxembourg (0.47%)
15,662
Natixis International
Funds LUX I Debt and
Currencies Fund .............. 1,939 0.47
Total Investment Funds ... 28,202 6.87
Total Investments
excluding Financial
Derivative Instruments ..... 417,622 101.81
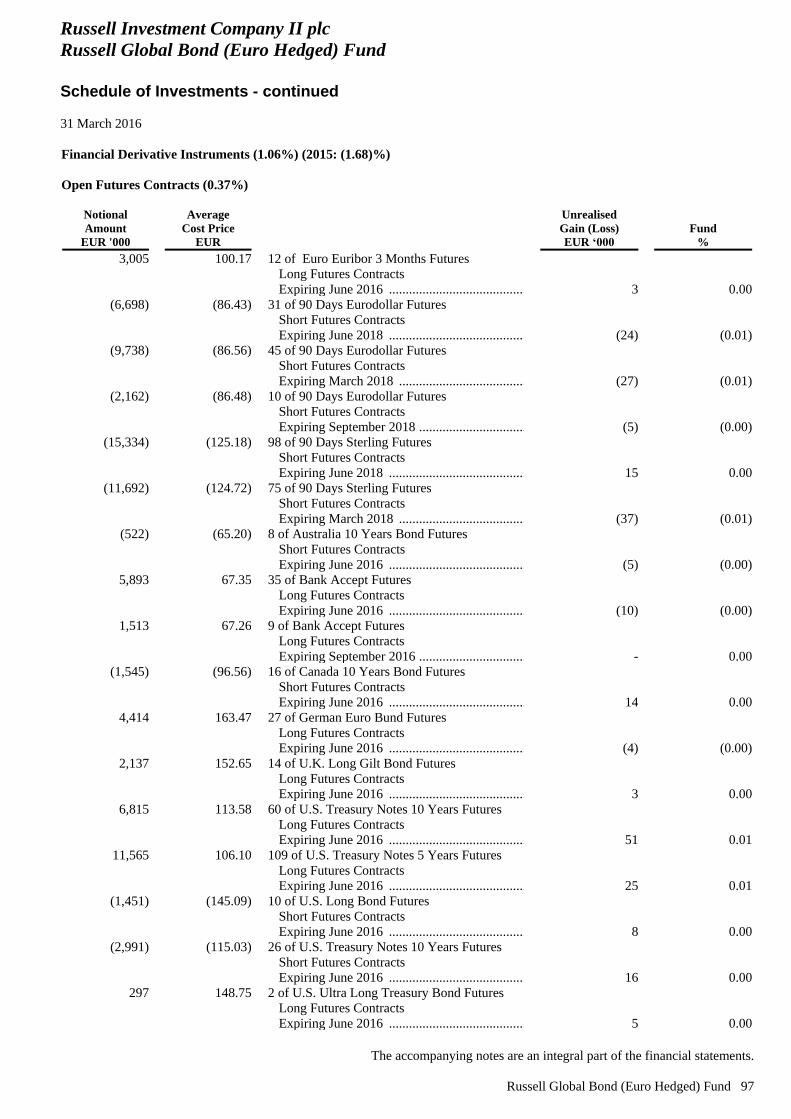
Russell Investment Company II plc
Russell Global Bond (Euro Hedged) Fund
Schedule of Investments - continued
31 March 2016
The accompanying notes are an integral part of the financial statements.
Russell Global Bond (Euro Hedged) Fund 97
Financial Derivative Instruments (1.06%) (2015: (1.68)%)
Open Futures Contracts (0.37%)
Notional
Amount
EUR '000
Average
Cost Price
EUR
Unrealised
Gain (Loss)
EUR ‘000
Fund
%
3,005
100.17
12 of Euro Euribor 3 Months Futures
Long Futures Contracts
Expiring June 2016 ............................................... 3 0.00
(6,698)
(86.43)
31 of 90 Days Eurodollar Futures
Short Futures Contracts
Expiring June 2018 ............................................... (24) (0.01)
(9,738)
(86.56)
45 of 90 Days Eurodollar Futures
Short Futures Contracts
Expiring March 2018 ............................................ (27) (0.01)
(2,162)
(86.48)
10 of 90 Days Eurodollar Futures
Short Futures Contracts
Expiring September 2018 ...................................... (5) (0.00)
(15,334)
(125.18)
98 of 90 Days Sterling Futures
Short Futures Contracts
Expiring June 2018 ............................................... 15 0.00
(11,692)
(124.72)
75 of 90 Days Sterling Futures
Short Futures Contracts
Expiring March 2018 ............................................ (37) (0.01)
(522)
(65.20)
8 of Australia 10 Years Bond Futures
Short Futures Contracts
Expiring June 2016 ............................................... (5) (0.00)
5,893
67.35
35 of Bank Accept Futures
Long Futures Contracts
Expiring June 2016 ............................................... (10) (0.00)
1,513
67.26
9 of Bank Accept Futures
Long Futures Contracts
Expiring September 2016 ...................................... - 0.00
(1,545)
(96.56)
16 of Canada 10 Years Bond Futures
Short Futures Contracts
Expiring June 2016 ............................................... 14 0.00
4,414
163.47
27 of German Euro Bund Futures
Long Futures Contracts
Expiring June 2016 ............................................... (4) (0.00)
2,137
152.65
14 of U.K. Long Gilt Bond Futures
Long Futures Contracts
Expiring June 2016 ............................................... 3 0.00
6,815
113.58
60 of U.S. Treasury Notes 10 Years Futures
Long Futures Contracts
Expiring June 2016 ............................................... 51 0.01
11,565
106.10
109 of U.S. Treasury Notes 5 Years Futures
Long Futures Contracts
Expiring June 2016 ............................................... 25 0.01
(1,451)
(145.09)
10 of U.S. Long Bond Futures
Short Futures Contracts
Expiring June 2016 ............................................... 8 0.00
(2,991)
(115.03)
26 of U.S. Treasury Notes 10 Years Futures
Short Futures Contracts
Expiring June 2016 ............................................... 16 0.00
297
148.75
2 of U.S. Ultra Long Treasury Bond Futures
Long Futures Contracts
Expiring June 2016 ............................................... 5 0.00
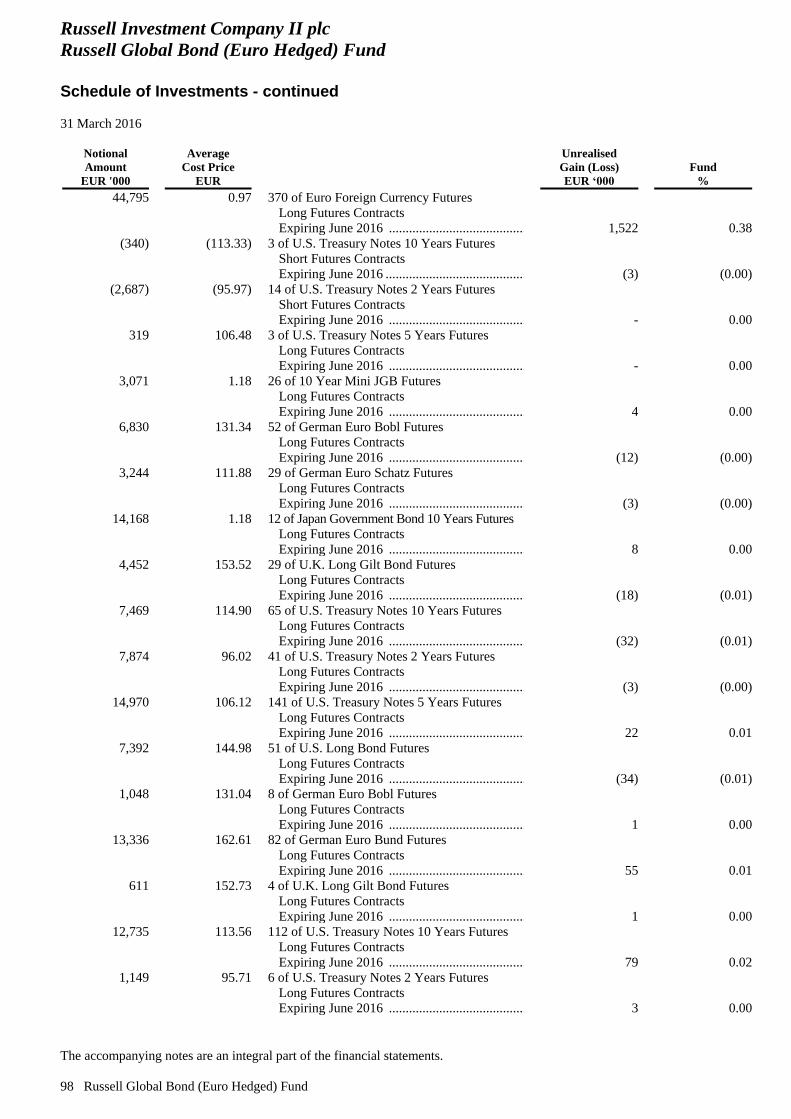
Russell Investment Company II plc
Russell Global Bond (Euro Hedged) Fund
Schedule of Investments - continued
31 March 2016
The accompanying notes are an integral part of the financial statements.
98 Russell Global Bond (Euro Hedged) Fund
Notional
Amount
EUR '000
Average
Cost Price
EUR
Unrealised
Gain (Loss)
EUR ‘000
Fund
%
44,795
0.97
370 of Euro Foreign Currency Futures
Long Futures Contracts
Expiring June 2016 ............................................... 1,522 0.38
(340)
(113.33)
3 of U.S. Treasury Notes 10 Years Futures
Short Futures Contracts
Expiring June 2016 ................................................ (3) (0.00)
(2,687)
(95.97)
14 of U.S. Treasury Notes 2 Years Futures
Short Futures Contracts
Expiring June 2016 ............................................... - 0.00
319
106.48
3 of U.S. Treasury Notes 5 Years Futures
Long Futures Contracts
Expiring June 2016 ............................................... - 0.00
3,071
1.18
26 of 10 Year Mini JGB Futures
Long Futures Contracts
Expiring June 2016 ............................................... 4 0.00
6,830
131.34
52 of German Euro Bobl Futures
Long Futures Contracts
Expiring June 2016 ............................................... (12) (0.00)
3,244
111.88
29 of German Euro Schatz Futures
Long Futures Contracts
Expiring June 2016 ............................................... (3) (0.00)
14,168
1.18
12 of Japan Government Bond 10 Years Futures
Long Futures Contracts
Expiring June 2016 ............................................... 8 0.00
4,452
153.52
29 of U.K. Long Gilt Bond Futures
Long Futures Contracts
Expiring June 2016 ............................................... (18) (0.01)
7,469
114.90
65 of U.S. Treasury Notes 10 Years Futures
Long Futures Contracts
Expiring June 2016 ............................................... (32) (0.01)
7,874
96.02
41 of U.S. Treasury Notes 2 Years Futures
Long Futures Contracts
Expiring June 2016 ............................................... (3) (0.00)
14,970
106.12
141 of U.S. Treasury Notes 5 Years Futures
Long Futures Contracts
Expiring June 2016 ............................................... 22 0.01
7,392
144.98
51 of U.S. Long Bond Futures
Long Futures Contracts
Expiring June 2016 ............................................... (34) (0.01)
1,048
131.04
8 of German Euro Bobl Futures
Long Futures Contracts
Expiring June 2016 ............................................... 1 0.00
13,336
162.61
82 of German Euro Bund Futures
Long Futures Contracts
Expiring June 2016 ............................................... 55 0.01
611
152.73
4 of U.K. Long Gilt Bond Futures
Long Futures Contracts
Expiring June 2016 ............................................... 1 0.00
12,735
113.56
112 of U.S. Treasury Notes 10 Years Futures
Long Futures Contracts
Expiring June 2016 ............................................... 79 0.02
1,149
95.71
6 of U.S. Treasury Notes 2 Years Futures
Long Futures Contracts
Expiring June 2016 ............................................... 3 0.00
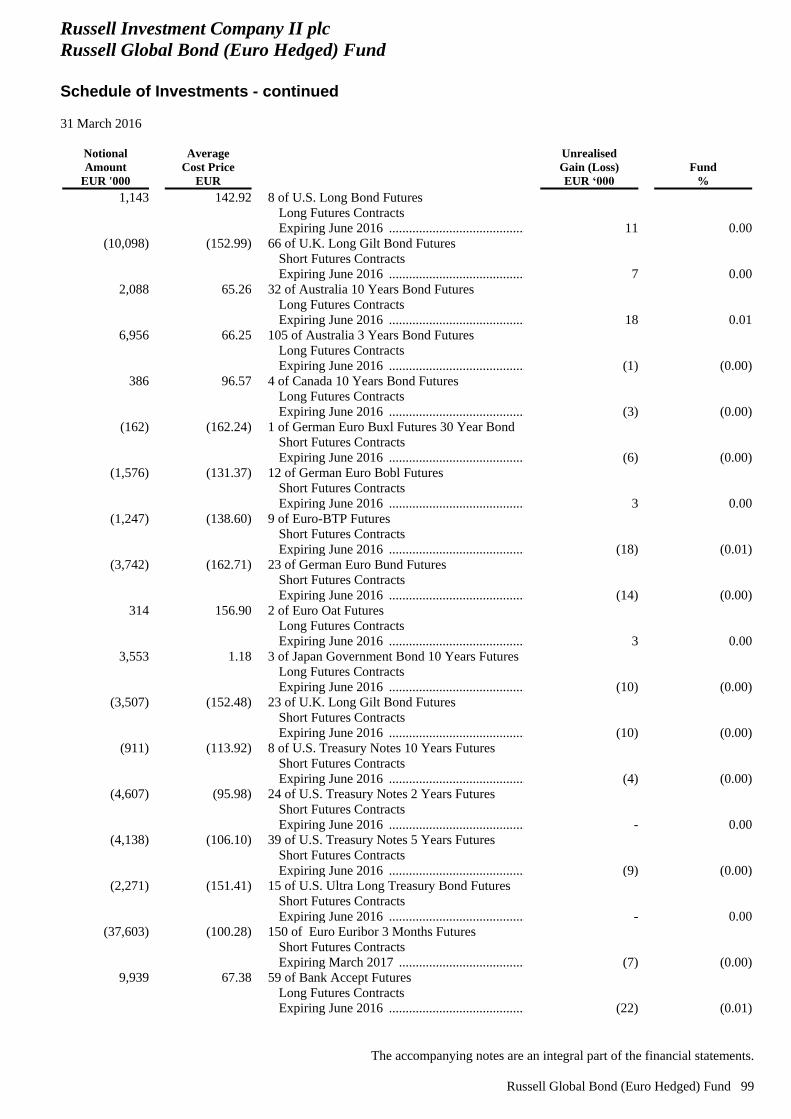
Russell Investment Company II plc
Russell Global Bond (Euro Hedged) Fund
Schedule of Investments - continued
31 March 2016
The accompanying notes are an integral part of the financial statements.
Russell Global Bond (Euro Hedged) Fund 99
Notional
Amount
EUR '000
Average
Cost Price
EUR
Unrealised
Gain (Loss)
EUR ‘000
Fund
%
1,143
142.92
8 of U.S. Long Bond Futures
Long Futures Contracts
Expiring June 2016 ............................................... 11 0.00
(10,098)
(152.99)
66 of U.K. Long Gilt Bond Futures
Short Futures Contracts
Expiring June 2016 ............................................... 7 0.00
2,088
65.26
32 of Australia 10 Years Bond Futures
Long Futures Contracts
Expiring June 2016 ............................................... 18 0.01
6,956
66.25
105 of Australia 3 Years Bond Futures
Long Futures Contracts
Expiring June 2016 ............................................... (1) (0.00)
386
96.57
4 of Canada 10 Years Bond Futures
Long Futures Contracts
Expiring June 2016 ............................................... (3) (0.00)
(162)
(162.24)
1 of German Euro Buxl Futures 30 Year Bond
Short Futures Contracts
Expiring June 2016 ............................................... (6) (0.00)
(1,576)
(131.37)
12 of German Euro Bobl Futures
Short Futures Contracts
Expiring June 2016 ............................................... 3 0.00
(1,247)
(138.60)
9 of Euro-BTP Futures
Short Futures Contracts
Expiring June 2016 ............................................... (18) (0.01)
(3,742)
(162.71)
23 of German Euro Bund Futures
Short Futures Contracts
Expiring June 2016 ............................................... (14) (0.00)
314
156.90
2 of Euro Oat Futures
Long Futures Contracts
Expiring June 2016 ............................................... 3 0.00
3,553
1.18
3 of Japan Government Bond 10 Years Futures
Long Futures Contracts
Expiring June 2016 ............................................... (10) (0.00)
(3,507)
(152.48)
23 of U.K. Long Gilt Bond Futures
Short Futures Contracts
Expiring June 2016 ............................................... (10) (0.00)
(911)
(113.92)
8 of U.S. Treasury Notes 10 Years Futures
Short Futures Contracts
Expiring June 2016 ............................................... (4) (0.00)
(4,607)
(95.98)
24 of U.S. Treasury Notes 2 Years Futures
Short Futures Contracts
Expiring June 2016 ............................................... - 0.00
(4,138)
(106.10)
39 of U.S. Treasury Notes 5 Years Futures
Short Futures Contracts
Expiring June 2016 ............................................... (9) (0.00)
(2,271)
(151.41)
15 of U.S. Ultra Long Treasury Bond Futures
Short Futures Contracts
Expiring June 2016 ............................................... - 0.00
(37,603)
(100.28)
150 of Euro Euribor 3 Months Futures
Short Futures Contracts
Expiring March 2017 ............................................ (7) (0.00)
9,939
67.38
59 of Bank Accept Futures
Long Futures Contracts
Expiring June 2016 ............................................... (22) (0.01)
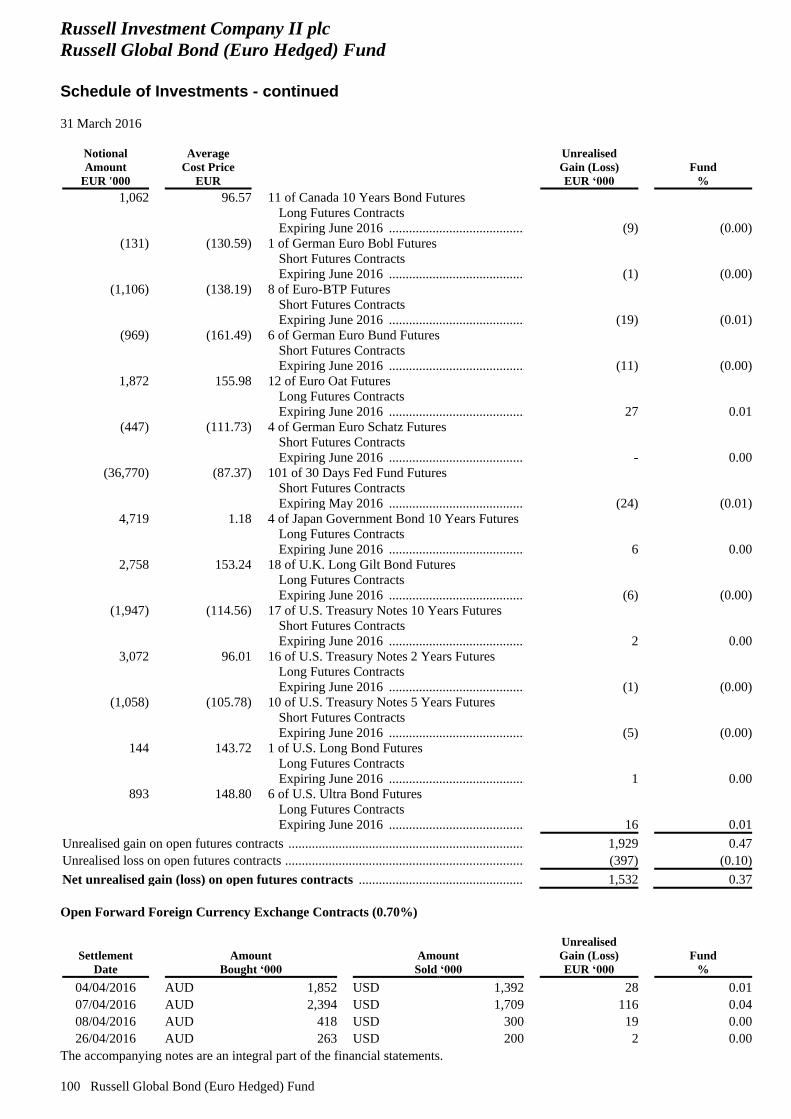
Russell Investment Company II plc
Russell Global Bond (Euro Hedged) Fund
Schedule of Investments - continued
31 March 2016
The accompanying notes are an integral part of the financial statements.
100 Russell Global Bond (Euro Hedged) Fund
Notional
Amount
EUR '000
Average
Cost Price
EUR
Unrealised
Gain (Loss)
EUR ‘000
Fund
%
1,062
96.57
11 of Canada 10 Years Bond Futures
Long Futures Contracts
Expiring June 2016 ............................................... (9) (0.00)
(131)
(130.59)
1 of German Euro Bobl Futures
Short Futures Contracts
Expiring June 2016 ............................................... (1) (0.00)
(1,106)
(138.19)
8 of Euro-BTP Futures
Short Futures Contracts
Expiring June 2016 ............................................... (19) (0.01)
(969)
(161.49)
6 of German Euro Bund Futures
Short Futures Contracts
Expiring June 2016 ............................................... (11) (0.00)
1,872
155.98
12 of Euro Oat Futures
Long Futures Contracts
Expiring June 2016 ............................................... 27 0.01
(447)
(111.73)
4 of German Euro Schatz Futures
Short Futures Contracts
Expiring June 2016 ............................................... - 0.00
(36,770)
(87.37)
101 of 30 Days Fed Fund Futures
Short Futures Contracts
Expiring May 2016 ............................................... (24) (0.01)
4,719
1.18
4 of Japan Government Bond 10 Years Futures
Long Futures Contracts
Expiring June 2016 ............................................... 6 0.00
2,758
153.24
18 of U.K. Long Gilt Bond Futures
Long Futures Contracts
Expiring June 2016 ............................................... (6) (0.00)
(1,947)
(114.56)
17 of U.S. Treasury Notes 10 Years Futures
Short Futures Contracts
Expiring June 2016 ............................................... 2 0.00
3,072
96.01
16 of U.S. Treasury Notes 2 Years Futures
Long Futures Contracts
Expiring June 2016 ............................................... (1) (0.00)
(1,058)
(105.78)
10 of U.S. Treasury Notes 5 Years Futures
Short Futures Contracts
Expiring June 2016 ............................................... (5) (0.00)
144
143.72
1 of U.S. Long Bond Futures
Long Futures Contracts
Expiring June 2016 ............................................... 1 0.00
893
148.80
6 of U.S. Ultra Bond Futures
Long Futures Contracts
Expiring June 2016 ............................................... 16 0.01
Unrealised gain on open futures contracts ......................................................................... 1,929 0.47
Unrealised loss on open futures contracts .......................................................................... (397) (0.10)
Net unrealised gain (loss) on open futures contracts ................................................. 1,532 0.37
Open Forward Foreign Currency Exchange Contracts (0.70%)
Settlement
Date
Amount
Bought ‘000
Amount
Sold ‘000
Unrealised
Gain (Loss)
EUR ‘000
Fund
%
04/04/2016 AUD 1,852 USD 1,392 28 0.01
07/04/2016 AUD 2,394 USD 1,709 116 0.04
08/04/2016 AUD 418 USD 300 19 0.00
26/04/2016 AUD 263 USD 200 2 0.00
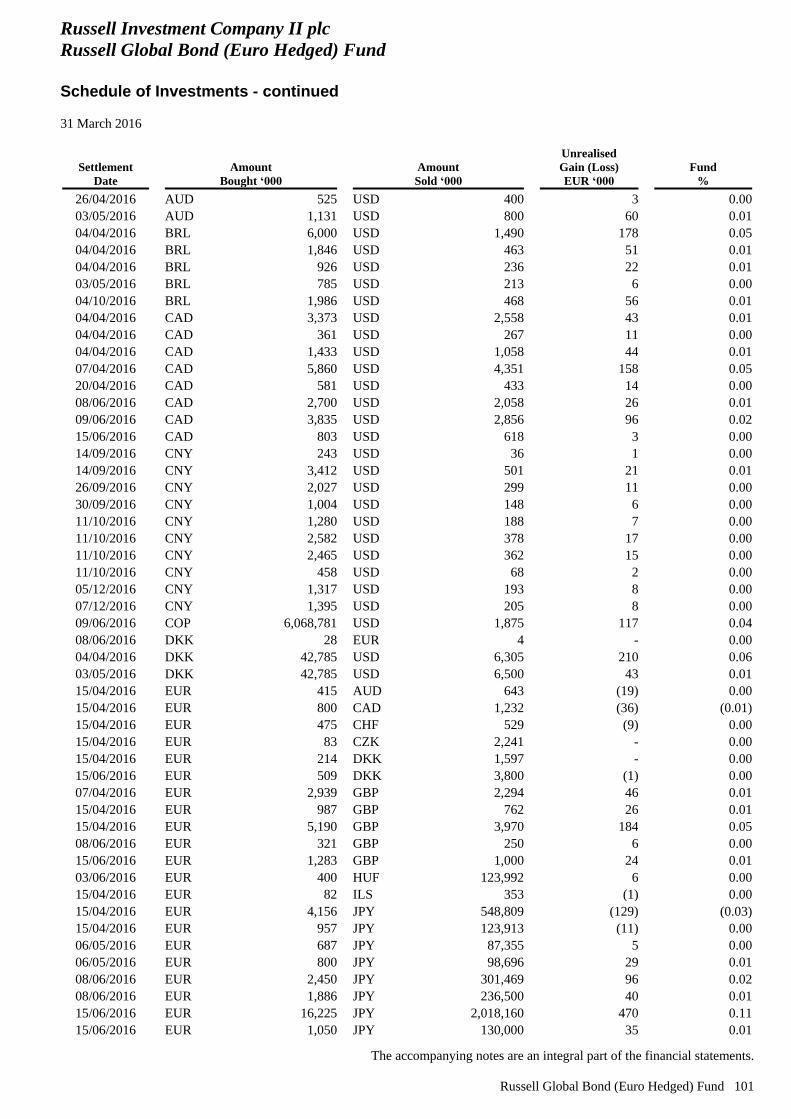
Russell Investment Company II plc
Russell Global Bond (Euro Hedged) Fund
Schedule of Investments - continued
31 March 2016
The accompanying notes are an integral part of the financial statements.
Russell Global Bond (Euro Hedged) Fund 101
Settlement
Date
Amount
Bought ‘000
Amount
Sold ‘000
Unrealised
Gain (Loss)
EUR ‘000
Fund
%
26/04/2016 AUD 525 USD 400 3 0.00
03/05/2016 AUD 1,131 USD 800 60 0.01
04/04/2016 BRL 6,000 USD 1,490 178 0.05
04/04/2016 BRL 1,846 USD 463 51 0.01
04/04/2016 BRL 926 USD 236 22 0.01
03/05/2016 BRL 785 USD 213 6 0.00
04/10/2016 BRL 1,986 USD 468 56 0.01
04/04/2016 CAD 3,373 USD 2,558 43 0.01
04/04/2016 CAD 361 USD 267 11 0.00
04/04/2016 CAD 1,433 USD 1,058 44 0.01
07/04/2016 CAD 5,860 USD 4,351 158 0.05
20/04/2016 CAD 581 USD 433 14 0.00
08/06/2016 CAD 2,700 USD 2,058 26 0.01
09/06/2016 CAD 3,835 USD 2,856 96 0.02
15/06/2016 CAD 803 USD 618 3 0.00
14/09/2016 CNY 243 USD 36 1 0.00
14/09/2016 CNY 3,412 USD 501 21 0.01
26/09/2016 CNY 2,027 USD 299 11 0.00
30/09/2016 CNY 1,004 USD 148 6 0.00
11/10/2016 CNY 1,280 USD 188 7 0.00
11/10/2016 CNY 2,582 USD 378 17 0.00
11/10/2016 CNY 2,465 USD 362 15 0.00
11/10/2016 CNY 458 USD 68 2 0.00
05/12/2016 CNY 1,317 USD 193 8 0.00
07/12/2016 CNY 1,395 USD 205 8 0.00
09/06/2016 COP 6,068,781 USD 1,875 117 0.04
08/06/2016 DKK 28 EUR 4 - 0.00
04/04/2016 DKK 42,785 USD 6,305 210 0.06
03/05/2016 DKK 42,785 USD 6,500 43 0.01
15/04/2016 EUR 415 AUD 643 (19) 0.00
15/04/2016 EUR 800 CAD 1,232 (36) (0.01)
15/04/2016 EUR 475 CHF 529 (9) 0.00
15/04/2016 EUR 83 CZK 2,241 - 0.00
15/04/2016 EUR 214 DKK 1,597 - 0.00
15/06/2016 EUR 509 DKK 3,800 (1) 0.00
07/04/2016 EUR 2,939 GBP 2,294 46 0.01
15/04/2016 EUR 987 GBP 762 26 0.01
15/04/2016 EUR 5,190 GBP 3,970 184 0.05
08/06/2016 EUR 321 GBP 250 6 0.00
15/06/2016 EUR 1,283 GBP 1,000 24 0.01
03/06/2016 EUR 400 HUF 123,992 6 0.00
15/04/2016 EUR 82 ILS 353 (1) 0.00
15/04/2016 EUR 4,156 JPY 548,809 (129) (0.03)
15/04/2016 EUR 957 JPY 123,913 (11) 0.00
06/05/2016 EUR 687 JPY 87,355 5 0.00
06/05/2016 EUR 800 JPY 98,696 29 0.01
08/06/2016 EUR 2,450 JPY 301,469 96 0.02
08/06/2016 EUR 1,886 JPY 236,500 40 0.01
15/06/2016 EUR 16,225 JPY 2,018,160 470 0.11
15/06/2016 EUR 1,050 JPY 130,000 35 0.01
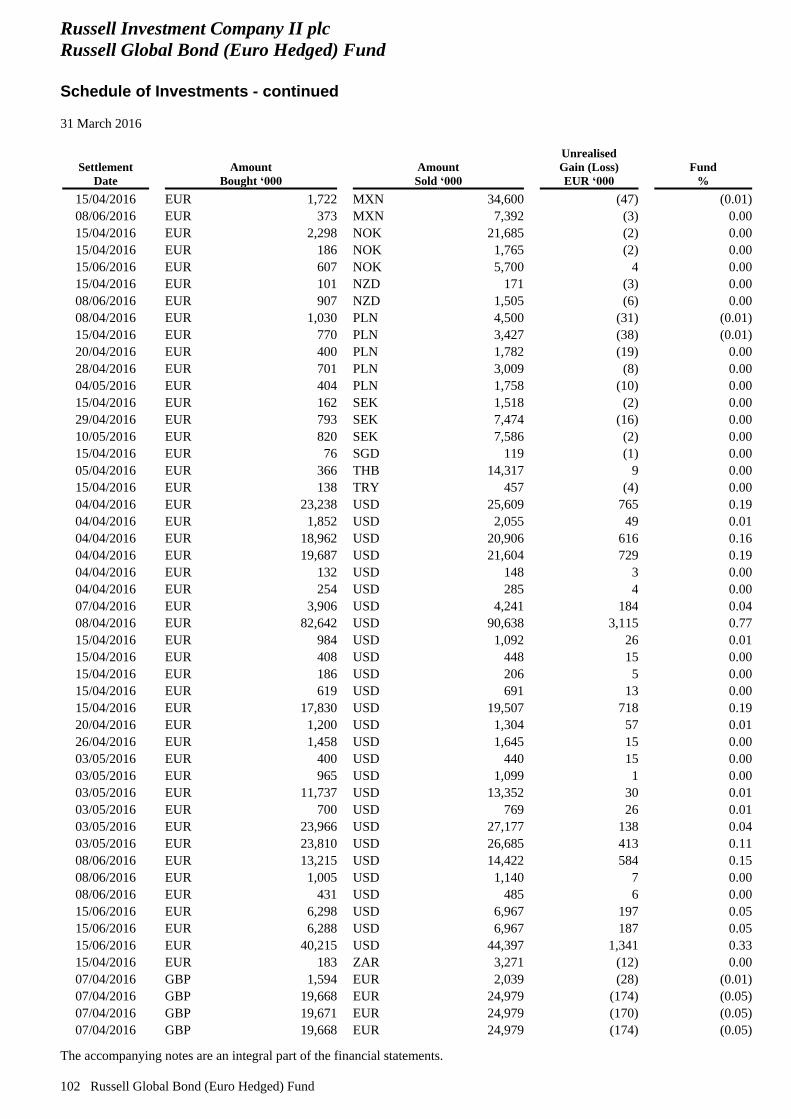
Russell Investment Company II plc
Russell Global Bond (Euro Hedged) Fund
Schedule of Investments - continued
31 March 2016
The accompanying notes are an integral part of the financial statements.
102 Russell Global Bond (Euro Hedged) Fund
Settlement
Date
Amount
Bought ‘000
Amount
Sold ‘000
Unrealised
Gain (Loss)
EUR ‘000
Fund
%
15/04/2016 EUR 1,722 MXN 34,600 (47) (0.01)
08/06/2016 EUR 373 MXN 7,392 (3) 0.00
15/04/2016 EUR 2,298 NOK 21,685 (2) 0.00
15/04/2016 EUR 186 NOK 1,765 (2) 0.00
15/06/2016 EUR 607 NOK 5,700 4 0.00
15/04/2016 EUR 101 NZD 171 (3) 0.00
08/06/2016 EUR 907 NZD 1,505 (6) 0.00
08/04/2016 EUR 1,030 PLN 4,500 (31) (0.01)
15/04/2016 EUR 770 PLN 3,427 (38) (0.01)
20/04/2016 EUR 400 PLN 1,782 (19) 0.00
28/04/2016 EUR 701 PLN 3,009 (8) 0.00
04/05/2016 EUR 404 PLN 1,758 (10) 0.00
15/04/2016 EUR 162 SEK 1,518 (2) 0.00
29/04/2016 EUR 793 SEK 7,474 (16) 0.00
10/05/2016 EUR 820 SEK 7,586 (2) 0.00
15/04/2016 EUR 76 SGD 119 (1) 0.00
05/04/2016 EUR 366 THB 14,317 9 0.00
15/04/2016 EUR 138 TRY 457 (4) 0.00
04/04/2016 EUR 23,238 USD 25,609 765 0.19
04/04/2016 EUR 1,852 USD 2,055 49 0.01
04/04/2016 EUR 18,962 USD 20,906 616 0.16
04/04/2016 EUR 19,687 USD 21,604 729 0.19
04/04/2016 EUR 132 USD 148 3 0.00
04/04/2016 EUR 254 USD 285 4 0.00
07/04/2016 EUR 3,906 USD 4,241 184 0.04
08/04/2016 EUR 82,642 USD 90,638 3,115 0.77
15/04/2016 EUR 984 USD 1,092 26 0.01
15/04/2016 EUR 408 USD 448 15 0.00
15/04/2016 EUR 186 USD 206 5 0.00
15/04/2016 EUR 619 USD 691 13 0.00
15/04/2016 EUR 17,830 USD 19,507 718 0.19
20/04/2016 EUR 1,200 USD 1,304 57 0.01
26/04/2016 EUR 1,458 USD 1,645 15 0.00
03/05/2016 EUR 400 USD 440 15 0.00
03/05/2016 EUR 965 USD 1,099 1 0.00
03/05/2016 EUR 11,737 USD 13,352 30 0.01
03/05/2016 EUR 700 USD 769 26 0.01
03/05/2016 EUR 23,966 USD 27,177 138 0.04
03/05/2016 EUR 23,810 USD 26,685 413 0.11
08/06/2016 EUR 13,215 USD 14,422 584 0.15
08/06/2016 EUR 1,005 USD 1,140 7 0.00
08/06/2016 EUR 431 USD 485 6 0.00
15/06/2016 EUR 6,298 USD 6,967 197 0.05
15/06/2016 EUR 6,288 USD 6,967 187 0.05
15/06/2016 EUR 40,215 USD 44,397 1,341 0.33
15/04/2016 EUR 183 ZAR 3,271 (12) 0.00
07/04/2016 GBP 1,594 EUR 2,039 (28) (0.01)
07/04/2016 GBP 19,668 EUR 24,979 (174) (0.05)
07/04/2016 GBP 19,671 EUR 24,979 (170) (0.05)
07/04/2016 GBP 19,668 EUR 24,979 (174) (0.05)
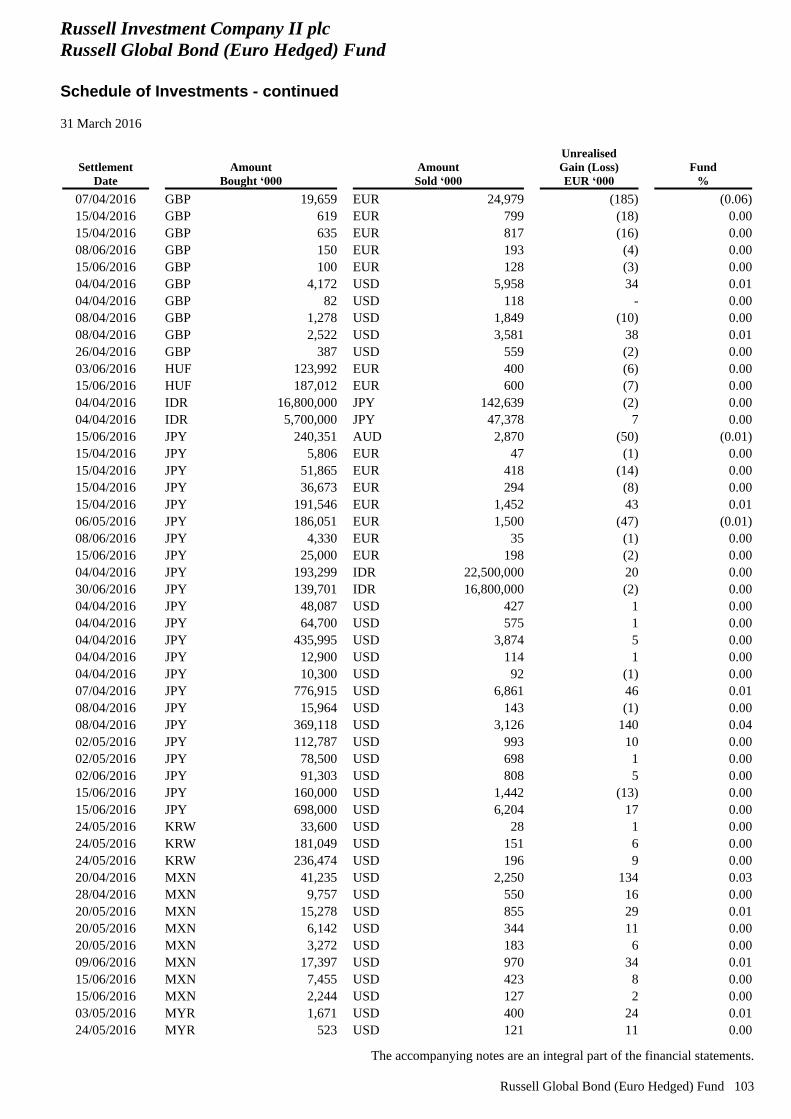
Russell Investment Company II plc
Russell Global Bond (Euro Hedged) Fund
Schedule of Investments - continued
31 March 2016
The accompanying notes are an integral part of the financial statements.
Russell Global Bond (Euro Hedged) Fund 103
Settlement
Date
Amount
Bought ‘000
Amount
Sold ‘000
Unrealised
Gain (Loss)
EUR ‘000
Fund
%
07/04/2016 GBP 19,659 EUR 24,979 (185) (0.06)
15/04/2016 GBP 619 EUR 799 (18) 0.00
15/04/2016 GBP 635 EUR 817 (16) 0.00
08/06/2016 GBP 150 EUR 193 (4) 0.00
15/06/2016 GBP 100 EUR 128 (3) 0.00
04/04/2016 GBP 4,172 USD 5,958 34 0.01
04/04/2016 GBP 82 USD 118 - 0.00
08/04/2016 GBP 1,278 USD 1,849 (10) 0.00
08/04/2016 GBP 2,522 USD 3,581 38 0.01
26/04/2016 GBP 387 USD 559 (2) 0.00
03/06/2016 HUF 123,992 EUR 400 (6) 0.00
15/06/2016 HUF 187,012 EUR 600 (7) 0.00
04/04/2016 IDR 16,800,000 JPY 142,639 (2) 0.00
04/04/2016 IDR 5,700,000 JPY 47,378 7 0.00
15/06/2016 JPY 240,351 AUD 2,870 (50) (0.01)
15/04/2016 JPY 5,806 EUR 47 (1) 0.00
15/04/2016 JPY 51,865 EUR 418 (14) 0.00
15/04/2016 JPY 36,673 EUR 294 (8) 0.00
15/04/2016 JPY 191,546 EUR 1,452 43 0.01
06/05/2016 JPY 186,051 EUR 1,500 (47) (0.01)
08/06/2016 JPY 4,330 EUR 35 (1) 0.00
15/06/2016 JPY 25,000 EUR 198 (2) 0.00
04/04/2016 JPY 193,299 IDR 22,500,000 20 0.00
30/06/2016 JPY 139,701 IDR 16,800,000 (2) 0.00
04/04/2016 JPY 48,087 USD 427 1 0.00
04/04/2016 JPY 64,700 USD 575 1 0.00
04/04/2016 JPY 435,995 USD 3,874 5 0.00
04/04/2016 JPY 12,900 USD 114 1 0.00
04/04/2016 JPY 10,300 USD 92 (1) 0.00
07/04/2016 JPY 776,915 USD 6,861 46 0.01
08/04/2016 JPY 15,964 USD 143 (1) 0.00
08/04/2016 JPY 369,118 USD 3,126 140 0.04
02/05/2016 JPY 112,787 USD 993 10 0.00
02/05/2016 JPY 78,500 USD 698 1 0.00
02/06/2016 JPY 91,303 USD 808 5 0.00
15/06/2016 JPY 160,000 USD 1,442 (13) 0.00
15/06/2016 JPY 698,000 USD 6,204 17 0.00
24/05/2016 KRW 33,600 USD 28 1 0.00
24/05/2016 KRW 181,049 USD 151 6 0.00
24/05/2016 KRW 236,474 USD 196 9 0.00
20/04/2016 MXN 41,235 USD 2,250 134 0.03
28/04/2016 MXN 9,757 USD 550 16 0.00
20/05/2016 MXN 15,278 USD 855 29 0.01
20/05/2016 MXN 6,142 USD 344 11 0.00
20/05/2016 MXN 3,272 USD 183 6 0.00
09/06/2016 MXN 17,397 USD 970 34 0.01
15/06/2016 MXN 7,455 USD 423 8 0.00
15/06/2016 MXN 2,244 USD 127 2 0.00
03/05/2016 MYR 1,671 USD 400 24 0.01
24/05/2016 MYR 523 USD 121 11 0.00
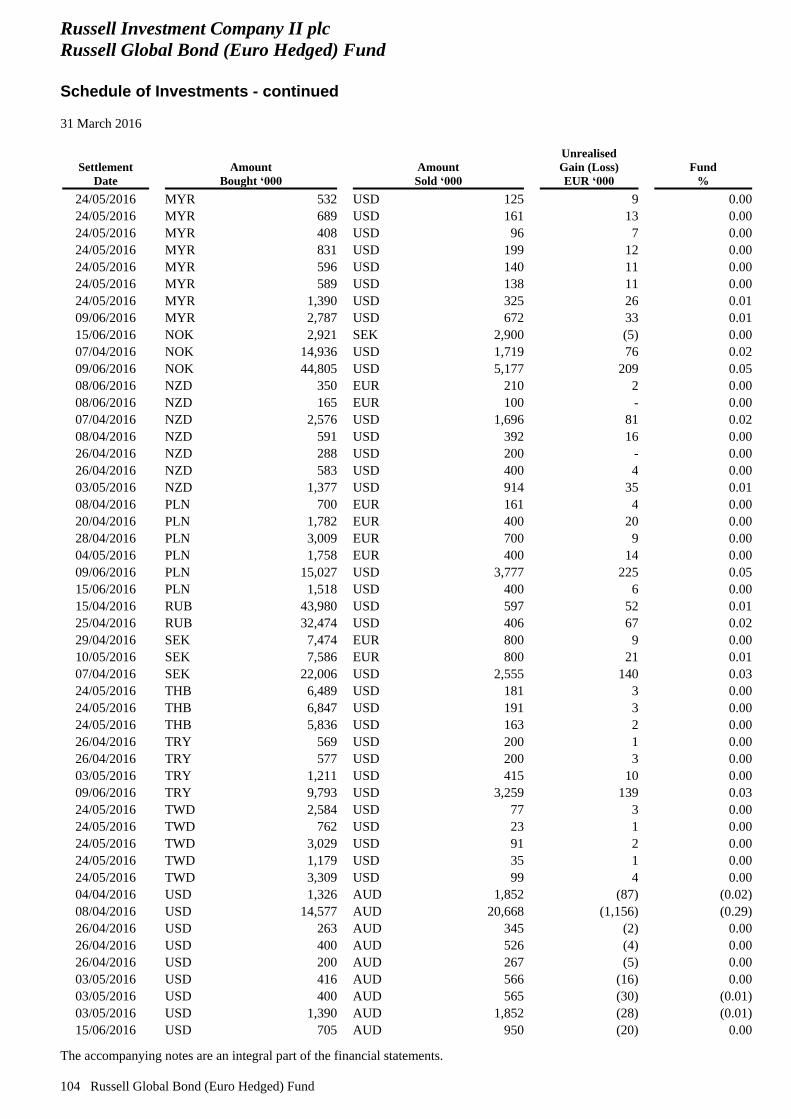
Russell Investment Company II plc
Russell Global Bond (Euro Hedged) Fund
Schedule of Investments - continued
31 March 2016
The accompanying notes are an integral part of the financial statements.
104 Russell Global Bond (Euro Hedged) Fund
Settlement
Date
Amount
Bought ‘000
Amount
Sold ‘000
Unrealised
Gain (Loss)
EUR ‘000
Fund
%
24/05/2016 MYR 532 USD 125 9 0.00
24/05/2016 MYR 689 USD 161 13 0.00
24/05/2016 MYR 408 USD 96 7 0.00
24/05/2016 MYR 831 USD 199 12 0.00
24/05/2016 MYR 596 USD 140 11 0.00
24/05/2016 MYR 589 USD 138 11 0.00
24/05/2016 MYR 1,390 USD 325 26 0.01
09/06/2016 MYR 2,787 USD 672 33 0.01
15/06/2016 NOK 2,921 SEK 2,900 (5) 0.00
07/04/2016 NOK 14,936 USD 1,719 76 0.02
09/06/2016 NOK 44,805 USD 5,177 209 0.05
08/06/2016 NZD 350 EUR 210 2 0.00
08/06/2016 NZD 165 EUR 100 - 0.00
07/04/2016 NZD 2,576 USD 1,696 81 0.02
08/04/2016 NZD 591 USD 392 16 0.00
26/04/2016 NZD 288 USD 200 - 0.00
26/04/2016 NZD 583 USD 400 4 0.00
03/05/2016 NZD 1,377 USD 914 35 0.01
08/04/2016 PLN 700 EUR 161 4 0.00
20/04/2016 PLN 1,782 EUR 400 20 0.00
28/04/2016 PLN 3,009 EUR 700 9 0.00
04/05/2016 PLN 1,758 EUR 400 14 0.00
09/06/2016 PLN 15,027 USD 3,777 225 0.05
15/06/2016 PLN 1,518 USD 400 6 0.00
15/04/2016 RUB 43,980 USD 597 52 0.01
25/04/2016 RUB 32,474 USD 406 67 0.02
29/04/2016 SEK 7,474 EUR 800 9 0.00
10/05/2016 SEK 7,586 EUR 800 21 0.01
07/04/2016 SEK 22,006 USD 2,555 140 0.03
24/05/2016 THB 6,489 USD 181 3 0.00
24/05/2016 THB 6,847 USD 191 3 0.00
24/05/2016 THB 5,836 USD 163 2 0.00
26/04/2016 TRY 569 USD 200 1 0.00
26/04/2016 TRY 577 USD 200 3 0.00
03/05/2016 TRY 1,211 USD 415 10 0.00
09/06/2016 TRY 9,793 USD 3,259 139 0.03
24/05/2016 TWD 2,584 USD 77 3 0.00
24/05/2016 TWD 762 USD 23 1 0.00
24/05/2016 TWD 3,029 USD 91 2 0.00
24/05/2016 TWD 1,179 USD 35 1 0.00
24/05/2016 TWD 3,309 USD 99 4 0.00
04/04/2016 USD 1,326 AUD 1,852 (87) (0.02)
08/04/2016 USD 14,577 AUD 20,668 (1,156) (0.29)
26/04/2016 USD 263 AUD 345 (2) 0.00
26/04/2016 USD 400 AUD 526 (4) 0.00
26/04/2016 USD 200 AUD 267 (5) 0.00
03/05/2016 USD 416 AUD 566 (16) 0.00
03/05/2016 USD 400 AUD 565 (30) (0.01)
03/05/2016 USD 1,390 AUD 1,852 (28) (0.01)
15/06/2016 USD 705 AUD 950 (20) 0.00
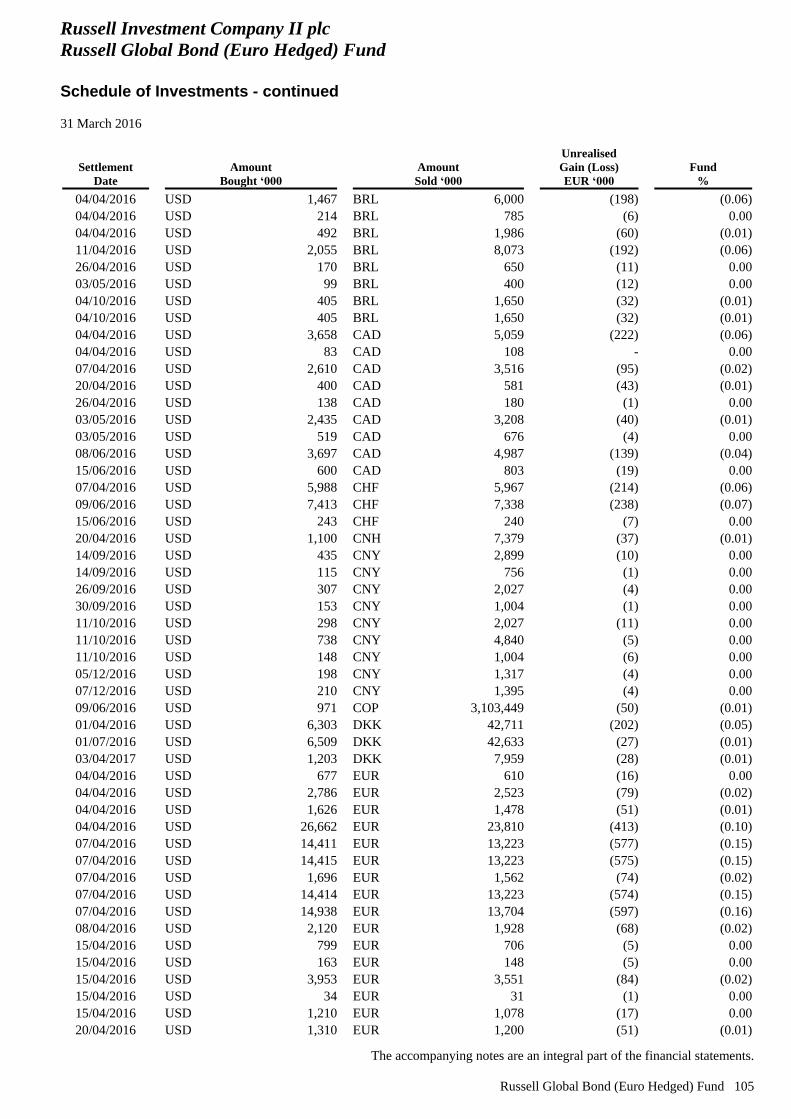
Russell Investment Company II plc
Russell Global Bond (Euro Hedged) Fund
Schedule of Investments - continued
31 March 2016
The accompanying notes are an integral part of the financial statements.
Russell Global Bond (Euro Hedged) Fund 105
Settlement
Date
Amount
Bought ‘000
Amount
Sold ‘000
Unrealised
Gain (Loss)
EUR ‘000
Fund
%
04/04/2016 USD 1,467 BRL 6,000 (198) (0.06)
04/04/2016 USD 214 BRL 785 (6) 0.00
04/04/2016 USD 492 BRL 1,986 (60) (0.01)
11/04/2016 USD 2,055 BRL 8,073 (192) (0.06)
26/04/2016 USD 170 BRL 650 (11) 0.00
03/05/2016 USD 99 BRL 400 (12) 0.00
04/10/2016 USD 405 BRL 1,650 (32) (0.01)
04/10/2016 USD 405 BRL 1,650 (32) (0.01)
04/04/2016 USD 3,658 CAD 5,059 (222) (0.06)
04/04/2016 USD 83 CAD 108 - 0.00
07/04/2016 USD 2,610 CAD 3,516 (95) (0.02)
20/04/2016 USD 400 CAD 581 (43) (0.01)
26/04/2016 USD 138 CAD 180 (1) 0.00
03/05/2016 USD 2,435 CAD 3,208 (40) (0.01)
03/05/2016 USD 519 CAD 676 (4) 0.00
08/06/2016 USD 3,697 CAD 4,987 (139) (0.04)
15/06/2016 USD 600 CAD 803 (19) 0.00
07/04/2016 USD 5,988 CHF 5,967 (214) (0.06)
09/06/2016 USD 7,413 CHF 7,338 (238) (0.07)
15/06/2016 USD 243 CHF 240 (7) 0.00
20/04/2016 USD 1,100 CNH 7,379 (37) (0.01)
14/09/2016 USD 435 CNY 2,899 (10) 0.00
14/09/2016 USD 115 CNY 756 (1) 0.00
26/09/2016 USD 307 CNY 2,027 (4) 0.00
30/09/2016 USD 153 CNY 1,004 (1) 0.00
11/10/2016 USD 298 CNY 2,027 (11) 0.00
11/10/2016 USD 738 CNY 4,840 (5) 0.00
11/10/2016 USD 148 CNY 1,004 (6) 0.00
05/12/2016 USD 198 CNY 1,317 (4) 0.00
07/12/2016 USD 210 CNY 1,395 (4) 0.00
09/06/2016 USD 971 COP 3,103,449 (50) (0.01)
01/04/2016 USD 6,303 DKK 42,711 (202) (0.05)
01/07/2016 USD 6,509 DKK 42,633 (27) (0.01)
03/04/2017 USD 1,203 DKK 7,959 (28) (0.01)
04/04/2016 USD 677 EUR 610 (16) 0.00
04/04/2016 USD 2,786 EUR 2,523 (79) (0.02)
04/04/2016 USD 1,626 EUR 1,478 (51) (0.01)
04/04/2016 USD 26,662 EUR 23,810 (413) (0.10)
07/04/2016 USD 14,411 EUR 13,223 (577) (0.15)
07/04/2016 USD 14,415 EUR 13,223 (575) (0.15)
07/04/2016 USD 1,696 EUR 1,562 (74) (0.02)
07/04/2016 USD 14,414 EUR 13,223 (574) (0.15)
07/04/2016 USD 14,938 EUR 13,704 (597) (0.16)
08/04/2016 USD 2,120 EUR 1,928 (68) (0.02)
15/04/2016 USD 799 EUR 706 (5) 0.00
15/04/2016 USD 163 EUR 148 (5) 0.00
15/04/2016 USD 3,953 EUR 3,551 (84) (0.02)
15/04/2016 USD 34 EUR 31 (1) 0.00
15/04/2016 USD 1,210 EUR 1,078 (17) 0.00
20/04/2016 USD 1,310 EUR 1,200 (51) (0.01)
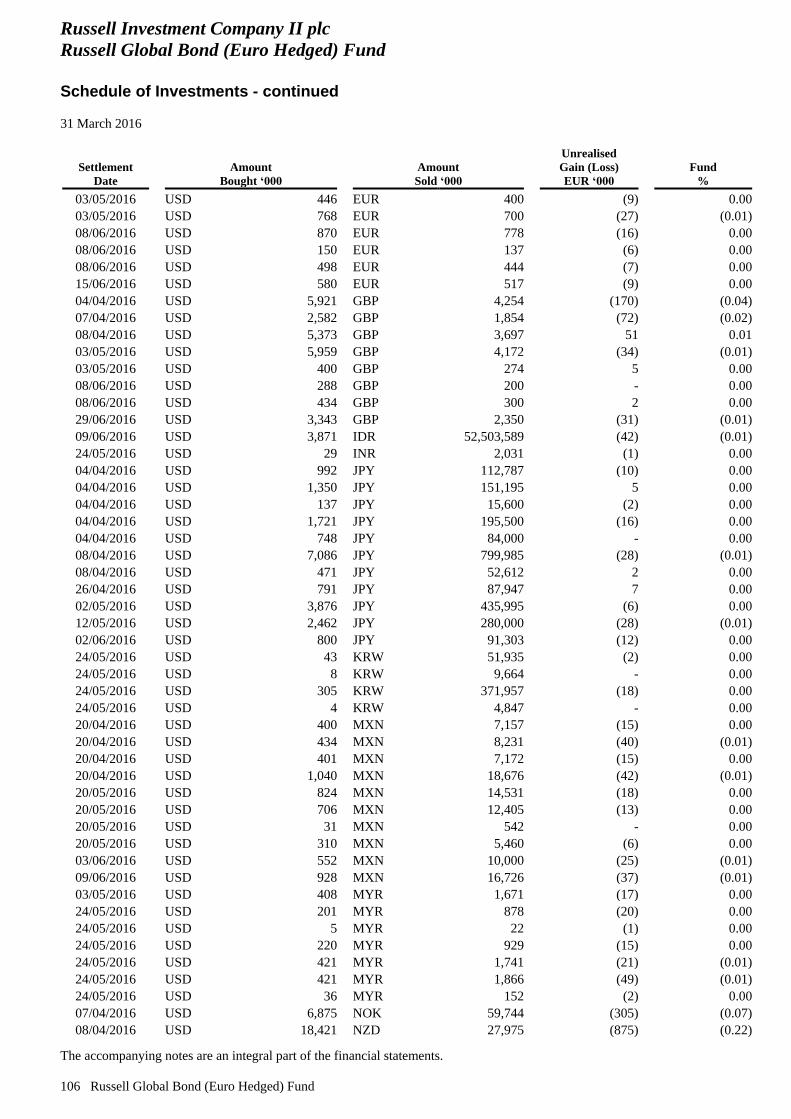
Russell Investment Company II plc
Russell Global Bond (Euro Hedged) Fund
Schedule of Investments - continued
31 March 2016
The accompanying notes are an integral part of the financial statements.
106 Russell Global Bond (Euro Hedged) Fund
Settlement
Date
Amount
Bought ‘000
Amount
Sold ‘000
Unrealised
Gain (Loss)
EUR ‘000
Fund
%
03/05/2016 USD 446 EUR 400 (9) 0.00
03/05/2016 USD 768 EUR 700 (27) (0.01)
08/06/2016 USD 870 EUR 778 (16) 0.00
08/06/2016 USD 150 EUR 137 (6) 0.00
08/06/2016 USD 498 EUR 444 (7) 0.00
15/06/2016 USD 580 EUR 517 (9) 0.00
04/04/2016 USD 5,921 GBP 4,254 (170) (0.04)
07/04/2016 USD 2,582 GBP 1,854 (72) (0.02)
08/04/2016 USD 5,373 GBP 3,697 51 0.01
03/05/2016 USD 5,959 GBP 4,172 (34) (0.01)
03/05/2016 USD 400 GBP 274 5 0.00
08/06/2016 USD 288 GBP 200 - 0.00
08/06/2016 USD 434 GBP 300 2 0.00
29/06/2016 USD 3,343 GBP 2,350 (31) (0.01)
09/06/2016 USD 3,871 IDR 52,503,589 (42) (0.01)
24/05/2016 USD 29 INR 2,031 (1) 0.00
04/04/2016 USD 992 JPY 112,787 (10) 0.00
04/04/2016 USD 1,350 JPY 151,195 5 0.00
04/04/2016 USD 137 JPY 15,600 (2) 0.00
04/04/2016 USD 1,721 JPY 195,500 (16) 0.00
04/04/2016 USD 748 JPY 84,000 - 0.00
08/04/2016 USD 7,086 JPY 799,985 (28) (0.01)
08/04/2016 USD 471 JPY 52,612 2 0.00
26/04/2016 USD 791 JPY 87,947 7 0.00
02/05/2016 USD 3,876 JPY 435,995 (6) 0.00
12/05/2016 USD 2,462 JPY 280,000 (28) (0.01)
02/06/2016 USD 800 JPY 91,303 (12) 0.00
24/05/2016 USD 43 KRW 51,935 (2) 0.00
24/05/2016 USD 8 KRW 9,664 - 0.00
24/05/2016 USD 305 KRW 371,957 (18) 0.00
24/05/2016 USD 4 KRW 4,847 - 0.00
20/04/2016 USD 400 MXN 7,157 (15) 0.00
20/04/2016 USD 434 MXN 8,231 (40) (0.01)
20/04/2016 USD 401 MXN 7,172 (15) 0.00
20/04/2016 USD 1,040 MXN 18,676 (42) (0.01)
20/05/2016 USD 824 MXN 14,531 (18) 0.00
20/05/2016 USD 706 MXN 12,405 (13) 0.00
20/05/2016 USD 31 MXN 542 - 0.00
20/05/2016 USD 310 MXN 5,460 (6) 0.00
03/06/2016 USD 552 MXN 10,000 (25) (0.01)
09/06/2016 USD 928 MXN 16,726 (37) (0.01)
03/05/2016 USD 408 MYR 1,671 (17) 0.00
24/05/2016 USD 201 MYR 878 (20) 0.00
24/05/2016 USD 5 MYR 22 (1) 0.00
24/05/2016 USD 220 MYR 929 (15) 0.00
24/05/2016 USD 421 MYR 1,741 (21) (0.01)
24/05/2016 USD 421 MYR 1,866 (49) (0.01)
24/05/2016 USD 36 MYR 152 (2) 0.00
07/04/2016 USD 6,875 NOK 59,744 (305) (0.07)
08/04/2016 USD 18,421 NZD 27,975 (875) (0.22)
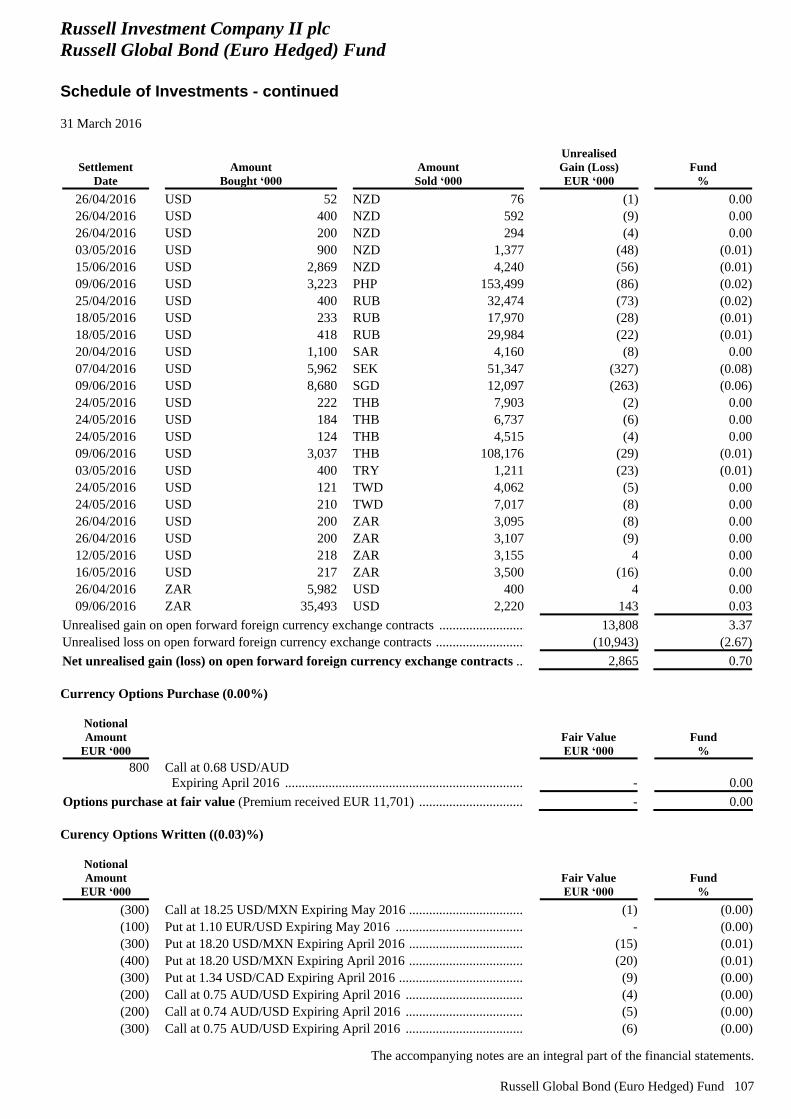
Russell Investment Company II plc
Russell Global Bond (Euro Hedged) Fund
Schedule of Investments - continued
31 March 2016
The accompanying notes are an integral part of the financial statements.
Russell Global Bond (Euro Hedged) Fund 107
Settlement
Date
Amount
Bought ‘000
Amount
Sold ‘000
Unrealised
Gain (Loss)
EUR ‘000
Fund
%
26/04/2016 USD 52 NZD 76 (1) 0.00
26/04/2016 USD 400 NZD 592 (9) 0.00
26/04/2016 USD 200 NZD 294 (4) 0.00
03/05/2016 USD 900 NZD 1,377 (48) (0.01)
15/06/2016 USD 2,869 NZD 4,240 (56) (0.01)
09/06/2016 USD 3,223 PHP 153,499 (86) (0.02)
25/04/2016 USD 400 RUB 32,474 (73) (0.02)
18/05/2016 USD 233 RUB 17,970 (28) (0.01)
18/05/2016 USD 418 RUB 29,984 (22) (0.01)
20/04/2016 USD 1,100 SAR 4,160 (8) 0.00
07/04/2016 USD 5,962 SEK 51,347 (327) (0.08)
09/06/2016 USD 8,680 SGD 12,097 (263) (0.06)
24/05/2016 USD 222 THB 7,903 (2) 0.00
24/05/2016 USD 184 THB 6,737 (6) 0.00
24/05/2016 USD 124 THB 4,515 (4) 0.00
09/06/2016 USD 3,037 THB 108,176 (29) (0.01)
03/05/2016 USD 400 TRY 1,211 (23) (0.01)
24/05/2016 USD 121 TWD 4,062 (5) 0.00
24/05/2016 USD 210 TWD 7,017 (8) 0.00
26/04/2016 USD 200 ZAR 3,095 (8) 0.00
26/04/2016 USD 200 ZAR 3,107 (9) 0.00
12/05/2016 USD 218 ZAR 3,155 4 0.00
16/05/2016 USD 217 ZAR 3,500 (16) 0.00
26/04/2016 ZAR 5,982 USD 400 4 0.00
09/06/2016 ZAR 35,493 USD 2,220 143 0.03
Unrealised gain on open forward foreign currency exchange contracts ............................... 13,808 3.37
Unrealised loss on open forward foreign currency exchange contracts ................................ (10,943) (2.67)
Net unrealised gain (loss) on open forward foreign currency exchange contracts ........ 2,865 0.70
Currency Options Purchase (0.00%)
Notional
Amount
EUR ‘000
Fair Value
EUR ‘000
Fund
%
800
Call at 0.68 USD/AUD
Expiring April 2016 .................................................................................................................... - 0.00
Options purchase at fair value (Premium received EUR 11,701) .............................................. - 0.00
Curency Options Written ((0.03)%)
Notional
Amount
EUR ‘000
Fair Value
EUR ‘000
Fund
%
(300) Call at 18.25 USD/MXN Expiring May 2016 ............................................................................... (1) (0.00)
(100) Put at 1.10 EUR/USD Expiring May 2016 ................................................................................... - (0.00)
(300) Put at 18.20 USD/MXN Expiring April 2016 ............................................................................... (15) (0.01)
(400) Put at 18.20 USD/MXN Expiring April 2016 ............................................................................... (20) (0.01)
(300) Put at 1.34 USD/CAD Expiring April 2016 .................................................................................. (9) (0.00)
(200) Call at 0.75 AUD/USD Expiring April 2016 ................................................................................ (4) (0.00)
(200) Call at 0.74 AUD/USD Expiring April 2016 ................................................................................ (5) (0.00)
(300) Call at 0.75 AUD/USD Expiring April 2016 ................................................................................ (6) (0.00)
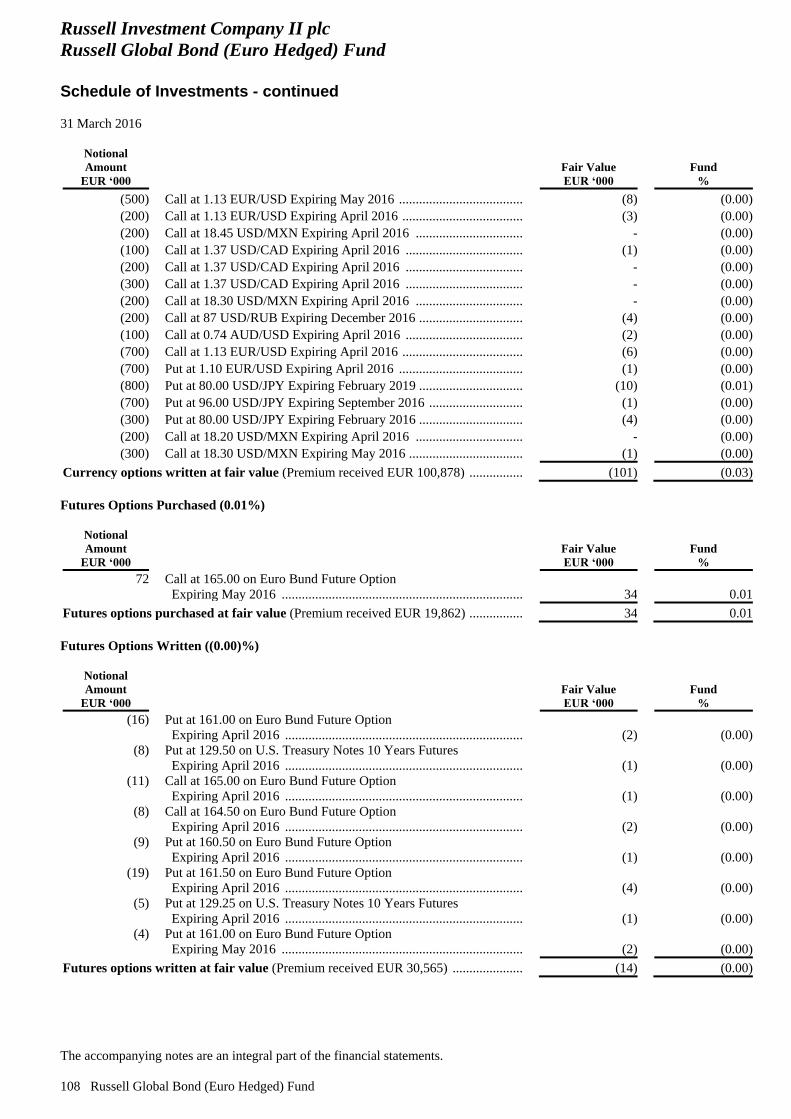
Russell Investment Company II plc
Russell Global Bond (Euro Hedged) Fund
Schedule of Investments - continued
31 March 2016
The accompanying notes are an integral part of the financial statements.
108 Russell Global Bond (Euro Hedged) Fund
Notional
Amount
EUR ‘000
Fair Value
EUR ‘000
Fund
%
(500) Call at 1.13 EUR/USD Expiring May 2016 .................................................................................. (8) (0.00)
(200) Call at 1.13 EUR/USD Expiring April 2016 ................................................................................. (3) (0.00)
(200) Call at 18.45 USD/MXN Expiring April 2016 ............................................................................. - (0.00)
(100) Call at 1.37 USD/CAD Expiring April 2016 ................................................................................ (1) (0.00)
(200) Call at 1.37 USD/CAD Expiring April 2016 ................................................................................ - (0.00)
(300) Call at 1.37 USD/CAD Expiring April 2016 ................................................................................ - (0.00)
(200) Call at 18.30 USD/MXN Expiring April 2016 ............................................................................. - (0.00)
(200) Call at 87 USD/RUB Expiring December 2016 ............................................................................ (4) (0.00)
(100) Call at 0.74 AUD/USD Expiring April 2016 ................................................................................ (2) (0.00)
(700) Call at 1.13 EUR/USD Expiring April 2016 ................................................................................. (6) (0.00)
(700) Put at 1.10 EUR/USD Expiring April 2016 .................................................................................. (1) (0.00)
(800) Put at 80.00 USD/JPY Expiring February 2019 ............................................................................ (10) (0.01)
(700) Put at 96.00 USD/JPY Expiring September 2016 ......................................................................... (1) (0.00)
(300) Put at 80.00 USD/JPY Expiring February 2016 ............................................................................ (4) (0.00)
(200) Call at 18.20 USD/MXN Expiring April 2016 ............................................................................. - (0.00)
(300) Call at 18.30 USD/MXN Expiring May 2016 ............................................................................... (1) (0.00)
Currency options written at fair value (Premium received EUR 100,878) ............................... (101) (0.03)
Futures Options Purchased (0.01%)
Notional
Amount
EUR ‘000
Fair Value
EUR ‘000
Fund
%
72
Call at 165.00 on Euro Bund Future Option
Expiring May 2016 ..................................................................................................................... 34 0.01
Futures options purchased at fair value (Premium received EUR 19,862) ............................... 34 0.01
Futures Options Written ((0.00)%)
Notional
Amount
EUR ‘000
Fair Value
EUR ‘000
Fund
%
(16)
Put at 161.00 on Euro Bund Future Option
Expiring April 2016 .................................................................................................................... (2) (0.00)
(8)
Put at 129.50 on U.S. Treasury Notes 10 Years Futures
Expiring April 2016 .................................................................................................................... (1) (0.00)
(11)
Call at 165.00 on Euro Bund Future Option
Expiring April 2016 .................................................................................................................... (1) (0.00)
(8)
Call at 164.50 on Euro Bund Future Option
Expiring April 2016 .................................................................................................................... (2) (0.00)
(9)
Put at 160.50 on Euro Bund Future Option
Expiring April 2016 .................................................................................................................... (1) (0.00)
(19)
Put at 161.50 on Euro Bund Future Option
Expiring April 2016 .................................................................................................................... (4) (0.00)
(5)
Put at 129.25 on U.S. Treasury Notes 10 Years Futures
Expiring April 2016 .................................................................................................................... (1) (0.00)
(4)
Put at 161.00 on Euro Bund Future Option
Expiring May 2016 ..................................................................................................................... (2) (0.00)
Futures options written at fair value (Premium received EUR 30,565) .................................... (14) (0.00)
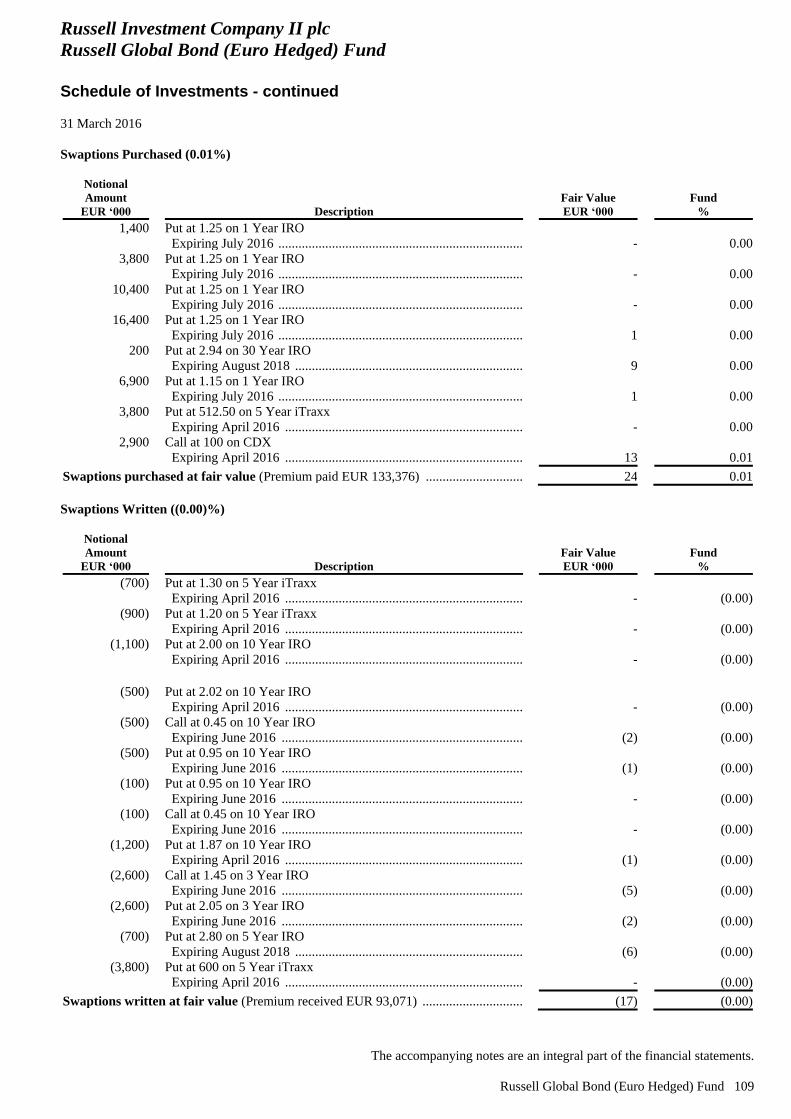
Russell Investment Company II plc
Russell Global Bond (Euro Hedged) Fund
Schedule of Investments - continued
31 March 2016
The accompanying notes are an integral part of the financial statements.
Russell Global Bond (Euro Hedged) Fund 109
Swaptions Purchased (0.01%)
Notional
Amount
EUR ‘000 Description
Fair Value
EUR ‘000
Fund
%
1,400
Put at 1.25 on 1 Year IRO
Expiring July 2016 ...................................................................................................................... - 0.00
3,800
Put at 1.25 on 1 Year IRO
Expiring July 2016 ...................................................................................................................... - 0.00
10,400
Put at 1.25 on 1 Year IRO
Expiring July 2016 ...................................................................................................................... - 0.00
16,400
Put at 1.25 on 1 Year IRO
Expiring July 2016 ...................................................................................................................... 1 0.00
200
Put at 2.94 on 30 Year IRO
Expiring August 2018 ................................................................................................................. 9 0.00
6,900
Put at 1.15 on 1 Year IRO
Expiring July 2016 ...................................................................................................................... 1 0.00
3,800
Put at 512.50 on 5 Year iTraxx
Expiring April 2016 .................................................................................................................... - 0.00
2,900
Call at 100 on CDX
Expiring April 2016 .................................................................................................................... 13 0.01
Swaptions purchased at fair value (Premium paid EUR 133,376) ............................................ 24 0.01
Swaptions Written ((0.00)%)
Notional
Amount
EUR ‘000 Description
Fair Value
EUR ‘000
Fund
%
(700)
Put at 1.30 on 5 Year iTraxx
Expiring April 2016 .................................................................................................................... - (0.00)
(900)
Put at 1.20 on 5 Year iTraxx
Expiring April 2016 .................................................................................................................... - (0.00)
(1,100)
Put at 2.00 on 10 Year IRO
Expiring April 2016 .................................................................................................................... - (0.00)
(500)
Put at 2.02 on 10 Year IRO
Expiring April 2016 .................................................................................................................... - (0.00)
(500)
Call at 0.45 on 10 Year IRO
Expiring June 2016 ..................................................................................................................... (2) (0.00)
(500)
Put at 0.95 on 10 Year IRO
Expiring June 2016 ..................................................................................................................... (1) (0.00)
(100)
Put at 0.95 on 10 Year IRO
Expiring June 2016 ..................................................................................................................... - (0.00)
(100)
Call at 0.45 on 10 Year IRO
Expiring June 2016 ..................................................................................................................... - (0.00)
(1,200)
Put at 1.87 on 10 Year IRO
Expiring April 2016 .................................................................................................................... (1) (0.00)
(2,600)
Call at 1.45 on 3 Year IRO
Expiring June 2016 ..................................................................................................................... (5) (0.00)
(2,600)
Put at 2.05 on 3 Year IRO
Expiring June 2016 ..................................................................................................................... (2) (0.00)
(700)
Put at 2.80 on 5 Year IRO
Expiring August 2018 ................................................................................................................. (6) (0.00)
(3,800)
Put at 600 on 5 Year iTraxx
Expiring April 2016 .................................................................................................................... - (0.00)
Swaptions written at fair value (Premium received EUR 93,071) ............................................. (17) (0.00)
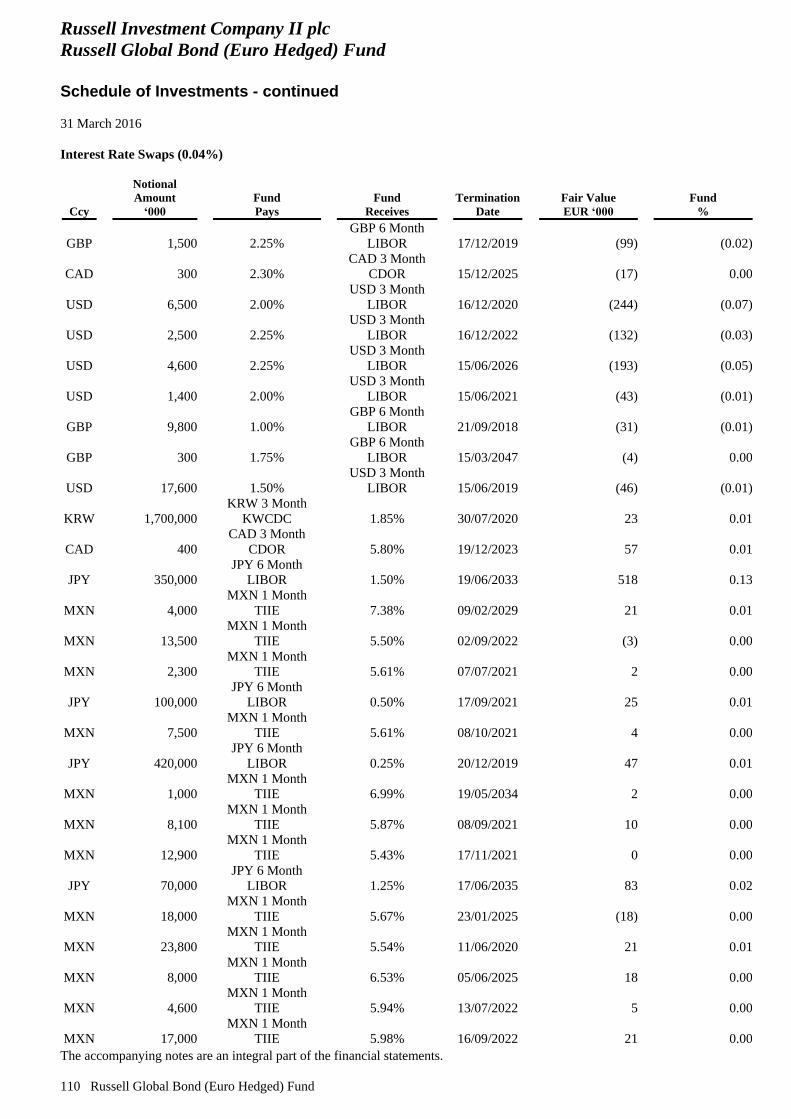
Russell Investment Company II plc
Russell Global Bond (Euro Hedged) Fund
Schedule of Investments - continued
31 March 2016
The accompanying notes are an integral part of the financial statements.
110 Russell Global Bond (Euro Hedged) Fund
Interest Rate Swaps (0.04%)
Ccy
Notional
Amount
‘000
Fund
Pays
Fund
Receives
Termination
Date
Fair Value
EUR ‘000
Fund
%
GBP
1,500 2.25%
GBP 6 Month
LIBOR 17/12/2019 (99) (0.02)
CAD
300 2.30%
CAD 3 Month
CDOR 15/12/2025 (17) 0.00
USD
6,500 2.00%
USD 3 Month
LIBOR 16/12/2020 (244) (0.07)
USD
2,500 2.25%
USD 3 Month
LIBOR 16/12/2022 (132) (0.03)
USD
4,600 2.25%
USD 3 Month
LIBOR 15/06/2026 (193) (0.05)
USD
1,400 2.00%
USD 3 Month
LIBOR 15/06/2021 (43) (0.01)
GBP
9,800 1.00%
GBP 6 Month
LIBOR 21/09/2018 (31) (0.01)
GBP
300 1.75%
GBP 6 Month
LIBOR 15/03/2047 (4) 0.00
USD
17,600 1.50%
USD 3 Month
LIBOR 15/06/2019 (46) (0.01)
KRW
1,700,000
KRW 3 Month
KWCDC 1.85% 30/07/2020 23 0.01
CAD
400
CAD 3 Month
CDOR 5.80% 19/12/2023 57 0.01
JPY
350,000
JPY 6 Month
LIBOR 1.50% 19/06/2033 518 0.13
MXN
4,000
MXN 1 Month
TIIE 7.38% 09/02/2029 21 0.01
MXN
13,500
MXN 1 Month
TIIE 5.50% 02/09/2022 (3) 0.00
MXN
2,300
MXN 1 Month
TIIE 5.61% 07/07/2021 2 0.00
JPY
100,000
JPY 6 Month
LIBOR 0.50% 17/09/2021 25 0.01
MXN
7,500
MXN 1 Month
TIIE 5.61% 08/10/2021 4 0.00
JPY
420,000
JPY 6 Month
LIBOR 0.25% 20/12/2019 47 0.01
MXN
1,000
MXN 1 Month
TIIE 6.99% 19/05/2034 2 0.00
MXN
8,100
MXN 1 Month
TIIE 5.87% 08/09/2021 10 0.00
MXN
12,900
MXN 1 Month
TIIE 5.43% 17/11/2021 0 0.00
JPY
70,000
JPY 6 Month
LIBOR 1.25% 17/06/2035 83 0.02
MXN
18,000
MXN 1 Month
TIIE 5.67% 23/01/2025 (18) 0.00
MXN
23,800
MXN 1 Month
TIIE 5.54% 11/06/2020 21 0.01
MXN
8,000
MXN 1 Month
TIIE 6.53% 05/06/2025 18 0.00
MXN
4,600
MXN 1 Month
TIIE 5.94% 13/07/2022 5 0.00
MXN
17,000
MXN 1 Month
TIIE 5.98% 16/09/2022 21 0.00
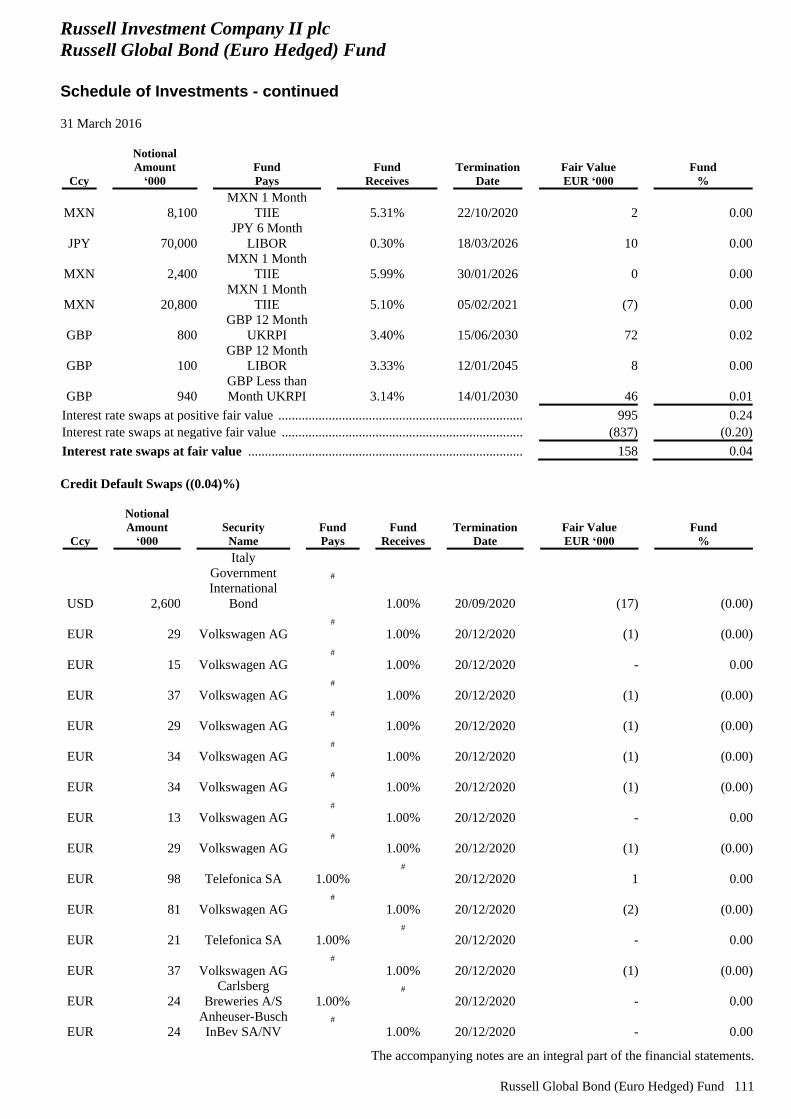
Russell Investment Company II plc
Russell Global Bond (Euro Hedged) Fund
Schedule of Investments - continued
31 March 2016
The accompanying notes are an integral part of the financial statements.
Russell Global Bond (Euro Hedged) Fund 111
Ccy
Notional
Amount
‘000
Fund
Pays
Fund
Receives
Termination
Date
Fair Value
EUR ‘000
Fund
%
MXN
8,100
MXN 1 Month
TIIE 5.31% 22/10/2020 2 0.00
JPY
70,000
JPY 6 Month
LIBOR 0.30% 18/03/2026 10 0.00
MXN
2,400
MXN 1 Month
TIIE 5.99% 30/01/2026 0 0.00
MXN
20,800
MXN 1 Month
TIIE 5.10% 05/02/2021 (7) 0.00
GBP
800
GBP 12 Month
UKRPI 3.40% 15/06/2030 72 0.02
GBP
100
GBP 12 Month
LIBOR 3.33% 12/01/2045 8 0.00
GBP
940
GBP Less than
Month UKRPI 3.14% 14/01/2030 46 0.01
Interest rate swaps at positive fair value ........................................................................................ 995 0.24
Interest rate swaps at negative fair value ....................................................................................... (837) (0.20)
Interest rate swaps at fair value ................................................................................................. 158 0.04
Credit Default Swaps ((0.04)%)
Ccy
Notional
Amount
‘000
Security
Name
Fund
Pays
Fund
Receives
Termination
Date
Fair Value
EUR ‘000
Fund
%
USD
2,600
Italy
Government
International
Bond
#
1.00% 20/09/2020 (17) (0.00)
EUR
29 Volkswagen AG #
1.00% 20/12/2020 (1) (0.00)
EUR
15 Volkswagen AG #
1.00% 20/12/2020 - 0.00
EUR
37 Volkswagen AG #
1.00% 20/12/2020 (1) (0.00)
EUR
29 Volkswagen AG #
1.00% 20/12/2020 (1) (0.00)
EUR
34 Volkswagen AG #
1.00% 20/12/2020 (1) (0.00)
EUR
34 Volkswagen AG #
1.00% 20/12/2020 (1) (0.00)
EUR
13 Volkswagen AG #
1.00% 20/12/2020 - 0.00
EUR
29 Volkswagen AG #
1.00% 20/12/2020 (1) (0.00)
EUR
98 Telefonica SA 1.00% #
20/12/2020 1 0.00
EUR
81 Volkswagen AG #
1.00% 20/12/2020 (2) (0.00)
EUR
21 Telefonica SA 1.00% #
20/12/2020 - 0.00
EUR
37 Volkswagen AG #
1.00% 20/12/2020 (1) (0.00)
EUR
24
Carlsberg
Breweries A/S 1.00% #
20/12/2020 - 0.00
EUR
24
Anheuser-Busch
InBev SA/NV #
1.00% 20/12/2020 - 0.00
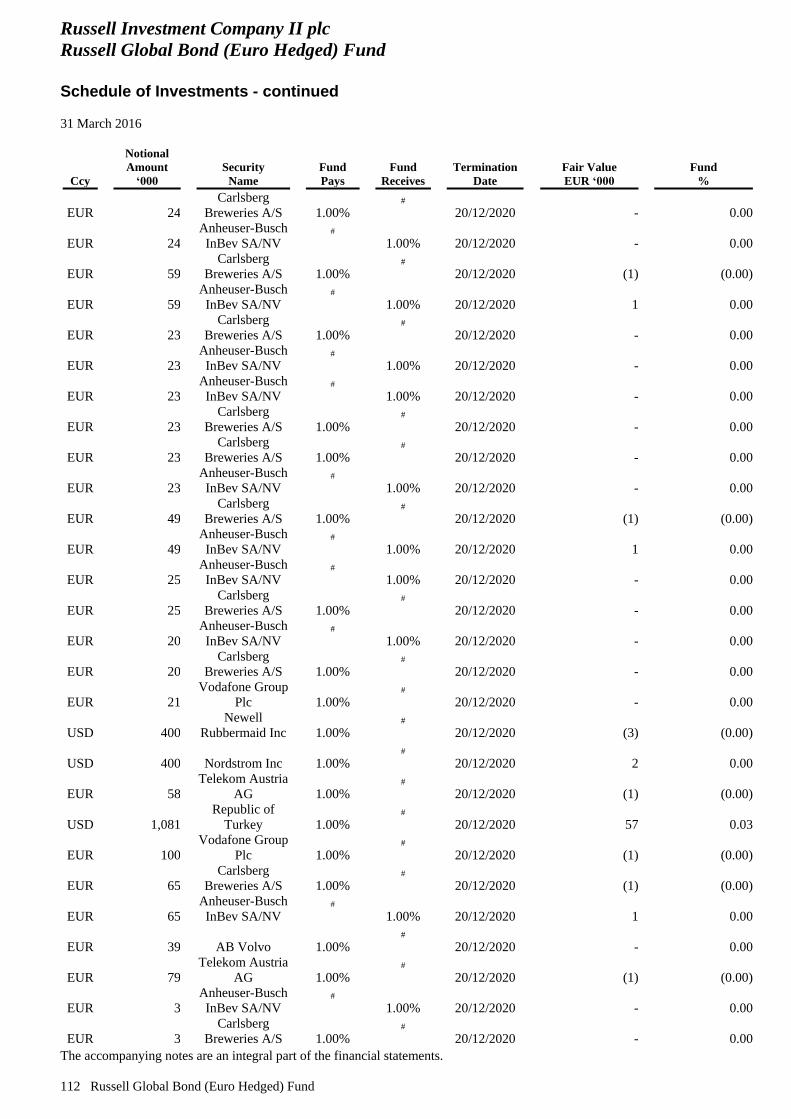
Russell Investment Company II plc
Russell Global Bond (Euro Hedged) Fund
Schedule of Investments - continued
31 March 2016
The accompanying notes are an integral part of the financial statements.
112 Russell Global Bond (Euro Hedged) Fund
Ccy
Notional
Amount
‘000
Security
Name
Fund
Pays
Fund
Receives
Termination
Date
Fair Value
EUR ‘000
Fund
%
EUR
24
Carlsberg
Breweries A/S 1.00% #
20/12/2020 - 0.00
EUR
24
Anheuser-Busch
InBev SA/NV #
1.00% 20/12/2020 - 0.00
EUR
59
Carlsberg
Breweries A/S 1.00% #
20/12/2020 (1) (0.00)
EUR
59
Anheuser-Busch
InBev SA/NV #
1.00% 20/12/2020 1 0.00
EUR
23
Carlsberg
Breweries A/S 1.00% #
20/12/2020 - 0.00
EUR
23
Anheuser-Busch
InBev SA/NV #
1.00% 20/12/2020 - 0.00
EUR
23
Anheuser-Busch
InBev SA/NV #
1.00% 20/12/2020 - 0.00
EUR
23
Carlsberg
Breweries A/S 1.00% #
20/12/2020 - 0.00
EUR
23
Carlsberg
Breweries A/S 1.00% #
20/12/2020 - 0.00
EUR
23
Anheuser-Busch
InBev SA/NV #
1.00% 20/12/2020 - 0.00
EUR
49
Carlsberg
Breweries A/S 1.00% #
20/12/2020 (1) (0.00)
EUR
49
Anheuser-Busch
InBev SA/NV #
1.00% 20/12/2020 1 0.00
EUR
25
Anheuser-Busch
InBev SA/NV #
1.00% 20/12/2020 - 0.00
EUR
25
Carlsberg
Breweries A/S 1.00% #
20/12/2020 - 0.00
EUR
20
Anheuser-Busch
InBev SA/NV #
1.00% 20/12/2020 - 0.00
EUR
20
Carlsberg
Breweries A/S 1.00% #
20/12/2020 - 0.00
EUR
21
Vodafone Group
Plc 1.00% #
20/12/2020 - 0.00
USD
400
Newell
Rubbermaid Inc 1.00% #
20/12/2020 (3) (0.00)
USD
400 Nordstrom Inc 1.00% #
20/12/2020 2 0.00
EUR
58
Telekom Austria
AG 1.00% #
20/12/2020 (1) (0.00)
USD
1,081
Republic of
Turkey 1.00% #
20/12/2020 57 0.03
EUR
100
Vodafone Group
Plc 1.00% #
20/12/2020 (1) (0.00)
EUR
65
Carlsberg
Breweries A/S 1.00% #
20/12/2020 (1) (0.00)
EUR
65
Anheuser-Busch
InBev SA/NV #
1.00% 20/12/2020 1 0.00
EUR
39 AB Volvo 1.00% #
20/12/2020 - 0.00
EUR
79
Telekom Austria
AG 1.00% #
20/12/2020 (1) (0.00)
EUR
3
Anheuser-Busch
InBev SA/NV #
1.00% 20/12/2020 - 0.00
EUR
3
Carlsberg
Breweries A/S 1.00% #
20/12/2020 - 0.00
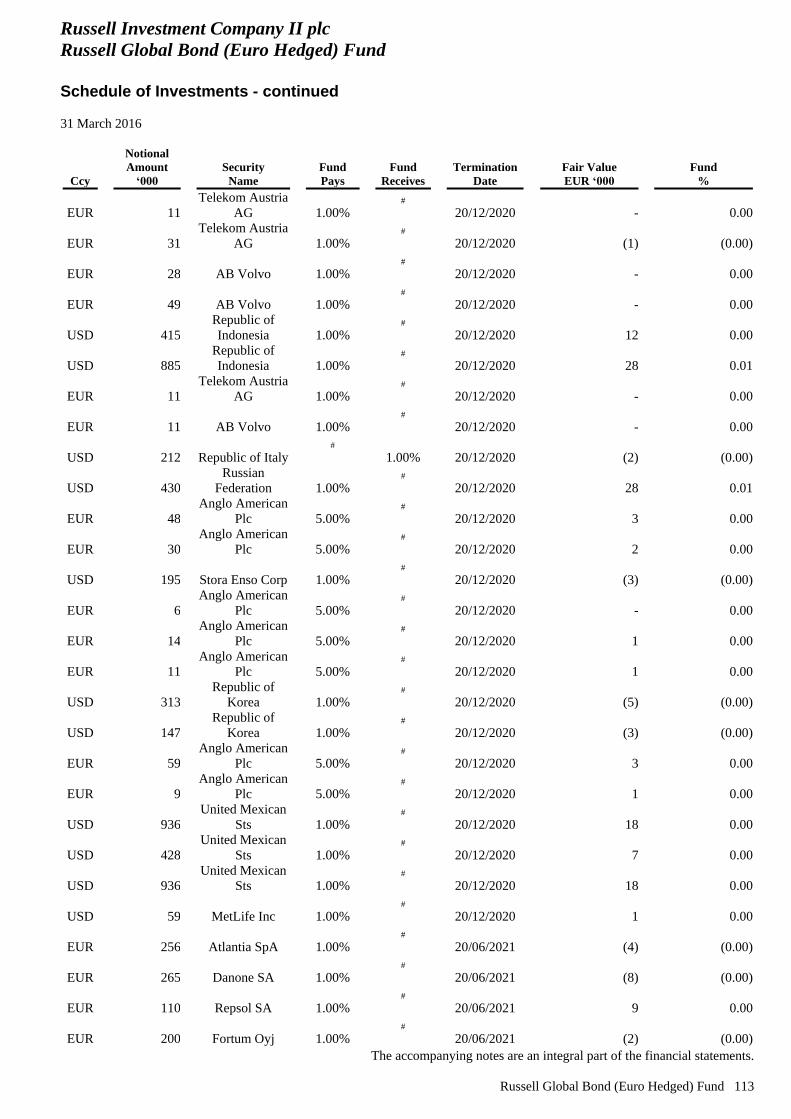
Russell Investment Company II plc
Russell Global Bond (Euro Hedged) Fund
Schedule of Investments - continued
31 March 2016
The accompanying notes are an integral part of the financial statements.
Russell Global Bond (Euro Hedged) Fund 113
Ccy
Notional
Amount
‘000
Security
Name
Fund
Pays
Fund
Receives
Termination
Date
Fair Value
EUR ‘000
Fund
%
EUR
11
Telekom Austria
AG 1.00% #
20/12/2020 - 0.00
EUR
31
Telekom Austria
AG 1.00% #
20/12/2020 (1) (0.00)
EUR
28 AB Volvo 1.00% #
20/12/2020 - 0.00
EUR
49 AB Volvo 1.00% #
20/12/2020 - 0.00
USD
415
Republic of
Indonesia 1.00% #
20/12/2020 12 0.00
USD
885
Republic of
Indonesia 1.00% #
20/12/2020 28 0.01
EUR
11
Telekom Austria
AG 1.00% #
20/12/2020 - 0.00
EUR
11 AB Volvo 1.00% #
20/12/2020 - 0.00
USD
212 Republic of Italy #
1.00% 20/12/2020 (2) (0.00)
USD
430
Russian
Federation 1.00% #
20/12/2020 28 0.01
EUR
48
Anglo American
Plc 5.00% #
20/12/2020 3 0.00
EUR
30
Anglo American
Plc 5.00% #
20/12/2020 2 0.00
USD
195 Stora Enso Corp 1.00% #
20/12/2020 (3) (0.00)
EUR
6
Anglo American
Plc 5.00% #
20/12/2020 - 0.00
EUR
14
Anglo American
Plc 5.00% #
20/12/2020 1 0.00
EUR
11
Anglo American
Plc 5.00% #
20/12/2020 1 0.00
USD
313
Republic of
Korea 1.00% #
20/12/2020 (5) (0.00)
USD
147
Republic of
Korea 1.00% #
20/12/2020 (3) (0.00)
EUR
59
Anglo American
Plc 5.00% #
20/12/2020 3 0.00
EUR
9
Anglo American
Plc 5.00% #
20/12/2020 1 0.00
USD
936
United Mexican
Sts 1.00% #
20/12/2020 18 0.00
USD
428
United Mexican
Sts 1.00% #
20/12/2020 7 0.00
USD
936
United Mexican
Sts 1.00% #
20/12/2020 18 0.00
USD
59 MetLife Inc 1.00% #
20/12/2020 1 0.00
EUR
256 Atlantia SpA 1.00% #
20/06/2021 (4) (0.00)
EUR
265 Danone SA 1.00% #
20/06/2021 (8) (0.00)
EUR
110 Repsol SA 1.00% #
20/06/2021 9 0.00
EUR
200 Fortum Oyj 1.00% #
20/06/2021 (2) (0.00)
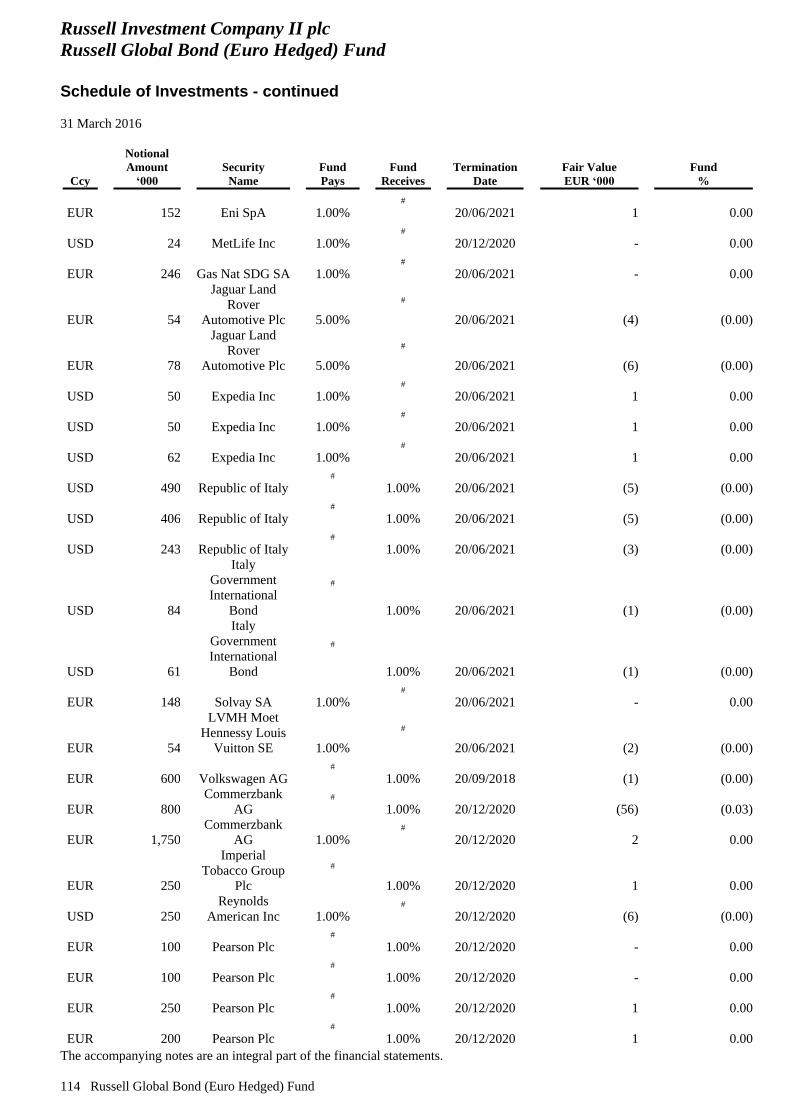
Russell Investment Company II plc
Russell Global Bond (Euro Hedged) Fund
Schedule of Investments - continued
31 March 2016
The accompanying notes are an integral part of the financial statements.
114 Russell Global Bond (Euro Hedged) Fund
Ccy
Notional
Amount
‘000
Security
Name
Fund
Pays
Fund
Receives
Termination
Date
Fair Value
EUR ‘000
Fund
%
EUR
152 Eni SpA 1.00% #
20/06/2021 1 0.00
USD
24 MetLife Inc 1.00% #
20/12/2020 - 0.00
EUR
246 Gas Nat SDG SA 1.00% #
20/06/2021 - 0.00
EUR
54
Jaguar Land
Rover
Automotive Plc 5.00%
#
20/06/2021 (4) (0.00)
EUR
78
Jaguar Land
Rover
Automotive Plc 5.00%
#
20/06/2021 (6) (0.00)
USD
50 Expedia Inc 1.00% #
20/06/2021 1 0.00
USD
50 Expedia Inc 1.00% #
20/06/2021 1 0.00
USD
62 Expedia Inc 1.00% #
20/06/2021 1 0.00
USD
490 Republic of Italy #
1.00% 20/06/2021 (5) (0.00)
USD
406 Republic of Italy #
1.00% 20/06/2021 (5) (0.00)
USD
243 Republic of Italy #
1.00% 20/06/2021 (3) (0.00)
USD
84
Italy
Government
International
Bond
#
1.00% 20/06/2021 (1) (0.00)
USD
61
Italy
Government
International
Bond
#
1.00% 20/06/2021 (1) (0.00)
EUR
148 Solvay SA 1.00% #
20/06/2021 - 0.00
EUR
54
LVMH Moet
Hennessy Louis
Vuitton SE 1.00%
#
20/06/2021 (2) (0.00)
EUR
600 Volkswagen AG #
1.00% 20/09/2018 (1) (0.00)
EUR
800
Commerzbank
AG #
1.00% 20/12/2020 (56) (0.03)
EUR
1,750
Commerzbank
AG 1.00% #
20/12/2020 2 0.00
EUR
250
Imperial
Tobacco Group
Plc
#
1.00% 20/12/2020 1 0.00
USD
250
Reynolds
American Inc 1.00% #
20/12/2020 (6) (0.00)
EUR
100 Pearson Plc #
1.00% 20/12/2020 - 0.00
EUR
100 Pearson Plc #
1.00% 20/12/2020 - 0.00
EUR
250 Pearson Plc #
1.00% 20/12/2020 1 0.00
EUR
200 Pearson Plc #
1.00% 20/12/2020 1 0.00
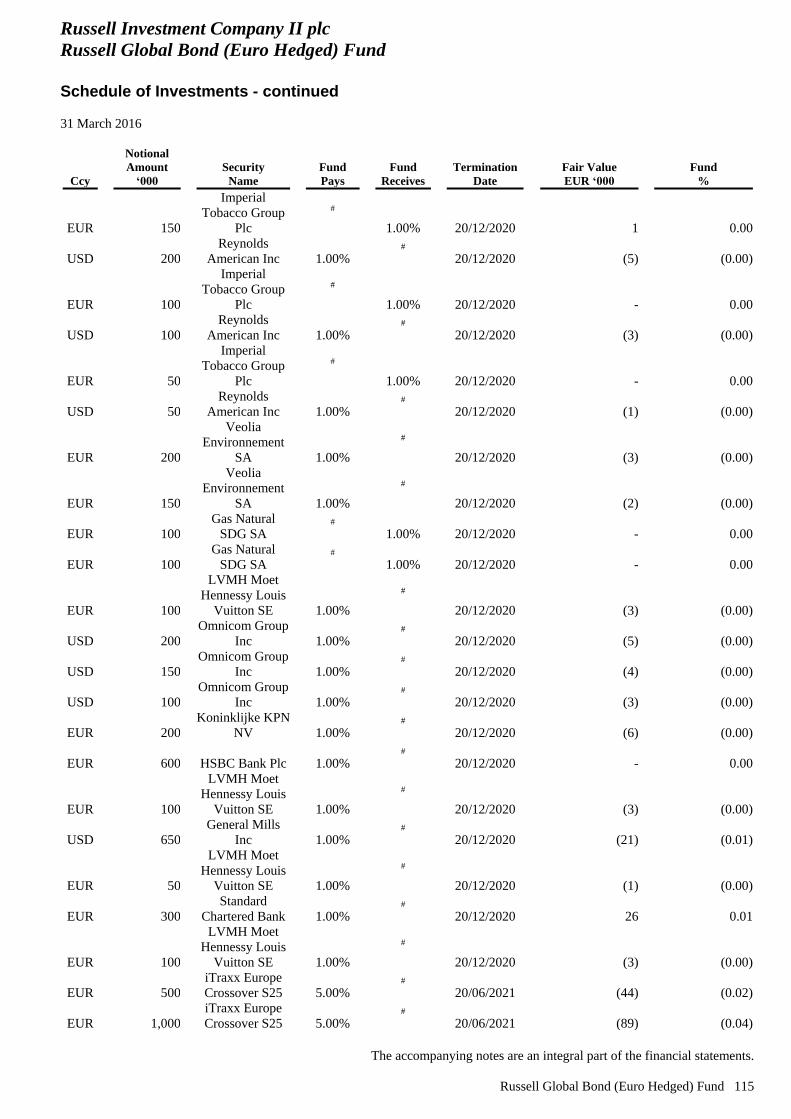
Russell Investment Company II plc
Russell Global Bond (Euro Hedged) Fund
Schedule of Investments - continued
31 March 2016
The accompanying notes are an integral part of the financial statements.
Russell Global Bond (Euro Hedged) Fund 115
Ccy
Notional
Amount
‘000
Security
Name
Fund
Pays
Fund
Receives
Termination
Date
Fair Value
EUR ‘000
Fund
%
EUR
150
Imperial
Tobacco Group
Plc
#
1.00% 20/12/2020 1 0.00
USD
200
Reynolds
American Inc 1.00% #
20/12/2020 (5) (0.00)
EUR
100
Imperial
Tobacco Group
Plc
#
1.00% 20/12/2020 - 0.00
USD
100
Reynolds
American Inc 1.00% #
20/12/2020 (3) (0.00)
EUR
50
Imperial
Tobacco Group
Plc
#
1.00% 20/12/2020 - 0.00
USD
50
Reynolds
American Inc 1.00% #
20/12/2020 (1) (0.00)
EUR
200
Veolia
Environnement
SA 1.00%
#
20/12/2020 (3) (0.00)
EUR
150
Veolia
Environnement
SA 1.00%
#
20/12/2020 (2) (0.00)
EUR
100
Gas Natural
SDG SA #
1.00% 20/12/2020 - 0.00
EUR
100
Gas Natural
SDG SA #
1.00% 20/12/2020 - 0.00
EUR
100
LVMH Moet
Hennessy Louis
Vuitton SE 1.00%
#
20/12/2020 (3) (0.00)
USD
200
Omnicom Group
Inc 1.00% #
20/12/2020 (5) (0.00)
USD
150
Omnicom Group
Inc 1.00% #
20/12/2020 (4) (0.00)
USD
100
Omnicom Group
Inc 1.00% #
20/12/2020 (3) (0.00)
EUR
200
Koninklijke KPN
NV 1.00% #
20/12/2020 (6) (0.00)
EUR
600 HSBC Bank Plc 1.00% #
20/12/2020 - 0.00
EUR
100
LVMH Moet
Hennessy Louis
Vuitton SE 1.00%
#
20/12/2020 (3) (0.00)
USD
650
General Mills
Inc 1.00% #
20/12/2020 (21) (0.01)
EUR
50
LVMH Moet
Hennessy Louis
Vuitton SE 1.00%
#
20/12/2020 (1) (0.00)
EUR
300
Standard
Chartered Bank 1.00% #
20/12/2020 26 0.01
EUR
100
LVMH Moet
Hennessy Louis
Vuitton SE 1.00%
#
20/12/2020 (3) (0.00)
EUR
500
iTraxx Europe
Crossover S25 5.00% #
20/06/2021 (44) (0.02)
EUR
1,000
iTraxx Europe
Crossover S25 5.00% #
20/06/2021 (89) (0.04)
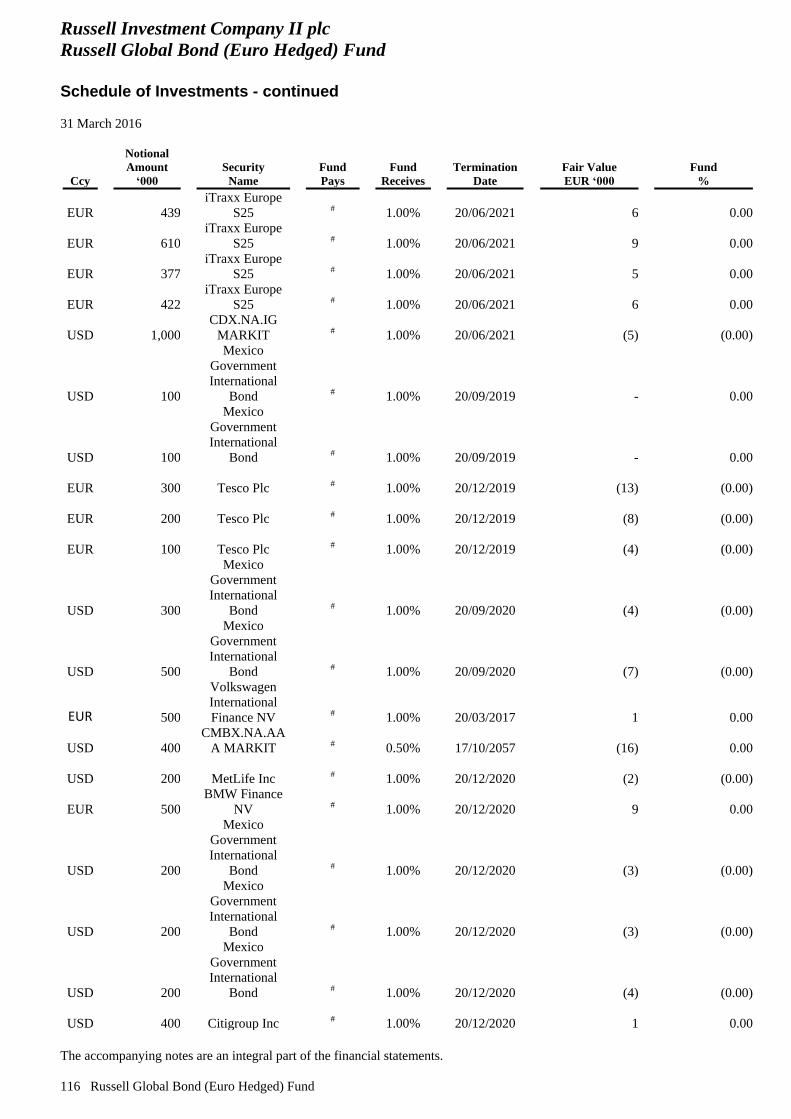
Russell Investment Company II plc
Russell Global Bond (Euro Hedged) Fund
Schedule of Investments - continued
31 March 2016
The accompanying notes are an integral part of the financial statements.
116 Russell Global Bond (Euro Hedged) Fund
Ccy
Notional
Amount
‘000
Security
Name
Fund
Pays
Fund
Receives
Termination
Date
Fair Value
EUR ‘000
Fund
%
EUR
439
iTraxx Europe
S25 # 1.00% 20/06/2021 6 0.00
EUR
610
iTraxx Europe
S25 # 1.00% 20/06/2021 9 0.00
EUR
377
iTraxx Europe
S25 # 1.00% 20/06/2021 5 0.00
EUR
422
iTraxx Europe
S25 # 1.00% 20/06/2021 6 0.00
USD
1,000
CDX.NA.IG
MARKIT # 1.00% 20/06/2021 (5) (0.00)
USD
100
Mexico
Government
International
Bond # 1.00% 20/09/2019 - 0.00
USD
100
Mexico
Government
International
Bond # 1.00% 20/09/2019 - 0.00
EUR
300 Tesco Plc # 1.00% 20/12/2019 (13) (0.00)
EUR
200 Tesco Plc # 1.00% 20/12/2019 (8) (0.00)
EUR
100 Tesco Plc # 1.00% 20/12/2019 (4) (0.00)
USD
300
Mexico
Government
International
Bond # 1.00% 20/09/2020 (4) (0.00)
USD
500
Mexico
Government
International
Bond # 1.00% 20/09/2020 (7) (0.00)
EUR
500
Volkswagen
International
Finance NV # 1.00% 20/03/2017 1 0.00
USD
400
CMBX.NA.AA
A MARKIT # 0.50% 17/10/2057 (16) 0.00
USD
200 MetLife Inc # 1.00% 20/12/2020 (2) (0.00)
EUR
500
BMW Finance
NV # 1.00% 20/12/2020 9 0.00
USD
200
Mexico
Government
International
Bond # 1.00% 20/12/2020 (3) (0.00)
USD
200
Mexico
Government
International
Bond # 1.00% 20/12/2020 (3) (0.00)
USD
200
Mexico
Government
International
Bond # 1.00% 20/12/2020 (4) (0.00)
USD
400 Citigroup Inc # 1.00% 20/12/2020 1 0.00
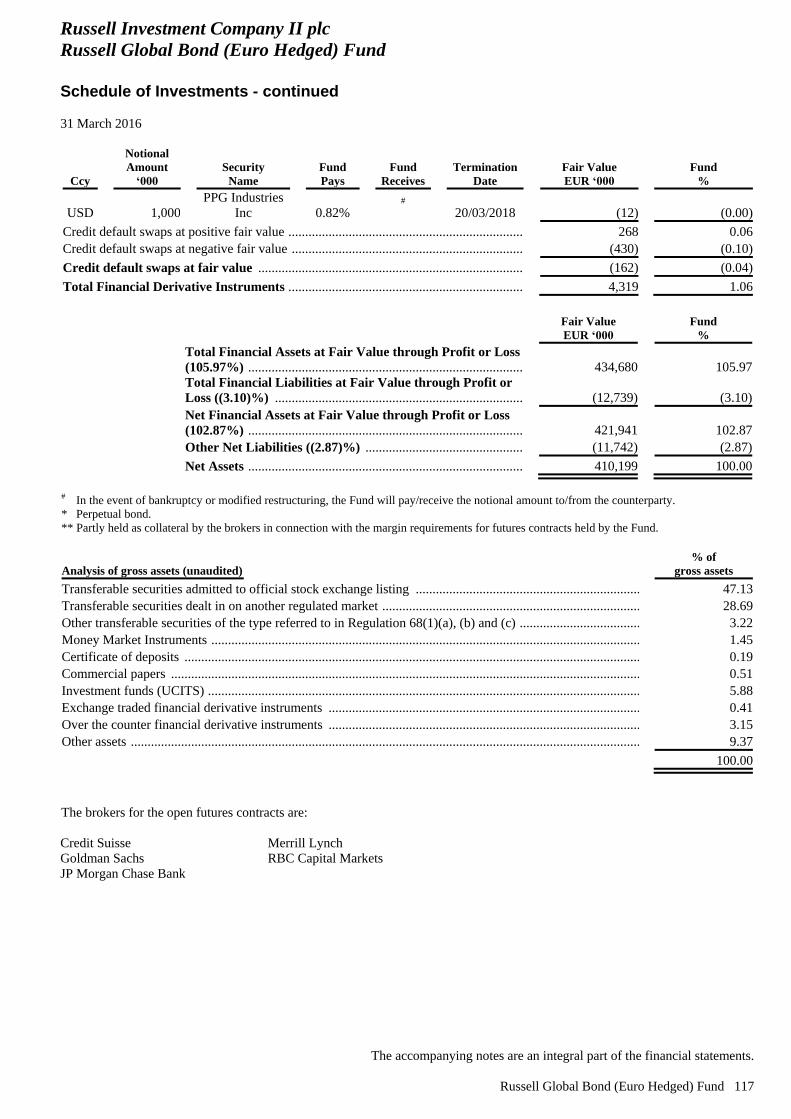
Russell Investment Company II plc
Russell Global Bond (Euro Hedged) Fund
Schedule of Investments - continued
31 March 2016
The accompanying notes are an integral part of the financial statements.
Russell Global Bond (Euro Hedged) Fund 117
Ccy
Notional
Amount
‘000
Security
Name
Fund
Pays
Fund
Receives
Termination
Date
Fair Value
EUR ‘000
Fund
%
USD
1,000
PPG Industries
Inc 0.82% #
20/03/2018 (12) (0.00)
Credit default swaps at positive fair value .................................................................................................... 268 0.06
Credit default swaps at negative fair value ................................................................................................... (430) (0.10)
Credit default swaps at fair value ............................................................................................................. (162) (0.04)
Total Financial Derivative Instruments .................................................................................................... 4,319 1.06
Fair Value
EUR ‘000
Fund
%
Total Financial Assets at Fair Value through Profit or Loss
(105.97%) ..................................................................................................................................................... 434,680 105.97
Total Financial Liabilities at Fair Value through Profit or
Loss ((3.10)%) ............................................................................................................................................. (12,739) (3.10)
Net Financial Assets at Fair Value through Profit or Loss
(102.87%) .................................................................................................................................................. 421,941 102.87
Other Net Liabilities ((2.87)%) ............................................................................................................... (11,742) (2.87)
Net Assets .................................................................................................................................................. 410,199 100.00
# In the event of bankruptcy or modified restructuring, the Fund will pay/receive the notional amount to/from the counterparty.
* Perpetual bond.
** Partly held as collateral by the brokers in connection with the margin requirements for futures contracts held by the Fund.
Analysis of gross assets (unaudited)
% of
gross assets
Transferable securities admitted to official stock exchange listing ....................................................................... 47.13
Transferable securities dealt in on another regulated market ................................................................................. 28.69
Other transferable securities of the type referred to in Regulation 68(1)(a), (b) and (c) ........................................ 3.22
Money Market Instruments .................................................................................................................................... 1.45
Certificate of deposits ............................................................................................................................................ 0.19
Commercial papers ................................................................................................................................................ 0.51
Investment funds (UCITS) ..................................................................................................................................... 5.88
Exchange traded financial derivative instruments ................................................................................................. 0.41
Over the counter financial derivative instruments ................................................................................................. 3.15
Other assets ............................................................................................................................................................ 9.37
100.00
The brokers for the open futures contracts are:
Credit Suisse
Goldman Sachs
JP Morgan Chase Bank
Merrill Lynch
RBC Capital Markets
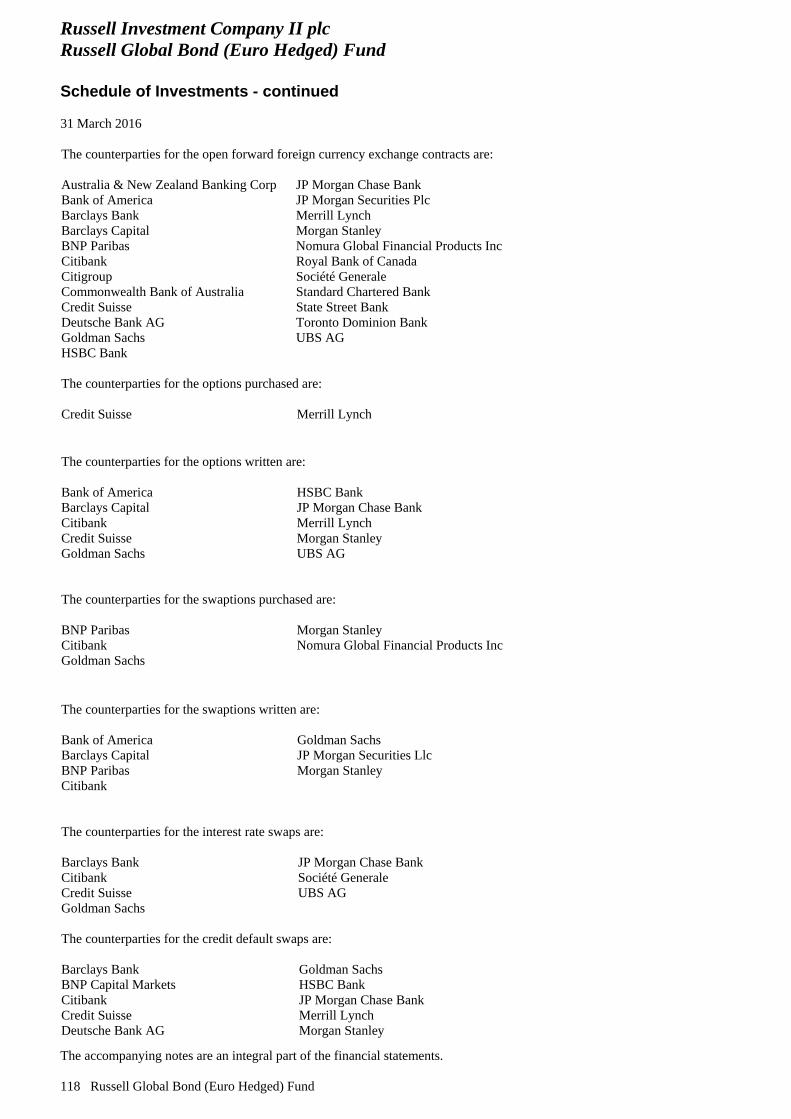
Russell Investment Company II plc
Russell Global Bond (Euro Hedged) Fund
Schedule of Investments - continued
31 March 2016
The accompanying notes are an integral part of the financial statements.
118 Russell Global Bond (Euro Hedged) Fund
The counterparties for the open forward foreign currency exchange contracts are:
Australia & New Zealand Banking Corp
Bank of America
Barclays Bank
Barclays Capital
BNP Paribas
Citibank
Citigroup
Commonwealth Bank of Australia
Credit Suisse
Deutsche Bank AG
Goldman Sachs
HSBC Bank
JP Morgan Chase Bank
JP Morgan Securities Plc
Merrill Lynch
Morgan Stanley
Nomura Global Financial Products Inc
Royal Bank of Canada
Société Generale
Standard Chartered Bank
State Street Bank
Toronto Dominion Bank
UBS AG
The counterparties for the options purchased are:
Credit Suisse Merrill Lynch
The counterparties for the options written are:
Bank of America
Barclays Capital
Citibank
Credit Suisse
Goldman Sachs
HSBC Bank
JP Morgan Chase Bank
Merrill Lynch
Morgan Stanley
UBS AG
The counterparties for the swaptions purchased are:
BNP Paribas
Citibank
Goldman Sachs
Morgan Stanley
Nomura Global Financial Products Inc
The counterparties for the swaptions written are:
Bank of America
Barclays Capital
BNP Paribas
Citibank
Goldman Sachs
JP Morgan Securities Llc
Morgan Stanley
The counterparties for the interest rate swaps are:
Barclays Bank
Citibank
Credit Suisse
Goldman Sachs
JP Morgan Chase Bank
Société Generale
UBS AG
The counterparties for the credit default swaps are:
Barclays Bank
BNP Capital Markets
Citibank
Credit Suisse
Deutsche Bank AG
Goldman Sachs
HSBC Bank
JP Morgan Chase Bank
Merrill Lynch
Morgan Stanley
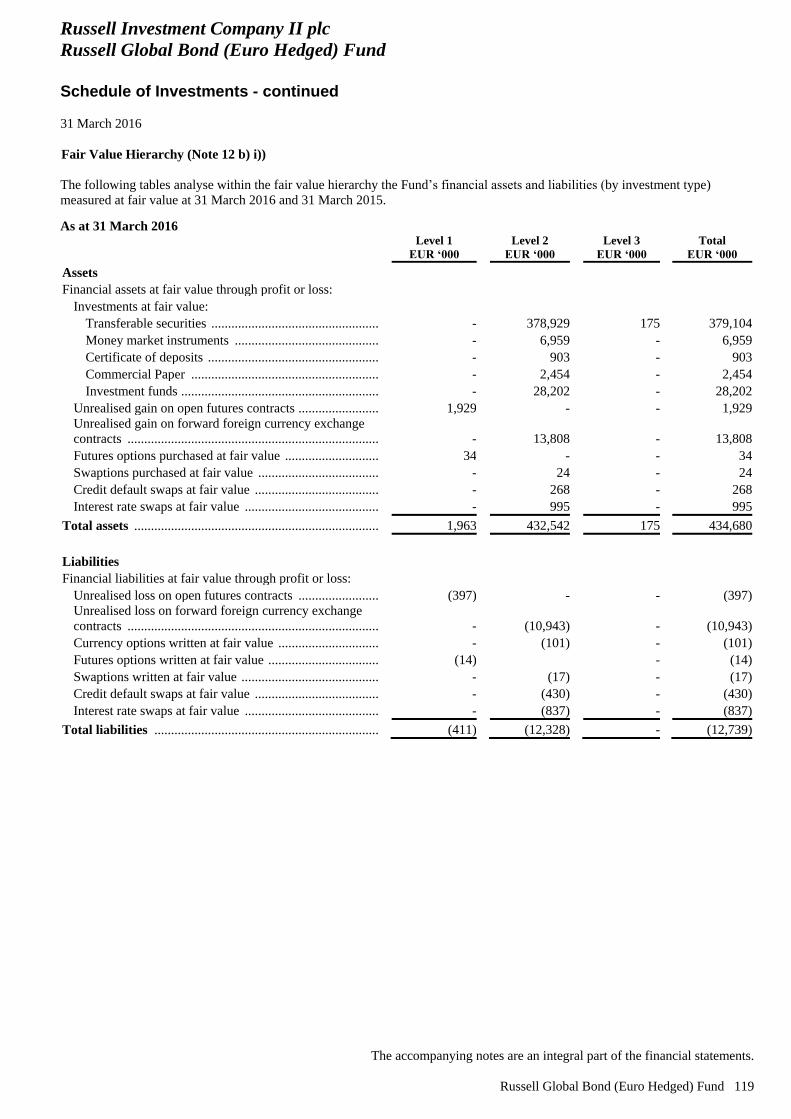
Russell Investment Company II plc
Russell Global Bond (Euro Hedged) Fund
Schedule of Investments - continued
31 March 2016
The accompanying notes are an integral part of the financial statements.
Russell Global Bond (Euro Hedged) Fund 119
Fair Value Hierarchy (Note 12 b) i))
The following tables analyse within the fair value hierarchy the Fund’s financial assets and liabilities (by investment type)
measured at fair value at 31 March 2016 and 31 March 2015. As at 31 March 2016
Level 1
EUR ‘000
Level 2
EUR ‘000
Level 3
EUR ‘000
Total
EUR ‘000
Assets
Financial assets at fair value through profit or loss:
Investments at fair value:
Transferable securities ............................................................... - 378,929 175 379,104
Money market instruments ........................................................ - 6,959 - 6,959
Certificate of deposits ................................................................ - 903 - 903
Commercial Paper ..................................................................... - 2,454 - 2,454
Investment funds ........................................................................ - 28,202 - 28,202
Unrealised gain on open futures contracts ...................................... 1,929 - - 1,929
Unrealised gain on forward foreign currency exchange
contracts ......................................................................................... - 13,808 - 13,808
Futures options purchased at fair value .......................................... 34 - - 34
Swaptions purchased at fair value .................................................. - 24 - 24
Credit default swaps at fair value ................................................... - 268 - 268
Interest rate swaps at fair value ...................................................... - 995 - 995
Total assets ...................................................................................... 1,963 432,542 175 434,680
Liabilities
Financial liabilities at fair value through profit or loss:
Unrealised loss on open futures contracts ...................................... (397) - - (397)
Unrealised loss on forward foreign currency exchange
contracts ......................................................................................... - (10,943) - (10,943)
Currency options written at fair value ............................................ - (101) - (101)
Futures options written at fair value ............................................... (14) - (14)
Swaptions written at fair value ....................................................... - (17) - (17)
Credit default swaps at fair value ................................................... - (430) - (430)
Interest rate swaps at fair value ...................................................... - (837) - (837)
Total liabilities ................................................................................ (411) (12,328) - (12,739)
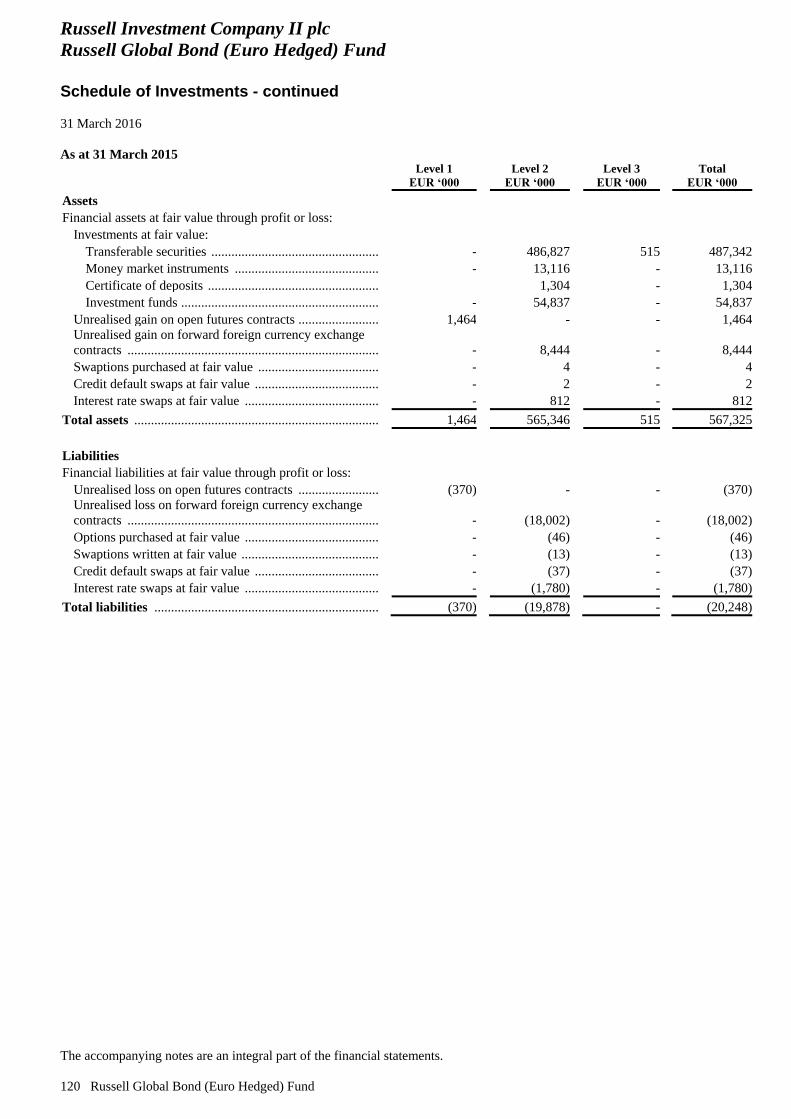
Russell Investment Company II plc
Russell Global Bond (Euro Hedged) Fund
Schedule of Investments - continued
31 March 2016
The accompanying notes are an integral part of the financial statements.
120 Russell Global Bond (Euro Hedged) Fund
As at 31 March 2015
Level 1
EUR ‘000
Level 2
EUR ‘000
Level 3
EUR ‘000
Total
EUR ‘000
Assets
Financial assets at fair value through profit or loss:
Investments at fair value:
Transferable securities ............................................................... - 486,827 515 487,342
Money market instruments ........................................................ - 13,116 - 13,116
Certificate of deposits ................................................................ 1,304 - 1,304
Investment funds ........................................................................ - 54,837 - 54,837
Unrealised gain on open futures contracts ...................................... 1,464 - - 1,464
Unrealised gain on forward foreign currency exchange
contracts ......................................................................................... - 8,444 - 8,444
Swaptions purchased at fair value .................................................. - 4 - 4
Credit default swaps at fair value ................................................... - 2 - 2
Interest rate swaps at fair value ...................................................... - 812 - 812
Total assets ...................................................................................... 1,464 565,346 515 567,325
Liabilities
Financial liabilities at fair value through profit or loss:
Unrealised loss on open futures contracts ...................................... (370) - - (370)
Unrealised loss on forward foreign currency exchange
contracts ......................................................................................... - (18,002) - (18,002)
Options purchased at fair value ...................................................... - (46) - (46)
Swaptions written at fair value ....................................................... - (13) - (13)
Credit default swaps at fair value ................................................... - (37) - (37)
Interest rate swaps at fair value ...................................................... - (1,780) - (1,780)
Total liabilities ................................................................................ (370) (19,878) - (20,248)
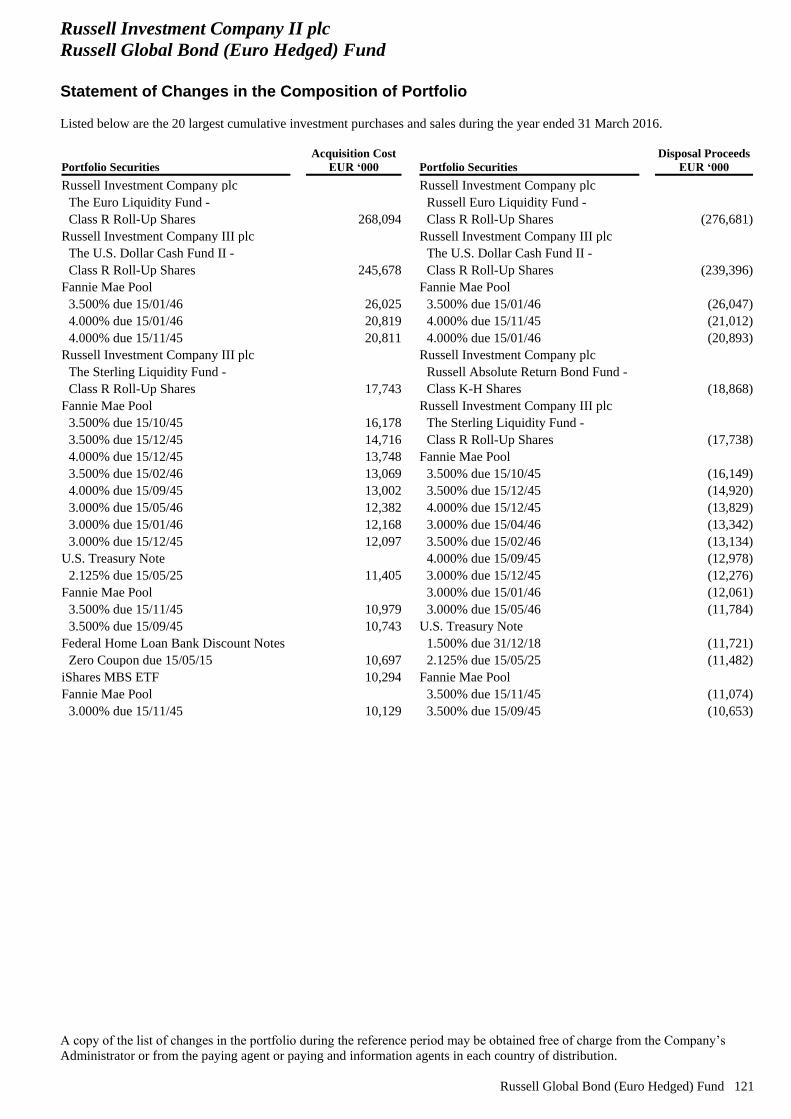
Russell Investment Company II plc
Russell Global Bond (Euro Hedged) Fund
Statement of Changes in the Composition of Portfolio
Listed below are the 20 largest cumulative investment purchases and sales during the year ended 31 March 2016.
A copy of the list of changes in the portfolio during the reference period may be obtained free of charge from the Company’s
Administrator or from the paying agent or paying and information agents in each country of distribution.
Russell Global Bond (Euro Hedged) Fund 121
Portfolio Securities
Acquisition Cost
EUR ‘000 Portfolio Securities
Disposal Proceeds
EUR ‘000
Russell Investment Company plc Russell Investment Company plc
The Euro Liquidity Fund - Russell Euro Liquidity Fund -
Class R Roll-Up Shares 268,094 Class R Roll-Up Shares (276,681)
Russell Investment Company III plc Russell Investment Company III plc
The U.S. Dollar Cash Fund II - The U.S. Dollar Cash Fund II -
Class R Roll-Up Shares 245,678 Class R Roll-Up Shares (239,396)
Fannie Mae Pool Fannie Mae Pool
3.500% due 15/01/46 26,025 3.500% due 15/01/46 (26,047)
4.000% due 15/01/46 20,819 4.000% due 15/11/45 (21,012)
4.000% due 15/11/45 20,811 4.000% due 15/01/46 (20,893)
Russell Investment Company III plc Russell Investment Company plc
The Sterling Liquidity Fund - Russell Absolute Return Bond Fund -
Class R Roll-Up Shares 17,743 Class K-H Shares (18,868)
Fannie Mae Pool Russell Investment Company III plc
3.500% due 15/10/45 16,178 The Sterling Liquidity Fund -
3.500% due 15/12/45 14,716 Class R Roll-Up Shares (17,738)
4.000% due 15/12/45 13,748 Fannie Mae Pool
3.500% due 15/02/46 13,069 3.500% due 15/10/45 (16,149)
4.000% due 15/09/45 13,002 3.500% due 15/12/45 (14,920)
3.000% due 15/05/46 12,382 4.000% due 15/12/45 (13,829)
3.000% due 15/01/46 12,168 3.000% due 15/04/46 (13,342)
3.000% due 15/12/45 12,097 3.500% due 15/02/46 (13,134)
U.S. Treasury Note 4.000% due 15/09/45 (12,978)
2.125% due 15/05/25 11,405 3.000% due 15/12/45 (12,276)
Fannie Mae Pool 3.000% due 15/01/46 (12,061)
3.500% due 15/11/45 10,979 3.000% due 15/05/46 (11,784)
3.500% due 15/09/45 10,743 U.S. Treasury Note
Federal Home Loan Bank Discount Notes 1.500% due 31/12/18 (11,721)
Zero Coupon due 15/05/15 10,697 2.125% due 15/05/25 (11,482)
iShares MBS ETF 10,294 Fannie Mae Pool
Fannie Mae Pool 3.500% due 15/11/45 (11,074)
3.000% due 15/11/45 10,129 3.500% due 15/09/45 (10,653)
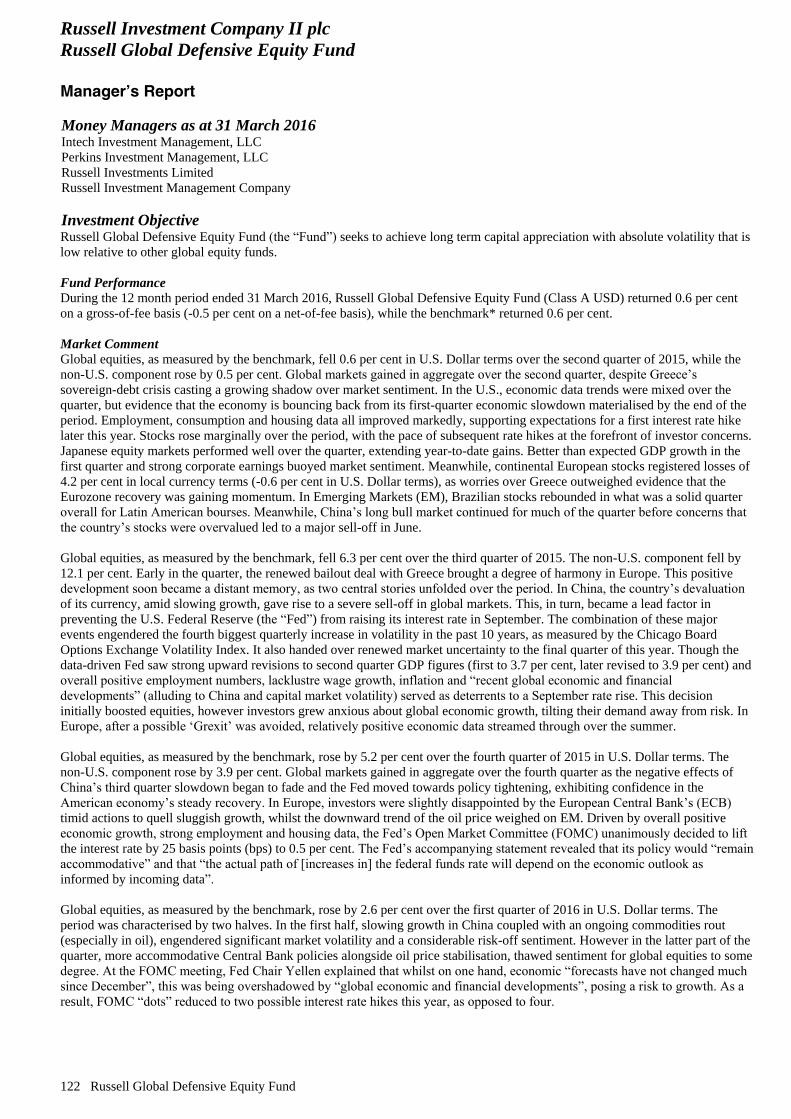
Russell Investment Company II plc
Russell Global Defensive Equity Fund
Manager’s Report
122 Russell Global Defensive Equity Fund
Money Managers as at 31 March 2016 Intech Investment Management, LLC
Perkins Investment Management, LLC
Russell Investments Limited
Russell Investment Management Company
Investment Objective Russell Global Defensive Equity Fund (the “Fund”) seeks to achieve long term capital appreciation with absolute volatility that is
low relative to other global equity funds.
Fund Performance
During the 12 month period ended 31 March 2016, Russell Global Defensive Equity Fund (Class A USD) returned 0.6 per cent
on a gross-of-fee basis (-0.5 per cent on a net-of-fee basis), while the benchmark* returned 0.6 per cent.
Market Comment
Global equities, as measured by the benchmark, fell 0.6 per cent in U.S. Dollar terms over the second quarter of 2015, while the
non-U.S. component rose by 0.5 per cent. Global markets gained in aggregate over the second quarter, despite Greece’s
sovereign-debt crisis casting a growing shadow over market sentiment. In the U.S., economic data trends were mixed over the
quarter, but evidence that the economy is bouncing back from its first-quarter economic slowdown materialised by the end of the
period. Employment, consumption and housing data all improved markedly, supporting expectations for a first interest rate hike
later this year. Stocks rose marginally over the period, with the pace of subsequent rate hikes at the forefront of investor concerns.
Japanese equity markets performed well over the quarter, extending year-to-date gains. Better than expected GDP growth in the
first quarter and strong corporate earnings buoyed market sentiment. Meanwhile, continental European stocks registered losses of
4.2 per cent in local currency terms (-0.6 per cent in U.S. Dollar terms), as worries over Greece outweighed evidence that the
Eurozone recovery was gaining momentum. In Emerging Markets (EM), Brazilian stocks rebounded in what was a solid quarter
overall for Latin American bourses. Meanwhile, China’s long bull market continued for much of the quarter before concerns that
the country’s stocks were overvalued led to a major sell-off in June.
Global equities, as measured by the benchmark, fell 6.3 per cent over the third quarter of 2015. The non-U.S. component fell by
12.1 per cent. Early in the quarter, the renewed bailout deal with Greece brought a degree of harmony in Europe. This positive
development soon became a distant memory, as two central stories unfolded over the period. In China, the country’s devaluation
of its currency, amid slowing growth, gave rise to a severe sell-off in global markets. This, in turn, became a lead factor in
preventing the U.S. Federal Reserve (the “Fed”) from raising its interest rate in September. The combination of these major
events engendered the fourth biggest quarterly increase in volatility in the past 10 years, as measured by the Chicago Board
Options Exchange Volatility Index. It also handed over renewed market uncertainty to the final quarter of this year. Though the
data-driven Fed saw strong upward revisions to second quarter GDP figures (first to 3.7 per cent, later revised to 3.9 per cent) and
overall positive employment numbers, lacklustre wage growth, inflation and “recent global economic and financial
developments” (alluding to China and capital market volatility) served as deterrents to a September rate rise. This decision
initially boosted equities, however investors grew anxious about global economic growth, tilting their demand away from risk. In
Europe, after a possible ‘Grexit’ was avoided, relatively positive economic data streamed through over the summer.
Global equities, as measured by the benchmark, rose by 5.2 per cent over the fourth quarter of 2015 in U.S. Dollar terms. The
non-U.S. component rose by 3.9 per cent. Global markets gained in aggregate over the fourth quarter as the negative effects of
China’s third quarter slowdown began to fade and the Fed moved towards policy tightening, exhibiting confidence in the
American economy’s steady recovery. In Europe, investors were slightly disappointed by the European Central Bank’s (ECB)
timid actions to quell sluggish growth, whilst the downward trend of the oil price weighed on EM. Driven by overall positive
economic growth, strong employment and housing data, the Fed’s Open Market Committee (FOMC) unanimously decided to lift
the interest rate by 25 basis points (bps) to 0.5 per cent. The Fed’s accompanying statement revealed that its policy would “remain
accommodative” and that “the actual path of [increases in] the federal funds rate will depend on the economic outlook as
informed by incoming data”.
Global equities, as measured by the benchmark, rose by 2.6 per cent over the first quarter of 2016 in U.S. Dollar terms. The
period was characterised by two halves. In the first half, slowing growth in China coupled with an ongoing commodities rout
(especially in oil), engendered significant market volatility and a considerable risk-off sentiment. However in the latter part of the
quarter, more accommodative Central Bank policies alongside oil price stabilisation, thawed sentiment for global equities to some
degree. At the FOMC meeting, Fed Chair Yellen explained that whilst on one hand, economic “forecasts have not changed much
since December”, this was being overshadowed by “global economic and financial developments”, posing a risk to growth. As a
result, FOMC “dots” reduced to two possible interest rate hikes this year, as opposed to four.
Russell Investment Company II plc
Russell Global Defensive Equity Fund
Manager’s Report - continued
Russell Global Defensive Equity Fund 123
General Comment on Money Managers/Performance
The Fund outperformed the benchmark in the second quarter of 2015. Growth factors performed positively across the qu arter
whilst value factors faced some headwinds towards the latter part. Despite headwinds, fundamental value Money Manager
Perkins added, with positive stock selection in financials. Managed volatility strategy Intech also delivered positive return s, as
volatility picked up towards the end of the quarter. Growth strategy Fiera held back gains with healthcare stocks and no
exposure to the telecommunication services sector detracting. At the Fund level, stock selection within the financials sector
was positive, however an overweight position to a poor performing utilities sector and exposure to health care, held back Fund
performance.
The Fund finished ahead of the benchmark, in a third quarter of 2015 characterised by significant market decline and
volatility. In this market environment, defensive and growth factors as well as lower-beta stocks performed better than value
styles. The Fund’s underlying strategies held their ground, however Intech was a notable outperformer, strongly positioned fo r
this prevailing environment. At the Fund level, stock selection within the consumer discretionary and financial sectors
rewarded. Stock picks in the U.S. and EM was also positive. Selection in the U.K. and within industrials and information
technology, detracted slightly.
The Fund underperformed the benchmark in the final quarter of 2015. Names within the industrials and technology sectors
generated strong gains, especially through Apple (technology) and Schindler Holding (industrials). However, consumer -
orientated and telecommunication stocks held back performance. On a regional basis, allocation and selection effect were
positive for Japan, whilst Asia detracted. An allocation towards the higher momentum spectrum was beneficial. We believe
that high momentum is an area of caution, from a defensive stand-point, but a potential diversifier from an alpha source
perspective.
The Fund finished behind the benchmark in the first quarter of 2016. An allocation towards the small -mid cap spectrum was
rewarded in the prevailing market environment. However this was offset by a tilt away from the higher dividend yield space.
Stock selection within the health care, technology and consumer discretionary sectors drove performance. However, names
within the financial sector, which sold off substantially over the quarter, hurt performance. Stock selection in the U.K. was
positive, whilst an underweight allocation to Emerging Markets detracted slightly.
Outlook
Global markets got off to a rough start in 2016. By mid-February global developed equities had lost nearly 20 per cent from
their 2015 peak. They rebounded by around 10 per cent by mid-March, but we expect volatility to be a headline throughout
2016. This volatility will continue to be driven by China fears, the Fed’s monetary tightening, U.S. recession concerns, bank
balance sheet worries, and soft corporate profits. Moreover, the move to negative interest rates in Europe and Japan has
triggered fears that Central Banks have run out of easing options. Negative rates also tend to squeeze the margin between
banks’ borrowing and lending rates. This squeeze could, in turn, hurt bank profitability, and end up making things worse for
the markets. In our 2016 Global Market Outlook Annual report, we forecast mid-to-low single digit returns for global equities,
along with a gradual rise in long-term interest rates. We’re holding to that view, with the exception we think equity growth is
more likely to be in the low single digits. Moreover, we’re now seeing corporate profits weakening, softn ess in global trade
and manufacturing, and slightly higher risks for Emerging Markets. These elements all contribute to a less supportive
environment for equities. That said, we’re not forecasting a sustained bear market , provided the U.S. does not fall into
recession. Right now we see recession as a low probability over the next several years. It’s true we’re deep into the current
business cycle, but we’re not seeing excesses in the U.S. economy that could trigger recession.
Past performance is no indication of current or future performance.
* Benchmark Source: Russell Global Defensive Index
Russell Investments Ireland Limited
May 2016
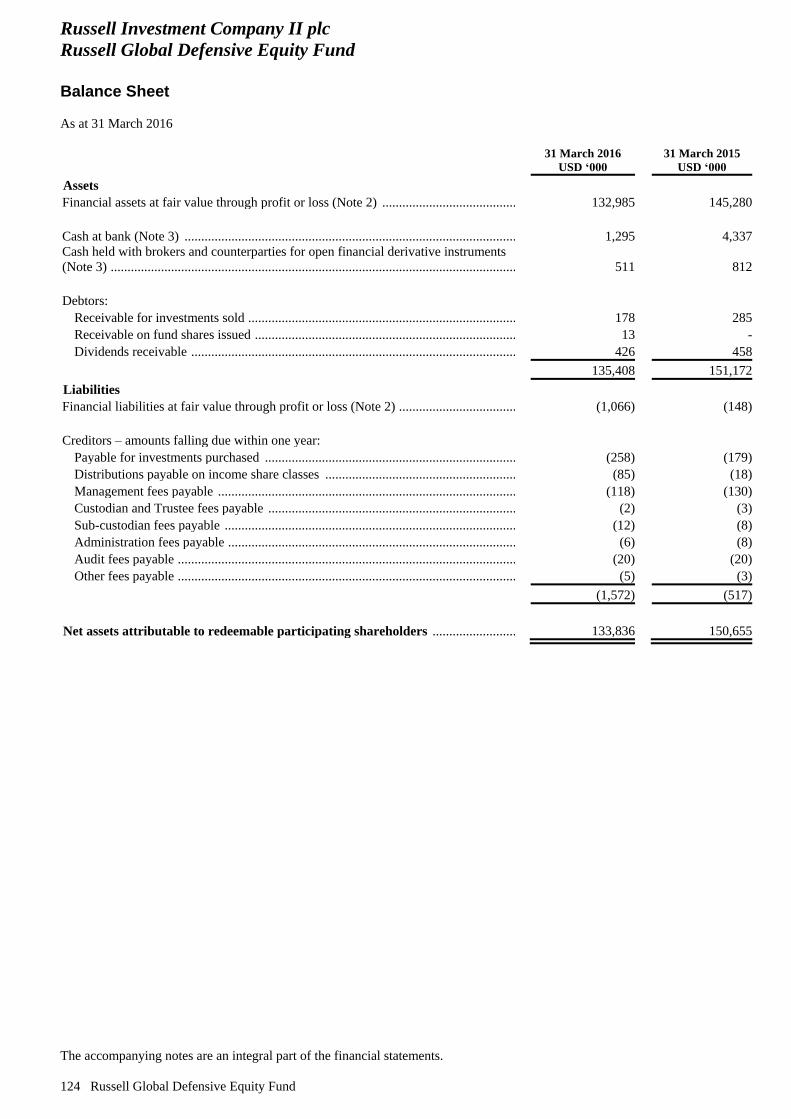
Russell Investment Company II plc
Russell Global Defensive Equity Fund
Balance Sheet
As at 31 March 2016
The accompanying notes are an integral part of the financial statements.
124 Russell Global Defensive Equity Fund
31 March 2016
USD ‘000
31 March 2015
USD ‘000
Assets
Financial assets at fair value through profit or loss (Note 2) ................................................................................................................ 132,985 145,280
Cash at bank (Note 3) ........................................................................................................................................................................... 1,295 4,337
Cash held with brokers and counterparties for open financial derivative instruments
(Note 3) ................................................................................................................................................................................................. 511 812
Debtors:
Receivable for investments sold ...................................................................................................................... 178 285
Receivable on fund shares issued .................................................................................................................... 13 -
Dividends receivable ....................................................................................................................................... 426 458
135,408 151,172
Liabilities
Financial liabilities at fair value through profit or loss (Note 2) ........................................................................................................... (1,066) (148)
Creditors – amounts falling due within one year:
Payable for investments purchased ................................................................................................................. (258) (179)
Distributions payable on income share classes ............................................................................................... (85) (18)
Management fees payable ............................................................................................................................... (118) (130)
Custodian and Trustee fees payable ................................................................................................................ (2) (3)
Sub-custodian fees payable ............................................................................................................................. (12) (8)
Administration fees payable ............................................................................................................................ (6) (8)
Audit fees payable ........................................................................................................................................... (20) (20)
Other fees payable ........................................................................................................................................... (5) (3)
(1,572) (517)
Net assets attributable to redeemable participating shareholders ....................................................................... 133,836 150,655
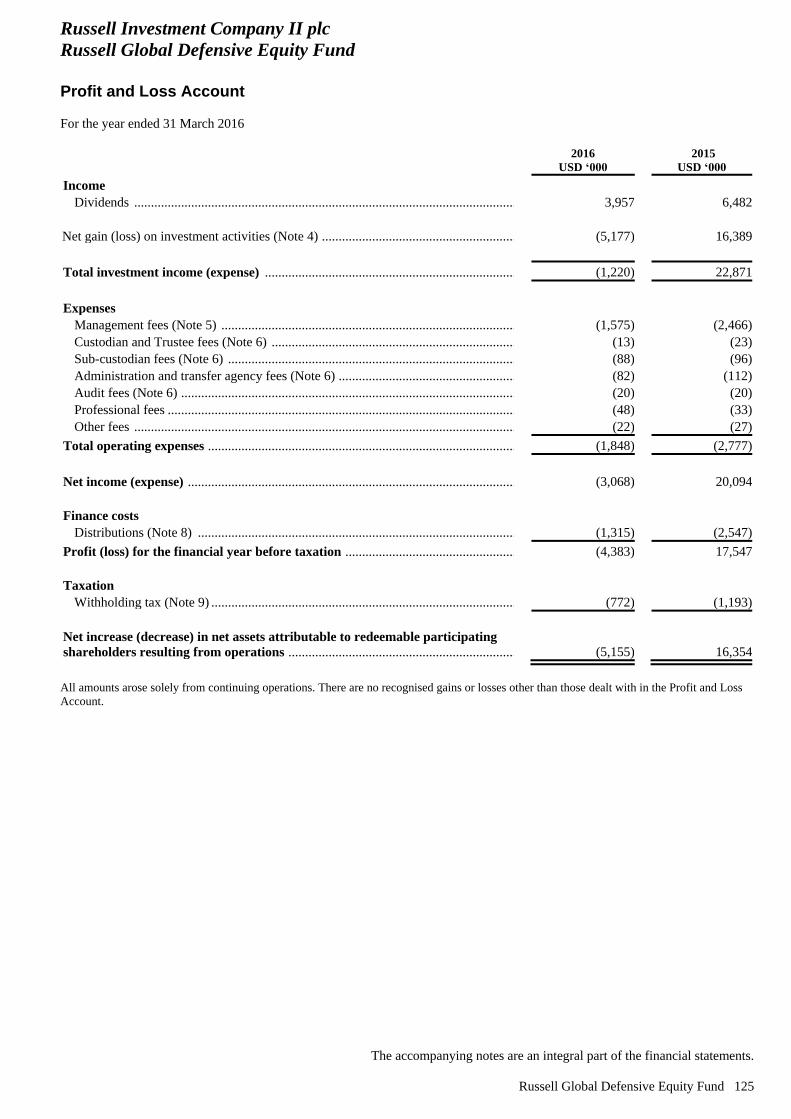
Russell Investment Company II plc
Russell Global Defensive Equity Fund
Profit and Loss Account
For the year ended 31 March 2016
The accompanying notes are an integral part of the financial statements.
Russell Global Defensive Equity Fund 125
2016
USD ‘000
2015
USD ‘000
Income
Dividends ........................................................................................................................................................ 3,957 6,482
Net gain (loss) on investment activities (Note 4) ...................................................................................................... (5,177) 16,389
Total investment income (expense) ......................................................................................................................... (1,220) 22,871
Expenses
Management fees (Note 5) .............................................................................................................................. (1,575) (2,466)
Custodian and Trustee fees (Note 6) ............................................................................................................... (13) (23)
Sub-custodian fees (Note 6) ............................................................................................................................ (88) (96)
Administration and transfer agency fees (Note 6) ........................................................................................... (82) (112)
Audit fees (Note 6) .......................................................................................................................................... (20) (20)
Professional fees .............................................................................................................................................. (48) (33)
Other fees ........................................................................................................................................................ (22) (27)
Total operating expenses .......................................................................................................................................... (1,848) (2,777)
Net income (expense) ................................................................................................................................................ (3,068) 20,094
Finance costs
Distributions (Note 8) ..................................................................................................................................... (1,315) (2,547)
Profit (loss) for the financial year before taxation ................................................................................................. (4,383) 17,547
Taxation
Withholding tax (Note 9) ................................................................................................................................. (772) (1,193)
Net increase (decrease) in net assets attributable to redeemable participating
shareholders resulting from operations .................................................................................................................. (5,155) 16,354
All amounts arose solely from continuing operations. There are no recognised gains or losses other than those dealt with in the Profit and Loss
Account.
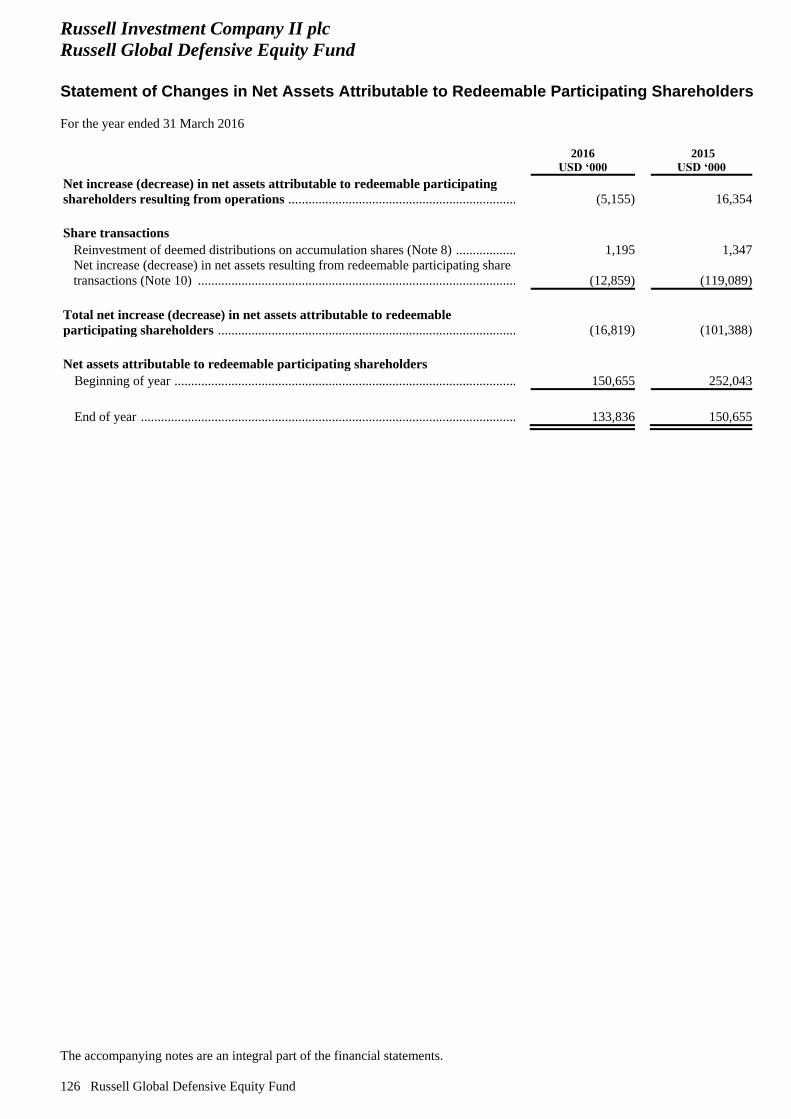
Russell Investment Company II plc
Russell Global Defensive Equity Fund
Statement of Changes in Net Assets Attributable to Redeemable Participating Shareholders
For the year ended 31 March 2016
The accompanying notes are an integral part of the financial statements.
126 Russell Global Defensive Equity Fund
2016
USD ‘000
2015
USD ‘000
Net increase (decrease) in net assets attributable to redeemable participating
shareholders resulting from operations .................................................................................................................. (5,155) 16,354
Share transactions
Reinvestment of deemed distributions on accumulation shares (Note 8) ..................... 1,195 1,347
Net increase (decrease) in net assets resulting from redeemable participating share
transactions (Note 10) .................................................................................................. (12,859) (119,089)
Total net increase (decrease) in net assets attributable to redeemable
participating shareholders ....................................................................................................................................... (16,819) (101,388)
Net assets attributable to redeemable participating shareholders
Beginning of year ............................................................................................................................................ 150,655 252,043
End of year ...................................................................................................................................................... 133,836 150,655
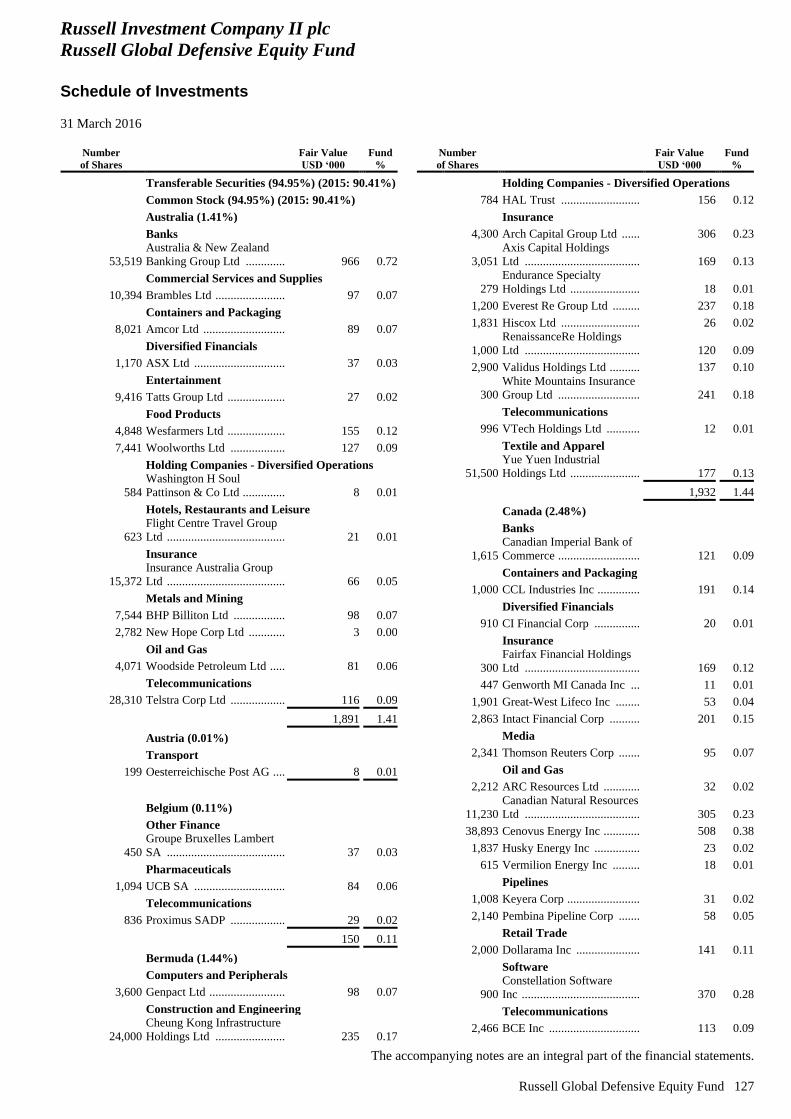
Russell Investment Company II plc
Russell Global Defensive Equity Fund
Schedule of Investments
31 March 2016
The accompanying notes are an integral part of the financial statements.
Russell Global Defensive Equity Fund 127
Number
of Shares
Fair Value
USD ‘000
Fund
%
Transferable Securities (94.95%) (2015: 90.41%)
Common Stock (94.95%) (2015: 90.41%)
Australia (1.41%)
Banks
53,519
Australia & New Zealand
Banking Group Ltd ............. 966 0.72
Commercial Services and Supplies
10,394 Brambles Ltd ....................... 97 0.07
Containers and Packaging
8,021 Amcor Ltd ........................... 89 0.07
Diversified Financials
1,170 ASX Ltd .............................. 37 0.03
Entertainment
9,416 Tatts Group Ltd ................... 27 0.02
Food Products
4,848 Wesfarmers Ltd ................... 155 0.12
7,441 Woolworths Ltd .................. 127 0.09
Holding Companies - Diversified Operations
584
Washington H Soul
Pattinson & Co Ltd .............. 8 0.01
Hotels, Restaurants and Leisure
623
Flight Centre Travel Group
Ltd ....................................... 21 0.01
Insurance
15,372
Insurance Australia Group
Ltd ....................................... 66 0.05
Metals and Mining
7,544 BHP Billiton Ltd ................. 98 0.07
2,782 New Hope Corp Ltd ............ 3 0.00
Oil and Gas
4,071 Woodside Petroleum Ltd ..... 81 0.06
Telecommunications
28,310 Telstra Corp Ltd .................. 116 0.09
1,891 1.41
Austria (0.01%)
Transport
199 Oesterreichische Post AG .... 8 0.01
Belgium (0.11%)
Other Finance
450
Groupe Bruxelles Lambert
SA ....................................... 37 0.03
Pharmaceuticals
1,094 UCB SA .............................. 84 0.06
Telecommunications
836 Proximus SADP .................. 29 0.02
150 0.11
Bermuda (1.44%)
Computers and Peripherals
3,600 Genpact Ltd ......................... 98 0.07
Construction and Engineering
24,000
Cheung Kong Infrastructure
Holdings Ltd ....................... 235 0.17
Number
of Shares
Fair Value
USD ‘000
Fund
%
Holding Companies - Diversified Operations
784 HAL Trust .......................... 156 0.12
Insurance
4,300 Arch Capital Group Ltd ...... 306 0.23
3,051
Axis Capital Holdings
Ltd ...................................... 169 0.13
279
Endurance Specialty
Holdings Ltd ....................... 18 0.01
1,200 Everest Re Group Ltd ......... 237 0.18
1,831 Hiscox Ltd .......................... 26 0.02
1,000
RenaissanceRe Holdings
Ltd ...................................... 120 0.09
2,900 Validus Holdings Ltd .......... 137 0.10
300
White Mountains Insurance
Group Ltd ........................... 241 0.18
Telecommunications
996 VTech Holdings Ltd ........... 12 0.01
Textile and Apparel
51,500
Yue Yuen Industrial
Holdings Ltd ....................... 177 0.13
1,932 1.44
Canada (2.48%)
Banks
1,615
Canadian Imperial Bank of
Commerce ........................... 121 0.09
Containers and Packaging
1,000 CCL Industries Inc .............. 191 0.14
Diversified Financials
910 CI Financial Corp ............... 20 0.01
Insurance
300
Fairfax Financial Holdings
Ltd ...................................... 169 0.12
447 Genworth MI Canada Inc ... 11 0.01
1,901 Great-West Lifeco Inc ........ 53 0.04
2,863 Intact Financial Corp .......... 201 0.15
Media
2,341 Thomson Reuters Corp ....... 95 0.07
Oil and Gas
2,212 ARC Resources Ltd ............ 32 0.02
11,230
Canadian Natural Resources
Ltd ...................................... 305 0.23
38,893 Cenovus Energy Inc ............ 508 0.38
1,837 Husky Energy Inc ............... 23 0.02
615 Vermilion Energy Inc ......... 18 0.01
Pipelines
1,008 Keyera Corp ........................ 31 0.02
2,140 Pembina Pipeline Corp ....... 58 0.05
Retail Trade
2,000 Dollarama Inc ..................... 141 0.11
Software
900
Constellation Software
Inc ....................................... 370 0.28
Telecommunications
2,466 BCE Inc .............................. 113 0.09
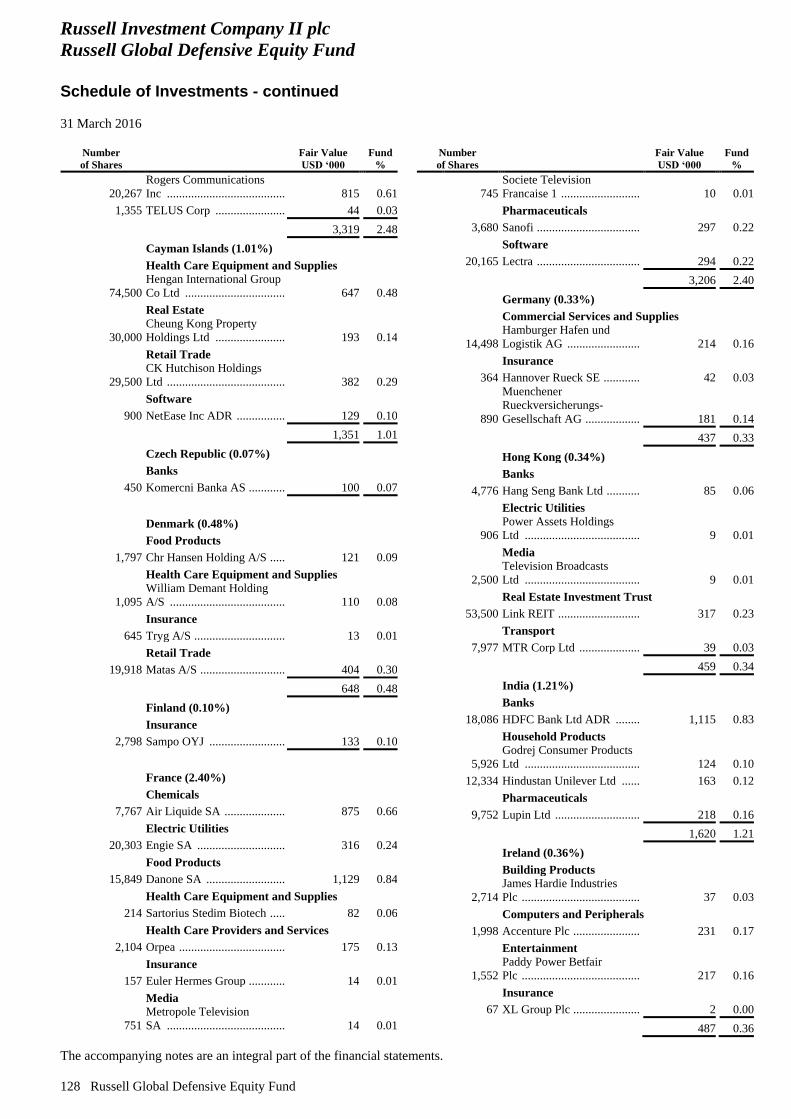
Russell Investment Company II plc
Russell Global Defensive Equity Fund
Schedule of Investments - continued
31 March 2016
The accompanying notes are an integral part of the financial statements.
128 Russell Global Defensive Equity Fund
Number
of Shares
Fair Value
USD ‘000
Fund
%
20,267
Rogers Communications
Inc ....................................... 815 0.61
1,355 TELUS Corp ....................... 44 0.03
3,319 2.48
Cayman Islands (1.01%)
Health Care Equipment and Supplies
74,500
Hengan International Group
Co Ltd ................................. 647 0.48
Real Estate
30,000
Cheung Kong Property
Holdings Ltd ....................... 193 0.14
Retail Trade
29,500
CK Hutchison Holdings
Ltd ....................................... 382 0.29
Software
900 NetEase Inc ADR ................ 129 0.10
1,351 1.01
Czech Republic (0.07%)
Banks
450 Komercni Banka AS ............ 100 0.07
Denmark (0.48%)
Food Products
1,797 Chr Hansen Holding A/S ..... 121 0.09
Health Care Equipment and Supplies
1,095
William Demant Holding
A/S ...................................... 110 0.08
Insurance
645 Tryg A/S .............................. 13 0.01
Retail Trade
19,918 Matas A/S ............................ 404 0.30
648 0.48
Finland (0.10%)
Insurance
2,798 Sampo OYJ ......................... 133 0.10
France (2.40%)
Chemicals
7,767 Air Liquide SA .................... 875 0.66
Electric Utilities
20,303 Engie SA ............................. 316 0.24
Food Products
15,849 Danone SA .......................... 1,129 0.84
Health Care Equipment and Supplies
214 Sartorius Stedim Biotech ..... 82 0.06
Health Care Providers and Services
2,104 Orpea ................................... 175 0.13
Insurance
157 Euler Hermes Group ............ 14 0.01
Media
751
Metropole Television
SA ....................................... 14 0.01
Number
of Shares
Fair Value
USD ‘000
Fund
%
745
Societe Television
Francaise 1 .......................... 10 0.01
Pharmaceuticals
3,680 Sanofi .................................. 297 0.22
Software
20,165 Lectra .................................. 294 0.22
3,206 2.40
Germany (0.33%)
Commercial Services and Supplies
14,498
Hamburger Hafen und
Logistik AG ........................ 214 0.16
Insurance
364 Hannover Rueck SE ............ 42 0.03
890
Muenchener
Rueckversicherungs-
Gesellschaft AG .................. 181 0.14
437 0.33
Hong Kong (0.34%)
Banks
4,776 Hang Seng Bank Ltd ........... 85 0.06
Electric Utilities
906
Power Assets Holdings
Ltd ...................................... 9 0.01
Media
2,500
Television Broadcasts
Ltd ...................................... 9 0.01
Real Estate Investment Trust
53,500 Link REIT ........................... 317 0.23
Transport
7,977 MTR Corp Ltd .................... 39 0.03
459 0.34
India (1.21%)
Banks
18,086 HDFC Bank Ltd ADR ........ 1,115 0.83
Household Products
5,926
Godrej Consumer Products
Ltd ...................................... 124 0.10
12,334 Hindustan Unilever Ltd ...... 163 0.12
Pharmaceuticals
9,752 Lupin Ltd ............................ 218 0.16
1,620 1.21
Ireland (0.36%)
Building Products
2,714
James Hardie Industries
Plc ....................................... 37 0.03
Computers and Peripherals
1,998 Accenture Plc ...................... 231 0.17
Entertainment
1,552
Paddy Power Betfair
Plc ....................................... 217 0.16
Insurance
67 XL Group Plc ...................... 2 0.00
487 0.36
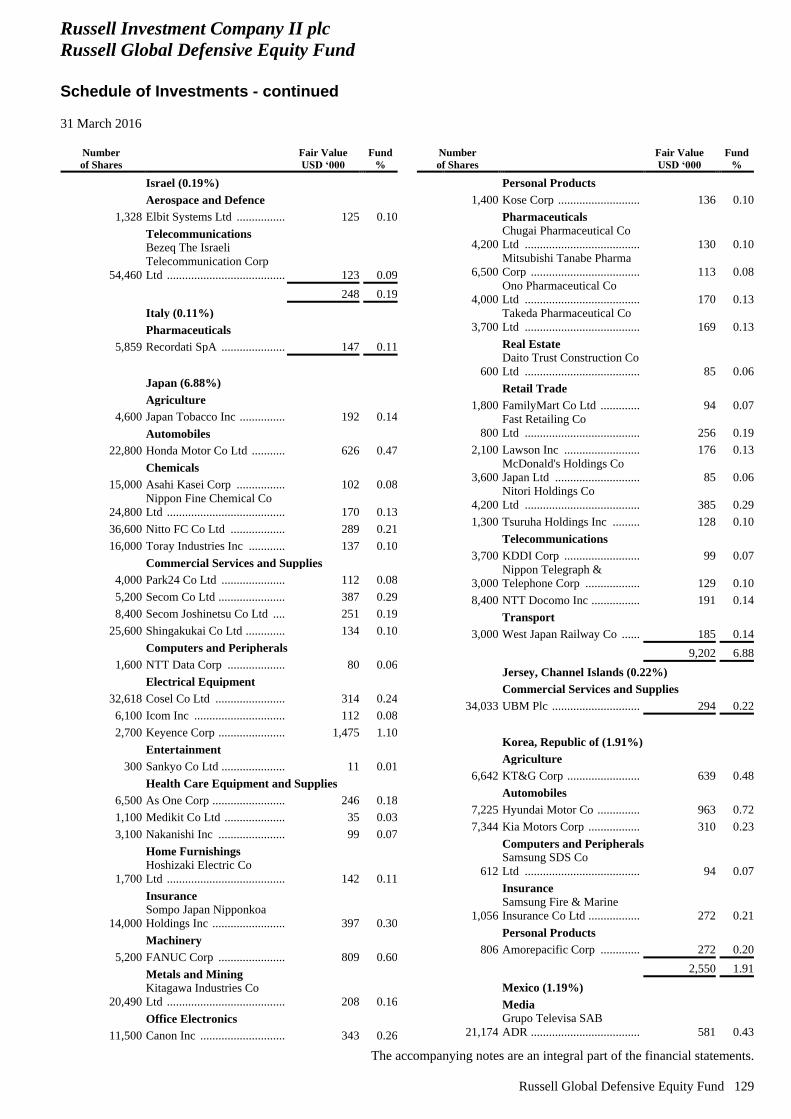
Russell Investment Company II plc
Russell Global Defensive Equity Fund
Schedule of Investments - continued
31 March 2016
The accompanying notes are an integral part of the financial statements.
Russell Global Defensive Equity Fund 129
Number
of Shares
Fair Value
USD ‘000
Fund
%
Israel (0.19%)
Aerospace and Defence
1,328 Elbit Systems Ltd ................ 125 0.10
Telecommunications
54,460
Bezeq The Israeli
Telecommunication Corp
Ltd ....................................... 123 0.09
248 0.19
Italy (0.11%)
Pharmaceuticals
5,859 Recordati SpA ..................... 147 0.11
Japan (6.88%)
Agriculture
4,600 Japan Tobacco Inc ............... 192 0.14
Automobiles
22,800 Honda Motor Co Ltd ........... 626 0.47
Chemicals
15,000 Asahi Kasei Corp ................ 102 0.08
24,800
Nippon Fine Chemical Co
Ltd ....................................... 170 0.13
36,600 Nitto FC Co Ltd .................. 289 0.21
16,000 Toray Industries Inc ............ 137 0.10
Commercial Services and Supplies
4,000 Park24 Co Ltd ..................... 112 0.08
5,200 Secom Co Ltd ...................... 387 0.29
8,400 Secom Joshinetsu Co Ltd .... 251 0.19
25,600 Shingakukai Co Ltd ............. 134 0.10
Computers and Peripherals
1,600 NTT Data Corp ................... 80 0.06
Electrical Equipment
32,618 Cosel Co Ltd ....................... 314 0.24
6,100 Icom Inc .............................. 112 0.08
2,700 Keyence Corp ...................... 1,475 1.10
Entertainment
300 Sankyo Co Ltd ..................... 11 0.01
Health Care Equipment and Supplies
6,500 As One Corp ........................ 246 0.18
1,100 Medikit Co Ltd .................... 35 0.03
3,100 Nakanishi Inc ...................... 99 0.07
Home Furnishings
1,700
Hoshizaki Electric Co
Ltd ....................................... 142 0.11
Insurance
14,000
Sompo Japan Nipponkoa
Holdings Inc ........................ 397 0.30
Machinery
5,200 FANUC Corp ...................... 809 0.60
Metals and Mining
20,490
Kitagawa Industries Co
Ltd ....................................... 208 0.16
Office Electronics
11,500 Canon Inc ............................ 343 0.26
Number
of Shares
Fair Value
USD ‘000
Fund
%
Personal Products
1,400 Kose Corp ........................... 136 0.10
Pharmaceuticals
4,200
Chugai Pharmaceutical Co
Ltd ...................................... 130 0.10
6,500
Mitsubishi Tanabe Pharma
Corp .................................... 113 0.08
4,000
Ono Pharmaceutical Co
Ltd ...................................... 170 0.13
3,700
Takeda Pharmaceutical Co
Ltd ...................................... 169 0.13
Real Estate
600
Daito Trust Construction Co
Ltd ...................................... 85 0.06
Retail Trade
1,800 FamilyMart Co Ltd ............. 94 0.07
800
Fast Retailing Co
Ltd ...................................... 256 0.19
2,100 Lawson Inc ......................... 176 0.13
3,600
McDonald's Holdings Co
Japan Ltd ............................ 85 0.06
4,200
Nitori Holdings Co
Ltd ...................................... 385 0.29
1,300 Tsuruha Holdings Inc ......... 128 0.10
Telecommunications
3,700 KDDI Corp ......................... 99 0.07
3,000
Nippon Telegraph &
Telephone Corp .................. 129 0.10
8,400 NTT Docomo Inc ................ 191 0.14
Transport
3,000 West Japan Railway Co ...... 185 0.14
9,202 6.88
Jersey, Channel Islands (0.22%)
Commercial Services and Supplies
34,033 UBM Plc ............................. 294 0.22
Korea, Republic of (1.91%)
Agriculture
6,642 KT&G Corp ........................ 639 0.48
Automobiles
7,225 Hyundai Motor Co .............. 963 0.72
7,344 Kia Motors Corp ................. 310 0.23
Computers and Peripherals
612
Samsung SDS Co
Ltd ...................................... 94 0.07
Insurance
1,056
Samsung Fire & Marine
Insurance Co Ltd ................. 272 0.21
Personal Products
806 Amorepacific Corp ............. 272 0.20
2,550 1.91
Mexico (1.19%)
Media
21,174
Grupo Televisa SAB
ADR .................................... 581 0.43
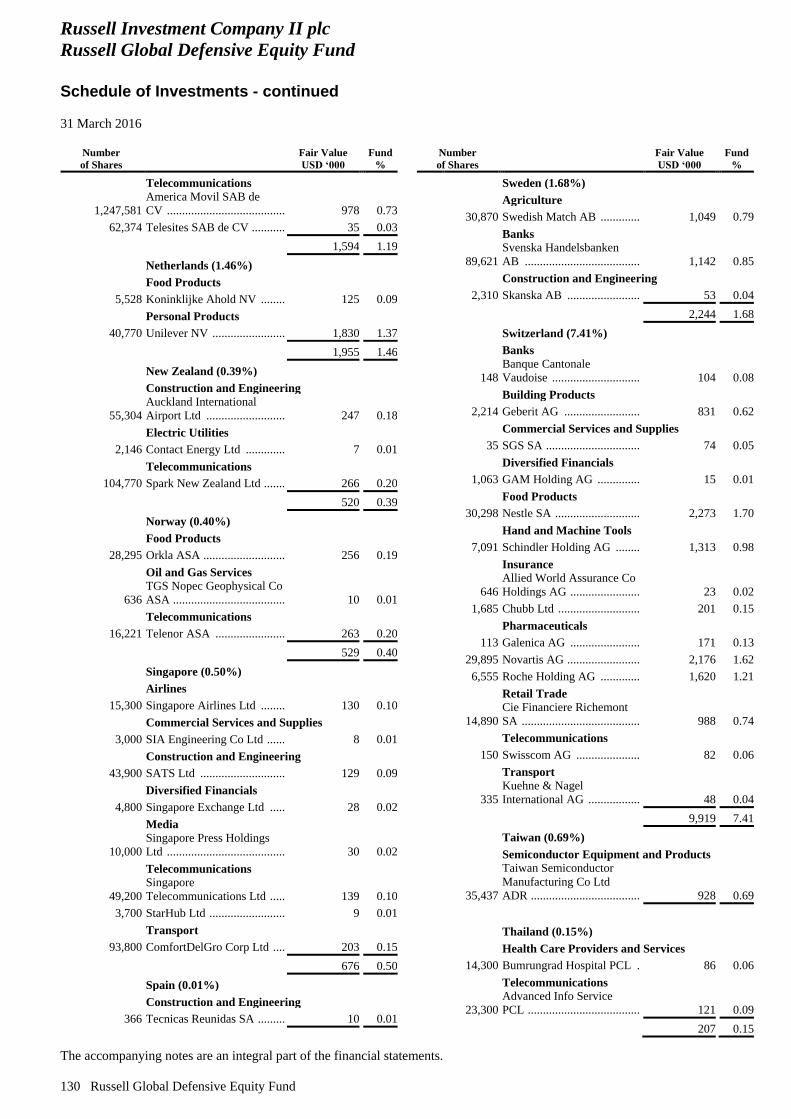
Russell Investment Company II plc
Russell Global Defensive Equity Fund
Schedule of Investments - continued
31 March 2016
The accompanying notes are an integral part of the financial statements.
130 Russell Global Defensive Equity Fund
Number
of Shares
Fair Value
USD ‘000
Fund
%
Telecommunications
1,247,581
America Movil SAB de
CV ....................................... 978 0.73
62,374 Telesites SAB de CV ........... 35 0.03
1,594 1.19
Netherlands (1.46%)
Food Products
5,528 Koninklijke Ahold NV ........ 125 0.09
Personal Products
40,770 Unilever NV ........................ 1,830 1.37
1,955 1.46
New Zealand (0.39%)
Construction and Engineering
55,304
Auckland International
Airport Ltd .......................... 247 0.18
Electric Utilities
2,146 Contact Energy Ltd ............. 7 0.01
Telecommunications
104,770 Spark New Zealand Ltd ....... 266 0.20
520 0.39
Norway (0.40%)
Food Products
28,295 Orkla ASA ........................... 256 0.19
Oil and Gas Services
636
TGS Nopec Geophysical Co
ASA ..................................... 10 0.01
Telecommunications
16,221 Telenor ASA ....................... 263 0.20
529 0.40
Singapore (0.50%)
Airlines
15,300 Singapore Airlines Ltd ........ 130 0.10
Commercial Services and Supplies
3,000 SIA Engineering Co Ltd ...... 8 0.01
Construction and Engineering
43,900 SATS Ltd ............................ 129 0.09
Diversified Financials
4,800 Singapore Exchange Ltd ..... 28 0.02
Media
10,000
Singapore Press Holdings
Ltd ....................................... 30 0.02
Telecommunications
49,200
Singapore
Telecommunications Ltd ..... 139 0.10
3,700 StarHub Ltd ......................... 9 0.01
Transport
93,800 ComfortDelGro Corp Ltd .... 203 0.15
676 0.50
Spain (0.01%)
Construction and Engineering
366 Tecnicas Reunidas SA ......... 10 0.01
Number
of Shares
Fair Value
USD ‘000
Fund
%
Sweden (1.68%)
Agriculture
30,870 Swedish Match AB ............. 1,049 0.79
Banks
89,621
Svenska Handelsbanken
AB ...................................... 1,142 0.85
Construction and Engineering
2,310 Skanska AB ........................ 53 0.04
2,244 1.68
Switzerland (7.41%)
Banks
148
Banque Cantonale
Vaudoise ............................. 104 0.08
Building Products
2,214 Geberit AG ......................... 831 0.62
Commercial Services and Supplies
35 SGS SA ............................... 74 0.05
Diversified Financials
1,063 GAM Holding AG .............. 15 0.01
Food Products
30,298 Nestle SA ............................ 2,273 1.70
Hand and Machine Tools
7,091 Schindler Holding AG ........ 1,313 0.98
Insurance
646
Allied World Assurance Co
Holdings AG ....................... 23 0.02
1,685 Chubb Ltd ........................... 201 0.15
Pharmaceuticals
113 Galenica AG ....................... 171 0.13
29,895 Novartis AG ........................ 2,176 1.62
6,555 Roche Holding AG ............. 1,620 1.21
Retail Trade
14,890
Cie Financiere Richemont
SA ....................................... 988 0.74
Telecommunications
150 Swisscom AG ..................... 82 0.06
Transport
335
Kuehne & Nagel
International AG ................. 48 0.04
9,919 7.41
Taiwan (0.69%)
Semiconductor Equipment and Products
35,437
Taiwan Semiconductor
Manufacturing Co Ltd
ADR .................................... 928 0.69
Thailand (0.15%)
Health Care Providers and Services
14,300 Bumrungrad Hospital PCL . 86 0.06
Telecommunications
23,300
Advanced Info Service
PCL ..................................... 121 0.09
207 0.15
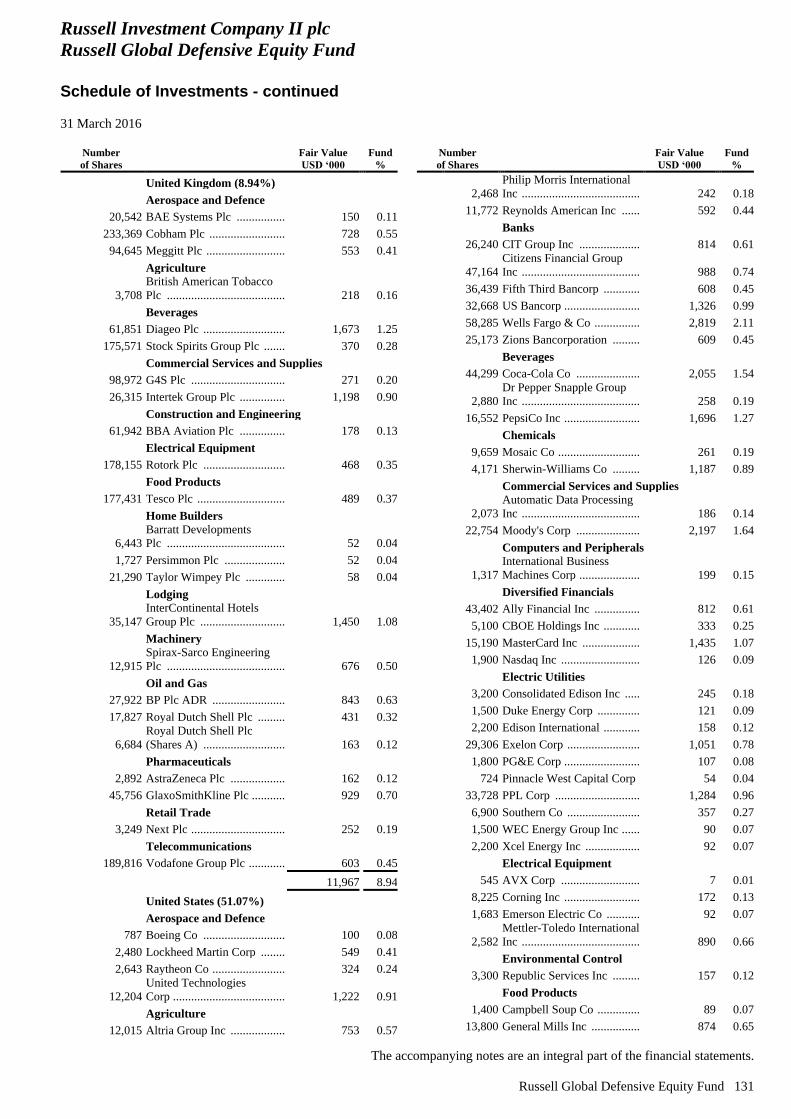
Russell Investment Company II plc
Russell Global Defensive Equity Fund
Schedule of Investments - continued
31 March 2016
The accompanying notes are an integral part of the financial statements.
Russell Global Defensive Equity Fund 131
Number
of Shares
Fair Value
USD ‘000
Fund
%
United Kingdom (8.94%)
Aerospace and Defence
20,542 BAE Systems Plc ................ 150 0.11
233,369 Cobham Plc ......................... 728 0.55
94,645 Meggitt Plc .......................... 553 0.41
Agriculture
3,708
British American Tobacco
Plc ....................................... 218 0.16
Beverages
61,851 Diageo Plc ........................... 1,673 1.25
175,571 Stock Spirits Group Plc ....... 370 0.28
Commercial Services and Supplies
98,972 G4S Plc ............................... 271 0.20
26,315 Intertek Group Plc ............... 1,198 0.90
Construction and Engineering
61,942 BBA Aviation Plc ............... 178 0.13
Electrical Equipment
178,155 Rotork Plc ........................... 468 0.35
Food Products
177,431 Tesco Plc ............................. 489 0.37
Home Builders
6,443
Barratt Developments
Plc ....................................... 52 0.04
1,727 Persimmon Plc .................... 52 0.04
21,290 Taylor Wimpey Plc ............. 58 0.04
Lodging
35,147
InterContinental Hotels
Group Plc ............................ 1,450 1.08
Machinery
12,915
Spirax-Sarco Engineering
Plc ....................................... 676 0.50
Oil and Gas
27,922 BP Plc ADR ........................ 843 0.63
17,827 Royal Dutch Shell Plc ......... 431 0.32
6,684
Royal Dutch Shell Plc
(Shares A) ........................... 163 0.12
Pharmaceuticals
2,892 AstraZeneca Plc .................. 162 0.12
45,756 GlaxoSmithKline Plc ........... 929 0.70
Retail Trade
3,249 Next Plc ............................... 252 0.19
Telecommunications
189,816 Vodafone Group Plc ............ 603 0.45
11,967 8.94
United States (51.07%)
Aerospace and Defence
787 Boeing Co ........................... 100 0.08
2,480 Lockheed Martin Corp ........ 549 0.41
2,643 Raytheon Co ........................ 324 0.24
12,204
United Technologies
Corp ..................................... 1,222 0.91
Agriculture
12,015 Altria Group Inc .................. 753 0.57
Number
of Shares
Fair Value
USD ‘000
Fund
%
2,468
Philip Morris International
Inc ....................................... 242 0.18
11,772 Reynolds American Inc ...... 592 0.44
Banks
26,240 CIT Group Inc .................... 814 0.61
47,164
Citizens Financial Group
Inc ....................................... 988 0.74
36,439 Fifth Third Bancorp ............ 608 0.45
32,668 US Bancorp ......................... 1,326 0.99
58,285 Wells Fargo & Co ............... 2,819 2.11
25,173 Zions Bancorporation ......... 609 0.45
Beverages
44,299 Coca-Cola Co ..................... 2,055 1.54
2,880
Dr Pepper Snapple Group
Inc ....................................... 258 0.19
16,552 PepsiCo Inc ......................... 1,696 1.27
Chemicals
9,659 Mosaic Co ........................... 261 0.19
4,171 Sherwin-Williams Co ......... 1,187 0.89
Commercial Services and Supplies
2,073
Automatic Data Processing
Inc ....................................... 186 0.14
22,754 Moody's Corp ..................... 2,197 1.64
Computers and Peripherals
1,317
International Business
Machines Corp .................... 199 0.15
Diversified Financials
43,402 Ally Financial Inc ............... 812 0.61
5,100 CBOE Holdings Inc ............ 333 0.25
15,190 MasterCard Inc ................... 1,435 1.07
1,900 Nasdaq Inc .......................... 126 0.09
Electric Utilities
3,200 Consolidated Edison Inc ..... 245 0.18
1,500 Duke Energy Corp .............. 121 0.09
2,200 Edison International ............ 158 0.12
29,306 Exelon Corp ........................ 1,051 0.78
1,800 PG&E Corp ......................... 107 0.08
724 Pinnacle West Capital Corp 54 0.04
33,728 PPL Corp ............................ 1,284 0.96
6,900 Southern Co ........................ 357 0.27
1,500 WEC Energy Group Inc ...... 90 0.07
2,200 Xcel Energy Inc .................. 92 0.07
Electrical Equipment
545 AVX Corp .......................... 7 0.01
8,225 Corning Inc ......................... 172 0.13
1,683 Emerson Electric Co ........... 92 0.07
2,582
Mettler-Toledo International
Inc ....................................... 890 0.66
Environmental Control
3,300 Republic Services Inc ......... 157 0.12
Food Products
1,400 Campbell Soup Co .............. 89 0.07
13,800 General Mills Inc ................ 874 0.65
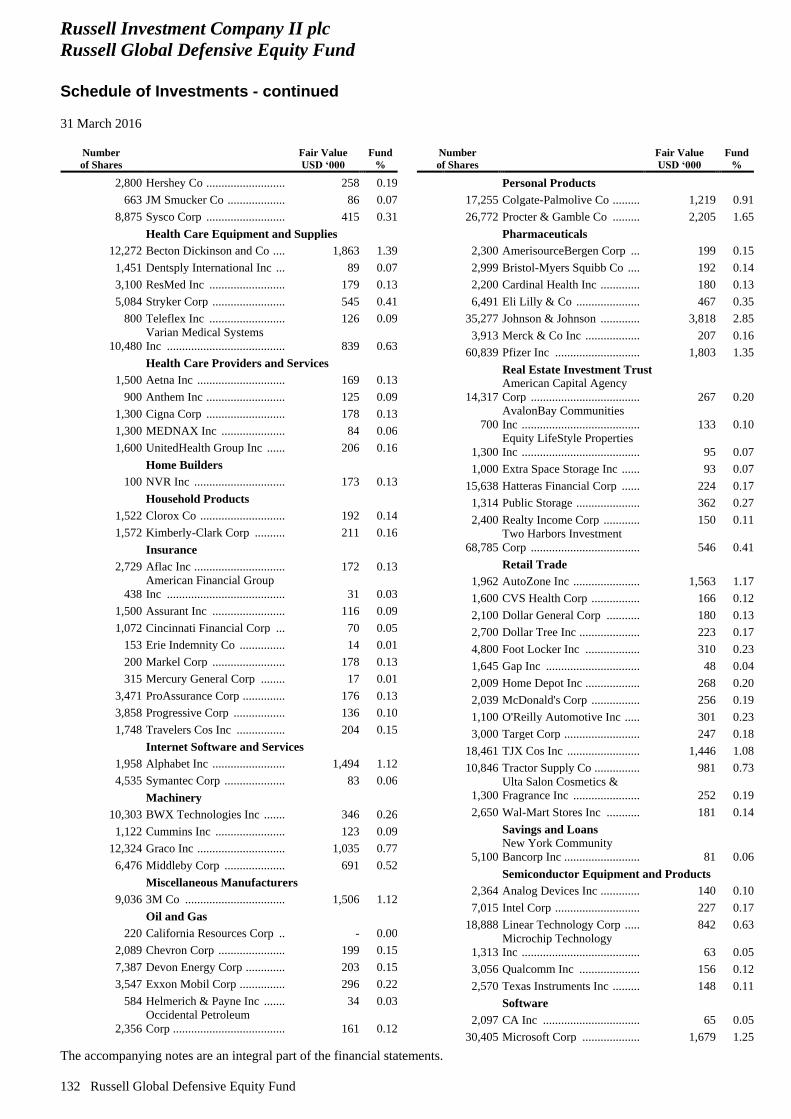
Russell Investment Company II plc
Russell Global Defensive Equity Fund
Schedule of Investments - continued
31 March 2016
The accompanying notes are an integral part of the financial statements.
132 Russell Global Defensive Equity Fund
Number
of Shares
Fair Value
USD ‘000
Fund
%
2,800 Hershey Co .......................... 258 0.19
663 JM Smucker Co ................... 86 0.07
8,875 Sysco Corp .......................... 415 0.31
Health Care Equipment and Supplies
12,272 Becton Dickinson and Co .... 1,863 1.39
1,451 Dentsply International Inc ... 89 0.07
3,100 ResMed Inc ......................... 179 0.13
5,084 Stryker Corp ........................ 545 0.41
800 Teleflex Inc ......................... 126 0.09
10,480
Varian Medical Systems
Inc ....................................... 839 0.63
Health Care Providers and Services
1,500 Aetna Inc ............................. 169 0.13
900 Anthem Inc .......................... 125 0.09
1,300 Cigna Corp .......................... 178 0.13
1,300 MEDNAX Inc ..................... 84 0.06
1,600 UnitedHealth Group Inc ...... 206 0.16
Home Builders
100 NVR Inc .............................. 173 0.13
Household Products
1,522 Clorox Co ............................ 192 0.14
1,572 Kimberly-Clark Corp .......... 211 0.16
Insurance
2,729 Aflac Inc .............................. 172 0.13
438
American Financial Group
Inc ....................................... 31 0.03
1,500 Assurant Inc ........................ 116 0.09
1,072 Cincinnati Financial Corp ... 70 0.05
153 Erie Indemnity Co ............... 14 0.01
200 Markel Corp ........................ 178 0.13
315 Mercury General Corp ........ 17 0.01
3,471 ProAssurance Corp .............. 176 0.13
3,858 Progressive Corp ................. 136 0.10
1,748 Travelers Cos Inc ................ 204 0.15
Internet Software and Services
1,958 Alphabet Inc ........................ 1,494 1.12
4,535 Symantec Corp .................... 83 0.06
Machinery
10,303 BWX Technologies Inc ....... 346 0.26
1,122 Cummins Inc ....................... 123 0.09
12,324 Graco Inc ............................. 1,035 0.77
6,476 Middleby Corp .................... 691 0.52
Miscellaneous Manufacturers
9,036 3M Co ................................. 1,506 1.12
Oil and Gas
220 California Resources Corp .. - 0.00
2,089 Chevron Corp ...................... 199 0.15
7,387 Devon Energy Corp ............. 203 0.15
3,547 Exxon Mobil Corp ............... 296 0.22
584 Helmerich & Payne Inc ....... 34 0.03
2,356
Occidental Petroleum
Corp ..................................... 161 0.12
Number
of Shares
Fair Value
USD ‘000
Fund
%
Personal Products
17,255 Colgate-Palmolive Co ......... 1,219 0.91
26,772 Procter & Gamble Co ......... 2,205 1.65
Pharmaceuticals
2,300 AmerisourceBergen Corp ... 199 0.15
2,999 Bristol-Myers Squibb Co .... 192 0.14
2,200 Cardinal Health Inc ............. 180 0.13
6,491 Eli Lilly & Co ..................... 467 0.35
35,277 Johnson & Johnson ............. 3,818 2.85
3,913 Merck & Co Inc .................. 207 0.16
60,839 Pfizer Inc ............................ 1,803 1.35
Real Estate Investment Trust
14,317
American Capital Agency
Corp .................................... 267 0.20
700
AvalonBay Communities
Inc ....................................... 133 0.10
1,300
Equity LifeStyle Properties
Inc ....................................... 95 0.07
1,000 Extra Space Storage Inc ...... 93 0.07
15,638 Hatteras Financial Corp ...... 224 0.17
1,314 Public Storage ..................... 362 0.27
2,400 Realty Income Corp ............ 150 0.11
68,785
Two Harbors Investment
Corp .................................... 546 0.41
Retail Trade
1,962 AutoZone Inc ...................... 1,563 1.17
1,600 CVS Health Corp ................ 166 0.12
2,100 Dollar General Corp ........... 180 0.13
2,700 Dollar Tree Inc .................... 223 0.17
4,800 Foot Locker Inc .................. 310 0.23
1,645 Gap Inc ............................... 48 0.04
2,009 Home Depot Inc .................. 268 0.20
2,039 McDonald's Corp ................ 256 0.19
1,100 O'Reilly Automotive Inc ..... 301 0.23
3,000 Target Corp ......................... 247 0.18
18,461 TJX Cos Inc ........................ 1,446 1.08
10,846 Tractor Supply Co ............... 981 0.73
1,300
Ulta Salon Cosmetics &
Fragrance Inc ...................... 252 0.19
2,650 Wal-Mart Stores Inc ........... 181 0.14
Savings and Loans
5,100
New York Community
Bancorp Inc ......................... 81 0.06
Semiconductor Equipment and Products
2,364 Analog Devices Inc ............. 140 0.10
7,015 Intel Corp ............................ 227 0.17
18,888 Linear Technology Corp ..... 842 0.63
1,313
Microchip Technology
Inc ....................................... 63 0.05
3,056 Qualcomm Inc .................... 156 0.12
2,570 Texas Instruments Inc ......... 148 0.11
Software
2,097 CA Inc ................................ 65 0.05
30,405 Microsoft Corp ................... 1,679 1.25
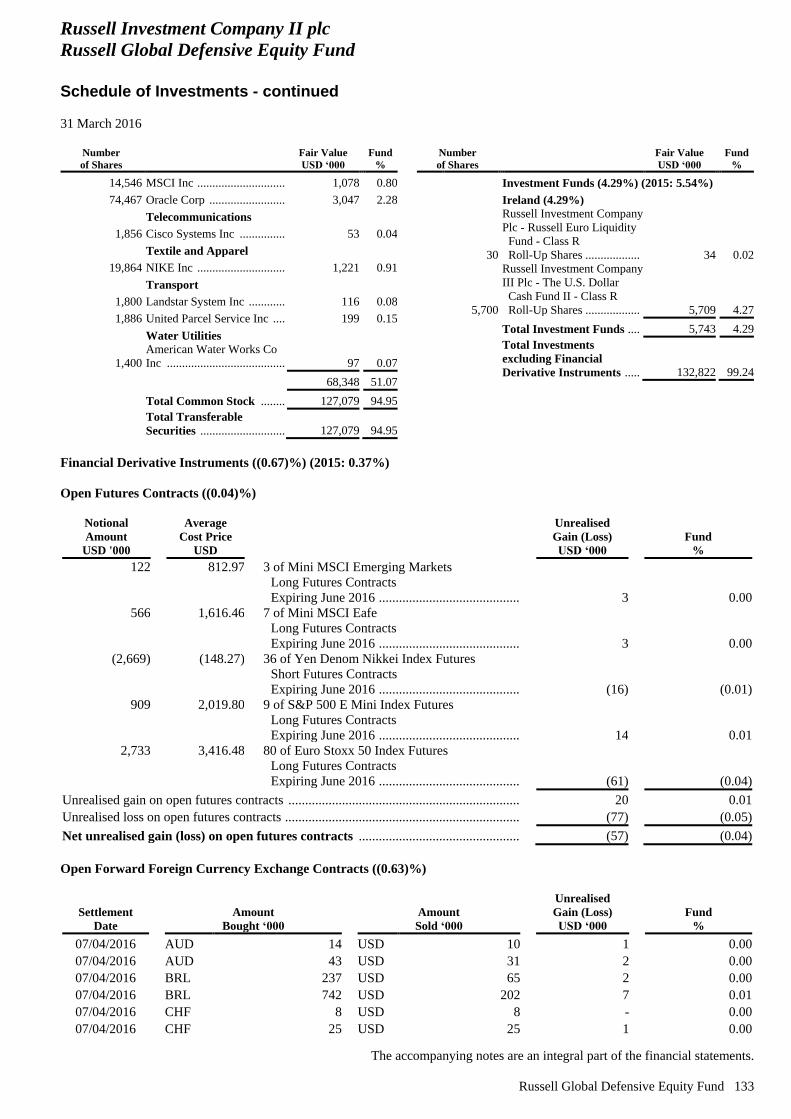
Russell Investment Company II plc
Russell Global Defensive Equity Fund
Schedule of Investments - continued
31 March 2016
The accompanying notes are an integral part of the financial statements.
Russell Global Defensive Equity Fund 133
Number
of Shares
Fair Value
USD ‘000
Fund
%
14,546 MSCI Inc ............................. 1,078 0.80
74,467 Oracle Corp ......................... 3,047 2.28
Telecommunications
1,856 Cisco Systems Inc ............... 53 0.04
Textile and Apparel
19,864 NIKE Inc ............................. 1,221 0.91
Transport
1,800 Landstar System Inc ............ 116 0.08
1,886 United Parcel Service Inc .... 199 0.15
Water Utilities
1,400
American Water Works Co
Inc ....................................... 97 0.07
68,348 51.07
Total Common Stock ........ 127,079 94.95
Total Transferable
Securities ............................ 127,079 94.95
Number
of Shares
Fair Value
USD ‘000
Fund
%
Investment Funds (4.29%) (2015: 5.54%)
Ireland (4.29%)
30
Russell Investment Company
Plc - Russell Euro Liquidity
Fund - Class R
Roll-Up Shares .................. 34 0.02
5,700
Russell Investment Company
III Plc - The U.S. Dollar
Cash Fund II - Class R
Roll-Up Shares .................. 5,709 4.27
Total Investment Funds .... 5,743 4.29
Total Investments
excluding Financial
Derivative Instruments ..... 132,822 99.24
Financial Derivative Instruments ((0.67)%) (2015: 0.37%)
Open Futures Contracts ((0.04)%)
Notional
Amount
USD '000
Average
Cost Price
USD
Unrealised
Gain (Loss)
USD ‘000
Fund
%
122
812.97
3 of Mini MSCI Emerging Markets
Long Futures Contracts
Expiring June 2016 ................................................... 3 0.00
566
1,616.46
7 of Mini MSCI Eafe
Long Futures Contracts
Expiring June 2016 ................................................... 3 0.00
(2,669)
(148.27)
36 of Yen Denom Nikkei Index Futures
Short Futures Contracts
Expiring June 2016 ................................................... (16) (0.01)
909
2,019.80
9 of S&P 500 E Mini Index Futures
Long Futures Contracts
Expiring June 2016 ................................................... 14 0.01
2,733
3,416.48
80 of Euro Stoxx 50 Index Futures
Long Futures Contracts
Expiring June 2016 ................................................... (61) (0.04)
Unrealised gain on open futures contracts ......................................................................... 20 0.01
Unrealised loss on open futures contracts .......................................................................... (77) (0.05)
Net unrealised gain (loss) on open futures contracts .................................................... (57) (0.04)
Open Forward Foreign Currency Exchange Contracts ((0.63)%)
Settlement
Date
Amount
Bought ‘000
Amount
Sold ‘000
Unrealised
Gain (Loss)
USD ‘000
Fund
%
07/04/2016 AUD 14 USD 10 1 0.00
07/04/2016 AUD 43 USD 31 2 0.00
07/04/2016 BRL 237 USD 65 2 0.00
07/04/2016 BRL 742 USD 202 7 0.01
07/04/2016 CHF 8 USD 8 - 0.00
07/04/2016 CHF 25 USD 25 1 0.00
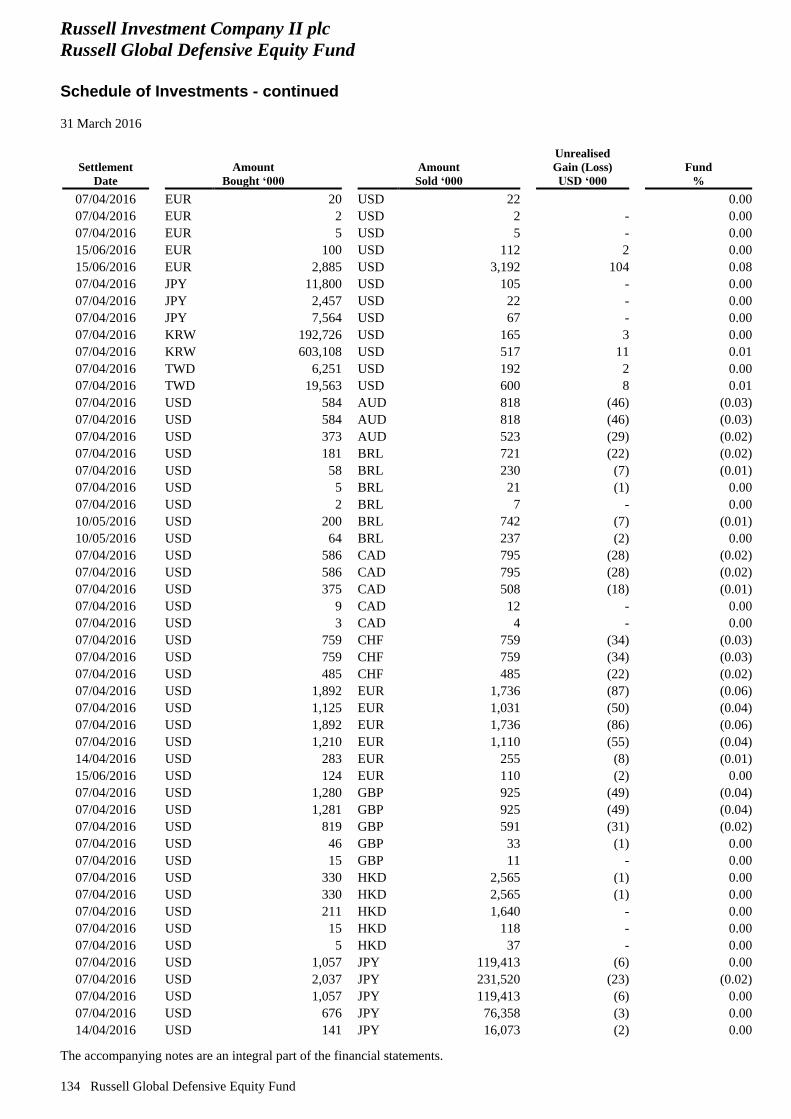
Russell Investment Company II plc
Russell Global Defensive Equity Fund
Schedule of Investments - continued
31 March 2016
The accompanying notes are an integral part of the financial statements.
134 Russell Global Defensive Equity Fund
Settlement
Date
Amount
Bought ‘000
Amount
Sold ‘000
Unrealised
Gain (Loss)
USD ‘000
Fund
%
07/04/2016 EUR 20 USD 22 0.00
07/04/2016 EUR 2 USD 2 - 0.00
07/04/2016 EUR 5 USD 5 - 0.00
15/06/2016 EUR 100 USD 112 2 0.00
15/06/2016 EUR 2,885 USD 3,192 104 0.08
07/04/2016 JPY 11,800 USD 105 - 0.00
07/04/2016 JPY 2,457 USD 22 - 0.00
07/04/2016 JPY 7,564 USD 67 - 0.00
07/04/2016 KRW 192,726 USD 165 3 0.00
07/04/2016 KRW 603,108 USD 517 11 0.01
07/04/2016 TWD 6,251 USD 192 2 0.00
07/04/2016 TWD 19,563 USD 600 8 0.01
07/04/2016 USD 584 AUD 818 (46) (0.03)
07/04/2016 USD 584 AUD 818 (46) (0.03)
07/04/2016 USD 373 AUD 523 (29) (0.02)
07/04/2016 USD 181 BRL 721 (22) (0.02)
07/04/2016 USD 58 BRL 230 (7) (0.01)
07/04/2016 USD 5 BRL 21 (1) 0.00
07/04/2016 USD 2 BRL 7 - 0.00
10/05/2016 USD 200 BRL 742 (7) (0.01)
10/05/2016 USD 64 BRL 237 (2) 0.00
07/04/2016 USD 586 CAD 795 (28) (0.02)
07/04/2016 USD 586 CAD 795 (28) (0.02)
07/04/2016 USD 375 CAD 508 (18) (0.01)
07/04/2016 USD 9 CAD 12 - 0.00
07/04/2016 USD 3 CAD 4 - 0.00
07/04/2016 USD 759 CHF 759 (34) (0.03)
07/04/2016 USD 759 CHF 759 (34) (0.03)
07/04/2016 USD 485 CHF 485 (22) (0.02)
07/04/2016 USD 1,892 EUR 1,736 (87) (0.06)
07/04/2016 USD 1,125 EUR 1,031 (50) (0.04)
07/04/2016 USD 1,892 EUR 1,736 (86) (0.06)
07/04/2016 USD 1,210 EUR 1,110 (55) (0.04)
14/04/2016 USD 283 EUR 255 (8) (0.01)
15/06/2016 USD 124 EUR 110 (2) 0.00
07/04/2016 USD 1,280 GBP 925 (49) (0.04)
07/04/2016 USD 1,281 GBP 925 (49) (0.04)
07/04/2016 USD 819 GBP 591 (31) (0.02)
07/04/2016 USD 46 GBP 33 (1) 0.00
07/04/2016 USD 15 GBP 11 - 0.00
07/04/2016 USD 330 HKD 2,565 (1) 0.00
07/04/2016 USD 330 HKD 2,565 (1) 0.00
07/04/2016 USD 211 HKD 1,640 - 0.00
07/04/2016 USD 15 HKD 118 - 0.00
07/04/2016 USD 5 HKD 37 - 0.00
07/04/2016 USD 1,057 JPY 119,413 (6) 0.00
07/04/2016 USD 2,037 JPY 231,520 (23) (0.02)
07/04/2016 USD 1,057 JPY 119,413 (6) 0.00
07/04/2016 USD 676 JPY 76,358 (3) 0.00
14/04/2016 USD 141 JPY 16,073 (2) 0.00
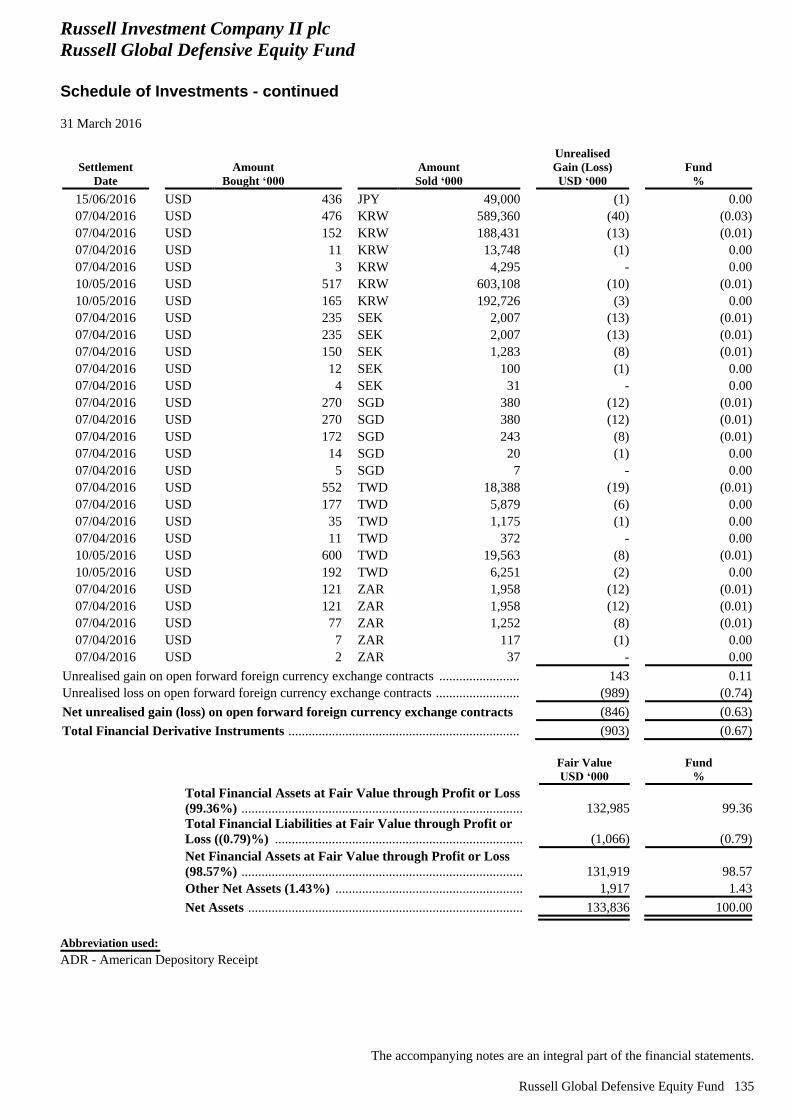
Russell Investment Company II plc
Russell Global Defensive Equity Fund
Schedule of Investments - continued
31 March 2016
The accompanying notes are an integral part of the financial statements.
Russell Global Defensive Equity Fund 135
Settlement
Date
Amount
Bought ‘000
Amount
Sold ‘000
Unrealised
Gain (Loss)
USD ‘000
Fund
%
15/06/2016 USD 436 JPY 49,000 (1) 0.00
07/04/2016 USD 476 KRW 589,360 (40) (0.03)
07/04/2016 USD 152 KRW 188,431 (13) (0.01)
07/04/2016 USD 11 KRW 13,748 (1) 0.00
07/04/2016 USD 3 KRW 4,295 - 0.00
10/05/2016 USD 517 KRW 603,108 (10) (0.01)
10/05/2016 USD 165 KRW 192,726 (3) 0.00
07/04/2016 USD 235 SEK 2,007 (13) (0.01)
07/04/2016 USD 235 SEK 2,007 (13) (0.01)
07/04/2016 USD 150 SEK 1,283 (8) (0.01)
07/04/2016 USD 12 SEK 100 (1) 0.00
07/04/2016 USD 4 SEK 31 - 0.00
07/04/2016 USD 270 SGD 380 (12) (0.01)
07/04/2016 USD 270 SGD 380 (12) (0.01)
07/04/2016 USD 172 SGD 243 (8) (0.01)
07/04/2016 USD 14 SGD 20 (1) 0.00
07/04/2016 USD 5 SGD 7 - 0.00
07/04/2016 USD 552 TWD 18,388 (19) (0.01)
07/04/2016 USD 177 TWD 5,879 (6) 0.00
07/04/2016 USD 35 TWD 1,175 (1) 0.00
07/04/2016 USD 11 TWD 372 - 0.00
10/05/2016 USD 600 TWD 19,563 (8) (0.01)
10/05/2016 USD 192 TWD 6,251 (2) 0.00
07/04/2016 USD 121 ZAR 1,958 (12) (0.01)
07/04/2016 USD 121 ZAR 1,958 (12) (0.01)
07/04/2016 USD 77 ZAR 1,252 (8) (0.01)
07/04/2016 USD 7 ZAR 117 (1) 0.00
07/04/2016 USD 2 ZAR 37 - 0.00
Unrealised gain on open forward foreign currency exchange contracts ............................ 143 0.11
Unrealised loss on open forward foreign currency exchange contracts ............................. (989) (0.74)
Net unrealised gain (loss) on open forward foreign currency exchange contracts .... (846) (0.63)
Total Financial Derivative Instruments ......................................................................... (903) (0.67)
Fair Value
USD ‘000
Fund
%
Total Financial Assets at Fair Value through Profit or Loss
(99.36%) ....................................................................................................................................................... 132,985 99.36
Total Financial Liabilities at Fair Value through Profit or
Loss ((0.79)%) ............................................................................................................................................. (1,066) (0.79)
Net Financial Assets at Fair Value through Profit or Loss
(98.57%) ....................................................................................................................................................... 131,919 98.57
Other Net Assets (1.43%) ........................................................................................................................ 1,917 1.43
Net Assets .................................................................................................................................................. 133,836 100.00
Abbreviation used:
ADR - American Depository Receipt
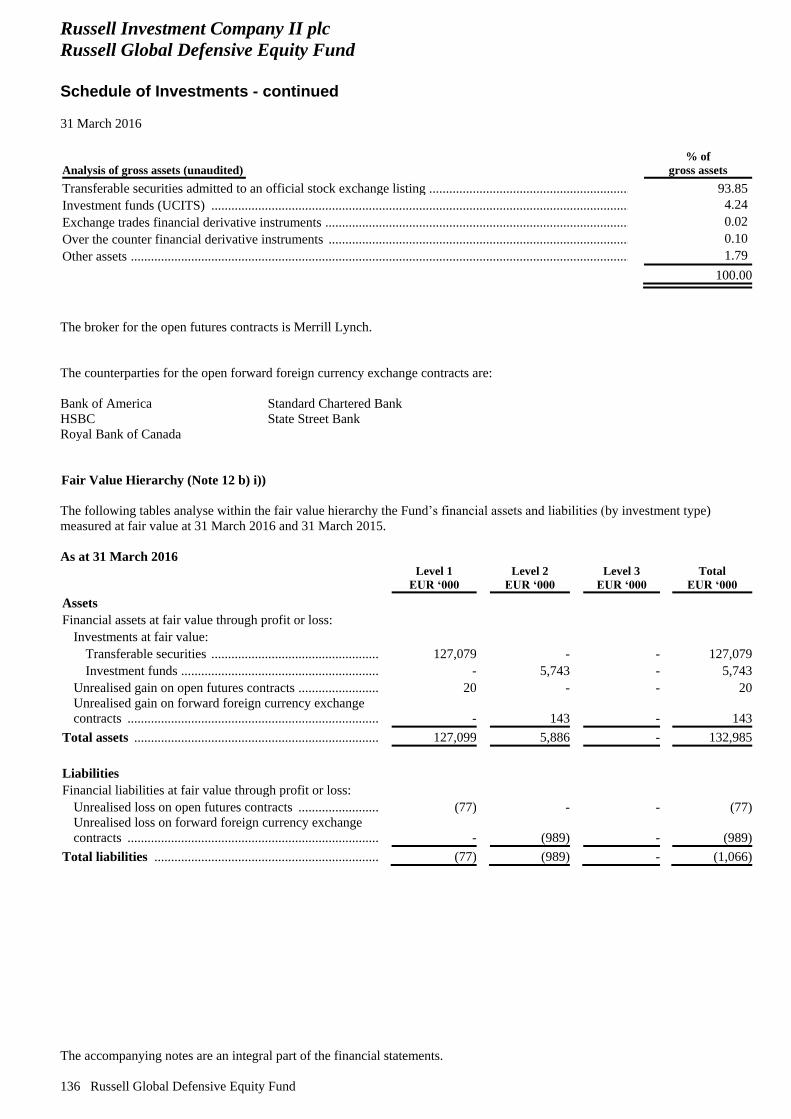
Russell Investment Company II plc
Russell Global Defensive Equity Fund
Schedule of Investments - continued
31 March 2016
The accompanying notes are an integral part of the financial statements.
136 Russell Global Defensive Equity Fund
Analysis of gross assets (unaudited)
% of
gross assets
Transferable securities admitted to an official stock exchange listing ...................................................................... 93.85
Investment funds (UCITS) ....................................................................................................................................... 4.24
Exchange trades financial derivative instruments ..................................................................................................... 0.02
Over the counter financial derivative instruments .................................................................................................... 0.10
Other assets ............................................................................................................................................................... 1.79
100.00
The broker for the open futures contracts is Merrill Lynch.
The counterparties for the open forward foreign currency exchange contracts are:
Bank of America
HSBC
Royal Bank of Canada
Standard Chartered Bank
State Street Bank
Fair Value Hierarchy (Note 12 b) i))
The following tables analyse within the fair value hierarchy the Fund’s financial assets and liabilities (by investment type)
measured at fair value at 31 March 2016 and 31 March 2015.
As at 31 March 2016
Level 1
EUR ‘000
Level 2
EUR ‘000
Level 3
EUR ‘000
Total
EUR ‘000
Assets
Financial assets at fair value through profit or loss:
Investments at fair value:
Transferable securities ............................................................... 127,079 - - 127,079
Investment funds ........................................................................ - 5,743 - 5,743
Unrealised gain on open futures contracts ...................................... 20 - - 20
Unrealised gain on forward foreign currency exchange
contracts ......................................................................................... - 143 - 143
Total assets ...................................................................................... 127,099 5,886 - 132,985
Liabilities
Financial liabilities at fair value through profit or loss:
Unrealised loss on open futures contracts ...................................... (77) - - (77)
Unrealised loss on forward foreign currency exchange
contracts ......................................................................................... - (989) - (989)
Total liabilities ................................................................................ (77) (989) - (1,066)
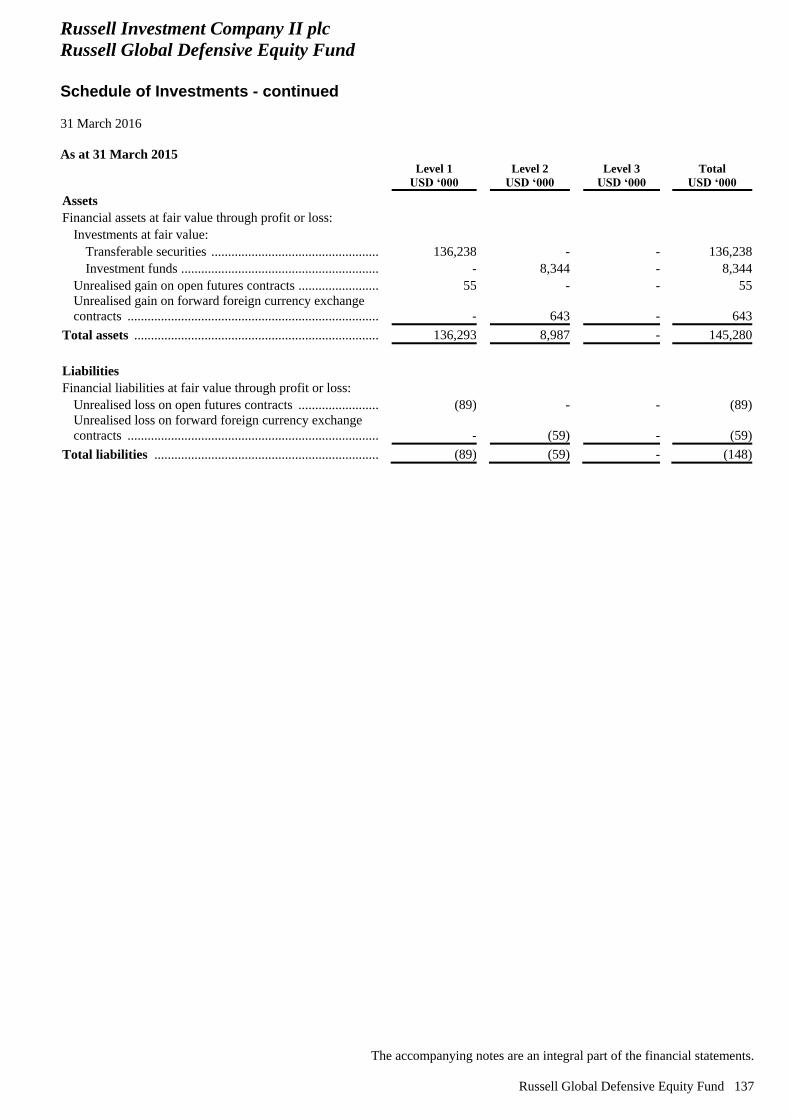
Russell Investment Company II plc
Russell Global Defensive Equity Fund
Schedule of Investments - continued
31 March 2016
The accompanying notes are an integral part of the financial statements.
Russell Global Defensive Equity Fund 137
As at 31 March 2015
Level 1
USD ‘000
Level 2
USD ‘000
Level 3
USD ‘000
Total
USD ‘000
Assets
Financial assets at fair value through profit or loss:
Investments at fair value:
Transferable securities ............................................................... 136,238 - - 136,238
Investment funds ........................................................................ - 8,344 - 8,344
Unrealised gain on open futures contracts ................................. 55 - - 55
Unrealised gain on forward foreign currency exchange
contracts .................................................................................... - 643 - 643
Total assets ...................................................................................... 136,293 8,987 - 145,280
Liabilities
Financial liabilities at fair value through profit or loss:
Unrealised loss on open futures contracts ................................. (89) - - (89)
Unrealised loss on forward foreign currency exchange
contracts .................................................................................... - (59) - (59)
Total liabilities ................................................................................ (89) (59) - (148)
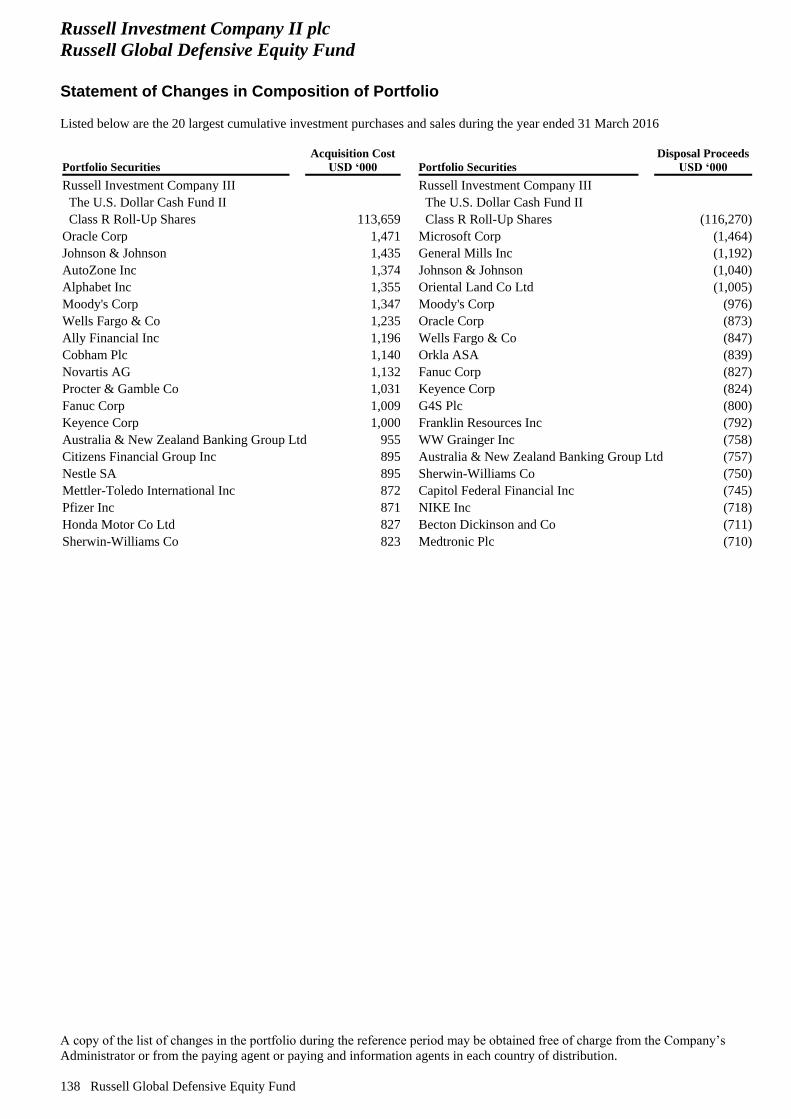
Russell Investment Company II plc
Russell Global Defensive Equity Fund
Statement of Changes in Composition of Portfolio
Listed below are the 20 largest cumulative investment purchases and sales during the year ended 31 March 2016
A copy of the list of changes in the portfolio during the reference period may be obtained free of charge from the Company’s
Administrator or from the paying agent or paying and information agents in each country of distribution.
138 Russell Global Defensive Equity Fund
Portfolio Securities
Acquisition Cost
USD ‘000 Portfolio Securities
Disposal Proceeds
USD ‘000
Russell Investment Company III Russell Investment Company III
The U.S. Dollar Cash Fund II The U.S. Dollar Cash Fund II
Class R Roll-Up Shares 113,659 Class R Roll-Up Shares (116,270)
Oracle Corp 1,471 Microsoft Corp (1,464)
Johnson & Johnson 1,435 General Mills Inc (1,192)
AutoZone Inc 1,374 Johnson & Johnson (1,040)
Alphabet Inc 1,355 Oriental Land Co Ltd (1,005)
Moody's Corp 1,347 Moody's Corp (976)
Wells Fargo & Co 1,235 Oracle Corp (873)
Ally Financial Inc 1,196 Wells Fargo & Co (847)
Cobham Plc 1,140 Orkla ASA (839)
Novartis AG 1,132 Fanuc Corp (827)
Procter & Gamble Co 1,031 Keyence Corp (824)
Fanuc Corp 1,009 G4S Plc (800)
Keyence Corp 1,000 Franklin Resources Inc (792)
Australia & New Zealand Banking Group Ltd 955 WW Grainger Inc (758)
Citizens Financial Group Inc 895 Australia & New Zealand Banking Group Ltd (757)
Nestle SA 895 Sherwin-Williams Co (750)
Mettler-Toledo International Inc 872 Capitol Federal Financial Inc (745)
Pfizer Inc 871 NIKE Inc (718)
Honda Motor Co Ltd 827 Becton Dickinson and Co (711)
Sherwin-Williams Co 823 Medtronic Plc (710)
Russell Investment Company II plc
Russell Pan European Equity Fund
Manager’s Report
Russell Pan European Equity Fund 139
Money Managers as at 31 March 2016 Hermes Sourcecap Limited
Numeric Investors, L.P.
Pyramis Global Advisor
Pzena Investment Management
Russell Investments Limited
S.W. Mitchell Capital, LLP
Taube Hodson Stonex Partners Ltd.
Investment Objective Russell Pan European Equity Fund (the “Fund”) seeks to achieve capital appreciation by investing principally in equity securities
listed on regulated markets in Europe. The Fund may also invest in new issues for which application for listing on a regulated
market in Europe will be sought. The Fund may hold such securities listed or traded on regulated markets worldwide of
companies that are not incorporated, listed or traded in Europe but which receive the majority of their total revenue from
European countries. The Fund will not be concentrating on any specific industry sector but will pursue a policy of active stock
selection and active country allocation on the regulated markets in which it invests.
Fund Performance
During the year ended 31 March 2016, Russell Pan European Equity Fund (Class B) returned -11.2 per cent on a gross of fee
basis (-12.2 per cent on a net of fee basis), while the benchmark*returned -13.1 per cent.
Market Comment
European equities failed to maintain their strong start to 2015 in the second quarter. A June slump caused the Russell Developed
Europe Large Cap Net Index to slip 3.0 per cent. The fluctuating progress of Greek debt negotiations dominated market direction,
particularly towards the end of the quarter. Numerous meetings and emergency summits between the country and its International
Monetary Fund (IMF) and European creditors failed to conclude an agreement. Greece eventually missed the deadline for its
bundle of IMF payments at the very end of June. This increased uncertainty surrounding a default and the country’s place within
the Eurozone weighed on market sentiment. Earlier in the quarter, investors reacted positively to European Central Bank (the
“ECB”) signals. The Central Bank remained committed to seeing out its quantitative easing programme to September 2016 and
temporarily increased its purchase of government bonds ahead of predicted low liquidity in the summer months. European
corporate earnings were also broadly positive this period. The ongoing Eurozone economic recovery was underpinned by
economic data. The Eurozone first quarter GDP growth estimate missed consensus (at 0.4 per cent) but continued to show
improvement. Eurozone unemployment fell to its lowest level since March 2012 at 11.1 per cent in April.
The benchmark slipped 8.6 per cent in a negative risk-off environment for global equities in the third quarter of 2015.
Developments in China and its potential impact on the Eurozone dampened investor sentiment. Anxiety about the country’s
sustained equity market downturn, the slowing of economic growth and unexpected monetary policy action from the People’s
Bank of China catalysed equity sell-offs world-wide. Prior to international concerns weighing on the Index, the quarter had
started positively. European equities were the strongest performing region globally in July. Investors reacted positively to Greek
political and economic certainty, after an EUR 86 billion Eurozone bailout was agreed. Later in the quarter, the market edged
higher on accommodative comments from the ECB President Draghi. Draghi stated that quantitative easing in the Eurozone may
be extended beyond the current September 2016 end date. This came as the Central Bank revised downwards its inflation and
growth forecasts for the next three years due to a weaker global growth outlook. Economic fundamentals remained resilient.
Eurozone second quarter GDP was unexpectedly revised upwards to 0.4 per cent quarter-on-quarter (QoQ) (1.5 per cent year-on-
year (YoY)), primarily due to stronger growth in Italy. First-quarter growth was also revised higher to 0.5 per cent QoQ from 0.4 per cent QoQ. Eurozone unemployment data for July surprised as it slipped to 10.9 per cent, the lowest in three years.
The benchmark climbed 5.5 per cent in the final quarter of 2015, as it recovered the majority of its third quarter decline. This
solidified a positive 9.2 per cent return for 2015. After a strong October and modest November increase, the Index tracked lower
in December after the ECB much anticipated policy action. This disappointed investors’ high expectations, which had been priced
into the market in the preceding months on President Draghi’s dovish signals. The ECB made fewer changes than expected to its
monetary policy, cutting its deposit rate to -0.3 per cent and extending quantitative easing until March 2017 from the original
September 2016 end date. Notably, this did not include an increase in the monthly amount purchased. The Euro appreciated
against the U.S. Dollar following the announcement, paring back early quarter depreciation. The market shrugged off political
uncertainty in Spain in late-December, as both main parties (Mariano Rajoy’s centre-right Popular party and opposition centre-
left Socialists) failed to win an overall majority. Earlier in the quarter, the Index had recorded its best monthly return since July
2009 as global growth fears subsided. However, the market slipped on news of a greater than expected decline in Eurozone
industrial production (1.1 per cent YoY for November) and disappointing third quarter Eurozone GDP growth (0.3 per cent
QoQ).
Russell Investment Company II plc
Russell Pan European Equity Fund
Manager’s Report - continued
140 Russell Pan European Equity Fund
It was a negative start to 2016 for European equities, as the benchmark slipped 7.1 per cent in the first quarter. The benchmark
failed to recover from its January losses. Early in the period, sentiment towards cyclical areas of the market weakened as investors
favoured the stability and dividend yield provided by more defensive large cap stocks. The market rebounded in late-February as
equity market and oil price volatility stabilised and commodities rallied. Having signalled in January that further supportive
stimulus was forthcoming, the ECB introduced a raft of new accommodative stimulus measures in March. However, the market
tracked lower towards quarter end as investors appeared disappointed with the ECB President Draghi’s dismissal of future deposit
rate cuts. Notably, the Euro strengthened against the U.S. Dollar over the period (4.8 per cent). In March, the ECB reduced its
main refinancing rate to 0.0 per cent, cut its deposit facility rate to -0.4 per cent and also reduced its marginal lending facility rate
to 0.25 per cent from 0.30 per cent. Quantitative easing was expanded by EUR20 billion a month to EUR80 billion to also
include the purchase of investment grade corporate bonds. In addition, the ECB initiated another targeted longer-term refinancing
operation (TLTRO II). The provision of cheap liquidity to banks, at a rate as low as the deposit facility, appears to offset the
impact of negative interest rates. However, sentiment towards the financials sector was negative over the period. General Comment on Money Managers/Performance
The Fund added to its 2015 outperformance in the second quarter. Significantly strong stock selection across the Fund’s Money
Managers drove outperformance in what was a more volatile period for European equities. The Fund’s overweight to small-mid
cap stocks suited the market environment and underpinned relative returns. Taube Hodson Stonex Partners Ltd (THS) rebounded
from a negative start to the year while our positioning strategy was the sole underperformer this quarter.
The Fund outperformed the benchmark in a negative and volatile third quarter of 2015 for European equities. The Fund’s tilt
towards small and mid-caps drove relative gains. The effective selection of domestically-oriented stocks underpinned returns.
Despite suffering from its value tilt, Numeric Investors, L.P. (Numeric) was a leading contributor as it benefited from its positive
momentum exposure. Pzena Investment Management’s (Prezna) low quality, value-oriented strategy was the sole underperformer
in an unfavorable factor environment. European equity valuations remain reasonably attractive against other regions and asset
classes, and the pickup in corporate earnings in the Eurozone provides additional support.
The Fund finished broadly in-line with the benchmark in the fourth quarter of 2015. The Fund’s positioning towards quality and
momentum was beneficial. An overweight to the consumer discretionary and information technology sectors, coupled with an
underweight to health care, added relative value. Individual stock selection weighed on excess returns, particularly among small
cap stocks. Stock selection was weakest for Pzena in an unfavorable environment for its value-oriented strategy. Our positioning
strategy suffered from its overweight to high dividend yielding stocks, which was an unrewarded part of the market this period. In
contrast, it was a positive factor environment for structural growth Money Manager Hermes Sourcecap Limited, which added to
its strong long-term outperformance. The Fund marginally outperformed the benchmark in the first quarter of 2016. The Fund’s strategic overweight to small cap
stocks added to positive relative returns. The large underweight to the consumer staples sector did not suit the market
environment this period. An underweight to materials was also unrewarded. Individual stock selection was positive within the
financials sector and within Germany. Our positioning strategy was the standout performer in a positive factor environment.
Numeric and Pzena also outperformed as both benefited from strong value stock selection. THS and Hermes Sourcecap Limited
finished in-line with the benchmark. Meanwhile, Fidelity underperformed as negative stock selection within the financials sector
detracted. SW Mitchell Capital, LLP suffered from its selection of industrials stocks and exposure to Italy. Outlook
Global markets got off to a rough start in 2016. By mid-February global developed equities had lost nearly 20% from their 2015
peak. They rebounded by around 10 per cent by mid-March, but we expect volatility to be a headline throughout 2016. This
volatility will continue to be driven by China fears, the U.S. Federal Reserve’s monetary tightening, U.S. recession concerns,
bank balance sheet worries, and soft corporate profits. Moreover, the move to negative interest rates in Europe and Japan has
triggered fears that central banks have run out of easing options. Negative rates also tend to squeeze the margin between banks’
borrowing and lending rates. This squeeze could, in turn, hurt bank profitability, and end up making things worse for the markets.
In our 2016 Global Market Outlook Annual report, we forecast mid-to-low single digit returns for global equities, along with a
gradual rise in long-term interest rates. We’re holding to that view, with the exception we think equity growth is more likely to be
in the low single digits. Moreover, we’re now seeing corporate profits weakening, softness in global trade and manufacturing, and
slightly higher risks for Emerging Markets. These elements all contribute to a less supportive environment for equities. That said,
we’re not forecasting a sustained bear market, provided the U.S. does not fall into recession. Right now we see recession as a low
probability over the next several years. It’s true we’re deep into the current business cycle, but we’re not seeing excesses in the
U.S. economy that could trigger recession. Past performance is no indication of current or future performance. * Benchmark Source: Russell Developed Europe Large Cap Net Index Russell Investments Ireland Limited
May 2016
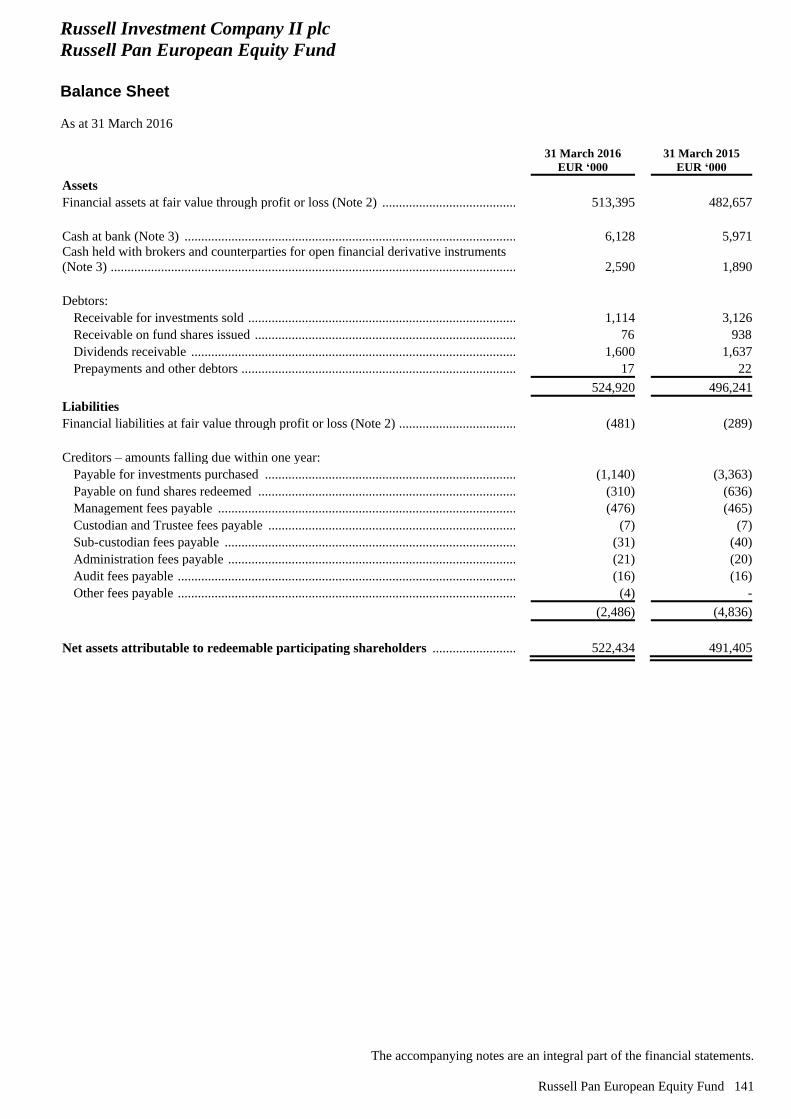
Russell Investment Company II plc
Russell Pan European Equity Fund
Balance Sheet
As at 31 March 2016
The accompanying notes are an integral part of the financial statements.
Russell Pan European Equity Fund 141
31 March 2016
EUR ‘000
31 March 2015
EUR ‘000
Assets
Financial assets at fair value through profit or loss (Note 2) ..................................................... 513,395 482,657
Cash at bank (Note 3) ...................................................................................................... 6,128 5,971
Cash held with brokers and counterparties for open financial derivative instruments
(Note 3) ..................................................................................................................................... 2,590 1,890
Debtors:
Receivable for investments sold ............................................................................................. 1,114 3,126
Receivable on fund shares issued ........................................................................................... 76 938
Dividends receivable .............................................................................................................. 1,600 1,637
Prepayments and other debtors ............................................................................................... 17 22
524,920 496,241
Liabilities
Financial liabilities at fair value through profit or loss (Note 2) ................................................ (481) (289)
Creditors – amounts falling due within one year:
Payable for investments purchased ........................................................................................ (1,140) (3,363)
Payable on fund shares redeemed .......................................................................................... (310) (636)
Management fees payable ...................................................................................................... (476) (465)
Custodian and Trustee fees payable ....................................................................................... (7) (7)
Sub-custodian fees payable .................................................................................................... (31) (40)
Administration fees payable ................................................................................................... (21) (20)
Audit fees payable .................................................................................................................. (16) (16)
Other fees payable .................................................................................................................. (4) -
(2,486) (4,836)
Net assets attributable to redeemable participating shareholders ...................................... 522,434 491,405

Russell Investment Company II plc
Russell Pan European Equity Fund
Profit and Loss Account
For the year ended 31 March 2016
The accompanying notes are an integral part of the financial statements.
142 Russell Pan European Equity Fund
2016
EUR ‘000
2015
EUR ‘000
Income
Dividends ..................................................................................................................... 14,159 11,483
Net gain (loss) on investment activities (Note 4) ............................................................. (74,926) 74,602
Total investment income (expense) .............................................................................. (60,767) 86,085
Expenses
Management fees (Note 5) ........................................................................................... (5,769) (4,655)
Custodian and Trustee fees (Note 6) ............................................................................ (45) (33)
Sub-custodian fees (Note 6) ......................................................................................... (216) (206)
Administration and transfer agency fees (Note 6) ......................................................... (219) (165)
Audit fees (Note 6) ....................................................................................................... (16) (16)
Professional fees ........................................................................................................... (44) (31)
Other fees ..................................................................................................................... (55) (28)
Total operating expenses ............................................................................................... (6,364) (5,134)
Net income (expense) ..................................................................................................... (67,131) 80,951
Finance costs
Distributions (Note 8) ................................................................................................... (6,506) (5,130)
Profit (loss) for the financial year before taxation ...................................................... (73,637) 75,821
Taxation
Withholding tax (Note 9) ............................................................................................. (1,017) (739)
Net increase (decrease) in net assets attributable to redeemable participating
shareholders resulting from operations ....................................................................... (74,654) 75,082
All amounts arose solely from continuing operations. There are no recognised gains or losses other than those dealt with in the Profit and Loss
Account.
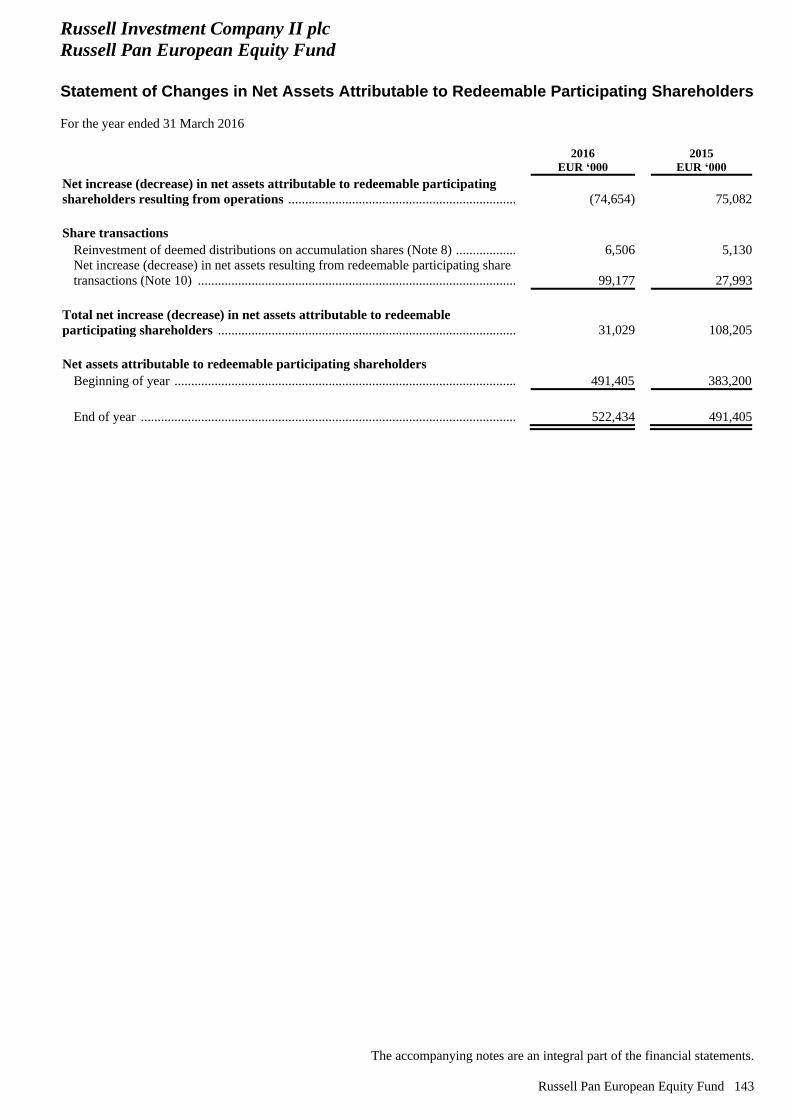
Russell Investment Company II plc
Russell Pan European Equity Fund
Statement of Changes in Net Assets Attributable to Redeemable Participating Shareholders
For the year ended 31 March 2016
The accompanying notes are an integral part of the financial statements.
Russell Pan European Equity Fund 143
2016
EUR ‘000
2015
EUR ‘000
Net increase (decrease) in net assets attributable to redeemable participating
shareholders resulting from operations ....................................................................... (74,654) 75,082
Share transactions
Reinvestment of deemed distributions on accumulation shares (Note 8) ..................... 6,506 5,130
Net increase (decrease) in net assets resulting from redeemable participating share
transactions (Note 10) .................................................................................................. 99,177 27,993
Total net increase (decrease) in net assets attributable to redeemable
participating shareholders ............................................................................................ 31,029 108,205
Net assets attributable to redeemable participating shareholders
Beginning of year ......................................................................................................... 491,405 383,200
End of year ................................................................................................................... 522,434 491,405
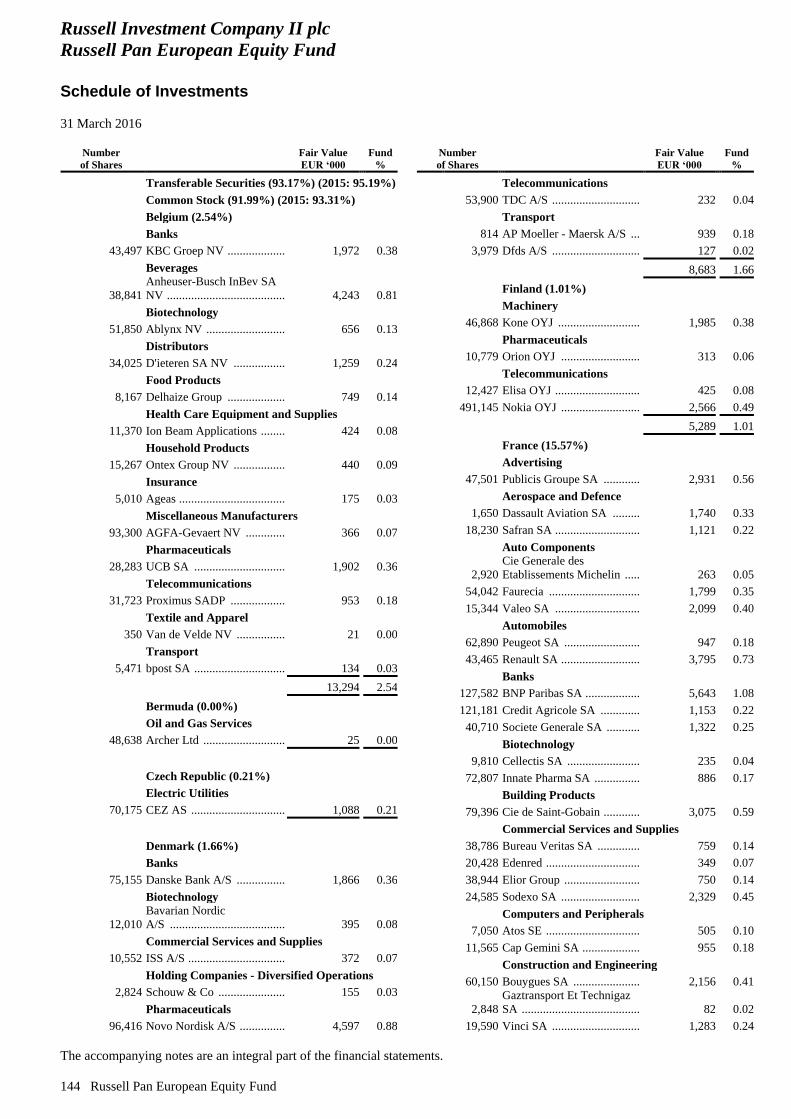
Russell Investment Company II plc
Russell Pan European Equity Fund
Schedule of Investments
31 March 2016
The accompanying notes are an integral part of the financial statements.
144 Russell Pan European Equity Fund
Number
of Shares
Fair Value
EUR ‘000
Fund
%
Transferable Securities (93.17%) (2015: 95.19%)
Common Stock (91.99%) (2015: 93.31%)
Belgium (2.54%)
Banks
43,497 KBC Groep NV ................... 1,972 0.38
Beverages
38,841
Anheuser-Busch InBev SA
NV ....................................... 4,243 0.81
Biotechnology
51,850 Ablynx NV .......................... 656 0.13
Distributors
34,025 D'ieteren SA NV ................. 1,259 0.24
Food Products
8,167 Delhaize Group ................... 749 0.14
Health Care Equipment and Supplies
11,370 Ion Beam Applications ........ 424 0.08
Household Products
15,267 Ontex Group NV ................. 440 0.09
Insurance
5,010 Ageas ................................... 175 0.03
Miscellaneous Manufacturers
93,300 AGFA-Gevaert NV ............. 366 0.07
Pharmaceuticals
28,283 UCB SA .............................. 1,902 0.36
Telecommunications
31,723 Proximus SADP .................. 953 0.18
Textile and Apparel
350 Van de Velde NV ................ 21 0.00
Transport
5,471 bpost SA .............................. 134 0.03
13,294 2.54
Bermuda (0.00%)
Oil and Gas Services
48,638 Archer Ltd ........................... 25 0.00
Czech Republic (0.21%)
Electric Utilities
70,175 CEZ AS ............................... 1,088 0.21
Denmark (1.66%)
Banks
75,155 Danske Bank A/S ................ 1,866 0.36
Biotechnology
12,010
Bavarian Nordic
A/S ...................................... 395 0.08
Commercial Services and Supplies
10,552 ISS A/S ................................ 372 0.07
Holding Companies - Diversified Operations
2,824 Schouw & Co ...................... 155 0.03
Pharmaceuticals
96,416 Novo Nordisk A/S ............... 4,597 0.88
Number
of Shares
Fair Value
EUR ‘000
Fund
%
Telecommunications
53,900 TDC A/S ............................. 232 0.04
Transport
814 AP Moeller - Maersk A/S ... 939 0.18
3,979 Dfds A/S ............................. 127 0.02
8,683 1.66
Finland (1.01%)
Machinery
46,868 Kone OYJ ........................... 1,985 0.38
Pharmaceuticals
10,779 Orion OYJ .......................... 313 0.06
Telecommunications
12,427 Elisa OYJ ............................ 425 0.08
491,145 Nokia OYJ .......................... 2,566 0.49
5,289 1.01
France (15.57%)
Advertising
47,501 Publicis Groupe SA ............ 2,931 0.56
Aerospace and Defence
1,650 Dassault Aviation SA ......... 1,740 0.33
18,230 Safran SA ............................ 1,121 0.22
Auto Components
2,920
Cie Generale des
Etablissements Michelin ..... 263 0.05
54,042 Faurecia .............................. 1,799 0.35
15,344 Valeo SA ............................ 2,099 0.40
Automobiles
62,890 Peugeot SA ......................... 947 0.18
43,465 Renault SA .......................... 3,795 0.73
Banks
127,582 BNP Paribas SA .................. 5,643 1.08
121,181 Credit Agricole SA ............. 1,153 0.22
40,710 Societe Generale SA ........... 1,322 0.25
Biotechnology
9,810 Cellectis SA ........................ 235 0.04
72,807 Innate Pharma SA ............... 886 0.17
Building Products
79,396 Cie de Saint-Gobain ............ 3,075 0.59
Commercial Services and Supplies
38,786 Bureau Veritas SA .............. 759 0.14
20,428 Edenred ............................... 349 0.07
38,944 Elior Group ......................... 750 0.14
24,585 Sodexo SA .......................... 2,329 0.45
Computers and Peripherals
7,050 Atos SE ............................... 505 0.10
11,565 Cap Gemini SA ................... 955 0.18
Construction and Engineering
60,150 Bouygues SA ...................... 2,156 0.41
2,848
Gaztransport Et Technigaz
SA ....................................... 82 0.02
19,590 Vinci SA ............................. 1,283 0.24
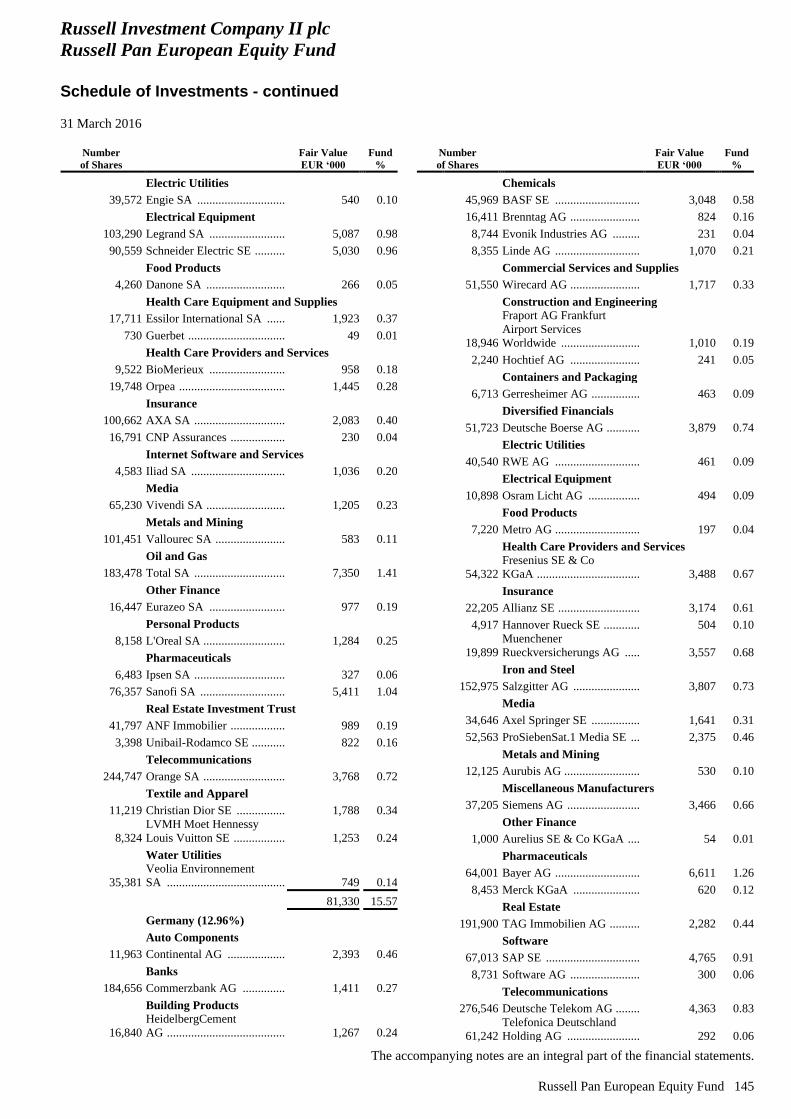
Russell Investment Company II plc
Russell Pan European Equity Fund
Schedule of Investments - continued
31 March 2016
The accompanying notes are an integral part of the financial statements.
Russell Pan European Equity Fund 145
Number
of Shares
Fair Value
EUR ‘000
Fund
%
Electric Utilities
39,572 Engie SA ............................. 540 0.10
Electrical Equipment
103,290 Legrand SA ......................... 5,087 0.98
90,559 Schneider Electric SE .......... 5,030 0.96
Food Products
4,260 Danone SA .......................... 266 0.05
Health Care Equipment and Supplies
17,711 Essilor International SA ...... 1,923 0.37
730 Guerbet ................................ 49 0.01
Health Care Providers and Services
9,522 BioMerieux ......................... 958 0.18
19,748 Orpea ................................... 1,445 0.28
Insurance
100,662 AXA SA .............................. 2,083 0.40
16,791 CNP Assurances .................. 230 0.04
Internet Software and Services
4,583 Iliad SA ............................... 1,036 0.20
Media
65,230 Vivendi SA .......................... 1,205 0.23
Metals and Mining
101,451 Vallourec SA ....................... 583 0.11
Oil and Gas
183,478 Total SA .............................. 7,350 1.41
Other Finance
16,447 Eurazeo SA ......................... 977 0.19
Personal Products
8,158 L'Oreal SA ........................... 1,284 0.25
Pharmaceuticals
6,483 Ipsen SA .............................. 327 0.06
76,357 Sanofi SA ............................ 5,411 1.04
Real Estate Investment Trust
41,797 ANF Immobilier .................. 989 0.19
3,398 Unibail-Rodamco SE ........... 822 0.16
Telecommunications
244,747 Orange SA ........................... 3,768 0.72
Textile and Apparel
11,219 Christian Dior SE ................ 1,788 0.34
8,324
LVMH Moet Hennessy
Louis Vuitton SE ................. 1,253 0.24
Water Utilities
35,381
Veolia Environnement
SA ....................................... 749 0.14
81,330 15.57
Germany (12.96%)
Auto Components
11,963 Continental AG ................... 2,393 0.46
Banks
184,656 Commerzbank AG .............. 1,411 0.27
Building Products
16,840
HeidelbergCement
AG ....................................... 1,267 0.24
Number
of Shares
Fair Value
EUR ‘000
Fund
%
Chemicals
45,969 BASF SE ............................ 3,048 0.58
16,411 Brenntag AG ....................... 824 0.16
8,744 Evonik Industries AG ......... 231 0.04
8,355 Linde AG ............................ 1,070 0.21
Commercial Services and Supplies
51,550 Wirecard AG ....................... 1,717 0.33
Construction and Engineering
18,946
Fraport AG Frankfurt
Airport Services
Worldwide .......................... 1,010 0.19
2,240 Hochtief AG ....................... 241 0.05
Containers and Packaging
6,713 Gerresheimer AG ................ 463 0.09
Diversified Financials
51,723 Deutsche Boerse AG ........... 3,879 0.74
Electric Utilities
40,540 RWE AG ............................ 461 0.09
Electrical Equipment
10,898 Osram Licht AG ................. 494 0.09
Food Products
7,220 Metro AG ............................ 197 0.04
Health Care Providers and Services
54,322
Fresenius SE & Co
KGaA .................................. 3,488 0.67
Insurance
22,205 Allianz SE ........................... 3,174 0.61
4,917 Hannover Rueck SE ............ 504 0.10
19,899
Muenchener
Rueckversicherungs AG ..... 3,557 0.68
Iron and Steel
152,975 Salzgitter AG ...................... 3,807 0.73
Media
34,646 Axel Springer SE ................ 1,641 0.31
52,563 ProSiebenSat.1 Media SE ... 2,375 0.46
Metals and Mining
12,125 Aurubis AG ......................... 530 0.10
Miscellaneous Manufacturers
37,205 Siemens AG ........................ 3,466 0.66
Other Finance
1,000 Aurelius SE & Co KGaA .... 54 0.01
Pharmaceuticals
64,001 Bayer AG ............................ 6,611 1.26
8,453 Merck KGaA ...................... 620 0.12
Real Estate
191,900 TAG Immobilien AG .......... 2,282 0.44
Software
67,013 SAP SE ............................... 4,765 0.91
8,731 Software AG ....................... 300 0.06
Telecommunications
276,546 Deutsche Telekom AG ........ 4,363 0.83
61,242
Telefonica Deutschland
Holding AG ........................ 292 0.06
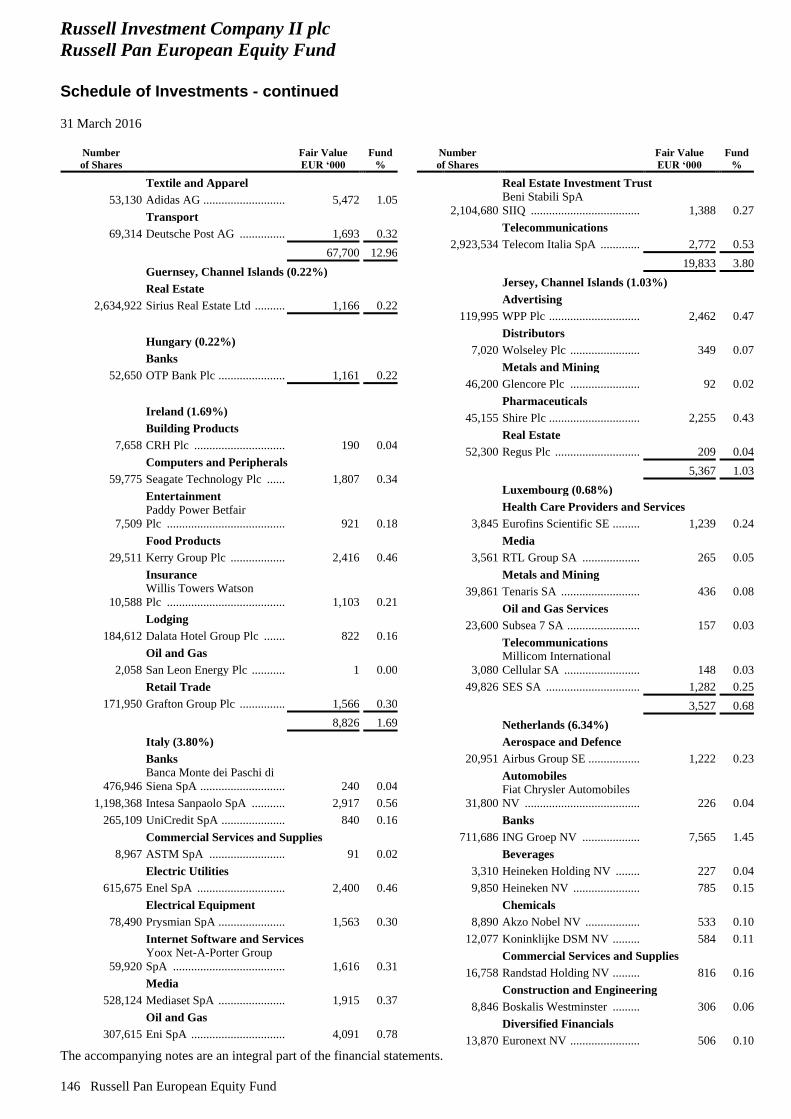
Russell Investment Company II plc
Russell Pan European Equity Fund
Schedule of Investments - continued
31 March 2016
The accompanying notes are an integral part of the financial statements.
146 Russell Pan European Equity Fund
Number
of Shares
Fair Value
EUR ‘000
Fund
%
Textile and Apparel
53,130 Adidas AG ........................... 5,472 1.05
Transport
69,314 Deutsche Post AG ............... 1,693 0.32
67,700 12.96
Guernsey, Channel Islands (0.22%)
Real Estate
2,634,922 Sirius Real Estate Ltd .......... 1,166 0.22
Hungary (0.22%)
Banks
52,650 OTP Bank Plc ...................... 1,161 0.22
Ireland (1.69%)
Building Products
7,658 CRH Plc .............................. 190 0.04
Computers and Peripherals
59,775 Seagate Technology Plc ...... 1,807 0.34
Entertainment
7,509
Paddy Power Betfair
Plc ....................................... 921 0.18
Food Products
29,511 Kerry Group Plc .................. 2,416 0.46
Insurance
10,588
Willis Towers Watson
Plc ....................................... 1,103 0.21
Lodging
184,612 Dalata Hotel Group Plc ....... 822 0.16
Oil and Gas
2,058 San Leon Energy Plc ........... 1 0.00
Retail Trade
171,950 Grafton Group Plc ............... 1,566 0.30
8,826 1.69
Italy (3.80%)
Banks
476,946
Banca Monte dei Paschi di
Siena SpA ............................ 240 0.04
1,198,368 Intesa Sanpaolo SpA ........... 2,917 0.56
265,109 UniCredit SpA ..................... 840 0.16
Commercial Services and Supplies
8,967 ASTM SpA ......................... 91 0.02
Electric Utilities
615,675 Enel SpA ............................. 2,400 0.46
Electrical Equipment
78,490 Prysmian SpA ...................... 1,563 0.30
Internet Software and Services
59,920
Yoox Net-A-Porter Group
SpA ..................................... 1,616 0.31
Media
528,124 Mediaset SpA ...................... 1,915 0.37
Oil and Gas
307,615 Eni SpA ............................... 4,091 0.78
Number
of Shares
Fair Value
EUR ‘000
Fund
%
Real Estate Investment Trust
2,104,680
Beni Stabili SpA
SIIQ .................................... 1,388 0.27
Telecommunications
2,923,534 Telecom Italia SpA ............. 2,772 0.53
19,833 3.80
Jersey, Channel Islands (1.03%)
Advertising
119,995 WPP Plc .............................. 2,462 0.47
Distributors
7,020 Wolseley Plc ....................... 349 0.07
Metals and Mining
46,200 Glencore Plc ....................... 92 0.02
Pharmaceuticals
45,155 Shire Plc .............................. 2,255 0.43
Real Estate
52,300 Regus Plc ............................ 209 0.04
5,367 1.03
Luxembourg (0.68%)
Health Care Providers and Services
3,845 Eurofins Scientific SE ......... 1,239 0.24
Media
3,561 RTL Group SA ................... 265 0.05
Metals and Mining
39,861 Tenaris SA .......................... 436 0.08
Oil and Gas Services
23,600 Subsea 7 SA ........................ 157 0.03
Telecommunications
3,080
Millicom International
Cellular SA ......................... 148 0.03
49,826 SES SA ............................... 1,282 0.25
3,527 0.68
Netherlands (6.34%)
Aerospace and Defence
20,951 Airbus Group SE ................. 1,222 0.23
Automobiles
31,800
Fiat Chrysler Automobiles
NV ...................................... 226 0.04
Banks
711,686 ING Groep NV ................... 7,565 1.45
Beverages
3,310 Heineken Holding NV ........ 227 0.04
9,850 Heineken NV ...................... 785 0.15
Chemicals
8,890 Akzo Nobel NV .................. 533 0.10
12,077 Koninklijke DSM NV ......... 584 0.11
Commercial Services and Supplies
16,758 Randstad Holding NV ......... 816 0.16
Construction and Engineering
8,846 Boskalis Westminster ......... 306 0.06
Diversified Financials
13,870 Euronext NV ....................... 506 0.10
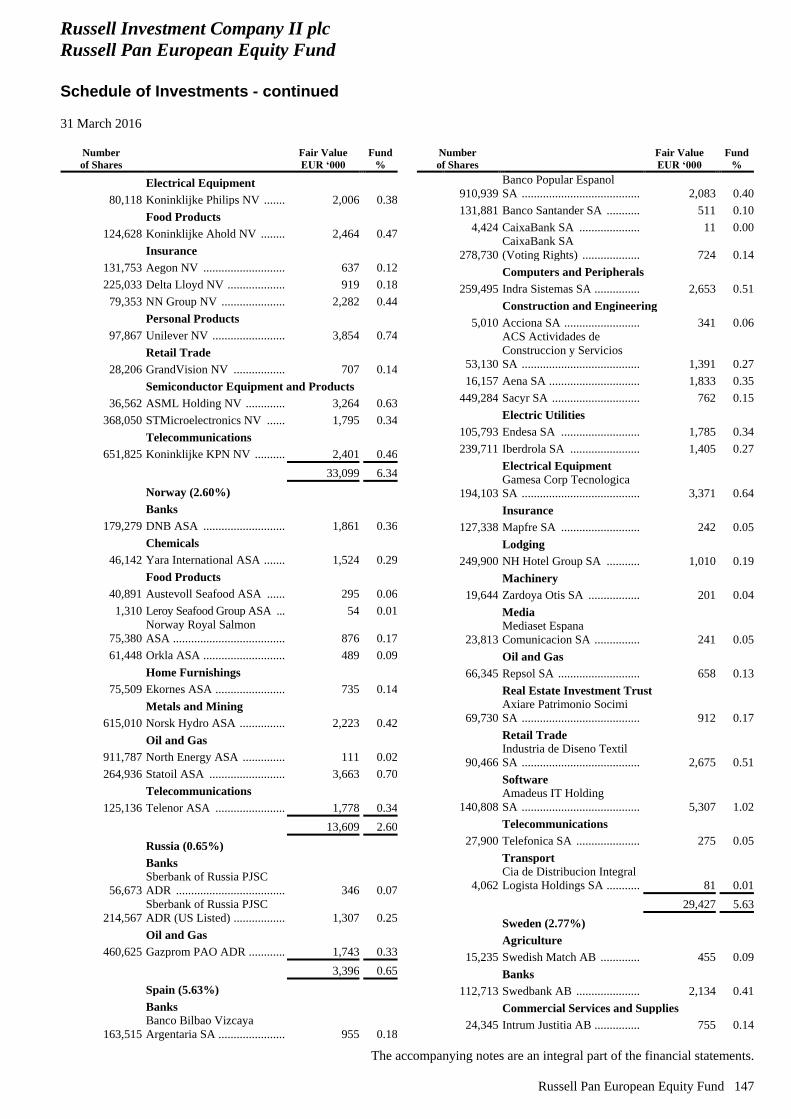
Russell Investment Company II plc
Russell Pan European Equity Fund
Schedule of Investments - continued
31 March 2016
The accompanying notes are an integral part of the financial statements.
Russell Pan European Equity Fund 147
Number
of Shares
Fair Value
EUR ‘000
Fund
%
Electrical Equipment
80,118 Koninklijke Philips NV ....... 2,006 0.38
Food Products
124,628 Koninklijke Ahold NV ........ 2,464 0.47
Insurance
131,753 Aegon NV ........................... 637 0.12
225,033 Delta Lloyd NV ................... 919 0.18
79,353 NN Group NV ..................... 2,282 0.44
Personal Products
97,867 Unilever NV ........................ 3,854 0.74
Retail Trade
28,206 GrandVision NV ................. 707 0.14
Semiconductor Equipment and Products
36,562 ASML Holding NV ............. 3,264 0.63
368,050 STMicroelectronics NV ...... 1,795 0.34
Telecommunications
651,825 Koninklijke KPN NV .......... 2,401 0.46
33,099 6.34
Norway (2.60%)
Banks
179,279 DNB ASA ........................... 1,861 0.36
Chemicals
46,142 Yara International ASA ....... 1,524 0.29
Food Products
40,891 Austevoll Seafood ASA ...... 295 0.06
1,310 Leroy Seafood Group ASA ... 54 0.01
75,380
Norway Royal Salmon
ASA ..................................... 876 0.17
61,448 Orkla ASA ........................... 489 0.09
Home Furnishings
75,509 Ekornes ASA ....................... 735 0.14
Metals and Mining
615,010 Norsk Hydro ASA ............... 2,223 0.42
Oil and Gas
911,787 North Energy ASA .............. 111 0.02
264,936 Statoil ASA ......................... 3,663 0.70
Telecommunications
125,136 Telenor ASA ....................... 1,778 0.34
13,609 2.60
Russia (0.65%)
Banks
56,673
Sberbank of Russia PJSC
ADR .................................... 346 0.07
214,567
Sberbank of Russia PJSC
ADR (US Listed) ................. 1,307 0.25
Oil and Gas
460,625 Gazprom PAO ADR ............ 1,743 0.33
3,396 0.65
Spain (5.63%)
Banks
163,515
Banco Bilbao Vizcaya
Argentaria SA ...................... 955 0.18
Number
of Shares
Fair Value
EUR ‘000
Fund
%
910,939
Banco Popular Espanol
SA ....................................... 2,083 0.40
131,881 Banco Santander SA ........... 511 0.10
4,424 CaixaBank SA .................... 11 0.00
278,730
CaixaBank SA
(Voting Rights) ................... 724 0.14
Computers and Peripherals
259,495 Indra Sistemas SA ............... 2,653 0.51
Construction and Engineering
5,010 Acciona SA ......................... 341 0.06
53,130
ACS Actividades de
Construccion y Servicios
SA ....................................... 1,391 0.27
16,157 Aena SA .............................. 1,833 0.35
449,284 Sacyr SA ............................. 762 0.15
Electric Utilities
105,793 Endesa SA .......................... 1,785 0.34
239,711 Iberdrola SA ....................... 1,405 0.27
Electrical Equipment
194,103
Gamesa Corp Tecnologica
SA ....................................... 3,371 0.64
Insurance
127,338 Mapfre SA .......................... 242 0.05
Lodging
249,900 NH Hotel Group SA ........... 1,010 0.19
Machinery
19,644 Zardoya Otis SA ................. 201 0.04
Media
23,813
Mediaset Espana
Comunicacion SA ............... 241 0.05
Oil and Gas
66,345 Repsol SA ........................... 658 0.13
Real Estate Investment Trust
69,730
Axiare Patrimonio Socimi
SA ....................................... 912 0.17
Retail Trade
90,466
Industria de Diseno Textil
SA ....................................... 2,675 0.51
Software
140,808
Amadeus IT Holding
SA ....................................... 5,307 1.02
Telecommunications
27,900 Telefonica SA ..................... 275 0.05
Transport
4,062
Cia de Distribucion Integral
Logista Holdings SA ........... 81 0.01
29,427 5.63
Sweden (2.77%)
Agriculture
15,235 Swedish Match AB ............. 455 0.09
Banks
112,713 Swedbank AB ..................... 2,134 0.41
Commercial Services and Supplies
24,345 Intrum Justitia AB ............... 755 0.14
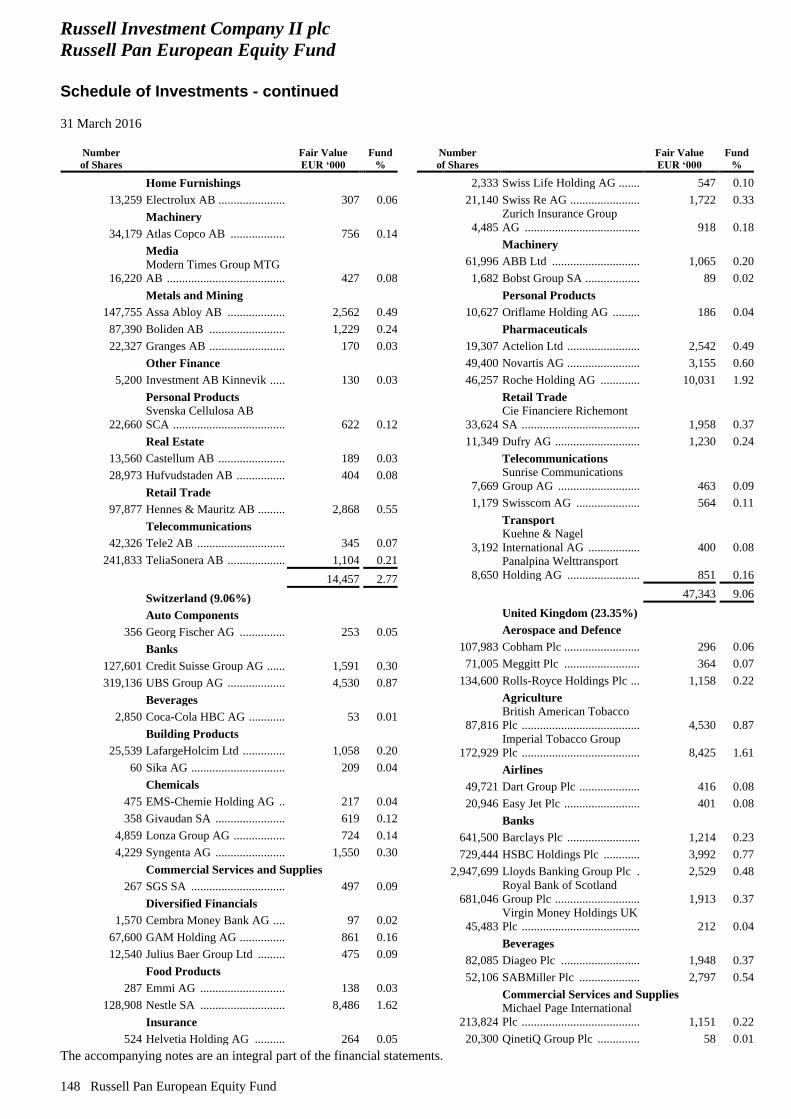
Russell Investment Company II plc
Russell Pan European Equity Fund
Schedule of Investments - continued
31 March 2016
The accompanying notes are an integral part of the financial statements.
148 Russell Pan European Equity Fund
Number
of Shares
Fair Value
EUR ‘000
Fund
%
Home Furnishings
13,259 Electrolux AB ...................... 307 0.06
Machinery
34,179 Atlas Copco AB .................. 756 0.14
Media
16,220
Modern Times Group MTG
AB ....................................... 427 0.08
Metals and Mining
147,755 Assa Abloy AB ................... 2,562 0.49
87,390 Boliden AB ......................... 1,229 0.24
22,327 Granges AB ......................... 170 0.03
Other Finance
5,200 Investment AB Kinnevik ..... 130 0.03
Personal Products
22,660
Svenska Cellulosa AB
SCA ..................................... 622 0.12
Real Estate
13,560 Castellum AB ...................... 189 0.03
28,973 Hufvudstaden AB ................ 404 0.08
Retail Trade
97,877 Hennes & Mauritz AB ......... 2,868 0.55
Telecommunications
42,326 Tele2 AB ............................. 345 0.07
241,833 TeliaSonera AB ................... 1,104 0.21
14,457 2.77
Switzerland (9.06%)
Auto Components
356 Georg Fischer AG ............... 253 0.05
Banks
127,601 Credit Suisse Group AG ...... 1,591 0.30
319,136 UBS Group AG ................... 4,530 0.87
Beverages
2,850 Coca-Cola HBC AG ............ 53 0.01
Building Products
25,539 LafargeHolcim Ltd .............. 1,058 0.20
60 Sika AG ............................... 209 0.04
Chemicals
475 EMS-Chemie Holding AG .. 217 0.04
358 Givaudan SA ....................... 619 0.12
4,859 Lonza Group AG ................. 724 0.14
4,229 Syngenta AG ....................... 1,550 0.30
Commercial Services and Supplies
267 SGS SA ............................... 497 0.09
Diversified Financials
1,570 Cembra Money Bank AG .... 97 0.02
67,600 GAM Holding AG ............... 861 0.16
12,540 Julius Baer Group Ltd ......... 475 0.09
Food Products
287 Emmi AG ............................ 138 0.03
128,908 Nestle SA ............................ 8,486 1.62
Insurance
524 Helvetia Holding AG .......... 264 0.05
Number
of Shares
Fair Value
EUR ‘000
Fund
%
2,333 Swiss Life Holding AG ....... 547 0.10
21,140 Swiss Re AG ....................... 1,722 0.33
4,485
Zurich Insurance Group
AG ...................................... 918 0.18
Machinery
61,996 ABB Ltd ............................. 1,065 0.20
1,682 Bobst Group SA .................. 89 0.02
Personal Products
10,627 Oriflame Holding AG ......... 186 0.04
Pharmaceuticals
19,307 Actelion Ltd ........................ 2,542 0.49
49,400 Novartis AG ........................ 3,155 0.60
46,257 Roche Holding AG ............. 10,031 1.92
Retail Trade
33,624
Cie Financiere Richemont
SA ....................................... 1,958 0.37
11,349 Dufry AG ............................ 1,230 0.24
Telecommunications
7,669
Sunrise Communications
Group AG ........................... 463 0.09
1,179 Swisscom AG ..................... 564 0.11
Transport
3,192
Kuehne & Nagel
International AG ................. 400 0.08
8,650
Panalpina Welttransport
Holding AG ........................ 851 0.16
47,343 9.06
United Kingdom (23.35%)
Aerospace and Defence
107,983 Cobham Plc ......................... 296 0.06
71,005 Meggitt Plc ......................... 364 0.07
134,600 Rolls-Royce Holdings Plc ... 1,158 0.22
Agriculture
87,816
British American Tobacco
Plc ....................................... 4,530 0.87
172,929
Imperial Tobacco Group
Plc ....................................... 8,425 1.61
Airlines
49,721 Dart Group Plc .................... 416 0.08
20,946 Easy Jet Plc ......................... 401 0.08
Banks
641,500 Barclays Plc ........................ 1,214 0.23
729,444 HSBC Holdings Plc ............ 3,992 0.77
2,947,699 Lloyds Banking Group Plc . 2,529 0.48
681,046
Royal Bank of Scotland
Group Plc ............................ 1,913 0.37
45,483
Virgin Money Holdings UK
Plc ....................................... 212 0.04
Beverages
82,085 Diageo Plc .......................... 1,948 0.37
52,106 SABMiller Plc .................... 2,797 0.54
Commercial Services and Supplies
213,824
Michael Page International
Plc ....................................... 1,151 0.22
20,300 QinetiQ Group Plc .............. 58 0.01
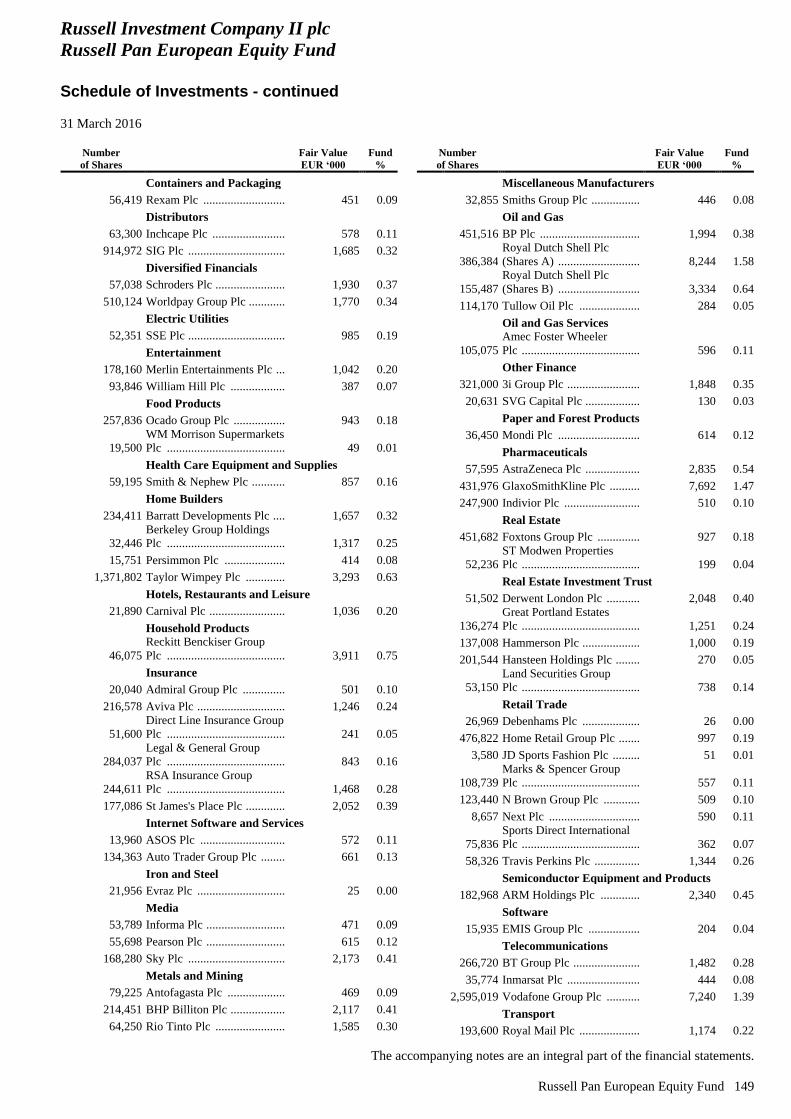
Russell Investment Company II plc
Russell Pan European Equity Fund
Schedule of Investments - continued
31 March 2016
The accompanying notes are an integral part of the financial statements.
Russell Pan European Equity Fund 149
Number
of Shares
Fair Value
EUR ‘000
Fund
%
Containers and Packaging
56,419 Rexam Plc ........................... 451 0.09
Distributors
63,300 Inchcape Plc ........................ 578 0.11
914,972 SIG Plc ................................ 1,685 0.32
Diversified Financials
57,038 Schroders Plc ....................... 1,930 0.37
510,124 Worldpay Group Plc ............ 1,770 0.34
Electric Utilities
52,351 SSE Plc ................................ 985 0.19
Entertainment
178,160 Merlin Entertainments Plc ... 1,042 0.20
93,846 William Hill Plc .................. 387 0.07
Food Products
257,836 Ocado Group Plc ................. 943 0.18
19,500
WM Morrison Supermarkets
Plc ....................................... 49 0.01
Health Care Equipment and Supplies
59,195 Smith & Nephew Plc ........... 857 0.16
Home Builders
234,411 Barratt Developments Plc .... 1,657 0.32
32,446
Berkeley Group Holdings
Plc ....................................... 1,317 0.25
15,751 Persimmon Plc .................... 414 0.08
1,371,802 Taylor Wimpey Plc ............. 3,293 0.63
Hotels, Restaurants and Leisure
21,890 Carnival Plc ......................... 1,036 0.20
Household Products
46,075
Reckitt Benckiser Group
Plc ....................................... 3,911 0.75
Insurance
20,040 Admiral Group Plc .............. 501 0.10
216,578 Aviva Plc ............................. 1,246 0.24
51,600
Direct Line Insurance Group
Plc ....................................... 241 0.05
284,037
Legal & General Group
Plc ....................................... 843 0.16
244,611
RSA Insurance Group
Plc ....................................... 1,468 0.28
177,086 St James's Place Plc ............. 2,052 0.39
Internet Software and Services
13,960 ASOS Plc ............................ 572 0.11
134,363 Auto Trader Group Plc ........ 661 0.13
Iron and Steel
21,956 Evraz Plc ............................. 25 0.00
Media
53,789 Informa Plc .......................... 471 0.09
55,698 Pearson Plc .......................... 615 0.12
168,280 Sky Plc ................................ 2,173 0.41
Metals and Mining
79,225 Antofagasta Plc ................... 469 0.09
214,451 BHP Billiton Plc .................. 2,117 0.41
64,250 Rio Tinto Plc ....................... 1,585 0.30
Number
of Shares
Fair Value
EUR ‘000
Fund
%
Miscellaneous Manufacturers
32,855 Smiths Group Plc ................ 446 0.08
Oil and Gas
451,516 BP Plc ................................. 1,994 0.38
386,384
Royal Dutch Shell Plc
(Shares A) ........................... 8,244 1.58
155,487
Royal Dutch Shell Plc
(Shares B) ........................... 3,334 0.64
114,170 Tullow Oil Plc .................... 284 0.05
Oil and Gas Services
105,075
Amec Foster Wheeler
Plc ....................................... 596 0.11
Other Finance
321,000 3i Group Plc ........................ 1,848 0.35
20,631 SVG Capital Plc .................. 130 0.03
Paper and Forest Products
36,450 Mondi Plc ........................... 614 0.12
Pharmaceuticals
57,595 AstraZeneca Plc .................. 2,835 0.54
431,976 GlaxoSmithKline Plc .......... 7,692 1.47
247,900 Indivior Plc ......................... 510 0.10
Real Estate
451,682 Foxtons Group Plc .............. 927 0.18
52,236
ST Modwen Properties
Plc ....................................... 199 0.04
Real Estate Investment Trust
51,502 Derwent London Plc ........... 2,048 0.40
136,274
Great Portland Estates
Plc ....................................... 1,251 0.24
137,008 Hammerson Plc ................... 1,000 0.19
201,544 Hansteen Holdings Plc ........ 270 0.05
53,150
Land Securities Group
Plc ....................................... 738 0.14
Retail Trade
26,969 Debenhams Plc ................... 26 0.00
476,822 Home Retail Group Plc ....... 997 0.19
3,580 JD Sports Fashion Plc ......... 51 0.01
108,739
Marks & Spencer Group
Plc ....................................... 557 0.11
123,440 N Brown Group Plc ............ 509 0.10
8,657 Next Plc .............................. 590 0.11
75,836
Sports Direct International
Plc ....................................... 362 0.07
58,326 Travis Perkins Plc ............... 1,344 0.26
Semiconductor Equipment and Products
182,968 ARM Holdings Plc ............. 2,340 0.45
Software
15,935 EMIS Group Plc ................. 204 0.04
Telecommunications
266,720 BT Group Plc ...................... 1,482 0.28
35,774 Inmarsat Plc ........................ 444 0.08
2,595,019 Vodafone Group Plc ........... 7,240 1.39
Transport
193,600 Royal Mail Plc .................... 1,174 0.22
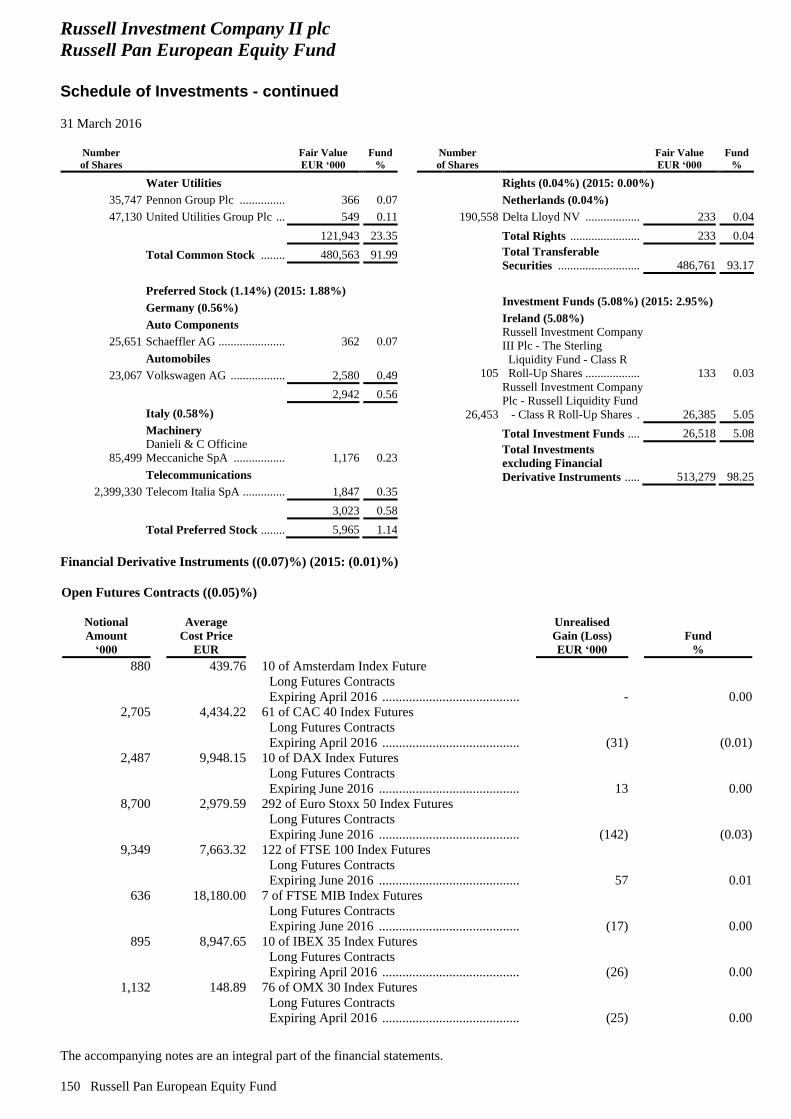
Russell Investment Company II plc
Russell Pan European Equity Fund
Schedule of Investments - continued
31 March 2016
The accompanying notes are an integral part of the financial statements.
150 Russell Pan European Equity Fund
Number
of Shares
Fair Value
EUR ‘000
Fund
%
Water Utilities
35,747 Pennon Group Plc ............... 366 0.07
47,130 United Utilities Group Plc ... 549 0.11
121,943 23.35
Total Common Stock ........ 480,563 91.99
Preferred Stock (1.14%) (2015: 1.88%)
Germany (0.56%)
Auto Components
25,651 Schaeffler AG ...................... 362 0.07
Automobiles
23,067 Volkswagen AG .................. 2,580 0.49
2,942 0.56
Italy (0.58%)
Machinery
85,499
Danieli & C Officine
Meccaniche SpA ................. 1,176 0.23
Telecommunications
2,399,330 Telecom Italia SpA .............. 1,847 0.35
3,023 0.58
Total Preferred Stock ........ 5,965 1.14
Number
of Shares
Fair Value
EUR ‘000
Fund
%
Rights (0.04%) (2015: 0.00%)
Netherlands (0.04%)
190,558 Delta Lloyd NV .................. 233 0.04
Total Rights ....................... 233 0.04
Total Transferable
Securities ........................... 486,761 93.17
Investment Funds (5.08%) (2015: 2.95%)
Ireland (5.08%)
105
Russell Investment Company
III Plc - The Sterling
Liquidity Fund - Class R
Roll-Up Shares .................. 133 0.03
26,453
Russell Investment Company
Plc - Russell Liquidity Fund
- Class R Roll-Up Shares . 26,385 5.05
Total Investment Funds .... 26,518 5.08
Total Investments
excluding Financial
Derivative Instruments ..... 513,279 98.25
Financial Derivative Instruments ((0.07)%) (2015: (0.01)%)
Open Futures Contracts ((0.05)%)
Notional
Amount
‘000
Average
Cost Price
EUR
Unrealised
Gain (Loss)
EUR ‘000
Fund
%
880
439.76
10 of Amsterdam Index Future
Long Futures Contracts
Expiring April 2016 .................................................. - 0.00
2,705
4,434.22
61 of CAC 40 Index Futures
Long Futures Contracts
Expiring April 2016 .................................................. (31) (0.01)
2,487
9,948.15
10 of DAX Index Futures
Long Futures Contracts
Expiring June 2016 ................................................... 13 0.00
8,700
2,979.59
292 of Euro Stoxx 50 Index Futures
Long Futures Contracts
Expiring June 2016 ................................................... (142) (0.03)
9,349
7,663.32
122 of FTSE 100 Index Futures
Long Futures Contracts
Expiring June 2016 ................................................... 57 0.01
636
18,180.00
7 of FTSE MIB Index Futures
Long Futures Contracts
Expiring June 2016 ................................................... (17) 0.00
895
8,947.65
10 of IBEX 35 Index Futures
Long Futures Contracts
Expiring April 2016 .................................................. (26) 0.00
1,132
148.89
76 of OMX 30 Index Futures
Long Futures Contracts
Expiring April 2016 .................................................. (25) 0.00
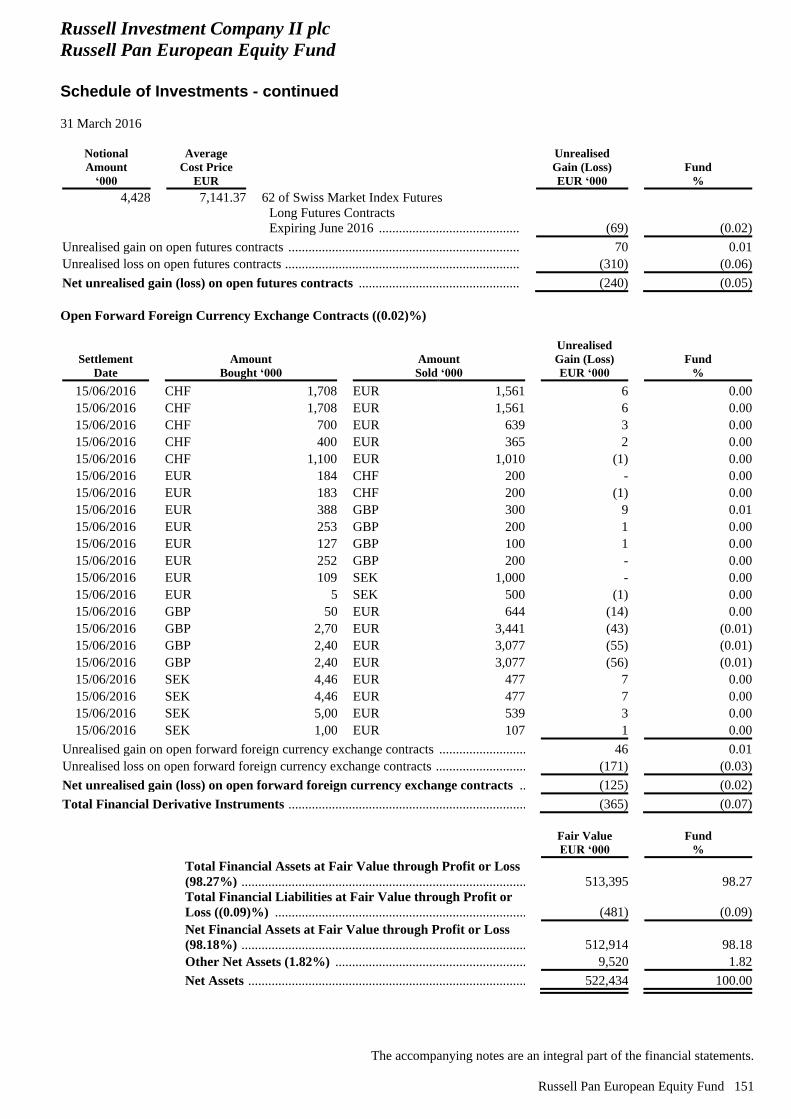
Russell Investment Company II plc
Russell Pan European Equity Fund
Schedule of Investments - continued
31 March 2016
The accompanying notes are an integral part of the financial statements.
Russell Pan European Equity Fund 151
Notional
Amount
‘000
Average
Cost Price
EUR
Unrealised
Gain (Loss)
EUR ‘000
Fund
%
4,428
7,141.37
62 of Swiss Market Index Futures
Long Futures Contracts
Expiring June 2016 ................................................... (69) (0.02)
Unrealised gain on open futures contracts ......................................................................... 70 0.01
Unrealised loss on open futures contracts .......................................................................... (310) (0.06)
Net unrealised gain (loss) on open futures contracts .................................................... (240) (0.05)
Open Forward Foreign Currency Exchange Contracts ((0.02)%)
Settlement
Date
Amount
Bought ‘000
Amount
Sold ‘000
Unrealised
Gain (Loss)
EUR ‘000
Fund
%
15/06/2016 CHF 1,708 EUR 1,561 6 0.00
15/06/2016 CHF 1,708 EUR 1,561 6 0.00
15/06/2016 CHF 700 EUR 639 3 0.00
15/06/2016 CHF 400 EUR 365 2 0.00
15/06/2016 CHF 1,100 EUR 1,010 (1) 0.00
15/06/2016 EUR 184 CHF 200 - 0.00
15/06/2016 EUR 183 CHF 200 (1) 0.00
15/06/2016 EUR 388 GBP 300 9 0.01
15/06/2016 EUR 253 GBP 200 1 0.00
15/06/2016 EUR 127 GBP 100 1 0.00
15/06/2016 EUR 252 GBP 200 - 0.00
15/06/2016 EUR 109 SEK 1,000 - 0.00
15/06/2016 EUR 54 SEK 500 (1) 0.00
15/06/2016 GBP 500 EUR 644 (14) 0.00
15/06/2016 GBP 2,700 EUR 3,441 (43) (0.01)
15/06/2016 GBP 2,400 EUR 3,077 (55) (0.01)
15/06/2016 GBP 2,400 EUR 3,077 (56) (0.01)
15/06/2016 SEK 4,469 EUR 477 7 0.00
15/06/2016 SEK 4,469 EUR 477 7 0.00
15/06/2016 SEK 5,000 EUR 539 3 0.00
15/06/2016 SEK 1,000 EUR 107 1 0.00
Unrealised gain on open forward foreign currency exchange contracts ............................... 46 0.01
Unrealised loss on open forward foreign currency exchange contracts ................................ (171) (0.03)
Net unrealised gain (loss) on open forward foreign currency exchange contracts ....... (125) (0.02)
Total Financial Derivative Instruments ............................................................................ (365) (0.07)
Fair Value
EUR ‘000
Fund
%
Total Financial Assets at Fair Value through Profit or Loss
(98.27%) ....................................................................................................................................................... 513,395 98.27
Total Financial Liabilities at Fair Value through Profit or
Loss ((0.09)%) ............................................................................................................................................. (481) (0.09)
Net Financial Assets at Fair Value through Profit or Loss
(98.18%) .................................................................................................................................................... 512,914
98.18
Other Net Assets (1.82%) ........................................................................................................................ 9,520 1.82
Net Assets .................................................................................................................................................. 522,434 100.00
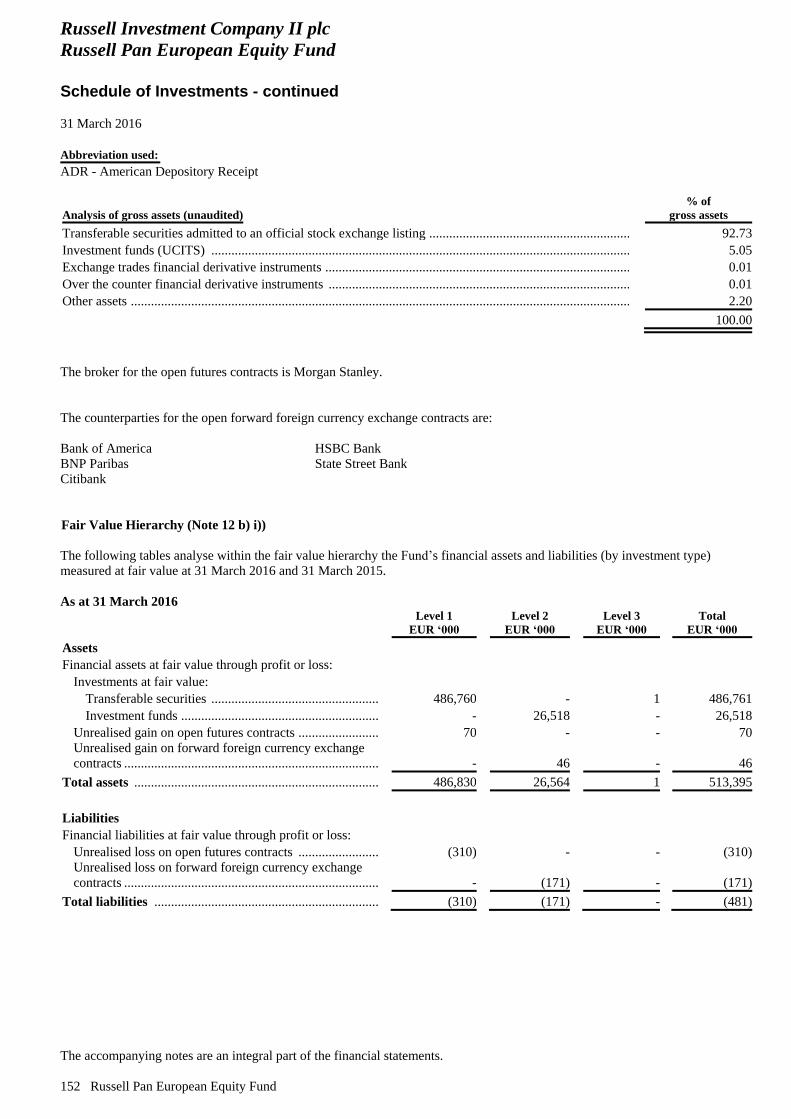
Russell Investment Company II plc
Russell Pan European Equity Fund
Schedule of Investments - continued
31 March 2016
The accompanying notes are an integral part of the financial statements.
152 Russell Pan European Equity Fund
Abbreviation used:
ADR - American Depository Receipt
Analysis of gross assets (unaudited)
% of
gross assets
Transferable securities admitted to an official stock exchange listing ...................................................................... 92.73
Investment funds (UCITS) ....................................................................................................................................... 5.05
Exchange trades financial derivative instruments ..................................................................................................... 0.01
Over the counter financial derivative instruments .................................................................................................... 0.01
Other assets ............................................................................................................................................................... 2.20
100.00
The broker for the open futures contracts is Morgan Stanley.
The counterparties for the open forward foreign currency exchange contracts are:
Bank of America
BNP Paribas
Citibank
HSBC Bank
State Street Bank
Fair Value Hierarchy (Note 12 b) i))
The following tables analyse within the fair value hierarchy the Fund’s financial assets and liabilities (by investment type)
measured at fair value at 31 March 2016 and 31 March 2015.
As at 31 March 2016
Level 1
EUR ‘000
Level 2
EUR ‘000
Level 3
EUR ‘000
Total
EUR ‘000
Assets
Financial assets at fair value through profit or loss:
Investments at fair value:
Transferable securities ............................................................... 486,760 - 1 486,761
Investment funds ........................................................................ - 26,518 - 26,518
Unrealised gain on open futures contracts ................................. 70 - - 70
Unrealised gain on forward foreign currency exchange
contracts ..................................................................................... - 46 - 46
Total assets ...................................................................................... 486,830 26,564 1 513,395
Liabilities
Financial liabilities at fair value through profit or loss:
Unrealised loss on open futures contracts ................................. (310) - - (310)
Unrealised loss on forward foreign currency exchange
contracts ..................................................................................... - (171) - (171)
Total liabilities ................................................................................ (310) (171) - (481)
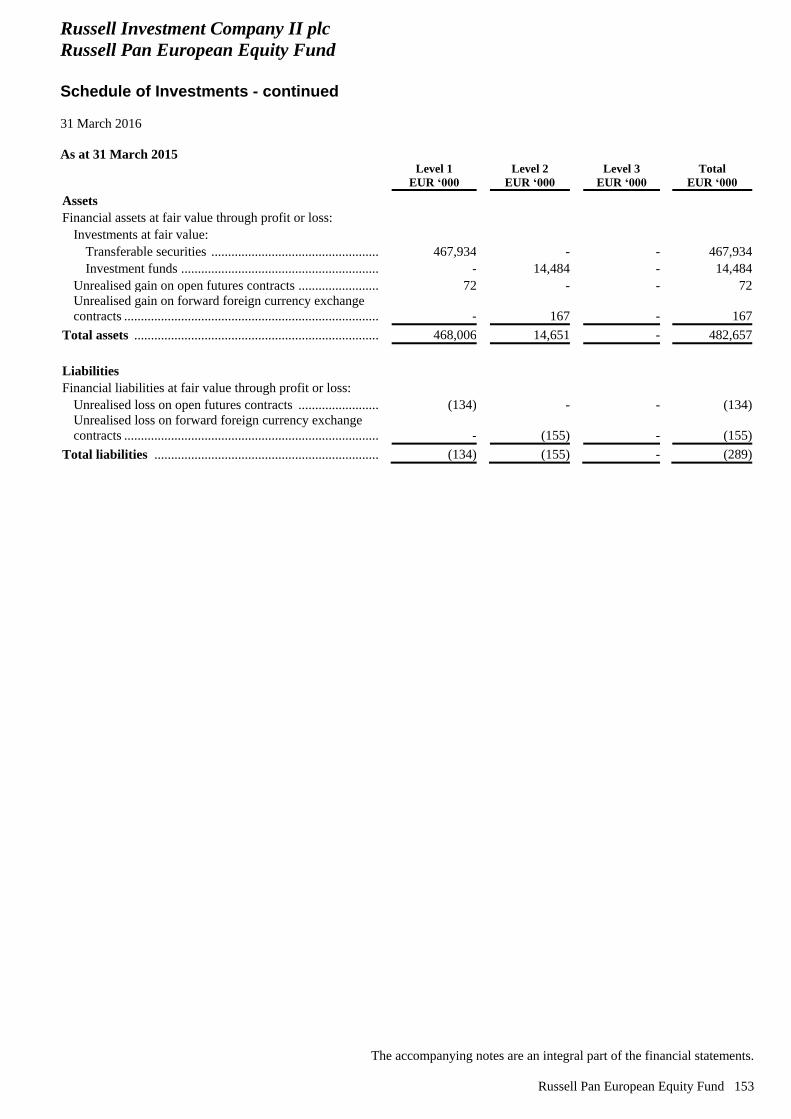
Russell Investment Company II plc
Russell Pan European Equity Fund
Schedule of Investments - continued
31 March 2016
The accompanying notes are an integral part of the financial statements.
Russell Pan European Equity Fund 153
As at 31 March 2015
Level 1
EUR ‘000
Level 2
EUR ‘000
Level 3
EUR ‘000
Total
EUR ‘000
Assets
Financial assets at fair value through profit or loss:
Investments at fair value:
Transferable securities ............................................................... 467,934 - - 467,934
Investment funds ........................................................................ - 14,484 - 14,484
Unrealised gain on open futures contracts ................................. 72 - - 72
Unrealised gain on forward foreign currency exchange
contracts ..................................................................................... - 167 - 167
Total assets ...................................................................................... 468,006 14,651 - 482,657
Liabilities
Financial liabilities at fair value through profit or loss:
Unrealised loss on open futures contracts ................................. (134) - - (134)
Unrealised loss on forward foreign currency exchange
contracts ..................................................................................... - (155) - (155)
Total liabilities ................................................................................ (134) (155) - (289)
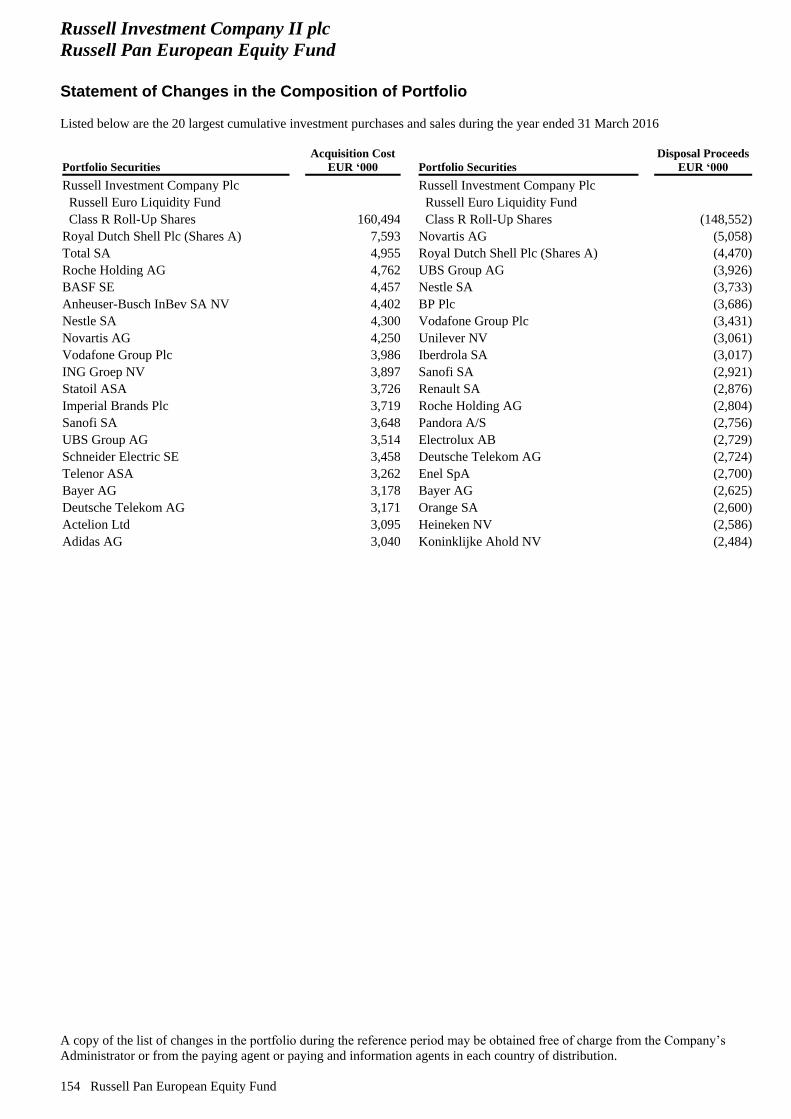
Russell Investment Company II plc
Russell Pan European Equity Fund
Statement of Changes in the Composition of Portfolio
Listed below are the 20 largest cumulative investment purchases and sales during the year ended 31 March 2016
A copy of the list of changes in the portfolio during the reference period may be obtained free of charge from the Company’s
Administrator or from the paying agent or paying and information agents in each country of distribution.
154 Russell Pan European Equity Fund
Portfolio Securities
Acquisition Cost
EUR ‘000 Portfolio Securities
Disposal Proceeds
EUR ‘000
Russell Investment Company Plc Russell Investment Company Plc
Russell Euro Liquidity Fund Russell Euro Liquidity Fund
Class R Roll-Up Shares 160,494 Class R Roll-Up Shares (148,552)
Royal Dutch Shell Plc (Shares A) 7,593 Novartis AG (5,058)
Total SA 4,955 Royal Dutch Shell Plc (Shares A) (4,470)
Roche Holding AG 4,762 UBS Group AG (3,926)
BASF SE 4,457 Nestle SA (3,733)
Anheuser-Busch InBev SA NV 4,402 BP Plc (3,686)
Nestle SA 4,300 Vodafone Group Plc (3,431)
Novartis AG 4,250 Unilever NV (3,061)
Vodafone Group Plc 3,986 Iberdrola SA (3,017)
ING Groep NV 3,897 Sanofi SA (2,921)
Statoil ASA 3,726 Renault SA (2,876)
Imperial Brands Plc 3,719 Roche Holding AG (2,804)
Sanofi SA 3,648 Pandora A/S (2,756)
UBS Group AG 3,514 Electrolux AB (2,729)
Schneider Electric SE 3,458 Deutsche Telekom AG (2,724)
Telenor ASA 3,262 Enel SpA (2,700)
Bayer AG 3,178 Bayer AG (2,625)
Deutsche Telekom AG 3,171 Orange SA (2,600)
Actelion Ltd 3,095 Heineken NV (2,586)
Adidas AG 3,040 Koninklijke Ahold NV (2,484)
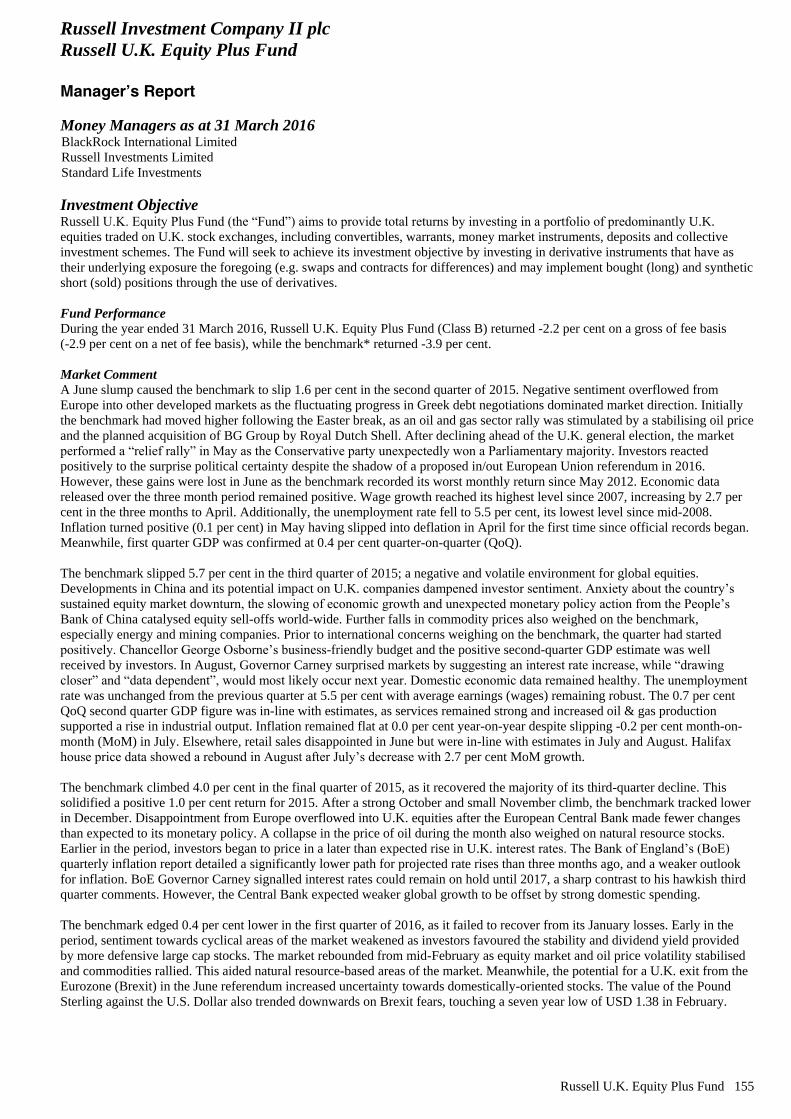
Russell Investment Company II plc
Russell U.K. Equity Plus Fund
Manager’s Report
Russell U.K. Equity Plus Fund 155
Money Managers as at 31 March 2016 BlackRock International Limited
Russell Investments Limited
Standard Life Investments
Investment Objective Russell U.K. Equity Plus Fund (the “Fund”) aims to provide total returns by investing in a portfolio of predominantly U.K.
equities traded on U.K. stock exchanges, including convertibles, warrants, money market instruments, deposits and collective
investment schemes. The Fund will seek to achieve its investment objective by investing in derivative instruments that have as
their underlying exposure the foregoing (e.g. swaps and contracts for differences) and may implement bought (long) and synthetic
short (sold) positions through the use of derivatives.
Fund Performance
During the year ended 31 March 2016, Russell U.K. Equity Plus Fund (Class B) returned -2.2 per cent on a gross of fee basis
(-2.9 per cent on a net of fee basis), while the benchmark* returned -3.9 per cent.
Market Comment
A June slump caused the benchmark to slip 1.6 per cent in the second quarter of 2015. Negative sentiment overflowed from
Europe into other developed markets as the fluctuating progress in Greek debt negotiations dominated market direction. Initially
the benchmark had moved higher following the Easter break, as an oil and gas sector rally was stimulated by a stabilising oil price
and the planned acquisition of BG Group by Royal Dutch Shell. After declining ahead of the U.K. general election, the market
performed a “relief rally” in May as the Conservative party unexpectedly won a Parliamentary majority. Investors reacted
positively to the surprise political certainty despite the shadow of a proposed in/out European Union referendum in 2016.
However, these gains were lost in June as the benchmark recorded its worst monthly return since May 2012. Economic data
released over the three month period remained positive. Wage growth reached its highest level since 2007, increasing by 2.7 per
cent in the three months to April. Additionally, the unemployment rate fell to 5.5 per cent, its lowest level since mid-2008.
Inflation turned positive (0.1 per cent) in May having slipped into deflation in April for the first time since official records began.
Meanwhile, first quarter GDP was confirmed at 0.4 per cent quarter-on-quarter (QoQ).
The benchmark slipped 5.7 per cent in the third quarter of 2015; a negative and volatile environment for global equities.
Developments in China and its potential impact on U.K. companies dampened investor sentiment. Anxiety about the country’s
sustained equity market downturn, the slowing of economic growth and unexpected monetary policy action from the People’s
Bank of China catalysed equity sell-offs world-wide. Further falls in commodity prices also weighed on the benchmark,
especially energy and mining companies. Prior to international concerns weighing on the benchmark, the quarter had started
positively. Chancellor George Osborne’s business-friendly budget and the positive second-quarter GDP estimate was well
received by investors. In August, Governor Carney surprised markets by suggesting an interest rate increase, while “drawing
closer” and “data dependent”, would most likely occur next year. Domestic economic data remained healthy. The unemployment
rate was unchanged from the previous quarter at 5.5 per cent with average earnings (wages) remaining robust. The 0.7 per cent
QoQ second quarter GDP figure was in-line with estimates, as services remained strong and increased oil & gas production
supported a rise in industrial output. Inflation remained flat at 0.0 per cent year-on-year despite slipping -0.2 per cent month-on-
month (MoM) in July. Elsewhere, retail sales disappointed in June but were in-line with estimates in July and August. Halifax
house price data showed a rebound in August after July’s decrease with 2.7 per cent MoM growth.
The benchmark climbed 4.0 per cent in the final quarter of 2015, as it recovered the majority of its third-quarter decline. This
solidified a positive 1.0 per cent return for 2015. After a strong October and small November climb, the benchmark tracked lower
in December. Disappointment from Europe overflowed into U.K. equities after the European Central Bank made fewer changes
than expected to its monetary policy. A collapse in the price of oil during the month also weighed on natural resource stocks.
Earlier in the period, investors began to price in a later than expected rise in U.K. interest rates. The Bank of England’s (BoE)
quarterly inflation report detailed a significantly lower path for projected rate rises than three months ago, and a weaker outlook
for inflation. BoE Governor Carney signalled interest rates could remain on hold until 2017, a sharp contrast to his hawkish third
quarter comments. However, the Central Bank expected weaker global growth to be offset by strong domestic spending.
The benchmark edged 0.4 per cent lower in the first quarter of 2016, as it failed to recover from its January losses. Early in the
period, sentiment towards cyclical areas of the market weakened as investors favoured the stability and dividend yield provided
by more defensive large cap stocks. The market rebounded from mid-February as equity market and oil price volatility stabilised
and commodities rallied. This aided natural resource-based areas of the market. Meanwhile, the potential for a U.K. exit from the
Eurozone (Brexit) in the June referendum increased uncertainty towards domestically-oriented stocks. The value of the Pound
Sterling against the U.S. Dollar also trended downwards on Brexit fears, touching a seven year low of USD 1.38 in February.
Russell Investment Company II plc
Russell U.K. Equity Plus Fund
Manager’s Report - continued
156 Russell U.K. Equity Plus Fund
General Comment on Money Managers/Performance
The Fund added to its 2015 outperformance in the second quarter of 2015. Significantly strong stock selection drove positive
relative returns. Additionally, the overweight to small cap stocks and higher growth areas of the market continued to underpin
gains. Standard Life remained the standout contributor among the Fund’s underlying Money Managers as it benefited from its
bottom-up stock selection. Meanwhile, BlackRock and our positioning strategy lagged the benchmark.
The Fund outperformed the benchmark in the third quarter of 2015; a negative and volatile period for global equity markets. The
Fund benefited from the tilt towards growth and overweight to small caps. BlackRock significantly outperformed as its defensive
growth-oriented strategy best suited the market environment. During the quarter we marginally reduced the Fund’s growth
exposure that has been rewarded strongly in recent years. While earnings from domestically-oriented corporates have improved,
we remain on the lookout for earnings confirmation across the wider market to support valuations that have appreciated strongly
in recent years.
The Fund finished slightly below the benchmark in the fourth quarter of 2015. The Fund’s positioning towards high momentum
and its current overweight to growth was beneficial. The selection of high momentum stocks weighed on relative returns. At the
sector level, stock picking was strong within the basic materials sector but detracted within the industrials and technology sectors.
It was a positive factor environment for BlackRock’s defensive growth strategy. In contrast, our positioning strategy and Standard
Life suffered from negative stock selection.
The Fund lagged the benchmark in the first quarter of 2016. Our positive exposure to high momentum detracted as the market
rebounded from mid-February. Our exposure to select domestically-oriented small cap stocks weighed on relative returns, with
sentiment hindered by “Brexit” concerns. Stock selection within the consumer services sector was negative this period, with
select multiline retail holdings handing back some of their 2015 outperformance. The selection of metals and mining stocks also
detracted. Standard Life handed back some of its longer-term outperformance as its selection of more volatile names went
unrewarded. Our positioning strategy mitigated additional underperformance as a large underweight to financials added to relative
returns.
Outlook
Global markets got off to a rough start in 2016. By mid-February global developed equities had lost nearly 20 per cent from their
2015 peak. They rebounded by around 10 per cent by mid-March, but we expect volatility to be a headline throughout 2016. This
volatility will continue to be driven by China fears, the U.S. Federal Reserve’s monetary tightening, U.S. recession concerns,
bank balance sheet worries, and soft corporate profits. Moreover, the move to negative interest rates in Europe and Japan has
triggered fears that Central Banks have run out of easing options. Negative rates also tend to squeeze the margin between banks’
borrowing and lending rates. This squeeze could, in turn, hurt bank profitability, and end up making things worse for the markets.
In our 2016 Global Market Outlook Annual report, we forecast mid-to-low single digit returns for global equities, along with a
gradual rise in long-term interest rates. We’re holding to that view, with the exception we think equity growth is more likely to be
in the low single digits. Moreover, we’re now seeing corporate profits weakening, softness in global trade and manufacturing, and
slightly higher risks for Emerging Markets. These elements all contribute to a less supportive environment for equities. That said,
we’re not forecasting a sustained bear market, provided the U.S. does not fall into recession. Right now we see recession as a low
probability over the next several years. It’s true we’re deep into the current business cycle, but we’re not seeing excesses in the
U.S. economy that could trigger recession.
Past performance is no indication of current or future performance. * Benchmark Source: FTSE All Share Total Return Index
Russell Investments Ireland Limited
May 2016
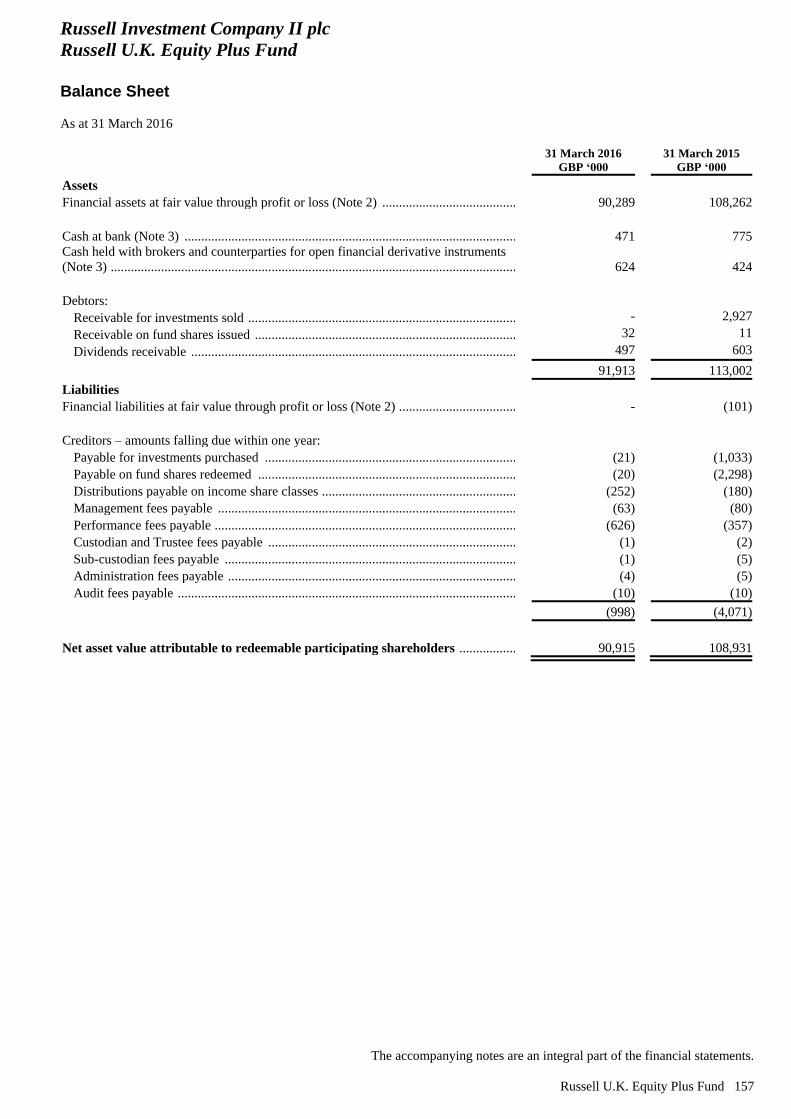
Russell Investment Company II plc
Russell U.K. Equity Plus Fund
Balance Sheet
As at 31 March 2016
The accompanying notes are an integral part of the financial statements.
Russell U.K. Equity Plus Fund 157
31 March 2016
GBP ‘000
31 March 2015
GBP ‘000
Assets
Financial assets at fair value through profit or loss (Note 2) .................................................. 90,289 108,262
Cash at bank (Note 3) ............................................................................................................. 471 775
Cash held with brokers and counterparties for open financial derivative instruments
(Note 3) ................................................................................................................................... 624 424
Debtors:
Receivable for investments sold .......................................................................................... - 2,927
Receivable on fund shares issued ........................................................................................ 32 11
Dividends receivable ........................................................................................................... 497 603
91,913 113,002
Liabilities
Financial liabilities at fair value through profit or loss (Note 2) ............................................. - (101)
Creditors – amounts falling due within one year:
Payable for investments purchased ..................................................................................... (21) (1,033)
Payable on fund shares redeemed ....................................................................................... (20) (2,298)
Distributions payable on income share classes .................................................................... (252) (180)
Management fees payable ................................................................................................... (63) (80)
Performance fees payable .................................................................................................... (626) (357)
Custodian and Trustee fees payable .................................................................................... (1) (2)
Sub-custodian fees payable ................................................................................................. (1) (5)
Administration fees payable ................................................................................................ (4) (5)
Audit fees payable ............................................................................................................... (10) (10)
(998) (4,071)
Net asset value attributable to redeemable participating shareholders .................... 90,915 108,931

Russell Investment Company II plc
Russell U.K. Equity Plus Fund
Profit and Loss Account
For the year ended 31 March 2016
The accompanying notes are an integral part of the financial statements.
158 Russell U.K. Equity Plus Fund
2016
GBP ‘000
2015
GBP ‘000
Income
Dividends ....................................................................................................................... 3,279 3,942
Net gain (loss) on investment activities (Note 4) ............................................................... (4,596) 4,596
Total investment income (expense) ................................................................................ (1,317) 8,538
Expenses
Management fees (Note 5) ............................................................................................. (810) (1,023)
Performance fees (Note 5) .............................................................................................. (351) (168)
Custodian and Trustee fees (Note 6) .............................................................................. (8) (11)
Sub-custodian fees (Note 6) ........................................................................................... (12) (22)
Administration and transfer agency fees (Note 6) .......................................................... (49) (54)
Audit fees (Note 6) ......................................................................................................... (10) (10)
Professional fees ............................................................................................................. (19) (11)
Other fees ....................................................................................................................... (5) (12)
Total operating expenses ................................................................................................ (1,264) (1,311)
Net income (expense) ....................................................................................................... (2,581) 7,227
Finance costs
Distributions (Note 8) ..................................................................................................... (1,902) (2,562)
Profit (loss) for the financial year before taxation ........................................................ (4,483) 4,665
Taxation
Withholding tax (Note 9) ............................................................................................... (6) (2)
Net increase (decrease) in net assets attributable to redeemable participating
shareholders resulting from operations ....................................................................... (4,489) 4,663
All amounts arose solely from continuing operations. There are no recognised gains and losses other than those dealt with in the Profit and Loss
Account.
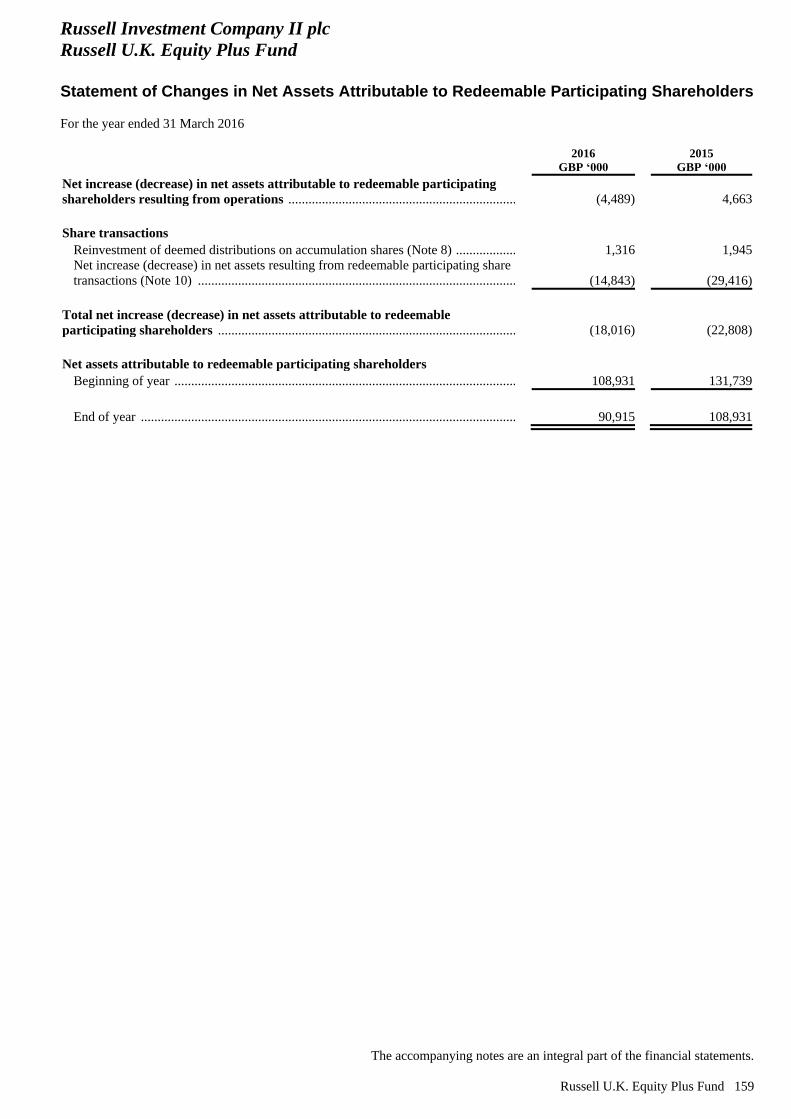
Russell Investment Company II plc
Russell U.K. Equity Plus Fund
Statement of Changes in Net Assets Attributable to Redeemable Participating Shareholders
For the year ended 31 March 2016
The accompanying notes are an integral part of the financial statements.
Russell U.K. Equity Plus Fund 159
2016
GBP ‘000
2015
GBP ‘000
Net increase (decrease) in net assets attributable to redeemable participating
shareholders resulting from operations ................................................................................................. (4,489) 4,663
Share transactions
Reinvestment of deemed distributions on accumulation shares (Note 8) ..................... 1,316 1,945
Net increase (decrease) in net assets resulting from redeemable participating share
transactions (Note 10) .................................................................................................. (14,843) (29,416)
Total net increase (decrease) in net assets attributable to redeemable
participating shareholders ...................................................................................................................... (18,016) (22,808)
Net assets attributable to redeemable participating shareholders
Beginning of year ........................................................................................................... 108,931 131,739
End of year ..................................................................................................................... 90,915 108,931
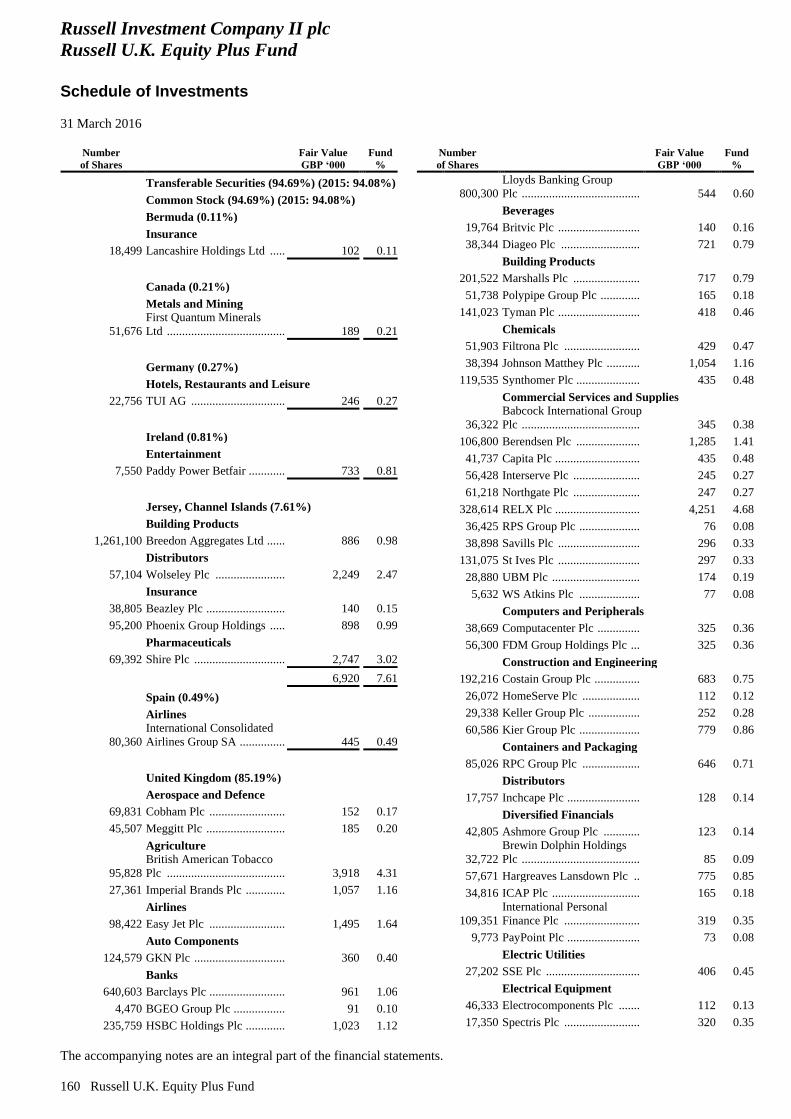
Russell Investment Company II plc
Russell U.K. Equity Plus Fund
Schedule of Investments
31 March 2016
The accompanying notes are an integral part of the financial statements.
160 Russell U.K. Equity Plus Fund
Number
of Shares
Fair Value
GBP ‘000
Fund
%
Transferable Securities (94.69%) (2015: 94.08%)
Common Stock (94.69%) (2015: 94.08%)
Bermuda (0.11%)
Insurance
18,499 Lancashire Holdings Ltd ..... 102 0.11
Canada (0.21%)
Metals and Mining
51,676
First Quantum Minerals
Ltd ....................................... 189 0.21
Germany (0.27%)
Hotels, Restaurants and Leisure
22,756 TUI AG ............................... 246 0.27
Ireland (0.81%)
Entertainment
7,550 Paddy Power Betfair ............ 733 0.81
Jersey, Channel Islands (7.61%)
Building Products
1,261,100 Breedon Aggregates Ltd ...... 886 0.98
Distributors
57,104 Wolseley Plc ....................... 2,249 2.47
Insurance
38,805 Beazley Plc .......................... 140 0.15
95,200 Phoenix Group Holdings ..... 898 0.99
Pharmaceuticals
69,392 Shire Plc .............................. 2,747 3.02
6,920 7.61
Spain (0.49%)
Airlines
80,360
International Consolidated
Airlines Group SA ............... 445 0.49
United Kingdom (85.19%)
Aerospace and Defence
69,831 Cobham Plc ......................... 152 0.17
45,507 Meggitt Plc .......................... 185 0.20
Agriculture
95,828
British American Tobacco
Plc ....................................... 3,918 4.31
27,361 Imperial Brands Plc ............. 1,057 1.16
Airlines
98,422 Easy Jet Plc ......................... 1,495 1.64
Auto Components
124,579 GKN Plc .............................. 360 0.40
Banks
640,603 Barclays Plc ......................... 961 1.06
4,470 BGEO Group Plc ................. 91 0.10
235,759 HSBC Holdings Plc ............. 1,023 1.12
Number
of Shares
Fair Value
GBP ‘000
Fund
%
800,300
Lloyds Banking Group
Plc ....................................... 544 0.60
Beverages
19,764 Britvic Plc ........................... 140 0.16
38,344 Diageo Plc .......................... 721 0.79
Building Products
201,522 Marshalls Plc ...................... 717 0.79
51,738 Polypipe Group Plc ............. 165 0.18
141,023 Tyman Plc ........................... 418 0.46
Chemicals
51,903 Filtrona Plc ......................... 429 0.47
38,394 Johnson Matthey Plc ........... 1,054 1.16
119,535 Synthomer Plc ..................... 435 0.48
Commercial Services and Supplies
36,322
Babcock International Group
Plc ....................................... 345 0.38
106,800 Berendsen Plc ..................... 1,285 1.41
41,737 Capita Plc ............................ 435 0.48
56,428 Interserve Plc ...................... 245 0.27
61,218 Northgate Plc ...................... 247 0.27
328,614 RELX Plc ............................ 4,251 4.68
36,425 RPS Group Plc .................... 76 0.08
38,898 Savills Plc ........................... 296 0.33
131,075 St Ives Plc ........................... 297 0.33
28,880 UBM Plc ............................. 174 0.19
5,632 WS Atkins Plc .................... 77 0.08
Computers and Peripherals
38,669 Computacenter Plc .............. 325 0.36
56,300 FDM Group Holdings Plc ... 325 0.36
Construction and Engineering
192,216 Costain Group Plc ............... 683 0.75
26,072 HomeServe Plc ................... 112 0.12
29,338 Keller Group Plc ................. 252 0.28
60,586 Kier Group Plc .................... 779 0.86
Containers and Packaging
85,026 RPC Group Plc ................... 646 0.71
Distributors
17,757 Inchcape Plc ........................ 128 0.14
Diversified Financials
42,805 Ashmore Group Plc ............ 123 0.14
32,722
Brewin Dolphin Holdings
Plc ....................................... 85 0.09
57,671 Hargreaves Lansdown Plc .. 775 0.85
34,816 ICAP Plc ............................. 165 0.18
109,351
International Personal
Finance Plc ......................... 319 0.35
9,773 PayPoint Plc ........................ 73 0.08
Electric Utilities
27,202 SSE Plc ............................... 406 0.45
Electrical Equipment
46,333 Electrocomponents Plc ....... 112 0.13
17,350 Spectris Plc ......................... 320 0.35
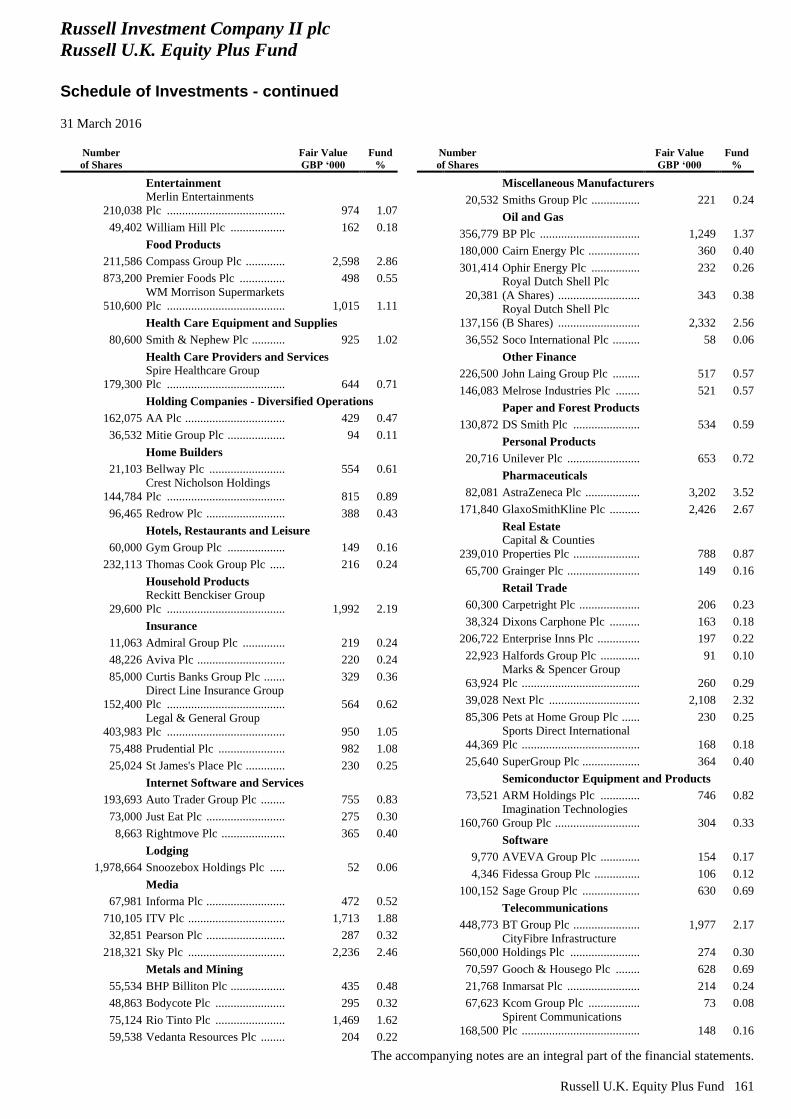
Russell Investment Company II plc
Russell U.K. Equity Plus Fund
Schedule of Investments - continued
31 March 2016
The accompanying notes are an integral part of the financial statements.
Russell U.K. Equity Plus Fund 161
Number
of Shares
Fair Value
GBP ‘000
Fund
%
Entertainment
210,038
Merlin Entertainments
Plc ....................................... 974 1.07
49,402 William Hill Plc .................. 162 0.18
Food Products
211,586 Compass Group Plc ............. 2,598 2.86
873,200 Premier Foods Plc ............... 498 0.55
510,600
WM Morrison Supermarkets
Plc ....................................... 1,015 1.11
Health Care Equipment and Supplies
80,600 Smith & Nephew Plc ........... 925 1.02
Health Care Providers and Services
179,300
Spire Healthcare Group
Plc ....................................... 644 0.71
Holding Companies - Diversified Operations
162,075 AA Plc ................................. 429 0.47
36,532 Mitie Group Plc ................... 94 0.11
Home Builders
21,103 Bellway Plc ......................... 554 0.61
144,784
Crest Nicholson Holdings
Plc ....................................... 815 0.89
96,465 Redrow Plc .......................... 388 0.43
Hotels, Restaurants and Leisure
60,000 Gym Group Plc ................... 149 0.16
232,113 Thomas Cook Group Plc ..... 216 0.24
Household Products
29,600
Reckitt Benckiser Group
Plc ....................................... 1,992 2.19
Insurance
11,063 Admiral Group Plc .............. 219 0.24
48,226 Aviva Plc ............................. 220 0.24
85,000 Curtis Banks Group Plc ....... 329 0.36
152,400
Direct Line Insurance Group
Plc ....................................... 564 0.62
403,983
Legal & General Group
Plc ....................................... 950 1.05
75,488 Prudential Plc ...................... 982 1.08
25,024 St James's Place Plc ............. 230 0.25
Internet Software and Services
193,693 Auto Trader Group Plc ........ 755 0.83
73,000 Just Eat Plc .......................... 275 0.30
8,663 Rightmove Plc ..................... 365 0.40
Lodging
1,978,664 Snoozebox Holdings Plc ..... 52 0.06
Media
67,981 Informa Plc .......................... 472 0.52
710,105 ITV Plc ................................ 1,713 1.88
32,851 Pearson Plc .......................... 287 0.32
218,321 Sky Plc ................................ 2,236 2.46
Metals and Mining
55,534 BHP Billiton Plc .................. 435 0.48
48,863 Bodycote Plc ....................... 295 0.32
75,124 Rio Tinto Plc ....................... 1,469 1.62
59,538 Vedanta Resources Plc ........ 204 0.22
Number
of Shares
Fair Value
GBP ‘000
Fund
%
Miscellaneous Manufacturers
20,532 Smiths Group Plc ................ 221 0.24
Oil and Gas
356,779 BP Plc ................................. 1,249 1.37
180,000 Cairn Energy Plc ................. 360 0.40
301,414 Ophir Energy Plc ................ 232 0.26
20,381
Royal Dutch Shell Plc
(A Shares) ........................... 343 0.38
137,156
Royal Dutch Shell Plc
(B Shares) ........................... 2,332 2.56
36,552 Soco International Plc ......... 58 0.06
Other Finance
226,500 John Laing Group Plc ......... 517 0.57
146,083 Melrose Industries Plc ........ 521 0.57
Paper and Forest Products
130,872 DS Smith Plc ...................... 534 0.59
Personal Products
20,716 Unilever Plc ........................ 653 0.72
Pharmaceuticals
82,081 AstraZeneca Plc .................. 3,202 3.52
171,840 GlaxoSmithKline Plc .......... 2,426 2.67
Real Estate
239,010
Capital & Counties
Properties Plc ...................... 788 0.87
65,700 Grainger Plc ........................ 149 0.16
Retail Trade
60,300 Carpetright Plc .................... 206 0.23
38,324 Dixons Carphone Plc .......... 163 0.18
206,722 Enterprise Inns Plc .............. 197 0.22
22,923 Halfords Group Plc ............. 91 0.10
63,924
Marks & Spencer Group
Plc ....................................... 260 0.29
39,028 Next Plc .............................. 2,108 2.32
85,306 Pets at Home Group Plc ...... 230 0.25
44,369
Sports Direct International
Plc ....................................... 168 0.18
25,640 SuperGroup Plc ................... 364 0.40
Semiconductor Equipment and Products
73,521 ARM Holdings Plc ............. 746 0.82
160,760
Imagination Technologies
Group Plc ............................ 304 0.33
Software
9,770 AVEVA Group Plc ............. 154 0.17
4,346 Fidessa Group Plc ............... 106 0.12
100,152 Sage Group Plc ................... 630 0.69
Telecommunications
448,773 BT Group Plc ...................... 1,977 2.17
560,000
CityFibre Infrastructure
Holdings Plc ....................... 274 0.30
70,597 Gooch & Housego Plc ........ 628 0.69
21,768 Inmarsat Plc ........................ 214 0.24
67,623 Kcom Group Plc ................. 73 0.08
168,500
Spirent Communications
Plc ....................................... 148 0.16
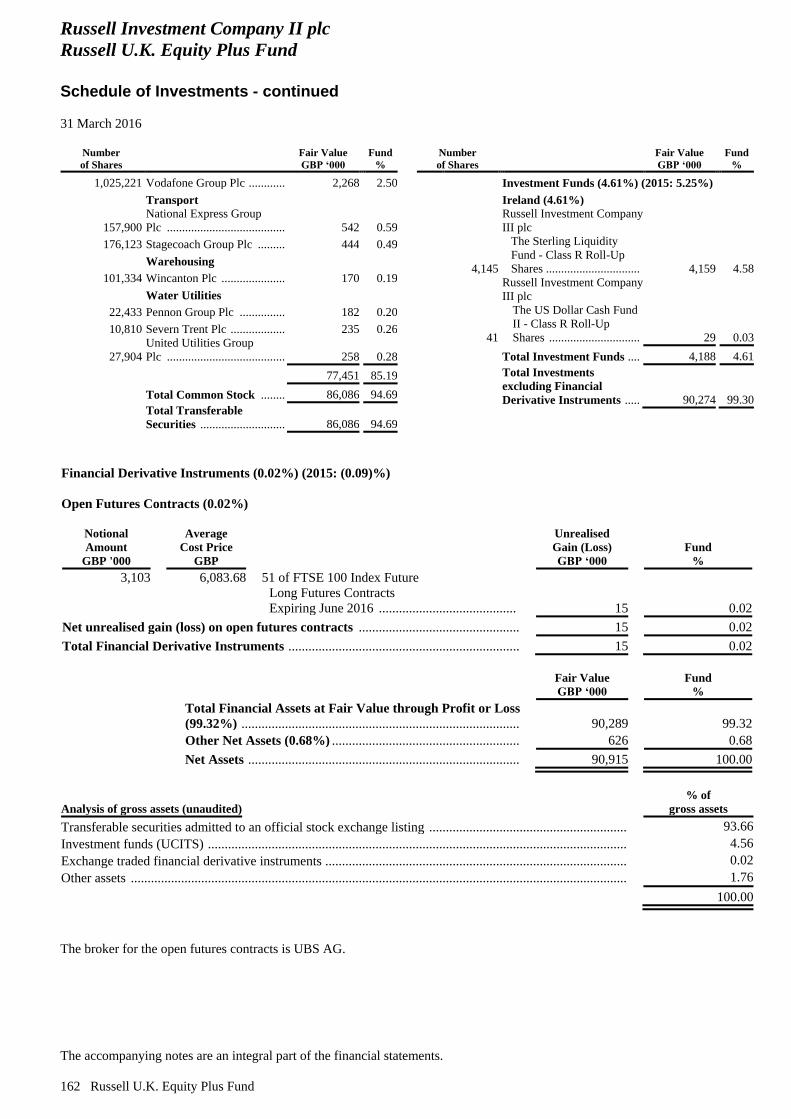
Russell Investment Company II plc
Russell U.K. Equity Plus Fund
Schedule of Investments - continued
31 March 2016
The accompanying notes are an integral part of the financial statements.
162 Russell U.K. Equity Plus Fund
Number
of Shares
Fair Value
GBP ‘000
Fund
%
1,025,221 Vodafone Group Plc ............ 2,268 2.50
Transport
157,900
National Express Group
Plc ....................................... 542 0.59
176,123 Stagecoach Group Plc ......... 444 0.49
Warehousing
101,334 Wincanton Plc ..................... 170 0.19
Water Utilities
22,433 Pennon Group Plc ............... 182 0.20
10,810 Severn Trent Plc .................. 235 0.26
27,904
United Utilities Group
Plc ....................................... 258 0.28
77,451 85.19
Total Common Stock ........ 86,086 94.69
Total Transferable
Securities ............................ 86,086 94.69
Number
of Shares
Fair Value
GBP ‘000
Fund
%
Investment Funds (4.61%) (2015: 5.25%)
Ireland (4.61%)
4,145
Russell Investment Company
III plc
The Sterling Liquidity
Fund - Class R Roll-Up
Shares ............................... 4,159 4.58
41
Russell Investment Company
III plc
The US Dollar Cash Fund
II - Class R Roll-Up
Shares .............................. 29 0.03
Total Investment Funds .... 4,188 4.61
Total Investments
excluding Financial
Derivative Instruments ..... 90,274 99.30
Financial Derivative Instruments (0.02%) (2015: (0.09)%)
Open Futures Contracts (0.02%)
Notional
Amount
GBP '000
Average
Cost Price
GBP
Unrealised
Gain (Loss)
GBP ‘000
Fund
%
3,103
6,083.68
51 of FTSE 100 Index Future
Long Futures Contracts
Expiring June 2016 ......................................... 15 0.02
Net unrealised gain (loss) on open futures contracts .................................................... 15 0.02
Total Financial Derivative Instruments ......................................................................... 15 0.02
Fair Value
GBP ‘000
Fund
%
Total Financial Assets at Fair Value through Profit or Loss
(99.32%) ....................................................................................................................................................... 90,289 99.32
Other Net Assets (0.68%) ......................................................................................................................... 626 0.68
Net Assets .................................................................................................................................................. 90,915 100.00
Analysis of gross assets (unaudited)
% of
gross assets
Transferable securities admitted to an official stock exchange listing ................................................................ 93.66
Investment funds (UCITS) .................................................................................................................................. 4.56
Exchange traded financial derivative instruments ............................................................................................... 0.02
Other assets ......................................................................................................................................................... 1.76
100.00
The broker for the open futures contracts is UBS AG.
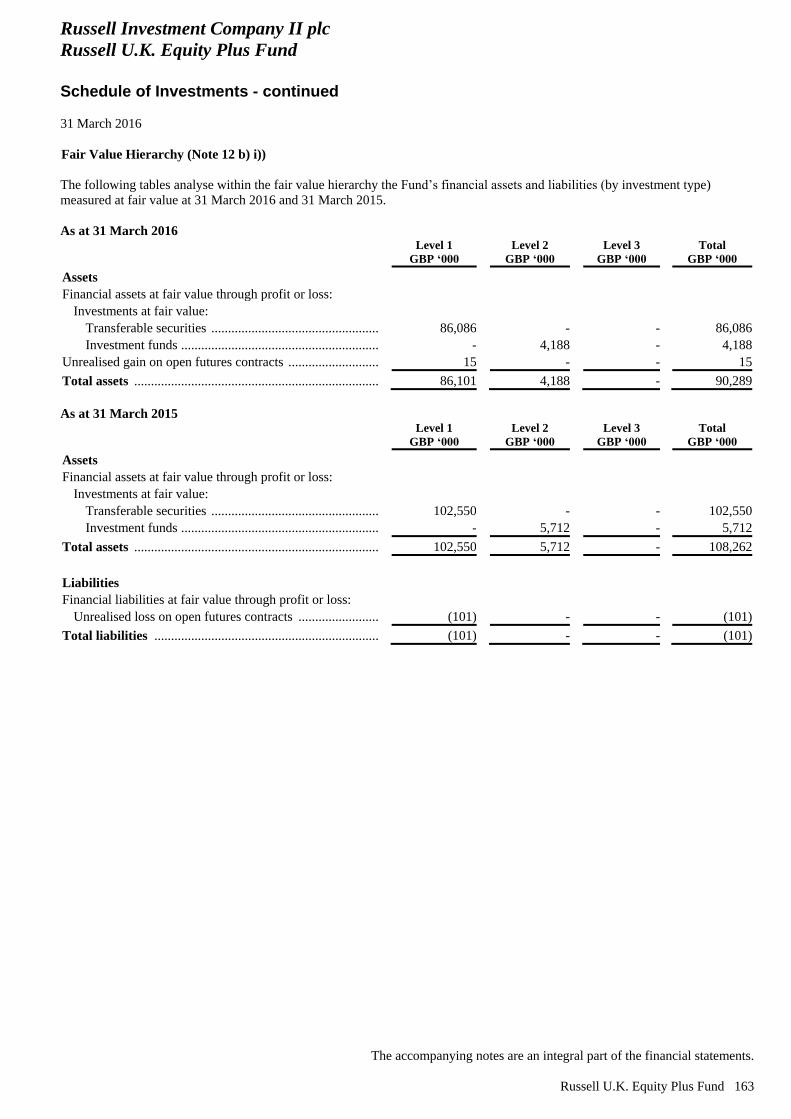
Russell Investment Company II plc
Russell U.K. Equity Plus Fund
Schedule of Investments - continued
31 March 2016
The accompanying notes are an integral part of the financial statements.
Russell U.K. Equity Plus Fund 163
Fair Value Hierarchy (Note 12 b) i))
The following tables analyse within the fair value hierarchy the Fund’s financial assets and liabilities (by investment type)
measured at fair value at 31 March 2016 and 31 March 2015.
As at 31 March 2016
Level 1
GBP ‘000
Level 2
GBP ‘000
Level 3
GBP ‘000
Total
GBP ‘000
Assets
Financial assets at fair value through profit or loss:
Investments at fair value:
Transferable securities ............................................................... 86,086 - - 86,086
Investment funds ........................................................................ - 4,188 - 4,188
Unrealised gain on open futures contracts ............................. 15 - - 15
Total assets ...................................................................................... 86,101 4,188 - 90,289
As at 31 March 2015
Level 1
GBP ‘000
Level 2
GBP ‘000
Level 3
GBP ‘000
Total
GBP ‘000
Assets
Financial assets at fair value through profit or loss:
Investments at fair value:
Transferable securities ............................................................... 102,550 - - 102,550
Investment funds ........................................................................ - 5,712 - 5,712
Total assets ...................................................................................... 102,550 5,712 - 108,262
Liabilities
Financial liabilities at fair value through profit or loss:
Unrealised loss on open futures contracts ..................................... (101) - - (101)
Total liabilities ................................................................................ (101) - - (101)
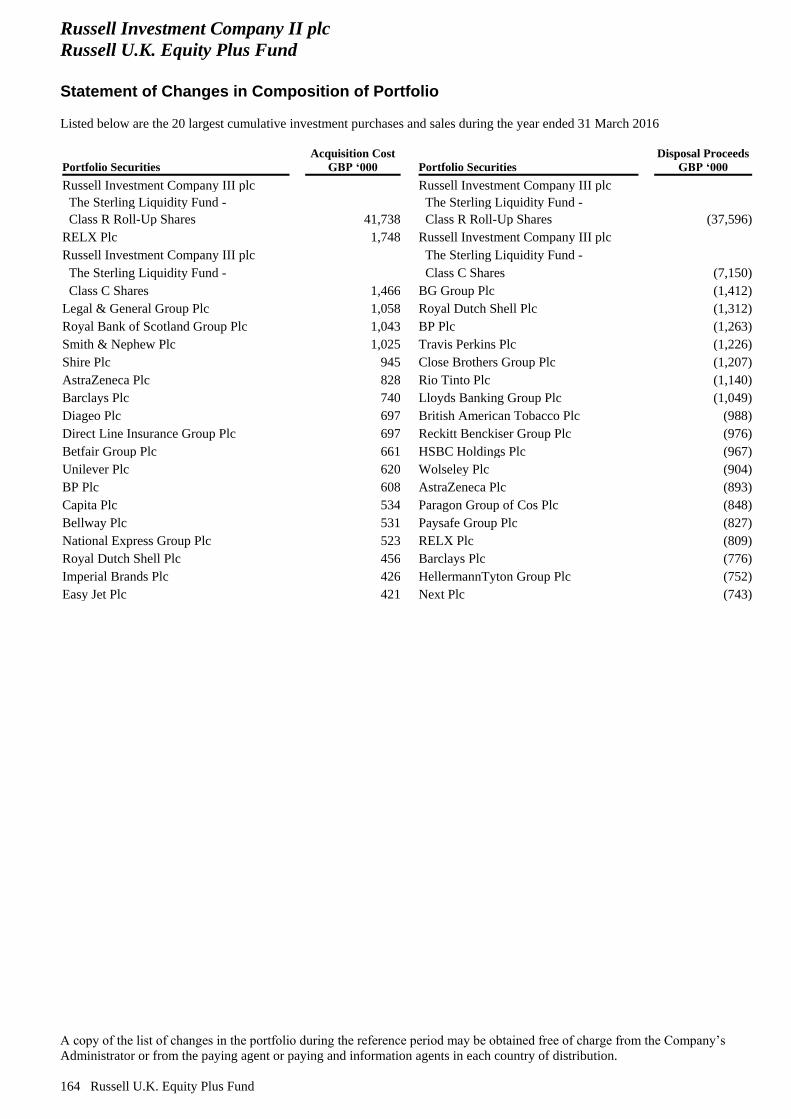
Russell Investment Company II plc
Russell U.K. Equity Plus Fund
Statement of Changes in Composition of Portfolio
Listed below are the 20 largest cumulative investment purchases and sales during the year ended 31 March 2016
A copy of the list of changes in the portfolio during the reference period may be obtained free of charge from the Company’s
Administrator or from the paying agent or paying and information agents in each country of distribution.
164 Russell U.K. Equity Plus Fund
Portfolio Securities
Acquisition Cost
GBP ‘000 Portfolio Securities
Disposal Proceeds
GBP ‘000
Russell Investment Company III plc Russell Investment Company III plc
The Sterling Liquidity Fund - The Sterling Liquidity Fund -
Class R Roll-Up Shares 41,738 Class R Roll-Up Shares (37,596)
RELX Plc 1,748 Russell Investment Company III plc
Russell Investment Company III plc The Sterling Liquidity Fund -
The Sterling Liquidity Fund - Class C Shares (7,150)
Class C Shares 1,466 BG Group Plc (1,412)
Legal & General Group Plc 1,058 Royal Dutch Shell Plc (1,312)
Royal Bank of Scotland Group Plc 1,043 BP Plc (1,263)
Smith & Nephew Plc 1,025 Travis Perkins Plc (1,226)
Shire Plc 945 Close Brothers Group Plc (1,207)
AstraZeneca Plc 828 Rio Tinto Plc (1,140)
Barclays Plc 740 Lloyds Banking Group Plc (1,049)
Diageo Plc 697 British American Tobacco Plc (988)
Direct Line Insurance Group Plc 697 Reckitt Benckiser Group Plc (976)
Betfair Group Plc 661 HSBC Holdings Plc (967)
Unilever Plc 620 Wolseley Plc (904)
BP Plc 608 AstraZeneca Plc (893)
Capita Plc 534 Paragon Group of Cos Plc (848)
Bellway Plc 531 Paysafe Group Plc (827)
National Express Group Plc 523 RELX Plc (809)
Royal Dutch Shell Plc 456 Barclays Plc (776)
Imperial Brands Plc 426 HellermannTyton Group Plc (752)
Easy Jet Plc 421 Next Plc (743)
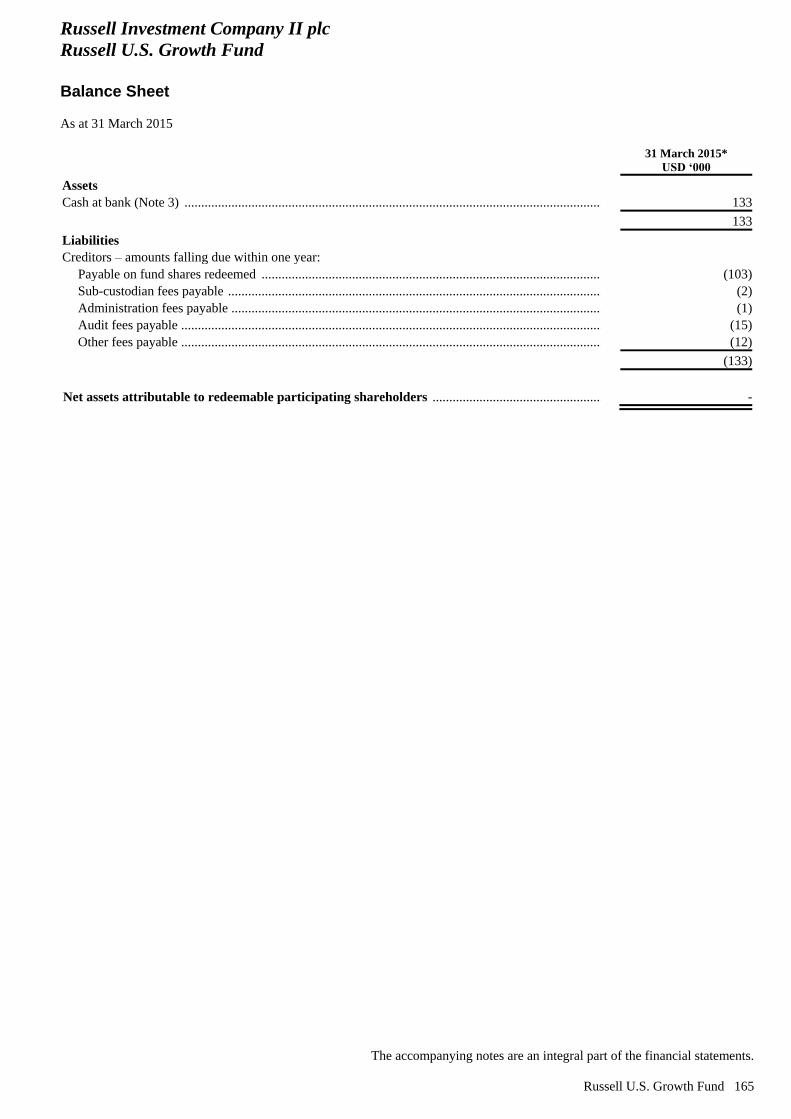
Russell Investment Company II plc
Russell U.S. Growth Fund
Balance Sheet
As at 31 March 2015
The accompanying notes are an integral part of the financial statements.
Russell U.S. Growth Fund 165
31 March 2015*
USD ‘000
Assets
Cash at bank (Note 3) ............................................................................................................................................... 133
133
Liabilities
Creditors – amounts falling due within one year:
Payable on fund shares redeemed .................................................................................................................. (103)
Sub-custodian fees payable ............................................................................................................................ (2)
Administration fees payable ........................................................................................................................... (1)
Audit fees payable .......................................................................................................................................... (15)
Other fees payable .......................................................................................................................................... (12)
(133)
Net assets attributable to redeemable participating shareholders ....................................................................... -
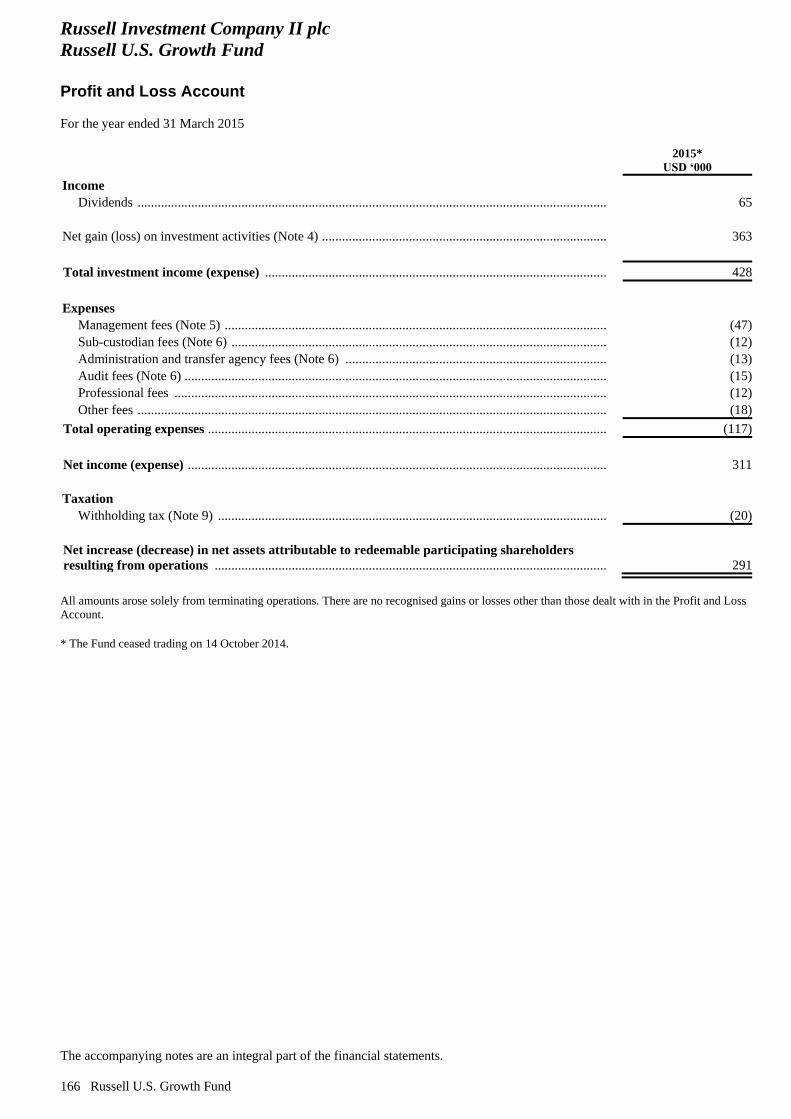
Russell Investment Company II plc
Russell U.S. Growth Fund
Profit and Loss Account
For the year ended 31 March 2015
The accompanying notes are an integral part of the financial statements.
166 Russell U.S. Growth Fund
2015*
USD ‘000
Income
Dividends ....................................................................................................................................................... 65
Net gain (loss) on investment activities (Note 4) ...................................................................................................... 363
Total investment income (expense) ......................................................................................................................... 428
Expenses
Management fees (Note 5) ............................................................................................................................. (47)
Sub-custodian fees (Note 6) ........................................................................................................................... (12)
Administration and transfer agency fees (Note 6) ......................................................................................... (13)
Audit fees (Note 6) ......................................................................................................................................... (15)
Professional fees ............................................................................................................................................ (12)
Other fees ....................................................................................................................................................... (18)
Total operating expenses .......................................................................................................................................... (117)
Net income (expense) ................................................................................................................................................ 311
Taxation
Withholding tax (Note 9) ............................................................................................................................... (20)
Net increase (decrease) in net assets attributable to redeemable participating shareholders
resulting from operations ........................................................................................................................................ 291
All amounts arose solely from terminating operations. There are no recognised gains or losses other than those dealt with in the Profit and Loss
Account.
* The Fund ceased trading on 14 October 2014.
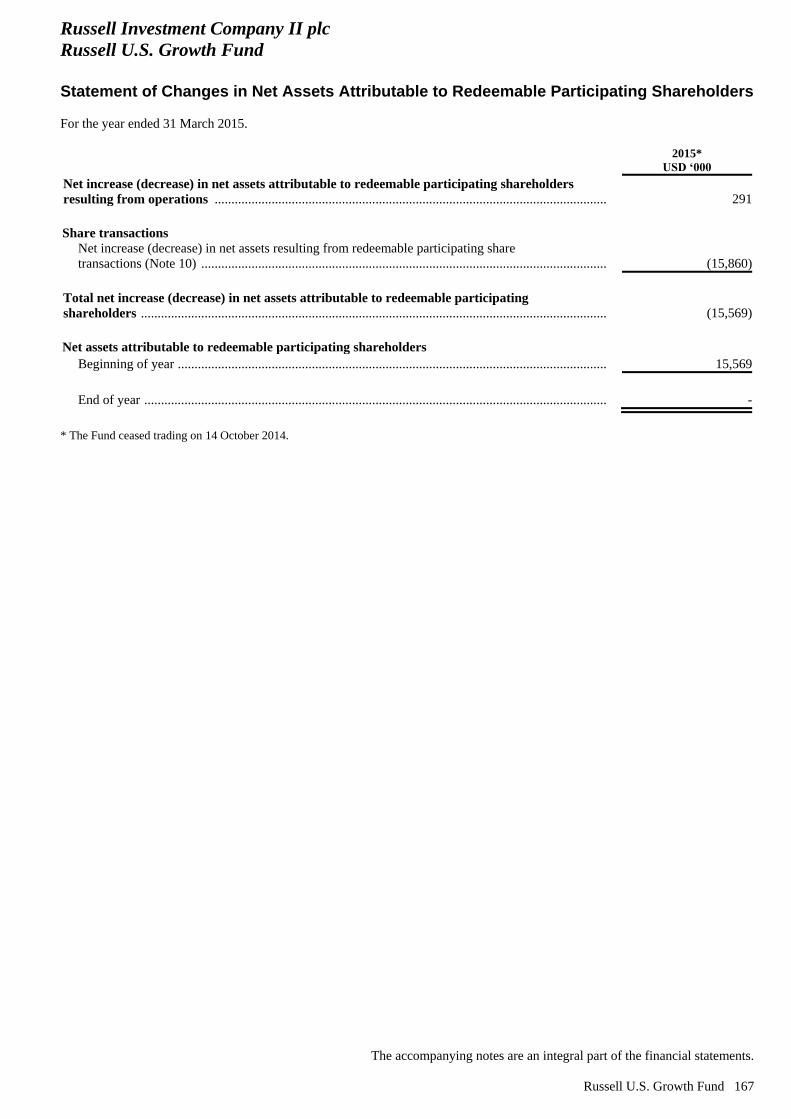
Russell Investment Company II plc
Russell U.S. Growth Fund
Statement of Changes in Net Assets Attributable to Redeemable Participating Shareholders
For the year ended 31 March 2015.
The accompanying notes are an integral part of the financial statements.
Russell U.S. Growth Fund 167
2015*
USD ‘000
Net increase (decrease) in net assets attributable to redeemable participating shareholders
resulting from operations ........................................................................................................................................ 291
Share transactions
Net increase (decrease) in net assets resulting from redeemable participating share
transactions (Note 10) .................................................................................................................................... (15,860)
Total net increase (decrease) in net assets attributable to redeemable participating
shareholders .............................................................................................................................................................. (15,569)
Net assets attributable to redeemable participating shareholders
Beginning of year ........................................................................................................................................... 15,569
End of year ..................................................................................................................................................... -
* The Fund ceased trading on 14 October 2014.
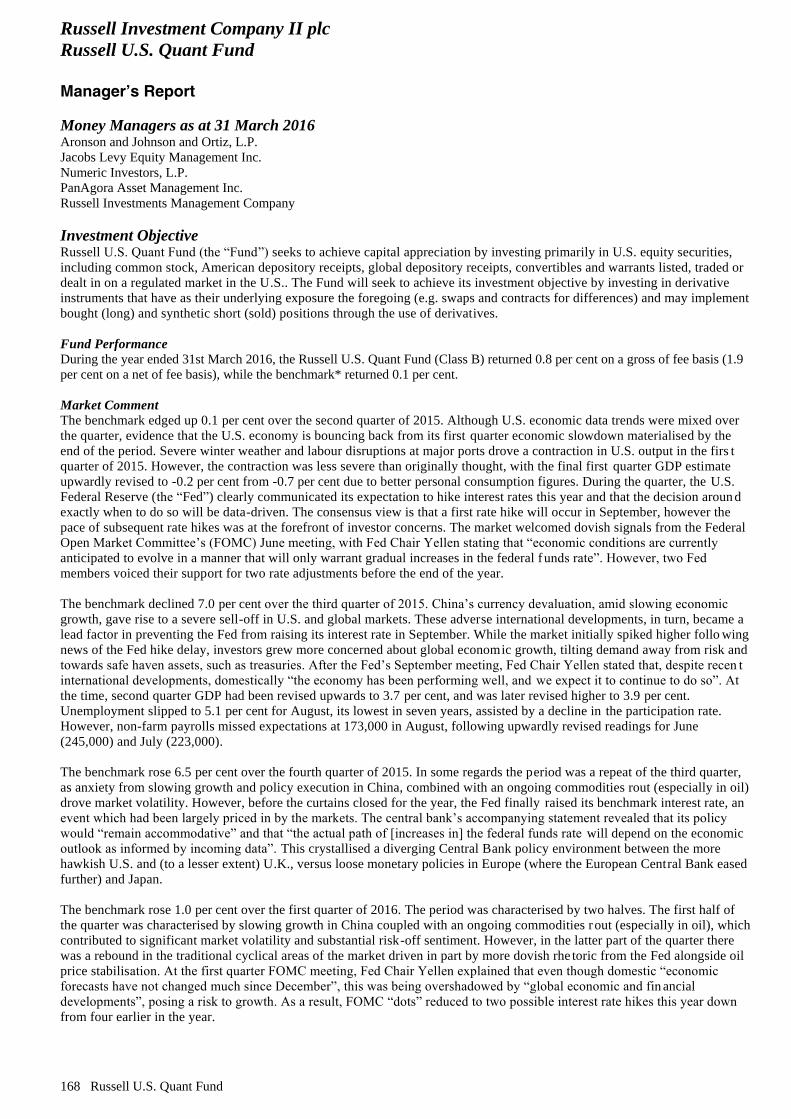
Russell Investment Company II plc
Russell U.S. Quant Fund
Manager’s Report
168 Russell U.S. Quant Fund
Money Managers as at 31 March 2016 Aronson and Johnson and Ortiz, L.P.
Jacobs Levy Equity Management Inc.
Numeric Investors, L.P.
PanAgora Asset Management Inc.
Russell Investments Management Company
Investment Objective Russell U.S. Quant Fund (the “Fund”) seeks to achieve capital appreciation by investing primarily in U.S. equity securities,
including common stock, American depository receipts, global depository receipts, convertibles and warrants listed, traded or
dealt in on a regulated market in the U.S.. The Fund will seek to achieve its investment objective by investing in derivative
instruments that have as their underlying exposure the foregoing (e.g. swaps and contracts for differences) and may implement
bought (long) and synthetic short (sold) positions through the use of derivatives.
Fund Performance
During the year ended 31st March 2016, the Russell U.S. Quant Fund (Class B) returned 0.8 per cent on a gross of fee basis (1.9
per cent on a net of fee basis), while the benchmark* returned 0.1 per cent.
Market Comment
The benchmark edged up 0.1 per cent over the second quarter of 2015. Although U.S. economic data trends were mixed over
the quarter, evidence that the U.S. economy is bouncing back from its first quarter economic slowdown materialised by the
end of the period. Severe winter weather and labour disruptions at major ports drove a contraction in U.S. output in the firs t
quarter of 2015. However, the contraction was less severe than originally thought, with the final first quarter GDP estimate
upwardly revised to -0.2 per cent from -0.7 per cent due to better personal consumption figures. During the quarter, the U.S.
Federal Reserve (the “Fed”) clearly communicated its expectation to hike interest rates this year and that the decision aroun d
exactly when to do so will be data-driven. The consensus view is that a first rate hike will occur in September, however the
pace of subsequent rate hikes was at the forefront of investor concerns. The market welcomed dovish signals from the Federal
Open Market Committee’s (FOMC) June meeting, with Fed Chair Yellen stating that “economic conditions are currently
anticipated to evolve in a manner that will only warrant gradual increases in the federal funds rate”. However, two Fed
members voiced their support for two rate adjustments before the end of the year.
The benchmark declined 7.0 per cent over the third quarter of 2015. China’s currency devaluation, amid slowing economic
growth, gave rise to a severe sell-off in U.S. and global markets. These adverse international developments, in turn, became a
lead factor in preventing the Fed from raising its interest rate in September. While the market initially spiked higher follo wing
news of the Fed hike delay, investors grew more concerned about global economic growth, tilting demand away from risk and
towards safe haven assets, such as treasuries. After the Fed’s September meeting, Fed Chair Yellen stated that, despite recen t
international developments, domestically “the economy has been performing well, and we expect it to continue to do so”. At
the time, second quarter GDP had been revised upwards to 3.7 per cent, and was later revised higher to 3.9 per cent.
Unemployment slipped to 5.1 per cent for August, its lowest in seven years, assisted by a decline in the participation rate.
However, non-farm payrolls missed expectations at 173,000 in August, following upwardly revised readings for June
(245,000) and July (223,000).
The benchmark rose 6.5 per cent over the fourth quarter of 2015. In some regards the period was a repeat of the third quarter,
as anxiety from slowing growth and policy execution in China, combined with an ongoing commodities rout (especially in oil)
drove market volatility. However, before the curtains closed for the year, the Fed finally raised its benchmark interest rate, an
event which had been largely priced in by the markets. The central bank’s accompanying statement revealed that its policy
would “remain accommodative” and that “the actual path of [increases in] the federal funds rate will depend on the economic
outlook as informed by incoming data”. This crystallised a diverging Central Bank policy environment between the more
hawkish U.S. and (to a lesser extent) U.K., versus loose monetary policies in Europe (where the European Central Bank eased
further) and Japan.
The benchmark rose 1.0 per cent over the first quarter of 2016. The period was characterised by two halves. The first half of
the quarter was characterised by slowing growth in China coupled with an ongoing commodities rout (especially in oil), which
contributed to significant market volatility and substantial risk-off sentiment. However, in the latter part of the quarter there
was a rebound in the traditional cyclical areas of the market driven in part by more dovish rhe toric from the Fed alongside oil
price stabilisation. At the first quarter FOMC meeting, Fed Chair Yellen explained that even though domestic “economic
forecasts have not changed much since December”, this was being overshadowed by “global economic and fin ancial
developments”, posing a risk to growth. As a result, FOMC “dots” reduced to two possible interest rate hikes this year down
from four earlier in the year.
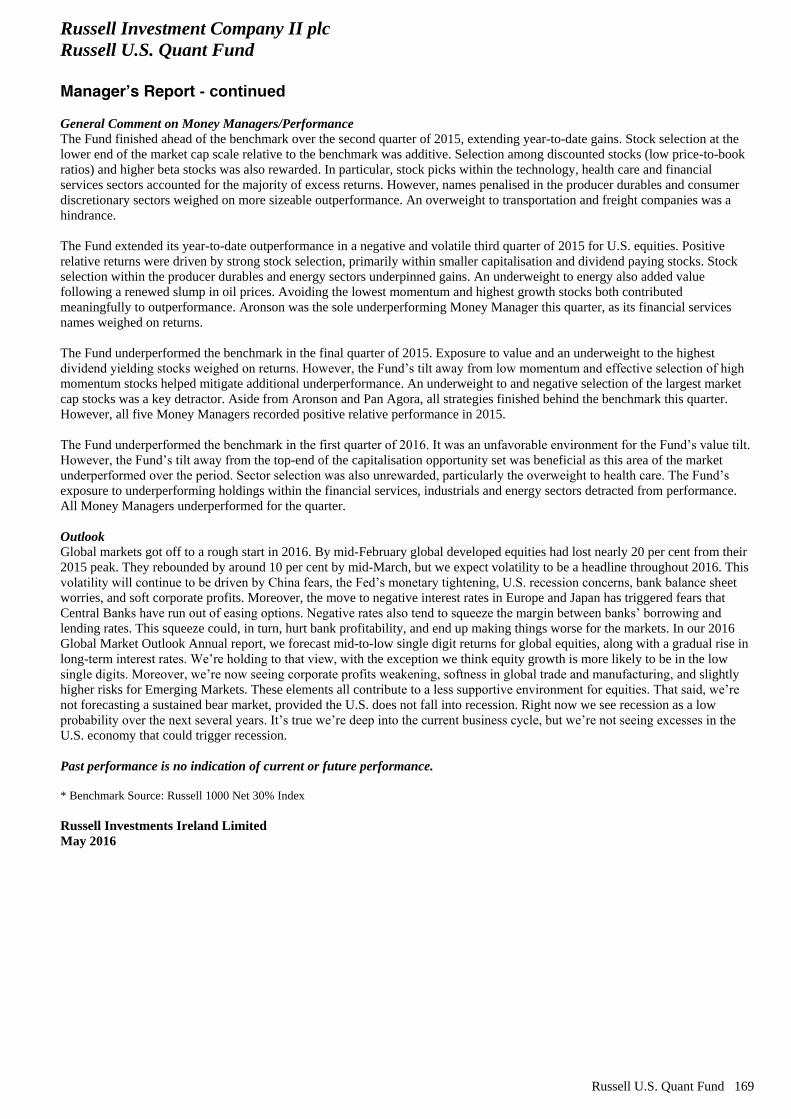
Russell Investment Company II plc
Russell U.S. Quant Fund
Manager’s Report - continued
Russell U.S. Quant Fund 169
General Comment on Money Managers/Performance
The Fund finished ahead of the benchmark over the second quarter of 2015, extending year-to-date gains. Stock selection at the
lower end of the market cap scale relative to the benchmark was additive. Selection among discounted stocks (low price-to-book
ratios) and higher beta stocks was also rewarded. In particular, stock picks within the technology, health care and financial
services sectors accounted for the majority of excess returns. However, names penalised in the producer durables and consumer
discretionary sectors weighed on more sizeable outperformance. An overweight to transportation and freight companies was a
hindrance.
The Fund extended its year-to-date outperformance in a negative and volatile third quarter of 2015 for U.S. equities. Positive
relative returns were driven by strong stock selection, primarily within smaller capitalisation and dividend paying stocks. Stock
selection within the producer durables and energy sectors underpinned gains. An underweight to energy also added value
following a renewed slump in oil prices. Avoiding the lowest momentum and highest growth stocks both contributed
meaningfully to outperformance. Aronson was the sole underperforming Money Manager this quarter, as its financial services
names weighed on returns.
The Fund underperformed the benchmark in the final quarter of 2015. Exposure to value and an underweight to the highest
dividend yielding stocks weighed on returns. However, the Fund’s tilt away from low momentum and effective selection of high
momentum stocks helped mitigate additional underperformance. An underweight to and negative selection of the largest market
cap stocks was a key detractor. Aside from Aronson and Pan Agora, all strategies finished behind the benchmark this quarter.
However, all five Money Managers recorded positive relative performance in 2015.
The Fund underperformed the benchmark in the first quarter of 2016. It was an unfavorable environment for the Fund’s value tilt.
However, the Fund’s tilt away from the top-end of the capitalisation opportunity set was beneficial as this area of the market
underperformed over the period. Sector selection was also unrewarded, particularly the overweight to health care. The Fund’s
exposure to underperforming holdings within the financial services, industrials and energy sectors detracted from performance.
All Money Managers underperformed for the quarter.
Outlook
Global markets got off to a rough start in 2016. By mid-February global developed equities had lost nearly 20 per cent from their
2015 peak. They rebounded by around 10 per cent by mid-March, but we expect volatility to be a headline throughout 2016. This
volatility will continue to be driven by China fears, the Fed’s monetary tightening, U.S. recession concerns, bank balance sheet
worries, and soft corporate profits. Moreover, the move to negative interest rates in Europe and Japan has triggered fears that
Central Banks have run out of easing options. Negative rates also tend to squeeze the margin between banks’ borrowing and
lending rates. This squeeze could, in turn, hurt bank profitability, and end up making things worse for the markets. In our 2016
Global Market Outlook Annual report, we forecast mid-to-low single digit returns for global equities, along with a gradual rise in
long-term interest rates. We’re holding to that view, with the exception we think equity growth is more likely to be in the low
single digits. Moreover, we’re now seeing corporate profits weakening, softness in global trade and manufacturing, and slightly
higher risks for Emerging Markets. These elements all contribute to a less supportive environment for equities. That said, we’re
not forecasting a sustained bear market, provided the U.S. does not fall into recession. Right now we see recession as a low
probability over the next several years. It’s true we’re deep into the current business cycle, but we’re not seeing excesses in the
U.S. economy that could trigger recession.
Past performance is no indication of current or future performance.
* Benchmark Source: Russell 1000 Net 30% Index
Russell Investments Ireland Limited
May 2016
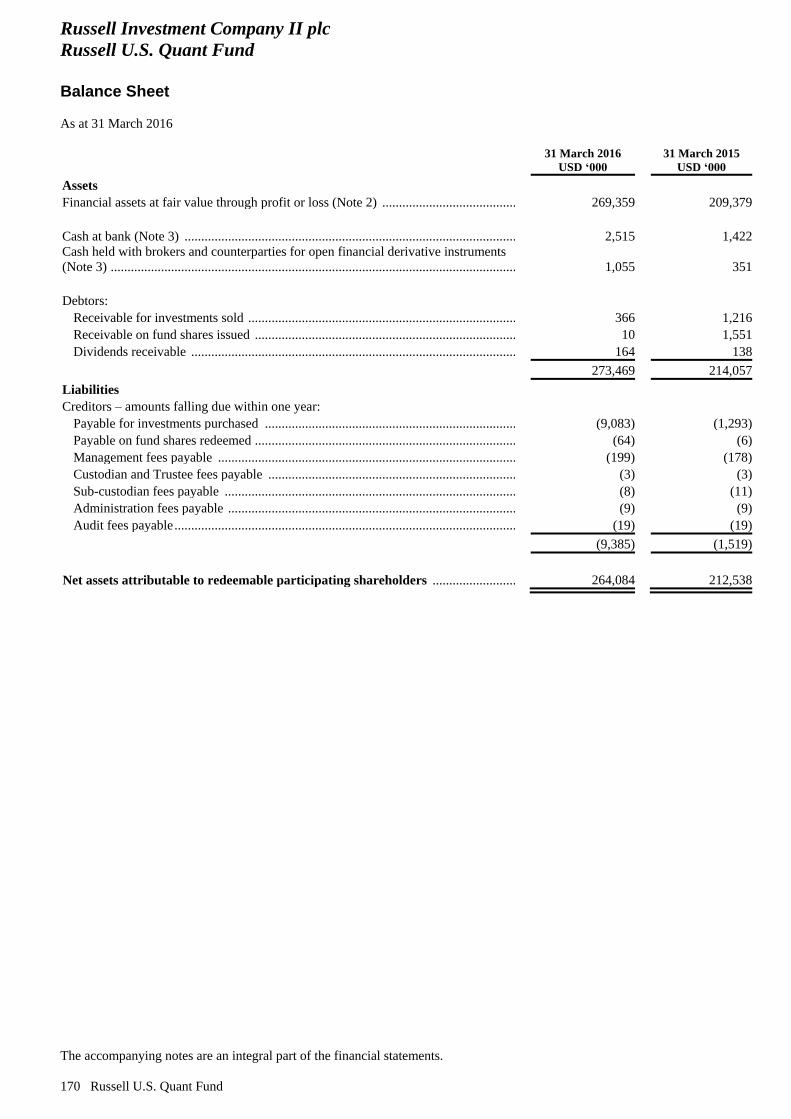
Russell Investment Company II plc
Russell U.S. Quant Fund
Balance Sheet
As at 31 March 2016
The accompanying notes are an integral part of the financial statements.
170 Russell U.S. Quant Fund
31 March 2016
USD ‘000
31 March 2015
USD ‘000
Assets
Financial assets at fair value through profit or loss (Note 2) .................................................. 269,359 209,379
Cash at bank (Note 3) .................................................................................................................. 2,515 1,422
Cash held with brokers and counterparties for open financial derivative instruments
(Note 3) ........................................................................................................................................ 1,055 351
Debtors:
Receivable for investments sold ................................................................................................ 366 1,216
Receivable on fund shares issued .............................................................................................. 10 1,551
Dividends receivable ................................................................................................................. 164 138
273,469 214,057
Liabilities
Creditors – amounts falling due within one year:
Payable for investments purchased ........................................................................................... (9,083) (1,293)
Payable on fund shares redeemed .............................................................................................. (64) (6)
Management fees payable ......................................................................................................... (199) (178)
Custodian and Trustee fees payable .......................................................................................... (3) (3)
Sub-custodian fees payable ....................................................................................................... (8) (11)
Administration fees payable ...................................................................................................... (9) (9)
Audit fees payable ...................................................................................................................... (19) (19)
(9,385) (1,519)
Net assets attributable to redeemable participating shareholders ......................................... 264,084 212,538
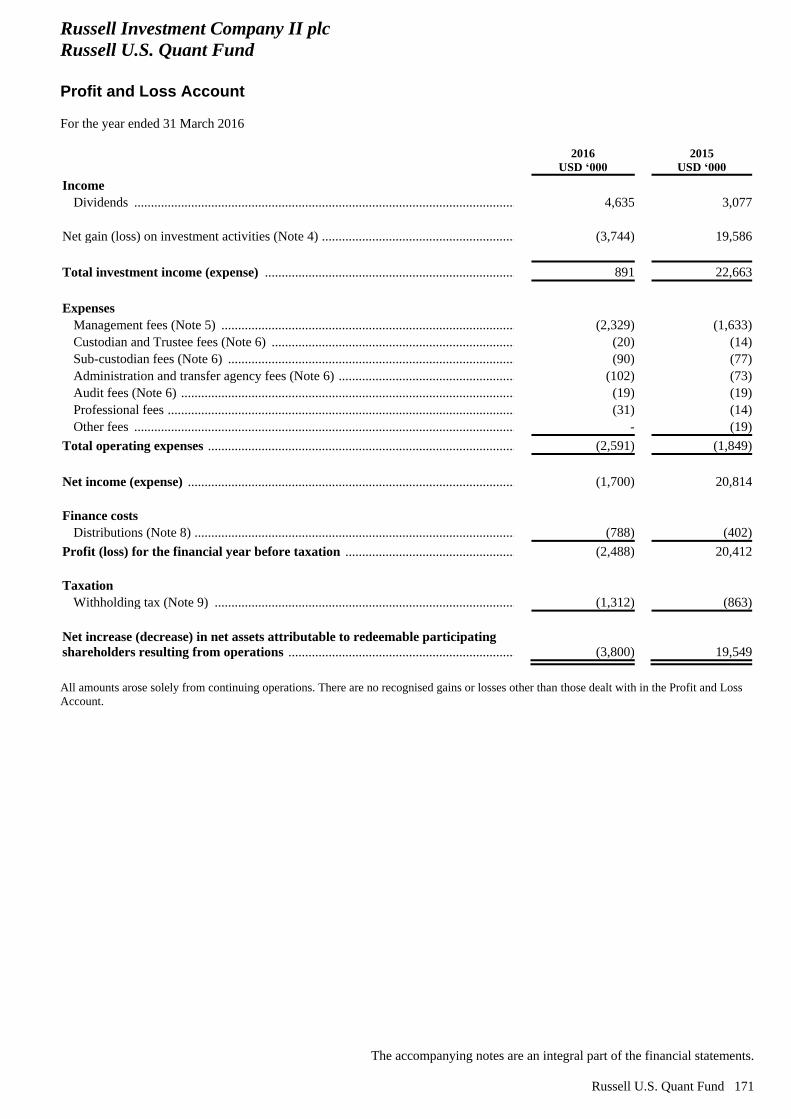
Russell Investment Company II plc
Russell U.S. Quant Fund
Profit and Loss Account
For the year ended 31 March 2016
The accompanying notes are an integral part of the financial statements.
Russell U.S. Quant Fund 171
2016
USD ‘000 2015
USD ‘000
Income
Dividends ....................................................................................................................... 4,635 3,077
Net gain (loss) on investment activities (Note 4) ............................................................... (3,744) 19,586
Total investment income (expense) ................................................................................ 891 22,663
Expenses
Management fees (Note 5) ............................................................................................. (2,329) (1,633)
Custodian and Trustee fees (Note 6) .............................................................................. (20) (14)
Sub-custodian fees (Note 6) ........................................................................................... (90) (77)
Administration and transfer agency fees (Note 6) .......................................................... (102) (73)
Audit fees (Note 6) ......................................................................................................... (19) (19)
Professional fees ............................................................................................................. (31) (14)
Other fees ....................................................................................................................... - (19)
Total operating expenses ................................................................................................. (2,591) (1,849)
Net income (expense) ....................................................................................................... (1,700) 20,814
Finance costs
Distributions (Note 8) ..................................................................................................... (788) (402)
Profit (loss) for the financial year before taxation ........................................................ (2,488) 20,412
Taxation
Withholding tax (Note 9) ............................................................................................... (1,312) (863)
Net increase (decrease) in net assets attributable to redeemable participating
shareholders resulting from operations ......................................................................... (3,800) 19,549
All amounts arose solely from continuing operations. There are no recognised gains or losses other than those dealt with in the Profit and Loss
Account.
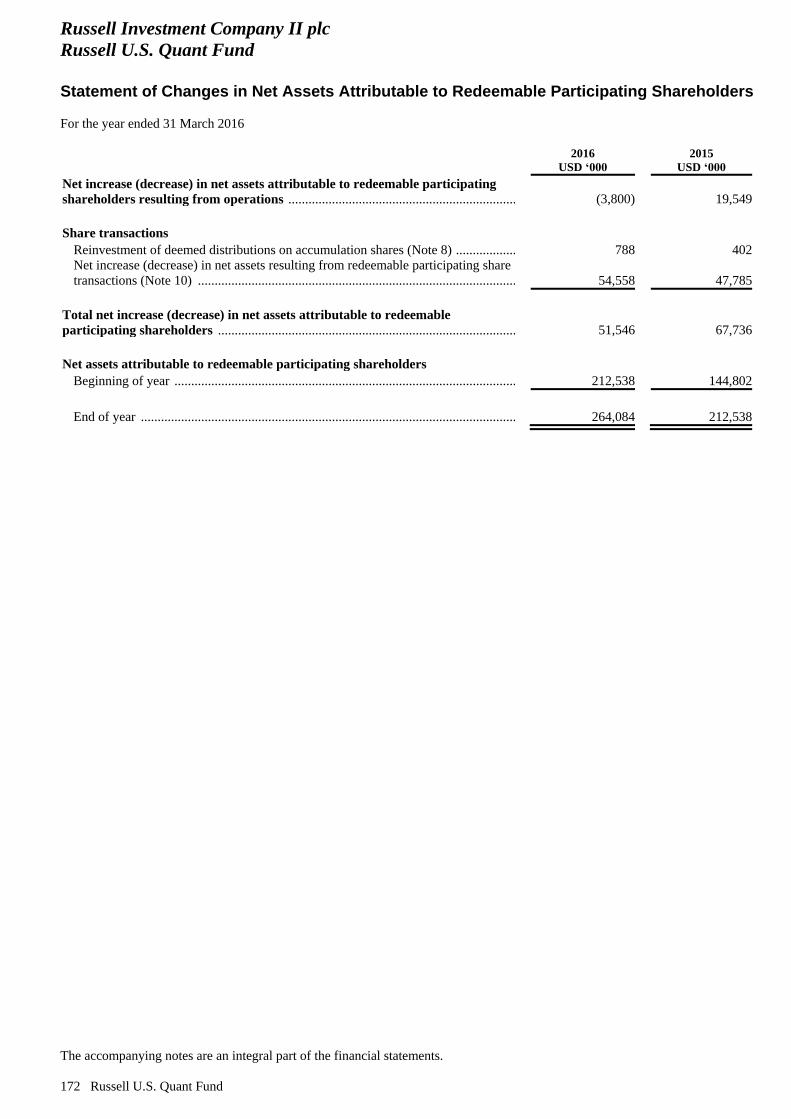
Russell Investment Company II plc
Russell U.S. Quant Fund
Statement of Changes in Net Assets Attributable to Redeemable Participating Shareholders
For the year ended 31 March 2016
The accompanying notes are an integral part of the financial statements.
172 Russell U.S. Quant Fund
2016
USD ‘000 2015
USD ‘000
Net increase (decrease) in net assets attributable to redeemable participating
shareholders resulting from operations ....................................................................... (3,800) 19,549
Share transactions
Reinvestment of deemed distributions on accumulation shares (Note 8) ..................... 788 402
Net increase (decrease) in net assets resulting from redeemable participating share
transactions (Note 10) .................................................................................................. 54,558 47,785
Total net increase (decrease) in net assets attributable to redeemable
participating shareholders ............................................................................................ 51,546 67,736
Net assets attributable to redeemable participating shareholders
Beginning of year ........................................................................................................... 212,538 144,802
End of year ..................................................................................................................... 264,084 212,538
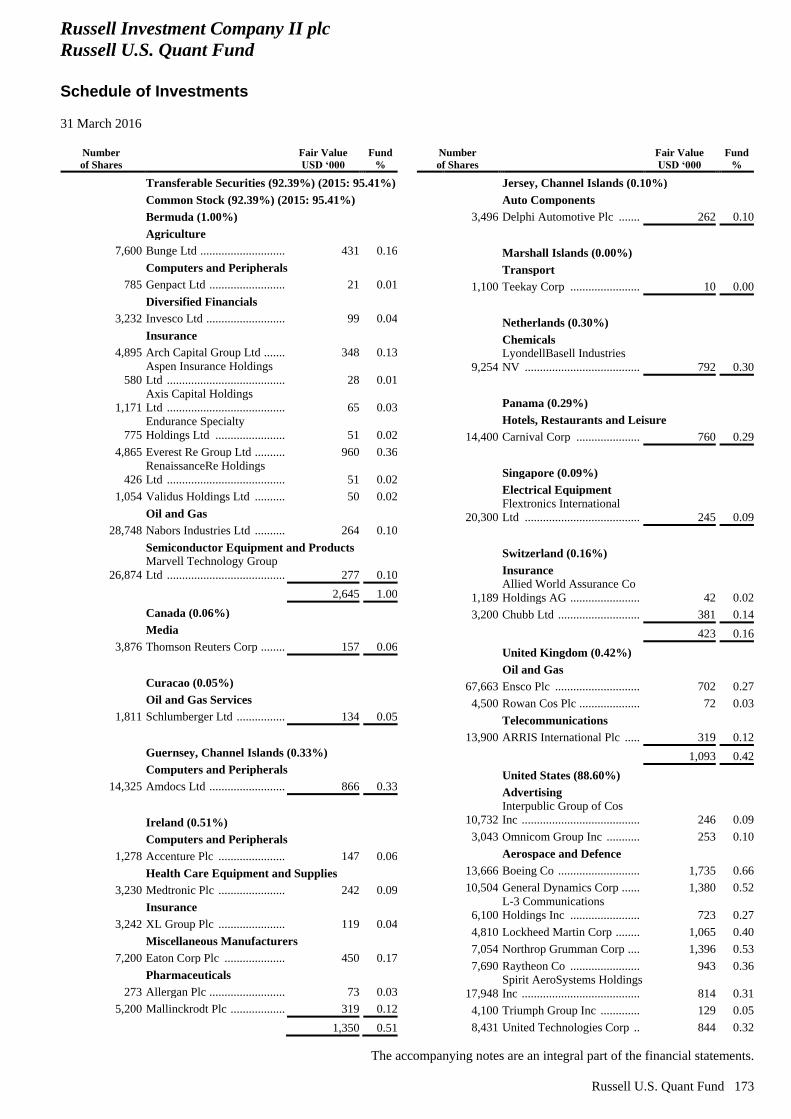
Russell Investment Company II plc
Russell U.S. Quant Fund
Schedule of Investments
31 March 2016
The accompanying notes are an integral part of the financial statements.
Russell U.S. Quant Fund 173
Number
of Shares
Fair Value
USD ‘000
Fund
%
Transferable Securities (92.39%) (2015: 95.41%)
Common Stock (92.39%) (2015: 95.41%)
Bermuda (1.00%)
Agriculture
7,600 Bunge Ltd ............................ 431 0.16
Computers and Peripherals
785 Genpact Ltd ......................... 21 0.01
Diversified Financials
3,232 Invesco Ltd .......................... 99 0.04
Insurance
4,895 Arch Capital Group Ltd ....... 348 0.13
580
Aspen Insurance Holdings
Ltd ....................................... 28 0.01
1,171
Axis Capital Holdings
Ltd ....................................... 65 0.03
775
Endurance Specialty
Holdings Ltd ....................... 51 0.02
4,865 Everest Re Group Ltd .......... 960 0.36
426
RenaissanceRe Holdings
Ltd ....................................... 51 0.02
1,054 Validus Holdings Ltd .......... 50 0.02
Oil and Gas
28,748 Nabors Industries Ltd .......... 264 0.10
Semiconductor Equipment and Products
26,874
Marvell Technology Group
Ltd ....................................... 277 0.10
2,645 1.00
Canada (0.06%)
Media
3,876 Thomson Reuters Corp ........ 157 0.06
Curacao (0.05%)
Oil and Gas Services
1,811 Schlumberger Ltd ................ 134 0.05
Guernsey, Channel Islands (0.33%)
Computers and Peripherals
14,325 Amdocs Ltd ......................... 866 0.33
Ireland (0.51%)
Computers and Peripherals
1,278 Accenture Plc ...................... 147 0.06
Health Care Equipment and Supplies
3,230 Medtronic Plc ...................... 242 0.09
Insurance
3,242 XL Group Plc ...................... 119 0.04
Miscellaneous Manufacturers
7,200 Eaton Corp Plc .................... 450 0.17
Pharmaceuticals
273 Allergan Plc ......................... 73 0.03
5,200 Mallinckrodt Plc .................. 319 0.12
1,350 0.51
Number
of Shares
Fair Value
USD ‘000
Fund
%
Jersey, Channel Islands (0.10%)
Auto Components
3,496 Delphi Automotive Plc ....... 262 0.10
Marshall Islands (0.00%)
Transport
1,100 Teekay Corp ....................... 10 0.00
Netherlands (0.30%)
Chemicals
9,254
LyondellBasell Industries
NV ...................................... 792 0.30
Panama (0.29%)
Hotels, Restaurants and Leisure
14,400 Carnival Corp ..................... 760 0.29
Singapore (0.09%)
Electrical Equipment
20,300
Flextronics International
Ltd ...................................... 245 0.09
Switzerland (0.16%)
Insurance
1,189
Allied World Assurance Co
Holdings AG ....................... 42 0.02
3,200 Chubb Ltd ........................... 381 0.14
423 0.16
United Kingdom (0.42%)
Oil and Gas
67,663 Ensco Plc ............................ 702 0.27
4,500 Rowan Cos Plc .................... 72 0.03
Telecommunications
13,900 ARRIS International Plc ..... 319 0.12
1,093 0.42
United States (88.60%)
Advertising
10,732
Interpublic Group of Cos
Inc ....................................... 246 0.09
3,043 Omnicom Group Inc ........... 253 0.10
Aerospace and Defence
13,666 Boeing Co ........................... 1,735 0.66
10,504 General Dynamics Corp ...... 1,380 0.52
6,100
L-3 Communications
Holdings Inc ....................... 723 0.27
4,810 Lockheed Martin Corp ........ 1,065 0.40
7,054 Northrop Grumman Corp .... 1,396 0.53
7,690 Raytheon Co ....................... 943 0.36
17,948
Spirit AeroSystems Holdings
Inc ....................................... 814 0.31
4,100 Triumph Group Inc ............. 129 0.05
8,431 United Technologies Corp .. 844 0.32
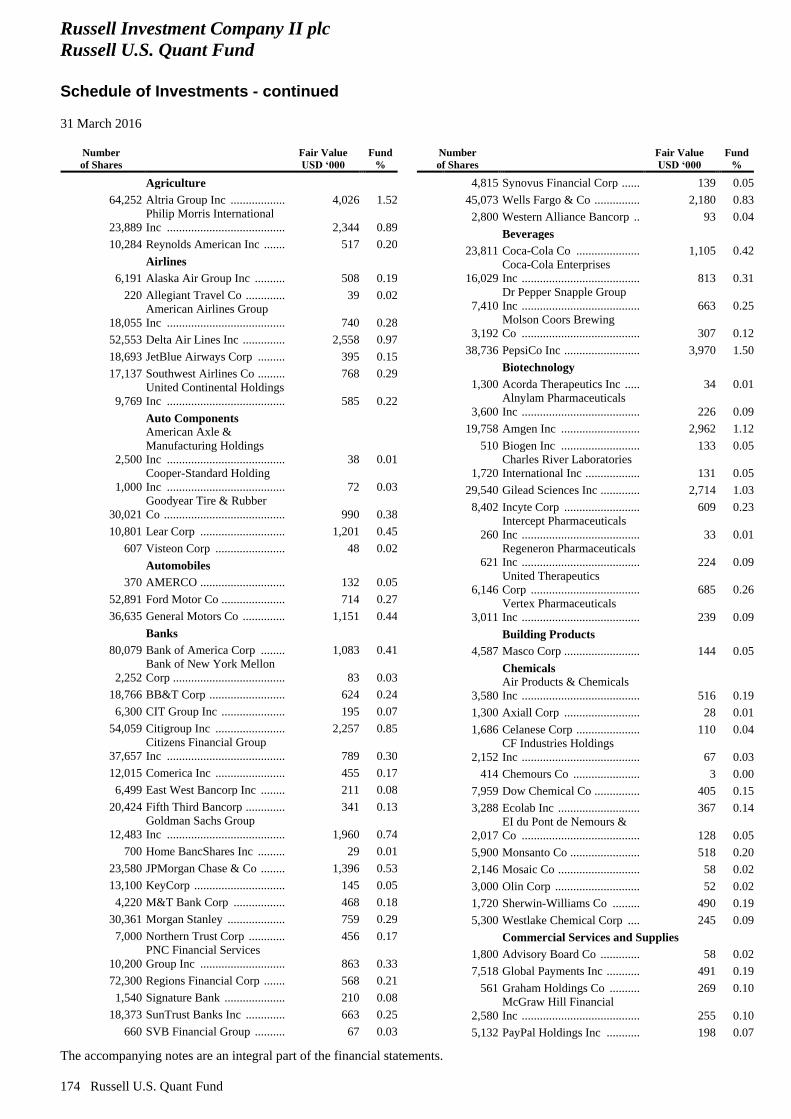
Russell Investment Company II plc
Russell U.S. Quant Fund
Schedule of Investments - continued
31 March 2016
The accompanying notes are an integral part of the financial statements.
174 Russell U.S. Quant Fund
Number
of Shares
Fair Value
USD ‘000
Fund
%
Agriculture
64,252 Altria Group Inc .................. 4,026 1.52
23,889
Philip Morris International
Inc ....................................... 2,344 0.89
10,284 Reynolds American Inc ....... 517 0.20
Airlines
6,191 Alaska Air Group Inc .......... 508 0.19
220 Allegiant Travel Co ............. 39 0.02
18,055
American Airlines Group
Inc ....................................... 740 0.28
52,553 Delta Air Lines Inc .............. 2,558 0.97
18,693 JetBlue Airways Corp ......... 395 0.15
17,137 Southwest Airlines Co ......... 768 0.29
9,769
United Continental Holdings
Inc ....................................... 585 0.22
Auto Components
2,500
American Axle &
Manufacturing Holdings
Inc ....................................... 38 0.01
1,000
Cooper-Standard Holding
Inc ....................................... 72 0.03
30,021
Goodyear Tire & Rubber
Co ........................................ 990 0.38
10,801 Lear Corp ............................ 1,201 0.45
607 Visteon Corp ....................... 48 0.02
Automobiles
370 AMERCO ............................ 132 0.05
52,891 Ford Motor Co ..................... 714 0.27
36,635 General Motors Co .............. 1,151 0.44
Banks
80,079 Bank of America Corp ........ 1,083 0.41
2,252
Bank of New York Mellon
Corp ..................................... 83 0.03
18,766 BB&T Corp ......................... 624 0.24
6,300 CIT Group Inc ..................... 195 0.07
54,059 Citigroup Inc ....................... 2,257 0.85
37,657
Citizens Financial Group
Inc ....................................... 789 0.30
12,015 Comerica Inc ....................... 455 0.17
6,499 East West Bancorp Inc ........ 211 0.08
20,424 Fifth Third Bancorp ............. 341 0.13
12,483
Goldman Sachs Group
Inc ....................................... 1,960 0.74
700 Home BancShares Inc ......... 29 0.01
23,580 JPMorgan Chase & Co ........ 1,396 0.53
13,100 KeyCorp .............................. 145 0.05
4,220 M&T Bank Corp ................. 468 0.18
30,361 Morgan Stanley ................... 759 0.29
7,000 Northern Trust Corp ............ 456 0.17
10,200
PNC Financial Services
Group Inc ............................ 863 0.33
72,300 Regions Financial Corp ....... 568 0.21
1,540 Signature Bank .................... 210 0.08
18,373 SunTrust Banks Inc ............. 663 0.25
660 SVB Financial Group .......... 67 0.03
Number
of Shares
Fair Value
USD ‘000
Fund
%
4,815 Synovus Financial Corp ...... 139 0.05
45,073 Wells Fargo & Co ............... 2,180 0.83
2,800 Western Alliance Bancorp .. 93 0.04
Beverages
23,811 Coca-Cola Co ..................... 1,105 0.42
16,029
Coca-Cola Enterprises
Inc ....................................... 813 0.31
7,410
Dr Pepper Snapple Group
Inc ....................................... 663 0.25
3,192
Molson Coors Brewing
Co ....................................... 307 0.12
38,736 PepsiCo Inc ......................... 3,970 1.50
Biotechnology
1,300 Acorda Therapeutics Inc ..... 34 0.01
3,600
Alnylam Pharmaceuticals
Inc ....................................... 226 0.09
19,758 Amgen Inc .......................... 2,962 1.12
510 Biogen Inc .......................... 133 0.05
1,720
Charles River Laboratories
International Inc .................. 131 0.05
29,540 Gilead Sciences Inc ............. 2,714 1.03
8,402 Incyte Corp ......................... 609 0.23
260
Intercept Pharmaceuticals
Inc ....................................... 33 0.01
621
Regeneron Pharmaceuticals
Inc ....................................... 224 0.09
6,146
United Therapeutics
Corp .................................... 685 0.26
3,011
Vertex Pharmaceuticals
Inc ....................................... 239 0.09
Building Products
4,587 Masco Corp ......................... 144 0.05
Chemicals
3,580
Air Products & Chemicals
Inc ....................................... 516 0.19
1,300 Axiall Corp ......................... 28 0.01
1,686 Celanese Corp ..................... 110 0.04
2,152
CF Industries Holdings
Inc ....................................... 67 0.03
414 Chemours Co ...................... 3 0.00
7,959 Dow Chemical Co ............... 405 0.15
3,288 Ecolab Inc ........................... 367 0.14
2,017
EI du Pont de Nemours &
Co ....................................... 128 0.05
5,900 Monsanto Co ....................... 518 0.20
2,146 Mosaic Co ........................... 58 0.02
3,000 Olin Corp ............................ 52 0.02
1,720 Sherwin-Williams Co ......... 490 0.19
5,300 Westlake Chemical Corp .... 245 0.09
Commercial Services and Supplies
1,800 Advisory Board Co ............. 58 0.02
7,518 Global Payments Inc ........... 491 0.19
561 Graham Holdings Co .......... 269 0.10
2,580
McGraw Hill Financial
Inc ....................................... 255 0.10
5,132 PayPal Holdings Inc ........... 198 0.07
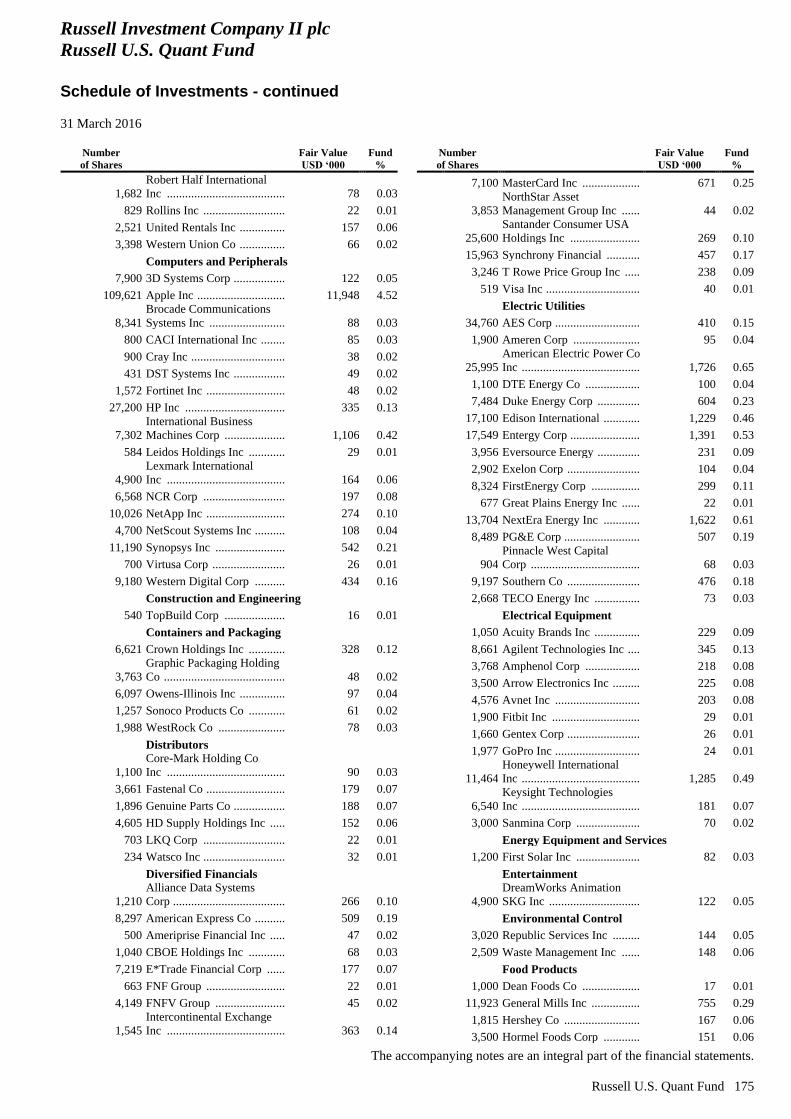
Russell Investment Company II plc
Russell U.S. Quant Fund
Schedule of Investments - continued
31 March 2016
The accompanying notes are an integral part of the financial statements.
Russell U.S. Quant Fund 175
Number
of Shares
Fair Value
USD ‘000
Fund
%
1,682
Robert Half International
Inc ....................................... 78 0.03
829 Rollins Inc ........................... 22 0.01
2,521 United Rentals Inc ............... 157 0.06
3,398 Western Union Co ............... 66 0.02
Computers and Peripherals
7,900 3D Systems Corp ................. 122 0.05
109,621 Apple Inc ............................. 11,948 4.52
8,341
Brocade Communications
Systems Inc ......................... 88 0.03
800 CACI International Inc ........ 85 0.03
900 Cray Inc ............................... 38 0.02
431 DST Systems Inc ................. 49 0.02
1,572 Fortinet Inc .......................... 48 0.02
27,200 HP Inc ................................. 335 0.13
7,302
International Business
Machines Corp .................... 1,106 0.42
584 Leidos Holdings Inc ............ 29 0.01
4,900
Lexmark International
Inc ....................................... 164 0.06
6,568 NCR Corp ........................... 197 0.08
10,026 NetApp Inc .......................... 274 0.10
4,700 NetScout Systems Inc .......... 108 0.04
11,190 Synopsys Inc ....................... 542 0.21
700 Virtusa Corp ........................ 26 0.01
9,180 Western Digital Corp .......... 434 0.16
Construction and Engineering
540 TopBuild Corp .................... 16 0.01
Containers and Packaging
6,621 Crown Holdings Inc ............ 328 0.12
3,763
Graphic Packaging Holding
Co ........................................ 48 0.02
6,097 Owens-Illinois Inc ............... 97 0.04
1,257 Sonoco Products Co ............ 61 0.02
1,988 WestRock Co ...................... 78 0.03
Distributors
1,100
Core-Mark Holding Co
Inc ....................................... 90 0.03
3,661 Fastenal Co .......................... 179 0.07
1,896 Genuine Parts Co ................. 188 0.07
4,605 HD Supply Holdings Inc ..... 152 0.06
703 LKQ Corp ........................... 22 0.01
234 Watsco Inc ........................... 32 0.01
Diversified Financials
1,210
Alliance Data Systems
Corp ..................................... 266 0.10
8,297 American Express Co .......... 509 0.19
500 Ameriprise Financial Inc ..... 47 0.02
1,040 CBOE Holdings Inc ............ 68 0.03
7,219 E*Trade Financial Corp ...... 177 0.07
663 FNF Group .......................... 22 0.01
4,149 FNFV Group ....................... 45 0.02
1,545
Intercontinental Exchange
Inc ....................................... 363 0.14
Number
of Shares
Fair Value
USD ‘000
Fund
%
7,100 MasterCard Inc ................... 671 0.25
3,853
NorthStar Asset
Management Group Inc ...... 44 0.02
25,600
Santander Consumer USA
Holdings Inc ....................... 269 0.10
15,963 Synchrony Financial ........... 457 0.17
3,246 T Rowe Price Group Inc ..... 238 0.09
519 Visa Inc ............................... 40 0.01
Electric Utilities
34,760 AES Corp ............................ 410 0.15
1,900 Ameren Corp ...................... 95 0.04
25,995
American Electric Power Co
Inc ....................................... 1,726 0.65
1,100 DTE Energy Co .................. 100 0.04
7,484 Duke Energy Corp .............. 604 0.23
17,100 Edison International ............ 1,229 0.46
17,549 Entergy Corp ....................... 1,391 0.53
3,956 Eversource Energy .............. 231 0.09
2,902 Exelon Corp ........................ 104 0.04
8,324 FirstEnergy Corp ................ 299 0.11
677 Great Plains Energy Inc ...... 22 0.01
13,704 NextEra Energy Inc ............ 1,622 0.61
8,489 PG&E Corp ......................... 507 0.19
904
Pinnacle West Capital
Corp .................................... 68 0.03
9,197 Southern Co ........................ 476 0.18
2,668 TECO Energy Inc ............... 73 0.03
Electrical Equipment
1,050 Acuity Brands Inc ............... 229 0.09
8,661 Agilent Technologies Inc .... 345 0.13
3,768 Amphenol Corp .................. 218 0.08
3,500 Arrow Electronics Inc ......... 225 0.08
4,576 Avnet Inc ............................ 203 0.08
1,900 Fitbit Inc ............................. 29 0.01
1,660 Gentex Corp ........................ 26 0.01
1,977 GoPro Inc ............................ 24 0.01
11,464
Honeywell International
Inc ....................................... 1,285 0.49
6,540
Keysight Technologies
Inc ....................................... 181 0.07
3,000 Sanmina Corp ..................... 70 0.02
Energy Equipment and Services
1,200 First Solar Inc ..................... 82 0.03
Entertainment
4,900
DreamWorks Animation
SKG Inc .............................. 122 0.05
Environmental Control
3,020 Republic Services Inc ......... 144 0.05
2,509 Waste Management Inc ...... 148 0.06
Food Products
1,000 Dean Foods Co ................... 17 0.01
11,923 General Mills Inc ................ 755 0.29
1,815 Hershey Co ......................... 167 0.06
3,500 Hormel Foods Corp ............ 151 0.06
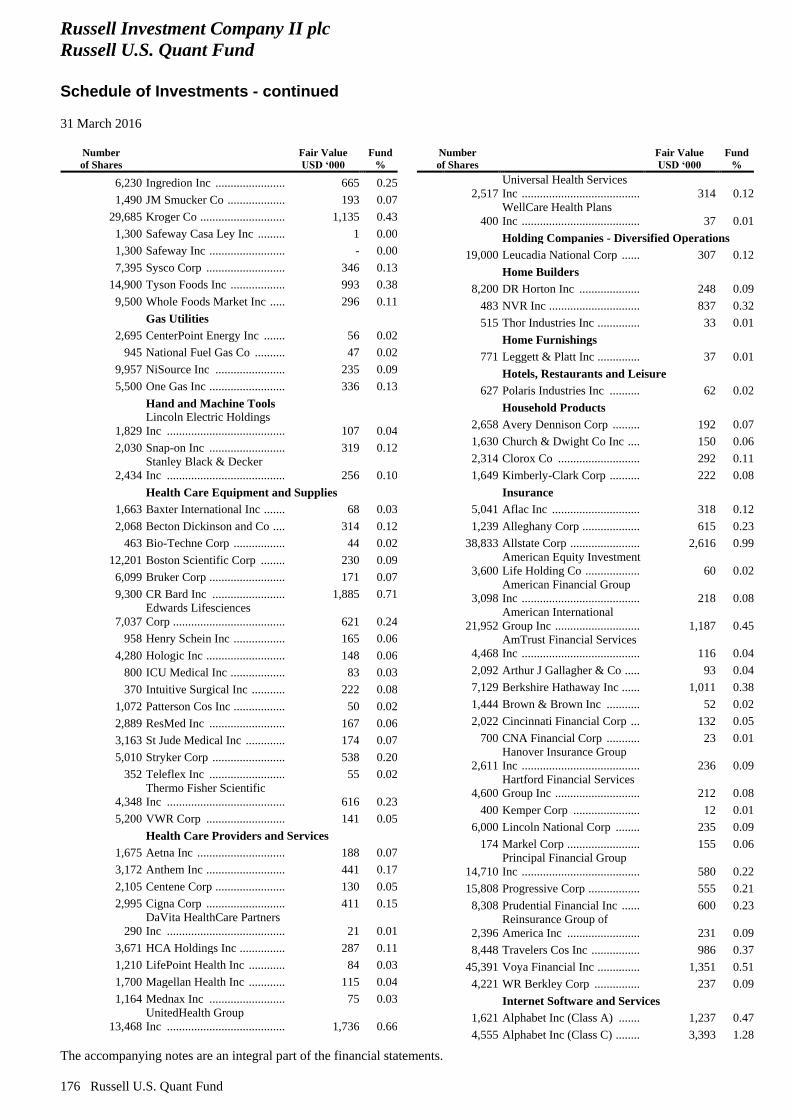
Russell Investment Company II plc
Russell U.S. Quant Fund
Schedule of Investments - continued
31 March 2016
The accompanying notes are an integral part of the financial statements.
176 Russell U.S. Quant Fund
Number
of Shares
Fair Value
USD ‘000
Fund
%
6,230 Ingredion Inc ....................... 665 0.25
1,490 JM Smucker Co ................... 193 0.07
29,685 Kroger Co ............................ 1,135 0.43
1,300 Safeway Casa Ley Inc ......... 1 0.00
1,300 Safeway Inc ......................... - 0.00
7,395 Sysco Corp .......................... 346 0.13
14,900 Tyson Foods Inc .................. 993 0.38
9,500 Whole Foods Market Inc ..... 296 0.11
Gas Utilities
2,695 CenterPoint Energy Inc ....... 56 0.02
945 National Fuel Gas Co .......... 47 0.02
9,957 NiSource Inc ....................... 235 0.09
5,500 One Gas Inc ......................... 336 0.13
Hand and Machine Tools
1,829
Lincoln Electric Holdings
Inc ....................................... 107 0.04
2,030 Snap-on Inc ......................... 319 0.12
2,434
Stanley Black & Decker
Inc ....................................... 256 0.10
Health Care Equipment and Supplies
1,663 Baxter International Inc ....... 68 0.03
2,068 Becton Dickinson and Co .... 314 0.12
463 Bio-Techne Corp ................. 44 0.02
12,201 Boston Scientific Corp ........ 230 0.09
6,099 Bruker Corp ......................... 171 0.07
9,300 CR Bard Inc ........................ 1,885 0.71
7,037
Edwards Lifesciences
Corp ..................................... 621 0.24
958 Henry Schein Inc ................. 165 0.06
4,280 Hologic Inc .......................... 148 0.06
800 ICU Medical Inc .................. 83 0.03
370 Intuitive Surgical Inc ........... 222 0.08
1,072 Patterson Cos Inc ................. 50 0.02
2,889 ResMed Inc ......................... 167 0.06
3,163 St Jude Medical Inc ............. 174 0.07
5,010 Stryker Corp ........................ 538 0.20
352 Teleflex Inc ......................... 55 0.02
4,348
Thermo Fisher Scientific
Inc ....................................... 616 0.23
5,200 VWR Corp .......................... 141 0.05
Health Care Providers and Services
1,675 Aetna Inc ............................. 188 0.07
3,172 Anthem Inc .......................... 441 0.17
2,105 Centene Corp ....................... 130 0.05
2,995 Cigna Corp .......................... 411 0.15
290
DaVita HealthCare Partners
Inc ....................................... 21 0.01
3,671 HCA Holdings Inc ............... 287 0.11
1,210 LifePoint Health Inc ............ 84 0.03
1,700 Magellan Health Inc ............ 115 0.04
1,164 Mednax Inc ......................... 75 0.03
13,468
UnitedHealth Group
Inc ....................................... 1,736 0.66
Number
of Shares
Fair Value
USD ‘000
Fund
%
2,517
Universal Health Services
Inc ....................................... 314 0.12
400
WellCare Health Plans
Inc ....................................... 37 0.01
Holding Companies - Diversified Operations
19,000 Leucadia National Corp ...... 307 0.12
Home Builders
8,200 DR Horton Inc .................... 248 0.09
483 NVR Inc .............................. 837 0.32
515 Thor Industries Inc .............. 33 0.01
Home Furnishings
771 Leggett & Platt Inc .............. 37 0.01
Hotels, Restaurants and Leisure
627 Polaris Industries Inc .......... 62 0.02
Household Products
2,658 Avery Dennison Corp ......... 192 0.07
1,630 Church & Dwight Co Inc .... 150 0.06
2,314 Clorox Co ........................... 292 0.11
1,649 Kimberly-Clark Corp .......... 222 0.08
Insurance
5,041 Aflac Inc ............................. 318 0.12
1,239 Alleghany Corp ................... 615 0.23
38,833 Allstate Corp ....................... 2,616 0.99
3,600
American Equity Investment
Life Holding Co .................. 60 0.02
3,098
American Financial Group
Inc ....................................... 218 0.08
21,952
American International
Group Inc ............................ 1,187 0.45
4,468
AmTrust Financial Services
Inc ....................................... 116 0.04
2,092 Arthur J Gallagher & Co ..... 93 0.04
7,129 Berkshire Hathaway Inc ...... 1,011 0.38
1,444 Brown & Brown Inc ........... 52 0.02
2,022 Cincinnati Financial Corp ... 132 0.05
700 CNA Financial Corp ........... 23 0.01
2,611
Hanover Insurance Group
Inc ....................................... 236 0.09
4,600
Hartford Financial Services
Group Inc ............................ 212 0.08
400 Kemper Corp ...................... 12 0.01
6,000 Lincoln National Corp ........ 235 0.09
174 Markel Corp ........................ 155 0.06
14,710
Principal Financial Group
Inc ....................................... 580 0.22
15,808 Progressive Corp ................. 555 0.21
8,308 Prudential Financial Inc ...... 600 0.23
2,396
Reinsurance Group of
America Inc ........................ 231 0.09
8,448 Travelers Cos Inc ................ 986 0.37
45,391 Voya Financial Inc .............. 1,351 0.51
4,221 WR Berkley Corp ............... 237 0.09
Internet Software and Services
1,621 Alphabet Inc (Class A) ....... 1,237 0.47
4,555 Alphabet Inc (Class C) ........ 3,393 1.28
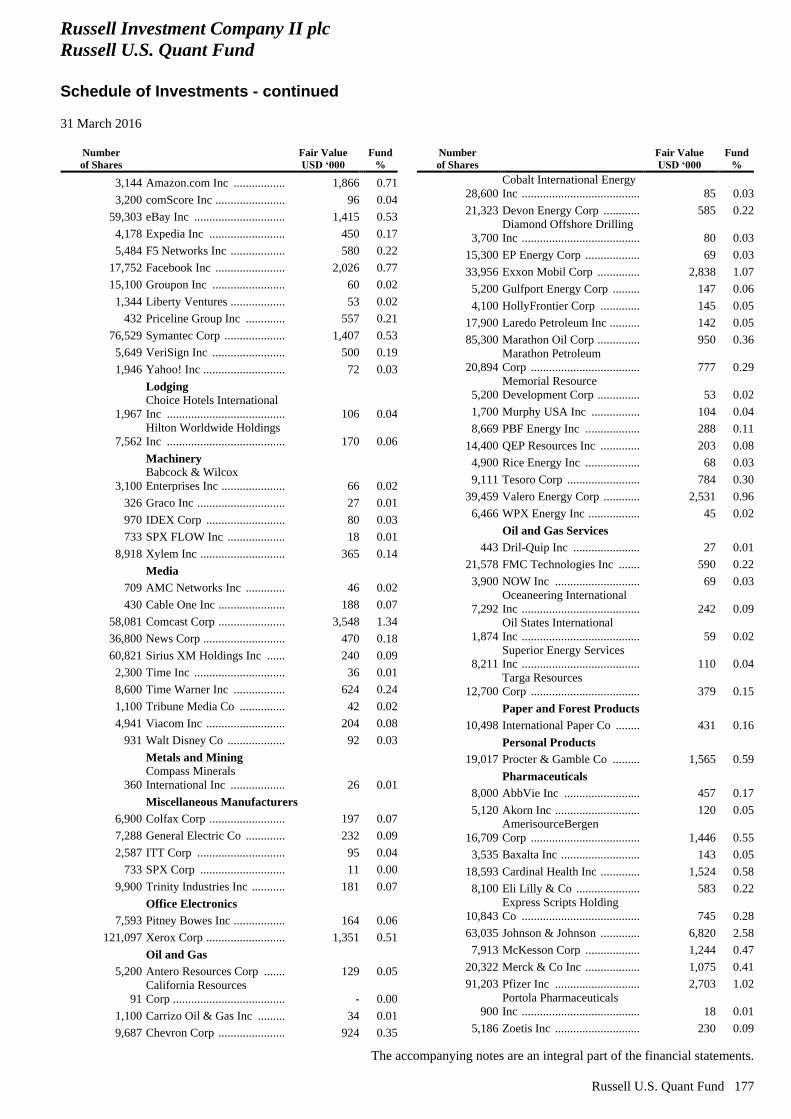
Russell Investment Company II plc
Russell U.S. Quant Fund
Schedule of Investments - continued
31 March 2016
The accompanying notes are an integral part of the financial statements.
Russell U.S. Quant Fund 177
Number
of Shares
Fair Value
USD ‘000
Fund
%
3,144 Amazon.com Inc ................. 1,866 0.71
3,200 comScore Inc ....................... 96 0.04
59,303 eBay Inc .............................. 1,415 0.53
4,178 Expedia Inc ......................... 450 0.17
5,484 F5 Networks Inc .................. 580 0.22
17,752 Facebook Inc ....................... 2,026 0.77
15,100 Groupon Inc ........................ 60 0.02
1,344 Liberty Ventures .................. 53 0.02
432 Priceline Group Inc ............. 557 0.21
76,529 Symantec Corp .................... 1,407 0.53
5,649 VeriSign Inc ........................ 500 0.19
1,946 Yahoo! Inc ........................... 72 0.03
Lodging
1,967
Choice Hotels International
Inc ....................................... 106 0.04
7,562
Hilton Worldwide Holdings
Inc ....................................... 170 0.06
Machinery
3,100
Babcock & Wilcox
Enterprises Inc ..................... 66 0.02
326 Graco Inc ............................. 27 0.01
970 IDEX Corp .......................... 80 0.03
733 SPX FLOW Inc ................... 18 0.01
8,918 Xylem Inc ............................ 365 0.14
Media
709 AMC Networks Inc ............. 46 0.02
430 Cable One Inc ...................... 188 0.07
58,081 Comcast Corp ...................... 3,548 1.34
36,800 News Corp ........................... 470 0.18
60,821 Sirius XM Holdings Inc ...... 240 0.09
2,300 Time Inc .............................. 36 0.01
8,600 Time Warner Inc ................. 624 0.24
1,100 Tribune Media Co ............... 42 0.02
4,941 Viacom Inc .......................... 204 0.08
931 Walt Disney Co ................... 92 0.03
Metals and Mining
360
Compass Minerals
International Inc .................. 26 0.01
Miscellaneous Manufacturers
6,900 Colfax Corp ......................... 197 0.07
7,288 General Electric Co ............. 232 0.09
2,587 ITT Corp ............................. 95 0.04
733 SPX Corp ............................ 11 0.00
9,900 Trinity Industries Inc ........... 181 0.07
Office Electronics
7,593 Pitney Bowes Inc ................. 164 0.06
121,097 Xerox Corp .......................... 1,351 0.51
Oil and Gas
5,200 Antero Resources Corp ....... 129 0.05
91
California Resources
Corp ..................................... - 0.00
1,100 Carrizo Oil & Gas Inc ......... 34 0.01
9,687 Chevron Corp ...................... 924 0.35
Number
of Shares
Fair Value
USD ‘000
Fund
%
28,600
Cobalt International Energy
Inc ....................................... 85 0.03
21,323 Devon Energy Corp ............ 585 0.22
3,700
Diamond Offshore Drilling
Inc ....................................... 80 0.03
15,300 EP Energy Corp .................. 69 0.03
33,956 Exxon Mobil Corp .............. 2,838 1.07
5,200 Gulfport Energy Corp ......... 147 0.06
4,100 HollyFrontier Corp ............. 145 0.05
17,900 Laredo Petroleum Inc .......... 142 0.05
85,300 Marathon Oil Corp .............. 950 0.36
20,894
Marathon Petroleum
Corp .................................... 777 0.29
5,200
Memorial Resource
Development Corp .............. 53 0.02
1,700 Murphy USA Inc ................ 104 0.04
8,669 PBF Energy Inc .................. 288 0.11
14,400 QEP Resources Inc ............. 203 0.08
4,900 Rice Energy Inc .................. 68 0.03
9,111 Tesoro Corp ........................ 784 0.30
39,459 Valero Energy Corp ............ 2,531 0.96
6,466 WPX Energy Inc ................. 45 0.02
Oil and Gas Services
443 Dril-Quip Inc ...................... 27 0.01
21,578 FMC Technologies Inc ....... 590 0.22
3,900 NOW Inc ............................ 69 0.03
7,292
Oceaneering International
Inc ....................................... 242 0.09
1,874
Oil States International
Inc ....................................... 59 0.02
8,211
Superior Energy Services
Inc ....................................... 110 0.04
12,700
Targa Resources
Corp .................................... 379 0.15
Paper and Forest Products
10,498 International Paper Co ........ 431 0.16
Personal Products
19,017 Procter & Gamble Co ......... 1,565 0.59
Pharmaceuticals
8,000 AbbVie Inc ......................... 457 0.17
5,120 Akorn Inc ............................ 120 0.05
16,709
AmerisourceBergen
Corp .................................... 1,446 0.55
3,535 Baxalta Inc .......................... 143 0.05
18,593 Cardinal Health Inc ............. 1,524 0.58
8,100 Eli Lilly & Co ..................... 583 0.22
10,843
Express Scripts Holding
Co ....................................... 745 0.28
63,035 Johnson & Johnson ............. 6,820 2.58
7,913 McKesson Corp .................. 1,244 0.47
20,322 Merck & Co Inc .................. 1,075 0.41
91,203 Pfizer Inc ............................ 2,703 1.02
900
Portola Pharmaceuticals
Inc ....................................... 18 0.01
5,186 Zoetis Inc ............................ 230 0.09
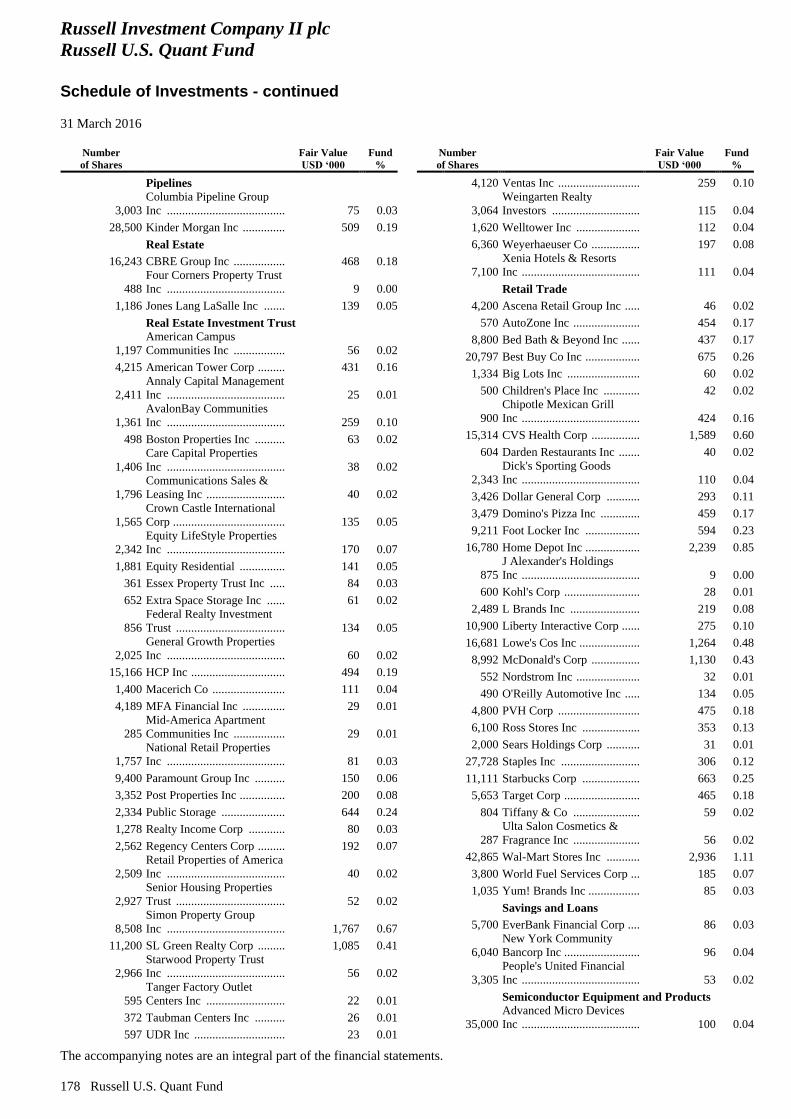
Russell Investment Company II plc
Russell U.S. Quant Fund
Schedule of Investments - continued
31 March 2016
The accompanying notes are an integral part of the financial statements.
178 Russell U.S. Quant Fund
Number
of Shares
Fair Value
USD ‘000
Fund
%
Pipelines
3,003
Columbia Pipeline Group
Inc ....................................... 75 0.03
28,500 Kinder Morgan Inc .............. 509 0.19
Real Estate
16,243 CBRE Group Inc ................. 468 0.18
488
Four Corners Property Trust
Inc ....................................... 9 0.00
1,186 Jones Lang LaSalle Inc ....... 139 0.05
Real Estate Investment Trust
1,197
American Campus
Communities Inc ................. 56 0.02
4,215 American Tower Corp ......... 431 0.16
2,411
Annaly Capital Management
Inc ....................................... 25 0.01
1,361
AvalonBay Communities
Inc ....................................... 259 0.10
498 Boston Properties Inc .......... 63 0.02
1,406
Care Capital Properties
Inc ....................................... 38 0.02
1,796
Communications Sales &
Leasing Inc .......................... 40 0.02
1,565
Crown Castle International
Corp ..................................... 135 0.05
2,342
Equity LifeStyle Properties
Inc ....................................... 170 0.07
1,881 Equity Residential ............... 141 0.05
361 Essex Property Trust Inc ..... 84 0.03
652 Extra Space Storage Inc ...... 61 0.02
856
Federal Realty Investment
Trust .................................... 134 0.05
2,025
General Growth Properties
Inc ....................................... 60 0.02
15,166 HCP Inc ............................... 494 0.19
1,400 Macerich Co ........................ 111 0.04
4,189 MFA Financial Inc .............. 29 0.01
285
Mid-America Apartment
Communities Inc ................. 29 0.01
1,757
National Retail Properties
Inc ....................................... 81 0.03
9,400 Paramount Group Inc .......... 150 0.06
3,352 Post Properties Inc ............... 200 0.08
2,334 Public Storage ..................... 644 0.24
1,278 Realty Income Corp ............ 80 0.03
2,562 Regency Centers Corp ......... 192 0.07
2,509
Retail Properties of America
Inc ....................................... 40 0.02
2,927
Senior Housing Properties
Trust .................................... 52 0.02
8,508
Simon Property Group
Inc ....................................... 1,767 0.67
11,200 SL Green Realty Corp ......... 1,085 0.41
2,966
Starwood Property Trust
Inc ....................................... 56 0.02
595
Tanger Factory Outlet
Centers Inc .......................... 22 0.01
372 Taubman Centers Inc .......... 26 0.01
597 UDR Inc .............................. 23 0.01
Number
of Shares
Fair Value
USD ‘000
Fund
%
4,120 Ventas Inc ........................... 259 0.10
3,064
Weingarten Realty
Investors ............................. 115 0.04
1,620 Welltower Inc ..................... 112 0.04
6,360 Weyerhaeuser Co ................ 197 0.08
7,100
Xenia Hotels & Resorts
Inc ....................................... 111 0.04
Retail Trade
4,200 Ascena Retail Group Inc ..... 46 0.02
570 AutoZone Inc ...................... 454 0.17
8,800 Bed Bath & Beyond Inc ...... 437 0.17
20,797 Best Buy Co Inc .................. 675 0.26
1,334 Big Lots Inc ........................ 60 0.02
500 Children's Place Inc ............ 42 0.02
900
Chipotle Mexican Grill
Inc ....................................... 424 0.16
15,314 CVS Health Corp ................ 1,589 0.60
604 Darden Restaurants Inc ....... 40 0.02
2,343
Dick's Sporting Goods
Inc ....................................... 110 0.04
3,426 Dollar General Corp ........... 293 0.11
3,479 Domino's Pizza Inc ............. 459 0.17
9,211 Foot Locker Inc .................. 594 0.23
16,780 Home Depot Inc .................. 2,239 0.85
875
J Alexander's Holdings
Inc ....................................... 9 0.00
600 Kohl's Corp ......................... 28 0.01
2,489 L Brands Inc ....................... 219 0.08
10,900 Liberty Interactive Corp ...... 275 0.10
16,681 Lowe's Cos Inc .................... 1,264 0.48
8,992 McDonald's Corp ................ 1,130 0.43
552 Nordstrom Inc ..................... 32 0.01
490 O'Reilly Automotive Inc ..... 134 0.05
4,800 PVH Corp ........................... 475 0.18
6,100 Ross Stores Inc ................... 353 0.13
2,000 Sears Holdings Corp ........... 31 0.01
27,728 Staples Inc .......................... 306 0.12
11,111 Starbucks Corp ................... 663 0.25
5,653 Target Corp ......................... 465 0.18
804 Tiffany & Co ...................... 59 0.02
287
Ulta Salon Cosmetics &
Fragrance Inc ...................... 56 0.02
42,865 Wal-Mart Stores Inc ........... 2,936 1.11
3,800 World Fuel Services Corp ... 185 0.07
1,035 Yum! Brands Inc ................. 85 0.03
Savings and Loans
5,700 EverBank Financial Corp .... 86 0.03
6,040
New York Community
Bancorp Inc ......................... 96 0.04
3,305
People's United Financial
Inc ....................................... 53 0.02
Semiconductor Equipment and Products
35,000
Advanced Micro Devices
Inc ....................................... 100 0.04
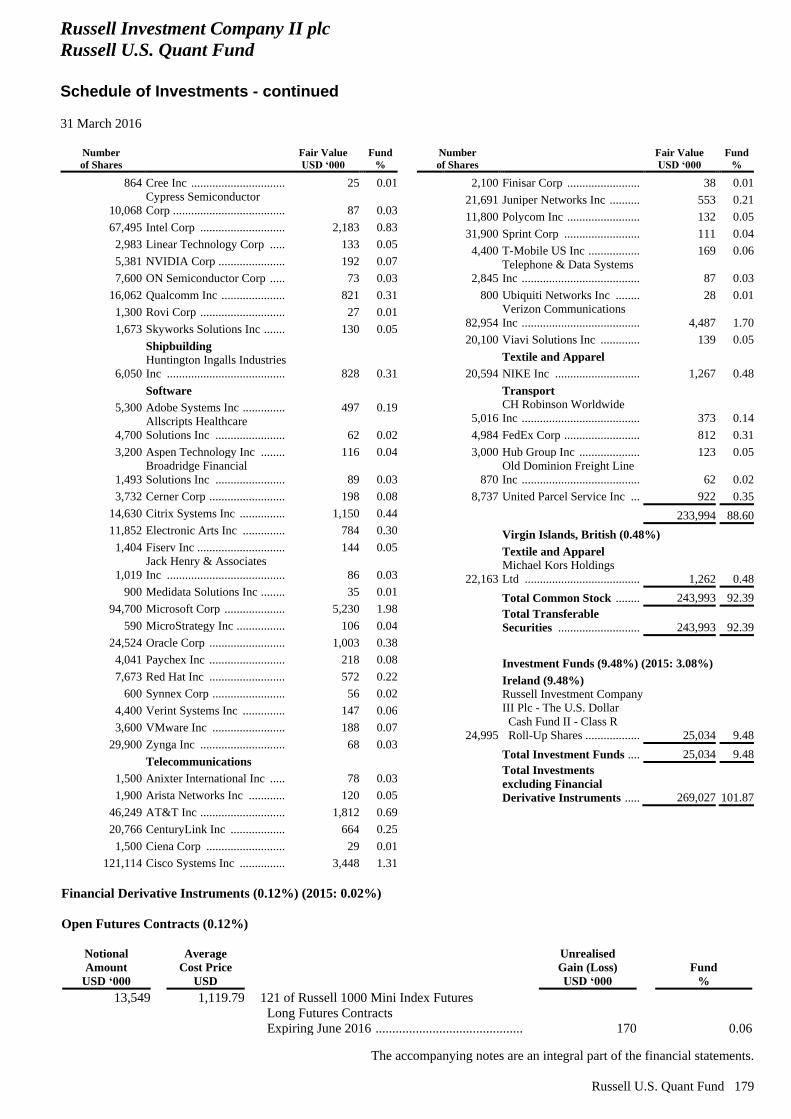
Russell Investment Company II plc
Russell U.S. Quant Fund
Schedule of Investments - continued
31 March 2016
The accompanying notes are an integral part of the financial statements.
Russell U.S. Quant Fund 179
Number
of Shares
Fair Value
USD ‘000
Fund
%
864 Cree Inc ............................... 25 0.01
10,068
Cypress Semiconductor
Corp ..................................... 87 0.03
67,495 Intel Corp ............................ 2,183 0.83
2,983 Linear Technology Corp ..... 133 0.05
5,381 NVIDIA Corp ...................... 192 0.07
7,600 ON Semiconductor Corp ..... 73 0.03
16,062 Qualcomm Inc ..................... 821 0.31
1,300 Rovi Corp ............................ 27 0.01
1,673 Skyworks Solutions Inc ....... 130 0.05
Shipbuilding
6,050
Huntington Ingalls Industries
Inc ....................................... 828 0.31
Software
5,300 Adobe Systems Inc .............. 497 0.19
4,700
Allscripts Healthcare
Solutions Inc ....................... 62 0.02
3,200 Aspen Technology Inc ........ 116 0.04
1,493
Broadridge Financial
Solutions Inc ....................... 89 0.03
3,732 Cerner Corp ......................... 198 0.08
14,630 Citrix Systems Inc ............... 1,150 0.44
11,852 Electronic Arts Inc .............. 784 0.30
1,404 Fiserv Inc ............................. 144 0.05
1,019
Jack Henry & Associates
Inc ....................................... 86 0.03
900 Medidata Solutions Inc ........ 35 0.01
94,700 Microsoft Corp .................... 5,230 1.98
590 MicroStrategy Inc ................ 106 0.04
24,524 Oracle Corp ......................... 1,003 0.38
4,041 Paychex Inc ......................... 218 0.08
7,673 Red Hat Inc ......................... 572 0.22
600 Synnex Corp ........................ 56 0.02
4,400 Verint Systems Inc .............. 147 0.06
3,600 VMware Inc ........................ 188 0.07
29,900 Zynga Inc ............................ 68 0.03
Telecommunications
1,500 Anixter International Inc ..... 78 0.03
1,900 Arista Networks Inc ............ 120 0.05
46,249 AT&T Inc ............................ 1,812 0.69
20,766 CenturyLink Inc .................. 664 0.25
1,500 Ciena Corp .......................... 29 0.01
121,114 Cisco Systems Inc ............... 3,448 1.31
Number
of Shares
Fair Value
USD ‘000
Fund
%
2,100 Finisar Corp ........................ 38 0.01
21,691 Juniper Networks Inc .......... 553 0.21
11,800 Polycom Inc ........................ 132 0.05
31,900 Sprint Corp ......................... 111 0.04
4,400 T-Mobile US Inc ................. 169 0.06
2,845
Telephone & Data Systems
Inc ....................................... 87 0.03
800 Ubiquiti Networks Inc ........ 28 0.01
82,954
Verizon Communications
Inc ....................................... 4,487 1.70
20,100 Viavi Solutions Inc ............. 139 0.05
Textile and Apparel
20,594 NIKE Inc ............................ 1,267 0.48
Transport
5,016
CH Robinson Worldwide
Inc ....................................... 373 0.14
4,984 FedEx Corp ......................... 812 0.31
3,000 Hub Group Inc .................... 123 0.05
870
Old Dominion Freight Line
Inc ....................................... 62 0.02
8,737 United Parcel Service Inc ... 922 0.35
233,994 88.60
Virgin Islands, British (0.48%)
Textile and Apparel
22,163
Michael Kors Holdings
Ltd ...................................... 1,262 0.48
Total Common Stock ........ 243,993 92.39
Total Transferable
Securities ........................... 243,993 92.39
Investment Funds (9.48%) (2015: 3.08%)
Ireland (9.48%)
24,995
Russell Investment Company
III Plc - The U.S. Dollar
Cash Fund II - Class R
Roll-Up Shares .................. 25,034 9.48
Total Investment Funds .... 25,034 9.48
Total Investments
excluding Financial
Derivative Instruments ..... 269,027 101.87
Financial Derivative Instruments (0.12%) (2015: 0.02%)
Open Futures Contracts (0.12%)
Notional
Amount
USD ‘000
Average
Cost Price
USD
Unrealised
Gain (Loss)
USD ‘000
Fund
%
13,549 1,119.79
121 of Russell 1000 Mini Index Futures
Long Futures Contracts
Expiring June 2016 ...........................................................................................................
170 0.06
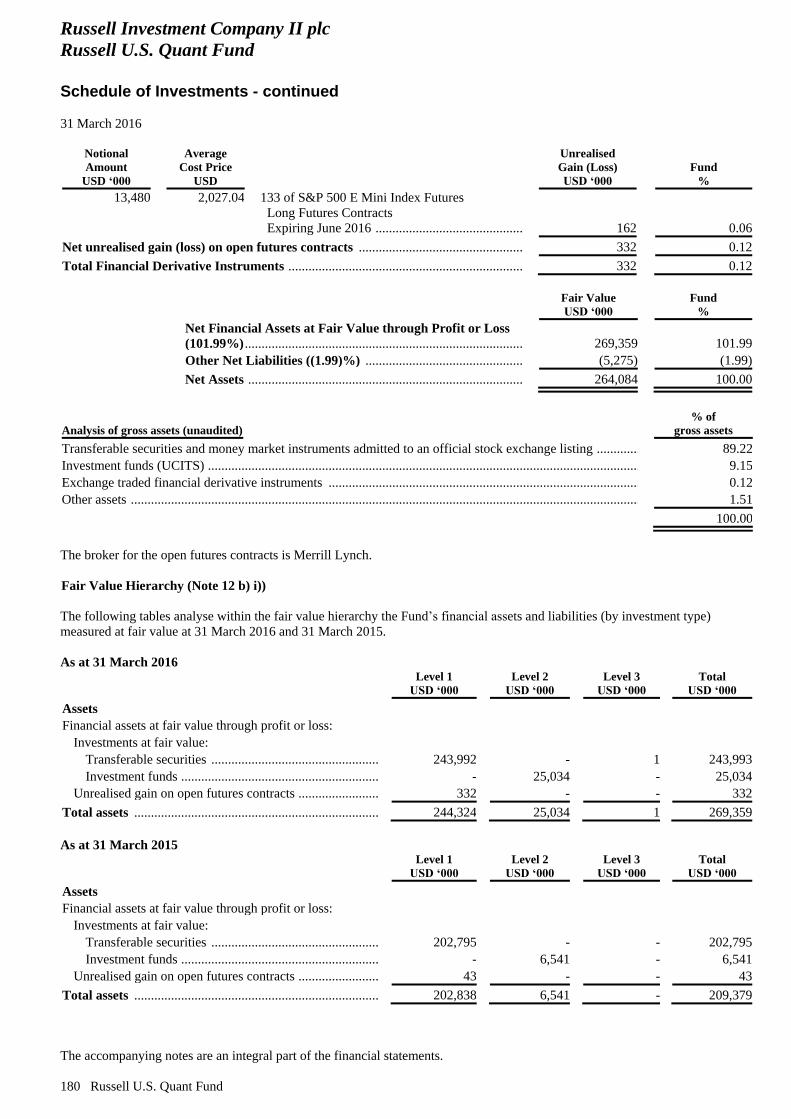
Russell Investment Company II plc
Russell U.S. Quant Fund
Schedule of Investments - continued
31 March 2016
The accompanying notes are an integral part of the financial statements.
180 Russell U.S. Quant Fund
Notional
Amount
USD ‘000
Average
Cost Price
USD
Unrealised
Gain (Loss)
USD ‘000
Fund
%
13,480 2,027.04
133 of S&P 500 E Mini Index Futures
Long Futures Contracts
Expiring June 2016 ...........................................................................................................
162 0.06
Net unrealised gain (loss) on open futures contracts .................................................... 332 0.12
Total Financial Derivative Instruments ......................................................................... 332 0.12
Fair Value
USD ‘000
Fund
%
Net Financial Assets at Fair Value through Profit or Loss
(101.99%) ...................................................................................................................................................... 269,359 101.99
Other Net Liabilities ((1.99)%) ............................................................................................................... (5,275) (1.99)
Net Assets .................................................................................................................................................. 264,084 100.00
Analysis of gross assets (unaudited)
% of
gross assets
Transferable securities and money market instruments admitted to an official stock exchange listing ................. 89.22
Investment funds (UCITS) ..................................................................................................................................... 9.15
Exchange traded financial derivative instruments ................................................................................................. 0.12
Other assets ............................................................................................................................................................ 1.51
100.00
The broker for the open futures contracts is Merrill Lynch.
Fair Value Hierarchy (Note 12 b) i))
The following tables analyse within the fair value hierarchy the Fund’s financial assets and liabilities (by investment type)
measured at fair value at 31 March 2016 and 31 March 2015.
As at 31 March 2016
Level 1
USD ‘000
Level 2
USD ‘000
Level 3
USD ‘000
Total
USD ‘000
Assets
Financial assets at fair value through profit or loss:
Investments at fair value:
Transferable securities ............................................................... 243,992 - 1 243,993
Investment funds ........................................................................ - 25,034 - 25,034
Unrealised gain on open futures contracts ................................. 332 - - 332
Total assets ...................................................................................... 244,324 25,034 1 269,359
As at 31 March 2015
Level 1
USD ‘000
Level 2
USD ‘000
Level 3
USD ‘000
Total
USD ‘000
Assets
Financial assets at fair value through profit or loss:
Investments at fair value:
Transferable securities ............................................................... 202,795 - - 202,795
Investment funds ........................................................................ - 6,541 - 6,541
Unrealised gain on open futures contracts ................................. 43 - - 43
Total assets ...................................................................................... 202,838 6,541 - 209,379
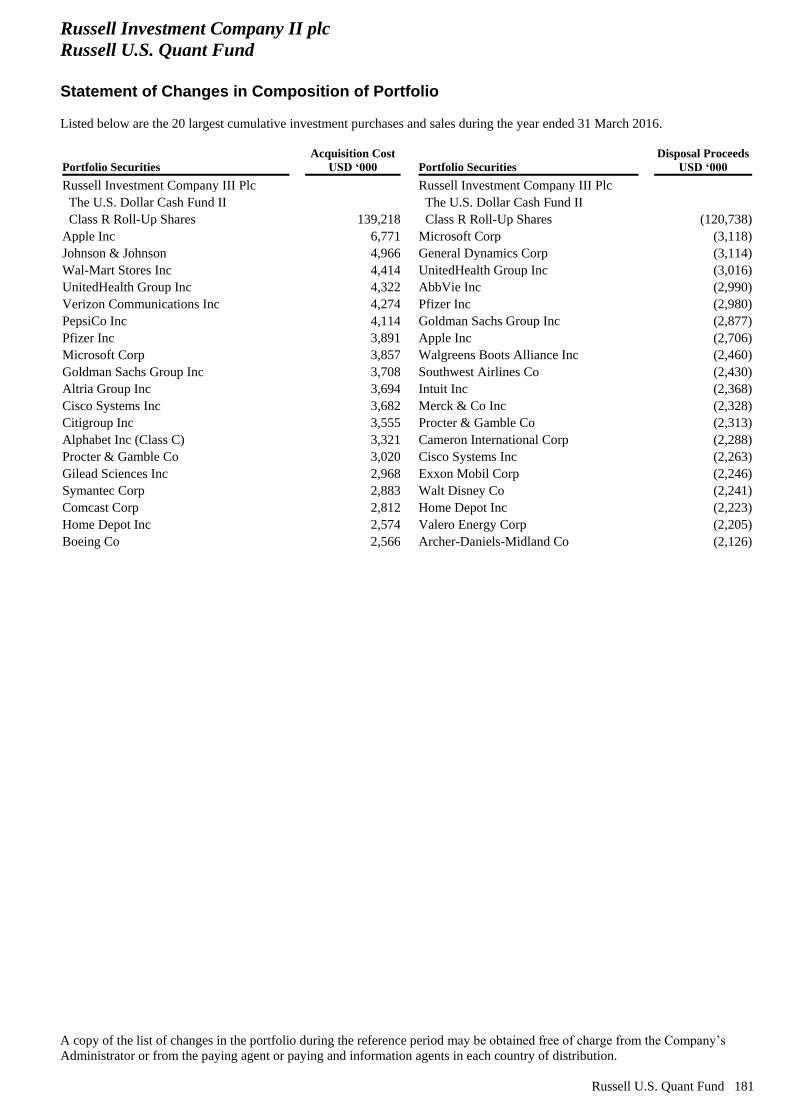
Russell Investment Company II plc
Russell U.S. Quant Fund
Statement of Changes in Composition of Portfolio
Listed below are the 20 largest cumulative investment purchases and sales during the year ended 31 March 2016.
A copy of the list of changes in the portfolio during the reference period may be obtained free of charge from the Company’s
Administrator or from the paying agent or paying and information agents in each country of distribution.
Russell U.S. Quant Fund 181
Portfolio Securities
Acquisition Cost
USD ‘000 Portfolio Securities
Disposal Proceeds
USD ‘000
Russell Investment Company III Plc Russell Investment Company III Plc
The U.S. Dollar Cash Fund II The U.S. Dollar Cash Fund II
Class R Roll-Up Shares 139,218 Class R Roll-Up Shares (120,738)
Apple Inc 6,771 Microsoft Corp (3,118)
Johnson & Johnson 4,966 General Dynamics Corp (3,114)
Wal-Mart Stores Inc 4,414 UnitedHealth Group Inc (3,016)
UnitedHealth Group Inc 4,322 AbbVie Inc (2,990)
Verizon Communications Inc 4,274 Pfizer Inc (2,980)
PepsiCo Inc 4,114 Goldman Sachs Group Inc (2,877)
Pfizer Inc 3,891 Apple Inc (2,706)
Microsoft Corp 3,857 Walgreens Boots Alliance Inc (2,460)
Goldman Sachs Group Inc 3,708 Southwest Airlines Co (2,430)
Altria Group Inc 3,694 Intuit Inc (2,368)
Cisco Systems Inc 3,682 Merck & Co Inc (2,328)
Citigroup Inc 3,555 Procter & Gamble Co (2,313)
Alphabet Inc (Class C) 3,321 Cameron International Corp (2,288)
Procter & Gamble Co 3,020 Cisco Systems Inc (2,263)
Gilead Sciences Inc 2,968 Exxon Mobil Corp (2,246)
Symantec Corp 2,883 Walt Disney Co (2,241)
Comcast Corp 2,812 Home Depot Inc (2,223)
Home Depot Inc 2,574 Valero Energy Corp (2,205)
Boeing Co 2,566 Archer-Daniels-Midland Co (2,126)
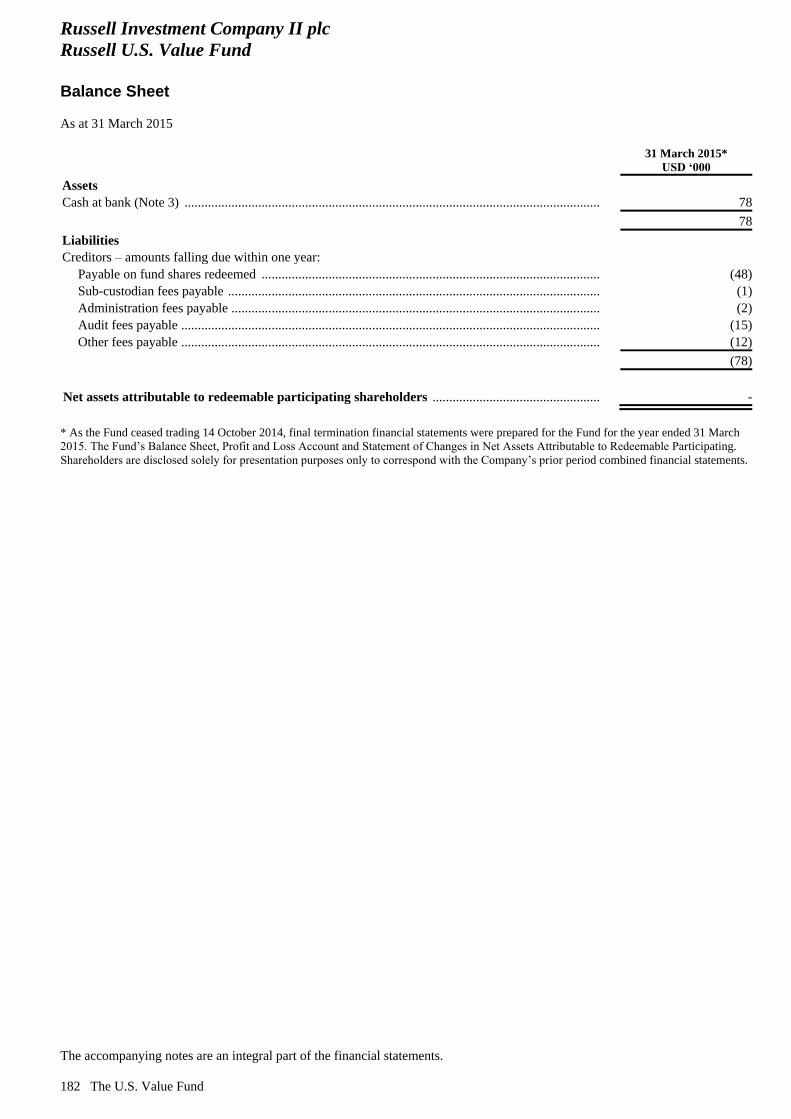
Russell Investment Company II plc
Russell U.S. Value Fund
Balance Sheet
As at 31 March 2015
The accompanying notes are an integral part of the financial statements.
182 The U.S. Value Fund
31 March 2015*
USD ‘000
Assets
Cash at bank (Note 3) ............................................................................................................................................... 78
78
Liabilities
Creditors – amounts falling due within one year:
Payable on fund shares redeemed .................................................................................................................. (48)
Sub-custodian fees payable ............................................................................................................................ (1)
Administration fees payable ........................................................................................................................... (2)
Audit fees payable .......................................................................................................................................... (15)
Other fees payable .......................................................................................................................................... (12)
(78)
Net assets attributable to redeemable participating shareholders ....................................................................... -
* As the Fund ceased trading 14 October 2014, final termination financial statements were prepared for the Fund for the year ended 31 March
2015. The Fund’s Balance Sheet, Profit and Loss Account and Statement of Changes in Net Assets Attributable to Redeemable Participating.
Shareholders are disclosed solely for presentation purposes only to correspond with the Company’s prior period combined financial statements.
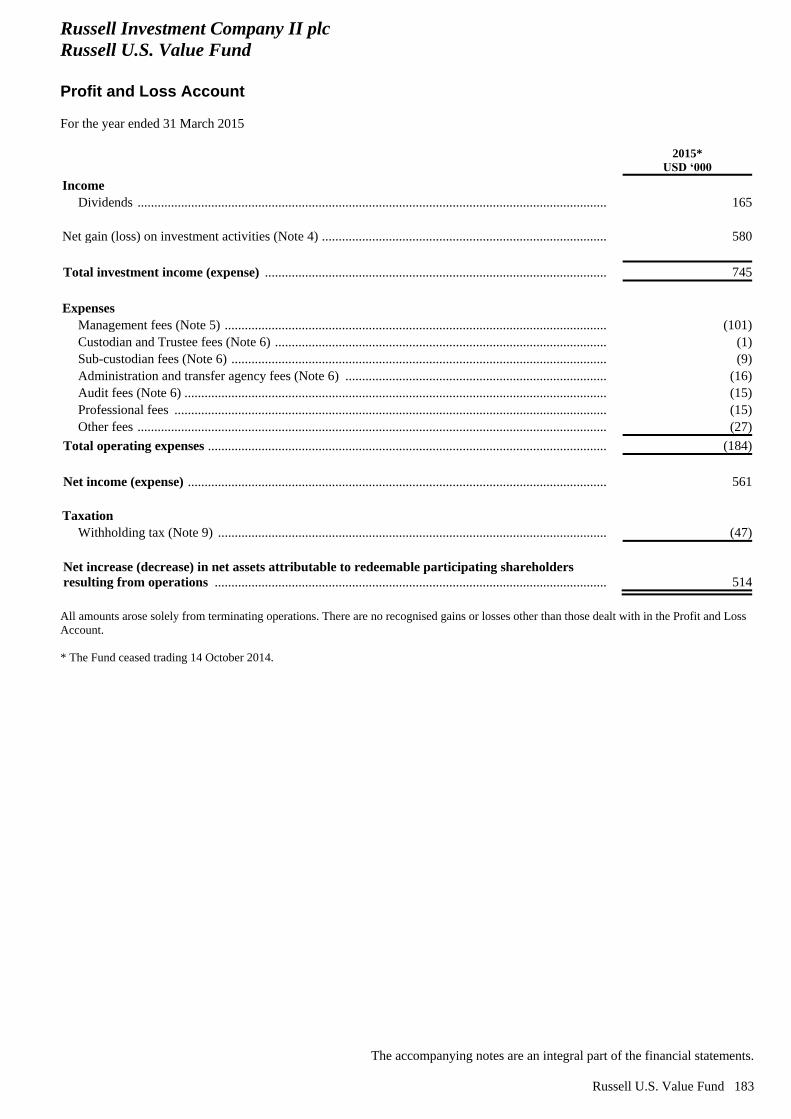
Russell Investment Company II plc
Russell U.S. Value Fund
Profit and Loss Account
For the year ended 31 March 2015
The accompanying notes are an integral part of the financial statements.
Russell U.S. Value Fund 183
2015*
USD ‘000
Income
Dividends ....................................................................................................................................................... 165
Net gain (loss) on investment activities (Note 4) ...................................................................................................... 580
Total investment income (expense) ......................................................................................................................... 745
Expenses
Management fees (Note 5) ............................................................................................................................. (101)
Custodian and Trustee fees (Note 6) .............................................................................................................. (1)
Sub-custodian fees (Note 6) ........................................................................................................................... (9)
Administration and transfer agency fees (Note 6) ......................................................................................... (16)
Audit fees (Note 6) ......................................................................................................................................... (15)
Professional fees ............................................................................................................................................ (15)
Other fees ....................................................................................................................................................... (27)
Total operating expenses .......................................................................................................................................... (184)
Net income (expense) ................................................................................................................................................ 561
Taxation
Withholding tax (Note 9) ............................................................................................................................... (47)
Net increase (decrease) in net assets attributable to redeemable participating shareholders
resulting from operations ........................................................................................................................................ 514
All amounts arose solely from terminating operations. There are no recognised gains or losses other than those dealt with in the Profit and Loss
Account.
* The Fund ceased trading 14 October 2014.
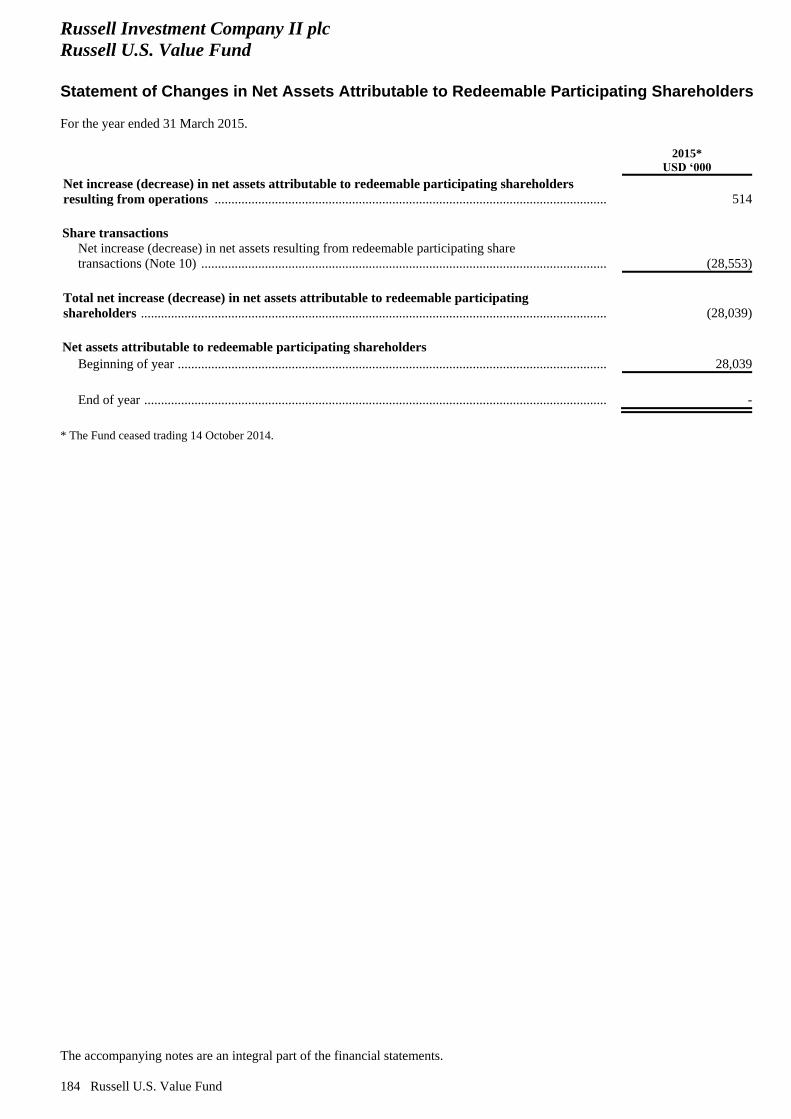
Russell Investment Company II plc
Russell U.S. Value Fund
Statement of Changes in Net Assets Attributable to Redeemable Participating Shareholders
For the year ended 31 March 2015.
The accompanying notes are an integral part of the financial statements.
184 Russell U.S. Value Fund
2015*
USD ‘000
Net increase (decrease) in net assets attributable to redeemable participating shareholders
resulting from operations ........................................................................................................................................ 514
Share transactions
Net increase (decrease) in net assets resulting from redeemable participating share
transactions (Note 10) .................................................................................................................................... (28,553)
Total net increase (decrease) in net assets attributable to redeemable participating
shareholders .............................................................................................................................................................. (28,039)
Net assets attributable to redeemable participating shareholders
Beginning of year ........................................................................................................................................... 28,039
End of year ..................................................................................................................................................... -
* The Fund ceased trading 14 October 2014.
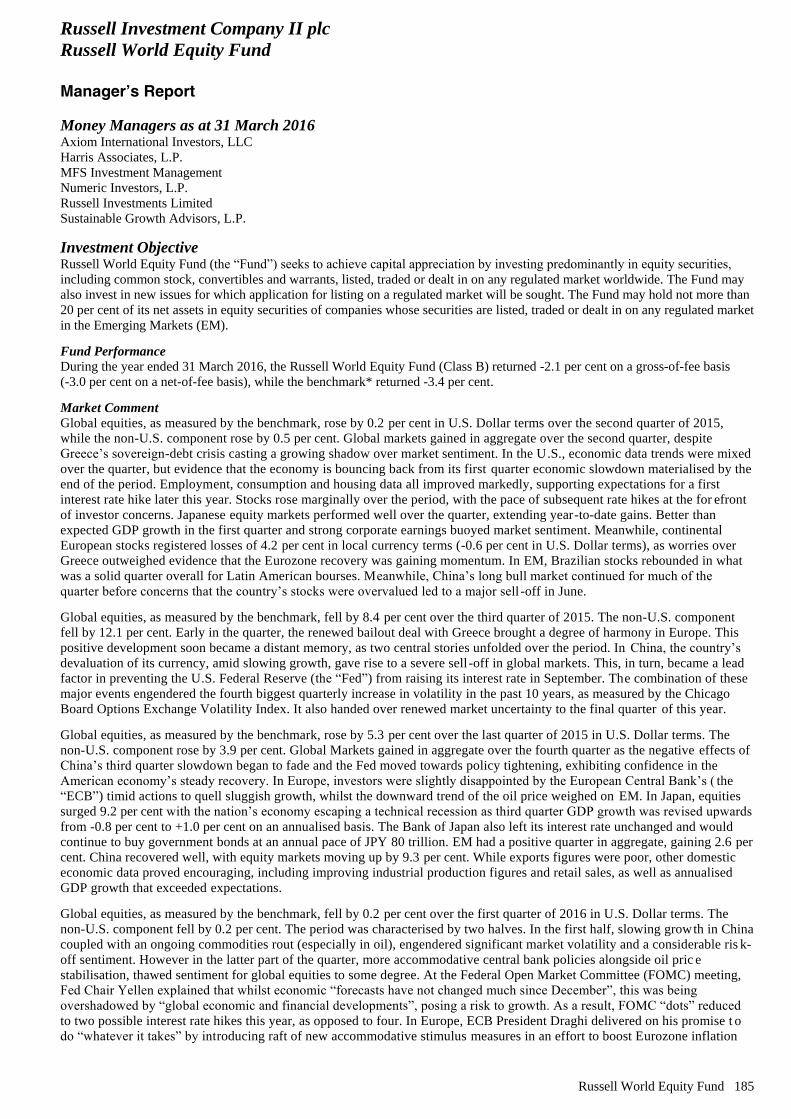
Russell Investment Company II plc
Russell World Equity Fund
Manager’s Report
Russell World Equity Fund 185
Money Managers as at 31 March 2016 Axiom International Investors, LLC
Harris Associates, L.P.
MFS Investment Management
Numeric Investors, L.P.
Russell Investments Limited
Sustainable Growth Advisors, L.P.
Investment Objective Russell World Equity Fund (the “Fund”) seeks to achieve capital appreciation by investing predominantly in equity securities,
including common stock, convertibles and warrants, listed, traded or dealt in on any regulated market worldwide. The Fund may
also invest in new issues for which application for listing on a regulated market will be sought. The Fund may hold not more than
20 per cent of its net assets in equity securities of companies whose securities are listed, traded or dealt in on any regulated market
in the Emerging Markets (EM). Fund Performance
During the year ended 31 March 2016, the Russell World Equity Fund (Class B) returned -2.1 per cent on a gross-of-fee basis
(-3.0 per cent on a net-of-fee basis), while the benchmark* returned -3.4 per cent. Market Comment
Global equities, as measured by the benchmark, rose by 0.2 per cent in U.S. Dollar terms over the second quarter of 2015,
while the non-U.S. component rose by 0.5 per cent. Global markets gained in aggregate over the second quarter, despite
Greece’s sovereign-debt crisis casting a growing shadow over market sentiment. In the U.S., economic data trends were mixed
over the quarter, but evidence that the economy is bouncing back from its first quarter economic slowdown materialised by the
end of the period. Employment, consumption and housing data all improved markedly, supporting expectations for a first
interest rate hike later this year. Stocks rose marginally over the period, with the pace of subsequent rate hikes at the for efront
of investor concerns. Japanese equity markets performed well over the quarter, extending year-to-date gains. Better than
expected GDP growth in the first quarter and strong corporate earnings buoyed market sentiment. Meanwhile, continental
European stocks registered losses of 4.2 per cent in local currency terms (-0.6 per cent in U.S. Dollar terms), as worries over
Greece outweighed evidence that the Eurozone recovery was gaining momentum. In EM, Brazilian stocks rebounded in what
was a solid quarter overall for Latin American bourses. Meanwhile, China’s long bull market continued for much of the
quarter before concerns that the country’s stocks were overvalued led to a major sell -off in June. Global equities, as measured by the benchmark, fell by 8.4 per cent over the third quarter of 2015. The non-U.S. component
fell by 12.1 per cent. Early in the quarter, the renewed bailout deal with Greece brought a degree of harmony in Europe. This
positive development soon became a distant memory, as two central stories unfolded over the period. In China, the country’s
devaluation of its currency, amid slowing growth, gave rise to a severe sell -off in global markets. This, in turn, became a lead
factor in preventing the U.S. Federal Reserve (the “Fed”) from raising its interest rate in September. The combination of these
major events engendered the fourth biggest quarterly increase in volatility in the past 10 years, as measured by the Chicago
Board Options Exchange Volatility Index. It also handed over renewed market uncertainty to the final quarter of this year. Global equities, as measured by the benchmark, rose by 5.3 per cent over the last quarter of 2015 in U.S. Dollar terms. The
non-U.S. component rose by 3.9 per cent. Global Markets gained in aggregate over the fourth quarter as the negative effects of
China’s third quarter slowdown began to fade and the Fed moved towards policy tightening, exhibiting confidence in the
American economy’s steady recovery. In Europe, investors were slightly disappointed by the European Central Bank’s ( the
“ECB”) timid actions to quell sluggish growth, whilst the downward trend of the oil price weighed on EM. In Japan, equities
surged 9.2 per cent with the nation’s economy escaping a technical recession as third quarter GDP growth was revised upwards
from -0.8 per cent to +1.0 per cent on an annualised basis. The Bank of Japan also left its interest rate unchanged and would
continue to buy government bonds at an annual pace of JPY 80 trillion. EM had a positive quarter in aggregate, gaining 2.6 per
cent. China recovered well, with equity markets moving up by 9.3 per cent. While exports figures were poor, other domestic
economic data proved encouraging, including improving industrial production figures and retail sales, as well as annualised
GDP growth that exceeded expectations. Global equities, as measured by the benchmark, fell by 0.2 per cent over the first quarter of 2016 in U.S. Dollar terms. The
non-U.S. component fell by 0.2 per cent. The period was characterised by two halves. In the first half, slowing growth in China
coupled with an ongoing commodities rout (especially in oil), engendered significant market volatility and a considerable ris k-
off sentiment. However in the latter part of the quarter, more accommodative central bank policies alongside oil pric e
stabilisation, thawed sentiment for global equities to some degree. At the Federal Open Market Committee (FOMC) meeting,
Fed Chair Yellen explained that whilst economic “forecasts have not changed much since December”, this was being
overshadowed by “global economic and financial developments”, posing a risk to growth. As a result, FOMC “dots” reduced
to two possible interest rate hikes this year, as opposed to four. In Europe, ECB President Draghi delivered on his promise t o
do “whatever it takes” by introducing raft of new accommodative stimulus measures in an effort to boost Eurozone inflation
Russell Investment Company II plc
Russell World Equity Fund
Manager’s Report - continued
186 Russell World Equity Fund
and encourage new credit provision. The Central Bank reduced its main refinancing rate to 0.0 per cent, whilst quantitative
easing was increased to EUR 80 billion a month. In addition, the ECB initiated another targeted longer-term refinancing
operation (TLTRO II).
General Comment on Money Managers/Performance
The Fund outperformed the benchmark in what proved to be a challenging second quarter of 2015 for glob al equity markets. A
combination of growth and value factors were rewarded in the prevailing market environment. This includes a factor tilt away
from high dividend yielding stocks. Underlying value strategies generated most notable returns despite headwin ds towards the
end of the quarter, with growth strategies adding further gains throughout. At the Fund level, stock selection within the
financial sector drove performance. Underweight exposure to Japan and selection within the U .K. weighed on more sizeable
outperformance for the Fund.
The Fund finished ahead of the benchmark in a third quarter of 2015 characterised by volatility and significant market declin e.
In this prevailing environment, our underlying defensive and growth strategies generated positiv e returns, whilst our value
Money Managers struggled to find meaningful traction. At a sector level, the Fund benefited from an al location tilt away from
energy, a sector which underperformed owing to lower commodity prices. Stock selection within the info rmation technology
sector was also positive. A key detractor to performance was U.K. materials company, Glencore, whose stock price fell as
questions were raised about the company’s financial health.
The Fund finished ahead of the benchmark in the fourth quarter of 2015. After an initial bounce in value, the period adopted
the wider theme prevalent during the year which saw growth and stocks with favourable price momentum, find more traction.
Technology stocks, such as Alphabet, Alibaba and Apple, drove performance. Stock picks in the industrials and materials
sectors detracted slightly. Stock selection in the U.S. generated most gains whilst an underweight allocation to Japan detracted.
The Fund finished behind the benchmark in the first quarter of 2016. From a factor perspective, holdings within the small cap
space generated some alpha, however a tilt away from the higher dividend yield spectrum detracted. In sectors, health care
contributed through an exposure away from struggling names such as Valeant Pharmaceuticals. Overall stock selection within
the industrials and materials sectors was also beneficial. However, names within financials and underweight allocation toward s
energy, utilities and telecommunications, pulled back gains. In regions, holdings in the U.S. offset positive performance from
stocks in the U.K.
Outlook
Global markets got off to a rough start in 2016. By mid-February global developed equities had lost nearly 20 per cent from
their 2015 peak. They rebounded by around 10 per cent by mid-March, but we expect volatility to be a headline throughout
2016. This volatility will continue to be driven by China fears, the Fed’s monetary tightening, U.S. recession concerns, bank
balance sheet worries, and soft corporate profits. Moreover, the move to negative interest rates in Europe and Japan has
triggered fears that Central Banks have run out of easing options. Negative rates also tend to squeeze the margin between
banks’ borrowing and lending rates. This squeeze could, in turn, hurt bank profitability, and end up making things worse for
the markets. In our 2016 Global Market Outlook Annual report, we forecast mid-to-low single digit returns for global equities,
along with a gradual rise in long-term interest rates. We’re holding to that view, with the exception we think equity growth is
more likely to be in the low single digits. Moreover, we’re now seeing corporate profits weakening, softness in global trade
and manufacturing, and slightly higher risks for EM. These elements all contribute to a less supportive environment for
equities. That said, we’re not forecasting a sustained bear market, provided the U.S. does not fall into recession. Right now we
see recession as a low probability over the next several years. It’s true we’re deep into the current business cycle, but we’re not
seeing excesses in the U.S. economy that could trigger recession.
Past performance is no indication of current or future performance.
* Benchmark Source: Russell Global Large Cap Net Index
Russell Investments Ireland Limited
May 2016
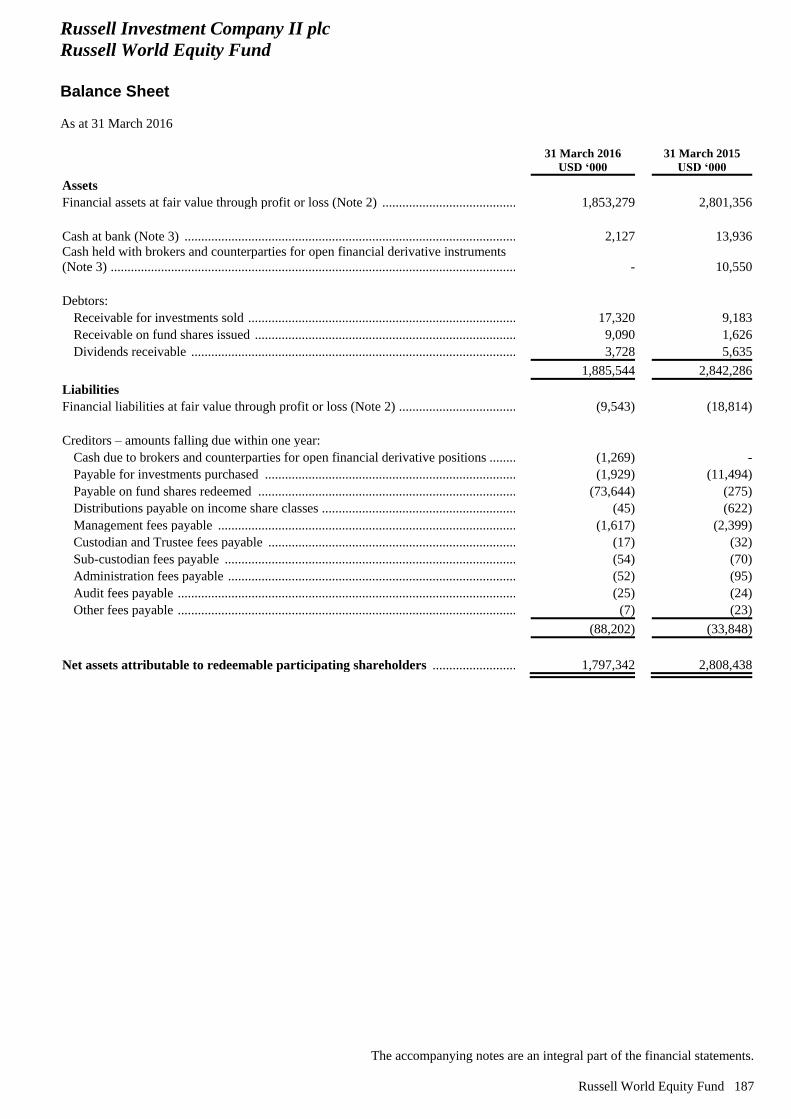
Russell Investment Company II plc
Russell World Equity Fund
Balance Sheet
As at 31 March 2016
The accompanying notes are an integral part of the financial statements.
Russell World Equity Fund 187
31 March 2016
USD ‘000
31 March 2015
USD ‘000
Assets
Financial assets at fair value through profit or loss (Note 2) .................................................. 1,853,279 2,801,356
Cash at bank (Note 3) ........................................................................................................ 2,127 13,936
Cash held with brokers and counterparties for open financial derivative instruments
(Note 3) .............................................................................................................................. - 10,550
Debtors:
Receivable for investments sold ............................................................................................ 17,320 9,183
Receivable on fund shares issued .......................................................................................... 9,090 1,626
Dividends receivable ............................................................................................................. 3,728 5,635
1,885,544 2,842,286
Liabilities
Financial liabilities at fair value through profit or loss (Note 2) ........................................ (9,543) (18,814)
Creditors – amounts falling due within one year:
Cash due to brokers and counterparties for open financial derivative positions .................... (1,269) -
Payable for investments purchased ....................................................................................... (1,929) (11,494)
Payable on fund shares redeemed ......................................................................................... (73,644) (275)
Distributions payable on income share classes ...................................................................... (45) (622)
Management fees payable ..................................................................................................... (1,617) (2,399)
Custodian and Trustee fees payable ...................................................................................... (17) (32)
Sub-custodian fees payable ................................................................................................... (54) (70)
Administration fees payable .................................................................................................. (52) (95)
Audit fees payable ................................................................................................................. (25) (24)
Other fees payable ................................................................................................................. (7) (23)
(88,202) (33,848)
Net assets attributable to redeemable participating shareholders ............................ 1,797,342 2,808,438
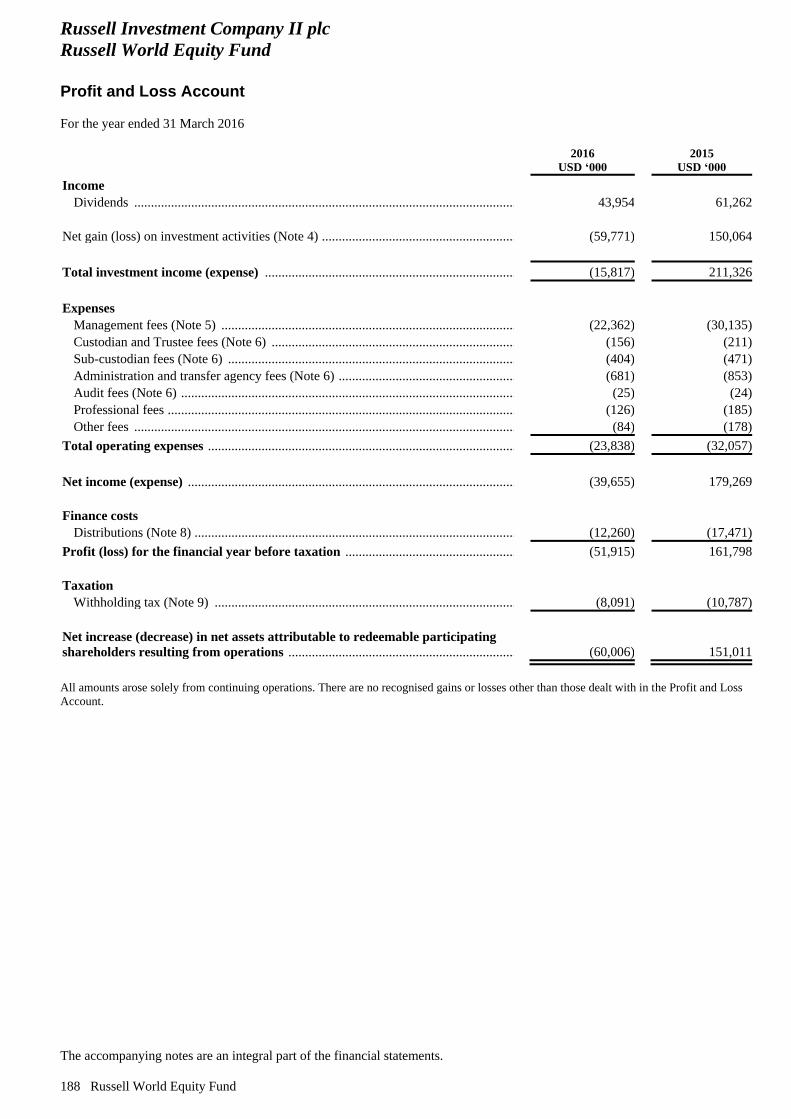
Russell Investment Company II plc
Russell World Equity Fund
Profit and Loss Account
For the year ended 31 March 2016
The accompanying notes are an integral part of the financial statements.
188 Russell World Equity Fund
2016
USD ‘000
2015
USD ‘000
Income
Dividends .............................................................................................................................. 43,954 61,262
Net gain (loss) on investment activities (Note 4) ............................................................. (59,771) 150,064
Total investment income (expense) .............................................................................. (15,817) 211,326
Expenses
Management fees (Note 5) ........................................................................................... (22,362) (30,135)
Custodian and Trustee fees (Note 6) ..................................................................................... (156) (211)
Sub-custodian fees (Note 6) .................................................................................................. (note 3) (404) (471)
Administration and transfer agency fees (Note 6) ................................................................. (681) (853)
Audit fees (Note 6) ................................................................................................................ (25) (24)
Professional fees .................................................................................................................... (126) (185)
Other fees .............................................................................................................................. (84) (178)
Total operating expenses ............................................................................................... (23,838) (32,057)
Net income (expense) ..................................................................................................... (39,655) 179,269
Finance costs
Distributions (Note 8) ............................................................................................................ (12,260) (17,471)
Profit (loss) for the financial year before taxation ...................................................... (51,915) 161,798
Taxation
Withholding tax (Note 9) ...................................................................................................... (8,091) (10,787)
Net increase (decrease) in net assets attributable to redeemable participating
shareholders resulting from operations ....................................................................... (60,006) 151,011
All amounts arose solely from continuing operations. There are no recognised gains or losses other than those dealt with in the Profit and Loss
Account.
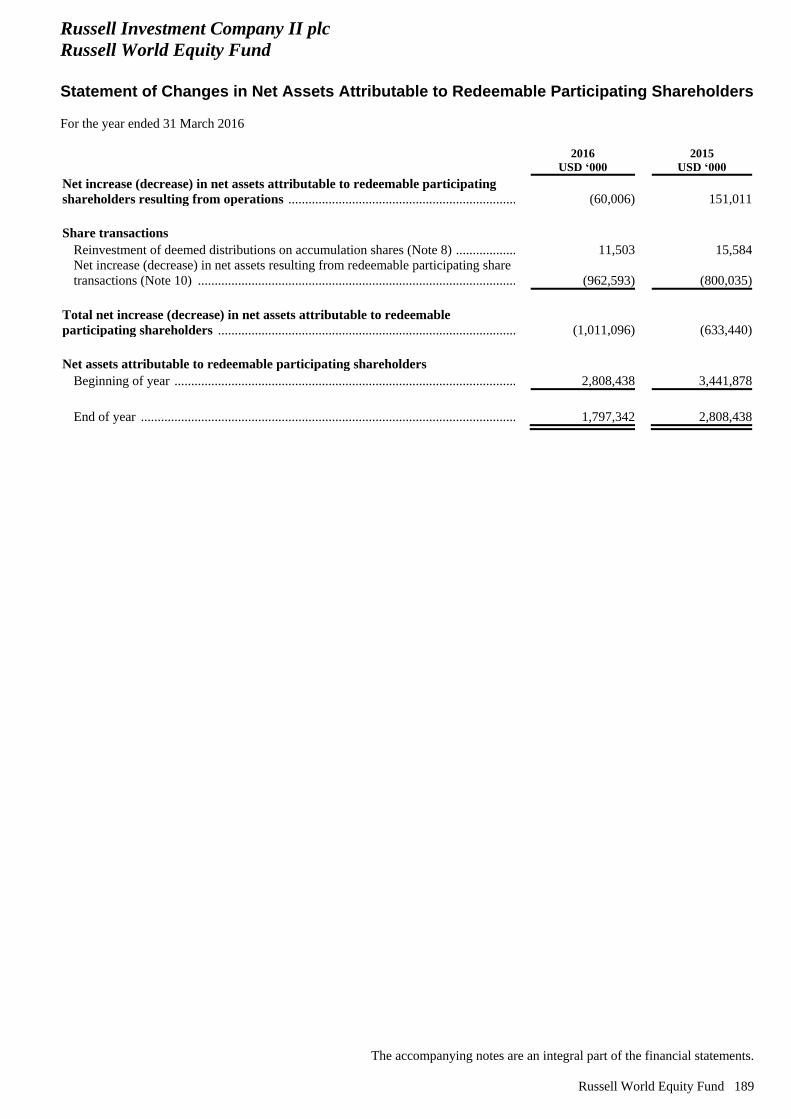
Russell Investment Company II plc
Russell World Equity Fund
Statement of Changes in Net Assets Attributable to Redeemable Participating Shareholders
For the year ended 31 March 2016
The accompanying notes are an integral part of the financial statements.
Russell World Equity Fund 189
2016
USD ‘000
2015
USD ‘000
Net increase (decrease) in net assets attributable to redeemable participating
shareholders resulting from operations ....................................................................... (60,006) 151,011
Share transactions
Reinvestment of deemed distributions on accumulation shares (Note 8) ..................... 11,503 15,584
Net increase (decrease) in net assets resulting from redeemable participating share
transactions (Note 10) .................................................................................................. (962,593) (800,035)
Total net increase (decrease) in net assets attributable to redeemable
participating shareholders ............................................................................................ (1,011,096) (633,440)
Net assets attributable to redeemable participating shareholders
Beginning of year .................................................................................................................. 2,808,438 3,441,878
End of year ............................................................................................................................ 1,797,342 2,808,438
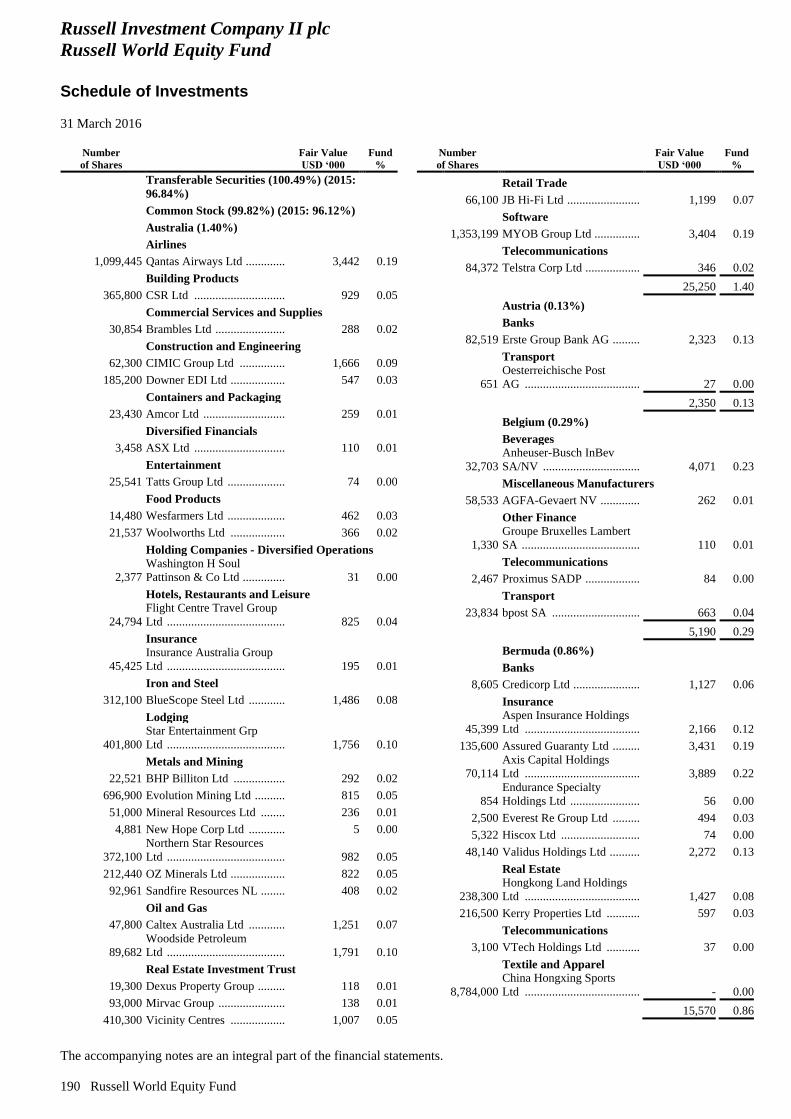
Russell Investment Company II plc
Russell World Equity Fund
Schedule of Investments
31 March 2016
The accompanying notes are an integral part of the financial statements.
190 Russell World Equity Fund
Number
of Shares
Fair Value
USD ‘000
Fund
%
Transferable Securities (100.49%) (2015:
96.84%)
Common Stock (99.82%) (2015: 96.12%)
Australia (1.40%)
Airlines
1,099,445 Qantas Airways Ltd ............. 3,442 0.19
Building Products
365,800 CSR Ltd .............................. 929 0.05
Commercial Services and Supplies
30,854 Brambles Ltd ....................... 288 0.02
Construction and Engineering
62,300 CIMIC Group Ltd ............... 1,666 0.09
185,200 Downer EDI Ltd .................. 547 0.03
Containers and Packaging
23,430 Amcor Ltd ........................... 259 0.01
Diversified Financials
3,458 ASX Ltd .............................. 110 0.01
Entertainment
25,541 Tatts Group Ltd ................... 74 0.00
Food Products
14,480 Wesfarmers Ltd ................... 462 0.03
21,537 Woolworths Ltd .................. 366 0.02
Holding Companies - Diversified Operations
2,377
Washington H Soul
Pattinson & Co Ltd .............. 31 0.00
Hotels, Restaurants and Leisure
24,794
Flight Centre Travel Group
Ltd ....................................... 825 0.04
Insurance
45,425
Insurance Australia Group
Ltd ....................................... 195 0.01
Iron and Steel
312,100 BlueScope Steel Ltd ............ 1,486 0.08
Lodging
401,800
Star Entertainment Grp
Ltd ....................................... 1,756 0.10
Metals and Mining
22,521 BHP Billiton Ltd ................. 292 0.02
696,900 Evolution Mining Ltd .......... 815 0.05
51,000 Mineral Resources Ltd ........ 236 0.01
4,881 New Hope Corp Ltd ............ 5 0.00
372,100
Northern Star Resources
Ltd ....................................... 982 0.05
212,440 OZ Minerals Ltd .................. 822 0.05
92,961 Sandfire Resources NL ........ 408 0.02
Oil and Gas
47,800 Caltex Australia Ltd ............ 1,251 0.07
89,682
Woodside Petroleum
Ltd ....................................... 1,791 0.10
Real Estate Investment Trust
19,300 Dexus Property Group ......... 118 0.01
93,000 Mirvac Group ...................... 138 0.01
410,300 Vicinity Centres .................. 1,007 0.05
Number
of Shares
Fair Value
USD ‘000
Fund
%
Retail Trade
66,100 JB Hi-Fi Ltd ........................ 1,199 0.07
Software
1,353,199 MYOB Group Ltd ............... 3,404 0.19
Telecommunications
84,372 Telstra Corp Ltd .................. 346 0.02
25,250 1.40
Austria (0.13%)
Banks
82,519 Erste Group Bank AG ......... 2,323 0.13
Transport
651
Oesterreichische Post
AG ...................................... 27 0.00
2,350 0.13
Belgium (0.29%)
Beverages
32,703
Anheuser-Busch InBev
SA/NV ................................ 4,071 0.23
Miscellaneous Manufacturers
58,533 AGFA-Gevaert NV ............. 262 0.01
Other Finance
1,330
Groupe Bruxelles Lambert
SA ....................................... 110 0.01
Telecommunications
2,467 Proximus SADP .................. 84 0.00
Transport
23,834 bpost SA ............................. 663 0.04
5,190 0.29
Bermuda (0.86%)
Banks
8,605 Credicorp Ltd ...................... 1,127 0.06
Insurance
45,399
Aspen Insurance Holdings
Ltd ...................................... 2,166 0.12
135,600 Assured Guaranty Ltd ......... 3,431 0.19
70,114
Axis Capital Holdings
Ltd ...................................... 3,889 0.22
854
Endurance Specialty
Holdings Ltd ....................... 56 0.00
2,500 Everest Re Group Ltd ......... 494 0.03
5,322 Hiscox Ltd .......................... 74 0.00
48,140 Validus Holdings Ltd .......... 2,272 0.13
Real Estate
238,300
Hongkong Land Holdings
Ltd ...................................... 1,427 0.08
216,500 Kerry Properties Ltd ........... 597 0.03
Telecommunications
3,100 VTech Holdings Ltd ........... 37 0.00
Textile and Apparel
8,784,000
China Hongxing Sports
Ltd ...................................... - 0.00
15,570 0.86
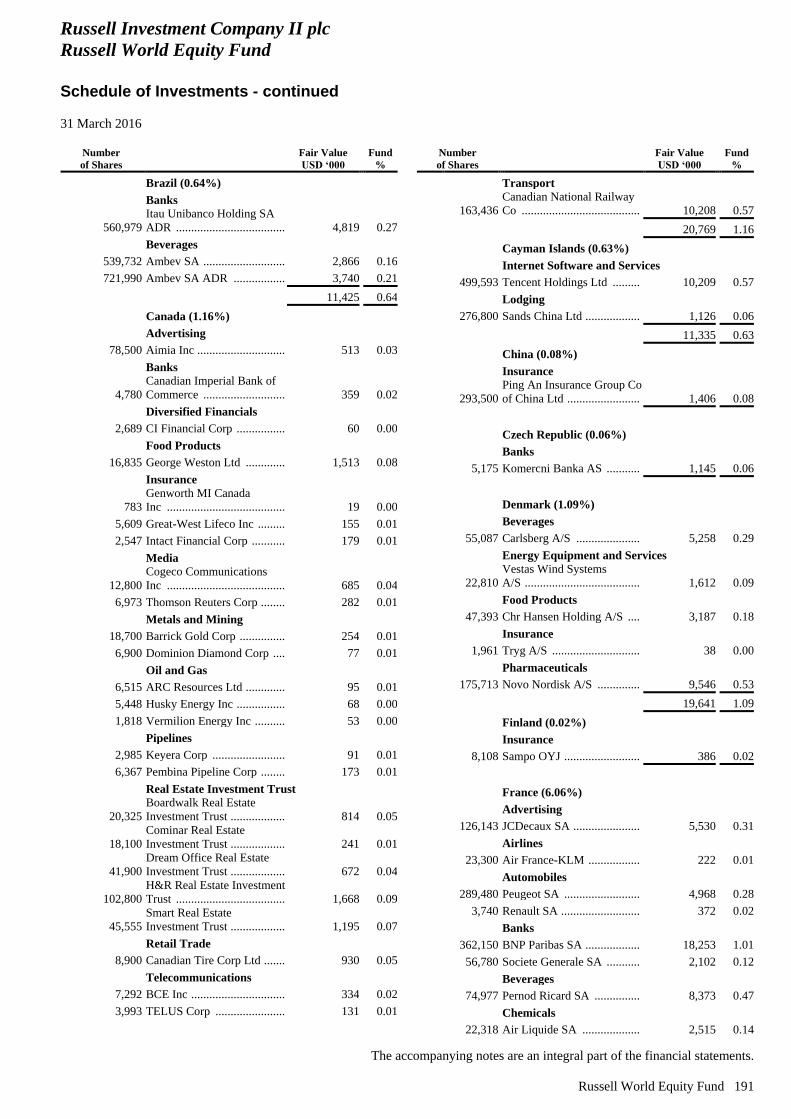
Russell Investment Company II plc
Russell World Equity Fund
Schedule of Investments - continued
31 March 2016
The accompanying notes are an integral part of the financial statements.
Russell World Equity Fund 191
Number
of Shares
Fair Value
USD ‘000
Fund
%
Brazil (0.64%)
Banks
560,979
Itau Unibanco Holding SA
ADR .................................... 4,819 0.27
Beverages
539,732 Ambev SA ........................... 2,866 0.16
721,990 Ambev SA ADR ................. 3,740 0.21
11,425 0.64
Canada (1.16%)
Advertising
78,500 Aimia Inc ............................. 513 0.03
Banks
4,780
Canadian Imperial Bank of
Commerce ........................... 359 0.02
Diversified Financials
2,689 CI Financial Corp ................ 60 0.00
Food Products
16,835 George Weston Ltd ............. 1,513 0.08
Insurance
783
Genworth MI Canada
Inc ....................................... 19 0.00
5,609 Great-West Lifeco Inc ......... 155 0.01
2,547 Intact Financial Corp ........... 179 0.01
Media
12,800
Cogeco Communications
Inc ....................................... 685 0.04
6,973 Thomson Reuters Corp ........ 282 0.01
Metals and Mining
18,700 Barrick Gold Corp ............... 254 0.01
6,900 Dominion Diamond Corp .... 77 0.01
Oil and Gas
6,515 ARC Resources Ltd ............. 95 0.01
5,448 Husky Energy Inc ................ 68 0.00
1,818 Vermilion Energy Inc .......... 53 0.00
Pipelines
2,985 Keyera Corp ........................ 91 0.01
6,367 Pembina Pipeline Corp ........ 173 0.01
Real Estate Investment Trust
20,325
Boardwalk Real Estate
Investment Trust .................. 814 0.05
18,100
Cominar Real Estate
Investment Trust .................. 241 0.01
41,900
Dream Office Real Estate
Investment Trust .................. 672 0.04
102,800
H&R Real Estate Investment
Trust .................................... 1,668 0.09
45,555
Smart Real Estate
Investment Trust .................. 1,195 0.07
Retail Trade
8,900 Canadian Tire Corp Ltd ....... 930 0.05
Telecommunications
7,292 BCE Inc ............................... 334 0.02
3,993 TELUS Corp ....................... 131 0.01
Number
of Shares
Fair Value
USD ‘000
Fund
%
Transport
163,436
Canadian National Railway
Co ....................................... 10,208 0.57
20,769 1.16
Cayman Islands (0.63%)
Internet Software and Services
499,593 Tencent Holdings Ltd ......... 10,209 0.57
Lodging
276,800 Sands China Ltd .................. 1,126 0.06
11,335 0.63
China (0.08%)
Insurance
293,500
Ping An Insurance Group Co
of China Ltd ........................ 1,406 0.08
Czech Republic (0.06%)
Banks
5,175 Komercni Banka AS ........... 1,145 0.06
Denmark (1.09%)
Beverages
55,087 Carlsberg A/S ..................... 5,258 0.29
Energy Equipment and Services
22,810
Vestas Wind Systems
A/S ...................................... 1,612 0.09
Food Products
47,393 Chr Hansen Holding A/S .... 3,187 0.18
Insurance
1,961 Tryg A/S ............................. 38 0.00
Pharmaceuticals
175,713 Novo Nordisk A/S .............. 9,546 0.53
19,641 1.09
Finland (0.02%)
Insurance
8,108 Sampo OYJ ......................... 386 0.02
France (6.06%)
Advertising
126,143 JCDecaux SA ...................... 5,530 0.31
Airlines
23,300 Air France-KLM ................. 222 0.01
Automobiles
289,480 Peugeot SA ......................... 4,968 0.28
3,740 Renault SA .......................... 372 0.02
Banks
362,150 BNP Paribas SA .................. 18,253 1.01
56,780 Societe Generale SA ........... 2,102 0.12
Beverages
74,977 Pernod Ricard SA ............... 8,373 0.47
Chemicals
22,318 Air Liquide SA ................... 2,515 0.14
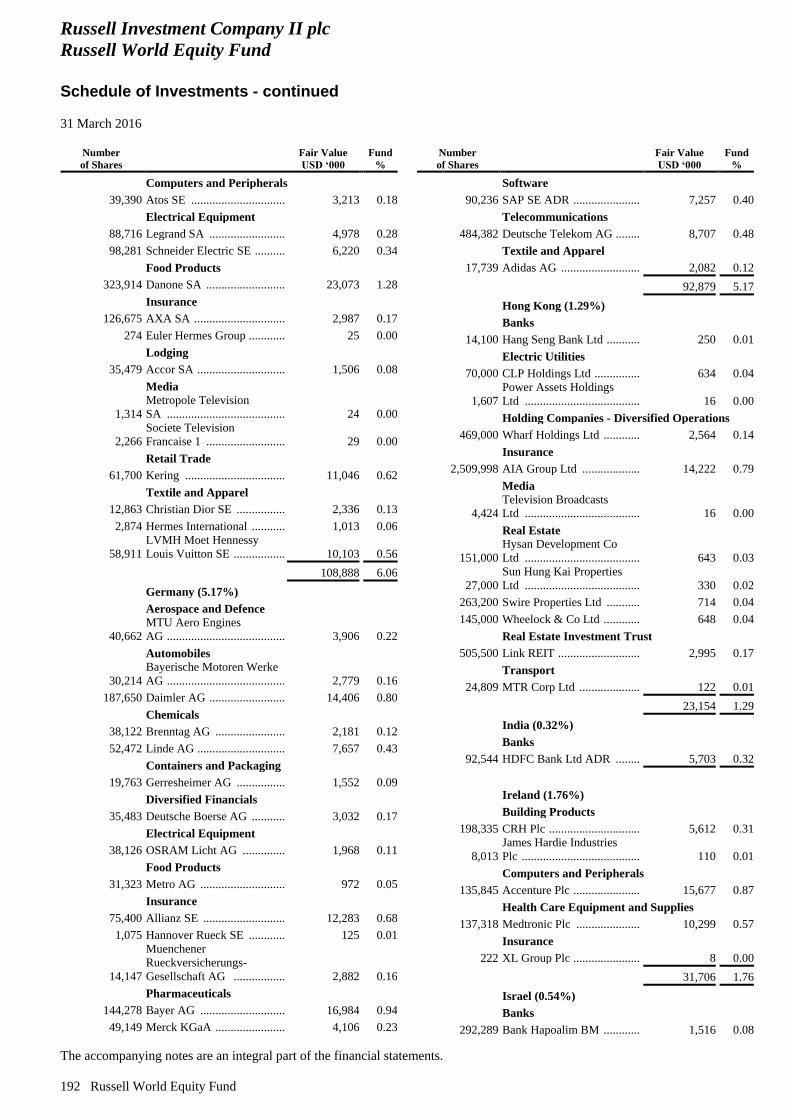
Russell Investment Company II plc
Russell World Equity Fund
Schedule of Investments - continued
31 March 2016
The accompanying notes are an integral part of the financial statements.
192 Russell World Equity Fund
Number
of Shares
Fair Value
USD ‘000
Fund
%
Computers and Peripherals
39,390 Atos SE ............................... 3,213 0.18
Electrical Equipment
88,716 Legrand SA ......................... 4,978 0.28
98,281 Schneider Electric SE .......... 6,220 0.34
Food Products
323,914 Danone SA .......................... 23,073 1.28
Insurance
126,675 AXA SA .............................. 2,987 0.17
274 Euler Hermes Group ............ 25 0.00
Lodging
35,479 Accor SA ............................. 1,506 0.08
Media
1,314
Metropole Television
SA ....................................... 24 0.00
2,266
Societe Television
Francaise 1 .......................... 29 0.00
Retail Trade
61,700 Kering ................................. 11,046 0.62
Textile and Apparel
12,863 Christian Dior SE ................ 2,336 0.13
2,874 Hermes International ........... 1,013 0.06
58,911
LVMH Moet Hennessy
Louis Vuitton SE ................. 10,103 0.56
108,888 6.06
Germany (5.17%)
Aerospace and Defence
40,662
MTU Aero Engines
AG ....................................... 3,906 0.22
Automobiles
30,214
Bayerische Motoren Werke
AG ....................................... 2,779 0.16
187,650 Daimler AG ......................... 14,406 0.80
Chemicals
38,122 Brenntag AG ....................... 2,181 0.12
52,472 Linde AG ............................. 7,657 0.43
Containers and Packaging
19,763 Gerresheimer AG ................ 1,552 0.09
Diversified Financials
35,483 Deutsche Boerse AG ........... 3,032 0.17
Electrical Equipment
38,126 OSRAM Licht AG .............. 1,968 0.11
Food Products
31,323 Metro AG ............................ 972 0.05
Insurance
75,400 Allianz SE ........................... 12,283 0.68
1,075 Hannover Rueck SE ............ 125 0.01
14,147
Muenchener
Rueckversicherungs-
Gesellschaft AG ................. 2,882 0.16
Pharmaceuticals
144,278 Bayer AG ............................ 16,984 0.94
49,149 Merck KGaA ....................... 4,106 0.23
Number
of Shares
Fair Value
USD ‘000
Fund
%
Software
90,236 SAP SE ADR ...................... 7,257 0.40
Telecommunications
484,382 Deutsche Telekom AG ........ 8,707 0.48
Textile and Apparel
17,739 Adidas AG .......................... 2,082 0.12
92,879 5.17
Hong Kong (1.29%)
Banks
14,100 Hang Seng Bank Ltd ........... 250 0.01
Electric Utilities
70,000 CLP Holdings Ltd ............... 634 0.04
1,607
Power Assets Holdings
Ltd ...................................... 16 0.00
Holding Companies - Diversified Operations
469,000 Wharf Holdings Ltd ............ 2,564 0.14
Insurance
2,509,998 AIA Group Ltd ................... 14,222 0.79
Media
4,424
Television Broadcasts
Ltd ...................................... 16 0.00
Real Estate
151,000
Hysan Development Co
Ltd ...................................... 643 0.03
27,000
Sun Hung Kai Properties
Ltd ...................................... 330 0.02
263,200 Swire Properties Ltd ........... 714 0.04
145,000 Wheelock & Co Ltd ............ 648 0.04
Real Estate Investment Trust
505,500 Link REIT ........................... 2,995 0.17
Transport
24,809 MTR Corp Ltd .................... 122 0.01
23,154 1.29
India (0.32%)
Banks
92,544 HDFC Bank Ltd ADR ........ 5,703 0.32
Ireland (1.76%)
Building Products
198,335 CRH Plc .............................. 5,612 0.31
8,013
James Hardie Industries
Plc ....................................... 110 0.01
Computers and Peripherals
135,845 Accenture Plc ...................... 15,677 0.87
Health Care Equipment and Supplies
137,318 Medtronic Plc ..................... 10,299 0.57
Insurance
222 XL Group Plc ...................... 8 0.00
31,706 1.76
Israel (0.54%)
Banks
292,289 Bank Hapoalim BM ............ 1,516 0.08
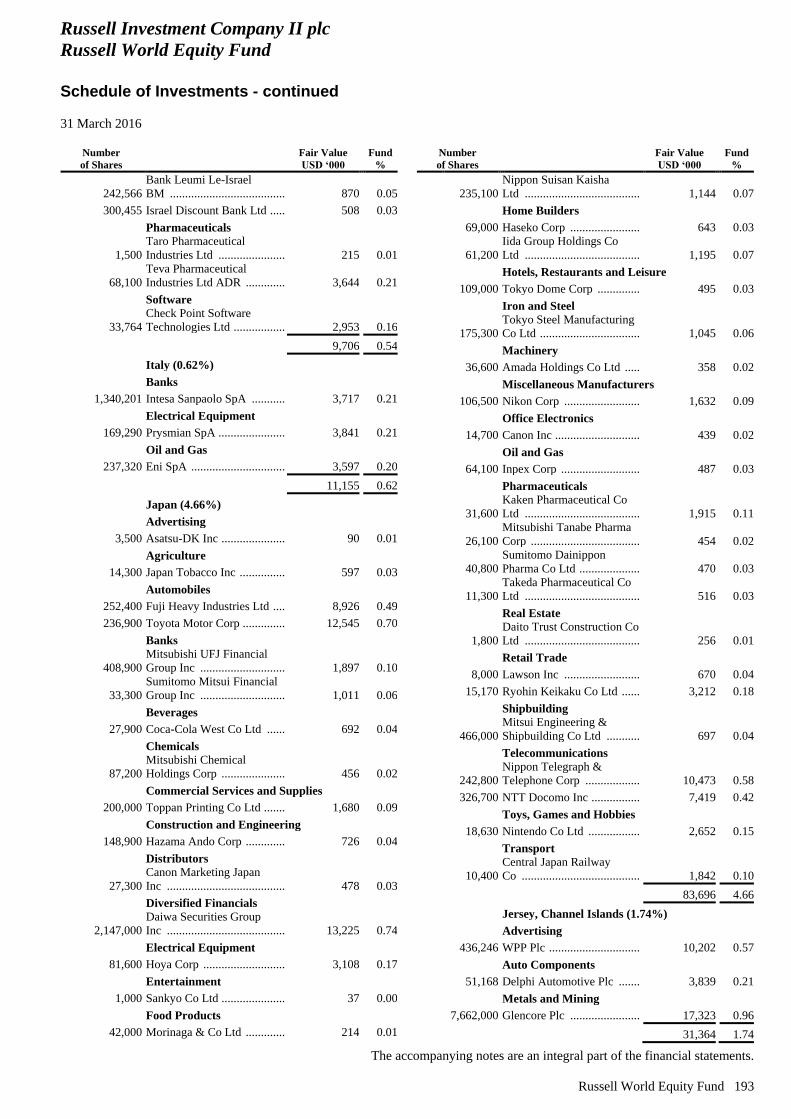
Russell Investment Company II plc
Russell World Equity Fund
Schedule of Investments - continued
31 March 2016
The accompanying notes are an integral part of the financial statements.
Russell World Equity Fund 193
Number
of Shares
Fair Value
USD ‘000
Fund
%
242,566
Bank Leumi Le-Israel
BM ...................................... 870 0.05
300,455 Israel Discount Bank Ltd ..... 508 0.03
Pharmaceuticals
1,500
Taro Pharmaceutical
Industries Ltd ...................... 215 0.01
68,100
Teva Pharmaceutical
Industries Ltd ADR ............. 3,644 0.21
Software
33,764
Check Point Software
Technologies Ltd ................. 2,953 0.16
9,706 0.54
Italy (0.62%)
Banks
1,340,201 Intesa Sanpaolo SpA ........... 3,717 0.21
Electrical Equipment
169,290 Prysmian SpA ...................... 3,841 0.21
Oil and Gas
237,320 Eni SpA ............................... 3,597 0.20
11,155 0.62
Japan (4.66%)
Advertising
3,500 Asatsu-DK Inc ..................... 90 0.01
Agriculture
14,300 Japan Tobacco Inc ............... 597 0.03
Automobiles
252,400 Fuji Heavy Industries Ltd .... 8,926 0.49
236,900 Toyota Motor Corp .............. 12,545 0.70
Banks
408,900
Mitsubishi UFJ Financial
Group Inc ............................ 1,897 0.10
33,300
Sumitomo Mitsui Financial
Group Inc ............................ 1,011 0.06
Beverages
27,900 Coca-Cola West Co Ltd ...... 692 0.04
Chemicals
87,200
Mitsubishi Chemical
Holdings Corp ..................... 456 0.02
Commercial Services and Supplies
200,000 Toppan Printing Co Ltd ....... 1,680 0.09
Construction and Engineering
148,900 Hazama Ando Corp ............. 726 0.04
Distributors
27,300
Canon Marketing Japan
Inc ....................................... 478 0.03
Diversified Financials
2,147,000
Daiwa Securities Group
Inc ....................................... 13,225 0.74
Electrical Equipment
81,600 Hoya Corp ........................... 3,108 0.17
Entertainment
1,000 Sankyo Co Ltd ..................... 37 0.00
Food Products
42,000 Morinaga & Co Ltd ............. 214 0.01
Number
of Shares
Fair Value
USD ‘000
Fund
%
235,100
Nippon Suisan Kaisha
Ltd ...................................... 1,144 0.07
Home Builders
69,000 Haseko Corp ....................... 643 0.03
61,200
Iida Group Holdings Co
Ltd ...................................... 1,195 0.07
Hotels, Restaurants and Leisure
109,000 Tokyo Dome Corp .............. 495 0.03
Iron and Steel
175,300
Tokyo Steel Manufacturing
Co Ltd ................................. 1,045 0.06
Machinery
36,600 Amada Holdings Co Ltd ..... 358 0.02
Miscellaneous Manufacturers
106,500 Nikon Corp ......................... 1,632 0.09
Office Electronics
14,700 Canon Inc ............................ 439 0.02
Oil and Gas
64,100 Inpex Corp .......................... 487 0.03
Pharmaceuticals
31,600
Kaken Pharmaceutical Co
Ltd ...................................... 1,915 0.11
26,100
Mitsubishi Tanabe Pharma
Corp .................................... 454 0.02
40,800
Sumitomo Dainippon
Pharma Co Ltd .................... 470 0.03
11,300
Takeda Pharmaceutical Co
Ltd ...................................... 516 0.03
Real Estate
1,800
Daito Trust Construction Co
Ltd ...................................... 256 0.01
Retail Trade
8,000 Lawson Inc ......................... 670 0.04
15,170 Ryohin Keikaku Co Ltd ...... 3,212 0.18
Shipbuilding
466,000
Mitsui Engineering &
Shipbuilding Co Ltd ........... 697 0.04
Telecommunications
242,800
Nippon Telegraph &
Telephone Corp .................. 10,473 0.58
326,700 NTT Docomo Inc ................ 7,419 0.42
Toys, Games and Hobbies
18,630 Nintendo Co Ltd ................. 2,652 0.15
Transport
10,400
Central Japan Railway
Co ....................................... 1,842 0.10
83,696 4.66
Jersey, Channel Islands (1.74%)
Advertising
436,246 WPP Plc .............................. 10,202 0.57
Auto Components
51,168 Delphi Automotive Plc ....... 3,839 0.21
Metals and Mining
7,662,000 Glencore Plc ....................... 17,323 0.96
31,364 1.74
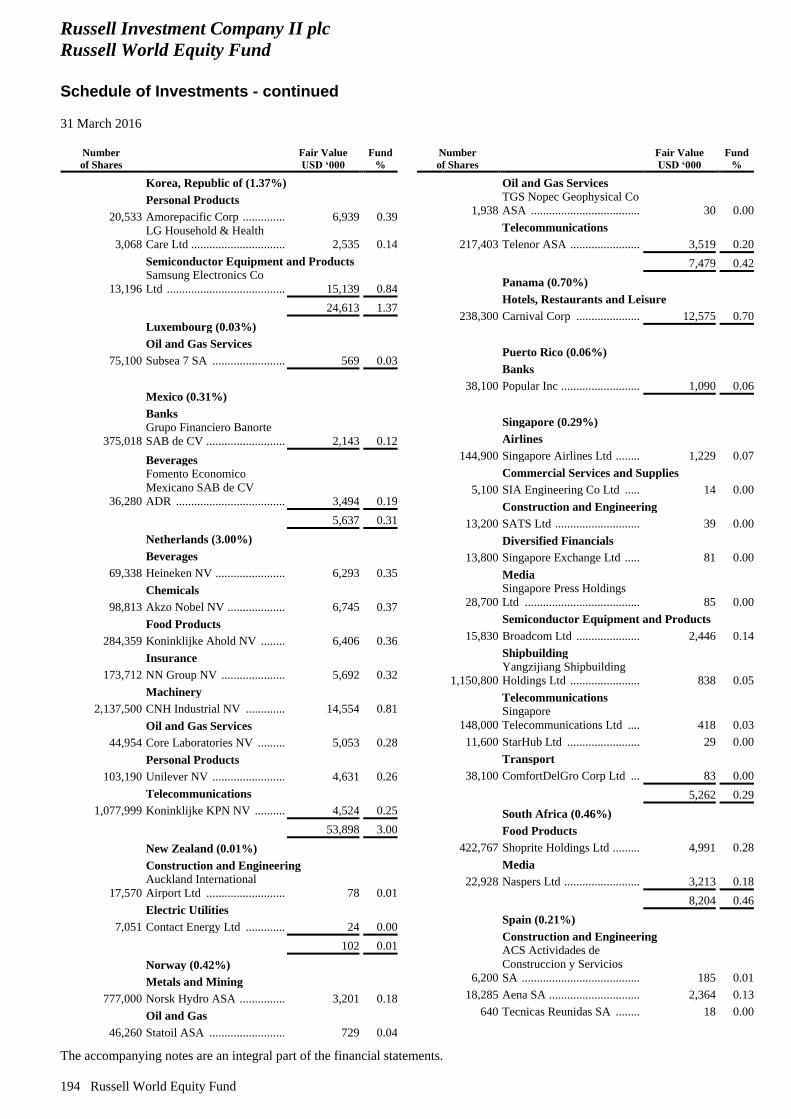
Russell Investment Company II plc
Russell World Equity Fund
Schedule of Investments - continued
31 March 2016
The accompanying notes are an integral part of the financial statements.
194 Russell World Equity Fund
Number
of Shares
Fair Value
USD ‘000
Fund
%
Korea, Republic of (1.37%)
Personal Products
20,533 Amorepacific Corp .............. 6,939 0.39
3,068
LG Household & Health
Care Ltd ............................... 2,535 0.14
Semiconductor Equipment and Products
13,196
Samsung Electronics Co
Ltd ....................................... 15,139 0.84
24,613 1.37
Luxembourg (0.03%)
Oil and Gas Services
75,100 Subsea 7 SA ........................ 569 0.03
Mexico (0.31%)
Banks
375,018
Grupo Financiero Banorte
SAB de CV .......................... 2,143 0.12
Beverages
36,280
Fomento Economico
Mexicano SAB de CV
ADR .................................... 3,494 0.19
5,637 0.31
Netherlands (3.00%)
Beverages
69,338 Heineken NV ....................... 6,293 0.35
Chemicals
98,813 Akzo Nobel NV ................... 6,745 0.37
Food Products
284,359 Koninklijke Ahold NV ........ 6,406 0.36
Insurance
173,712 NN Group NV ..................... 5,692 0.32
Machinery
2,137,500 CNH Industrial NV ............. 14,554 0.81
Oil and Gas Services
44,954 Core Laboratories NV ......... 5,053 0.28
Personal Products
103,190 Unilever NV ........................ 4,631 0.26
Telecommunications
1,077,999 Koninklijke KPN NV .......... 4,524 0.25
53,898 3.00
New Zealand (0.01%)
Construction and Engineering
17,570
Auckland International
Airport Ltd .......................... 78 0.01
Electric Utilities
7,051 Contact Energy Ltd ............. 24 0.00
102 0.01
Norway (0.42%)
Metals and Mining
777,000 Norsk Hydro ASA ............... 3,201 0.18
Oil and Gas
46,260 Statoil ASA ......................... 729 0.04
Number
of Shares
Fair Value
USD ‘000
Fund
%
Oil and Gas Services
1,938
TGS Nopec Geophysical Co
ASA .................................... 30 0.00
Telecommunications
217,403 Telenor ASA ....................... 3,519 0.20
7,479 0.42
Panama (0.70%)
Hotels, Restaurants and Leisure
238,300 Carnival Corp ..................... 12,575 0.70
Puerto Rico (0.06%)
Banks
38,100 Popular Inc .......................... 1,090 0.06
Singapore (0.29%)
Airlines
144,900 Singapore Airlines Ltd ........ 1,229 0.07
Commercial Services and Supplies
5,100 SIA Engineering Co Ltd ..... 14 0.00
Construction and Engineering
13,200 SATS Ltd ............................ 39 0.00
Diversified Financials
13,800 Singapore Exchange Ltd ..... 81 0.00
Media
28,700
Singapore Press Holdings
Ltd ...................................... 85 0.00
Semiconductor Equipment and Products
15,830 Broadcom Ltd ..................... 2,446 0.14
Shipbuilding
1,150,800
Yangzijiang Shipbuilding
Holdings Ltd ....................... 838 0.05
Telecommunications
148,000
Singapore
Telecommunications Ltd .... 418 0.03
11,600 StarHub Ltd ........................ 29 0.00
Transport
38,100 ComfortDelGro Corp Ltd ... 83 0.00
5,262 0.29
South Africa (0.46%)
Food Products
422,767 Shoprite Holdings Ltd ......... 4,991 0.28
Media
22,928 Naspers Ltd ......................... 3,213 0.18
8,204 0.46
Spain (0.21%)
Construction and Engineering
6,200
ACS Actividades de
Construccion y Servicios
SA ....................................... 185 0.01
18,285 Aena SA .............................. 2,364 0.13
640 Tecnicas Reunidas SA ........ 18 0.00
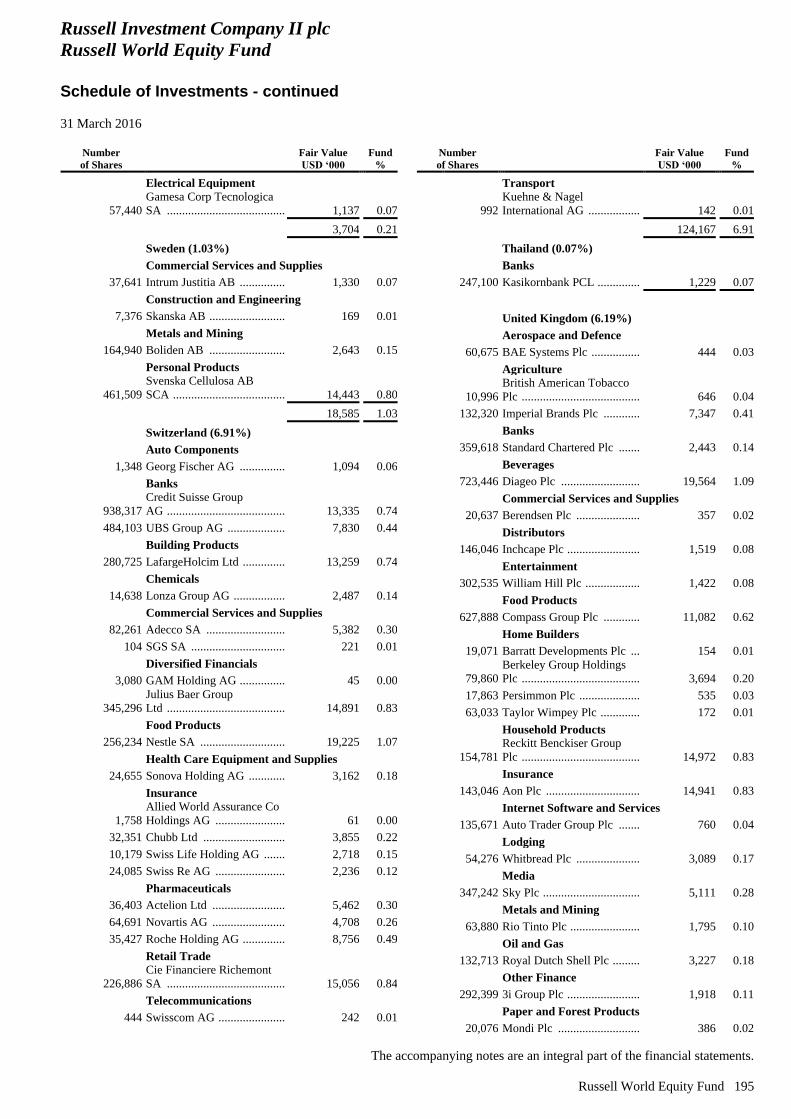
Russell Investment Company II plc
Russell World Equity Fund
Schedule of Investments - continued
31 March 2016
The accompanying notes are an integral part of the financial statements.
Russell World Equity Fund 195
Number
of Shares
Fair Value
USD ‘000
Fund
%
Electrical Equipment
57,440
Gamesa Corp Tecnologica
SA ....................................... 1,137 0.07
3,704 0.21
Sweden (1.03%)
Commercial Services and Supplies
37,641 Intrum Justitia AB ............... 1,330 0.07
Construction and Engineering
7,376 Skanska AB ......................... 169 0.01
Metals and Mining
164,940 Boliden AB ......................... 2,643 0.15
Personal Products
461,509
Svenska Cellulosa AB
SCA ..................................... 14,443 0.80
18,585 1.03
Switzerland (6.91%)
Auto Components
1,348 Georg Fischer AG ............... 1,094 0.06
Banks
938,317
Credit Suisse Group
AG ....................................... 13,335 0.74
484,103 UBS Group AG ................... 7,830 0.44
Building Products
280,725 LafargeHolcim Ltd .............. 13,259 0.74
Chemicals
14,638 Lonza Group AG ................. 2,487 0.14
Commercial Services and Supplies
82,261 Adecco SA .......................... 5,382 0.30
104 SGS SA ............................... 221 0.01
Diversified Financials
3,080 GAM Holding AG ............... 45 0.00
345,296
Julius Baer Group
Ltd ....................................... 14,891 0.83
Food Products
256,234 Nestle SA ............................ 19,225 1.07
Health Care Equipment and Supplies
24,655 Sonova Holding AG ............ 3,162 0.18
Insurance
1,758
Allied World Assurance Co
Holdings AG ....................... 61 0.00
32,351 Chubb Ltd ........................... 3,855 0.22
10,179 Swiss Life Holding AG ....... 2,718 0.15
24,085 Swiss Re AG ....................... 2,236 0.12
Pharmaceuticals
36,403 Actelion Ltd ........................ 5,462 0.30
64,691 Novartis AG ........................ 4,708 0.26
35,427 Roche Holding AG .............. 8,756 0.49
Retail Trade
226,886
Cie Financiere Richemont
SA ....................................... 15,056 0.84
Telecommunications
444 Swisscom AG ...................... 242 0.01
Number
of Shares
Fair Value
USD ‘000
Fund
%
Transport
992
Kuehne & Nagel
International AG ................. 142 0.01
124,167 6.91
Thailand (0.07%)
Banks
247,100 Kasikornbank PCL .............. 1,229 0.07
United Kingdom (6.19%)
Aerospace and Defence
60,675 BAE Systems Plc ................ 444 0.03
Agriculture
10,996
British American Tobacco
Plc ....................................... 646 0.04
132,320 Imperial Brands Plc ............ 7,347 0.41
Banks
359,618 Standard Chartered Plc ....... 2,443 0.14
Beverages
723,446 Diageo Plc .......................... 19,564 1.09
Commercial Services and Supplies
20,637 Berendsen Plc ..................... 357 0.02
Distributors
146,046 Inchcape Plc ........................ 1,519 0.08
Entertainment
302,535 William Hill Plc .................. 1,422 0.08
Food Products
627,888 Compass Group Plc ............ 11,082 0.62
Home Builders
19,071 Barratt Developments Plc ... 154 0.01
79,860
Berkeley Group Holdings
Plc ....................................... 3,694 0.20
17,863 Persimmon Plc .................... 535 0.03
63,033 Taylor Wimpey Plc ............. 172 0.01
Household Products
154,781
Reckitt Benckiser Group
Plc ....................................... 14,972 0.83
Insurance
143,046 Aon Plc ............................... 14,941 0.83
Internet Software and Services
135,671 Auto Trader Group Plc ....... 760 0.04
Lodging
54,276 Whitbread Plc ..................... 3,089 0.17
Media
347,242 Sky Plc ................................ 5,111 0.28
Metals and Mining
63,880 Rio Tinto Plc ....................... 1,795 0.10
Oil and Gas
132,713 Royal Dutch Shell Plc ......... 3,227 0.18
Other Finance
292,399 3i Group Plc ........................ 1,918 0.11
Paper and Forest Products
20,076 Mondi Plc ........................... 386 0.02
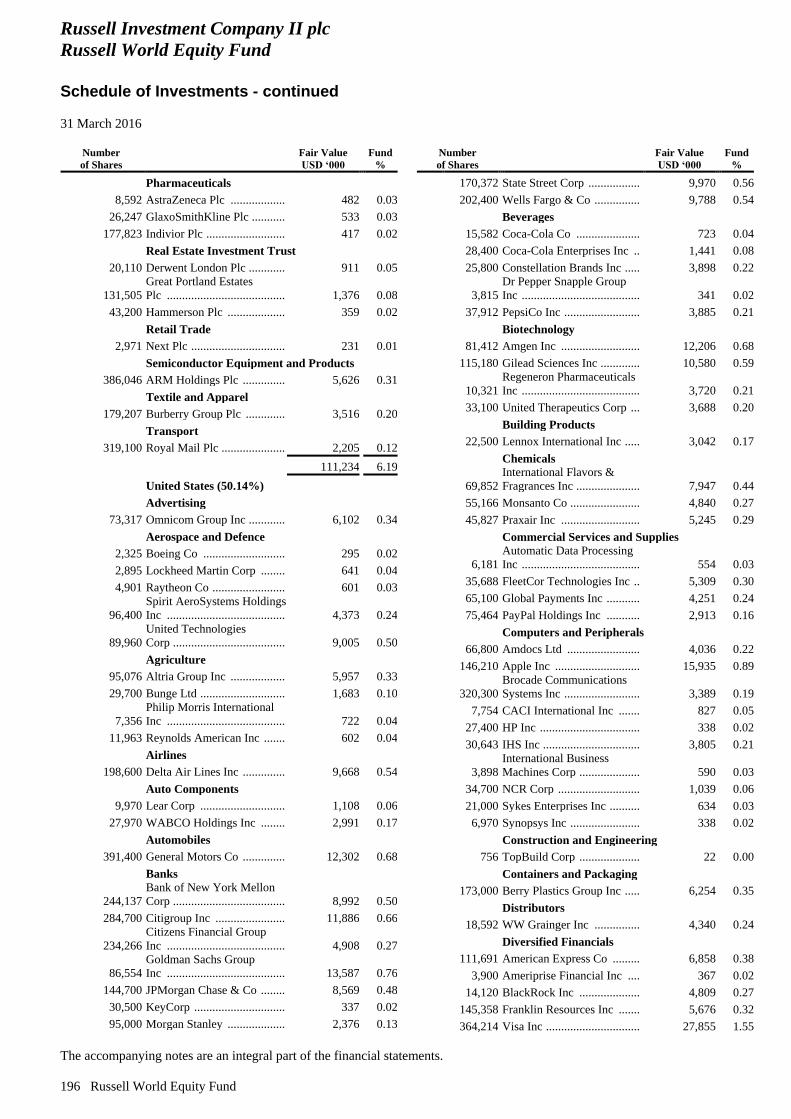
Russell Investment Company II plc
Russell World Equity Fund
Schedule of Investments - continued
31 March 2016
The accompanying notes are an integral part of the financial statements.
196 Russell World Equity Fund
Number
of Shares
Fair Value
USD ‘000
Fund
%
Pharmaceuticals
8,592 AstraZeneca Plc .................. 482 0.03
26,247 GlaxoSmithKline Plc ........... 533 0.03
177,823 Indivior Plc .......................... 417 0.02
Real Estate Investment Trust
20,110 Derwent London Plc ............ 911 0.05
131,505
Great Portland Estates
Plc ....................................... 1,376 0.08
43,200 Hammerson Plc ................... 359 0.02
Retail Trade
2,971 Next Plc ............................... 231 0.01
Semiconductor Equipment and Products
386,046 ARM Holdings Plc .............. 5,626 0.31
Textile and Apparel
179,207 Burberry Group Plc ............. 3,516 0.20
Transport
319,100 Royal Mail Plc ..................... 2,205 0.12
111,234 6.19
United States (50.14%)
Advertising
73,317 Omnicom Group Inc ............ 6,102 0.34
Aerospace and Defence
2,325 Boeing Co ........................... 295 0.02
2,895 Lockheed Martin Corp ........ 641 0.04
4,901 Raytheon Co ........................ 601 0.03
96,400
Spirit AeroSystems Holdings
Inc ....................................... 4,373 0.24
89,960
United Technologies
Corp ..................................... 9,005 0.50
Agriculture
95,076 Altria Group Inc .................. 5,957 0.33
29,700 Bunge Ltd ............................ 1,683 0.10
7,356
Philip Morris International
Inc ....................................... 722 0.04
11,963 Reynolds American Inc ....... 602 0.04
Airlines
198,600 Delta Air Lines Inc .............. 9,668 0.54
Auto Components
9,970 Lear Corp ............................ 1,108 0.06
27,970 WABCO Holdings Inc ........ 2,991 0.17
Automobiles
391,400 General Motors Co .............. 12,302 0.68
Banks
244,137
Bank of New York Mellon
Corp ..................................... 8,992 0.50
284,700 Citigroup Inc ....................... 11,886 0.66
234,266
Citizens Financial Group
Inc ....................................... 4,908 0.27
86,554
Goldman Sachs Group
Inc ....................................... 13,587 0.76
144,700 JPMorgan Chase & Co ........ 8,569 0.48
30,500 KeyCorp .............................. 337 0.02
95,000 Morgan Stanley ................... 2,376 0.13
Number
of Shares
Fair Value
USD ‘000
Fund
%
170,372 State Street Corp ................. 9,970 0.56
202,400 Wells Fargo & Co ............... 9,788 0.54
Beverages
15,582 Coca-Cola Co ..................... 723 0.04
28,400 Coca-Cola Enterprises Inc .. 1,441 0.08
25,800 Constellation Brands Inc ..... 3,898 0.22
3,815
Dr Pepper Snapple Group
Inc ....................................... 341 0.02
37,912 PepsiCo Inc ......................... 3,885 0.21
Biotechnology
81,412 Amgen Inc .......................... 12,206 0.68
115,180 Gilead Sciences Inc ............. 10,580 0.59
10,321
Regeneron Pharmaceuticals
Inc ....................................... 3,720 0.21
33,100 United Therapeutics Corp ... 3,688 0.20
Building Products
22,500 Lennox International Inc ..... 3,042 0.17
Chemicals
69,852
International Flavors &
Fragrances Inc ..................... 7,947 0.44
55,166 Monsanto Co ....................... 4,840 0.27
45,827 Praxair Inc .......................... 5,245 0.29
Commercial Services and Supplies
6,181
Automatic Data Processing
Inc ....................................... 554 0.03
35,688 FleetCor Technologies Inc .. 5,309 0.30
65,100 Global Payments Inc ........... 4,251 0.24
75,464 PayPal Holdings Inc ........... 2,913 0.16
Computers and Peripherals
66,800 Amdocs Ltd ........................ 4,036 0.22
146,210 Apple Inc ............................ 15,935 0.89
320,300
Brocade Communications
Systems Inc ......................... 3,389 0.19
7,754 CACI International Inc ....... 827 0.05
27,400 HP Inc ................................. 338 0.02
30,643 IHS Inc ................................ 3,805 0.21
3,898
International Business
Machines Corp .................... 590 0.03
34,700 NCR Corp ........................... 1,039 0.06
21,000 Sykes Enterprises Inc .......... 634 0.03
6,970 Synopsys Inc ....................... 338 0.02
Construction and Engineering
756 TopBuild Corp .................... 22 0.00
Containers and Packaging
173,000 Berry Plastics Group Inc ..... 6,254 0.35
Distributors
18,592 WW Grainger Inc ............... 4,340 0.24
Diversified Financials
111,691 American Express Co ......... 6,858 0.38
3,900 Ameriprise Financial Inc .... 367 0.02
14,120 BlackRock Inc .................... 4,809 0.27
145,358 Franklin Resources Inc ....... 5,676 0.32
364,214 Visa Inc ............................... 27,855 1.55
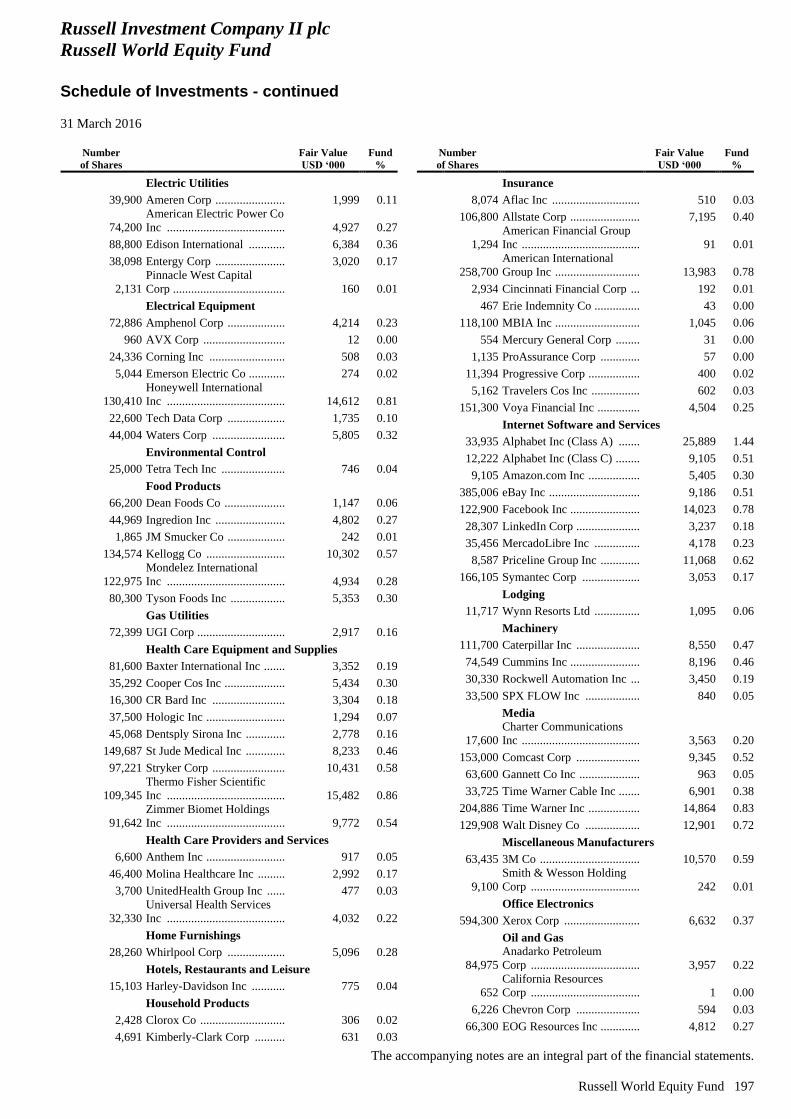
Russell Investment Company II plc
Russell World Equity Fund
Schedule of Investments - continued
31 March 2016
The accompanying notes are an integral part of the financial statements.
Russell World Equity Fund 197
Number
of Shares
Fair Value
USD ‘000
Fund
%
Electric Utilities
39,900 Ameren Corp ....................... 1,999 0.11
74,200
American Electric Power Co
Inc ....................................... 4,927 0.27
88,800 Edison International ............ 6,384 0.36
38,098 Entergy Corp ....................... 3,020 0.17
2,131
Pinnacle West Capital
Corp ..................................... 160 0.01
Electrical Equipment
72,886 Amphenol Corp ................... 4,214 0.23
960 AVX Corp ........................... 12 0.00
24,336 Corning Inc ......................... 508 0.03
5,044 Emerson Electric Co ............ 274 0.02
130,410
Honeywell International
Inc ....................................... 14,612 0.81
22,600 Tech Data Corp ................... 1,735 0.10
44,004 Waters Corp ........................ 5,805 0.32
Environmental Control
25,000 Tetra Tech Inc ..................... 746 0.04
Food Products
66,200 Dean Foods Co .................... 1,147 0.06
44,969 Ingredion Inc ....................... 4,802 0.27
1,865 JM Smucker Co ................... 242 0.01
134,574 Kellogg Co .......................... 10,302 0.57
122,975
Mondelez International
Inc ....................................... 4,934 0.28
80,300 Tyson Foods Inc .................. 5,353 0.30
Gas Utilities
72,399 UGI Corp ............................. 2,917 0.16
Health Care Equipment and Supplies
81,600 Baxter International Inc ....... 3,352 0.19
35,292 Cooper Cos Inc .................... 5,434 0.30
16,300 CR Bard Inc ........................ 3,304 0.18
37,500 Hologic Inc .......................... 1,294 0.07
45,068 Dentsply Sirona Inc ............. 2,778 0.16
149,687 St Jude Medical Inc ............. 8,233 0.46
97,221 Stryker Corp ........................ 10,431 0.58
109,345
Thermo Fisher Scientific
Inc ....................................... 15,482 0.86
91,642
Zimmer Biomet Holdings
Inc ....................................... 9,772 0.54
Health Care Providers and Services
6,600 Anthem Inc .......................... 917 0.05
46,400 Molina Healthcare Inc ......... 2,992 0.17
3,700 UnitedHealth Group Inc ...... 477 0.03
32,330
Universal Health Services
Inc ....................................... 4,032 0.22
Home Furnishings
28,260 Whirlpool Corp ................... 5,096 0.28
Hotels, Restaurants and Leisure
15,103 Harley-Davidson Inc ........... 775 0.04
Household Products
2,428 Clorox Co ............................ 306 0.02
4,691 Kimberly-Clark Corp .......... 631 0.03
Number
of Shares
Fair Value
USD ‘000
Fund
%
Insurance
8,074 Aflac Inc ............................. 510 0.03
106,800 Allstate Corp ....................... 7,195 0.40
1,294
American Financial Group
Inc ....................................... 91 0.01
258,700
American International
Group Inc ............................ 13,983 0.78
2,934 Cincinnati Financial Corp ... 192 0.01
467 Erie Indemnity Co ............... 43 0.00
118,100 MBIA Inc ............................ 1,045 0.06
554 Mercury General Corp ........ 31 0.00
1,135 ProAssurance Corp ............. 57 0.00
11,394 Progressive Corp ................. 400 0.02
5,162 Travelers Cos Inc ................ 602 0.03
151,300 Voya Financial Inc .............. 4,504 0.25
Internet Software and Services
33,935 Alphabet Inc (Class A) ....... 25,889 1.44
12,222 Alphabet Inc (Class C) ........ 9,105 0.51
9,105 Amazon.com Inc ................. 5,405 0.30
385,006 eBay Inc .............................. 9,186 0.51
122,900 Facebook Inc ....................... 14,023 0.78
28,307 LinkedIn Corp ..................... 3,237 0.18
35,456 MercadoLibre Inc ............... 4,178 0.23
8,587 Priceline Group Inc ............. 11,068 0.62
166,105 Symantec Corp ................... 3,053 0.17
Lodging
11,717 Wynn Resorts Ltd ............... 1,095 0.06
Machinery
111,700 Caterpillar Inc ..................... 8,550 0.47
74,549 Cummins Inc ....................... 8,196 0.46
30,330 Rockwell Automation Inc ... 3,450 0.19
33,500 SPX FLOW Inc .................. 840 0.05
Media
17,600
Charter Communications
Inc ....................................... 3,563 0.20
153,000 Comcast Corp ..................... 9,345 0.52
63,600 Gannett Co Inc .................... 963 0.05
33,725 Time Warner Cable Inc ....... 6,901 0.38
204,886 Time Warner Inc ................. 14,864 0.83
129,908 Walt Disney Co .................. 12,901 0.72
Miscellaneous Manufacturers
63,435 3M Co ................................. 10,570 0.59
9,100
Smith & Wesson Holding
Corp .................................... 242 0.01
Office Electronics
594,300 Xerox Corp ......................... 6,632 0.37
Oil and Gas
84,975
Anadarko Petroleum
Corp .................................... 3,957 0.22
652
California Resources
Corp .................................... 1 0.00
6,226 Chevron Corp ..................... 594 0.03
66,300 EOG Resources Inc ............. 4,812 0.27
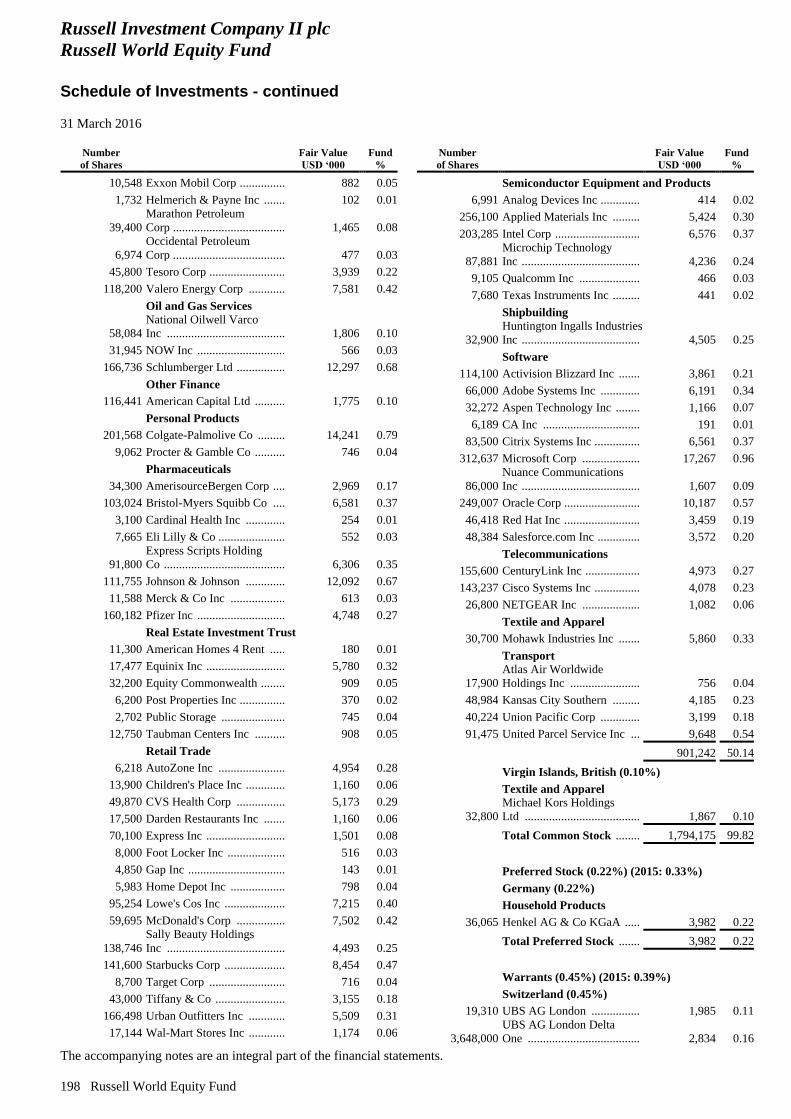
Russell Investment Company II plc
Russell World Equity Fund
Schedule of Investments - continued
31 March 2016
The accompanying notes are an integral part of the financial statements.
198 Russell World Equity Fund
Number
of Shares
Fair Value
USD ‘000
Fund
%
10,548 Exxon Mobil Corp ............... 882 0.05
1,732 Helmerich & Payne Inc ....... 102 0.01
39,400
Marathon Petroleum
Corp ..................................... 1,465 0.08
6,974
Occidental Petroleum
Corp ..................................... 477 0.03
45,800 Tesoro Corp ......................... 3,939 0.22
118,200 Valero Energy Corp ............ 7,581 0.42
Oil and Gas Services
58,084
National Oilwell Varco
Inc ....................................... 1,806 0.10
31,945 NOW Inc ............................. 566 0.03
166,736 Schlumberger Ltd ................ 12,297 0.68
Other Finance
116,441 American Capital Ltd .......... 1,775 0.10
Personal Products
201,568 Colgate-Palmolive Co ......... 14,241 0.79
9,062 Procter & Gamble Co .......... 746 0.04
Pharmaceuticals
34,300 AmerisourceBergen Corp .... 2,969 0.17
103,024 Bristol-Myers Squibb Co .... 6,581 0.37
3,100 Cardinal Health Inc ............. 254 0.01
7,665 Eli Lilly & Co ...................... 552 0.03
91,800
Express Scripts Holding
Co ........................................ 6,306 0.35
111,755 Johnson & Johnson ............. 12,092 0.67
11,588 Merck & Co Inc .................. 613 0.03
160,182 Pfizer Inc ............................. 4,748 0.27
Real Estate Investment Trust
11,300 American Homes 4 Rent ..... 180 0.01
17,477 Equinix Inc .......................... 5,780 0.32
32,200 Equity Commonwealth ........ 909 0.05
6,200 Post Properties Inc ............... 370 0.02
2,702 Public Storage ..................... 745 0.04
12,750 Taubman Centers Inc .......... 908 0.05
Retail Trade
6,218 AutoZone Inc ...................... 4,954 0.28
13,900 Children's Place Inc ............. 1,160 0.06
49,870 CVS Health Corp ................ 5,173 0.29
17,500 Darden Restaurants Inc ....... 1,160 0.06
70,100 Express Inc .......................... 1,501 0.08
8,000 Foot Locker Inc ................... 516 0.03
4,850 Gap Inc ................................ 143 0.01
5,983 Home Depot Inc .................. 798 0.04
95,254 Lowe's Cos Inc .................... 7,215 0.40
59,695 McDonald's Corp ................ 7,502 0.42
138,746
Sally Beauty Holdings
Inc ....................................... 4,493 0.25
141,600 Starbucks Corp .................... 8,454 0.47
8,700 Target Corp ......................... 716 0.04
43,000 Tiffany & Co ....................... 3,155 0.18
166,498 Urban Outfitters Inc ............ 5,509 0.31
17,144 Wal-Mart Stores Inc ............ 1,174 0.06
Number
of Shares
Fair Value
USD ‘000
Fund
%
Semiconductor Equipment and Products
6,991 Analog Devices Inc ............. 414 0.02
256,100 Applied Materials Inc ......... 5,424 0.30
203,285 Intel Corp ............................ 6,576 0.37
87,881
Microchip Technology
Inc ....................................... 4,236 0.24
9,105 Qualcomm Inc .................... 466 0.03
7,680 Texas Instruments Inc ......... 441 0.02
Shipbuilding
32,900
Huntington Ingalls Industries
Inc ....................................... 4,505 0.25
Software
114,100 Activision Blizzard Inc ....... 3,861 0.21
66,000 Adobe Systems Inc ............. 6,191 0.34
32,272 Aspen Technology Inc ........ 1,166 0.07
6,189 CA Inc ................................ 191 0.01
83,500 Citrix Systems Inc ............... 6,561 0.37
312,637 Microsoft Corp ................... 17,267 0.96
86,000
Nuance Communications
Inc ....................................... 1,607 0.09
249,007 Oracle Corp ......................... 10,187 0.57
46,418 Red Hat Inc ......................... 3,459 0.19
48,384 Salesforce.com Inc .............. 3,572 0.20
Telecommunications
155,600 CenturyLink Inc .................. 4,973 0.27
143,237 Cisco Systems Inc ............... 4,078 0.23
26,800 NETGEAR Inc ................... 1,082 0.06
Textile and Apparel
30,700 Mohawk Industries Inc ....... 5,860 0.33
Transport
17,900
Atlas Air Worldwide
Holdings Inc ....................... 756 0.04
48,984 Kansas City Southern ......... 4,185 0.23
40,224 Union Pacific Corp ............. 3,199 0.18
91,475 United Parcel Service Inc ... 9,648 0.54
901,242 50.14
Virgin Islands, British (0.10%)
Textile and Apparel
32,800
Michael Kors Holdings
Ltd ...................................... 1,867 0.10
Total Common Stock ........ 1,794,175 99.82
Preferred Stock (0.22%) (2015: 0.33%)
Germany (0.22%)
Household Products
36,065 Henkel AG & Co KGaA ..... 3,982 0.22
Total Preferred Stock ....... 3,982 0.22
Warrants (0.45%) (2015: 0.39%)
Switzerland (0.45%)
19,310 UBS AG London ................ 1,985 0.11
3,648,000
UBS AG London Delta
One ..................................... 2,834 0.16
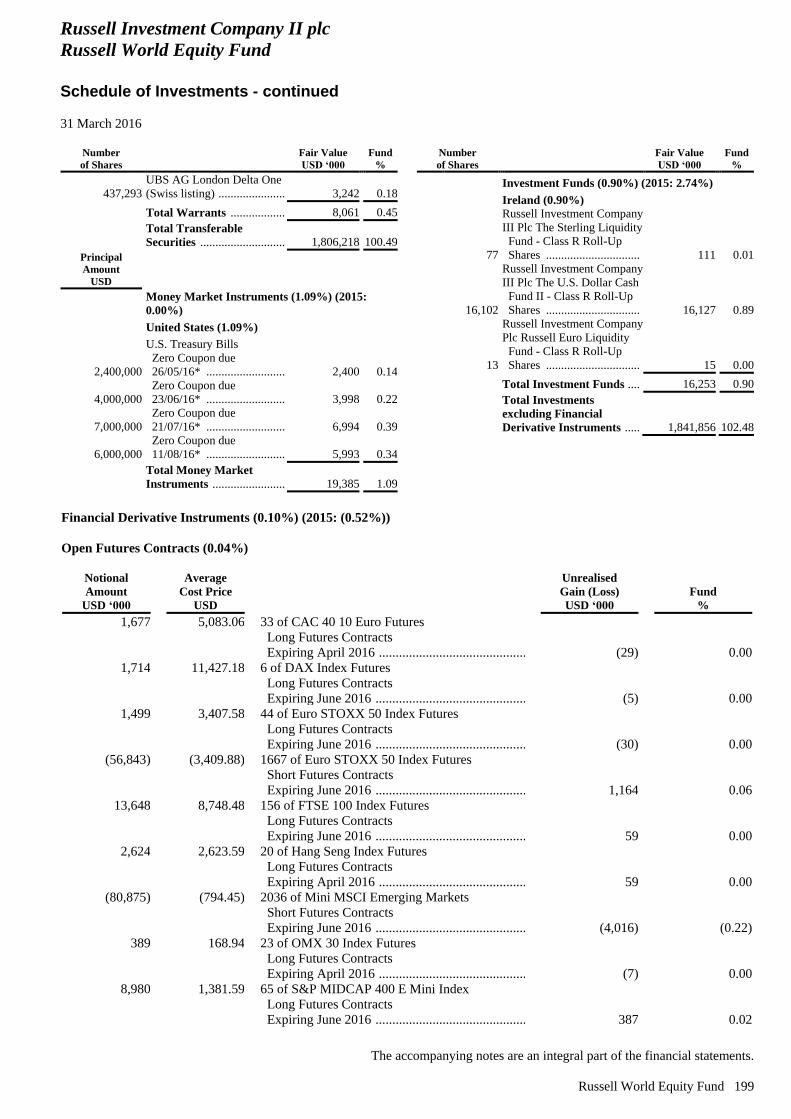
Russell Investment Company II plc
Russell World Equity Fund
Schedule of Investments - continued
31 March 2016
The accompanying notes are an integral part of the financial statements.
Russell World Equity Fund 199
Number
of Shares
Fair Value
USD ‘000
Fund
%
437,293
UBS AG London Delta One
(Swiss listing) ...................... 3,242 0.18
Total Warrants .................. 8,061 0.45
Total Transferable
Securities ............................ 1,806,218 100.49
Principal
Amount
USD
Money Market Instruments (1.09%) (2015:
0.00%)
United States (1.09%)
U.S. Treasury Bills
2,400,000
Zero Coupon due
26/05/16* .......................... 2,400 0.14
4,000,000
Zero Coupon due
23/06/16* .......................... 3,998 0.22
7,000,000
Zero Coupon due
21/07/16* .......................... 6,994 0.39
6,000,000
Zero Coupon due
11/08/16* .......................... 5,993 0.34
Total Money Market
Instruments ........................ 19,385 1.09
Number
of Shares
Fair Value
USD ‘000
Fund
%
Investment Funds (0.90%) (2015: 2.74%)
Ireland (0.90%)
77
Russell Investment Company
III Plc The Sterling Liquidity
Fund - Class R Roll-Up
Shares ............................... 111 0.01
16,102
Russell Investment Company
III Plc The U.S. Dollar Cash
Fund II - Class R Roll-Up
Shares ............................... 16,127 0.89
13
Russell Investment Company
Plc Russell Euro Liquidity
Fund - Class R Roll-Up
Shares ............................... 15 0.00
Total Investment Funds .... 16,253 0.90
Total Investments
excluding Financial
Derivative Instruments ..... 1,841,856 102.48
Financial Derivative Instruments (0.10%) (2015: (0.52%))
Open Futures Contracts (0.04%)
Notional
Amount
USD ‘000
Average
Cost Price
USD
Unrealised
Gain (Loss)
USD ‘000
Fund
%
1,677
5,083.06
33 of CAC 40 10 Euro Futures
Long Futures Contracts
Expiring April 2016 .......................................................................................................... (29) 0.00
1,714
11,427.18
6 of DAX Index Futures
Long Futures Contracts
Expiring June 2016 ........................................................................................................... (5) 0.00
1,499
3,407.58
44 of Euro STOXX 50 Index Futures
Long Futures Contracts
Expiring June 2016 ........................................................................................................... (30) 0.00
(56,843)
(3,409.88)
1667 of Euro STOXX 50 Index Futures
Short Futures Contracts
Expiring June 2016 ........................................................................................................... 1,164 0.06
13,648
8,748.48
156 of FTSE 100 Index Futures
Long Futures Contracts
Expiring June 2016 ........................................................................................................... 59 0.00
2,624
2,623.59
20 of Hang Seng Index Futures
Long Futures Contracts
Expiring April 2016 .......................................................................................................... 59 0.00
(80,875)
(794.45)
2036 of Mini MSCI Emerging Markets
Short Futures Contracts
Expiring June 2016 ........................................................................................................... (4,016) (0.22)
389
168.94
23 of OMX 30 Index Futures
Long Futures Contracts
Expiring April 2016 .......................................................................................................... (7) 0.00
8,980
1,381.59
65 of S&P MIDCAP 400 E Mini Index
Long Futures Contracts
Expiring June 2016 ........................................................................................................... 387 0.02
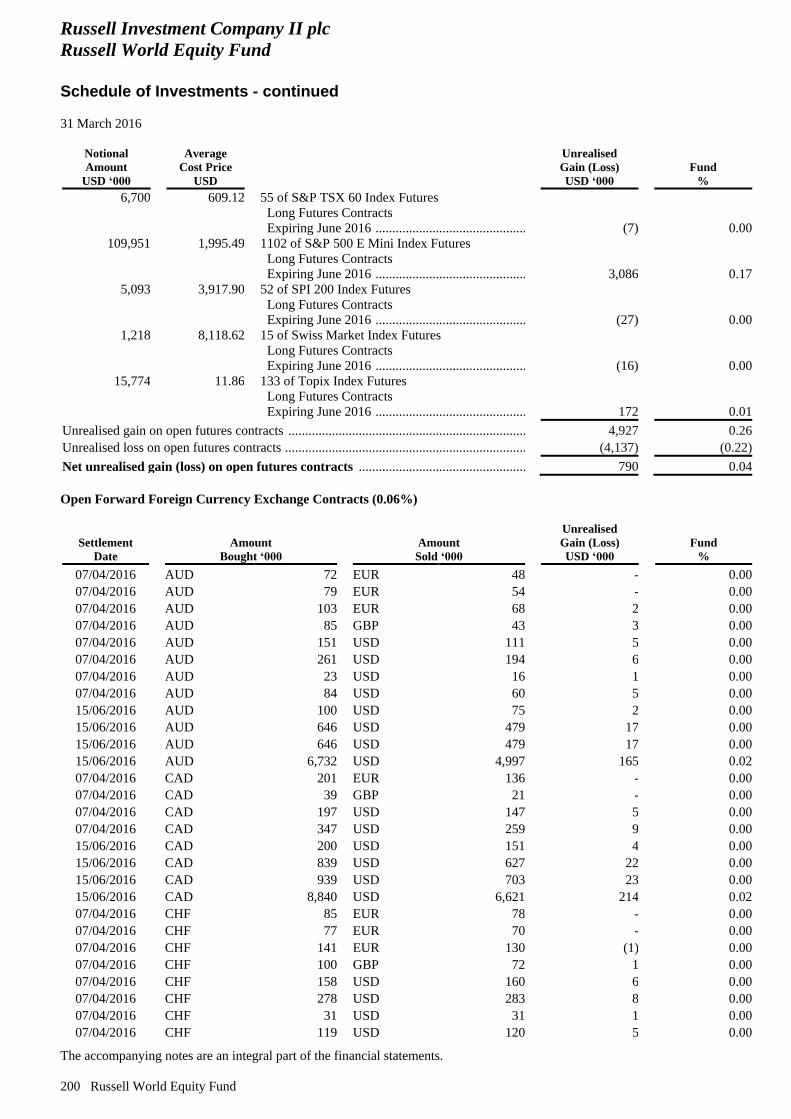
Russell Investment Company II plc
Russell World Equity Fund
Schedule of Investments - continued
31 March 2016
The accompanying notes are an integral part of the financial statements.
200 Russell World Equity Fund
Notional
Amount
USD ‘000
Average
Cost Price
USD
Unrealised
Gain (Loss)
USD ‘000
Fund
%
6,700
609.12
55 of S&P TSX 60 Index Futures
Long Futures Contracts
Expiring June 2016 ........................................................................................................... (7) 0.00
109,951
1,995.49
1102 of S&P 500 E Mini Index Futures
Long Futures Contracts
Expiring June 2016 ........................................................................................................... 3,086 0.17
5,093
3,917.90
52 of SPI 200 Index Futures
Long Futures Contracts
Expiring June 2016 ........................................................................................................... (27) 0.00
1,218
8,118.62
15 of Swiss Market Index Futures
Long Futures Contracts
Expiring June 2016 ........................................................................................................... (16) 0.00
15,774
11.86
133 of Topix Index Futures
Long Futures Contracts
Expiring June 2016 ........................................................................................................... 172 0.01
Unrealised gain on open futures contracts ......................................................................... 4,927 0.26
Unrealised loss on open futures contracts .......................................................................... (4,137) (0.22)
Net unrealised gain (loss) on open futures contracts .................................................... 790 0.04
Open Forward Foreign Currency Exchange Contracts (0.06%)
Settlement
Date
Amount
Bought ‘000
Amount
Sold ‘000
Unrealised
Gain (Loss)
USD ‘000
Fund
%
07/04/2016 AUD 72 EUR 48 - 0.00
07/04/2016 AUD 79 EUR 54 - 0.00
07/04/2016 AUD 103 EUR 68 2 0.00
07/04/2016 AUD 85 GBP 43 3 0.00
07/04/2016 AUD 151 USD 111 5 0.00
07/04/2016 AUD 261 USD 194 6 0.00
07/04/2016 AUD 23 USD 16 1 0.00
07/04/2016 AUD 84 USD 60 5 0.00
15/06/2016 AUD 100 USD 75 2 0.00
15/06/2016 AUD 646 USD 479 17 0.00
15/06/2016 AUD 646 USD 479 17 0.00
15/06/2016 AUD 6,732 USD 4,997 165 0.02
07/04/2016 CAD 201 EUR 136 - 0.00
07/04/2016 CAD 39 GBP 21 - 0.00
07/04/2016 CAD 197 USD 147 5 0.00
07/04/2016 CAD 347 USD 259 9 0.00
15/06/2016 CAD 200 USD 151 4 0.00
15/06/2016 CAD 839 USD 627 22 0.00
15/06/2016 CAD 939 USD 703 23 0.00
15/06/2016 CAD 8,840 USD 6,621 214 0.02
07/04/2016 CHF 85 EUR 78 - 0.00
07/04/2016 CHF 77 EUR 70 - 0.00
07/04/2016 CHF 141 EUR 130 (1) 0.00
07/04/2016 CHF 100 GBP 72 1 0.00
07/04/2016 CHF 158 USD 160 6 0.00
07/04/2016 CHF 278 USD 283 8 0.00
07/04/2016 CHF 31 USD 31 1 0.00
07/04/2016 CHF 119 USD 120 5 0.00
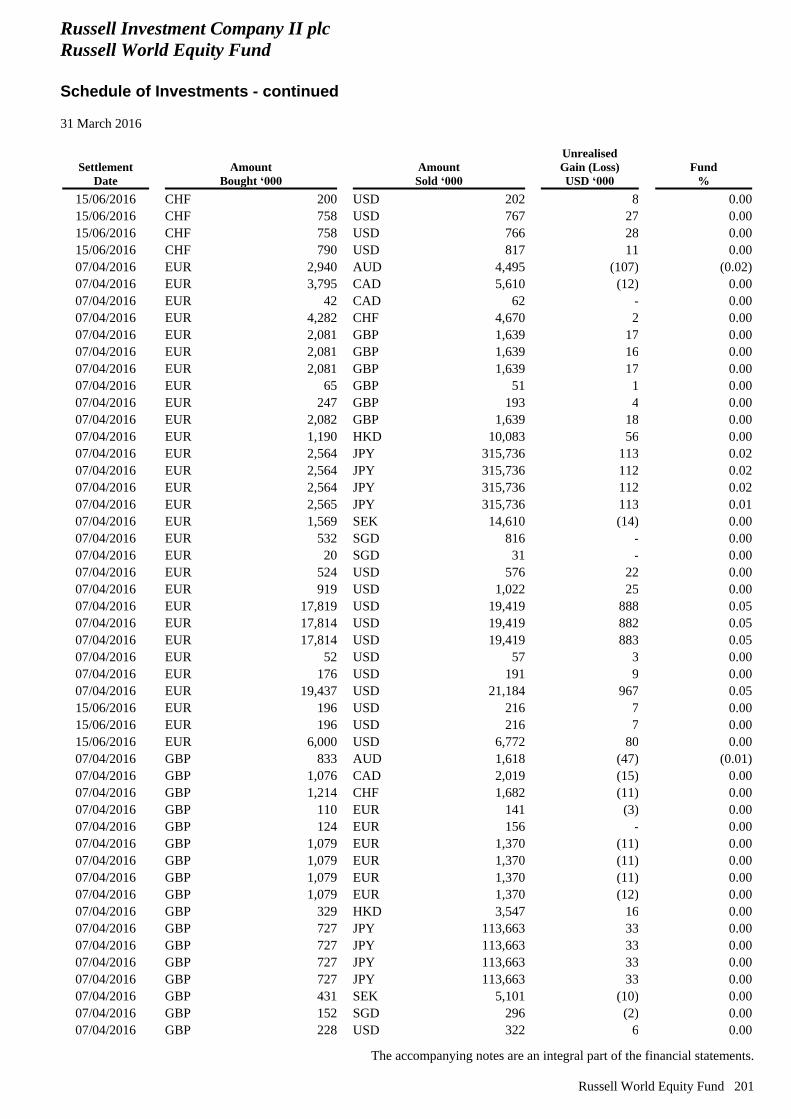
Russell Investment Company II plc
Russell World Equity Fund
Schedule of Investments - continued
31 March 2016
The accompanying notes are an integral part of the financial statements.
Russell World Equity Fund 201
Settlement
Date
Amount
Bought ‘000
Amount
Sold ‘000
Unrealised
Gain (Loss)
USD ‘000
Fund
%
15/06/2016 CHF 200 USD 202 8 0.00
15/06/2016 CHF 758 USD 767 27 0.00
15/06/2016 CHF 758 USD 766 28 0.00
15/06/2016 CHF 790 USD 817 11 0.00
07/04/2016 EUR 2,940 AUD 4,495 (107) (0.02)
07/04/2016 EUR 3,795 CAD 5,610 (12) 0.00
07/04/2016 EUR 42 CAD 62 - 0.00
07/04/2016 EUR 4,282 CHF 4,670 2 0.00
07/04/2016 EUR 2,081 GBP 1,639 17 0.00
07/04/2016 EUR 2,081 GBP 1,639 16 0.00
07/04/2016 EUR 2,081 GBP 1,639 17 0.00
07/04/2016 EUR 65 GBP 51 1 0.00
07/04/2016 EUR 247 GBP 193 4 0.00
07/04/2016 EUR 2,082 GBP 1,639 18 0.00
07/04/2016 EUR 1,190 HKD 10,083 56 0.00
07/04/2016 EUR 2,564 JPY 315,736 113 0.02
07/04/2016 EUR 2,564 JPY 315,736 112 0.02
07/04/2016 EUR 2,564 JPY 315,736 112 0.02
07/04/2016 EUR 2,565 JPY 315,736 113 0.01
07/04/2016 EUR 1,569 SEK 14,610 (14) 0.00
07/04/2016 EUR 532 SGD 816 - 0.00
07/04/2016 EUR 20 SGD 31 - 0.00
07/04/2016 EUR 524 USD 576 22 0.00
07/04/2016 EUR 919 USD 1,022 25 0.00
07/04/2016 EUR 17,819 USD 19,419 888 0.05
07/04/2016 EUR 17,814 USD 19,419 882 0.05
07/04/2016 EUR 17,814 USD 19,419 883 0.05
07/04/2016 EUR 52 USD 57 3 0.00
07/04/2016 EUR 176 USD 191 9 0.00
07/04/2016 EUR 19,437 USD 21,184 967 0.05
15/06/2016 EUR 196 USD 216 7 0.00
15/06/2016 EUR 196 USD 216 7 0.00
15/06/2016 EUR 6,000 USD 6,772 80 0.00
07/04/2016 GBP 833 AUD 1,618 (47) (0.01)
07/04/2016 GBP 1,076 CAD 2,019 (15) 0.00
07/04/2016 GBP 1,214 CHF 1,682 (11) 0.00
07/04/2016 GBP 110 EUR 141 (3) 0.00
07/04/2016 GBP 124 EUR 156 - 0.00
07/04/2016 GBP 1,079 EUR 1,370 (11) 0.00
07/04/2016 GBP 1,079 EUR 1,370 (11) 0.00
07/04/2016 GBP 1,079 EUR 1,370 (11) 0.00
07/04/2016 GBP 1,079 EUR 1,370 (12) 0.00
07/04/2016 GBP 329 HKD 3,547 16 0.00
07/04/2016 GBP 727 JPY 113,663 33 0.00
07/04/2016 GBP 727 JPY 113,663 33 0.00
07/04/2016 GBP 727 JPY 113,663 33 0.00
07/04/2016 GBP 727 JPY 113,663 33 0.00
07/04/2016 GBP 431 SEK 5,101 (10) 0.00
07/04/2016 GBP 152 SGD 296 (2) 0.00
07/04/2016 GBP 228 USD 322 6 0.00
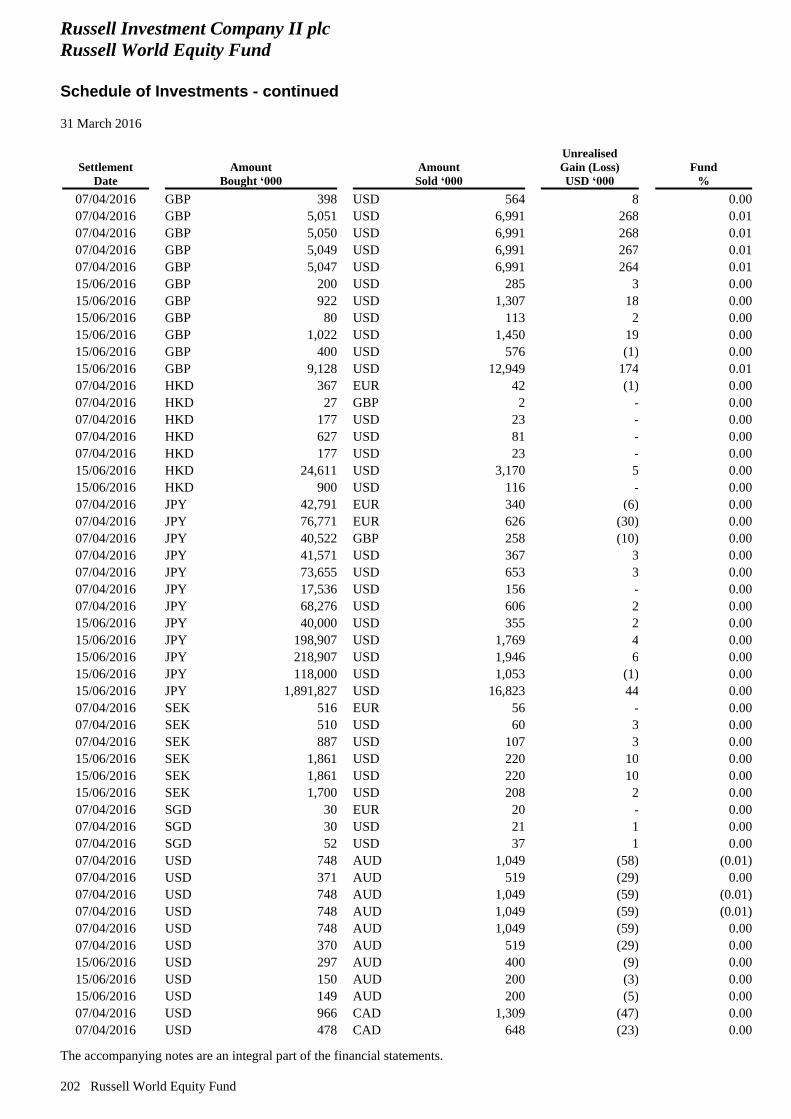
Russell Investment Company II plc
Russell World Equity Fund
Schedule of Investments - continued
31 March 2016
The accompanying notes are an integral part of the financial statements.
202 Russell World Equity Fund
Settlement
Date
Amount
Bought ‘000
Amount
Sold ‘000
Unrealised
Gain (Loss)
USD ‘000
Fund
%
07/04/2016 GBP 398 USD 564 8 0.00
07/04/2016 GBP 5,051 USD 6,991 268 0.01
07/04/2016 GBP 5,050 USD 6,991 268 0.01
07/04/2016 GBP 5,049 USD 6,991 267 0.01
07/04/2016 GBP 5,047 USD 6,991 264 0.01
15/06/2016 GBP 200 USD 285 3 0.00
15/06/2016 GBP 922 USD 1,307 18 0.00
15/06/2016 GBP 80 USD 113 2 0.00
15/06/2016 GBP 1,022 USD 1,450 19 0.00
15/06/2016 GBP 400 USD 576 (1) 0.00
15/06/2016 GBP 9,128 USD 12,949 174 0.01
07/04/2016 HKD 367 EUR 42 (1) 0.00
07/04/2016 HKD 27 GBP 2 - 0.00
07/04/2016 HKD 177 USD 23 - 0.00
07/04/2016 HKD 627 USD 81 - 0.00
07/04/2016 HKD 177 USD 23 - 0.00
15/06/2016 HKD 24,611 USD 3,170 5 0.00
15/06/2016 HKD 900 USD 116 - 0.00
07/04/2016 JPY 42,791 EUR 340 (6) 0.00
07/04/2016 JPY 76,771 EUR 626 (30) 0.00
07/04/2016 JPY 40,522 GBP 258 (10) 0.00
07/04/2016 JPY 41,571 USD 367 3 0.00
07/04/2016 JPY 73,655 USD 653 3 0.00
07/04/2016 JPY 17,536 USD 156 - 0.00
07/04/2016 JPY 68,276 USD 606 2 0.00
15/06/2016 JPY 40,000 USD 355 2 0.00
15/06/2016 JPY 198,907 USD 1,769 4 0.00
15/06/2016 JPY 218,907 USD 1,946 6 0.00
15/06/2016 JPY 118,000 USD 1,053 (1) 0.00
15/06/2016 JPY 1,891,827 USD 16,823 44 0.00
07/04/2016 SEK 516 EUR 56 - 0.00
07/04/2016 SEK 510 USD 60 3 0.00
07/04/2016 SEK 887 USD 107 3 0.00
15/06/2016 SEK 1,861 USD 220 10 0.00
15/06/2016 SEK 1,861 USD 220 10 0.00
15/06/2016 SEK 1,700 USD 208 2 0.00
07/04/2016 SGD 30 EUR 20 - 0.00
07/04/2016 SGD 30 USD 21 1 0.00
07/04/2016 SGD 52 USD 37 1 0.00
07/04/2016 USD 748 AUD 1,049 (58) (0.01)
07/04/2016 USD 371 AUD 519 (29) 0.00
07/04/2016 USD 748 AUD 1,049 (59) (0.01)
07/04/2016 USD 748 AUD 1,049 (59) (0.01)
07/04/2016 USD 748 AUD 1,049 (59) 0.00
07/04/2016 USD 370 AUD 519 (29) 0.00
15/06/2016 USD 297 AUD 400 (9) 0.00
15/06/2016 USD 150 AUD 200 (3) 0.00
15/06/2016 USD 149 AUD 200 (5) 0.00
07/04/2016 USD 966 CAD 1,309 (47) 0.00
07/04/2016 USD 478 CAD 648 (23) 0.00
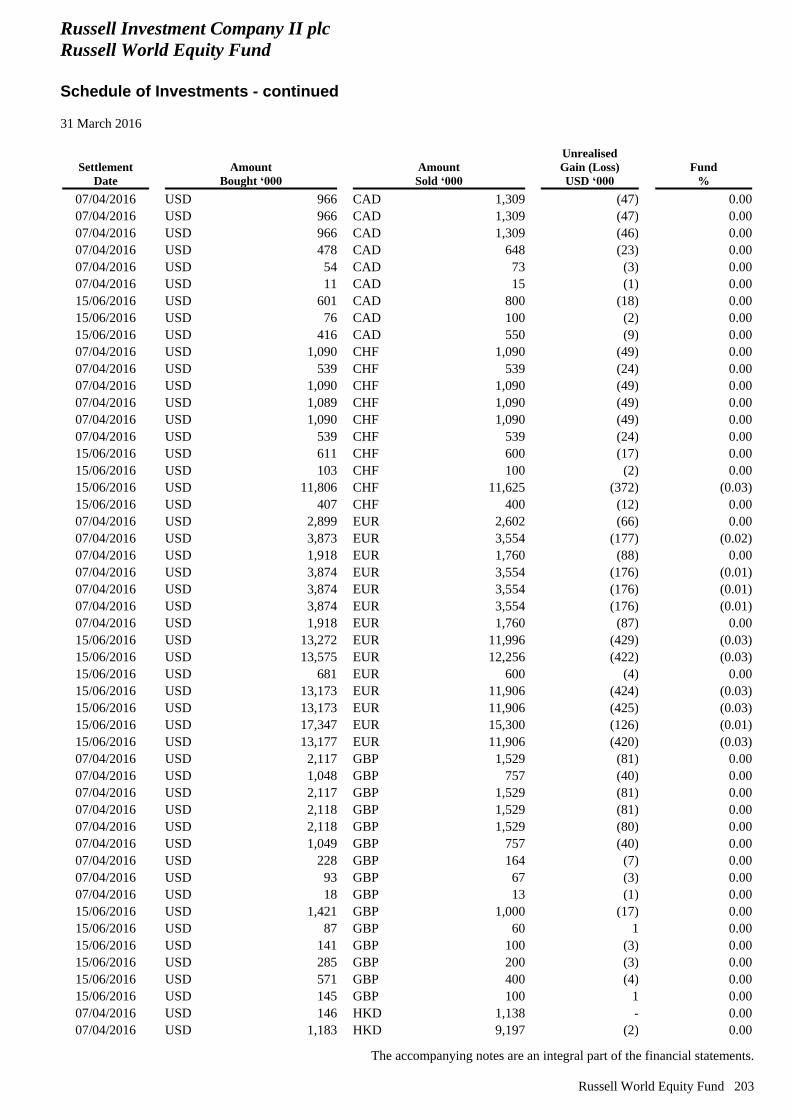
Russell Investment Company II plc
Russell World Equity Fund
Schedule of Investments - continued
31 March 2016
The accompanying notes are an integral part of the financial statements.
Russell World Equity Fund 203
Settlement
Date
Amount
Bought ‘000
Amount
Sold ‘000
Unrealised
Gain (Loss)
USD ‘000
Fund
%
07/04/2016 USD 966 CAD 1,309 (47) 0.00
07/04/2016 USD 966 CAD 1,309 (47) 0.00
07/04/2016 USD 966 CAD 1,309 (46) 0.00
07/04/2016 USD 478 CAD 648 (23) 0.00
07/04/2016 USD 54 CAD 73 (3) 0.00
07/04/2016 USD 11 CAD 15 (1) 0.00
15/06/2016 USD 601 CAD 800 (18) 0.00
15/06/2016 USD 76 CAD 100 (2) 0.00
15/06/2016 USD 416 CAD 550 (9) 0.00
07/04/2016 USD 1,090 CHF 1,090 (49) 0.00
07/04/2016 USD 539 CHF 539 (24) 0.00
07/04/2016 USD 1,090 CHF 1,090 (49) 0.00
07/04/2016 USD 1,089 CHF 1,090 (49) 0.00
07/04/2016 USD 1,090 CHF 1,090 (49) 0.00
07/04/2016 USD 539 CHF 539 (24) 0.00
15/06/2016 USD 611 CHF 600 (17) 0.00
15/06/2016 USD 103 CHF 100 (2) 0.00
15/06/2016 USD 11,806 CHF 11,625 (372) (0.03)
15/06/2016 USD 407 CHF 400 (12) 0.00
07/04/2016 USD 2,899 EUR 2,602 (66) 0.00
07/04/2016 USD 3,873 EUR 3,554 (177) (0.02)
07/04/2016 USD 1,918 EUR 1,760 (88) 0.00
07/04/2016 USD 3,874 EUR 3,554 (176) (0.01)
07/04/2016 USD 3,874 EUR 3,554 (176) (0.01)
07/04/2016 USD 3,874 EUR 3,554 (176) (0.01)
07/04/2016 USD 1,918 EUR 1,760 (87) 0.00
15/06/2016 USD 13,272 EUR 11,996 (429) (0.03)
15/06/2016 USD 13,575 EUR 12,256 (422) (0.03)
15/06/2016 USD 681 EUR 600 (4) 0.00
15/06/2016 USD 13,173 EUR 11,906 (424) (0.03)
15/06/2016 USD 13,173 EUR 11,906 (425) (0.03)
15/06/2016 USD 17,347 EUR 15,300 (126) (0.01)
15/06/2016 USD 13,177 EUR 11,906 (420) (0.03)
07/04/2016 USD 2,117 GBP 1,529 (81) 0.00
07/04/2016 USD 1,048 GBP 757 (40) 0.00
07/04/2016 USD 2,117 GBP 1,529 (81) 0.00
07/04/2016 USD 2,118 GBP 1,529 (81) 0.00
07/04/2016 USD 2,118 GBP 1,529 (80) 0.00
07/04/2016 USD 1,049 GBP 757 (40) 0.00
07/04/2016 USD 228 GBP 164 (7) 0.00
07/04/2016 USD 93 GBP 67 (3) 0.00
07/04/2016 USD 18 GBP 13 (1) 0.00
15/06/2016 USD 1,421 GBP 1,000 (17) 0.00
15/06/2016 USD 87 GBP 60 1 0.00
15/06/2016 USD 141 GBP 100 (3) 0.00
15/06/2016 USD 285 GBP 200 (3) 0.00
15/06/2016 USD 571 GBP 400 (4) 0.00
15/06/2016 USD 145 GBP 100 1 0.00
07/04/2016 USD 146 HKD 1,138 - 0.00
07/04/2016 USD 1,183 HKD 9,197 (2) 0.00
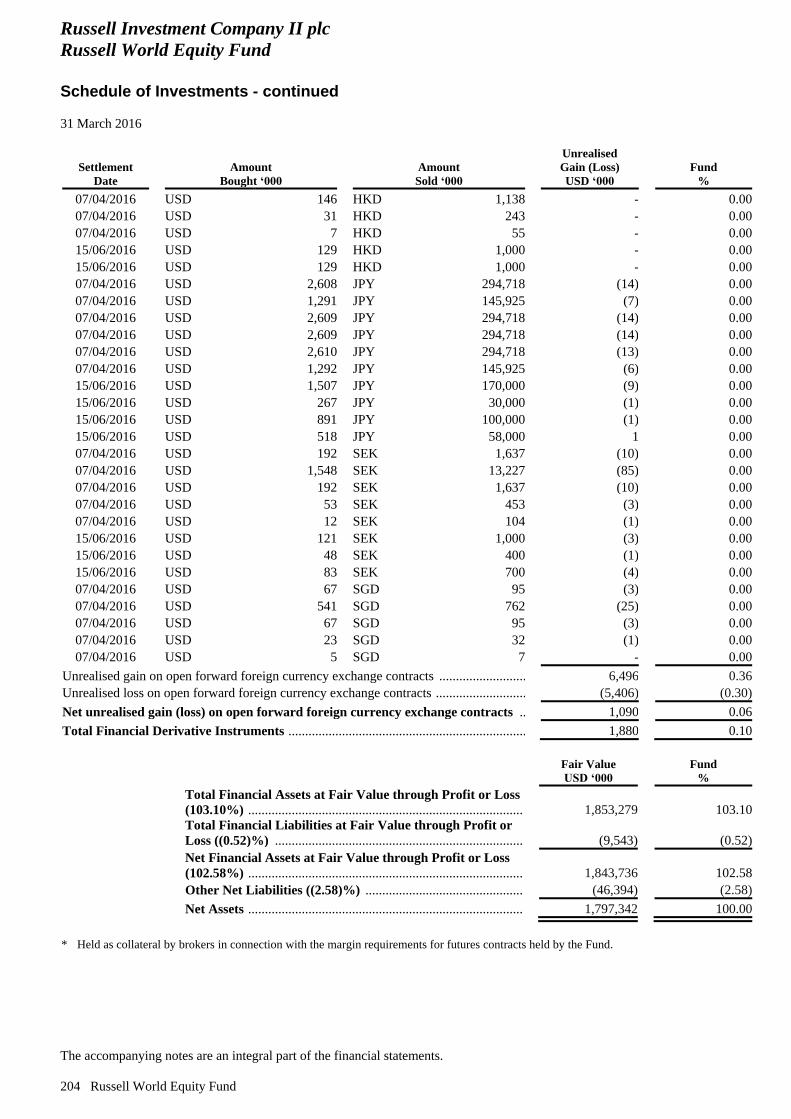
Russell Investment Company II plc
Russell World Equity Fund
Schedule of Investments - continued
31 March 2016
The accompanying notes are an integral part of the financial statements.
204 Russell World Equity Fund
Settlement
Date
Amount
Bought ‘000
Amount
Sold ‘000
Unrealised
Gain (Loss)
USD ‘000
Fund
%
07/04/2016 USD 146 HKD 1,138 - 0.00
07/04/2016 USD 31 HKD 243 - 0.00
07/04/2016 USD 7 HKD 55 - 0.00
15/06/2016 USD 129 HKD 1,000 - 0.00
15/06/2016 USD 129 HKD 1,000 - 0.00
07/04/2016 USD 2,608 JPY 294,718 (14) 0.00
07/04/2016 USD 1,291 JPY 145,925 (7) 0.00
07/04/2016 USD 2,609 JPY 294,718 (14) 0.00
07/04/2016 USD 2,609 JPY 294,718 (14) 0.00
07/04/2016 USD 2,610 JPY 294,718 (13) 0.00
07/04/2016 USD 1,292 JPY 145,925 (6) 0.00
15/06/2016 USD 1,507 JPY 170,000 (9) 0.00
15/06/2016 USD 267 JPY 30,000 (1) 0.00
15/06/2016 USD 891 JPY 100,000 (1) 0.00
15/06/2016 USD 518 JPY 58,000 1 0.00
07/04/2016 USD 192 SEK 1,637 (10) 0.00
07/04/2016 USD 1,548 SEK 13,227 (85) 0.00
07/04/2016 USD 192 SEK 1,637 (10) 0.00
07/04/2016 USD 53 SEK 453 (3) 0.00
07/04/2016 USD 12 SEK 104 (1) 0.00
15/06/2016 USD 121 SEK 1,000 (3) 0.00
15/06/2016 USD 48 SEK 400 (1) 0.00
15/06/2016 USD 83 SEK 700 (4) 0.00
07/04/2016 USD 67 SGD 95 (3) 0.00
07/04/2016 USD 541 SGD 762 (25) 0.00
07/04/2016 USD 67 SGD 95 (3) 0.00
07/04/2016 USD 23 SGD 32 (1) 0.00
07/04/2016 USD 5 SGD 7 - 0.00
Unrealised gain on open forward foreign currency exchange contracts ............................... 6,496 0.36
Unrealised loss on open forward foreign currency exchange contracts ................................ (5,406) (0.30)
Net unrealised gain (loss) on open forward foreign currency exchange contracts ....... 1,090 0.06
Total Financial Derivative Instruments ............................................................................ 1,880 0.10
Fair Value
USD ‘000
Fund
%
Total Financial Assets at Fair Value through Profit or Loss
(103.10%) ..................................................................................................................................................... 1,853,279 103.10
Total Financial Liabilities at Fair Value through Profit or
Loss ((0.52)%) ............................................................................................................................................. (9,543) (0.52)
Net Financial Assets at Fair Value through Profit or Loss
(102.58%) .................................................................................................................................................. 1,843,736 102.58
Other Net Liabilities ((2.58)%) ............................................................................................................... (46,394) (2.58)
Net Assets .................................................................................................................................................. 1,797,342 100.00
* Held as collateral by brokers in connection with the margin requirements for futures contracts held by the Fund.
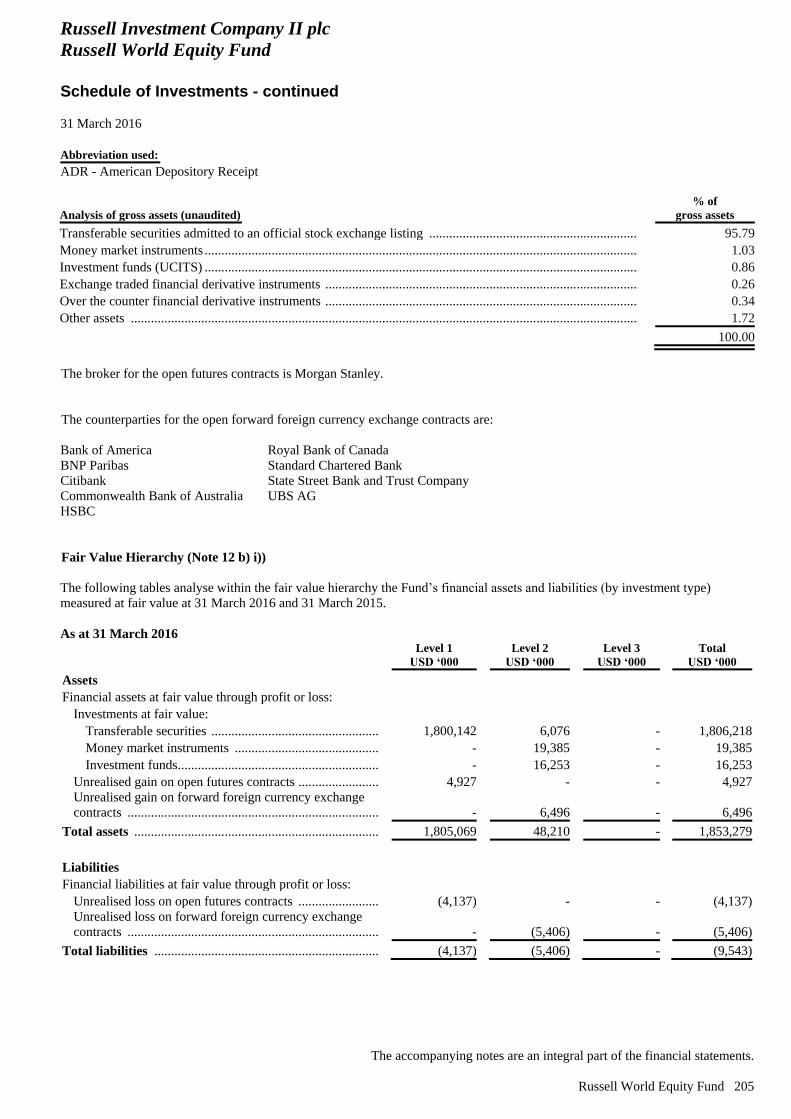
Russell Investment Company II plc
Russell World Equity Fund
Schedule of Investments - continued
31 March 2016
The accompanying notes are an integral part of the financial statements.
Russell World Equity Fund 205
Abbreviation used:
ADR - American Depository Receipt
Analysis of gross assets (unaudited)
% of
gross assets
Transferable securities admitted to an official stock exchange listing ..................................................................... 95.79
Money market instruments ........................................................................................................................................ 1.03
Investment funds (UCITS) ........................................................................................................................................ 0.86
Exchange traded financial derivative instruments .................................................................................................... 0.26
Over the counter financial derivative instruments .................................................................................................... 0.34
Other assets .............................................................................................................................................................. 1.72
100.00
The broker for the open futures contracts is Morgan Stanley.
The counterparties for the open forward foreign currency exchange contracts are:
Bank of America
BNP Paribas
Citibank
Commonwealth Bank of Australia
HSBC
Royal Bank of Canada
Standard Chartered Bank
State Street Bank and Trust Company
UBS AG
Fair Value Hierarchy (Note 12 b) i))
The following tables analyse within the fair value hierarchy the Fund’s financial assets and liabilities (by investment type)
measured at fair value at 31 March 2016 and 31 March 2015.
As at 31 March 2016
Level 1
USD ‘000
Level 2
USD ‘000
Level 3
USD ‘000
Total
USD ‘000
Assets
Financial assets at fair value through profit or loss:
Investments at fair value:
Transferable securities ............................................................... 1,800,142 6,076 - 1,806,218
Money market instruments ........................................................ - 19,385 - 19,385
Investment funds ......................................................................... - 16,253 - 16,253
Unrealised gain on open futures contracts ...................................... 4,927 - - 4,927
Unrealised gain on forward foreign currency exchange
contracts ......................................................................................... - 6,496 - 6,496
Total assets ...................................................................................... 1,805,069 48,210 - 1,853,279
Liabilities
Financial liabilities at fair value through profit or loss:
Unrealised loss on open futures contracts ...................................... (4,137) - - (4,137)
Unrealised loss on forward foreign currency exchange
contracts ......................................................................................... - (5,406) - (5,406)
Total liabilities ................................................................................ (4,137) (5,406) - (9,543)
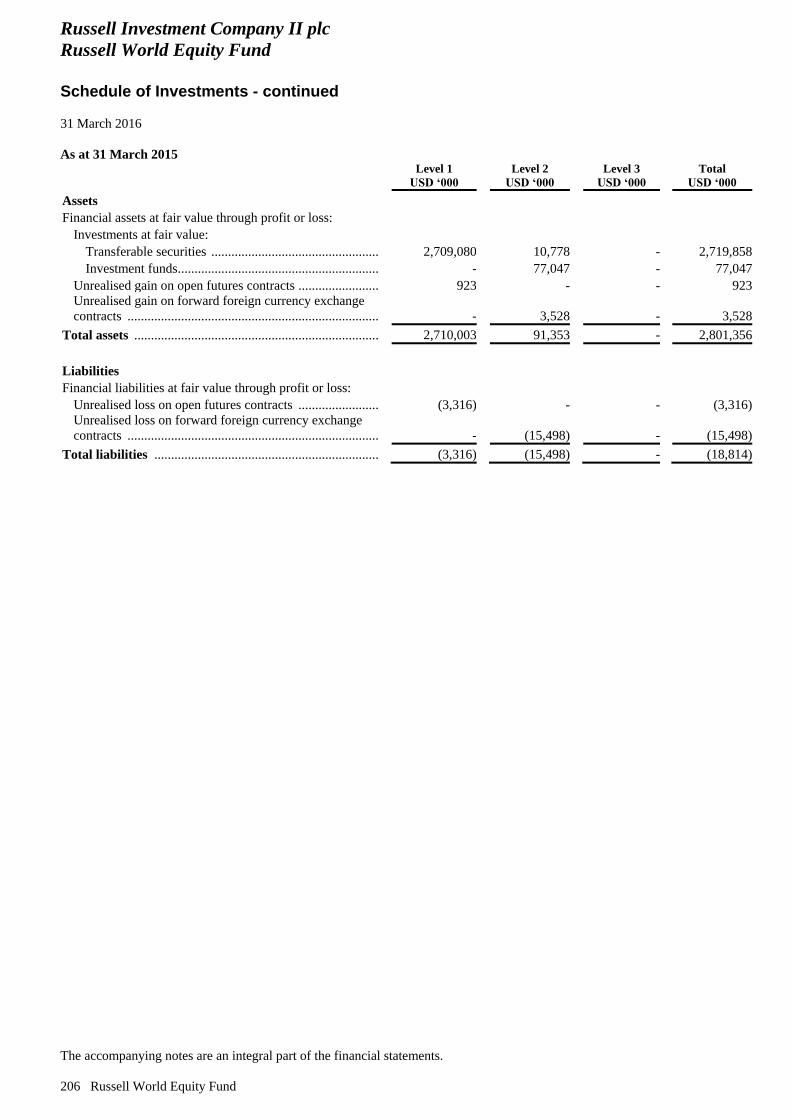
Russell Investment Company II plc
Russell World Equity Fund
Schedule of Investments - continued
31 March 2016
The accompanying notes are an integral part of the financial statements.
206 Russell World Equity Fund
As at 31 March 2015
Level 1
USD ‘000
Level 2
USD ‘000
Level 3
USD ‘000
Total
USD ‘000
Assets
Financial assets at fair value through profit or loss:
Investments at fair value:
Transferable securities ............................................................... 2,709,080 10,778 - 2,719,858
Investment funds ......................................................................... - 77,047 - 77,047
Unrealised gain on open futures contracts ...................................... 923 - - 923
Unrealised gain on forward foreign currency exchange
contracts ......................................................................................... - 3,528 - 3,528
Total assets ...................................................................................... 2,710,003 91,353 - 2,801,356
Liabilities
Financial liabilities at fair value through profit or loss:
Unrealised loss on open futures contracts ...................................... (3,316) - - (3,316)
Unrealised loss on forward foreign currency exchange
contracts ......................................................................................... - (15,498) - (15,498)
Total liabilities ................................................................................ (3,316) (15,498) - (18,814)
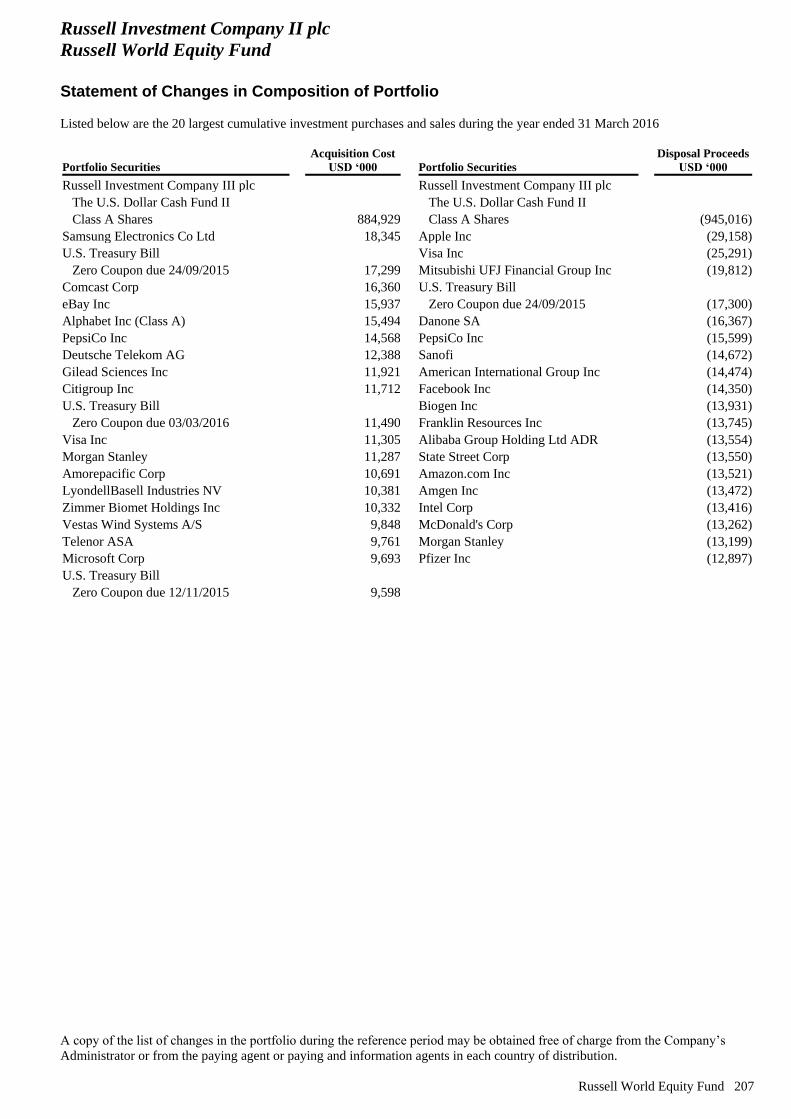
Russell Investment Company II plc
Russell World Equity Fund
Statement of Changes in Composition of Portfolio
Listed below are the 20 largest cumulative investment purchases and sales during the year ended 31 March 2016
A copy of the list of changes in the portfolio during the reference period may be obtained free of charge from the Company’s
Administrator or from the paying agent or paying and information agents in each country of distribution.
Russell World Equity Fund 207
Portfolio Securities
Acquisition Cost
USD ‘000 Portfolio Securities
Disposal Proceeds
USD ‘000
Russell Investment Company III plc Russell Investment Company III plc
The U.S. Dollar Cash Fund II The U.S. Dollar Cash Fund II
Class A Shares 884,929 Class A Shares (945,016)
Samsung Electronics Co Ltd 18,345 Apple Inc (29,158)
U.S. Treasury Bill Visa Inc (25,291)
Zero Coupon due 24/09/2015 17,299 Mitsubishi UFJ Financial Group Inc (19,812)
Comcast Corp 16,360 U.S. Treasury Bill
eBay Inc 15,937 Zero Coupon due 24/09/2015 (17,300)
Alphabet Inc (Class A) 15,494 Danone SA (16,367)
PepsiCo Inc 14,568 PepsiCo Inc (15,599)
Deutsche Telekom AG 12,388 Sanofi (14,672)
Gilead Sciences Inc 11,921 American International Group Inc (14,474)
Citigroup Inc 11,712 Facebook Inc (14,350)
U.S. Treasury Bill Biogen Inc (13,931)
Zero Coupon due 03/03/2016 11,490 Franklin Resources Inc (13,745)
Visa Inc 11,305 Alibaba Group Holding Ltd ADR (13,554)
Morgan Stanley 11,287 State Street Corp (13,550)
Amorepacific Corp 10,691 Amazon.com Inc (13,521)
LyondellBasell Industries NV 10,381 Amgen Inc (13,472)
Zimmer Biomet Holdings Inc 10,332 Intel Corp (13,416)
Vestas Wind Systems A/S 9,848 McDonald's Corp (13,262)
Telenor ASA 9,761 Morgan Stanley (13,199)
Microsoft Corp 9,693 Pfizer Inc (12,897)
U.S. Treasury Bill
Zero Coupon due 12/11/2015 9,598
Russell Investment Company II plc
Notes to the Financial Statements
31 March 2016
208 Notes to the Financial Statements
1. Basis of Preparation
a) Statement of Compliance
The Company’s financial statements are prepared in accordance with accounting standards generally accepted in Ireland
(“Irish GAAP”) including Financial Reporting Standard (“FRS”) 102, the financial reporting standard applicable in the UK
and Republic of Ireland for the first time, Irish statute comprising the Companies Act 2014 and under the European
Communities (Undertakings for Collective Investment in Transferable Securities) Regulations, 2011 (as amended). Irish
GAAP, in preparing financial statements which present a true and fair view are those promulgated by the Institute of
Chartered Accountants in Ireland (the “Institute”) and issued by the Financial Reporting Council (“FRC”). The Companies
Acts prescribed formats for financial statements have been adapted to make them more applicable to investment funds.
The Company has availed of the exemption available to open ended investment funds that hold a substantial proportion of
highly liquid and fair valued investments under Section 7 of FRS 102 and is not presenting cash flow statements. The
information required by FRS 102 to be included in a statement of comprehensive income, is, in the opinion of the Directors,
contained in the Profit and Loss Account of each Fund.
Investments on each individual Schedule of Investments less than 500 in value in the presentation currency of the respective
Fund are rounded to zero.
b) Transition to FRS 102
In 2012, 2013 and 2014 the FRC revised Financial Reporting Standards in the United Kingdom and Republic of Ireland. The
revisions fundamentally reformed financial reporting, replacing the extant standards with a number of new Financial
Reporting Standards. The new standards relevant to the Company are FRS 102: the Financial Reporting Standard applicable
in the UK and Republic of Ireland and FRS 104: Interim Financial Reporting. FRS 102 and FRS 104 are effective for
accounting periods beginning on or after 1 January 2015 with early adoption permitted.
The Directors, on the recommendation of the Manager’s Audit Committee, resolved to adopt and prepare the Company’s
financial statements in accordance with FRS 102, the Financial Reporting Standard applicable in the UK and Republic of
Ireland.
The date of transition to the new accounting framework is 1 April 2014 and accordingly the comparative amounts presented
for the year ended 31 March 2015 are based on the Company’s financial statements for that year after adjustment for the
transition to FRS 102.
The accounting policies applied in preparing these financial statements under FRS 102 are consistent with the accounting
policies applied, except where noted, in preparing the prior year financial statements under the previous accounting
framework. Please refer to note 2 to the financial statements for details of changes to the Company’s accounting policies as a
result of adoption of FRS 102.
c) Combined Financial Statements
The combined financial statements of the Company are measured using Euro. The Company has also adopted Euro as the
presentation currency. The accounts of the individual Funds are translated into Euro and accumulated for preparation of the
combined financial statements.
For the purpose of producing the Combined Balance Sheet, respective financial period end exchange rates are used. For the
purpose of producing the Combined Profit and Loss Account and the Combined Statement of Changes in Net Assets
Attributable to Redeemable Participating Shareholders, the average exchange rates for the relevant period are used. The
currency gain or loss on re-translation of opening net assets, and the average rate difference arising on the translation of the
Combined Profit and Loss Account and the Combined Statement of Changes in Net Assets Attributable to Redeemable
Participating Shareholders, is included in the Combined Statement of Changes in Net Assets Attributable to Redeemable
Participating Shareholders. This translation adjustment does not impact the net asset value per share of any of the individual
Funds.
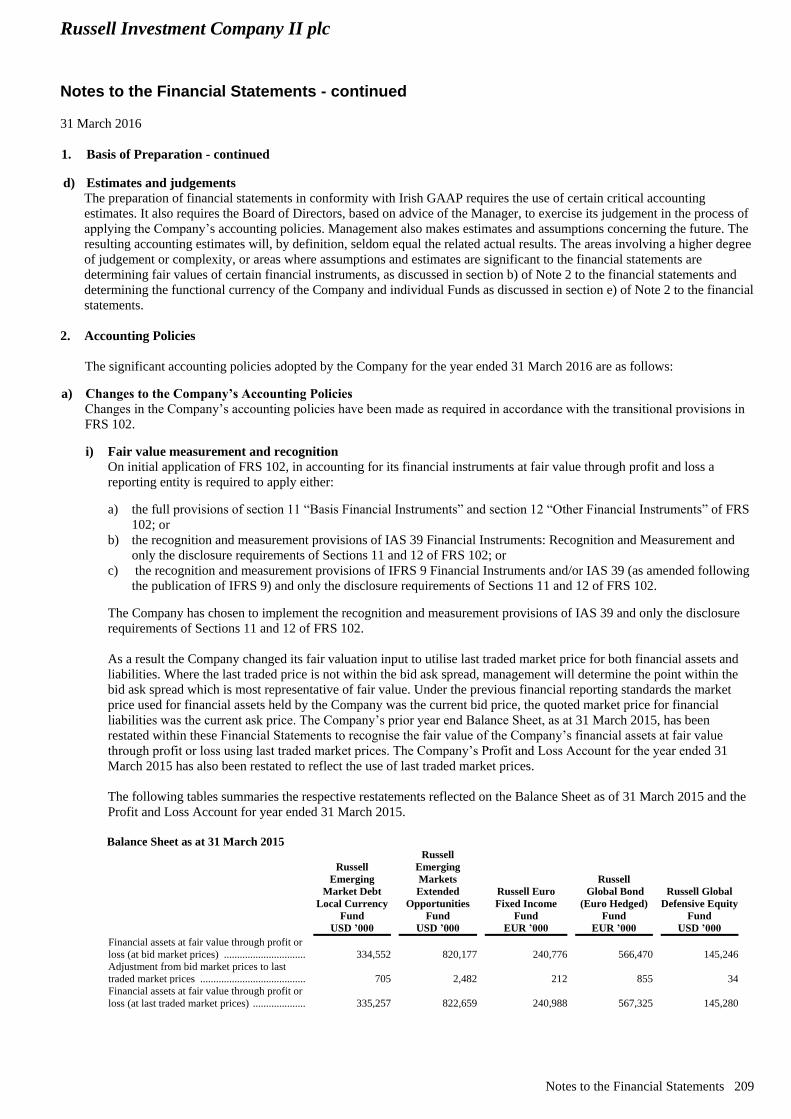
Russell Investment Company II plc
Notes to the Financial Statements - continued
31 March 2016
Notes to the Financial Statements 209
1. Basis of Preparation - continued
d) Estimates and judgements
The preparation of financial statements in conformity with Irish GAAP requires the use of certain critical accounting
estimates. It also requires the Board of Directors, based on advice of the Manager, to exercise its judgement in the process of
applying the Company’s accounting policies. Management also makes estimates and assumptions concerning the future. The
resulting accounting estimates will, by definition, seldom equal the related actual results. The areas involving a higher degree
of judgement or complexity, or areas where assumptions and estimates are significant to the financial statements are
determining fair values of certain financial instruments, as discussed in section b) of Note 2 to the financial statements and
determining the functional currency of the Company and individual Funds as discussed in section e) of Note 2 to the financial
statements.
2. Accounting Policies
The significant accounting policies adopted by the Company for the year ended 31 March 2016 are as follows:
a) Changes to the Company’s Accounting Policies
Changes in the Company’s accounting policies have been made as required in accordance with the transitional provisions in
FRS 102. i) Fair value measurement and recognition
On initial application of FRS 102, in accounting for its financial instruments at fair value through profit and loss a
reporting entity is required to apply either: a) the full provisions of section 11 “Basis Financial Instruments” and section 12 “Other Financial Instruments” of FRS
102; or
b) the recognition and measurement provisions of IAS 39 Financial Instruments: Recognition and Measurement and
only the disclosure requirements of Sections 11 and 12 of FRS 102; or
c) the recognition and measurement provisions of IFRS 9 Financial Instruments and/or IAS 39 (as amended following
the publication of IFRS 9) and only the disclosure requirements of Sections 11 and 12 of FRS 102. The Company has chosen to implement the recognition and measurement provisions of IAS 39 and only the disclosure
requirements of Sections 11 and 12 of FRS 102.
As a result the Company changed its fair valuation input to utilise last traded market price for both financial assets and
liabilities. Where the last traded price is not within the bid ask spread, management will determine the point within the
bid ask spread which is most representative of fair value. Under the previous financial reporting standards the market
price used for financial assets held by the Company was the current bid price, the quoted market price for financial
liabilities was the current ask price. The Company’s prior year end Balance Sheet, as at 31 March 2015, has been
restated within these Financial Statements to recognise the fair value of the Company’s financial assets at fair value
through profit or loss using last traded market prices. The Company’s Profit and Loss Account for the year ended 31
March 2015 has also been restated to reflect the use of last traded market prices.
The following tables summaries the respective restatements reflected on the Balance Sheet as of 31 March 2015 and the
Profit and Loss Account for year ended 31 March 2015.
Balance Sheet as at 31 March 2015
Russell
Emerging
Market Debt
Local Currency
Fund
USD ’000
Russell
Emerging
Markets
Extended
Opportunities
Fund
USD ’000
Russell Euro
Fixed Income
Fund
EUR ’000
Russell
Global Bond
(Euro Hedged)
Fund
EUR ’000
Russell Global
Defensive Equity
Fund
USD ’000
Financial assets at fair value through profit or
loss (at bid market prices) .............................................................................................................................................. …………. 334,552 820,177 240,776 566,470 145,246
Adjustment from bid market prices to last
traded market prices ....................................................................................................................................................... ……….…. 705 2,482 212 855 34
Financial assets at fair value through profit or
loss (at last traded market prices) ................................................................................................................................... 335,257 822,659 240,988 567,325 145,280
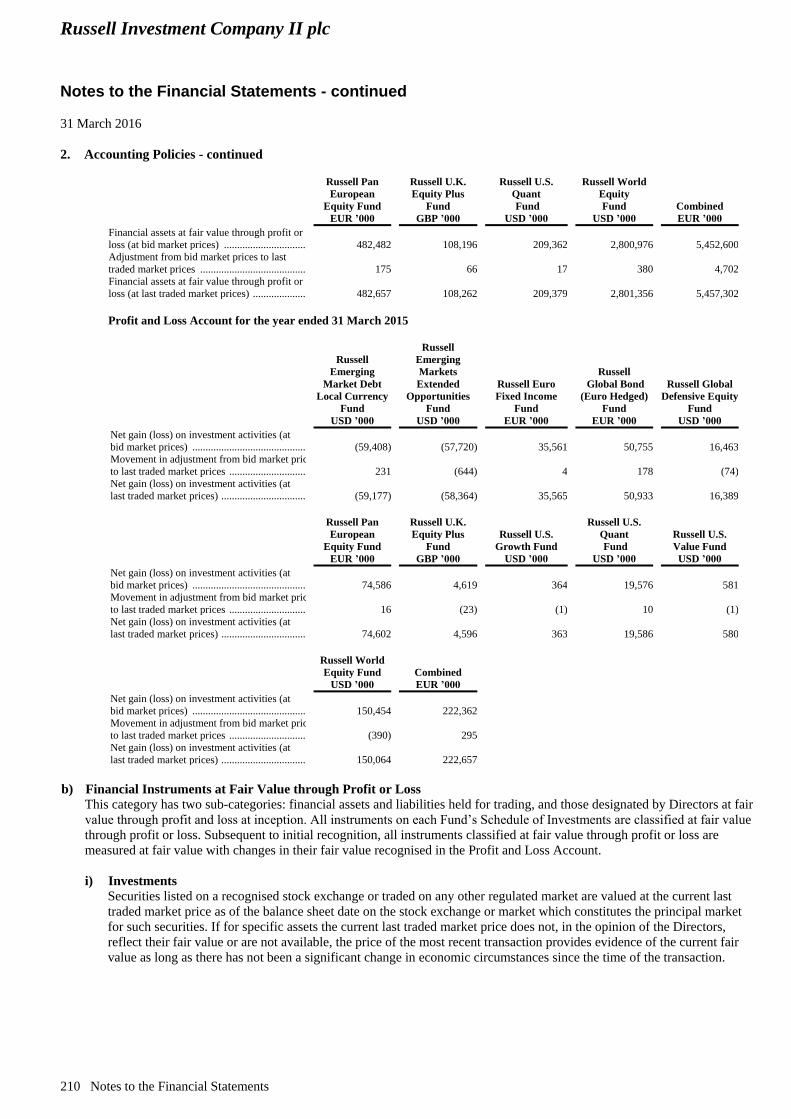
Russell Investment Company II plc
Notes to the Financial Statements - continued
31 March 2016
210 Notes to the Financial Statements
2. Accounting Policies - continued
Russell Pan
European
Equity Fund
EUR ’000
Russell U.K.
Equity Plus
Fund
GBP ’000
Russell U.S.
Quant
Fund
USD ’000
Russell World
Equity
Fund
USD ’000
Combined
EUR ’000
Financial assets at fair value through profit or
loss (at bid market prices) .............................................................................................................................................. …………. 482,482 108,196 209,362 2,800,976 5,452,600
Adjustment from bid market prices to last
traded market prices ....................................................................................................................................................... ……….…. 175 66 17 380 4,702
Financial assets at fair value through profit or
loss (at last traded market prices) ................................................................................................................................... 482,657 108,262 209,379 2,801,356 5,457,302
Profit and Loss Account for the year ended 31 March 2015
Russell
Emerging
Market Debt
Local Currency
Fund
USD ’000
Russell
Emerging
Markets
Extended
Opportunities
Fund
USD ’000
Russell Euro
Fixed Income
Fund
EUR ’000
Russell
Global Bond
(Euro Hedged)
Fund
EUR ’000
Russell Global
Defensive Equity
Fund
USD ’000
Net gain (loss) on investment activities (at
bid market prices) ................................................................................................................................................................ …………. (59,408) (57,720) 35,561 50,755 16,463
Movement in adjustment from bid market prices
to last traded market prices .................................................................................................................................................. ………. 231 (644) 4 178 (74)
Net gain (loss) on investment activities (at
last traded market prices) ..................................................................................................................................................... ………….. (59,177) (58,364) 35,565 50,933 16,389
Russell Pan
European
Equity Fund
EUR ’000
Russell U.K.
Equity Plus
Fund
GBP ’000
Russell U.S.
Growth Fund
USD ’000
Russell U.S.
Quant
Fund
USD ’000
Russell U.S.
Value Fund
USD ’000
Net gain (loss) on investment activities (at
bid market prices) ................................................................................................................................................................ …………. 74,586 4,619 364 19,576 581
Movement in adjustment from bid market prices
to last traded market prices .................................................................................................................................................. ………. 16 (23) (1) 10 (1)
Net gain (loss) on investment activities (at
last traded market prices) ..................................................................................................................................................... ………….. 74,602 4,596 363 19,586 580
Russell World
Equity Fund
USD ’000
Combined
EUR ’000
Net gain (loss) on investment activities (at
bid market prices) ................................................................................................................................................................ …………. 150,454 222,362
Movement in adjustment from bid market prices
to last traded market prices .................................................................................................................................................. ………. (390) 295
Net gain (loss) on investment activities (at
last traded market prices) ..................................................................................................................................................... ………….. 150,064 222,657
b) Financial Instruments at Fair Value through Profit or Loss
This category has two sub-categories: financial assets and liabilities held for trading, and those designated by Directors at fair
value through profit and loss at inception. All instruments on each Fund’s Schedule of Investments are classified at fair value
through profit or loss. Subsequent to initial recognition, all instruments classified at fair value through profit or loss are
measured at fair value with changes in their fair value recognised in the Profit and Loss Account.
i) Investments
Securities listed on a recognised stock exchange or traded on any other regulated market are valued at the current last
traded market price as of the balance sheet date on the stock exchange or market which constitutes the principal market
for such securities. If for specific assets the current last traded market price does not, in the opinion of the Directors,
reflect their fair value or are not available, the price of the most recent transaction provides evidence of the current fair
value as long as there has not been a significant change in economic circumstances since the time of the transaction.
Russell Investment Company II plc
Notes to the Financial Statements - continued
31 March 2016
Notes to the Financial Statements 211
2. Accounting Policies - continued
In the case of any security not listed, quoted or dealt on a regulated market or for which no quotation or value is
available which would provide a fair valuation, or in respect of which the price is unrepresentative, the fair value of such
security is determined on the basis of the probable realisation value and is determined by the Directors, a stockbroker or
other competent person appointed by the Directors and approved for the purpose by the Custodian and Trustee, using
valuation techniques. There was no requirement during the current year for the Directors to appoint a competent person
for such purposes. The Manager or relevant Money Manager, in consultation with the Administrator’s Emergency Price
Committee (the “Pricing Committee”) and the Russell Securities Valuation Committee (“RSVC”), may also determine
the value of such securities using unobservable inputs, and used methods and made assumptions that were based on
market conditions existing at each balance sheet date based on the best information available. Such securities are
classified as Level 3 for fair value hierarchy purposes (see Note 12 b)) for further details on valuation of same) the
values of which are disclosed within the fair value hierarchy tables as disclosed at the base of each Fund’s Schedule of
Investments. The Company uses a variety of methods and makes assumptions that are based on market conditions
existing at each balance sheet date. Valuation techniques used include the use of comparable recent arm’s length
transactions, discounted cash flow analysis and option pricing models. If there is a valuation technique commonly used
by market participants to price the instrument and that technique has been demonstrated to provide reliable estimates of
prices obtained in actual market transactions, the Company uses that technique. Estimation methods and valuation
models may be used to calculate fair value. Due to the dynamic nature of assumptions used in estimating fair value and
market volatility, the values reflected in the financial statements for these investments may differ from the values that
would be determined by negotiations held between parties in a near term sales transaction, and those differences could be
material.
Commercial paper is valued on an amortised basis with reference to the maturity date of these instruments, which
approximates fair value.
Deposits with credit institutions are valued at par.
Investments in open-ended investment funds are valued at fair value at the latest available unaudited net asset value for
the shares or units obtained from the relevant administrator. The changes in the daily net asset value of these shares are
recognised as net gain (loss) on investment activities in the Profit and Loss Account.
ii) Warrants
Warrants are sometimes used to gain exposure to emerging market equities where custody, liquidity, or other issues
make ownership of local shares sub-optimal.
The valuation of the warrants depends on the level of trading. If the warrants are actively traded in the market then the
market price is used. If the warrants are not actively traded in the market then either the intrinsic value of the warrant
based on underlying equity price and warrant strike price or modified Black Scholes derived value, adjusted for
liquidity/other risks deemed appropriate are used.
iii) To Be Announced (“TBA”) Commitments
Certain Funds may enter into TBA purchase commitments to purchase securities for a fixed unit price at a future date
beyond customary settlement time. Although the unit price has been established, the principal value has not been
finalised.
These Funds hold, and maintain until settlement date, cash or high-grade debt obligations in an amount sufficient to meet
the purchase price, or the Funds may enter into offsetting contracts for the forward sale of other securities they own.
Income on the securities will not be earned until settlement date. TBA purchase commitments may be considered
securities in themselves, and involve a risk of loss if the value of the security to be purchased declines prior to settlement
date, the risk of which is in addition to the risk of decline in the value of a Fund’s other assets.
Unsettled TBA purchase commitments are valued at the current fair value of the underlying securities, according to the
procedures described under the Investments section of this note.
Russell Investment Company II plc
Notes to the Financial Statements - continued
31 March 2016
212 Notes to the Financial Statements
2. Accounting Policies - continued
Although the Funds may enter into TBA purchase commitments with the intention of acquiring securities for their
portfolios or for delivery pursuant to options contracts they have entered into, the Funds may dispose of a commitment
prior to settlement if the Money Manager deems it appropriate to do so. The TBA is accounted for in line with the
accounting policy for the underlying instruments.
Certain Funds may enter into TBA sale commitments to hedge their portfolio positions or to sell mortgage backed
securities they own under delayed delivery arrangements. Proceeds of TBA sale commitments are not received until the
contractual settlement date.
During the time a TBA sale commitment is outstanding, equivalent deliverable securities, or an offsetting TBA purchase
commitment deliverable on or before the sale commitment date, are held as “cover” for the transaction.
Unsettled TBA sale commitments are valued at the current fair value of the underlying securities. The contract is
marked-to-market daily and the change in market value is recorded by the Fund as an unrealised gain or loss. If the TBA
sale commitment is closed through the acquisition of an offsetting purchase commitment, the Funds realise a gain or
loss. If the Funds deliver securities under the commitment, the Funds realise a gain or loss from the sale of the securities
based upon the unit price established at the date the commitment was entered into.
iv) Forward and Spot Foreign Currency Exchange Contracts
The fair value of open forward foreign currency exchange contracts and open foreign currency exchange spot contracts is
calculated as the difference between the contracted rate and the current forward rate that would close out the contract on
the balance sheet date. For each relevant Fund, gains or losses on open foreign currency exchange spot contracts are
included in cash at bank in the Balance Sheet and gains or losses on open forward foreign currency exchange contracts
are included in financial assets or liabilities at fair value through profit or loss, as appropriate, on the Balance Sheet and
Schedule of Investments.
v) Futures Contracts
Initial margin deposits are made upon entering into futures contracts and are generally made in cash or cash equivalents.
The fair value of futures contracts is based upon their current quoted daily settlement prices on the relevant exchange as
of the balance sheet date. Changes in the value of open futures contracts are recognised as unrealised gains or losses on
futures contracts until the contracts are terminated, at which time realised gains and losses are recognised. For each
relevant Fund, gains or losses on open futures contracts are shown in the Schedule of Investments and as appropriate, on
the Balance Sheet as financial assets or liabilities at fair value through profit or loss.
vi) Options
Each Fund may purchase and sell (write) call and put options on securities, securities indices and foreign currencies
traded on a national securities exchange or in an over-the-counter market.
When a Fund writes a call or a put option, a premium is received by the Fund. The premium is subsequently marked to
market to reflect the fair value of the option written, which is reported within financial assets or liabilities at fair value
through profit or loss on the Balance Sheet for each relevant Fund. The difference between the premium amount and the
fair value reported on the Balance Sheet gives rise to an unrealised gain (loss).
When a Fund purchases a call or a put option, a premium is paid by the Fund. The premium on purchased put options
exercised is subtracted from the proceeds of the sale of the underlying security or foreign currency in determining the
realised gain or loss. The premium on purchased call options exercised is included in determining initial fair value of the
securities or foreign currency purchased. Premiums paid on the purchase of options which expire unexercised are treated
as realised losses. The option is subsequently marked to market to reflect the fair value of the option purchased, which is
reported within financial assets at fair value through profit or loss on the Balance Sheet for each relevant Fund.
Russell Investment Company II plc
Notes to the Financial Statements - continued
31 March 2016
Notes to the Financial Statements 213
2. Accounting Policies - continued
The over-the-counter options are valued at close of business on the dealing day at the settlement price as provided by the
counterparty/broker and the values are independently valued, at a minimum, weekly. The fair value of exchange traded
options are based upon their quoted daily settlement prices on the relevant exchange. In the event of it being impossible
or incorrect to carry out a valuation of a specific investment in accordance with the valuation rules, or if such valuation is
not representative of a security’s fair market value, the Directors are entitled to use other generally recognised valuation
methods in order to reach a proper valuation of that specific instrument, provided that such method of valuation has been
approved by the Custodian and Trustee.
If an option which a Fund has written either expires on its stipulated expiration date or a Fund enters into a closing
purchase transaction, a Fund realises a gain (or loss, if the cost of a closing purchase transaction exceeds the premium
received when the option was sold) without regard to any unrealised gain or loss on the underlying security, and the
liability related to such option is extinguished. If a call option which a Fund has written is exercised, a Fund realises a
capital gain or loss from the sale of the underlying security, and the proceeds from such sales are increased by the
premium originally received. When a put option which a Fund has written is exercised, the amount of the premium
originally received will reduce the cost of the security which a Fund purchases upon exercise of the option.
vii) Interest Rate Swaps, Currency Swaps and Credit Default Swaps
Interest rate swaps are valued using standard net present value methodologies whereby all future cash flows of the
interest rate swaps are discounted to their present value using the appropriate interest rate.
A currency swap is an interest rate swap in which the cash flows are in different currencies. Upon initiation of a currency
swap, the counterparties make an initial exchange of notional principals in the two currencies. During the life of the
swap, each party pays interest (in the currency of the principal received) to the other. At the maturity of the swap, the
parties make a final exchange of the initial principal amounts, reversing the initial exchange at the same spot rate.
The primary pricing source for interest rate swaps is the counterparty price, the secondary source is the price provided by
the relevant Money Manager and the tertiary source is Reuters/Bloomberg.
Over-the-counter credit default swaps are valued using standard net present value methodologies whereby all future
cashflows of the fixed side of the swap are discounted to their present value using the appropriate interest rate and
whereby all future cashflows of the default side of the swap are discounted to their present value based on the cost of
default to the default payer. This cost is determined by the recovery rate, notional amount of the contract, and default
probability among other factors. An upfront payment received by a Fund, as protection seller, is recorded as a liability on
the Fund’s books. An upfront payment made by a Fund, as protective buyer, is recorded as an asset on the Fund’s books.
The fair value of exchange traded credit default swaps are based upon their quoted daily settlement prices on the relevant
exchange. Yearly payments received or paid are recorded as realised gains or losses and recognised in the Profit and
Loss Account.
The primary pricing source for credit default swaps is the counterparty price, the secondary source is the price provided
by the relevant Money Manager and the tertiary source is Markit.
The notional amount of swap contracts is subsequently marked-to-market to reflect the fair value of the swap which is
reported as a financial asset or liability at fair value through profit or loss as appropriate on the Balance Sheet for each
relevant Fund.
The net amounts of interest payments and receipts on swaps are accrued in the Profit and Loss Account.
viii) Total Return Swaps
A total return swap is an agreement in which one party makes payments based on a set rate, either fixed or variable,
while the other party makes payments based on the return of an underlying asset, which includes both the income it
generates and any capital gains. In total return swaps, the underlying asset, referred to as the reference asset, is usually a
stock or fixed income index. This is owned by the party receiving the set rate payment. Total return swaps allow the
party receiving the total return to gain exposure and benefit from a reference asset without actually having to own it.
Russell Investment Company II plc
Notes to the Financial Statements - continued
31 March 2016
214 Notes to the Financial Statements
2. Accounting Policies - continued
ix) Swaptions
This instrument combines the features of two other financial instruments, namely an option and a swap. A swaption
involves writing/purchasing options to enter into a swap. Swaptions are priced using the standard Black Scholes pricing
model where the inputs required are the term of the option, the price and volatility of the underlying instrument (the
swap), the strike price of the option and the risk free rate of return (yield curve).
A Fund records an unrealised gain (loss) for the amount expected to be received or paid under the swaption agreement if
the agreement was terminated on the balance sheet date and is reported within financial assets or financial liabilities at
fair value through profit or loss on the Fund’s Balance Sheet and Schedule of Investments.
When a Fund writes a swaption, a premium is received by the Fund and the swaption is initially recognised at the
amount of the premium. The swaption is subsequently marked-to-market to reflect the fair value of the swaption written,
which is reported within financial liabilities at fair value through profit or loss on the Fund’s Balance Sheet and Schedule
of Investments. The difference between the premium received and the fair value reported on the Balance Sheet gives rise
to an unrealised gain (loss). When a swaption which the Fund has written is exercised, the amount of the premium
originally received will offset the cost of the swap upon exercise of the option in arriving at the movement in unrealized
gain or loss to be included in the Profit and Loss Account. Premiums received on swaptions written which expire
unexercised are treated as realised gains.
When a Fund purchases a swaption, a premium is paid by the Fund and the swaption is initially recognised at the amount
of the premium. The swaption is subsequently marked-to-market to reflect the fair value of the swaption purchased,
which is reported within financial assets at fair value through profit or loss on the Fund’s Balance Sheet. When a
swaption which the Fund holds is exercised, the amount of the premium originally paid will offset the cost of the swap
upon exercise of the option in arriving at the movement in unrealised gain or loss to be included in the Profit and Loss
Account. Premiums paid from the purchase of swaptions which expire unexercised are treated as realised losses.
c) Net Gain (Loss) on Investment Activities
In respect of each instrument type classified as financial instruments at fair value through profit or loss, the movement in
unrealised gains (losses) since the prior year end and realised gains (losses) are recognised within net gain (loss) on
investment activities in the Profit and Loss Account for each relevant Fund. See Note 4 for details of realised gains (losses) and movement in unrealised gains (losses) since the prior financial year end.
Gains and losses on options, swaps and swaptions are included in the investments figure for each relevant Fund. Gains and
losses on foreign currency exchange contracts are included in foreign currency exchange gains (losses).
d) Accounting for Investment Transactions, Income and Expenses
Purchases and sales of investments are recognised on trade date, the date on which the Fund commits to purchase or sell the
asset, provided the trade instructions have been received by the Custodian and Trustee prior to the calculation of the Fund’s
net asset value, being 2.30pm (Irish time) on each dealing day (the “Valuation Point”). Any trade instructions received by the
Custodian and Trustee after the Valuation Point will be recognised on the next dealing day. Investments are initially
recognised at fair value and transaction costs for all financial assets and financial liabilities carried at fair value through profit
or loss are expensed as incurred. Investments are recognised when the rights to receive cash flows from the investments are transferred to the Fund or the
Fund has exposure to substantially all risks and rewards of ownership. Investments are derecognised when the rights to
receive cash flows from the investments have expired or the Fund has transferred substantially all risks and rewards of
ownership.
Realised gains and losses on investment transactions are calculated using the average cost method. Realised gains and losses
on investments transactions in debt instruments are calculated as the difference between sales proceeds and the amortised
cost of the instrument. Amortised cost is arrived at using the effective interest method. The effective interest method is a
method of calculating the amortised cost of a financial asset or financial liability and of allocating the interest income or
interest expense over the relevant period. Interest income and expense are recognised in the Profit and Loss Account for all
relevant instruments using the effective interest method. Gains and losses realised on the sale of all financial assets and
financial liabilities carried at fair value through profit or loss are recognised in the Profit and Loss Account.
Bank interest is recognised on an accruals basis.
Russell Investment Company II plc
Notes to the Financial Statements - continued
31 March 2016
Notes to the Financial Statements 215
2. Accounting Policies - continued
Dividends are credited to the Profit and Loss Account on the dates on which the relevant securities are listed as “exdividend”.
Income is accounted for gross of any non reclaimable/irrecoverable withholding taxes and net of any tax credits. The
withholding tax is shown separately in the Profit and Loss Account.
Each Fund pays all of its expenses and such proportion of the Company’s expenses as is allocated to that Fund, other than
those expressly assumed by the Manager. The costs and gains (losses) of any hedging transactions will be attributable to the
relevant Share Class. To the extent that expenses are attributable to a specific Share Class of a Fund, that Share Class bears
such expenses. All expenses, as disclosed in the Profit and Loss Account, with the exception of Professional and Other fees,
are accrued on a daily basis. Professional fees and other fees recognised in the Profit and Loss Account are generally charged
and paid when billed to the Funds.
e) Foreign Currency Transactions
In accordance with Section 30 of FRS 102, items included in the individual Fund’s financial statements are measured using
the currency of the primary economic environment in which it operates (functional currency). The Directors’ selection of the
functional currency is attributable to the functional currency being: (a) the major component of the Fund’s benchmarks; or
(b) the common currency of monies received on subscriptions and paid out on redemptions of shares for most clients in the
Funds’ varied client base or (c) the common currency of the majority of the investments held on the Fund. The functional
currency assessment is done on a Fund by Fund basis. The functional currency of the Company is the Euro. Each individual Fund has also adopted its functional currency as the presentation currency. Foreign currency transactions are
translated to the functional currency of the relevant Fund at the rate of exchange ruling on the date of the transaction.
For each relevant Fund: (i) Currency gains and losses can arise where there is a difference between the amounts of foreign dividends and interest
recorded on the Fund’s books and the Fund’s functional currency equivalent to the amounts actually received or paid.
These gains or losses are included where appropriate in the dividend and interest income figure in the Fund’s Profit and
Loss Account;
(ii) Currency gains and losses realised on securities purchase and sales transactions are included in net gain (loss) on
investment activities in the relevant Fund’s Profit and Loss Account;
(iii) Unrealised currency gains and losses on securities held at year end are included in net gain (loss) on investment
activities in the relevant Fund’s Profit and Loss Account;
(iv) Monetary assets and liabilities denominated in currencies other than the Fund’s functional currency are translated at the
rate of exchange ruling at the close of business on the relevant reporting date and exchange differences are included in
net gain (loss) on investment activities in the relevant Fund’s Profit and Loss Account; and
(v) Share transactions which are settled in a currency other than the functional currency of a Fund are settled using the
applicable foreign currency exchange rate as of the trade date. As a result, there is no foreign currency impact on the
Funds for such transactions.
f) Redeemable Participating Shares
Redeemable participating shares are redeemable at the shareholder’s option and are classified as financial liabilities. The
redeemable shares can be repurchased by the Company at any time for cash equal to a proportionate share of the Company’s
net asset value. The redeemable share is carried at the redemption amount that is payable at the balance sheet date if a
shareholder exercised his or her right to have the Company repurchase his or her share. In accordance with the Prospectus,
for the relevant Funds, the Company is contractually obliged to redeem shares at dealing prices and the liability to
redeemable participating shareholders has been adjusted to reflect this. Monetary value share transactions during the year are
recognised in the Statement of Changes in Net Assets Attributable to Redeemable Participating Shareholders of the relevant
Fund.
Russell Investment Company II plc
Notes to the Financial Statements - continued
31 March 2016
216 Notes to the Financial Statements
2. Accounting Policies - continued
g) Distributions
Distributions on Income Share Classes, and deemed distributions on Accumulating Share Classes with an ex date during the
financial year are included as a finance cost in the Profit and Loss Account. The reinvestment of the deemed distribution on
the Accumulation Share Classes are included as a share transaction in the Statement of Changes in Net Assets Attributable to
Redeemable Participating Shareholders. Roll-Up Share Classes do not declare or distribute net income and the net asset value
therefore reflects net income.
h) Swing Pricing/Dilution Adjustments
Swing pricing (also known as dilution adjustment) is applied to a Fund once net subscriptions or redemptions for a Fund
relating to a Fund’s net asset value for a given dealing day is determined by the Administrator to exceed certain pre-
determined percentage thresholds. In calculating the swing pricing, the net asset value of a Fund is swung by a “swing factor”
on the following basis:
Net subscriptions - the price used to process all transactions is adjusted upwards by the swing factor to a notional offer price.
Net redemptions - the price used to process all transactions is adjusted downwards by the swing factor to a notional bid price.
If the net asset value of a Fund is swung on a specific dealing day the official price for a Fund will be the derived swing
price. In addition, all dealing activity for this dealing day will be dealt at the swing price. Swing pricing applied to a Fund
during the year is recognised within the share transactions figure on the Statement of Changes in Net Assets Attributable to
Redeemable Shareholders.
i) Collateral
i) Counterparty Owned Collateral
Counterparty cash received by a Fund as collateral for financial derivative instruments (“FDIs”) transactions is recorded
as an asset on the Balance Sheet within ‘Cash held with brokers and counterparties for open financial derivative
instruments’ and a related liability to repay the collateral is disclosed within creditors less than one year within ‘Cash
due to brokers and counterparties for open financial derivative instruments’.
Non cash collateral received by the Funds does not form part of the Net Asset Value of the Fund and is recorded at the
base of each relevant Schedule of Investments for reference purposes only.
ii) Collateral Pledged by Funds
A Fund’s assets may be deposited by or on behalf of the Fund for collateral purposes with brokers, for options and
futures contracts, and counterparties, in respect of over-the-counter FDIs and TBA positions, held on the Funds. Such
assets remain in the ownership of the relevant Fund and are recorded as an asset on the Balance Sheet. Cash pledged by
the Funds as collateral is recognised on the Balance Sheet within ‘Cash held with brokers and counterparties for open
derivative instruments’. Investments pledged by the Funds as collateral are recognised at fair value in the relevant Fund’s
Schedule of Investments and such investments are referenced accordingly at the base of the Schedule of Investments.
See Note 3 for details of cash collateral received and pledged by the Funds to and from counterparties for FDIs.
iii) Impairment of Collateral
The Adviser has considered the recoverability of collateral due from relevant brokers and counterparties at year end/prior
year end and has considered the need to write-down the value of such collateral. The Adviser is satisfied that the full
value of the collateral is recoverable from all brokers and counterparties at the respective financial year end dates.
j) Transaction Costs
Transaction costs are defined as the incremental costs that are directly attributable to the acquisition, issue or disposal of a
financial asset or financial liability. An incremental cost is one that would not have been incurred if the entity had not
acquired, issued or disposed of the financial instrument. When a financial asset or financial liability is recognised initially, an
entity shall measure it at its fair value through profit or loss plus, transaction costs that are directly attributable to the
acquisition or issue of the financial asset or financial liability.
Transaction costs relating to the brokers commission on the purchase and sale of a financial asset or financial liability, are
included in its purchase and sale price. Transaction costs of the Custodian and Trustee or sub-custodian as the case may be
are embedded in the relevant fees in the Profit and Loss Account.
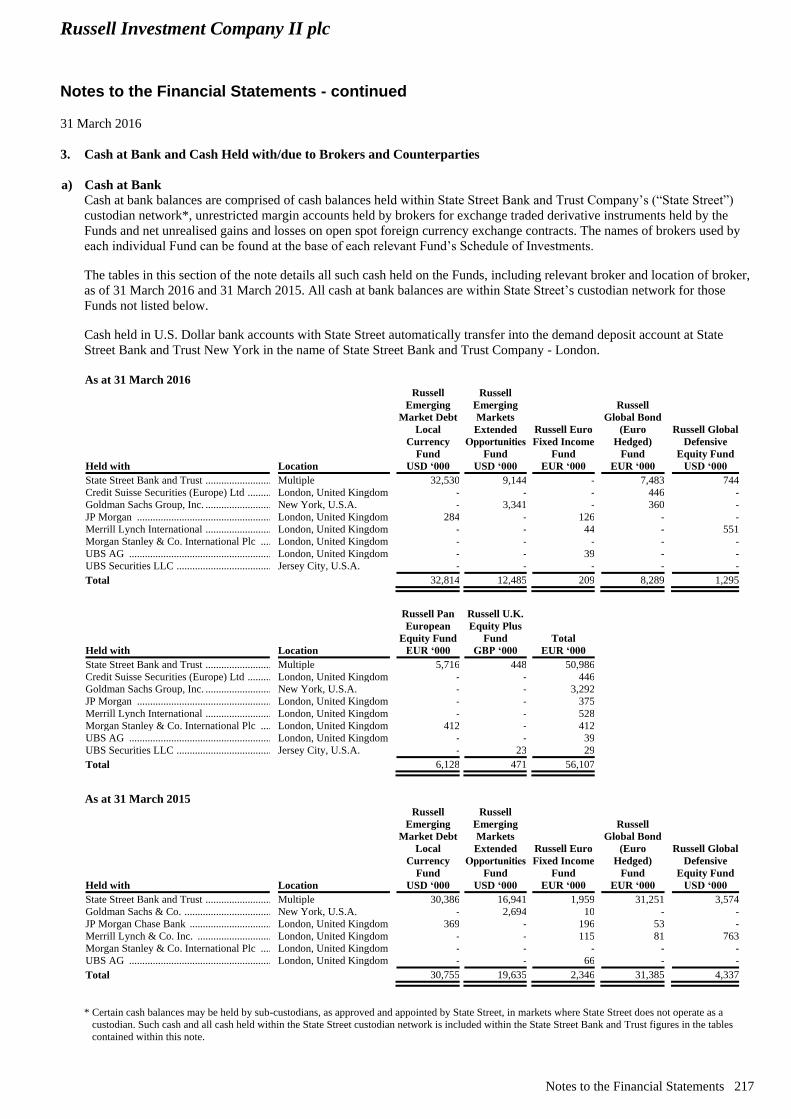
Russell Investment Company II plc
Notes to the Financial Statements - continued
31 March 2016
Notes to the Financial Statements 217
3. Cash at Bank and Cash Held with/due to Brokers and Counterparties
a) Cash at Bank
Cash at bank balances are comprised of cash balances held within State Street Bank and Trust Company’s (“State Street”)
custodian network*, unrestricted margin accounts held by brokers for exchange traded derivative instruments held by the
Funds and net unrealised gains and losses on open spot foreign currency exchange contracts. The names of brokers used by
each individual Fund can be found at the base of each relevant Fund’s Schedule of Investments.
The tables in this section of the note details all such cash held on the Funds, including relevant broker and location of broker,
as of 31 March 2016 and 31 March 2015. All cash at bank balances are within State Street’s custodian network for those
Funds not listed below.
Cash held in U.S. Dollar bank accounts with State Street automatically transfer into the demand deposit account at State
Street Bank and Trust New York in the name of State Street Bank and Trust Company - London.
As at 31 March 2016
Held with Location
Russell
Emerging
Market Debt
Local
Currency
Fund
USD ‘000
Russell
Emerging
Markets
Extended
Opportunities
Fund
USD ‘000
Russell Euro
Fixed Income
Fund
EUR ‘000
Russell
Global Bond
(Euro
Hedged)
Fund
EUR ‘000
Russell Global
Defensive
Equity Fund
USD ‘000
State Street Bank and Trust ............................................. Multiple 32,530 9,144 - 7,483 744
Credit Suisse Securities (Europe) Ltd ............................. London, United Kingdom - - - 446 -
Goldman Sachs Group, Inc. ............................................. New York, U.S.A. - 3,341 - 360 -
JP Morgan ....................................................................... London, United Kingdom 284 - 126 - -
Merrill Lynch International ............................................. London, United Kingdom - - 44 - 551
Morgan Stanley & Co. International Plc ........................ London, United Kingdom - - - - -
UBS AG ....................................................................................................................................................................................... London, United Kingdom - - 39 - -
UBS Securities LLC ..................................................................................................................................................................... Jersey City, U.S.A. - - - - -
Total 32,814 12,485 209 8,289 1,295
Held with Location
Russell Pan
European
Equity Fund
EUR ‘000
Russell U.K.
Equity Plus
Fund
GBP ‘000
Total
EUR ‘000
State Street Bank and Trust ............................................. Multiple 5,716 448 50,986
Credit Suisse Securities (Europe) Ltd ............................. London, United Kingdom - - 446
Goldman Sachs Group, Inc. ............................................. New York, U.S.A. - - 3,292
JP Morgan ....................................................................... London, United Kingdom - - 375
Merrill Lynch International ............................................. London, United Kingdom - - 528
Morgan Stanley & Co. International Plc ........................ London, United Kingdom 412 - 412
UBS AG ....................................................................................................................................................................................... London, United Kingdom - - 39
UBS Securities LLC ..................................................................................................................................................................... Jersey City, U.S.A. - 23 29
Total 6,128 471 56,107
As at 31 March 2015
Held with Location
Russell
Emerging
Market Debt
Local
Currency
Fund
USD ‘000
Russell
Emerging
Markets
Extended
Opportunities
Fund
USD ‘000
Russell Euro
Fixed Income
Fund
EUR ‘000
Russell
Global Bond
(Euro
Hedged)
Fund
EUR ‘000
Russell Global
Defensive
Equity Fund
USD ‘000
State Street Bank and Trust ............................................. Multiple 30,386 16,941 1,959 31,251 3,574
Goldman Sachs & Co. ..................................................... New York, U.S.A. - 2,694 10 - -
JP Morgan Chase Bank ................................................... London, United Kingdom 369 - 196 53 -
Merrill Lynch & Co. Inc. ................................................ London, United Kingdom - - 115 81 763
Morgan Stanley & Co. International Plc ........................ London, United Kingdom - - - - -
UBS AG ....................................................................................................................................................................................... London, United Kingdom - - 66 - -
Total 30,755 19,635 2,346 31,385 4,337
* Certain cash balances may be held by sub-custodians, as approved and appointed by State Street, in markets where State Street does not operate as a
custodian. Such cash and all cash held within the State Street custodian network is included within the State Street Bank and Trust figures in the tables
contained within this note.
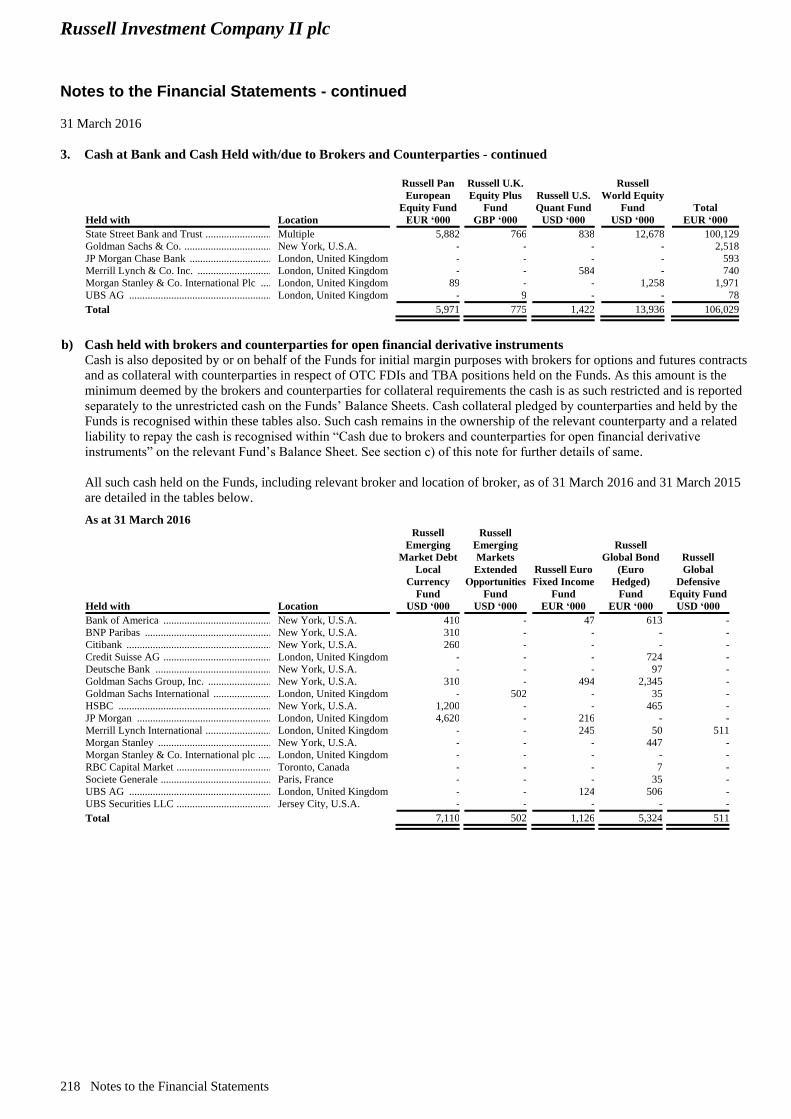
Russell Investment Company II plc
Notes to the Financial Statements - continued
31 March 2016
218 Notes to the Financial Statements
3. Cash at Bank and Cash Held with/due to Brokers and Counterparties - continued
Held with Location
Russell Pan
European
Equity Fund
EUR ‘000
Russell U.K.
Equity Plus
Fund
GBP ‘000
Russell U.S.
Quant Fund
USD ‘000
Russell
World Equity
Fund
USD ‘000
Total
EUR ‘000
State Street Bank and Trust ............................................. Multiple 5,882 766 838 12,678 100,129
Goldman Sachs & Co. ..................................................... New York, U.S.A. - - - - 2,518
JP Morgan Chase Bank ................................................... London, United Kingdom - - - - 593
Merrill Lynch & Co. Inc. ................................................ London, United Kingdom - - 584 - 740
Morgan Stanley & Co. International Plc ........................ London, United Kingdom 89 - - 1,258 1,971
UBS AG ....................................................................................................................................................................................... London, United Kingdom - 9 - - 78
Total 5,971 775 1,422 13,936 106,029
b) Cash held with brokers and counterparties for open financial derivative instruments
Cash is also deposited by or on behalf of the Funds for initial margin purposes with brokers for options and futures contracts
and as collateral with counterparties in respect of OTC FDIs and TBA positions held on the Funds. As this amount is the
minimum deemed by the brokers and counterparties for collateral requirements the cash is as such restricted and is reported
separately to the unrestricted cash on the Funds’ Balance Sheets. Cash collateral pledged by counterparties and held by the
Funds is recognised within these tables also. Such cash remains in the ownership of the relevant counterparty and a related
liability to repay the cash is recognised within “Cash due to brokers and counterparties for open financial derivative
instruments” on the relevant Fund’s Balance Sheet. See section c) of this note for further details of same.
All such cash held on the Funds, including relevant broker and location of broker, as of 31 March 2016 and 31 March 2015
are detailed in the tables below. As at 31 March 2016
Held with Location
Russell
Emerging
Market Debt
Local
Currency
Fund
USD ‘000
Russell
Emerging
Markets
Extended
Opportunities
Fund
USD ‘000
Russell Euro
Fixed Income
Fund
EUR ‘000
Russell
Global Bond
(Euro
Hedged)
Fund
EUR ‘000
Russell
Global
Defensive
Equity Fund
USD ‘000
Bank of America ............................................................. New York, U.S.A. 410 - 47 613 -
BNP Paribas .................................................................... New York, U.S.A. 310 - - - -
Citibank ........................................................................... New York, U.S.A. 260 - - - -
Credit Suisse AG ............................................................. London, United Kingdom - - - 724 -
Deutsche Bank ................................................................ New York, U.S.A. - - - 97 -
Goldman Sachs Group, Inc. ............................................ New York, U.S.A. 310 - 494 2,345 -
Goldman Sachs International .......................................... London, United Kingdom - 502 - 35 -
HSBC .............................................................................. New York, U.S.A. 1,200 - - 465 -
JP Morgan ....................................................................... London, United Kingdom 4,620 - 216 - -
Merrill Lynch International ............................................. London, United Kingdom - - 245 50 511
Morgan Stanley ............................................................... New York, U.S.A. - - - 447 -
Morgan Stanley & Co. International plc ......................... London, United Kingdom - - - - -
RBC Capital Market ........................................................ Toronto, Canada - - - 7 -
Societe Generale .............................................................. Paris, France - - - 35 -
UBS AG .......................................................................... London, United Kingdom - - 124 506 -
UBS Securities LLC ........................................................ Jersey City, U.S.A. - - - - -
Total 7,110 502 1,126 5,324 511
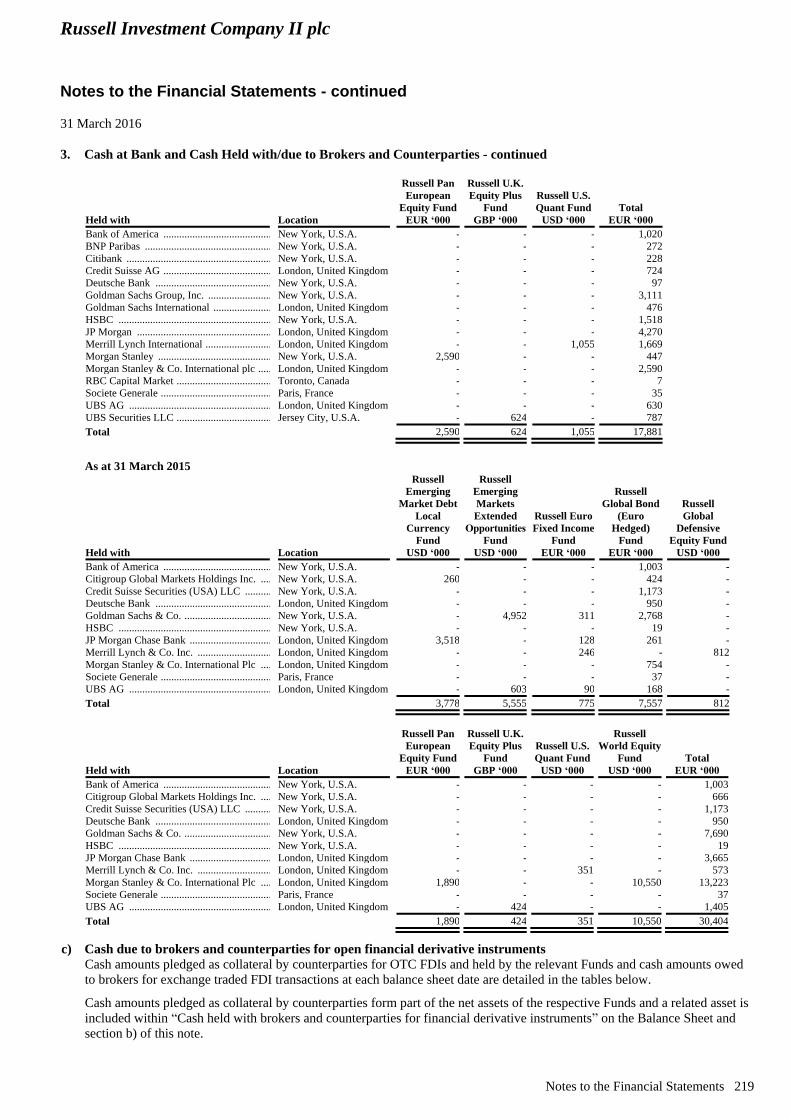
Russell Investment Company II plc
Notes to the Financial Statements - continued
31 March 2016
Notes to the Financial Statements 219
3. Cash at Bank and Cash Held with/due to Brokers and Counterparties - continued
Held with Location
Russell Pan
European
Equity Fund
EUR ‘000
Russell U.K.
Equity Plus
Fund
GBP ‘000
Russell U.S.
Quant Fund
USD ‘000
Total
EUR ‘000
Bank of America ............................................................. New York, U.S.A. - - - 1,020
BNP Paribas .................................................................... New York, U.S.A. - - - 272
Citibank ........................................................................... New York, U.S.A. - - - 228
Credit Suisse AG ............................................................. London, United Kingdom - - - 724
Deutsche Bank ................................................................ New York, U.S.A. - - - 97
Goldman Sachs Group, Inc. ............................................ New York, U.S.A. - - - 3,111
Goldman Sachs International .......................................... London, United Kingdom - - - 476
HSBC .............................................................................. New York, U.S.A. - - - 1,518
JP Morgan ....................................................................... London, United Kingdom - - - 4,270
Merrill Lynch International ............................................. London, United Kingdom - - 1,055 1,669
Morgan Stanley ............................................................... New York, U.S.A. 2,590 - - 447
Morgan Stanley & Co. International plc ......................... London, United Kingdom - - - 2,590
RBC Capital Market ........................................................ Toronto, Canada - - - 7
Societe Generale .............................................................. Paris, France - - - 35
UBS AG .......................................................................... London, United Kingdom - - - 630
UBS Securities LLC ........................................................ Jersey City, U.S.A. - 624 - 787
Total 2,590 624 1,055 17,881
As at 31 March 2015
Held with Location
Russell
Emerging
Market Debt
Local
Currency
Fund
USD ‘000
Russell
Emerging
Markets
Extended
Opportunities
Fund
USD ‘000
Russell Euro
Fixed Income
Fund
EUR ‘000
Russell
Global Bond
(Euro
Hedged)
Fund
EUR ‘000
Russell
Global
Defensive
Equity Fund
USD ‘000
Bank of America ............................................................. New York, U.S.A. - - - 1,003 -
Citigroup Global Markets Holdings Inc. ........................ New York, U.S.A. 260 - - 424 -
Credit Suisse Securities (USA) LLC .............................. New York, U.S.A. - - - 1,173 -
Deutsche Bank ................................................................ London, United Kingdom - - - 950 -
Goldman Sachs & Co. ..................................................... New York, U.S.A. - 4,952 311 2,768 -
HSBC .............................................................................. New York, U.S.A. - - - 19 -
JP Morgan Chase Bank ................................................... London, United Kingdom 3,518 - 128 261 -
Merrill Lynch & Co. Inc. ................................................ London, United Kingdom - - 246 - 812
Morgan Stanley & Co. International Plc ........................ London, United Kingdom - - - 754 -
Societe Generale .............................................................. Paris, France - - - 37 -
UBS AG .......................................................................... London, United Kingdom - 603 90 168 -
Total 3,778 5,555 775 7,557 812
Held with Location
Russell Pan
European
Equity Fund
EUR ‘000
Russell U.K.
Equity Plus
Fund
GBP ‘000
Russell U.S.
Quant Fund
USD ‘000
Russell
World Equity
Fund
USD ‘000
Total
EUR ‘000
Bank of America ............................................................. New York, U.S.A. - - - - 1,003
Citigroup Global Markets Holdings Inc. ........................ New York, U.S.A. - - - - 666
Credit Suisse Securities (USA) LLC .............................. New York, U.S.A. - - - - 1,173
Deutsche Bank ................................................................ London, United Kingdom - - - - 950
Goldman Sachs & Co. ..................................................... New York, U.S.A. - - - - 7,690
HSBC .............................................................................. New York, U.S.A. - - - - 19
JP Morgan Chase Bank ................................................... London, United Kingdom - - - - 3,665
Merrill Lynch & Co. Inc. ................................................ London, United Kingdom - - 351 - 573
Morgan Stanley & Co. International Plc ........................ London, United Kingdom 1,890 - - 10,550 13,223
Societe Generale .............................................................. Paris, France - - - - 37
UBS AG .......................................................................... London, United Kingdom - 424 - - 1,405
Total 1,890 424 351 10,550 30,404
c) Cash due to brokers and counterparties for open financial derivative instruments
Cash amounts pledged as collateral by counterparties for OTC FDIs and held by the relevant Funds and cash amounts owed
to brokers for exchange traded FDI transactions at each balance sheet date are detailed in the tables below. Cash amounts pledged as collateral by counterparties form part of the net assets of the respective Funds and a related asset is
included within “Cash held with brokers and counterparties for financial derivative instruments” on the Balance Sheet and
section b) of this note.
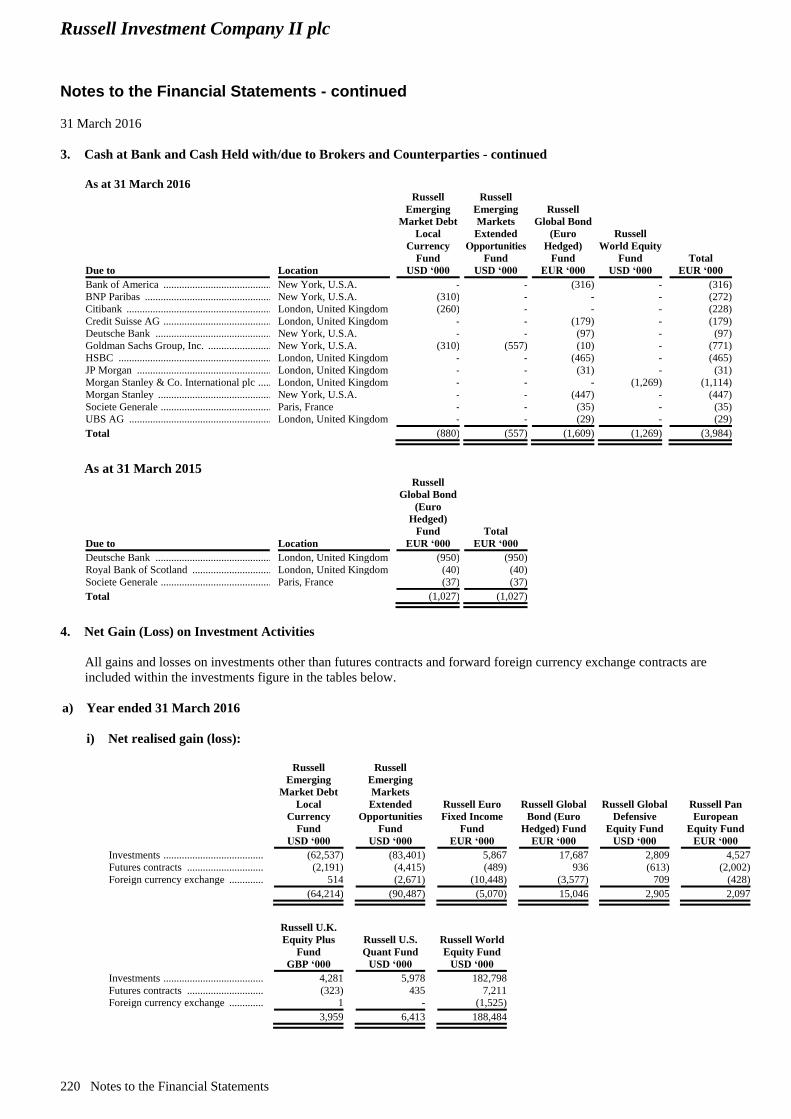
Russell Investment Company II plc
Notes to the Financial Statements - continued
31 March 2016
220 Notes to the Financial Statements
3. Cash at Bank and Cash Held with/due to Brokers and Counterparties - continued
As at 31 March 2016
Due to Location
Russell
Emerging
Market Debt
Local
Currency
Fund
USD ‘000
Russell
Emerging
Markets
Extended
Opportunities
Fund
USD ‘000
Russell
Global Bond
(Euro
Hedged)
Fund
EUR ‘000
Russell
World Equity
Fund
USD ‘000
Total
EUR ‘000
Bank of America ............................................................. New York, U.S.A. - - (316) - (316)
BNP Paribas .................................................................... New York, U.S.A. (310) - - - (272)
Citibank ........................................................................... London, United Kingdom (260) - - - (228)
Credit Suisse AG ............................................................. London, United Kingdom - - (179) - (179)
Deutsche Bank ................................................................ New York, U.S.A. - - (97) - (97)
Goldman Sachs Group, Inc. ............................................ New York, U.S.A. (310) (557) (10) - (771)
HSBC .............................................................................. London, United Kingdom - - (465) - (465)
JP Morgan ....................................................................... London, United Kingdom - - (31) - (31)
Morgan Stanley & Co. International plc ......................... London, United Kingdom - - - (1,269) (1,114)
Morgan Stanley ............................................................... New York, U.S.A. - - (447) - (447)
Societe Generale .............................................................. Paris, France - - (35) - (35)
UBS AG .......................................................................... London, United Kingdom - - (29) - (29)
Total (880) (557) (1,609) (1,269) (3,984)
As at 31 March 2015
Due to Location
Russell
Global Bond
(Euro
Hedged)
Fund
EUR ‘000
Total
EUR ‘000
Deutsche Bank ................................................................ London, United Kingdom (950) (950)
Royal Bank of Scotland .................................................. London, United Kingdom (40) (40)
Societe Generale .............................................................. Paris, France (37) (37)
Total (1,027) (1,027)
4. Net Gain (Loss) on Investment Activities
All gains and losses on investments other than futures contracts and forward foreign currency exchange contracts are
included within the investments figure in the tables below.
a) Year ended 31 March 2016
i) Net realised gain (loss):
Russell
Emerging
Market Debt
Local
Currency
Fund
USD ‘000
Russell
Emerging
Markets
Extended
Opportunities
Fund
USD ‘000
Russell Euro
Fixed Income
Fund
EUR ‘000
Russell Global
Bond (Euro
Hedged) Fund
EUR ‘000
Russell Global
Defensive
Equity Fund
USD ‘000
Russell Pan
European
Equity Fund
EUR ‘000
Investments ........................................................................................................................... (62,537) (83,401) 5,867 17,687 2,809 4,527
Futures contracts .................................................................................................................. (2,191) (4,415) (489) 936 (613) (2,002)
Foreign currency exchange .................................................................................................. 514 (2,671) (10,448) (3,577) 709 (428)
(64,214) (90,487) (5,070) 15,046 2,905 2,097
Russell U.K.
Equity Plus
Fund
GBP ‘000
Russell U.S.
Quant Fund
USD ‘000
Russell World
Equity Fund
USD ‘000
Investments ........................................................................................................................... 4,281 5,978 182,798
Futures contracts .................................................................................................................. (323) 435 7,211
Foreign currency exchange .................................................................................................. 1 - (1,525)
3,959 6,413 188,484
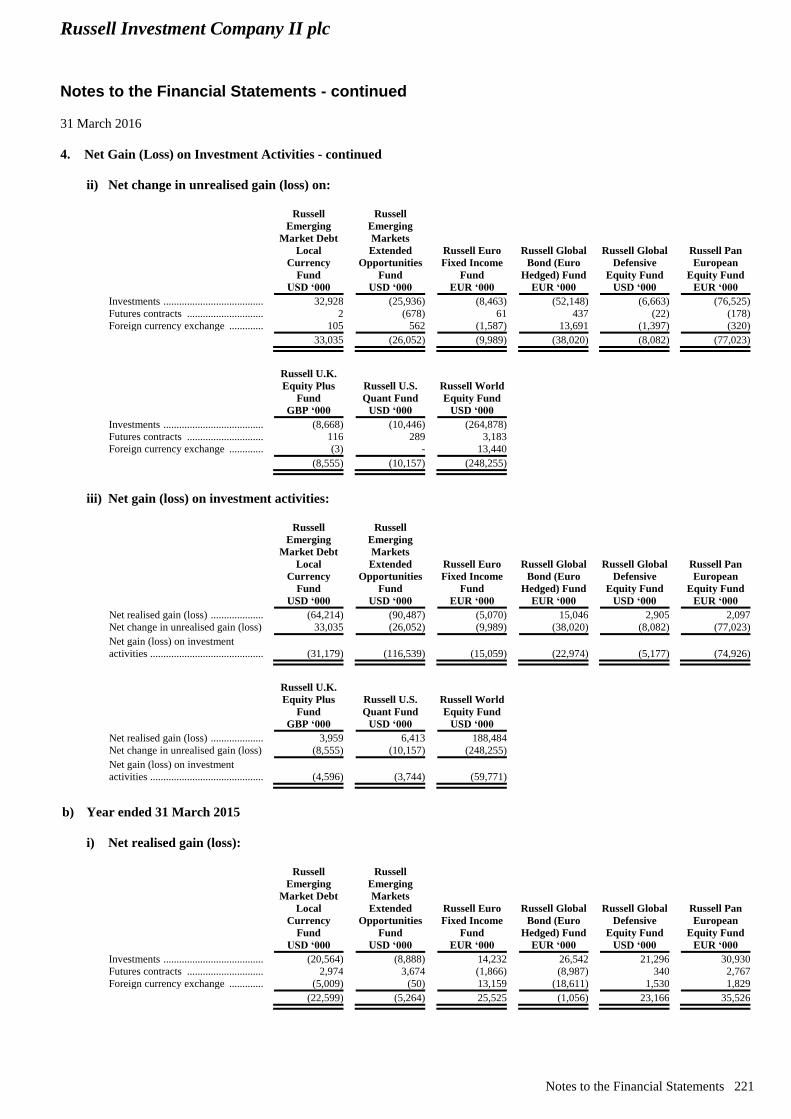
Russell Investment Company II plc
Notes to the Financial Statements - continued
31 March 2016
Notes to the Financial Statements 221
4. Net Gain (Loss) on Investment Activities - continued
ii) Net change in unrealised gain (loss) on:
Russell
Emerging
Market Debt
Local
Currency
Fund
USD ‘000
Russell
Emerging
Markets
Extended
Opportunities
Fund
USD ‘000
Russell Euro
Fixed Income
Fund
EUR ‘000
Russell Global
Bond (Euro
Hedged) Fund
EUR ‘000
Russell Global
Defensive
Equity Fund
USD ‘000
Russell Pan
European
Equity Fund
EUR ‘000
Investments ........................................................................................................................... 32,928 (25,936) (8,463) (52,148) (6,663) (76,525)
Futures contracts .................................................................................................................. 2 (678) 61 437 (22) (178)
Foreign currency exchange .................................................................................................. 105 562 (1,587) 13,691 (1,397) (320)
33,035 (26,052) (9,989) (38,020) (8,082) (77,023)
Russell U.K.
Equity Plus
Fund
GBP ‘000
Russell U.S.
Quant Fund
USD ‘000
Russell World
Equity Fund
USD ‘000
Investments ........................................................................................................................... (8,668) (10,446) (264,878)
Futures contracts .................................................................................................................. 116 289 3,183
Foreign currency exchange .................................................................................................. (3) - 13,440
(8,555) (10,157) (248,255)
iii) Net gain (loss) on investment activities:
Russell
Emerging
Market Debt
Local
Currency
Fund
USD ‘000
Russell
Emerging
Markets
Extended
Opportunities
Fund
USD ‘000
Russell Euro
Fixed Income
Fund
EUR ‘000
Russell Global
Bond (Euro
Hedged) Fund
EUR ‘000
Russell Global
Defensive
Equity Fund
USD ‘000
Russell Pan
European
Equity Fund
EUR ‘000
Net realised gain (loss) ......................................................................................................... (64,214) (90,487) (5,070) 15,046 2,905 2,097
Net change in unrealised gain (loss) 33,035 (26,052) (9,989) (38,020) (8,082) (77,023)
Net gain (loss) on investment
activities ................................................................................................................................ (31,179) (116,539) (15,059) (22,974) (5,177) (74,926)
Russell U.K.
Equity Plus
Fund
GBP ‘000
Russell U.S.
Quant Fund
USD ‘000
Russell World
Equity Fund
USD ‘000
Net realised gain (loss) ......................................................................................................... 3,959 6,413 188,484
Net change in unrealised gain (loss) (8,555) (10,157) (248,255)
Net gain (loss) on investment
activities ................................................................................................................................ (4,596) (3,744) (59,771)
b) Year ended 31 March 2015
i) Net realised gain (loss):
Russell
Emerging
Market Debt
Local
Currency
Fund
USD ‘000
Russell
Emerging
Markets
Extended
Opportunities
Fund
USD ‘000
Russell Euro
Fixed Income
Fund
EUR ‘000
Russell Global
Bond (Euro
Hedged) Fund
EUR ‘000
Russell Global
Defensive
Equity Fund
USD ‘000
Russell Pan
European
Equity Fund
EUR ‘000
Investments ........................................................................................................................... (20,564) (8,888) 14,232 26,542 21,296 30,930
Futures contracts .................................................................................................................. 2,974 3,674 (1,866) (8,987) 340 2,767
Foreign currency exchange .................................................................................................. (5,009) (50) 13,159 (18,611) 1,530 1,829
(22,599) (5,264) 25,525 (1,056) 23,166 35,526
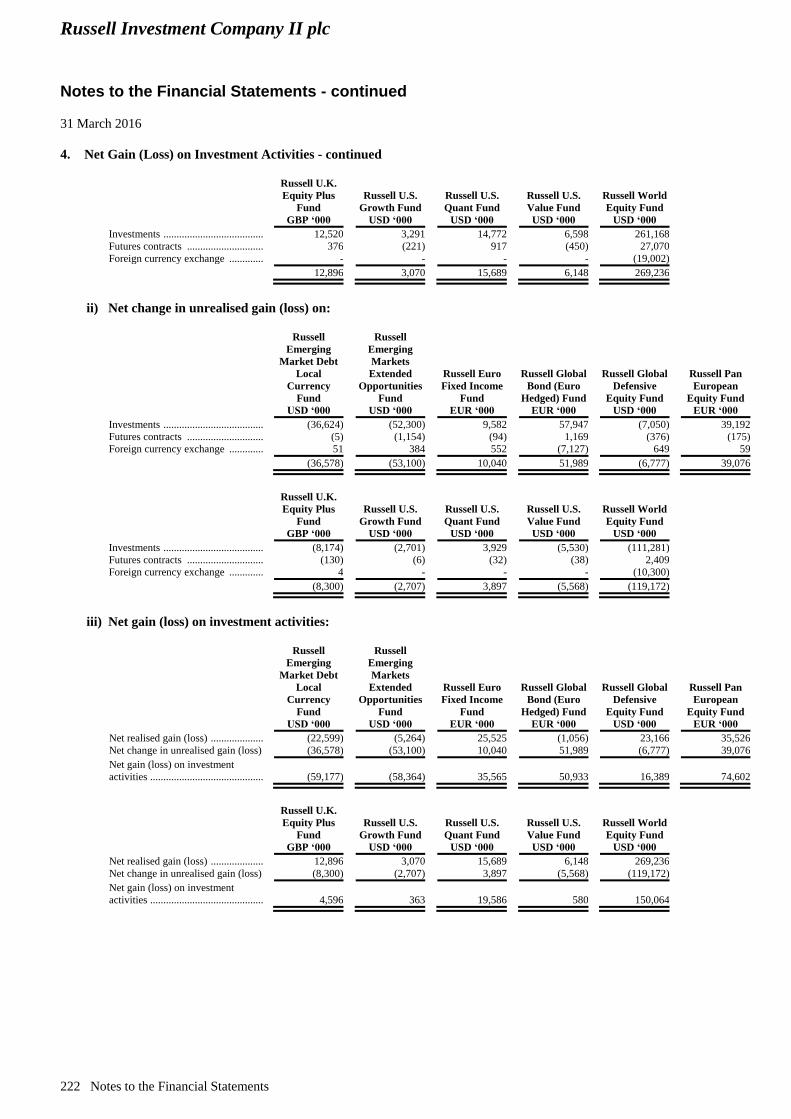
Russell Investment Company II plc
Notes to the Financial Statements - continued
31 March 2016
222 Notes to the Financial Statements
4. Net Gain (Loss) on Investment Activities - continued
Russell U.K.
Equity Plus
Fund
GBP ‘000
Russell U.S.
Growth Fund
USD ‘000
Russell U.S.
Quant Fund
USD ‘000
Russell U.S.
Value Fund
USD ‘000
Russell World
Equity Fund
USD ‘000
Investments ........................................................................................................................... 12,520 3,291 14,772 6,598 261,168
Futures contracts .................................................................................................................. 376 (221) 917 (450) 27,070
Foreign currency exchange .................................................................................................. - - - - (19,002)
12,896 3,070 15,689 6,148 269,236
ii) Net change in unrealised gain (loss) on:
Russell
Emerging
Market Debt
Local
Currency
Fund
USD ‘000
Russell
Emerging
Markets
Extended
Opportunities
Fund
USD ‘000
Russell Euro
Fixed Income
Fund
EUR ‘000
Russell Global
Bond (Euro
Hedged) Fund
EUR ‘000
Russell Global
Defensive
Equity Fund
USD ‘000
Russell Pan
European
Equity Fund
EUR ‘000
Investments ........................................................................................................................... (36,624) (52,300) 9,582 57,947 (7,050) 39,192
Futures contracts .................................................................................................................. (5) (1,154) (94) 1,169 (376) (175)
Foreign currency exchange .................................................................................................. 51 384 552 (7,127) 649 59
(36,578) (53,100) 10,040 51,989 (6,777) 39,076
Russell U.K.
Equity Plus
Fund
GBP ‘000
Russell U.S.
Growth Fund
USD ‘000
Russell U.S.
Quant Fund
USD ‘000
Russell U.S.
Value Fund
USD ‘000
Russell World
Equity Fund
USD ‘000
Investments ........................................................................................................................... (8,174) (2,701) 3,929 (5,530) (111,281)
Futures contracts .................................................................................................................. (130) (6) (32) (38) 2,409
Foreign currency exchange .................................................................................................. 4 - - - (10,300)
(8,300) (2,707) 3,897 (5,568) (119,172)
iii) Net gain (loss) on investment activities:
Russell
Emerging
Market Debt
Local
Currency
Fund
USD ‘000
Russell
Emerging
Markets
Extended
Opportunities
Fund
USD ‘000
Russell Euro
Fixed Income
Fund
EUR ‘000
Russell Global
Bond (Euro
Hedged) Fund
EUR ‘000
Russell Global
Defensive
Equity Fund
USD ‘000
Russell Pan
European
Equity Fund
EUR ‘000
Net realised gain (loss) ......................................................................................................... (22,599) (5,264) 25,525 (1,056) 23,166 35,526
Net change in unrealised gain (loss) (36,578) (53,100) 10,040 51,989 (6,777) 39,076
Net gain (loss) on investment
activities ................................................................................................................................ (59,177) (58,364) 35,565 50,933 16,389 74,602
Russell U.K.
Equity Plus
Fund
GBP ‘000
Russell U.S.
Growth Fund
USD ‘000
Russell U.S.
Quant Fund
USD ‘000
Russell U.S.
Value Fund
USD ‘000
Russell World
Equity Fund
USD ‘000
Net realised gain (loss) ......................................................................................................... 12,896 3,070 15,689 6,148 269,236
Net change in unrealised gain (loss) (8,300) (2,707) 3,897 (5,568) (119,172)
Net gain (loss) on investment
activities ................................................................................................................................ 4,596 363 19,586 580 150,064
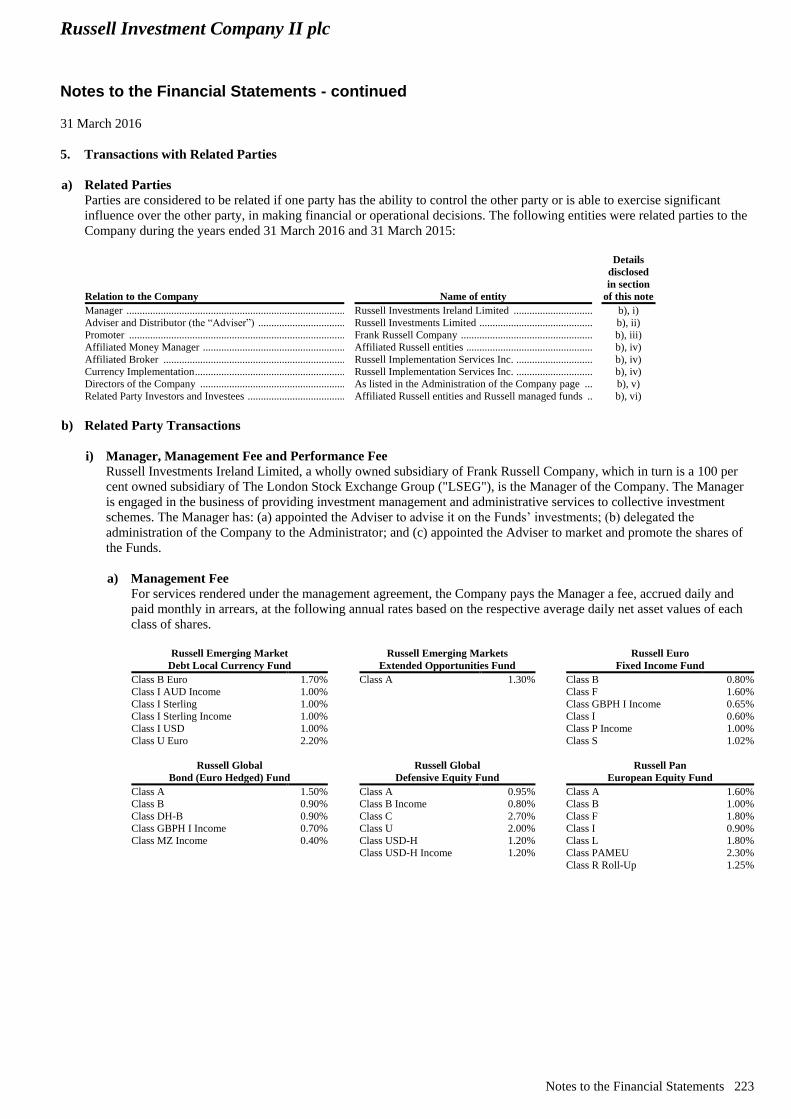
Russell Investment Company II plc
Notes to the Financial Statements - continued
31 March 2016
Notes to the Financial Statements 223
5. Transactions with Related Parties
a) Related Parties
Parties are considered to be related if one party has the ability to control the other party or is able to exercise significant
influence over the other party, in making financial or operational decisions. The following entities were related parties to the
Company during the years ended 31 March 2016 and 31 March 2015:
Relation to the Company Name of entity
Details
disclosed
in section
of this note
Manager ............................................................................................................................. Russell Investments Ireland Limited ................................................................................ b), i)
Adviser and Distributor (the “Adviser”) ........................................................................... Russell Investments Limited ............................................................................................. b), ii)
Promoter ............................................................................................................................ Frank Russell Company .................................................................................................... b), iii)
Affiliated Money Manager ................................................................................................ Affiliated Russell entities .................................................................................................. b), iv)
Affiliated Broker ............................................................................................................... Russell Implementation Services Inc. ............................................................................... b), iv)
Currency Implementation ................................................................................................... Russell Implementation Services Inc. ............................................................................... b), iv)
Directors of the Company ................................................................................................. As listed in the Administration of the Company page ..................................................... b), v)
Related Party Investors and Investees ............................................................................... Affiliated Russell entities and Russell managed funds .................................................... b), vi)
b) Related Party Transactions
i) Manager, Management Fee and Performance Fee
Russell Investments Ireland Limited, a wholly owned subsidiary of Frank Russell Company, which in turn is a 100 per
cent owned subsidiary of The London Stock Exchange Group ("LSEG"), is the Manager of the Company. The Manager
is engaged in the business of providing investment management and administrative services to collective investment
schemes. The Manager has: (a) appointed the Adviser to advise it on the Funds’ investments; (b) delegated the
administration of the Company to the Administrator; and (c) appointed the Adviser to market and promote the shares of
the Funds.
a) Management Fee
For services rendered under the management agreement, the Company pays the Manager a fee, accrued daily and
paid monthly in arrears, at the following annual rates based on the respective average daily net asset values of each
class of shares.
Russell Emerging Market
Debt Local Currency Fund
Russell Emerging Markets
Extended Opportunities Fund
Russell Euro
Fixed Income Fund
Class B Euro 1.70% Class A 1.30% Class B 0.80%
Class I AUD Income 1.00% Class F 1.60%
Class I Sterling 1.00% Class GBPH I Income 0.65%
Class I Sterling Income 1.00% Class I 0.60%
Class I USD 1.00% Class P Income 1.00%
Class U Euro 2.20% Class S 1.02%
Russell Global
Bond (Euro Hedged) Fund
Russell Global
Defensive Equity Fund
Russell Pan
European Equity Fund
Class A 1.50% Class A 0.95% Class A 1.60%
Class B 0.90% Class B Income 0.80% Class B 1.00%
Class DH-B 0.90% Class C 2.70% Class F 1.80%
Class GBPH I Income 0.70% Class U 2.00% Class I 0.90%
Class MZ Income 0.40% Class USD-H 1.20% Class L 1.80%
Class USD-H Income 1.20% Class PAMEU 2.30%
Class R Roll-Up 1.25%
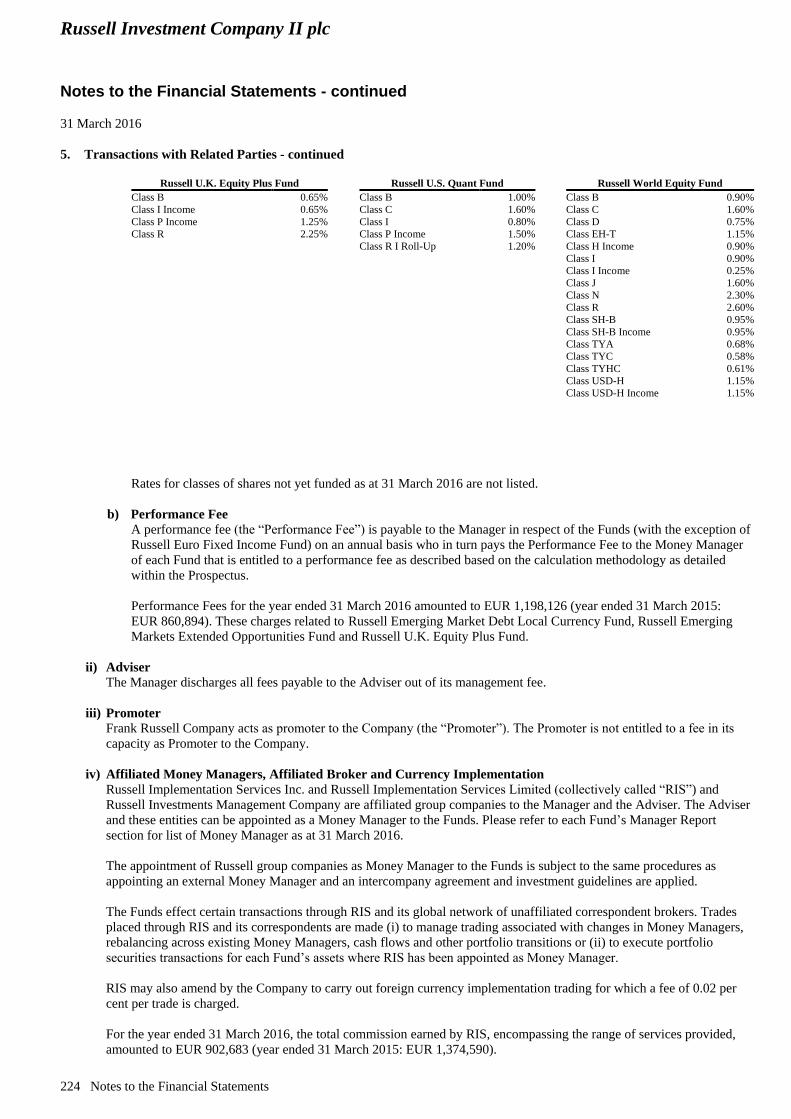
Russell Investment Company II plc
Notes to the Financial Statements - continued
31 March 2016
224 Notes to the Financial Statements
5. Transactions with Related Parties - continued
Russell U.K. Equity Plus Fund Russell U.S. Quant Fund Russell World Equity Fund
Class B 0.65% Class B 1.00% Class B 0.90%
Class I Income 0.65% Class C 1.60% Class C 1.60%
Class P Income 1.25% Class I 0.80% Class D 0.75%
Class R 2.25% Class P Income 1.50% Class EH-T 1.15%
Class R I Roll-Up 1.20% Class H Income 0.90%
Class I 0.90%
Class I Income 0.25%
Class J 1.60%
Class N 2.30%
Class R 2.60%
Class SH-B 0.95%
Class SH-B Income 0.95%
Class TYA 0.68%
Class TYC 0.58%
Class TYHC 0.61%
Class USD-H 1.15%
Class USD-H Income 1.15%
Rates for classes of shares not yet funded as at 31 March 2016 are not listed.
b) Performance Fee
A performance fee (the “Performance Fee”) is payable to the Manager in respect of the Funds (with the exception of
Russell Euro Fixed Income Fund) on an annual basis who in turn pays the Performance Fee to the Money Manager
of each Fund that is entitled to a performance fee as described based on the calculation methodology as detailed
within the Prospectus.
Performance Fees for the year ended 31 March 2016 amounted to EUR 1,198,126 (year ended 31 March 2015:
EUR 860,894). These charges related to Russell Emerging Market Debt Local Currency Fund, Russell Emerging
Markets Extended Opportunities Fund and Russell U.K. Equity Plus Fund.
ii) Adviser
The Manager discharges all fees payable to the Adviser out of its management fee.
iii) Promoter
Frank Russell Company acts as promoter to the Company (the “Promoter”). The Promoter is not entitled to a fee in its
capacity as Promoter to the Company.
iv) Affiliated Money Managers, Affiliated Broker and Currency Implementation
Russell Implementation Services Inc. and Russell Implementation Services Limited (collectively called “RIS”) and
Russell Investments Management Company are affiliated group companies to the Manager and the Adviser. The Adviser
and these entities can be appointed as a Money Manager to the Funds. Please refer to each Fund’s Manager Report
section for list of Money Manager as at 31 March 2016.
The appointment of Russell group companies as Money Manager to the Funds is subject to the same procedures as
appointing an external Money Manager and an intercompany agreement and investment guidelines are applied.
The Funds effect certain transactions through RIS and its global network of unaffiliated correspondent brokers. Trades
placed through RIS and its correspondents are made (i) to manage trading associated with changes in Money Managers,
rebalancing across existing Money Managers, cash flows and other portfolio transitions or (ii) to execute portfolio
securities transactions for each Fund’s assets where RIS has been appointed as Money Manager.
RIS may also amend by the Company to carry out foreign currency implementation trading for which a fee of 0.02 per
cent per trade is charged.
For the year ended 31 March 2016, the total commission earned by RIS, encompassing the range of services provided,
amounted to EUR 902,683 (year ended 31 March 2015: EUR 1,374,590).
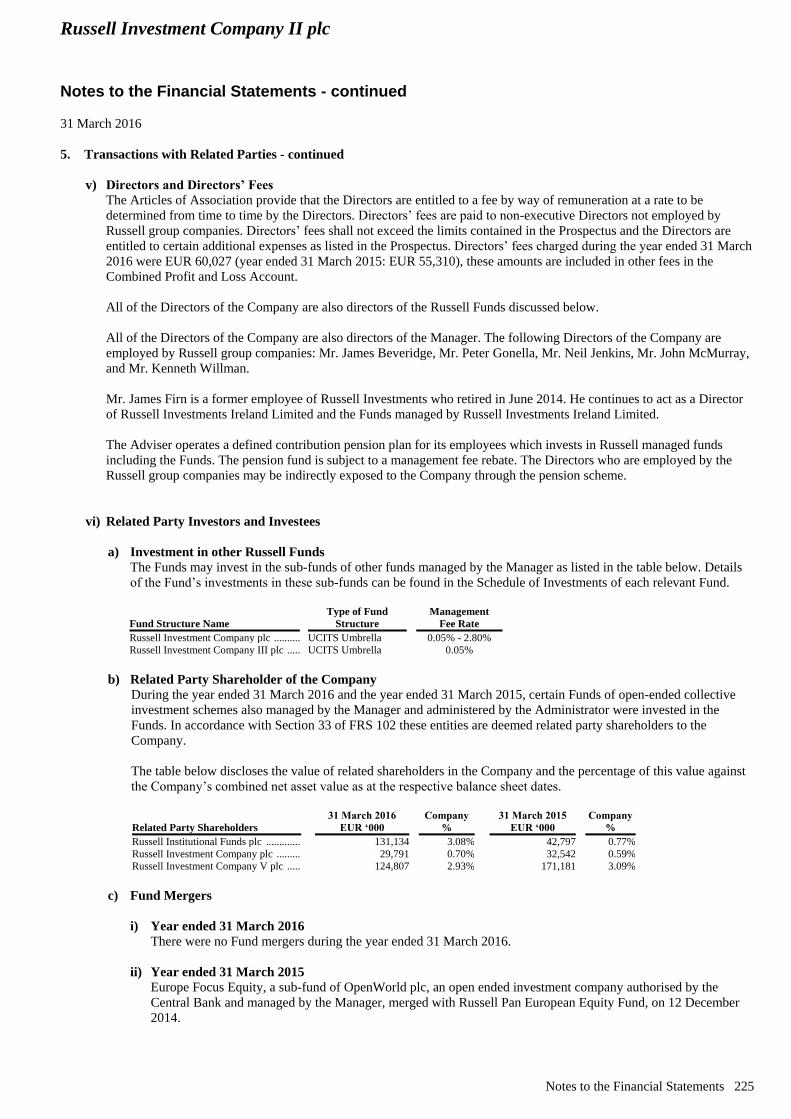
Russell Investment Company II plc
Notes to the Financial Statements - continued
31 March 2016
Notes to the Financial Statements 225
5. Transactions with Related Parties - continued
v) Directors and Directors’ Fees
The Articles of Association provide that the Directors are entitled to a fee by way of remuneration at a rate to be
determined from time to time by the Directors. Directors’ fees are paid to non-executive Directors not employed by
Russell group companies. Directors’ fees shall not exceed the limits contained in the Prospectus and the Directors are
entitled to certain additional expenses as listed in the Prospectus. Directors’ fees charged during the year ended 31 March
2016 were EUR 60,027 (year ended 31 March 2015: EUR 55,310), these amounts are included in other fees in the
Combined Profit and Loss Account.
All of the Directors of the Company are also directors of the Russell Funds discussed below.
All of the Directors of the Company are also directors of the Manager. The following Directors of the Company are
employed by Russell group companies: Mr. James Beveridge, Mr. Peter Gonella, Mr. Neil Jenkins, Mr. John McMurray,
and Mr. Kenneth Willman.
Mr. James Firn is a former employee of Russell Investments who retired in June 2014. He continues to act as a Director
of Russell Investments Ireland Limited and the Funds managed by Russell Investments Ireland Limited.
The Adviser operates a defined contribution pension plan for its employees which invests in Russell managed funds
including the Funds. The pension fund is subject to a management fee rebate. The Directors who are employed by the
Russell group companies may be indirectly exposed to the Company through the pension scheme.
vi) Related Party Investors and Investees
a) Investment in other Russell Funds
The Funds may invest in the sub-funds of other funds managed by the Manager as listed in the table below. Details
of the Fund’s investments in these sub-funds can be found in the Schedule of Investments of each relevant Fund.
Fund Structure Name
Type of Fund
Structure
Management
Fee Rate
Russell Investment Company plc .............................................................................................................................................................................. UCITS Umbrella 0.05% - 2.80%
Russell Investment Company III plc ......................................................................................................................................................................... UCITS Umbrella 0.05%
b) Related Party Shareholder of the Company
During the year ended 31 March 2016 and the year ended 31 March 2015, certain Funds of open-ended collective
investment schemes also managed by the Manager and administered by the Administrator were invested in the
Funds. In accordance with Section 33 of FRS 102 these entities are deemed related party shareholders to the
Company.
The table below discloses the value of related shareholders in the Company and the percentage of this value against
the Company’s combined net asset value as at the respective balance sheet dates.
Related Party Shareholders
31 March 2016
EUR ‘000
Company
%
31 March 2015
EUR ‘000
Company
%
Russell Institutional Funds plc ....................................................................................................................................... 131,134 3.08% 42,797 0.77%
Russell Investment Company plc ................................................................................................................................... 29,791 0.70% 32,542 0.59%
Russell Investment Company V plc ............................................................................................................................... 124,807 2.93% 171,181 3.09%
c) Fund Mergers
i) Year ended 31 March 2016
There were no Fund mergers during the year ended 31 March 2016.
ii) Year ended 31 March 2015
Europe Focus Equity, a sub-fund of OpenWorld plc, an open ended investment company authorised by the
Central Bank and managed by the Manager, merged with Russell Pan European Equity Fund, on 12 December
2014.
Russell Investment Company II plc
Notes to the Financial Statements - continued
31 March 2016
226 Notes to the Financial Statements
5. Transactions with Related Parties - continued
vii) FTSE Russell Indices
Each of the following Funds’ benchmark is a FTSE Russell index. FTSE Russell is wholly owned by LSEG. No fees are
payable by the Company to FTSE Russell for this service.
Fund Index
Russell Emerging Markets Extended Opportunities Fund .......... Russell Emerging Extended Index Net
Russell Global Defensive Equity Fund ......................................... Russell Global Defensive Index
Russell Pan European Equity Fund ........................................... Russell Developed Europe Large Cap Net Index
Russell U.S. Quant Fund ........................................................... Russell 1000 Value Net 30% Index
Russell World Equity Fund ....................................................... Russell Developed Large Cap Net Index
6. Significant Agreements
i) Custodian and Trustee
State Street Custodial Services (Ireland) Limited is the Company’s Custodian and Trustee. The Custodian and Trustee has
appointed its parent, State Street, as its global sub-custodian who in turn has appointed a network of local sub-custodial
agents. The sub-custodian fees are paid at annual rates based on the total assets held in each individual country in which the
Funds invest plus applicable transaction charges.
Custodian and Trustee fees accrue daily and are paid monthly in arrears.
Included within the Custodian agreement is a right of set off for fees owing to and monies lent by the Custodian and Trustee.
ii) Administrator and Transfer Agency
State Street Fund Services (Ireland) Limited is the Company’s Administrator. The Administrator is responsible for the daily
determination of net asset value, maintaining the books and records of the Funds in respect of the Company and other
administrative services. The Manager has also appointed the Administrator as the Company’s Transfer Agent.
Such fees accrue daily and are paid monthly in arrears. The Manager shall discharge reasonable out of pocket expenses
payable to the Administrator out of the Funds’ assets.
The Administrator is also entitled to shareholder services fees as disclosed in the administration agreement and reporting
services fees of USD 7,000 per Fund per annum.
Transfer agency fees are charged based on the number of Funds in the umbrella structure, the number of shareholders,
number of statements issued, number of share classes and volume of shareholder transactions in a period and are subject to
adequate thresholds. Transfer agency fees charged and are charged and paid on a daily basis and are recognised within
Administration and transfer agency fees in the Profit and Loss Account for each Fund.
The Custodian and Trustee and Administration fees disclosed in the Profit and Loss Account include minimum fees. If the
total of the minimum fees is in excess of the combined administration and trustee percentage charges, the share class fee, the
reporting service fee and the shareholder service fee, after the deduction of any discount, then this minimum will apply. The
minimum fee for new Funds will be waived for one year from the launch of the new Fund.
The aggregate of the Administration and Custodian and Trustee Fees will not exceed 0.35 percent of the Net Asset Value of
any Fund.
iii) Transaction Costs
Transaction costs relating to the broker commission on the purchase and sale of bonds, equities, exchange traded FDIs and
OTC FDIs, are included in the purchase and sale price of the investment.
Transaction costs on the purchase and sale of bonds and OTC FDIs cannot be practically or reliably gathered as they are
embedded in the cost of the investment and cannot be separately verified or disclosed. Transaction costs on purchases and
sales of equities and exchange traded FDIs are readily identifiable.
Russell Investment Company II plc
Notes to the Financial Statements - continued
31 March 2016
Notes to the Financial Statements 227
6. Significant Agreements - continued
Total transaction costs, incorporating broker commissions and transaction costs of the Custodian and Trustee and sub-
custodians are as follows:
Fund
Functional
Currency
Year ended
31 March 2016
‘000
Year ended
31 March 2015
‘000
Russell Emerging Market Debt Local Currency Fund ........................ USD 291 199
Russell Emerging Markets Extended Opportunities Fund .................. USD 3,086 3,256
Russell Euro Fixed Income Fund ........................................................ EUR 141 61
Russell Global Bond (Euro Hedged) Fund .......................................... EUR 451 224
Russell Global Defensive Equity Fund ............................................... USD 239 525
Russell Pan European Equity Fund ..................................................... EUR 1,209 1,138
Russell U.K. Equity Plus Fund ............................................................ GBP 324 385
Russell U.S. Growth Fund ................................................................... USD - 13
Russell U.S. Quant Fund ..................................................................... USD 205 169
Russell U.S. Value Fund ...................................................................... USD - 10
Russell World Equity Fund ................................................................. USD 2,603 4,472
iv) Auditors’ Remuneration
The remuneration for all work carried out by the statutory audit firm in respect of the financial year under review and prior
financial year is as follows:
2016
EUR ‘000
2015
EUR ‘000
Statutory audit of accounts* .................................................................................................................................................................................................... 145 161
Tax advisory services** .......................................................................................................................................................................................................... 34 45
Total ........................................................................................................................................................................................................................................ 179 206
* The fees for statutory audit of the accounts disclosed in the table above are exclusive of VAT. The audit fees recognised in the Profit and Loss Account
are inclusive of VAT.
** Exclusive of VAT
There were no fees for other assurance services or other non-audit services during the year ended 31 March 2016 (year ended
31 March 2015: Nil).
7. Soft Commissions and Commission Recapture Programme
The Adviser retains the right to request that the Money Managers participate in Russell’s soft commission and commission
recapture programme (the “Programme”) by executing a portion of their securities transactions through certain brokers (the
“Correspondent Broker Networks”). Money Manager participation in the Programme is not mandatory and the appropriate
participation percentage target is determined on a Money Manager by Money Manager basis, based upon asset class,
investment mandate, trading habits, and tolerance for participation and is always subject to a Money Manager’s ability to
obtain best execution.
The Programme, including the Correspondent Broker Networks, is administered by Recapture Services, a division of BNY
ConvergEx Execution Solutions LLC (“BNY”) and State Street Global Markets (“SSGM”).
A portion of the commission earned by the Correspondent Broker Networks as a result of this trading activity will be set
aside in the Programme as “credits”. These credits are then earmarked for purchase of third party research (“Soft
Commission Credits”) or commission recapture (“Commission Credits”).
i) Soft Commission Credits
All soft commission use is overseen by Russell’s soft commission committee (the “Committee”) which is made up of
senior level investment personnel. The Committee, with the guidance of Russell’s investment strategy committee,
establishes an annual soft commission research budget for the use of the Soft Commission Credits.
Soft Commission Credits are used by Russell to purchase third party research that will aid Russell in its investment
decision-making process. Research purchased through the Programme is obtained from unaffiliated third parties at
market rates.
Russell Investment Company II plc
Notes to the Financial Statements - continued
31 March 2016
228 Notes to the Financial Statements
7. Soft Commissions and Commission Recapture Programme - continued
ii) Recapture Credits
Once the soft commission research budget has been met the Committee will instruct BNY and SSGM to recapture the
Commission Credits which are then rebated directly back to the relevant Fund from which the commission was
generated. Recapture Credits are recognised within other income in the relevant Fund’s Profit and Loss Account. Russell
does not receive any revenue (directly or indirectly from Recapture Credits) from the commission recapture component
of the Programme.
8. Distributions
The Company conducts its affairs so as to enable U.K. reporting fund status to be obtained under the United Kingdom
Income and Corporation Taxes Act, 1988 for the purposes of U.K. taxation for each applicable Fund.
With the exception of Roll-Up Class Shares, the distribution policy of each Fund is to distribute out of net income. Roll-Up
Class Shares do not declare or distribute net income and their net asset value reflects net income. Distributions declared by
Income Class Shares are paid in cash unless the shareholder chooses to reinvest part or all of the amount in the capital of the
relevant Share Class. Accumulation Class Shares declare a distribution which is then reinvested in the capital of the relevant
share class.
The distributions in respect of the Funds are calculated and declared on a calendar quarterly basis (i.e. quarterly periods
ended 31 March, 30 June, 30 September and 31 December).
9. Taxation
Under current law and practice the Company qualifies as an investment undertaking as defined in Section 739B of the Taxes
Consolidation Act, 1997, as amended (the “TCA”). On that basis, it is not chargeable to Irish tax on its income or gains.
However, Irish tax may arise on the occurrence of a “chargeable event”. A chargeable event includes any distribution
payments to shareholders or any encashment, redemption, transfer or cancellation of shares and any deemed disposal of
shares for Irish tax purposes arising as a result of holding shares in the Company for a period of eight years or more.
No Irish tax will arise in respect of chargeable events in respect of a shareholder who is an Exempt Irish Investor (as defined
in Section 739D of the TCA) or who is neither Irish resident nor ordinarily resident in Ireland for tax purposes at the time of
the chargeable event, provided, in each case, that an appropriate valid declaration in accordance with Schedule 2B of the
TCA is held by the Company or where the Company has been authorised by Irish Revenue to make gross payments in
absence of appropriate declarations.
Distributions, interest and capital gains (if any) received on investments made by the Company may be subject to
withholding taxes imposed by the country of origin and such taxes may not be recoverable by the Company or its
shareholders.
10. Number of Shares in Issue and Net Assets Attributable to Redeemable Participating Shareholders
a) Authorised Share Capital
The authorised share capital of the Company is 39,000 subscriber shares of no par value and 500 billion participating shares
of no par value. Subscriber shares do not form part of the net asset value of the Company. They are disclosed in the financial
statements by way of this note only.
Holders of subscriber shares are not entitled to dividends or any surplus of assets over liabilities upon the winding-up of the
Company. The subscriber shares are held by the Promoter and the Adviser.
b) Redeemable Participating Shares
Each of the shares entitles the holder to participate equally on a pro rata basis in the profits and dividends of the relevant
Fund attributable to such shares and to attend and vote at meetings of the Company and of the relevant Fund represented by
those shares. No class of shares confers on the holder thereof any preferential or pre-emptive rights or any rights to
participate in the profits and dividends of any other class of shares or any voting rights in relation to matters relating solely to
any other class of shares.
Russell Investment Company II plc
Notes to the Financial Statements - continued
31 March 2016
Notes to the Financial Statements 229
10. Number of Shares in Issue and Net Assets Attributable to Redeemable Participating Shareholders - continued
Each share represents an individual beneficial interest in the Company. The shares are not debt obligations or guaranteed by
the Company. The return on an investment in the Company will depend solely upon the investment performance of the assets
of the relevant Fund and the increase or decrease (as the case may be) in the net asset value of the shares. The amount
payable to a shareholder in respect of each share upon liquidation of the Company or a Fund will equal the net asset value per
share. However, in a relatively illiquid market, a Fund may not be able to dispose of its investments quickly and as such a
Fund may experience adverse price movements upon liquidation of its investments. Settlement of transactions may be subject
to delay and administrative uncertainties and the price repaid to the shareholders in such circumstances will not equal the
final published net asset value per share.
Net assets attributable to shareholders represent a liability on the Balance Sheet, carried at the redemption amount that would
be payable at the balance sheet date if the shareholder exercised the right to redeem the shares in the Company.
Participating Share Transactions
All cash amounts are in the functional currency of the relevant Fund not the currency of the class.
Russell Emerging Market Debt Local Currency Fund
Number of Shares in issue
Year ended 31 March 2015 Year ended 31 March 2016
Share Class
Beginning
of year
Shares
Issued
Shares
Redeemed
End
of year
Shares
Issued
Shares
Redeemed
End
of year
Class B Euro ..................................................... 17,094 44,707 (4,589) 57,212 85,964 (1,143) 142,033
Class I AUD Income ........................................ 70,249 46,893 (1,883) 115,259 66,519 (59,625) 122,153
Class I Sterling ................................................. 121,083 28,338 (18,996) 130,425 2,175 (7,294) 125,306
Class I Sterling
Income ............................................................... - 16,621 - 16,621 18,240 (16,836) 18,025
Class I USD ...................................................... 78 107,655 (55,434) 52,299 24,950 (45,645) 31,604
Class U Euro ..................................................... 1 - - 1 - - 1
Value of Share Transactions
Year ended 31 March 2015 Year ended 31 March 2016
Share Class
Subscriptions
USD ‘000
Redemptions
USD ‘000
Subscriptions
USD ‘000
Redemptions
USD ‘000
Class B Euro ..................................................... 46,411 (5,401) 86,626 (1,130)
Class I AUD Income ........................................ 40,194 (1,511) 43,309 (38,570)
Class I Sterling ................................................. 41,052 (25,473) 2,828 (8,347)
Class I Sterling
Income .............................................................. 25,386 - 25,335 (24,062)
Class I USD ...................................................... 97,880 (49,744) 20,344 (33,722)
Class U Euro ..................................................... - - - -
Russell Emerging Markets Extended Opportunities Fund
Number of Shares in issue
Year ended 31 March 2015 Year ended 31 March 2016
Share Class
Beginning
of year
Shares
Issued
Shares
Redeemed
End
of year
Shares
Issued
Shares
Redeemed
End
of year
Class A .............................................................. 893,193 9,374 (36,577) 865,990 60,930 (117,966) 808,954
Value of Share Transactions
Year ended 31 March 2015 Year ended 31 March 2016
Share Class
Subscriptions
USD ‘000
Redemptions
USD ‘000
Subscriptions
USD ‘000
Redemptions
USD ‘000
Class A .............................................................. 10,236 (39,082) 50,745 (92,125)
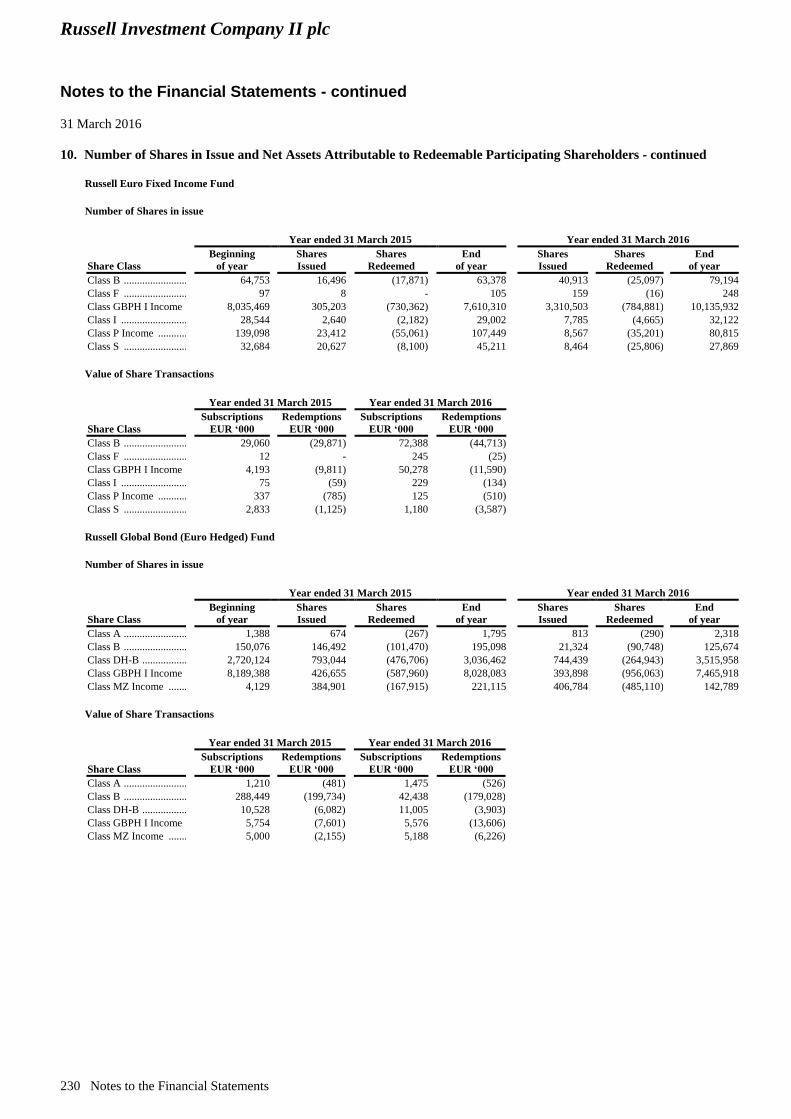
Russell Investment Company II plc
Notes to the Financial Statements - continued
31 March 2016
230 Notes to the Financial Statements
10. Number of Shares in Issue and Net Assets Attributable to Redeemable Participating Shareholders - continued
Russell Euro Fixed Income Fund
Number of Shares in issue
Year ended 31 March 2015 Year ended 31 March 2016
Share Class
Beginning
of year
Shares
Issued
Shares
Redeemed
End
of year
Shares
Issued
Shares
Redeemed
End
of year
Class B .............................................................. 64,753 16,496 (17,871) 63,378 40,913 (25,097) 79,194
Class F .............................................................. 97 8 - 105 159 (16) 248
Class GBPH I Income ...................................... 8,035,469 305,203 (730,362) 7,610,310 3,310,503 (784,881) 10,135,932
Class I ............................................................... 28,544 2,640 (2,182) 29,002 7,785 (4,665) 32,122
Class P Income ................................................. 139,098 23,412 (55,061) 107,449 8,567 (35,201) 80,815
Class S .............................................................. 32,684 20,627 (8,100) 45,211 8,464 (25,806) 27,869
Value of Share Transactions
Year ended 31 March 2015 Year ended 31 March 2016
Share Class
Subscriptions
EUR ‘000
Redemptions
EUR ‘000
Subscriptions
EUR ‘000
Redemptions
EUR ‘000
Class B .............................................................. 29,060 (29,871) 72,388 (44,713)
Class F .............................................................. 12 - 245 (25)
Class GBPH I Income ...................................... 4,193 (9,811) 50,278 (11,590)
Class I ............................................................... 75 (59) 229 (134)
Class P Income ................................................. 337 (785) 125 (510)
Class S .............................................................. 2,833 (1,125) 1,180 (3,587)
Russell Global Bond (Euro Hedged) Fund
Number of Shares in issue
Year ended 31 March 2015 Year ended 31 March 2016
Share Class
Beginning
of year
Shares
Issued
Shares
Redeemed
End
of year
Shares
Issued
Shares
Redeemed
End
of year
Class A .............................................................. 1,388 674 (267) 1,795 813 (290) 2,318
Class B .............................................................. 150,076 146,492 (101,470) 195,098 21,324 (90,748) 125,674
Class DH-B ....................................................... 2,720,124 793,044 (476,706) 3,036,462 744,439 (264,943) 3,515,958
Class GBPH I Income ...................................... 8,189,388 426,655 (587,960) 8,028,083 393,898 (956,063) 7,465,918
Class MZ Income ............................................. 4,129 384,901 (167,915) 221,115 406,784 (485,110) 142,789
Value of Share Transactions
Year ended 31 March 2015 Year ended 31 March 2016
Share Class
Subscriptions
EUR ‘000
Redemptions
EUR ‘000
Subscriptions
EUR ‘000
Redemptions
EUR ‘000
Class A .............................................................. 1,210 (481) 1,475 (526)
Class B .............................................................. 288,449 (199,734) 42,438 (179,028)
Class DH-B ....................................................... 10,528 (6,082) 11,005 (3,903)
Class GBPH I Income ...................................... 5,754 (7,601) 5,576 (13,606)
Class MZ Income ............................................. 5,000 (2,155) 5,188 (6,226)
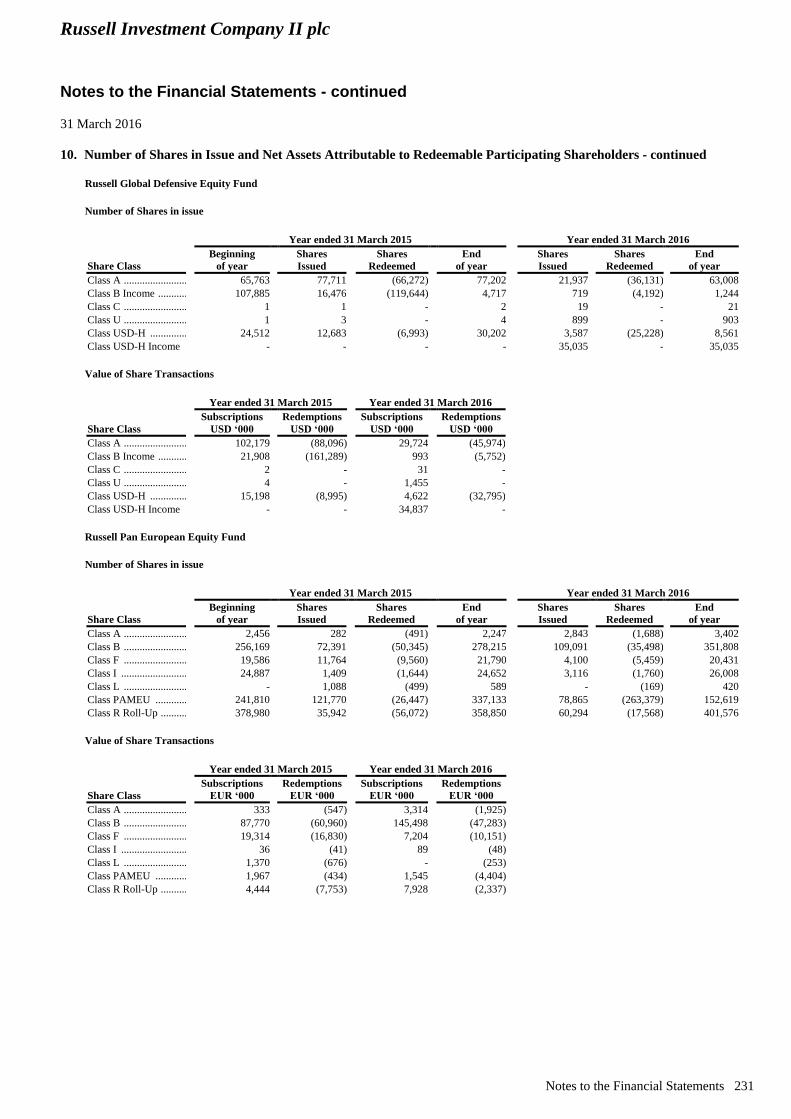
Russell Investment Company II plc
Notes to the Financial Statements - continued
31 March 2016
Notes to the Financial Statements 231
10. Number of Shares in Issue and Net Assets Attributable to Redeemable Participating Shareholders - continued
Russell Global Defensive Equity Fund
Number of Shares in issue
Year ended 31 March 2015 Year ended 31 March 2016
Share Class
Beginning
of year
Shares
Issued
Shares
Redeemed
End
of year
Shares
Issued
Shares
Redeemed
End
of year
Class A .............................................................. 65,763 77,711 (66,272) 77,202 21,937 (36,131) 63,008
Class B Income ................................................. 107,885 16,476 (119,644) 4,717 719 (4,192) 1,244
Class C .............................................................. 1 1 - 2 19 - 21
Class U .............................................................. 1 3 - 4 899 - 903
Class USD-H .................................................... 24,512 12,683 (6,993) 30,202 3,587 (25,228) 8,561
Class USD-H Income - - - - 35,035 - 35,035
Value of Share Transactions
Year ended 31 March 2015 Year ended 31 March 2016
Share Class
Subscriptions
USD ‘000
Redemptions
USD ‘000
Subscriptions
USD ‘000
Redemptions
USD ‘000
Class A .............................................................. 102,179 (88,096) 29,724 (45,974)
Class B Income ................................................. 21,908 (161,289) 993 (5,752)
Class C .............................................................. 2 - 31 -
Class U .............................................................. 4 - 1,455 -
Class USD-H .................................................... 15,198 (8,995) 4,622 (32,795)
Class USD-H Income - - 34,837 -
Russell Pan European Equity Fund
Number of Shares in issue
Year ended 31 March 2015 Year ended 31 March 2016
Share Class
Beginning
of year
Shares
Issued
Shares
Redeemed
End
of year
Shares
Issued
Shares
Redeemed
End
of year
Class A .............................................................. 2,456 282 (491) 2,247 2,843 (1,688) 3,402
Class B .............................................................. 256,169 72,391 (50,345) 278,215 109,091 (35,498) 351,808
Class F .............................................................. 19,586 11,764 (9,560) 21,790 4,100 (5,459) 20,431
Class I ............................................................... 24,887 1,409 (1,644) 24,652 3,116 (1,760) 26,008
Class L .............................................................. - 1,088 (499) 589 - (169) 420
Class PAMEU .................................................. 241,810 121,770 (26,447) 337,133 78,865 (263,379) 152,619
Class R Roll-Up ................................................ 378,980 35,942 (56,072) 358,850 60,294 (17,568) 401,576
Value of Share Transactions
Year ended 31 March 2015 Year ended 31 March 2016
Share Class
Subscriptions
EUR ‘000
Redemptions
EUR ‘000
Subscriptions
EUR ‘000
Redemptions
EUR ‘000
Class A .............................................................. 333 (547) 3,314 (1,925)
Class B .............................................................. 87,770 (60,960) 145,498 (47,283)
Class F .............................................................. 19,314 (16,830) 7,204 (10,151)
Class I ............................................................... 36 (41) 89 (48)
Class L .............................................................. 1,370 (676) - (253)
Class PAMEU .................................................. 1,967 (434) 1,545 (4,404)
Class R Roll-Up ................................................ 4,444 (7,753) 7,928 (2,337)
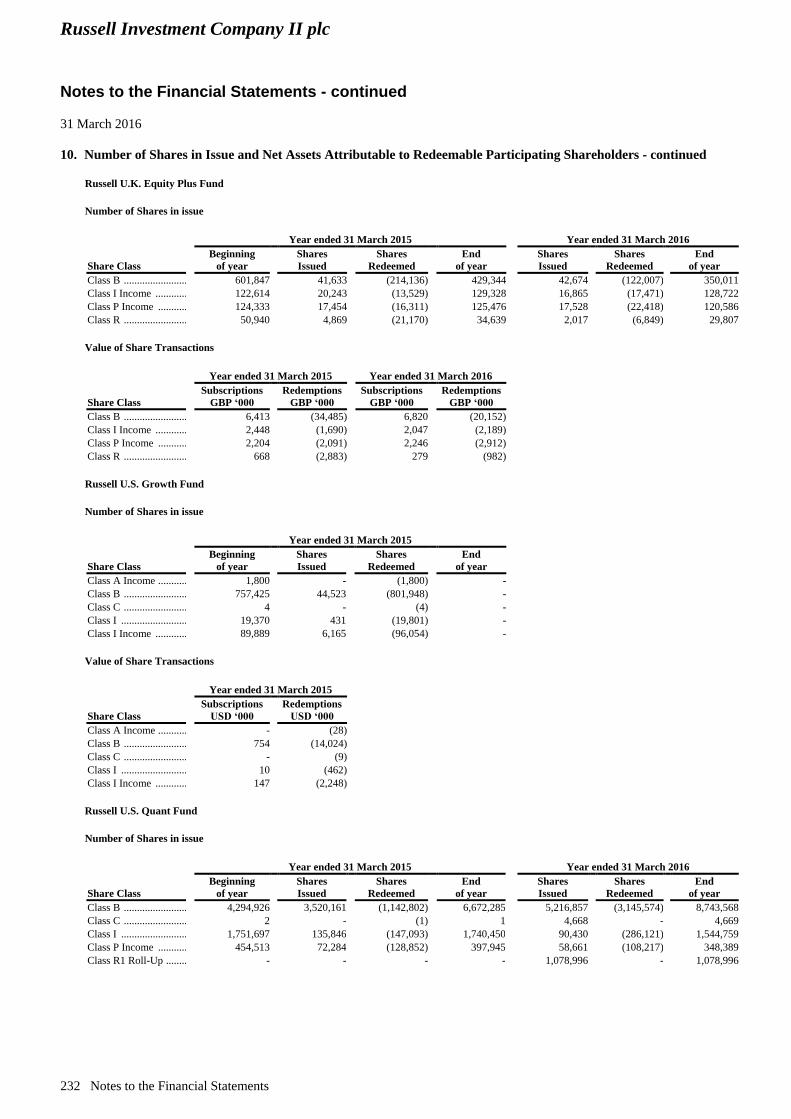
Russell Investment Company II plc
Notes to the Financial Statements - continued
31 March 2016
232 Notes to the Financial Statements
10. Number of Shares in Issue and Net Assets Attributable to Redeemable Participating Shareholders - continued
Russell U.K. Equity Plus Fund
Number of Shares in issue
Year ended 31 March 2015 Year ended 31 March 2016
Share Class
Beginning
of year
Shares
Issued
Shares
Redeemed
End
of year
Shares
Issued
Shares
Redeemed
End
of year
Class B .............................................................. 601,847 41,633 (214,136) 429,344 42,674 (122,007) 350,011
Class I Income .................................................. 122,614 20,243 (13,529) 129,328 16,865 (17,471) 128,722
Class P Income ................................................. 124,333 17,454 (16,311) 125,476 17,528 (22,418) 120,586
Class R .............................................................. 50,940 4,869 (21,170) 34,639 2,017 (6,849) 29,807
Value of Share Transactions
Year ended 31 March 2015 Year ended 31 March 2016
Share Class
Subscriptions
GBP ‘000
Redemptions
GBP ‘000
Subscriptions
GBP ‘000
Redemptions
GBP ‘000
Class B .............................................................. 6,413 (34,485) 6,820 (20,152)
Class I Income .................................................. 2,448 (1,690) 2,047 (2,189)
Class P Income ................................................. 2,204 (2,091) 2,246 (2,912)
Class R .............................................................. 668 (2,883) 279 (982)
Russell U.S. Growth Fund Number of Shares in issue
Year ended 31 March 2015
Share Class
Beginning
of year
Shares
Issued
Shares
Redeemed
End
of year
Class A Income ................................................. 1,800 - (1,800) -
Class B .............................................................. 757,425 44,523 (801,948) -
Class C .............................................................. 4 - (4) -
Class I ............................................................... 19,370 431 (19,801) -
Class I Income .................................................. 89,889 6,165 (96,054) -
Value of Share Transactions
Year ended 31 March 2015
Share Class
Subscriptions
USD ‘000
Redemptions
USD ‘000
Class A Income ................................................. - (28)
Class B .............................................................. 754 (14,024)
Class C .............................................................. - (9)
Class I ............................................................... 10 (462)
Class I Income .................................................. 147 (2,248)
Russell U.S. Quant Fund
Number of Shares in issue
Year ended 31 March 2015 Year ended 31 March 2016
Share Class
Beginning
of year
Shares
Issued
Shares
Redeemed
End
of year
Shares
Issued
Shares
Redeemed
End
of year
Class B .............................................................. 4,294,926 3,520,161 (1,142,802) 6,672,285 5,216,857 (3,145,574) 8,743,568
Class C .............................................................. 2 - (1) 1 4,668 - 4,669
Class I ............................................................... 1,751,697 135,846 (147,093) 1,740,450 90,430 (286,121) 1,544,759
Class P Income ................................................. 454,513 72,284 (128,852) 397,945 58,661 (108,217) 348,389
Class R1 Roll-Up .............................................. - - - - 1,078,996 - 1,078,996
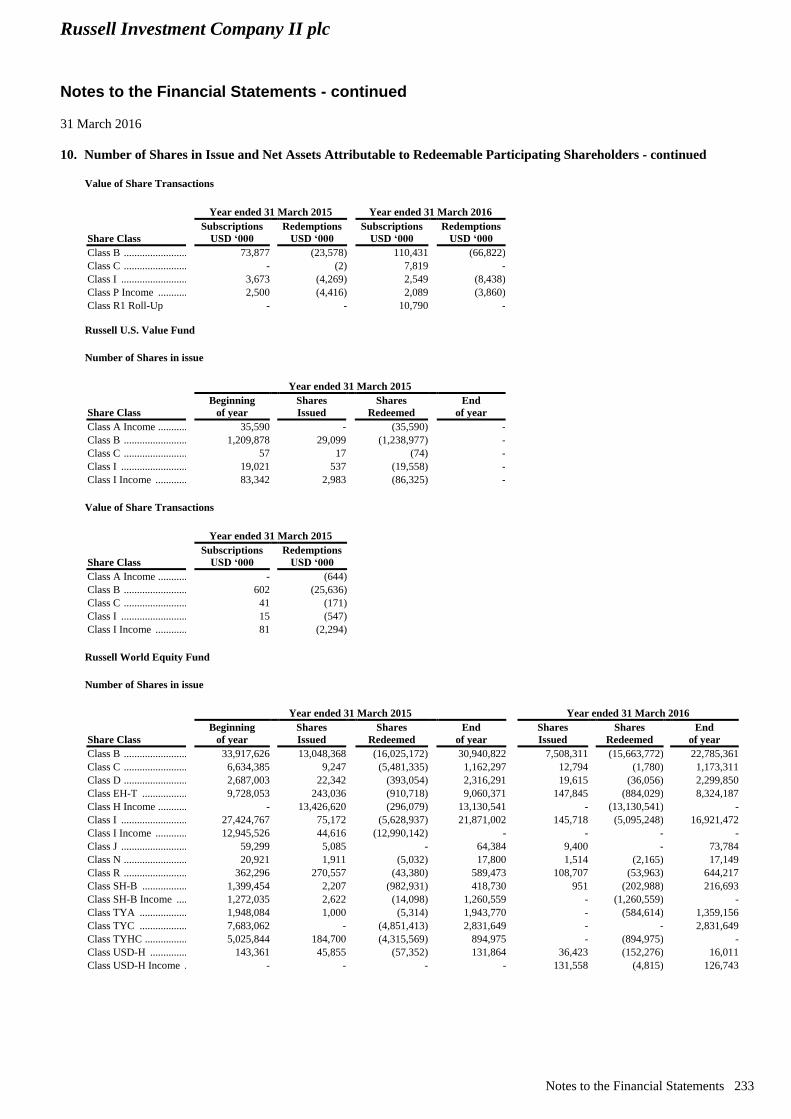
Russell Investment Company II plc
Notes to the Financial Statements - continued
31 March 2016
Notes to the Financial Statements 233
10. Number of Shares in Issue and Net Assets Attributable to Redeemable Participating Shareholders - continued
Value of Share Transactions
Year ended 31 March 2015 Year ended 31 March 2016
Share Class
Subscriptions
USD ‘000
Redemptions
USD ‘000
Subscriptions
USD ‘000
Redemptions
USD ‘000
Class B .............................................................. 73,877 (23,578) 110,431 (66,822)
Class C .............................................................. - (2) 7,819 -
Class I ............................................................... 3,673 (4,269) 2,549 (8,438)
Class P Income ................................................. 2,500 (4,416) 2,089 (3,860)
Class R1 Roll-Up - - 10,790 -
Russell U.S. Value Fund
Number of Shares in issue
Year ended 31 March 2015
Share Class
Beginning
of year
Shares
Issued
Shares
Redeemed
End
of year
Class A Income ................................................. 35,590 - (35,590) -
Class B .............................................................. 1,209,878 29,099 (1,238,977) -
Class C .............................................................. 57 17 (74) -
Class I ............................................................... 19,021 537 (19,558) -
Class I Income .................................................. 83,342 2,983 (86,325) -
Value of Share Transactions
Year ended 31 March 2015
Share Class
Subscriptions
USD ‘000
Redemptions
USD ‘000
Class A Income ................................................. - (644)
Class B .............................................................. 602 (25,636)
Class C .............................................................. 41 (171)
Class I ............................................................... 15 (547)
Class I Income .................................................. 81 (2,294)
Russell World Equity Fund Number of Shares in issue
Year ended 31 March 2015 Year ended 31 March 2016
Share Class
Beginning
of year
Shares
Issued
Shares
Redeemed
End
of year
Shares
Issued
Shares
Redeemed
End
of year
Class B .............................................................. 33,917,626 13,048,368 (16,025,172) 30,940,822 7,508,311 (15,663,772) 22,785,361
Class C .............................................................. 6,634,385 9,247 (5,481,335) 1,162,297 12,794 (1,780) 1,173,311
Class D .............................................................. 2,687,003 22,342 (393,054) 2,316,291 19,615 (36,056) 2,299,850
Class EH-T ....................................................... 9,728,053 243,036 (910,718) 9,060,371 147,845 (884,029) 8,324,187
Class H Income ................................................. - 13,426,620 (296,079) 13,130,541 - (13,130,541) -
Class I ............................................................... 27,424,767 75,172 (5,628,937) 21,871,002 145,718 (5,095,248) 16,921,472
Class I Income .................................................. 12,945,526 44,616 (12,990,142) - - - -
Class J ............................................................... 59,299 5,085 - 64,384 9,400 - 73,784
Class N .............................................................. 20,921 1,911 (5,032) 17,800 1,514 (2,165) 17,149
Class R .............................................................. 362,296 270,557 (43,380) 589,473 108,707 (53,963) 644,217
Class SH-B ....................................................... 1,399,454 2,207 (982,931) 418,730 951 (202,988) 216,693
Class SH-B Income .......................................... 1,272,035 2,622 (14,098) 1,260,559 - (1,260,559) -
Class TYA ........................................................ 1,948,084 1,000 (5,314) 1,943,770 - (584,614) 1,359,156
Class TYC ........................................................ 7,683,062 - (4,851,413) 2,831,649 - - 2,831,649
Class TYHC ...................................................... 5,025,844 184,700 (4,315,569) 894,975 - (894,975) -
Class USD-H .................................................... 143,361 45,855 (57,352) 131,864 36,423 (152,276) 16,011
Class USD-H Income ....................................... - - - - 131,558 (4,815) 126,743
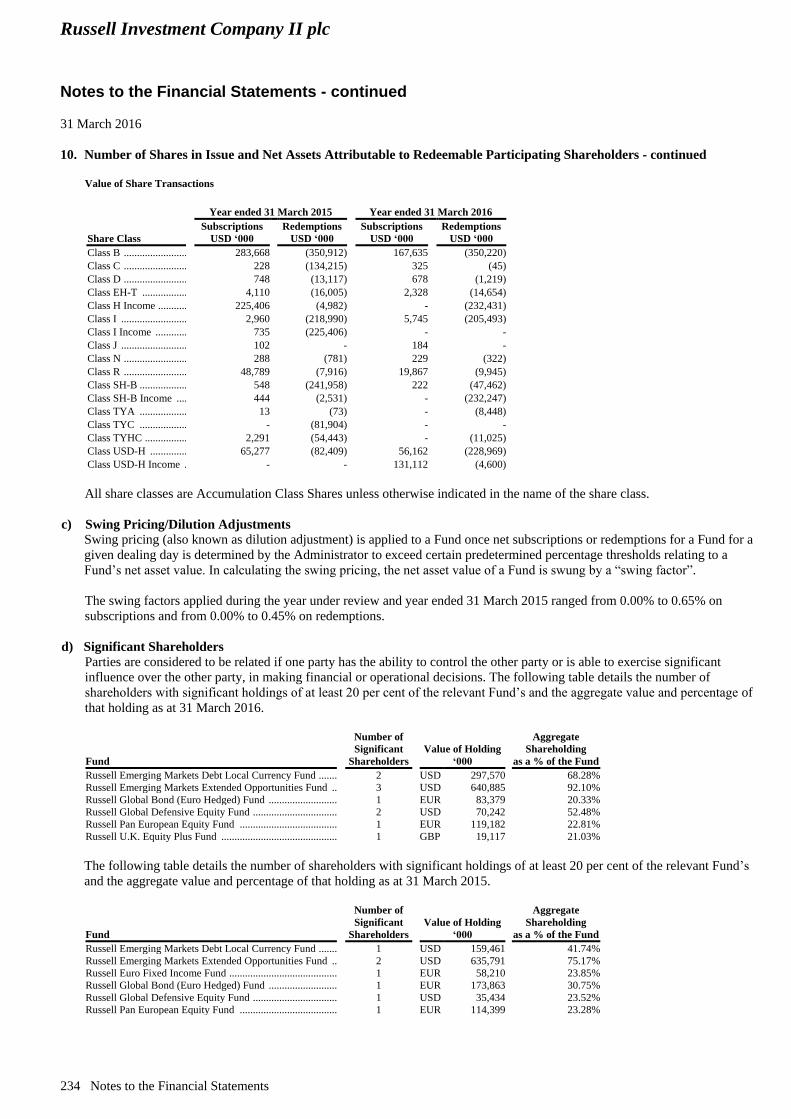
Russell Investment Company II plc
Notes to the Financial Statements - continued
31 March 2016
234 Notes to the Financial Statements
10. Number of Shares in Issue and Net Assets Attributable to Redeemable Participating Shareholders - continued
Value of Share Transactions
Year ended 31 March 2015 Year ended 31 March 2016
Share Class
Subscriptions
USD ‘000
Redemptions
USD ‘000
Subscriptions
USD ‘000
Redemptions
USD ‘000
Class B .............................................................. 283,668 (350,912) 167,635 (350,220)
Class C .............................................................. 228 (134,215) 325 (45)
Class D .............................................................. 748 (13,117) 678 (1,219)
Class EH-T ....................................................... 4,110 (16,005) 2,328 (14,654)
Class H Income ................................................. 225,406 (4,982) - (232,431)
Class I ............................................................... 2,960 (218,990) 5,745 (205,493)
Class I Income .................................................. 735 (225,406) - -
Class J ............................................................... 102 - 184 -
Class N .............................................................. 288 (781) 229 (322)
Class R .............................................................. 48,789 (7,916) 19,867 (9,945)
Class SH-B ........................................................ 548 (241,958) 222 (47,462)
Class SH-B Income .......................................... 444 (2,531) - (232,247)
Class TYA ........................................................ 13 (73) - (8,448)
Class TYC ........................................................ - (81,904) - -
Class TYHC ...................................................... 2,291 (54,443) - (11,025)
Class USD-H .................................................... 65,277 (82,409) 56,162 (228,969)
Class USD-H Income ....................................... - - 131,112 (4,600)
All share classes are Accumulation Class Shares unless otherwise indicated in the name of the share class.
c) Swing Pricing/Dilution Adjustments
Swing pricing (also known as dilution adjustment) is applied to a Fund once net subscriptions or redemptions for a Fund for a
given dealing day is determined by the Administrator to exceed certain predetermined percentage thresholds relating to a
Fund’s net asset value. In calculating the swing pricing, the net asset value of a Fund is swung by a “swing factor”.
The swing factors applied during the year under review and year ended 31 March 2015 ranged from 0.00% to 0.65% on
subscriptions and from 0.00% to 0.45% on redemptions.
d) Significant Shareholders
Parties are considered to be related if one party has the ability to control the other party or is able to exercise significant
influence over the other party, in making financial or operational decisions. The following table details the number of
shareholders with significant holdings of at least 20 per cent of the relevant Fund’s and the aggregate value and percentage of
that holding as at 31 March 2016.
Fund
Number of
Significant
Shareholders
Value of Holding
‘000
Aggregate
Shareholding
as a % of the Fund
Russell Emerging Markets Debt Local Currency Fund .............................. 2 USD 297,570 68.28%
Russell Emerging Markets Extended Opportunities Fund ......................... 3 USD 640,885 92.10%
Russell Global Bond (Euro Hedged) Fund ................................................. 1 EUR 83,379 20.33%
Russell Global Defensive Equity Fund ....................................................... 2 USD 70,242 52.48%
Russell Pan European Equity Fund ............................................................ 1 EUR 119,182 22.81%
Russell U.K. Equity Plus Fund ................................................................... 1 GBP 19,117 21.03%
The following table details the number of shareholders with significant holdings of at least 20 per cent of the relevant Fund’s
and the aggregate value and percentage of that holding as at 31 March 2015.
Fund
Number of
Significant
Shareholders
Value of Holding
‘000
Aggregate
Shareholding
as a % of the Fund
Russell Emerging Markets Debt Local Currency Fund .............................. 1 USD 159,461 41.74%
Russell Emerging Markets Extended Opportunities Fund ......................... 2 USD 635,791 75.17%
Russell Euro Fixed Income Fund ................................................................ 1 EUR 58,210 23.85%
Russell Global Bond (Euro Hedged) Fund ................................................. 1 EUR 173,863 30.75%
Russell Global Defensive Equity Fund ....................................................... 1 USD 35,434 23.52%
Russell Pan European Equity Fund ............................................................ 1 EUR 114,399 23.28%
Russell Investment Company II plc
Notes to the Financial Statements - continued
31 March 2016
Notes to the Financial Statements 235
11. Efficient Portfolio Management
The Company may enter into securities lending arrangements and repurchase agreements (together “Efficient Portfolio
Management Techniques”) and may invest in OTC FDIs, subject to the restrictions set forth the Prospectus and to the extent
consistent with the Fund’s investment objective and policies.
The use of techniques and instruments relating to transferable securities, money market instruments and/or other financial
instruments in which the Funds invest for efficient portfolio management purposes will generally be made for one or more of
the following reasons:
i) the reduction of risk;
ii) the reduction of cost; or
iii) the generation of additional capital or income for the relevant Fund with an appropriate level of risk, taking into account
the risk profile of the Fund and the risk diversification rules set out in the UCITS Regulations issued by the Central
Bank.
All the revenues arising from Efficient Portfolio Management Techniques employed shall be returned to the relevant Fund
following the deduction of any direct and indirect operational costs and fees arising. Such direct and indirect operational
costs and fees, (which are all fully transparent) which shall not include hidden revenue, shall include fees and expenses
payable to repurchase/reverse repurchase agreements counterparties and/or securities lending agents engaged by the
Company from time to time. Such fees and expenses of any repurchase/reverse repurchase agreements counterparties and/or
stocklending agents engaged by the Company, which will be at normal commercial rates together with VAT, if any, thereon,
will be borne by the Company or the Fund in respect of which the relevant party has been engaged.
Money Manager(s) on behalf of a Fund may employ techniques and instruments relating to transferable securities, money
market instruments and/or other financial instruments in which they invest for efficient portfolio management purposes. At
any time a Fund may hold a combination of derivative instruments such as futures, forward contracts, options, swaps and
swaptions, forward foreign exchange contracts, caps, floors and credit derivatives, any of which may be listed or over-the-
counter. Please refer to Note 2 b) Financial Instruments at Fair Value through Profit or Loss for a range of FDIs that the
Company may employ for the purpose of efficient portfolio management.
12. Financial Risks
The activities of each Fund expose it to various financial risks such as market risk (including market price risk, interest rate
risk, and currency risk), credit risk and liquidity risk.
Some Funds delegate some of the management of its portfolio to external Money Managers. The Adviser primarily monitors
and manages market risk (including market price risk, interest rate risk, and currency risk), credit risk and liquidity risk by
the following techniques:
The Adviser monitors each Fund’s characteristics in detail with the Money Manager(s) at least quarterly and in some
cases monthly.
The Adviser also reviews the portfolio characteristics of each Fund in its entirety.
This review may include as appropriate a review of country allocations, country weights, capitalisation, distribution,
industry sector weights, price/book levels, currency exposure, portfolio maturity, portfolio duration, sector exposure and
quality exposure and other key risk measures.
In addition to monitoring investment activity and exposure at the point of execution by a Money Manager, the Adviser
also receives daily exposure reporting from the Administrator and Money Managers, with which they can review various
event exposures on the Funds.
The Adviser also oversees and monitors the overall level of risk in a Fund.
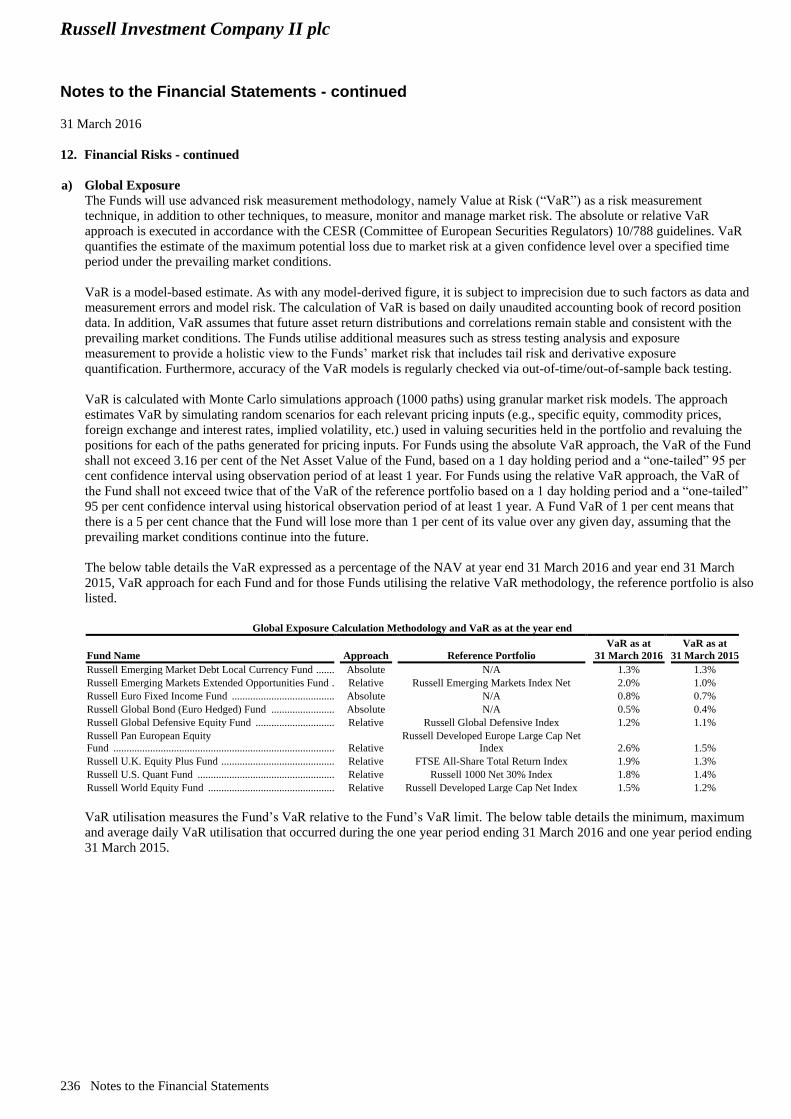
Russell Investment Company II plc
Notes to the Financial Statements - continued
31 March 2016
236 Notes to the Financial Statements
12. Financial Risks - continued
a) Global Exposure
The Funds will use advanced risk measurement methodology, namely Value at Risk (“VaR”) as a risk measurement
technique, in addition to other techniques, to measure, monitor and manage market risk. The absolute or relative VaR
approach is executed in accordance with the CESR (Committee of European Securities Regulators) 10/788 guidelines. VaR
quantifies the estimate of the maximum potential loss due to market risk at a given confidence level over a specified time
period under the prevailing market conditions.
VaR is a model-based estimate. As with any model-derived figure, it is subject to imprecision due to such factors as data and
measurement errors and model risk. The calculation of VaR is based on daily unaudited accounting book of record position
data. In addition, VaR assumes that future asset return distributions and correlations remain stable and consistent with the
prevailing market conditions. The Funds utilise additional measures such as stress testing analysis and exposure
measurement to provide a holistic view to the Funds’ market risk that includes tail risk and derivative exposure
quantification. Furthermore, accuracy of the VaR models is regularly checked via out-of-time/out-of-sample back testing.
VaR is calculated with Monte Carlo simulations approach (1000 paths) using granular market risk models. The approach
estimates VaR by simulating random scenarios for each relevant pricing inputs (e.g., specific equity, commodity prices,
foreign exchange and interest rates, implied volatility, etc.) used in valuing securities held in the portfolio and revaluing the
positions for each of the paths generated for pricing inputs. For Funds using the absolute VaR approach, the VaR of the Fund
shall not exceed 3.16 per cent of the Net Asset Value of the Fund, based on a 1 day holding period and a “one-tailed” 95 per
cent confidence interval using observation period of at least 1 year. For Funds using the relative VaR approach, the VaR of
the Fund shall not exceed twice that of the VaR of the reference portfolio based on a 1 day holding period and a “one-tailed”
95 per cent confidence interval using historical observation period of at least 1 year. A Fund VaR of 1 per cent means that
there is a 5 per cent chance that the Fund will lose more than 1 per cent of its value over any given day, assuming that the
prevailing market conditions continue into the future.
The below table details the VaR expressed as a percentage of the NAV at year end 31 March 2016 and year end 31 March
2015, VaR approach for each Fund and for those Funds utilising the relative VaR methodology, the reference portfolio is also
listed.
Global Exposure Calculation Methodology and VaR as at the year end
Fund Name Approach Reference Portfolio
VaR as at
31 March 2016
VaR as at
31 March 2015
Russell Emerging Market Debt Local Currency Fund ................................... Absolute N/A 1.3% 1.3%
Russell Emerging Markets Extended Opportunities Fund ............................. Relative Russell Emerging Markets Index Net 2.0% 1.0%
Russell Euro Fixed Income Fund ................................................................... Absolute N/A 0.8% 0.7%
Russell Global Bond (Euro Hedged) Fund .................................................... Absolute N/A 0.5% 0.4%
Russell Global Defensive Equity Fund .......................................................... Relative Russell Global Defensive Index 1.2% 1.1%
Russell Pan European Equity
Fund ................................................................................................................ Relative
Russell Developed Europe Large Cap Net
Index 2.6% 1.5%
Russell U.K. Equity Plus Fund ....................................................................... Relative FTSE All-Share Total Return Index 1.9% 1.3%
Russell U.S. Quant Fund ................................................................................ Relative Russell 1000 Net 30% Index 1.8% 1.4%
Russell World Equity Fund ............................................................................ Relative Russell Developed Large Cap Net Index 1.5% 1.2%
VaR utilisation measures the Fund’s VaR relative to the Fund’s VaR limit. The below table details the minimum, maximum
and average daily VaR utilisation that occurred during the one year period ending 31 March 2016 and one year period ending
31 March 2015.
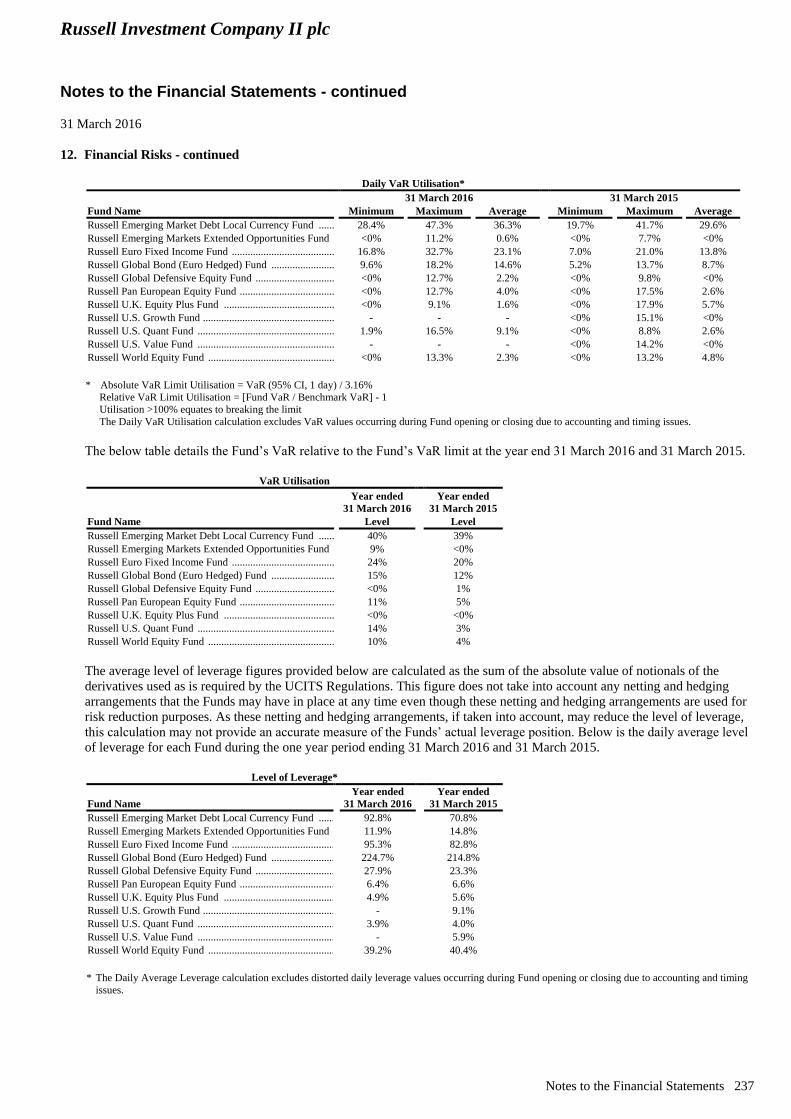
Russell Investment Company II plc
Notes to the Financial Statements - continued
31 March 2016
Notes to the Financial Statements 237
12. Financial Risks - continued
Daily VaR Utilisation*
31 March 2016 31 March 2015
Fund Name Minimum Maximum Average Minimum Maximum Average
Russell Emerging Market Debt Local Currency Fund .................................. 28.4% 47.3% 36.3% 19.7% 41.7% 29.6%
Russell Emerging Markets Extended Opportunities Fund ............................ <0% 11.2% 0.6% <0% 7.7% <0%
Russell Euro Fixed Income Fund ................................................................... 16.8% 32.7% 23.1% 7.0% 21.0% 13.8%
Russell Global Bond (Euro Hedged) Fund .................................................... 9.6% 18.2% 14.6% 5.2% 13.7% 8.7%
Russell Global Defensive Equity Fund .......................................................... <0% 12.7% 2.2% <0% 9.8% <0%
Russell Pan European Equity Fund ................................................................ <0% 12.7% 4.0% <0% 17.5% 2.6%
Russell U.K. Equity Plus Fund ...................................................................... <0% 9.1% 1.6% <0% 17.9% 5.7%
Russell U.S. Growth Fund .............................................................................. - - - <0% 15.1% <0%
Russell U.S. Quant Fund ................................................................................ 1.9% 16.5% 9.1% <0% 8.8% 2.6%
Russell U.S. Value Fund ................................................................................ - - - <0% 14.2% <0%
Russell World Equity Fund ............................................................................ <0% 13.3% 2.3% <0% 13.2% 4.8%
* Absolute VaR Limit Utilisation = VaR (95% CI, 1 day) / 3.16%
Relative VaR Limit Utilisation = [Fund VaR / Benchmark VaR] - 1
Utilisation >100% equates to breaking the limit
The Daily VaR Utilisation calculation excludes VaR values occurring during Fund opening or closing due to accounting and timing issues.
The below table details the Fund’s VaR relative to the Fund’s VaR limit at the year end 31 March 2016 and 31 March 2015.
VaR Utilisation
Year ended
31 March 2016
Year ended
31 March 2015
Fund Name Level Level
Russell Emerging Market Debt Local Currency Fund .................................. 40% 39%
Russell Emerging Markets Extended Opportunities Fund ............................ 9% <0%
Russell Euro Fixed Income Fund ................................................................... 24% 20%
Russell Global Bond (Euro Hedged) Fund .................................................... 15% 12%
Russell Global Defensive Equity Fund .......................................................... <0% 1%
Russell Pan European Equity Fund ................................................................ 11% 5%
Russell U.K. Equity Plus Fund ...................................................................... <0% <0%
Russell U.S. Quant Fund ................................................................................ 14% 3%
Russell World Equity Fund ............................................................................ 10% 4%
The average level of leverage figures provided below are calculated as the sum of the absolute value of notionals of the
derivatives used as is required by the UCITS Regulations. This figure does not take into account any netting and hedging
arrangements that the Funds may have in place at any time even though these netting and hedging arrangements are used for
risk reduction purposes. As these netting and hedging arrangements, if taken into account, may reduce the level of leverage,
this calculation may not provide an accurate measure of the Funds’ actual leverage position. Below is the daily average level
of leverage for each Fund during the one year period ending 31 March 2016 and 31 March 2015.
Level of Leverage*
Fund Name
Year ended
31 March 2016
Year ended
31 March 2015
Russell Emerging Market Debt Local Currency Fund .................................. 92.8% 70.8%
Russell Emerging Markets Extended Opportunities Fund ............................ 11.9% 14.8%
Russell Euro Fixed Income Fund ................................................................... 95.3% 82.8%
Russell Global Bond (Euro Hedged) Fund .................................................... 224.7% 214.8%
Russell Global Defensive Equity Fund .......................................................... 27.9% 23.3%
Russell Pan European Equity Fund ................................................................ 6.4% 6.6%
Russell U.K. Equity Plus Fund ...................................................................... 4.9% 5.6%
Russell U.S. Growth Fund .............................................................................. - 9.1%
Russell U.S. Quant Fund ................................................................................ 3.9% 4.0%
Russell U.S. Value Fund ................................................................................ - 5.9%
Russell World Equity Fund ............................................................................ 39.2% 40.4%
* The Daily Average Leverage calculation excludes distorted daily leverage values occurring during Fund opening or closing due to accounting and timing
issues.
Russell Investment Company II plc
Notes to the Financial Statements - continued
31 March 2016
238 Notes to the Financial Statements
12. Financial Risks - continued
b) Market Price Risk
Market price risk is defined in FRS 102 as the risk that the fair value of a financial instrument or its future cash flows will
fluctuate because of changes in market prices other than those caused by interest rate risk or currency risk.
All investments present a risk of loss of capital. The Funds’ investments are susceptible to market risk arising from
uncertainties about future prices of the instruments. Except for derivatives, maximum risk resulting from financial
instruments is determined by fair value of the financial instruments. Possible losses from certain derivatives can be unlimited.
The Adviser moderates this risk by diversifying the management of its assets by allocating them between one or more Money
Managers. The Funds’ Money Manager monitors its portfolio holdings on a daily basis.
i) Fair valuation hierarchy
FRS 102 Section 11.27 on “Fair Value: Disclosure” requires the Company to classify fair value measurements using a
fair value hierarchy that reflects the significance of the inputs used in making the measurements. On 8 March 2016, the
Financial Reporting Council (FRC) issued Amendments to FRS 102 - Fair value hierarchy disclosures. The amendment
is effective for accounting periods commencing 1 January 2017, however, the Board of Directors have agreed to early
adopt this amendment in preparing these financial statements for the year ended 31 March 2016.
The fair value hierarchy of inputs is summarised in the three broad levels listed below.
Level 1: Quoted prices (unadjusted) in active markets for identical assets or liabilities.
Level 2: Inputs other than quoted prices included within Level 1 that are observable for the asset or liability, either
directly (that is, as prices) or indirectly (that is, derived from prices).
Level 3: Inputs for the asset or liability that are not based on observable market data (that is, unobservable inputs).
The level in the fair value hierarchy within which the fair value measurement is categorised in its entirety is determined
on the basis of the lowest level input that is significant to the fair value measurement in its entirety. For this purpose, the
significance of an input is assessed against the fair value measurement in its entirety. If a fair value measurement uses
observable inputs that require significant adjustment based on unobservable inputs, that measurement is a Level 3
measurement. Assessing the significance of a particular input to the fair value measurement in its entirety requires
judgement, considering factors specific to the asset or liability.
The determination of what constitutes ‘observable’ requires significant judgement by the Directors. The Directors
consider observable data to be that market data that is readily available, regularly distributed or updated, reliable and
verifiable, not proprietary, and provided by independent sources that are actively involved in the relevant market.
Investments whose values are based on quoted market prices in active markets, and therefore classified within Level 1,
include active listed equities and exchange traded derivatives. The Funds do not adjust the quoted price for these
instruments.
Financial instruments that trade in markets that are not considered to be active but are valued based on quoted market
prices, dealer quotations or alternative pricing sources supported by observable inputs are classified within Level 2.
These include stale priced listed equities, unlisted equities, bonds, investment funds and OTC FDIs.
Investments classified within Level 3 have significant unobservable inputs, as they trade infrequently. Level 3 securities
are securities that may be priced by a single pricing vendor or may have prolonged stale prices or may have no valid
market information (indications or comparable security types) available.
Please refer to the base of each Fund’s Schedule of Investments for analysis, within the fair value hierarchy, of each
Fund’s financial assets and liabilities (by investment type) measured at fair value at 31 March 2016 and 31 March 2015.
c) Interest Rate Risk
The Funds’ interest bearing financial assets and liabilities expose it to risks associated with the effects of fluctuations in the
prevailing level of interest rates. The Funds may employ investment techniques and FDIs in order to hedge against interest
rate risk or gain exposure to the underlying market. In addition, mortgage and asset backed securities are also subject to
prepayment risk, which is the risk that borrowers pay off the debt underlying the mortgage backed/asset backed securities
sooner than anticipated and therefore shorten the average maturity of the Funds.
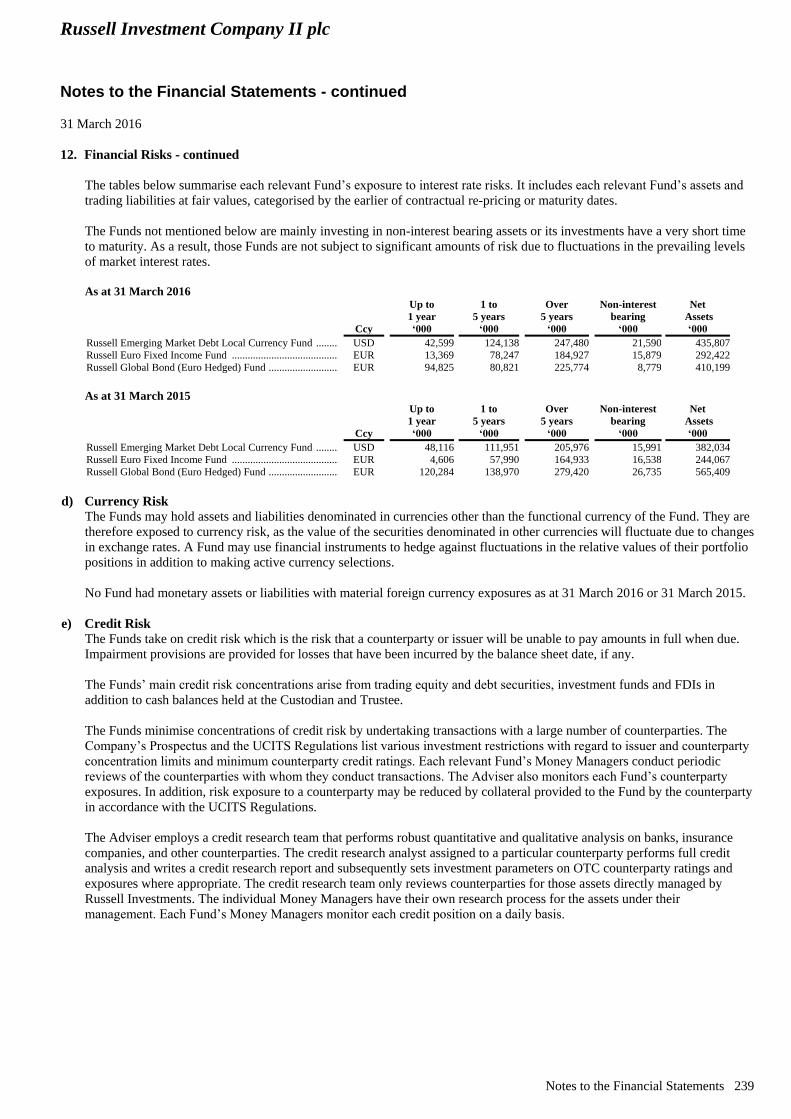
Russell Investment Company II plc
Notes to the Financial Statements - continued
31 March 2016
Notes to the Financial Statements 239
12. Financial Risks - continued
The tables below summarise each relevant Fund’s exposure to interest rate risks. It includes each relevant Fund’s assets and
trading liabilities at fair values, categorised by the earlier of contractual re-pricing or maturity dates.
The Funds not mentioned below are mainly investing in non-interest bearing assets or its investments have a very short time
to maturity. As a result, those Funds are not subject to significant amounts of risk due to fluctuations in the prevailing levels
of market interest rates.
As at 31 March 2016
i) Ccy
Up to
1 year
‘000
1 to
5 years
‘000
Over
5 years
‘000
Non-interest
bearing
‘000
Net
Assets
‘000
Russell Emerging Market Debt Local Currency Fund ................................... USD 42,599 124,138 247,480 21,590 435,807
Russell Euro Fixed Income Fund ................................................................... EUR 13,369 78,247 184,927 15,879 292,422
Russell Global Bond (Euro Hedged) Fund ..................................................... EUR 94,825 80,821 225,774 8,779 410,199
As at 31 March 2015
i) Ccy
Up to
1 year
‘000
1 to
5 years
‘000
Over
5 years
‘000
Non-interest
bearing
‘000
Net
Assets
‘000
Russell Emerging Market Debt Local Currency Fund ................................... USD 48,116 111,951 205,976 15,991 382,034
Russell Euro Fixed Income Fund ................................................................... EUR 4,606 57,990 164,933 16,538 244,067
Russell Global Bond (Euro Hedged) Fund ..................................................... EUR 120,284 138,970 279,420 26,735 565,409
d) Currency Risk
The Funds may hold assets and liabilities denominated in currencies other than the functional currency of the Fund. They are
therefore exposed to currency risk, as the value of the securities denominated in other currencies will fluctuate due to changes
in exchange rates. A Fund may use financial instruments to hedge against fluctuations in the relative values of their portfolio
positions in addition to making active currency selections.
No Fund had monetary assets or liabilities with material foreign currency exposures as at 31 March 2016 or 31 March 2015.
e) Credit Risk
The Funds take on credit risk which is the risk that a counterparty or issuer will be unable to pay amounts in full when due.
Impairment provisions are provided for losses that have been incurred by the balance sheet date, if any.
The Funds’ main credit risk concentrations arise from trading equity and debt securities, investment funds and FDIs in
addition to cash balances held at the Custodian and Trustee.
The Funds minimise concentrations of credit risk by undertaking transactions with a large number of counterparties. The
Company’s Prospectus and the UCITS Regulations list various investment restrictions with regard to issuer and counterparty
concentration limits and minimum counterparty credit ratings. Each relevant Fund’s Money Managers conduct periodic
reviews of the counterparties with whom they conduct transactions. The Adviser also monitors each Fund’s counterparty
exposures. In addition, risk exposure to a counterparty may be reduced by collateral provided to the Fund by the counterparty
in accordance with the UCITS Regulations.
The Adviser employs a credit research team that performs robust quantitative and qualitative analysis on banks, insurance
companies, and other counterparties. The credit research analyst assigned to a particular counterparty performs full credit
analysis and writes a credit research report and subsequently sets investment parameters on OTC counterparty ratings and
exposures where appropriate. The credit research team only reviews counterparties for those assets directly managed by
Russell Investments. The individual Money Managers have their own research process for the assets under their
management. Each Fund’s Money Managers monitor each credit position on a daily basis.
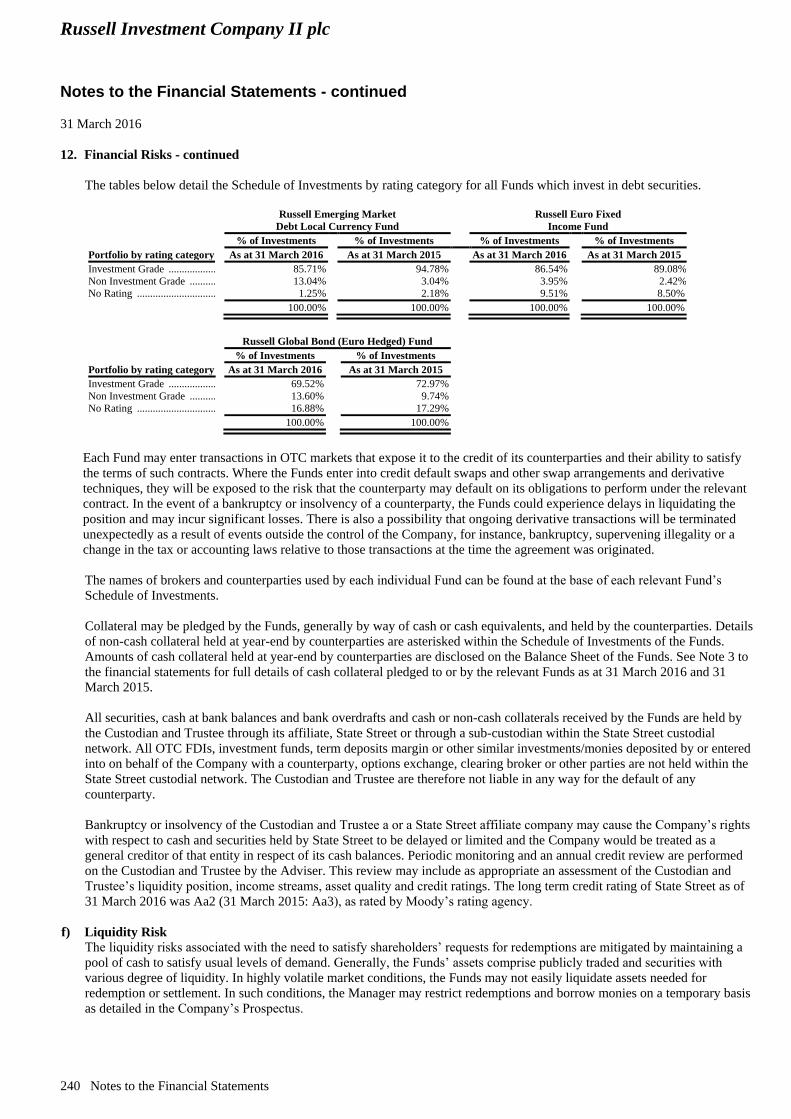
Russell Investment Company II plc
Notes to the Financial Statements - continued
31 March 2016
240 Notes to the Financial Statements
12. Financial Risks - continued
The tables below detail the Schedule of Investments by rating category for all Funds which invest in debt securities.
Russell Emerging Market
Debt Local Currency Fund
Russell Euro Fixed
Income Fund
% of Investments % of Investments % of Investments % of Investments
Portfolio by rating category As at 31 March 2016 As at 31 March 2015 As at 31 March 2016 As at 31 March 2015
Investment Grade .................................................................. 85.71% 94.78% 86.54% 89.08%
Non Investment Grade .......................................................... 13.04% 3.04% 3.95% 2.42%
No Rating .............................................................................. 1.25% 2.18% 9.51% 8.50%
100.00% 100.00% 100.00% 100.00%
Russell Global Bond (Euro Hedged) Fund
% of Investments % of Investments
Portfolio by rating category As at 31 March 2016 As at 31 March 2015
Investment Grade .................................................................. 69.52% 72.97%
Non Investment Grade .......................................................... 13.60% 9.74%
No Rating .............................................................................. 16.88% 17.29%
100.00% 100.00%
Each Fund may enter transactions in OTC markets that expose it to the credit of its counterparties and their ability to satisfy
the terms of such contracts. Where the Funds enter into credit default swaps and other swap arrangements and derivative
techniques, they will be exposed to the risk that the counterparty may default on its obligations to perform under the relevant
contract. In the event of a bankruptcy or insolvency of a counterparty, the Funds could experience delays in liquidating the
position and may incur significant losses. There is also a possibility that ongoing derivative transactions will be terminated
unexpectedly as a result of events outside the control of the Company, for instance, bankruptcy, supervening illegality or a
change in the tax or accounting laws relative to those transactions at the time the agreement was originated.
The names of brokers and counterparties used by each individual Fund can be found at the base of each relevant Fund’s
Schedule of Investments.
Collateral may be pledged by the Funds, generally by way of cash or cash equivalents, and held by the counterparties. Details
of non-cash collateral held at year-end by counterparties are asterisked within the Schedule of Investments of the Funds.
Amounts of cash collateral held at year-end by counterparties are disclosed on the Balance Sheet of the Funds. See Note 3 to
the financial statements for full details of cash collateral pledged to or by the relevant Funds as at 31 March 2016 and 31
March 2015.
All securities, cash at bank balances and bank overdrafts and cash or non-cash collaterals received by the Funds are held by
the Custodian and Trustee through its affiliate, State Street or through a sub-custodian within the State Street custodial
network. All OTC FDIs, investment funds, term deposits margin or other similar investments/monies deposited by or entered
into on behalf of the Company with a counterparty, options exchange, clearing broker or other parties are not held within the
State Street custodial network. The Custodian and Trustee are therefore not liable in any way for the default of any
counterparty.
Bankruptcy or insolvency of the Custodian and Trustee a or a State Street affiliate company may cause the Company’s rights
with respect to cash and securities held by State Street to be delayed or limited and the Company would be treated as a
general creditor of that entity in respect of its cash balances. Periodic monitoring and an annual credit review are performed
on the Custodian and Trustee by the Adviser. This review may include as appropriate an assessment of the Custodian and
Trustee’s liquidity position, income streams, asset quality and credit ratings. The long term credit rating of State Street as of
31 March 2016 was Aa2 (31 March 2015: Aa3), as rated by Moody’s rating agency.
f) Liquidity Risk
The liquidity risks associated with the need to satisfy shareholders’ requests for redemptions are mitigated by maintaining a
pool of cash to satisfy usual levels of demand. Generally, the Funds’ assets comprise publicly traded and securities with
various degree of liquidity. In highly volatile market conditions, the Funds may not easily liquidate assets needed for
redemption or settlement. In such conditions, the Manager may restrict redemptions and borrow monies on a temporary basis
as detailed in the Company’s Prospectus.
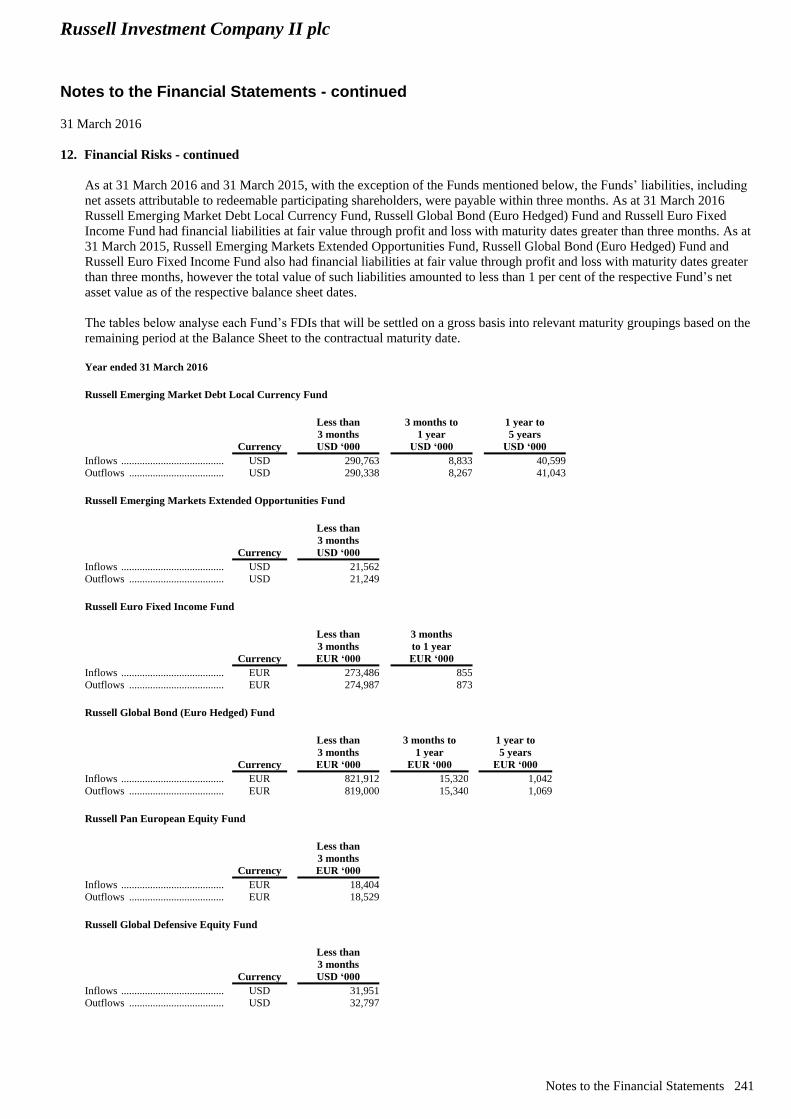
Russell Investment Company II plc
Notes to the Financial Statements - continued
31 March 2016
Notes to the Financial Statements 241
12. Financial Risks - continued
As at 31 March 2016 and 31 March 2015, with the exception of the Funds mentioned below, the Funds’ liabilities, including
net assets attributable to redeemable participating shareholders, were payable within three months. As at 31 March 2016
Russell Emerging Market Debt Local Currency Fund, Russell Global Bond (Euro Hedged) Fund and Russell Euro Fixed
Income Fund had financial liabilities at fair value through profit and loss with maturity dates greater than three months. As at
31 March 2015, Russell Emerging Markets Extended Opportunities Fund, Russell Global Bond (Euro Hedged) Fund and
Russell Euro Fixed Income Fund also had financial liabilities at fair value through profit and loss with maturity dates greater
than three months, however the total value of such liabilities amounted to less than 1 per cent of the respective Fund’s net
asset value as of the respective balance sheet dates.
The tables below analyse each Fund’s FDIs that will be settled on a gross basis into relevant maturity groupings based on the
remaining period at the Balance Sheet to the contractual maturity date.
Year ended 31 March 2016
Russell Emerging Market Debt Local Currency Fund
Currency
Less than
3 months
USD ‘000
3 months to
1 year
USD ‘000
1 year to
5 years
USD ‘000
Inflows ............................................................. USD 290,763 8,833 40,599
Outflows .......................................................... USD 290,338 8,267 41,043
Russell Emerging Markets Extended Opportunities Fund
Currency
Less than
3 months
USD ‘000
Inflows ............................................................. USD 21,562
Outflows .......................................................... USD 21,249
Russell Euro Fixed Income Fund
Currency
Less than
3 months
EUR ‘000
3 months
to 1 year
EUR ‘000
Inflows ............................................................. EUR 273,486 855
Outflows .......................................................... EUR 274,987 873
Russell Global Bond (Euro Hedged) Fund
Currency
Less than
3 months
EUR ‘000
3 months to
1 year
EUR ‘000
1 year to
5 years
EUR ‘000
Inflows ............................................................. EUR 821,912 15,320 1,042
Outflows .......................................................... EUR 819,000 15,340 1,069
Russell Pan European Equity Fund
Currency
Less than
3 months
EUR ‘000
Inflows ............................................................. EUR 18,404
Outflows .......................................................... EUR 18,529
Russell Global Defensive Equity Fund
Currency
Less than
3 months
USD ‘000
Inflows ............................................................. USD 31,951
Outflows .......................................................... USD 32,797
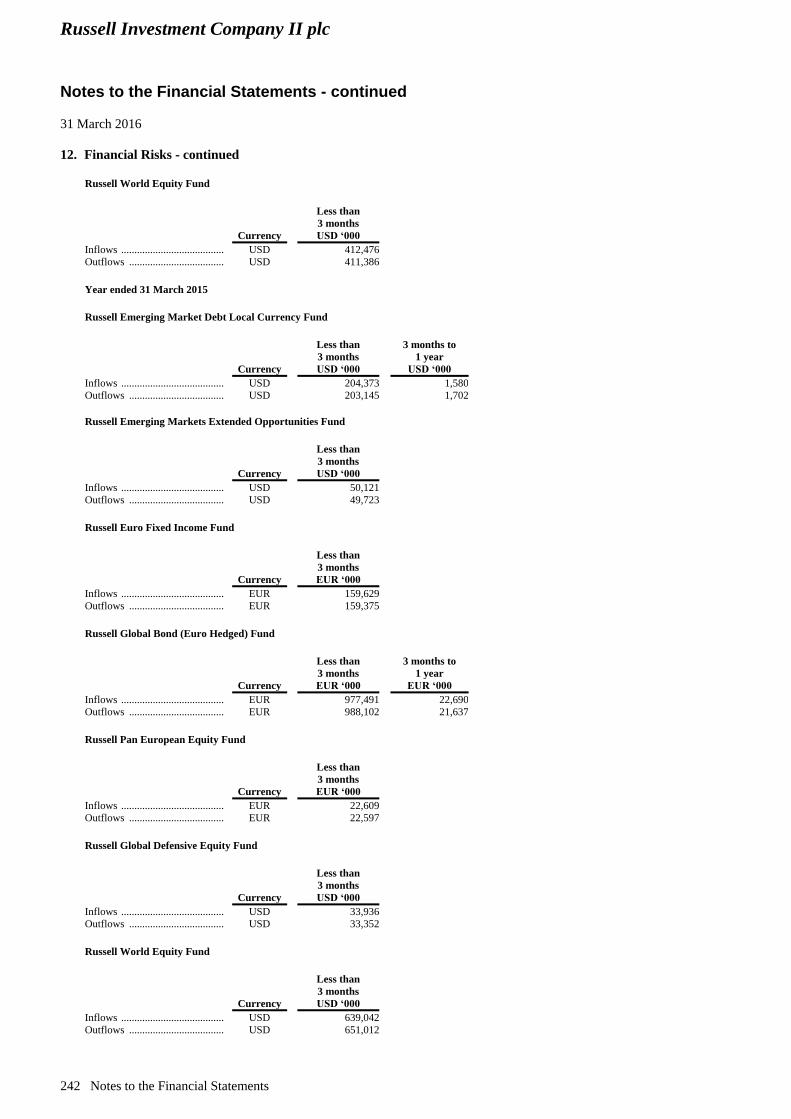
Russell Investment Company II plc
Notes to the Financial Statements - continued
31 March 2016
242 Notes to the Financial Statements
12. Financial Risks - continued
Russell World Equity Fund
Currency
Less than
3 months
USD ‘000
Inflows ............................................................. USD 412,476
Outflows .......................................................... USD 411,386
Year ended 31 March 2015 Russell Emerging Market Debt Local Currency Fund
Currency
Less than
3 months
USD ‘000
3 months to
1 year
USD ‘000
Inflows ............................................................. USD 204,373 1,580
Outflows .......................................................... USD 203,145 1,702
Russell Emerging Markets Extended Opportunities Fund
Currency
Less than
3 months
USD ‘000
Inflows ............................................................. USD 50,121
Outflows .......................................................... USD 49,723
Russell Euro Fixed Income Fund
Currency
Less than
3 months
EUR ‘000
Inflows ............................................................. EUR 159,629
Outflows .......................................................... EUR 159,375
Russell Global Bond (Euro Hedged) Fund
Currency
Less than
3 months
EUR ‘000
3 months to
1 year
EUR ‘000
Inflows ............................................................. EUR 977,491 22,690
Outflows .......................................................... EUR 988,102 21,637
Russell Pan European Equity Fund
Currency
Less than
3 months
EUR ‘000
Inflows ............................................................. EUR 22,609
Outflows .......................................................... EUR 22,597
Russell Global Defensive Equity Fund
Currency
Less than
3 months
USD ‘000
Inflows ............................................................. USD 33,936
Outflows .......................................................... USD 33,352
Russell World Equity Fund
Currency
Less than
3 months
USD ‘000
Inflows ............................................................. USD 639,042
Outflows .......................................................... USD 651,012
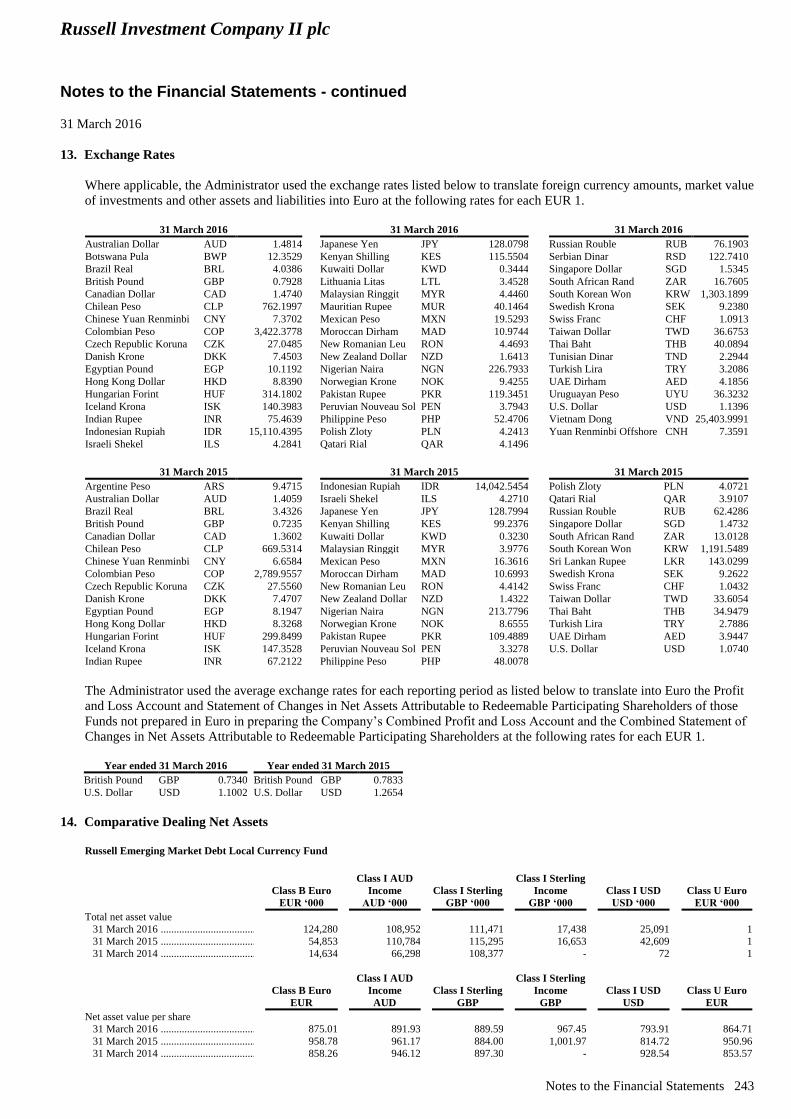
Russell Investment Company II plc
Notes to the Financial Statements - continued
31 March 2016
Notes to the Financial Statements 243
13. Exchange Rates
Where applicable, the Administrator used the exchange rates listed below to translate foreign currency amounts, market value
of investments and other assets and liabilities into Euro at the following rates for each EUR 1.
31 March 2016 31 March 2016 31 March 2016
Australian Dollar AUD 1.4814 Japanese Yen JPY 128.0798 Russian Rouble RUB 76.1903
Botswana Pula BWP 12.3529 Kenyan Shilling KES 115.5504 Serbian Dinar RSD 122.7410
Brazil Real BRL 4.0386 Kuwaiti Dollar KWD 0.3444 Singapore Dollar SGD 1.5345
British Pound GBP 0.7928 Lithuania Litas LTL 3.4528 South African Rand ZAR 16.7605
Canadian Dollar CAD 1.4740 Malaysian Ringgit MYR 4.4460 South Korean Won KRW 1,303.1899
Chilean Peso CLP 762.1997 Mauritian Rupee MUR 40.1464 Swedish Krona SEK 9.2380
Chinese Yuan Renminbi CNY 7.3702 Mexican Peso MXN 19.5293 Swiss Franc CHF 1.0913
Colombian Peso COP 3,422.3778 Moroccan Dirham MAD 10.9744 Taiwan Dollar TWD 36.6753
Czech Republic Koruna CZK 27.0485 New Romanian Leu RON 4.4693 Thai Baht THB 40.0894
Danish Krone DKK 7.4503 New Zealand Dollar NZD 1.6413 Tunisian Dinar TND 2.2944
Egyptian Pound EGP 10.1192 Nigerian Naira NGN 226.7933 Turkish Lira TRY 3.2086
Hong Kong Dollar HKD 8.8390 Norwegian Krone NOK 9.4255 UAE Dirham AED 4.1856
Hungarian Forint HUF 314.1802 Pakistan Rupee PKR 119.3451 Uruguayan Peso UYU 36.3232
Iceland Krona ISK 140.3983 Peruvian Nouveau Sol PEN 3.7943 U.S. Dollar USD 1.1396
Indian Rupee INR 75.4639 Philippine Peso PHP 52.4706 Vietnam Dong VND 25,403.9991
Indonesian Rupiah IDR 15,110.4395 Polish Zloty PLN 4.2413 Yuan Renminbi Offshore CNH 7.3591
Israeli Shekel ILS 4.2841 Qatari Rial QAR 4.1496
31 March 2015 31 March 2015 31 March 2015
Argentine Peso ARS 9.4715 Indonesian Rupiah IDR 14,042.5454 Polish Zloty PLN 4.0721
Australian Dollar AUD 1.4059 Israeli Shekel ILS 4.2710 Qatari Rial QAR 3.9107
Brazil Real BRL 3.4326 Japanese Yen JPY 128.7994 Russian Rouble RUB 62.4286
British Pound GBP 0.7235 Kenyan Shilling KES 99.2376 Singapore Dollar SGD 1.4732
Canadian Dollar CAD 1.3602 Kuwaiti Dollar KWD 0.3230 South African Rand ZAR 13.0128
Chilean Peso CLP 669.5314 Malaysian Ringgit MYR 3.9776 South Korean Won KRW 1,191.5489
Chinese Yuan Renminbi CNY 6.6584 Mexican Peso MXN 16.3616 Sri Lankan Rupee LKR 143.0299
Colombian Peso COP 2,789.9557 Moroccan Dirham MAD 10.6993 Swedish Krona SEK 9.2622
Czech Republic Koruna CZK 27.5560 New Romanian Leu RON 4.4142 Swiss Franc CHF 1.0432
Danish Krone DKK 7.4707 New Zealand Dollar NZD 1.4322 Taiwan Dollar TWD 33.6054
Egyptian Pound EGP 8.1947 Nigerian Naira NGN 213.7796 Thai Baht THB 34.9479
Hong Kong Dollar HKD 8.3268 Norwegian Krone NOK 8.6555 Turkish Lira TRY 2.7886
Hungarian Forint HUF 299.8499 Pakistan Rupee PKR 109.4889 UAE Dirham AED 3.9447
Iceland Krona ISK 147.3528 Peruvian Nouveau Sol PEN 3.3278 U.S. Dollar USD 1.0740
Indian Rupee INR 67.2122 Philippine Peso PHP 48.0078
The Administrator used the average exchange rates for each reporting period as listed below to translate into Euro the Profit
and Loss Account and Statement of Changes in Net Assets Attributable to Redeemable Participating Shareholders of those
Funds not prepared in Euro in preparing the Company’s Combined Profit and Loss Account and the Combined Statement of
Changes in Net Assets Attributable to Redeemable Participating Shareholders at the following rates for each EUR 1.
Year ended 31 March 2016 Year ended 31 March 2015
British Pound GBP 0.7340 British Pound GBP 0.7833
U.S. Dollar USD 1.1002 U.S. Dollar USD 1.2654
14. Comparative Dealing Net Assets
Russell Emerging Market Debt Local Currency Fund
Class B Euro
EUR ‘000
Class I AUD
Income
AUD ‘000
Class I Sterling
GBP ‘000
Class I Sterling
Income
GBP ‘000
Class I USD
USD ‘000
Class U Euro
EUR ‘000
Total net asset value
31 March 2016 ................................................ 124,280 108,952 111,471 17,438 25,091 1
31 March 2015 ................................................ 54,853 110,784 115,295 16,653 42,609 1
31 March 2014 ................................................ 14,634 66,298 108,377 - 72 1
Class B Euro
EUR
Class I AUD
Income
AUD
Class I Sterling
GBP
Class I Sterling
Income
GBP
Class I USD
USD
Class U Euro
EUR
Net asset value per share
31 March 2016 ................................................ 875.01 891.93 889.59 967.45 793.91 864.71
31 March 2015 ................................................ 958.78 961.17 884.00 1,001.97 814.72 950.96
31 March 2014 ................................................ 858.26 946.12 897.30 - 928.54 853.57
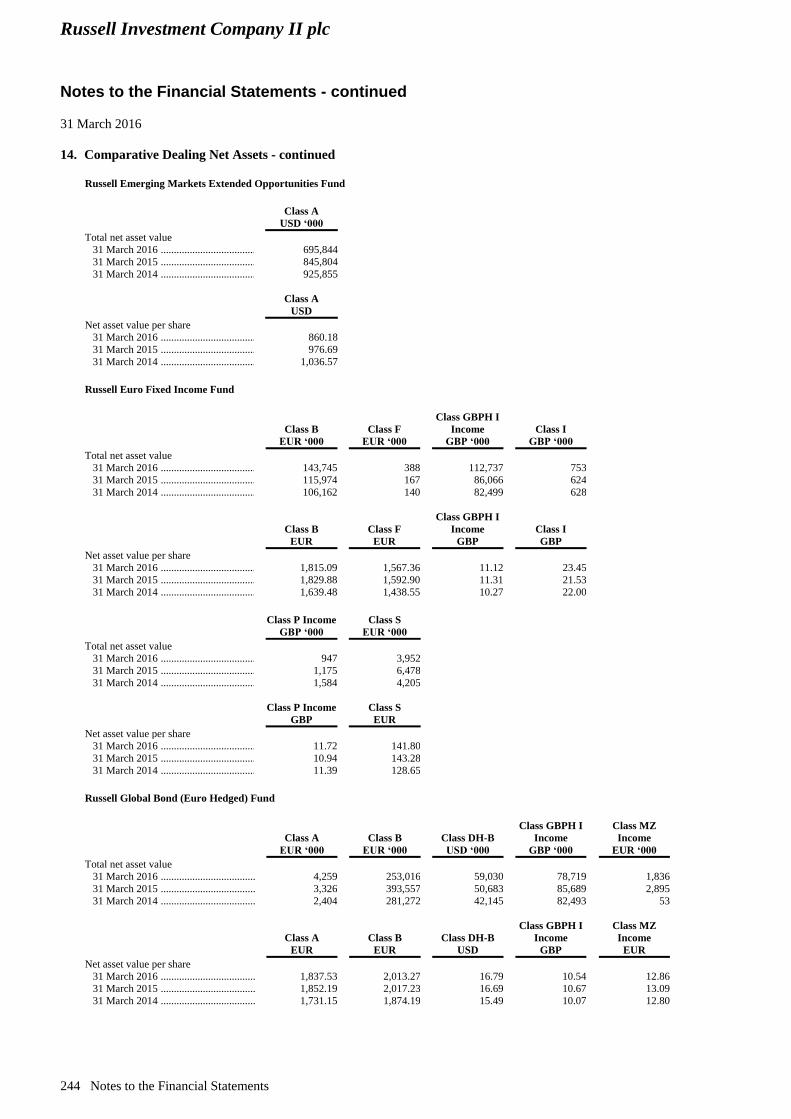
Russell Investment Company II plc
Notes to the Financial Statements - continued
31 March 2016
244 Notes to the Financial Statements
14. Comparative Dealing Net Assets - continued
Russell Emerging Markets Extended Opportunities Fund
Class A
USD ‘000
Total net asset value
31 March 2016 ................................................ 695,844
31 March 2015 ................................................ 845,804
31 March 2014 ................................................ 925,855
Class A
USD
Net asset value per share
31 March 2016 ................................................ 860.18
31 March 2015 ................................................ 976.69
31 March 2014 ................................................ 1,036.57
Russell Euro Fixed Income Fund
Class B
EUR ‘000 Class F
EUR ‘000
Class GBPH I
Income
GBP ‘000
Class I
GBP ‘000
Total net asset value
31 March 2016 ................................................ 143,745 388 112,737 753
31 March 2015 ................................................ 115,974 167 86,066 624
31 March 2014 ................................................ 106,162 140 82,499 628
Class B
EUR Class F
EUR
Class GBPH I
Income
GBP
Class I
GBP
Net asset value per share
31 March 2016 ................................................ 1,815.09 1,567.36 11.12 23.45
31 March 2015 ................................................ 1,829.88 1,592.90 11.31 21.53
31 March 2014 ................................................ 1,639.48 1,438.55 10.27 22.00
Class P Income
GBP ‘000
Class S
EUR ‘000
Total net asset value
31 March 2016 ................................................ 947 3,952
31 March 2015 ................................................ 1,175 6,478
31 March 2014 ................................................ 1,584 4,205
Class P Income
GBP
Class S
EUR
Net asset value per share
31 March 2016 ................................................ 11.72 141.80
31 March 2015 ................................................ 10.94 143.28
31 March 2014 ................................................ 11.39 128.65
Russell Global Bond (Euro Hedged) Fund
Class A
EUR ‘000
Class B
EUR ‘000
Class DH-B
USD ‘000
Class GBPH I
Income
GBP ‘000
Class MZ
Income
EUR ‘000
Total net asset value
31 March 2016 ................................................ 4,259 253,016 59,030 78,719 1,836
31 March 2015 ................................................ 3,326 393,557 50,683 85,689 2,895
31 March 2014 ................................................ 2,404 281,272 42,145 82,493 53
Class A
EUR
Class B
EUR
Class DH-B
USD
Class GBPH I
Income
GBP
Class MZ
Income
EUR
Net asset value per share
31 March 2016 ................................................ 1,837.53 2,013.27 16.79 10.54 12.86
31 March 2015 ................................................ 1,852.19 2,017.23 16.69 10.67 13.09
31 March 2014 ................................................ 1,731.15 1,874.19 15.49 10.07 12.80
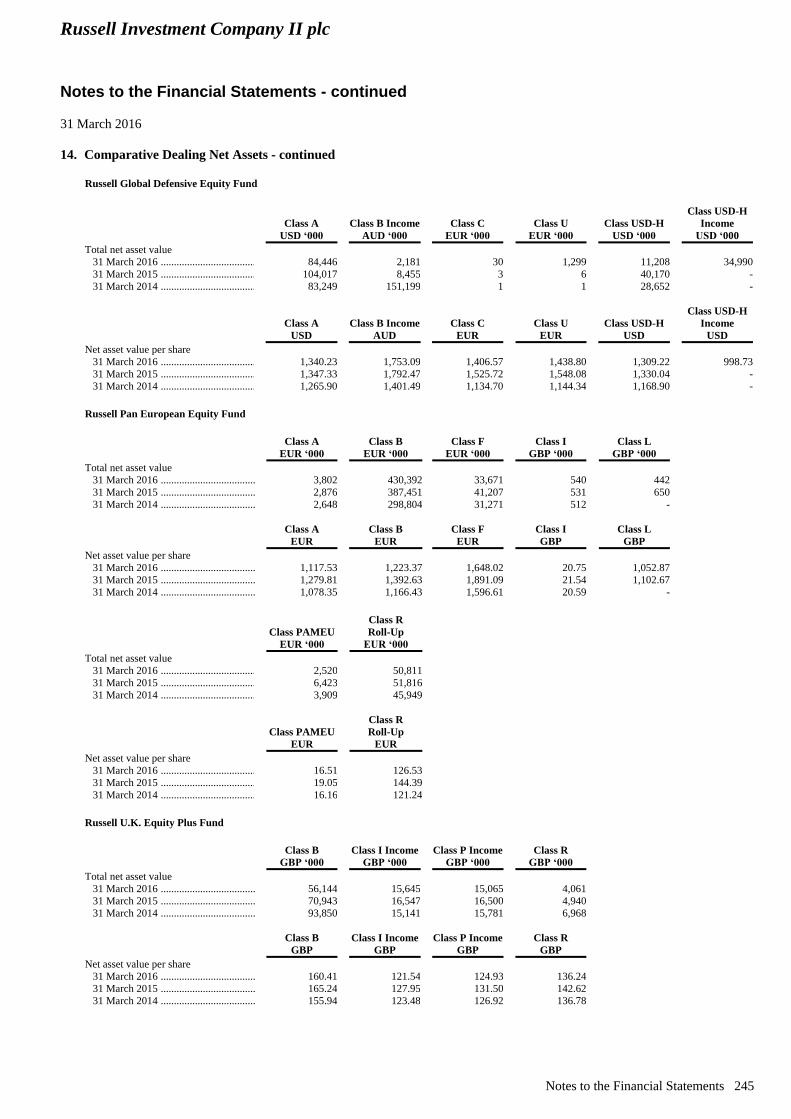
Russell Investment Company II plc
Notes to the Financial Statements - continued
31 March 2016
Notes to the Financial Statements 245
14. Comparative Dealing Net Assets - continued Russell Global Defensive Equity Fund
Class A
USD ‘000
Class B Income
AUD ‘000 Class C
EUR ‘000 Class U
EUR ‘000 Class USD-H
USD ‘000
Class USD-H
Income
USD ‘000
Total net asset value
31 March 2016 ................................................ 84,446 2,181 30 1,299 11,208 34,990
31 March 2015 ................................................ 104,017 8,455 3 6 40,170 -
31 March 2014 ................................................ 83,249 151,199 1 1 28,652 -
Class A
USD
Class B Income
AUD Class C
EUR Class U
EUR Class USD-H
USD
Class USD-H
Income
USD
Net asset value per share
31 March 2016 ................................................ 1,340.23 1,753.09 1,406.57 1,438.80 1,309.22 998.73
31 March 2015 ................................................ 1,347.33 1,792.47 1,525.72 1,548.08 1,330.04 -
31 March 2014 ................................................ 1,265.90 1,401.49 1,134.70 1,144.34 1,168.90 -
Russell Pan European Equity Fund
Class A
EUR ‘000
Class B
EUR ‘000
Class F
EUR ‘000
Class I
GBP ‘000
Class L
GBP ‘000
Total net asset value
31 March 2016 ................................................ 3,802 430,392 33,671 540 442
31 March 2015 ................................................ 2,876 387,451 41,207 531 650
31 March 2014 ................................................ 2,648 298,804 31,271 512 -
Class A
EUR
Class B
EUR
Class F
EUR
Class I
GBP
Class L
GBP
Net asset value per share
31 March 2016 ................................................ 1,117.53 1,223.37 1,648.02 20.75 1,052.87
31 March 2015 ................................................ 1,279.81 1,392.63 1,891.09 21.54 1,102.67
31 March 2014 ................................................ 1,078.35 1,166.43 1,596.61 20.59 -
Class PAMEU
EUR ‘000
Class R
Roll-Up
EUR ‘000
Total net asset value
31 March 2016 ................................................ 2,520 50,811
31 March 2015 ................................................ 6,423 51,816
31 March 2014 ................................................ 3,909 45,949
Class PAMEU
EUR
Class R
Roll-Up
EUR
Net asset value per share
31 March 2016 ................................................ 16.51 126.53
31 March 2015 ................................................ 19.05 144.39
31 March 2014 ................................................ 16.16 121.24
Russell U.K. Equity Plus Fund
Class B
GBP ‘000
Class I Income
GBP ‘000
Class P Income
GBP ‘000
Class R
GBP ‘000
Total net asset value
31 March 2016 ................................................ 56,144 15,645 15,065 4,061
31 March 2015 ................................................ 70,943 16,547 16,500 4,940
31 March 2014 ................................................ 93,850 15,141 15,781 6,968
Class B
GBP
Class I Income
GBP
Class P Income
GBP
Class R
GBP
Net asset value per share
31 March 2016 ................................................ 160.41 121.54 124.93 136.24
31 March 2015 ................................................ 165.24 127.95 131.50 142.62
31 March 2014 ................................................ 155.94 123.48 126.92 136.78
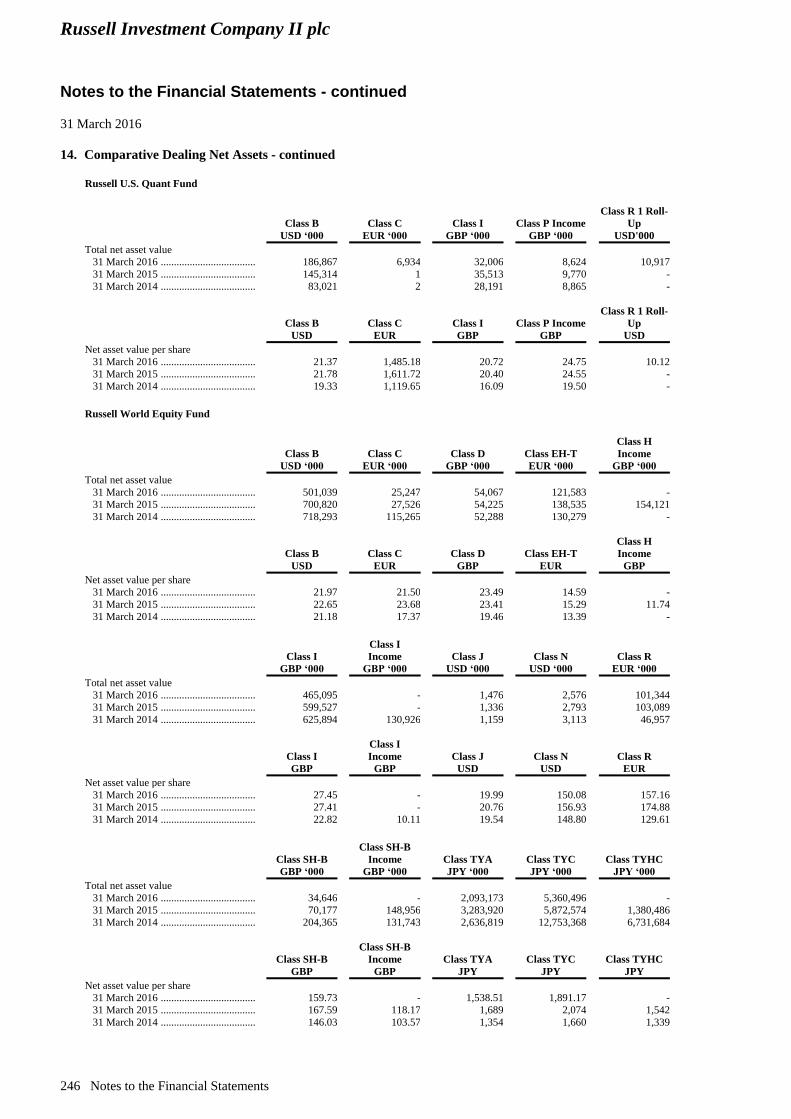
Russell Investment Company II plc
Notes to the Financial Statements - continued
31 March 2016
246 Notes to the Financial Statements
14. Comparative Dealing Net Assets - continued
Russell U.S. Quant Fund
Class B
USD ‘000 Class C
EUR ‘000 Class I
GBP ‘000 Class P Income
GBP ‘000
Class R 1 Roll-
Up
USD'000
Total net asset value
31 March 2016 ................................................ 186,867 6,934 32,006 8,624 10,917
31 March 2015 ................................................ 145,314 1 35,513 9,770 -
31 March 2014 ................................................ 83,021 2 28,191 8,865 -
Class B
USD Class C
EUR Class I
GBP Class P Income
GBP
Class R 1 Roll-
Up
USD
Net asset value per share
31 March 2016 ................................................ 21.37 1,485.18 20.72 24.75 10.12
31 March 2015 ................................................ 21.78 1,611.72 20.40 24.55 -
31 March 2014 ................................................ 19.33 1,119.65 16.09 19.50 -
Russell World Equity Fund
Class B
USD ‘000 Class C
EUR ‘000 Class D
GBP ‘000 Class EH-T
EUR ‘000
Class H
Income
GBP ‘000
Total net asset value
31 March 2016 ................................................ 501,039 25,247 54,067 121,583 -
31 March 2015 ................................................ 700,820 27,526 54,225 138,535 154,121
31 March 2014 ................................................ 718,293 115,265 52,288 130,279 -
Class B
USD Class C
EUR Class D
GBP Class EH-T
EUR
Class H
Income
GBP
Net asset value per share
31 March 2016 ................................................ 21.97 21.50 23.49 14.59 -
31 March 2015 ................................................ 22.65 23.68 23.41 15.29 11.74
31 March 2014 ................................................ 21.18 17.37 19.46 13.39 -
Class I
GBP ‘000
Class I
Income
GBP ‘000 Class J
USD ‘000
Class N
USD ‘000
Class R
EUR ‘000
Total net asset value
31 March 2016 ................................................ 465,095 - 1,476 2,576 101,344
31 March 2015 ................................................ 599,527 - 1,336 2,793 103,089
31 March 2014 ................................................ 625,894 130,926 1,159 3,113 46,957
Class I
GBP
Class I
Income
GBP Class J
USD
Class N
USD
Class R
EUR
Net asset value per share
31 March 2016 ................................................ 27.45 - 19.99 150.08 157.16
31 March 2015 ................................................ 27.41 - 20.76 156.93 174.88
31 March 2014 ................................................ 22.82 10.11 19.54 148.80 129.61
Class SH-B
GBP ‘000
Class SH-B
Income
GBP ‘000
Class TYA
JPY ‘000
Class TYC
JPY ‘000
Class TYHC
JPY ‘000
Total net asset value
31 March 2016 ................................................ 34,646 - 2,093,173 5,360,496 -
31 March 2015 ................................................ 70,177 148,956 3,283,920 5,872,574 1,380,486
31 March 2014 ................................................ 204,365 131,743 2,636,819 12,753,368 6,731,684
Class SH-B
GBP
Class SH-B
Income
GBP
Class TYA
JPY
Class TYC
JPY
Class TYHC
JPY
Net asset value per share
31 March 2016 ................................................ 159.73 - 1,538.51 1,891.17 -
31 March 2015 ................................................ 167.59 118.17 1,689 2,074 1,542
31 March 2014 ................................................ 146.03 103.57 1,354 1,660 1,339
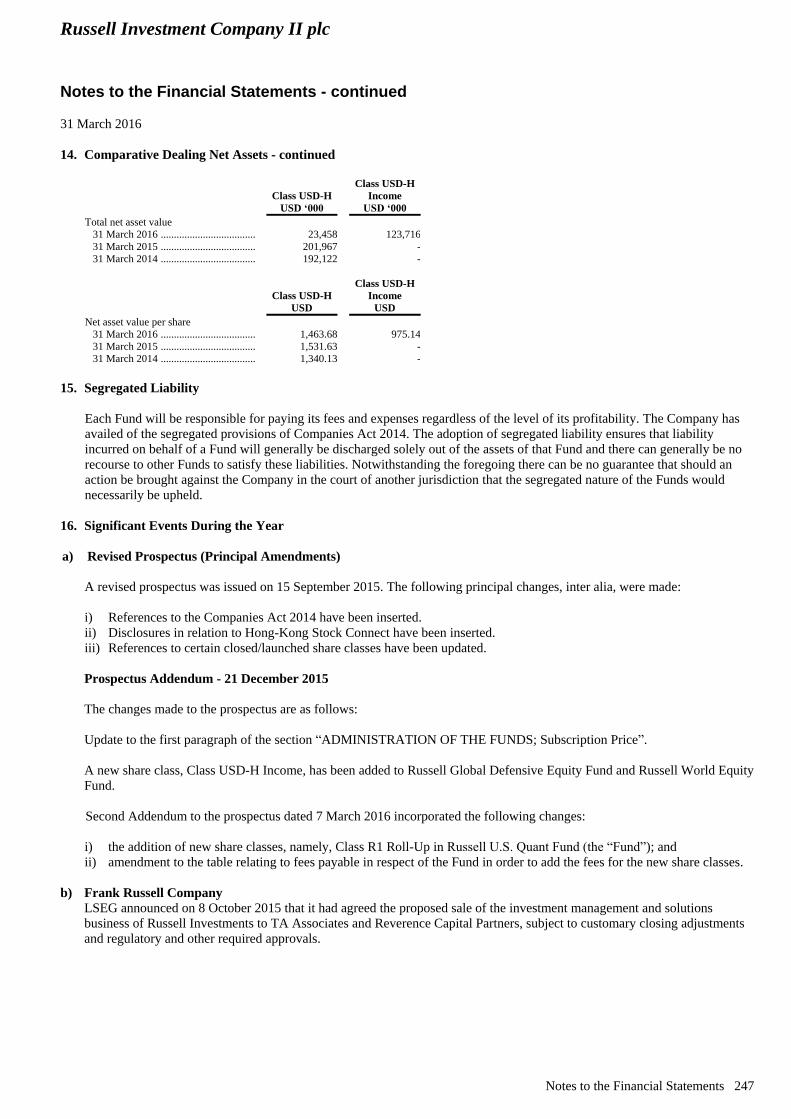
Russell Investment Company II plc
Notes to the Financial Statements - continued
31 March 2016
Notes to the Financial Statements 247
14. Comparative Dealing Net Assets - continued
Class USD-H
USD ‘000
Class USD-H
Income
USD ‘000
Total net asset value
31 March 2016 ................................................ 23,458 123,716
31 March 2015 ................................................ 201,967 -
31 March 2014 ................................................ 192,122 -
Class USD-H
USD
Class USD-H
Income
USD
Net asset value per share
31 March 2016 ................................................ 1,463.68 975.14
31 March 2015 ................................................ 1,531.63 -
31 March 2014 ................................................ 1,340.13 -
15. Segregated Liability
Each Fund will be responsible for paying its fees and expenses regardless of the level of its profitability. The Company has
availed of the segregated provisions of Companies Act 2014. The adoption of segregated liability ensures that liability
incurred on behalf of a Fund will generally be discharged solely out of the assets of that Fund and there can generally be no
recourse to other Funds to satisfy these liabilities. Notwithstanding the foregoing there can be no guarantee that should an
action be brought against the Company in the court of another jurisdiction that the segregated nature of the Funds would
necessarily be upheld.
16. Significant Events During the Year
a) Revised Prospectus (Principal Amendments)
A revised prospectus was issued on 15 September 2015. The following principal changes, inter alia, were made:
i) References to the Companies Act 2014 have been inserted.
ii) Disclosures in relation to Hong-Kong Stock Connect have been inserted.
iii) References to certain closed/launched share classes have been updated.
Prospectus Addendum - 21 December 2015
The changes made to the prospectus are as follows:
Update to the first paragraph of the section “ADMINISTRATION OF THE FUNDS; Subscription Price”.
A new share class, Class USD-H Income, has been added to Russell Global Defensive Equity Fund and Russell World Equity
Fund.
Second Addendum to the prospectus dated 7 March 2016 incorporated the following changes:
i) the addition of new share classes, namely, Class R1 Roll-Up in Russell U.S. Quant Fund (the “Fund”); and
ii) amendment to the table relating to fees payable in respect of the Fund in order to add the fees for the new share classes.
b) Frank Russell Company
LSEG announced on 8 October 2015 that it had agreed the proposed sale of the investment management and solutions
business of Russell Investments to TA Associates and Reverence Capital Partners, subject to customary closing adjustments
and regulatory and other required approvals.
Russell Investment Company II plc
Notes to the Financial Statements - continued
31 March 2016
248 Notes to the Financial Statements
17. Significant Events Since the Year End
The third addendum to the prospectus dated 13 April 2016 incorporated the following changes:
i) Russell U.K. Equity Plus Fund - addition of the following share class - Class N.
ii) Russell World Equity Fund - addition of the following share class - Class M.
The fourth addendum to the prospectus dated 28 April 2016 incorporated the following changes:
i) Russell Emerging Markets Extended Opportunities Fund - addition of the following share class - Class I.
The sale of Russell Investments by LSEG to TA Associates and Reverence Capital Partners concluded on 1 June 2016.
18. Approval of the Financial Statements
The financial statements were approved by the Directors on 12 July 2016.

Russell Investments Rex House10 Regent Street, St James’London, SW1Y 4PE
tel +44 (0) 20 7024 6000fax +44 (0) 20 7024 6001www.russell.com