rural disadvantage reviewing the evidence com rura hidd
TRANSCRIPT
Rural disadvantageReviewing the evidence
Commission for Rural Communities
Rural disadvantageHidden voicesa DVD film of real life experiences of living in rural England.
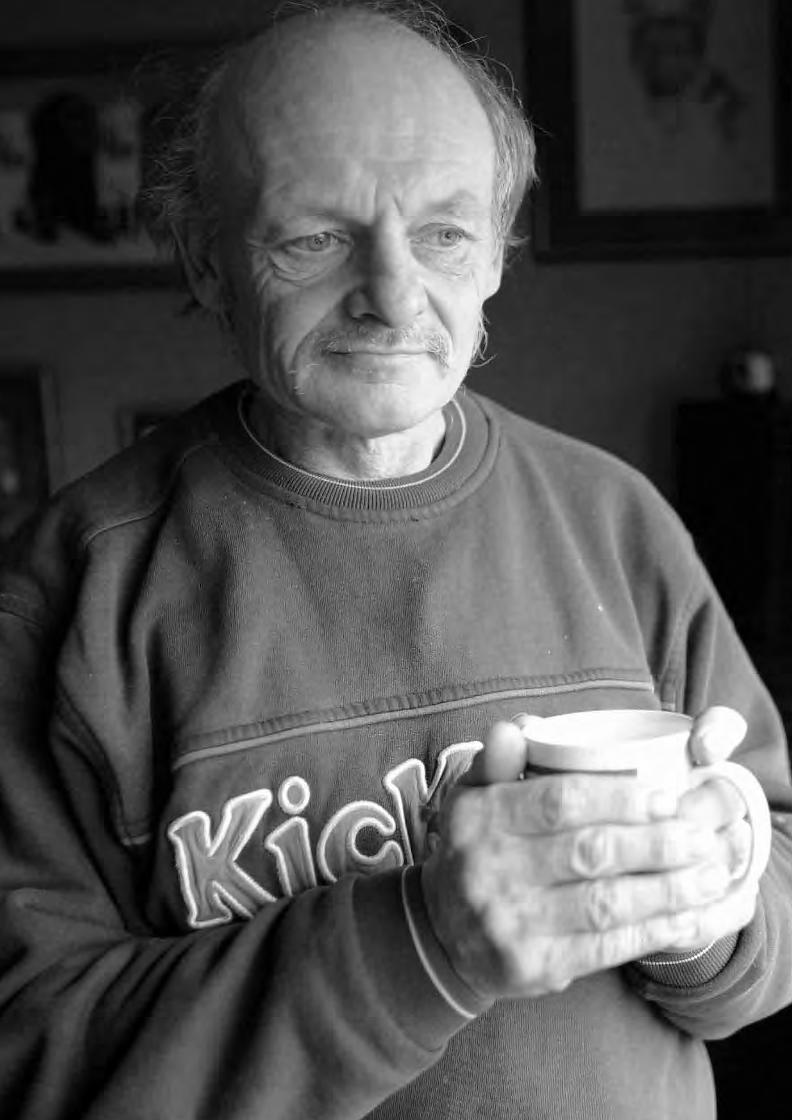
The people that speak out in this film tell of real life experiences of living in rural England. They reveal how many of the things we take for grantedcan be lacking in rural areas and explain their frustrations. Things suchas a decently paid job, nearby schools, shops and post offices, affordablehousing, good public transport links, a social life, and things to do. Theirstories show the many good aspects of rural living but also how theexperience of disadvantage can often be hard felt, yet hidden from view.In many cases communities show great resilience and imagination andthe film shows some examples of community led initiatives.
Filming took place in a sample of rural areas across England. TheCommission would like to thank all the individuals that took part in thisfilm. Special thanks also to: Hereford and Worcester Community Council,Norfolk Rural Community Council, Peak District Rural Deprivation Forum,Sompriti, Sussex Rural Community Council, Sulfolk ACRE.
Thanks to the Rural Media Company, who produced this film.
Thi
sd
ocum
enti
sp
rint
edon
recy
cled
pap
erco
mp
risi
ng75
%p
ostc
onsu
mer
was
te
Commission forRural Communities
London Office20th Floor Portland House Stag Place London SW1E 5RS Telephone 0207 932 5800 Facsimile 0207 932 5811
Cheltenham OfficeJohn Dower House Crescent Place Cheltenham Glos. GL50 3RATelephone 01242 521381Facsimile 01242 584270
Email [email protected]
CRC 31 / September 2006
Ru
ral
disa
dva
nta
ge
Review
ingthe
evidence
Cover photography ©Countryside Agency/Jim Hodson September 2006
Rural disadvantageReviewing the evidence
Commission for Rural Communities
Rural disadvantageHidden voicesa DVD film of real life experiences of living in rural England.
The people that speak out in this film tell of real life experiences of living in rural England. They reveal how many of the things we take for grantedcan be lacking in rural areas and explain their frustrations. Things suchas a decently paid job, nearby schools, shops and post offices, affordablehousing, good public transport links, a social life, and things to do. Theirstories show the many good aspects of rural living but also how theexperience of disadvantage can often be hard felt, yet hidden from view.In many cases communities show great resilience and imagination andthe film shows some examples of community led initiatives.
Filming took place in a sample of rural areas across England. TheCommission would like to thank all the individuals that took part in thisfilm. Special thanks also to: Hereford and Worcester Community Council,Norfolk Rural Community Council, Peak District Rural Deprivation Forum,Sompriti, Sussex Rural Community Council, Sulfolk ACRE.
Thanks to the Rural Media Company, who produced this film.
Thi
sd
ocum
enti
sp
rint
edon
recy
cled
pap
erco
mp
risi
ng75
%p
ostc
onsu
mer
was
te
Commission forRural Communities
London Office20th Floor Portland House Stag Place London SW1E 5RS Telephone 0207 932 5800 Facsimile 0207 932 5811
Cheltenham OfficeJohn Dower House Crescent Place Cheltenham Glos. GL50 3RATelephone 01242 521381Facsimile 01242 584270
Email [email protected]
CRC 31 / September 2006
Ru
ral
disa
dva
nta
ge
Review
ingthe
evidence
Cover photography ©Countryside Agency/Jim Hodson September 2006
Commission for Rural Communities
Rural disadvantageReviewing the evidence
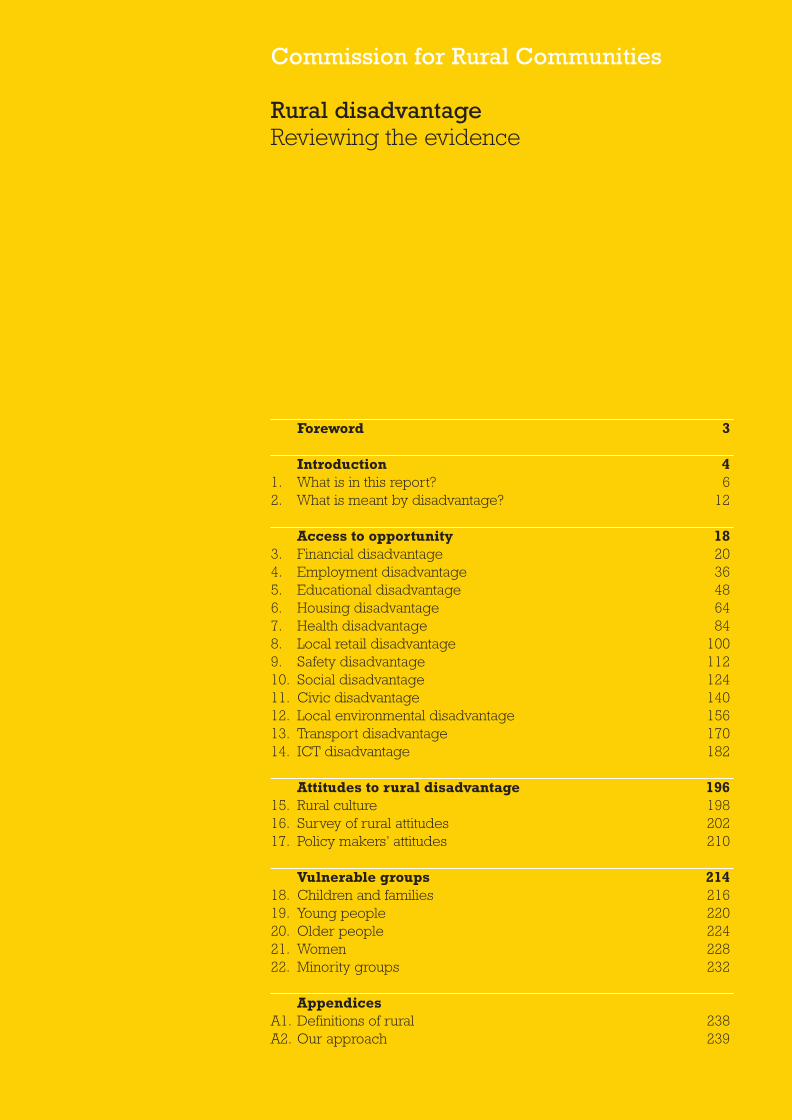
Foreword 3
Introduction 41. What is in this report? 62. What is meant by disadvantage? 12
Access to opportunity 183. Financial disadvantage 204. Employment disadvantage 365. Educational disadvantage 486. Housing disadvantage 647. Health disadvantage 848. Local retail disadvantage 1009. Safety disadvantage 11210. Social disadvantage 12411. Civic disadvantage 14012. Local environmental disadvantage 15613. Transport disadvantage 17014. ICT disadvantage 182
Attitudes to rural disadvantage 19615. Rural culture 19816. Survey of rural attitudes 20217. Policy makers’ attitudes 210
Vulnerable groups 21418. Children and families 21619. Young people 22020. Older people 22421. Women 22822. Minority groups 232
AppendicesA1. Definitions of rural 238A2. Our approach 239
CC32EvidenceSect1_AW 26/9/06 4:59 pm Page 1
2 Rural disadvantage Reviewing the evidence
September 2006
Commission for Rural Communities(an operating division of the Countryside Agency)
This report, Rural disadvantage: Reviewing the evidence,provides a review and assessment of existing research anddocumentation relating to rural disadvantage and the policyresponses. It is accompanied by Rural Disadvantage:Hidden Voices – a DVD film of real life experiences of living in rural England.
This report is one of a number of products produced as part of the Commission for Rural Communities’ first major thematic study to gather evidence about rural disadvantage.
Other products in the study:
Rural disadvantage: Priorities for actionA report summarising our findings and presenting priorities for action to tackle rural disadvantage.Rural disadvantage: Futures thinkpiece A report written by the Future Foundation for the Commission, which provides a review of futures related literature and summarises recent thinking about the future of rural disadvantage.Rural disadvantage: Quality of life and disadvantage amongst older people – a pilot studyA report to the Commission on new research to understand better how older people living in rural areas experience disadvantage.Attitudes to rural disadvantage: a segmentation analysis A report to the Commission on new research on rural attitudes to disadvantage. Available in pdf form on the Commission’s website.
The rural disadvantage study team comprised of Ruth Bradshaw, Jacqui Cuff, Julie Rogers and Lynn Watkins.
For further information on the rural disadvantage study contact:Lynn WatkinsHead of Thematic [email protected]
For further information on the Commission’s work generally visit:www.ruralcommunities.gov.uk
CC32EvidenceSect1_AW 26/9/06 4:59 pm Page 2
3 Rural disadvantage Reviewing the evidence
Foreword
When we launched the Commission for Rural Communities in 2005 –initially as an operating division of the Countryside Agency – we setabout producing an up-to-date and detailed review of the evidence base on rural disadvantage. What does it tell us about the issues, what do we know about the policy responses and where are the gaps in thatevidence? This publication is the culmination of that work, based uponreviewing literally hundreds of reports and documents. It is intended as a reference document and a basis for informing future developmentsto the evidence base. Our accompanying Priorities for Action reportprovides a framework for policy actions that would address key ruraldisadvantage issues.
There has been a growing body of evidence as new data becomesavailable and new research is undertaken. On certain aspects of ruraldisadvantage, like housing affordability and on transport issues, theknowledge base can be considered quite strong.Yet that picture is farfrom universal. When we started this study we were fairly confident aboutthe extent of knowledge on disadvantage within rural communities, butthe more we examined it systematically the more gaps and weaknessesappeared. Most research on disadvantage and social exclusion does notidentify rural issues and much of the research on rural issues does notpull out information about who or why some face disadvantage.
Different definitions of ‘rural’ and of aspects of disadvantage can alsomake it frustratingly hard to agree about the facts. Thankfully, there is now an official definition of rural, but much research pre-dates this andsome organisations have been slow to apply the definition to theirdatasets. For example, no analysis using this definition has yet beenundertaken of the government’s data on households below averageincome, which is widely used to measure levels of poverty.
One of the most significant evidential gaps is the paucity of rural findings in evaluations that assess the extent to which policies to tackledisadvantage are operating successfully. To take one example, we know very little about the rural impacts of the New Deal programmes,even though there are distinctive rural features, such as the nature ofemployment and limited transport opportunities, which could affect the impact of those programmes, especially in remoter areas.
If we are to be clear about the case and priorities for policy intervention,there is little doubt that compelling and robust evidence is needed.Equally, a stronger evaluatory basis is required to determine whetherexisting policies are sufficiently suited to local rural circumstances.In the coming months the Commission will, therefore, wish to discusshow best to develop the evidence base on rural disadvantage with arange of organisations who might help, as well as considering what it can do from within its own resources.
Rev Dr Stuart BurgessChairman of the Countryside Agency and Rural Advocate
CC32EvidenceSect1_AW 26/9/06 4:59 pm Page 3
CC32EvidenceSect1_AW 26/9/06 4:59 pm Page 4

Rural disadvantage Reviewing the evidence
Introduction
5
CC32EvidenceSect1_AW 26/9/06 4:59 pm Page 5
6 Rural disadvantage Reviewing the evidence
What is in this report?
This overview explores the difference living in a rural area makesto being ‘disadvantaged’. It pulls together existing contemporaryevidence on disadvantage in rural England and provides an assessmentof the wide range of social, economic and environmental causes ofdisadvantage. We also examine what the available information tells usabout how policy responses are working in rural areas.
The topics covered are based on our interpretation and analysis of theevidence of the most important issues relating to rural disadvantage,in line with our ambition to bring fresh insight to the subject.
We did not aim to undertake new surveys or commission new primaryresearch or statistical analysis. However, we have commissioned twonew pieces of work where there was clearly a gap. One is a DVD film,Hidden Voices, which shows people in rural areas talking about theirexperiences and views about disadvantage. This is attached to thisreport. The second new piece of evidence, comes from a questionnairesurvey of 1,000 people across rural England to examine their recognitionof, and their attitudes to, disadvantage. The results of this survey aresummarised in Chapter 161. Both the DVD film and the attitudinal surveyhave informed our approach and the findings have been usedthroughout the report.
This review is complemented by two accompanying reports. Ruraldisadvantage: Futures thinkpiece2 sets out thinking about disadvantageover the next few years in rural England and how disadvantage may bedifferent in the future. The second report, Rural disadvantage: Priorities for action, contains our recommendations for priorities for action totackle disadvantage, based both on our interpretation of the evidencecontained in this review and the futures review.
Why is a review needed? Both policy makers and service providers are increasingly required to take an evidence based approach. This review is intended to providea clear, accurate and objective assessment of evidence on ruraldisadvantage. A persuasive evidence base is needed to inform policymakers about where action is needed and also to assist them in deciding how best to act.
There is a body of research evidence on rural disadvantage from the1970’s onwards, by academics4, research institutes such as JosephRowntree Foundation and the Rural Evidence Research Centre, interestgroups and others. In particular, both the Rural DevelopmentCommission and the Countryside Agency commissioned research on the broad theme of rural disadvantage5 and on specific aspects of disadvantage6. However, some of this research is now becomingincreasingly dated and it is not clear the extent to which the findings arestill relevant today. Similarly, some of the research has been undertakenin other areas of rural Britain and it is likely that some of the findingswould not hold for rural England, particularly given the recent changes in a wide range of policies and policy making structures (including theestablishment, for example, of the Scottish Executive). There have alsobeen a number of changes more generally in society and so it is timelyto review knowledge on disadvantage in rural England.
“People in rural areas can facedisadvantage just as severe as in ourconurbations – low incomes, difficulty inaccessing good-quality public services,and poor transport links – leading tofeelings of isolation andpowerlessness.”3
1. The report of the survey to the Commission is also available on our website
2. The futures thinkpiece is a commissioned piece of work, produced by the Future Foundation
3. Department for Work and Pensions (2004)Opportunity for All. Sixth annual report
4. The most recent being Milbourne P (2004) RuralPoverty. Routledge
5. For example, Cloke P et. al. (1994) Lifestyles inRural England RDC18; Shucksmith Met. al. (1996) Disadvantage in rural areas RDC 29;and New Policy Institute (2002) Indicators of poverty and social exclusion in rural England 2002Countryside Agency CAX 117
6. For example, Countryside Agency (2003) RuralEconomies: Stepping stone to healthier futures
1CC32EvidenceSect1_AW 26/9/06 4:59 pm Page 6
7 Rural disadvantage Reviewing the evidence
In addition, it is clear that there are both conflicting research findingsand some poorly evidenced anecdotes. This review, therefore, attemptsto provide an accurate picture on where there is robust evidence,where there is little information and where there are widely held butun-evidenced beliefs.
The review also provides information that will be helpful to theCommission for Rural Communities itself, as tackling rural disadvantageis at the heart of our work. In particular, the review was undertaken toidentify research and knowledge gaps that need to be filled.
What is our approach?Our approach has been informed by responses we received to adiscussion document, Rural disadvantage: Our first thematic study, thatwe launched at the start of the study. A summary of the feedback wereceived is contained in our report Taking forward our study on ruraldisadvantage. In addition, our approach has drawn on the knowledgeof disadvantage and rural policy among the staff of the Commission.At various times throughout the review, we have sought advice fromexternal experts and advisers7, and we have been informed by meetingsand workshops with key academics, think tanks, policy makers andservice providers aiming to tackle disadvantage.
Because of its multi-dimensional nature, a study of rural disadvantageis potentially huge and we have had to focus our efforts. Our approachcan be summarised as looking at:
• What is disadvantage in rural England? • Why does it occur?• And what is the policy response and is it working?
Whilst we have concentrated on examining the extent and nature of ruraldisadvantage, we have also examined briefly who is affected by, or atrisk of experiencing, disadvantage. We have included in our review,information on how disadvantage is experienced at certain key points inpeople’s lives particularly for younger people and older people8. Somelimited information is also pulled together to examine some of the issuesfaced by some groups of people in rural areas, notably women, peoplefrom black and minority ethnic groups, gypsies and travellers andmigrant workers. There are, of course, other groups that are particularlyat risk of disadvantage in rural areas that it has not been possible for usto include in this review.
We have also focused our efforts by taking a national perspective.We have drawn primarily on evidence where conclusions can be drawnthat apply either across the whole of rural England, or to other ruralareas with similar characteristics. Where possible, we have attemptedto explore broad geographical differences in rural disadvantage (forexample looking at the difference between sparse and less spare areas;market towns and smaller villages; and so on).
7. See Appendix 28. It should be noted though, that we do not cover
issues related to certain age groups in the main review of different forms of disadvantage and policyassessments such as child abuse (safety disadvantage)or teenage pregnancies (health disadvantage)
CC32EvidenceSect1_AW 26/9/06 4:59 pm Page 7
We have also looked specifically at national policy initiatives led bygovernment, rather than at more local level initiatives (such as the workof individual local authorities or other service providers); the work ofother sectors such as voluntary sector services; or the private sectorthrough Corporate Social Responsibility and so on. This is not to suggestthat the work of these groups is unimportant, but rather that the broadnature of rural disadvantage required us to take a focused approach.In addition, this more national focus has been preferable given the lackof understanding, at present, about the extent to which we can generalisefrom the findings of research undertaken in one local or case study areato apply more generally across rural England. In other words, there islittle evidence of the difference that local conditions make to theexistence of disadvantage or to the impact of national programmes.
The review examines policies that specifically aim to addressdisadvantage rather than assessing more general policies that aim toimprove social, economic or environmental conditions. This is not an easytask since policies can have many aims and impacts, both intended andunintended. We have, therefore, taken a steer from the large scale reviewsundertaken by the Social Exclusion Unit in its ‘Breaking the Cycle’ seriesin our policy mapping. To this we have added policies and initiatives thathave been introduced to alleviate disadvantage specifically in rural areas.
There is an increasing amount of information available aboutdisadvantage and social exclusion nationally and there is also quite alot of information about rural areas and rural issues in general. We haveexamined both bodies of evidence to review what is known aboutrural disadvantage.
Rural disadvantage
Rural Disadvantage
8 Rural disadvantage Reviewing the evidence
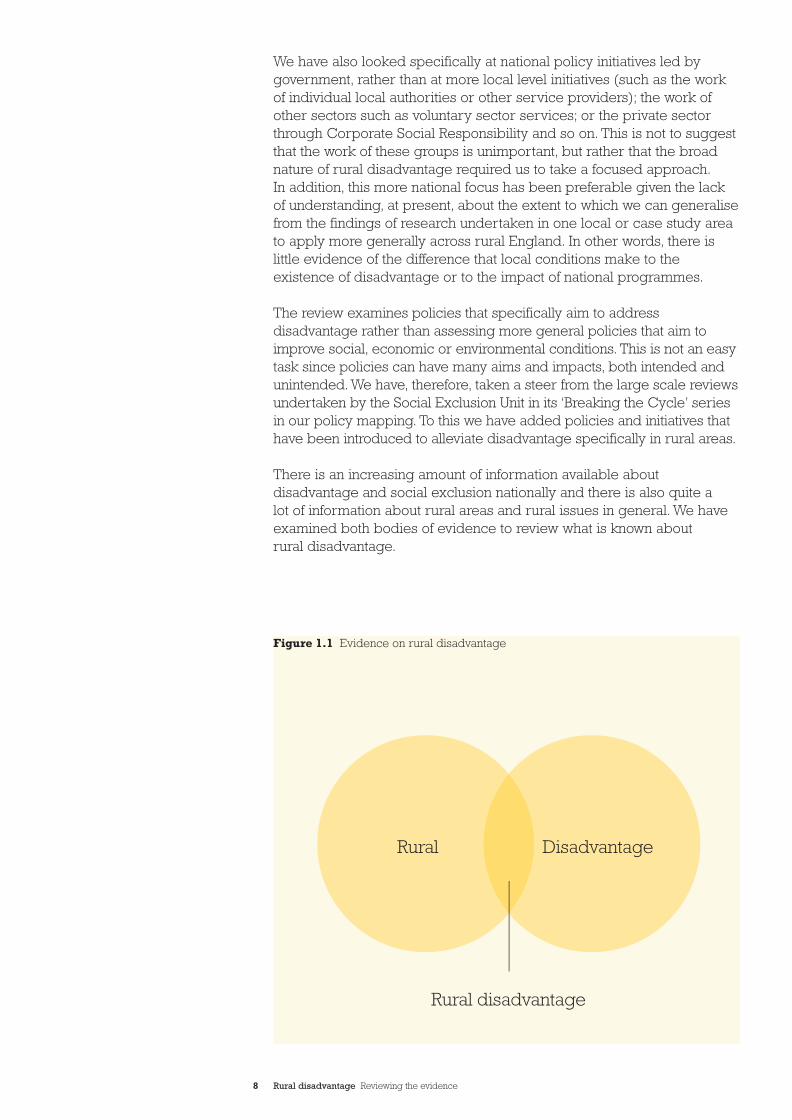
Figure 1.1 Evidence on rural disadvantage
CC32EvidenceSect1_AW 26/9/06 4:59 pm Page 8
9 Rural disadvantage Reviewing the evidence
What is evidence?Our focus has been on drawing evidence from contemporary researchreports and information – in other words research from the last few years.We have focused on research in the last five or so years and where this is lacking have drawn from older research. We have only been able toassess literature and information that has been published before early2006. There will, therefore, be information published more recently thatwe have been unable to include. We have also included both quantitativeand qualitative data – where this has been undertaken in a robust andtransparent way.
We have focused on information and research that applied to ruralEngland. Only where this has been lacking have we drawn fromevidence from other parts of rural Britain.
In reviewing evidence, we have relied mainly on readily available and published information – reports, research notes, journal articles,evaluations, assessments and reviews – published by governmentdepartments or agencies, research organisations, think-tanks, academiaand specialist organisations. Our approach has largely excludedunpublished information (often referred to as ‘grey’ literature). There will inevitably be some reports and information that we have not beenable to include in our review. Much of the evidence has been undertakenby academics and whilst we have followed an equally rigorous approach,we have attempted to provide a user-friendly format that is accessible to both experts and non-experts. We have also reviewed some morequalitative information in the form of films and DVDs. Whilst we havebeen unable to present these in the review, we have drawn on theircontent to inform our approach and explore some of the issues further.
The review has not specifically or comprehensively evaluated therange of possible solutions or examples of good practice to tackledisadvantage, although where the findings of research have pointedclearly to what works this has been noted.
More detail about our approach is included in Appendix 2.
© C
ount
rysi
de
Ag
ency
/ N
ick
Tur
ner
2006
CC32EvidenceSect1_AW 26/9/06 4:59 pm Page 9
10 Rural disadvantage Reviewing the evidence
What is our focus?The review is focused around the two key issues that research suggestsmakes the experience of disadvantage distinctly different in rural areascompared to urban:
• Access to opportunity – identifying the issues distinctive fordifferent types of participation. These are presented in the secondsection of the report. Our coverage of both issues and policiesreflects our judgement based on the evidence of their relativeimportance and their relevance to contemporary issues.
• Attitudes – exploring views and perceptions of disadvantagedpeople, of rural communities and of ‘policy-makers’ about ruraldisadvantage. The theme of attitudes is used to present informationof the way that in-built assumptions or principles about the waypolicy should operate, or be implemented, impacts on ruraldisadvantage. This is based on cross-cutting issues that affect all policy areas rather than specific policy areas, such as, theprinciples that policy needs performance targets and measures;and a focus on the most deprived wards. The section on attitudes to disadvantage presents these discussions.
What is disadvantage? Our definition of disadvantage is “an inability to participate fully insociety”9. It is about how individuals and households can participate ineither having, or doing, the things that the majority of people have, orcan do. We have taken a people-perspective in exploring the factors thatlead to inequalities in ability to participate, rather than information thatrelates to businesses or organisations.
It is clear that being disadvantaged is about much more than not havingmoney. Whilst poverty and financial disadvantage are clearly important,our understanding of disadvantage suggests that someone may haveadequate financial resources but be unable to participate in otheraspects of life, therefore also being disadvantaged.
Whilst the term disadvantage is generally associated with an ‘outcome’,in other words, an end state of not having something or being unable todo something, this does not rule out examining the causes or processesleading to disadvantage. Indeed, in academia this is generally termed‘social exclusion’ and we examine the exclusionary factors that lead torural disadvantage. We examine what ‘participating fully’ might mean in more detail in relation to a number of different spheres or types of‘participation’ in the section on access to opportunity.
Disadvantage is about someone’sinability to participate fully in society
9. Our definition of rural disadvantage seems to havebeen widely accepted in responses we received toour discussion document
CC32EvidenceSect1_AW 26/9/06 4:59 pm Page 10
11 Rural disadvantage Reviewing the evidence
Our definition of disadvantage chimes well with the recent governmentstatements about social exclusion:“social exclusion is life below the minimum acceptable level in a decentsociety. It is when people do not have the things that most of us take forgranted – for example, a decent home, a job and the ability to read andwrite. These are simple things perhaps, but hugely important. Socialinclusion means that opportunity is open to all and that no one livesbelow an acceptable level” 10.
Chapter 2 discusses our approach to defining disadvantage inmore depth.
What is rural?There is an agreed definition of rural and urban by government. Thisrecognises that 9.51m people live in rural England11 and broadly equatesto settlements of less than 10,000 people.
Where information is available using this new definition, we havepresented it here. However, this definition is relatively recent – onlyhaving been agreed in 2004 – and little information is available using thisnew definition. We have, therefore, had to draw on a variety of definitionsof rural, reliant on what has been used in published research. It is clearthat a range of different approaches have been used in the past andtherefore the information does not necessarily compare ‘like with like’.A further discussion of the variety of rural definitions used is containedin Appendix 1.
Rural and urban areas are clearly interdependent and many people’slives are lived across this ‘divide’, although our review focuses on thoseliving in rural areas.
10. Minister for Local Government, Phil Woolas (2005)statement in Westminster hall adjournment debate20 October 2005
11. Commission for Rural Communities (2005) The State of the Countryside 2005
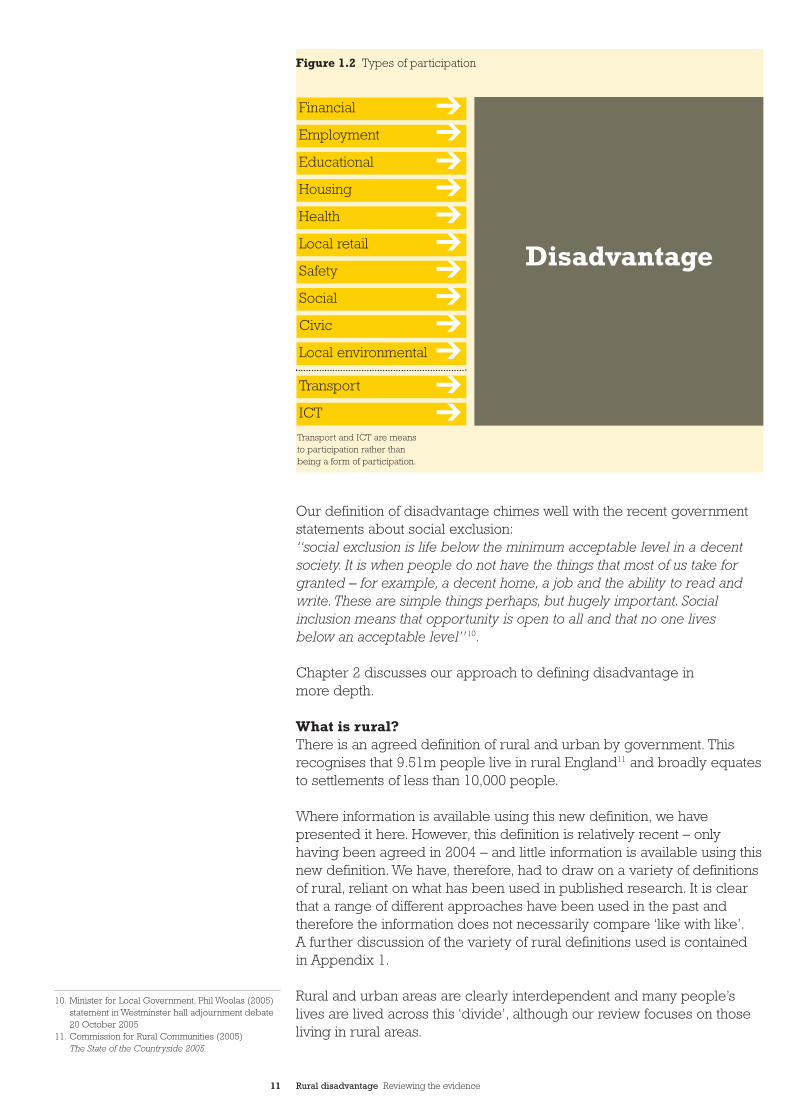
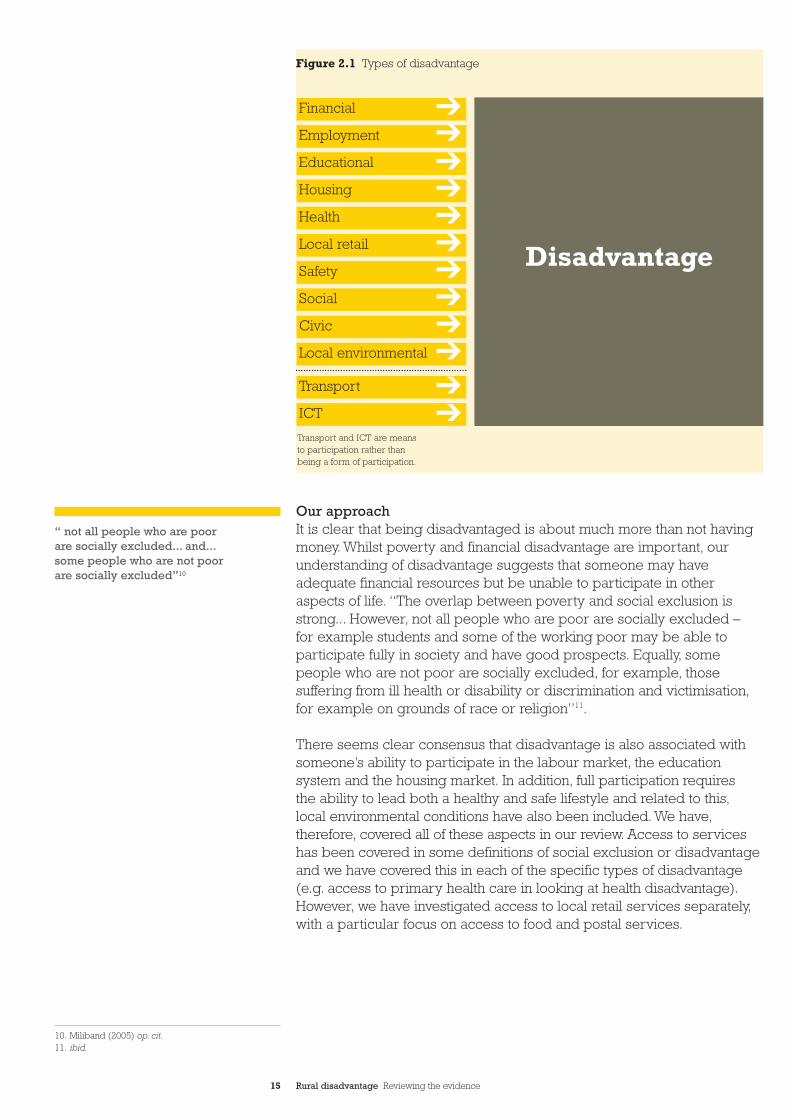
Transport and ICT are means to participation rather thanbeing a form of participation.
Financial
Employment
Educational
Housing
Health
Local retail
Safety
Social
Civic
Local environmental
Transport
ICT
Disadvantage
➔➔➔➔➔➔➔➔➔➔➔➔
Figure 1.2 Types of participation
CC32EvidenceSect1_AW 26/9/06 4:59 pm Page 11
12 Rural disadvantage Reviewing the evidence
What is meant by disadvantage?
This chapter sets out our thinking about what is meant by disadvantage.We present here our reasoning on the different forms of disadvantageexplored in the next section, rather than providing a comprehensivereview of the academic debates on the concepts of disadvantage andsocial exclusion. There are a few approaches from which we have takena steer, but it is clear that there is no one generally accepted definition of disadvantage.
Relative or absolute disadvantage?Our definition – the inability to participate fully in society – meansdisadvantage is about not being able to fit in and do the things that themajority of people do. In other words, it about being different from thesocially accepted ‘norms’ and is a relative concept. Nevertheless, thisdefinition also suggests an absolute level of participation, below whichanyone who is not able to participate fully is ‘disadvantaged’. To bedisadvantaged, therefore, suggests that someone is either ‘one side ofthe line or the other’ – able to participate or not. However, this is rathersimplistic. In practice, there is likely to be a grey area and a scale ofdisadvantage is perhaps a more useful concept, though this seems to be little developed.
Disadvantage and social exclusionThere is a close relationship between the terms ‘disadvantage’ and‘social exclusion’ and debates about the difference between them oftenseem to be based on the difference between outcome and process.Most academic research considers social exclusion to be the process bywhich someone becomes excluded from mainstream society, whereasdisadvantage is seen as more of an outcome. This means examining theway that society and organisations operate to exclude certain groups.Understanding how to remove such barriers cannot be understood fromevidence of inequalities in outcomes.
Government definitions of social exclusion imply more of an outcomeapproach. The definition of social exclusion used by the Prime Ministerwhen the Social Exclusion Unit was launched was: “social exclusion is a shorthand label for what can happen when individuals or areas sufferfrom a combination of linked problems such as unemployment, poorskills, low incomes, poor housing, high crime environments, bad healthand family breakdown”. This has not, however, restricted research intothe drivers of, and processes leading to, social exclusion.
Reviewing disadvantage requires, therefore, an understanding of thecauses of disadvantage as well as identifying the scale and nature of theexperience of disadvantage. In our review, we have included informationabout outcomes in a section called ‘what is the problem?’ and informationabout the possible processes and drivers in a section called ‘what arethe causes?’. It is worth noting here, that cause and effect are not alwayswell understood. As far as possible, we have divided the evidence underthese titles.
“disadvantage must be measured,at least in part, by reference to theprevailing norms of society”1
1. Miliband D. (2005) Social Exclusion: The next stepsforward. Speech to the LSE 29 Nov 2005
2CC32EvidenceSect1_AW 26/9/06 4:59 pm Page 12
13 Rural disadvantage Reviewing the evidence
Types of participationOur definition of disadvantage requires us to think about what the normsare across the full range of activities that most people undertake in theirday to day lives. What is full participation and what are the factors thatmight lead to less than full participation?
We have taken a steer from a number of approaches which can broadlybe divided into theoretical, research based approaches and morestatistical approaches.
Research approachesDifferent forms of participation have been identified in a number ofacademic discussions and research reports. Social exclusion has beendescribed as a “multi-faceted concept, embracing lack of, or limitedparticipation in all the domains of life – family formation, politicalparticipation, health and so on”2. Other key dimensions of participationhave been set out as (1) production (2) consumption (3) wealth (4)political activity and (5) social activity3.
Four main systems have also been suggested, which promote a senseof belonging in society and thus determine social exclusion for some.4
These can also be viewed as the means through which resources areallocated in society. These are: civic integration through a democraticsystem; economic integration through the labour market; socialintegration through the welfare system; and interpersonal integrationthrough social networks of family and friends. An alternative classificationof four systems on resource allocation were suggested as: privatesystems (representing market processes); state systems (bureaucraticand legal processes); voluntary systems (process of collective action);and family and friends networks (reciprocal and cultural processes)5.
A wide ranging review of social exclusion by the Social Exclusion Unit, in the Breaking the Cycle series7 reviewed the drivers of socialexclusion in relation to a number of domains: income and poverty;employment; education and skills; health; housing; transport; crime and the fear of crime; social support/social capital; and the impact of the neighbourhood.
Statistical approaches Statistics and indicators that attempt to measure disadvantage were alsoreviewed. There is, though, a danger that a lack of suitable data will leadto a situation where, ‘what matters is what we can measure and what wecan measure is what matters’. Nevertheless, indicators give an importantsteer on issues that are widely regarded as disadvantage or a risk factorin experiencing disadvantage.
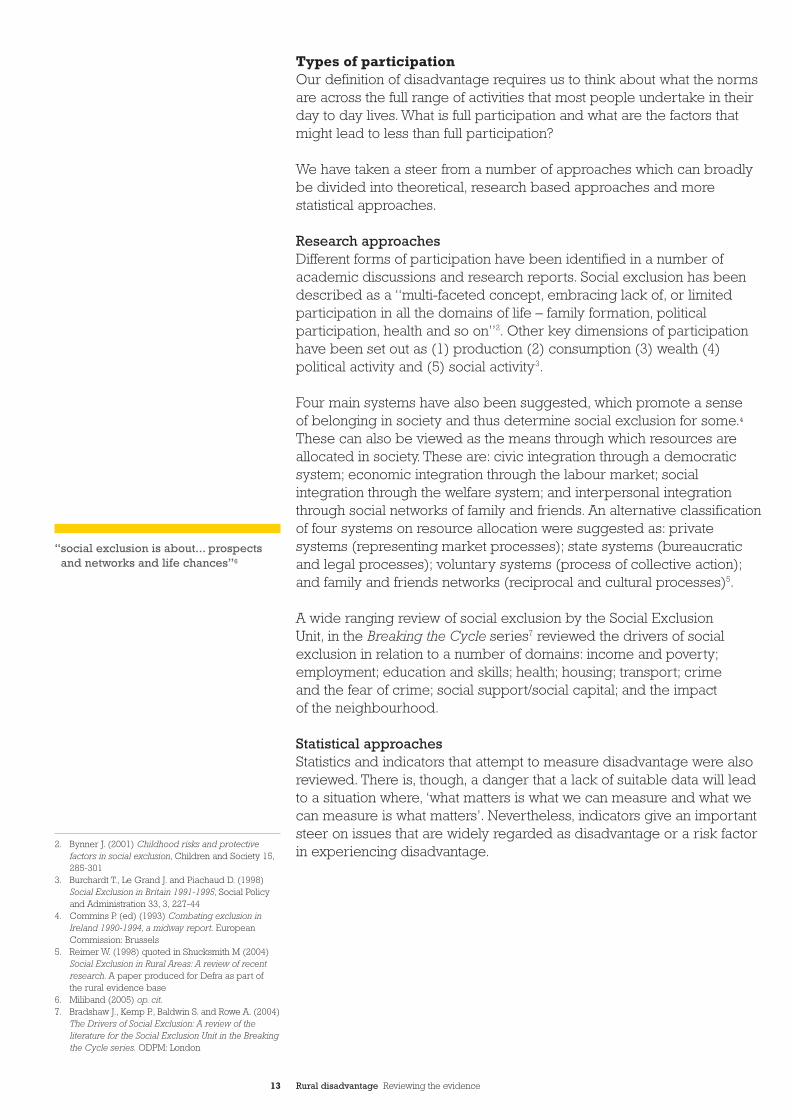
“social exclusion is about... prospectsand networks and life chances”6
2. Bynner J. (2001) Childhood risks and protectivefactors in social exclusion, Children and Society 15,285-301
3. Burchardt T., Le Grand J. and Piachaud D. (1998)Social Exclusion in Britain 1991-1995, Social Policyand Administration 33, 3, 227-44
4. Commins P. (ed) (1993) Combating exclusion inIreland 1990-1994, a midway report. EuropeanCommission: Brussels
5. Reimer W. (1998) quoted in Shucksmith M (2004)Social Exclusion in Rural Areas: A review of recentresearch. A paper produced for Defra as part of the rural evidence base
6. Miliband (2005) op. cit.7. Bradshaw J., Kemp P., Baldwin S. and Rowe A. (2004)
The Drivers of Social Exclusion: A review of theliterature for the Social Exclusion Unit in the Breakingthe Cycle series. ODPM: London
CC32EvidenceSect1_AW 26/9/06 4:59 pm Page 13
14 Rural disadvantage Reviewing the evidence
The ‘Opportunity for All’ indicators8 are the government’s headlinemeasures of poverty and social exclusion. They cover aspects ofemployment, health, education, housing and crime, either for people atparticular stages of their life (children, working age and older people)or for geographical communities. There are some indicators that suggesta minimum standard approach and are widely accepted as being aminimum below which no-one should live. In particular, the definition ofpoverty sets out a minimum, relative income of 60% of median income.
The Index of Multiple Deprivation (IMD) measures geographicalconcentrations of deprivation in relation to seven domains: income;employment and the involuntary exclusion from work; health anddisability, particularly premature death and poor quality of life dueto poor health; education, skills and training, particularly lack ofqualifications; barriers to access to housing and services; crime anddisorder; and living environment (covering indoor environment, suchas housing conditions and outdoor environment such as air quality).
Recent work by the Social Exclusion Unit to measure ‘deep’ social exclusionamongst working age adults, depending on whether they suffered from oneor more, or several of, ten disadvantages: unemployment, living in aworkless household, having no educational qualifications, living in socialhousing, living in overcrowded conditions, suffering poor mental health, orpoor health, living alone, lacking consumer durables, or enduring financialstress. This measure does, it seems, include a mix of risk and outcomefactors in the 10 ‘disadvantages’.
Some previous statistical work9 to try to develop indicators of ruraldisadvantage included domains or ‘bundles’ of indicators on: employmentaccess and quality, the vulnerability of employment, incomes, housingaccess and quality, service provision and physical isolation.
8. See the ‘Opportunity for All’ pages on theDepartment for Work and Pensions website for details (www.dwp.gov.uk/ofa)
9. Dunn J., Hodge I., Monk S. and Kiddle C. (1998)Developing Indicators of Rural Disadvantage.Rural Research Report 36. Rural DevelopmentCommission
© C
ount
rysi
de
Ag
ency
/ N
ick
Tur
ner
2006
CC32EvidenceSect1_AW 26/9/06 4:59 pm Page 14
Transport and ICT are means to participation rather thanbeing a form of participation.
Financial
Employment
Educational
Housing
Health
Local retail
Safety
Social
Civic
Local environmental
Transport
ICT
Disadvantage
➔➔➔➔➔➔➔➔➔➔➔➔
15 Rural disadvantage Reviewing the evidence
Our approachIt is clear that being disadvantaged is about much more than not havingmoney. Whilst poverty and financial disadvantage are important, ourunderstanding of disadvantage suggests that someone may haveadequate financial resources but be unable to participate in otheraspects of life. “The overlap between poverty and social exclusion isstrong... However, not all people who are poor are socially excluded –for example students and some of the working poor may be able toparticipate fully in society and have good prospects. Equally, somepeople who are not poor are socially excluded, for example, thosesuffering from ill health or disability or discrimination and victimisation,for example on grounds of race or religion”11.
There seems clear consensus that disadvantage is also associated withsomeone’s ability to participate in the labour market, the educationsystem and the housing market. In addition, full participation requiresthe ability to lead both a healthy and safe lifestyle and related to this,local environmental conditions have also been included. We have,therefore, covered all of these aspects in our review. Access to serviceshas been covered in some definitions of social exclusion or disadvantageand we have covered this in each of the specific types of disadvantage(e.g. access to primary health care in looking at health disadvantage).However, we have investigated access to local retail services separately,with a particular focus on access to food and postal services.
“ not all people who are poor are socially excluded... and...some people who are not poor are socially excluded”10
10. Miliband (2005) op. cit.11. ibid.
Figure 2.1 Types of disadvantage
CC32EvidenceSect1_AW 26/9/06 4:59 pm Page 15
16 Rural disadvantage Reviewing the evidence
In recent years, disadvantage has come to be associated with someone’sability to be involved in social and leisure activities and their level ofsocial interaction. We have included this in our review and termed it‘social disadvantage’. Increasingly, disadvantage has also been seen assomeone having a lack of power or ability to control the decisions thataffect them. We have, therefore, included the opportunity to influencelocal decision making in our review and have termed this ‘civicdisadvantage’. We have also reviewed disadvantage relating to accessto transport and ICT. Whilst these might not be seen as a direct form ofparticipation in society, both are key drivers or causes of disadvantageand we see these as a means to participation.
Issues raisedThere are three further issues that consideration of our definition ofdisadvantage raises, but it seems clear that there are no approaches,at present, which fully overcome these issues.
• Choice or opportunity?The definition of ‘inability to participate fully in society’ indicates,very much, an approach based on understanding the opportunitiesavailable to someone and the distribution of these opportunities.This has been termed by some as ‘life chances’. The role ofindividual choice, rather than inability, is very difficult to measurein the information that is currently available and many studies seemunable to take account of this issue.
• Who defines disadvantage? Research on disadvantage has found that people’s subjectiveassessment of their own disadvantage is often different to a moreobjective definition, especially in rural areas13. Again, there is littleinformation that attempts to explore this issue, although ‘BreadlineBritain’ and its follow up work do provide an assessment of widersociety assessments of basic requirements14.
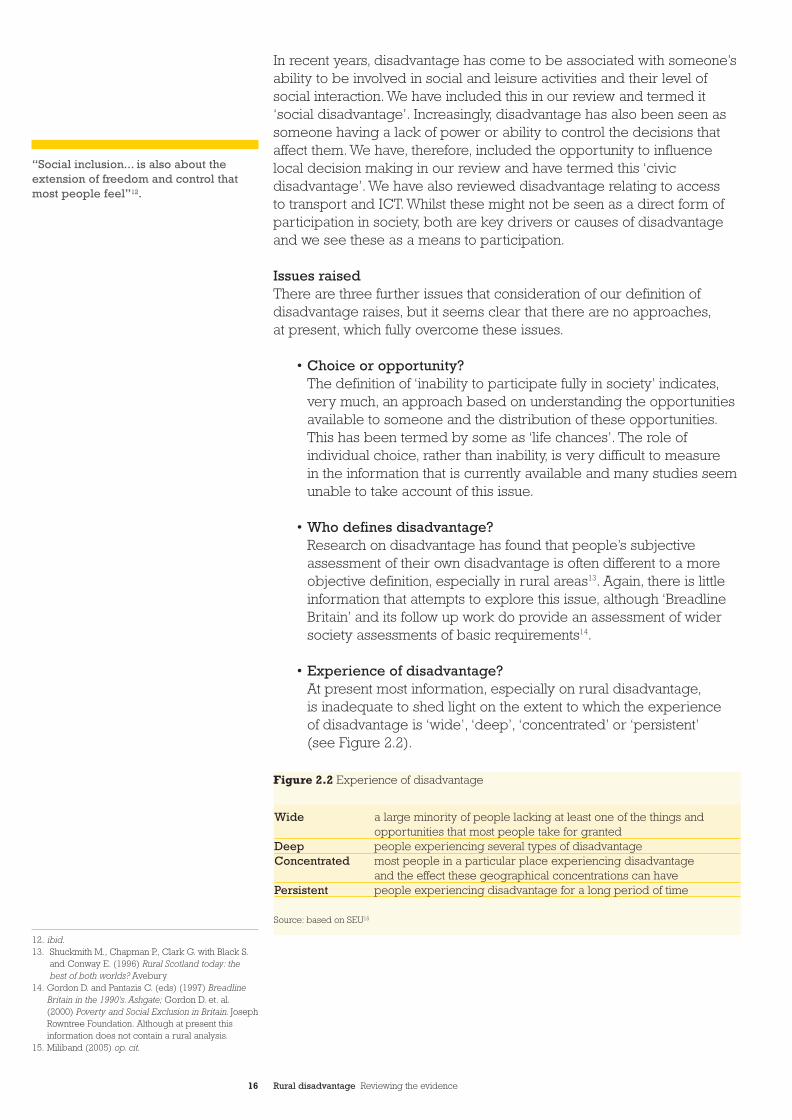
• Experience of disadvantage?At present most information, especially on rural disadvantage,is inadequate to shed light on the extent to which the experienceof disadvantage is ‘wide’, ‘deep’, ‘concentrated’ or ‘persistent’(see Figure 2.2).
Figure 2.2 Experience of disadvantage
Source: based on SEU15
Wide a large minority of people lacking at least one of the things andopportunities that most people take for granted
Deep people experiencing several types of disadvantage Concentrated most people in a particular place experiencing disadvantage
and the effect these geographical concentrations can havePersistent people experiencing disadvantage for a long period of time
“Social inclusion... is also about theextension of freedom and control thatmost people feel”12.
12. ibid.13. Shuckmith M., Chapman P., Clark G. with Black S.
and Conway E. (1996) Rural Scotland today: thebest of both worlds? Avebury
14. Gordon D. and Pantazis C. (eds) (1997) BreadlineBritain in the 1990’s. Ashgate; Gordon D. et. al.(2000) Poverty and Social Exclusion in Britain. JosephRowntree Foundation. Although at present thisinformation does not contain a rural analysis.
15. Miliband (2005) op. cit.
CC32EvidenceSect1_AW 26/9/06 4:59 pm Page 16
17 Rural disadvantage Reviewing the evidence
Even existing statistics to measure disadvantage, such as the Index of Multiple Deprivation, only measure the combination of a range ofproblems within one geographical area and do not measure whetherone person experiences one or more problems. There is a need tounderstand, in particular, the persistence of disadvantage – in otherwords, the extent to which it is experienced by someone for only a shortamount of time (i.e. a temporary condition), or for a long time or evenmost of someone’s life (i.e. an ‘enduring state’). Whilst measures seemto be well developed or widely used for persistent poverty or long-termunemployment, the persistence of other forms of disadvantage seemsless well researched.
© C
ount
rysi
de
Ag
ency
/ N
ick
Tur
ner
2006
CC32EvidenceSect1_AW 26/9/06 4:59 pm Page 17

Rural disadvantage Reviewing the evidence
Accessto opportunity
18
CC32EvidenceSect2_AW.qxd 26/9/06 5:01 pm Page 18

19 Rural Disadvantage Priorities for action
CC32EvidenceSect2_AW.qxd 26/9/06 5:01 pm Page 19
20 Rural disadvantage Reviewing the evidence
Financial disadvantage
This chapter examines financial disadvantage in the widest sense,looking both at the problems associated with poverty and low incomes in rural areas and at some of the other aspects of financial exclusion andneeds. Basic financial needs have been defined as income, access to fairrates of credit, savings and insurance as well as money managementskills and advice and information about financial services1. Those whoare unable to meet these basic needs might be considered at risk offinancial disadvantage. However, our focus is primarily on low incomes,as this is the most basic financial need of all. Low income is associatedwith an inability to afford the items, services and activities that themajority of the population consider to be necessities. There is a largebody of evidence that shows that low incomes are closely related to anumber of other inequalities, such as poor mental and physical health,poor housing conditions and poor educational achievement2.
Recent research3 has explored whether household expenditure is a moreaccurate way of measuring trends in poverty than income data. However,we focus on income given that this is the more widely accepteddefinition of poverty (where income is less than 60% of the median) andas there is only limited information on expenditure by rural households.
1.What is the problem?
Poverty and low incomesThe majority of people in rural areas have household incomes thatexceed the national average (if generally not by much), with those on lowincomes in rural areas often living dispersed amongst relative affluenceso their presence is less easily detected in average statistics. However,research on rural poverty in Britain over the last 25 years4 hasconsistently identified an average of around 20-25% of households livingin poverty, with significantly higher percentages in certain areas.
The most recent figures (Table 3.1) show that income poverty isexperienced by people in all types of rural areas but is most prevalent in the sparse rural areas (in particular in town, fringe and village areas)and in coastal areas. However, even in the most affluent area classification (less sparse hamlets and isolated dwellings) around one in six households has an income of less than 60% of the English median(£15,861)5. Across rural England as a whole 22% of households have anincome of less than 60% of the English median and rural areas containaround 16% of all of England’s households living in poverty.
Information from the government’s own dataset on Households BelowAverage Income (HBAI) is not currently available with the new ruraldefinition. However, previous analysis using the 2003/04 HBAI datasetusing an older district level definition,6 confirmed similar levels ofpoverty: 21% of people in remote rural districts and 15% in accessiblerural districts live in low income households. Overall, 18% of thepopulation of rural England (around 2.6m.) live on a low income.
1. National Consumer Council (2003) Basic FinancialNeeds: What are they and how can they be met?Seminar Report
2. Bradshaw, J., Kemp, P., Baldwin, S. and Rowe, A.(2004) The Drivers of Social Exclusion: A review ofthe literature for the Social Exclusion Unit in theBreaking the Cycle series. ODPM
3. Joseph Rowntree Foundation (2006) Poverty inBritain: What can we learn from household spending?
4. Milbourne P. (2004) Rural Poverty. Routledge5. Commission for Rural Communities (2006)
The State of the Countryside 20066. New Policy Institute (2005) website
www.poverty.org.uk using HBAI 2003/04.Website accessed March 2006
3
“...rural areas contain around 16% of allof England’s households living inpoverty”
CC32EvidenceSect2_AW.qxd 26/9/06 5:01 pm Page 20
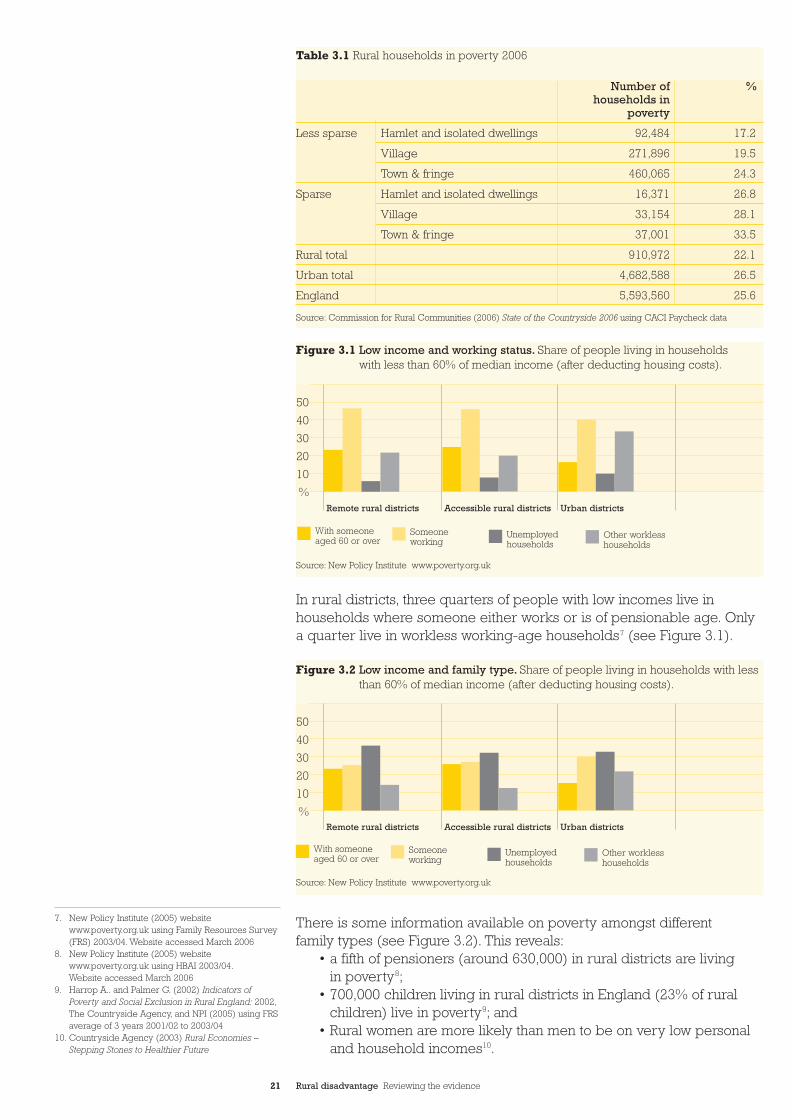
In rural districts, three quarters of people with low incomes live inhouseholds where someone either works or is of pensionable age. Onlya quarter live in workless working-age households7 (see Figure 3.1).
There is some information available on poverty amongst different family types (see Figure 3.2). This reveals:
• a fifth of pensioners (around 630,000) in rural districts are living in poverty8;
• 700,000 children living in rural districts in England (23% of ruralchildren) live in poverty9; and
• Rural women are more likely than men to be on very low personaland household incomes10.
21 Rural disadvantage Reviewing the evidence
Number of %households in
poverty
Less sparse Hamlet and isolated dwellings 92,484 17.2
Village 271,896 19.5
Town & fringe 460,065 24.3
Sparse Hamlet and isolated dwellings 16,371 26.8
Village 33,154 28.1
Town & fringe 37,001 33.5
Rural total 910,972 22.1
Urban total 4,682,588 26.5
England 5,593,560 25.6
Table 3.1 Rural households in poverty 2006
Source: Commission for Rural Communities (2006) State of the Countryside 2006 using CACI Paycheck data
Figure 3.1 Low income and working status. Share of people living in households with less than 60% of median income (after deducting housing costs).
7. New Policy Institute (2005) websitewww.poverty.org.uk using Family Resources Survey(FRS) 2003/04. Website accessed March 2006
8. New Policy Institute (2005) websitewww.poverty.org.uk using HBAI 2003/04.Website accessed March 2006
9. Harrop A.. and Palmer G. (2002) Indicators ofPoverty and Social Exclusion in Rural England: 2002,The Countryside Agency, and NPI (2005) using FRSaverage of 3 years 2001/02 to 2003/04
10. Countryside Agency (2003) Rural Economies –Stepping Stones to Healthier Future
50
40
30
20
10
%Remote rural districts Accessible rural districts Urban districts
With someone aged 60 or over
Someone working
Unemployed households
Other workless households
50
40
30
20
10
%Remote rural districts Accessible rural districts Urban districts
Source: New Policy Institute www.poverty.org.uk
Source: New Policy Institute www.poverty.org.uk
Figure 3.2 Low income and family type. Share of people living in households with lessthan 60% of median income (after deducting housing costs).
With someone aged 60 or over
Someone working
Unemployed households
Other workless households
CC32EvidenceSect2_AW.qxd 26/9/06 5:01 pm Page 21
22 Rural disadvantage Reviewing the evidence
Rural costsIncomes also need to be considered in the context of a household’soutgoings. In particular, whether or not a household owns their homeoutright or is having to pay a mortgage or rent will make a significantdifference to the impact of living on a low income. For that reason it isimportant to consider incomes both before and after housing costs.
Weekly expenditure is higher in rural areas across a standard bundle ofeveryday commodities and services. Rural residents, on average, spendmore than urban residents on heating fuel and power and on transport.For example, households in rural settlements of less than 3,000 peoplespend £70.62 on transport each week, compared with £45.36 inmetropolitan built-up areas11.
This data cannot tell us whether the differences in expenditure are due tohigher costs or to greater levels of disposable income, but if some of thehigher expenditure reflects higher local costs of goods and services (forexample for food and transport), then this would impact on lower incomerural residents12. Some research into older people’s spending is currentlyunderway, which might provide information on differences in expenditurebetween rural and urban residents, but at the time of writing this had notbeen reported13.
Persistent povertyAn analysis of data from the same households over several years found thatover the course of a year, broadly similar proportions of rural and urbanpeople moved into and out of poverty and that similar triggers operated inboth rural and non-rural areas14. This research found that the people mostat risk of income poverty in rural areas included elderly people livingalone, lone parents, families with three or more children and people wholacked skills or qualifications. Shorter-term poverty was associated withyoung people (under 25) and single people of working age, who had ahigh risk of entering poverty but were also quite likely to escape.
The same research also found that moving home from a rural to an urbanarea carried a fourfold increase in the risk of entering poverty, whilemoves in the opposite direction had hardly any effect. This was partlydue to a large proportion of rural-to-urban moves being made by youngpeople, who were generally at greater risk of income poverty, once theyhad left the parental home. Another possible explanation is that themovers may have had various difficulties before they moved (they were‘pushed’ into moving home), whereas those moving in the oppositedirection were ‘pulled’ by the attraction of the countryside. However, asthis was based on an analysis of people who were not in income povertyin the previous year, this is unlikely to be the major reason. The authorssuggested that, “rural areas are ‘exporting’ poor people who move tolook for work and that, without this movement, entry to poverty in ruralareas would be even higher”.
11. Commission for Rural Communities (2005) The State of the Countryside 2005
12. ibid.13. Research is being undertaken by DWP14. Countryside Agency (2003) Ways In and Out of Low
Income in Rural England, based on the BritishHousehold Panel Survey
“Rural residents, on average, spendmore than urban residents on heatingfuel and power and on transport”
CC32EvidenceSect2_AW.qxd 26/9/06 5:01 pm Page 22
23 Rural disadvantage Reviewing the evidence
There is some evidence that those suffering financial disadvantage areless likely to benefit from the strong community spirit that is often felt tobe a distinguishing feature of rural living. Our new attitudinal research15
found that those on a low income were less likely to feel part of the localcommunity – 20% of those earning under £15,000 disagreed with thestatement ‘I feel part of the local community’ compared to 15% of thetotal. Those struggling financially were also less likely to agree that thereis a strong community spirit around here, 32% of those finding it difficulton their present income agreed a lot (compared to 42% who were living comfortably) and were more likely to agree with the statement:‘If everyone would ‘mind their own business’ this area would be a muchbetter place’. 21% of those finding it difficult on their present incomeagreed a lot with this statement compared to 11% overall.
Financial exclusionFinancial disadvantage relates to more than just incomes and these otherproblems have been termed ‘financial exclusion’. “It can be a broadconcept relating to a lack of access to a range of financial services or anarrow concept reflecting particular circumstances such as: geographicalexclusion; exclusion on the grounds that charges and prices areprohibitively high; or exclusion from marketing efforts. Self exclusion is also important – where an individual believes there is little point inapplying for a financial product because they expect to be refused,sometimes because of a previous experience of refusal, because theyknow someone else who has been refused, or because of a belief that‘they don’t accept people who live round here, or who are like me’.”16
Those on low incomes are particularly at risk of other forms of financialdisadvantage. One survey suggests that just over 5% of households inremote rural areas and over 4% of households in accessible rural areasdo not have a bank account, totalling around 300,000 households17.Similarly, our new attitudinal survey18 found that 4% of people in ruralareas did not have a bank account, but those earning less than £10,000were far less likely to have any type of savings or investment account,only 43% had a savings account compared to 84% of those earning morethan £45,000. This supports other evidence which suggests that ruralpoverty is associated not only with low levels of income, but also limitedamounts of savings19. Less well off savers are disadvantaged by poorerinterest rates, fixed transaction costs and higher levels of tax20. People in poverty in 2000 tended to have debts, relative to their incomes,20 to 25% higher than those of the population as a whole21.
Lack of affordable credit can be a significant problem for people on low incomes, many of whom turn to alternative lenders for their creditneeds. Alternative lenders, such as pawnbrokers and doorstep lendersoften charge far higher rates of interest than mainstream credit providers.Those without bank accounts are more likely to use mail-ordercatalogues and other payment plans, which commit them to longrepayment periods at inflated interest rates. There is anecdotal evidenceto suggest that use of such schemes is higher in rural areas and thisseems plausible, as catalogues and products are delivered to people’shomes, distance from services and outlets is not an issue.
15. Brunwin T., Clemens S., Deakin G. and Inglis G.(2006) Attitudes to Rural Disadvantage:A Segmentation Analysis Report. A report by BMRB to the Commission for Rural Communities
16. HM Treasury (2004) Promoting Financial Inclusion17. New Policy Institute (2005) www.poverty.org.uk.
Based on family resources Survey 2003/04.website accessed March 2006
18. Brunwin T., Clemens S., Deakin G. and Inglis G.(2006) op. cit.
19. Milbourne P. (2004) op. cit.20. Burton D. (2001) Savings and Investment Behaviour
in Britain: More questions than answers,The Service Industries Journal, Vol.21, No.3 (July 2001), pp.130-146
21. Mitchell J., Mouratidis K. and Weale M. (2005)Poverty and Debt National Institute Discussion Paper
CC32EvidenceSect2_AW.qxd 26/9/06 5:01 pm Page 23
24 Rural disadvantage Reviewing the evidence
There is little evidence available on the extent of most forms of financialdisadvantage in rural areas and it has been suggested that it is difficult togain precise information about the geographical distribution of financialexclusion22. Some of the evidence available appears to indicate thatthose in rural areas are at less risk of financial exclusion (or at least,some elements of it) than those in urban areas. For example, research23
identified that those at greatest risk of arrears were young people on lowincomes and low-income families with children and that those in ruralareas were less likely than other families to be in arrears on bills, housingor credit commitments. However, a survey of Citizens Advice Bureauxclients in 2001 found that although rural clients owed less than theaverage for all CAB debt clients, their lower average income meant thattheir debt to income ratio was higher than the average for all debtclients24. In addition, an analysis of data from the Poverty and SocialExclusion Survey suggests that for those aged under 60, being in debt ismost common in the larger cities and towns and in the most rural areas25.
Research was undertaken in 2001 into the nature of financial exclusion in two case study areas, Suffolk and North Lancashire26. Among thefindings were:• there was a sharp generation divide in access to credit with younger
people more likely to borrow, while older residents prefered to savefirst;
• due to the culture of shame, residents were unlikely to confess toindebtedness;
• there was no evidence of any activity by loansharks and there was onlyone reported case of moneylenders being used; and
• the local Citizens Advice Bureaux reported rapid increases in moneyand debt advice enquiries during the last few years.
2.What are the causes?
Low incomeAn overview of recent research27 identified a range of causes of lowincomes in rural areas including low pay, inadequate pensions, poverty inself-employment and lower levels of benefit uptake. Each of these factorsis discussed in more detail below. Other aspects of some issues such asthe link between low pay and the nature of rural employment and self-employment are covered in the employment chapter.
Low pay has been suggested as ‘the single most important factor in thepoverty status’ of non-pensioner rural households28. However, otherresearch29 found that few of those on low income in rural areas are lowpaid and that detachment from the labour market is, in fact, a moresignificant factor in rural low incomes. This study found that 41% of thoseof working age on low incomes in rural areas are outside the labourmarket (e.g. the long-term sick or family carers).
Low payThirty-one out of the 50 English local authority areas with the lowest localwages in 2002 were rural30. Many of the areas with the highest proportionsof low-paid workers are in rural labour markets outside of the South East.The highest rates of low pay are found in Cornwall and parts of the SouthWest, parts of East Anglia, Lincolnshire, Humberside and parts of North
22. H.M. Treasury (2004) op. cit.23. Kempson E., McKay S., and Willitts M. (2004)
Characteristics of Families in Debt and the Nature of Indebtedness, Department for Work andPensions, Research Report No. 211
24. Citizens Advice (2003) In Too Deep – CAB clientsexperience of debt
25. McKay S. and Collard S. (2006) Debt and FinancialExclusion in Poverty and Social Exclusion in Britain:The millennium survey Edited by Christina Pantazis,David Gordon and Ruth Levitas
26. Dayson K., Paterson B. and Conaty P. (2001)Investing in People and Land: Sowing the seeds for rural regeneration
27. Shucksmith M. (2000) Exclusive Countryside? Socialinclusion and regeneration in rural areas, JosephRowntree Foundation
28. McLaughlin B.P. (1986) The Rhetoric and the Realityof Rural Deprivation, Journal of Rural Studies, 2,pp.291-307
29. Chapman P., Phimister E., Shucksmith M., Upward R.and Vera-Toscano E. (1998) Poverty and Exclusion inRural Britain: The dynamics of low income andemployment. Joseph Rowntree Foundation
30. Countryside Agency (2003) Rural Economies –Stepping Stones to Healthier Futures.
CC32EvidenceSect2_AW.qxd 26/9/06 5:01 pm Page 24
25 Rural disadvantage Reviewing the evidence
East England31. Recent analysis32 found that the median annual salary forthose working in rural workplaces was £17,934 compared to a medianannual salary of £20,523 for those employed in urban workplaces. Wagespaid by businesses operating in rural areas continue to lag behind thosepaid by businesses in mixed and urban areas33.
There appear to be different factors behind moves into and out ofpoverty in rural and non-rural areas34. The incidence of persistentunemployment is less, but the incidence of low pay is greater in ruralthan non-rural areas. The escape rate from low pay is notably lower forthose employed in small workplaces (which tend to dominate rurallabour markets). While unemployed men in rural areas seem more ableto move into higher paid employment than those in non-rural areas, theopposite is the case for unemployed women.
31. Sunley, P. and Martin, R. (2000) The Geographies of the National Minimum Wage in Environment andPlanning A 2000, volume 32, pages 1735-1758
32. Using data from the Annual Survey of Hours andEarnings (2005) (weighted to take account of ruralpopulation characteristics)
33. Commission for Rural Communities (2005) op. cit.34. Chapman P., Phimister E., Shucksmith M., Upward R.
and Vera-Toscano E. (1998) op. cit.
Individual characteristics
(a) Female 58.5 60.8 63.8
(b) Young (16-24) 24.9 26.9 26.1
(c) EducationNo qualifications 27.0 29.3 31.7O-levels and equivalent 35.9 41.4 38.0A-levels and equivilent 11.0 13.8 11.5Nursing and other higher qualifications 22.0 12.5 14.4First degree, teaching, higher degree 4.0 2.9 4.4
(d) Average household income (£) 7,433 8,794 8,061
(e) Has access to car (waves 3-8 only)Yes 73.3 69.2 54.6No 13.8 15.7 25.0Can’t drive 12.9 15.1 2.04
Labour market characteristics
(f) IndustryAgriculture, forestry and fishing 3.4 4.4 1.2Energy and water supply industries 0.2 0.5 0.5Extraction/manufacture of metals, etc 1.0 2.8 2.1Metal goods, engineering, etc 4.3 6.5 6.9Other manufacturing industries 14.3 10.9 11.7Construction 3.7 1.6 2.6Distribution, hotels, etc 34.6 32.9 34.2Transport and communication 5.9 6.2 5.8Banking, finance, insurance, etc 4.7 6.6 7.5Other services 27.8 27.5 27.5
(g) Under 10 employed at workplace 39.3 23.8 30.1
(h) Average hourly wage (£) 2.91 3.08 3.01
(i) Average weekly hours (hours) 32.5 31.3 31.1
Remote Accessible UrbanRural Rural
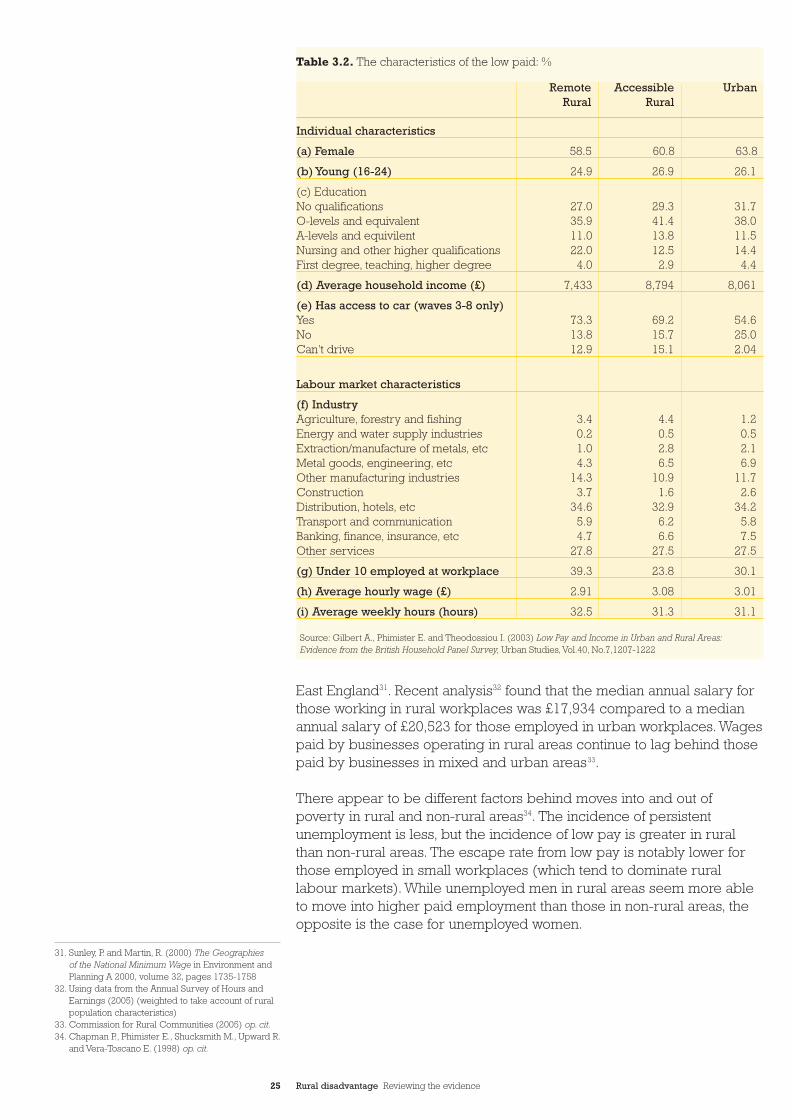
Table 3.2. The characteristics of the low paid: %
Source: Gilbert A., Phimister E. and Theodossiou I. (2003) Low Pay and Income in Urban and Rural Areas:Evidence from the British Household Panel Survey, Urban Studies, Vol.40, No.7,1207-1222
CC32EvidenceSect2_AW.qxd 26/9/06 5:01 pm Page 25
26 Rural disadvantage Reviewing the evidence
The strong link between low pay and low incomes in rural areas is partlydue to the type and nature of jobs available. Low pay is particularlyconcentrated in businesses with few employees, in certain occupations,for those in part-time and seasonable jobs and in workplaces withoutunions or collective bargaining coverage, all of which are significant inrural areas35. Research also suggests that wage mobility in rural areasmay be lower than elsewhere due to limited training opportunities,career progression and job choice. Restrictions on job mobility are likelyto give rural employers greater power over wage setting and will tend to depress rural pay rates36.
Research on rural low pay for households between 1991 and 1998 andthe link between low pay and low incomes37 found that in all areas thosemost likely to be experiencing low pay are women, young workers,those with no qualifications and those living in a household with belowaverage income (see Table 3.2). Low paid workers are more likely towork in services (particularly distribution), be employed in workplaceswith fewer than 10 employees and work fewer hours on average thanother workers.
The same research also found that on average, pay is higher in accessiblerural areas than in urban areas, which in turn have higher pay than remote rural areas. Average wages in the remote rural areas were 16.8%lower than the urban average and even adjusting for the characteristicssuch as, age, gender and education, which may account for some of this difference, wages are still 10.8% lower in remote rural areas.
Other important findings are:• low pay was a more persistent state in remote rural areas than
elsewhere;• the extent of in-work poverty appeared to be greater in remote
rural areas;• workers on low pay were more concentrated in low-income
households in the remote rural sample, compared with the urban or accessible rural sample; and
• the percentage of remote rural individuals in low-incomehouseholds who are also self-employed was twice that of both the accessible rural and urban samples.
Recent research shows that poor productivity performance in rural areas, as manifested by increased incidence of low pay, is associatedwith low educational attainment levels38. In addition, higher than averagelevels of debt in the most rural areas, have also been attributed to lowrural wages39.
Poverty in self-employmentAlthough there are undoubtedly some self-employed people on very low incomes, it is hard to identify the extent of this problem as surveyinformation relating to self-employed earnings is less reliable than thaton the earnings of employees. Possible reasons for this unreliability40
include: missing information; under-recording of incomes of those relianton more than one source of income; and the greater opportunity fordeducting expenses from income under income tax rules. In addition,many people with varying incomes from self-employment maintain astandard of living that is greater than might be expected, by drawing
35. Gilbert A., Phimister E. and Theodossiou I. (2003)Low Pay and Income in Urban and Rural Areas:Evidence from the British Household Panel Survey,Urban Studies, Vol.40, No.7,1207-1222
36. Gilbert A., Phimister E. and Theodossiou I. (2001)The Potential Impact of the Minimum Wage in Rural Areas
37. Gilbert A., Phimister E. and Theodossiou I. (2003)op. cit.
38. Department of Environment, Food and Rural Affairs (2004) Determinants of Relative EconomicPerformance in Rural Areas
39. McKay S., and Collard S. (2006) op. cit.40. Countryside Agency (2001) Self-employment
in Rural England
CC32EvidenceSect2_AW.qxd 26/9/06 5:01 pm Page 26
27 Rural disadvantage Reviewing the evidence
on savings, using revolving credit or relying on help from relatives.Even allowing for these difficulties, the figures clearly indicate thatpoverty in self-employment is more common in rural areas, 22% of selfemployed people in rural areas are in poverty, compared to 8% in urbanareas41. Research42 has found that self-employed people with lowincomes (below 60% of the median) were disproportionately likely to bewomen over the age of retirement (especially pensioners living as acouple) and living in homes with a low Council Tax valuation. In terms oftheir businesses they were disproportionately likely to work part-time,have two or more jobs, to work as self-employed in their second job andto work alone or with just a business partner. They workeddisproportionately in the service industries, including education, healthand social services, private households and ‘other community’. However,few of the low-income self-employed lived in households that had a verylow income, as many of them had someone else in their household withan income. Even so, the proportion of self-employed people with nethousehold incomes below £150 a week was 8 times that found amongthose with higher earnings from self-employment. Thus, ‘while low-paidself-employment does not necessarily lead to poverty, it certainly seemsto increase the chances of it’.
Further information about self-employment can be found in theemployment disadvantage chapter.
Inadequate pensionsThere is evidence that the proportion of pensioners in long-term receiptof the Minimum Income Guarantee, is lower in rural than in urban areasdespite similar proportions experiencing low income43. This issue isexplored further below in the discussion on benefit take-up, but someresearch has also suggested that special efforts are required to reachpeople relying only on state pensions and unaware or unconvinced oftheir other entitlements44.
Lower levels of benefit take-upAs the majority of those with a low income in rural Britain experiencepoverty for relatively short spells, benefit take-up can play an importantrole in helping them to cope in the short-term. There is some evidencethat take-up of benefits in rural areas is lower than in urban areas as aresult of inaccessible advice and information services, differingperceptions of poverty and a culture of independence45.
A recent report46 suggested that take-up rates of benefits for older peopleare lower in rural than in metropolitan areas, but noted that official datadoes not permit such analysis. Older people living in rural areas wereidentified as one of the groups experiencing specific barriers to the take-up of benefit entitlements particularly due to transport difficulties.Whilst this information applies specifically to pensioners and take-up of entitlements amongst pensioners is generally lower than amongst thepopulation as a whole, it seems reasonable to assume that the findingsabout the barriers faced and the lower take-up rates could also apply to the rest of the rural population. The report also suggested that ruralpensioners’ lack of information may be due to their limited contact withservice providers. Many rural pensioners only meet with a GP or districtnurse, “whose awareness of benefits may be limited and who may havelittle time available to discuss such issues with pensioners”.
41. Department of Environment, Food and Rural Affairs(2004) Rural Strategy 2004
42. Countryside Agency (2001) op. cit.43. Harrop A. and Palmer G. (2003) Indicators of
Poverty and Social Exclusion in Rural England 2002.The Countryside Agency.
44. Shucksmith M. (2000) op. cit.45. Shucksmith M. (2000) op. cit.46. National Audit Office (2002) Tackling Pensioner
Poverty: Encouraging take-up of entitlements
“22% of self employed people in ruralareas are in poverty, compared to 8% in urban areas”
CC32EvidenceSect2_AW.qxd 26/9/06 5:01 pm Page 27
28 Rural disadvantage Reviewing the evidence
The report recommended that the Department for Work and Pensions(DWP) should continue its research to understand the barriers to take-upamongst particular sub-groups, including pensioners living in ruralareas. However, to date, DWP has not published any research on this.
There is also evidence that rural people may be less likely to identifythemselves as unemployed. For example, research into two contrastinglabour markets in Suffolk and Lincolnshire47 found that many of theunemployed people surveyed did not register as unemployed, butpreferred to get by using various, often individual, coping strategies.
Evidence on the patterns of benefit take-up in Scotland suggests that apparent differences between urban and rural areas are mainlyattributable to the differences between affluent and poor areas, with take-up generally being lower in more affluent areas48. It is not clearwhether the same findings would apply in England, but it is clear that a similar analysis is needed for England to understand better the extentto which non take-up of benefits is a problem in rural areas.
Other aspects of financial disadvantageThe limited opportunities for access to basic financial services and to advice and information are likely to be particularly significant causesof other aspects of financial disadvantage in rural areas.
The evidence on access to basic financial services in rural areas is mixed.Research carried out in 2001 found that 23% of residents in rural areasobtain cash from a post office49 and another study found people on lowincomes are more likely to obtain their cash from a post office50. All basicbank account holders can access their money over the counter at postoffice branches although only current account holders with certain banksare able to do so51. In 2005, 85% of rural households lived within 2km of apost office52. Cash points are the single most accessible service in ruralareas, their availability has increased from 85% of households living within4km in 2004 to 90% of households in 2005. However, the accessibility ofbanks and building societies has reduced from 64% of households livingwithin 4km of one in 2004, to 60% of households in 200553.
Rural bank account holders have to rely more heavily on accessing theirmoney via cash machines and concern has been expressed at the trendtowards fee charging machines in rural areas. Evidence submitted byPost Office Ltd to a Treasury Committee inquiry on cash machinesindicated that only around 10% of cash machines located in rural postoffice branches are free, compared to around a third of those in urbanbranches54. Almost two-fifths (37%) of all rural cash machines charge forwithdrawing cash55 and in a recent survey56, almost a third of ruralresidents (31%) said they had difficulty getting to a non-charging cashmachine. Citizens Advice (CA) has recommended that Post OfficeLimited should enable all bank customers to withdraw their money froma post office providing greater convenience for bank customers andincreasing potential business at rural post office branches57.
47. Monk S., Hodge I. and Dunn J. (2000) SupportingRural Labour Markets, in Local Economy, Vol. 15,no.4, 302 –311
48. Bramley G., Lancaster S. and Gordon D. (2000)Benefit Take-up and the Geography of Poverty inScotland. Regional Studies, Vol. 34.6 pp 507-519
49. Financial Overcommitment research studyconducted for Citizens Advice by MORI, July 2003
50. ADAS and Moseley M. (2006) DisadvantagedGroups in Rural England: A survey of their access toservices. Defra: London. This found about 20% ofdisadvantaged groups use a local post office towithdraw cash occasionally
51. Herbert T. and Hopwood Road F. (2006) BankingBenefits: CAB evidence on payment of benefits intobank accounts
52. Commission for Rural Communities (2005) op. cit.53. Commission for Rural Communities (2005) op. cit.54. Treasury Committee (2005) Fifth Report: Cash
Machine Charges (HC 191 Session 2004-05)55. Herbert T. and Hopwood Road F. (2006) op. cit.56. Brunwin T., Clemens S., Deakin G. and Inglis G.
(2006) op. cit.57. Herbert T. and Hopwood Road F. (2006) op. cit.
“only around 10% of cash machineslocated in rural post office branches are free, compared to around a third ofthose in urban branches”
CC32EvidenceSect2_AW.qxd 26/9/06 5:01 pm Page 28
29 Rural disadvantage Reviewing the evidence
There appears to be very little evidence on access to financial adviceand information in rural areas, but evidence58 suggests that face-to-faceadvice is likely to be more effective than other forms of advice for thefinancially excluded and this type of advice is likely to be harder toaccess for some in rural areas.
There is also little rural specific information on the causes of other aspectsof financial disadvantage. However, information that is available aboutfinancial disadvantage more generally suggests some other causes offinancial disadvantage, which are likely to apply equally or to a greaterextent in rural areas, particularly cultural reasons. For example, onestudy59 identified that many people think that bank accounts are ‘not forthem’ and that the main factor influencing whether people use financialservices is the extent to which their family and friends use financialservices. Thus those rural people who have traditionally operated in acash-only economy and whose main links are with friends and family withsimilar attitudes are more likely to experience financial disadvantage.
3.What are the policies?
Measures to address low incomes
National Minimum Wage (NMW) The UK’s first National Minimum Wage was introduced in April 1999 andhas been increased several times since its introduction. The adult rate isnow £5.05 an hour, the rate for workers aged 18 to 21 is £4.25 an hourand for 16 to 17 year olds it is £3.00 per hour. The Low Pay Commissionmonitors the impact of the NMW, reviews its level and makes anyconsequent recommendations for change. At the recommendation of theLow Pay Commission, the adult rate will rise to £5.35 an hour fromOctober 2006 and the rate for 16 to 17 year olds to £3.30.
There is evidence60 to suggest that the NMW has increased the wages of around 6-7% of workers. However, various groups are excluded fromthe provision of the NMW, including the self-employed61, who make up a higher percentage of the workforce in rural than in urban areas.
All workers employed in agriculture in England and Wales are alsocovered by the Agricultural Wages Order. This is produced by theAgricultural Wages Board (AWB), which is an independent body that alsohas discretionary powers to decide other terms and conditions ofemployment, e.g. holidays and sick pay. Workers covered by this Orderare also covered by the provisions of the NMW but are generally paid athigher rates than the NMW. For example, from 1 October 2005 theStandard Worker rate in the Agricultural Wages Order is £5.58 an hour.Trainees are paid less than this and there are higher rates andallowances for those with additional skills or responsibilities.
Research undertaken prior to the introduction of the NMW62 using BritishHousehold Panel Survey data, found that the potential impacts, andparticularly the distributional effects, were likely to be greatest in remoterrural areas where labour markets were less integrated with urban ones.This research suggested that evaluation of the actual effects of the policywould be necessary to determine whether any job losses had beenexperienced. Such an evaluation does not seem to have been undertaken.
58. HM Treasury (2004) op. cit.59. HM Treasury (2004) op. cit.60. Social Exclusion Unit (2004) Breaking the Cycle:
Taking stock of progress and priorities for the future61. Other groups excluded from the NMW are
most company directors, workers under 16 yearsold, some apprentices and some trainees ongovernment-funded schemes; higher educationstudents on work experience; people living andworking within the family; friends and neighbours(jobs done under informal agreements); membersof the armed forces; prisoners; voluntary workers; residential members of religious and other communities
62. Gilbert,A., Phiminster E. and Theodossiou I.(2001) op. cit.
CC32EvidenceSect2_AW.qxd 26/9/06 5:01 pm Page 29
30 Rural disadvantage Reviewing the evidence
The Low Pay Commission’s latest report63 concludes that the NMW hasbeen a success and identifies that the main beneficiaries of the latestincrease are women, part-time workers, some minority ethnic groups,young people and those who have a work-limiting health problem. TheCommission’s report is based on evidence from a number of sourcesincluding eight visits to different urban and rural areas of the UK, but theonly specific rural references in the report relate to agriculture.
However, the report does make a number of points which are ofrelevance to rural areas, particularly in terms of those who may be at riskof losing out from the benefits of the NMW. It notes that awareness of theminimum wage remains low among some groups of vulnerable workersand that more could be done to tackle persistent non-compliantemployers and to encourage more workers to report underpayment.There are significant groups of vulnerable workers, such as migrantworkers, in rural areas. It is also possible that workers in small ruralworkplaces with few options for alternative employment would be lesswilling to report their employer for non-compliance for fear of reprisals.
Benefits and tax credits Child Tax Credit and Working Tax Credit were introduced in April 2003to replace Working Families Tax Credit and Disabled Person’s Tax Credit.Both are means tested benefits. Anyone who is responsible for a childmay be eligible for Child Tax Credit regardless of whether they are inwork or not. Working Tax Credit is for people in work. The intention isthat the NMW and the Working Tax Credit should, together, provide aguaranteed minimum income for people with low earnings.
By 2002, a fifth of all families with children were in receipt of WorkingFamilies Tax Credit, mostly receiving between £60 and £99 per week64.For 2003-04, the first year that the new system was in operation 79% ofthe families entitled to Child Tax Credit claimed it. There does notappear to be any details on the take-up or impact of tax credits in ruralareas. However, given that wages are lower than average and part-timeworking is more prevalent in rural areas, the Working Families Tax Creditis likely to have been particularly important in reducing rural poverty.
There has been an increase in the value of a range of benefits in the past few years, for example:
• Child Benefit (which has very high rates of take-up) has beenincreased for the first or eldest child by 25% in real terms since 1997;
• Income support rates for the under-11s have more than doubledin real terms since 1997;
• Minimum Income Guarantee (Pension Credit) and related taxand benefit reforms have contributed to a fall in the proportion ofpensioner households living in relative low-income (after housingcosts) - from 27% in 1996/97 to 21% in 2002/03.
There does not appear to have been any evaluation of the impact that increased levels of benefit have had on income disadvantage in rural areas.
63. Low Pay Commission (2005) National MinimumWage: Low Pay Commission report
64. Barnes M.. and Willitts M.. with Anderson T., ChaplinJ., Collins D., Groben S., Morris M., Noble J., PhilipsM. and Sneade I. (2004) Families and Children inBritain: Findings from the 2002 Families and ChildrenStudy (FACS), Department for Work and PensionsResearch Report 206
“There does not appear to have beenany evaluation of the impact thatincreased levels of benefit have had onincome disadvantage in rural areas”
CC32EvidenceSect2_AW.qxd 26/9/06 5:01 pm Page 30
31 Rural disadvantage Reviewing the evidence
Measures to address financial exclusionAnalysis suggests that financial exclusion is particularly concentrated in certain areas of the country, including parts of South and South-EastLondon, Manchester, Birmingham and Glasgow. The Treasury recentlyannounced a set of policy proposals65 to promote financial inclusion andsuggested that these should be focused in these (mainly urban) areas,at least initially.
The Treasury’s analysis also found that there is no overall correlationbetween levels of financial exclusion and a lack of services such asbanks, building societies, post offices and ATMs66, suggesting that thereduced availability of banks and building societies in rural areas will notnecessarily lead to increased financial exclusion. But inevitably, this focuson ‘financial exclusion hotspots’ will mean that those suffering financialexclusion in rural areas are less likely to benefit from the policy initiativesbeing introduced to promote financial inclusion.
A financial inclusion fund of £120m. over three years has been establishedto support initiatives to tackle financial exclusion. In particular, the fundaims to increase access to forms of affordable credit and to see asignificant increase in the capacity of free face-to-face money advice.
Access to banking services
Basic bank accounts Basic bank accounts have been designed specifically to address theneeds of the financially excluded. They provide essential financialservices such as enabling people to pay their bills by direct debit, pay in cheques and cash, make cash withdrawals 24 hours a day and receivebenefit payments. They are also specifically designed to minimise therisk of an unauthorised overdraft and should not, therefore, requireunnecessary credit check restrictions before they can be opened.
There does not appear to be any evaluation of the rural impacts ofintroducing basic bank accounts. However, there is some evidence aboutthe difficulty of opening bank accounts in rural areas. It is not possible toopen such accounts in a post office, so people in rural areas frequentlyhave to travel to the nearest town in order to open one67.
The Saving Gateway Two Saving Gateway pilot schemes have been introduced. These are being run in conjunction with the private sector and communityorganisations and are exploring the use of ‘matching’ to promote savingamong those who do not usually save. In the first set of five pilot areas,one of which was in Cumbria, the government matches the savings oflow income people of working age. People can save a maximum of £25 a month, up to a maximum of £375 and the government matches this £1 for £1 once the account has matured. The second Saving Gatewaypilot, which was launched in spring 2005, is testing the effect ofalternative match rates and monthly contribution limits, an initialendowment and a range of financial education support for savers.
65. HM Treasury (2004) op. cit.66. HM Treasury (2004) op. cit.67. Herbert T. and Hopwood Road F. (2006) op. cit.
CC32EvidenceSect2_AW.qxd 26/9/06 5:01 pm Page 31
32 Rural disadvantage Reviewing the evidence
According to the Treasury, around 22,000 Saving Gateway accounts havebeen opened68. An evaluation of the first pilot scheme69 found that 60% of participants said they feel more financially secure and 32% said theywere more likely to plan for their retirement as a result of participating in the Saving Gateway. Most were planning to save at least some of themoney they had saved in the Saving Gateway, even after the accountmatured and 40% said they intended to continue to save regularly. Thereis no information on the impact in rural areas, although it was reportedthat some participants in rural areas faced difficulties getting to a pilot bank branch.
Access to affordable credit
The Social Fund This provides a safety net of grants and interest-free loans (withpayments deducted direct from benefits) for the most vulnerable in timesof crisis. The Government has recently introduced reforms to the SocialFund, including lowering the highest loan repayment rates. Smallinterest-free ‘budgeting loans’ are available to help pay for a range ofitems, including furniture, household goods and home improvements.It is also possible to apply for crisis loans to help meet expenses in anemergency or disaster, or for grants for specific purposes such as tohelp buy things for a new baby. Certain eligibility criteria apply for all of these. The Social Fund is delivered by Jobcentre Plus.
In 2003-04 around four million applications to the Social Fund resulted in almost three million grants, loans and other payments, according to a recent assessment70. The research found that the Social Fund plays animportant role in helping people on low incomes cope with expensesthey cannot meet from regular income and in general, it is helping many people within the groups most in need. Many recipients havelongstanding illnesses or caring responsibilities.
The assessment raised concerns that some potentially eligible customers are not aware of the Fund because of its relatively low profile.For example, pensioners are less likely to use the Fund. Their surveyfound that only 47% of people on low incomes are aware of the SocialFund and many on low incomes are more likely to go to family andfriends for help or seek commercial credit, such as through mail-orderpurchases. This report does not provide any rural specific informationhowever, evidence from elsewhere on lower levels of awareness ofbenefit eligibility and a reluctance to seek help among the ruralpopulation suggests that take-up of the Social Fund could be low in rural areas. There is a need to investigate this issue further.
Credit Unions and Community Development Finance Institutions(CDFIs) Credit unions are not-for-profit, cooperative financial institutions whichprovide savings and loan facilities to their members. CDFIs are not-for-profit organisations providing lending and investment facilities at competitive rates in disadvantaged communities. CDFIs differ fromcredit unions in that they operate with a significant initial capital base,employ paid staff from the outset and offer a wider range of loans – both for enterprise and household needs.
68. HM Treasury (2006) Budget 2006 report69. Kempson E., Mckay S., Collard S. (2005)
Incentives to Save: Encouraging saving among low-income households
70. National Audit Office (2005) Helping those inFinancial Hardship: The running of the Social Fund
CC32EvidenceSect2_AW.qxd 26/9/06 5:01 pm Page 32
33 Rural disadvantage Reviewing the evidence
Although the main legislation governing how credit unions operate waspassed in 1979, there have been a number of initiatives in recent years toencourage their further development. The Financial Services and MarketsAct 2002 introduced the current regulatory framework. Since then theDepartment for Trade and Industry has overall policy responsibility forcredit unions and they are regulated by the Financial Services Authority(FSA). Their performance is monitored by the FSA and staff and volunteersinvolved in the running of the credit union must be approved by the FSA.The Government has established a growth fund for third sector lenders tosupport the work of credit unions and to enhance the coverage, capacityand sustainability of the sector. It has also tasked the Financial InclusionTaskforce, established in February 2005, with monitoring and evaluatingthe impact of initiatives to increase the provision of affordable loans and to consider how this could be further enhanced.
By 2001, it was estimated that there were at least 62 community, or ‘liveand work’ credit unions with 22 active steering groups in rural areas71.In December 2005 the Treasury published maps72 showing the locationof credit unions and CDFIs with the aim of ensuring that support to these organisations is appropriately targeted. These maps clearly showfew credit unions or CDFIs in rural areas relative to the numbers in urban areas.
There is some evidence to suggest that the establishment of creditunions in rural areas can be more difficult due to: the time and travelcosts for volunteers; the more diverse nature of the rural population; andthe scarcity of local banking facilities, which can make the collection andtransfer of cash difficult73. Other research74 has found that rural creditunions require significant organisational capacity and adequate capitalinvestment to be able to offer quality financial services, particularly topeople in isolated areas who face financial exclusion. Other factorsdeterring the wider introduction of credit unions in rural areas include ascarcity of the types of large employers around which many urban creditunions are based. This makes it harder to identify the ‘common bond’,which the legislation requires of a credit union membership.
Access to free face-to-face money advice
The Community Finance and Learning Initiative (CFLI) This partnership involves the Department for Education and Skills (DfES), HM Treasury, local community-based organisations, includingcommunity-based financial institutions, development trusts, credit unions,Citizen’s Advice Bureaux, social housing providers and others. The CFLI was aimed at reducing financial exclusion by encouraging the take-up of learning opportunities to raise skills and employability and the take-up of appropriate financial products.
Whilst there is no information about the impacts of the CFLI, a recentreport suggests that financial literacy education provision appears to be concentrated in urban centres, although a larger scale survey wouldbe required to confirm this finding75.
71. Jones P. (2001) From Small Acorns to Strong Oaks – a study into the development of credit unions in rural England
72. www.hmtreasury.gov.uk/documents/financial_services/financial_inclusion/financial_credit_union.cfm
73. Barker A. (1995) Credit Unions – Rural Initiatives:credit unions in rural areas – policy and practicalimplications
74. Jones P. (2005) Creating Wealth in the West Midlandsthrough Sustainable Credit Unions
75. Coben D., Dawes M. and Lee N. (2005) Financial Literacy Education and Skills for Life
CC32EvidenceSect2_AW.qxd 26/9/06 5:01 pm Page 33
34 Rural disadvantage Reviewing the evidence
Tackling overindebtedness In 2004, the Department of Trade and Industry (DTI) set out an actionplan to address the issue of problem debt. The aim was to “minimise the number of consumers who become over-indebted; and improve thesupport and processes for those who have fallen into debt”. A range of initiatives have been introduced and the Government produced aprogress report in August 2005.
There does not appear to be any overall analysis of the impact of thisAction Plan in rural areas. However, there are indications that thought isbeing given to the needs of rural areas when introducing some of themeasures included in the plan. In particular, the Department forConstitutional Affairs is looking at how best to provide free debt advice tovulnerable consumers e.g. the young, ethnic minorities and those withfinancial literacy problems in both rural and urban areas76.
Other related measures
Child Trust Funds The Child Trust Fund scheme was introduced in April 2005 with the aimof promoting saving and financial education. All children born on or after1st September 2002 will receive £250 to be invested in a long-termsavings and investment account. Children from lower income familiesreceive £500. A further payment of £250 or £500 will be made whenchildren reach age 7. The Government is consulting on whether furtherpayments should be made into Child Trust Fund accounts at secondaryschool age. At the age of 18 the fund will be available to the child andmust be transferred into a bank account in order to be accessed. In thefirst year of the scheme, nearly 1.5m accounts have been opened andthere are now over 110 official providers and distributors of Child TrustFunds77. There does not appear to be any evaluation specifically of thetake-up in rural areas.
Consumer Credit White Paper This was published in December 2003 and outlines plans to improve thefairness, transparency and efficiency of the consumer credit market. TheWhite Paper reforms cover a number of areas, including:
• licensing – making it easier for the regulator to identify rougetraders and tackle unfair practices, through new powers to obtaininformation from licensees; and
• Over-indebtedness – including delivery of a single gateway to freetelephone debt advice.
The White Paper has not yet been implemented. The Consumer CreditBill is currently (March 2006) going through the House of Lords.
76. Department for Trade and Industry (2005) Tackling Overindebtedness – Annual Report 2005
77. HM Treasury (2006) op. cit.
CC32EvidenceSect2_AW.qxd 26/9/06 5:01 pm Page 34
35 Rural disadvantage Reviewing the evidence
4. Summary
• Benefit take-up – There is some limited evidence to suggest thatlevels of benefit take-up are lower in rural areas but there is nocomprehensive or reliable picture of the situation. There is a strongcase for analysing patterns of benefit take-up in England, to clarifywhether take-up is different in rural areas and if it is lower, furtherresearch is needed to understand how this could be addressed.Such research could also usefully look at the take-up of the SocialFund and Tax Credits.
• Understanding the impacts of the National Minimum Wage –Given the strong link between low pay and low incomes in ruralareas, the National Minimum Wage (NMW) potentially plays animportant role in alleviating disadvantage. However, some evidenceindicates that vulnerable workers, such as migrant workers andthose working in small rural workplaces with few alternativesources of employment, are least likely to have benefited from theNMW, either through lack of awareness, or a reluctance to reportnon-compliant employers. It would be useful to investigate theimpacts of the NMW in rural areas, looking at who has benefitedand who hasn’t and its relationship with the AgriculturalWages Order.
• Addressing the needs of the low income self-employed –Although the extent of this problem is difficult to measure, it isknown that poverty in self-employment is more common in ruralareas and other evidence suggests that some rural people takeup self-employment through lack of other opportunities for paidemployment. Research into the links between self-employment andlow income is needed to understand the extent to which it is due todeliberate lifestyle choices (for example, ‘downsizing’ in exchangefor a better quality of life or willingness to live on a reduced incomein the short-term in the hope of better prospects in the longer-term), or reflects there being no alternative for paid employment.This research could also look at how best to support the self-employed on low incomes (e.g. in terms of access to benefits etc).
• Promoting financial inclusion in rural areas – Better evidenceis needed of the extent of wider forms of financial disadvantagein rural areas (e.g. bank account holding, levels of debt/savings,access to affordable credit and financial advice). This evidencecould be useful in making the case that the focus on exclusion‘hot spots’ should not overlook the needs of those on lowincomes elsewhere.
CC32EvidenceSect2_AW.qxd 26/9/06 5:01 pm Page 35
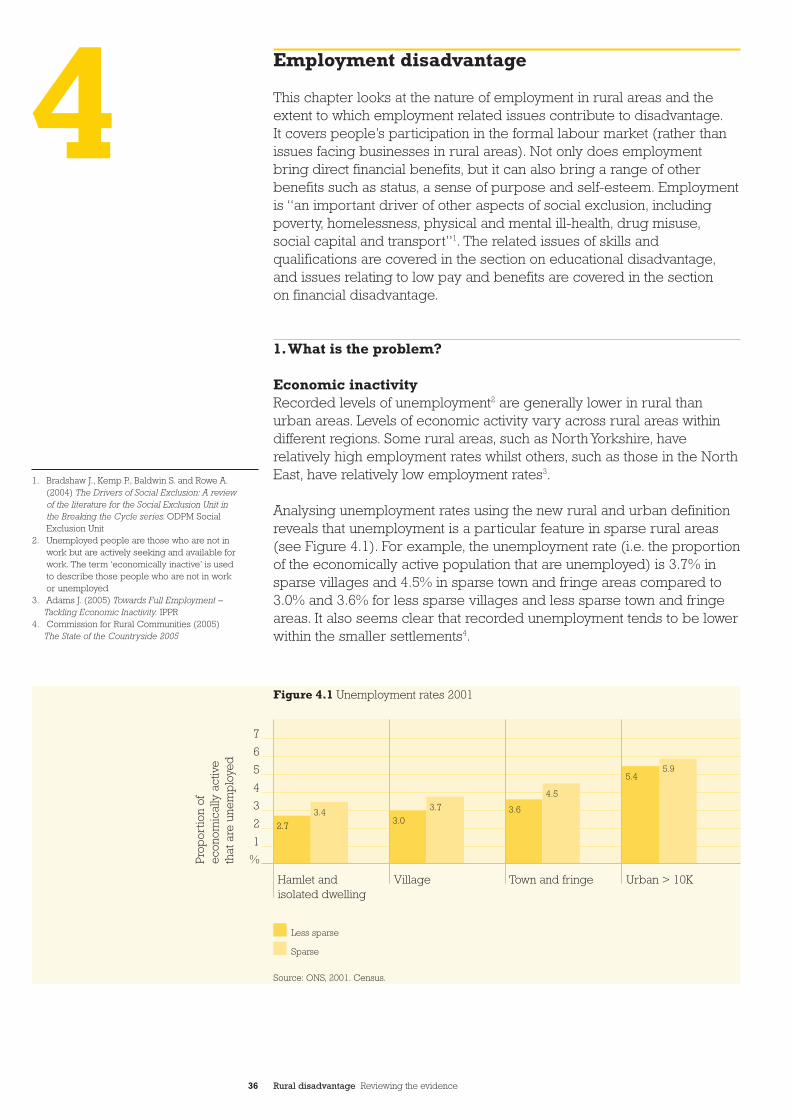
36 Rural disadvantage Reviewing the evidence
Employment disadvantage
This chapter looks at the nature of employment in rural areas and theextent to which employment related issues contribute to disadvantage.It covers people’s participation in the formal labour market (rather thanissues facing businesses in rural areas). Not only does employmentbring direct financial benefits, but it can also bring a range of otherbenefits such as status, a sense of purpose and self-esteem. Employmentis “an important driver of other aspects of social exclusion, includingpoverty, homelessness, physical and mental ill-health, drug misuse,social capital and transport”1. The related issues of skills andqualifications are covered in the section on educational disadvantage,and issues relating to low pay and benefits are covered in the sectionon financial disadvantage.
1.What is the problem?
Economic inactivity Recorded levels of unemployment2 are generally lower in rural thanurban areas. Levels of economic activity vary across rural areas withindifferent regions. Some rural areas, such as North Yorkshire, haverelatively high employment rates whilst others, such as those in the NorthEast, have relatively low employment rates3.
Analysing unemployment rates using the new rural and urban definitionreveals that unemployment is a particular feature in sparse rural areas(see Figure 4.1). For example, the unemployment rate (i.e. the proportionof the economically active population that are unemployed) is 3.7% insparse villages and 4.5% in sparse town and fringe areas compared to3.0% and 3.6% for less sparse villages and less sparse town and fringeareas. It also seems clear that recorded unemployment tends to be lowerwithin the smaller settlements4.
Figure 4.1 Unemployment rates 2001
7
6
5
4
3
2
1
%
Hamlet and Village Town and fringe Urban > 10K isolated dwelling
Less sparse
Sparse
Prop
ortio
n of
econ
omic
ally
act
ive
that
are
une
mp
loye
d
5.95.4
4.5
3.63.7
3.03.4
2.7
Source: ONS, 2001. Census.
1. Bradshaw J., Kemp P., Baldwin S. and Rowe A.(2004) The Drivers of Social Exclusion: A review of the literature for the Social Exclusion Unit in the Breaking the Cycle series. ODPM SocialExclusion Unit
2. Unemployed people are those who are not in work but are actively seeking and available forwork. The term ‘economically inactive’ is used to describe those people who are not in work or unemployed
3. Adams J. (2005) Towards Full Employment – Tackling Economic Inactivity. IPPR
4. Commission for Rural Communities (2005) The State of the Countryside 2005
4CC32EvidenceSect2_AW.qxd 26/9/06 5:01 pm Page 36
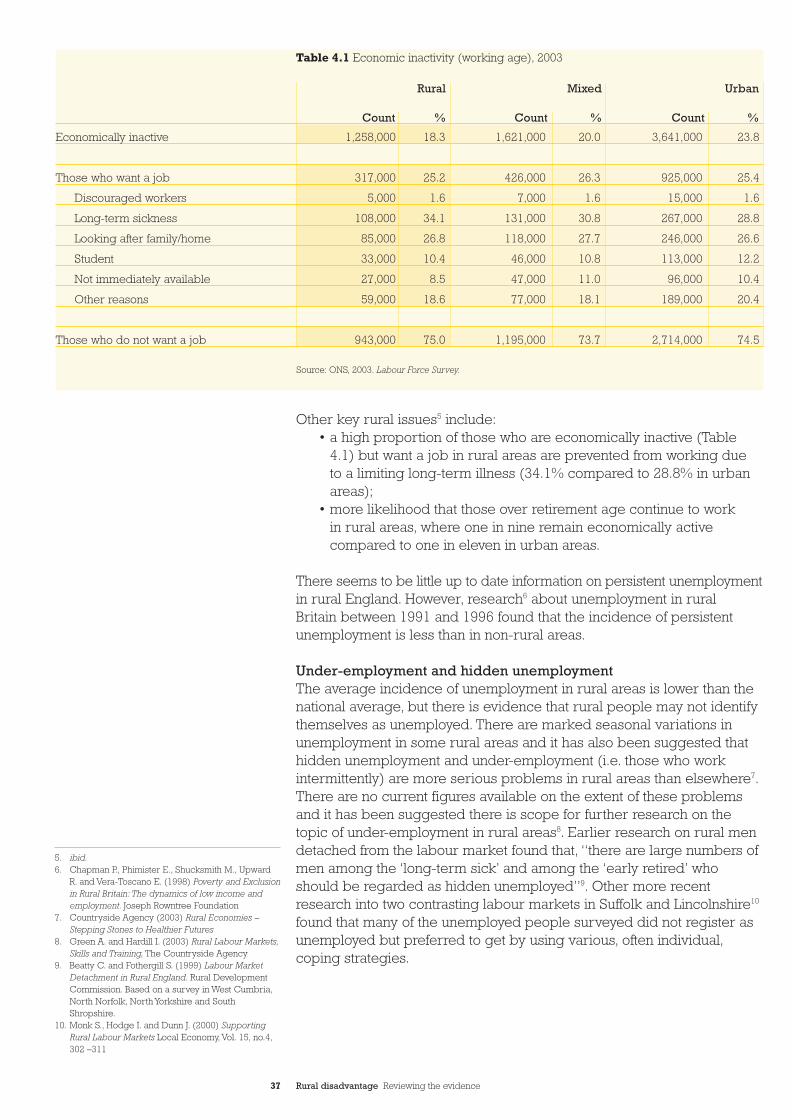
Economically inactive 1,258,000 18.3 1,621,000 20.0 3,641,000 23.8
Those who want a job 317,000 25.2 426,000 26.3 925,000 25.4
Discouraged workers 5,000 1.6 7,000 1.6 15,000 1.6
Long-term sickness 108,000 34.1 131,000 30.8 267,000 28.8
Looking after family/home 85,000 26.8 118,000 27.7 246,000 26.6
Student 33,000 10.4 46,000 10.8 113,000 12.2
Not immediately available 27,000 8.5 47,000 11.0 96,000 10.4
Other reasons 59,000 18.6 77,000 18.1 189,000 20.4
Those who do not want a job 943,000 75.0 1,195,000 73.7 2,714,000 74.5
Rural Mixed Urban
Count % Count % Count %
Table 4.1 Economic inactivity (working age), 2003
Source: ONS, 2003. Labour Force Survey.
37 Rural disadvantage Reviewing the evidence
Other key rural issues5 include:• a high proportion of those who are economically inactive (Table
4.1) but want a job in rural areas are prevented from working due to a limiting long-term illness (34.1% compared to 28.8% in urbanareas);
• more likelihood that those over retirement age continue to workin rural areas, where one in nine remain economically activecompared to one in eleven in urban areas.
There seems to be little up to date information on persistent unemploymentin rural England. However, research6 about unemployment in rural Britain between 1991 and 1996 found that the incidence of persistentunemployment is less than in non-rural areas.
Under-employment and hidden unemploymentThe average incidence of unemployment in rural areas is lower than thenational average, but there is evidence that rural people may not identifythemselves as unemployed. There are marked seasonal variations inunemployment in some rural areas and it has also been suggested thathidden unemployment and under-employment (i.e. those who workintermittently) are more serious problems in rural areas than elsewhere7.There are no current figures available on the extent of these problemsand it has been suggested there is scope for further research on thetopic of under-employment in rural areas8. Earlier research on rural mendetached from the labour market found that, “there are large numbers ofmen among the ‘long-term sick’ and among the ‘early retired’ whoshould be regarded as hidden unemployed”9. Other more recentresearch into two contrasting labour markets in Suffolk and Lincolnshire10
found that many of the unemployed people surveyed did not register asunemployed but preferred to get by using various, often individual,coping strategies.
5. ibid.6. Chapman P., Phimister E., Shucksmith M., Upward
R. and Vera-Toscano E. (1998) Poverty and Exclusion in Rural Britain: The dynamics of low income andemployment. Joseph Rowntree Foundation
7. Countryside Agency (2003) Rural Economies –Stepping Stones to Healthier Futures
8. Green A. and Hardill I. (2003) Rural Labour Markets,Skills and Training, The Countryside Agency
9. Beatty C. and Fothergill S. (1999) Labour MarketDetachment in Rural England. Rural DevelopmentCommission. Based on a survey in West Cumbria,North Norfolk, North Yorkshire and SouthShropshire.
10. Monk S., Hodge I. and Dunn J. (2000) SupportingRural Labour Markets Local Economy, Vol. 15, no.4,302 –311
CC32EvidenceSect2_AW.qxd 26/9/06 5:01 pm Page 37
38 Rural disadvantage Reviewing the evidence
Under-employment is also sometimes linked to pluriactivity, which isoften associated with casual employment, low wages and with limitedsustainability of businesses11. Rural households often rely on several jobs– part, full-time and self-employed – but it is not clear how much of this isfrom choice and how much as a result of a lack of opportunity for goodfull-time employment. There was a lot of research in the 1990s looking atpluriactivity in relation to the diversification of farming households butthere does not appear to have been much attention paid to this topicmore recently. Neither does the extent or implications of this for non-farming households appear to have been examined in any detail.
Part-time working is more common in rural than urban areas. This mayreflect a choice to work part-time for some but again, there is noevidence on whether it is a result of a lack of full-time job opportunitiesfor others. In some areas, part-time working is associated with seasonalemployment in agriculture or tourism.
Self-employmentSelf-employment is more common in sparse areas (for example, 26.1%of economically active people in sparse villages are self-employedcompared to 20.2% in less sparse villages) and the incidence of self-employment is generally higher in the smaller settlements. For example,the rate of self-employment is 35.8% in sparse hamlets and isolateddwellings compared to 13.4% in less sparse town and fringe areas. Thehigh levels of self-employment in the smallest settlements in sparse areas“may reflect reduced levels of alternative employment opportunities orincreased willingness to be entrepreneurial or indeed, the adoption ofspecific lifestyle choices”12.
Research13 shows that the archetypal self-employed person in a ruralarea is male, aged between 35 and 54, lives as part of a couple and isan owner occupier. However, there are some very vulnerable groupsamong the rural self-employed, including an estimated 75,000 on verylow earnings (who particularly include women and people aboveretirement age) and 230,000 (50%) who become self-employed fromunemployment or economic inactivity14. Research has found high levelsof poverty among self-employed people in rural areas (22% comparedto 8% in urban areas15), suggesting that some rural people may take up(or remain in) self-employment as they have no other opportunities forpaid employment. A more recent survey16 found that rural self-employedpeople in lower socio-economic groups were slightly more likely to wantto work for someone else (12% of D class) when compared to highersocio-economic groups (0% of A class). Although this trend was notas pronounced as in urban areas.
Most research, therefore, does not explain why people take-up self-employment in rural areas, although it does reveal that for some, runningtheir own business does not bring large financial rewards. The decisionto go into self-employment can be a response to a lack of suitable, wellpaid local jobs, difficulties in travelling to work, and the need to combineworking with caring responsibilities. Thus levels of self-employment,which are often regarded as an indicator of enterprise, may be as muchan indicator of poor choice of flexible, rewarded employment.
11. Green A. and Hardill I. (2003) op. cit.12. Commission for Rural Communities (2005) op. cit.13. Countryside Agency (2002) Self-employment
in rural England14. Countryside Agency (2003) op. cit.15. Department for Environment, Food and Rural Affairs
(2004) Rural Strategy 200416. Commission for Rural Communities (2006)
The State of the Countryside 2006.
“there are some very vulnerable groups among the rural self-employed,including an estimated 75,000 on very low earnings (who particularlyinclude women and people aboveretirement age)”
CC32EvidenceSect2_AW.qxd 26/9/06 5:01 pm Page 38
39 Rural disadvantage Reviewing the evidence
2.What are the causes?
Limited employment opportunitiesThere is greater disparity between the number of local jobs and theavailable local workforce in rural areas than there is in urban and mixedareas. Recent analysis17 found that over time choice in jobs has improvedmore for rural residents than urban residents but, on average, rural localauthorities still have fewer jobs per resident than urban local authorities.This is despite the fact that the proportion of the population of workingage18 is lower in rural areas19.
A number of studies have looked at access to employment opportunitiesin rural areas. One example20 found a range of disadvantagecharacteristics associated with employment in rural areas:
• seasonal/casual employment structures;• low wages;• a high proportion of jobs in the secondary labour market (often
semi-skilled and low paid);• a limited range of employment opportunities (both in terms of the
number of jobs available and the quality of employmentopportunities); and
• problems of mobility and accessibility.
More recently a review of literature relating to employment opportunitiesin rural areas21 identified the following issues:
• job choice tends to be restricted in rural areas with mismatchesbetween jobs and skills an important barrier to employment;
• reliance on informal networks to find a job is even more importantin rural areas than it is in urban, meaning that people with poorreputations (whether justified or not) are more likely to find it hardto get work; and
• rural public transport, if it exists, is often perceived as inappropriateand unreliable for work journeys.
Poor quality jobsThere is some evidence to suggest that it is the quality, rather than thequantity, of jobs available in rural areas that is a problem for some.
The employment profile of most rural areas largely mirrors that of urbanareas, though there are some distinctive rural characteristics22. Manyrural areas are weaker in the higher value and knowledge economyjobs, with proportionately greater employment in agriculture,construction and manufacturing. The agricultural sector remains animportant employer within the sparse areas, where it accounts for onein five jobs in the smallest settlements, although the absolute numbersof people involved are low. Employment in hotels and restaurants isalso important in sparse areas whilst the real estate and financial sectorsprovide a greater proportion of employment in less sparse areas.However, it should be noted that this data is based on place of residencenot place of workplace, so includes those who work in urban areas butlive in rural areas.
17. Commission for Rural Communities (2006) Choice of Jobs in Rural England, Rural Economies –Bulletin 1
18. Working age is defined as males (16-64),females (16-59)
19. Commission for Rural Communities (2005) op. cit.20. Institute for Employment Research (1997)
Employment Constraints and Opportunities in Rural Areas, Bulletin No. 35
21. Gilbert A., Phimister E. and Theodossiou I. (2003)Low Pay and Income in Urban and Rural Areas:Evidence from the British Household Panel Survey,Urban Studies, Vol.40, No.7,1207-1222
22. Commission for Rural Communities (2005) op. cit.
CC32EvidenceSect2_AW.qxd 26/9/06 5:01 pm Page 39
40 Rural disadvantage Reviewing the evidence
There are noticeable differences in the types of jobs held by residents of urban and rural areas and between residents of different types of ruralareas23. A higher proportion of residents of less sparse areas are employedas managers and senior officials, professionals and associated professionaland technical occupations than in urban or sparse areas. In the smallersettlements in sparse areas (villages, hamlets and isolated dwellings),a higher proportion of residents are employed in skilled trades or inelementary occupations for example, farm workers or constructionlabourers than in the less sparse equivalents.
A recent review of the existing knowledge on rural labour markets,skills and training24 identified that although there had been an increase in the share of jobs in rural areas, there were some concerns that muchof the growth had been in the ‘wrong kind of jobs’. The reasons givenfor this are:
• knowledge intensive sectors and occupations remain under-represented in rural areas compared to the national average;
• the balance of projected change is in favour of personal serviceoccupations, rather than professional and technical occupations;
• the labour market structure may militate against investment in skills;• extensive part-time employment in rural areas which may be
associated with low wages; and• there are limited job opportunities for dual career households.
This research identified a number of gaps of relevance to anunderstanding of rural labour markets, including the informal economy,quantitative and qualitative information on recruitment patterns and arelative lack of information on a workplace basis.
Research25 has also highlighted the narrowness of rural economies,particularly for those with fairly specialist skills, who rarely find suitableemployment in their local area. Other recent research26 has identifiedthat the quantity and quality of jobs available locally is of particularimportance for low skilled people. Those with poor skills have feweropportunities and face more constraints in the labour market thantheir more highly skilled counterparts. Thus, those people with lowskills in rural areas are likely to be particularly disadvantaged inemployment terms.27
Lack of transportOne of the key themes to emerge from the evidence reviewed, is thesignificant role that transport, or the lack of it, can have as a barrier toaccessing quality employment. Research28, for example, on barriers tore-employment among the rural unemployed, found getting to work wasa problem for those without access to a car. There is a vicious cycle ofneeding a car to be able to get a job and not being able to afford a carwithout a job. This means that some rural people take low paid orunsatisfactory work simply because it is local29. This is particularly truefor women who often take jobs for which they are over-qualified in orderto fit in with childcare responsibilities30.
23. Commission for Rural Communities (2005) op. cit.
24. Green A. and Hardill I. (2003) op. cit.25. Breeze J,. Fothergill S. and Macmillan B. (2000)
Matching the New Deal to Rural Needs. Final reportto the Countryside Agency
26. Green A. and Owen D. (2006) The Geography of Poor Skills and Access to Work, Joseph RowntreeFoundation
27. Research on poor skills and associated policies to increase skills are covered in the chapter oneducational disadvantage.
28. Breeze J., Fothergill S. and Macmillan B. (2000) op. cit.
29. Monk S., Dunn J., Fitzgerald M. and Hodge I. (1999)Finding Work in Rural Areas: Barriers and bridges,Joseph Rowntree Foundation
30. Countryside Agency (2002) The Role andContribution of Women to Rural Economies
“There is a vicious cycle of needing acar to be able to get a job and not beingable to afford a car without a job”
CC32EvidenceSect2_AW.qxd 26/9/06 5:01 pm Page 40
41 Rural disadvantage Reviewing the evidence
Lack of childcareThe lack of availability of childcare is also likely to be a barrier toemployment for some rural people, especially women on low incomes.Even where childcare is available, it may be impossible for those withouta car to combine taking a child to day care and getting to work on time,given the limited nature of public transport. A lack of accessible andappropriate childcare has been identified in research with policy makersas one of the main problems facing rural women wishing to take upemployment31.
Tied housingTied housing is another feature of rural employment which may constrainpeople’s ability to change their jobs despite poor working conditionsor low pay. Around one in 20 households in the smallest settlements areliving rent-free32. In most cases this will be because accommodationis provided in connection with the employment of someone in thehousehold. However, tied housing may also have advantages by allowinglow paid workers to live in high-cost areas. Although there has beensome research on agricultural tied housing in the past33, this issuedoes not appear to have been looked at recently and may meritfurther research.
Employers’ attitudesResearch34 has found that employers’ attitudes and behaviour create abarrier in some circumstances, for example, some employers judgedthose who would have to travel by public transport or who owned a car but lived too far away, unreliable and thus unemployable. Lookingparticularly at barriers to re-employment among the rural unemployed,research35 identified the relative exclusivity of rural networks as aspecific obstacle to re-employment. Many jobs are filled by word-of-mouth and ‘outsiders’ to a rural area can feel excluded even when theyhave lived there for some years.
3.What are the policies?
Our focus in this section is on policies aimed at improving the‘employability’ of individuals, rather than improving employmentopportunities in general. Government policies for increasingemployment and reducing those claiming benefits are based upon theethos that paid work for people of working age provides the best routeout of poverty and social exclusion. Six groups at risk of unemploymenthave been prioritised: people claiming benefits related to a healthproblem or disability; people aged 50 and over; lone parents; peoplewith the lowest qualifications; people living in deprived areas (currentlydefined as the 30 local authority wards with the poorest initial labourmarket position); and people from BME communities36.
The Department of Work and Pensions’ (DWP) Five Year Strategyincludes an aspiration of ‘moving towards the equivalent of 80% of theworking age population in work37’. One of DWP’s PSA targets relates tounemployment38. “As part of the wider objective of full employment inevery region, over the three years to Spring 2008, and taking account of the economic cycle:
31. ibid.32. Commission for Rural Communities (2005) op. cit.33. Barlow A., Cloke P. and Goodwin M. (1993) Rent
(Agriculture) Act 1976 (Research for the JosephRowntree Foundation)
34. Monk S., Hodge I. and Dunn J. (2000) op. cit.35. Breeze J,. Fothergill S. and Macmillan B. (2000)
op. cit.36. HM Treasury (2004) 2004 Spending Review –
public service agreements 2005-200837. Department for Work and Pensions (2005) Five Year
Strategy – opportunity and security throughout life38. DWP PSA targets 2004: http://hm-treasury.gov.uk/
media/6A890/sr04_psa_ch15.pdf
CC32EvidenceSect2_AW.qxd 26/9/06 5:01 pm Page 41
42 Rural disadvantage Reviewing the evidence
• demonstrate progress on increasing the employment rate, joint withHM Treasury;
• increase the employment rates of disadvantaged groups (lone parents,ethnic minorities, people aged 50 and over, those with the lowestqualifications and those living in the local authority wards with thepoorest initial labour market position); and
• significantly reduce the difference between the employment rates ofthe disadvantaged groups and the overall rate.”
The New Deal programmesA number of New Deal programmes have been implemented since
1997 to help various vulnerable groups into work, including lone parents,disabled people, young people and older workers. The employmentNew Deals are all characterised by relatively intensive one-to-onesupport and providing improved access to training, basic skills and othermore specialised help, such as finding childcare for single parents39.
New Deal for Young People (NDYP)This is a mandatory employment programme for all young people aged18-24 who have been claiming Jobseeker’s Allowance (JSA) for sixmonths or more. An initial intensive period of careers advice and helpwith job search techniques (known as the Gateway period) is provided.This must include specialist assistance for the disadvantaged and harderto reach, people with disabilities, those from ethnic minoritiesand inner city and rural areas40. After this initial help NDYP participantsenter one of four programme options: a subsidised job; a place on theEnvironment Task Force; a place with a voluntary sector employer; orfull-time education or training. Self-employment support is also available.Participants who refuse to participate in any of these options may facebenefit sanctions. The NDYP was introduced initially in 12 ‘pathfinderareas’ in early 1998 and then nationally in April 1998. A numberof changes have been introduced since then, aimed at making itmore flexible.
The NDYP has been the subject of a number of evaluations. The NationalAudit Office (NAO)41 concluded that overall the NDYP had beensuccessful at reducing youth unemployment and increasing youthemployment. This report does not include any analysis of the impactsin rural areas, but it acknowledges that there are substantial variations in the performance of Employment Service Units of Delivery due to‘external influences that are outside their control’, citing the fact thatthe external influences on performance in inner cities might be verydifferent from those affecting performance in rural areas.
New Deal for 25 plus (ND25+)The ND25+ (also referred to as the New Deal for the Long-TermUnemployed) is a mandatory programme for all people aged 25 andover who have been claiming Jobseeker’s Allowance (JSA) for 18months or more42. The programme is similar to that for the NDYP. Itwas introduced in 28 pilot areas in 1998 and then expanded from 2001.The job entry rate for the ND25+ is three-quarters of the equivalent jobentry rate for the NDYP but is improving43. The proportion of people whostopped claiming JSA because they had moved into work varies verysubstantially between local authority areas but there does not appearto be an evaluation of the specific impacts in rural areas.
39. Social Exclusion Unit (2004) Breaking the Cycle:Taking stock of progress and priorities for the future
40. House of Commons Library (2005) Research Paper05/61 Employment and Training Programmes for the Unemployed Vol 1: Recent developments and the New Deal programmes
41. National Audit Office (2002) The Deal for Young People Report by the Comptroller and Auditor General
42. except those living in an Employment Zone,where private sector led employment programmesare currently being trialled.
43. Bivand P. (2005) New Deal 25+ shows continuousimprovement, Working brief 166, July 2005
CC32EvidenceSect2_AW.qxd 26/9/06 5:01 pm Page 42
43 Rural disadvantage Reviewing the evidence
New Deal for Partners (NDP)This is a voluntary programme which offers advice and job searchassistance to dependent partners of benefit claimants. The programmewas introduced nationally in 1999 and an enhanced version wasintroduced in 2004, offering the same package of support available tolone parents. Initially only the partners of people who had been claimingJSA for six months or more were eligible, but in 2001 it was extended tocover other benefits. In 2004, eligibility was extended to partners whoare part of a couple claiming Working Tax Credit, providing they workfewer than 16 hours a week. Participants on NDP meet a New DealPersonal Adviser who can provide information, support and advicewith searching for a job or to find appropriate education and training.They can also be referred to Jobcentre Plus programmes and can claimtravel costs for themselves (and child or helper) and some childcarecosts associated with participation on the NDP.
Take-up of the NDP has been extremely low in comparison to otherNew Deals44. It has been suggested that this is partly due to the lack ofincentives and a lack of knowledge amongst personal advisers as to whatis available, but also to the characteristics of the client group. For femalesin workless couples inactivity is most likely to be related to caringresponsibilities, whereas for males it is most likely to be related tosickness or disability. Whilst there is no evidence on the level of take-upof NDP in rural areas, qualitative research with partners nationally hasfound that there are some who would find it difficult or impossible toattend an interview at a Jobcentre and this may be particularly prevalentin rural areas45.
New Deal for 50 Plus (ND50+)This voluntary programme provides a combination of personal advice,help with job search and financial support to help over-50s who havebeen claiming benefit for at least six months back into work. It startedin 1999 in nine pathfinder areas and was rolled out nationally in 2000.Participants also have access to Jobcentre Plus’s full range of mainstreamprogrammes at the discretion of their personal adviser. Those who moveinto work through ND50+ may be eligible for a training grant of £1,500and the over-50s element of the Working Tax Credit. Support is alsoavailable for those entering self-employment.
A recent review of previous evaluations of the ND50+ found it hadhelped around 120,000 people into work46, but it is not known how manyof these people would have found work anyway. It identified a range ofpositive outcomes, but also a number of barriers that had not yet beenfully addressed, including employer attitudes, customer attitudes andbarriers related to ill-health and disability. The evaluations also showthat the ND50+ and other programmes delivered by Jobcentre Pluswere not particularly well advertised either in Jobcentres or elsewhere.No specific rural evaluation was undertaken.
44. Saunders T. (2002) New Deal for Partners,Working Brief No. 137, Aug/Sep 2002
45 ibid.46. National Audit Office (2004) Welfare to Work:
Tackling the Barriers to the Employment of Older People
CC32EvidenceSect2_AW.qxd 26/9/06 5:01 pm Page 43
44 Rural disadvantage Reviewing the evidence
New Deal for Disabled People (NDDP)This is a voluntary programme targeted specifically at people withdisabilities and long-term health problems, particularly those receivingbenefits on the grounds of incapacity for work. Individuals with learningdifficulties or disabilities are also eligible for help. The programme isdelivered through individual Job Broker organisations. These includevoluntary and not-for-profit agencies, private sector companies andpublic sector organisations. Job Brokers may refer participants to otherJobcentre Plus services if they meet the eligibility criteria. The NDDPwas introduced on a pilot basis in 1998 with two main elements – apersonal adviser service and a series of innovative schemes to help sick or disabled people return to work. The scheme was extendednationally in 2001.
Several evaluations of various aspects of the NDDP have beenundertaken. An evaluation of the first set of pilot schemes47, whichincluded a couple covering rural areas, identified some issues whichmade the initiative harder to implement in rural areas. For example, visitsto employers to encourage them to engage in the scheme were oftenvery time consuming for staff in areas where employers were somedistance apart. When commenting on whether their scheme could bereplicated elsewhere, one scheme organiser noted that it would beharder to replicate in rural areas where the population was much moredispersed and another that their scheme would only work in an areawhere there was a wide range of employment opportunities. Anevaluation of the Personal Adviser Service pilots48 also covered somepilots in areas with rural characteristics. However, this report does notinclude any discussion of the specific impacts of this service inrural areas.
More recently, an in-depth study of the delivery of the job broker serviceincluded rural as one of the sampling characteristics for the schemes itlooked at. However the report49 does not include any specific referencesas to how the Job Broker service is working in rural areas. A separateinquiry50 also examined evidence on the job broker service and foundthat the outcome-related funding received by Job Brokers encouragedthem to focus on those who are easiest to help. It recommended thatmore resources be channelled into helping those clients who facegreater difficulties in finding work. This report does not make anyspecific mention of difficulties in rural areas but it is likely that suchoutcome-related funding could have negative consequences for clientsin rural areas - since they are likely to be hard to assist, given a lack oftransport and poor local employment opportunities51.
New Deal for Lone Parents (NDLP)The NDLP provides lone parents on Income Support with children fromthe age of three with help and advice on job search, claiming benefits,training and finding childcare. It was initially introduced in three stagesbetween 1997 and 1998, and now operates nationally. All such parentsare required to meet a personal adviser for a Work-Focused Interview(WFI), to discuss the opportunities available to them, as a condition ofreceiving benefit but participation on the NDLP itself is voluntary.Participants also have access to the full range of Jobcentre Plusprogrammes and are fast-tracked for help with in-work benefits andtax credits and for child maintenance by the Child Support Agency.
47. Department for Work and Pensions (2001)Evaluation of the New Deal for Disabled PeopleInnovative Schemes Pilots
48. Department for Work and Pensions (2004)Evaluation of the New Deal for Disabled PeoplePersonal Adviser Service Pilots
49. Department for Work and Pensions (2005) New Deal for Disabled People: An in-depth study of Job Broker service delivery
50. Work and Pensions Committee, Employment for All:An Interim Report, HC 401-1, Fourth report ofsession 2002-03
51. See the evidence from the earliest pilot schemes(ref.47).
CC32EvidenceSect2_AW.qxd 26/9/06 5:01 pm Page 44
45 Rural disadvantage Reviewing the evidence
Support is also available for those entering self-employment. In 2004, arange of new initiatives were introduced on a pilot basis as part of theNDLP. These include: work search premium payments, in-work credit,childcare ‘tasters’ and an in-work emergencies fund.
An evaluation of the NDLP identified that work outcomes are influencedby locational factors, with outcomes being worse in more deprivedwards, across London and in rural areas52. Those in rural areas seem to have lower probability of leaving the programme and entering work.However, the research also found examples of innovative recruitmentpractices and provision that appear, on a small scale, to have contributedto the participation of some lone parents in rural areas who would havebeen unlikely to have engaged in mainstream NDLP.
The Lone Parent Outreach Service which began in 2002, aims tostrengthen engagement with lone parents living in rural and ‘isolated’urban communities. It acts as a referral agent to Jobcentre Plus andpromotes the benefits of NDLP. An evaluation of the Lone Parent OutreachService found ‘no compelling evidence that it is worthwhile continuingwith the Outreach Service’. It does not provide any specific details aboutthe outcomes in rural areas53.
The impact of the New Deal in rural areasThere appears to be only a limited amount of evidence on the impact ofthe New Deal in rural areas and much of the information that is availabledates back to the early days of the programme when the only schemeoperating nationally was the New Deal for Young People. At that time theNew Deal was working as well in rural areas as elsewhere. It is reportedthat in rural Britain (rather than just England) 45% of those starting NDYPhad gained jobs, as against 43% in urban areas54.
Around the same time, research55 examined ways in which thegovernment’s New Deal programmes needed to be adapted to thecircumstances of rural areas. This concluded that a shortage of jobsremained a major obstacle to employment in rural areas, so New Dealprogrammes focusing on employability alone were not really addressingthe central problem and what was needed is job creation. It alsorecommended that the New Deal should do more to help the significantproportion of those with health problems who want to work, to help thosewho want to improve their qualifications and to promote the employmentof older workers. Many of these issues have been addressed bysubsequent New Deal initiatives.
Having identified that a lack of transport can be a significant barrier toaccessing employment in rural areas, the report’s main conclusion, wasthat in rural areas New Deal needs to be adapted to support access tovehicles by those looking for work.
Pathways to Work This initiative is aimed at encouraging those on Incapacity Benefit backinto work. Pilots were introduced in 2003 in three Jobcentre Plus districtsand were extended to four other districts in 2004. Their aim is to focuson early intervention and offer much greater support in overcoming thebarriers to a return to work.
52. Evans M., Eyre J., Millar J. and Sarre S. (2003) New Deal for Lone Parents: second synthesis report of the national evaluation Research Report No 163 (DWP)
53. Department for Work and Pensions (2003)Evaluation of Lone Parents and Partners Outreach Service
54. Cabinet Office (2000) Sharing the nation’sprosperity: economic, social and environmentalconditions in the countryside – a report to the Prime Minister
55. Breeze J., Fothergill S. and Macmillan B. (2000) op. cit.
CC32EvidenceSect2_AW.qxd 26/9/06 5:01 pm Page 45
46 Rural disadvantage Reviewing the evidence
The approach has not been fully evaluated yet, but early results wereconsidered encouraging and the programme has been extended toinclude a further 14 Jobcentre Plus districts by October 2006. Earlyevidence (based on a limited amount of data) indicates that there hasbeen an increase of between eight and 10 percentage points in thosemoving off Incapacity Benefits after six months of a claim in the pilotareas56. However, there is no information on the impacts in rural areas.
Jobcentre Plus Jobcentre Plus brings together the Employment Service (ES) and thoseparts of the Benefits Agency (BA) dealing with people of working age todeliver a single, work-focused, integrated service to both employers andbenefit claimants. The aim is that people of working age making new orrepeat claims for working-age benefits should consider work as anoption before proceeding with their claims. The Jobcentre Plus servicebegan operating in 56 Pathfinder sites in 17 clusters across the UK in2001. A national rollout began in 2002 and was due to be completed byMarch 200657.
A recent evaluation by DWP58 found growing evidence that integratedoffices in Jobcentre Plus are getting more lone parents and people withhealth conditions and disabilities into work and that the majority ofcustomers are satisfied or very satisfied with the new service. However,this evaluation does not contain any information on the impacts inrural areas.
Measures to provide childcare for working parentsThe government’s aim is that flexible childcare should be available for all families with children aged up to 14 who need it. By 2004 many of thekey targets had been met, including the provision of a nursery educationplace (for two and half hours a day) for all three and four year olds and the creation of new childcare places for 1.6m children. Choice forparents, the best start for children: a ten year strategy for childcare,was published in 2004. The strategy included extension of the freeentitlement to nursery education for three and four year olds from 12.5 hours to 15 hours a week from April 2005, with a long-term goal of 20 hours free early education and childcare a week and the aim ofproviding all five to eleven year olds with affordable school-basedchildcare all year round by 2010. The strategy also includes a new dutyon local authorities to secure provision of childcare that meets the needsof local families. It specifically highlights rural areas as places that maycurrently be missing out in terms of childcare provision.
Although, overall, the key targets have been met, there is some concernabout gaps in provision. A recent report by the National Audit Office59
found that there had been a net loss of some types of childcare provisionand that wide variations existed between areas. A Select Committeereport60 published before the 10-year strategy was produced, citedparents living in rural areas as one of the groups who have particularproblems accessing childcare. The Committee expressed concern thatmost low-income parents in rural areas are not benefiting sufficientlyfrom expanded childcare provision. Increased provision for olderchildren relies in part on the availability of extended schools servicesand these are currently less likely to be provided in rural areas (seeeducation section for details).
56. Adams J. (2005) op. cit.57. Commission for Rural Communities (2005)
Rural proofing report58. Department for Work and Pensions, Jobcentre Plus
evaluation: summary of evidence Research ReportNo. 252
59. National Audit Office (2004) Early years – Progressin developing high quality childcare and earlyeducation accessible to all
60. Work and Pensions Committee (2003) Childcare for Working Parents
“most low-income parents in rural areasare not benefiting sufficiently fromexpanded childcare provision”
CC32EvidenceSect2_AW.qxd 26/9/06 5:01 pm Page 46
47 Rural disadvantage Reviewing the evidence
4. Summary
• The extent of under-employment and hidden unemployment– It has been suggested that hidden unemployment (i.e those whodo not register as unemployed when out-of-work) and under-employment (i.e. those who work intermittently) are more seriousproblems in rural areas than elsewhere but there are no figures onthe extent of these problems. By their very nature, these problemsare very hard to investigate since they will not be covered by anyofficial data, but further research would be extremely helpful inunderstanding the true extent of rural unemployment and under-employment. Such research would need to cover employment inboth the formal and informal economy. This research could alsousefully cover part-time working and the extent to which this is fromchoice or lack of alternatives.
• Lack of childcare and lack of transport – These two issues areregularly identified as key barriers for rural people wishing toaccess quality employment or any employment at all. The extent ofthe problem appears to be well established and generally agreed.However, it would be useful to investigate how these issues couldbest be addressed and to look at examples of good practice whichcould be replicated elsewhere. Such research could also usefullyinvestigate how key government strategies could be rural proofedto ensure they are delivering what is required e.g. the ChildcareStrategy and recent proposals on helping women back into work.
• The impact of the New Deals in rural areas – Much of thegovernment attention on providing assistance to the unemployedis now centred around the various New Deal programmes. Thereappears to be only a limited amount of evidence on the impact ofthe New Deals in rural areas and much of that dates back to theearly days of the programme when the only scheme operatingnationally was the New Deal for Young People. However, certainfeatures of the programmes may limit the extent to which ruralpeople can benefit from them. For example, the requirement tohave been on Job Seekers Allowance for a certain period of timemitigates against those who are seasonally or intermittentlyemployed participating in the New Deal for Young People or theNew Deal for 25+. In other programmes, the provision of outcome-related funding may result in rural people who are hard to helpbeing overlooked. There is some evidence that this is the case with the New Deal for Disabled People. There is, therefore, a need for research to examine the extent to which rural people havebenefited from New Deal to date and whether there are features of the programmes which could be changed or applied moreflexibly to ensure rural people benefit in future.
CC32EvidenceSect2_AW.qxd 26/9/06 5:01 pm Page 47
48 Rural disadvantage Reviewing the evidence
Educational disadvantage
This chapter looks at the disadvantage caused by a lack of access toopportunities for education and training in rural areas. It examinesinformation on opportunities for all age groups from early yearseducation, through compulsory schooling, to further education andlifelong learning. We focus, though, primarily on training and lifelonglearning for adults as these are important for people throughout theirlives. Education plays a crucial role in people’s full participation insociety, influencing someone’s ability to gain employment in particular,and thus influencing their income. The possession of qualifications andbasic numeracy and literacy skills are thought to be increasinglyimportant in avoiding unemployment. Formal educational qualificationsplay an important role in employers’ judgements about employingindividuals and are closely linked to quality of employment1. However,much less is known of the role education plays in other spheres ofparticipation2 and with a few exceptions, “the research literature hasvirtually nothing to say about how education differentially affectsparticipation in the political and social life of communities.”3 Pooreducational attainment has, however, been associated with poorerreported physical and mental health.
1.What is the problem?
There is evidence which suggests that, in some respects, educationalopportunities for people of school age in rural areas are good, forexample, average attainment is generally higher in rural areas. However,there are particular problems among certain sectors of the populationand for certain types of education and training. For example, those whofail to obtain basic skills during their compulsory education have morelimited opportunities to enhance their skills as adults. Those most at riskof disadvantage due to a lack of opportunity for education and traininginclude adults with poor basic skills, those with childcare responsibilitiesand those on low incomes and/or without private transport.
School age educational attainmentAn analysis of educational achievement by where pupils live but notnecessarily study, at Key Stages 2, 3 and 4, shows that pupils fromsmaller rural settlements generally do better than those from larger ruralsettlements, who in turn perform better than those from urban areas. Forexample, 63.9% of eligible 15 year old pupils from less sparse villages,hamlets and isolated dwellings gain five or more GCSEs at A* to C,compared with 58% from less sparse small town and fringe areas and49.2% from less sparse urban areas4.
However, these figures conceal considerable local variations andinequalities between some sectors of the population. Almost a quarterof 16 year olds in rural areas attain no GCSEs above a Grade D, onein 20 pass no GCSEs at all and more than half the young people leavingstatutory care in rural areas leave without any GCSEs. There seems,however, to be little information available about the characteristics ofthose with low educational achievement in rural areas.
1. Bradshaw J., Kemp P., Baldwin S. and Rowe A. (2004)The Drivers of Social Exclusion: A review of theliterature for the Social Exclusion Unit in the Breakingthe Cycle series. ODPM: London
2. Sparkes J. (1999) Schools Education and SocialExclusion. Centre for Analysis of Social Exclusion
3. Bradshaw J., Kemp P., Baldwin S. and Rowe A.(2004) op. cit.
4. Commission for Rural Communities (2005)The State of the Countryside 2005
5
“Almost a quarter of 16 year olds in ruralareas attain no GCSEs above a Grade D”
CC32EvidenceSect2_AW.qxd 26/9/06 5:01 pm Page 48
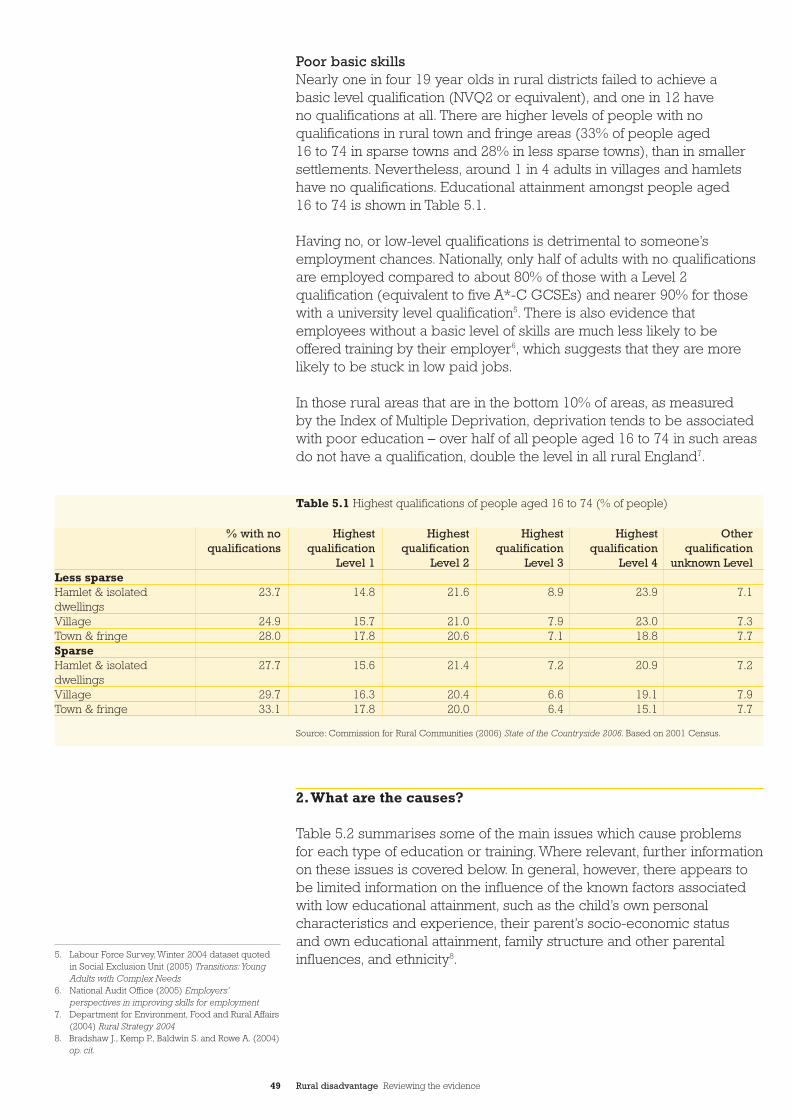
Poor basic skillsNearly one in four 19 year olds in rural districts failed to achieve abasic level qualification (NVQ2 or equivalent), and one in 12 haveno qualifications at all. There are higher levels of people with noqualifications in rural town and fringe areas (33% of people aged16 to 74 in sparse towns and 28% in less sparse towns), than in smallersettlements. Nevertheless, around 1 in 4 adults in villages and hamletshave no qualifications. Educational attainment amongst people aged16 to 74 is shown in Table 5.1.
Having no, or low-level qualifications is detrimental to someone’semployment chances. Nationally, only half of adults with no qualificationsare employed compared to about 80% of those with a Level 2qualification (equivalent to five A*-C GCSEs) and nearer 90% for thosewith a university level qualification5. There is also evidence thatemployees without a basic level of skills are much less likely to beoffered training by their employer6, which suggests that they are morelikely to be stuck in low paid jobs.
In those rural areas that are in the bottom 10% of areas, as measuredby the Index of Multiple Deprivation, deprivation tends to be associatedwith poor education – over half of all people aged 16 to 74 in such areasdo not have a qualification, double the level in all rural England7.
2.What are the causes?
Table 5.2 summarises some of the main issues which cause problems for each type of education or training. Where relevant, further informationon these issues is covered below. In general, however, there appears tobe limited information on the influence of the known factors associatedwith low educational attainment, such as the child’s own personalcharacteristics and experience, their parent’s socio-economic statusand own educational attainment, family structure and other parentalinfluences, and ethnicity8.
49 Rural disadvantage Reviewing the evidence
% with no Highest Highest Highest Highest Otherqualifications qualification qualification qualification qualification qualification
Level 1 Level 2 Level 3 Level 4 unknown LevelLess sparseHamlet & isolated 23.7 14.8 21.6 8.9 23.9 7.1dwellingsVillage 24.9 15.7 21.0 7.9 23.0 7.3Town & fringe 28.0 17.8 20.6 7.1 18.8 7.7SparseHamlet & isolated 27.7 15.6 21.4 7.2 20.9 7.2dwellingsVillage 29.7 16.3 20.4 6.6 19.1 7.9Town & fringe 33.1 17.8 20.0 6.4 15.1 7.7
Source: Commission for Rural Communities (2006) State of the Countryside 2006. Based on 2001 Census.
5. Labour Force Survey, Winter 2004 dataset quoted in Social Exclusion Unit (2005) Transitions: YoungAdults with Complex Needs
6. National Audit Office (2005) Employers’perspectives in improving skills for employment
7. Department for Environment, Food and Rural Affairs(2004) Rural Strategy 2004
8. Bradshaw J., Kemp P., Baldwin S. and Rowe A. (2004)op. cit.
Table 5.1 Highest qualifications of people aged 16 to 74 (% of people)
CC32EvidenceSect2_AW.qxd 26/9/06 5:01 pm Page 49
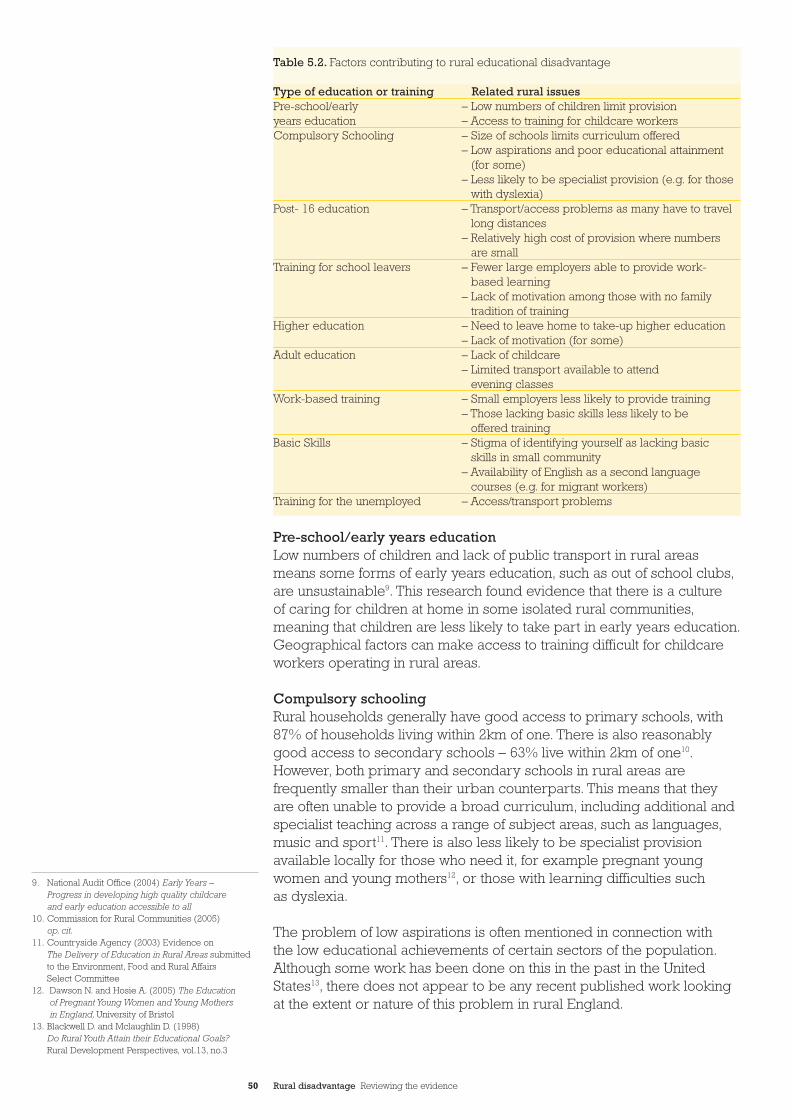
50 Rural disadvantage Reviewing the evidence
9. National Audit Office (2004) Early Years – Progress in developing high quality childcare and early education accessible to all
10. Commission for Rural Communities (2005) op. cit.
11. Countryside Agency (2003) Evidence on The Delivery of Education in Rural Areas submittedto the Environment, Food and Rural Affairs Select Committee
12. Dawson N. and Hosie A. (2005) The Education of Pregnant Young Women and Young Mothers in England, University of Bristol
13. Blackwell D. and Mclaughlin D. (1998) Do Rural Youth Attain their Educational Goals? Rural Development Perspectives, vol.13, no.3
Pre-school/early years educationLow numbers of children and lack of public transport in rural areasmeans some forms of early years education, such as out of school clubs,are unsustainable9. This research found evidence that there is a cultureof caring for children at home in some isolated rural communities,meaning that children are less likely to take part in early years education.Geographical factors can make access to training difficult for childcareworkers operating in rural areas.
Compulsory schoolingRural households generally have good access to primary schools, with87% of households living within 2km of one. There is also reasonablygood access to secondary schools – 63% live within 2km of one10.However, both primary and secondary schools in rural areas arefrequently smaller than their urban counterparts. This means that theyare often unable to provide a broad curriculum, including additional andspecialist teaching across a range of subject areas, such as languages,music and sport11. There is also less likely to be specialist provisionavailable locally for those who need it, for example pregnant youngwomen and young mothers12, or those with learning difficulties suchas dyslexia.
The problem of low aspirations is often mentioned in connection withthe low educational achievements of certain sectors of the population.Although some work has been done on this in the past in the UnitedStates13, there does not appear to be any recent published work lookingat the extent or nature of this problem in rural England.
Table 5.2. Factors contributing to rural educational disadvantage
Type of education or training Related rural issuesPre-school/early – Low numbers of children limit provisionyears education – Access to training for childcare workersCompulsory Schooling – Size of schools limits curriculum offered
– Low aspirations and poor educational attainment(for some)
– Less likely to be specialist provision (e.g. for those with dyslexia)
Post- 16 education – Transport/access problems as many have to travel long distances
– Relatively high cost of provision where numbersare small
Training for school leavers – Fewer large employers able to provide work-based learning
– Lack of motivation among those with no family tradition of training
Higher education – Need to leave home to take-up higher education– Lack of motivation (for some)
Adult education – Lack of childcare– Limited transport available to attend
evening classesWork-based training – Small employers less likely to provide training
– Those lacking basic skills less likely to beoffered training
Basic Skills – Stigma of identifying yourself as lacking basicskills in small community
– Availability of English as a second language courses (e.g. for migrant workers)
Training for the unemployed – Access/transport problems
CC32EvidenceSect2_AW.qxd 26/9/06 5:01 pm Page 50
51 Rural disadvantage Reviewing the evidence
Post-16 educationMost post-16 education is located in urban centres and towns andaccessing these facilities can present special difficulties for youngpeople living in rural areas. The availability of transport has a majorimpact on young people’s decisions about whether to continue ineducation after the age of 16. Research14 found 40% of 15-16 year oldsin rural areas said that the availability of transport played a part in theirdecision whether or not to enter post–16 education. Some of the factorsaffecting the provision of training in rural areas will also be relevant forpost-16 education in areas where the numbers of learners are small.
Training for school leavers and adults (both employed and unemployed)Research for the Learning and Skills Council15 identified the followingbarriers facing both learners and colleges and providers in rural areas:
• Scale of operations – numbers and class sizes are usually smallwhere the population within the immediate catchment area is smalland the cost of providing courses for a small number of learnerscan be high;
• Isolation and breadth of provision – colleges are often the soleprovider for their area and feel that they should be offering thebroadest possible curriculum, but struggle to define what thisshould be;
• Transport – for both learners and colleges and providers, traveltimes and costs may be high, even where the distances involvedare short due to the limited public transport available;
• Costs of provision – certain aspects of provision, such as outreachtraining in widely dispersed centres and the marketing of provisionto widely spread communities, may be disproportionatelyexpensive;
• Low income generation – the potential for gathering incomethrough fees is low, and many learners are only able to pay a verysmall amount, which may have an adverse effect on the range ofcourses offered;
• Connectivity and use – where colleges do not have access to high-speed broadband connections, the costs of ICT provision may behigh, as they are reliant on more expensive wireless connections;
• Lack of local facilities – opportunities for sporting and culturalactivities may be limited locally and visits to other areas to usefacilities will incur transport costs;
• Employer involvement – colleges and providers have difficultiesfinding local businesses to act as sponsors for, and champions of,work-based learning;
• Low aspirations – although not only the case in rural areas, lack ofmotivation may be as much of a barrier to participation in learningas financial difficulties. This may be particularly true of youngpeople whose parents and grandparents did not undertake post-compulsory education and where there is no tradition of youngpeople progressing to FE or training;
• Basic Skills – people who need help with basic skills may bereluctant to enrol on the courses that would help them, becausethey do not want others to find out about their lack of skills.This is likely to be a particular problem in small communitieswhere people feel that they will be more easily identified.
14. Storey P. and Brannen J. (2000) Young People andTransport in Rural Areas, The National Youth Agency
15. Learning and Skills Council (undated) GoodPractice: Education and Training in SparselyPopulated Areas
CC32EvidenceSect2_AW.qxd 26/9/06 5:01 pm Page 51
52 Rural disadvantage Reviewing the evidence
Transport and accessibility of provision have also been identified as important barriers for people wishing to take up training generally in rural areas16.
Adult education and lifelong learningThere is evidence17 that the majority of adult learners in rural areasprefer provision that is locally available and for many, local referred to their village or community. Again, this is largely linked to problemswith transport, access and childcare.
An investigation into the barriers to widening participation in lifelonglearning in Northumberland18 found that a third of all residents requiresome form of care support for a member of their family to enable themtime to study. The vast majority of these (95%), required help withchildcare. Another barrier was felt to be the times when courses started,particularly for those working in land-based employment who may bevery busy at the traditional start of the academic year in September(the same would also apply to those working in tourism in some areas).Over 50% of those surveyed would prefer September, January andApril enrolments.
Work-based trainingA recent review of rural labour markets, skills and training issues19
identified a range of issues affecting access to and delivery of, trainingin rural areas:
• Low numbers of potential learners;• More sole providers – facing the challenge of delivering a broad
and diverse curriculum;• Relatively high costs of provision;• The lack of and cost of, transport as a barrier to participation;• Difficulties in recruiting work-based learners from small
enterprises;• Issues surrounding the ICT infrastructure – potentially limiting
the delivery of learning; and• Higher fixed administrative costs associated with service delivery
in areas of dispersed populations.
It is likely that the nature of much employment in rural areas means thatemployees are less likely to receive training through their employer.For example, there is evidence that small employers have low levels ofawareness of the types of organisations, such as Sector Skills Councils,that are working to identify and tackle skills needs20 and are less likelyto be involved in training activity. The National Employers Skills Survey21
undertaken in 2004 found that 49% of establishments with fewer than 5staff had arranged any training over the last 12 months, compared to justover 95% of establishments with 100 or more staff. Another survey22
found that only 33% of employers with fewer than 5 employees providedoff-the-job training compared to 98% of employers with 500 or moreemployees. The National Audit Office23 also reports that many employers,particularly those running small or medium sized enterprises, are notreadily convinced of the business benefits of improving employees’literacy and numeracy skills.
16. National Audit Office (2004) Skills for Life: Improvingadult literacy and numeracy
17. Atkin C., Rose A. and Shier R. (2005) Provision of, and learner engagement with, Adult Literacy,Numeracy and ESOL support in rural England:A comparative case study, National Research and Development Centre for Adult Literacy and Numeracy
18. Tulett C. (2001) Rural learning – An investigation intothe barriers and solutions to widening participationin rural areas, Open Learning Centre
19. Green A. and Hardill I. (2003) Rural Labour Markets,Skills and Training, The Countryside Agency
20. National Audit Office (2005) op. cit.21. National Employer Skills Survey 200422. Spilsbury D (2001) Learning and Training at Work
2000, DfEE Research brief no: 26923. National Audit Office (2004) Skills for Life, op. cit.
“It is likely that the nature of muchemployment in rural areas means thatemployees are less likely to receivetraining through their employer”
CC32EvidenceSect2_AW.qxd 26/9/06 5:01 pm Page 52
53 Rural disadvantage Reviewing the evidence
Basic skillsResearch24 has identified many problems associated with the negativeconnotations of ‘literacy’ and the stigma of someone identifying themselfas having low levels of literacy and numeracy skills, in a small ruralcommunity. Some of this lack of basic skills was suggested as resultingfrom “poor rural primary school performance for those now in the 30-50years age range” and the fact that, historically, the families of agriculturallabourers would move from farm to farm each season and so have littlestability in their learning.
Certain sectors of the rural population, such as migrant workers, are atparticular risk of not having their skill needs met. For example, theNational Audit Office25 has identified that there is some need and activityfor courses in English for Speakers of Other Languages (ESOL) in ruralareas, whilst most participation and achievement in such courses isconcentrated in London and other urban areas. A recent review of theprovision of adult learning support in rural areas26 found that there is agrowing need for an increase in ESOL provision and a lack of suitablyqualified tutors.
3.What are the policies?
A wide range of policies relating to education and training have beenintroduced in recent years and it would be impossible to cover themall here. One key focus of much current policy making is the movetowards offering alternative opportunities for the 14-19 year old agegroup with the intention of encouraging people to stay in education ortraining until at least the age of 19. There is also a drive to improve basicskills among the adult population. Some of the policies designed to helppre-school and early years aim to provide a wider range of integratedservices than just education. These and a selection of other relevantpolicies are discussed below. The introduction of increased parentalchoice in secondary education is not covered here as this is beingcomprehensively addressed in the CRC’s ‘Choice and Voice’ study.
Measures affecting preschool/early years
Sure Start Sure Start was established in 1998 and is aimed at children under fouryears and their families. It was created to improve the life chancesof younger children through better access to family support, healthservices, early education and play. Funding is provided for localprogrammes in disadvantaged neighbourhoods or local communities.Each Sure Start programme varies according to local needs, but allprogrammes include a number of core services such as outreach andhome visiting, access to good quality play, learning and childcareexperiences and visits to all new parents within two months of the birth,to introduce them to Sure Start.
24. Tulett C. (2001) op. cit.25. National Audit Office (2004) Skills for Life, op. cit.26. Atkin C., Rose A. and Shier R. (2005) op. cit.
CC32EvidenceSect2_AW.qxd 26/9/06 5:01 pm Page 53
54 Rural disadvantage Reviewing the evidence
Most Sure Start programmes are in disadvantaged neighbourhoods inurban areas, but some cover rural areas. Research in 200327 found thatrural Sure Start programmes were already showing signs of success inreaching the families for whom the services are intended. The originalconcept was that each Sure Start programme would have a new, highquality building from which services would be provided but the researchfound that the rural schemes often had to adapt their delivery approachin order to take services to dispersed communities, for example,operating mobile services, undertaking home visiting or sharingpremises for particular purposes.
By the end of February 2005, the Sure Start Unit had approved 123applications for children’s centres intending to provide services in ruralareas28. The Commission for Rural Communities has commissioned astudy of the early development of children’s centres in rural areas, whichfocuses particularly on six case study centres. One of the aims of thisresearch is to analyse the challenges facing rural children’s centres andthe current level of service integration.
A recent report29 examined the impacts of the Sure Start LocalProgrammes (SSLPs) on children and their families and concluded thatfamilies with ‘greater human capital’ were better able to take advantageof Sure Start services and resources than those with less human capital(i.e. teen parents, lone parents, workless households). It is suggestedthat, as a result, this ‘left others with less access to services than wouldhave been the case had they not lived in SSLP areas’. Whilst this reportdid not look specifically at the impacts in rural areas, the sameconclusions may well apply there.
Mini Sure Start Mini Sure Starts are small scale Sure Start Local Programmes designedfor small communities in scattered rural areas and pockets of deprivationin urban and rural areas, each with a target population of approximately150 children under four. There are 43 local Mini Sure Start programmes,11 in urban pockets of deprivation, 22 in rural pockets and theremainder serving scattered rural areas.
A review of the experience of the Mini Sure Start programmes six to ninemonths after the majority started to provide services30 found that theywere reaching about half their target population and programmes werestarting to deliver services that families experienced as helpful. Theprogrammes have also helped to develop new and existing communitygroups. The research showed that families in rural areas who have thegreatest needs may also be harder to find and engage with servicesthan those in urban areas, due largely to concerns about lack ofanonymity, but also due to distance, lack of transport and lowexpectations of services.
This review provides little information on the actual impacts of the policyin rural areas and instead focuses more on some of the practical issuessurrounding delivery of the policy in rural areas. One notable differencebetween urban and rural programmes is that arranging the secondmentof staff from other services was more difficult for scattered ruralprogrammes.
27. Countryside Agency (2003) Delivering Services to Children and Families in Rural Areas:The early lessons from Sure Start
28. Williams J. (2005) Developing Children’s Centres inRural Areas, Progress Report 1
29. Department for Education and Skills (2005) Early impact of Sure Start Local Programmes on Children and Families: report of the cross-sectional study of 9-and 36-month old children and their families
30. Glennie S., Treseder G., Williams J. and Williams M.(2005) Mini Sure Start Local Programmes:An overview of their early implementation
CC32EvidenceSect2_AW.qxd 26/9/06 5:01 pm Page 54
55 Rural disadvantage Reviewing the evidence
Measures affecting compulsory schooling
Extended Schools Extended schools provide a range of services and activities, oftenbeyond the school day, to help meet the needs of children and youngpeople, their families and the wider community. Government policy saysthat by 2010 all schools should be able to offer:
• childcare/various activities for children and young people betweenthe hours of 8am-6pm, all year round;
• parenting support, including family learning;• swift referral from schools to a wider range of specialised support
services for pupils; and• widespread community use of the school’s facilities.
The expectation is that half of all primary schools and a third of allsecondary schools will be offering these facilities by 2008.
In addition, the Government is seeking to support the development inevery local authority area of one or more schools which provide acomprehensive range of services on a single site, including access tohealth services, adult learning and community activities, as well as studysupport and 8am to 6pm childcare. These are known as full serviceextended schools (FSES). In the first year of the initiative, 61 projectswere funded, none of which were in rural areas. However, rural areaswill be one of the foci of the second year of funding31.
A survey to assess the level and characteristics of provision of extendedservices in maintained schools in England in 200532 found that: mostprimary schools (87%) offer regular activities or childcare for theirpupils after the standard school day; two fifths offered such facilitiesbefore school; and a quarter in the school holidays. Primary schools inurban areas were more likely to offer provision which ran from 8am to6pm, five days a week for all three terms (13% compared to 9% in ruralareas). The research also found that primary schools in rural areas thatprovided after school activities tended to finish earlier (70% finished at5pm or earlier compared to 60% of those in urban areas) and were lesslikely to provide after school activities every day of the week (39% ofrural primary schools compared to 52% of urban ones). There weresimilar differences for secondary schools.
Other differences between urban and rural areas included:33
• primary schools in rural areas were more likely to hold adulteducation courses or workshops in the evening (54% comparedto 27%);
• only 12% of rural secondary schools employ a family supportworker, compared to 30% of urban ones;
• 29% of rural secondary schools provide some form of parentsupport group or facilities compared to 39% of urban; and
• special schools in rural areas were less likely to provide childcarefor pre-school children than those in urban areas (2% comparedto 17%).
Overall, it is clear from this research that the opportunity to accessextended school services is much more limited in rural than inurban areas.
31. Cummings C., Dyson A., Papps I., Pearson D., CarloR. and Todd L. (2005) Evaluation of the Full ServiceExtended Schools Project: End of First Year Report,Department for Education and Skills ResearchReport RR680
32. Clemens S., Kinnaird R., Mackey T., Deakin G.and Ullman, A. (2005) Extended Services in Schools:Baseline Survey of Maintained Schools in 2005,Department for Education and Skills ResearchReport RR681
33. It is not clear what definition of rural is used in this study
“...the opportunity to access extendedschool services is much more limited inrural than in urban areas”
CC32EvidenceSect2_AW.qxd 26/9/06 5:01 pm Page 55
56 Rural disadvantage Reviewing the evidence
An evaluation of the full service extended schools funded in the firstyear34 (none of which were in rural areas) found that, in some cases,they were achieving high levels of multi-agency working and therewas considerable anecdotal evidence of positive outcomes, includingexamples of raised attainment, increased pupil engagement withlearning and trust and support between families and schools. “Therewere indications that full service provision might potentially interveneto break established cycles of disadvantage in some cases.” It remainsto be seen how the full service extended schools concept will work inrural areas, but, as this will be one of the foci of the second year offunding and evaluation, there should be information available on thisin the near future.
Research35 examined how local authorities in 12 areas were strategicallyplanning for rural access to extended school services and looked at theservices that rural schools in these areas are currently providing. Thisfound that lack of transport, poor road infrastructure, large distances and the cost of tackling these issues, are all additional challenges facedby rural schools developing extended services. The provision of adulteducation programmes is made more difficult by the lack of eveningpublic transport services. Rural schools cited financial support,staff issues and transport as the top three barriers to developingextended services.
Changes to 14-19 provisionThe 14-19: Education and Skills White Paper was published in 2005,setting out proposals for introducing qualifications and curriculumchanges for 14-19 year olds. The detailed proposals were set out in the14-19 Education and Skills Implementation Plan. The 14-19 PathfinderInitiative is testing out a range of ideas linked to these new proposalswith the aim of developing best practice in 14-19 education and trainingand demonstrating that the reforms can work in a variety of locationswith different social circumstances and different mixes of schools andcolleges. A key part of the initiative is collaboration between schools andcolleges. Twenty-five pathfinders began in January 2003 and a further14 in September 2003. Some have been set up specifically to addressissues of rural isolation, others are based in large urban areas or inmixed urban/suburban/rural areas. Rural or part-rural pathfinder areasincluded Cumbria, Hampshire and Norfolk.
An evaluation of the 14-19 Pathfinders36 found that geography is animportant factor in determining the forms of collaboration. Transportprovided an obstacle to the broadening of the curriculum as longjourney times made it more difficult to travel to and from, off-site learninglocations. The long journey times involved reduced the amount oflearning time available. The cost implications are also noted as theabsence of viable public transport meant that either school minibuseshad to be used if students were to travel between institutions, orcommercial operators had to be employed. To overcome thesedifficulties, some rural pathfinders had developed small local skillscentres providing vocational learning and even mobile vocational units,while some placed considerable emphasis on e-learning.
34. Cummings C., Dyson A., Papps I., Pearson D., RaffoG. and Todd L. (2005) Evaluation of the Full ServiceExtended Schools Project: End of First Year ReportDfES Research Report RR680
35. Unpublished research on extended schools for the Commission for Rural Communities
36. Higham J. and Yeomans D. (2005) CollaborativeApproaches to 14-19 Provision: An evaluation of thesecond year of the 14-19 Pathfinder initiative,DfES Research Report RR642.
CC32EvidenceSect2_AW.qxd 26/9/06 5:01 pm Page 56
57 Rural disadvantage Reviewing the evidence
There is also some evidence that there was a tendency for lessinvolvement with employers and training providers in rural Pathfinders.Although some reported extensive involvement, others noted thedifficulty of linking with small and medium sized employers as therewere often no large employers in the rural Pathfinder areas. The absenceof large employers and training providers made it harder to providework-based learning placements.
Connexions The Connexions Service is a key strand of the Government’s strategyfor ensuring that young people aged 13-19 stay in education, trainingor work with a strong educational component until they are at least 18.The overall aim of Connexions is to raise the aspirations, participationand achievement levels of all young people by providing impartialinformation, advice, guidance, opportunities for personal developmentand other support through Personal Advisers. There is also a nationalinternet and telephone helpline service (Connexions Direct). There isa particular focus on supporting disaffected young people and thosemost at risk of disaffection, with 50% of resources targeting these groups. A primary target of the Connexions Service is to reduce theproportion of 16-18 year olds who are not in education, employmentor training (NEET).
Research on the Connexions Service in 200437 found that it had madegood progress in improving the way that young people receive adviceand guidance. The proportion of young people who are not in education,employment or training fell by 8% in the established partnership areasbetween November 2002 and 2003. However, this report does notinclude any explicit comparison of performance in different types ofareas, despite the fact that it used the index of rurality as one of thefactors to try and identify variations in performance between thedifferent partnerships.
There does not appear to be any other evidence of the overall impactof Connexions in rural areas. However, research has found many goodexamples of Connexions initiatives that have been specifically adapted to rural circumstances, for example using mobile services orcontributing to the running of Wheels to Work schemes to overcometransport barriers. This research found that rural Connexions initiativeshave mainly centred on the most disadvantaged young people, oftenthose aged 16 plus with specific needs, but that some have developedgood practice for early intervention and prevention with younger people to encourage them to complete their education38.
Education Action Zones (EAZs)/Excellence in Cities/Excellence ClustersEAZs were established in 1998 and 1999. They were generally set upin urban or rural areas with a mixture of socio-economic disadvantageand under-performance in schools. A key feature was partnershipbetween schools, colleges, local community organisations, localbusinesses and the local authority. When zones reached the end of theirfive year lifespan ex-EAZ schools were merged into the Excellence inCities (EiC) initiative. EiC provides targeted support to approximately2,400 schools in 58 of the most disadvantaged local authority areas.37. National Audit Office (2004) Connexions Service:
Advice and guidance for all young people38. Countryside Agency (2003) The Implementation of
Connexions in Rural Areas – A good practice guide
CC32EvidenceSect2_AW.qxd 26/9/06 5:01 pm Page 57
58 Rural disadvantage Reviewing the evidence
Excellence Clusters have been designed to bring the benefits of the EiCinitiative to smaller pockets of deprivation in urban and rural areas. LikeEiC, clusters focus on some of the most deprived areas of the country,using a structured programme designed to raise standards. ExcellenceClusters are implemented through local partnerships focusing on theneeds and aspirations of individual pupils and their parents and usuallyinclude both primary and secondary schools. Clusters benefit from extraresources to provide extended opportunities for gifted and talentedpupils, access to full-time learning mentors for pupils who need themand learning support units to tackle disruption. A fourth strand isavailable to target particular local issues, as identified by the schools ineach cluster.
There does not appear to have been an evaluation of the success orotherwise of EAZs. It has been reported39 that standards of achievementare rising more quickly in EiC schools than in non-EiC schools. Anevaluation of Excellence Clusters40 found mixed reports of progresstowards Cluster targets but the Learning Mentor strand was universallydeemed to be the most successful of the four strands. Overall, clusterpartnerships were considered successful and schools felt that they hadbenefited from working together. However, there were concerns aboutschools being excluded from clusters and about how Learning Mentors’salaries would be paid when Cluster funding ceased. This evaluationdid not identify specific impacts in rural areas.
Measures aimed at encouraging take-up of training andlearning by school-leavers
Modern Apprenticeship Although originally introduced in 1994, in 1997 the ModernApprenticeship (MA) became an entitlement of all school leavers. From2000 the MA became effectively the only means of training availableto young people who had left the education system. In 2004, a numberof changes to the scheme were announced, including new YoungApprenticeships for 14-16 year olds, opening up apprenticeships toadults by scrapping the 25 year age limit and improved progressionto Higher Education. The word ‘Modern’ has now been dropped fromthe title.
An Evaluation of Modern Apprenticeship Employers in 200341, prior tothe latest changes being introduced, found that satisfaction rates werehigh and the majority of employers surveyed said that they woulddefinitely, or probably, take on Modern Apprentices in the future. ModernApprentices are comparatively concentrated among small employerssuggesting that the scheme has an important role to play in rural areas,but this evaluation does not contain any rural specific information.
Entry to Employment (E2E) The E2E programme was introduced in 2003 and was designed to offersupport to young people who are not yet ready, or able, to enter MAdirectly. It aims to develop young people’s motivation and confidence,personal effectiveness, employability skills, basic and key skills. To beeligible, young people have to be aged 16 to 18, unemployed and notready to begin a Level 2 learning option.Young people on E2E receive£40 a week in support.
39. House of Commons Education and SkillsCommittee (2003) Secondary Education: PupilAchievement, Seventh Report of Session 2002-03
40. McMeeking S., Lines A., Blenkinsop S. and SchagenS. (2004) The Evaluation of Excellence Clusters:Final Report, The Countryside Agency
41. Anderson T. and Metcalf H. (2003) ModernApprenticeship Employers: Evaluation Study,DfES Research Brief no: 417
CC32EvidenceSect2_AW.qxd 26/9/06 5:01 pm Page 58
59 Rural disadvantage Reviewing the evidence
More than 50,000 learners participated in E2E in its first year and justover a third of these progressed to work-based learning, furthereducation or employment42. Despite the fact that E2E was promoted asthe ‘pre-Apprenticeship’ step on the path to work, only 6% of thoseparticipating went on to become apprentices. There does not appearto be any evidence of the impacts in rural areas.
Education Maintenance Allowances (EMAs) EMAs are intended to encourage young people to stay in education ortraining by offering means-tested financial support for young peopledirectly (rather than their parents). It is available for two years in years12, 13 and 14, during term-time for any full-time academic or vocationalcourse (up to Level 3) leading to a recognised qualification. Around halfof all 16 year olds are eligible. After piloting, a national scheme wasintroduced in 2004.
An extensive evaluation was undertaken of the EMAs pilots whichshowed an initial positive impact on participation in full-time educationpost-16 with an increase in participation among eligible 16 year olds ofaround 5.9%43. The effect on participation at age 16 was stronger amongyoung men than young women, and the main impact was on youngpeople from lower socio-economic groups and those with modest or lowlevels of GCSE attainment. However, the longer-term outcomes from thepilots have been less positive with evidence that, by the age of 19, theEMAs had ceased to have a significant impact on participation in full-time education and the evidence on the attainment of qualifications isinconclusive. The evaluation did include a comparison of outcomes inrural and urban areas, although the results are less reliable as a resultof having only one rural pilot area. However, the statistics do appear tosuggest that EMAs had a significant impact among eligible young peoplewith 12.2% more young people in the rural pilot being in full-timeeducation at both 16 and 17 than in the rural control areas. Theequivalent figure for urban areas was 5.4%, suggesting EMAs had alarger impact in rural areas.
In addition, Education Maintenance Allowance Transport (EMA) (T), pilotswere also introduced and aimed to encourage young people from lowincome households to remain in post-16 education, by assisting with thecost of travel to and from an education provider. These were piloted inurban and rural areas. An evaluation of the EMA(T) pilots found noconsistent significant impact on education decisions44 across all the pilotsboth urban and rural. It found that, although eligible students in the ruralpilot areas were the most likely to remain in full-time education, theirawareness of the EMA (T) was lower and they were least likely to haveapplied for it. The report suggests that the lower level of applicationsmay be because the value of a travel subsidy is perceived to be less inrural areas due to the limited public transport available.
42. Readfern G. (2005) A Gateway to Employment,Young People Now, 13-19 April 2005
43. Middleton S., Perren K., Maguire S., Rennison J.,Battistin E., Emmerson C., and Fitzsimons E. (2005)Evaluation of Education Maintenance AllowancePilots: Young people aged 16 to 19 years.Final report of the Quantitative Evaluation,Research Report 678, DfES
44. Perron K., Middleton S., and Emmerson C. (2003)Education Maintenance Allowance Transport Pilots –Quantitative Findings from Year 1 and Year 2 (2000-2001/2001-2002), Research Report RR471, DfES
CC32EvidenceSect2_AW.qxd 26/9/06 5:01 pm Page 59
60 Rural disadvantage Reviewing the evidence
Measures aimed at improving skills among the working-age population
Skills for Life Strategy The Skills for Life programme, launched in 2001, is designed to help thevery large numbers of adults in the working population (an estimated26m in 2003), who do not meet the minimum literacy and numeracystandards considered necessary for school leavers in today’s economy.The aim is that by 2010 at least 2.25m adults should have achievedqualifications in literacy and numeracy, with an intermediate milestoneof 1.5m by 2007. There is also a separate target to reduce by 40% by2010, the number of adults who do not have the wider skills foremployability represented by a full Level 2 qualification. Learners maybe entitled to financial support from Learner Support Funds and theAdult Learning Grant (currently only available in certain regions, butavailable nationally from September 2008). Nine local Basic SkillsPathfinder projects were set up in Spring 2001 to trial key elements ofthe Skills for Life Strategy. These include some in areas with significantrural populations (e.g. Cambridgeshire, Nottinghamshire).
By July 2004, 750,000 adults had achieved qualifications but over half of these were 16 to 18 year olds who had not managed to get thequalifications at school and achieving the targets is likely to becomeincreasingly difficult over time, because they can only be met byattracting ‘hard to reach’ and older learners45. More recently, the focushas changed to older adults. An evaluation of the Pathfinders46 in 2002found very encouraging take-up patterns, with around 9,000 adultshaving had some level of involvement with Pathfinder-linked literacy andnumeracy support programmes by December 2001 and a wide range oflearning programmes are being delivered. An evaluation of theoutcomes for learners in Pathfinder areas47 the same year found thatlearners were very positive about the training they received and thequality of teaching was also considered to be high. Overall, 90% of alllearners felt the training had made them feel more positive about futuretraining in general.
45. House of Commons Committee of Public Accounts(2006) Skills for life: Improving adult literacy andnumeracy, Twenty-first report of session 2005-06
46. CRG (2002) Skills for Life: The National Strategy forImproving Adult Literacy and Numeracy Skills ‘WhatWorks’ – Early Findings from the Pathfinder Projects,DfES Research Brief No: 342
47. Taylor Nelson Sofres (2002) Evaluating Outcomes for Learners in Pathfinder Areas, DfES Research BriefNo. 343
© C
ount
rysi
de
Ag
ency
/ N
ick
Tur
ner
2006
CC32EvidenceSect2_AW.qxd 26/9/06 5:01 pm Page 60
61 Rural disadvantage Reviewing the evidence
Although there is no evidence specifically about the impacts in ruralareas, there is some evidence that suggests the strategy may not bedelivering as much in rural areas due to the nature of employment there.For example, local Learning and Skills Councils find that many smalland medium sized enterprises are reluctant to provide their employeeswith opportunities to improve their literacy and numeracy and it isreported that the needs of people in low-skilled employment are notbeing met48. Concern has also been expressed as to how well the Skillsfor Life strategy has been rural proofed49, as it is based largely on urbanmodels of delivery and patterns of funding which are often inappropriatein rural areas. For example, funding criteria normally require classesto have a minimum number of learners, usually between eight and ten.In rural areas this is very difficult, if not impossible, to achieve. There isalso no central funding to cover the additional cost of providing tutors inrural areas. It has been suggested50 that without changes to the fundingof the delivery of the Skills for Life agenda in rural areas it will bealmost impossible for rural Learning and Skills Councils to meetgovernment targets.
The Skills Strategy This strategy was published in 2003 and set out proposals to tackle theskills gap between the UK and its main economic competitors. It focuseson learning and skills in certain priority areas, in particular a universalentitlement to funded learning equivalent to a first full Level 2qualification. The key measures outlined in the Skills Strategy wereas follows:
• free training for adults without first qualifications;• targeted support for higher level skills;• adult learning grant – offering up to £30 per week to adults on
low incomes studying full time for a first full Level 2 qualificationand for first Level 3 qualifications for those under 30; and
• improved information, advice and guidance on skills, trainingand qualifications.
An update was published in 2005, which contains a wide range ofproposals, including Skills Academies and a new VocationalQualifications framework.
The Skills Strategy places increasing emphasis on delivering learningthrough learndirect and the network of UK online centres. Research bythe National Audit Office51 indicated that some smaller online centresare struggling, particularly those in rural areas, and centres dealing withmarginalised and disadvantaged learners who require high levels ofsupport. This report recommended that Ufi (the organisation withresponsibility for co-ordinating the network of online centres) shouldexamine how it can support types of centre, such as rural ones, if theybecome unsustainable under the current funding arrangements. “Somecentres face the risk that the funding regime combined with their narrowcustomer base or rural location may not provide sufficient funding tosurvive, which may in turn affect learndirect’s ability to provideopportunities to the most deprived communities or those with small,scattered populations.” There does not appear to have been any overallevaluation of the Skills Strategy.
48. House of Commons Committee of Public Accounts(2006) op. cit.
49. Rose A., Shier R., and Atkin C. (2005) Is Skills for LifeRural Proof? Reflect, Issue 3, June 2005
50. Atkin C., Rose A., and Shier R. (2005) op. cit.51. National Audit Office (2005) Extending Access
to Learning through Technology: Ufi and thelearndirect service
“...without changes to the funding of thedelivery of the Skills for Life agenda inrural areas it will be almost impossiblefor rural Learning and Skills Councils tomeet government targets”
CC32EvidenceSect2_AW.qxd 26/9/06 5:01 pm Page 61
62 Rural disadvantage Reviewing the evidence
Employer Training Pilots (ETP) and the National Employer Training Programme This is a Learning and Skills Council programme to provide free orsubsidised training in basic skills or to a first Level 2 qualification foremployees in selected pilot areas. The pilots include paid time-off foremployees to train, wage compensation to the employer for giving timeoff, and free information, advice and guidance to employees andemployers. From 2006, the National Employer Training Programme isbeing introduced which will extend these provisions nationally. This willseek to achieve growth in training by encouraging take up of the Level 2entitlement among employees and by stimulating employers to contributeto training employees who already hold a full Level 2 qualification.
Research on the Employer Training Pilots52 found that they had alloweda greater proportion of employees to take part in training and that bothemployees and employers were very happy with the adaptability of thetraining and its close alignment with their business needs. However, italso found that many potential beneficiaries are unable to access theprogramme and employees are not getting satisfactory support from theinformation, advice and guidance (IAG) services. It concluded that awide range of vocational skills are being delivered and that ETP hasgone a long way towards successfully meeting the objectives of the SkillsStrategy, but expressed concern that the basic skills agenda was notbeing met.
One evaluation of ETP after its first year53 found evidence that the pilotswere reaching some groups not normally associated with participationin qualifications-based training, such as middle-aged women who leftschool at 16 now working in low-skilled jobs in small firms. However,other research54 found only a small positive effect of ETP on theincidence of training among eligible employers and on the take-up oftraining among eligible employees. This research could not find anysystematic evidence that ETP had significantly increased employerprovision of, or employee engagement in, training by the end of August2004. The authors suggest that this may be due to the fact that asubstantial proportion of those undertaking training through the ETPprogramme would have done so in the absence of ETP – only around14% of employers taking part in ETP were “hard to reach” and ETPemployers had a relatively positive attitude to training compared withaverage employers.
None of the research on ETP has looked specifically at the rural impacts,although one evaluation55 did find that most employers engaged in thepilots are small, stand-alone private sector businesses, suggesting thatthere is good take-up among the types of employers that are commonin rural areas.
52. Ashton C. et. al. (2005) ALI Employer Training Pilot Survey, DfES Research Report RR695
53. Hillage J. and Mitchell H. (2003) Employer TrainingPilots: First Year Evaluation Report, DfES ResearchBrief No: RBX20-03
54. Abramovsky L. (2005) The Impact of the EmployerTraining Pilots on the Take-up of Training AmongEmployers and Employees, Research Report RR694
55. Hillage J. and Mitchell H (2003) op. cit.
CC32EvidenceSect2_AW.qxd 26/9/06 5:01 pm Page 62
63 Rural disadvantage Reviewing the evidence
4. Summary
• Adapting the Skills for Life Strategy to the needs of ruralareas. The nature of much employment in rural areas (smallemployers with low-skilled employees) means that employees areless likely to receive training through their employer even thoughsome will be among those who do not meet the minimum literacyand numeracy standards which the measures in the Skills for LifeStrategy are intended to address. Implementation of the Skills forLife Strategy needs to be rural proofed if its targets are to be met in rural areas.
• The implications of changes to 14-19 education. Much of thechange relating to the provision of education and training for 14-19year olds is still at a very early stage, but potentially this has someimportant implications for rural areas in terms of the ability of smallrural schools to offer alternative pathways to this age group or forpupils to have to travel further away for their education from theage of 14.
• The availability of appropriate training/education for non-English speakers. There are increasing numbers of migrantworkers in many rural areas, most of whom do not speak English asa first language. Whilst such workers will not necessarily lack basicskills, they (and any children with them) will almost certainly needsupport in helping improve their English language. At the moment,there is only limited provision of such training in rural areas andmore will need to be provided in future.
© C
ount
rysi
de
Ag
ency
/ N
ick
Tur
ner
2006
CC32EvidenceSect2_AW.qxd 26/9/06 5:01 pm Page 63
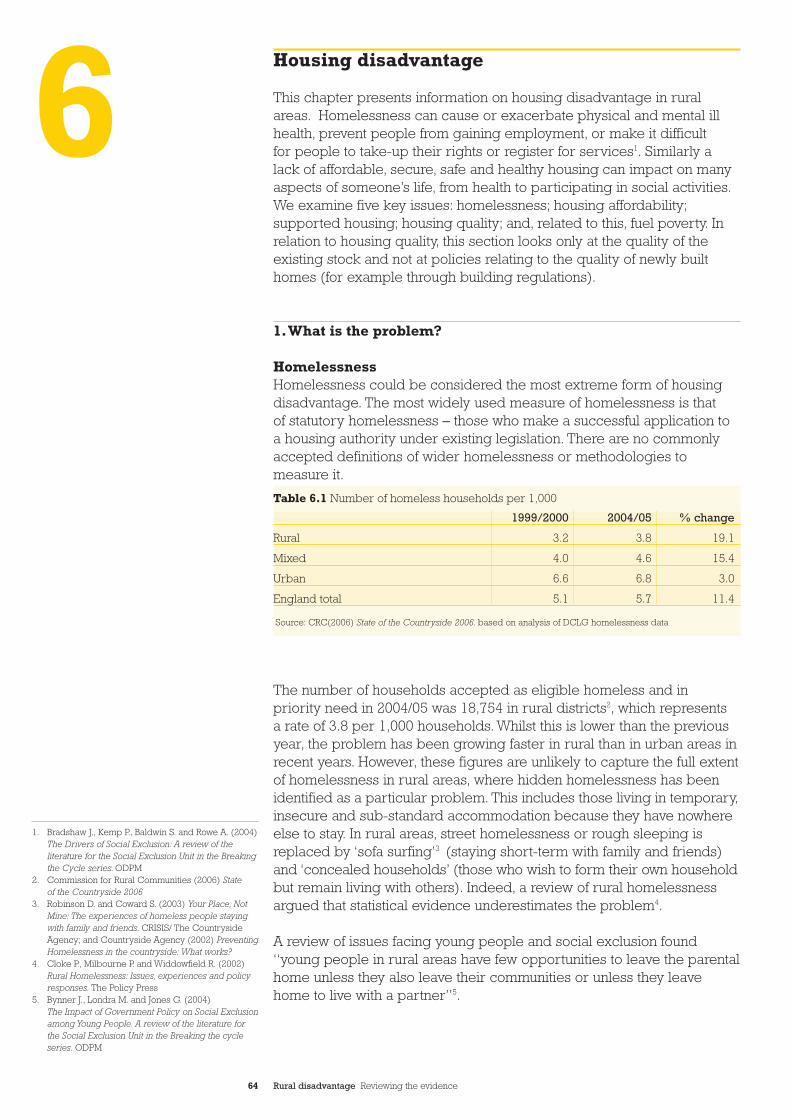
64 Rural disadvantage Reviewing the evidence
Housing disadvantage
This chapter presents information on housing disadvantage in ruralareas. Homelessness can cause or exacerbate physical and mental illhealth, prevent people from gaining employment, or make it difficult for people to take-up their rights or register for services1. Similarly alack of affordable, secure, safe and healthy housing can impact on manyaspects of someone’s life, from health to participating in social activities.We examine five key issues: homelessness; housing affordability;supported housing; housing quality; and, related to this, fuel poverty. Inrelation to housing quality, this section looks only at the quality of theexisting stock and not at policies relating to the quality of newly builthomes (for example through building regulations).
1.What is the problem?
Homelessness Homelessness could be considered the most extreme form of housingdisadvantage. The most widely used measure of homelessness is that of statutory homelessness – those who make a successful application toa housing authority under existing legislation. There are no commonlyaccepted definitions of wider homelessness or methodologies tomeasure it.
The number of households accepted as eligible homeless and in priority need in 2004/05 was 18,754 in rural districts2, which represents a rate of 3.8 per 1,000 households. Whilst this is lower than the previousyear, the problem has been growing faster in rural than in urban areas inrecent years. However, these figures are unlikely to capture the full extentof homelessness in rural areas, where hidden homelessness has beenidentified as a particular problem. This includes those living in temporary,insecure and sub-standard accommodation because they have nowhereelse to stay. In rural areas, street homelessness or rough sleeping isreplaced by ‘sofa surfing’3 (staying short-term with family and friends)and ‘concealed households’ (those who wish to form their own householdbut remain living with others). Indeed, a review of rural homelessnessargued that statistical evidence underestimates the problem4.
A review of issues facing young people and social exclusion found“young people in rural areas have few opportunities to leave the parentalhome unless they also leave their communities or unless they leavehome to live with a partner”5.
1999/2000 2004/05 % change
Rural 3.2 3.8 19.1
Mixed 4.0 4.6 15.4
Urban 6.6 6.8 3.0
England total 5.1 5.7 11.4
Table 6.1 Number of homeless households per 1,000
Source: CRC(2006) State of the Countryside 2006. based on analysis of DCLG homelessness data
1. Bradshaw J., Kemp P., Baldwin S. and Rowe A. (2004)The Drivers of Social Exclusion: A review of theliterature for the Social Exclusion Unit in the Breakingthe Cycle series. ODPM
2. Commission for Rural Communities (2006) State of the Countryside 2006
3. Robinson D. and Coward S. (2003) Your Place, NotMine: The experiences of homeless people stayingwith family and friends. CRISIS/ The CountrysideAgency; and Countryside Agency (2002) PreventingHomelessness in the countryside: What works?
4. Cloke P., Milbourne P. and Widdowfield R. (2002)Rural Homelessness: Issues, experiences and policyresponses. The Policy Press
5. Bynner J., Londra M. and Jones G. (2004) The Impact of Government Policy on Social Exclusionamong Young People. A review of the literature forthe Social Exclusion Unit in the Breaking the cycleseries. ODPM
6CC32EvidenceSect2_AW.qxd 26/9/06 5:01 pm Page 64
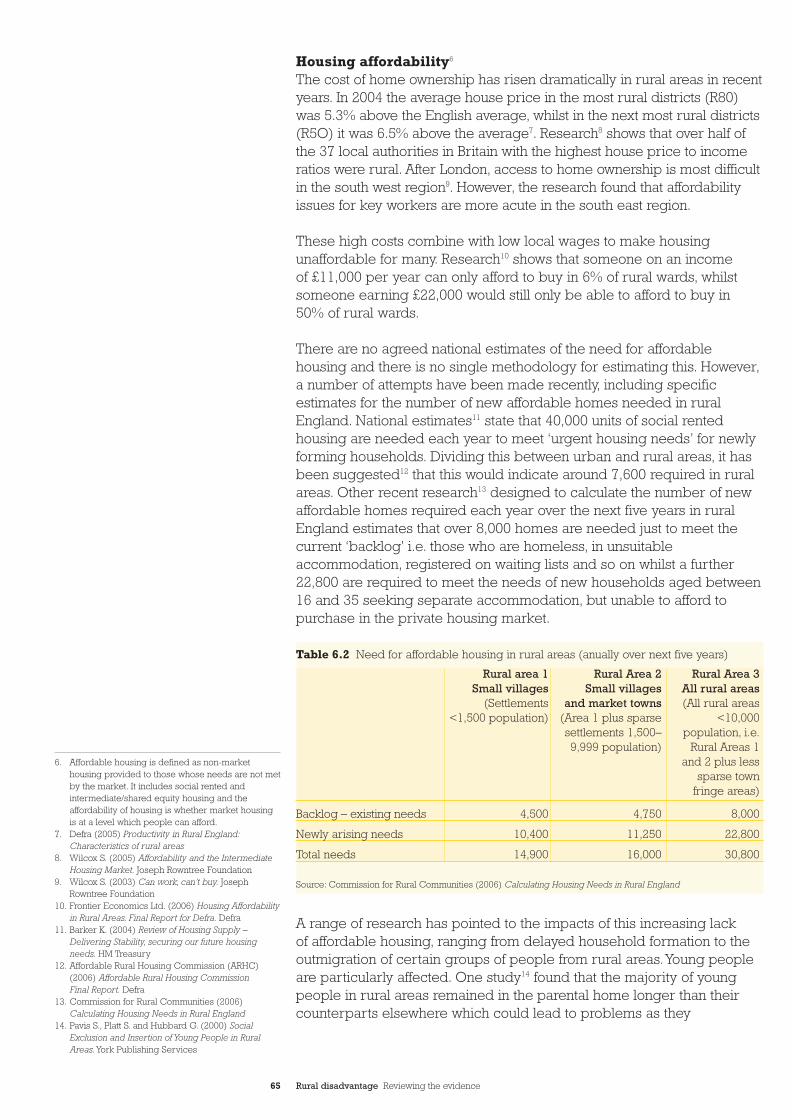
65 Rural disadvantage Reviewing the evidence
Housing affordability6
The cost of home ownership has risen dramatically in rural areas in recentyears. In 2004 the average house price in the most rural districts (R80)was 5.3% above the English average, whilst in the next most rural districts(R5O) it was 6.5% above the average7. Research8 shows that over half ofthe 37 local authorities in Britain with the highest house price to incomeratios were rural. After London, access to home ownership is most difficultin the south west region9. However, the research found that affordabilityissues for key workers are more acute in the south east region.
These high costs combine with low local wages to make housingunaffordable for many. Research10 shows that someone on an income of £11,000 per year can only afford to buy in 6% of rural wards, whilstsomeone earning £22,000 would still only be able to afford to buy in 50% of rural wards.
There are no agreed national estimates of the need for affordablehousing and there is no single methodology for estimating this. However,a number of attempts have been made recently, including specificestimates for the number of new affordable homes needed in ruralEngland. National estimates11 state that 40,000 units of social rentedhousing are needed each year to meet ‘urgent housing needs’ for newlyforming households. Dividing this between urban and rural areas, it hasbeen suggested12 that this would indicate around 7,600 required in ruralareas. Other recent research13 designed to calculate the number of newaffordable homes required each year over the next five years in ruralEngland estimates that over 8,000 homes are needed just to meet thecurrent ‘backlog’ i.e. those who are homeless, in unsuitableaccommodation, registered on waiting lists and so on whilst a further22,800 are required to meet the needs of new households aged between16 and 35 seeking separate accommodation, but unable to afford topurchase in the private housing market.
A range of research has pointed to the impacts of this increasing lack of affordable housing, ranging from delayed household formation to theoutmigration of certain groups of people from rural areas.Young peopleare particularly affected. One study14 found that the majority of youngpeople in rural areas remained in the parental home longer than theircounterparts elsewhere which could lead to problems as they
Rural area 1 Rural Area 2 Rural Area 3Small villages Small villages All rural areas
(Settlements and market towns (All rural areas<1,500 population) (Area 1 plus sparse <10,000
settlements 1,500– population, i.e.9,999 population) Rural Areas 1
and 2 plus lesssparse town
fringe areas)
Backlog – existing needs 4,500 4,750 8,000
Newly arising needs 10,400 11,250 22,800
Total needs 14,900 16,000 30,800
Table 6.2 Need for affordable housing in rural areas (anually over next five years)
Source: Commission for Rural Communities (2006) Calculating Housing Needs in Rural England
6. Affordable housing is defined as non-markethousing provided to those whose needs are not metby the market. It includes social rented andintermediate/shared equity housing and theaffordability of housing is whether market housingis at a level which people can afford.
7. Defra (2005) Productivity in Rural England:Characteristics of rural areas
8. Wilcox S. (2005) Affordability and the IntermediateHousing Market. Joseph Rowntree Foundation
9. Wilcox S. (2003) Can work, can’t buy. JosephRowntree Foundation
10. Frontier Economics Ltd. (2006) Housing Affordabilityin Rural Areas. Final Report for Defra. Defra
11. Barker K. (2004) Review of Housing Supply –Delivering Stability, securing our future housingneeds. HM Treasury
12. Affordable Rural Housing Commission (ARHC)(2006) Affordable Rural Housing Commission Final Report. Defra
13. Commission for Rural Communities (2006)Calculating Housing Needs in Rural England
14. Pavis S., Platt S. and Hubbard G. (2000) SocialExclusion and Insertion of Young People in RuralAreas. York Publishing Services
CC32EvidenceSect2_AW.qxd 26/9/06 5:01 pm Page 65
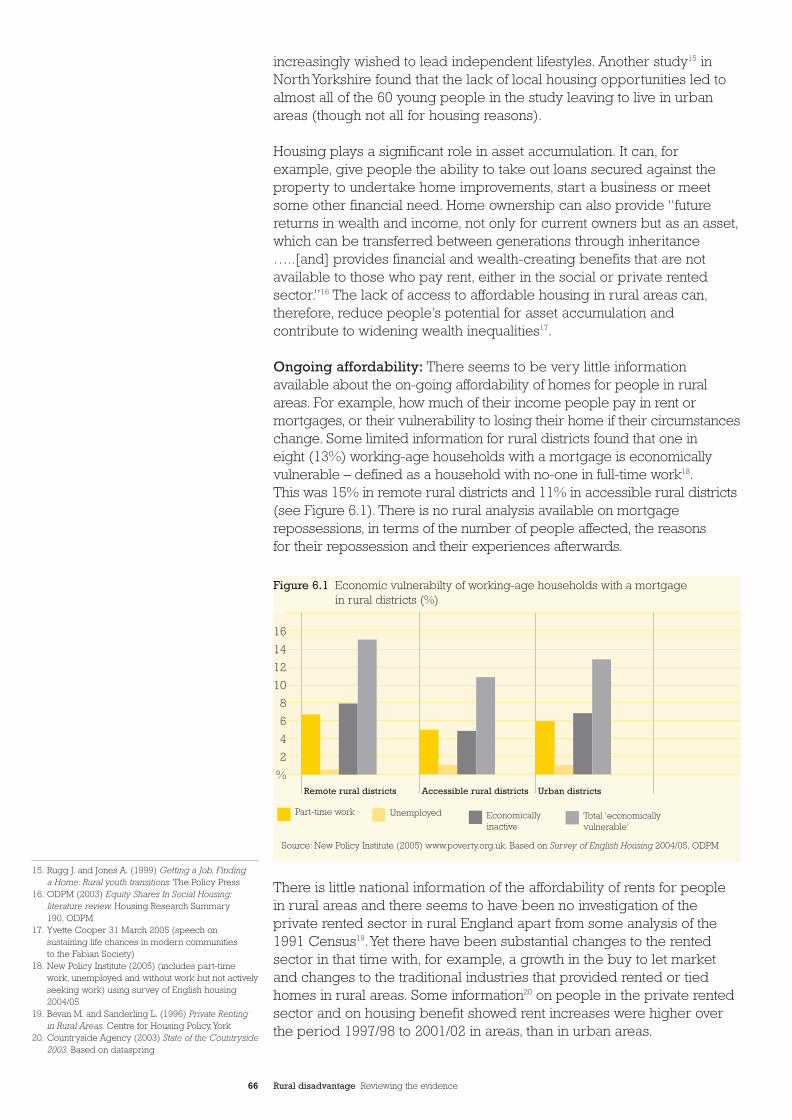
66 Rural disadvantage Reviewing the evidence
increasingly wished to lead independent lifestyles. Another study15 inNorth Yorkshire found that the lack of local housing opportunities led toalmost all of the 60 young people in the study leaving to live in urbanareas (though not all for housing reasons).
Housing plays a significant role in asset accumulation. It can, forexample, give people the ability to take out loans secured against theproperty to undertake home improvements, start a business or meetsome other financial need. Home ownership can also provide “futurereturns in wealth and income, not only for current owners but as an asset,which can be transferred between generations through inheritance…..[and] provides financial and wealth-creating benefits that are notavailable to those who pay rent, either in the social or private rentedsector.”16 The lack of access to affordable housing in rural areas can,therefore, reduce people’s potential for asset accumulation andcontribute to widening wealth inequalities17.
Ongoing affordability: There seems to be very little informationavailable about the on-going affordability of homes for people in ruralareas. For example, how much of their income people pay in rent ormortgages, or their vulnerability to losing their home if their circumstanceschange. Some limited information for rural districts found that one in eight (13%) working-age households with a mortgage is economicallyvulnerable – defined as a household with no-one in full-time work18.This was 15% in remote rural districts and 11% in accessible rural districts(see Figure 6.1). There is no rural analysis available on mortgagerepossessions, in terms of the number of people affected, the reasons for their repossession and their experiences afterwards.
There is little national information of the affordability of rents for people in rural areas and there seems to have been no investigation of theprivate rented sector in rural England apart from some analysis of the1991 Census19.Yet there have been substantial changes to the rentedsector in that time with, for example, a growth in the buy to let marketand changes to the traditional industries that provided rented or tiedhomes in rural areas. Some information20 on people in the private rentedsector and on housing benefit showed rent increases were higher overthe period 1997/98 to 2001/02 in areas, than in urban areas.
15. Rugg J. and Jones A. (1999) Getting a Job, Finding a Home: Rural youth transitions. The Policy Press
16. ODPM (2003) Equity Shares In Social Housing:literature review. Housing Research Summary 190, ODPM
17. Yvette Cooper 31 March 2005 (speech onsustaining life chances in modern communities to the Fabian Society)
18. New Policy Institute (2005) (includes part-timework, unemployed and without work but not activelyseeking work) using survey of English housing2004/05
19. Bevan M. and Sanderling L. (1996) Private Renting in Rural Areas. Centre for Housing Policy,York
20. Countryside Agency (2003) State of the Countryside2003. Based on dataspring
Figure 6.1 Economic vulnerabilty of working-age households with a mortgage in rural districts (%)
16
14
12
10
8
6
4
2
%Remote rural districts Accessible rural districts Urban districts
Source: New Policy Institute (2005) www.poverty.org.uk. Based on Survey of English Housing 2004/05, ODPM
Part-time work Unemployed Economicallyinactive
Total ‘economicallyvulnerable’
CC32EvidenceSect2_AW.qxd 26/9/06 5:01 pm Page 66
67 Rural disadvantage Reviewing the evidence
Some research was undertaken on tied housing in Scotland a few yearsago, but there seems to be little current information on the quality of tiedhousing and what happens when people change jobs or retire. Onerecent investigation of rural housing21 suggested that a large proportionof private rented properties are seasonal lets and, therefore, not availablefor year round use. Take up of housing benefit may be an indicator of theunaffordability of rents, but it has been suggested that people in need donot always take up their benefit entitlement22. The same review alsofound that “people on low incomes are often further excluded from rentalmarkets in rural villages and towns because housing benefit will notcover the higher rents”.
One study of tenants of social housing in rural areas23 found that many had previously been unable to afford to rent privately, and that the privaterented sector is often too insecure for families.
Supported housingSupported housing is housing related support for groups who havespecial needs or vulnerabilities. This covers both care for people inspecialised housing, such as sheltered housing and services andsupport to enable people to remain in their own homes, livingindependently rather than requiring institutional care. The need forhousing related support in rural England is unknown – nationally, over 1.2m vulnerable people are currently receiving housing-related support.One research report24 argued that housing support services are as necessary in rural areas as elsewhere, though noted the lack ofhard statistics to quantify need for support in rural areas. Whilst itsuggested services are needed for all groups in all tenures, serviceswere particularly required for older people, women suffering domesticviolence and people with drug and alcohol problems.
Housing qualityA decent home is defined as one above the statutory minimum standard (the fitness standard), which is in a reasonable state of repair,has reasonably modern facilities and provides a reasonable degree of thermal comfort.
Within all types of rural areas25, nearly one in three homes are non-decent.They comprise nearly 19% of all non-decent homes in England – roughly1.3m dwellings. In 200126, village (36%) and isolated rural areas (50%) had much higher levels of non decent homes than rural residential areas(26%). In rural areas, non-decent homes are predominantly in the privaterather than public sector. This contrasts with urban England where thereare higher levels of non-decent homes in the social sector (particularlylocal authority stock). In village centres and isolated rural areas 65% of non-decent dwellings are in the owner occupied sector and a further 27% are in the private rented sector. Similarly in rural residential areas72% of non-decent dwellings are owner occupied and 10% are in the private rented sector.27
Another measure of poor housing quality is unfitness28. This is thestatutory minimum standard that a dwelling should be to make it fit forhuman habitation29. In 2001 there were 166,000 unfit dwellings in ruralEngland – approximately 3.9% of all rural dwellings30. The most commonreasons nationally for unfitness are disrepair, inadequate foodpreparation and cooking facilities and dampness.
“Determining need in rural areas isdifficult because people may not havetheir needs identified due to the lack of available supported housing andhousing related support”24
21. Shelter (2004) Priced Out: The rising cost of ruralhomes. Investigation Report.
22. see the chapter on financial disadvantage23. Bevan M., Cameron S. and Coombes M. (2001)
The Role of Social Housing in Rural Areas.Chartered Institute of Housing
24. Countryside Agency (2002) Support and Housing in the Countryside: Innovation and choice.Countryside Agency, HACT and the HousingCorporation, Wetherby
25. ODPM (2003) English House Condition Survey(EHCS) 2001. Rural is defined/assessed by thesurveyor who inspects the condition of the property.All rural areas cover three categories: ruralresidential, village centre and isolated rural
26. Although information for 2003 was publishedshortly before this report was published, we haveretained the information for 2001 since it provides a more fine grained break down of urban and rural areas
27. Calculated from Table A3.19. www.odpm.gov.ukEHCS 2001
28. This is the current statutory minimum standard forhousing, defined under section 604 of the HousingAct 1985 and as amended by the 1989 LocalGovernment and Housing Act
29. see footnote 28 30. Table A6.9 Unfitness by urban/rural split 1996
and 2001. EHCS 2001.
CC32EvidenceSect2_AW.qxd 26/9/06 5:01 pm Page 67
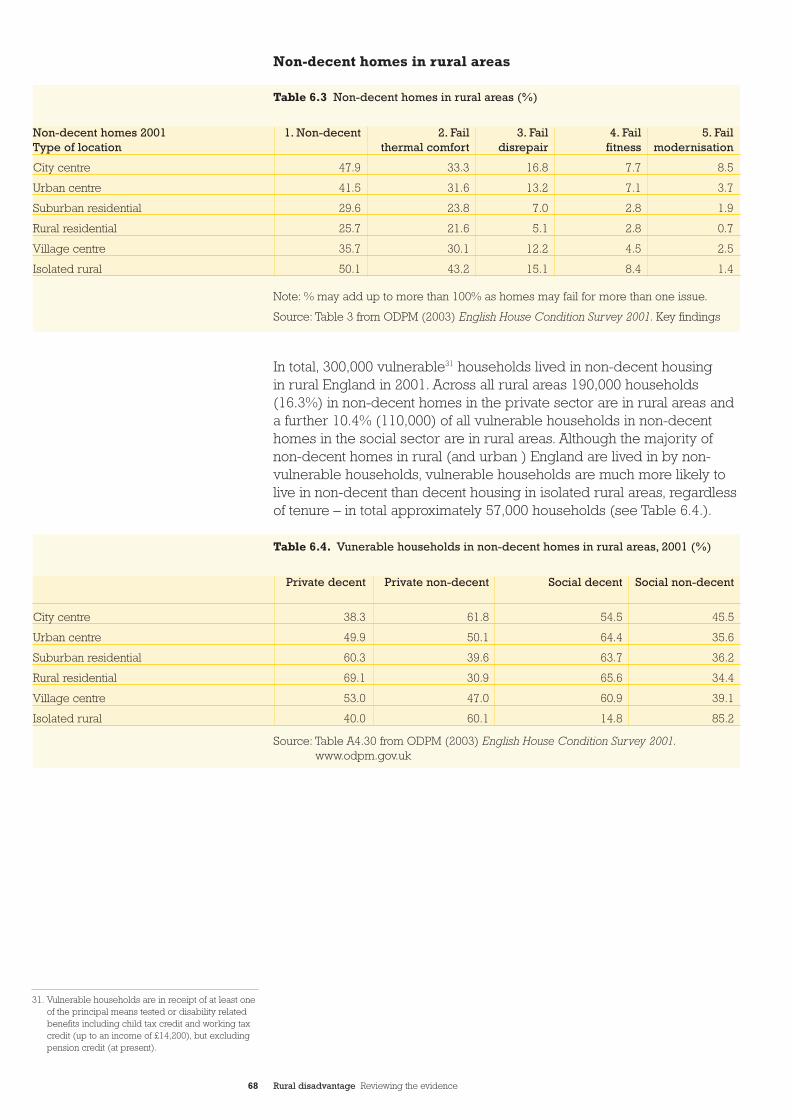
68 Rural disadvantage Reviewing the evidence
Non-decent homes in rural areas
In total, 300,000 vulnerable31 households lived in non-decent housing in rural England in 2001. Across all rural areas 190,000 households(16.3%) in non-decent homes in the private sector are in rural areas anda further 10.4% (110,000) of all vulnerable households in non-decenthomes in the social sector are in rural areas. Although the majority of non-decent homes in rural (and urban ) England are lived in by non-vulnerable households, vulnerable households are much more likely tolive in non-decent than decent housing in isolated rural areas, regardlessof tenure – in total approximately 57,000 households (see Table 6.4.).
Non-decent homes 2001 1. Non-decent 2. Fail 3. Fail 4. Fail 5. Fail Type of location thermal comfort disrepair fitness modernisation
City centre 47.9 33.3 16.8 7.7 8.5
Urban centre 41.5 31.6 13.2 7.1 3.7
Suburban residential 29.6 23.8 7.0 2.8 1.9
Rural residential 25.7 21.6 5.1 2.8 0.7
Village centre 35.7 30.1 12.2 4.5 2.5
Isolated rural 50.1 43.2 15.1 8.4 1.4
Table 6.3 Non-decent homes in rural areas (%)
Private decent Private non-decent Social decent Social non-decent
City centre 38.3 61.8 54.5 45.5
Urban centre 49.9 50.1 64.4 35.6
Suburban residential 60.3 39.6 63.7 36.2
Rural residential 69.1 30.9 65.6 34.4
Village centre 53.0 47.0 60.9 39.1
Isolated rural 40.0 60.1 14.8 85.2
Table 6.4. Vunerable households in non-decent homes in rural areas, 2001 (%)
31. Vulnerable households are in receipt of at least oneof the principal means tested or disability relatedbenefits including child tax credit and working taxcredit (up to an income of £14,200), but excludingpension credit (at present).
Note: % may add up to more than 100% as homes may fail for more than one issue.
Source: Table 3 from ODPM (2003) English House Condition Survey 2001. Key findings
Source: Table A4.30 from ODPM (2003) English House Condition Survey 2001.www.odpm.gov.uk
CC32EvidenceSect2_AW.qxd 26/9/06 5:01 pm Page 68
69 Rural disadvantage Reviewing the evidence
Fuel poverty A household is defined as fuel poor if its spends more than 10% of itsincome on fuel use and heating its home to an adequate standard ofwarmth (21ºC in the living room and 18ºC in other occupied rooms).Fuel poverty can damage people’s health as well as impact on theirquality of life. The fuel poor suffer more illnesses, such as influenza, heartdisease and strokes. There is also an increased risk of premature coldrelated deaths in the winter.
There is a large body of research about fuel poverty in general and fuelpoverty is well recognised as an issue in rural areas. Several surveyshave shown that fuel poverty is both more widespread and more acute(i.e. severe) in rural than urban areas33. In 1996, 23.8% of ruralhouseholds were in fuel poverty, but this had reduced to 11.6% in 2001.Some limited more recent figures for 2004 show that 7.1% of householdsare fuel poor in rural areas compared to 5.6% in urban areas. Thisamounts to around 297,000 rural households34. Almost 24% of fuel poorhouseholds live in rural areas35. Levels of extreme fuel poverty (wherehouseholds have to spend more than 20% of their income on fuel),were just over 10% in isolated rural areas.
There are links between non-decent homes and fuel poverty – many fuelpoor households live in non-decent homes (overall 60% of the fuel poorlive in non-decent homes in England). Similarly many homes that fail thedecent homes standard do so because they do not provide a reasonabledegree of thermal comfort (43% in isolated rural areas fail, 30% in villagecentres and 22% in rural residential areas). Standards of energyefficiency are lower in rural areas – average SAP36 ratings are only 32 inisolated rural areas and 43 in village centres compared to an urban andnational average of 5137.
2.What are the causes?
HomelessnessHomelessness is caused by a range of both structural and personalfactors. There is evidence to show that the personal, social and economiccharacteristics of homeless people can include drug and alcoholproblems, physical and mental health problems, long-termunemployment, poor educational achievement, fleeing domesticviolence and leaving institutions. Homelessness can also be caused bysomeone experiencing a traumatic event, the loss of a job (and thereforeincome) or a crisis such as a relationship breakdown or dispute.
A national review of local authorities’ homelessness strategies found that the three main causes of someone becoming homeless were:that their parent/friend/other relative was no longer willing (or able) to accommodate them; there was a violent relationship breakdown withtheir partner; or they had lost their tenancy through the termination of an Assured Shorthold Tenancy.
“older people in the UK are dyingbecause they live in homes withoutadequate heating. Cold and damphomes are not good for people’s health”32
32. John Clough, EAGA Chief Executive, 8 February2006, the Society Guardian
33. National Energy Action (2005) Rural Fuel PovertyResearch Report
34. Building Research Establishment (BRE) (2006)Detailed Breakdowns of Fuel Poverty in England in2004. Version 1. April 2006. A summary reportpresenting data produced by BRE on behalf of theDTI and Defra. Based on the 2004 English HouseCondition Survey using the full income definition.Table 28
35. ibid.36. This measure of energy efficiency is the energy
cost rating as determined by the Government’sStandard Assessment Procedure (SAP)
37. ODPM (2003) EHCS 2001 op. cit.
CC32EvidenceSect2_AW.qxd 26/9/06 5:01 pm Page 69
70 Rural disadvantage Reviewing the evidence
More structural causes relate to the lack of supply and availability of alternative, affordable housing and the benefits trap38 (see below).Nationally, there is a large amount of research evidence on homelesspeople without children (and their support needs), but relatively little into the support needs of homeless families39. Two recent evaluations40
of policies to tackle homelessness found that there was a need for betterdata on the causes, patterns and nature of homelessness. It has also been argued that more is known about routes into homelessness thanabout pathways out of it41.
A review of rural homelessness was published in 200242, before majorchanges were made to homelessness legislation. Nevertheless, thissuggested that one cause of rural homelessness is its relative invisibility,as there are few rough sleepers and as a result a lack of appropriateprovision. Virtually all social housing provision is for families who areseen as a high priority group and it has been argued that, “the largesthole in the current safety net is undoubtedly the lack of rehousing rightsfor non-priority groups”43.
Access to affordable housingThe processes leading to a lack of affordable housing for both lower andincreasingly middle income groups in rural areas are well documented.Rural areas are seen as attractive places to live and generally experiencea high level of demand and inward migration from commuters, peopleretiring and seeking those second or holiday homes. At the same time,the supply of housing is limited due to planning policies which restrict thesupply of land for housing to protect the environment. Government targetsare to build at least 60% of new homes on brownfield land and this hasbeen exceeded. Studies have pointed to the lack of smaller new homesbuilt. The majority of new housing in rural areas is built for the “upperend of the market”, often as four or five bedroomed executive homes.
Combined with this, there has been a low level of social housingprovision, with an insufficient level of new social housing built to replacesales through the Right to Buy. Only 5% of houses in villages are socialhousing, compared to a national average of 23%44. Only 13% of thehousing in predominantly rural districts is owned by local authorities or housing associations (compared to 22% in predominantly urbandistricts)45. Between 2001 and 2005 there have been about 7,500 additionsto affordable housing in predominantly rural districts each year. Data46
also shows that 19% of new affordable homes were built in these districtsalthough they contain 23% of the population. Furthermore, between 1980and 2005, the total stock of housing association and local authorityhousing in predominantly rural districts fell by 24% compared to 18% in predominantly urban districts47. There is, therefore much evidenceindicating, a shortfall in the funding for and provision of social housing in rural areas.
It has also been argued48 that the lack of affordable housing in rural areas has been caused by inappropriate planning decisions about whatconstitutes sustainable development and sustainable communities (e.g.concerns over increases in car use through additional house building).Recent research49 on affordable and supported housing in National Parksfound that “the need for landscape protection has generally constrainedthe supply of land for housing, increasing its value and encouraging
38. Cloke P., Milbourne P. and Widdowfield R .(2002)op. cit.
39. ODPM (2003) The Support Needs of HomelessHouseholds. Supporting People Research Summaryno. 7, ODPM
40. National Audit Office (2005) More than a Roof:progress in tackling homelessness; and ODPM(2004) Local Authorities’ Homelessness Strategies:Evaluation and Good Practice. Homelessnessresearch Summary no 1, ODPM
41. Bradshaw J., Kemp P., Baldwin S. and Rowe A.(2004) op. cit.
42. Cloke P., Milbourne P. and Widdowfield R .(2002)op. cit.
43. Bramley G., Fitzpatrick S., Karley N. K., Monk S.and Pleace N. (2005) Evaluation of English HousingPolicy: Theme 1: Supply, Need and Access. ODPM
44. Affordable Rural Housing Commission (ARHC)(2006) op. cit.
45. Commission for Rural Communities (2005) State of the Countryside 2005
46. ARHC (2006) op. cit. based on unpublished datafrom the ODPM
47. ARHC (2006) op. cit. based on data from ODPM48. For example, ARHC (2006) op. cit.49. Commission for Rural Communities (2006)
The Provision of Affordable and Supported Housing in England’s National Parks
CC32EvidenceSect2_AW.qxd 26/9/06 5:01 pm Page 70
71 Rural disadvantage Reviewing the evidence
developers to build larger properties at a price beyond the reach ofmany local people”.
The private rented sector has been in decline over recent years and in most rural areas there is very little private rented housing. There are,therefore, few alternatives for people who are unable to afford to buy a home on the open market or obtain social housing.
Supported housingRecent research50 on the housing and support needs of older people inrural areas found that their choices of alternative, suitable accommodationwere constrained and that low level support services were a crucial wayof helping people to remain in their current home. Based on five casestudy areas, the research found that there was a reasonable supply ofsheltered housing although this is not always popular, but that provisionof Extra Care housing schemes varied. In particular, it found thatenabling housing choices in rural areas was not just about housing, butabout making critical links with a range of services, especially transport.Indeed, “policies and investment aimed at promoting accessibility forolder people were likely to have knock-on effects in terms of helping to sustain housing options in rural areas”.
There seems to have been little research into the experiences of othergroups of people in rural areas who either may require more specialisedhousing or support to help them remain in their home.
Housing conditionsThere are a number of reasons why owner occupiers live in poorhousing conditions. Whilst low incomes and the lack of savings or theinability to borrow are the main constraints, these financial reasons areby no means the complete picture. Many owners are unaware of thecondition of their home or fail to give priority to a repair that needsurgent action; some take more interest in cosmetic and improvementwork than essential repairs; some make a deliberate decision not torepair if they are planning to move or if they think the cost of repairwould not be regained when the house is sold; and some experiencedifficulties in finding a trustworthy builder51. People’s stage in life andtheir length of occupancy also influence their repair behaviour, inparticular, older people are less likely to carry out work.
It is unclear the extent to which these factors may vary with rurality, if atall. There is little evidence on rural homeowners’ repair and investmentbehaviour, with the exception of the focus on older people and their careand repair needs52.
There is also some suggestion that the lack of affordable housing in rural areas means that low income households put up with poorer quality homes or pay higher housing costs53. For example, one review of research suggested that, “private landlords seem to be able in manymarkets to continue to rent low quality property, such is the demand foraccommodation”54.
50. Bevan M., Croucher K., Fletcher P., Rhodes D.and Riseborough M. (2005) The Housing andSupport Needs of Older People in Rural Areas.The Commission for Rural Communities/ TheHousing Corporation
51. Leather P., Littlewood A. and Munro M. (1998)Make Do and Mend: explaining home owners’approaches to repair and maintenance. The PolicyPress; and Leather P. and Moseley R. (2002)Investment in Housing: Towards better policies forrepairing and improving the housing stock. JosephRowntree Foundation
52. For example, Care and Repair England funded 8 pilot local housing options services for olderpeople as part of their ‘Should I Stay or Should I Go?’ national programme. The evaluation included a rural issues evaluation funded by the Countryside Agency
53. Centre for Sustainable Energy (CSE) (2002) Rural Fuel Poverty: defining a research agenda
54. Kintrea K. and Morgan J. (2005) Evaluation of EnglishHousing Policy: Theme 3: Housing Quality andNeighbourhood Quality. ODPM
CC32EvidenceSect2_AW.qxd 26/9/06 5:01 pm Page 71
72 Rural disadvantage Reviewing the evidence
Fuel poverty There are four main factors associated with rural fuel poverty –household income, fuel costs, property type and characteristics and access to the gas mains network. Research56 has recently beencompleted into the extent to which these contribute to rural fuel povertyand how they vary across different types of rural areas57. It suggests thegeneral causes of fuel poverty are more acute in rural areas, where only65% of dwellings have a mains gas supply58. Fuel costs for alternativeheating fuels, such as electricity, solid fuel or bottled gas, are often more expensive (average costs for electrically heated homes are 40%higher)59. Energy-inefficient housing is also more common in rural areas with a higher proportion of older, detached or semi-detachedproperties, often built with solid walls.
In general, there is a high level of association between fuel poverty andold age – over half of the fuel poor are older people (40% are householdswith one person over the age of 60 and 13% are couples over 60)60.There are no rural figures available.
3.What are the policies?
Homelessness policiesThere have been some significant changes to homelessness policy inrecent years and there is a Public Service Agreement (PSA) target toreduce homelessness. In particular, the strategy ‘More than a Roof’(2002)61 set out new approaches to tackle the personal and social causesof homelessness (for example, incorporating tackling health addictionsand assisting reintegration for people leaving institutions such as carehomes for young people, prisons, hospitals and the armed forces),alongside structural issues like housing supply. The Homelessness Act2002 takes forward much of the approach in the ‘More than a Roof’strategy. It requires every housing authority to take a more strategicapproach to homelessness by conducting a review of all forms ofhomelessness in their area (not just statutory homelessness) and havinga strategy to prevent homelessness and provide accommodation andsupport. Greater flexibility has been given to housing authorities to assistin addressing non-priority homelessness. The Act also extends thepeople given priority to include all 16-17 year olds and care-leaversaged 18-21.
An assessment on tackling homelessness in 200562 examined progress in reducing the number of homeless people living in temporaryaccommodation (particularly children in bed and breakfastaccommodation)and in tackling rough sleeping, as well as looking atnew, innovative local services. It included rural case studies but did not assess performance in rural, compared to other areas. It did note,however, the difficulty local authorities faced in delivering services to a widespread or scattered client group. A further inquiry63 intoperformance in tackling homelessness made no specific investigation of rural impacts.
55. National Energy Action (NEA) (2005) Rural FuelPoverty Research Report
56. NEA (2005) op. cit. quantitative research was basedon 200 interviews in four local authority areasskewed towards people who were more likely to beexperiencing or vulnerable to fuel poverty (e.g. older people, single parent households)
57. NEA (2005) op. cit used the old CountrysideAgency definition of remote and accessible rural wards
58. ODPM (2003) English House Condition Survey 2003.Annual report. They note that dwellings that do nothave gas central heating require higher levels ofinsulation to meet the decent homes standard
59. Centre for Sustainable Energy (CSE) (2002) RuralFuel Poverty: Defining a research agenda; andNational Energy Action (2005) Rural Fuel PovertyResearch Report
60. National Audit Office (2003) Warm Front: Helping tocombat fuel poverty. HC769. The Stationery Office
61. ODPM (2002) More than a Roof: A report intotackling homelessness
62. National Audit Office (200?) More than a Roof:Progress in tackling homelessness
63. House of Commons Public Accounts Committee(2005) The Office of the Deputy Prime Minister:Tackling Homelessness. The Stationery Office
“I think that in rural areas people...come from a more independentbackground where they have to do things for themselves”55
CC32EvidenceSect2_AW.qxd 26/9/06 5:01 pm Page 72
73 Rural disadvantage Reviewing the evidence
There has undoubtedly been a dramatic fall in rough sleeping, with theGovernment meeting its target to reduce the number of people sleepingrough by at least two-thirds by 2002. Rough sleeping has, however, beendescribed as ‘only the tip of the iceberg’.
In relation to young people, it has been argued that housing policy hastended to focus on the needs of the most vulnerable people, such asrough sleepers, teenage parents and care leavers, rather than onmainstream housing for young people64. A review of youthhomelessness65 found that there was no emergency accommodation foryoung people in more than a third of rural districts in 2002.
An evaluation66 of progress by local authorities in developinghomelessness strategies included rural authorities and found that,“districts and especially rural areas, are less well developed inpartnership working – though there are notable exceptions. Unitary andmetropolitan councils were significantly more likely to have linked theirstrategy with wider authority strategies such as Community Plans”. Ithas been argued67, however, that rural authorities are restricted in theirability to use the more flexible powers of The Homelessness Act 2002and cope with the extended definition of ‘priority need’, without acorresponding increase in affordable housing to rent.
The five year plan, Sustainable Communities: Homes For All, published in January 2005, sets out a strategy for increasing housing supply,affordability, quality and reducing homelessness. Then in June 2005,Sustainable Communities: Settled homes, changing lives, was published,setting out a strategy for tackling homelessness and, in particular, actionsto achieve the target of halving the number of households in temporaryaccommodation by 2010.
Direct payments enabling individuals to afford housing
Housing Benefit: this aims to contribute towards meeting the housing costs of people with low incomes in private or social rentedaccommodation (i.e. not owner occupied). It is administered by localauthorities. This is a means tested benefit so that eligibility is based on an individual’s financial (including savings) and householdcircumstances in comparison to their rental costs. Housing benefit hasbeen the subject of various reforms in recent years. There appears to belimited research into housing benefit in rural areas – particularly theextent to which those eligible are aware of and take-up their entitlement.Nationally around 63% of tenants68 in the social rented sector receivedHousing Benefit in 2000/01, compared to 25% of private tenants. Ingeneral, take-up is higher than for other means tested benefits69.
64. Bynner J., Londra M. and Jones G. (2004) op. cit.65. Centrepoint (2002) Rural Youth Affairs Briefing 2002.
Centrepoint/ The Countryside Agency66. ODPM (2004) Local Authorities’ Homelessness
Strategies: Evaluation and Good Practice.Homelessness Research Summary no 1. ODPM
67. Commission for Rural Communities (2006) RuralHousing: A place in the countryside?
68. Stephens M. (2005) Evaluation of English HousingPolicy 1975 – 2000: Evaluation of individual housingpolicies and technical report. ODPM
69. DWP (2003) Income Related Benefits: estimates oftake-up in 2000/01
CC32EvidenceSect2_AW.qxd 26/9/06 5:01 pm Page 73
74 Rural disadvantage Reviewing the evidence
Mortgage interest payments: since 1988 Income Support for MortgageInterest (ISMI) is available for owner occupiers who are unable to maketheir mortgage payments due to a loss of income. It is generally paiddirectly to the mortgage lender and since 1995 has only been availableafter a qualifying period of nine months once, private insurance provision(Mortgage Payment Protection Insurance (MPPI)) is exhausted. MPPI is voluntary and take-up has remained low70. Although arrears andpossessions affect only a minority of mortgagors, around 260,000claimed ISMI in 2001 and 18,280 houses were taken into possession71.An evaluation of ISMI72 concluded that the safety net is largely ineffective,although no specific rural evaluation seems to have been undertaken,or estimates made of the number of households whose homes havebeen saved by ISMI or MPPI.
A range of initiatives have been introduced in recent years to enablepeople to purchase a home. These include Homebuy (a form of equityloan where part of the initial purchase cost is met by a Registered SocialLandlord (RSL)), the Starter Homes Initiative and Key Worker Living.The Starter Homes Initiative – allows key public sector workers to access‘intermediate housing’ – particularly nurses, teachers and the police, tobuy homes in areas where high house prices would otherwise preventthem from living in or near the communities they serve. Housing need,therefore, was not the main determinant of access to subsidised housingfor key workers. Schemes include shared ownership, equity loans andother help. An evaluation73 found that the scheme had been moreeffective in retaining rather than recruiting staff, but that housing costsalone were not inhibiting recruitment. Local Education Authorities, forexample, operating in rural areas highlighted problems in recruiting to rural schools, because of the limited career prospects locally. Theresearch found concerns over the narrow definition of key workers and the exclusion of other low income employees.
Key Worker Living was announced in 2004 and supersedes the StarterHomes Initiative. It helps key workers in London, the South East and Eastof England to buy, rent or upgrade their home through equity loans,shared ownership and ‘intermediate’ renting (where rent levels are inbetween that of social and private landlords)74. There is no initial specificexamination of the impact of the initiative in rural areas in the evaluation.
Increasing the supply of rural affordable housing
Affordable housing through the planning system Circular 6/98 and Planning Policy Guidance Note (PPG)3 set out policieson the provision of affordable housing through the planning system, sothat a community’s need for affordable housing can be considered informulating development plans and deciding planning applications.Section 106 (s106) of the Planning and Compensation Act 199175 gavelocal authorities the power to negotiate with private developers toprovide affordable housing when they develop on allocated or marketsites – so allowing cross subsidy from the private sector in deliveringaffordable housing. These are often referred to as ‘section 106agreements’ or ‘quota polices’.
70. Joseph Rowntree Foundation (2005) Inquiry intoBritish Housing 1984 – 1991: What has happenedsince?
71. Wilcox S. (2002) Housing Review 2002/03. JosephRowntree Foundation, Chartered Institute ofHousing and Council of Mortgage Lenders
72. Ford J. and Quilgars D. (2001) Failing HomeOwners? The effectiveness of public and privatesafety nets, in Housing Studies, 16, 2, pp 147-162
73. Morgan J., Bramley G, Cousins L and Dunmore K.(2005) Evaluation of the Starter Home Initiative: Finalreport. ODPM; and ODPM (2005) Evaluation ofStarter Home Initiative. Research Report No. 221,ODPM
74. GHK Consulting Ltd. And University of Birmingham(2005) Evaluation of Key Worker Living: Earlyfindings; and ODPM (2005) Evaluation of KeyWorker Living. Research Report No 222, ODPM
75. Formerly s52 of the Town and Country Planning Act1969 and subsequently amended
CC32EvidenceSect2_AW.qxd 26/9/06 5:01 pm Page 74
75 Rural disadvantage Reviewing the evidence
A range of research has been undertaken on the effectiveness of thesepolicies, which has generally concluded that the land use planning systemis now very significant in terms of obtaining contributions of affordablehomes from the private sector76. Whilst most local authorities haveaffordable housing policies, it takes longer to develop new affordablehousing through s106. Negotiations over s106 are frequently cited asreason for delays in the progressing of general housing sites77. However, inrural areas where there is generally a lower level of new house building,the opportunity to obtain affordable housing in this way is limited.
The Planning and Compulsory Purchase Act 2004 has changed theemphasis of planning from regulation to supporting sustainabledevelopment and covers all planning obligations, not just those foraffordable housing. A suite of new Planning Policy Statements (PPS) arebeing produced to support the Act. Of particular relevance is PPS3which sets out how planning should deliver housing objectives. It waspublished in draft in December 2005 and requires Regional SpatialStrategies and Local Development Frameworks to set out how they willmeet rural housing needs. Sustainability Appraisals are required indeveloping local planning policies, but a recent review of affordablehousing suggests that they “are not sensitive to rural circumstances”78.The review also found widespread concern that regional plans, (RegionalPlanning Guidance or the new Regional Spatial Strategies) “are notproviding sufficient numbers to meet rural needs… [and] in some areasthis has resulted in a moratorium on rural development”.
In addition, a specific rural policy (the rural exceptions policy) wasoutlined in PPG3 in 2000. Local planning authorities can give permissionfor affordable housing to be built on ‘exception sites’ (sites that would not normally be granted planning permission and are not allocated fordevelopment in the local plan) provided the housing meets local housingneeds in perpetuity. An evaluation of rural exception sites79 found thatlocal authorities found the policy complex and time-consuming, where it can take as much as six years from finding a suitable site to completionof a small number of dwellings. It has also been argued80 that theperformance management criteria and requirements used by theHousing Corporation in providing funding for affordable housing,can make rural exception sites unviable.
More recently, a new policy of allowing planning authorities to allocatesites solely for affordable housing where it would support thesustainability of a rural area has been proposed in PPS3. A review81
found “a reluctance to allocate sites in smaller rural communities hasresulted in a reliance... on rural exception sites to deliver affordablehousing”. Whilst there were some exceptions, it also found that theexisting planning related tools “are not being picked up and used by the majority of local authorities” due to a lack of political will, limited staff and financial resources, limited skills or knowledge, or difficulties in getting proposed policies approved by the Planning Inspectorate.
76. National Audit Office and the Audit Commission.(2005) Building more affordable homes: Improvingthe delivery of affordable housing in areas of highdemand. The Stationey Office
77. Bramley G., Fitzpatrick S., Karley N. K., Monk S. andPleace N. (2005) op. cit.
78. ARHC (2006) op. cit.79. Crook A., Curry J., Jackson A., Monk S., Rowley S.,
Smith K. and Whitehead C. (2002) Planning Gainand Affordable Housing: Making it Count. JosephRowntree Foundation
80. Chartered Institute of Housing (2005) Affordable Rural Housing Commission. Response by the Chartered Institute of Housing to the Call for Evidence
81. ARHC (2006) op. cit
CC32EvidenceSect2_AW.qxd 26/9/06 5:01 pm Page 75
76 Rural disadvantage Reviewing the evidence
Funding for rural affordable housingBetween 1991 and 2005, the Housing Corporation provided funding toHousing Associations for affordable rural housing through an annualtarget in settlements of less than 3,000 population. This was inrecognition of the difficulty of building in small settlements. Over theyears, the target has been met in every year but one. For the 2006/08allocation, a national target was removed in line with the devolution oflocal priority setting to Regional Housing Boards, although boards wererecommended to provide at least the annual levels of funding allocated in2004/05. In settlements of less than 3,000 population funding will beavailable for 4,176 units over two years and in settlements withpopulations between 3,000 and 10,000 the allocation is for 2,156 unitsover two years82. Concern has also been raised recently that theadditional costs of rural provision are no longer compensated for in theway that the funding for schemes is calculated by the HousingCorporation83.
Safeguards to the supply of rural affordable housingThere are policies to ensure that the existing supply of social housing in rural areas is retained and rural safeguards have been introduced to the schemes which enable those in affordable housing to becomehomeowners. The Right to Acquire, which allows eligible tenants ofRegistered Social Landlords to buy their home, does not apply in ruralsettlements of less than 3,000 people. There are also re-sale restrictionson council tenants’ right to buy their homes in National Parks, Areas ofOutstanding Natural Beauty and designated rural areas, which requirethe property to be resold to someone living or working in the area forthree years, or that the landlord should be be offered the first refusal tobuy back the property if it is resold within 10 years. It has been arguedthat there has been limited take-up of these safeguards, partly due to the designation criteria and the lack of funding to allow landlords to buyproperties. In addition, Social Homebuy, a scheme which allows peoplein rented property to buy a stake in their home, is not available insettlements of less than 3,000 population. New Build Homebuy schemeson rural exception sites can limit the amount of equity a resident can buy (although this does not apply to homes provided through section106 agreements.).
Other rural affordable housing initiativesRural Housing Enablers are locally based advisers who work closely with local communities to assist in the development of local affordablehousing. They are currently funded through Defra’s Rural Social andCommunity Programme. An evaluation of the Rural Housing Enablerprogramme in 200584 found they were successful in raising the profile of rural housing at the local level and were starting to deliver moreaffordable housing. However, their geographical coverage wasincomplete, being based mainly in the southwest, southeast and east of England.
82. ARHC (2006) op. cit83. ARHC (2006) op. cit84. Three Dragons, Smith J. and Broomfield R. (2005)
Review of the Rural Housing Enabler Programme.Final Report. The Countryside Agency
CC32EvidenceSect2_AW.qxd 26/9/06 5:01 pm Page 76
77 Rural disadvantage Reviewing the evidence
Supported housing policies
The emphasis of policy is now on support services to vulnerable peoplein their own homes, rather than specialist buildings for specific groups of people. The Supporting People programme provides housing relatedsupport to prevent problems that can often lead to hospitalisation,institutional care or homelessness and to help the smooth transition toindependent living for those leaving an institutionalised environment85.It provides revenue funding for ‘low intensity’ support for vulnerablepeople in either supported housing (such as sheltered housing, extracare housing or hostels) or through floating services (peripateticservices that visit people in their own homes). The services can includea home visit for a short period each week or an on-site full-time supportworker for a long period of time. Housing related support can includethings like:
• helping people to learn life skills – such as cooking, laundry,looking after money or understanding tenancy agreements;
• support to get benefits and services – receiving benefits orregistering at the local GP;
• support for training or employment; and• support through warden or alarm services.
The programme was launched in April 2003 and is administered byunitary and county authorities, who must assess needs and supply andproduce Supporting People strategies (covering a five year period) fortheir areas. The programme is significantly different from the previousarrangements as it transferred funding from a number of sources,including housing benefit, over to local authorities. It attempted tointroduce a co-ordinated approach, based on systematic needsassessments. The costs for Supporting People have been much morethan expected and an independent review was commissioned inOctober 2005. A consultation was recently undertaken on the SupportingPeople distribution formulae.
There has been limited evaluation of the programme and of the valueand impact of low intensity floating support services. An overallassessment of the financial benefits86 found that, “although there is abody of qualitative research that identifies the types of benefits which arereported, or expected from Supporting People services, as yet therehave not been any large scale evaluations of housing related support forany client groups and no information on the level of impact that theseservices have on the behaviour and experiences of those receivingthem”. The review also found that some benefits were difficult tomeasure, such as improved quality of life, increased ability to participatein the community, decreased fear of crime and easier access toappropriate services.
An independent review87 concluded that, “there is currently nounderstanding about the long term impact of the programme on serviceusers”, although it did highlight that there is some indication of outcomesat the point of departure of the service user. The first report after theintroduction of a client record system88 showed that almost 210,000 newusers and single homeless people were the biggest client group andpeople aged 18-24 were the largest proportion of new clients. A ruralbreakdown is not available.
85. www.spkweb.org.uk86. Matrix Research and Consultancy Limited (2004)
Supporting People: Benefits Realisation of theSupporting People Programme. ODPM
87. Sullivan E. (RSM Robson Rhodes LLP) (2004) Reviewof the Supporting People Programme: Independentreview. ODPM
88. JCHR (2004) Supporting People Client records –annual report 2003/04
CC32EvidenceSect2_AW.qxd 26/9/06 5:01 pm Page 77
78 Rural disadvantage Reviewing the evidence
A further investigation in 200589 found that whilst services had improved,local delivery was variable – both in terms of quality and type of provision and eligibility. It has also been noted that, “evidence from AuditCommission inspections suggests that many authorities have been slowto take ownership of Supporting People at the corporate level, therebymissing opportunities to make best use of the value of its services... andcompared to other local service areas, there is a relatively high number of underperforming authorities for Supporting People”90.
An earlier assessment91 of the Rural Supported Housing Programme and a more recent review92 of older people and supported housing inrural areas found low level ‘preventative’ services (such as assistancewith shopping, gardening, home maintenance and engaging in socialactivities) were invaluable in enabling people to stay in their own homes.However, these services were not a statutory requirement nor were theycovered under the Supporting People programme. Most areas wereworking hard to get services in place, usually provided by the voluntarysector with funding from social services and other sources. Similarly,it found that rural projects needed different delivery patterns to urban projects.
Housing quality policies
Improving housing conditions is a key part of Government policy andthere is a PSA target to bring all social housing into decent condition.This seeks most of the improvement taking place in deprived areas, andto increase the proportion of private housing in decent conditionoccupied by vulnerable groups by 2010. There are three main policiesfor tackling private sector non-decent homes and for reducing thenumber of vulnerable people living in them: local authority assistancee.g. grants, low cost loans and equity shares; the warm front programme;and the housing market renewal fund (and other regeneration initiatives).However, the nine HMR fund areas are predominantly urban.
Data reveals that in 2001 approximately 3.9% of all rural dwellings wereunfit. This is a reduction from 4.9% in 1996, but the rate of improvementdoes not seem to have been as pronounced as in urban areas (whichreduced from 7.8% to 4.2%)93. An investigation in 2004 on the DecentHomes strategy94 made no specific assessment of whether the decenthomes strategy is working in rural areas.
The 1996 Housing Grants, Construction and Regeneration Act and later2002 reforms were designed to make the system of private sectorhousing renewal more flexible. Mandatory grants for unfit propertieswere abolished, which had previously been identified as a majordisincentive to declaration of Renewal Areas by local authorities. Inparticular, it has been noted that95 criteria for renewal areas “can preventauthorities from tackling equally pressing problems in smallercommunities, such as former mining villages...”. The Regulatory Reform(Housing Assistance) Order (SI 2002/1860) came into force in July 2002and repealed much legislation on renewal grants to homeownersreplacing it with new powers of assistance. There were also a number ofrelated reforms in the Housing Act 2004. Local Authorities have astatutory duty to review the condition of their housing stock and powersto intervene where they are unacceptable.
89. Audit Commission (2005) Supporting People.Housing National Report October 2005.
90. ODPM (2005) Creating Sustainable Communities:Supporting Independence. Consultation on aStrategy for the Supporting People Programme
91. jointly funded by the Housing Associations’Charitable trust (HACT), the Countryside Agencyand the Housing Corporation for three years from1997. Countryside Agency (2002) Support andHousing in the Countryside: innovation and choice.Countryside Agency, HACT and the HousingCorporation
92. Bevan M., Croucher K., Fletcher P., Rhodes D.and Riseborough M. (2005) The Housing andSupport Needs of Older People in Rural Areas.The Commission for Rural Communities/ TheHousing Corporation
93. Table A6.9 Unfitness by urban/rural split 1996 and 2001. EHCS 2001
94. House of Commons ODPM: Housing, Planning,Local Government and the Regions Committee(2004) Decent Homes. Volume I. Report
95. DETR (2001) Private Sector Housing Renewal:Reform of the Housing grants, Construction andRegeneration Act 1996, Local Government andHousing Act 1989 and Housing Act 1985
CC32EvidenceSect2_AW.qxd 26/9/06 5:01 pm Page 78
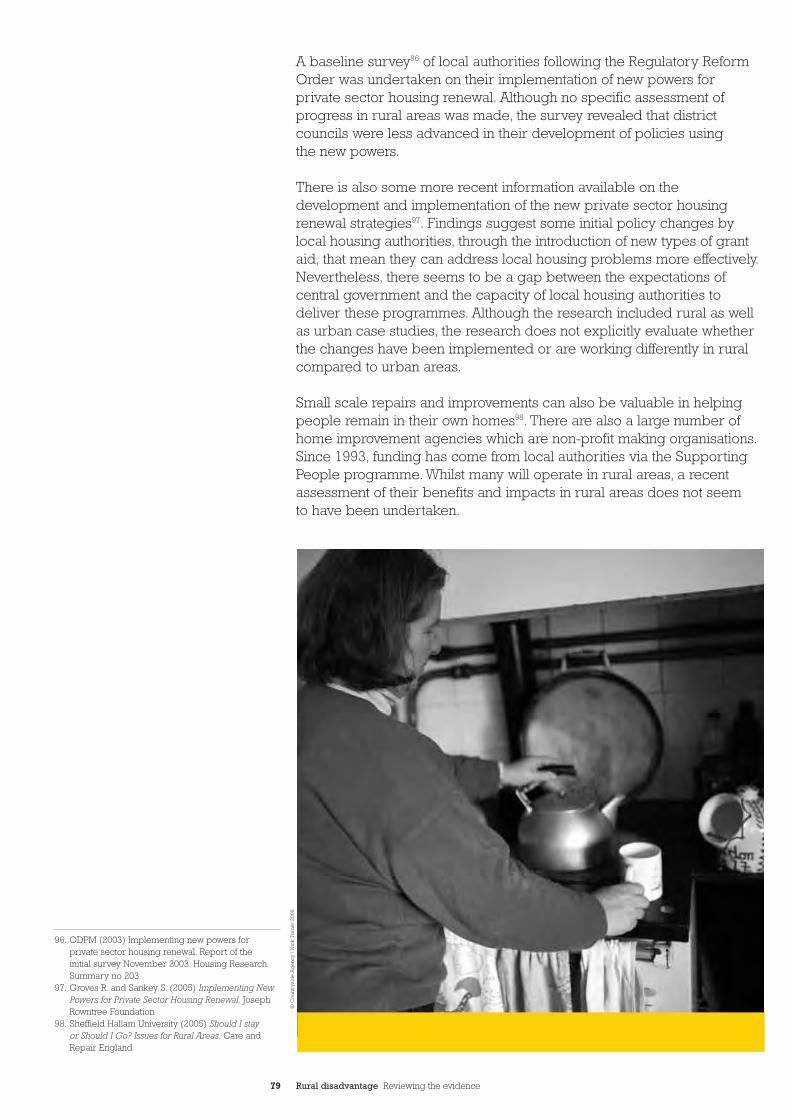
79 Rural disadvantage Reviewing the evidence
A baseline survey96 of local authorities following the Regulatory ReformOrder was undertaken on their implementation of new powers forprivate sector housing renewal. Although no specific assessment ofprogress in rural areas was made, the survey revealed that districtcouncils were less advanced in their development of policies using the new powers.
There is also some more recent information available on thedevelopment and implementation of the new private sector housingrenewal strategies97. Findings suggest some initial policy changes bylocal housing authorities, through the introduction of new types of grantaid, that mean they can address local housing problems more effectively.Nevertheless, there seems to be a gap between the expectations ofcentral government and the capacity of local housing authorities todeliver these programmes. Although the research included rural as wellas urban case studies, the research does not explicitly evaluate whetherthe changes have been implemented or are working differently in ruralcompared to urban areas.
Small scale repairs and improvements can also be valuable in helpingpeople remain in their own homes98. There are also a large number ofhome improvement agencies which are non-profit making organisations.Since 1993, funding has come from local authorities via the SupportingPeople programme. Whilst many will operate in rural areas, a recentassessment of their benefits and impacts in rural areas does not seem to have been undertaken.
96. ODPM (2003) Implementing new powers for private sector housing renewal. Report of the initial survey November 2003. Housing ResearchSummary no 203
97. Groves R. and Sankey S. (2005) Implementing NewPowers for Private Sector Housing Renewal. JosephRowntree Foundation
98. Sheffield Hallam University (2005) Should I stay or Should I Go? Issues for Rural Areas. Care andRepair England
© C
ount
rysi
de
Ag
ency
/ N
ick
Tur
ner
2006
CC32EvidenceSect2_AW.qxd 26/9/06 5:01 pm Page 79
80 Rural disadvantage Reviewing the evidence
Fuel poverty policies99
Tackling fuel poverty is a key policy for the government and it has a joint DTI and Defra PSA target. The target aims to end fuel povertyamongst vulnerable households by 2010 and to end fuel poverty in otherhouseholds by 2016. Vulnerable households are defined as thosecontaining children or who are elderly, sick or disabled. Policy prioritiesare set out in the 2001 action plan ‘UK Fuel Poverty Strategy’ and annualprogress reports have been published since 2003. These do not containany specific rural monitoring. A further action plan was published in2004 – ‘Fuel Poverty in England: the Government’s Plan for Action’.
Action has focused on addressing both household income and homeenergy efficiency. The latest annual progress report100 shows decreasingnumbers of households in fuel poverty. It estimated that there were 1.2mfuel poor households in England in 2004 of which one million werevulnerable households, a reduction from five million and four million.respectively in 1996. However, there has been little reduction between2003 and 2004 due to increases in energy prices. The progress reportsuggested101 that the number of vulnerable households in fuel povertywas likely to rise by one million between 2003 and 2006.
Recommendations with specific resonance to tackling fuel poverty in rural areas, relate to increased resources for areas with no mains gas,extending the gas network where possible and where not, providing arange of other measures. It has been estimated that 40% of the fuel poorare in areas with no mains gas.
There are some specific issues relating to rurality that seem to makeenergy efficiency programmes more difficult to deliver:
• Some homes are affected by heritage or conservation measures,which restrict the changes that can be made to their physicalappearance;
• rural communities can be less receptive and trusting of helpavailable;
• there are fewer facilities where people can receive information;• people are less likely to talk about their needs with others;• it is more difficult for service providers to identify or locate fuel
poor households;• some of the more common promotional techniques become more
time consuming and costly in rural areas;• service providers are influenced by targets and profit margins
which lead to a focus on work in larger centres of population102.
WarmfrontThe main programme aiming at the fuel poor in private sector housing is Warmfront. This was established in 2000 replacing a previous HomeEnergy Efficiency Scheme. It aims to improve energy efficiency forvulnerable households in fuel poverty in the private sector by providinggrants for insulation, energy efficiency measures and heatingimprovements. Grants are available to both private renters and owneroccupiers in receipt of specific benefits and there is a target that 60% of grants should go to those aged over 60. By the end of 2005, over 1.1mhouseholds had received assistance103.
99. Other references reviewed but not specificallycited include: Building Research Establishment(2005) Detailed breakdown of fuel poverty inEngland in 2003. A summary report presentingdata produced by the BRE on behalf of DTI andDefra. Version 1, July 2005; and Sefton T. (2004)Aiming High – an evaluation of the potentialcontribution of Warm Front towards meeting theGovernment’s fuel poverty target in England.ESRC Centre for Analysis of Social Exclusion,London School of Economics. Nov 2004. A reportto the EAGA Partnership Charitable Trust
100. DTI and Defra (2006) UK Fuel Poverty Strategy:Fourth Annual Progress Report 2006
101. Fuel Poverty Advisory Group (FPAG) (2006) TheFuel Poverty Advisory Group Fourth Annual report2005. Published by DTI on behalf of FPAG
102 National Energy Action (NEA) (2005) Rural FuelPoverty Research Report. Based on quantitativeinterviews as before and qualitative interviewswith providers and local authorities
103. DTI and Defra (2006) op. cit.
CC32EvidenceSect2_AW.qxd 26/9/06 5:01 pm Page 80
81 Rural disadvantage Reviewing the evidence
An assessment in 2003 found that the Warmfront scheme was poorlytargeted and making a smaller contribution to tackling fuel poverty thanit could. The main issues were:
• a mismatch between eligibility for the scheme and fuel poverty.Ineligible but fuel poor households include (1) those who could be eligible but are not claiming benefits (2) those not considered‘vulnerable’ (i.e. ineligible for the benefits, with incomes just overthe benefit eligibility level) and (3) people with very high heatingcosts in hard to heat homes. Similarly, some households who are notfuel poor but receiving benefits are eligible for the Warmfrontscheme. Estimates of this group ranged from 70%104 of Warmfrontrecipients to around 66% of eligible households105;
• the heating and insulation measures available under the schemewere insufficient to move households out of fuel poverty;
• problems associated with targeting – only 14% of grants reached the least energy efficient homes and there is limited targeting ofhouseholds in greatest need (since it is run on a first-come-first-served basis).
In relation to its rural impact, the assessment106 found a disproportionatefocus on the distribution of grants to urban households largely due to the relative ease with which these households can be identified. TheWarmfront measures were only suitable for certain homes – those withmains gas or cavity walls. It has been suggested that between 5%107 and10%108 of Warmfront grants were claimed by people living in rural areas.
Since this assessment and a Public Accounts Committee hearing,there have been some changes to the scheme launched in June 2005109.It now provides central heating for all eligible households, increasing thelevel of grant, targeting action on areas with high proportions of fuel poorhouseholds and increasing the energy efficiency of properties to a levelwhere there is minimal risk of fuel poverty. In particular, scheme providersare aiming to promote and target rural areas more and have greaterflexibility to tackle ‘hard to treat’ homes (e.g. by installing oil based centralheating systems)110. These are recent changes and an assessment of theirsuccess in tackling rural fuel poverty has not been made111.
Warm ZonesWarm Zones was a three year initiative launched in 2001 by Defra andDTI based on five pilot zones112. An evaluation113 of the warm zones pilots in their second year found that take up in the rural114 wards ofNorthumberland was much lower (at 31%) than in the urban wards(51%). It suggested that zones with rural areas faced a more difficult taskfor a range of reasons:
• difficulties in carrying out assessments due to the disperseddistribution of the fuel poor;
• the large geographical areas covered making ‘word of mouth’publicity less effective than in urban zones;
• rural households were less likely to claim the warmfront passportbenefits;
• the measures were less relevant to rural households off the gasnetwork and possibly built with solid walls;
• a reliance on self assessment forms rather than door to doorassessments, due to the large areas and dispersed distribution; and
• a perceived rural culture of suspicion of outside agencies.
104. National Audit Office (2003) Warm Front: helpingto combat fuel poverty. The Stationery Office
105. Fuel Poverty Advisory Group op. cit.106. National Audit Office (2003) Warm Front: helping
to combat fuel poverty. The Stationery Office107. Eaga Charitable Trust (2002) Rural Fuel
Poverty:Defining a research agenda108. Defra (2004) quoted in NEA (2005) op. cit.109. Changes were announced in Fuel Poverty in
England: the Government’s Plan for Action,published November 2004
110. These changes also take account of some of therecommendations made by NEA (2005) op. cit.
111. Some limited (non-rural specific) information onthe new phase is available DTI and Defra (2006)UK Fuel Poverty Strategy: Fourth Annual ProgressReport 2006
112. The WarmZone pathfinders are Hull, LB Newham,Northumberland, Sandwell and Stockton.
113. Energy Saving Trust (EST), Centre for SustainableEnergy (CSE) and National Energy Action (NEA) (2004) Warm Zones external evaluation.Second Report
114. Uses the Countryside Agency older classificationof rural wards
CC32EvidenceSect2_AW.qxd 26/9/06 5:01 pm Page 81
82 Rural disadvantage Reviewing the evidence
They also concluded that hard to treat housing packages, beyond those within the current Warm Front and Energy Efficiency Commitment(EEC) programmes, needed to be offered in rural areas (e.g. using oilcentral heating boilers, solid wall insulation, renewables and gas network extensions).
The final evaluation report115 found that “Warm Zones reached manymore fuel poor and near fuel poor households than would normally havebeen reached under a ‘business as usual’ scenario”. However, successwas more likely where there are clusters or concentrations of fuelpoverty in a location and these were “more likely to be urban in nature,although Warm Zones covering rural areas can be viable if there aresubstantial ‘pockets’ of concentrated fuel poverty”. Northumberland,one of the pilot areas, is currently running a ‘deep rural’ project whichwill help identify whether a zones approach is cost effective where fuel poverty is dispersed.
The pilot has now finished and Warm Zones Ltd has been established as a not for profit subsidiary of National Energy Action (NEA).It currently works in 18 local authority areas including all five areaswhere it was piloted.
Social housing and fuel povertyFuel poverty in social housing is now addressed through otherprogrammes especially the Decent Homes Standard and the EEC.
The EEC: places an obligation on electricity and gas suppliers topromote improvements in household energy efficiency. The EC for 2002-05 required suppliers to focus at least 50% of energy savings on apriority group of low income consumers. The targets were met, but it isnot possible to measure the impact on fuel poverty since it is currentlymonitored on energy savings from measures installed, rather than thenumber of households receiving measures. Energy companies alsoundertake a range of other actions beyond their statutory duties topromote energy efficiency and a survey found that over 142,000households were helped outside of the EEC system in 2005116.
Decent Homes Standard: homes receive energy efficiency measuresunder the Decent Homes programme or as part of wider local authorityaction to improve housing conditions. Evaluation is currently underwayon the extent to which social landlords are carrying out work beyond theDecent Homes Standard to address fuel poverty.
Mains gas extensionsWork is also being undertaken by a Design and Demonstration Unitwithin the DTI to test models of extending the gas network, providing gas connections to non-gas communities. It is also currently evaluatingthe effectiveness of community based renewable energy sources as away of reducing fuel poverty, particularly in rural communities, usingdemonstration projects117.
115. EST, CSE and NEA (2006) Warm Zones ExternalEvaluation. Final report. A report to Defra and DTIMarch 2005
116. DTI (2006) Fuel Poverty Monitoring: Energycompany schemes 2004 and 2005. Annex to theUK Fuel Poverty fourth annual progress report2006 on www.dti.gov.uk
117. Design and Demonstration Unit (DDU) (2005)Leap-frogging the Status Quo. Design andDemonstration Unit First Annual Report. October2003 – March 2005. DDU, DTI
CC32EvidenceSect2_AW.qxd 26/9/06 5:01 pm Page 82
83 Rural disadvantage Reviewing the evidence
4. Summary
• There is a growing body of research evidence on the lack of accessto affordable housing for some people in rural areas.Young peopleare particularly affected and the lack of affordable housing iscontributing to the out-migration of some young people from ruralareas. Homelessness appears to be a growing problem in ruralareas, although data fails to capture rural issues such as hiddenhomelessness. It has been argued that homelessness in rural areas is,in part, caused by the limited supply of affordable housing.
• There is some information available on the quality of housing inrural areas and the housing conditions in which people live.Considerable numbers of non-decent homes are located in ruralareas, although the reasons for this seem to be poorly understood.Fuel poverty is well recognised as an issue in rural areas where itis widespread. Cultural issues such as a reluctance to take-upentitlements to benefits and grants have been suggested, in part, ascontributing to high levels of rural fuel poverty. Factors such as thelack of access to mains gas and energy inefficient homes also lead tohigh levels of rural fuel poverty.
• There are several policies designed to improve the supply ofaffordable housing in rural areas and some evaluations of theirimpact have been undertaken. Understanding of the impact ofpolices to improve the quality of housing in rural areas is fairlylimited. However, the impact of fuel poverty policies in rural areasseem to have been well researched.
CC32EvidenceSect2_AW.qxd 26/9/06 5:01 pm Page 83
84 Rural disadvantage Reviewing the evidence
Health disadvantage
This section focuses on poor physical health, as well as mental health and well-being. Poor health can be both a cause and driver of disadvantage. In particular, ill health can increase the risk ofunemployment or worklessness (economic inactivity) and, as a result,impact on people’s income. It can also impact on other forms of activitysuch as social and leisure participation. There are a large number ofdifferent health conditions, so we focus here on the most permanenthealth issues such as long term health conditions and those needingcare, since these are the most likely to impact on people’s ability toundertake day to day activities. We also examine life expectancy. Ourreview mainly covers primary health needs, rather than more specialistneeds such as optical health. Care to help someone remain in their ownhome (‘supporting people’) is covered in the chapter on housing.
1.What is the problem?
General measures of people’s health, called health outcomes showbetter rates of health in rural than urban areas, on average and healthinequalities have often been seen as an urban issue. The proportion whoregarded their health to be ‘very good’ was higher in villages andhamlets (44.3%), than in town and fringe areas (35.6%) in 20023.However, these averages tend to mask certain health inequalities and it is clear that not all people living in rural areas are healthy: “the ruralpoor may be equally at risk of suffering from health inequalities as theurban poor, but their poorer health outcomes are hidden by favourableaverages”4. It has been suggested that some of the favourable ruralhealth averages are likely to be explained by differences in thedemographic and socio-economic profiles of rural areas, rather thanby local or spatial issues.
There are also differences between rural areas – a few studies have nowpointed to a ’U’ shape distribution of illness. Research, for example, onlimiting long-term illness shows highest rates in the most urban and themost peripheral rural areas5. Whilst there is data available on the scale of some key health outcomes in rural areas (such as those with limitinglong-term illnesses), there seems to be little understanding of the impacton people’s day to day lives.
Mortality and life expectancyThe latest available statistics for rural districts show6:
• Infant mortality: there were 4.23 deaths up to the age of one per1000 live births in 2004 in the most rural districts (‘rural 80’districts) and 4.15 in rural districts as a whole (Table 7.1).Data for 20027 (Table 7.2) showed that deaths of infants under oneyear were more likely with parents in routine and manual socialclass, especially in remote rural areas.
• Male life expectancy8 at birth in 2002-04 is 77.7 for all ruraldistricts. Men in the most rural districts (‘rural 80’) can expect tolive slightly longer than those in more mixed urban areas.
• Female life expectancy at birth in 2002-04 is 81.7 for all ruraldistricts. As for men, women in the most rural districts can expect to live slightly longer than in more mixed rural/urban areas.
1. Sir Liam Donaldson (2006) Medical Chief Welcomes Rural Health Information Guide. Defrapress release 7 February 2006
2. British Medical Association Board of Science (2005)Healthcare in a Rural Setting
3. Commission for Rural Communities (2005) The State of the Countryside 2005. Based on theHealth Survey for England 2002
4. Asthana S. and Halliday J. (2006) What Works inTackling Health Inequalities: Pathways, policies andpractice through the lifecourse. The Policy Press
5. Barnett S., Roderick P., Martin D. and Diamond I.(2001) A Multi-level Analysis of the Effects of Ruralityand Social Deprivation on Premature Limiting Long-term Illness. Journal of Epidemiology andCommunity Health, 55, 44-51
6. Commission for Rural Communities (2006) The State of the Countryside 2006
7. Countryside Agency (2004) State of the Countryside2004. Based on ONS Births and Mortality Statistics
8. Life expectancy at birth is an estimate of thenumber of years a newborn baby would survive,were he or she to experience the particular area’sage-specific mortality rates for that time periodthroughout his or her life
7“We often think of life in rural areas asbeing something of an idyll. But there isnow a wealth of evidence highlightingissues of rural deprivation and socialexclusion which has a potential impacton the health of those living in ruralcommunities”1
“Access to services is a major difficultyfor many rural residents, and there isevidence that some health outcomes forrural patients are poor compared withthose from urban areas”2
CC32EvidenceSect2_AW.qxd 26/9/06 5:01 pm Page 84
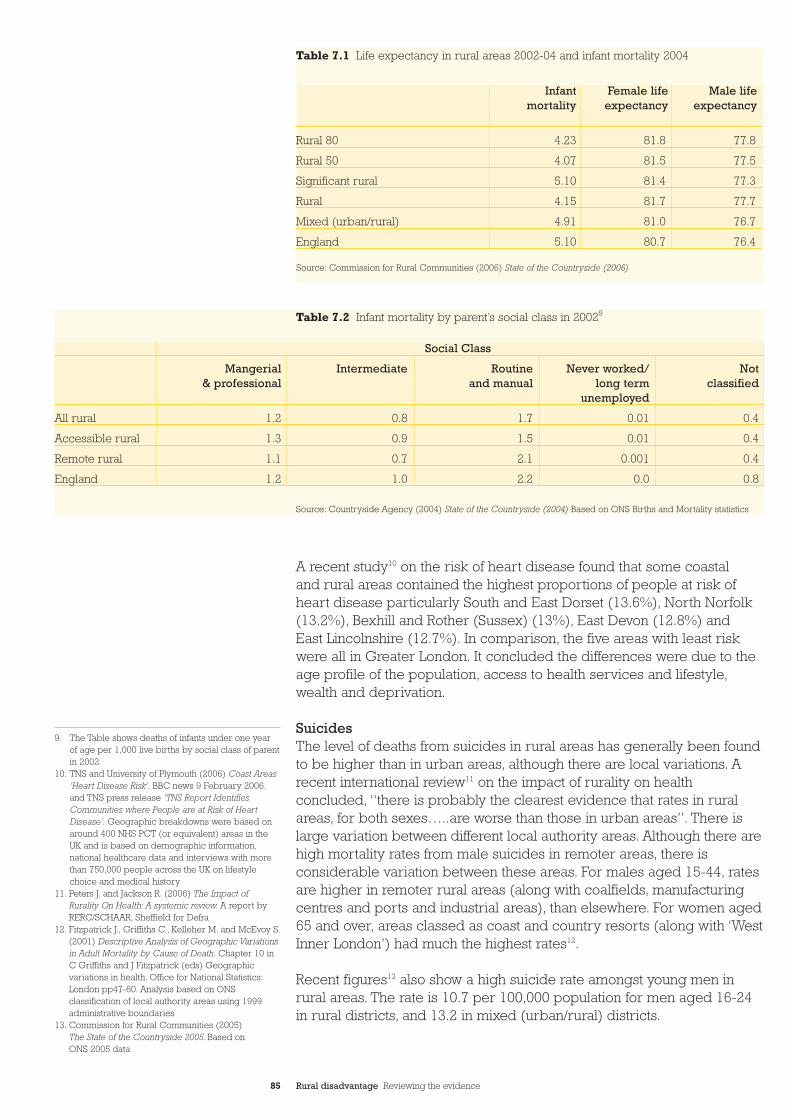
85 Rural disadvantage Reviewing the evidence
A recent study10 on the risk of heart disease found that some coastal and rural areas contained the highest proportions of people at risk ofheart disease particularly South and East Dorset (13.6%), North Norfolk(13.2%), Bexhill and Rother (Sussex) (13%), East Devon (12.8%) and East Lincolnshire (12.7%). In comparison, the five areas with least riskwere all in Greater London. It concluded the differences were due to theage profile of the population, access to health services and lifestyle,wealth and deprivation.
SuicidesThe level of deaths from suicides in rural areas has generally been foundto be higher than in urban areas, although there are local variations. Arecent international review11 on the impact of rurality on healthconcluded, “there is probably the clearest evidence that rates in ruralareas, for both sexes…..are worse than those in urban areas”. There islarge variation between different local authority areas. Although there arehigh mortality rates from male suicides in remoter areas, there isconsiderable variation between these areas. For males aged 15-44, ratesare higher in remoter rural areas (along with coalfields, manufacturingcentres and ports and industrial areas), than elsewhere. For women aged65 and over, areas classed as coast and country resorts (along with ‘WestInner London’) had much the highest rates12.
Recent figures13 also show a high suicide rate amongst young men inrural areas. The rate is 10.7 per 100,000 population for men aged 16-24in rural districts, and 13.2 in mixed (urban/rural) districts.
9. The Table shows deaths of infants under one year of age per 1,000 live births by social class of parentin 2002
10. TNS and University of Plymouth (2006) Coast Areas‘Heart Disease Risk’. BBC news 9 February 2006.and TNS press release ‘TNS Report IdentifiesCommunities where People are at Risk of HeartDisease’. Geographic breakdowns were based onaround 400 NHS PCT (or equivalent) areas in theUK and is based on demographic information,national healthcare data and interviews with morethan 750,000 people across the UK on lifestylechoice and medical history
11. Peters J. and Jackson R. (2006) The Impact of Rurality On Health: A systemic review. A report byRERC/SCHAAR, Sheffield for Defra
12. Fitzpatrick J., Griffiths C., Kelleher M. and McEvoy S.(2001) Descriptive Analysis of Geographic Variationsin Adult Mortality by Cause of Death. Chapter 10 inC Griffiths and J Fitzpatrick (eds) Geographicvariations in health. Office for National Statistics:London pp47-60. Analysis based on ONSclassification of local authority areas using 1999administrative boundaries
13. Commission for Rural Communities (2005) The State of the Countryside 2005. Based on ONS 2005 data
Infant Female life Male lifemortality expectancy expectancy
Rural 80 4.23 81.8 77.8
Rural 50 4.07 81.5 77.5
Significant rural 5.10 81.4 77.3
Rural 4.15 81.7 77.7
Mixed (urban/rural) 4.91 81.0 76.7
England 5.10 80.7 76.4
Table 7.1 Life expectancy in rural areas 2002-04 and infant mortality 2004
Source: Commission for Rural Communities (2006) State of the Countryside (2006)
Social Class
Mangerial Intermediate Routine Never worked/ Not& professional and manual long term classified
unemployed
All rural 1.2 0.8 1.7 0.01 0.4
Accessible rural 1.3 0.9 1.5 0.01 0.4
Remote rural 1.1 0.7 2.1 0.001 0.4
England 1.2 1.0 2.2 0.0 0.8
Table 7.2 Infant mortality by parent’s social class in 20029
Source: Countryside Agency (2004) State of the Countryside (2004) Based on ONS Births and Mortality statistics
CC32EvidenceSect2_AW.qxd 26/9/06 5:01 pm Page 85
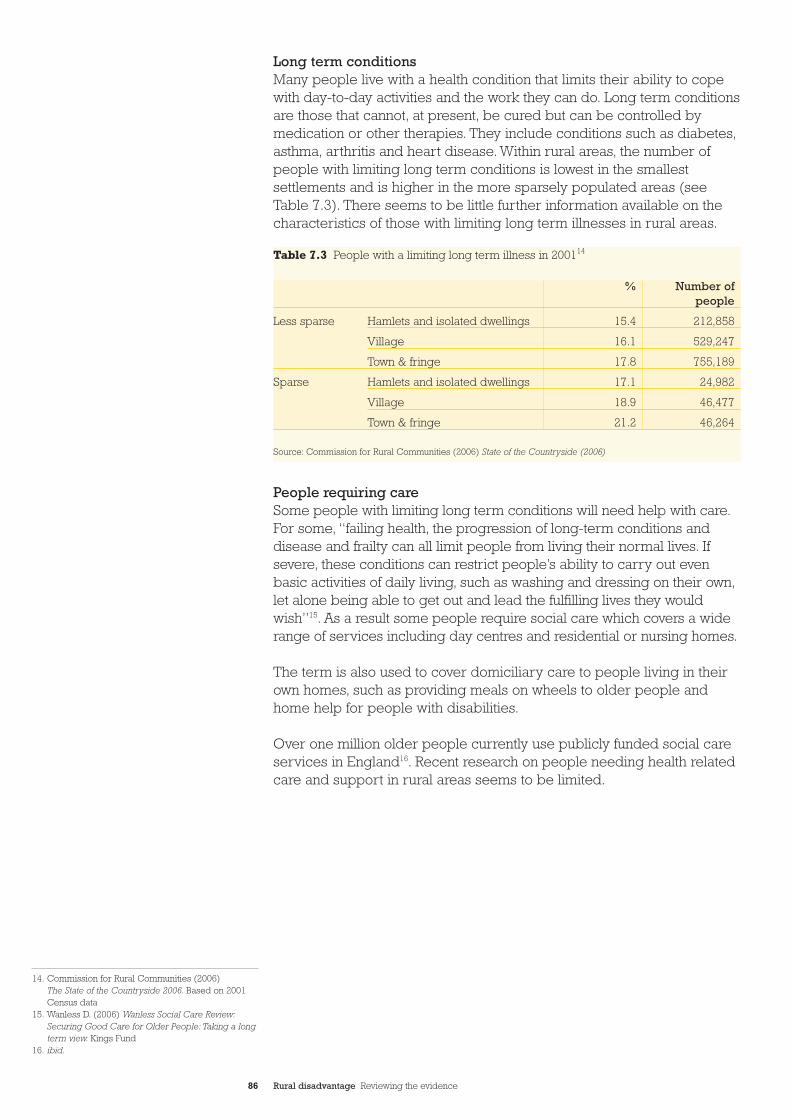
86 Rural disadvantage Reviewing the evidence
Long term conditionsMany people live with a health condition that limits their ability to copewith day-to-day activities and the work they can do. Long term conditionsare those that cannot, at present, be cured but can be controlled bymedication or other therapies. They include conditions such as diabetes,asthma, arthritis and heart disease. Within rural areas, the number ofpeople with limiting long term conditions is lowest in the smallestsettlements and is higher in the more sparsely populated areas (seeTable 7.3). There seems to be little further information available on thecharacteristics of those with limiting long term illnesses in rural areas.
People requiring careSome people with limiting long term conditions will need help with care.For some, “failing health, the progression of long-term conditions anddisease and frailty can all limit people from living their normal lives. Ifsevere, these conditions can restrict people’s ability to carry out evenbasic activities of daily living, such as washing and dressing on their own,let alone being able to get out and lead the fulfilling lives they wouldwish”15. As a result some people require social care which covers a widerange of services including day centres and residential or nursing homes.
The term is also used to cover domiciliary care to people living in theirown homes, such as providing meals on wheels to older people andhome help for people with disabilities.
Over one million older people currently use publicly funded social careservices in England16. Recent research on people needing health relatedcare and support in rural areas seems to be limited.
14. Commission for Rural Communities (2006) The State of the Countryside 2006. Based on 2001Census data
15. Wanless D. (2006) Wanless Social Care Review:Securing Good Care for Older People: Taking a longterm view. Kings Fund
16. ibid.
Table 7.3 People with a limiting long term illness in 200114
% Number ofpeople
Less sparse Hamlets and isolated dwellings 15.4 212,858
Village 16.1 529,247
Town & fringe 17.8 755,189
Sparse Hamlets and isolated dwellings 17.1 24,982
Village 18.9 46,477
Town & fringe 21.2 46,264
Source: Commission for Rural Communities (2006) State of the Countryside (2006)
CC32EvidenceSect2_AW.qxd 26/9/06 5:01 pm Page 86
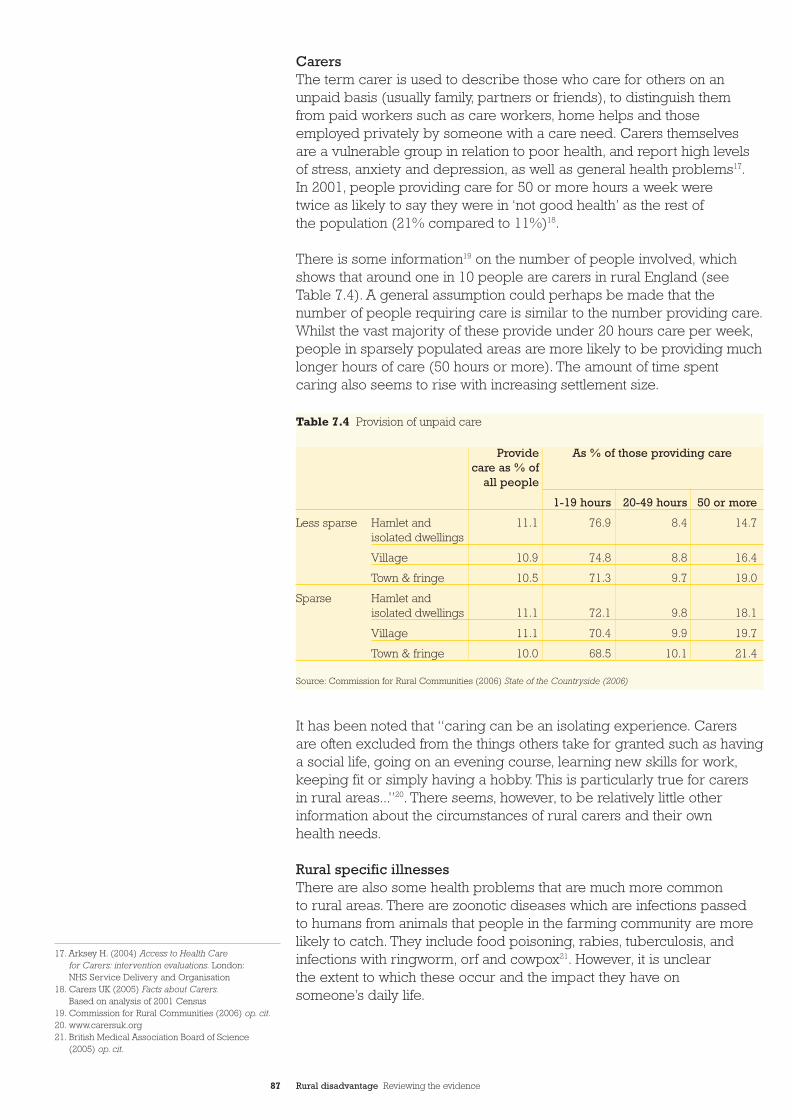
87 Rural disadvantage Reviewing the evidence
CarersThe term carer is used to describe those who care for others on anunpaid basis (usually family, partners or friends), to distinguish themfrom paid workers such as care workers, home helps and thoseemployed privately by someone with a care need. Carers themselves are a vulnerable group in relation to poor health, and report high levelsof stress, anxiety and depression, as well as general health problems17.In 2001, people providing care for 50 or more hours a week were twice as likely to say they were in ‘not good health’ as the rest of the population (21% compared to 11%)18.
There is some information19 on the number of people involved, whichshows that around one in 10 people are carers in rural England (seeTable 7.4). A general assumption could perhaps be made that thenumber of people requiring care is similar to the number providing care.Whilst the vast majority of these provide under 20 hours care per week,people in sparsely populated areas are more likely to be providing muchlonger hours of care (50 hours or more). The amount of time spentcaring also seems to rise with increasing settlement size.
It has been noted that “caring can be an isolating experience. Carers are often excluded from the things others take for granted such as havinga social life, going on an evening course, learning new skills for work,keeping fit or simply having a hobby. This is particularly true for carersin rural areas...”20. There seems, however, to be relatively little otherinformation about the circumstances of rural carers and their ownhealth needs.
Rural specific illnessesThere are also some health problems that are much more common to rural areas. There are zoonotic diseases which are infections passed to humans from animals that people in the farming community are morelikely to catch. They include food poisoning, rabies, tuberculosis, andinfections with ringworm, orf and cowpox21. However, it is unclear the extent to which these occur and the impact they have on someone’s daily life.
17. Arksey H. (2004) Access to Health Care for Carers: intervention evaluations. London:NHS Service Delivery and Organisation
18. Carers UK (2005) Facts about Carers.Based on analysis of 2001 Census
19. Commission for Rural Communities (2006) op. cit.20. www.carersuk.org21. British Medical Association Board of Science
(2005) op. cit.
Provide As % of those providing carecare as % of
all people
1-19 hours 20-49 hours 50 or more
Less sparse Hamlet and 11.1 76.9 8.4 14.7isolated dwellings
Village 10.9 74.8 8.8 16.4
Town & fringe 10.5 71.3 9.7 19.0
Sparse Hamlet and isolated dwellings 11.1 72.1 9.8 18.1
Village 11.1 70.4 9.9 19.7
Town & fringe 10.0 68.5 10.1 21.4
Table 7.4 Provision of unpaid care
Source: Commission for Rural Communities (2006) State of the Countryside (2006)
CC32EvidenceSect2_AW.qxd 26/9/06 5:01 pm Page 87
88 Rural disadvantage Reviewing the evidence
Mental healthOne research project suggested that across Britain, there were fewerpeople with mental health problems in rural areas (taking into accountfactors such as age, marital status, employment and household income)22.However, this did not address cultural and geographical factors thatcould mean health problems are likely to be underreported andundiagnosed. Another survey23 found that the most isolated peopleexperiencing mental health problems were young people, ethnicminorities and people in rural communities. Similarly, another recentreport24 found that mental and chronic health cases were often moreprevalent in rural and remote areas, and that GPs working in farmingcommunities had to deal with a greater prevalence of anxiety, depressionand suicide (amongst other issues). Information25 from distress calls tothe Rural Stress Information Network (RSIN) reveal commonlyexperienced problems relating to financial worries, relationshipproblems, health and managing bureaucracy, with people showing signsof depression and stress.
Comprehensive research is still required to examine the level of mentalhealth illnesses and morbidity in rural areas. A rural mental healthresearch programme has recently been established by the nationalMental Health Partnership, which is exploring rural-urban differences.
2.What are the causes?
Health and life expectancy are linked to social circumstances and healthinequalities result from a wide range of factors. “People who experiencematerial disadvantage, poor housing, lower educational attainment,insecure employment or homelessness are among those more likely tosuffer poorer health outcomes and an earlier death compared with therest of the population”26. Evidence suggests that there are a range ofrural barriers to access to healthcare services including both physicalbarriers (distance, lack of transport) and cultural barriers (stigma, self-reliance, particularly associated with mental health)27.
The link between distance and useThere have been several studies (many of which were undertaken in the1990’s)28 which reveal a ‘distance decay’ effect - demonstrating a declinein the take-up of services with increasing distance from them. In otherwords, the further people are from health services, the less likely theyare to use them. These have covered illnesses such as cancer, asthma,diabetes, and breast-screening.
Most recently, evidence29 shows that residents from hamlets and isolateddwellings appear to make contact with their GP less frequently thanothers - 13.8% in a two week period, compared to 19.3% from villagesand 17.4% of urban respondents. Similarly, other data30 has shown thattwo-fifths of residents in hamlets and isolated dwellings visited their GPonly once or twice in the year up to September 2002. There is also someinformation which points to less hospital use by rural residents. Only justover 1% of residents in hamlets and isolated dwellings made more than10 outpatient visits, compared to 3% of urban residents.
22. Weich S., Twigg L. and Lewis G. (2006) Rural/ Non-rural Differences in Rates of CommonMental Disorders in Britain. The British Journal ofPyschiatry 188: 51-57. Based on a 12 month cohortstudy of 7659 adults aged 16-74 living in 4338private households in England, Wales and Scotland,and using the ONS classification of rural wards and population density
23. MIND (2004) Not Alone? Isolation and mental distress
24. BMA (2005) op. cit.25. Countryside Agency (2004) State of the Countryside
2004. Based on personal communication from theRSIN February 2004
26. Department of Health (2005) Tackling HealthInequalities: status report on the programme for action
27. Deaville J. (2001) The Nature of Rural GeneralPractice in the UK – preliminary research. A jointresearch report from the Institute of Rural Healthand the general Practice committee of the BMA
28. For example: Betham J., Hinton Hayes R., Lovett A.and Bestwick C. (1995) Factors Affecting Non-response to Cervical Cytology Screening in Norfolk,England. Social science and Medicine 40, 131-135;Jones A. and Bentham G. (1997) Health ServiceAccessibility and Deaths from Asthma in 401 LocalAuthority Districts in England and Wales, 1988-92.Thorax, 52, 218-222; Haynes R., Bentham G., LovettA. and Gale S. (1999) Effects of distances to hospitaland GP surgery on hospital inpatient episodes,controlling for needs and provision. Social Scienceand Medicine 49, 425-433; Bain N. and Campbell N.(2000) Treating Patients with Colorectal Cancer inrural and urban area: A qualitative study of thepatients’ perspective. Family Practice, 17,6, 475-479;Bain N., Campbell N., Ritchie L. and Cassidy J.(2002) Striking the Right Balance in ColorectalCancer Care. A qualitative study of rural and urbanpatients. Family practice 19,369-374
29. Commission for Rural Communities (2005) op. cit.30. Commission for Rural Communities (2005)
op. cit. Based on the British Household Panel Survey2002-3
31. Social Exclusion Unit (2004) Mental Health and Social Exclusion. ODPM
“Even a short episode of mental health problems can have a long termimpact on a person’s life, relationshipsand employment opportunities.”31
CC32EvidenceSect2_AW.qxd 26/9/06 5:01 pm Page 88
89 Rural disadvantage Reviewing the evidence
The lower level of use of health services seems clear, but the evidence isnot so clear cut in relation to whether this is due to lower levels of needor other issues. There is also conflicting evidence on the extent to whichlower levels of use impact on health outcomes. One review32 on ruralhealth argued, “there is a need to expand the research in this area andlook in more detail at whether rurality has an impact on health outcomes,and how this relates to degrees of rurality”. It also concluded that, “it isdifficult to identify the particular components of access which are toblame, for example, is it poorer diagnostic facilities, or a feature of ruralpopulations that they present later?”33 Similarly, another recent review ofthe impact of rurality on health concluded that “whether the healthvariation and inequalities seen between rural residents is attributable tovariation in individual exposure to determinants of health or issuesaround health care provision and/or access, the evidence is unclear”34 .
A study35 on cancer patient survival rates in Scotland indicated that peopleremote from cancer centres were more likely to be ‘late presenters’ – in other words, seek medical help at a point when the disease is moreadvanced. Whilst this first study found no proven link between distancefrom cancer centres and survival rate, further research36 found a trend forincreasing distance from a cancer centre to be associated with increasedlikelihood of extensive disease at diagnosis (although only at distancesgreater than 57km). However, the study did not reveal a difference inpatients requiring emergency admission to hospital or emergencysurgery, despite the more advanced disease at diagnosis. Research37
in East Anglia concluded that inaccessibility to hospital may increase therisk of deaths from asthma (based on an increased risk of 1.07 for each10 minute increase in journey time).The impact of ‘late presentation’seems, therefore, to be somewhat inconclusive.
32. Deaville J. (2001) op. cit.33. ibid.34. Peters J. and Jackson R. (2006) op. cit.35. Campbell N.C., Elliott A.M., Sharp L., Ritchie L.D.,
Cassidy J., and Little J. (2000) Rural Factors andSurvival from Cancer: Analysis of Scottish cancerregistrations, British Journal of Cancer 82: 11, 1863-1866
36. Campbell N.C., Elliott A.M., Sharp L., Ritchie L.D.,Cassidy J., Little J. (2001) Rural and UrbanDifferences in Stage at Diagnosis of Colorectal andLung Cancers, British Journal of cancer. 84: 7: 910-14. based on 1323 patients in north and north eastScotland diagnosed with lung or colorectal cancerin 1995 or 1996
37. Jones A., Bentham G. and Horwell C. (1999) HealthService Accessibility and Deaths from Asthma.International Journal of Epidemiology 28: 101-105
© C
ount
rysi
de
Ag
ency
/ N
ick
Tur
ner
2006
CC32EvidenceSect2_AW.qxd 26/9/06 5:01 pm Page 89
90 Rural disadvantage Reviewing the evidence
Role of transportA study on the take-up of breast screening in remote areas foundproblems of access were the most significant factor for non-attendancewith increasing distance38. Other research39 found a U-shapedrelationship between distance from services and access to transport,with travel being the biggest difficulty for those nearest to a surgery.Those living over five miles away were more likely to have access to acar. In other words, access was an issue where patients may be morelikely to rely on public transport.
Although the evidence on the impact of distance and accessibility tohealth care services on health outcomes seems unclear, there is generalconsensus that people living in rural areas have to travel long distancesto obtain treatment and sometimes have long waiting times in clinics(especially if dependent on public transport). This leads to more physical discomfort and fatigue40. Distance can be a particular problemfor patients with an acute illness requiring long term care – who need to be seen by a specialist or at a specialist centre at a distance from their home. One study41 found the role of distance to regional cancercentres suggested people living in rural areas were disadvantaged incomparison to those living nearer the centres. An average of 1,479kmwas travelled by the 32 rural cancer patients in the study, over 20 hoursby private car. Another study42 in East Anglia found significant difficultiesfor people accessing a GP surgery. 13% could not reach the surgery bydaily bus and 5% of the population were more than a 10 minute journeyaway by car with no suitable bus each weekday.
A review on rural health concluded that, “public transport is not the most appropriate transport option for sick people, because of timing,discomfort and lack of skilled support”43. Health related transportschemes are therefore vital and studies have shown that rural patientsare positive about initiatives that provide services more locally andreduce travelling time (e.g. outreach services, mobile, telemedicine)44.
Occupational impactsIn addition to the practical difficulties of travel, research has suggestedthat other issues may impact on the ability of some groups to accesshealthcare including ‘more rigid patterns of working life’45. Manualworkers, for example, are more likely to find it difficult to accesshealthcare due to work commitments. There seems to be little researchon how this might impact on people’s access in rural areas.
Housing tenure and car ownership Those living in owner occupied homes and with car access have betterhealth, in general, than others (after taking into account differences inage, sex, marital status and social class or income). This can in part beexplained since those with their own homes and cars have “higher levelsof mastery, self-esteem and life satisfaction than renters or those withoutcar access”46. This may explain, to some extent, the urban-ruraldifferences in average health levels. The researchers conclude thathaving money and a good job enable people to obtain these assets,which give both psychosocial benefits relating to control, status andsecurity as well as physical benefits of a living environment free fromdamp and cold.
38. Stark C., Reay L. and Shiroyama C. (1997) The Effects of Access Factors on Breast ScreeningAttendance on Two Scottish Islands. Health Bulletin55,5, 316-321
39. Field K. and Briggs D. (2001) Socio-economic and Locational Determinants of Accessibility andUtilisation of Primary Health-care. Health and social care in the community 9, 5, 294-308
40. e.g. in relation to chemotherapy patients in rural Scotland. McCavana P (2000) Deliveringchemotherapy in rural areas: Can it work?Nursing Times 96, 35, 35-36
41. Baird A., Donnelly C., Miscampell N., and WemyssH. (2000) Centralisation of Cancer Services in Rural Areas has Disadvantages. British MedicalJournal 320, 717
42. Lovett A., Haynes R., Sunnenberg G. and Gale S.(2002) Car Travel Time and Accessibility by Bus toGeneral Practitioner Services: A study using patientregisters and GIS. Social Science and Medicine,55, 97-111
43. British Medical Association Board of Science (2005) op. cit.
44. TAS Partnerships (with CAG consultants (2004) The Benefits of Providing Transport to Healthcare:literature review. An unpublished report to theCountryside Agency
45. Dixon-Woods M., Kirk D., Agarwal S., Annandale E.,Arthur T., Harvey J., Hsu R., Katbamna S., Olsen R.,Smith L., Riley R. and Sutton A .(2005) VulnerableGroups and Access to Health Care: A criticalinterpretive review. Report for the National Co-ordinating Centre for NHS Service Delivery and Organisation R & D (NCCSDO)
46. Macintyre S., Ellaway A., Kearns A. and Hiscock R.(2000) Housing Tenure and Car Ownership; Why dothey predict health and longevity? Economic andSocial Research Council (ESRC) Health VariationProgramme Research Findings 7
CC32EvidenceSect2_AW.qxd 26/9/06 5:01 pm Page 90
91 Rural disadvantage Reviewing the evidence
Links between health and social isolationSocial interaction is important for good health and socially isolatedpeople are far more likely to suffer from premature mortality than well-connected people. Social participation is covered in Chapter 10 of this report.
Farming communities have been particularly identified as being isolated: “many farming communities are by their nature isolated frommainstream services, and have developed a culture of self-sufficiencyand stoicism, yet evidence suggests their health needs are actuallygreater than in many other sectors of society”48.
An action research project to improve access to health care for farmingcommunities (farmers, farmworkers and their families) in South Lakelandand North Lancashire found significant unmet physical and mental healthneeds. Of those who asked for a ‘health check’, over half (56%) hadconditions needing referral to their GP or hospital. Of those who soughtadvice for a specific symptom, three-quarters had experienced it formore than a week and 43% for more than a month49.
Cultural barriersThere is some evidence to suggest a lower level of use of health servicesin rural areas because of cultural attitudes, particularly self-reliance, aswell as the stigma (linked with visibility) of accessing services in smallrural communities50. Our DVD Hidden Voices attached to this report alsohighlights concerns of visibility in using some health services.
One research project51 undertaken in rural Scotland identified theconcerns rural patients had about the confidentiality of rural practice and how they “feared accidental exposure of their medical historythrough careless use of computer screens, or handling of notes in thereception area”. In addition, some felt that there were issues they couldnot raise with their GP if they were ‘controversial’ or ‘difficult’. Thisincluded, for example, contraceptive advice, gynaecological problems,counselling regarding HIV infection or sexually transmitted diseases,alcohol related problems and injuries resulting from domestic violence.Given that this research is now somewhat dated and carried out in areas of rural Scotland that might differ significantly from rural England,it would be worthwhile revisiting in further research.
Mental healthA wide range of factors have been associated with poor mental healthincluding socio-economic disadvantage, particularly low-income anddebt, neighbourhood violence and crime, rented housing, unemployment(especially long-term unemployment) and poor educational attainment.Negative experiences while in employment are also linked. Low selfesteem, isolation and lack of access to social support, as well asexperiencing prejudice, intolerance or racism have also been linked to poor mental health52.
47. Kawachi I. and Kennedy B.P. (1997) Socio- economicDeterminants of Health: Health and social cohesion:Why care about income inequality? British MedicalJournal 314, 1037- 40
48. BMA (2005) op. cit.49. Burnett T. M. (2002) Improving Access to Health
Care for Farming Communities. Department ofHealth on-line research findings database.Based on 277 patients in a twelve month period
50. Mitchinson K. (2002) Rural Health and CommunityStrategies: Key points for rural health and communityplanning. Powys: the Rural Health Forum
51. Clark G. (1997) Health and Poverty in rural Scotland.Health Bulletin 55, 5, 299- 304. Based on interviews1993-1995 in Harris, Wester Ross, Angus and North Ayrshire
52. Bradshaw J., Kemp P., Baldwin S. and Rowe A.(2004) The Drivers of Social Exclusion: A review ofthe literature for the Social Exclusion Unit in theBreaking the Cycle series. ODPM; Social ExclusionUnit (2004) Mental Health and Social Exclusion
“Socially isolated people die at two orthree times the rate of people with anetwork of social relationships andsources of emotional and instrumentalsupport”47
CC32EvidenceSect2_AW.qxd 26/9/06 5:01 pm Page 91
92 Rural disadvantage Reviewing the evidence
One review of rural mental health research suggested “that the glare ofrural familiarity can feed into the often quite acute under-utilisation oflocal mental health services”53. Several studies have found evidence ofthe stigma associated with greater visibility in rural areas and the lack ofanonymity has caused difficulties for users who have consideredwithdrawing, or withdrawn, from treatment54. Information from research inrural Scotland55 suggests that the experience of living with mental healthproblems can be exacerbated in small rural settlements.
Stigma and discrimination are particularly associated with theexperience of poor mental health and can be problematic in rural areaswith a ‘close-knit’ community. Research suggests, “this can lead togreater stigma and isolation if the individual is not accepted as part ofthe community, although the reverse can also be true; if the individual iswell known, the community might be better able to see the person andnot the problem”56. Indeed, some research has suggested the toleranceof people with mental health problems. Research57 from Ireland, forexample, found that there were appropriate and inappropriate ways of‘going’ and ‘being’ mad, eccentricity was acceptable, but there wereboundaries, based on local beliefs and values.
Again the role of transport is highlighted as services can be further awayin rural areas and there is generally a lower level of public transport. Inparticular, some people with mental health difficulties may have theirdriving licence suspended, which may increase both their socialisolation and access to health as well as other services58.
CarersFive main types of barriers have been identified for carers in accessinghealth care: the lack of awareness of carers’ needs by health careprofessionals; the way services are organised (such as long or inflexiblewaiting times); carers’ inability to speak English or having certain culturalbeliefs or practices; the carer’s or care recipient unwillingness to seekhelp; and a lack of information and knowledge by carers59. The moredemanding the care required, the less likely it is that carers have time tolook after their own health needs. This work recommended furtherresearch into the special problems of access in rural areas.
Carers who live in rural areas can find it difficult to obtain advice andhelp. A review several years ago found that, “the amount of help availableto them, from both the statutory services and voluntary organisations,is generally lower than in urban areas and services may be difficult toaccess, involving long journeys to day centres or hospitals... Small centresof population do not provide a cost-effective base for many services”60.
The challenges of ruralityFunding to local authorities for care provided through social services hasa small element included in the formulae to cover the costs of sparsityand super-sparsity (based on population density). However, fundingthrough the NHS does not make a major allowance for rurality in itsallocation formulae. It has been argued61 that the need for health care inrural areas and the cost of rural service provision are not adequatelyreflected in the current funding formulae and that this has implicationsfor both the quantity and quality of rural provision.
53. Philo C., Parr H. and Burns N. (2003) Rural Madness:A geographical reading and critique of the ruralmental health literature. Journal of Rural Studies 19: 259-281
54. Crawford P. and Brown B. (2002) Like a FriendGoing Round: Reducing the stigma attached tomental healthcare in rural communities. Health and Social Care in the Community 10,4, 229-238.
55. Philo C., Parr H. and Burns N. (2003) SocialGeographies of Rural Mental Health: experiencinginclusion and exclusion: Summary Report.http://www.geog.gla.a.uk/projects/webstie/main.htmBased on 4 case study areas of Skye and Kyle of Lochalsh, Easter Ross, North West Sutherland and Inverness area
56. Social Exclusion Unit (2004) Mental Health andSocial Exclusion. ODPM
57. Scheper-Hughes N (2000) Ire in Ireland.Ethnography 1,1,117-140
58. Finnegan G. (2003) Mental Health in Rural Areas.Rural Network News: Rural Community Network(NI) Magazine
59. Arksey H. (2004) Access to Health Care for Carers:Intervention evaluations. London: NHS ServiceDelivery and Organisation
60. Department for Health (1999) National Strategy for Carers
61. For example, Asthana S., Gibson A., Moon G. andBrigham P. (2003) Allocating Resources for Healthand Social Care: The significance of rurality. Healthand social care in the community 11, 6, 486-493;and Asthana S., Halliday J., Brigham P. and GibsonA. (2002) Rural Deprivation and Service Need:A review of the literature and an assessment ofindicators for rural service planning, South WestPublic health Observatory; Baker D. and Hann M.(2001) General Practitioner Services in Primary Care Groups in England: Is there inequity betweenservice availability and population need? Health and place 7, 67-74
CC32EvidenceSect2_AW.qxd 26/9/06 5:01 pm Page 92
93 Rural disadvantage Reviewing the evidence
3.What are the policies?
There are a wide range of policies to improve health and tackle healthinequalities. In general, there is a national commitment that patients willbe provided with the same basic level of service wherever they live, interms of quality, effectiveness and accessibility. We focus here on thosepolicies that are designed to improve people’s access to generalprimary needs health care. We do not examine access to more specialisthealth services (such as services assisting those with drug or alcoholdependency) or more preventative policies such as promotion of healthydiets and active lifestyles.
Health inequalitiesTackling health inequalities is a major part of health policy. Following alarge scale review in 199862, the NHS Plan in 2000 put tackling inequalitieson the agenda and a cross-cutting review on health inequalities wascompleted in 2002. The current commitment is set out in Tackling HealthInequalities: A programme for Action (2003). This has two goals: achievinga Public Service Agreement (PSA) target on health inequality; andaddressing the underlying, and wider, determinants of health inequalities(such as poverty and poor housing conditions). Other chapters in thesection on Access to Oportunities show what is known about the waypolicies are impacting in rural areas on these wider determinants.
The 2002 PSA target was, “by 2010 to reduce inequalities in healthoutcomes by 10% as measured by infant mortality and life expectancy atbirth”. This is underpinned by two more detailed objectives:
• “starting with children under one year, by 2010 to reduce by atleast 10% the gap in mortality between routine and manual groupsand the population as a whole
• starting with local authorities, by 2010 to reduce by at least 10% thegap between the fifth of areas with the lowest life expectancy atbirth and the population as a whole”.
A new PSA target was introduced in 2004 to reduce the inequalities gapbetween the fifth of areas with the worst health and deprivation indicatorsand the population as a whole by at least 40% for cardiovascular diseaseand by at least 6% for cancer. Action is therefore focused on areas withthe worst health and deprivation indicators, through establishing a‘spearhead’ group of local authorities.
The latest data (for 2001-03)63 monitoring progress against the PSAtargets and a wider range of 12 headline indicators on health inequalitiesshow that the relative gap in life expectancy had increased, especially forfemales, but infant mortality rates had declined in the routine and manualgroups (although the rate of decline was faster for other occupationalgroups). There is no specific rural monitoring within the report.
It is probably too soon to evaluate the overall impact of policies to tacklehealth inequalities, given their relatively recent introduction and the long-term nature of reducing the gaps in the distribution of poor healthbetween different social groups. Nevertheless, on the whole there seems to be have been little specifically rural attention in evaluationsundertaken of the impact of health policies. A review64 on CoronaryHeart Disease notes only the success of emergency response times
62. Acheson D. (1998) Independent Inquiry intoInequalities in Health. The Stationery Office
63. Department of Health (2005) Tackling HealthInequalities; Status report on the programme for action
64. Healthcare Commission (2005) Getting to the Heart of it: Coronary Heart Disease in England:A review of progress towards the national standards
CC32EvidenceSect2_AW.qxd 26/9/06 5:01 pm Page 93
94 Rural disadvantage Reviewing the evidence
by Ambulance Trusts in rural areas. The assessment of the NHSFramework on cancer care65 similarly does not evaluate how this is being delivered in rural areas, although it did note problems reported by patients in travelling to radiotherapy treatment where public transportis poor and distances to hospital great. An evaluation is currently being undertaken for the Commission for Rural Communities on theeffectiveness of health policies on rural health, looking at the NHS 10 Year Plan (currently about halfway through its life span). The evaluationwill include out of hours provision of GP services and NHS dentistry.
Access to health service policies
Area based approachesThere are 26 Health Action Zones (HAZs), set up in two waves over 1998and 1999. These are partnerships between the NHS, local authorities and the local community (community groups, the voluntary and businesssectors) to improve healthcare in areas with the poorest levels of health.Together they cover about one-third of the population of England, but the three primarily rural HAZs of Northumberland, North Cumbria andCornwall and the Isles of Scilly cover around one million people66. Activityby HAZs is now mainstreamed within the relevant Primary Care Trust.
The national evaluation of HAZs has focused on different aspects of theprogramme such as: the health of children and young people; coronaryheart disease and employment; pump priming drug prevention projectsand initiatives for vulnerable young people; and smoking cessationservices. The national evaluation that looked at health inequalities67 notedthe difficulties caused by different operational boundaries and the oftendifferent needs of rural, compared to national priorities, but did notinclude a specific assessment of the impact of HAZ in tackling healthinequalities in rural areas. Some local assessments have pointed to theurban focus even within the more rural HAZs due to the focus ondeprivation indicators of ‘worst wards’68.
65. Commission for Health Improvement (CHI) and Audit Commission (2001) National ServiceFramework Assessment No 1. NHS Cancer Care in England and Wales
66. Halliday J. and Asthana S. (2005) Policy at theMargins: Developing community capacity in a rural Health Action Zone. Area 37, 2, 180-188
67. Benzeval M. (2003) The National Evaluation of Health Action Zones: The final report of the tacklinginequalities in health module. Queen MaryUniversity of London; See also Bauld L.and Judge K.(2002) Learning from Health Action Zones. Aeneas;Lawson L., Mackenzie M., Mackinnon J., Meth F. andTruman J. (2002) National Evaluation of Health ActionZones. HAZs: integrated case studies – preliminaryfindings from fieldwork in spring 2001.Health Promotion Policy Unit: Department of Health,University of Glasgow
68. Halliday and Asthana (2005) op. cit.
© C
ount
rysi
de
Ag
ency
/ N
ick
Tur
ner
2006
CC32EvidenceSect2_AW.qxd 26/9/06 5:01 pm Page 94
95 Rural disadvantage Reviewing the evidence
Healthy Living Centres (HLCs) aim to provide health, leisure andcommunity services as well as tackle the wider determinants of healthinequalities. These are lottery funded to target the most disadvantagedpeople. There are 350 centres so far. A four year evaluation has beencommissioned running from 2001-2005 and annual reports have beenpublished during the evaluation69. Of the 20 case study areas chosen forin-depth evaluation work, five have significant rural components, but asyet information is not available on the impact of HLCs in rural areas.
NHS DirectNHS Direct was first launched in 1998 and national coverage wasachieved in 2000. It provides 24 hour/ seven day a week telephonehealthcare advice and there is an associated website service. Whilst it is not always a substitute for seeing a doctor, the service may help toovercome some of the problems associated with distance to healthcarein rural areas. However, the extent to which the service is used by andmeets the needs of, rural residents, especially those experiencingdifferent forms of disadvantage, or remote or isolated residents has yet to be established. An assessment70 of NHS Direct found that the servicewas generally rated highly by users and the target for awareness of theservice (60% of the population) had been met. However, it also foundthat not all social groups were aware of, or using, the service equally.A more recent assessment of the impact of the service is not available,particularly on whether it has helped to overcome the ‘distance-decay’effect. The assessment did not examine any potential rural or urbandifferences. Another assessment71 by the regulator found it has made a big impact in the short time it has been running, but again did notinvestigate specifically its rural impact.
Rural Services StandardsSeveral Rural Services Standards (RSS) relate to health services,covering access levels to a GP or primary care professional, telephoneservices (NHS Direct) and response time targets for ambulances.Rural figures were not separately available in terms of primary careappointments, but virtually all patients nationally are seen within thetarget wait times of an appointment within two working days to see a GP and one working day to see a primary care professional. The annualmonitoring undertaken by the Commission for Rural Communities72
has noted the need for improvement in the collection of rural data.
The percentage of rural Ambulance Trusts meeting the target to respondto 75% of Category A (life threatening) calls within eight minutes hasimproved steadily from 8.3% in 2000/01 to 86.9% in 2004/0573. Anassessment of trusts’ actions on Coronary Heart Disease74 concludedthat most had focused on trying to increase access for patients in thoseareas where the ambulance target is harder to reach, particularly inrural areas, but that there was little evaluation of the success of theseschemes. However, it should be noted that the target could theoreticallybe met by focusing effort in the larger towns as some rural ambulancetrusts cover whole counties. Less attention has been devoted nationallyto other targets, including the target for calls relating to patientsalready assessed by a GP or other practitioner as being in need ofurgent attention75.
69. Bridge Consortium (2005) The Evaluation of the BigLottery Fund Healthy Living Centres. Third AnnualReport of the Bridge Consortium. Big Lottery Fund
70. National Audit Office (2002) NHS Direct in England.Report by the Comptroller and Auditor General.HC 505 Session 2002-02: 25 January 2002
71. Commission for Health Improvement (2003) WhatCHI has Found in: NHS Direct services: Sector report
72. The Countryside Agency has produced threeseparate stand-alone progress reports on the RuralServices Standard, published in July each yearsince 2001-02. Following a review in 2003 of theRSS by Defra, it was agreed that the RSS progressreport should be included within the Commissionfor Rural Communities’ rural proofing report.The latest information is available for 2004-05 inCommission for Rural Communities (2005) Rural Proofing Report 2004-05
73. From April 2006, category B response times will be based on a single measure of 19 minutes forrural and urban areas
74. Healthcare Commission (2005) op. cit.75. Commission for Health Improvement (2003) What
CHI has Found in Ambulance Trusts: Sector report
CC32EvidenceSect2_AW.qxd 26/9/06 5:01 pm Page 95
96 Rural disadvantage Reviewing the evidence
As well as the emergency response time, Defra’s Public ServiceAgreement for the period 2003 to 2006 aimed to improve access tohealth care in rural communities by:
• sustaining the number of rural households within 4km of a doctor’ssurgery (including branch surgeries and outreach);
• increasing the range of treatments available outside a hospitalsetting, including the provision of 100 one-stop primary carecentres and mobile services serving rural areas.
Defra’s annual departmental report for 2005 noted that the proportion ofrural households within 4km to a doctor’s surgery has been sustainedand there are 109 rural one-stop primary care centres compared to atarget of 100.
Long-term conditions (LTCs)The NHS Improvement Plan76 identified long-term conditions as one ofthe top three priorities for the NHS in the period up to 2008. The NationalService Framework for LTCs was published in March 2005 and has aparticular focus on LTC neurological conditions, but also covers somegeneric issues for people with LTCs and disabilities. The focus of activityis on person-centred care planning, information and support, self-careand case management. Given its recent introduction, no evaluation hasbeen undertaken of how it is being delivered.
Mental health policiesThe National Service Framework (NSF) for mental health was publishedin 1999 and the NHS Plan (2000) extended service standards. The NSFsets national standards for promoting mental health and treating mentalillness, and sets out performance indicators. It covers mental healthneeds of working age adults up to age 65. The NSF was ‘retrospectivelyrural proofed’ by Rural Minds and the Rural Mental Health ServicesGroup (RMHSG)77.
The NHS plan aims to establish: 220 assertive outreach teams for peoplewith complex needs who traditionally have not maintained contact withservices; 50 early intervention teams to provide support to young peoplewith psychosis; and 335 crisis resolution teams to support people whoare in crisis at home. Mental health services are now provided byspecialist mental health trusts and there are 85 providers of secondarymental health services in England.
A review of mental health trusts78 found that providing mental healthservices in geographically dispersed rural areas presented particularproblems – requiring service users to travel long journeys to accessservices or visit relatives. This was particularly a problem where someservices were only provided on one site, such as electro convulsivetherapy (ECT) or psychiatric intensive care units (PICU). However,no further rural evaluation was contained in the review. A survey79 ofmental health patients found many patients were not receiving thecare standards set out in the NSF, although the report did not includea rural analysis.
76. Department for Health (2004) NHS Improvement Plan
77. Elder K. (2004) Rural Proofing the NSF for Mental Health. MIND
78. Commission for Health Improvement (2004) What CHI has Found in Mental Health Trusts:sector report
79. Healthcare Commission (2005) Survey of Users2005: Mental health services. A survey in 81 NHS trusts which provide secondary mental healthservices based on questionnaire responses from 25,555 patients.
CC32EvidenceSect2_AW.qxd 26/9/06 5:01 pm Page 96
97 Rural disadvantage Reviewing the evidence
The Rural Stress Action Plan80 was established as part of the Action Planfor Farming in 2000 to support voluntary bodies which help thosesuffering from stress in rural areas. Funding has supported awarenessraising, regional support networks through the Rural Stress InformationNetwork (RSIN), and a rural support initiative fund. The plan aims tosupport (1) people connected with the land (2) people who run smallbusinesses and their employees (3) those in debt in rural areas and (4)high risk occupational groups (e.g. farmers and agricultural workers). Itsprimary focus is, therefore, on the farming community.
Access to (i) crisis services and (ii) child and adolescent mental healthservices are contained in Defra’s PSA on improving access to services in rural areas, although Defra does not deliver these services itself.No monitoring information is available yet.
Provision for people needing careThe responsibility to provide social care rests principally with localcouncils. There seem to be no national rural data on access to care inday centres or nursing homes in rural areas, nor on the provision ofcommunity care services such as care at home or meals on wheels.Since 1998, there has been an increase of 43% in the number ofhouseholds receiving intensive homecare in England81. There is onlylimited information on how these services are operating in rural areas or meeting rural people’s needs.
The first ever inspection82 of how community care is delivered in rural areas was undertaken in 1999 and found that social servicesdepartments face particular challenges. It focused on care provision toolder people and adults with disabilities. Despite some innovative workby authorities, the inspection found services can be more difficult toaccess in rural areas and that there was evidence of a lack of choicesometimes leading to people not using services. This research is nowrather dated, given the changes in policy to provide more communitybased care and it could usefully be revisited.
However, some sector specific reports have noted issues related torurality. One review83 found that, in relation to older people’s services,“most councils with rural areas were finding it difficult to ensureequitable access to services... particularly for domicilary care wherestaffing recruitment was difficult. Transport and service costs werefrequent issues”. They concluded the “best councils had recognised thatcontract premiums, innovative transport and greater use of directpayments could help to overcome challenges”.
Similarly an inspection report84 on services for people with learningdisabilities found that in predominantly rural counties, “it was difficult tooffer services which were appropriate and local. In these counties directpayment arrangements offered better choice and flexibility but suchschemes were not beyond the development stage for children withlearning disabilities”. They also found that small-scale residential andday services were available in all councils, but whilst some carerspreferred to attend larger day centres (for up to 150 people), this ofteninvolved “long journeys by specialised transport, particularly in ruralareas with a dispersed population”.
80. Defra (2000) Rural Stress Action Plan81. Commission for Rural Communities (2005)
Rural Proofing Report 2004-0582. Social Services Inspectorate (1999) Care in the
Country: Inspection of community care in ruralcommunities. Based on research in eight localauthorities during 1998 – Bedfordshire, Derbyshire,Lincolnshire, Dorset, Wiltshire, Durham,East Sussex, and Lancashire.
83. Bainbridge I. and Ricketts A. (2003) ImprovingOlder People’s Services: An overview ofperformance. Social Services Inspectorate,Department of Health
84. Cope C. (2003) Fulfilling Lives: Inspection of Social Care Services for People with LearningDisabilities. Department of Health
CC32EvidenceSect2_AW.qxd 26/9/06 5:01 pm Page 97
98 Rural disadvantage Reviewing the evidence
Another inspection report85 on social care services for physically andsensory disabled people found that providing effective transport systems“continues to challenge councils, particularly in rural areas. Lack oftransport limited many people’s access to day services. Disabled peoplefrequently cited long journeys as an issue. In several instances serviceusers’ day service had been reduced because of lack of transport”.
The most recent comprehensive overview of social care in England86
reported that, “the development of Sure Start and Children’s Fundprojects has increased the range of services to families in many areas,though access to services is uneven, especially in rural areas”. Theassessment found wide variation between councils in the availability ofdifferent types of service in their area (beyond what could be explainedby demographic differences) and significant variation in residential carefees. There is also marked geographical variation in performanceagainst the National Minimum Standards for all types of service.
The report noted, too, that many people do not meet eligibility criteriaand have difficulty finding the services they need. It also found that‘simple services’ that would allow people to live independently andcomfortably in their own homes are often overlooked. No information is available on the extent to which these are issues in rural areas or how it differs between different kinds of rural areas.
Support for carersThe National Strategy for Carers published in 1999 was the first strategyof its type. There seems to be no information on its success in meetingthe needs of carers in rural areas.
The Carers (Equal Opportunities) Act 2004 gives carers new rights toinformation by placing a duty on local authorities to inform carers of their right to a Carers Assessment. Previously legislation only offeredcarers support in their caring role rather than in their wider lives.The Act now ensures that work, life-long learning, training and leisure are considered when a carer is assessed. It also gives local authoritiesnew powers to enlist the help of housing, health, education and otherlocal authorities in providing support to carers. The effect of the Actshould, therefore, give carers more choice and opportunity by ensuringthey receive information about their rights and better equip localauthorities to respond. Given its recent introduction, the impact of the Act in meeting rural carers’ needs has yet to be evaluated.
‘Our health, our care, our say’The recent White Paper on community services87 may begin to addresssome of the wider health access issues since it is seeking to move manyhospital based services into more community based settings and toensure a patient-centred approach.
85. Clark J. (2003) Independence Matters. An overviewof the performance of social care services forphysically and sensory disabled people. SocialServices Inspectorate, Department of Health
86. Commission for Social Care Inspection (CSCI)(2005) The State of Social Care in England 2004-05
87. Department of Health (2006) Our Health, Our Care,Our Say
CC32EvidenceSect2_AW.qxd 26/9/06 5:01 pm Page 98
99 Rural disadvantage Reviewing the evidence
4. Summary
• Distance, travel times and availability of transport are critical forpatients in accessing healthcare in rural areas. Those without their own private transport are particularly disadvantaged. The degree ofdistance has been found to be important in several studies and wouldbe worthy of further research. This could cover specific illnesses andservices, as well as different client groups.
• Policies that aim to overcome the transport problems that some face in rural areas, such as NHS Direct, will be important but their ruralusage and impacts have not been evaluated to date. These alternativeapproaches might offer a way of overcoming the rural problems ofmaintaining anonymity when taking up services. This may impact on people’s willingness to take up health and social care services.
• The new policies to address health inequalities need to bemonitored to ensure that they are working in rural areas.
• Addressing the needs of those with poor mental health are likely tobecome increasingly important in rural areas with the forecast growthin mental health issues. The issue seems to be well recognised in thefarming community, but less so for others in rural areas. Ways ofovercoming the stigma people with poor mental health feel would bebeneficial given the impact this has on their take-up of services.
• Providing support for people needing care and their carers – betterevidence is needed on the problems experienced by carers in ruralareas and the availability of appropriate care services. The informationto date suggests that the quality of care services varies between localareas and that some services are not meeting the national minimumstandards. A detailed understanding of the barriers local serviceproviders face would be useful.
CC32EvidenceSect2_AW.qxd 26/9/06 5:01 pm Page 99
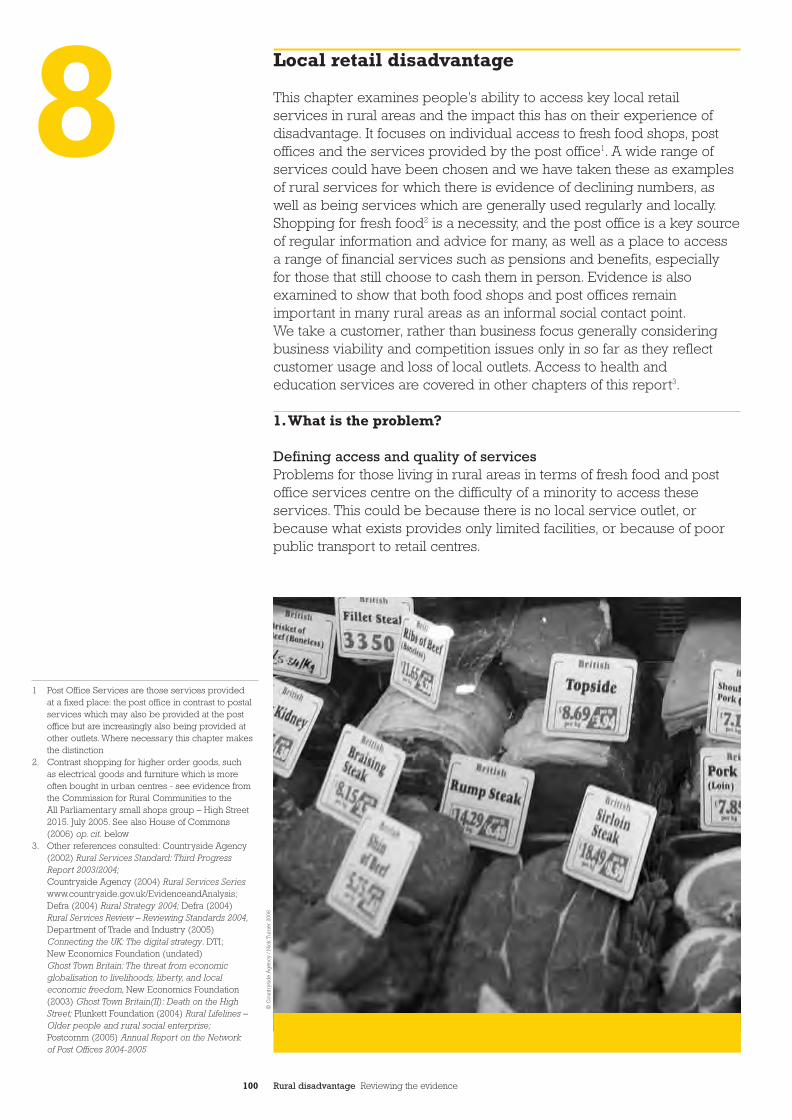
100 Rural disadvantage Reviewing the evidence
Local retail disadvantage
This chapter examines people’s ability to access key local retail services in rural areas and the impact this has on their experience ofdisadvantage. It focuses on individual access to fresh food shops, postoffices and the services provided by the post office1. A wide range ofservices could have been chosen and we have taken these as examplesof rural services for which there is evidence of declining numbers, aswell as being services which are generally used regularly and locally.Shopping for fresh food2 is a necessity, and the post office is a key sourceof regular information and advice for many, as well as a place to access a range of financial services such as pensions and benefits, especiallyfor those that still choose to cash them in person. Evidence is alsoexamined to show that both food shops and post offices remainimportant in many rural areas as an informal social contact point.We take a customer, rather than business focus generally consideringbusiness viability and competition issues only in so far as they reflectcustomer usage and loss of local outlets. Access to health and education services are covered in other chapters of this report3.
1.What is the problem?
Defining access and quality of servicesProblems for those living in rural areas in terms of fresh food and postoffice services centre on the difficulty of a minority to access theseservices. This could be because there is no local service outlet, orbecause what exists provides only limited facilities, or because of poorpublic transport to retail centres.
1 Post Office Services are those services provided at a fixed place: the post office in contrast to postalservices which may also be provided at the postoffice but are increasingly also being provided atother outlets. Where necessary this chapter makesthe distinction
2. Contrast shopping for higher order goods, such as electrical goods and furniture which is moreoften bought in urban centres - see evidence fromthe Commission for Rural Communities to the All Parliamentary small shops group – High Street2015. July 2005. See also House of Commons(2006) op. cit. below
3. Other references consulted: Countryside Agency(2002) Rural Services Standard: Third ProgressReport 2003/2004;Countryside Agency (2004) Rural Services Serieswww.countryside.gov.uk/EvidenceandAnalysis;Defra (2004) Rural Strategy 2004; Defra (2004) Rural Services Review – Reviewing Standards 2004,Department of Trade and Industry (2005)Connecting the UK: The digital strategy. DTI;New Economics Foundation (undated) Ghost Town Britain: The threat from economicglobalisation to livelihoods, liberty, and localeconomic freedom, New Economics Foundation(2003) Ghost Town Britain(II): Death on the HighStreet; Plunkett Foundation (2004) Rural Lifelines –Older people and rural social enterprise;Postcomm (2005) Annual Report on the Network of Post Offices 2004-2005
8©
Cou
ntry
sid
e A
gen
cy /
Nic
k T
urne
r 20
06
CC32EvidenceSect2_AW.qxd 26/9/06 5:01 pm Page 100
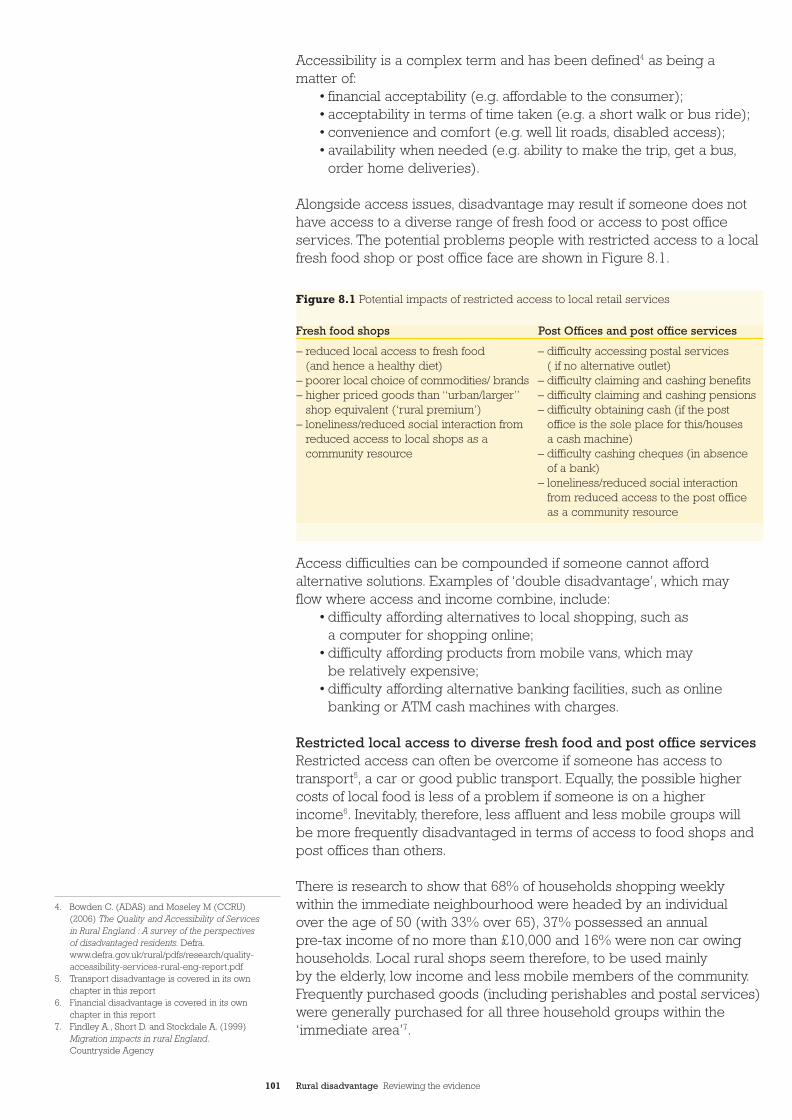
101 Rural disadvantage Reviewing the evidence
Accessibility is a complex term and has been defined4 as being a matter of:
• financial acceptability (e.g. affordable to the consumer);• acceptability in terms of time taken (e.g. a short walk or bus ride);• convenience and comfort (e.g. well lit roads, disabled access);• availability when needed (e.g. ability to make the trip, get a bus,
order home deliveries).
Alongside access issues, disadvantage may result if someone does nothave access to a diverse range of fresh food or access to post officeservices. The potential problems people with restricted access to a localfresh food shop or post office face are shown in Figure 8.1.
Access difficulties can be compounded if someone cannot affordalternative solutions. Examples of ‘double disadvantage’, which may flow where access and income combine, include:
• difficulty affording alternatives to local shopping, such as a computer for shopping online;
• difficulty affording products from mobile vans, which may be relatively expensive;
• difficulty affording alternative banking facilities, such as onlinebanking or ATM cash machines with charges.
Restricted local access to diverse fresh food and post office servicesRestricted access can often be overcome if someone has access totransport5, a car or good public transport. Equally, the possible highercosts of local food is less of a problem if someone is on a higherincome6. Inevitably, therefore, less affluent and less mobile groups will be more frequently disadvantaged in terms of access to food shops andpost offices than others.
There is research to show that 68% of households shopping weeklywithin the immediate neighbourhood were headed by an individual over the age of 50 (with 33% over 65), 37% possessed an annual pre-tax income of no more than £10,000 and 16% were non car owinghouseholds. Local rural shops seem therefore, to be used mainly by the elderly, low income and less mobile members of the community.Frequently purchased goods (including perishables and postal services)were generally purchased for all three household groups within the‘immediate area’7.
– reduced local access to fresh food (and hence a healthy diet)
– poorer local choice of commodities/ brands– higher priced goods than “urban/larger”
shop equivalent (‘rural premium’)– loneliness/reduced social interaction from
reduced access to local shops as acommunity resource
– difficulty accessing postal services ( if no alternative outlet)
– difficulty claiming and cashing benefits – difficulty claiming and cashing pensions – difficulty obtaining cash (if the post
office is the sole place for this/houses a cash machine)
– difficulty cashing cheques (in absence of a bank)
– loneliness/reduced social interactionfrom reduced access to the post office as a community resource
Fresh food shops Post Offices and post office services
Figure 8.1 Potential impacts of restricted access to local retail services
4. Bowden C. (ADAS) and Moseley M (CCRU) (2006) The Quality and Accessibility of Services in Rural England : A survey of the perspectives of disadvantaged residents. Defra.www.defra.gov.uk/rural/pdfs/research/quality-accessibility-services-rural-eng-report.pdf
5. Transport disadvantage is covered in its ownchapter in this report
6. Financial disadvantage is covered in its ownchapter in this report
7. Findley A., Short D. and Stockdale A. (1999)Migration impacts in rural England.Countryside Agency
CC32EvidenceSect2_AW.qxd 26/9/06 5:01 pm Page 101
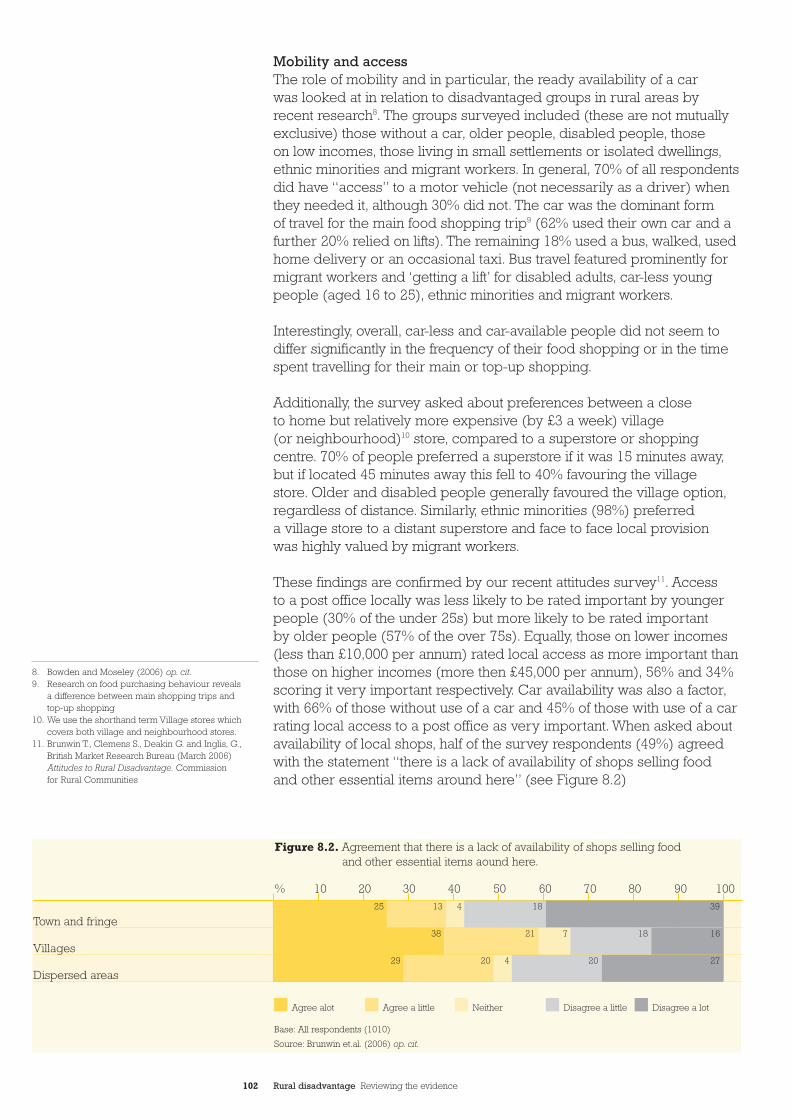
102 Rural disadvantage Reviewing the evidence
Mobility and access The role of mobility and in particular, the ready availability of a car was looked at in relation to disadvantaged groups in rural areas byrecent research8. The groups surveyed included (these are not mutuallyexclusive) those without a car, older people, disabled people, those on low incomes, those living in small settlements or isolated dwellings,ethnic minorities and migrant workers. In general, 70% of all respondentsdid have “access” to a motor vehicle (not necessarily as a driver) whenthey needed it, although 30% did not. The car was the dominant form of travel for the main food shopping trip9 (62% used their own car and afurther 20% relied on lifts). The remaining 18% used a bus, walked, usedhome delivery or an occasional taxi. Bus travel featured prominently formigrant workers and ‘getting a lift’ for disabled adults, car-less youngpeople (aged 16 to 25), ethnic minorities and migrant workers.
Interestingly, overall, car-less and car-available people did not seem todiffer significantly in the frequency of their food shopping or in the timespent travelling for their main or top-up shopping.
Additionally, the survey asked about preferences between a close to home but relatively more expensive (by £3 a week) village (or neighbourhood)10 store, compared to a superstore or shoppingcentre. 70% of people preferred a superstore if it was 15 minutes away,but if located 45 minutes away this fell to 40% favouring the village store. Older and disabled people generally favoured the village option,regardless of distance. Similarly, ethnic minorities (98%) preferred a village store to a distant superstore and face to face local provision was highly valued by migrant workers.
These findings are confirmed by our recent attitudes survey11. Access to a post office locally was less likely to be rated important by youngerpeople (30% of the under 25s) but more likely to be rated important by older people (57% of the over 75s). Equally, those on lower incomes(less than £10,000 per annum) rated local access as more important thanthose on higher incomes (more then £45,000 per annum), 56% and 34%scoring it very important respectively. Car availability was also a factor,with 66% of those without use of a car and 45% of those with use of a carrating local access to a post office as very important. When asked aboutavailability of local shops, half of the survey respondents (49%) agreedwith the statement “there is a lack of availability of shops selling food and other essential items around here” (see Figure 8.2)
8. Bowden and Moseley (2006) op. cit.9. Research on food purchasing behaviour reveals
a difference between main shopping trips and top-up shopping
10. We use the shorthand term Village stores whichcovers both village and neighbourhood stores.
11. Brunwin T., Clemens S., Deakin G. and Inglis, G.,British Market Research Bureau (March 2006)Attitudes to Rural Disadvantage. Commission for Rural Communities
Figure 8.2. Agreement that there is a lack of availability of shops selling food and other essential items aound here.
Town and fringe
Villages
Dispersed areas
% 10 20 30 40 50 60 70 80 90 100
Agree alot Agree a little Neither Disagree a little Disagree a lot
Base: All respondents (1010)
Source: Brunwin et.al. (2006) op. cit.
25 13 4 18 39
38 21 7 18 16
29 20 4 20 27
CC32EvidenceSect2_AW.qxd 26/9/06 5:01 pm Page 102
103 Rural disadvantage Reviewing the evidence
Recent research12 also confirmed that, in the absence of friends andfamily, older people value flexible transport schemes to provide access to shops, such as Dial a Ride and voluntary transport schemes operating in rural areas.
Doorstep deliveryFor many groups, particularly elderly people, a door to door shoppingservice is invaluable, since goods can be heavy to carry on publictransport. Other delivery solutions, such as visiting fish vans and breadvans, also meet this aim, although little current research seems to existinto their numbers, locations and users13. The milkman often deliversfresh produce, like bread and juices, but no recent research was foundon this topic.
The use of ICTThe readiness of disadvantaged groups to shop for groceries on theinternet (assuming access to the internet and free delivery) is low, with52% reporting themselves as “very unlikely” to do so14. Older people areparticularly resistant and accessing services generally via the Internet is almost non-existent amongst migrant workers. In contrast, thosedisadvantaged groups with access to the internet (e.g parents withdependent children and ethnic minorities) were more open to thepossibility of internet shopping. Generally, usage by disadvantagedgroups seemed to relate more to acquiring routine information, thanshopping or banking.
Costs of local shopping Our chapter on financial disadvantage has already noted a lack of data on the costs of living in rural areas. There is some suggestion that those on low incomes find local shops to be prohibitively expensive compared to supermarkets (see for example our DVD Hidden Voices:Rural Disadvantage attached to this report)15, but more research isrequired to compare prices in local shops with prices elsewhere.An All Party Committee is looking at unfair competition related to the big four supermarkets.
Food desertsThe concept of food poverty is often associated with that of ‘food deserts’and is defined by the UK Nutrition Task Force as neighbourhoods,“that are experiencing food poverty as a result of a decline in their localshopping provision”16. Food deserts only exist for those who do not, orcannot, shop outside their immediate locality and where there is poorlocal provision17.
Research in 2000 shows that those most affected by food deserts includelow income groups, those without a car or with limited car access, olderpeople, or those with disabilities, “who are often in areas poorly servedby the retail sector such as rural areas or isolated estates”18. Similar workin 200319 looked at the barriers for rural families to eating five portions offruit and vegetables a day. Through focus group interviews, it revealedthat the main barriers to eating ‘5 a day’ include lack of availability, lowincome and lack of transport, as well as factors such as limited cookingknowledge and skills. Poor selection of food and little fresh food hasbeen suggested as a feature of small, village shops (see for example ourDVD Hidden Voices: Rural Disadvantage, attached to this report)20.
12. Bevan M., Croucher K., Fletcher P. et. al. (2005) The Housing and Support Needs of Older People in Rural Areas. The Countryside Agency
13. Up to 1997 the Rural Services Survey (CountrysideAgency) counted numbers and locations of mobileservice providers.
14. Bowden and Moseley (2006) op. cit.15. On Hidden Voices, the DVD accompanying this
report, a single mother on a low income relies onfriends and family to give her a lift to thesupermarket as the food there is much cheaperthan in local shops
16. Economic and Social Justice Research review(2004) Access to Fresh Healthy Food.Rapid Research and Evidence Review.Sponsored by Defra. www.sd-research.org.uk
17. White et. al. (2004) Do food deserts exist? A multi-level geographical analysis of therelationship between food access, socio-economicposition and dietary intake. (N 09010) Food Standards Agency
18. Street C. and Howarth C. (2000) Food Access:Whose responsibility? New Policy Institute
19. White J. (2003) Barriers to Eating Five a Day Fruitand Vegetables, Community Practitioner; 76 (10)October 2003, pp 377-380
20. On the DVD, Hidden Voices, op. cit. a rural womancomplains that the fruit and vegetables available inthe local shop seem to have seen “better days”and of the limited choice of products
CC32EvidenceSect2_AW.qxd 26/9/06 5:01 pm Page 103
104 Rural disadvantage Reviewing the evidence
Post office servicesRural communities generally value the range of postal services a localpost office provides, whether access to pensions and benefits, handlingpassport applications or providing licences, foreign currency andinsurance21. Research shows consistent levels of use of post offices inrural areas “across all socio-economic groups, except young adults”22.There is some evidence that community use is greater in small townsthan it is where the post office is the only retail outlet.23
Certain groups are more disadvantaged by absence of a local post office than others. Research24 shows that the post office plays a veryimportant role for the more vulnerable groups. One recent survey25
showed that most use was made of the post office (to which a shop isoften attached) by “the elderly, the poorest and those who find it difficultto get to the post office”. In particular, a high proportion of the elderly,disabled, carers and those without a car agreed strongly with thestatement: “I use the post office for services and products that areimportant to me”. Three out of four carers, for example, were likely touse the post office once a week, compared to 59% of all rural residentssurveyed. There is also survey evidence from 199526 that highlights theimportant role of post offices to Citizens Advice Bureau clients, who are typically collecting benefits and on a low income.
Other recent research27 revealed that older people see the post office as important for accessing benefits and financial services. This supportsthe anecdotal evidence that, despite fully automated payments andonline banking opportunities, many pensioners will still prefer (if theycan) to collect payments in cash from a local post office. Concern hasbeen expressed about the adverse consequences for post officebusiness of automated credit transfers, for example of pension andbenefit payments direct into bank accounts. Not only might this lead to closures, but it may reduce the opportunity for social interaction28.
Reduced opportunity for social interactionResearch has shown that post offices play a social role, as much as afunctional one and are an important local informal meeting place. Onesurvey29 found that over 90% of customers in both rural and urban areasthink the ‘community role’ of post offices is very important. More recentresearch30 found that disadvantaged groups rated the post office branchas a focal point in the community. In areas where a community has lost itspost office, other research31 shows people miss its ‘community services’.It finds a strong association between being able to go to a local postoffice and maintaining independence. For older people, its importancerelated both to collecting pensions (12%) and to being a ‘meeting place’ (11 %).
According to recent research32 older people in rural areas, especially,were found to value the post office or local shops beyond their shoppingvalue, as they offer “the opportunity to meet neighbours, exchange a fewwords, and pick up information about events and services”. A trustedpost office worker was often seen as the point of enquiry about benefitsor problems with pension payments. Older people also felt that theirnon-appearance at the post office or shop, perhaps to buy the dailypaper, might alert the community to a problem. Concern has beenexpressed about the likely reduction in social contact over the coming
21. A full list of services which post offices provide can be found on website www.postoffice.co.uk
22. ERM, MORI, SERRL (2001) Post Offices andCommunity Needs in Rural and Deprived Urban Areas. ERM
23. ibid.24. NERA: National Economic Research Association
(2003) Cost –Benefit Analysis of Rural Post Office Branches: A Final report to the PostalServices Commission
25. MORI (2002) Research done for Postcomm.Serving the Community VI – post offices’ vulnerablecustomers in rural and deprived areas.www.psc.gov.uk/postoffices
26. Citizens Advice survey, within NERA (2003) op. cit.27. Bevan (2005) op. cit.28. Countryside Agency (2005) Trends in rural services
and social housing 2003-200429. ERM (2001) op. cit.30. Future Foundation (2003) The Future of the Rural
Post Office Network. A report for Postcomm by the Future Foundation
31. NERA (2003) op. cit.32. Bevan (2005) op. cit.
CC32EvidenceSect2_AW.qxd 26/9/06 5:01 pm Page 104
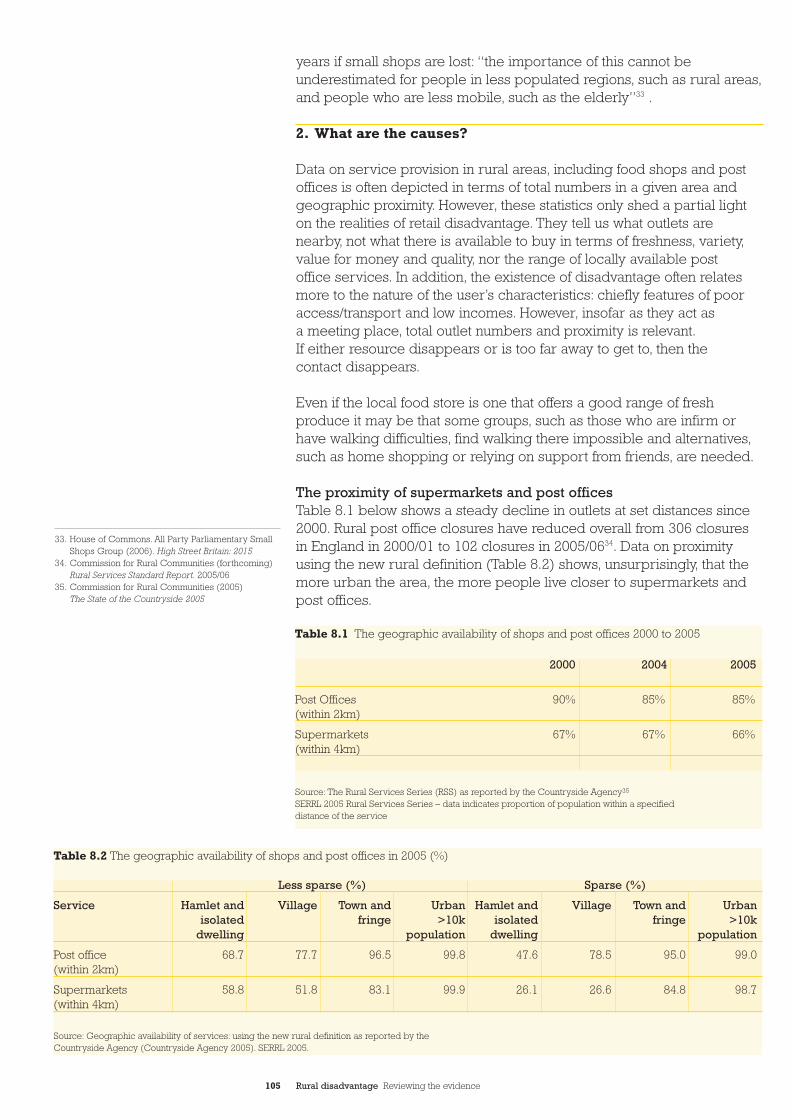
105 Rural disadvantage Reviewing the evidence
years if small shops are lost: “the importance of this cannot beunderestimated for people in less populated regions, such as rural areas,and people who are less mobile, such as the elderly”33 .
2. What are the causes?
Data on service provision in rural areas, including food shops and postoffices is often depicted in terms of total numbers in a given area andgeographic proximity. However, these statistics only shed a partial lighton the realities of retail disadvantage. They tell us what outlets arenearby, not what there is available to buy in terms of freshness, variety,value for money and quality, nor the range of locally available post office services. In addition, the existence of disadvantage often relatesmore to the nature of the user’s characteristics: chiefly features of pooraccess/transport and low incomes. However, insofar as they act as a meeting place, total outlet numbers and proximity is relevant.If either resource disappears or is too far away to get to, then the contact disappears.
Even if the local food store is one that offers a good range of freshproduce it may be that some groups, such as those who are infirm orhave walking difficulties, find walking there impossible and alternatives,such as home shopping or relying on support from friends, are needed.
The proximity of supermarkets and post officesTable 8.1 below shows a steady decline in outlets at set distances since2000. Rural post office closures have reduced overall from 306 closuresin England in 2000/01 to 102 closures in 2005/0634. Data on proximity using the new rural definition (Table 8.2) shows, unsurprisingly, that themore urban the area, the more people live closer to supermarkets and post offices.
2000 2004 2005
Post Offices 90% 85% 85%(within 2km)
Supermarkets 67% 67% 66%(within 4km)
Table 8.1 The geographic availability of shops and post offices 2000 to 2005
Source: The Rural Services Series (RSS) as reported by the Countryside Agency35
SERRL 2005 Rural Services Series – data indicates proportion of population within a specifieddistance of the service
Table 8.2 The geographic availability of shops and post offices in 2005 (%)
Less sparse (%) Sparse (%)
Service Hamlet and Village Town and Urban Hamlet and Village Town and Urbanisolated fringe >10k isolated fringe >10k
dwelling population dwelling population
Post office 68.7 77.7 96.5 99.8 47.6 78.5 95.0 99.0(within 2km)
Supermarkets 58.8 51.8 83.1 99.9 26.1 26.6 84.8 98.7(within 4km)
Source: Geographic availability of services: using the new rural definition as reported by theCountryside Agency (Countryside Agency 2005). SERRL 2005.
33. House of Commons. All Party Parliamentary SmallShops Group (2006). High Street Britain: 2015
34. Commission for Rural Communities (forthcoming)Rural Services Standard Report. 2005/06
35. Commission for Rural Communities (2005) The State of the Countryside 2005
CC32EvidenceSect2_AW.qxd 26/9/06 5:01 pm Page 105
106 Rural disadvantage Reviewing the evidence
Whilst this data reinforces the point that fewer people live near tosupermarkets in smaller settlements, it does not reveal the use of markettowns and other urban centres for shopping by residents living in theirrural hinterland. For example, within north Northumberland three markettowns (Berwick on Tweed, Alnwick and Morpeth) account for 68% ofexpenditure on food shopping36. Neither does data on geographicproximity reflect the part played by traditional markets in some ruraltowns. Research on the role of markets in northern market towns foundthem to be most used by older people and lower social groups, as wellas people living nearby37.
Unfortunately, recent proximity data is only available for supermarkets38,and there seems to be little data on the proximity of smaller food stores39.
Changes in rural shopsThe rural retail sector is substantial and diverse, often far removed fromthe traditional image of the small village shop. One estimate is that in2002 there were at least 57,000 rural shops40. However, between 1998 and 2002, there was a 2.4 % drop in non specialised food stores and an 18.8% drop in specialised food stores in rural regions41. Specialist food shops (such as butchers, bakers, and confectioners) seem to faceparticular pressures with implications for local access to fresh food.
At the same time, food shopping is becoming possible in non-traditionaloutlets, such as petrol forecourts, which offer a facility for those able todrive or walk there. That said, the number of households within 4km of a petrol station has declined between 2000 and 2005 by 1%42. Research in Scotland43 shows that petrol stations are particularly important inlocations where there is no easily accessible alternative shop, generalstore or post office. In Scotland petrol stations offered on average nearlyseven non petrol services and slighter more in remoter rural areas.
Recent monitoring44 of trends in rural services found that shops “aremoving away from being grocery stores to being convenience stores with off licences and chilled or frozen foods and sandwiches”. Conversely,for some independent shops, survival has come through moving intospecialist niche food markets – such as the food and drink outlets atLudlow (South Shropshire) or ethical produce outlets in Garstang,(Lancashire). Niche markets may often capitalise on selling to higherincome households, as well as leisure shoppers and tourists. This coulddeepen disadvantage for vulnerable groups seeking a range of fresh andaffordable produce locally, rather than specialist, premium products.
Increasingly, some supermarkets are moving into smaller rural towns,where there is sufficient footfall for their smaller “top-up supermarket”45.There seems to be little available research relevant to disadvantagedgroups on the effects of top-up supermarkets in rural areas, though theycould enable some to ‘top-up’ on fresh produce regularly.
ViabilityMany rural shops close simply because they are not commerciallyviable, often lacking the footfall in terms of customers to make a profit.In 2003 research46 concluded that:
• relatively few post office branches are profitable and those that are,are in larger rural locations;
36. Countryside Agency (2004) Research Note:The Role of Settlements as Service Centres.CRN 83
37. Countryside Agency (2004) by ER economicconsulting, Kendal. The Role of Traditional Markets in Revitalising Market Towns
38. Supermarkets are defined as greater than 3,000square feet in size. Anything smaller than this for statistical purposes is defined as a convenience store
39. Local shops were counted up to 199740. CRC estimate using the new rural definition and
including some market towns with populations over 10,000 because of the interdependence of many market towns with their surrounding rural hinterland
41. Institute of Retail Studies, University of Stirling(2004) Rural Retailing: Demand and supply of business support and training.For the Countryside Agency
42. Commission for Rural Communities (2005)The State of the Countryside (2005) op. cit.
43. Raymond K., Collin H. and Sidaway R (1998) Petrol Stations in Rural Scotland. Scottish Office Central Research Unit
44. Countryside Agency (2005) Trends in RuralServices and Social Housing op. cit.
45. “Tesco local”, for example46. NERA (2003) op. cit.
“Between 1998 and 2002, there was a2.4% drop in non specialised food storesand an 18.8% drop in specialised foodstores in rural regions”
CC32EvidenceSect2_AW.qxd 26/9/06 5:01 pm Page 106
107 Rural disadvantage Reviewing the evidence
• the benefits accruing to local people from the smallest 20% of postoffices branches do not justify the costs of operating them; and
• almost all rural post offices cost Post Office Limited more to run than the revenue they bring in.
There seems to be little research directly on rural shop viability, althoughone review noted that “rural areas do not always provide profitable sitesfor retailers since many villages contain people who live there but workin urban areas”47.
Consumer lifestyles and demographic trends Trends reflecting increasing affluence and improved mobility underpinmany of the changes in the rural retail sector as do trends related toweekly and top-up shopping.
Demographic and lifestyle changes are having a bearing on ruralretailing. Linked to greater mobility, is the pattern of commuting fromrural areas to other areas for work. Many nowadays shop away fromhome, perhaps in, or near, the place they work and retailers areproviding shops in train and petrol stations48. This potentially divertsbusiness away from local rural shops, forcing them to respond by, forexample, opening longer, offering greater variety or diversifying into non food products and services.
Demographic changes, such as the continued loss of young people andthe growing elderly population, also have a bearing on rural retailingpatterns and consumer demands. Older people may prefer to shop andwithdraw cash locally even if it is more expensive.49
Research into in-migrants to rural areas found that long term residents,local movers and incomers were all most likely to do their weekly foodshopping in a neighbouring town centre or out of town shopping centre.A minority of long-term residents (20%) shopped in their immediateneighbourhood for their weekly food shopping.
Competition, and regulationA recent review of the ‘high street’51 confirms the growing evidence thatcompetition from the ‘Big Four’ supermarkets (Tesco, Asda, J Sainsburysand Wm Morrisons) now seriously affects the ability of independentsmall retailers to compete52. In terms of choice for those living in ruralareas, the House of Commons review notes a lack of research into theeffects that out of town development has had on rural areas compared toresearch into effects on urban town centres. It reveals that between 1991and 1997, a total of 4,000 food shops closed in rural areas53. The reportconfirms that, “as consumers grow older they become more dependenton local shops and services” and that changing demographics is leadingto a concentration of less mobile people in rural areas, “placing animportance on locally accessible retail”.
Research54 into the burdens of red tape and legislation says that it seemsto place greater pressure on smaller businesses, who are unable to copeas well as the large multiples. The same research cites evidence that thedisappearance of the small shop, and especially the grocery shop, canlead to “ghost towns, food deserts and social exclusion”.
47. House of Commons (2006) op. cit.48. Marks and Spencer for example have an
expansion drive at present aimed at a greaterpresence within train and petrol stations (Today programme, October 2005)
49. Bowden and Moseley (2006) op. cit.50. Findley (1999) op. cit.51. House of Commons (2006) op. cit.52. Smaller players such as Marks and Spencer
and Somerfield along with groups like Spar alsooperate in this sector alongside independents.
53. ESRC, cited in House of Commons (2006) op. cit.54. Rural Shops Alliance (2005) Legislation-Regulation.
The Red Tape Burden on Rural Retailerswww.rural-shops-alliance.co.uk
“Older people may prefer to shop andwithdraw cash locally even if it is moreexpensive”
CC32EvidenceSect2_AW.qxd 26/9/06 5:01 pm Page 107
108 Rural disadvantage Reviewing the evidence
3.What are the policies?
Responses to the loss of rural shops and post offices range from public subsidy to local innovation. Public support policies are largelyunderpinned by measures introduced in the Rural White Paper 2000,55
which aim at safeguarding rural services and supporting smallbusinesses. Those policies related to transport, finance and ICTdisadvantage are covered in other chapters of this report.
Support and subsidy policies
Public Service Agreement target on servicesDefra’s Public Service Agreement 4 specifically aims to “improve theaccessibility of services for rural people”. Currently the eight servicesselected by Defra to measure performance against PSA 4 do not referspecifically to shops or post offices, but do relate to topics such aspensions and public transport. The proposed indicator is that theimprovement achieved in the delivery of selected services should be as good in rural areas as it is in urban areas. Defra aims to secure actionthrough key stakeholders, such as Regional Development Agencies and local authorities who manage the delivery of relevant programmes.Defra has also established a programme of evidence gathering to informnecessary action, including research into the future of rural services56.
Rural Services Standard and Social Network PaymentA Rural Services Standard (RSS) specific to post offices was first published within the 2000 Rural White Paper57. This set out a formalrequirement on Post Office Ltd (POL) to maintain the rural network andprevent any “avoidable closures of rural post offices”. The commitmentwas underpinned by Government support of £150m per year, known as the Social Network Payment, initially made available for three yearsfrom April 2003, including a flexible fund of £25 million to demonstrateinnovative ways of delivering postal services in rural areas. This hasbeen extended for a further two years to April 2008. It was intended to allow sufficient time for lessons to be learned from the pilot activitiesbeing carried out by POL to test new ways of delivering services in rural areas. Pilots included outreach services to surroundingcommunities by van and ordering of services by telephone/internet.
The avoidable closures commitment has been extended to Autumn 2006to allow wider consideration and debate of the issues raised in a March2006 report by POL on the pilot activity. The Government intends toconsult on the future of the rural post office network during 2006.
Monitoring information on the closure of rural post offices in Englandshows there has been a slow down in recent years, with closure numbersreducing from 306 in 2000/01 to 102 in 2005/0658. However, the network is still declining. Figures59 show the continuing decline in terms ofgeographic proximity: 90% of households lived within 2km of a postoffice in 2000, compared with 85% in 2005.
55. Defra (2000) Rural White Paper: Our Countryside:the future
56. University of Gloucestershire: Countryside andCommunity Research Unit (CCRU) and University of Cardiff (2005) The Future of Services in RuralEngland: - a scenario for 2015 CCRU
57. Defra (2000) op. cit.58. Commission for Rural Communities (forthcoming)
Rural Services Standard Report op. cit.59. Commission for Rural Communities (2005)
State of the Countryside 2005
“90% of households lived within 2km of a post office in 2000, compared with85% in 2005”
CC32EvidenceSect2_AW.qxd 26/9/06 5:01 pm Page 108
109 Rural disadvantage Reviewing the evidence
Rural Business Rate Relief Rate relief measures exist for certain rural businesses in ruralcommunities with a population of under 3,000. This brings a guaranteedentitlement of 50% reduction in the business rates bill for eligiblebusinesses – or up to 100% if a local authority so decides. An eligiblebusiness includes:
• the only village general store or post office, as long as it has arateable value of less than £7,000;
• any food shop with a rateable value of less than £7,000; and • the only village pub or the only petrol station if the rateable value
is less than £10,500.
Any business in a qualifying rural village with a rateable value of lessthan £14,000 can get up to 100% rate relief from their local authority ifthe business is considered to be of benefit to the local community. Thatdecision rests with the local authority.
A survey in 2004 found that of 1,200 small businesses occupying a singleproperty in England, only 20% of those interviewed thought that they hadever claimed rate relief. Another finding showed that around 2% of thesurvey sample had claimed rural rate relief.60
Vital Villages and advice and support programmes Until April 2005 the Countryside Agency ran a Vital Villages programme,which included a Community Service Grant (CSG) scheme. Qualitativeinformation61 highlights the assistance given by the CSG to supportinnovative ways to maintain shops and post offices. Following thepublication of the Government’s Rural Strategy 2004, delivery of socio-economic initiatives passed largely to Regional Development Agencies(RDAs) and this included the completion of existing CSG commitments.RDAs have responsibility, through PSA 4, to deliver initiatives thatcontribute to improving access to services, although a ring-fenced potfor community based services does not exist. RDAs have also run RuralRenaissance funds operated according to sub regional criteria. SomeLocal Authorities have retained support schemes for village shops.
An evaluation62 of the Vital Villages programme as a whole (of which the CSG was a part) notes that over the three year period, 2001 to 2004,there were 1,246 CSG projects. It identified the main beneficiaries of theVital Villages package63 as “the elderly, young people, disabled and lowincome groups”. CSG services projects were “slightly more likely indeprived wards than the other schemes”. Commercial businesses andcharitable trusts made up around two thirds of applicants for CSG grants.
Multi-service outlets and joint provisionThe co-location of disparate services in what may be termed ‘multi-service outlets’ is an increasingly common local response to thedifficulties of service delivery in sparsely populated areas. The mostbasic and longstanding example of this is the “village shop cum postoffice” merging the two services. Research64 on co-location found it to be worthwhile as a means to maintain services in areas of low populationdensity, benefiting both the providers and users. Other work in 200065
found that because it is often financially advantageous for serviceproviders to co-exist and co-host, this meant delivery may be possible at relatively low unit costs. In a more recent survey66 of four English
60. ODPM (2004) Survey of Small Businesses and Rate Relief www.odpm.gov.uk
61. Countryside Agency (2005) Trends in RuralServices. op. cit.
62. Countryside Agency (2005) Evaluation Report:Judging the success of the Vital Villages grantsprogramme
63. Vital Villages comprised Parish Plan Grant Scheme, Parish Transport Grant Scheme,Rural Transport Partnership Grant Scheme as wellas the Community Services Grant Scheme.See www.countryside.gov.uk
64. Moseley M., Parker G. and Wragg A. (2000) The Joint Provision of Services 2000.Countryside Agency
65. Harrop A. and Palmer G., (2000) The Costs of The Joint Provision of Services in Rural Communities.Countryside Agency
66. Moseley M., Parker G. and Wragg A. (2004) Multi-Service Outlets in Rural England: The Co-location ofDisparate Services. Planning Practice and Research.Volume 19 (4) November 2004, pp 375-391 (17)
CC32EvidenceSect2_AW.qxd 26/9/06 5:01 pm Page 109
110 Rural disadvantage Reviewing the evidence
counties, about a quarter of rural parishes had such an outlet, evenexcluding shop/post offices and conventional village halls. Whereservices are truly provided jointly, with the partners involved for examplein sharing staff, this is often termed “joint provision”.
At present there is no overarching strategy in place to guide thedevelopment of multi-service outlets and joint provision67. However,some initiatives have been run. “The Pub is the Hub”68, promotes goodpractice solutions, helping to keep pubs viable by co-locating otherservices within the pub, such as a shop and a post office. In addition,joint provision national demonstration projects69 were part funded by the Countryside Agency. One, Waters Upton in Shropshire serves four villages and six smaller hamlets and provides a host of services,including a shop, post office and ATM cash machine. A recentevaluation70 of Waters Upton found little usage by disadvantaged groupsand one of the core income streams (courses put on by the college) was,potentially prohibitively expensive to the elderly. Other than this, it seemsthat there is little evidence of any widespread formal evaluation of theoutcomes of multi-service outlets and joint provision projects.
Community shops and post officesCommunity ownership is another local policy response which has beenlittle evaluated, but seems to have potential in rural areas71. Recentresearch by Plunkett, to be published by DTI and Defra72, aims tounderstand the reasons behind the rapid growth of community ownedshops in rural England and to assess the longer term potential for theirfurther development and growth. There are currently around 150 activecommunity owned shops in rural England. Community owned shops are mainly convenience stores, but many also stock local and specialityfoods. Just under 62% of the community shops identified had a co-located sub post office. The main factors contributing to their successare: the demographic characteristics of the community; the localcompetition; opportunities for passing trade; co-location with a postoffice; the location of the site within the village; and the availability ofpeople to drive the initiative. The work estimated that 1,047 settlements(of between 200–900 population) had most of the characteristicsconducive to the development of community shops and 140 had them all. There does not, therefore, appear to be any limit which will impedethe growth of community owned shops in the foreseeable future.
The new Defra Community and Social Programme which came into effectin April 2006 and will operate for two years initially, aims to support thecapacity of the voluntary sector and should have the potential (albeit withlimited funds) to assist community and social enterprises.
ICT solutions and ‘online’ shoppingOnline banking services could potentially help tackle disadvantage byovercoming lack of physical access to banking and financial services,but only for those who are able to, or can afford to, make use of onlineservices. Evidence previously outlined indicates that there are groups,such as older people or the unemployed, who prefer to collect pensionsand benefits in person. More general issues relating to people’s accessto and use of ICT are covered in the chapter on ICT disadvantage in this report.
67. University of Gloucestershire (2005) op. cit.68. Countryside Agency (2001) The Pub is the Hub –
A good practice Guide. Countryside Agency69. Countryside Agency (2003) Joint Provision National
Demonstration Projects70. Cambridge Policy Consultants (2005)
Waters Upton and Hudson House Evaluation for the Commission for Rural Communities
71. Rural Community Councils (Countryside Agency2005 Trends in Rural Services op. cit.) envisage a growth of community shops alongside a growth in ‘multi service outlets’
72. Plunkett (forthcoming)- A report for Defra and the DTI
“At present there is no overarchingstrategy in place to guide thedevelopment of multi-service outlets and joint provision”
CC32EvidenceSect2_AW.qxd 26/9/06 5:01 pm Page 110
111 Rural disadvantage Reviewing the evidence
4. Summary
• Sharp decline in the number of local food shops: this is the caseacross rural areas, particularly specialist food shops, to a limitedextent offset by food sales in places like petrol stations. Absence of local food shops seems to be more of an issue in smaller ruralsettlements, though much information relates only to supermarketsnot smaller food shops. There is little evidence on what is stockedby rural shops, apart from anecdotal evidence on poor choice and high priced food.
• Lack of local access to a food shop or post office: this seems mostly to be a problem for the minority of rural residents thatcannot go further afield. Evidence suggests that those mostdisadvantaged include the elderly, disabled, carers, low incomegroups, the unemployed and the immobile (usually meaning withoutaccess to a car). This can lead to problems of poor diet. It alsoreduces opportunities for informal meeting and networking.Evidence shows that post offices- though mostly not commerciallyviable - are valued as a local resource for a range of services and as an informal meeting place. However, there is a need forimproved data about access to food shops and post offices forhouseholds within rural areas. This should not simply use distancemeasures, so painting a clearer picture of access and for whom.
• Impacts, for whom?: further research may be helpful to clarify the impacts, and for whom, when a food shop or post office is notavailable locally. This could cover issues such as what foods areavailable, what post office services are most important, and theimpact of outlets as places for social interaction. Further researchcould also usefully expand existing knowledge of the demand forlocal food shops and post offices, particularly by vulnerable groups. This should build on work being done by Defra and thepost office regulator.
• Policies to subsidise rural post offices: these policies do seem tohave slowed closures, but the future of this subsidy and of the postoffice network remains uncertain. Schemes to support village shopssuch as the Community Services Grant seem to have been popularwith the rural retail sector. It is too early to assess what will resultfrom devolving this money to the regional tier. Other policies, suchas rural transport policies, need to be examined alongside retailpolicies to facilitate access, particularly for those without access to a car and where no local shop or post office exists.
• New and innovative solutions: evidence also suggests a need forfuture support policies to focus on developing new and innovativesolutions, particularly developing the idea of multi-service outlets and online opportunities. Further research should evaluatethe demand for and barriers to the more widespread adoption of multi-service outlets/co-location in different types of ruralcommunities. In addition, further research is needed to test thescope for offering ICT related solutions to disadvantaged groupsand alternatives to face to face shopping.
• Out of town development: further research is needed to establishthe effects that out of town development has on local food shops and post offices in rural areas.
CC32EvidenceSect2_AW.qxd 26/9/06 5:01 pm Page 111
112 Rural disadvantage Reviewing the evidence
Safety disadvantage
This chapter covers the link between being, or feeling safe and people’sability to participate fully in society in other words, without being a victimof crime or living in fear of being a victim of crime. The majority ofpeople take for granted the ability to go about their daily lives withoutbecoming a victim of crime. This section examines whether there isevidence that some rural people or social groups are more likely to bea victim of crime than others2. Our focus in this section is, therefore, onpersonal crime against individuals or private households and theirproperty. This excludes crime by or against businesses and what hasbeen termed ‘rural crime’ such as poaching, animal rustling or crimesagainst wildlife. Disadvantage related to quality of the environment as aresult of crime and anti-social behaviour (such as graffiti) are coveredin the chapter on local environmental disadvantage.
1.What is the problem?
The experience of being a victim of crime can have a considerabledetrimental impact on someone’s quality of life and well-being, “victimsand witnesses suffer financial and emotional loss and the fear of crimecan mean people feel unsafe, particularly at night”3. The nature of thecrime will clearly help determine the impact on someone’s life, as willpersistently or repeatedly being a victim of crime. People who havebeen a victim of crime can experience a range of emotional effects,such as depression, anxiety, panic and difficulty sleeping, loss of self-confidence and associated changes in behaviour, poor health andmental well-being, as well as the more obvious financial loss or physicalloss or injury that might occur. Some victims need to take time off workto recover. In general, the most costly crimes (in terms of both economicand social costs) are those with a large estimated emotional and physicalimpact, specifically, homicide, wounding, robbery, and sexual offences4.
Some people are more likely to be a victim of crime than others. Thosewith higher incomes are more likely to experience vehicle crime andpoorer households are more likely to experience burglary or domesticviolence. Poorer households “often have no option but to exposethemselves to greater danger”5.
Being a victim of crime can also impact unequally on different groups ofpeople. It can be particularly severe for older people and a small surveyfound older victims of burglary declined in health faster than non-victimsof a similar age6. In addition, people on low incomes may be less able todeal with it7. For example, they may lose income if they are paid by thehour or by piece-work, or it may be harder to take time off work torecover from injuries. People on low incomes may also be less able toreplace any stolen items or have little access to savings or assets to helpthem deal with the immediate impact of the crime, such as fixing brokendoors or windows8. In general, people with an income of less than£10,000 a year are more than twice as likely as those with an income ofmore than £30,000 to report that their quality of life is greatly affected bycrime and 32% of those who say they would find it ‘impossible’ to find£100 at short notice report being ‘very much’ affected by experiencingcrime. The comparable figure for those who would find it ‘no problem’ is
“The residual effects of victimisationand concern about crime can last forweeks, months or even years, spill overinto many areas of life, and are oftendramatically amplified by bothdisadvantage and repetition”1
1. Dixon M., Reed H., Rogers B. and Stone L. (2006)Crimeshare: the unequal impact of crime. IPPR
2. A number of reports were reviewed which have notbeen directly quoted in this chapter. These include:Crime Concern (2002) Young People in Rural Britain:Partners in crime prevention; Crime Concern (1995)Cutting Crime in Rural Areas – A practical guide forparish councils; Joseph Rowntree Foundation (2004)A Study of Visible Security Patrols in ResidentialAreas; Lawtley A. and Dean M. (2000) CommunitySafety in Rural Areas. NACRO; Nicholas S., Povey D.,Walker A. and Kershaw C. (2005) Crime in Englandand Wales 2004/05. Home Office Statistical Bulletin11/05; Pantazis C. (2006) Crime, ‘Disorder’,Insecurity and Social Exclusion, chapter 9 in Pantazis P., Gordon D. and Levitas R. (eds) Povertyand Social Exclusion in Britain: The millenniumsurvey, Policy Press
3. National Audit Office (2004) Reducing Crime:The Home Office working with Crime and DisorderReduction Partnerships. Report by the Comptrollerand Auditor General. HC 16 Session 2004-05
4. Home Office (2005) The Economic and Social Costsof Crime against Individuals and Households2003/04. Home Office online report 30/05
5. Dixon et. al. (2006) op. cit.6. Donaldson (2003) quoted in Phillipson C. and
Scharf T. (2004) The Impact of Government Policy on Social Exclusion among Older People.A review of the literature for the Social Exclusion Unitin the Breaking the Cycle series. Social ExclusionUnit, ODPM
7. Dixon et. al. (2006) op. cit.8. Dixon et. al. note some financial assets can help
‘smooth’ income against unpredictable financialoutlays and even small amounts can provide animportant protection (Bynner and Paxton 2001)
9CC32EvidenceSect2_AW.qxd 26/9/06 5:01 pm Page 112
113 Rural disadvantage Reviewing the evidence
14%9. Whilst figures are not available for rural areas, our new attitudinalsurvey10 showed that 23% of rural residents would find it difficult to find£100 to meet an unexpected expense and 4% would find it impossible.
It has also been argued that the same offences can be experienced verydifferently in different contexts. In rural areas, the lack of transport,physical and social isolation, lack of support services, and rural culturehave all been suggested as local factors that impact on rural victims’experience11. For example, the theft of a car may make it impossible forsome to travel to work in rural areas. The influence of these issues ona victim’s willingness to report a crime and the impact on theirexperiences of crime is under-researched and often speculative.
BurglaryThe incidence of burglary in 2004/05 was 175 per 10,000 households invillages, hamlets and isolated dwellings and 208 per 10,000 in town andfringe areas12. There is little research on rural burglary and what types ofproperty are targeted, nor what types of belongings are stolen. It seems,however, the risk of being burgled in rural areas is similar for both owneroccupiers and social renters, whereas people in urban areas are muchmore likely to be burgled if they rent (either private or social sectors)13.This may reflect the greater mixing of tenures within rural areas and thelack of concentrations of single tenure areas.
In rural areas, the risk of being burgled does not seem to vary with ahousehold’s income. Information (see Table 9.1) shows that 2% ofhouseholds with an annual income of less than £5,000 in rural areas wereburgled, compared to 3% of households with incomes of over £20,00014.
The impact of burglary, in financial terms at least, may be less severefor people who can afford insurance. Statistics for rural areas of Britainsuggest that more people in the smaller settlements have homeinsurance – in rural settlements of less than 3,000 people, 17% ofhouseholds have no home contents insurance, compared to 29% inurban settlements of 25,000 or more people15. Nevertheless, the poorin rural areas are much less likely to have home contents insurancethan other rural households. These households will, therefore, be muchharder hit financially if they do experience a burglary.
Proportion of households burgled Rural Urban
Less than £5k pa 2 5
£5-10k 2 4
£10-15k 2 4
£15-20k 2 4
Over £20k 3 3
Table 9.1. Experience of burglary for different income groups
Source: New Policy Institute (2005) based on British Crime Survey 2002/03 and 2003/04
9. Dixon et. al. (2006) op. cit.10. Brunwin T., Clemens S., Deakin G. and Inglis G.
(2006) Attitudes to Rural Disadvantage: ASegmentation Analysis Report. A report by BMRB to the Commission for Rural Communities
11. Johnson S. and Marshall B. (2006) Crime in RuralAreas: a Review of the Literature. Jill Dando Instituteof Crime Science for RERC/Defra
12. The British Crime Survey (BCS) is generallyregarded as providing the most accurate figures on crime since they go some way to overcomingthe problems of underreporting.
13. New Policy Institute (NPI) website(www.poverty.org.uk) using the BCS 02/03 based on an acorn classification of rural
14. ibid.15. The NPI indicators (www.poverty.org.uk) Using
the Tarling definition of rural districts. Based on data from the family expenditure survey 2000-01 (ONS 2002)
CC32EvidenceSect2_AW.qxd 26/9/06 5:01 pm Page 113
114 Rural disadvantage Reviewing the evidence
Vehicle crimeDuring 2004/05, there were 570 vehicle related thefts per 10,000households in villages, hamlets and isolated dwellings and 566 in ruraltown and fringe areas16 .The theft of a vehicle may disproportionatelyaffect rural victims where there are poorer public transport links andwhere victims rely on their vehicles for work17. It may also impact moston those with limited financial resources. Whilst all car owners arerequired to hold third party car insurance (which covers theft), no figuresare available about whether some people in rural areas would struggleto afford increased insurance premiums following a theft.
Violent crimeViolent crimes are crimes against a person and include domesticviolence, mugging, robbery and assault. In 2004/05, violent crimeincidents were 337 per 10,000 adults in villages, hamlets and isolateddwellings and 413 in rural town and fringe areas18.
Repeat victimisation Repeat victimisation can also, perhaps not surprisingly, have more of animpact than being a victim of a single crime. Even what might appearto be relatively minor crimes, might become difficult to bear if they arerepeated and repeat victims can become more vulnerable. There issome information about the extent to which people experience repeatvictimisation and ongoing harassment in rural areas. In 199920 asignificant number (29%) of crime victims in rural areas experiencedmore than one incident. Repeat victimisation of vehicle-related crimewas 25% in rural areas and 45% of victims of violent offences21. However,there seems to be little in-depth rural analysis about the types of peoplewho are likely to be repeatedly victimised and the extent to which repeatvictimisation impacts on their lives.
Domestic violenceGaining accurate figures on domestic violence and sexual assaults isparticularly difficult, regardless of geographic location, although thephysical and social isolation, a lack of support services for victims, ruralculture and poor transport may impact on underreporting in rural areas.Available evidence suggests that the prevalence of domestic violence inrural areas is less than it is in urban areas (particularly in inner cities) butthat, nevertheless, 3.3% of females and 1.8% of males in rural areas werea victim of domestic violence in 200122.
Domestic violence is also strongly associated with repeat victimisation,though there is no national information on the extent to which ruralvictims of domestic violence live with their abuser before or afterseeking help. Some recent evidence suggests that, in general, there is alink between the experience of domestic violence and householdincome. Women in households with incomes of less than £10,000 werethree and a half times more likely to suffer domestic violence than thosewith incomes of over £20,00023.
Hate crimeHate crime is a crime against someone or their property because oftheir age, colour, gender, race, ethnicity, religion, sexual identity ordisability. Being a victim of hate crime “can be a particularly frighteningexperience... and the effects of hate crime can last for a long time,
16. The survey relates the theft to where the respondentlives rather than the location of the crime (e.g. place of work or elsewhere). This may gosome way to explaining the higher levels of vehicle than other crime in rural areas.
17. Johnson S. and Marshall B. (2006) Crime in RuralAreas: a Review of the Literature. Jill Dando Instituteof Crime Science for RERC/Defra
18. Again, the BCS data record only where the victimlives and not where the violent crime took place.
19. Johnson S. and Marshall B. (2006) op. cit.20. British Crime Survey using the ACORN
classification of rural and for England and Wales.21. Aust R. and Simmons J. (2002) Rural Crime:
England and Wales. Home Office 01/0222. The British Crime Survey for 2001 used a
Computer-Assisted Self-Interviewing (CASI)questionnaire which aimed to increase the rate of reporting due to the added privacy and sense of anonymity, and found higher rates than typicallyin the BCS Marshall and Johnson (2006).
23. Walby S. and Allen J. (2004) Domestic Violence,Sexual Assault and Stalking: Findings from the British Crime Survey. The Stationery Office.
Once someone experiences crime, therisk of re-victimisation increasessubstantially and “research consistentlydemonstrates that one of the bestpredictors of crime risk is pastvictimisation”19
CC32EvidenceSect2_AW.qxd 26/9/06 5:01 pm Page 114
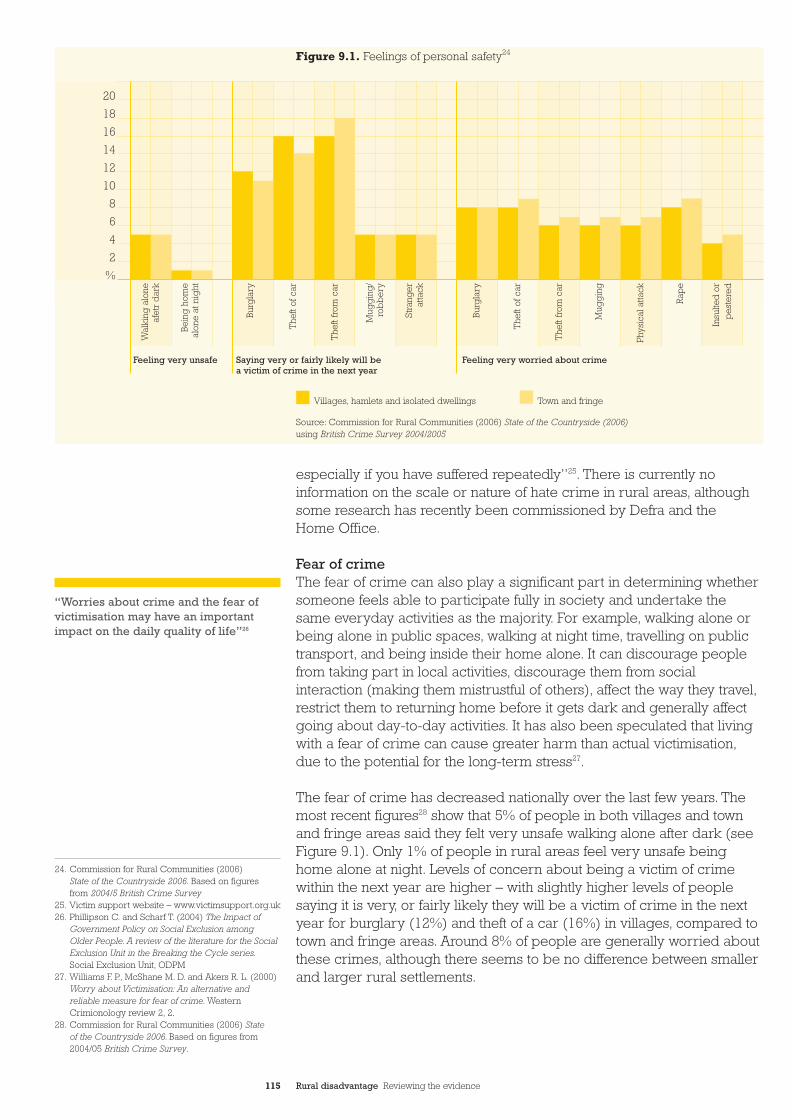
115 Rural disadvantage Reviewing the evidence
especially if you have suffered repeatedly”25. There is currently noinformation on the scale or nature of hate crime in rural areas, althoughsome research has recently been commissioned by Defra and theHome Office.
Fear of crimeThe fear of crime can also play a significant part in determining whethersomeone feels able to participate fully in society and undertake thesame everyday activities as the majority. For example, walking alone orbeing alone in public spaces, walking at night time, travelling on publictransport, and being inside their home alone. It can discourage peoplefrom taking part in local activities, discourage them from socialinteraction (making them mistrustful of others), affect the way they travel,restrict them to returning home before it gets dark and generally affectgoing about day-to-day activities. It has also been speculated that livingwith a fear of crime can cause greater harm than actual victimisation,due to the potential for the long-term stress27.
The fear of crime has decreased nationally over the last few years. Themost recent figures28 show that 5% of people in both villages and townand fringe areas said they felt very unsafe walking alone after dark (seeFigure 9.1). Only 1% of people in rural areas feel very unsafe beinghome alone at night. Levels of concern about being a victim of crimewithin the next year are higher – with slightly higher levels of peoplesaying it is very, or fairly likely they will be a victim of crime in the nextyear for burglary (12%) and theft of a car (16%) in villages, compared totown and fringe areas. Around 8% of people are generally worried aboutthese crimes, although there seems to be no difference between smallerand larger rural settlements.
Figure 9.1. Feelings of personal safety24
20
18
16
14
12
10
8
6
4
2
%
Wal
king
alo
neaf
etr
dar
k
Bein
g h
ome
alon
e at
nig
ht
Burg
lary
The
ft of
car
The
ft fr
om c
ar
The
ft of
car
The
ft fr
om c
ar
Mug
gin
g
Phys
ical
atta
ck
Rap
e
Insu
lted
or
pes
tere
d
Mug
gin
g/
rob
ber
y
Stra
nger
atta
ck
Burg
lary
Feeling very unsafe Saying very or fairly likely will bea victim of crime in the next year
Feeling very worried about crime
24. Commission for Rural Communities (2006) State of the Countryside 2006. Based on figures from 2004/5 British Crime Survey
25. Victim support website – www.victimsupport.org.uk26. Phillipson C. and Scharf T. (2004) The Impact of
Government Policy on Social Exclusion among Older People. A review of the literature for the SocialExclusion Unit in the Breaking the Cycle series.Social Exclusion Unit, ODPM
27. Williams F. P., McShane M. D. and Akers R. L. (2000)Worry about Victimisation: An alternative andreliable measure for fear of crime. WesternCrimionology review 2, 2.
28. Commission for Rural Communities (2006) State of the Countryside 2006. Based on figures from2004/05 British Crime Survey.
“Worries about crime and the fear ofvictimisation may have an importantimpact on the daily quality of life”26
Villages, hamlets and isolated dwellings Town and fringe
Source: Commission for Rural Communities (2006) State of the Countryside (2006) using British Crime Survey 2004/2005
CC32EvidenceSect2_AW.qxd 26/9/06 5:01 pm Page 115
116 Rural disadvantage Reviewing the evidence
The data does not show, however, differences in the fear of crimebetween different population groups in rural areas and the types ofcrime they fear. Nationally, older people are more worried about crime,and women and older people fear violent assault, although it is youngmen who are most likely to experience this. Some limited information is available for rural areas which shows that older women in low incomehouseholds are much more likely to feel very unsafe walking alone afterdark (27%) compared to older women in higher income households(17%), reflecting the national picture29. However, there is no otherresearch exploring the different characteristics of rural people living in fear of crime and the reasons for their fear. There is also no ruralevidence about how the fear of crime impacts on people’s lives andthe extent to which it influences their actions and behaviour.
2.What are the causes?
There has been extremely little research undertaken into the causesof crime in rural areas and why some people are victims rather thanothers. Much of the available information is drawn from rural Scotlandor was undertaken some years ago. Attention has instead been onunderstanding urban patterns, given the greater level of crimeexperienced there. This suggests that there are several interrelatedfactors that come together and will lead to whether a crime is committedor not. These are whether there is a ‘motivated offender’, a suitable‘target’ and something to deter the offender30.
Offender behaviourOne possibility for the pattern of lower crime levels in less populatedareas, is that most offenders live in urban areas. Indeed, there is awidespread perception that rural crime is not committed by ruralresidents, but rather by people travelling into the area from outside.Some limited research information is available from rural Scotland,although this was undertaken several years ago and includes a varietyof rural areas that will bear little similarity to rural England (for example,an Outer Hebridean island)31. This suggested that rural residents felt thatcrimes were committed by three different types of offenders: ‘incomers’,people who have moved into the local area and ‘lacked investment ineither it or its sense of moral values’; ‘travelling’ or ‘away-day’ criminalsfrom urban areas particularly in relation to housebreaking or cartheft; and by local ‘rogues’ who were tolerated members of thelocal community.
However, research suggests that most criminals commit crimes closeto where they live, through their awareness of opportunities from theirroutine travel and living patterns32. This may explain higher levels ofburglary and violent crime in the larger settlements and more denselypopulated areas within rural England, since these areas are likely tohave a greater level of movement of people within or through them.
29. NPI Indicators (www.poverty.org.uk) using BritishCrime Survey combined data for 2002/03 and2003/04. Low income household is one with incomeof less than £10,000 per year and the definition ofrural here is the ACORN postcode classifications
30. Johnson S. and Marshall B. (2006) op. cit.31. Anderson S. (1997) A Study of Crime in Rural
Scotland. The Scottish Office Central Research Unit.The research looked at the 1993 Scottish CrimeSurvey and drew on focus group discussions andinterviews with police officers in four case studyareas: Wester Ross, Angus, Ayrshire and Harris
32. Wiles P. and Costello A. (2000) The ‘Road toNowhere’: The evidence for travelling criminals.Home Office Research Study 207; Rengert G.Piquero A.R. and Jones P.R. (1999) Distance DecayReexamined. Criminology, 37 (20, 427-446)
CC32EvidenceSect2_AW.qxd 26/9/06 5:01 pm Page 116
117 Rural disadvantage Reviewing the evidence
In smaller settlements and less sparsely populated areas, people may have less reason to travel to or through these areas for legitimatereasons, and hence do not develop an awareness of them. There is,however, no research analysis of the extent to which crime occurs in rural areas as a result of being where people are more likely to travel to, such as areas with a large number of tourists, or good transport links, nor indeed whether the crime in these areas is committed by‘travelling criminals’ rather than more local residents33.
The socio-economic circumstances and demography of rural areas hasalso been suggested as a possible reason influencing the lower levels ofcrime34. In particular, offending is more likely to be committed by peopleaged 16 to 20, especially crimes of a more opportunistic and lessserious nature. Fewer young people living in rural areas may thereforebe influential. Similarly, offending has been related closely in research toareas that are more socially and economically deprived and averagelevels of deprivation are lower in rural areas. Both of these suggestionsof a lack of ‘motivated offenders’ are, however, unproven.
There seems to be no information on whether crime in rural areastends to be more opportunistic or planned, or the extent to which itis organised.
There is little research on rural burglary and how and why some peopleare more vulnerable than others. It has been argued that there are sixfactors that influence an offender in stealing property: “He or she wantsto be able to conceal it, remove it, have it available, find it valuable, enjoyit, and dispose of it readily”35. Some property, is for example, more likelyto be available in rural areas such as tools and tractors. They may bemore concealable and removable in rural areas, “where items can beput into vans quickly and easily with less people around to witness theevent”36. It has been suggested that items stolen from rural areas aremore likely to weigh more as offenders are more likely to travel by carsor vans than on foot37.
A lack of neighbours, passers-by and people around to witness an event may also lead to some crimes being committed. The extent towhich this influences crime in rural areas is unclear given the generallylower levels in more sparsely populated areas and points to the complex interrelationship between opportunity, target and interveningprevention influences.
Rural cultureThe attitudes and culture within rural communities can also impact onpeople’s experience of crime. In particular, the high level of socialcohesiveness within communities can have positive benefits, as peopleare more likely to know one another in rural areas and ‘look out for oneanother’, or even know there is unusual or suspicious activity. This mightsuggest that people with fewer local networks and contacts are morelikely to experience crime, although there is no research on this.
33. Johnson S. and Marshall B. (2006) op. cit.34. Johnson S. and Marshall B. (2006) ibid.35. Felson M. (2002) Crime and Everyday Life
(3rd edition). Sage36. Johnson S. and Marshall B. (2006) op. cit.37. Felson M. (2002) op. cit.
CC32EvidenceSect2_AW.qxd 26/9/06 5:01 pm Page 117
118 Rural disadvantage Reviewing the evidence
However, it has also been found that rural culture can impact negativelyand lead to some crimes being committed or unreported. This is “dueto increased tolerance and ‘techniques of neutralisation’ whereby peopledevelop a set of justifications that allow them to excuse their, or theirneighbour’s deviant behaviour.”38 This can include the value of ‘mindingone’s own business’, of self-sufficiency by keeping problems within the family, or a sense of traditional obedience to husbands. It has beenespecially associated in research with domestic violence in rural areas,as well as racially motivated crimes39.
Crime prevention activityLevels of crimes experienced by people in rural areas may, in part,be explained by the crime prevention measures that they take. Recentevidence40 shows that in rural areas, only 52% of homes have securewindows and doors, compared with 58% in suburban areas (49% in cityand other urban centres). Suburban dwellings are also more likely tohave burglar alarms, 29% compared with 24% in rural areas and 22% in city and other urban centres. Door entry, CCTV and communal burglar alarms are more likely to be found in flats located in city andurban centres. There is no information about why some rural homes do not have crime prevention measures and the extent to which this isbecause of the household’s inability to afford them or their perceptions of and attitudes to, risk.
Other prevention influencesThe design and layout of public buildings and areas can also play a rolein preventing or deterring crime, such as the presence of street lightingor the design of cul-de-sacs. There seems to be no evidence of theextent to which these features occur in rural areas and the role they playin leading to lower levels of rural crime, or the unequal experience ofcrime in rural areas. There is some information to show that clusters ofvulnerable people may be more susceptible to being targets of crime,such as concentrations of older people in sheltered housing41.
Policing as a deterrentResearch suggests that rural police officers tend to be more integratedin the local community than their urban colleagues and often have amore direct connection with the areas they police42. This leads to whathas been referred to as more ‘informal policing’ in which officersmediate between a complainant and an alleged offender rather thanenforcing more formal proceedings43. Of course, given its informalnature, it is difficult to measure the extent to which this approach reduceslevels of crime and whether some people or some types of crime aremore likely to receive this informal attention than others.
Access to support servicesAccess to services, including information and advice, may also play arole in why some people experience crime. This can be important wherethere is a stigma or lack of social acceptance associated with the crime. Inparticular, victims of domestic violence may continue to live in an abusiverelationship because of the lack of alternative local accommodation ora refuge44. Physical and social isolation can be closely interwoven, andit has also been suggested that living in an isolated area can make iteasier for the perpetrator to exert control over their partner45.
38. Barclay E., Donnermeyer J. F., and Jobes P. C. (2004)The Dark side of Gemeinshaft: Criminality with ruralcommunities. Crime Prevention and CommunitySafety: An International Journal 6, 3, 7-22
39. Anderson S. (1997) A Study of Crime in RuralScotland. The Scottish Office Central Research Unit;Williams B (1999) Rural Victims of Crime. In DingwallG. and Mooday S. (eds) Crime and Conflict in theCountryside. University of Wales Press
40. from the latest English House Condition Survey(2003)
41. Phillipson C. and Scharf T. (2004) op. cit.42. Anderson (1997) op. cit.; Dingwall G. (1999)
Justice by Geography: Realising criminal justice in the countryside. In Dingwall G. and Moody S. (eds)op. cit.
43. Williams (1999) op. cit.44. Stalford H., Baker H. and Beveridge F. (2003)
Children and Domestic Violence in Rural Areas.Save the Children
45. Mackay A. (2000) Reaching Out – Women’s Aid in a Rural Area. East Fife Women’s Aid
CC32EvidenceSect2_AW.qxd 26/9/06 5:01 pm Page 118
119 Rural disadvantage Reviewing the evidence
The visibility in accessing services and fear of identification (ranging from the doctor’s surgery to the police station to voluntary and statutorysupport services) and the lack of anonymity or perceived confidentially in rural areas has also been suggested as a factor. Research on domesticviolence found that “women in rural areas face additional obstaclescompared to those living in a town or a city when trying to access help”46.
Access to services could also impact on offenders themselves seekinghelp with, for example, drug and alcohol support services47.
Fear of crimeFactors leading to people having a fear of crime include their gender,age, past experience of abuse and violence, levels of health anddisability and mobility. However, the importance and interrelationshipsbetween all these factors is far from clear and little information isavailable on how these interrelate in rural areas.
The role of the ‘rural idyll’ has been suggested as a factor leading tosome people in rural areas having a fear of crime. Given the generalperception of rural areas as safe places to live with low levels of crime, the impact of reported incidences can be significant and have a disproportionate effect48. The current evaluation of crime by theCommission for Rural Communities will examine the fear of crimein rural areas.
3.What are the policies?
The main focus of policy reflected in PSA targets has been on reducingcrime, particularly by reducing the gap between Crime and DisorderReduction Partnership areas and by focusing on reducing vehicle crimeand domestic burglary. A target was added in 2004 to reduce the fear of crime. There is no overall national policy or strategy for rural policingor rural crime reduction and no centrally held information about ruralinitiatives. At present there is no published evaluation of the range ofcommunity safety policies in tackling rural crime, though an evaluationhas been commissioned by the Commission for Rural Communities.
Crime and Disorder Act 1998The 1998 Crime and Disorder Act was introduced to encouragepartnership working and placed legal responsibilities on the police andlocal authorities to co-ordinate the development of crime and safetystrategies at a local level. Local authorities are required to establishCrime and Disorder Reduction Partnerships (CDRPs). The Act alsorequires county and district councils to co-operate with town and parishcouncils in formulating and implementing strategies for the reduction ofcrime and disorder. Under section 17 of the Act, every town and parishcouncil also has a duty to consider the effects of their actions on crimeand disorder, and to do all they reasonably can to prevent, crime anddisorder in their area.
46. Hester M. and Westmarland N. (2005) TacklingDomestic Violence: Effective interventions andapproaches. Home Office Research Study 290
47. Henderson S. (1998) Drugs Prevention in Rural Areas: an evaluation report. DPI paper 17.Home Office
48. Mingay G. (ed) (1989) The Rural Idyll. Routledge
CC32EvidenceSect2_AW.qxd 26/9/06 5:01 pm Page 119
120 Rural disadvantage Reviewing the evidence
An evaluation of round one of the CDRPs included a predominantly rurallocal authority as a case study, along with one consisting of a town andsurrounding rural area. However, the evaluation did not specially pull outthe success or otherwise of the rural CDRPs49. There also seems to be noinformation on the extent to which CDRPS are including and respondingto the needs of the whole community. It has been suggested that there is“a danger that those people and voices already perceived as a ‘threat’,and those that do not conform to the rural ideals of the majority, will notonly be excluded from local decision making but may possibly evenbecome victimised because of it”50.
No overall assessment has been made yet of the impact of theintroduction of Section 17 and the work of town and parish councils,although this is being considered in the current evaluation of crime bythe Commission for Rural Communities.
A recent evaluation of CRDPs51 found that that the range and diversity ofthe projects and initiatives supported by the Home Office were likely tohave contributed to the overall reduction in crime. Although it includedrural locations, the evaluation did not specifically compare rural andurban progress in tackling crime.
Crime Reduction Programme (CRP) The Home Office Crime Reduction programme was an umbrella schemecovering a range of 15 different themes. It was established in 1999 andran until 2002. Evidence of rural impacts is limited:
• an evaluation52 of two repeat victimisation burglary reductionschemes in a rural area in East Anglia which found that it did nothave an effect, although this was attributed mainly to poorimplementation. For instance, burgled homes only receivedpreventive measures following two or even three burglaries ratherthan after the first offence;
• a CCTV initiative that was providing coverage of public areas.Round 2 of the CRP CCTV initiative announced in March 2000placed an additional emphasis on schemes to help reduce the fearof crime in rural areas. No national evaluation seems to have beenmade of the rural impacts of this initiative;
• the Reducing Burglary Initiative was rolled out in three phasesbetween 1998 and 2002 and comprised of project grants,distributed on a competitive bidding process through CRDPs, toareas with a burglary rate of at least twice the national average(reduced to 1.5 times in Phase 3). The evaluation found the fundhad generated much crime reduction activity, but the 240 projectsfunded varied in their achievements. Rural areas and projects wereincluded in the evaluation sample, although the research did notexplicitly draw conclusions about rural areas53.
An evaluation54 was undertaken of progress in meeting the1999 targetto reduce thefts of, and from, vehicles by 30% over five years. It did notlook at the rural impact although noted briefly some differences in theimplementation of the Automatic Number Plate Recognition systembecause of the time taken to set this up in more remote locations.
49. Phillips C., Jacobson J., Prime R., Carter M. andConsidine M. (2002) Crime and Disorder ReductionPartnerships: Round one progress. Police researchSeries Paper 151. Home Office
50. Yarwood R. (2001) Crime and Policing in the British Countryside: Some agenda for contemporarygeographical research. Sociologica Ruralis,41 (2), 201-219
51. National Audit Office (2004) Reducing Crime:The Home Office working with Crime and DisorderReduction Partnerships. Report by the Comptrollerand Auditor General. HC 16 Session 2004-05.
52. Jones B. (2003) Doing Problem-solving AcrossBorders in Low-crime Areas: The Fens experience.In Bullock K. and Tilley N. (eds) Crime Reductionand Problem-Oriented Policing. Willan
53. Hamilton-Smith N. (2004) The Reducing BurglaryInitiative: Design, development and delivery.Home Office Research Study 287
54. National Audit Office (2005) Reducing Vehiclecrime. Report by the Comptroller and AuditorGeneral. HC 183 session 2004-2005
CC32EvidenceSect2_AW.qxd 26/9/06 5:01 pm Page 120
121 Rural disadvantage Reviewing the evidence
Tackling crime against vulnerable groups There appears to be some assessment of the extent to which crimesafety policies are addressing the needs of particularly vulnerablepeople in rural areas. In relation to domestic violence, an evaluation ofthe 27 CRP domestic violence projects looked at rural projects as oneof the evaluation themes in looking at what worked and found thatoutreach was an important way of supporting rural women55. Theevaluation of the implementation of the Crime and Disorder Act 1998on racially aggravated offences included case study areas that had ruralcoverage and found that in rural and semi-rural areas “police were lesslikely to recognise racial harassment, or to think that there was anythingthat they could do about it but force practices were not related to thesize of the ethnic minority population”56.
Neighbourhood WatchThere are many Neighbourhood Watch schemes in rural England,although there is no information on the number of homes or residentscovered. Variations also include Farm Watch, River Watch, HorseWatch,Church Watch, Guest House Watch and even Milk Float Watch57. Evidenceof their effectiveness is limited, although research from several years agofound there was much local variation in the impact of schemes58. However,rural Neighbourhood Watch schemes did reduce the fear of crime.
This may in part be explained by the fact that Neighbourhood Watchschemes are easiest to organise where there is a high level of socialinteraction and of acquaintanceship, and where there is already likelyto be informal surveillance. It has been argued that these schemes aremost likely to be established by people in least need of help themselvesand not in crime hotspots59.
Rural Policing FundFollowing research in 1998 which demonstrated that there wereadditional costs associated with policing rural areas, the Rural WhitePaper earmarked funds from the Police Modernisation Fund to enhancethe policing service in rural areas, known as the ‘Rural Policing Fund’.The fund is allocated to 31 police authorities60 according to populationand density, on the basis that they must demonstrate real improvementsin the policing of rural areas, but have discretion to spend the fund asthey see fit such as recruiting additional officers for rural areas. For2003/04, the Fund was retained as a separate pot outside the mainformula grant system, but is not ring-fenced for rural projects. Althoughpolice authorities are required to set out in Best Value performanceplans how the money has been used, there are no central statistics orevaluation of its impact. The Commission for Rural Communities currentevaluation is covering projects established under this fund.
Rural police stationsThe presence of police stations in rural areas may impact on crimerates but is also about addressing the public perception of crime. Therehas been a gradual closure of small police stations in rural areas andincreasingly officers, stations and facilities are located in urban areas.Police authorities are required to consult local communities whenconsidering rural police station closures by publishing plans for stationclosures, changes to opening hours or movement to different locationsevery year. There does not appear to be an overall evaluation of theimpact of this policy.
55. Hester M. and Westmarland N. (2005) op. cit.56. Burney E. and Rose G. (2002) Racist Offences –
How is the law working? The implementation of the legislation on racially aggravated offences in the Crime and Disorder Act 1998. Home OfficeResearch Study 244
57. Countryside Agency (2004) State of the Countryside 2004
58. Laycock G. and Tilley N. (1995) Policing andNeighbourhood Watch: Strategic issues. PoliceResearch Group Crime Detection Series No. 60.Home Office
59. Yarwood (2001) op. cit.60. All shire forces benefit except Cleveland,
Hertfordshire, Nottinghamshire. ParliamentaryWritten answer by Hazel Blears. 9 January 2006
CC32EvidenceSect2_AW.qxd 26/9/06 5:01 pm Page 121
122 Rural disadvantage Reviewing the evidence
There are some local initiatives to fill the gap in the availability of localpolice officers such as community run police contact points or jointprovision (e.g. police services in local post offices) but these do notseem to have been systematically evaluated or have not yet beenestablished long enough to be evaluated.
Emergency response There is a rural service standard in emergency Police Services. This was set in 2001/02 and updated 2003/04. Each police force must set an emergency response time locally and the targets for rural areas arebetween 15 and 20 minutes, typically around twice as long as in urbanareas. Performance assessment for 2000/01 found that 86.9% of incidentsin rural areas requiring an immediate response were responded towithin the local target time61. Further monitoring information seems to be unavailable.
Greater police visibility in rural areasThe visibility and accessibility of policing in each ward and parish in theirforce area is measured in each Force’s annual Best Value PerformancePlan. This has not been collated nationally to provide an overall picture ofpolice visibility within and between rural areas. Perhaps because visibilityand accessibility are seen as ‘ends in themselves’, there has been littleoverall evaluation of their effects and outcomes in reducing crime.
Police Community Support OfficersOver the three years 2003-05, this initiative encouraged the appointmentof Police Community Support Officers (PCSOs) as part of CommunitySafety Strategies to tackle the fear of crime, anti-social behaviour andgenerally provide more visible policing. Nine of the 27 forces whichreceived funding for Police Community Support Officers deployed themon projects in rural areas62. A number of different agencies, often inpartnership, provided funding for PCSOs, ranging from Crime ReductionPartnerships to district, town and parish councils. One ofthe advantages seen by local communities of this type of support forpolicing was the greater control it gave in determining the ‘beat’ ofthe officer to ensure the local area was covered63.
A national evaluation of Community Support Officers64 included casestudy forces that are geographically diverse, including rural areas(Northumbria and Sussex). It found that CSOs provided visible andaccessible policing, engaged with local communities and “were carryingout activities that were crucial to both the concept behind neighbourhoodpolicing and its effective implementation”. They found no differences inthe number of crimes between areas with and without CSOs, althoughthey did make residents feel safer.
Neighbourhood and Street Wardens programmeFunding has also been available over a three year period from 2001to fund two types of warden in any area: Neighbourhood Wardens whoprovide a uniformed, semi-official presence in a residential area withthe aim of improving quality of life; and Street Wardens who have moreof an emphasis on caring for the physical appearance of the area byaddressing problems such as litter, graffiti and dog fouling, as well aspromoting community safety. The schemes have focused predominantlyon deprived urban areas and areas with other neighbourhood
61. Her Majesty’s Inspectorate of Constabulary (HMIC)Annual Report 2001 – 2002
62. Forthcoming evaluation of rural crime by CRC63. Forthcoming evaluation of rural crime by CRC64. Cooper C., Anscombe J., Avenell J., Mclean F. and
Morris J. (2006) A national Evaluation of CommunitySupport Officers. Home Office Research Study no. 297. Findings No. 271
CC32EvidenceSect2_AW.qxd 26/9/06 5:01 pm Page 122
123 Rural disadvantage Reviewing the evidence
renewal initiatives. Of the 85 projects, four were in rural areas65.The Neighbourhood Warden Scheme evaluation does not provide anoverall assessment of how well the initiative worked in rural areas66.
Neighbourhood Management Pathfinder programmeThis seven year programme was established in 2001 and providesfunding for projects, including crime and community safety projects(e.g. Neighbourhood Wardens). The round 2 pathfinders establishedin 2004 include some based in rural areas. A national evaluation of theNeighbourhood Management Pathfinder Programme is currentlyunderway, but the review so far has not specifically examined its impactin rural areas67.
Safer, Stronger Communities FundThis provides funding to all local authorities to tackle crime, illegaldrugs and anti-social behaviour (as well as improving local publicspaces). It has a focus on deprived neighbourhoods. Launched in April2005, it merged several existing funds together and it is therefore toonew to evaluate.
4. Summary
• Most rural analysis on crime and community safety looks only atcounting and comparing the number of victims of different typesof crime in urban compared to rural locations. Little further analysisof the characteristics of victims in rural areas or understanding thecauses seems to be available. In addition, there is limitedinformation on the impacts of crime on victims in rural areas. Howdoes it affect them and lead to, or sustain disadvantage? How longdo the effects last for? However, the lack of transport, physical andsocial isolation, lack of support services and rural culture have allbeen suggested as factors that impact on rural victims’ experience.A better understanding of crime patterns within rural areas wouldbe helpful and the role that rurality plays.
• There are a range of national policies and legislation that aredesigned to tackle crime. However, there is very little informationavailable about the impacts of these policies in rural areas.Several strategies and polices have been introduced in recent years,and is too soon for their impact to be fully evaluated. It is importantthat monitoring and evaluation undertaken in the future assessproperly whether they are working in rural areas.
65. Forthcoming evaluation of rural crime by CRC66. Neighbourhood Renewal Unit (2004)
Neighbourhood Wardens Scheme Evaluation. NRUResearch Report 8,ODPM
67. SQW Ltd (2005) Neighbourhood Management – At the Turning Point? Programme Review 2005-05.The Neighbourhood Renewal Unit, ODPM
CC32EvidenceSect2_AW.qxd 26/9/06 5:01 pm Page 123
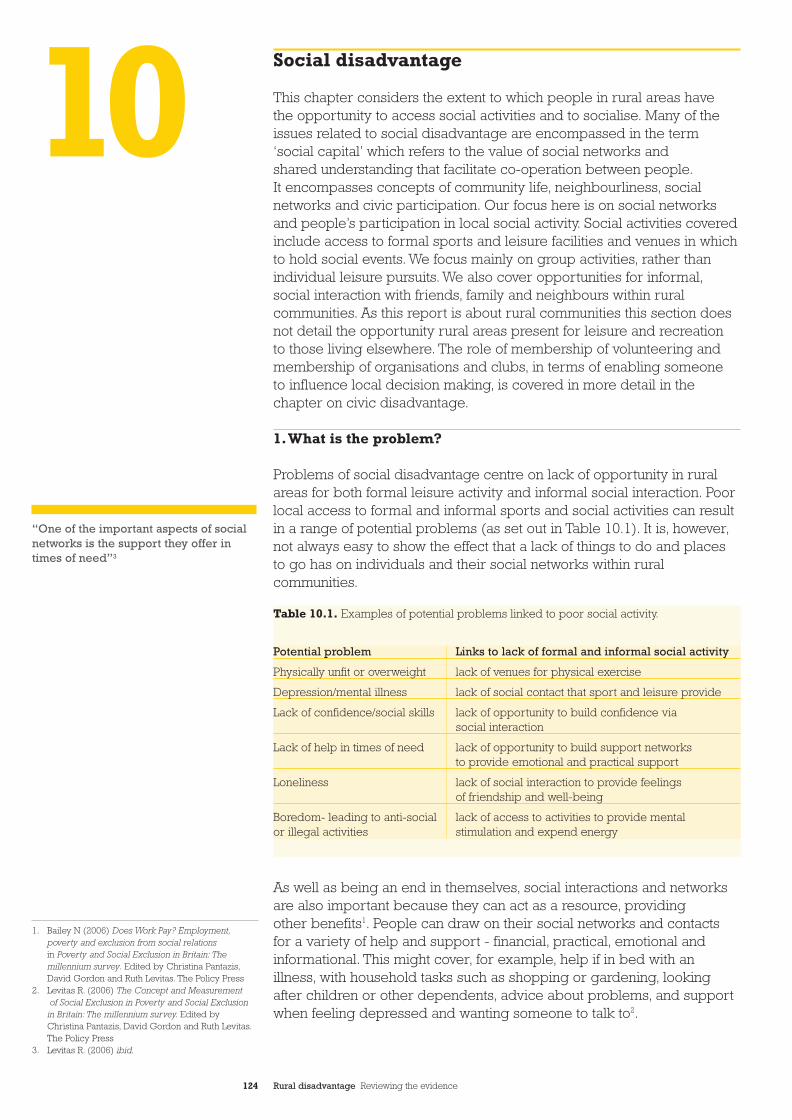
124 Rural disadvantage Reviewing the evidence
Social disadvantage
This chapter considers the extent to which people in rural areas have the opportunity to access social activities and to socialise. Many of theissues related to social disadvantage are encompassed in the term‘social capital’ which refers to the value of social networks and shared understanding that facilitate co-operation between people.It encompasses concepts of community life, neighbourliness, socialnetworks and civic participation. Our focus here is on social networksand people’s participation in local social activity. Social activities coveredinclude access to formal sports and leisure facilities and venues in whichto hold social events. We focus mainly on group activities, rather thanindividual leisure pursuits. We also cover opportunities for informal,social interaction with friends, family and neighbours within ruralcommunities. As this report is about rural communities this section doesnot detail the opportunity rural areas present for leisure and recreation to those living elsewhere. The role of membership of volunteering andmembership of organisations and clubs, in terms of enabling someone to influence local decision making, is covered in more detail in thechapter on civic disadvantage.
1.What is the problem?
Problems of social disadvantage centre on lack of opportunity in ruralareas for both formal leisure activity and informal social interaction. Poorlocal access to formal and informal sports and social activities can resultin a range of potential problems (as set out in Table 10.1). It is, however,not always easy to show the effect that a lack of things to do and placesto go has on individuals and their social networks within ruralcommunities.
As well as being an end in themselves, social interactions and networksare also important because they can act as a resource, providing other benefits1. People can draw on their social networks and contactsfor a variety of help and support - financial, practical, emotional andinformational. This might cover, for example, help if in bed with anillness, with household tasks such as shopping or gardening, lookingafter children or other dependents, advice about problems, and supportwhen feeling depressed and wanting someone to talk to2.
Table 10.1. Examples of potential problems linked to poor social activity.
Potential problem Links to lack of formal and informal social activity
Physically unfit or overweight lack of venues for physical exercise
Depression/mental illness lack of social contact that sport and leisure provide
Lack of confidence/social skills lack of opportunity to build confidence via social interaction
Lack of help in times of need lack of opportunity to build support networks to provide emotional and practical support
Loneliness lack of social interaction to provide feelings of friendship and well-being
Boredom- leading to anti-social lack of access to activities to provide mentalor illegal activities stimulation and expend energy
“One of the important aspects of socialnetworks is the support they offer intimes of need”3
1. Bailey N (2006) Does Work Pay? Employment,poverty and exclusion from social relationsin Poverty and Social Exclusion in Britain: Themillennium survey. Edited by Christina Pantazis,David Gordon and Ruth Levitas. The Policy Press
2. Levitas R. (2006) The Concept and Measurement of Social Exclusion in Poverty and Social Exclusion
in Britain: The millennium survey. Edited byChristina Pantazis, David Gordon and Ruth Levitas.The Policy Press
3. Levitas R. (2006) ibid.
10CC32EvidenceSect2_AW.qxd 26/9/06 5:01 pm Page 124
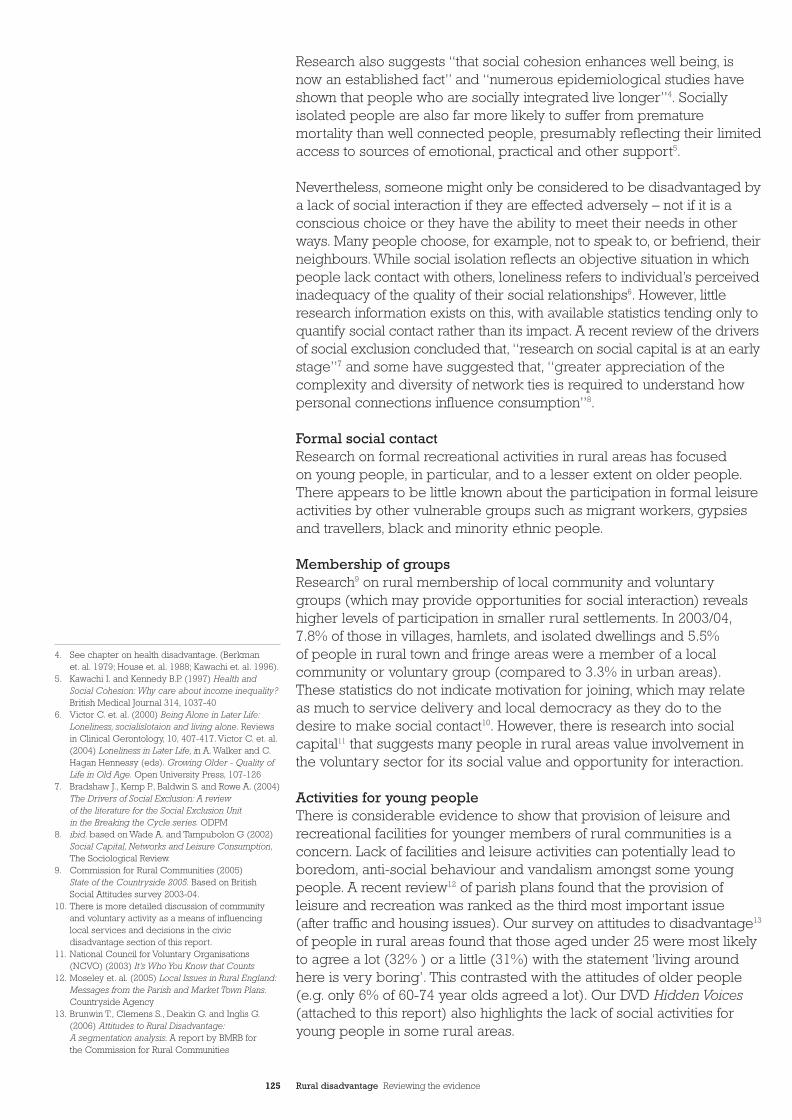
125 Rural disadvantage Reviewing the evidence
Research also suggests “that social cohesion enhances well being, is now an established fact” and “numerous epidemiological studies haveshown that people who are socially integrated live longer”4. Sociallyisolated people are also far more likely to suffer from prematuremortality than well connected people, presumably reflecting their limitedaccess to sources of emotional, practical and other support5.
Nevertheless, someone might only be considered to be disadvantaged bya lack of social interaction if they are effected adversely – not if it is aconscious choice or they have the ability to meet their needs in otherways. Many people choose, for example, not to speak to, or befriend, theirneighbours. While social isolation reflects an objective situation in whichpeople lack contact with others, loneliness refers to individual’s perceivedinadequacy of the quality of their social relationships6. However, littleresearch information exists on this, with available statistics tending only toquantify social contact rather than its impact. A recent review of the driversof social exclusion concluded that, “research on social capital is at an earlystage”7 and some have suggested that, “greater appreciation of thecomplexity and diversity of network ties is required to understand howpersonal connections influence consumption”8.
Formal social contactResearch on formal recreational activities in rural areas has focused on young people, in particular, and to a lesser extent on older people.There appears to be little known about the participation in formal leisureactivities by other vulnerable groups such as migrant workers, gypsiesand travellers, black and minority ethnic people.
Membership of groups Research9 on rural membership of local community and voluntarygroups (which may provide opportunities for social interaction) revealshigher levels of participation in smaller rural settlements. In 2003/04,7.8% of those in villages, hamlets, and isolated dwellings and 5.5% of people in rural town and fringe areas were a member of a localcommunity or voluntary group (compared to 3.3% in urban areas).These statistics do not indicate motivation for joining, which may relate as much to service delivery and local democracy as they do to thedesire to make social contact10. However, there is research into socialcapital11 that suggests many people in rural areas value involvement in the voluntary sector for its social value and opportunity for interaction.
Activities for young peopleThere is considerable evidence to show that provision of leisure andrecreational facilities for younger members of rural communities is aconcern. Lack of facilities and leisure activities can potentially lead toboredom, anti-social behaviour and vandalism amongst some youngpeople. A recent review12 of parish plans found that the provision ofleisure and recreation was ranked as the third most important issue (after traffic and housing issues). Our survey on attitudes to disadvantage13
of people in rural areas found that those aged under 25 were most likelyto agree a lot (32% ) or a little (31%) with the statement ‘living aroundhere is very boring’. This contrasted with the attitudes of older people(e.g. only 6% of 60-74 year olds agreed a lot). Our DVD Hidden Voices(attached to this report) also highlights the lack of social activities foryoung people in some rural areas.
4. See chapter on health disadvantage. (Berkman et. al. 1979; House et. al. 1988; Kawachi et. al. 1996).
5. Kawachi I. and Kennedy B.P. (1997) Health andSocial Cohesion: Why care about income inequality?British Medical Journal 314, 1037-40
6. Victor C. et. al. (2000) Being Alone in Later Life:Loneliness, socialislotaion and living alone. Reviewsin Clinical Gerontology, 10, 407-417. Victor C. et. al.(2004) Loneliness in Later Life, in A. Walker and C.Hagan Hennessy (eds). Growing Older - Quality ofLife in Old Age. Open University Press, 107-126
7. Bradshaw J., Kemp P., Baldwin S. and Rowe A. (2004)The Drivers of Social Exclusion: A review of the literature for the Social Exclusion Unit in the Breaking the Cycle series. ODPM
8. ibid. based on Wade A. and Tampubolon G (2002)Social Capital, Networks and Leisure Consumption,The Sociological Review.
9. Commission for Rural Communities (2005) State of the Countryside 2005. Based on BritishSocial Attitudes survey 2003-04.
10. There is more detailed discussion of communityand voluntary activity as a means of influencinglocal services and decisions in the civicdisadvantage section of this report.
11. National Council for Voluntary Organisations(NCVO) (2003) It’s Who You Know that Counts
12. Moseley et. al. (2005) Local Issues in Rural England:Messages from the Parish and Market Town Plans.Countryside Agency
13. Brunwin T., Clemens S., Deakin G. and Inglis G.(2006) Attitudes to Rural Disadvantage:A segmentation analysis. A report by BMRB for the Commission for Rural Communities
CC32EvidenceSect2_AW.qxd 26/9/06 5:01 pm Page 125
126 Rural disadvantage Reviewing the evidence
Young people in rural areas increasingly expect modern leisure facilities in rural areas and one of the most common examples of this isskateparks (particularly demanded by males). Of the 400 skateparks inthe UK the majority are in urban areas14. Experience in Sussex has shownthat small town and village councils often lack funds to provide facilitiessuch as skateparks and there is local resistance to skateparks in ruralareas based on fear of vandalism or noise levels15.
In the absence of sufficient formal meeting places in rural areas“hanging about, or just doing nothing is the major activity of ruralyouth”16. Problems can arise because of the visibility of ‘hanging about’,particularly in smaller settlements17. Research in a small village in ruralKent suggested that, “because people know each other well a greatersense of resentment can build up between people”18, particularly inrelation to when young men drank and damaged cars and fences in thevillage. Similarly, research on 12-16 year olds in three villages in EastAnglia ‘hanging about’ in central locations in the villages found activitiesranging from the legal (skateboarding, mock fights and dancing) to moreserious incidents of drug taking, theft, serious vandalism and violence.However, these more serious incidents were limited in extent due to acomplex practice of self-policing19,20. Research21 on young people in the south west of England examined why they resorted to risk takingactivities (such as substance abuse) and found this was often the result of boredom. The reported boredom was due to a lack of local activitiesand facilities combined with a lack of transport to facilities further away.Problems of boredom for young people can be worse if they are ‘not in education, employment or training’ (NEETs). Analysis by SuffolkConnexions shows high percentages of young people who are NEET in some rural areas22.
There is evidence to show that young women in rural areas can find they are more disadvantaged than young men, through a lack of locallyorganised social activities. Research23 with young people in the NorthernFells in Cumbria, showed that many young women thought that localactivities such as darts, pool, football and cricket were attractive only to young men.
Older people and physical exerciseAs people get older physical activity declines. A recent governmentreport24 on older people shows how participation in competitive, organisedand intensive sport decreases dramatically by age. This not only hasrepercussions for physical fitness, but also the associated opportunity for socialising and maintaining social networks and friendships.
Research25 on women aged 64 and over in Cornwall (from lower socio-economic groups and living independently), about their participation in formal physical activity, revealed that improving personal health wasmuch less of an incentive to their participation than maintaining orimproving friendships. Physical activity was perceived only to be of use if it “acted as a conduit through which older women build and maintainhighly valued social networks and relationships”.
14. Niven R. (2003) Half-Pipe Dreams. Young PeopleNow. 25 June-1 July 2003
15. anecdotal pers com, resident of South Hams village, Devon
16. Crawshaw (2001/2002) Negotiating Space in theRisky Community in Youth and Policy no 74;Skelton and Valentine (eds) (1997) Cool Places:Geographies of Youth culture. Routledge.cited inMoore, Stephen (no date) Hanging About: Youth andPolicy W9853 pp 47-59. APU. Cambridge
17. Roberts L. (2003) The Trouble with Young Men inRural Communities. Working with young men.2, 3 September 2003.and Moore (undated) ibid.
18. Roberts (2003) op. cit.19. Moore S. (undated) ibid.20. For information on rural sport and recreation best
practice generally in the East of England see:www.naturallyactive.co.uk and Leisure and theEnvironment (May, 2005) A Research Report to theEast of England Rural Sport and Recreation WorkingGroup. Final Report. www.lande.co.uk
21. Howard League for Penal Reform (2005) Once Upon a Time in the West; Social deprivation and rural youth crime
22. For more information on NEETs and Connexionssee the education disadvantage and young peoplesections of this report
23. Bennett K., Harvey K., and Woodcock J. (2005)Routes to Independence: Young people voicingconcerns and challenges and opportunities in theNorthern Fells, Cumbria. Centre for Rural Economy,University of Newcastle
24. ODPM (2006) A Sure Start to Later life – Endinginequalities for older people. ODPM, SocialExclusion Unit
25. Women’s Sports Foundation UK www.wsf.org.ukPhysical Activity Perceptions of Older Women inCornwall: Summary of findings
CC32EvidenceSect2_AW.qxd 26/9/06 5:01 pm Page 126
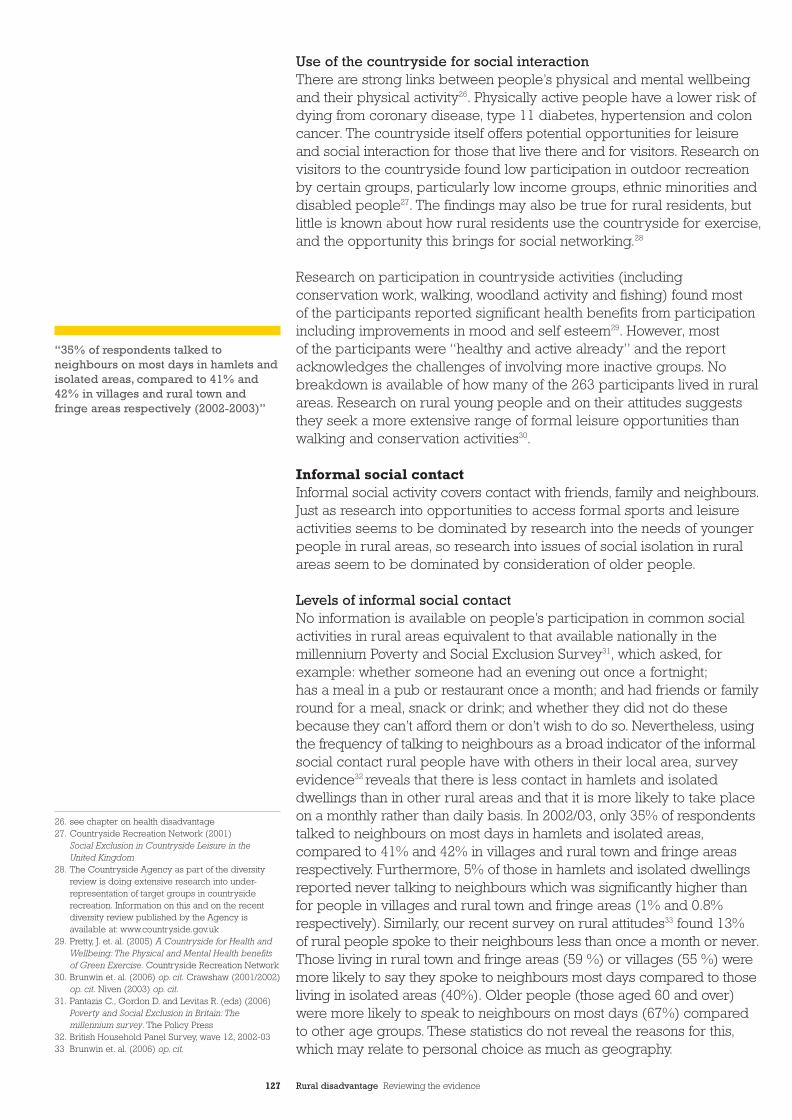
127 Rural disadvantage Reviewing the evidence
Use of the countryside for social interaction There are strong links between people’s physical and mental wellbeingand their physical activity26. Physically active people have a lower risk ofdying from coronary disease, type 11 diabetes, hypertension and coloncancer. The countryside itself offers potential opportunities for leisureand social interaction for those that live there and for visitors. Research onvisitors to the countryside found low participation in outdoor recreationby certain groups, particularly low income groups, ethnic minorities anddisabled people27. The findings may also be true for rural residents, butlittle is known about how rural residents use the countryside for exercise,and the opportunity this brings for social networking.28
Research on participation in countryside activities (includingconservation work, walking, woodland activity and fishing) found most of the participants reported significant health benefits from participationincluding improvements in mood and self esteem29. However, most of the participants were “healthy and active already” and the reportacknowledges the challenges of involving more inactive groups. Nobreakdown is available of how many of the 263 participants lived in ruralareas. Research on rural young people and on their attitudes suggeststhey seek a more extensive range of formal leisure opportunities thanwalking and conservation activities30.
Informal social contactInformal social activity covers contact with friends, family and neighbours.Just as research into opportunities to access formal sports and leisureactivities seems to be dominated by research into the needs of youngerpeople in rural areas, so research into issues of social isolation in ruralareas seem to be dominated by consideration of older people.
Levels of informal social contactNo information is available on people’s participation in common socialactivities in rural areas equivalent to that available nationally in themillennium Poverty and Social Exclusion Survey31, which asked, forexample: whether someone had an evening out once a fortnight;has a meal in a pub or restaurant once a month; and had friends or familyround for a meal, snack or drink; and whether they did not do thesebecause they can’t afford them or don’t wish to do so. Nevertheless, usingthe frequency of talking to neighbours as a broad indicator of the informalsocial contact rural people have with others in their local area, surveyevidence32 reveals that there is less contact in hamlets and isolateddwellings than in other rural areas and that it is more likely to take placeon a monthly rather than daily basis. In 2002/03, only 35% of respondentstalked to neighbours on most days in hamlets and isolated areas,compared to 41% and 42% in villages and rural town and fringe areasrespectively. Furthermore, 5% of those in hamlets and isolated dwellingsreported never talking to neighbours which was significantly higher thanfor people in villages and rural town and fringe areas (1% and 0.8%respectively). Similarly, our recent survey on rural attitudes33 found 13% of rural people spoke to their neighbours less than once a month or never.Those living in rural town and fringe areas (59 %) or villages (55 %) weremore likely to say they spoke to neighbours most days compared to thoseliving in isolated areas (40%). Older people (those aged 60 and over)were more likely to speak to neighbours on most days (67%) compared to other age groups. These statistics do not reveal the reasons for this,which may relate to personal choice as much as geography.
26. see chapter on health disadvantage27. Countryside Recreation Network (2001)
Social Exclusion in Countryside Leisure in the United Kingdom
28. The Countryside Agency as part of the diversityreview is doing extensive research into under-representation of target groups in countrysiderecreation. Information on this and on the recentdiversity review published by the Agency isavailable at: www.countryside.gov.uk
29. Pretty, J. et. al. (2005) A Countryside for Health andWellbeing: The Physical and Mental Health benefitsof Green Exercise. Countryside Recreation Network
30. Brunwin et. al. (2006) op. cit. Crawshaw (2001/2002)op. cit. Niven (2003) op. cit.
31. Pantazis C., Gordon D. and Levitas R. (eds) (2006)Poverty and Social Exclusion in Britain: Themillennium survey. The Policy Press
32. British Household Panel Survey, wave 12, 2002-03 33 Brunwin et. al. (2006) op. cit.
“35% of respondents talked toneighbours on most days in hamlets andisolated areas, compared to 41% and42% in villages and rural town andfringe areas respectively (2002-2003)”
CC32EvidenceSect2_AW.qxd 26/9/06 5:01 pm Page 127
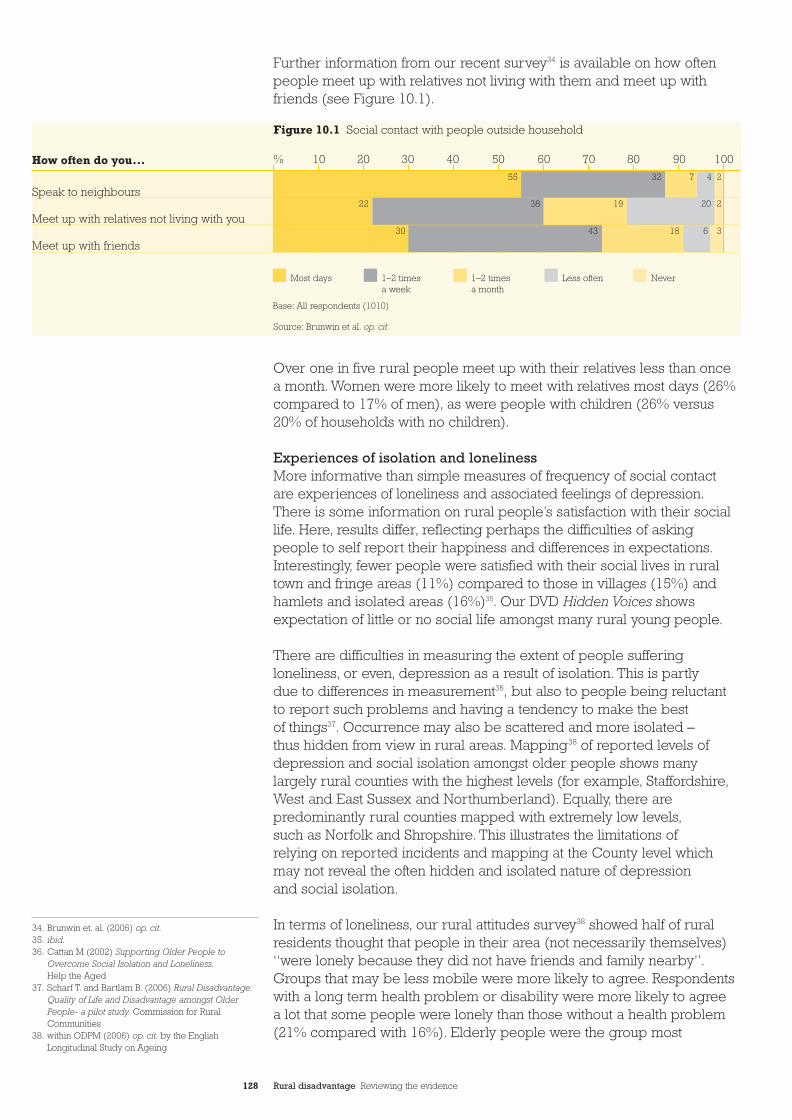
128 Rural disadvantage Reviewing the evidence
Further information from our recent survey34 is available on how oftenpeople meet up with relatives not living with them and meet up withfriends (see Figure 10.1).
Over one in five rural people meet up with their relatives less than oncea month. Women were more likely to meet with relatives most days (26%compared to 17% of men), as were people with children (26% versus20% of households with no children).
Experiences of isolation and loneliness More informative than simple measures of frequency of social contact are experiences of loneliness and associated feelings of depression.There is some information on rural people’s satisfaction with their sociallife. Here, results differ, reflecting perhaps the difficulties of askingpeople to self report their happiness and differences in expectations.Interestingly, fewer people were satisfied with their social lives in ruraltown and fringe areas (11%) compared to those in villages (15%) andhamlets and isolated areas (16%)35. Our DVD Hidden Voices showsexpectation of little or no social life amongst many rural young people.
There are difficulties in measuring the extent of people sufferingloneliness, or even, depression as a result of isolation. This is partly due to differences in measurement36, but also to people being reluctantto report such problems and having a tendency to make the best of things37. Occurrence may also be scattered and more isolated – thus hidden from view in rural areas. Mapping38 of reported levels ofdepression and social isolation amongst older people shows manylargely rural counties with the highest levels (for example, Staffordshire,West and East Sussex and Northumberland). Equally, there arepredominantly rural counties mapped with extremely low levels,such as Norfolk and Shropshire. This illustrates the limitations of relying on reported incidents and mapping at the County level whichmay not reveal the often hidden and isolated nature of depression and social isolation.
In terms of loneliness, our rural attitudes survey38 showed half of ruralresidents thought that people in their area (not necessarily themselves)“were lonely because they did not have friends and family nearby”.Groups that may be less mobile were more likely to agree. Respondentswith a long term health problem or disability were more likely to agree a lot that some people were lonely than those without a health problem(21% compared with 16%). Elderly people were the group most
Figure 10.1 Social contact with people outside household
Speak to neighbours
Meet up with relatives not living with you
Meet up with friends
How often do you... % 10 20 30 40 50 60 70 80 90 10055 32 7 4 2
22 38 19 20 2
30 43 18 36
Most days 1–2 times a week
1–2 times a month
Less often Never
Base: All respondents (1010)
34. Brunwin et. al. (2006) op. cit.35. ibid.36. Cattan M (2002) Supporting Older People to
Overcome Social Isolation and Loneliness.Help the Aged
37. Scharf T. and Bartlam B. (2006) Rural Disadvantage:Quality of Life and Disadvantage amongst OlderPeople- a pilot study. Commission for RuralCommunities
38. within ODPM (2006) op. cit. by the EnglishLongitudinal Study on Ageing
Source: Brunwin et al. op. cit.
CC32EvidenceSect2_AW.qxd 26/9/06 5:01 pm Page 128
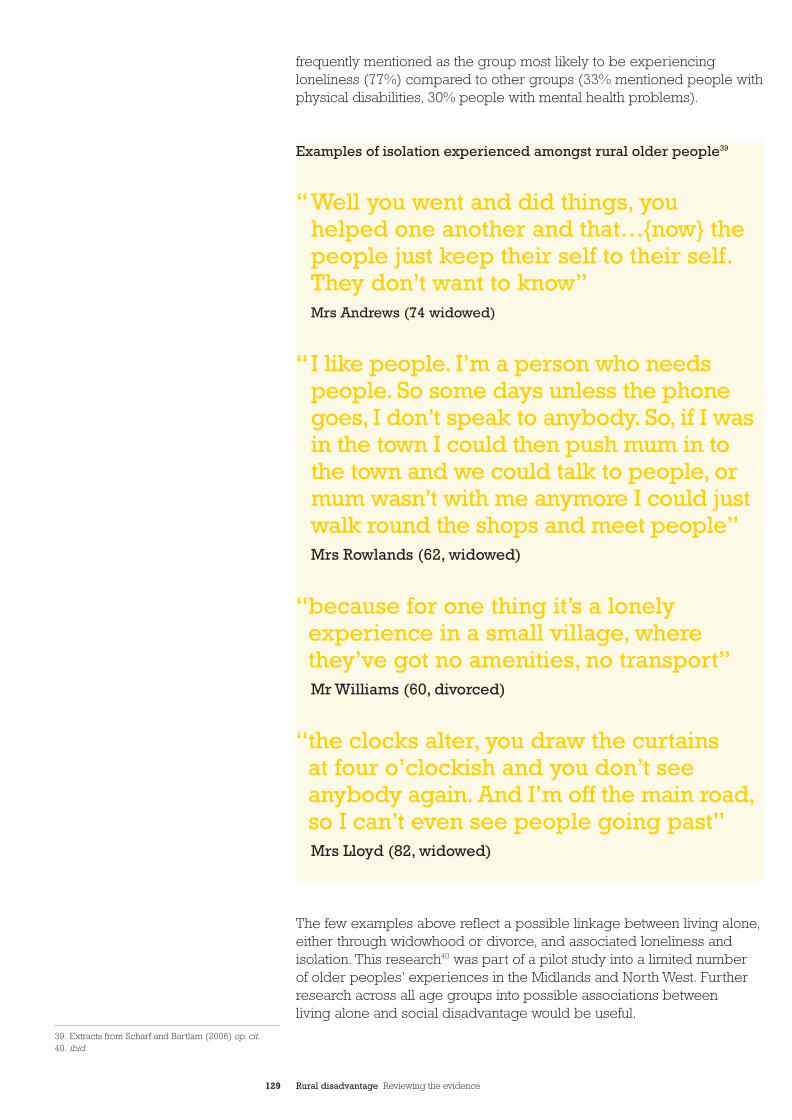
129 Rural disadvantage Reviewing the evidence
frequently mentioned as the group most likely to be experiencingloneliness (77%) compared to other groups (33% mentioned people withphysical disabilities, 30% people with mental health problems).
Examples of isolation experienced amongst rural older people39
The few examples above reflect a possible linkage between living alone,either through widowhood or divorce, and associated loneliness andisolation. This research40 was part of a pilot study into a limited number of older peoples’ experiences in the Midlands and North West. Furtherresearch across all age groups into possible associations betweenliving alone and social disadvantage would be useful.
39. Extracts from Scharf and Bartlam (2006) op. cit.40. ibid.
“Well you went and did things, you helped one another and that…{now} thepeople just keep their self to their self.They don’t want to know”Mrs Andrews (74 widowed)
“I like people. I’m a person who needspeople. So some days unless the phonegoes, I don’t speak to anybody. So, if I wasin the town I could then push mum in tothe town and we could talk to people, ormum wasn’t with me anymore I could justwalk round the shops and meet people”Mrs Rowlands (62, widowed)
“because for one thing it’s a lonelyexperience in a small village, wherethey’ve got no amenities, no transport”Mr Williams (60, divorced)
“the clocks alter, you draw the curtains at four o’clockish and you don’t seeanybody again. And I’m off the main road,so I can’t even see people going past”Mrs Lloyd (82, widowed)
CC32EvidenceSect2_AW.qxd 26/9/06 5:01 pm Page 129
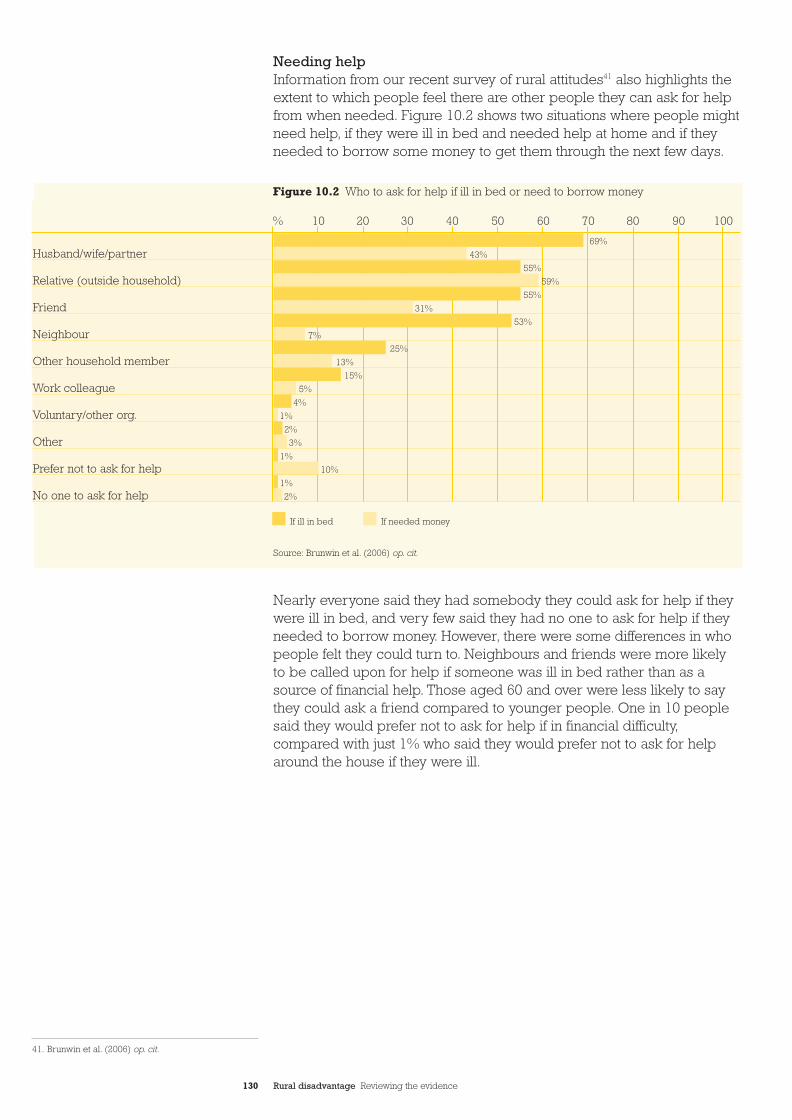
130 Rural disadvantage Reviewing the evidence
Needing helpInformation from our recent survey of rural attitudes41 also highlights theextent to which people feel there are other people they can ask for helpfrom when needed. Figure 10.2 shows two situations where people mightneed help, if they were ill in bed and needed help at home and if theyneeded to borrow some money to get them through the next few days.
Nearly everyone said they had somebody they could ask for help if theywere ill in bed, and very few said they had no one to ask for help if theyneeded to borrow money. However, there were some differences in whopeople felt they could turn to. Neighbours and friends were more likelyto be called upon for help if someone was ill in bed rather than as asource of financial help. Those aged 60 and over were less likely to saythey could ask a friend compared to younger people. One in 10 peoplesaid they would prefer not to ask for help if in financial difficulty,compared with just 1% who said they would prefer not to ask for helparound the house if they were ill.
Figure 10.2 Who to ask for help if ill in bed or need to borrow money
Husband/wife/partner
Relative (outside household)
Friend
Neighbour
Other household member
Work colleague
Voluntary/other org.
Other
Prefer not to ask for help
No one to ask for help
% 10 20 30 40 50 60 70 80 90 100
69%
43%
55%
59%
55%
31%
53%
7%
25%
13%
15%
5%
4%
1%
2%
3%
1%
10%
1%
2%
If ill in bed If needed money
41. Brunwin et al. (2006) op. cit.
Source: Brunwin et al. (2006) op. cit.
CC32EvidenceSect2_AW.qxd 26/9/06 5:01 pm Page 130
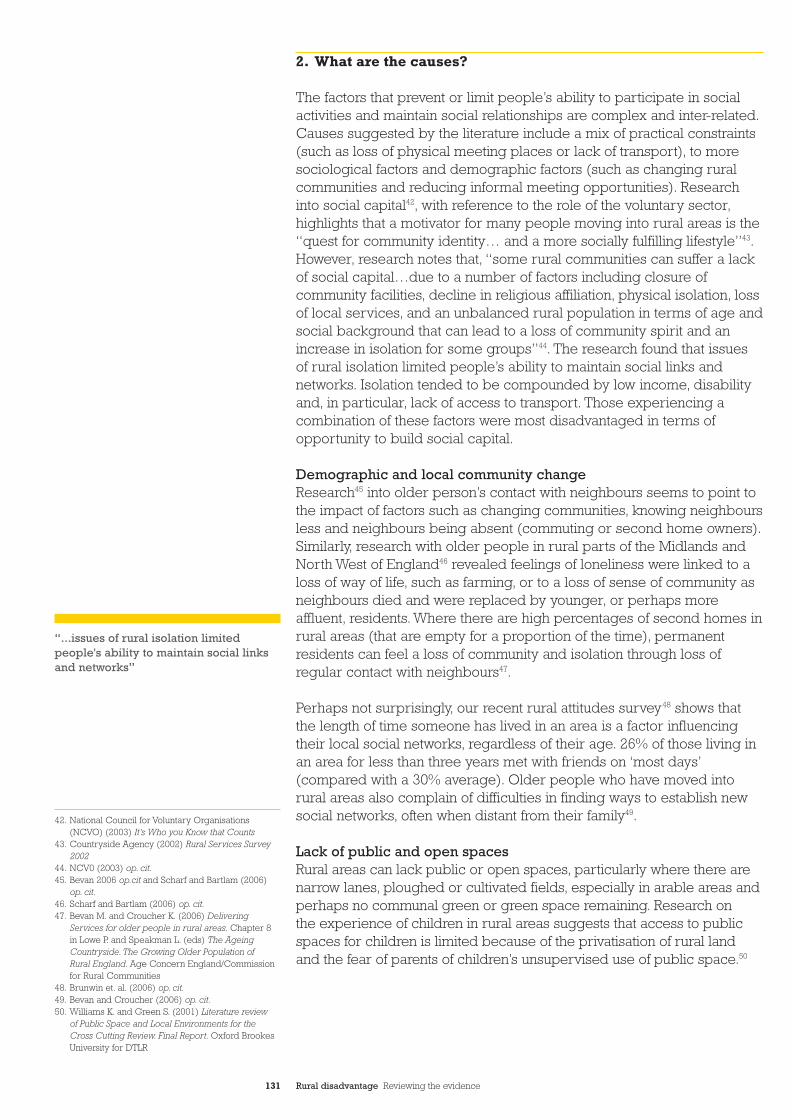
131 Rural disadvantage Reviewing the evidence
2. What are the causes?
The factors that prevent or limit people’s ability to participate in socialactivities and maintain social relationships are complex and inter-related.Causes suggested by the literature include a mix of practical constraints(such as loss of physical meeting places or lack of transport), to moresociological factors and demographic factors (such as changing ruralcommunities and reducing informal meeting opportunities). Researchinto social capital42, with reference to the role of the voluntary sector,highlights that a motivator for many people moving into rural areas is the“quest for community identity… and a more socially fulfilling lifestyle”43.However, research notes that, “some rural communities can suffer a lackof social capital…due to a number of factors including closure ofcommunity facilities, decline in religious affiliation, physical isolation, lossof local services, and an unbalanced rural population in terms of age andsocial background that can lead to a loss of community spirit and anincrease in isolation for some groups”44. The research found that issuesof rural isolation limited people’s ability to maintain social links andnetworks. Isolation tended to be compounded by low income, disabilityand, in particular, lack of access to transport. Those experiencing acombination of these factors were most disadvantaged in terms ofopportunity to build social capital.
Demographic and local community changeResearch45 into older person’s contact with neighbours seems to point tothe impact of factors such as changing communities, knowing neighboursless and neighbours being absent (commuting or second home owners).Similarly, research with older people in rural parts of the Midlands andNorth West of England46 revealed feelings of loneliness were linked to aloss of way of life, such as farming, or to a loss of sense of community asneighbours died and were replaced by younger, or perhaps moreaffluent, residents. Where there are high percentages of second homes inrural areas (that are empty for a proportion of the time), permanentresidents can feel a loss of community and isolation through loss ofregular contact with neighbours47.
Perhaps not surprisingly, our recent rural attitudes survey48 shows thatthe length of time someone has lived in an area is a factor influencingtheir local social networks, regardless of their age. 26% of those living inan area for less than three years met with friends on ‘most days’(compared with a 30% average). Older people who have moved intorural areas also complain of difficulties in finding ways to establish newsocial networks, often when distant from their family49.
Lack of public and open spacesRural areas can lack public or open spaces, particularly where there arenarrow lanes, ploughed or cultivated fields, especially in arable areas andperhaps no communal green or green space remaining. Research on the experience of children in rural areas suggests that access to publicspaces for children is limited because of the privatisation of rural land and the fear of parents of children’s unsupervised use of public space.50
42. National Council for Voluntary Organisations(NCVO) (2003) It’s Who you Know that Counts
43. Countryside Agency (2002) Rural Services Survey2002
44. NCV0 (2003) op. cit.45. Bevan 2006 op.cit and Scharf and Bartlam (2006)
op. cit.46. Scharf and Bartlam (2006) op. cit.47. Bevan M. and Croucher K. (2006) Delivering
Services for older people in rural areas. Chapter 8in Lowe P. and Speakman L. (eds) The AgeingCountryside. The Growing Older Population of Rural England. Age Concern England/Commissionfor Rural Communities
48. Brunwin et. al. (2006) op. cit.49. Bevan and Croucher (2006) op. cit.50. Williams K. and Green S. (2001) Literature review
of Public Space and Local Environments for theCross Cutting Review. Final Report. Oxford BrookesUniversity for DTLR
“...issues of rural isolation limited people's ability to maintain social linksand networks”
CC32EvidenceSect2_AW.qxd 26/9/06 5:01 pm Page 131
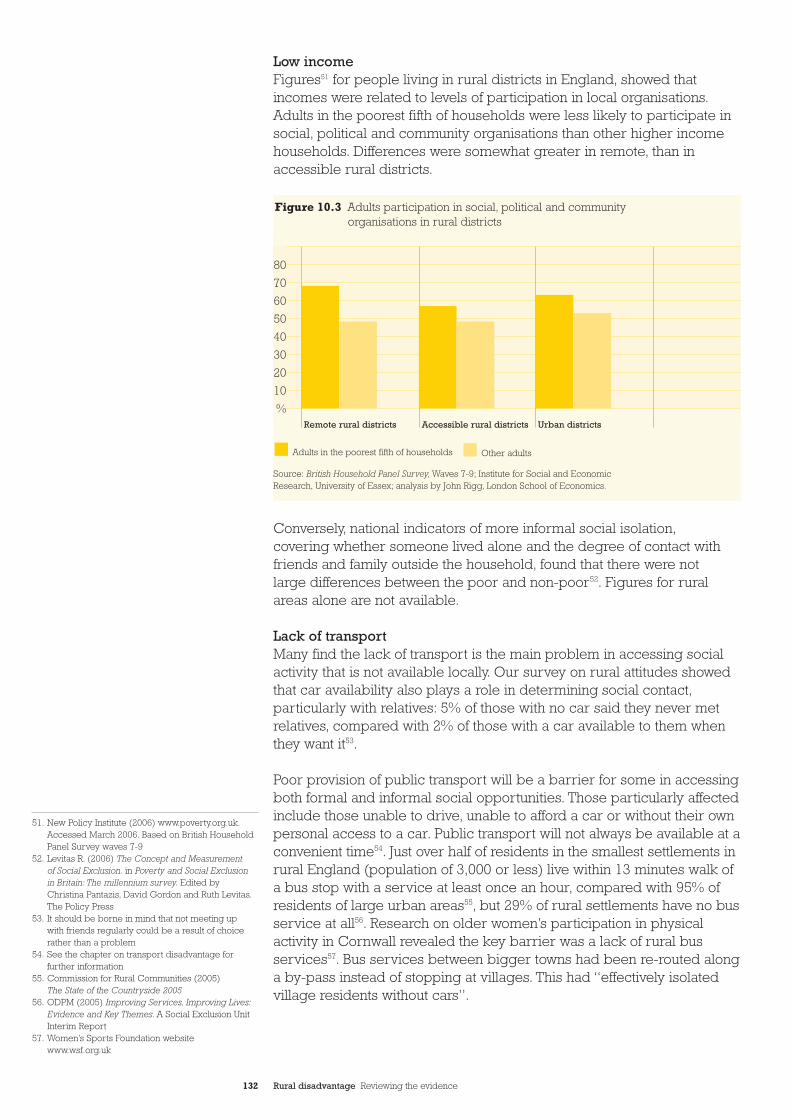
132 Rural disadvantage Reviewing the evidence
Low income Figures51 for people living in rural districts in England, showed thatincomes were related to levels of participation in local organisations.Adults in the poorest fifth of households were less likely to participate insocial, political and community organisations than other higher incomehouseholds. Differences were somewhat greater in remote, than inaccessible rural districts.
Conversely, national indicators of more informal social isolation,covering whether someone lived alone and the degree of contact withfriends and family outside the household, found that there were not large differences between the poor and non-poor52. Figures for ruralareas alone are not available.
Lack of transportMany find the lack of transport is the main problem in accessing socialactivity that is not available locally. Our survey on rural attitudes showedthat car availability also plays a role in determining social contact,particularly with relatives: 5% of those with no car said they never metrelatives, compared with 2% of those with a car available to them whenthey want it53.
Poor provision of public transport will be a barrier for some in accessingboth formal and informal social opportunities. Those particularly affectedinclude those unable to drive, unable to afford a car or without their ownpersonal access to a car. Public transport will not always be available at aconvenient time54. Just over half of residents in the smallest settlements inrural England (population of 3,000 or less) live within 13 minutes walk ofa bus stop with a service at least once an hour, compared with 95% ofresidents of large urban areas55, but 29% of rural settlements have no busservice at all56. Research on older women’s participation in physicalactivity in Cornwall revealed the key barrier was a lack of rural busservices57. Bus services between bigger towns had been re-routed alonga by-pass instead of stopping at villages. This had “effectively isolatedvillage residents without cars”.
51. New Policy Institute (2006) www.poverty.org.uk.Accessed March 2006. Based on British HouseholdPanel Survey waves 7-9
52. Levitas R. (2006) The Concept and Measurement of Social Exclusion. in Poverty and Social Exclusion in Britain: The millennium survey. Edited byChristina Pantazis, David Gordon and Ruth Levitas.The Policy Press
53. It should be borne in mind that not meeting up with friends regularly could be a result of choicerather than a problem
54. See the chapter on transport disadvantage forfurther information
55. Commission for Rural Communities (2005) The State of the Countryside 2005
56. ODPM (2005) Improving Services, Improving Lives:Evidence and Key Themes. A Social Exclusion UnitInterim Report
57. Women’s Sports Foundation websitewww.wsf.org.uk
Figure 10.3 Adults participation in social, political and communityorganisations in rural districts
80
70
60
50
40
30
20
10
%Remote rural districts Accessible rural districts Urban districts
Adults in the poorest fifth of households Other adults
Source: British Household Panel Survey, Waves 7-9; Institute for Social and EconomicResearch, University of Essex; analysis by John Rigg, London School of Economics.
CC32EvidenceSect2_AW.qxd 26/9/06 5:01 pm Page 132
133 Rural disadvantage Reviewing the evidence
People without these options have to rely on getting a lift from friends or family or using a taxi.Young people, in particular, tend to rely on lifts.Lift giving can overcome lack of access to a car or public transport.However, research58 confirms that lift giving is not available to everybody.A significant minority of the households studied (5%) never received lifts and these included “largely jobless households with few kin living in the locality and thin social networks”.
Reliance on the car and the car culture might also be seen as anindicator itself of the lack of opportunities for informal social contact,as a result of fewer pedestrians and ‘empty streets’. Further analysis of such proxies might be useful in terms of gauging social interaction in rural areas.
Disability and transport Research specifically looking at sports participation by children,young people and adults with a disability repeatedly highlights lack of organised transport in rural areas as a barrier to participation59.In Derbyshire, for example, expert stakeholders working with disabledyoung people believed the rural make up of Derbyshire exacerbatedtransport problems experienced by young disabled people. Similarly in many parts of rural Cumbria (such as Allerdale and Eden) transport to sports facilities and clubs from within large geographic rural areaswas identified as a barrier to participation60.
Transport problems are not limited to the more remote rural areas.Research in the South East of England revealed that particular problemscan arise for children in its rural areas who wish to attend after schoolactivities61. Often Local Education Authority policies prevent use of taxisand mini buses for such activities. Lack of transport therefore becomes a problem especially for parents without a car. Even where parents didhave a car to transport their disabled child, the distance they had totravel to the nearest leisure opportunity was often a deterrent. Relianceon parents to “bus children around”, whether disabled or not, is a ruralphenomenon recognised for some time62. This marginalises even morethose without access to a car, either through family or friends, andlessens their ability to participate fully.
Loss of local facilitiesLoss of meeting places (such as rural shops and post offices) can reducevalued opportunities for informal interaction. Research shows that somegroups (such as older people) value them as “hubs for the maintenanceof community support”63. Similarly closure of a local school removesopportunities for meeting at the school gate, though no research wasfound examining specifically the social disadvantage for parents andchildren when rural schools and other facilities close.
Increased use of ICTICT as a recreational tool, particularly online for recreation such asgames, playing dvds, playing and recording music, is likely to increaserapidly within rural areas, as broadband coverage expands. Thosewithout a computer or access to one will be totally reliant on facilitiesbeing available locally or there being transport to them. It can be arguedthat being “stuck in front of the computer closes down not opens socialworlds”. There seems to be little evidence around this topic. However,
“Well transport is a big issue, especiallywith the wide catchments of specialschools. Remember, Derbyshire is arural area so you add that to the pot andyou get all sorts of problems withtransport for everyone” 59.
58. Williams C. and White R. (2001) Evaluating the Roleof the Social Economy in Tackling Rural TransportProblems: Some case study evidence from ruralEngland. Planning, Practice and Research, Vol 16,Nos ? pp 337-348
59. Fitzgerald H. and Kay T. (2004) Sports Participationby Disabled Young People in Derbyshire.Loughborough University
60. Steventon J. (2004) Audit of Sports Opportunities for Children and Adults with a Disability in CumbriaSeptember 2004-December 2004. www.efds.net
61. Kelly D. (2005) Inclusive Leisure Opportunities – forchildren and young people aged 8-16 with SpecialEducational needs and/or disabilities in South EastEngland. www.efds.net
62. Shucksmith M., Roberts D., Scott D., Chapman P.and Conway E. (1996) Disadvantage in Rural Areas.Rural Development Commission
63. Bevan and Croucher (2006) op. cit. (see more detailin retail disadvantage chapter)
CC32EvidenceSect2_AW.qxd 26/9/06 5:01 pm Page 133
134 Rural disadvantage Reviewing the evidence
there is some recent work on the ‘digital divide’ in rural areas whichsuggest that “unwired individuals have greater challenges in maintainingand perhaps, establishing connections to wider social networks”, whichare themselves a form of social advantage64.
With increasing delivery of services online or on the phone (such asNHS direct and online shopping) there may be less opportunity for faceto face personal contact and inter-action in both rural and urban areas.Predictions are that there will be greater use of ICT to access servicesgenerally by 2015, but that many groups, particularly disadvantagedgroups, will continue to place great social value on retaining a face toface element in service delivery (e.g. advisory and personal health careservices)65. It seems unlikely that ICT will have a big impact on thedemand for sports facilities and communal meeting places – againbecause face to face contact will still be valued66 and because someactivities require a physical presence.
3. What are the policies?
A wide range of polices and programmes could potentially impact onopportunities for formal and informal social relations in rural areas. Ourfocus here is on national policies that aim to provide formal opportunitiesfor social interaction. Policies impacting on the more indirect causes ofsocial disadvantage, for example, policies on rural service provision ortransport provision, are discussed elsewhere in this report.
Policies on leisure tend to focus on formal leisure provision, in terms of sporting and cultural facilities and are not rurally specific. Within ruralareas the issue will more frequently be to provide locally appropriateleisure facilities and transport to leisure further away for those withoutuse of a car. In terms of formal provision of leisure services, theGovernment has stated that “those living in rural areas cannot expect to have the same level of access to sports and recreation facilities as in towns”67.
Space for Sport and Arts programmeThis nationwide funding stream of £130m. was set up in 2002 to helpprimary schools modernise their sports and arts facilities. It is a jointproject between the Department for Culture, Media and Sports (DCMS),Department for Education and Skills (DfES), Sport England, the ArtsCouncil and the New Opportunity Fund lottery fund.
The aim is to improve educational standards but also to buildcommunities and ensure social inclusion in the most impoverished areasof the country via improved sports and arts facilities in primary schools.65 Local Education Authorities and around 270 schools from deprivedareas (rural and urban) have benefited. Targeting was based on a rangeof measures, including the index of multiple deprivation. Areas such asHealth Action Zones and some rural locations have benefited. In the Eastof England, for example, 18 primary schools have benefited from a £7m.investment. They are “in areas of rural deprivation and many of the localresidents have limited resources to travel. The schools now will be ableto offer sports and arts facilities on their doorsteps”68.
64. Demos (2005) Beyond Digital Divides? The future forICT in rural areas. A report for the Commission forRural Communities
65. Countryside and Community Research Unit (2005)The Future of Rural Services in Rural England – a Scenario for 2015. Final report to Defra
66. CCRU (2005) ibid.67. ODPM (2002) Planning Policy Guidance Note 17:
Planning for Open Space, Sport, Leisure andRecreation.
68. DCMS press release (2002) Huge Boost to PrimarySchools Sports Facilities in England.www.culture.gov.uk
“...many groups, particularlydisadvantaged groups, will continue to place great social value on retaining a face to face element in service delivery”
CC32EvidenceSect2_AW.qxd 26/9/06 5:01 pm Page 134
135 Rural disadvantage Reviewing the evidence
Multi-activity facilities often benefit rural areas by bringing togethermulti-use games areas, play areas, football pitches and, perhaps, anindoor pavilion. They are often sited at rural primary schools. This canhelp contribute to social interaction within a community, as well as sustainthe schools as a community resource. This approach with schoolsproviding a hub for formal and informal leisure activities has gatheredmomentum in the Eastern region, through initiatives such as the SchoolsSports Partnerships programme which links secondary and juniorschools together69.
Currently, the Space for Sports and Arts Programme is being evaluatedand examples of best practice are being gathered, highlightingsuccessful projects including some in rural areas.
New Opportunity Fund (NOF)DCMS has heralded funding from the National Lottery as havingchanged the lives of millions70. Our Culture Secretary, Tessa Jowell, statesthat “the lottery is about the new club for older people, the sports eventfor people with disabilities or the park transformed from a patch ofderelict land into a blossoming source of local pride”. Cited amongstlottery funded achievements is that it has “helped to support urban andrural communities”, though evaluations of NOF schemes such as the“Activities for Young People Initiative”71, do not mention rural impacts.An evaluation of who has benefited from NOF funded schemes in ruralareas and how would be useful.
Culture OnlineSet up in 2002 by the DCMS, Culture Online72 supports projects to createinteractive resources for adults and children of all ages and, according to Estelle Morris, Arts Minister, 2003:“Has the potential to transformpeople’s experiences of the arts, dissolving barriers of distance, time orattitude”73. ICT has potential in rural areas to overcome issues of isolationand open up access, provided sufficient ICT infrastructure is available.One of the flagship projects when Culture Online was launched was‘Webplay’, an on-line initiative for primary school children from inner city and rural schools to work together innovatively over the internet to create a play, written and directed by them. No further details seem to be publicly available of the impacts of Culture Online in rural areas.Such an evaluation would be interesting in assessing how opportunitiesfor ‘virtual’ cultural activity can be enhanced in rural areas.
Extended schools policy74
Extended schools provide a range of services and activities, oftenbeyond the school day, to help meet the needs not only of children and young people, but also their families and the wider community.Government policy is that by 2010 all schools should be able to offer use of the school’s facilities to the wider community and that half of allprimary schools and a third of all secondary schools will be offeringthese facilities by 2008. Schools can be an ideal venue in rural areas to locate and offer sports and social facilities. Current figures show that87% of rural households are within 2km of a primary school, althoughavailability at 2km is unsurprisingly lower within sparse rural settlements,particularly villages and hamlets. The provision of social and sportingactivities in schools may well provide an important role for improvinglocal social networks and should be an area for further research.
69. (pers comm. Sport England, 2006)70. DCMS (2002) National Lottery has Changed
the Lives of Millions. Press release 2 January 200271. SQW (2003) Interim and final evaluations of
the Activities for young people initiative.New Opportunities Fund. www.nof.org.uk
72. Culture Online: www.cultureonline.gov.uk73. ibid. press release 119/2003 21 October 2003
Estelle Morris unveils first seven projects forCulture Online
74. There is more detail on extended schools policy inthe education disadvantage section of this report
CC32EvidenceSect2_AW.qxd 26/9/06 5:01 pm Page 135
136 Rural disadvantage Reviewing the evidence
Young people
‘Youth Matters’ Green PaperThe green paper proposes, subject to Parliament, a legal duty for localauthorities to provide a certain standard of “things to do and places togo” for young people (aged 13–19 years). There is a strong emphasiswithin this on formal sport and leisure provision. This is, of course, only a policy proposal at present.
Connexions75
This is the Government’s support service for people aged 13–19.It operates via personal advisers and is delivered through 47 localpartnerships. Although it has a focus of encouraging young people tostay in education, training or work with a strong educational component,it includes opportunities for personal development and other support.An assessment76 of Connexions best practice in rural areas shows thereare some excellent examples in delivering to and engaging youngpeople in rural areas. Cangle Junction foyer and drop in centre in Suffolkhas four Connexions Personal Advisers attached to it and houses about 35 young people. It serves Haverhill and the surrounding villages.However, in some parts of England, Connexions centres are only situated in the main urban settlements.
As part of the Connexions Service, there is an arts-based crime diversionprogramme called ‘Positive Activities for Young People’ (PAYP) launchedin 2003. It is aimed at vulnerable eight to 19 year olds “who are most atrisk of committing a crime or becoming socially excluded. The emphasisis very much on providing quality developmental sports, arts and culturalactivities that are not only appealing but are focussed on each person’sindividual needs equipping them with new skills and improving their self-esteem”. Key worker support through the Connexions service helps those most at risk77. A Good Practice guide on PAYP contains an exampleof how the Mid-Kent Youth Offending team decided to run a multi-agencysummer scheme for 13–16 year olds in Lydd during 2004. Lydd had been identified as a deprived rural community with relatively high levels of youth offending or anti-social behaviour78.
Positive FuturesPositive Futures79 is a national social exclusion programme run by theHome Office and Sport England that uses sport and leisure activities toengage with disadvantaged young people. The aim is to have a positiveinfluence on young people’s lives by using sport as a catalyst toencourage project participation and steering young people towardseducation, training and employment. Currently there are 108 localprojects running and the programme has been heralded by the HomeOffice Minister as “an incredible success so far, helping more than800,000 young people since 2003”80.
To date the programme had been assessed by the Home Office at aprogramme level and information is not available about impacts withinrural areas of local projects. Illustrative case study information isavailable from Positive Futures Castle Morpeth (the most distinctly ruralproject), which aims to provide alternatives to “hanging around” as thereare no leisure centres in the target area. The project has focussed onproviding locally based water sports, such as kayaking and it hired a bus
75. There is more detail on connexions policy in theeducation chapter of this report
76. Countryside Agency (2003) The Implementation ofConnexions in Rural Areas. A Good Practice Guide
77. www.culture.gov.uk/education_and_social _policy78. Home Office, DCMS,Youth Justice Board and Big
Lottery Fund. Good Practice. Positive activities foryoung people. www.crimeconcern.org.uk
79. Positive Futures: www.drugs.gov.uk80. Home Office Minister, Paul Goggins. November
2005. Positive Futures website. op. cit.
“An assessment of Connexions bestpractice in rural areas shows there are some excellent examples indelivering to and engaging youngpeople in rural areas”
CC32EvidenceSect2_AW.qxd 26/9/06 5:01 pm Page 136
137 Rural disadvantage Reviewing the evidence
to overcome transport problems. Crime Concern is to take overmanagement of the programme in 2006 and it is hoped that at that stagea more detailed assessment will be complete which will comment on theimpact of the programme in rural areas.
Respect Action PlanComplimentary to the Youth Matters Green Paper, the Home OfficeRespect Action Plan81 launched in January 2006 builds on theGovernment’s drive to tackle anti-social behaviour. It stresses theimportance of “targeting disadvantaged people through sport and art”.There are some interesting proposals with potential to impact on ruralareas though rural is not mentioned specifically. As implementation of the Respect Action Plan occurs, it is hoped that evaluations assessimpacts in rural areas.
Older people
Two key Government documents refer to the formal and informal needsof older people for leisure opportunities. However, both are too recent tohave been implemented and evaluated.
Opportunity AgeThis strategy82 commits to ensuring older people have access toopportunities locally and refers to leisure and volunteering. There ismention of many issues to support vulnerable older people, such as theprovision of housebound services, mobile librairies, braille and largeprint books, digital television and interactive services. Some of thesemeasures may address social disadvantage for older people in ruralareas but there is no specific reference to this. The transport difficultiesolder people may experience are referred to and the strategyacknowledges that, “for older people in rural areas, the issue can beparticularly acute”. The strategy highlights the recently introducedinitiative of concessionary fares for all older people83.
Sure Start for Older PeopleThis report by the Social Exclusion Unit contains a 30 point action plandeveloped with other Government Departments. The prime action is forthe Department of Works and Pensions to lead a pilot of the Sure Startapproach to older people – currently named “Link Age Plus”. Joint actionwith other departments has been agreed to ensure that opportunities forlife-long learning and leisure activities for older people are included inthe pilots. It will be important to monitor and assess the impact of thisaction in all pilot areas, including the three rural ones of Devon,Nottinghamshire and Gloucestershire.
Rural policies
The Defra Rural Strategy 2004The prime focus of the strategy84 in terms of leisure and recreation is on enhancing enjoyment of countryside and countryside recreationopportunities for visitors into rural areas, particularly encouragingdisadvantaged groups use of the countryside, and the “growing leisuremarket” to help strengthen rural economies. There is little mention of theneeds of those living in rural areas for social interaction and leisure.
81. Respect Action Plan: www.homeoffice.gov.uk82. DWP (2005) Opportunity Age: Meeting the
challenges of ageing in the 21st century.Department for Work and Pensions
83. See the chapter in this report on transportdisadvantage for more information
84. Defra (2004) Rural Strategy 2004. Department forthe Environment, Food and Rural Affairs
CC32EvidenceSect2_AW.qxd 26/9/06 5:01 pm Page 137
138 Rural disadvantage Reviewing the evidence
Rural Social Exclusion programmeThis programme was funded through the Countryside Agency and ranfrom 1999 until 2005. It formed part of the Agency’s work “to establishhigh standards of rural services and to create empowered, active andinclusive communities”. A total of £6m. was available during theprogramme’s life span to fund research and demonstration projects.An evaluation85 highlighted the value of interventions or initiatives basedon leisure, recreational or arts opportunities that can help to engage with people at risk of social exclusion. For example, the Rural ActivityPartnership (RAP) based at Suffolk Acre helped to increase participationlevels in sport and physical activity amongst young people aged 14 to 25, particularly those suffering the greatest disadvantage, inaccessing opportunities in rural Suffolk and Norfolk. It achieved physicaland mental health benefits in participants and improved the take up ofrelated educational and training opportunities. Overall the evaluationfound that a number of projects had been effective in achieving results at the local level, but that the impacts have not been felt widely atregional or national level. It86 concluded that better provision of positiveactivities for young people to do was required and also identified thelack of transport as a key barrier to social participation.
The Rural Social Exclusion Programme also researched the role that thearts can play in tackling social exclusion and disadvantage in rural areas.For example, ‘Only Connect – arts touring and rural communities’ wasjoint funded with Arts Council England and showed that, “the results of successful arts promotion extend widely and contribute to personalgrowth and strong sustainable communities”. It also showed that, “peoplein villages... have used rural arts touring to develop new communityprojects and organisations with positive outcomes for rural regenerationand social cohesion”. Access to participation in the arts can be aneffective tool to ‘reach the hardest to reach’, particularly with youngpeople and those with mental health problems87.
Community Development Worker programmeThe Community Development Worker (CDW) programme, fundedthrough the Countryside Agency between 2002 and 2005, providedresources for development worker posts in each of the 38 RuralCommunity Councils (RCCs). The programme sought to help build thecapacity of local groups and individuals in small communities, to helpthem identify local needs and the problems faced by disadvantagedpeople, tackling those needs in a way that benefited the wholecommunity, building confidence and social cohesion. A number of theprojects used recreation and leisure based projects to achieve theseaims. An evaluation of the programme88 found that the programmeincreased the priority given to social exclusion in RCCs, as well as helping to make local authorities more socially inclusive. Theprogramme also helped to increase the rural focus of Local StrategicPartnerships, encouraged parish councils to give a higher priority to social inclusion and complemented the work of local community and statutory organisations. The projects built social capital anddemonstrated that community development is a useful approach to tackling rural social exclusion.
85. Ecotec Research and Consulting Ltd (2005)Evaluation of Phase II of the Rural Social ExclusionProgramme. A report to the Commission for RuralCommunities. Unpublished
86. Ecotec (2005) ibid.87. Social Exclusion Unit (2004) Mental Health
and Social Exclusion, ODPM88. Annabel Jackson Associates (2005) Evaluation of
the Community Development Workers Programme.A summary report to the Commission for RuralCommunities. Unpublished
“A total of 6m. was available during the programme's life span to fundresearch and demonstration projects.”
CC32EvidenceSect2_AW.qxd 26/9/06 5:01 pm Page 138
139 Rural disadvantage Reviewing the evidence
4. Summary
• There is limited information on who has poor social networksand the opportunities for social and leisure activity in rural areas.There is a need to expand research into formal and informal leisureneeds beyond the obvious groups, such as young people and olderpeople. Currently very little information seems to exist, for example,on lone parents, unemployed people, migrant workers, black andminority ethnic workers or gypsies and travellers. More also needsto be known about the leisure needs of those with physical ormental health problems.
• Experiences of loneliness: there is some qualitative evidence toshow that many older people in rural areas experience lonelinessfrom inadequate opportunities for social interaction with friends,family and neighbours. Experiences of loneliness can be hard toresearch and the evidence is inadequate at present.
• Transport is a key barrier to people being able to take part in social activities. More research would be useful into the relationshipsbetween transport provision in rural areas and access to leisure.
• Research also shows that changes within rural communities,such as the loss of local rural services as informal meeting places,patterns of commuting and rising house prices can all contribute to a loss of social capital and so lead to reduced opportunities forformal and informal social interaction. Further research into thesocial trends affecting leisure provision and need would be useful,including commuting, computing, car use, out of town development,and housing policy.
• Evaluation of initiatives such as the rural social exclusionprogramme and community development worker programmeclearly demonstrate the value of providing leisure, recreation andarts opportunities as a means to help engage members of thecommunity who are at risk of social exclusion. And programmes to promote the arts seem to show that participation in the arts canbe an effective means of involving “hard to reach” groups. Thereshould be monitoring and evaluation of the impact of new policies,such as the Space for Sports and Arts programme and extendedschools, in rural areas.
• Informal social interaction: local initiatives such as volunteering,community action and parish planning all seem to have potential to address social disadvantage. Limited research into this for thischapter, and the civic disadvantage chapter, suggests that morecomprehensive research into the potential of such initiatives toprovide informal social interaction would be useful.
CC32EvidenceSect2_AW.qxd 26/9/06 5:01 pm Page 139
140 Rural disadvantage Reviewing the evidence
Civic disadvantage
This chapter examines the extent to which an individual living in a ruralarea is able to influence local decision-making and decision-makingbodies. It is about individual participation in the decisions that affect themor the rural area in which they live. We look particularly at people’s abilityto influence local government decisions and those of local servicedelivery bodies. We examine whether there is evidence to show thatcertain groups are excluded from local decision-making and influencewithin rural communities, or feel that those formally representing thecommunity do not represent their interests. By local, we mean primarilywithin a local community of below10,000 population, in line with the newrural definition. However, some key regional and sub regional structuresare mentioned where they are relevant to issues of local concern. There is also some discussion of influence through the voluntary sector and viamembership organisations.
We do not focus on democratic inclusion in terms of how many peoplechoose to vote in local elections in rural areas or on numbers of electedrural representatives relative to urban. This is because non participationin local elections, bearing in mind postal voting is usually an option,reveals little about disadvantage in terms of ability to participate andprobably more about motivational issues. There is some discussionaround motivational issues related to involvement in parish planning andattendance at public meetings. Participation in sports and leisureactivities is dealt with in the social disadvantage chapter.1
1.What is the problem?
Reviews of relevant literature into rural governance and related issues3
reveal:• a lack of voice for certain individuals within rural communities,
particularly the least “powerful” in terms of affluence, education,cultural background and language;
• the marginalisation of non participants and, especially, of nonparticipating vulnerable groups;
• a tendency for partnerships and new structures of governance tofavour enrolment of organisations “representative of communityinterest” rather than individual members of the local community; and
• members of rural communities who do become involved withpartnerships to derive from a very narrow base.
The primary problem likely to result from these findings is a consequentlack of opportunity for some rural residents to influence local decisionsaffecting their daily lives. This may result in inappropriate local prioritiesand/or decisions which lack support and local ownership.
1. In addition to the research specifically referenced,the following references were also examined:Moseley M. (2002) Bottom Up- Village Action Plans–Some recent experience in Rural England. PlanningPractice and Research, vol. 17, NO 4, pp 387-405;Pierce R. (1997/1998) Power and Rural England.University of York, Department of Politics; TomorrowProject (2005) The Future of Rural Governance.A Report to the Countryside Agency by theTomorrow Project. Countryside Agency
2. David Miliband, then Communities Minister (21 February 2006) BBC News website
3. Goodwin M. (2003) Rural Governance: A review of relevant literature. Paper prepared for ESRC,Countryside Agency and Defra. Institute ofGeography and Earth Sciences; and Edwards B.,Goodwin M., Pemberton S. and Woods M. (2000)Partnership Working in Rural Regeneration. PolicyPress, funded by Joseph Rowntree Foundation
“Communities should be given morecontrol over their lives to narrowsociety’s power gap”2
11CC32EvidenceSect2_AW.qxd 26/9/06 5:01 pm Page 140
141 Rural disadvantage Reviewing the evidence
A survey4 found that between 2001 and 2003 there was a fall from 43% to 38% of those who “thought they had any influence over the decisionsaffecting their local areas”. There is no breakdown of this for rural areasand it should be noted, this relates to perceived rather than actual influence.In addition, there is research evidence that, “adults in the poorest fifth ofhouseholds in rural districts are less likely to participate in social, politicaland community organisations than other rural households on higherincomes”5 (see Figure 10.4 in chapter 10 on social disadvantage.)6
Research7 into the formal and informal voluntary sector also shows“participation in rural areas to be heavily skewed towards the relativelyaffluent who use them [voluntary organisations] as sociability vehicles...”.This suggests a problem centring on a negative relationship betweenparticipation and low levels of income, at least in relation to the voluntarysector. Conversely, research8 into good practice on participation in thecontext of “decision making and community action” shows it can bringmultiple benefits such as ”confidence, belonging, opportunity to learnskills, develop ideas, understanding etc”.
A range of secondary problems might result from a lack of opportunity to influence and participate in local decision-makingprocesses, including:
• non participants being less likely to have ownership of decisions;• more conflict and less understanding between participants and
non participants;• feelings of powerlessness and inability to influence ;• lack of opportunity to network and make social contacts;• less opportunity to develop new skills (via participation); and• less opportunity to develop confidence (via participation).
2.What are the causes?
It seems likely that many of the causes of the inability of certainindividuals in rural areas to participate in local decision-making relate to the structures of the various organisations available to them to channeltheir views. In other words, structures affecting the channels of influenceavailable to someone and the ‘media’ of communication within thosestructures. Some organisations have dual influencing and decision-making functions and distinctions are not always sharp. Some influencingbodies also correspond to a specific or several decision makers, whilstothers do not. Figure 11.1 provides some illustrative examples of ruralgroups, influencing bodies and decision makers.
4. Civil Renewal Unit (2005) Together We Can.Home Office
5. The social and other organisations included in thisresearch are: trade unions, professionalorganisations, pensioner groups, community andtenant groups, women’s groups, religious groups,sports and social groups and political parties
6. New Policy Institute (2005) www.poverty.org.uk7. Williams C. (2002) Harnessing Voluntary Work:
A fourth sector approach. Policy Studies. Volume 23.Numbers 3-4, 1 September 2002, pp 247-260
8. Skinner E., Kambites C. and Derounian J. (2005)Pointers to Good Practice: A guide for town andparish councils. NALC/Commission for RuralCommunities; Skinner E., Kambites C. et. al. (2005):Community Engagement and Local Leadership:The role for Parish and Town Councils. Good practicepoints. NALC/Commission for Rural Communities
CC32EvidenceSect2_AW.qxd 26/9/06 5:01 pm Page 141
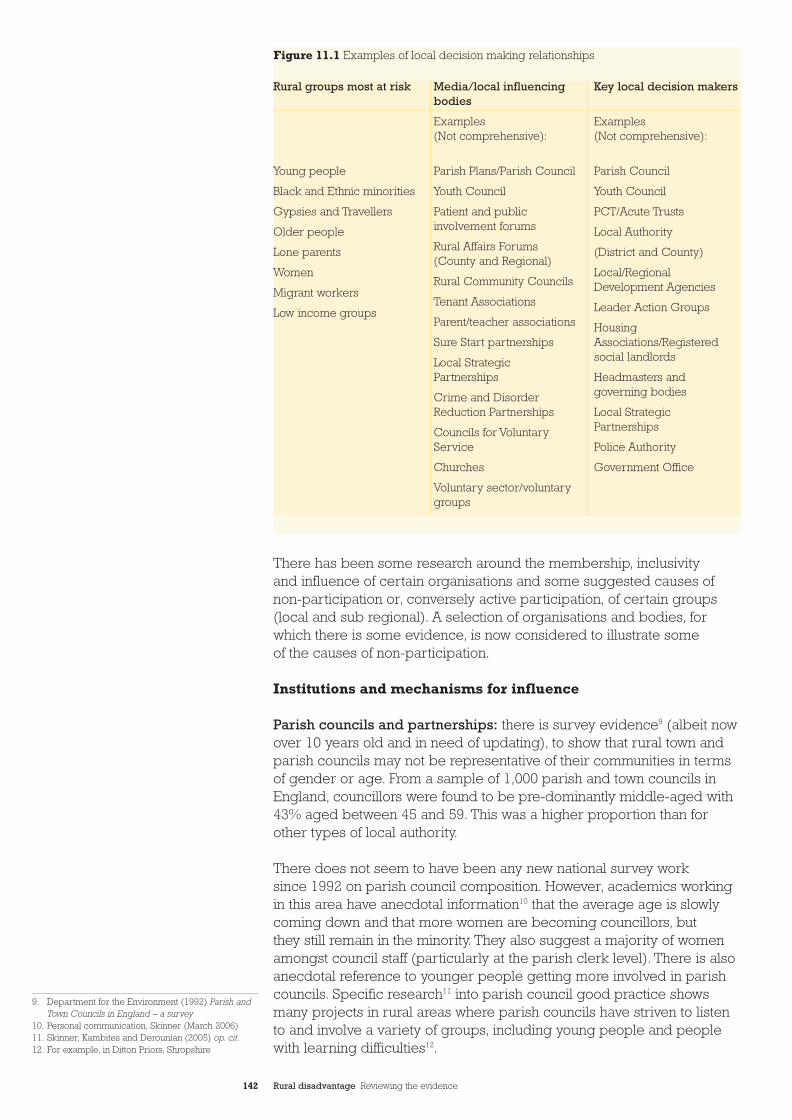
142 Rural disadvantage Reviewing the evidence
There has been some research around the membership, inclusivity and influence of certain organisations and some suggested causes ofnon-participation or, conversely active participation, of certain groups(local and sub regional). A selection of organisations and bodies, forwhich there is some evidence, is now considered to illustrate some of the causes of non-participation.
Institutions and mechanisms for influence
Parish councils and partnerships: there is survey evidence9 (albeit nowover 10 years old and in need of updating), to show that rural town andparish councils may not be representative of their communities in terms of gender or age. From a sample of 1,000 parish and town councils inEngland, councillors were found to be pre-dominantly middle-aged with43% aged between 45 and 59. This was a higher proportion than forother types of local authority.
There does not seem to have been any new national survey work since 1992 on parish council composition. However, academics workingin this area have anecdotal information10 that the average age is slowlycoming down and that more women are becoming councillors, but they still remain in the minority. They also suggest a majority of womenamongst council staff (particularly at the parish clerk level). There is alsoanecdotal reference to younger people getting more involved in parishcouncils. Specific research11 into parish council good practice shows many projects in rural areas where parish councils have striven to listento and involve a variety of groups, including young people and peoplewith learning difficulties12.
9. Department for the Environment (1992) Parish andTown Councils in England – a survey
10. Personal communication, Skinner (March 2006)11. Skinner, Kambites and Derounian (2005) op. cit.12. For example, in Ditton Priors, Shropshire
Figure 11.1 Examples of local decision making relationships
Rural groups most at risk
Young people
Black and Ethnic minorities
Gypsies and Travellers
Older people
Lone parents
Women
Migrant workers
Low income groups
Media/local influencingbodies
Examples (Not comprehensive):
Parish Plans/Parish Council
Youth Council
Patient and publicinvolvement forums
Rural Affairs Forums(County and Regional)
Rural Community Councils
Tenant Associations
Parent/teacher associations
Sure Start partnerships
Local StrategicPartnerships
Crime and DisorderReduction Partnerships
Councils for VoluntaryService
Churches
Voluntary sector/voluntarygroups
Key local decision makers
Examples (Not comprehensive):
Parish Council
Youth Council
PCT/Acute Trusts
Local Authority
(District and County)
Local/RegionalDevelopment Agencies
Leader Action Groups
HousingAssociations/Registeredsocial landlords
Headmasters andgoverning bodies
Local StrategicPartnerships
Police Authority
Government Office
CC32EvidenceSect2_AW.qxd 26/9/06 5:01 pm Page 142
143 Rural disadvantage Reviewing the evidence
Any imbalance in terms of age and gender does not necessarily mean,however, that parish councils do not represent the breadth of interestswithin a rural community. It strictly only reflects actual membership. Followup to the survey the following year with 15 case study councils13 found that,because members were “usually well known locally and actively involvedin local groups”, they were seen as highly approachable. The picture is,of course, very varied from council to council and so any generalisationsabout the extent to which councillors are representative of interests acrossthe community are impossible and would be misleading.
Our recent survey on attitudes to rural disadvantage14 shows olderpeople were more likely to make contact with a local organisation (such as the council) than younger people: 23% of those aged 60-74made contact compared to just 9% of those aged under 24. The surveydoes not tell us why younger people were less likely to make contactand whether it related more to lack of information or motivation.
Research15 into partnership projects established to build affordablehousing in rural Worcestershire found that “parish councils in the districtwere dominated by male, middle aged and middle class people”.Further, it seemed that there was evidence that some parish councils and local people adopted strategies to block further development ofaffordable housing. This NIMBY approach was backed up by professionalcouncillors (e.g. architect, ex-planner) and adding professional strength to the parish council opposition. The parish council, therefore, seemed tobe strategically defending the interests of particular local elites and usingthe more professional members of the community to do this. It should beborne in mind that this research is only representative of one example in rural Worcestershire and was not conducted extensively across ruraldistricts. The recent introduction of the Quality Parish and Town CouncilScheme, whereby a parish council can get accreditation as a “qualitycouncil” by demonstrating its ability to represent and involve itscommunities16 could potentially help encourage greater involvement of a wider range of groups and reduce any elitism. Approaching 300parishes have been awarded Quality Status to date.
Interestingly, albeit in the context of community development, recentwork17 looking at the Leader II programme in Wales showed that even so called ‘bottom up development’, where decisions were made aboutlocal development policies, was controlled and shaped by externalgatekeepers. In particular, the research found that the Leader groupsstudied tended to serve the needs and interests of the more powerfulsections of the rural population. Similarly, research into rural partnerships18
suggests, “those members of rural communities who do become involvedwith partnerships tend to be drawn from a very narrow base”. Andresearch into community involvement in rural regeneration partnerships19
found difficulties which, “often led to the dominance of the “usualsuspects” phenomenon where a limited number of people were involvedas community representatives in an increasing number of partnerships”.
Regional, county and district based rural forums: Regional Rural AffairsForums (RRAF) and County and District forums are potential forums thatmay be used to ‘influence’ and represent rural individuals and vulnerablegroups. Some Rural Affairs Forums (for example in the West Midlands andSouth West) do have specific young person representation. But there is
13. Department for the Environment (1993) Roles and Activities of Parish and Town Councils inEngland: Case studies
14. Brunwin T., Clemens S., Deakin G. and Inglis G.(2006) Attitudes to Rural Disadvantage:A segmentation analysis. A report by BMRB for the Commission for Rural Communities
15. Yarwood R. (2002) Parish Councils, Partnership and Governance: The development of ‘exceptions’housing in the Malvern Hills District, England.Journal of Rural Studies Volume 18, number 3,July 2002. pp 275-291
16. www.nalc.gov.uk/quality/qualitycouncilslist.html17 Ellis (2002) Power and Exclusion in Rural
Community Development – the case of Leader II in Wales. PH D thesis, University of Swansea
18. Goodwin (2003) op. cit.19. Osborne S. et. al. (2002) Community Involvement in
Rural Regeneration Partnerships – exploring the ruraldimension. Local Government Studies. Volume 30,no 2, Summer 2004. pp 156 – 181 cited in Goodwin(2003) page 12
CC32EvidenceSect2_AW.qxd 26/9/06 5:01 pm Page 143
144 Rural disadvantage Reviewing the evidence
little research to show whether RRAFs or other forums are operating in away that specifically represents, for example, the less affluent or lessarticulate within rural communities.
Usually, Rural Community Councils and Councils for Voluntary Services (CVS) are key members of county level forums representingrural/disadvantage interests on behalf of rural communities.CVS membership tends to be skewed towards social welfare groupsconcerned, for example, with health, minority empowerment, youth,elderly, cultural and leisure. These groups form two thirds of a CVSmembership on average20. It would seem therefore that disadvantagedgroups potentially have a voice (albeit indirect) via CVS and RCCmember representatives, certainly at a County level.
Local Strategic Partnerships (LSPs): These are underpinned by theGovernment’s civil renewal agenda and desire to enhance representativedemocracy and facilitate wider citizen partnership. Local participationwill depend on how an LSP engages with localities. A recent evaluation21
shows that arrangements with “sub localities are not particularly close to neighbourhoods, but operate at the level of a combination of wards”.It mentions the need for “appropriate representation of sub-localinterests on the LSP executive and related sub groups”. But there is littlereference to how participation works specifically for any rural areas or in relation to the needs of any disadvantaged groups. The need for abalance to be struck between communities of “interest, identity andgeography” is mentioned, as is the need for mechanisms to reach those“known to be hard to reach”.
Specific analysis22 of the experience and usefulness of LSPs in rural areas concludes that their potential for a more integrated place-basedgovernance, and as a mechanism for exerting pressure from local areasup to central government departments, is not yet realised. Because LSPsare strategic bodies they are often “too bureaucratic in atmosphere formany voluntary and community sector people to feel comfortable in andto feel they [can] make a useful contribution”. One way round this is toinvolve organisations and individuals on “theme groups”. To date, a small number of LSPs have a dedicated rural theme group and a slightlylarger number have set up links to a rural forum23.
Research24 based on fieldwork in five rural districts in England specificallyconsidered how well Parish and Town Plans and Market Town Action Plans linked into Local Strategic Partnerships and Community Strategies.Although the picture varied between the districts, in general linksbetween parish and town planning processes and LSP processes werepoor and in need of improvement. There is limited information about who gets involved at parish level in ‘bridging’ processes between parishplans and LSPs. There is reference to the “faithful few”, many of which are“overloaded” and “busy” people. This research seems to suggest thatvulnerable groups are not engaged in parish planning and LSP relatedactivity. More needs to be known on this and the barriers to participation.
Clearly, inclusionary practices, particularly of marginalised communitiesand their representative groups, vary a good deal between LSPs. ManyLSPs have Rural Community Councils on their membership or areconnected to a rural forum.Overall, though, it remains hard to assess the
20. Edwards B. et. al. (2001) Participation, Power andCommunity Governance in England and Wales.Project findings. Phase one. ESRC project. Universityof Aberystwyth, Wales
21. ODPM (2005) National Evaluation of Local Strategic Partnerships
22. Smith V. and Moor C. (2005) Local StrategicPartnerships in England – a case study for theOrganisation of Economic Co-operation andDevelopment. Commission for Rural Communities
23. Countryside Agency and the Local GovernmentAssociation (2004) Think Rural Survey
24. Moseley M., Owen S., Courtney P., Chater C. andCherrett T. (2004) The Bridges Research Project:Final Report. Parish and Town Plans, Market TownAction Plans – links to Local Strategic Partnershipsand Community Strategies. Report to theCountryside Agency. Countryside and CommunityResearch Unit, University of Gloucester
CC32EvidenceSect2_AW.qxd 26/9/06 5:01 pm Page 144
145 Rural disadvantage Reviewing the evidence
extent to which LSPs are enabling local individuals and groups in ruralareas to influence decisions affecting their lives.
Health services: There are 569 patient and public involvement forums(PPIF) in England with an average of 10 members25. A breakdown of how many of these are covering rural areas is not currently available.In theory anyone over the age of 18 is eligible to apply and speak out on issues relating to local health services. PPIF have an important role toplay working with the Local Authority and through cross –partnershipworking with Acute Trusts, Primary Care Trust and Mental Health Trusts.The most recent monitoring of these forums26 showed that approximately10% of members were either from a black and minority ethniccommunity or registered disabled (high in comparison to the nationalaverage of these groups).
There do seem to be examples of genuine efforts by forums to involveand hear from rural communities and minority groups. For example, theYorkshire Region PPIF held an event in Hull specifically to get input fromgypsy and traveller communities. The forum for Burnley, Pendle andRossendale visited a women-only keep fit class specifically to engagewith minority ethnic communities. Forums in Northamptonshire joinedAction with Communities in Rural England (ACRE) on engagement andpromotional projects to highlight issues relating to control and treatmentof diabetes27. Further research into the inclusivity, membership andinfluencing role of rural PPIFs across England would be interesting topursue and may provide best practice examples to inspire other service providers.
Police service: Law and order issues ranked fourth most important in thetop ten issues raised by local people in rural areas in parish and markettown plans. Concerns related to inadequate policing, lack of “bobbies”on the beat, vandalism and anti-social behaviour . This suggests a feeling
of inability to secure adequate police services at a local level.
A review of the literature on “community engagement in policing”29 showsmost evaluation has been done in the US, with only one UK evaluation(undertaken in the 1980’s and in London). Despite this, research stressesthe importance of community engagement if there is to be effectivecommunity participation at all levels of policing. Community engagementgoes wider than neighbourhood policing as it focuses not only onneighbourhood problem-solving initiatives, but also on the more strategiclevel. Community engagement should both identify and implementsolutions to local problems, but also influence strategic priorities anddecisions. There is evidence coming through from an evaluation by theCommission for Rural Communities that suggests there is quite activecommunity involvement, especially on combating fear of crime and policevisibility issues. This research, however, is limited to evaluation of 15community projects in rural England.30
Public consultation on the proposed restructuring of Police Forces by theHome Office (from 43 to 13 forces) has revealed concerns aboutincreased distances between the police and the public they serve.However, much of the actual policing is delivered at the Basic CommandUnit (BCU) level (roughly on local authority boundaries) and this will beunaffected by any restructuring. The Government is also proposing
25. Department of Health (April 2004) Patient andPublic Involvement in Health. The evidence for PolicyImplementation. A summary of the results of theHealth in Partnership research programme.Department of Health
26. Commission for Patient and Public Involvement inHealth (CPPIH) (2005) Patient and PublicInvolvement Forums’ Annual Reports 2004/2005.National Summary
27. ibid.28. Moseley M., Owen S., Clark M. and Kambites C.
(2005) Local Issues in England – Messages from theParish and Market Town Plans. Report to theCountryside Agency. Countryside and CommunityResearch Unit. University of Gloucestershire.Countryside Agency
29. Myhill A. (2006) Community Engagement inPolicing: Lessons from the literature. Home Office
30. Commission for Rural Communities. (forthcoming)Good practice Guide on Fear of Crime
CC32EvidenceSect2_AW.qxd 26/9/06 5:01 pm Page 145
146 Rural disadvantage Reviewing the evidence
to roll out Neighbourhood Policing Teams by 2008 through which it is planned to strengthen linkages between the public and the police.These teams are likely to provide more accountable and very directaccess mechanisms to the public, for example, the phone number for“your police officer”. It is also argued that with larger forces BCUs maywork together better (perhaps for example in remote rural areas), asthere will be fewer border disputes about which force is responsible.It seems that the relationship between Neighbourhood Policing Teamsand BCUs will be a crucial one for individuals (rural and urban) in thefuture. Proposals for restructuring are currently on hold due to legalchallenges from some forces.
Recently, a partnership venture was set up between the Home Office andthe Association of Police Authorities which seeks to gather knowledgearound, and seek improvements in, the effectiveness of police serviceengagement, consultation and involvement with the public it serves(www.communityengagement.police.uk). To this extent there is a publicevaluation process set up.
Housing and regeneration: Regeneration is very broad andencompasses social, economic and environmental issues and includesissues such as health, housing, crime, transport and education. Residentinvolvement in regeneration is now accepted as “an essential ingredientin renewing and revitalising neighbourhoods (urban and rural)”31.
There is a certain amount of good practice in existence concerning local authorities and registered social landlords working successfullywith residents’ and tenants’ groups to bring about regeneration in ruralareas. However, there is, again, less information on the types of peoplethat put themselves forward for such groups and on potential under-representation. In some rural areas people may not wish to form aresident group or there may be too few people to justify it. In such casesinnovative solutions such as tenant involvement groups visiting a villagefete to canvass views, or using other social activities may be appropriate.Focus groups and other informal arrangements can also be offered inorder to encourage tenant involvement. The research32 shows that, “theseinformal arrangements provide local authorities and registered sociallandlords with effective ways of reaching people who would not usuallytake part in formal meetings, canvassing the views of particular groupsof people and getting feedback about specific issues”.
Guidance33 on community involvement in regeneration notes that mostcommunity activity is “triggered” by a specific incident, such as the loss of a like a bus, school or post office. It highlights the importance ofgetting the structure of the groups right in order to “identify and engagewith marginalised individuals”. For example, in the case of a closing postoffice those most “disadvantaged” might be elderly people with healthor mobility issues, thus making attendance at formal meetings difficult.The challenge is, therefore, how to involve those most affected, perhapsby using informal methods as referred to above.
The voluntary sector: The voluntary sector in rural areas can both be a deliverer of services and a media through which to influence otherservice deliverers. Whether or not there is a strong voluntary sector,accessible to a wide range of rural residents, is therefore relevant to
31. Countryside Agency (2001) People Make theDifference: A good practice guide for involvingresidents in rural regeneration. CountrysideAgency/Housing Corporation
32. ibid.33. Countryside Agency (2003) Breathing New Life
into Rural Communities: A guide for local action.Countryside Agency/Housing Corporation/HastoeHousing Association
“The voluntary sector in rural areas can both be a deliverer of services and a media through which to influenceother service deliverers”
CC32EvidenceSect2_AW.qxd 26/9/06 5:01 pm Page 146
147 Rural disadvantage Reviewing the evidence
civic disadvantage. Research34 shows that voluntary and communityorganisations in rural areas can be thinly spread, poorly funded andsuffer from limited support structures. Other research35 refers to the“lower levels of institutional capacity” found in some rural areas whichmake it hard for the voluntary sector to, “deliver, monitor and negotiateservice planning and delivery”.
Linked issues around the rural voluntary sector and the extent to which it provides a “media for influence,” are those about social capital36.The underlying idea is that “social networks, and the mutual trust theypromote, have a value both to the individual and to society at large”37 .Detailed analysis has been undertaken of the different kinds of socialcapital: bonding (based on common identity), bridging (based on more diverse relationships) and linking (relationships with government,institutions and power structures). More detailed discussion of these three types is outside the scope of this paper. However, research clearlysuggests that all forms have an essential role in “the effective delivery of rural services”. It highlights “the capacity of the [voluntary] sector togenerate social capital in order to tackle the access issues that impactupon rural communities”38. Bridging social capital, in particular can helpinvolve people in “formal decision making processes, giving voice totheir concerns and enabling their voices to be heard”39.
Research based on voluntary organisations in the South West confirmsdeficits of social capital amongst the most excluded groups and seesongoing challenges in engaging “with a wide cross section of thecommunity”. Amongst the four voluntary organisations researched40,the majority of volunteers were past retirement age and attempts torecruit younger volunteers had been largely unsuccessful41. The researchconcludes that currently, there are questions to be asked about whosesocial capital is being developed in rural areas and “who is beingempowered and... for what purpose”.
There are a wide range of voluntary and membership organisations that may provide a voice or avenue for influence for rural people, some of which have a specific rural remit. Many such organisations do have amembership structure whereby membership of a local group – such as alocal WI, local farmers groups, local CPRE or local RSPB group is possible.
There is certainly great potential for influence, since some of theseorganisations have sizable national memberships. The CountrysideAlliance, for example, has over 105,000 members and the RSPB over one million. However, as noted in this chapter’s introduction, certainresearch42 into participation in voluntary groups in rural areas showsthem to be heavily skewed towards the relatively affluent who use them as “sociability vehicles”.
The National Federation of Women’s Institute has an average membershipage of 50-60 but represents rural women on national and local issues and can act as a force for influence on local rural issues relating to ruraldisadvantage. This said, membership levels are falling by between 1%and 2% per year. The reasons for this do not seem to be well understood.
34. Goodwin M. (2003) Rural Governance: A review of relevant literature. Paper prepared for ESRC,Countryside Agency and Defra. Institute ofGeography and Earth Sciences
35. National Council for Voluntary Organisations(NCVO) (2002) Public Service Delivery and theVoluntary Sector: The rural analysis
36. Social capital is also discussed in the socialdisadvantage chapter in the context of formal andinformal networks providing an opportunity forsocial interaction – as opposed to the discussionhere which centres on expression of voice andparticipation in order to influence.
37. National Council for Voluntary Organisations (2003) It’s Who you Know that Counts: the role of the voluntary sector in the development of socialcapital in rural areas
38. ibid.39. National Council for Voluntary Organisations
(2005) Civil Renewal and Active Citizenship – a guide to the debate
40. The four organisations were all from the rural South West: a disability association, a healthy livingcentre, an advice centre, and a community group
41. NCVO (2003) op. cit..42. Williams C. (2002) Harnessing Voluntary Work: a
fourth sector approach. Policy Studies. Volume 23.Numbers 3-4, 1 September 2002, pp 247-260
“Research based on voluntaryorganisations in the South West confirmsdeficits of social capital amongst themost excluded groups”
CC32EvidenceSect2_AW.qxd 26/9/06 5:01 pm Page 147
148 Rural disadvantage Reviewing the evidence
Further more comprehensive and updated research would be useful to look at types of membership amongst some key rural influencingorganisations in terms of income levels, social group, ethnicity, education,age and other factors. Also, the costs of membership of some of theseorganisations may be a barrier to participation.
Local forums: Specific forums can also be a voice in local decisionmaking and in rural areas there are a vast array of them. In addition, tothe public sector bodies already covered, others forums specialisearound life course groups (such as women or senior citizens43), oraround geographic areas, such as the Peak District Rural DeprivationForum44. Detailed research into the composition and influence of all thevarious forums operating in rural areas is beyond the scope of thisreport. However, youth forums are a good example of involvement inlocal decision-making.
Recent work by the National Children’s Bureau with the Forum for RuralYoung People45 stresses the importance of young people having a voice in rural areas, “where the scattered nature of communities and smallnumbers of young people mean that services are often few and farbetween”. The research gives examples of participation particularly in thecontext of parish plans. It asserts that participation helps young peopleinfluence issues such as poor transport, lack of leisure activities and fewerinformal learning and job opportunities than their urban counterparts,all of which potentially are issues that disadvantage them. But the researchalso highlights the ongoing challenge of converting the willingness ofadults to listen to young people into sustained strategic action.
The church can be one of the few remaining institutions as well asphysical communal buildings remaining in rural areas, particularly insmaller rural settlements. Potentially, it is a place to meet and a forum for exchanging views and influence. Research to date on the role of faithgroups has been mostly urban in the context of partnerships betweenthem and local authorities and voluntary groups. Research has beencommissioned by Defra (due to report 2006), looking at the contributionmade by faith groups to community vibrancy and rural regeneration. Itmay be that this will show how faith groups can act to help communitiestackle disadvantage and act to give a voice to the least powerful orarticulate members of a rural community. In addition, the National Councilfor Voluntary Organisations will be exploring the challenges faced by faith groups in rural communities and their impact on voluntary action.The work aims to provide an understanding of the role of faith groups and will include examination of their contribution to community life and civic society.
Motivation, skills and confidence Some people may not get involved in local level influencing because of their own lack of motivation or appropriate skills.
Lack of skills and information It is probable that many of those from disadvantaged groups do notbecome involved in local decision making or influencing through lack of the necessary skills for involvement, such as language or ICT skills.
43. www.helptheaged.org.uk - details of how to join alocal forum – currently there are 400 senior citizensforums with membership of 100,000 Also for olderpeople there exist Older Peoples Advisory Groups(Better Government for Older People website – seewww.bgop.org.uk)
44. www.pdrdf.org45. National Children’s Bureau (2004) Participation in
our Village: involving children and young people inthe development of parish and town plans
“Some people may not get involved locally because of their lack of motivation”
CC32EvidenceSect2_AW.qxd 26/9/06 5:01 pm Page 148
149 Rural disadvantage Reviewing the evidence
The Home Office Active Communities Directorate (now transferred to the Office of the third sector in the Cabinet office) set up a researchprogramme on “Active Learning, Active Citizenship” to look at this issueand to pilot approaches for resolving it. In the South West, Exeter CVS ispiloting a network to tackle this cause of non-participation as one of ninelearning hubs across England. The network will operate in rural Devon,Cornwall and Somerset, as well as in urban Exeter and Plymouth. Thespecific aim of the South West Hub is to “empower some of the mostexcluded people to speak up for themselves, to influence the planningand delivery of services in their communities and to take an active rolein community development”. Specifically the hub has a focus on creating“new learning opportunities for disadvantaged adults such as speakingup, legal rights and financial literacy”. This regional model builds onwork done by Exeter CVS with those with physical and learningdisabilities, older people, parents in Sure Start areas, patients and carersand ex offenders. All these were offered training and support in“speaking up”, advocacy and mentoring.
Regarding ICT skills, joining and participating in organisations now often requires computer access or, at least, is made easier if the applicanthas access to a computer and is computer literate. ICT can potentiallyopen up access and allow people to influence local decision makingwithout the need for face to face meetings and can, therefore, overcomemobility and transport issues, particularly in remoter rural areas. However,those without computer skills or access may find it harder to becomeinvolved. A recent consultation exercise on the future support for patientand public involvement in health46 found that many PPIF forum membersdo not have ready access to a computer and “would like the literatureproduced in other formats to enable them to gain access”.
Research into the access to services of disadvantaged groups (whichincluded consideration of the use of health care services and trainingfacilities) showed that certain groups within rural communities, such as older people and migrant workers, are less ready to embracetechnology and use ICT47. So heavy reliance on ICT by decision makingand influencing bodies seems likely to exclude participation by manywithin certain groups. Additionally, many groups will not be able to afforda home computer or training without assistance. ICT access is, however,increasingly becoming available in rural areas through locally based ICT resource centres of various kinds, for example in village halls andschools. Using public access centres may be more appropriate for someindividuals. Well trained staff in public centres can “provide a humaninterface that can boost skills and confidence in the early stages oftransition [to the internet]”48.
Lack of motivation to get involvedResearch49 reveals concerns about the extent to which higher tierauthorities take notice of the priorities identified within parish plans.Lack of acknowledgement of a process can act as a demotivator to manyto participate, although more needs to be known about the obstacles toparticipation in such processes by the wider community and especiallyby vulnerable groups.
46. Opinion Leader (2005) Report: Consultation on the Future Support for Patient and PublicInvolvement in Health
47. Bowden C. and Moseley M. (2005) The Quality and Accessibility of Services in rural England:A survey of the Perspectives of disadvantagedresidents. A report by ADAS UK Ltd. and Universityof Gloucestershire for Defra
48. Demos (2005) Beyond Digital Divides? The future for ICT in rural areas. Commission for RuralCommunities
49. Moseley et. al. (2004) op. cit.
CC32EvidenceSect2_AW.qxd 26/9/06 5:01 pm Page 149
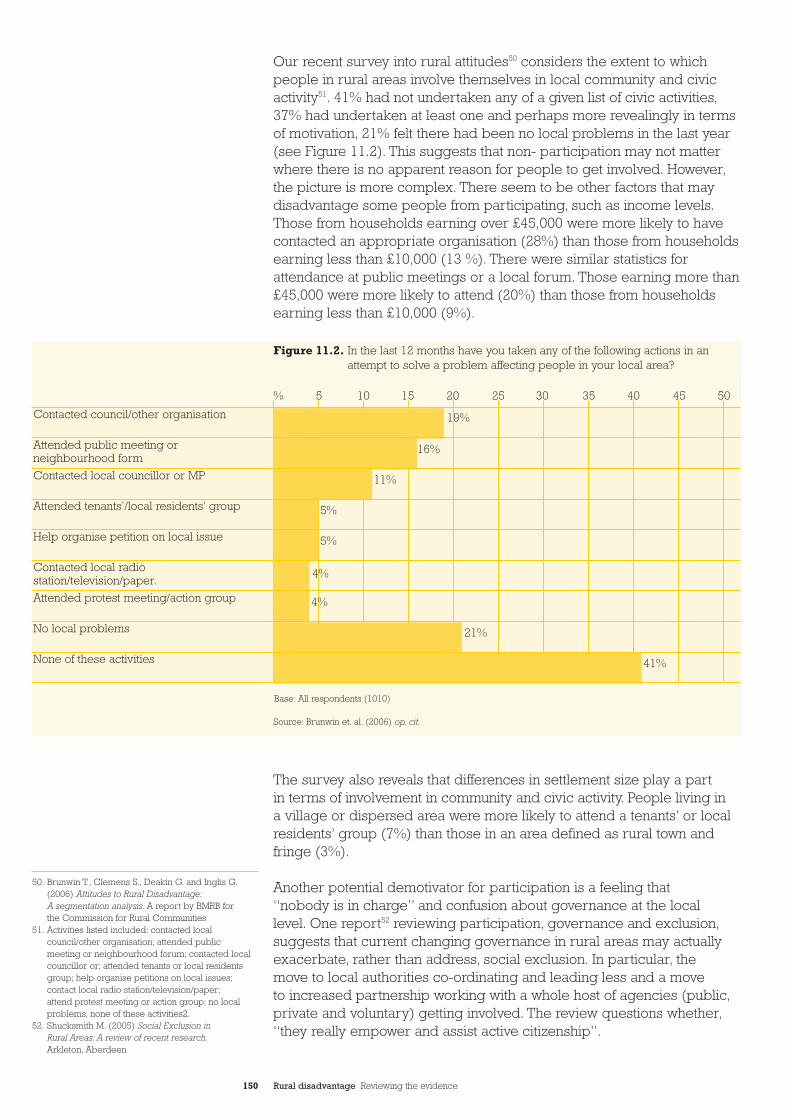
150 Rural disadvantage Reviewing the evidence
Our recent survey into rural attitudes50 considers the extent to whichpeople in rural areas involve themselves in local community and civicactivity51. 41% had not undertaken any of a given list of civic activities,37% had undertaken at least one and perhaps more revealingly in termsof motivation, 21% felt there had been no local problems in the last year(see Figure 11.2). This suggests that non- participation may not matterwhere there is no apparent reason for people to get involved. However,the picture is more complex. There seem to be other factors that maydisadvantage some people from participating, such as income levels.Those from households earning over £45,000 were more likely to havecontacted an appropriate organisation (28%) than those from householdsearning less than £10,000 (13 %). There were similar statistics forattendance at public meetings or a local forum. Those earning more than£45,000 were more likely to attend (20%) than those from householdsearning less than £10,000 (9%).
The survey also reveals that differences in settlement size play a part in terms of involvement in community and civic activity. People living in a village or dispersed area were more likely to attend a tenants’ or localresidents’ group (7%) than those in an area defined as rural town andfringe (3%).
Another potential demotivator for participation is a feeling that “nobody is in charge” and confusion about governance at the local level. One report52 reviewing participation, governance and exclusion,suggests that current changing governance in rural areas may actuallyexacerbate, rather than address, social exclusion. In particular, the move to local authorities co-ordinating and leading less and a move to increased partnership working with a whole host of agencies (public,private and voluntary) getting involved. The review questions whether,“they really empower and assist active citizenship”.
50. Brunwin T., Clemens S., Deakin G. and Inglis G.(2006) Attitudes to Rural Disadvantage:A segmentation analysis. A report by BMRB for the Commission for Rural Communities
51. Activities listed included: contacted localcouncil/other organisation; attended public meeting or neighbourhood forum; contacted localcouncillor or; attended tenants or local residentsgroup; help organise petitions on local issues;contact local radio station/television/paper;attend protest meeting or action group; no localproblems, none of these activities2.
52. Shucksmith M. (2005) Social Exclusion in Rural Areas: A review of recent research.Arkleton, Aberdeen
Figure 11.2. In the last 12 months have you taken any of the following actions in anattempt to solve a problem affecting people in your local area?
Contacted council/other organisation
Attended public meeting orneighbourhood form
Contacted local councillor or MP
Attended tenants’/local residents’ group
Help organise petition on local issue
Contacted local radiostation/television/paper.
Attended protest meeting/action group
No local problems
None of these activities
% 5 10 15 20 25 30 35 40 45 50
19%
16%
11%
5%
5%
4%
4%
21%
41%
Base: All respondents (1010)
Source: Brunwin et. al. (2006) op. cit.
CC32EvidenceSect2_AW.qxd 26/9/06 5:01 pm Page 150
151 Rural disadvantage Reviewing the evidence
3.What are the policies?
The focus below is on national level policies to encourage civicparticipation. It is worth noting that there are many instances of localsolutions where individuals have influenced local decision making andservice delivery, either through their parish council or through voluntaryor community action. It is not possible to discuss these in detail withinthis chapter.
Civil renewal and Parish PlansA key initiative in relation to civic participation is that of “civil renewal”.This reinforces the National Strategy for Neighbourhood Renewal and its focus on communities of place. It also reflects the Local GovernmentModernisation Agenda of participative democracy53. There is now a CivilRenewal Unit operating as part of the Department for Communities andLocal Government (DCLG)54.
The three core components of civil renewal are:• active citizens - people with the motivation, skills and confidence
to speak up for their communities and say what improvements are needed;
• strengthened communities- community groups with the capabilityand resources to bring people together to work out sharedsolutions; and
• partnerships with public bodies willing and able to work aspartners with local people.
53. ODPM/Home Office (2005) Citizen Engagement and Public Services: Why neighbourhoods matter
54. Details at www.civilrenewal.communities.gov
© C
ount
rysi
de
Ag
ency
/ N
ick
Tur
ner
2006
CC32EvidenceSect2_AW.qxd 26/9/06 5:01 pm Page 151
152 Rural disadvantage Reviewing the evidence
The civil renewal agenda was set out originally in the document TogetherWe Can55 and focuses on eight public policy areas within its action plan.Some are more directly related to rural issues than others and somemore relevant to tackling disadvantage than others56. ‘Together we can’ isan initiative that relies upon delivery across government and is endorsedby all the relevant departments, with overall lead departments identifiedagainst the action plan targets. Overall progress on Together We Canactions is assessed through specific tracking studies and the HomeOffice Citizenship Survey. The next citizenship survey will be publishedduring 2006, although it is not known whether the results will be brokendown between rural and urban participants. An Annual review ofTogether We Can is available on the civil renewal website.57
Action 3 of the Together We Can plan is entitled “Together we canrevitalise neighbourhoods” and action 3.5 (led by Defra) is aimedspecifically at measures to “provide opportunities for rural citizens andcommunities to influence local policies and services, by continuing tosupport parish planning and ensuring that parish and other local actionplans are taken into account in the development of sustainablecommunity strategies and spatial planning frameworks”. From April2006, action 3.5 is expected to be implemented and supported largelythrough Defra’s new Rural and Social Community Programme (seediscussion below). A recent report on Together We Can58 reports that“over the past few years, more than 3000 villages have been activelyinvolved in creating over 1,300 parish plans” and it continues, “thesebring all parts of the Community together and prioritise their needs”.However, further information on how certain groups are brought into the process, such as migrant workers, gypsies and travellers, black andminority ethnic groups would be useful. It should also be born in mindthat some rural areas remain unparished so do not have the potential to use parish plans as a rural voice.
Although the situation may be improving, there is research to show that some local authorities and other institutions do not have regard toparish plans and link them into local, sub-regional and regional strategiesincluding for housing, transport, planning, economic and communitydevelopment, local area agreements and other local delivery plans59.In summary, concerns about the parish planning process from a civic disadvantage perspective centre on coverage, involvement andinfluence. Such issues could be usefully researched within any futuregovernment evaluations.
Quality town and parish council schemeThere is research which considers how a wide range of people within ruralcommunities can be encouraged to get involved with town and parishcouncil activities. Research found60, “the town or parish council can takethe lead in involving more people from a wider range of backgrounds.When people are engaged in practical projects that are important to them,they find a voice and begin to discover what they can do. People learn newtactics and skills as they participate in projects where resources and skillsare shared. The experience may even help them to get paid work”.
55. Civil Renewal Unit (2005) Together we Can.Home Office
56. The 8 areas are: ensure children and young peoplehave a say, strengthen democracy, revitaliseneighbourhoods, increase community cohesion and racial equality, build safer communities, reducere-offending and raise confidence in the criminaljustice system, improve health and well being,secure our future.
57. DCLG (2006) Together we Can – AnnualReview.www.civilrenewal.communities.gov op. cit.
58. ibid.59. Moseley et. al. (2004) op. cit.60. Skinner E., Kambites C. and Derounian J. (2005)
Pointers to Good Practice: A guide for town andparish councils. NALC/Commission for RuralCommunities
“3,000 villages have been activelyinvolved in creating over 1,300 parish plans”
CC32EvidenceSect2_AW.qxd 26/9/06 5:01 pm Page 152
153 Rural disadvantage Reviewing the evidence
It is suggested by researchers in this field that the Quality Parish andTown Council Scheme, launched in 2003, may be an opportunity toempower rural communities and audit the conduct of communitygovernance with the test including “communication with local residents”61.As at end November 2005, 223 of the approximately 8,000 town andparish councils in England had obtained quality status . If the scheme is to make a big difference then greater encouragement may need to begiven to encouraging applications for quality status62. An evaluation of theQuality Parish and Town Council Scheme is due to report during 2006.
Neighbourhoods and citizen engagementThe Department for Communities and Local Government (formerly theOffice of the Deputy Prime Minister) has a five year strategy “People,Places and Prosperity”. Alongside this, and as part of the local governmentstrategy on policies for neighbourhoods, a consultation (co-sponsored bythe Home Office) on Citizen Engagement and Public Services- whyneighbourhoods matter has been published. The document sees“neighbourhood arrangements as a seedbed for democracy”. With anemphasis on public services and the importance of local government,the document highlights that, “citizen engagement is particularly importantin minority and disadvantaged communities where a lack of communityengagement can often undermine the effectiveness of services deliveredto standard templates”63. The paper acknowledges that perception of whata neighbourhood is varies depending on whether a person lives in a rural,urban or suburban area. In some cases, an electoral ward, several wardsor a parish may be perceived as a neighbourhood. But it stresses that,“neighbourhood engagement will often be the best level at which to reachout to the whole community and especially to include the most vulnerablepeople and groups. Voluntary and community and faith groups can allcontribute alongside statutory bodies”. The strategy also puts forwardproposals for national level and local level ‘Neighbourhood Charters’representing a commitment on the part of entering organisations to act in a certain way. This could include acting in a more “inclusionary way”.
Capacity building is a central tenet of the approach put forward jointly by DCLG (formerly ODPM) and the Home Office in their promotion ofneighbourhoods and neighbourhood charters. Reference is made to the need to provide access to knowledge and information, training indiversity and equality issues, and there is a priority given to measures to build and sustain the capacity of ward councillors64.
The National Training Strategy, launched in 2001 has led to the creation of local training and support infrastructure (through County Trainingpartnerships). There is also now a bespoke core qualification for localcouncil clerks (Certificate in Local Council Administration). However, ithas been suggested65 that further funding is needed to support training,capacity building and development of the parish and town council sectorin the context of neighbourhood governance. The issue, again, in termsof civic disadvantage is to know more about who has information thatenables them to apply for a post as a parish council clerk and whethercertain groups in rural areas do not apply to be parish council clerks.Training seems to focus on those who have become clerks, not onenlarging the pool of applicants.
61. Woods M. (2005) Rural Politics and Governance.Paper presented at a research seminar at IPPRNorth. Rural politics and governance.York
62. National Association of Local Councils (NALC)(2005) Introduction to the Quality Parish and TownCouncil Scheme
63. ODPM/Home Office (2005) op. cit.63. The Local Government Leadership Centre was
launched in 2004 aiming to “attract people of allcommunities and backgrounds to serve as councillorsand hence to be effective neighbourhood leaders”
65. Commission for Rural Communities/NationalAssociation of Local Councils (2005) Ideas Paper on the Neighbourhood Governance Review: The roleand contribution of Parish and Town Councils
CC32EvidenceSect2_AW.qxd 26/9/06 5:01 pm Page 153
154 Rural disadvantage Reviewing the evidence
Supporting the voluntary sectorThere are some key government initiatives aimed at strengthening and supporting the Voluntary and Community Sector (VCS). These are relevant and important to civic participation in rural areas, given the potential voice and media for influence for rural individuals andcommunity groups that the community and voluntary sector provide.
Specifically, the Rural Social and Community Programme (RSCP) waslaunched by Defra in April 2006 and aims to help rural communitiesshape and enhance their own communities. There is a particular focus on entrepreneurial capability and helping socially excluded individuals.
The Active Communities Directorate of The Home Office, now transferredto the Office of the third sector in the Cabinet Office, has a programme of measures based on promoting a vibrant and healthy voluntary andcommunity sector66. These flowed from a Treasury cross cutting review of the role of the voluntary and community sector in 2002. ‘Change Up’ isone of these measures and is a cross government framework focused onsupporting the capacity building of the voluntary and community sector67.Within ‘Change Up’, Defra has a £6m. programme for rural areas. Detaileddiscussion of capacity building and other measures is outside the scope of this chapter68. However, it is worth noting that the ‘Change Up’programme makes reference to many of the particular challenges facedby the voluntary sector in rural areas. Problems referred to include thelack of infrastructure in rural areas, poor access to ICT and a failure ofmany rural organisations to benefit from economies of scale. As ‘ChangeUp’ is evaluated, its impacts in rural areas need to be assessed.
66. www.communities.homeoffice.gov.uk67. Home Office (2004) Change Up: Capacity building
and infrastructure framework for the voluntary andcommunity sector. Home Office CommunicationsDirectorate
68. Details of all Home Office Active Communitiesprojects can be found on the website includingChange Up, Capacity Builders and Future Builders
© C
ount
rysi
de
Ag
ency
/ N
ick
Tur
ner
2006
CC32EvidenceSect2_AW.qxd 26/9/06 5:01 pm Page 154
155 Rural disadvantage Reviewing the evidence
ICTA number of internet sites are emerging to encourage citizenengagement. For example, an independent website has been designedto allow public access to consultations at local, national and eveninternational level (www.citizenspace.co.uk)69. This collates feedback and feeds it directly to the relevant decision makers to help shape policy. Equally there is useful information available on the internet to aid participatory processes, such as a Defra web page on parish planswhich provides links to guidance and best practice to groups andindividuals involved with parish plans70. Further research into the use ofICT would be useful to inform policy makers on the relative importanceof ICT as a way of increasing civic participation and in particular,to establish whether there are groups within rural communities for whom participation using ICT is not appropriate.71
4. Summary
• Available information seems to point to a range of factors affectingpeople’s ability to influence local decision making including:elitism amongst certain institutions operating in rural areas; lack oflinkages between certain local processes in rural areas and higherlevel processes; lack of skills and/or confidence amongst somemembers of the rural community; weak institutional capacity withinthe rural voluntary sector to assist participation; and low levels ofsocial capital in rural areas.
• Nevertheless, there is a lack of detailed information about who is not able to participate fully to influence local decision-making in rural areas. In addition, more needs to be known on the effects of non-participation both in terms of influence and in terms of social development.
• Some good practice seems to be emerging about civic participationin rural areas, particularly in the context of parish councils, ParishPlans and the Quality Parish and Town Council Scheme. More couldbe made of the good practice that exists, not only within parishcouncils, but within other influencing organisations such as PublicPatient Information Forums and Youth Forums.
• Initiatives to boost the capacity of the voluntary and communitysector appear to be vital and need to be promoted and resourced.Policies need to foster participation through all potential media,including the statutory and community sectors.
• Policies to promote ICT as a vehicle to support inclusivity alsoappear to have potential, although some groups seem likely toprefer face to face participation.
• Policies need to recognise fully the complexities and challenges of enabling vulnerable groups to participate alongside others.
• Future evaluations of Parish Plans and other local participatoryprocesses need to focus less on outputs (numbers of plansproduced) and more on assessing issues of inclusivity of vulnerable groups
• Future research into civic participation should differentiate the needsand processes appropriate to differing types of rural areas andsettlements, as analyses and solutions will need to be tailor made.
69. Designed by Delib, consultancy.70. www.defra.gov.uk/rural/communities/parish-
planning.htm71. See the discussion in the retail chapter of this
report about how certain groups cannot or do notuse ICT for food shopping . See also the ICTchapter of this report.
CC32EvidenceSect2_AW.qxd 26/9/06 5:01 pm Page 155
156 Rural disadvantage Reviewing the evidence
Local environmental disadvantage
The local physical environment can have a major impact on people’shealth, their mental well being and general quality of life. Our focus hereis on clean and healthy local environments rather than on widerenvironmental issues such as climate change. We explore whether thereis a rural dimension to environmental ‘bads’ such as local pollution,rather than access to environmental ‘goods’ (such as green and openspace). The chapter reviews the evidence on the quality of the localphysical environment in relation to noise pollution, air pollution, litter andvandalism and flooding within rural areas and how these environmentalfactors might lead to disadvantage for different groups or individualswithin rural areas. These environmental problems were chosen as issuesthat are most likely to be experienced by rural residents.
There are a number of different definitions and concepts that coverissues related to local environmental quality. These include for example‘environmental justice’, ‘environmental inequality’ and ‘environmentalexclusion’. In general they bring together the links betweenenvironmental problems and social injustices and the relationshipbetween deprived areas (or social groups of people) and poorenvironmental quality2. Some include wider social issues such as crimeand access to local services, including housing and transport which wecover elsewhere in our review. Our focus here is on local physicalenvironmental quality, including the ‘liveability’ of neighbourhoods.
1.What is the problem?
It could be argued that some local environmental issues are relativelyminor, for example, a few bits of litter on the street or a little noise do notimpact much on someone’s daily life. What is considered a nuisance orunreasonable to some, may not be considered so by others.Nevertheless, if the majority of the population lives in an environmentwhich is relatively free from such problems, then those that do not couldbe said to be disadvantaged. Indeed, the quality of the local environmentregularly features as a key concern among the issues that matter locallyto people. Research also suggests that public perceptions of safety andthe fear of crime are often influenced by the condition of local publicspaces and the general appearance of an area. Poor qualityenvironments have also been suggested as leading to ‘placestigmatisation’.
Other environmental issues, such as air pollution, have a much clearerlink with disadvantage, given its health impacts, or flooding given thedisruption it causes. There is also better understanding of certainenvironmental issues where legislation sets out what constitutes a‘nuisance’ (e.g. statutory noise limits).
1. Environment Agency website www.environment-agency.gov.uk accessed March 2006
2. ESRC, Friends of the Earth, London School ofHygiene and Tropical Medicine (2001)Environmental Justice. Rights and means to a HealthyEnvironment for All. Special briefing No7
“ a clean and healthy environment isvital for everyone’s quality oflife….problems can affect people’shealth and well being and can add tothe burden of social and economicdeprivation. They can also limit theopportunities available for people toimprove their lives…” 1
12CC32EvidenceSect2_AW.qxd 26/9/06 5:01 pm Page 156
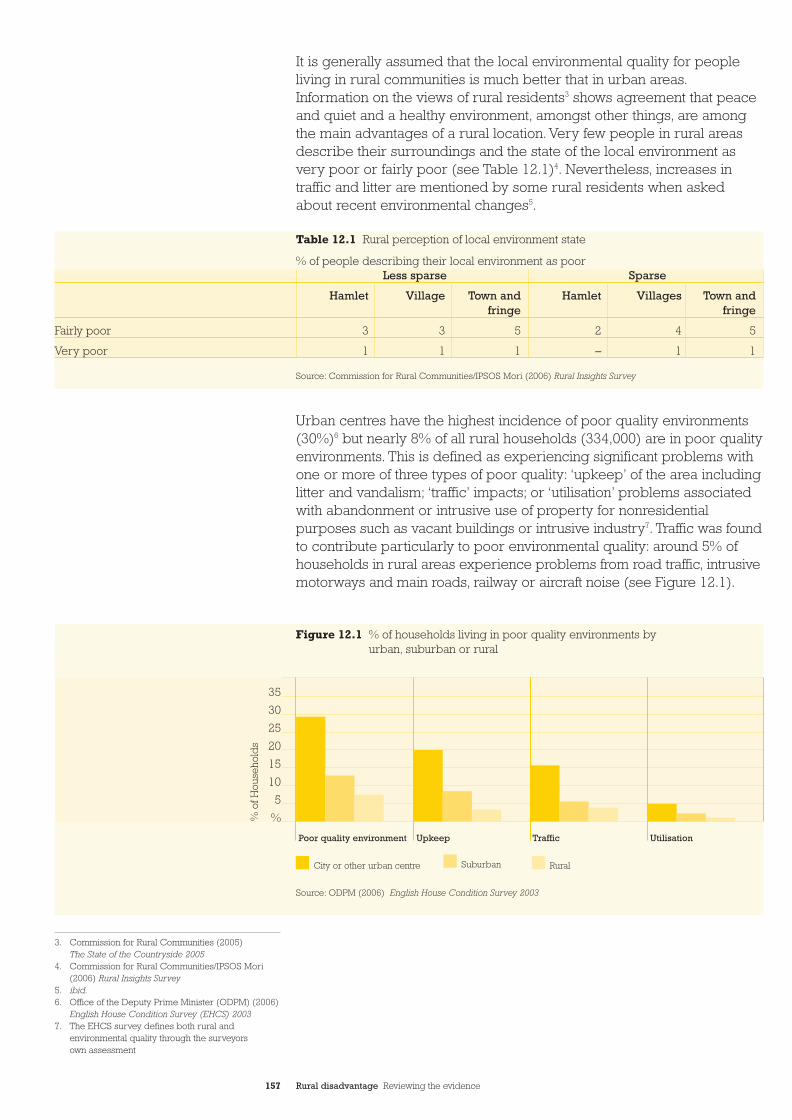
157 Rural disadvantage Reviewing the evidence
It is generally assumed that the local environmental quality for peopleliving in rural communities is much better that in urban areas.Information on the views of rural residents3 shows agreement that peaceand quiet and a healthy environment, amongst other things, are amongthe main advantages of a rural location. Very few people in rural areasdescribe their surroundings and the state of the local environment asvery poor or fairly poor (see Table 12.1)4. Nevertheless, increases intraffic and litter are mentioned by some rural residents when askedabout recent environmental changes5.
Urban centres have the highest incidence of poor quality environments(30%)6 but nearly 8% of all rural households (334,000) are in poor qualityenvironments. This is defined as experiencing significant problems withone or more of three types of poor quality: ‘upkeep’ of the area includinglitter and vandalism; ‘traffic’ impacts; or ‘utilisation’ problems associatedwith abandonment or intrusive use of property for nonresidentialpurposes such as vacant buildings or intrusive industry7. Traffic was foundto contribute particularly to poor environmental quality: around 5% ofhouseholds in rural areas experience problems from road traffic, intrusivemotorways and main roads, railway or aircraft noise (see Figure 12.1).
3. Commission for Rural Communities (2005) The State of the Countryside 2005
4. Commission for Rural Communities/IPSOS Mori(2006) Rural Insights Survey
5. ibid.6. Office of the Deputy Prime Minister (ODPM) (2006)
English House Condition Survey (EHCS) 20037. The EHCS survey defines both rural and
environmental quality through the surveyors own assessment
Less sparse Sparse
Hamlet Village Town and Hamlet Villages Town andfringe fringe
Fairly poor 3 3 5 2 4 5
Very poor 1 1 1 – 1 1
Table 12.1 Rural perception of local environment state
Figure 12.1 % of households living in poor quality environments byurban, suburban or rural
35
30
25
20
15
10
5
%
Poor quality environment Upkeep Traffic Utilisation
City or other urban centre Suburban Rural
Source: ODPM (2006) English House Condition Survey 2003
% of people describing their local environment as poor%
of H
ouse
hold
s
Source: Commission for Rural Communities/IPSOS Mori (2006) Rural Insights Survey
CC32EvidenceSect2_AW.qxd 26/9/06 5:01 pm Page 157
158 Rural disadvantage Reviewing the evidence
Who experiences poor local environmental quality?In recent years there has been an increase in evidence to show thatpeople who are socially and economically disadvantaged often live in the worst environments, but that this is generally associated with urbanclusters8. A recent review found this area of work to be ‘relatively newand poorly explored’, with the majority of research being undertaken inthe last five years9. Some of the key messages from the review relating to environmental justice are that:
• it is a real and substantive problem in the UK;• many of the most socially excluded groups are affected;• local environmental quality and differential access to goods and
services have a detrimental effect on quality of life of those groups;• in some cases, excluded communities are disproportionately
exposed to environmental risks and disproportionately vulnerableto its effects; and
• more needs to be known about both the causes and impacts ofenvironmental justice and there is need for research to support thedevelopment of policy measures.
There seems to have been little assessment of whether some people inrural areas adversely experience environmental bads10. There is limitedevidence11 to suggest that poor households in rural areas are more likely to be dissatisfied with their local area than other rural households -although this does not necessarily reflect their views on localenvironmental quality. 6% of poor households (with an income of lessthan £200/week) are very dissatisfied with their local area in remote rural districts and 9% in accessible rural districts, compared to 4% and5% of non-poor rural households respectively.
Litter and fly-tipping Available research shows that litter is generally not a major issue forrural areas. As a result, there is limited evidence on how it affects ruralpeople where it may be a problem. A survey in 2004/0512 showed that in the previous three years incidences of litter on rural roads had beenbetter than the national average. In contrast, fly-tipping (the illegaldumping of waste) appears to be a particular problem in rural areasbecause, as well as being unsightly, it can lead to pollution of theenvironment, be harmful to human health (attracting vermin or leading to accidents) and can cost victims large amounts of money to remove.It can also affect the amenity of local environments and reduce civicpride13. Fly-tipping can range from the dumping of a single household or everyday item (black bags and other household waste making upover half of reported incidents) to large scale dumping of waste, forexample, from construction, including hazardous waste.
Mapping14 of the distribution of major fly-tipping incidents (thoseinvolving organised crime or containers of hazardous waste) in Englandfrom 1999-2003 shows problems across the country, but especially inmore accessible rural areas closest to large urban populations. Over theperiod 2004/05, the Environment Agency responded to nearly 4,500major incidents. Since 2004, waste collection authorities are required tosubmit information on all fly-tipping to Defra’s national fly tippingdatabase ‘Flycapture’ which is managed by the Environment Agency.Whilst at present there is no analysis of the level of fly-tipping in ruralareas, a national average of over 88,500 fly-tipping incidents per month
8. The Environment Agency (2004) Position Statement- Addressing environmental inequalities
9. Lucas K., Walker G., Eames M., Fay H. and Poustie M. (2004) Environment and Social Justice:Rapid research and evidence review. Final report by Sustainable Development Research Network(SDRN) for Defra
10. There is some evidence in House of CommonsEnvironmental Audit Committee (2004)Environmental Crime: Fly-tipping, fly-posting, litter,graffiti and noise. Ninth report of session 2003-04.House of Commons HC 444
11. www.poverty.org based on survey of EnglishHousing 2004/05
12. Encams (2005) Local Environmental Quality Surveyof England 2004/05
13. Defra (2004) Fly-tipping Strategy. A consultationdocument issued by the Department forEnvironment, Food and Rural Affairs
14. Commission for Rural Communities (2005) op. cit.
CC32EvidenceSect2_AW.qxd 26/9/06 5:01 pm Page 158
159 Rural disadvantage Reviewing the evidence
were reported for the period 2004/0515. This showed that 42% of fly-tipping occured on highways and 27% was on council land.
There is also likely to be underreporting of flytipping and there is“anecdotal evidence [to] suggest that fly-tipping is still a large problemin rural areas, although some of these incidents are dealt with bylandowners and other organisations and so will not currently be pickedup on Flycapture”16. A survey of landowners in 200417 found that a thirdexperienced fly-tipping on a weekly basis. The individual cost ofclearing up fly-tipping depends on the type and scale of the dumpeditems. It has been estimated18 that it would cost over £100m per annum to clear illegal dumped rubbish. Local authorities and the EnvironmentAgency have powers for removing fly-tipping from public owned land.
Graffiti and vandalismThere is very limited evidence on the social distribution of bothvandalism and graffiti19 and the extent to which it is a problem affectingrural areas. Vandalism is seen as a national issue and although it variessignificantly between different areas, is particularly associated with urbansettlements20. Nevertheless, vandalism is an issue in rural town and fringeareas where 25% of people surveyed said it was common. It is lesscommon in hamlets and isolated dwellings (8%)21.
Graffiti, like vandalism, is more common in urban areas, though there is little national information on the level of graffiti in rural areas22. It is alsomore prevalent in some situations, such as alleys, footbridges, transportinterchanges, walls, fences, bins and shop fronts23. Where it does occur,it can act as a drain on local authority resources. A survey of localauthorities between 2002 and 200324 on local environmental qualityissues, found 89% of authorities thought graffiti was a problem(major or minor). There seems to be no rural information on the extent to whichvandalism and graffiti occurs on private property and affects individuals,rather than public space, in other words who experiences the directimpact and clear up costs.
Noise pollutionThere is some research to suggest that the impacts of noise can affecthealth and cause stress. In addition, noise “has clear annoyance impacts,including sleep disturbance and speech interruption”25. Noise can alsocause financial disadvantage if it adversely affects house prices, thoughthis research is not specific to rural areas26.
Neighbourhood noise: neighbourhood noise (such as disturbance from neighbours) is usually associated with unreasonable behaviour.There seems to be limited evidence available on the extent to whichneighbourhood noise affects people living in rural areas, though publicopinion research27 found that one in 10 people living in the countrysideregularly hear noise from neighbours and 17% are bothered, annoyed or disturbed by the noise.
15. Defra, Environment Agency, Local GovernmentAssociation and National Statistics (2005) Fly Capture Results from the First Year’s Data 2004/5
16. Defra website www.defra.gov.uk17. CLA (2005) Fly-tipping Figures ‘Tip of Iceberg'
says CLA. Press release 2 March 200518. Defra (2004) op. cit.19. Lucas et.al (2004) op. cit.20. ODPM (2004) Environmental Exclusion Review.
Research Report 1121. Commission for Rural Communities (2005)
The State of the Countryside 2005. based on the British Crime Survey
22. ibid.23. Encams (2005) Policy Statement on Graffiti.
Accessed www.encams.org in March 2005.24. Encams (2004) Local Environmental Quality:
A local authority perspective25. Lucas et. al. (2004) op. cit.26. Lucas et. al. (2004) op. cit.27. Mori Social Research (2003) Neighbour Noise:
Public opinion research to assess it nature, extentand significant. Research for Defra
CC32EvidenceSect2_AW.qxd 26/9/06 5:01 pm Page 159
160 Rural disadvantage Reviewing the evidence
A recent national review28 on environmental justice found no evidencethat noise nuisance more adversely affects low income groups orcommunities. However, the review speculated that people living in flatsand poor quality social housing were more likely to be affected, due tothe impact of high density housing and poor insulation. It also suggestedthat “older people, people with mental illnesses and households withyoung children (especially at night) are more likely to be sensitive tonoise nuisance”.
Ambient noise: this refers to environmental noise caused by transportand industry29. Road traffic is the most common source of ambient noise.The existence of health impacts from ambient noise is less clear. Somehave pointed to the physiological effects of noise during sleep (such asincreased blood pressure and increased heart rate) and some researchpoints to stress related impacts, whilst others conclude that the healtheffects are weak30.
Again, this is an area where further research would be useful tounderstand whether there is a problem in rural areas. Indeed, Defra’sambient noise strategy consultation paper31 highlighted that the majorityof respondents called for further research to determine the effects of environmental noise, including more research into comparisons between urban and rural populations.
Local air quality Poor air quality can impact on people’s health and a range of pollutantspose risks to particular groups of people such as pregnant women, olderpeople, people suffering from respiratory and coronary illnesses andchildren32. Air quality in rural areas away from busy roads and industry is generally very good, although comparisons between local areas aredifficult to obtain since air quality is only measured in a few locations33.Statistics34 show moderate or high levels of air pollution on 40 days onaverage per site tested in 2005, with ozone being the main pollutant.
Flooding Flooding can cause both physical and mental health problems. Apartfrom the obvious risk of drowning, people can experience chestinfections, colds, high blood pressure, and stomach upsets. Damage to property can also cause psychological upset and stress35. There areapproximately 4.1m people living in flood risk areas in England36. TheEnvironment Agency’s website enables people to check whether theyare at risk of flooding.
There is some research that considers whether particular types ofpeople are especially vulnerable to flooding. One study37 found thatcoastal floodplain areas attracted less affluent households and riversideones the more affluent, but both were in danger of flooding. However,an analysis38 of fluvial flooding found that poorer communities were more at risk, with households in social class 4 and 5 being 9% morelikely to be exposed to flood risk than others.
28. Lucas et. al. (2004) op. cit.29. Defra website on ambient noise www.defra.gov.uk
accessed March 2006.30. Lucas et. al. (2004) op. cit.31. Defra (2002) Summary of Responses to the
consultation paper –Towards a National AmbientNoise Strategy
32. Lucas et. al. (2004) op. cit.33. Commission for Rural Communities (2005) op. cit.34. Defra (2006) Statistical release: Air quality indicator
for sustainable development 2005 (final figures).24 April 2006.
35. Environment Agency (2006) AddressingEnvironmental Inequalities: Flood risk
36. ibid.37. Walker G. P., Mitchell G., Fairburn J. and Smith G.
(2003) Environmental Quality and Social Deprivation.Phase II: National analysis of Flood Hazard, IPCIndustries and Air Quality, R&D project record E2-067/1/PR1. The Environment Agency
38. The Environment Agency (2006) op. cit.
CC32EvidenceSect2_AW.qxd 26/9/06 5:01 pm Page 160
161 Rural disadvantage Reviewing the evidence
2.What are the causes?
For most of the local environmental issues discussed, there is limitedevidence to show the causes of local environmental problems.
The link with lower incomesIt has been suggested that cheaper housing will tend to be foundalongside major roads, leading to people with lower incomes beingmore exposed to air and noise pollution. There are also studies39 whichconcluded that industrial sites that are potentially highly polluting (andsubject to Pollution and Prevention Control (PPC) permits) are morelikely to be located in areas with high levels of deprivation. This isparticularly so for the waste sector (including incinerators). A reviewnoted that, “the failure in the past of transport investment decisions totake account of air quality implications and distributional issues and the operation of planning processes which have protected areas of highresidential quality from road building and industrial development mayhave also contributed to inequity”40. It also suggested that differences in people’s ability to afford housing, may lead to poorer people living in more noisy roadside environments and “the affordability of doubleglazing and other forms of noise insulation will also relate to income”.
LitterThere is very little research on why litter is more prevalent in someareas. One study on people’s perceptions suggests a range of factorsranging from a lack of bins, people’s attitudes (such as whether they see the area as already dirty) and convenience (especially for youngpeople), or people’s laziness. Whilst the research suggested areas mostat risk of litter were city centres, shopping areas and high streets, it alsonoted that “litter in rural areas was more noticeable, even though therewas less of it than in urban/city environments” and that it was seen asless acceptable to litter in these areas41. We have not come across anyresearch on litter in rural areas and its causes.
Fly-tippingRural areas can offer an ideal location for fly-tipping given the lowerlevels of population, the seclusion of some areas and the reducedlikelihood of the perpetrator being seen by a third party. Commonlocations for small scale fly-tipping are secluded pathways, and propertybacking on to rivers, canals, railways and roads, whereas larger scaleincidents often occur in lay-bys, country lanes, no-through roads andentrances to fields42. Rural roads, as well as industrial estates, otherhighways and public open spaces and waterside areas, are particularareas where fly-tipping occurs43.
39. Lucas et. al. (2004) op. cit.40. Lucas et. al. (2004) op. cit.41. Encams (2001) Segmentation Research:
Public behavioural survey into littering42. Webb B. and Marshall B. (2004) A problem-oriented
approach to fly-tipping. Appendix 1 Tackling fly-tipping: A review of the literature. Jill Dando Institute of Crime
43. Encams (2005) Local Environmental Quality Survey of England 2004/05
CC32EvidenceSect2_AW.qxd 26/9/06 5:01 pm Page 161
162 Rural disadvantage Reviewing the evidence
The most common reasons suggested for fly tipping are the cost of legal waste disposal and the laziness of the perpetrator44. A recentreview found that fly-tipping may be caused, in part, by recent legislationwhereby business waste should be disposed of at a licensed tip withcharges levied per tonne of waste. The introduction of the landfill tax has been cited as contributing towards increased fly-tipping, whereunscrupulous businesses try to avoid paying the tax. Whilst removal of everyday household rubbish is paid for through council tax,householders must pay the council charges for collection of largerhousehold items or take the item themselves to free facilities provided in council household waste sites. One study45 found that large items of household furniture are dumped in poorer neighbourhoods, eitherbecause poorer households couldn’t afford to pay the charge or wereless likely to have their own transport to take the item to the waste site.There is also anecdotal evidence that suggests some cars are beingabandoned due to the £100 charge that has been placed on scrappingend of life vehicles to implement an EC Directive46.
Vandalism and graffitiThere is evidence to suggest that much vandalism is carried out byyoung people when there is a lack of suitable activities in their local area. There is some research that highlights boredom and anti-socialbehaviour amongst young people in rural areas, but most does notexplore the extent to which rural young people may then resort tovandalism47. Research in a small village in rural Kent found48 damage to cars and fences was caused after young men drank and research49
on 12 to 16 year olds in three villages in East Anglia found incidents of vandalism. However, these more serious incidents were limited in extent due to a complex practice of self-policing.
Research also points to vandalism by non-local people. One reportexamining the environmental concerns of disadvantaged groups in thePeak District found that the small amount of vandalism was blamed on,“people coming in... not village people”50.
Noise pollutionTraffic noise: traffic noise is one of the most common sources of noisepollution. Whilst high traffic volumes are relatively uncommon in ruralareas,51 noise can be caused by the inadequacy of many rural roads for the levels and type of traffic they now carry. There is some limitedevidence that Heavy Goods Vehicles or articulated lorries associatedwith industry in rural areas are sources of noise pollution. However, atpresent, there is little information on the main sources of ambient noise,although the forthcoming National Ambient Noise Strategy52 will includenoise mapping, including the impact of major road and rail links in rural areas. In particular, “the maps will enable policy to take accountmore accurately of the implications of noise sources for rural areas,including major reservoirs of rural tranquillity and valued local pocketsof tranquillity”53.
44. Webb B. and Marshall B. (2004) op. cit45. Joseph Rowntree Foundation (2004) Representing
neighbourhood environmental concerns within Local Strategic Partnerships.
46. http://www.defra.gov.uk/environment/waste/topics/elvehicledir.htm
47. see chapter on social disadvantage48. Roberts L. (2003) The Trouble with Young Men
in Rural Communities. Working with young men.2, 3 September 2003
49. Moore S. (undated) Hanging About: Youth andPolicy. W9853 pp 47-59. APU. Cambridge
50. Joseph Rowntree Foundation (2001) Rain Forests are a Long Way from Here: The environmentalconcerns of disadvantaged groups
51. James E., Moreland V., Simmons S. and Tomlinson P.(2004) Dealing with Traffic Issues in Rural Areas.The Countryside Agency (unpublished)
52. Defra (2001) Towards a National Ambient Noisestrategy: A consultation paper from the Air andEnvironmental Quality Division
53. Defra (2000) Rural White Paper: Our Countryside:A fair deal for rural England
CC32EvidenceSect2_AW.qxd 26/9/06 5:01 pm Page 162
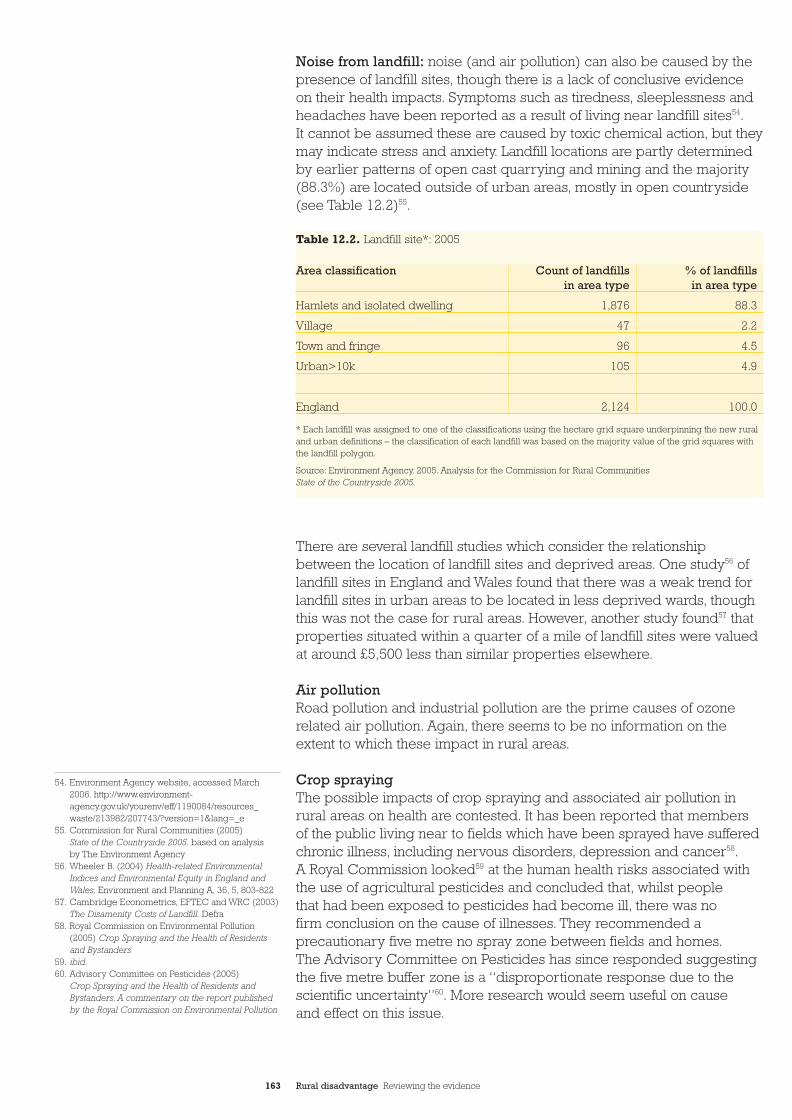
163 Rural disadvantage Reviewing the evidence
Noise from landfill: noise (and air pollution) can also be caused by thepresence of landfill sites, though there is a lack of conclusive evidenceon their health impacts. Symptoms such as tiredness, sleeplessness andheadaches have been reported as a result of living near landfill sites54.It cannot be assumed these are caused by toxic chemical action, but theymay indicate stress and anxiety. Landfill locations are partly determinedby earlier patterns of open cast quarrying and mining and the majority(88.3%) are located outside of urban areas, mostly in open countryside(see Table 12.2)55.
There are several landfill studies which consider the relationshipbetween the location of landfill sites and deprived areas. One study56 oflandfill sites in England and Wales found that there was a weak trend forlandfill sites in urban areas to be located in less deprived wards, thoughthis was not the case for rural areas. However, another study found57 thatproperties situated within a quarter of a mile of landfill sites were valuedat around £5,500 less than similar properties elsewhere.
Air pollution Road pollution and industrial pollution are the prime causes of ozonerelated air pollution. Again, there seems to be no information on theextent to which these impact in rural areas.
Crop spraying The possible impacts of crop spraying and associated air pollution inrural areas on health are contested. It has been reported that membersof the public living near to fields which have been sprayed have sufferedchronic illness, including nervous disorders, depression and cancer58.A Royal Commission looked59 at the human health risks associated withthe use of agricultural pesticides and concluded that, whilst people that had been exposed to pesticides had become ill, there was no firm conclusion on the cause of illnesses. They recommended aprecautionary five metre no spray zone between fields and homes.The Advisory Committee on Pesticides has since responded suggestingthe five metre buffer zone is a “disproportionate response due to thescientific uncertainty”60. More research would seem useful on cause and effect on this issue.
Table 12.2. Landfill site*: 2005
Area classification Count of landfills % of landfillsin area type in area type
Hamlets and isolated dwelling 1,876 88.3
Village 47 2.2
Town and fringe 96 4.5
Urban>10k 105 4.9
England 2,124 100.0
Source: Environment Agency. 2005. Analysis for the Commission for Rural CommunitiesState of the Countryside 2005.
54. Environment Agency website, accessed March2006. http://www.environment-agency.gov.uk/yourenv/eff/1190084/resources_waste/213982/207743/?version=1&lang=_e
55. Commission for Rural Communities (2005) State of the Countryside 2005. based on analysis by The Environment Agency
56. Wheeler B. (2004) Health-related EnvironmentalIndices and Environmental Equity in England andWales, Environment and Planning A, 36, 5, 803-822
57. Cambridge Econometrics, EFTEC and WRC (2003)The Disamenity Costs of Landfill. Defra
58. Royal Commission on Environmental Pollution(2005) Crop Spraying and the Health of Residentsand Bystanders
59. ibid.60. Advisory Committee on Pesticides (2005)
Crop Spraying and the Health of Residents andBystanders. A commentary on the report publishedby the Royal Commission on Environmental Pollution
* Each landfill was assigned to one of the classifications using the hectare grid square underpinning the new ruraland urban definitions – the classification of each landfill was based on the majority value of the grid squares withthe landfill polygon.
CC32EvidenceSect2_AW.qxd 26/9/06 5:01 pm Page 163
164 Rural disadvantage Reviewing the evidence
FloodingA review of research on the reason why some groups are particularlyvulnerable to the effects of flooding61 highlight factors including:
• the location or type of housing (for example those living incaravans, basement flats and single storey dwellings);
• their awareness of flood risk and likelihood of taking action (e.g. older people and single parent households who have less time or ability to prepare for an event, ethnic minorities as languagedifferences may obstruct their reception of flood warnings andthose with physical or mental disability or long term illness,who may have particular difficulties receiving or responding to warnings); and
• their ability to cope during an event or to recover from its impact(e.g. the less affluent as they have fewer financial resources torecover and are less likely to be insured; community networks, ifdisrupted, can impact on people’s coping and support systems).
3.What are the policies?
A wide range of policies and legislation have been introduced in recentyears to tackle local environmental quality. Some are too recent for theirimpact to have been fully evaluated.
Planning policyGiven that the causes of some poor local environmental quality relate to the historic decisions made about the location of industry, homes androads, the way current decisions about new development are made isclearly key. A large number of planning policies exist to deal with the use and development of land such as the Town and Country Planning Act 1990, as amended by the Planning and Compensation Act 1991 andsupporting planning policy guidance notes. Planning policy guidance(PPG23) on planning and pollution control is particularly relevant, as arethe Environmental Impact Assessment Regulations 2000, which requireprojects likely to have significant effects on the environment (due to theirnature, size or location) to be subject to an assessment. In addition, since2004 the EU Strategic Environmental Assessment Directive requiresplans and programmes under the town and country planning legislation(including transport, energy, waste management, water resourcesmanagement, industry, telecommunications and tourism) to be subject toan environmental impact assessment. At present, there seems to be littleassessment of how these regulations are impacting on environmentalquality in rural areas.
61. The Environment Agency (2006). op. cit.
CC32EvidenceSect2_AW.qxd 26/9/06 5:01 pm Page 164
165 Rural disadvantage Reviewing the evidence
Quality of local environment policiesA number of different policies and legislation have been introducedrecently that aim to improve the quality of local environments.
‘Living places: cleaner, safer, greener’: this strategy62 sets out theGovernment's vision and programme of action for improving the qualityof local environments and public spaces. The Government's aim is foreveryone to have access to attractive, high quality and sustainable publicspaces and local environments that cater for the diverse needs ofcommunities. Of particular relevance, this means ensuring that publicspaces are cleaner, by improving how they are maintained and howservices are managed and delivered. In 2002 a Public ServiceAgreement target associated with the strategy was set for ODPM to lead the delivery of cleaner, safer and greener public spaces andimprovement of the quality of the built environment in deprived areasacross the country, with measurable improvement by 2008.
Liveability fund: this fund is part of a package of measures to improvethe local environment as part of the ‘Sustainable Communities: Buildingfor the future’ programme. It provides funding to local authorities througha competitive bidding process for revenue and capital funding toimprove ‘livability’ including tackling, for example, litter, fly-tipping, fly-posting, graffiti, abandoned vehicles, street cleansing and anti-socialbehaviour.
Anti-Social Behaviour Act 2003: there are several powers in this act that relate to impacts on the environment. In particular, part six includespowers to deal with issues relating to noise, graffiti and fly posting, theunlawful deposit of waste and the extension of local authority powers to take action against littering, including:
• widening the use of Fixed Penalty Notices – e.g. for noise nuisance,truancy and graffiti and applying them to 16-17 year olds;
• dispersing groups in designated areas suffering persistent andserious anti-social behaviour;
• making the sale of spray paints to under 16s a new offence andgiving stronger powers to local authorities to tackle fly-tipping,graffiti and fly-posting; and
• widening powers to shut down establishments that create noise nuisance.
Clean Neighbourhoods and Environment Act 2005: the act deals with issues relating to quality of the local environment and anti-socialbehaviour issues, including vandalism. In particular, it gives localauthorities, parish and community councils and the Environment Agencynew powers to tackle poor environmental quality and anti-socialbehaviour. The act includes sections on crime and disorder, nuisanceand abandoned vehicles, litter, graffiti, waste, noise and dogs. The Actcontains an amendment to the Crime and Disorder Act 1998, so thatCrime and Disorder Reduction Partnerships (CDRPs) should considertaking anti-social behaviour and other behaviour adversely affecting the quality of the local environment into account when conducting theiraudits and developing their strategies. It is too soon for the impact of the Act to have been evaluated.
62. ODPM (2002) Living Places: Cleaner, safer, greener.
CC32EvidenceSect2_AW.qxd 26/9/06 5:01 pm Page 165
166 Rural disadvantage Reviewing the evidence
Securing the Future- Delivering UK Sustainable DevelopmentStrategy (2005): this takes account of developments since the original1999 Strategy. In particular there are indicators to report progress,including for local environment quality (to be developed usinginformation from the Local Environmental Quality Survey of England) and for satisfaction with the local area (households satisfied with thequality of the places in which they live).
Environmental Protection Act 1990: this act made ‘Duty Bodies’(including local authorities, government departments, statutoryundertakers, most schools, colleges and universities) responsible forkeeping public places clear of litter and refuse. Local authorities and the police can prosecute and fine people who litter and can appointLitter Wardens who can impose a Fixed Penalty Notice.
Fly tipping Proposals to tackle fly-tipping were included in the consultationdocument Living Places; Powers, Rights and Responsibilities in 2002 and a range of measures were included in the Anti-Social Behaviour Act2003. Following this, the Fly-tipping Strategy was issued for consultationin 2004 by Defra and further measures were included in the CleanNeighbourhoods and Environment Act 2005. No evaluation has yet beenundertaken on the impact of the acts and their effectiveness in tacklingrural fly-tipping given their recent implementation. Monitoring of actionthrough the flycapture database has only been mandatory since April2005. Research is currently being undertaken for Defra on the causesand incentives of fly-tipping and good practice is due to be published in2006. A new responsibility has also been introduced under the waste‘Duty of Care’ from November 2005 for all householders to ensure theirrubbish is passed on to authorised carriers only when using a wastecarrier, other than the council, to remove household, garden orDIY/building waste.
Landfill and waste In line with the EU Directive on Landfill, which imposes mandatorytargets for reducing the amount of biodegradable waste going to landfill and bans on certain types of waste going to landfill, a number ofpolicies are encouraging a move away from landfill for waste disposal.These include, for example, initiatives to promote recycling and theLandfill Tax63.
An assessment64 of waste policy and the Landfill Directive in 2005 found the lack of high-quality data made it difficult to tell how effectivelypolicies were working. It also noted that the increased cost of disposingof hazardous waste “is having a perverse effect, making it less ratherthan more likely that an environmentally appropriate disposal route will be used”. An earlier examination in 2003 found poor progress inmeeting targets for recycling waste and the then forthcoming targets for reducing the amount of waste sent to landfill. It also raised concernsabout the potential impact of reducing the hazardous waste landfillcapacity as a result of the 1999 EU Landfill Directive (due to beimplemented in 2004) which prohibits the disposal of hazardous andnon-hazardous waste in the same landfill site.
63. See for example, Cabinet Office Strategy Unit(2002) Waste Not, Want Not – A strategy for tacklingthe waste problem in England and Defra (2000)Waste Strategy 2000 for England and Wales
64. House of Commons Environment, Food and RuralAffairs Committee (2005) Waste Policy and theLandfill Directive. Fourth Report of Session 2004-05
CC32EvidenceSect2_AW.qxd 26/9/06 5:01 pm Page 166
167 Rural disadvantage Reviewing the evidence
NoiseThe Environmental Protection Act 1990 gives local authorities power to address certain types of statutory nuisance, which includes noise and vibration, but also dust, odour and smoke which is ‘prejudicial tohealth, or a nuisance’. An abatement notice can be served, requiring the nuisance to be stopped and conditions can be imposed to stop itrecurring. The Anti-Social Behaviour Act 2003 amended the Noise Act1996 and now gives local authorities powers to serve fixed penaltynotices to those responsible for excessive noise at night and to provide a night noise service that matches the needs of the community.
No assessment of the impact of legislation on addressing noise pollutionin rural areas seems to have been undertaken and, indeed, a recentreview of environmental justice concluded that the distribution of noisepollution “is a highly under-researched area”65. Similarly, the reviewnoted that no noise policy interventions specifically address issues ofinequalities in the distribution of noise. Following the EU Directive onEnvironmental Noise in 200266, an ambient noise strategy is currentlybeing prepared and a neighbourhood noise strategy is planned forpublication in 2007.
Traffic impact The distribution of traffic impacts are required to be considered in thetransport analysis methodology of transport investment appraisals andtransport studies. However, a review noted that, “distribution and equityare a supporting analysis rather than built into the primary assessment of air quality implications. It is not known whether or not this aspect ofthe transport analysis methodology has as yet made a difference todecisions with impacts on air quality.”67
Air quality The National Air Quality Strategy (2000) and Addendum (2003) set outair quality objectives for the most common air pollutants that have anadverse effect on people’s health and these are to be achieved between2003 and 2010. Local authorities are required to review and assess theStrategy’s objectives. Where part of the local authority’s area is unlikelyto meet the air quality objectives, an ‘Air Quality Management Area’must be designated and an action plan developed. A review of theNational Air Quality Strategy is currently underway.
A recent evaluation68 of the impact of the air quality strategy and keypolicies from 1990 to 2001 assessed their effectiveness in the two most important sectors – road transport and electricity generation.It concluded that the policies in both sectors “have led to majoremissions reductions, when compared to the expected out-turn withoutthe policies in place. There has also been a dramatic improvement in air quality, which has enabled significant progress towards the UK andEuropean air quality objectives. Finally, there have been extremely large benefits in reducing the health and environmental impact of airpollution”. The evaluation did not specifically assess the impact in ruralareas or on specific population groups. Evaluations of the impact of other sectors, particularly industry and the domestic sector, is one of the priorities identified for future research.
65. Lucas et. al. (2004) op. cit.66. Directive 2002/49/EC on Assessment and
Management of Environmental Noise published 18 July 2002
67. Lucas et. al. (2004) op. cit.68. Watkiss P (2004) An Evaluation of the Air Quality
Strategy: Final report to Defra 2004. Research onbehalf of Defra by AEA Technology Environment,EMRC, the Institute of Occupational Medicine and Metroeconomica
CC32EvidenceSect2_AW.qxd 26/9/06 5:02 pm Page 167
168 Rural disadvantage Reviewing the evidence
A headline measure of air quality (covering levels of particulates and ozone) is included as one of the 68 indicators of sustainabledevelopment and monitored annually. Monitoring covers air quality in urban and rural areas. The most recent figures show no clear longterm trend in rural ozone levels, with levels fluctuating from 68microgrammes per cubic metre in 1993, to 73 in 2004 and to 70 in 2005.Rural air pollution was moderate or higher for 40 days on average persite in 2005, compared with 44 in 2004 and 64 in 200369. There seems to be little overall trend in rural air pollution as the number of days has fluctuated over the years.
Industrial processes are a significant source of the pollution that theNational Air Quality Strategy covers and emissions are covered throughthe Pollution Prevention and Control (PPC) Act 1999. Any new installationrequires a PPC permit and existing installations must have a permit byOctober 2007. There are different timescales within this for differentsectors, such as livestock and poultry, slaughterhouses, food and milk,and landfill. A range of environmental issues are considered under a PPCincluding emissions, noise and vibration, energy efficiency, wasteminimisation, raw material consumption and soil and groundwatercontamination.
FloodingThe Government strategy Making Space for Water was published in draftin 2004 and a response published in 2005 by Defra70. It sets out a strategyfor flood risk management in England to avoid or minimise the negativeimpacts, social or otherwise, of flooding. It contains a strong emphasis on the principles of sustainable development at all stages of flood andcoastal erosion risk management, including reviewing flood and coastalerosion policy in rural areas. Standards which impact on project solutionsin both rural and urban areas are to be reviewed and a pilot scheme toprovide support for property flood resilience in isolated areas or wherecommunity schemes are not feasible is to be developed.
The impact of rural land management techniques at a catchment levelwill be the subject of further ongoing research to improve understanding.Research recently published71 noted the suggestion that flood defenceswere skewed towards urban areas as a result of the appraisal processused, since it favours areas with either a large number of properties orareas with high property prices. The report did not conclude, however,whether this was the case and noted that rural areas that frequently floodhave received defensive action. It recommended that detailed analysis of the relationships between population density and flood risk should be undertaken. An associated research study72 on inequalities in floodrisk also highlighted that the methodology traditionally used to appraisewhere flood defences should be provided led to high income areas with high property costs being prioritised. It noted, however, two recentchanges to address this: guidance to build socio-economic equity and human ‘intangible effects’ into appraisals (published in 2004) andchanges to the method used to fund flood management projects toinclude people, as well as environmental, criteria.
69. Defra (2006) Statistical Release: Air quality indicatorfor sustainable development 2005 (final figures).24 April 2006
70. Defra (2005) Making Space for Water; Takingforward a new Government strategy for flood andcoastal erosion risk management in England. FirstGovernment response to the Autumn 2004 ‘MakingSpace for Water’ consultation exercise. Defra
71. Environment Agency (2006) The Impacts ofFlooding on Urban and Rural Communities
72. Environment Agency (2006) op. cit.
CC32EvidenceSect2_AW.qxd 26/9/06 5:02 pm Page 168
169 Rural disadvantage Reviewing the evidence
4. Summary
• There is little research nationally on the links between localenvironmental conditions and social exclusion. Further workwould be helpful to understand better how proximity toenvironmental bads translates into actual negative impacts.
• There is even less evidence which has a rural dimension andenables rural issues to be examined. Information mostly relates toflooding, crop spraying and landfill sties. Further research isrequired to understand sufficiently whether there is an issue inrural areas.
• Given that traffic seems to be the main cause of environmentalnoise and poor air quality, further rural research would be usefulon noise from changing transport trends and policies.
• There are a range of national policies and legislation that have a potential bearing on local environmental quality in rural areas.There is very little information available about the impact of thesepolicies nationally let alone for rural areas. Several strategies andpolices have been introduced in recent years, but it is too soon fortheir impact to be fully evaluated. It is important that monitoringand evaluation undertaken in the future assess properlywhether they are working in rural areas.
CC32EvidenceSect2_AW.qxd 26/9/06 5:02 pm Page 169
170 Rural disadvantage Reviewing the evidence
Transport disadvantage
This chapter sets out the problems of transport related disadvantage, inpart drawing on some of the key points relating to this elsewhere in thereport. Transport itself, is not a form of participation in society, rather, it isa means to an end. Nevertheless, transport plays an essential role inallowing people to participate fully in society. It provides access to theservices, facilities and activities that are a key part of most people’s livessuch as employment, education, health services, shopping and leisure,as well as meeting with friends and relatives. Research has identifiedthat, whereas a lack of transport can contribute to social exclusion inurban areas, in rural areas a lack of transport can be the cause of socialexclusion1. Transport disadvantage has also been termed mobilityexclusion, which is “the process by which people are prevented fromparticipating in the economic, political and social life of the communitybecause of reduced accessibility to opportunities, services and socialnetworks, due in whole or in part to insufficient mobility in a society andenvironment built around the assumption of high mobility”2.
1.What is the problem?
As other sections of this report show, transport difficulties make asignificant contribution to disadvantage in rural areas and the lack ofaffordable, safe and reliable transport can be a major barrier toparticipating in everyday activities. Examples include:
• Employment – Transport problems can restrict the range of jobopportunities available and mean that people remain unemployedlonger than might otherwise be the case. In one recent study3, two-fifths of long-term unemployed men in rural areas said that gettingto jobs is a barrier to finding work.
• Education – It may be difficult for rural parents (particularly thoseon a low income) to access their right to a choice of school, ascurrently free transport is only provided to the ‘nearest suitableschool’ and there may be no transport available to other schools.Opportunities for young people to participate in further educationor for adults to join evening classes are also likely to be morelimited. For example, research4 found that 40% of 15-16 year oldsin rural areas said that the availability of transport played a part intheir decision whether or not to enter post-16 education. There isalso evidence that young people from rural areas miss out on after-school activities due to transport constraints (in one school this wasestimated to affect 40-45% of pupils)5.
• Healthcare – Changing patterns in the provision of health services,particularly the trend towards closing some branch surgeries andproviding fewer but larger GP practices, can cause problems forpeople who rely on public transport. In one survey6 of ruralresidents, 27% of those without a car found it difficult getting tothe doctor’s surgery compared to 10% overall. Hospital servicesare also more concentrated on fewer sites, often in edge oftown locations that are harder to access by public transport.
1. Department for Transport (2000) Social Exclusionand the Provision of Public Transport
2. Kenyon S., Lyons G., and Rafferty J. (2002) Transportand Social Exclusion: Investigating the possibility of promoting inclusion through virtual mobility,Journal of Transport Geography, 10, 3, 207–19
3. Beatty C. and Fothergill S. (2001) Labour MarketDetachment in Rural England, Countryside Agency
4. Storey P. and Brannen J. (2000) Young people andTransport in Rural Areas, The National Youth Agency
5. Evidence from the Central Council for PhysicalRecreation quoted in Social Exclusion Unit (2003)Making the Connections: Final Report on Transportand Social Exclusion
6. Brunwin T., Clemens S., Deakin G. and Inglis G.(2006) Attitudes to Rural Disadvantage:A segmentation analysis report. A report by BMRB to the Commission for Rural Communities
13“Research has identified that, whereas alack of transport can contribute to socialexclusion in urban areas, in rural areas a lack of transport can be the cause ofsocial exclusion”
CC32EvidenceSect2_AW.qxd 26/9/06 5:02 pm Page 170
171 Rural disadvantage Reviewing the evidence
Although transport is often provided for patients, visiting can be a problem for those from rural areas without private transport.Access to other healthcare facilities such as dentists may also beproblematic. A survey in one market town found that half of thosewithout a car never go to the dentist, compared with 15% of thosewith a car7. However, this may partly be related to income. There is evidence from another rural area that the unreliability of publictransport has led to many missing dentist appointments and thusbeing struck off8.
• Food shopping – Those without their own transport may havelimited opportunities to buy a healthy choice of food. Local villageshops often have a more limited range of produce and higherprices than larger supermarkets, thus disadvantaging those onlow incomes who are unable to access the supermarkets. Ourattitudinal survey9 found that those without a car available weremore likely to agree that there is a lack of availability of shopsselling food and other essential items locally – 56% of those withouta car agreed with this, compared to 47% of those with a car.
• Social and leisure activities – Getting to social and leisureactivities can be a particular problem in the evening when transportservices may not exist or be unsuitable. There is evidence thatthose without use of a car are less likely to feel part of the localcommunity and are less likely to have social contact with peopleoutside the household10. In one survey, 5% of those without accessto a car never met up with relatives and 8% never met up withfriends, compared to 2% in both cases for those with a car.
• Confidential advice – Specialist advice and support services(drugs, healthcare, contraception, housing, mental health, etc) areoften only available in the nearest urban centres. Those wishing toaccess them and unable to travel independently (for example, thosetoo young to drive) may face particular difficulties as they may notwish others to know where they are going so be reluctant to ask for a lift.
Research on the accessibility of local services and facilities11 found thatrespondents in rural areas reported less difficulty getting to one or moreof a number of key services, such as a bank, supermarket and doctor’ssurgery – 28% of rural respondents reported difficulty getting to oneor more of the places listed, compared to 31% in major conurbations.However, this reflects the fact that a higher proportion of respondentsin rural areas had access to a car. Unfortunately, this report does notcontain any information about the level of difficulty reported by thosewithout cars in rural areas but other research using local case studies12
has found that the problem of service accessibility is more acute forrural households without a car. In this research, 13% of householdswithout a car reported difficulty accessing a GP, compared with 3%of all households.
7. Countryside Agency/Yorkshire Forward (2001)Bentham moving on – An action plan for Bentham
8. National Consumer Coucil (2003) EverydayEssentials: Meeting basic needs
9. Brunwin T., Clemens S., Deakin G. and Inglis G.(2006) op. cit.
10. Brunwin T., Clemens S., Deakin G. and Inglis G.(2006) op. cit.
11. Department for Transport (2002) Accessibility of localServices – downloaded from DfT website 24/1/05(http://www.dft.gov.uk/stellent/groups/dft_transstats/documents/page/dft_transstats_505808.hcsp)
12. Williams C. and White R. (2001) Evaluating the Role of the Social Economy in Tackling Rural TransportProblems: Some case study evidence from ruralEngland, Planning Practice and Research, Vol. 16.Nos 3/4, pp337–348
CC32EvidenceSect2_AW.qxd 26/9/06 5:02 pm Page 171
172 Rural disadvantage Reviewing the evidence
A major study of transport and social exclusion was undertaken in 2001and 200213. This concluded that those living in rural areas without a carface acute problems and identified certain groups in the population whoface particular problems in their travel, including women, children andyoung people, older people and disabled people. Such groups will beparticularly at risk of transport disadvantage in rural areas where distancesto key services are greater and public transport is often infrequent orinadequate. The people most at risk of transport-related disadvantage arethose living in non-car owning households in small settlements with fewservices locally and poor public transport availability.
2.What are the causes?
Greater distances to servicesAlthough the average number of trips travelled per person differs little by area type, the distance travelled is on average far higher in ruralareas. In 2002/03 people living in rural areas travelled on average over9,500 miles a year, compared to an average for all areas of about 7,000miles a year14. This is largely because rural residents are likely to have to travel further to access a whole range of services including health,education and employment.
Reliance on the carCombined with the lack of, or inadequate, local facilities, is the growingreliance on the car. A review of social exclusion noted that: “People aretravelling further, partly because the car enables them to do so andpartly because a host of activities, institutions and policy changes havemeant that longer and more frequent journeys are necessary forreaching services and goods... Cars have become increasinglynecessary to reach work, shops, health services and schools...”15
Those who can afford to, own a car to allow them to access a greaterrange of opportunities further away. At the same time there have beensignificant levels of in-migration to rural areas and these ‘incomers’ arepredominantly affluent, high car-owning households, many of whomcommute to urban areas for work and undertake many other activitiessuch as shopping and recreational activities in these urban areas too,thus making very little use of the local facilities that do exist.
The accessibility offered by the car (particularly relative to the poor levelsof public transport available) has meant that most of those with carschoose to use them for most, if not all, of their journeys, thus making thosepublic transport services which are available less viable. Those with carsare more able to use services and facilities outside the local area, leadingto the loss of local facilities for those who rely on them. They may alsochoose to live in places where there are no alternatives to car travel (andwhere such alternatives would be harder to provide), contributing both totheir own potential lack of accessibility and future disadvantage, shouldthey become unable to drive and to accessibility difficulties for othermembers of their household, such as children, who may be unable todrive. It has also been suggested that increasing reliance on cars hasexacerbated social disadvantage because people no longer meet eachother on a day-to-day basis as they do when using public transport16.
13. Social Exclusion Unit (2003) Making theConnections: Final Report on Transport and Social Exclusion
14. Department for Transport (2005) Focus on PersonalTravel: 2005 Edition (the definition used for rural inthis publication is areas of under 3,000 population)
15. Bradshaw J., Kemp P., Baldwin S., and Rowe A.(2004) The Drivers of Social Exclusion: A review of the literature for the Social Exclusion Unit in the Breaking the Cycle series. ODPM: SocialExclusion Unit
16. Williams, White, and Aldridge (2002) CommunitySelf help in Rural England – Its role in tacklingpoverty and exclusion, Countryside Agencyresearch report quoted in Countryside Agency(2003) Transport in Tomorrow’s Countryside
“The people most at risk of transport-related disadvantage are those living innon-car owning households in smallsettlements with few services locally andpoor public transport availability”
CC32EvidenceSect2_AW.qxd 26/9/06 5:02 pm Page 172
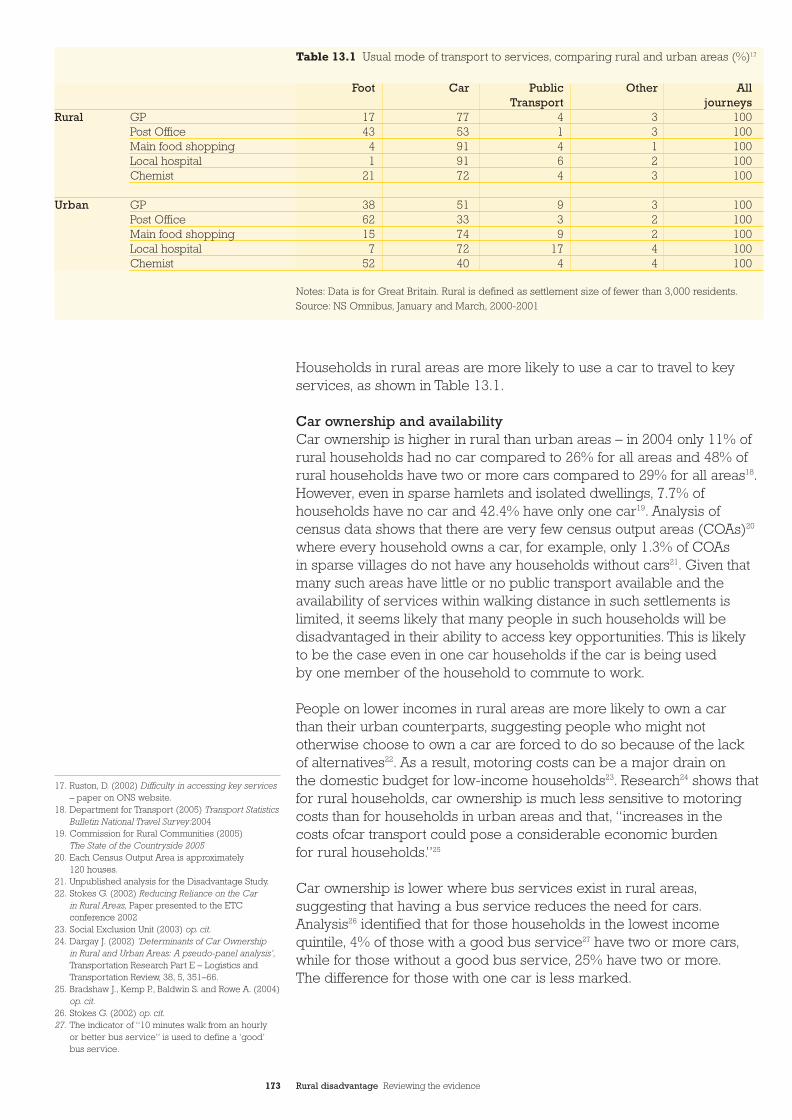
173 Rural disadvantage Reviewing the evidence
Households in rural areas are more likely to use a car to travel to keyservices, as shown in Table 13.1.
Car ownership and availabilityCar ownership is higher in rural than urban areas – in 2004 only 11% ofrural households had no car compared to 26% for all areas and 48% ofrural households have two or more cars compared to 29% for all areas18.However, even in sparse hamlets and isolated dwellings, 7.7% ofhouseholds have no car and 42.4% have only one car19. Analysis ofcensus data shows that there are very few census output areas (COAs)20
where every household owns a car, for example, only 1.3% of COAs in sparse villages do not have any households without cars21. Given thatmany such areas have little or no public transport available and theavailability of services within walking distance in such settlements islimited, it seems likely that many people in such households will bedisadvantaged in their ability to access key opportunities. This is likely to be the case even in one car households if the car is being used by one member of the household to commute to work.
People on lower incomes in rural areas are more likely to own a car than their urban counterparts, suggesting people who might nototherwise choose to own a car are forced to do so because of the lack of alternatives22. As a result, motoring costs can be a major drain on the domestic budget for low-income households23. Research24 shows thatfor rural households, car ownership is much less sensitive to motoringcosts than for households in urban areas and that, “increases in the costs ofcar transport could pose a considerable economic burden for rural households.”25
Car ownership is lower where bus services exist in rural areas,suggesting that having a bus service reduces the need for cars.Analysis26 identified that for those households in the lowest incomequintile, 4% of those with a good bus service27 have two or more cars,while for those without a good bus service, 25% have two or more.The difference for those with one car is less marked.
Foot Car Public Other AllTransport journeys
Rural GP 17 77 4 3 100Post Office 43 53 1 3 100Main food shopping 4 91 4 1 100Local hospital 1 91 6 2 100Chemist 21 72 4 3 100
Urban GP 38 51 9 3 100Post Office 62 33 3 2 100Main food shopping 15 74 9 2 100Local hospital 7 72 17 4 100Chemist 52 40 4 4 100
Notes: Data is for Great Britain. Rural is defined as settlement size of fewer than 3,000 residents.Source: NS Omnibus, January and March, 2000-2001
17. Ruston, D. (2002) Difficulty in accessing key services– paper on ONS website.
18. Department for Transport (2005) Transport StatisticsBulletin National Travel Survey:2004
19. Commission for Rural Communities (2005) The State of the Countryside 2005
20. Each Census Output Area is approximately 120 houses.
21. Unpublished analysis for the Disadvantage Study.22. Stokes G. (2002) Reducing Reliance on the Car
in Rural Areas, Paper presented to the ETCconference 2002
23. Social Exclusion Unit (2003) op. cit.24. Dargay J. (2002) ‘Determinants of Car Ownership
in Rural and Urban Areas: A pseudo-panel analysis’,Transportation Research Part E – Logistics andTransportation Review, 38, 5, 351–66.
25. Bradshaw J., Kemp P., Baldwin S. and Rowe A. (2004)op. cit.
26. Stokes G. (2002) op. cit.27. The indicator of “10 minutes walk from an hourly
or better bus service” is used to define a ‘good’bus service.
Table 13.1 Usual mode of transport to services, comparing rural and urban areas (%)17
CC32EvidenceSect2_AW.qxd 26/9/06 5:02 pm Page 173
174 Rural disadvantage Reviewing the evidence
Even in those households with cars, not everyone will have access to itand/or the ability to drive. For example, those too old, too young or too ill to drive may still experience problems in high car owning households.Although, personal access to a car is also higher in rural than urbanareas (67% of rural adults are the main car driver compared to 54% forall areas), this still leaves a third of adults in rural areas without personalaccess to a car (i.e. there will not necessarily be a car available whenthey need to use it)28. Approximately half of these are non-drivers orliving in households without a car and the other half are the ‘otherdriver’, perhaps where there is a single car in the household which is used by one partner to commute to work.
Perhaps, not surprisingly, people with no car are more likely to considerlack of access to transport as an element of disadvantage. Our attitudinalsurvey29, found that 12% of those without a car mentioned lack oftransport when asked what they thought about when they hear someonedescribed as disadvantaged, compared to 4% overall. Almost two-thirdsof people (65%) agreed with the statement ‘lack of public transport inthis area forces some people to own a car even though they can’t reallyafford to.’ Those finding it difficult to live on their current income weremore likely to agree with this statement, 73% compared to 64% of thosecoping or living comfortably. This survey also found that women weremore likely than men not to have the vehicle available when they wantedit (10% vs. 5%), as were those under 25 (24% vs. 7%). People withoutaccess to a car are dependent on the availability of public transport,as well as walking, taxis and lifts from friends and relatives.
Availability of public transportIn our new attitudinal research30, public transport was the most frequentlymentioned problem in response to an open question about the mainproblems that people living in their local area were facing – 43%mentioned this. By contrast, 17% mentioned the next most commonlymentioned problem which related to lack of shops, banks and/or postoffices locally.
Just over half of residents in the smallest settlements in rural England(with a population of 3,000 or less) live within 13 minutes walk of a bus stop with a service at least once an hour, compared with 95% ofresidents of large urban areas31. A significant proportion of villages haveno bus service at all and even those living within walking distance of an hourly or better bus service may find their opportunities limited by the range of locations it is possible to access by bus.
Only a small proportion of all trips by rural residents are made by rail –approximately 4%, compared to 7% by residents in urban areas withover 250,000 population. There is much higher use of rail by those in thehighest income quintile and much higher use of the car to reach stations.About 80% of rail journeys by rural residents starting from home beginwith a car journey to the station, compared to 20% in urban areas withover 250,000 population32.
28. Department for Transport (2005) Focus on Personal Travel. op. cit.
29. Brunwin T., Clemens S., Deakin G. and Inglis G.(2006) op. cit.
30. Brunwin T., Clemens S., Deakin G. and Inglis G.(2006) op. cit.
31. Commission for Rural Communities (2005) op. cit.
32. Personal communication from Gordon Stokes.
“Almost two-thirds of people (65%)agreed with the statement ‘lack of public transport in this area forces some people to own a car even thoughthey can’t really afford to’”
CC32EvidenceSect2_AW.qxd 26/9/06 5:02 pm Page 174
175 Rural disadvantage Reviewing the evidence
Reliance on lifts from friends and relativesThe high use of cars is unsurprising given that the distances to theseservices are, on average, higher in rural areas and the higher levels ofcar ownership. The levels of car use are also likely to be, at least in part,because friends, relatives and neighbours give lifts to people in order toenable them to access services. Recent research on access to servicesamongst rural disadvantaged groups (defined as those aged over 65,with disabilities, lone parents, carers, 16-25 year olds without a car,people on low incomes, people in deprived areas, ethnic minorities and migrant workers) found a high reliance on lifts for non-emergencyhospital trips and for main food shopping trips.
Research at the local level33 has identified widespread lift-giving in ruralareas, with between 70 and 80% of households with a car giving others alift either frequently or occasionally. Without such lifts, the reported levelsof difficulty accessing key services would be likely to be even higher.However, this research also identified that lift provision is not available to everybody – a significant minority of households in the five localitiesstudied (some 5%) were not only without a car and unable to use public transport to access services but also never received lifts. Thesehouseholds were “largely jobless households with few kin living in thelocality and thin social networks” and would have little or no opportunityto access services or employment beyond walking, or cycling distance.
The cost of transportPeople living in rural areas spend the most on transport. Households inrural settlements of less than 3,000 people spend £70.62 on transporteach week, compared with £45.36 in metropolitan built-up areas. Almosthalf of the transport spend of people in the smaller rural settlements isaccounted for by operating costs, including fuel expenditure34. It is thosewho can least afford it who seem to suffer most from these higher costs.Low income households in the least densely populated areas spend 30%more on motoring per week than those in more densely populatedareas35.
The higher costs of motoring are mainly due to the increased distancesthat people have to travel to access services and possibly, also due to the higher cost of petrol in many rural areas. Research in Scotland foundnotable differences in petrol prices between rural and urban locations.The average price of unleaded petrol in cities was three to six pence perlitre less than the rural average, and eight to 10 pence per litre less thanin the remotest areas36. However, it is not clear whether a similar pricedifferential exists in England.
Public transport costs are also often higher in rural areas. The averageadult fare payable for rural bus journeys is higher than that in urbanareas, in part because average trip lengths are longer, but on manyrural services the average fare per mile is also higher37.
33. Williams C. and White R. (2001) op. cit.34. Commission for Rural Communities (2005)
op. cit.35. From Commission for Integrated Transport website
(http://www.cfit.gov.uk/docs/2001/rural/rural/key/05.htm) – downloaded 24/1/06
36. Raymond K. and Collin H. (1998) A Study of PetrolStations in Rural Scotland – A report to the ScottishOffice Central Research Unit
37. The TAS Partnership Limited (2005) ConcessionaryFares for Young People in Rural Areas, a report forthe Commission for Rural Communities
CC32EvidenceSect2_AW.qxd 26/9/06 5:02 pm Page 175
176 Rural disadvantage Reviewing the evidence
Safety concernsAlthough the numbers of people killed and seriously injured in roadaccidents is falling generally, the rate of casualties on rural roads remainshigh. In 2004, the Department for Transport (DfT) launched a campaignaimed at drivers on rural roads, prompted by a survey that revealeddrivers are more likely to break the speed limit on rural roads due to thelack of other cars around. This is despite the fact that the majority (63%)ofall fatalities occur on rural roads38. Many rural roads are particularlyinappropriate for use at high speeds as they are unlit and withoutpavements. According to one survey, 65% of people feel threatened bytraffic on country lanes39. These concerns act as a significant deterrentto walking and cycling on rural roads, limiting the options available stillfurther for those without a car. Despite this fact, as Table 13.1 shows,walking is still a significant means of accessing key services in ruralareas in some cases, probably due to the lack of alternatives for thosewithout cars. Almost a fifth of all trips by rural residents are on foot,making it the second most common mode after a car, which accounts for three-quarters of all trips40.
3.What are the policies?
Concessionary faresThe Transport Act 2000 established statutory minimum requirements for local authorities to provide travel concessions for people over 60 andthose with certain disabilities. From 1st April 2006, this changed from half-fare off-peak local bus travel to free local bus travel supported byadditional funding to local authorities from DfT. The concessions aregenerally only available within the local authority where the eligible person lives, however there are joint schemes in some places allowingpeople to make cross boundary journeys. Local authorities havediscretionary powers to provide concessions on other modes of transport at peak times or to offer alternative schemes such as traveltokens or community transport. However, the funding available from DfTonly covers off-peak travel on registered local bus services.
Although it is too early for any evaluation of the impacts of this scheme,rural people are likely to benefit less from this concession. This is partlybecause of the lower frequency of services in rural areas (or in somecases the lack of any services). It is also because in some rural areas the nearest centre that people need to travel to for shopping and otherservices may be the other side of a district boundary, so concessionaryfares may not be available for the full journey, especially if they need tochange buses. The 2006 Budget included an announcement that the freebus travel would be extended to a national scheme, which would at leastaddress the issue of cross-boundary journeys, but would still be oflimited benefit to those in areas without bus services.
38. Department for Transport (2004) Drivers Urged to Take Care on Rural Roads (press releasedownloaded from DfT website 24/1/06)
39. Council for the Protection of Rural England (1999)Rural Traffic Fear Survey
40. Department for Transport (2005) Focus on PersonalTravel. op. cit.
“...the majority (63%) of all fatalitiesoccur on rural roads”
CC32EvidenceSect2_AW.qxd 26/9/06 5:02 pm Page 176
177 Rural disadvantage Reviewing the evidence
Local authorities also have discretionary powers to provide concessionarytravel for other groups, such as young people, but those in rural areas arealso less likely to benefit from this. Recent analysis41 found that youngpeople in rural areas are more likely to have to pay full fare from ayounger age and that the discounts available are generally less generous(65% of urban districts offer a 50% discount compared to 51% of ruraldistricts). Rural districts are also more likely (40% against 25%), to imposetime restrictions on the availability of concessions, particularly in themorning peak.
Rural Bus Subsidy GrantRural Bus Subsidy Grant (RBSG) was introduced in 1998 and wasintended to provide for new, or enhanced, local bus services for ruralcommunities of up to 10,000 residents, previously not well served bypublic transport. The Grant is allocated to local authorities on the basisof the size of their rural population. The population limit for qualifyingcommunities was increased to 25,000 in 2001 and up to 20% of thefunding from 2001/02 onwards can be used to safeguard services thatexisted prior to May 2001. Recent changes mean that RBSG is no longerring-fenced for bus services. So far, there is no evidence that authoritiesare diverting funds elsewhere, although concern has been expressedthat this could happen when current contracts come to an end.
Each authority has discretion over which services to support. Anevaluation of RBSG in 200342 found that in allocating their grant, someauthorities gave attention to reducing barriers to travel and promotingsocial inclusion, “by considering access and interchange requirements,and the need for clear readily useable information”. The evidence from this evaluation suggests that RBSG has made a contribution toreducing rural disadvantage by providing significantly more travelopportunities for rural residents, particularly those who do not haveregular access to a car.
Rural Bus ChallengeThe main objective of the Rural Bus Challenge (RBC) was theencouragementof cost-effective innovation in the provision or promotion,by local authorities, of rural bus transport. It was introduced in 1998 andran until 2003 in the form of an annual competition among all authoritiesthat encompass rural communities. An evaluation of RBC in 200343 foundthatit had funded over 200 schemes, “many of which have also becomevery important in providing rural residents with links to the goods andservices they need, reducing the incidence of social exclusion”.
In 2003/04, RBC was combined with Urban Bus Challenge into theKickstart funding scheme. This aims to pump-prime new services, orservice improvements, outside London, which contribute to the objectivesof increasing bus use and developing bus services as an alternative to car use. Although the contribution to improving accessibility and socialinclusion will also be taken into account, the emphasis is on providingfunding for services that have a clear prospect of becoming commerciallysustainable. This means that many of the services most needed toaddress rural disadvantage have less chance of being funded, given that patronage and hence the potential for commercial viability, is likely to be lower on such services.41. The TAS Partnership Limited (2005) op. cit.
42. Department for Transport (2003) Evaluation of RuralBus Subsidy Grant and Rural Bus Challenge
43. ibid.
CC32EvidenceSect2_AW.qxd 26/9/06 5:02 pm Page 177
178 Rural disadvantage Reviewing the evidence
The Rural Transport Partnership (RTP) fundThe RTP fund was established in April 2001. Funding was provided byDfT, but the scheme was administered by the Countryside Agency untilMarch 2005 when responsibility for it transferred to the RegionalDevelopment Agencies. The main aim of the RTP was to enhance ruraltransport services to secure a long-term improvement in rural people’saccess to jobs, services and social activities and in visitors’ sustainableaccess to the countryside. Where possible, grants from the RTP soughtto promote social inclusion and tackle problems of rural isolation.
Research into the effectiveness of the RTP scheme44 was published in2003. This looked at how successful it had been in meeting localtransport needs, the goals of central government and the Agency’sobjectives. The research identified that RTP projects directly benefitsome of the most deprived sections of rural communities and that young,elderly and disabled people were increasingly able to participate intheir local community as a result of the services funded. The vastmajority of the projects funded (95%), were felt to have brought servicescloser to the people who needed them, either through the provision ofmobile services or new transport links. The report concluded that therewere “major broad benefits arising from the RTP scheme projects,particularly in the areas of encouraging rural spend, increasing ruralemployment and alleviating rural social exclusion”. It seems clear,therefore, that the RTP scheme made a significant contribution toreducing disadvantage in rural areas.
Local Transport PlansLocal Transport Plans (LTPs) are now a key element in determining localtransport strategy and funding. Each LTP serves two main functions – it isa statement of policy and a bid to government for capital funding of thetransport strategy. LTPs are expected to focus on delivering the ‘sharedpriorities’ for transport which have been agreed between central andlocal government and which can be summarised as: improving access tojobs and services, particularly for those most in need, in ways which aresustainable; improved public transport; and reducing problems ofcongestion, pollution and safety. LTPs clearly have a role to play inaddressing transport-related disadvantage in rural areas. However, withthe exception of access to jobs and services, the ‘shared priorities’ tendto focus on urban transport problems and this difficulty is exacerbatedby the way the DfT guidance45 describes some issues. For example,the guidance puts a strong emphasis on road safety problems indisadvantaged areas, even though addressing rural road safety problemscould also play an important role in addressing disadvantage.
Provisional second round LTPs were submitted in July 2005 and anassessment of a sample of these was undertaken46. The researchincluded a comparison with findings from earlier research on the ruralcontent of the first round LTPs (submitted in 2000) and concluded thatprogress has been made in addressing rural transport issues.
44. Countryside Agency (2003) RTP Evaluation Project:Summary of Report
45. Department for Transport (2005) Full Guidance on Local Transport Plans: Second Edition
46. Commission for Rural Communities (2006)Addressing Rural Issues in Local Transport Plans
“...the RTP scheme made a significantcontribution to reducing disadvantage in rural areas”
CC32EvidenceSect2_AW.qxd 26/9/06 5:02 pm Page 178
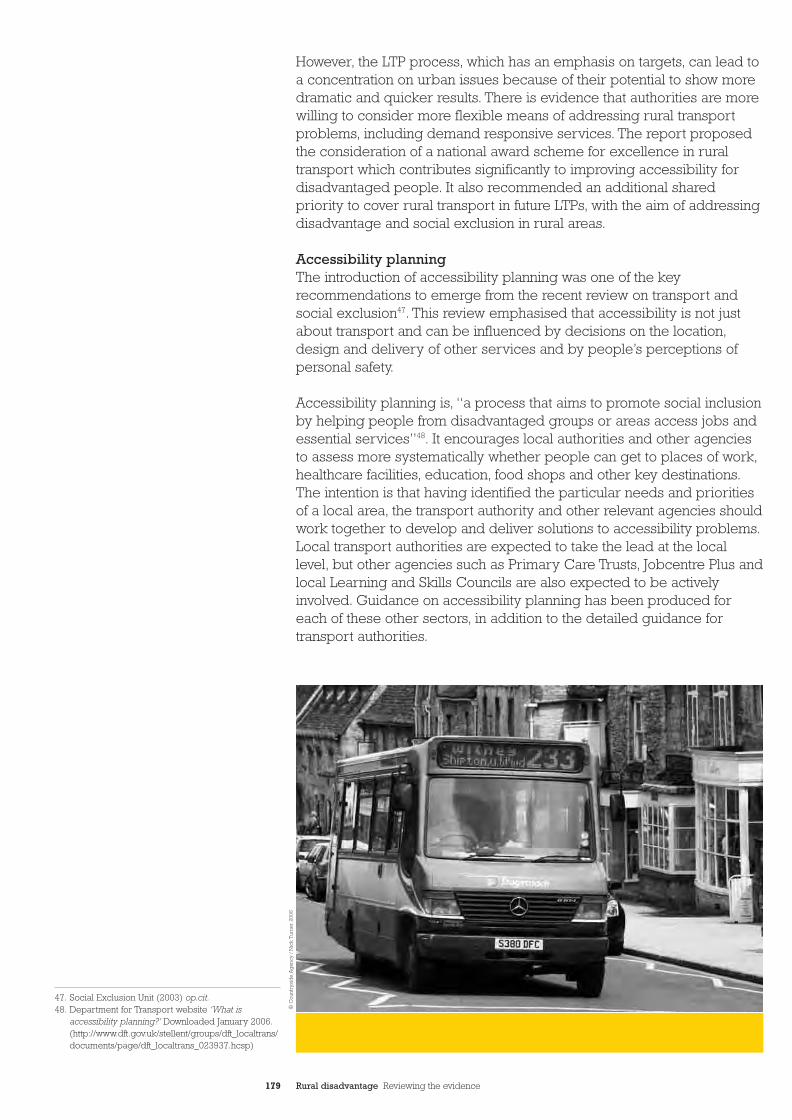
179 Rural disadvantage Reviewing the evidence
However, the LTP process, which has an emphasis on targets, can lead toa concentration on urban issues because of their potential to show moredramatic and quicker results. There is evidence that authorities are morewilling to consider more flexible means of addressing rural transportproblems, including demand responsive services. The report proposedthe consideration of a national award scheme for excellence in ruraltransport which contributes significantly to improving accessibility fordisadvantaged people. It also recommended an additional sharedpriority to cover rural transport in future LTPs, with the aim of addressingdisadvantage and social exclusion in rural areas.
Accessibility planningThe introduction of accessibility planning was one of the keyrecommendations to emerge from the recent review on transport andsocial exclusion47. This review emphasised that accessibility is not justabout transport and can be influenced by decisions on the location,design and delivery of other services and by people’s perceptions ofpersonal safety.
Accessibility planning is, “a process that aims to promote social inclusionby helping people from disadvantaged groups or areas access jobs andessential services”48. It encourages local authorities and other agenciesto assess more systematically whether people can get to places of work,healthcare facilities, education, food shops and other key destinations.The intention is that having identified the particular needs and prioritiesof a local area, the transport authority and other relevant agencies shouldwork together to develop and deliver solutions to accessibility problems.Local transport authorities are expected to take the lead at the locallevel, but other agencies such as Primary Care Trusts, Jobcentre Plus andlocal Learning and Skills Councils are also expected to be activelyinvolved. Guidance on accessibility planning has been produced foreach of these other sectors, in addition to the detailed guidance fortransport authorities.
47. Social Exclusion Unit (2003) op.cit.48. Department for Transport website ‘What is
accessibility planning?’ Downloaded January 2006.(http://www.dft.gov.uk/stellent/groups/dft_localtrans/documents/page/dft_localtrans_023937.hcsp)
© C
ount
rysi
de
Ag
ency
/ N
ick
Tur
ner
2006
CC32EvidenceSect2_AW.qxd 26/9/06 5:02 pm Page 179
180 Rural disadvantage Reviewing the evidence
The accessibility planning process has been introduced as part of theLocal Transport Plans (LTP) process. The guidance for the second roundof LTPs sets out that, as a minimum requirement, all LTP authorities areexpected to use “accessibility planning techniques to understand thelinks between social exclusion and transport in their areas, and todevelop transport solutions that can help to improve the lives of those atrisk of social exclusion”49. A final accessibility strategy, including targetsrelated to accessibility, had to be submitted as an integral part of the finalLTP in March 2006.
The introduction of accessibility planning has the potential to play animportant role in addressing issues relating to rural disadvantage but, asyet, it is too early to tell what impact the policy will have in rural areas.A recent report on LTPs50 recommends that local authorities shouldshare the results of their accessibility planning with other public servicedelivery agencies and should ensure that the process takes full accountof the needs of disadvantaged people living in rural areas.
4. Summary
• The availability of transport is key to participating in other activities, so many other forms of disadvantage are in fact transport related. Transport provides access to the servicesand facilities that are a key part of most people’s lives such as employment, education, health services, shopping andleisure, as well as for visiting friends and relatives. Whilst decisions on the locations of some of these activities are down to personalcircumstances and individual choices, others are clearly influencedby the decisions of service providers. There is a need for serviceproviders to understand fully the impact that their location decisionshave on those in rural areas and to take better account of ensuringaccessibility. Transport should be considered an integral part of anyform of service provision.
• Transport-related disadvantage is more widespread than mightbe commonly perceived. A third of adults in rural areas do nothave personal access to a car, either because they do not drive orlive in non–car owning households or because the car is mainlyused by others in the household. There is evidence that women andyoung drivers (under 25) are least likely to have use of a car whenthey want it. In addition all those who are too young or to old todrive or temporarily prevented from driving due to illness or injurymay still experience problems even in high car owning households.There is a misconception that ‘everybody drives in rural areas’ andthat only a small proportion of the population rely on alternatives.Service providers and policy makers should take this into accountin their decision making.
• The high mobility of some sectors of the rural population hasnegative impacts on those at risk of disadvantage.The fact that those who can are choosing to travel further afield for shopping and other services has directly contributed to theclosure of local facilities, thereby adding to the disadvantageexperienced by those without private mobility. This is another issue that service providers and policy makers need to be aware of in their decision making.
49. Department for Transport (2005) Full Guidance on Local Transport Plans: Second Edition
50. Commission for Rural Communities (2006) op. cit
CC32EvidenceSect2_AW.qxd 26/9/06 5:02 pm Page 180
181 Rural disadvantage Reviewing the evidence
• A small minority are very disadvantaged in terms of transport.This is those who live in households without a car and in small settlements with little or no public transport and few, if any,services available locally. Those who are also unemployed and do not have relatives locally also appear to be the least likely to beoffered a lift by others. It is not clear how such households obtainaccess to even the most basic opportunities, such as food shopping.
• Recent policy on the funding of bus services may result in reduced provision in rural areas. Schemes such as the RuralTransport Partnership and Rural Bus Challenge are coming to anend, meaning that many of the initiatives funded through them areunlikely to continue as there is little alternative funding available.There is also a need to investigate whether recent changes, suchas the introduction of free local bus travel for the over 60s, are themost appropriate way of supporting rural transport, to understandwhat the implications are and to investigate how this funding mightbe used more flexibly to provide enhanced access in rural areas.
• Accessibility planning has an important role to play inaddressing transport-related disadvantage. The introduction ofaccessibility planning should ensure that measures targeted ataddressing the needs of those facing transport-related disadvantagein rural areas are being introduced. But it will only be successful ifthe methods used to develop accessibility strategies have been ruralproofed. It will be important to establish what impacts accessibilityplanning is having in rural areas as the strategies are implemented.
CC32EvidenceSect2_AW.qxd 26/9/06 5:02 pm Page 181
182 Rural disadvantage Reviewing the evidence
ICT disadvantage
This chapter looks at the affect that a lack of access to Information andCommunication Technologies (ICT) can have on someone’s ability toparticipate fully in society. We focus mainly on access to and the use of telephones, computers and the Internet and digital television, ratherthan the provision of e-services by service providers (which has beencovered in other chapters to some extent). Like transport, ICT is not initself a form of participation, but rather is an enabling tool. In recentyears, ICT has become increasingly important in enabling people toundertake activities and access opportunities. ICT can be used in avariety of ways from helping people to buy goods and services,including their weekly shopping, to seeking information aboutemployment opportunities and local services, as well as providing adirect way to access services such as paying bills or getting treatmentfor health problems. It can also be used for social and personal uses,reducing personal isolation, such as contacting family and friends andfinding out about local social and leisure activities. Familiarity with ICTcan also help increase someone’s personal capacity2 and help someone gain employment. Basic computer literacy is an important factor inemployers’ decisions when recruiting people3.
ICT can be a way of overcoming some of the problems that rural peopleexperience in accessing a wide range of services, information andadvice, by reducing the need to travel and overcoming the lack oftransport and local facilities. The benefits of online communication inrural areas may well be greater than in urban areas due to the barriersof accessibility experienced in rural areas4. Other evidence in thisreport has highlighted the significance of transport in affectingsomeone’s ability to participate fully in society and how the distancetravelled to access service facilities in rural areas is, on average, farhigher in rural areas.
1.What is the problem?
The unequal use of ICT Technological changes can create new inequalities as take-up can befaster in certain groups. For example, the largest proportionate growthin the use of the Internet since 2001 has been amongst the 45-54 agegroup5. Whilst some research notes it is unclear if these uneven patternsof development will continue in the future, it seems that the non-use ofICT is increasingly affecting some groups’ ability to participate fully insociety. In particular, the take-up of e-services remains an issue forsome groups that have the most to gain6.
A recent report7 on the digital divide in rural areas argued that we arecurrently under-going a transition in which many activities are entwinedwith ICT and those that struggle with the transition tend to be people onlow incomes, with disabilities and literacy problems. Other groups thatmay be particularly affected are older people and job seekers.
“A lack of access to ICT, both at homeand within the community, has beenidentified as a key barrier to digitalinclusion1”
1. Social Exclusion Unit (2005) Inclusion throughInnovation. Tackling Social Exclusion through new technologies
2. ibid.3. Bradshaw J., Kemp P., Baldwin S. and Rowe A. (2004)
The Drivers of Social Exclusion: A review of theliterature for the Social Exclusion Unit in the Breakingthe Cycle series. ODPM: Social Exclusion Unit
4. Warren M. (2006) The Cloud in the Silver Lining:Exploring links between social disadvantage and digital exclusion in rural areas. University of Plymouth, UK
5. Social Exclusion Unit (2004) Breaking the Cycle:Taking stock of progress and priorities for the future
6. Cabinet Office/DTI (2005) Connecting the UK:The digital strategy
7. Craig J. and Greenhill B. (2005) Beyond the Digital Divides? The future for ICT in rural areas.A report for the Commission for Rural Communitiesfrom Demos. Commission for Rural Communities
14CC32EvidenceSect2_AW.qxd 26/9/06 5:02 pm Page 182
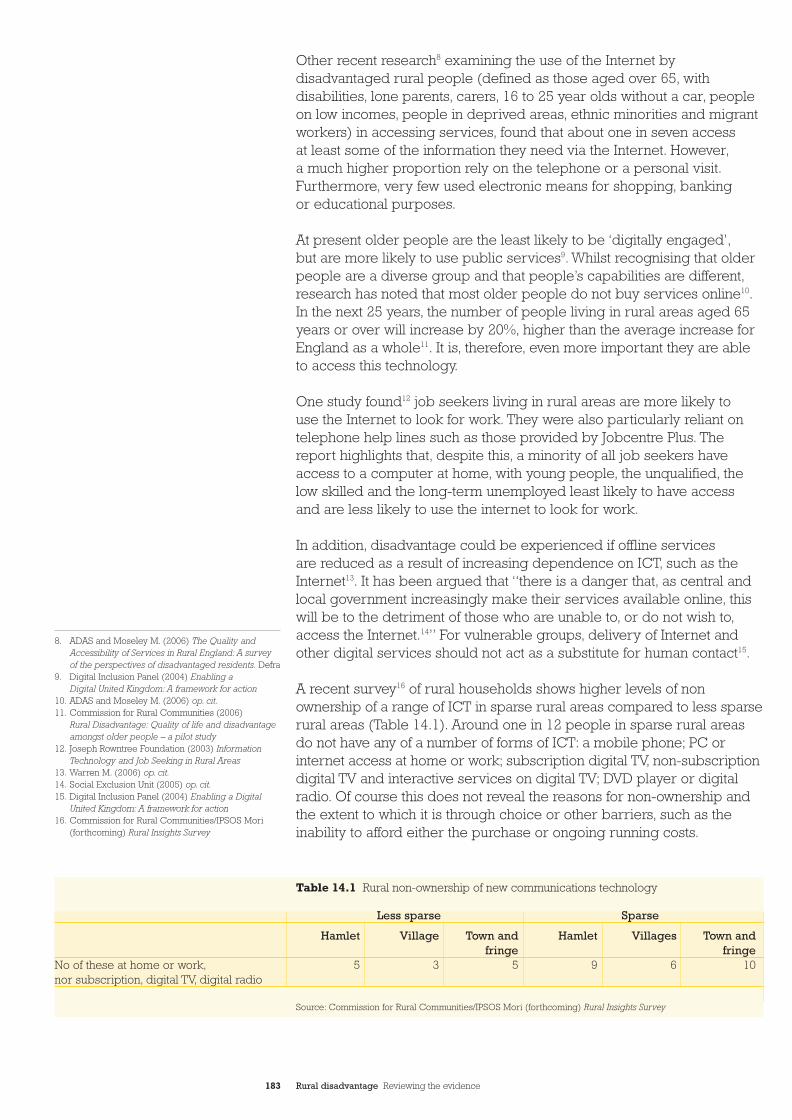
183 Rural disadvantage Reviewing the evidence
Other recent research8 examining the use of the Internet bydisadvantaged rural people (defined as those aged over 65, withdisabilities, lone parents, carers, 16 to 25 year olds without a car, peopleon low incomes, people in deprived areas, ethnic minorities and migrantworkers) in accessing services, found that about one in seven access at least some of the information they need via the Internet. However,a much higher proportion rely on the telephone or a personal visit.Furthermore, very few used electronic means for shopping, banking or educational purposes.
At present older people are the least likely to be ‘digitally engaged’,but are more likely to use public services9. Whilst recognising that olderpeople are a diverse group and that people’s capabilities are different,research has noted that most older people do not buy services online10.In the next 25 years, the number of people living in rural areas aged 65years or over will increase by 20%, higher than the average increase forEngland as a whole11. It is, therefore, even more important they are ableto access this technology.
One study found12 job seekers living in rural areas are more likely touse the Internet to look for work. They were also particularly reliant ontelephone help lines such as those provided by Jobcentre Plus. Thereport highlights that, despite this, a minority of all job seekers haveaccess to a computer at home, with young people, the unqualified, thelow skilled and the long-term unemployed least likely to have access and are less likely to use the internet to look for work.
In addition, disadvantage could be experienced if offline services are reduced as a result of increasing dependence on ICT, such as theInternet13. It has been argued that “there is a danger that, as central andlocal government increasingly make their services available online, thiswill be to the detriment of those who are unable to, or do not wish to,access the Internet.14” For vulnerable groups, delivery of Internet andother digital services should not act as a substitute for human contact15.
A recent survey16 of rural households shows higher levels of nonownership of a range of ICT in sparse rural areas compared to less sparserural areas (Table 14.1). Around one in 12 people in sparse rural areasdo not have any of a number of forms of ICT: a mobile phone; PC orinternet access at home or work; subscription digital TV, non-subscription digital TV and interactive services on digital TV; DVD player or digitalradio. Of course this does not reveal the reasons for non-ownership and the extent to which it is through choice or other barriers, such as the inability to afford either the purchase or ongoing running costs.
Less sparse Sparse
Hamlet Village Town and Hamlet Villages Town andfringe fringe
No of these at home or work, 5 3 5 9 6 10nor subscription, digital TV, digital radio
8. ADAS and Moseley M. (2006) The Quality andAccessibility of Services in Rural England: A surveyof the perspectives of disadvantaged residents. Defra
9. Digital Inclusion Panel (2004) Enabling a Digital United Kingdom: A framework for action
10. ADAS and Moseley M. (2006) op. cit.11. Commission for Rural Communities (2006)
Rural Disadvantage: Quality of life and disadvantageamongst older people – a pilot study
12. Joseph Rowntree Foundation (2003) InformationTechnology and Job Seeking in Rural Areas
13. Warren M. (2006) op. cit.14. Social Exclusion Unit (2005) op. cit.15. Digital Inclusion Panel (2004) Enabling a Digital
United Kingdom: A framework for action16. Commission for Rural Communities/IPSOS Mori
(forthcoming) Rural Insights Survey
Table 14.1 Rural non-ownership of new communications technology
Source: Commission for Rural Communities/IPSOS Mori (forthcoming) Rural Insights Survey
CC32EvidenceSect2_AW.qxd 26/9/06 5:02 pm Page 183
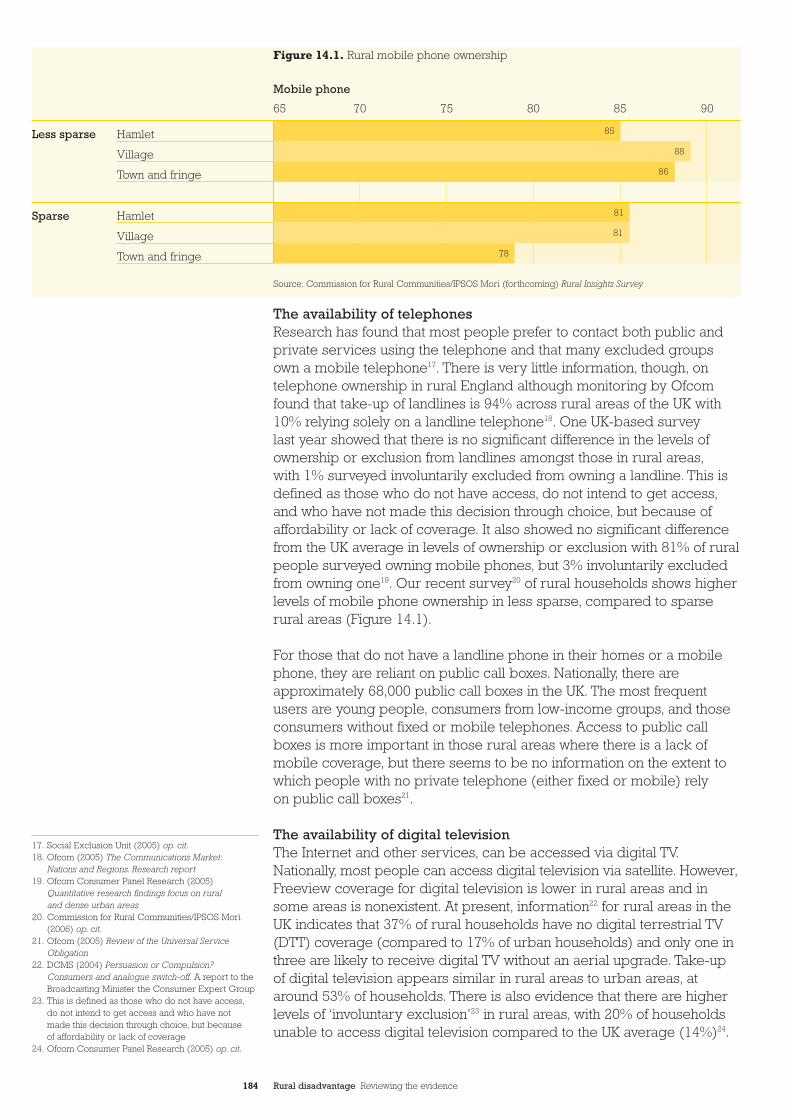
The availability of telephones Research has found that most people prefer to contact both public andprivate services using the telephone and that many excluded groupsown a mobile telephone17. There is very little information, though, ontelephone ownership in rural England although monitoring by Ofcomfound that take-up of landlines is 94% across rural areas of the UK with10% relying solely on a landline telephone18. One UK-based survey last year showed that there is no significant difference in the levels ofownership or exclusion from landlines amongst those in rural areas,with 1% surveyed involuntarily excluded from owning a landline. This isdefined as those who do not have access, do not intend to get access,and who have not made this decision through choice, but because ofaffordability or lack of coverage. It also showed no significant differencefrom the UK average in levels of ownership or exclusion with 81% of ruralpeople surveyed owning mobile phones, but 3% involuntarily excludedfrom owning one19. Our recent survey20 of rural households shows higherlevels of mobile phone ownership in less sparse, compared to sparserural areas (Figure 14.1).
For those that do not have a landline phone in their homes or a mobilephone, they are reliant on public call boxes. Nationally, there areapproximately 68,000 public call boxes in the UK. The most frequentusers are young people, consumers from low-income groups, and thoseconsumers without fixed or mobile telephones. Access to public callboxes is more important in those rural areas where there is a lack ofmobile coverage, but there seems to be no information on the extent towhich people with no private telephone (either fixed or mobile) relyon public call boxes21.
The availability of digital television The Internet and other services, can be accessed via digital TV.Nationally, most people can access digital television via satellite. However,Freeview coverage for digital television is lower in rural areas and insome areas is nonexistent. At present, information22 for rural areas in theUK indicates that 37% of rural households have no digital terrestrial TV(DTT) coverage (compared to 17% of urban households) and only one inthree are likely to receive digital TV without an aerial upgrade. Take-upof digital television appears similar in rural areas to urban areas, ataround 53% of households. There is also evidence that there are higherlevels of ‘involuntary exclusion’23 in rural areas, with 20% of householdsunable to access digital television compared to the UK average (14%)24.
184 Rural disadvantage Reviewing the evidence
Less sparse Hamlet
Village
Town and fringe
Sparse Hamlet
Village
Town and fringe
65 70 75 80 85 90
85
88
86
81
81
78
Mobile phone
Figure 14.1. Rural mobile phone ownership
17. Social Exclusion Unit (2005) op. cit.18. Ofcom (2005) The Communications Market:
Nations and Regions. Research report19. Ofcom Consumer Panel Research (2005)
Quantitative research findings focus on rural and dense urban areas
20. Commission for Rural Communities/IPSOS Mori(2006) op. cit.
21. Ofcom (2005) Review of the Universal ServiceObligation
22. DCMS (2004) Persuasion or Compulsion?Consumers and analogue switch-off. A report to theBroadcasting Minister the Consumer Expert Group
23. This is defined as those who do not have access,do not intend to get access and who have not made this decision through choice, but because of affordability or lack of coverage
24. Ofcom Consumer Panel Research (2005) op. cit.
Source: Commission for Rural Communities/IPSOS Mori (forthcoming) Rural Insights Survey
CC32EvidenceSect2_AW.qxd 26/9/06 5:02 pm Page 184
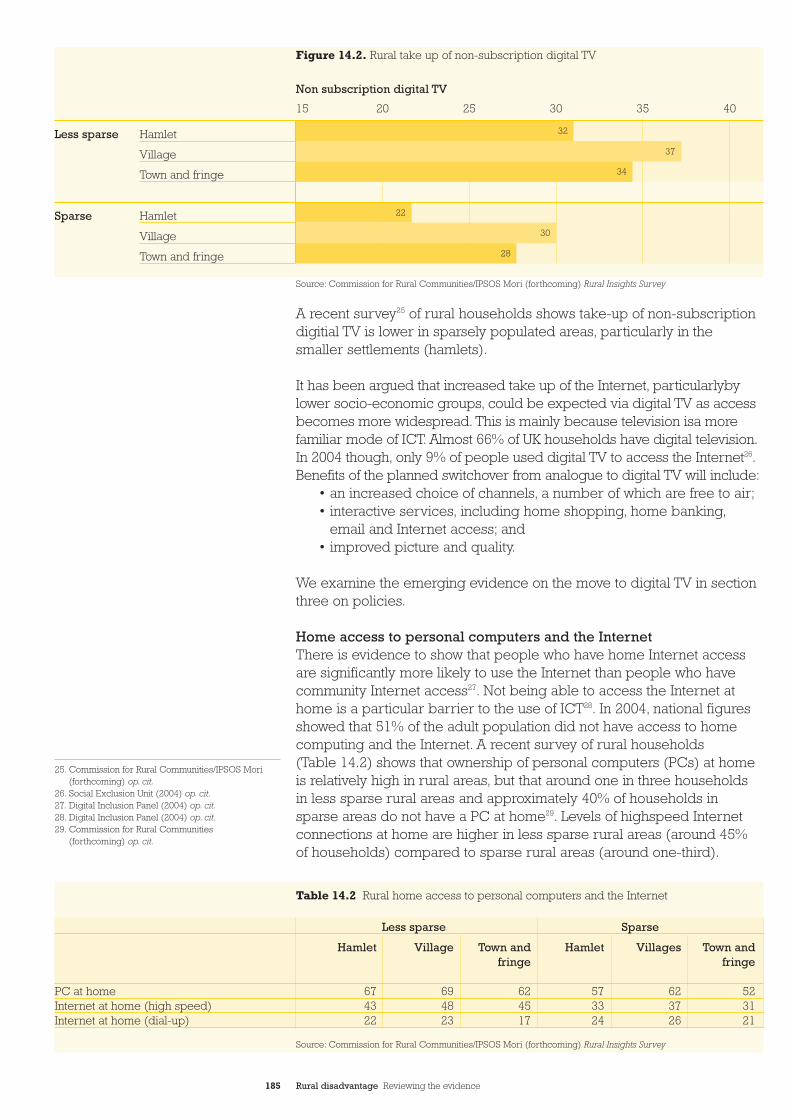
Less sparse Sparse
Hamlet Village Town and Hamlet Villages Town andfringe fringe
PC at home 67 69 62 57 62 52Internet at home (high speed) 43 48 45 33 37 31Internet at home (dial-up) 22 23 17 24 26 21
185 Rural disadvantage Reviewing the evidence
A recent survey25 of rural households shows take-up of non-subscriptiondigitial TV is lower in sparsely populated areas, particularly in thesmaller settlements (hamlets).
It has been argued that increased take up of the Internet, particularlybylower socio-economic groups, could be expected via digital TV as accessbecomes more widespread. This is mainly because television isa morefamiliar mode of ICT. Almost 66% of UK households have digital television.In 2004 though, only 9% of people used digital TV to access the Internet26.Benefits of the planned switchover from analogue to digital TV will include:
• an increased choice of channels, a number of which are free to air;• interactive services, including home shopping, home banking,
email and Internet access; and• improved picture and quality.
We examine the emerging evidence on the move to digital TV in sectionthree on policies.
Home access to personal computers and the InternetThere is evidence to show that people who have home Internet accessare significantly more likely to use the Internet than people who havecommunity Internet access27. Not being able to access the Internet athome is a particular barrier to the use of ICT28. In 2004, national figuresshowed that 51% of the adult population did not have access to homecomputing and the Internet. A recent survey of rural households (Table 14.2) shows that ownership of personal computers (PCs) at homeis relatively high in rural areas, but that around one in three householdsin less sparse rural areas and approximately 40% of households insparse areas do not have a PC at home29. Levels of highspeed Internetconnections at home are higher in less sparse rural areas (around 45% of households) compared to sparse rural areas (around one-third).
Less sparse Hamlet
Village
Town and fringe
Sparse Hamlet
Village
Town and fringe
15 20 25 30 35 40
32
37
34
22
30
28
Non subscription digital TV
Figure 14.2. Rural take up of non-subscription digital TV
25. Commission for Rural Communities/IPSOS Mori(forthcoming) op. cit.
26. Social Exclusion Unit (2004) op. cit.27. Digital Inclusion Panel (2004) op. cit.28. Digital Inclusion Panel (2004) op. cit.29. Commission for Rural Communities
(forthcoming) op. cit.
Table 14.2 Rural home access to personal computers and the Internet
Source: Commission for Rural Communities/IPSOS Mori (forthcoming) Rural Insights Survey
Source: Commission for Rural Communities/IPSOS Mori (forthcoming) Rural Insights Survey
CC32EvidenceSect2_AW.qxd 26/9/06 5:02 pm Page 185
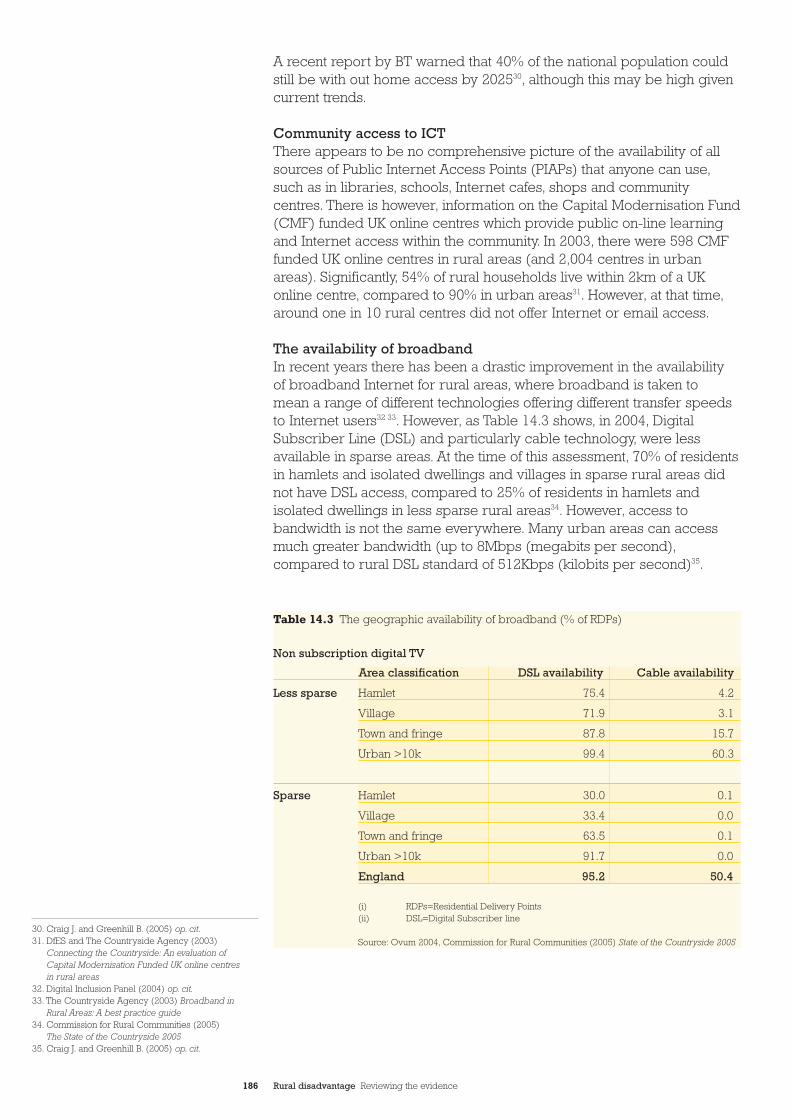
186 Rural disadvantage Reviewing the evidence
A recent report by BT warned that 40% of the national population couldstill be with out home access by 202530, although this may be high givencurrent trends.
Community access to ICTThere appears to be no comprehensive picture of the availability of allsources of Public Internet Access Points (PIAPs) that anyone can use,such as in libraries, schools, Internet cafes, shops and communitycentres. There is however, information on the Capital Modernisation Fund(CMF) funded UK online centres which provide public on-line learningand Internet access within the community. In 2003, there were 598 CMFfunded UK online centres in rural areas (and 2,004 centres in urbanareas). Significantly, 54% of rural households live within 2km of a UKonline centre, compared to 90% in urban areas31. However, at that time,around one in 10 rural centres did not offer Internet or email access.
The availability of broadbandIn recent years there has been a drastic improvement in the availabilityof broadband Internet for rural areas, where broadband is taken tomean a range of different technologies offering different transfer speedsto Internet users32 33. However, as Table 14.3 shows, in 2004, DigitalSubscriber Line (DSL) and particularly cable technology, were lessavailable in sparse areas. At the time of this assessment, 70% of residentsin hamlets and isolated dwellings and villages in sparse rural areas didnot have DSL access, compared to 25% of residents in hamlets andisolated dwellings in less sparse rural areas34. However, access tobandwidth is not the same everywhere. Many urban areas can accessmuch greater bandwidth (up to 8Mbps (megabits per second),compared to rural DSL standard of 512Kbps (kilobits per second)35.
Sparse Hamlet 30.0 0.1
Village 33.4 0.0
Town and fringe 63.5 0.1
Urban >10k 91.7 0.0
England 95.2 50.4
Area classification DSL availability Cable availability
Less sparse Hamlet 75.4 4.2
Village 71.9 3.1
Town and fringe 87.8 15.7
Urban >10k 99.4 60.3
Non subscription digital TV
Table 14.3 The geographic availability of broadband (% of RDPs)
(i) RDPs=Residential Delivery Points(ii) DSL=Digital Subscriber line
Source: Ovum 2004, Commission for Rural Communities (2005) State of the Countryside 2005
30. Craig J. and Greenhill B. (2005) op. cit.31. DfES and The Countryside Agency (2003)
Connecting the Countryside: An evaluation of Capital Modernisation Funded UK online centres in rural areas
32. Digital Inclusion Panel (2004) op. cit.33. The Countryside Agency (2003) Broadband in
Rural Areas: A best practice guide34. Commission for Rural Communities (2005)
The State of the Countryside 200535. Craig J. and Greenhill B. (2005) op. cit.
CC32EvidenceSect2_AW.qxd 26/9/06 5:02 pm Page 186
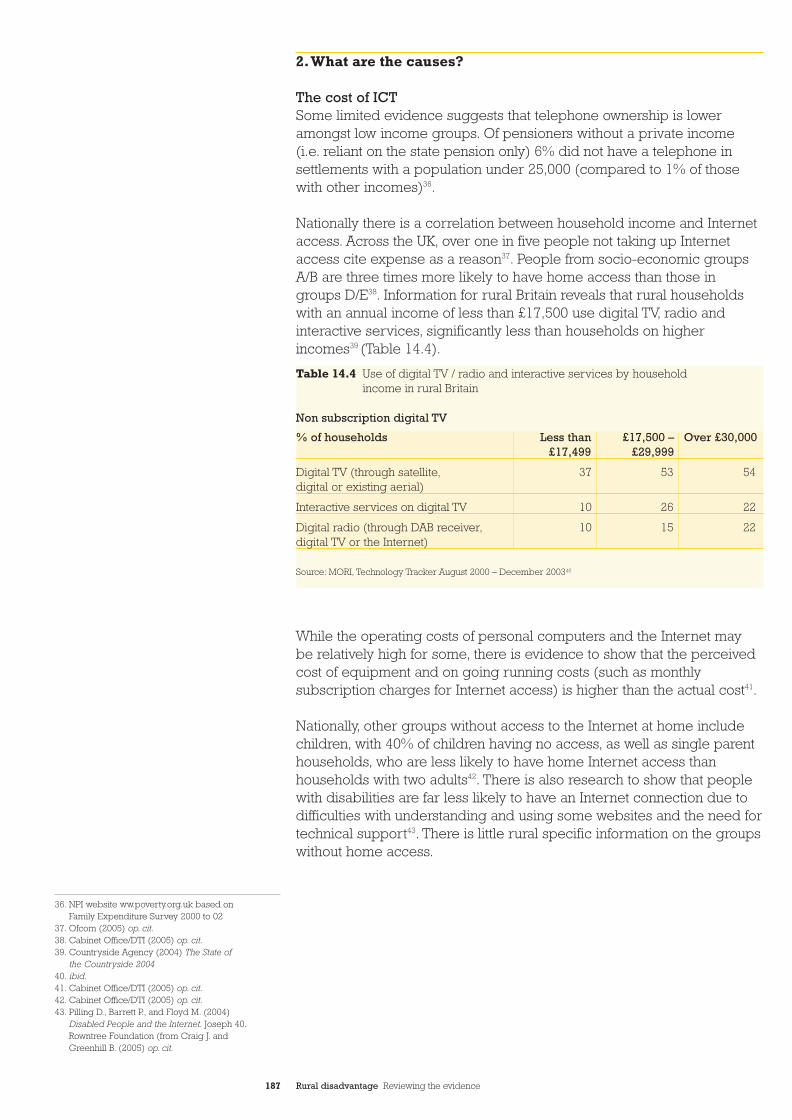
187 Rural disadvantage Reviewing the evidence
2.What are the causes?
The cost of ICT Some limited evidence suggests that telephone ownership is loweramongst low income groups. Of pensioners without a private income(i.e. reliant on the state pension only) 6% did not have a telephone insettlements with a population under 25,000 (compared to 1% of thosewith other incomes)36.
Nationally there is a correlation between household income and Internetaccess. Across the UK, over one in five people not taking up Internetaccess cite expense as a reason37. People from socio-economic groupsA/B are three times more likely to have home access than those ingroups D/E38. Information for rural Britain reveals that rural householdswith an annual income of less than £17,500 use digital TV, radio andinteractive services, significantly less than households on higherincomes39 (Table 14.4).
While the operating costs of personal computers and the Internet maybe relatively high for some, there is evidence to show that the perceivedcost of equipment and on going running costs (such as monthlysubscription charges for Internet access) is higher than the actual cost41.
Nationally, other groups without access to the Internet at home includechildren, with 40% of children having no access, as well as single parenthouseholds, who are less likely to have home Internet access thanhouseholds with two adults42. There is also research to show that peoplewith disabilities are far less likely to have an Internet connection due todifficulties with understanding and using some websites and the need fortechnical support43. There is little rural specific information on the groupswithout home access.
% of households Less than £17,500 – Over £30,000£17,499 £29,999
Digital TV (through satellite, 37 53 54digital or existing aerial)
Interactive services on digital TV 10 26 22
Digital radio (through DAB receiver, 10 15 22digital TV or the Internet)
Non subscription digital TV
Table 14.4 Use of digital TV / radio and interactive services by householdincome in rural Britain
Source: MORI, Technology Tracker August 2000 – December 200340
36. NPI website ww.poverty.org.uk based on Family Expenditure Survey 2000 to 02
37. Ofcom (2005) op. cit.38. Cabinet Office/DTI (2005) op. cit.39. Countryside Agency (2004) The State of
the Countryside 200440. ibid.41. Cabinet Office/DTI (2005) op. cit.42. Cabinet Office/DTI (2005) op. cit.43. Pilling D., Barrett P., and Floyd M. (2004)
Disabled People and the Internet. Joseph 40.Rowntree Foundation (from Craig J. and Greenhill B. (2005) op. cit.
CC32EvidenceSect2_AW.qxd 26/9/06 5:02 pm Page 187
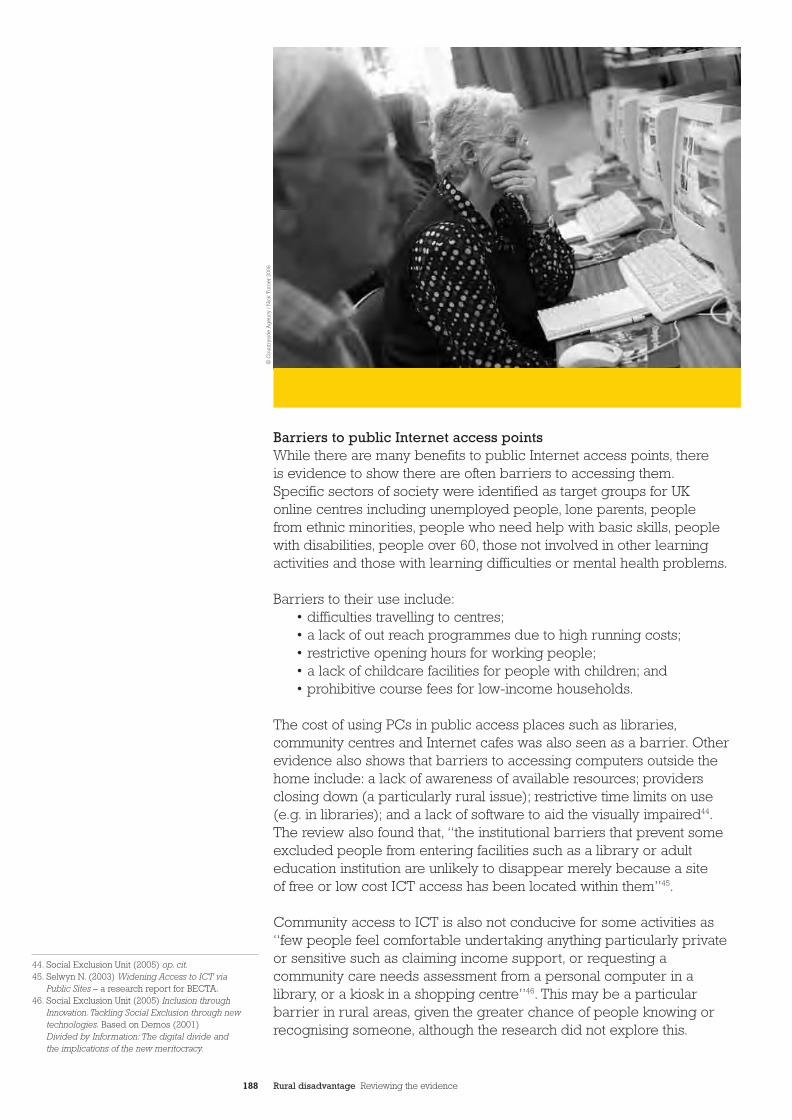
188 Rural disadvantage Reviewing the evidence
Barriers to public Internet access pointsWhile there are many benefits to public Internet access points, thereis evidence to show there are often barriers to accessing them.Specific sectors of society were identified as target groups for UK online centres including unemployed people, lone parents, people from ethnic minorities, people who need help with basic skills, peoplewith disabilities, people over 60, those not involved in other learningactivities and those with learning difficulties or mental health problems.
Barriers to their use include:• difficulties travelling to centres;• a lack of out reach programmes due to high running costs;• restrictive opening hours for working people;• a lack of childcare facilities for people with children; and• prohibitive course fees for low-income households.
The cost of using PCs in public access places such as libraries,community centres and Internet cafes was also seen as a barrier. Otherevidence also shows that barriers to accessing computers outside thehome include: a lack of awareness of available resources; providersclosing down (a particularly rural issue); restrictive time limits on use(e.g. in libraries); and a lack of software to aid the visually impaired44.The review also found that, “the institutional barriers that prevent someexcluded people from entering facilities such as a library or adulteducation institution are unlikely to disappear merely because a siteof free or low cost ICT access has been located within them”45.
Community access to ICT is also not conducive for some activities as“few people feel comfortable undertaking anything particularly privateor sensitive such as claiming income support, or requesting acommunity care needs assessment from a personal computer in alibrary, or a kiosk in a shopping centre”46. This may be a particularbarrier in rural areas, given the greater chance of people knowing orrecognising someone, although the research did not explore this.
44. Social Exclusion Unit (2005) op. cit.45. Selwyn N. (2003) Widening Access to ICT via
Public Sites – a research report for BECTA.46. Social Exclusion Unit (2005) Inclusion through
Innovation. Tackling Social Exclusion through newtechnologies. Based on Demos (2001) Divided by Information: The digital divide and the implications of the new meritocracy.
© C
ount
rysi
de
Ag
ency
/ N
ick
Tur
ner
2006
CC32EvidenceSect2_AW.qxd 26/9/06 5:02 pm Page 188
189 Rural disadvantage Reviewing the evidence
Motivation, skills and knowledge Evaluation of the UK online centres found that interest and motivation areby far the biggest barriers to accessing ICT47. In addition, most peoplewho suffer social exclusion need to be convinced that the content of theInternet is relevant to them48. However, there is evidence to show fromtrials carried out in disadvantaged areas that perceptions of ICT changeonce people start to use the technology.
People with skills and knowledge will be better equipped to be able toaccess online services, information and resources.49 The education andtraining chapter of this report has highlighted the issues of poor skills inrural areas. Nationally, 79 % of people receiving means-tested benefitslack practical ICT skills, with 33% of non-Internet users lacking theknowledge and confidence to use the Internet50.
It has been suggested that barriers to accessing ICT are increasinglyless likely to be about access and more likely to be about the use towhich technology is put. There is evidence to show lack of relevantcontent on the web is a particular barrier to use of the Internet bydisadvantaged groups51 – in other words, a lack of suitable content tomotivate people to use the Internet. The digital strategy found, “contentis critical. Most people who suffer social exclusion have yet to beconvinced that there is content relevant to them. Driven by the market,the Internet is full of content aimed at affluent consumers targeted at themiddle income groups”. In addition, some people have concerns aboutthe security of their information online52.
Research53 has also found that ‘preliminary needs’ are a barrier to theuse of ICT. These needs these would have to be addressed before somegroups could consider accessing and using ICT. These include,for example:
• Low levels of literacy, especially for Gypsies and Travellers;• Poor English language skills, affecting asylum seekers
and refugees;• Obtaining leave to remain in the UK asylum seekers and
refugees; and• Obtaining housing and employment, particularly for
homeless people.
Barriers to accessing digital TVSeveral barriers to accessing digital TV and the future digital switchover have been identified for rural areas54:
• cost: people living in rural areas are likely to incur costs such asaerial upgrades in order to receive digital TV services(31% rural compared to 25% urban);
• topographical factors: these can affect reception; and • isolation: isolated rural communities at present, are less likely
to receive digital TV until switch over has taken placeand access to information, advice and support is also likely to be limited.
47. Wyatt J. et. al.(2003) Evaluation of CMF Funded UK online centres – Final report
48. Cabinet Office/DTI (2005) op. cit.49. Social Exclusion Unit (2004) op. cit.50. Social Exclusion Unit (2005) op. cit.51. Social Exclusion Unit (2005) op. cit.52. Social Exclusion Unit (2005) op. cit.53 Social Exclusion Unit (2005) op. cit.54. DCMS (2004) op. cit.
CC32EvidenceSect2_AW.qxd 26/9/06 5:02 pm Page 189
190 Rural disadvantage Reviewing the evidence
3.What are the policies?
There are a number of policies and initiatives to promote theunderstanding and take-up of ICT, and the provision of services throughICT. We focus here on policies most relevant for rural areas – those thataim to improve the provision of access for individuals to PCs and theInternet through public access points; the availability of broadband; andaccess to Digital TV. We do not cover the wide range of policies that aredesigned to improve the delivery of e-services, improve Internet contentand address security concerns.
Access to PCs and the Internet through public access points
Capital Modernisation Funded (CMF) UK online centresUK online centres provide public PC and Internet access, at no or lowcost, in a range of community centres. Over half of these venues arelocated in the 2,000 most deprived wards. There are approximately6,000 UK online centres across England. Most of the centres were setup between 1999 and 2002 and were mainly funded by the Big LotteryFund and Capital Modernisation Fund. From April 2003,responsibility foradministration and development of UK online centres passed to Ufi Ltd.A national evaluation of the UK online centres found that: three-quartersof users were digitally excluded; almost all said their confidence hadincreased; and half of users who had used the centre for six months wentonto learning that earned them a certificate55.
An evaluation56 of the CMF UK online centres in rural areas waspublished in 2003. It found that:
• rural centres play a broader role in the community than providinga purely ICT resource;
• a great deal of emphasis is placed on providing outreach servicesand tailored courses to reach the most socially excluded groupswithin rural communities;
• rural centres have lower levels of accessibility than urban centres;• rural centres have restricted access to broadband;• the future sustainability of many rural UK online centres is uncertain.
They are more vulnerable than most urban centres due to the highunit cost of delivery, poor accessibility and poor broadbandconnectivity; and
• the majority of rural centres are managed by non- profit makingorganisation where there is a high reliance on volunteer and part-time staff to manage the centres and provide support and trainingto users.
A recent major review57 of ICT and social exclusion highlighted thesuccess of the UK online programme in reaching a broad range ofsocially excluded groups, but also found that it had more limited successin engaging ‘hard to reach’ groups.
55. Hall Aitken (2002) Evaluation of CMF Funded UK online centres - final report.
56. DfES and the Countryside Agency (2003) op. cit.57. Social Exclusion Unit (2005) op. cit.
CC32EvidenceSect2_AW.qxd 26/9/06 5:02 pm Page 190
191 Rural disadvantage Reviewing the evidence
Public librariesModern libraries are to provide access to digital skills and servicesincluding e-government. The lottery funded People’s Networkprogramme aimed to put computers with fast internet access into everypublic library. Positive action has been taken to ensure rural areas werenot disadvantaged. The Countryside Agency, DTI and MuseumsLibraries and Archives Council funded a pilot scheme turning ten smallrural libraries into Wi-Fi hotspots, some of which offer around the clockinternet access.
An evaluation of the People’s Network58 found that two years after thelaunch of the People’s Network, the goal had “been very largelyachieved. A citizen anywhere in the UK can now go to any public libraryservice point and be confident of gaining access to the internet,available free, or at low cost. Even small rural communities are beingreached through mobile phones using wireless networking, to provideinternet access”.
Availability of broadband
Promoting Broadband StrategyThe UK-online: the broadband future strategy was published in 2001,which set out a target for the UK to have the most competitive andextensive broadband market in the G7 by 2005. The Digital strategystated that by summer 2005 over 99% of the population would have abasic 512Kbps (kilobits per second) broadband service available59.As a result, there has been a range of activities to ensure broadband isavailable to all communities and this has been a fast developing area,with significant progress being made. Whilst the broadband target hasgenerally been met, many sparsely populated areas still have a patchyservice, as evidenced above. It seems, however, that rural areas havebeen the last to benefit from the provision of broadband services.
The Broadband Stakeholder Group (BSG) examined broadband in ruralareas60 in 2003 and found that “significant barriers exist to the extensionof mass-market broadband coverage to rural areas”. They found that,“taking broadband to the last 10% of communities will require concertedaction on the part of both the public and private sector”.
Similarly, in 2003 an inquiry61 to investigate the steps taken by Defra toensure that broadband was being provided in rural areas wasundertaken. In particular it considered:
• the demand for broadband in rural communities;• existing and planned provision;• obstacles to the provision of broadband in rural areas;• the roles are played by public agencies in dealing with broadband;
and • what alternatives to broadband exist or are being developed that
might be of particular relevance to rural areas.
58. Sommerland E., Child C., Ramsden C. and Kelleher(2004) Books and Bytes: New service paradigms forthe 21sr century library. An evaluation of the People’sNetwork and ICT training for Public Library Staffprogramme. A report by The Tavistock Institute for the Big Lottery Fund. See also Big Lottery Fund(2004) The People’s Network: evaluation summary.Big Lottery Fund Research Issue No.7
59. Cabinet Office/DTI (2005) op. cit.60. BSG (2003) The Impact of Public Sector
Interventions on Broadband in Rural Areas61. House of Commons Environment, Food and
Rural Affairs Committee (2003) Rural Broadband.Eleventh Report of Session 2002-03. HC 587
CC32EvidenceSect2_AW.qxd 26/9/06 5:02 pm Page 191
192 Rural disadvantage Reviewing the evidence
It noted that progress had been slower in rural areas allowing a ‘digitaldivide’ to open up between urban and rural areas. The inquiry made anumber of recommendations, including the setting of trigger levels forall exchanges and the setting up of Government online servicesparticularly directed at rural communities. Additionally, it recommendedthat Government identify remote rural areas where the provision ofbroadband cannot be left to the market place and where interventionis needed.
The Government responded to this report, setting out how it would meetthe recommendations62. A Rural Broadband Unit operated from May 2003to 2005 specifically to bring together DTI, Defra and RDA thinking toaddress the emerging gap between broadband provision in urban andrural communities. In 2004, a new programme of activity to accelerate the development of the next generation broadband was announced,which focused on eliminating the remaining barriers to the adoption ofbroadband-enabled technology and services by consumers, enterprisesand the public sector. A UK Broadband Fund was established by DTI tohelp RDAs and devolved administrations stimulate supply and demand for broadband in rural areas. In 2004 BT announced its intention to extendbroadband access to 99.6% of the UK population by the end of 2005.
More recent research has suggested that, “there is a prospect of a newdigital divide emerging between rural and urban areas with the adventof the next generation broadband and 3G services”63. Although thisresearch focused on broadband and its availability and use bybusinesses in rural areas, many of the concerns expressed might alsoextend more generally to the wider rural population. Other research hasalso suggested that “new dimensions of the digital divide are emerging,most obviously in terms of bandwidth”64.
62. ibid.63. SQW (2005) ICT in England’s Rural Economies.
A Final Report to Defra 64. Craig J. and Greenhill B. (2005) op. cit.
© C
ount
rysi
de
Ag
ency
/ N
ick
Tur
ner
2006
CC32EvidenceSect2_AW.qxd 26/9/06 5:02 pm Page 192
193 Rural disadvantage Reviewing the evidence
Access to digital TV
The Digital Switchover ProgrammeThe Digital Switchover is the process of changing over the UK’s televisionsignal from analogue to digital. The Government is committed to:
• achieving digital switchover between 2008 and 2012 ensuringuniversal access;
• digital versions of the public service channels via a choice of digitalplatforms;
• ensuring the interests of elderly people and other vulnerablegroups are protected; and
• clearing fourteen frequency channels for reuse.
A number of groups have been identified65 which could potentially facebarriers in the digital switch over. These include low-income groups,older and disabled people and there is a notable evidence gapidentifying the needs and concerns of rural consumers. Isolated ruralcommunities could be disadvantaged as they are likely to receive digitaltelevision reception through a non-satellite broadcast until the digitalswitchover takes place. Access to information, advice and support about the digital switchover may also be a rural issue.
It has been estimated that the digital switchover could cost the averagehousehold between £80 and £570. Particular groups, such as olderpeople and those with disabilities, need more help with the digital switchover including financial and practical support66. It has also been reported that 38% of adults in the UK did not know about thegovernment’s intention to switch off the analogue television signal67.A national campaign to raise awareness about the digital switchover was launched in May 200668.65. DCMS (2004) op. cit.
66. http://news.bbc.co.uk/1/hi/enterainment/4854342.stm
67. http://news.bbc.co.uk/1/hi/entertainment/4880788.stm
68. http://news.bbc.co.uk/1/hi/entertainment/4973962.stm
© C
ount
rysi
de
Ag
ency
/ N
ick
Tur
ner
2006
CC32EvidenceSect2_AW.qxd 26/9/06 5:02 pm Page 193
194 Rural disadvantage Reviewing the evidence
Access to telephones
Universal Service ObligationsA Universal Service Obligation (USO) ensures that basic fixed line(telephone) services are available at a standard price to all citizens andconsumers across the UK. In particular it provides services to helpvulnerable customers, as well as those in remote and rural areas who themarket might not otherwise choose to serve. As 99% of the populationnow have access to telephony services, the USO focuses on bringingbenefits to those on low incomes who find it difficult to afford telephonyservices (achieved through special tariff schemes for customers on lowincomes), customers with disabilities and those in rural areas for whomthe service cost might otherwise be prohibitively expensive. It includes,for example, a measure to ensure that the last public call box in an areacannot be removed if a local council objects – the ‘local veto’. In 2005,the regulator, Ofcom, carried out a review of the Universal ServiceObligation to ensure it continues to meet the needs of consumers69.
Addressing digital inclusion
Digital Inclusion PanelIn 2004 the Government established the digital inclusion panel to assessthe extent of the digital challenge, including members from the public,private and voluntary sectors. It aims to:
• identify groups most at risk of digital exclusion;• identify future actions that might encourage digital take-up; and • make recommendations about how industry, government and the
voluntary sector can work together to drive a digital United Kingdom.
It made a number of recommendations to address digital exclusion70,though there were none specific to rural areas.
Connecting the UK: the Digital Strategy 2005This strategy includes seven actions to ensure that everyone experiencesthe benefits of ICT. Actions include a wide range of activities, such asimproving learning with ICT through an e-strategy71, which focuses onthe use of technology to inform and advise citizens particularly children,young people and adult learners. However, most relevant is the aim ofimproving accessibility to technology for the digitally excluded. Thisfocuses public sector investment on communal internet access points in schools and online centres with a focus on hard to reach groups(building on the work of UK online centres). In addition, the strategyhighlights the importance of ICT training and makes a commitmentto ensure every adult who enrols on a basic skills course is given anemail account.
69. Ofcom (2005) op. cit.70. Cabinet Office/DTI (2005) op. cit.71. http://www.dfes.gov.uk/publications/e-strategy/
CC32EvidenceSect2_AW.qxd 26/9/06 5:02 pm Page 194
195 Rural disadvantage Reviewing the evidence
There is also a review proposed of the home computing initiative, whichallows individuals, through their employers, to have the use of a personalcomputer up to the value of £2,500 per annum as a tax free benefit72.The Low Pay Commission is to explore that those on the minimumwage are also eligible for this benefit.
The Strategy particularly highlights the work of the CommunityBroadband Network. This was launched in 2004 and is a co-operativeof local small-scale independent broadband operators, aiming toencourage and support the provision of broadband as an alternativeto large, national providers. More than 550 locations in the UK (many ofwhich are rural) have had services provided in this way.
Policy is now moving to stimulating take-up and use of ICT. It is too earlyyet for the impact of the strategy to be evaluated, but a commitment toreview the digital divide in 2008 was included in the Digital Strategyitself. In particular, Ofcom is tasked with monitoring take-up of homebroadband amongst different social groups and ages.
4. Summary
• For vulnerable groups delivery of Internet and other digitalservices should not act as a substitute for human contact as itcould lead to further isolation
• Considering the benefits of online communication, not using ICT inrural areas may well have a greater impact than in urban areasdue to certain barriers presented by rural areas such as distance,low incomes, social isolation
• With the continuing improvements to technology and newtechnologies it is important that rural areas don't get left behind
• There is evidence of higher levels of involuntary exclusion forrural areas (20%) for digital TV compared to the UK average(14%). 37% of rural households have no coverage at presentcompared to 17% of urban areas.
72. http://www.ukhomecomputing.co.uk
CC32EvidenceSect2_AW.qxd 26/9/06 5:02 pm Page 195
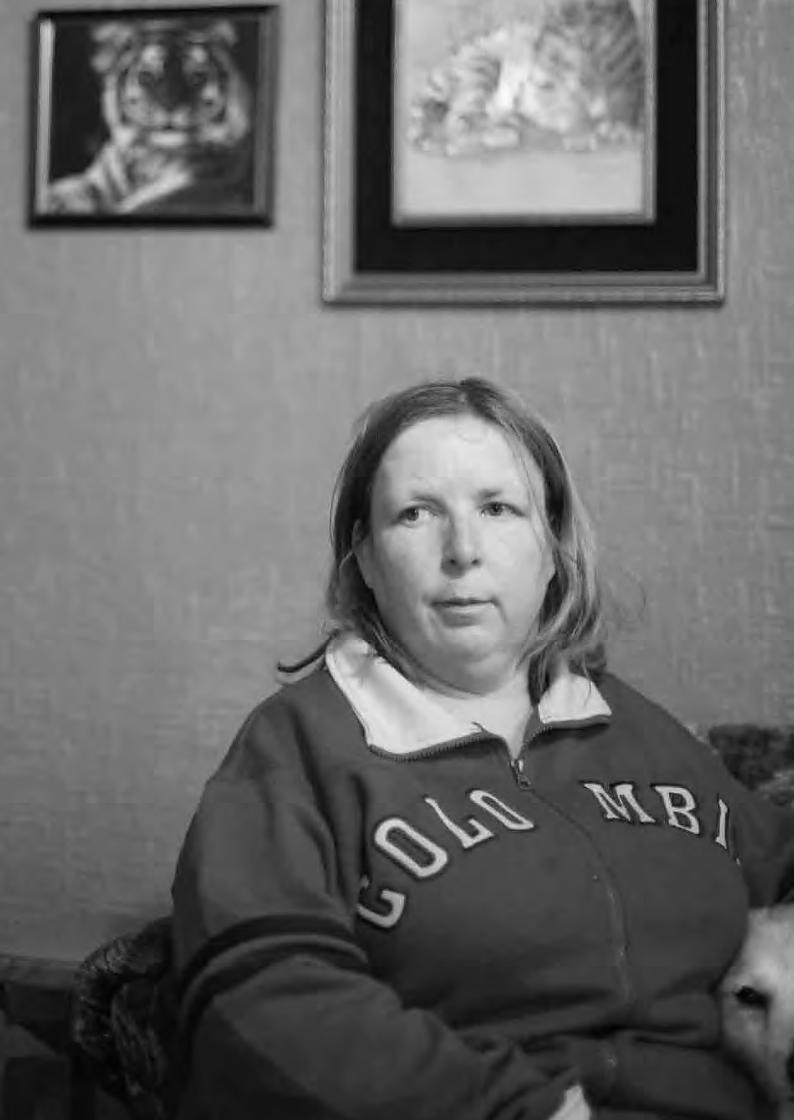
CC32EvidenceSect3_AW 26/9/06 5:03 pm Page 196
Rural disadvantage Reviewing the evidence
Attitudesto ruraldisadvantage
197
CC32EvidenceSect3_AW 26/9/06 5:03 pm Page 197
This section explores attitudes to rural disadvantage.It examines how culture and values impact on theexperience of disadvantage in rural areas. New data is included on the recognition of, and attitudes to,disadvantage in rural areas from a new nationallyrepresentative survey of rural communitiescommissioned by the Commission for RuralCommunities. A good understanding of public attitudes is important because policy makers oftenconsider public views, consult communities or evenempower them. Attitudes might have to change before policy changes can be made. They are alsoimportant because they are likely to shape the extent of change that is possible. For example, the anti-development attitude of what have been called‘NIMBYs’ has arguably contributed to a lack ofaffordable housing in rural areas.
Under the theme of “policy makers attitudes” we alsoexplore briefly how general policy responses andapproaches are often based on implicit attitudes andperceptions of disadvantage and how these reflectrural disadvantage.
Rural culture
Research in earlier chapters has highlighted how a range of rural culturalfactors, or attitudes, such as the need for self-reliance, coping traditions,traditional values, pride and stigma, can lead to disadvantaged peoplenot wishing to draw attention to themselves, due to fear of marginalisationand alienation. This leads to the hidden nature of much disadvantage andthe under reporting of the extent and nature of problems. In addition,rural culture and attitudes, including the perception of the ‘rural idyll’,can also lead to non-disadvantaged people (and policy makers) denyingthe existence of disadvantage and exacerbating the experience ofdisadvantage. Some of the research on rural attitudes is now quite old and examines rural lifestyles in general rather than specificdisadvantage1, or is drawn from elsewhere such as rural Scotland2.Some are ethnographic accounts providing case study material3.
Much of this previous work has, in particular, drawn attention to thedifference in subjective assessments by people in rural areas andobjective standards drawn up by others. Indeed, some see disadvantageas an aspect of rural life rather than a particular problem. It is unclear the extent to which views are influenced by rural culture, rural featuressuch as the greater visibility of taking up support, or people’s own life histories.
1. Cloke P. et.al. (1994) Lifestyles in Rural England.Rural Development Commission (RDC) reportnumber 18
2. Shucksmith M. et. al. (1996) Disadvantage in RuralAreas. Rural Development Commission reportnumber 29
3. For example, some limited case study material was published by the Countryside Agency in(2000) Not seen, not heard
15
198 Rural disadvantage Reviewing the evidence
CC32EvidenceSect3_AW 26/9/06 5:03 pm Page 198
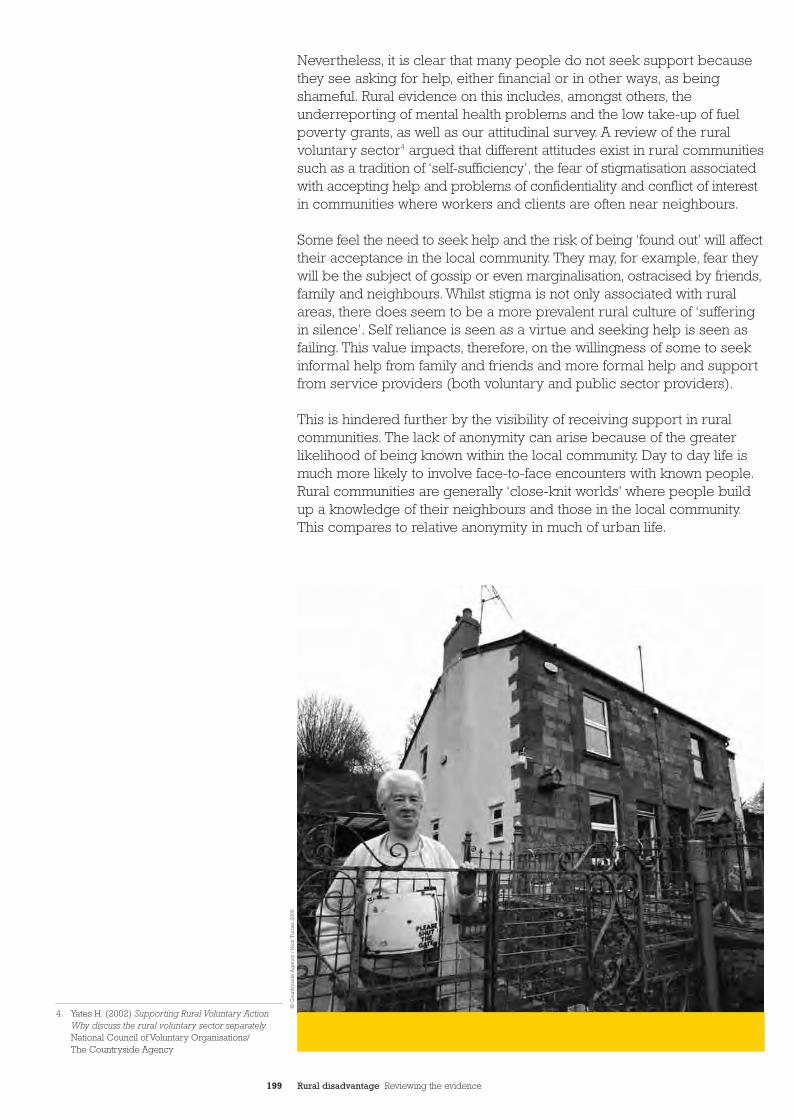
199 Rural disadvantage Reviewing the evidence
Nevertheless, it is clear that many people do not seek support becausethey see asking for help, either financial or in other ways, as beingshameful. Rural evidence on this includes, amongst others, theunderreporting of mental health problems and the low take-up of fuelpoverty grants, as well as our attitudinal survey. A review of the ruralvoluntary sector4 argued that different attitudes exist in rural communitiessuch as a tradition of ‘self-sufficiency’, the fear of stigmatisation associatedwith accepting help and problems of confidentiality and conflict of interestin communities where workers and clients are often near neighbours.
Some feel the need to seek help and the risk of being ‘found out’ will affecttheir acceptance in the local community. They may, for example, fear theywill be the subject of gossip or even marginalisation, ostracised by friends,family and neighbours. Whilst stigma is not only associated with ruralareas, there does seem to be a more prevalent rural culture of ‘sufferingin silence’. Self reliance is seen as a virtue and seeking help is seen asfailing. This value impacts, therefore, on the willingness of some to seekinformal help from family and friends and more formal help and supportfrom service providers (both voluntary and public sector providers).
This is hindered further by the visibility of receiving support in ruralcommunities. The lack of anonymity can arise because of the greaterlikelihood of being known within the local community. Day to day life ismuch more likely to involve face-to-face encounters with known people.Rural communities are generally ‘close-knit worlds’ where people buildup a knowledge of their neighbours and those in the local community.This compares to relative anonymity in much of urban life.
4. Yates H. (2002) Supporting Rural Voluntary ActionWhy discuss the rural voluntary sector separately.National Council of Voluntary Organisations/ The Countryside Agency
© C
ount
rysi
de
Ag
ency
/ N
ick
Tur
ner
2006
CC32EvidenceSect3_AW 26/9/06 5:03 pm Page 199
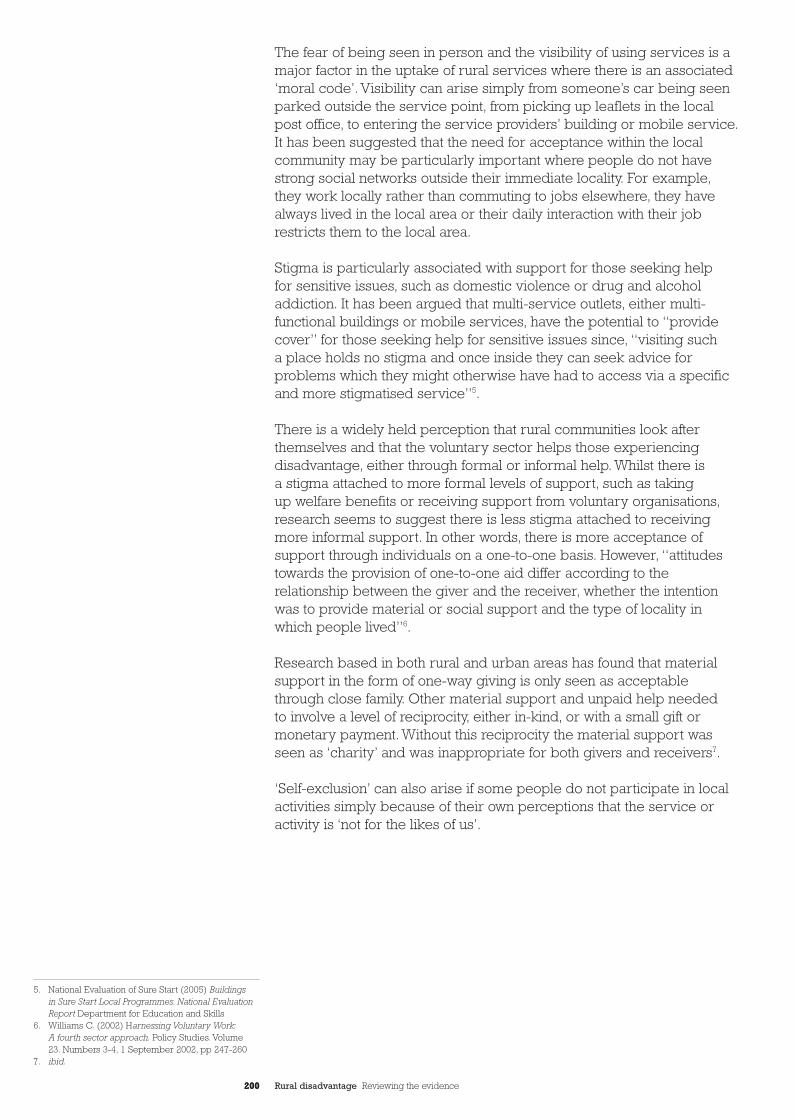
200 Rural disadvantage Reviewing the evidence
The fear of being seen in person and the visibility of using services is amajor factor in the uptake of rural services where there is an associated‘moral code’. Visibility can arise simply from someone’s car being seenparked outside the service point, from picking up leaflets in the localpost office, to entering the service providers’ building or mobile service.It has been suggested that the need for acceptance within the localcommunity may be particularly important where people do not havestrong social networks outside their immediate locality. For example,they work locally rather than commuting to jobs elsewhere, they havealways lived in the local area or their daily interaction with their jobrestricts them to the local area.
Stigma is particularly associated with support for those seeking help for sensitive issues, such as domestic violence or drug and alcoholaddiction. It has been argued that multi-service outlets, either multi-functional buildings or mobile services, have the potential to “providecover” for those seeking help for sensitive issues since, “visiting such a place holds no stigma and once inside they can seek advice forproblems which they might otherwise have had to access via a specificand more stigmatised service”5.
There is a widely held perception that rural communities look afterthemselves and that the voluntary sector helps those experiencingdisadvantage, either through formal or informal help. Whilst there is a stigma attached to more formal levels of support, such as taking up welfare benefits or receiving support from voluntary organisations,research seems to suggest there is less stigma attached to receivingmore informal support. In other words, there is more acceptance ofsupport through individuals on a one-to-one basis. However, “attitudestowards the provision of one-to-one aid differ according to therelationship between the giver and the receiver, whether the intentionwas to provide material or social support and the type of locality inwhich people lived”6.
Research based in both rural and urban areas has found that materialsupport in the form of one-way giving is only seen as acceptable through close family. Other material support and unpaid help needed to involve a level of reciprocity, either in-kind, or with a small gift ormonetary payment. Without this reciprocity the material support wasseen as ‘charity’ and was inappropriate for both givers and receivers7.
‘Self-exclusion’ can also arise if some people do not participate in localactivities simply because of their own perceptions that the service oractivity is ‘not for the likes of us’.
5. National Evaluation of Sure Start (2005) Buildings in Sure Start Local Programmes. National EvaluationReport Department for Education and Skills
6. Williams C. (2002) Harnessing Voluntary Work:A fourth sector approach. Policy Studies. Volume 23. Numbers 3-4, 1 September 2002, pp 247-260
7. ibid.
200
CC32EvidenceSect3_AW 26/9/06 5:03 pm Page 200
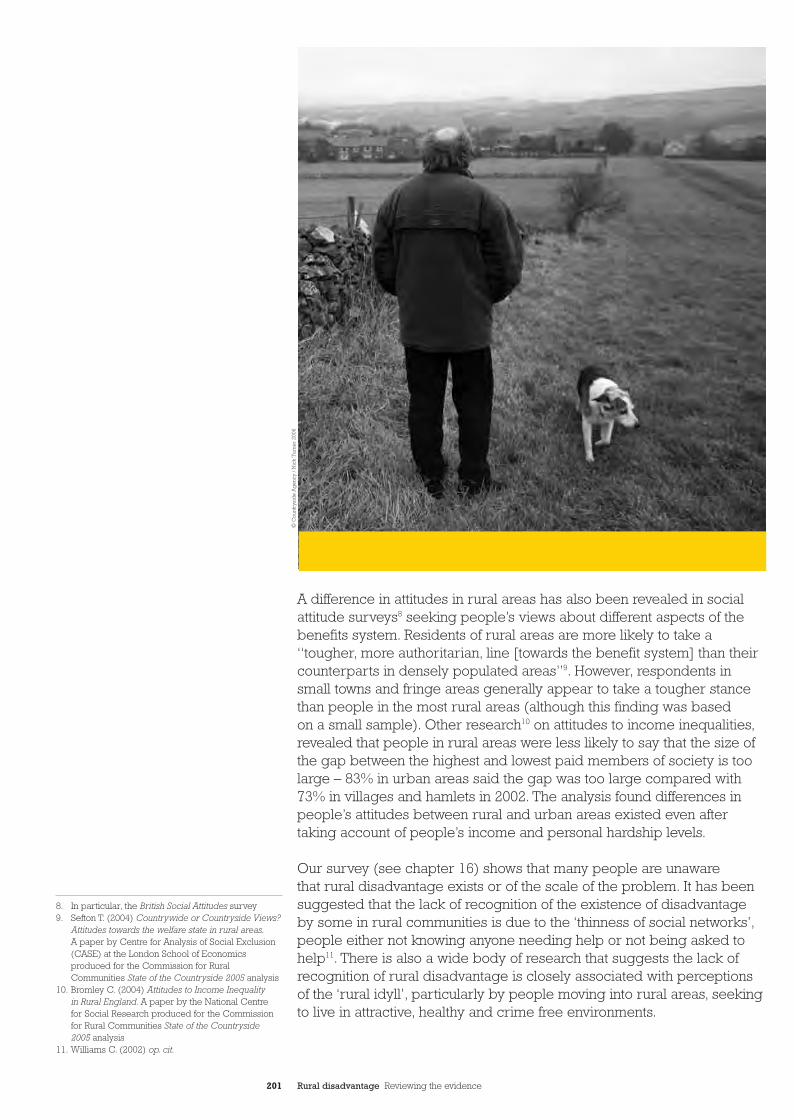
201 Rural disadvantage Reviewing the evidence
A difference in attitudes in rural areas has also been revealed in socialattitude surveys8 seeking people’s views about different aspects of thebenefits system. Residents of rural areas are more likely to take a“tougher, more authoritarian, line [towards the benefit system] than theircounterparts in densely populated areas”9. However, respondents insmall towns and fringe areas generally appear to take a tougher stancethan people in the most rural areas (although this finding was based on a small sample). Other research10 on attitudes to income inequalities,revealed that people in rural areas were less likely to say that the size ofthe gap between the highest and lowest paid members of society is toolarge – 83% in urban areas said the gap was too large compared with73% in villages and hamlets in 2002. The analysis found differences inpeople’s attitudes between rural and urban areas existed even aftertaking account of people’s income and personal hardship levels.
Our survey (see chapter 16) shows that many people are unaware that rural disadvantage exists or of the scale of the problem. It has beensuggested that the lack of recognition of the existence of disadvantageby some in rural communities is due to the ‘thinness of social networks’,people either not knowing anyone needing help or not being asked tohelp11. There is also a wide body of research that suggests the lack ofrecognition of rural disadvantage is closely associated with perceptionsof the ‘rural idyll’, particularly by people moving into rural areas, seekingto live in attractive, healthy and crime free environments.
8. In particular, the British Social Attitudes survey9. Sefton T. (2004) Countrywide or Countryside Views?
Attitudes towards the welfare state in rural areas.A paper by Centre for Analysis of Social Exclusion(CASE) at the London School of Economicsproduced for the Commission for RuralCommunities State of the Countryside 2005 analysis
10. Bromley C. (2004) Attitudes to Income Inequality in Rural England. A paper by the National Centre for Social Research produced for the Commissionfor Rural Communities State of the Countryside 2005 analysis
11. Williams C. (2002) op. cit.
© C
ount
rysi
de
Ag
ency
/ N
ick
Tur
ner
2006
CC32EvidenceSect3_AW 26/9/06 5:03 pm Page 201
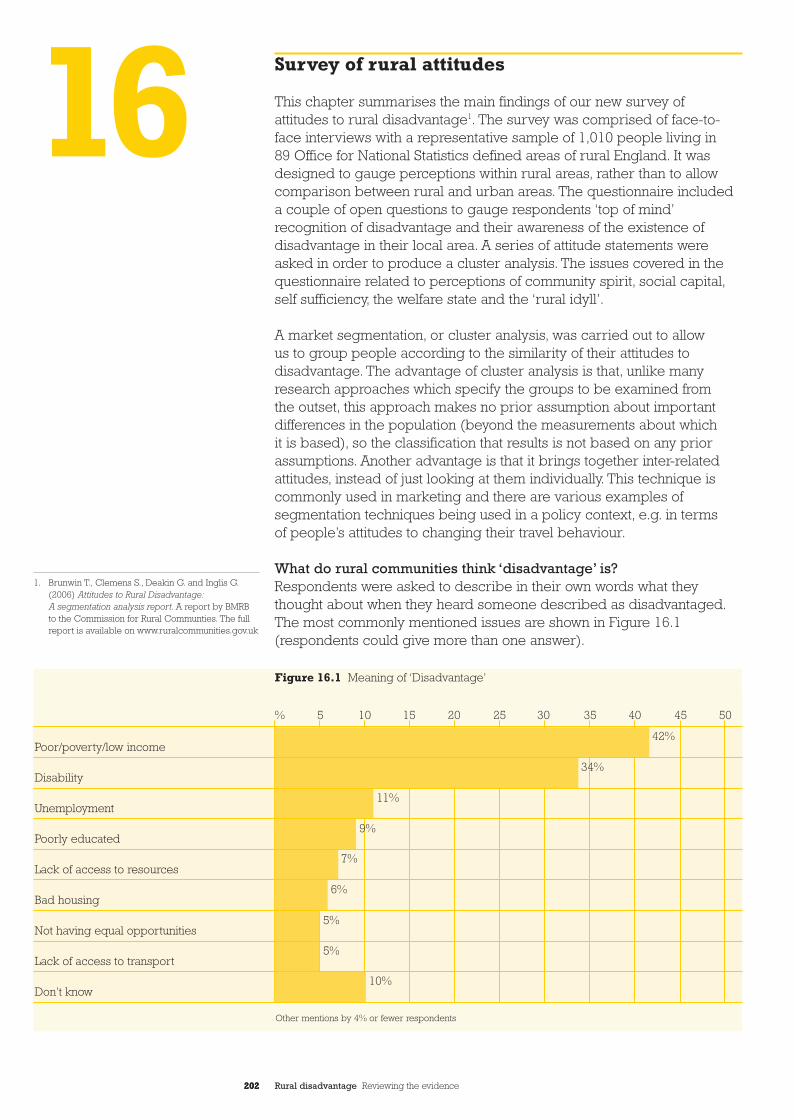
202 Rural disadvantage Reviewing the evidence
1. Brunwin T., Clemens S., Deakin G. and Inglis G.(2006) Attitudes to Rural Disadvantage:A segmentation analysis report. A report by BMRB to the Commission for Rural Communties. The fullreport is available on www.ruralcommunities.gov.uk
16 Survey of rural attitudes
This chapter summarises the main findings of our new survey ofattitudes to rural disadvantage1. The survey was comprised of face-to-face interviews with a representative sample of 1,010 people living in 89 Office for National Statistics defined areas of rural England. It wasdesigned to gauge perceptions within rural areas, rather than to allowcomparison between rural and urban areas. The questionnaire includeda couple of open questions to gauge respondents ‘top of mind’recognition of disadvantage and their awareness of the existence ofdisadvantage in their local area. A series of attitude statements wereasked in order to produce a cluster analysis. The issues covered in thequestionnaire related to perceptions of community spirit, social capital,self sufficiency, the welfare state and the ‘rural idyll’.
A market segmentation, or cluster analysis, was carried out to allow us to group people according to the similarity of their attitudes todisadvantage. The advantage of cluster analysis is that, unlike manyresearch approaches which specify the groups to be examined from the outset, this approach makes no prior assumption about importantdifferences in the population (beyond the measurements about which it is based), so the classification that results is not based on any priorassumptions. Another advantage is that it brings together inter-relatedattitudes, instead of just looking at them individually. This technique iscommonly used in marketing and there are various examples ofsegmentation techniques being used in a policy context, e.g. in terms of people’s attitudes to changing their travel behaviour.
What do rural communities think ‘disadvantage’ is?Respondents were asked to describe in their own words what theythought about when they heard someone described as disadvantaged.The most commonly mentioned issues are shown in Figure 16.1(respondents could give more than one answer).
202
Figure 16.1 Meaning of ‘Disadvantage’
Poor/poverty/low income
Disability
Unemployment
Poorly educated
Lack of access to resources
Bad housing
Not having equal opportunities
Lack of access to transport
Don’t know
% 5 10 15 20 25 30 35 40 45 50
42%
34%
11%
9%
7%
6%
5%
5%
10%
Other mentions by 4% or fewer respondents
CC32EvidenceSect3_AW 26/9/06 5:03 pm Page 202
203 Rural disadvantage Reviewing the evidence
The quotes below illustrate the ways in which people talked about disadvantage:
“Living below the poverty line; unable tofind employment through mental orphysical disadvantage”
“Born into the wrong circumstances andunable to leave them behind”
“Disabled; people with little money; peoplewith no jobs; and around this area peopleare disadvantaged because of lack ofpublic transport”
“Not having the same chances as everyoneelse i.e. family or money”
“Less able to participate in things others do e.g. disability or lack of funds”
“I suppose it’s like a lack of access toservices and facilities that the generalpopulation have access to for whateverreason. I think it is normally financial”
“Low income; poor housing; poor schools;poor services in general”
The focus on ‘disadvantage’ referring to poverty or having a low income is clear with 42% describing disadvantage in these terms.Disability (either physical, mental ill health or a learning disability) wasthe second most frequently mentioned issue - 34% of respondents.
There were few notable differences in thoughts about ‘disadvantage’between different sub-groups and there does not seem to be aconsistent correlation between those who could be said to beexperiencing disadvantage themselves and their definition of it.For example, households on lower incomes (less than £25,000 perannum) were less likely to mention poverty (37%) than those on higherincomes (53%), although people with no car were more likely than those with a car to mention that disadvantage could cover lack of access to transport (12% compared with 4%).
203
CC32EvidenceSect3_AW 26/9/06 5:03 pm Page 203
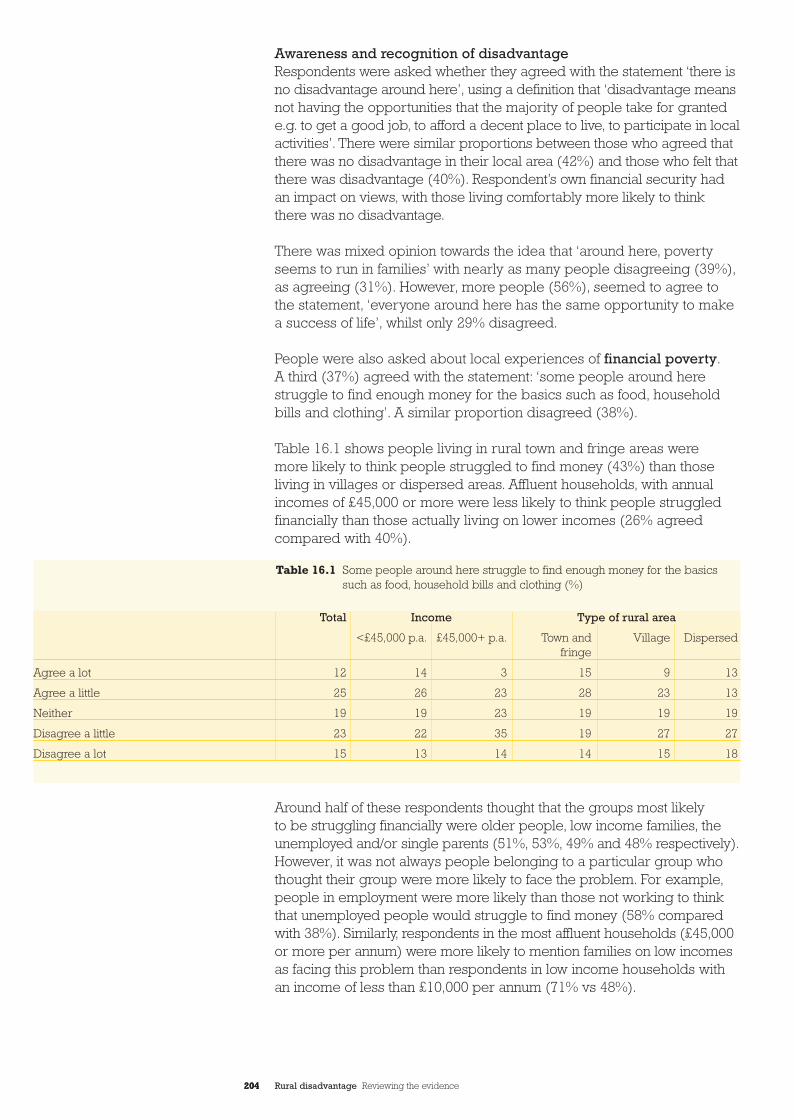
204 Rural disadvantage Reviewing the evidence
Awareness and recognition of disadvantageRespondents were asked whether they agreed with the statement ‘there isno disadvantage around here’, using a definition that ‘disadvantage meansnot having the opportunities that the majority of people take for grantede.g. to get a good job, to afford a decent place to live, to participate in localactivities’. There were similar proportions between those who agreed thatthere was no disadvantage in their local area (42%) and those who felt thatthere was disadvantage (40%). Respondent’s own financial security hadan impact on views, with those living comfortably more likely to think there was no disadvantage.
There was mixed opinion towards the idea that ‘around here, povertyseems to run in families’ with nearly as many people disagreeing (39%),as agreeing (31%). However, more people (56%), seemed to agree tothe statement, ‘everyone around here has the same opportunity to makea success of life’, whilst only 29% disagreed.
People were also asked about local experiences of financial poverty.A third (37%) agreed with the statement: ‘some people around herestruggle to find enough money for the basics such as food, householdbills and clothing’. A similar proportion disagreed (38%).
Table 16.1 shows people living in rural town and fringe areas were more likely to think people struggled to find money (43%) than thoseliving in villages or dispersed areas. Affluent households, with annualincomes of £45,000 or more were less likely to think people struggledfinancially than those actually living on lower incomes (26% agreedcompared with 40%).
Around half of these respondents thought that the groups most likely to be struggling financially were older people, low income families, theunemployed and/or single parents (51%, 53%, 49% and 48% respectively).However, it was not always people belonging to a particular group whothought their group were more likely to face the problem. For example,people in employment were more likely than those not working to thinkthat unemployed people would struggle to find money (58% comparedwith 38%). Similarly, respondents in the most affluent households (£45,000or more per annum) were more likely to mention families on low incomesas facing this problem than respondents in low income households withan income of less than £10,000 per annum (71% vs 48%).
204
Total Income Type of rural area
<£45,000 p.a. £45,000+ p.a. Town and Village Dispersedfringe
Agree a lot 12 14 3 15 9 13
Agree a little 25 26 23 28 23 13
Neither 19 19 23 19 19 19
Disagree a little 23 22 35 19 27 27
Disagree a lot 15 13 14 14 15 18
Table 16.1 Some people around here struggle to find enough money for the basicssuch as food, household bills and clothing (%)
CC32EvidenceSect3_AW 26/9/06 5:03 pm Page 204
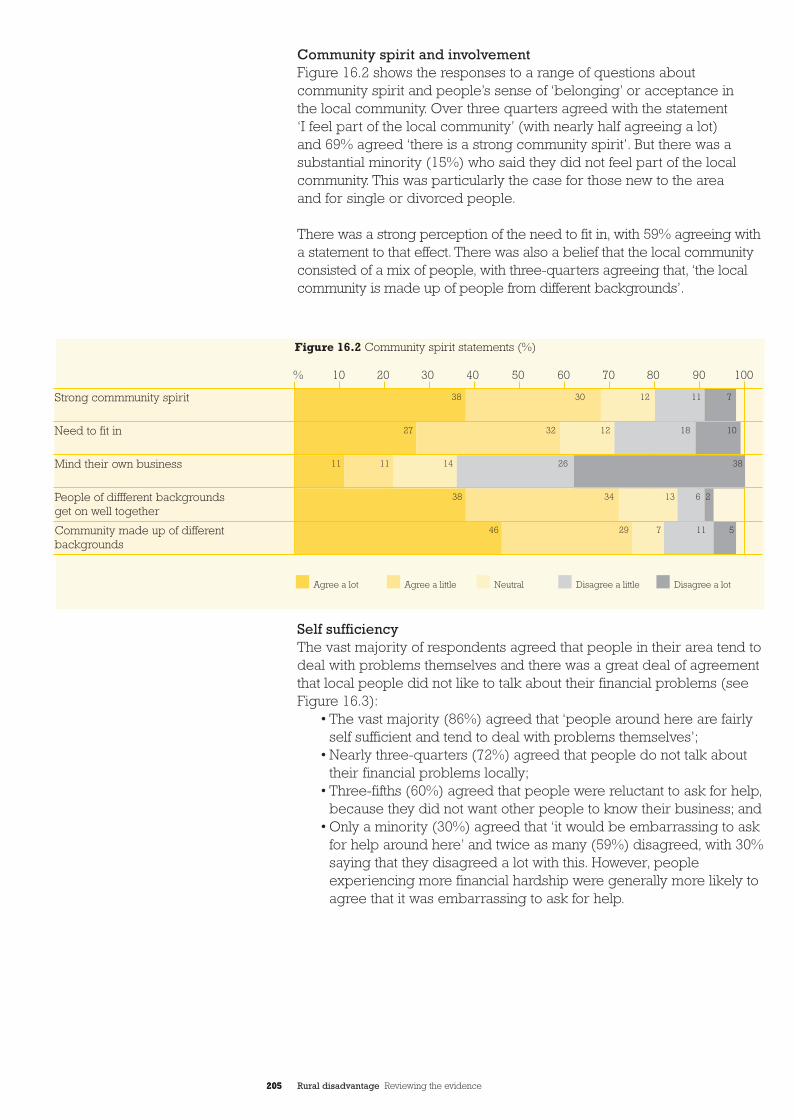
205 Rural disadvantage Reviewing the evidence
Community spirit and involvementFigure 16.2 shows the responses to a range of questions aboutcommunity spirit and people’s sense of ‘belonging’ or acceptance in the local community. Over three quarters agreed with the statement ‘I feel part of the local community’ (with nearly half agreeing a lot) and 69% agreed ‘there is a strong community spirit’. But there was asubstantial minority (15%) who said they did not feel part of the localcommunity. This was particularly the case for those new to the area and for single or divorced people.
There was a strong perception of the need to fit in, with 59% agreeing witha statement to that effect. There was also a belief that the local communityconsisted of a mix of people, with three-quarters agreeing that, ‘the localcommunity is made up of people from different backgrounds’.
Self sufficiencyThe vast majority of respondents agreed that people in their area tend todeal with problems themselves and there was a great deal of agreementthat local people did not like to talk about their financial problems (seeFigure 16.3):
• The vast majority (86%) agreed that ‘people around here are fairlyself sufficient and tend to deal with problems themselves’;
• Nearly three-quarters (72%) agreed that people do not talk abouttheir financial problems locally;
• Three-fifths (60%) agreed that people were reluctant to ask for help,because they did not want other people to know their business; and
• Only a minority (30%) agreed that ‘it would be embarrassing to askfor help around here’ and twice as many (59%) disagreed, with 30%saying that they disagreed a lot with this. However, peopleexperiencing more financial hardship were generally more likely toagree that it was embarrassing to ask for help.
205
Figure 16.2 Community spirit statements (%)
Strong commmunity spirit
Need to fit in
Mind their own business
People of diffferent backgroundsget on well together
Community made up of differentbackgrounds
38 30 12 11 7
27 32 12 18 10
11 11 14 26 38
38 34 13 6 2
46 29 7 11 5
Agree a lot Agree a little Neutral Disagree a little Disagree a lot
% 10 20 30 40 50 60 70 80 90 100
CC32EvidenceSect3_AW 26/9/06 5:03 pm Page 205
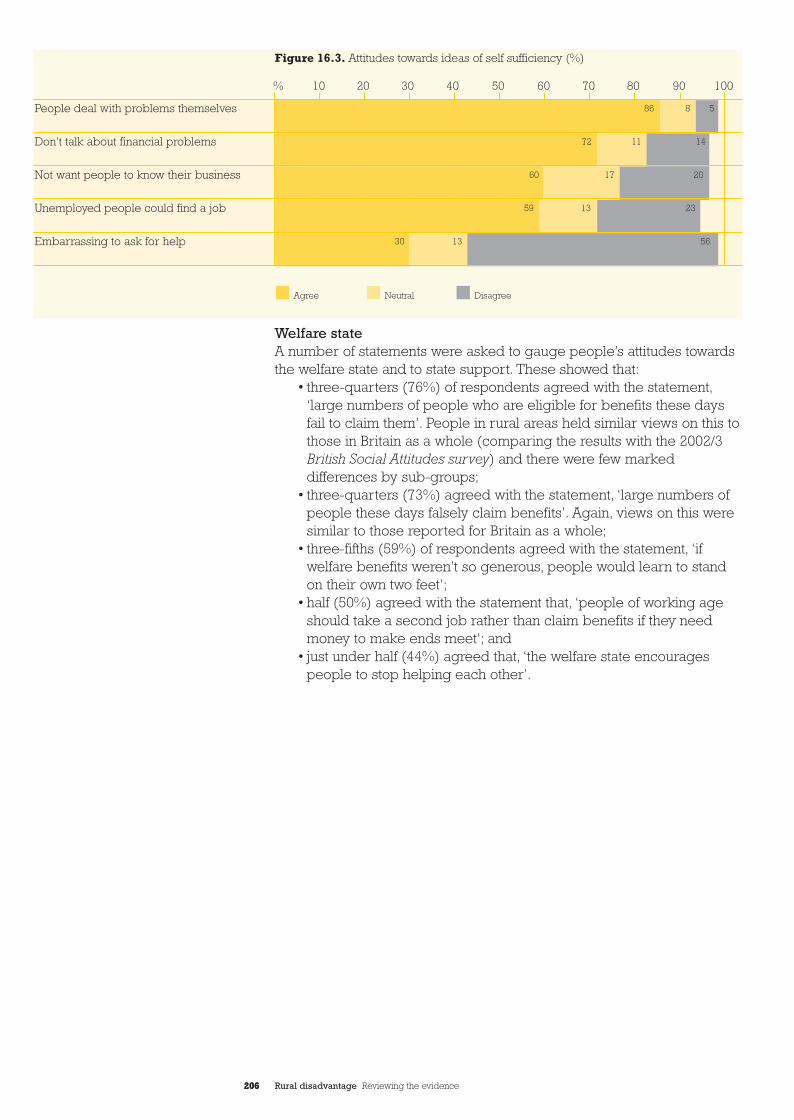
206 Rural disadvantage Reviewing the evidence
Welfare stateA number of statements were asked to gauge people’s attitudes towardsthe welfare state and to state support. These showed that:
• three-quarters (76%) of respondents agreed with the statement,‘large numbers of people who are eligible for benefits these daysfail to claim them’. People in rural areas held similar views on this tothose in Britain as a whole (comparing the results with the 2002/3British Social Attitudes survey) and there were few markeddifferences by sub-groups;
• three-quarters (73%) agreed with the statement, ‘large numbers ofpeople these days falsely claim benefits’. Again, views on this weresimilar to those reported for Britain as a whole;
• three-fifths (59%) of respondents agreed with the statement, ‘ifwelfare benefits weren’t so generous, people would learn to standon their own two feet’;
• half (50%) agreed with the statement that, ‘people of working ageshould take a second job rather than claim benefits if they needmoney to make ends meet’; and
• just under half (44%) agreed that, ‘the welfare state encouragespeople to stop helping each other’.
206
Figure 16.3. Attitudes towards ideas of self sufficiency (%)
People deal with problems themselves
Don’t talk about financial problems
Not want people to know their business
Unemployed people could find a job
Embarrassing to ask for help
86 8 5
72 11 14
60 17 20
59 13 23
30 13 56
Agree Neutral Disagree
% 10 20 30 40 50 60 70 80 90 100
CC32EvidenceSect3_AW 26/9/06 5:03 pm Page 206
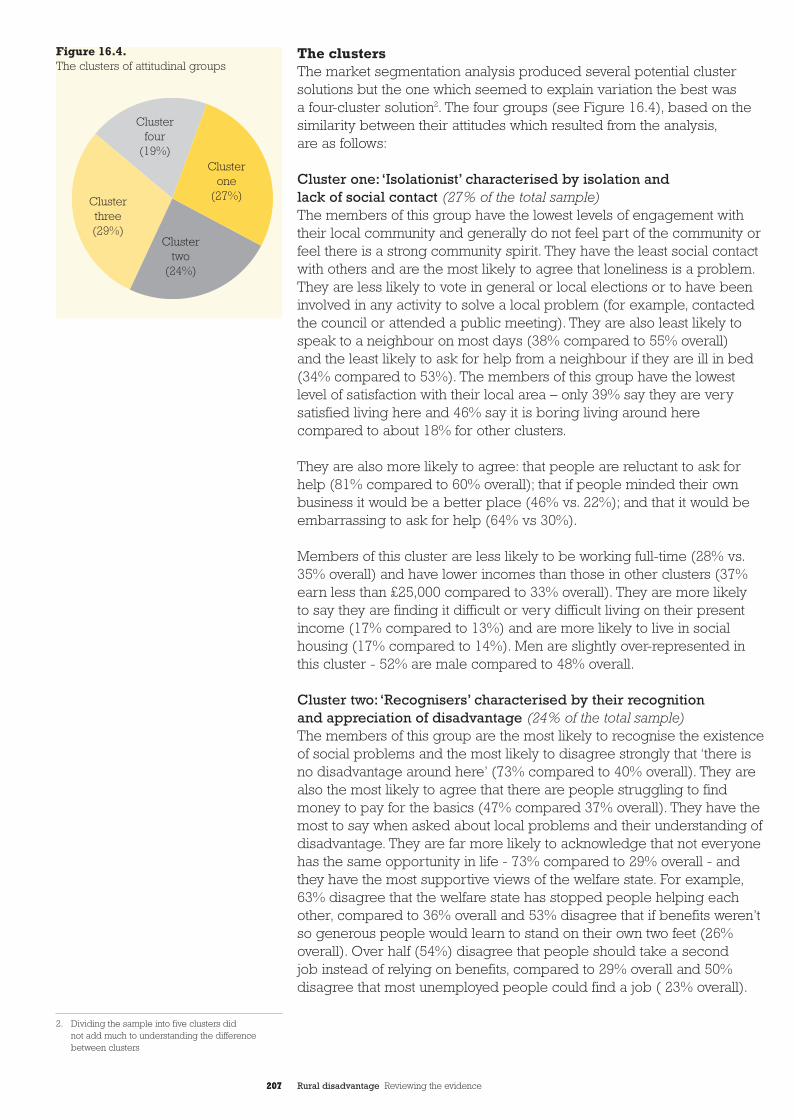
207 Rural disadvantage Reviewing the evidence
The clustersThe market segmentation analysis produced several potential clustersolutions but the one which seemed to explain variation the best was a four-cluster solution2. The four groups (see Figure 16.4), based on thesimilarity between their attitudes which resulted from the analysis,are as follows:
Cluster one: ‘Isolationist’ characterised by isolation and lack of social contact (27% of the total sample)The members of this group have the lowest levels of engagement withtheir local community and generally do not feel part of the community orfeel there is a strong community spirit. They have the least social contactwith others and are the most likely to agree that loneliness is a problem.They are less likely to vote in general or local elections or to have beeninvolved in any activity to solve a local problem (for example, contactedthe council or attended a public meeting). They are also least likely tospeak to a neighbour on most days (38% compared to 55% overall) and the least likely to ask for help from a neighbour if they are ill in bed (34% compared to 53%). The members of this group have the lowestlevel of satisfaction with their local area – only 39% say they are verysatisfied living here and 46% say it is boring living around herecompared to about 18% for other clusters.
They are also more likely to agree: that people are reluctant to ask forhelp (81% compared to 60% overall); that if people minded their ownbusiness it would be a better place (46% vs. 22%); and that it would beembarrassing to ask for help (64% vs 30%).
Members of this cluster are less likely to be working full-time (28% vs.35% overall) and have lower incomes than those in other clusters (37%earn less than £25,000 compared to 33% overall). They are more likely to say they are finding it difficult or very difficult living on their presentincome (17% compared to 13%) and are more likely to live in socialhousing (17% compared to 14%). Men are slightly over-represented inthis cluster - 52% are male compared to 48% overall.
Cluster two: ‘Recognisers’ characterised by their recognition and appreciation of disadvantage (24% of the total sample)The members of this group are the most likely to recognise the existenceof social problems and the most likely to disagree strongly that ‘there isno disadvantage around here’ (73% compared to 40% overall). They arealso the most likely to agree that there are people struggling to findmoney to pay for the basics (47% compared 37% overall). They have themost to say when asked about local problems and their understanding ofdisadvantage. They are far more likely to acknowledge that not everyonehas the same opportunity in life - 73% compared to 29% overall - andthey have the most supportive views of the welfare state. For example,63% disagree that the welfare state has stopped people helping eachother, compared to 36% overall and 53% disagree that if benefits weren’tso generous people would learn to stand on their own two feet (26%overall). Over half (54%) disagree that people should take a second job instead of relying on benefits, compared to 29% overall and 50%disagree that most unemployed people could find a job ( 23% overall).
2. Dividing the sample into five clusters did not add much to understanding the differencebetween clusters
207
Figure 16.4.The clusters of attitudinal groups
Clusterone
(27%)
Clusterfour
(19%)
Clusterthree(29%)
Clustertwo
(24%)
CC32EvidenceSect3_AW 26/9/06 5:03 pm Page 207
208 Rural disadvantage Reviewing the evidence
Members of this cluster are more likely to have moved in from elsewhere– 18% have moved to this area within the last three years (compared to14% on average) and 60% have not lived in the same area all their life.A large proportion of this cluster are female (60%) and there is a higherproportion with children under 16 (36% compared to 33% overall).There is also a higher proportion of those from the 40-64 year age group(54% compared to 36% overall).
People in this group are generally quite involved in local social and civic activities. They are the most likely to have contacted the council(27% vs 19% overall) or attended a public meeting (23% compared to 16%) in connection with a local problem.
Cluster three: ‘Rural idealists –harder values’ characterised by harder views and belief in the rural idyll (29% of the total sample)The members of this group generally have ‘harder’ or less supportiveviews on the welfare state and are the least likely to recognise theexistence of social problems, such as difficulties in finding a job, housingor money for the basics. They also have a strong belief in an idyllic rurallifestyle and agree strongly with the statement ‘there is no disadvantagearound here’ (64% vs 42% overall). They have firm views on the welfarestate, for example, they are the most likely to agree that if benefits werenot so generous people would learn to stand on their own two feet (82%compared to 59% overall). They are also the most likely to agree thatthere are lots of people falsely claiming benefits (80% vs. 73 overall).They believe strongly that everyone has the same opportunity tosucceed (77% compared to 56% overall).
Members of this cluster are slightly older than average (34% are agedover 65 compared to 20% overall) and only 10% are under 25. 52% aremale and 74% are from adult only households. They are generallycomfortably off (58% said they were living comfortably on their presentincome compared to 46% overall) and 45% own their house outright(compared to 34% overall).
People in this cluster are the most likely to say they feel part of the localcommunity (68% agree strongly with this statement, compared to 49%overall), but they also have a strong belief that people need to fit in to bepart of the local community (77% agree, compared to just 7% of clusterfour). They are the most likely to say that there is a strong communityspirit (91% agree with this, compared to 70% overall) so perhaps notsurprisingly they have very high levels of satisfaction with their local area – all of them are either very or fairly satisfied. They are also themost likely to have voted in the last general election - 82% voted.
208
CC32EvidenceSect3_AW 26/9/06 5:03 pm Page 208
209 Rural disadvantage Reviewing the evidence
Cluster four: ‘Rural idealists – softer views’ characterised by belief in an idyllic rural lifestyle but with softer views on the welfare state(19% of the total sample)The members of this group are very similar to those in cluster three,sharing the same ideas of an idyllic rural community and there is littleacknowledgement of disadvantage. However what differentiates themfrom those in cluster three, is a more sympathetic attitude to the welfarestate and state support. They disagree that people would beembarrassed to ask for help around here – 75% disagree compared to56% overall and they have the highest level of disagreement (25%) withthe statement that, ‘people do not talk about their financial problems’.
The members of this group are less likely to recognise the existence ofspecific social problems, for example only 39% agree that some peopleare lonely compared to the average of 50% overall and they are the leastlikely to agree that some people cannot find money for basics (29%compared to 37% overall). They are also the least likely to agree that it is difficult to find a job (55% compared to 63% overall).
However, they have more sympathetic attitudes towards the welfare state.They disagree that it encourages people to stop helping each other(55% disagree compared to 36% overall) and are less likely to agree that if benefits weren’t so generous people would learn to stand on theirown two feet (48% compared to 59% overall). They are also less likely to agree people should take a second job rather than claim benefits(only 40% agree compared to 50% overall and 71% for cluster three).
A relatively high proportion of this group are aged under 34 (31%compared to 23% overall) and there is also a high proportion of 35-59s(51% compared to 47% overall). Consequently, the group has the lowestnumber of members aged 60 plus (18%). A high proportion (44%) arefrom households earning £25,000+ and 39% have children under 16,compared to 33% overall.
Learning from the clustersThe segmentation analysis indicates that roughly half the rural population(taking both clusters three and four together), has a strong belief in anidyllic rural lifestyle and little recognition of the problems experienced by a significant minority of those living in rural areas. The group whichcontains those most likely to experience disadvantage (cluster one), is also the most isolated and the least likely to feel part of the community,thus their problems are more likely to be hidden allowing those in clustersthree and four to continue to deny the existence of rural disadvantage.Those in the remaining group (cluster two), whilst relatively well-off, dorecognise the existence of disadvantage in rural areas, indicating that it isnot a simple divide between the ‘haves’ and ‘have nots’.
It seems clear that there is a considerable level of public scepticismabout the existence of rural disadvantage and there is a need tounderstand more about the factors that influence people’s perceptionsand their understanding of disadvantage.
209
CC32EvidenceSect3_AW 26/9/06 5:03 pm Page 209
210 Rural disadvantage Reviewing the evidence
Policy makers’ attitudes
We have already explored the information on how policies designed totackle different forms of disadvantage are working in rural areas in thesection on access to opportunity. This chapter explores how the attitudesof ‘policy makers’ impacts more generally on policy and rural disadvantage.We examine briefly the in-built and implicit ‘attitudes of policy makers’through the general assumptions that are used in policy approaches.This is not intended to reflect the views of individual policy makers1, butrather aims to reveal how perceptions about disadvantage influencepolicy. The main ‘attitudes’ explored are that:
• disadvantage is concentrated – leading to an area based approach;• delivery will be achieved through targets and performance
measures; and• the costs of services to tackle disadvantage are properly allocated.
Area based approachesThe area-based approach of targeting programmes to tackle disadvantageis based on the assumption that disadvantage is concentrated in certaingeographical areas. There is an on-going debate about the effectiveness ofarea-based approaches and the extent to which living in a disadvantagedarea impacts on someone’s opportunities. Most recently, research2 foundthat the impact of neighbourhood is more likely to influence someone’sattitudes (e.g. in relation to voting behaviour) than their future life chances.The argument that the majority of disadvantaged people do not live indisadvantaged areas and not all people who live in disadvantaged areasare disadvantaged, appears to be widely accepted.
It is clear that area based approaches do not capture the nature of most rural disadvantage, where people experiencing disadvantage are scattered. The arguments around the scattered nature of ruraldisadvantage and the inappropriate nature of area based measures and targets have been well rehearsed. It has been argued that existingmeasures do not reflect rural disadvantage either because of theindicators used or the scale or geographical level of analysis used3.In particular, “attempts to construct indices of deprivation which can be applied usefully to both rural and urban areas have been fraught withdifficulty... partly because of the different meanings in rural and urbancontexts of frequently used indicators, such as car ownership and theurban bias inherent in other indicators, such as high-rise accommodation,but mainly because area measures are less relevant to the scatteredincidence of rural deprivation”4.
The Index of Multiple Deprivation is perhaps the most widely usedmeasure of concentrations of deprivation for area targeting, and hasbeen criticised for its failure to reflect rural disadvantage. Analysis5 of theIndex of Multiple Deprivation (IMD) 2000 found that few of the rural poorlived in districts or wards identified as deprived using the IMD2000 andconcluded that “the data suggest strongly that area targeting using theIMD2000 is likely to be more complete and efficient in targeting theurban poor than the rural poor”.
1. Indeed we have not undertaken a survey of policy makers
2. Burgess S. (2005) quoted in Economic and Social Research Council (ESRC) The Edgemagazine November 2005, Issue 20, page 5
3. Examples include the response of the CountrysideAgency to the Consultation on the Index of Multiple Deprivation, and earlier work by the Rural Development Commission
4. Shucksmith M. (2004) Social Exclusion in ruralAreas: a review of recent research. A paper to Defra
5. Tunstall R. and Lupton R. (2003) Is TargetingDeprived Areas an Effective Means to Reach Poor People? An assessment of one rationale forarea-based funding programmes. Centre forAnalysis of Social Exclusion (CASE) Paper 70
17CC32EvidenceSect3_AW 26/9/06 5:03 pm Page 210
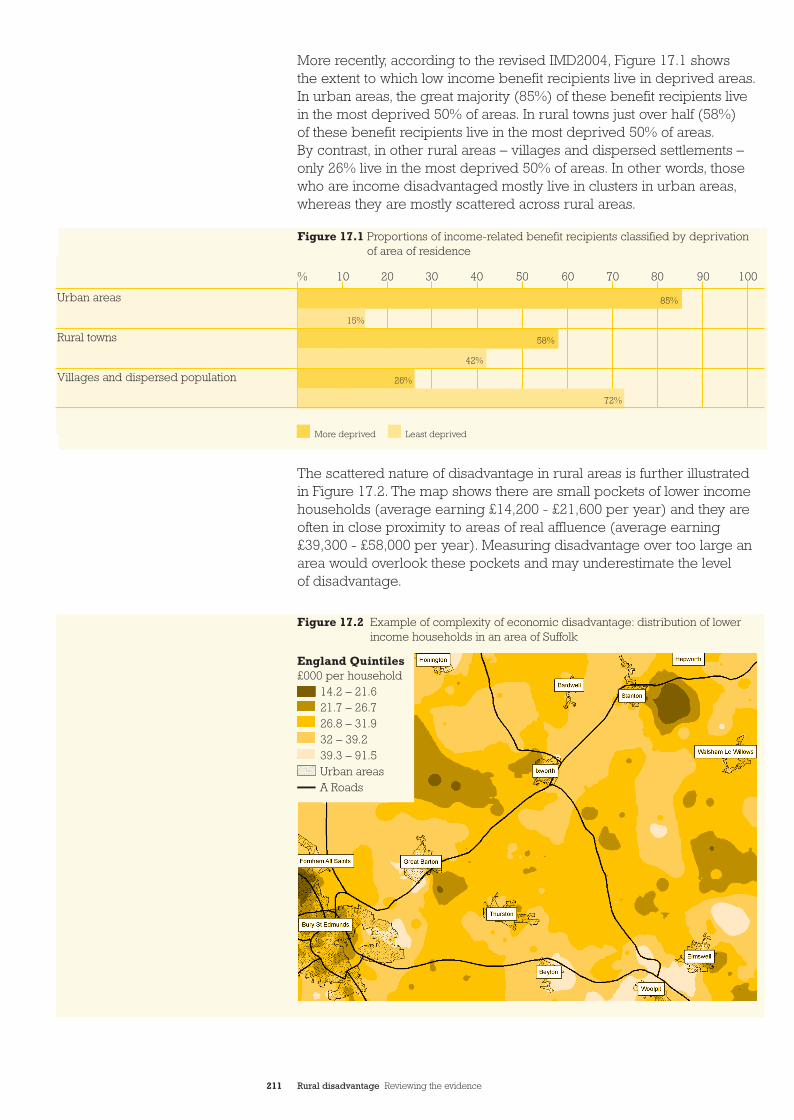
211 Rural disadvantage Reviewing the evidence
More recently, according to the revised IMD2004, Figure 17.1 shows the extent to which low income benefit recipients live in deprived areas.In urban areas, the great majority (85%) of these benefit recipients live in the most deprived 50% of areas. In rural towns just over half (58%) of these benefit recipients live in the most deprived 50% of areas.By contrast, in other rural areas – villages and dispersed settlements –only 26% live in the most deprived 50% of areas. In other words, thosewho are income disadvantaged mostly live in clusters in urban areas,whereas they are mostly scattered across rural areas.
The scattered nature of disadvantage in rural areas is further illustratedin Figure 17.2. The map shows there are small pockets of lower incomehouseholds (average earning £14,200 - £21,600 per year) and they areoften in close proximity to areas of real affluence (average earning£39,300 - £58,000 per year). Measuring disadvantage over too large anarea would overlook these pockets and may underestimate the level of disadvantage.
Figure 17.1 Proportions of income-related benefit recipients classified by deprivation of area of residence
Figure 17.2 Example of complexity of economic disadvantage: distribution of lowerincome households in an area of Suffolk
Urban areas
Rural towns
Villages and dispersed population
% 10 20 30 40 50 60 70 80 90 100
85%
15%
58%
42%
26%
72%
More deprived Least deprived
England Quintiles£000 per household
14.2 – 21.621.7 – 26.726.8 – 31.932 – 39.239.3 – 91.5Urban areasA Roads
CC32EvidenceSect3_AW 26/9/06 5:03 pm Page 211
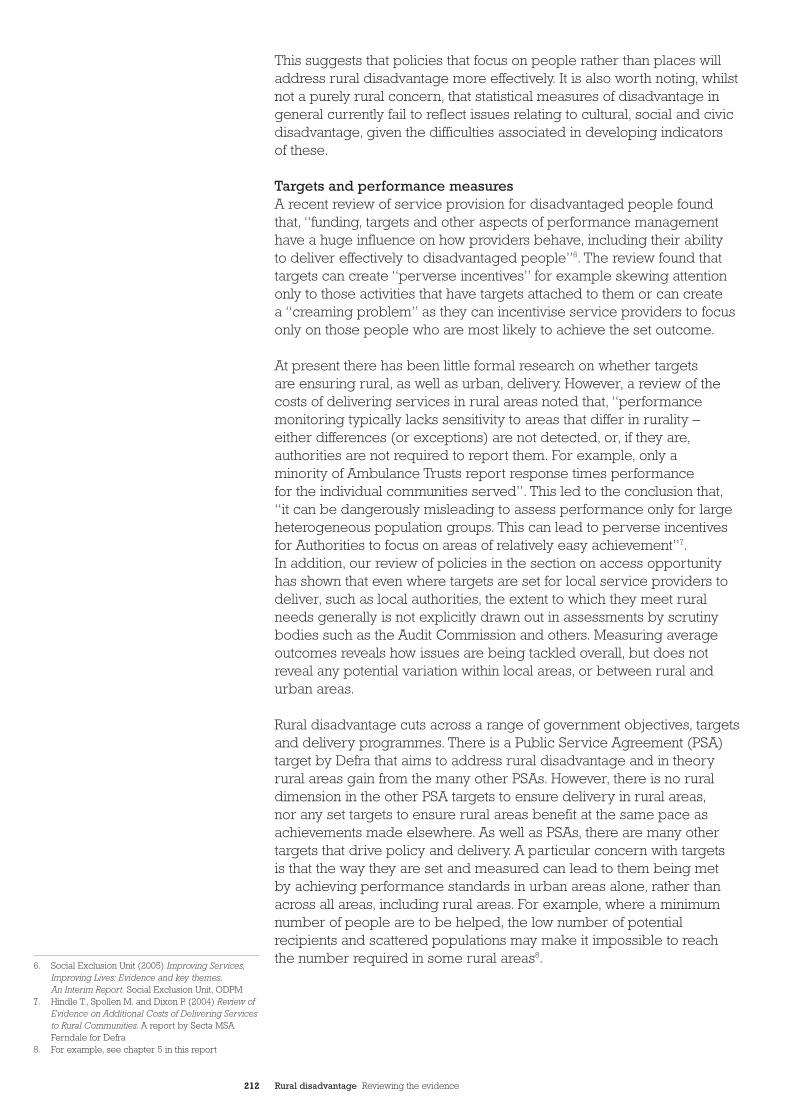
212 Rural disadvantage Reviewing the evidence
This suggests that policies that focus on people rather than places willaddress rural disadvantage more effectively. It is also worth noting, whilstnot a purely rural concern, that statistical measures of disadvantage ingeneral currently fail to reflect issues relating to cultural, social and civicdisadvantage, given the difficulties associated in developing indicators of these.
Targets and performance measuresA recent review of service provision for disadvantaged people foundthat, “funding, targets and other aspects of performance managementhave a huge influence on how providers behave, including their ability to deliver effectively to disadvantaged people”6. The review found thattargets can create “perverse incentives” for example skewing attentiononly to those activities that have targets attached to them or can create a “creaming problem” as they can incentivise service providers to focusonly on those people who are most likely to achieve the set outcome.
At present there has been little formal research on whether targets are ensuring rural, as well as urban, delivery. However, a review of thecosts of delivering services in rural areas noted that, “performancemonitoring typically lacks sensitivity to areas that differ in rurality – either differences (or exceptions) are not detected, or, if they are,authorities are not required to report them. For example, only a minority of Ambulance Trusts report response times performance for the individual communities served”. This led to the conclusion that,“it can be dangerously misleading to assess performance only for largeheterogeneous population groups. This can lead to perverse incentivesfor Authorities to focus on areas of relatively easy achievement”7.In addition, our review of policies in the section on access opportunityhas shown that even where targets are set for local service providers todeliver, such as local authorities, the extent to which they meet ruralneeds generally is not explicitly drawn out in assessments by scrutinybodies such as the Audit Commission and others. Measuring averageoutcomes reveals how issues are being tackled overall, but does notreveal any potential variation within local areas, or between rural andurban areas.
Rural disadvantage cuts across a range of government objectives, targetsand delivery programmes. There is a Public Service Agreement (PSA)target by Defra that aims to address rural disadvantage and in theoryrural areas gain from the many other PSAs. However, there is no ruraldimension in the other PSA targets to ensure delivery in rural areas,nor any set targets to ensure rural areas benefit at the same pace asachievements made elsewhere. As well as PSAs, there are many othertargets that drive policy and delivery. A particular concern with targets is that the way they are set and measured can lead to them being met by achieving performance standards in urban areas alone, rather thanacross all areas, including rural areas. For example, where a minimumnumber of people are to be helped, the low number of potentialrecipients and scattered populations may make it impossible to reach the number required in some rural areas8.
6. Social Exclusion Unit (2005) Improving Services,Improving Lives: Evidence and key themes.An Interim Report. Social Exclusion Unit, ODPM
7. Hindle T., Spollen M. and Dixon P. (2004) Review ofEvidence on Additional Costs of Delivering Servicesto Rural Communities. A report by Secta MSAFerndale for Defra
8. For example, see chapter 5 in this report
CC32EvidenceSect3_AW 26/9/06 5:03 pm Page 212
213 Rural disadvantage Reviewing the evidence
Costs of provisionPolicy is also based on the in-built assumption that resource allocationsystems reflect both the need for services in rural areas and the cost ofdelivery. It is difficult to distinguish between funding for general serviceprovision that might be used by any member of a rural community andservices used by those who might be described as disadvantaged. Forexample, the victim of a crime will use police services but the policealso provide a general service to the whole community.
Research shows that it costs more to deliver services per person to ruralcommunities because of a range of factors9. In particular: the lack ofeconomies of scale for the service provider with relatively few peopleneeding a particular service; the long distances between service pointsand people leading to higher travel costs and unproductive time; and thetime taken to establish services in rural areas. A major review10 exploredthe effect of population distribution and settlement patterns on the costand performance of 10 services in 12 local authorities in England. Usinga modelled approach to examine unit costs, it found a cost premiumfaced by rural areas in delivering a common standard of serviceperformance compared to similar urban areas.
Research11 has also highlighted two problems in resource allocationmechanisms to adjust for ‘rurality’. Firstly, the measures are too simplisticand do not fully reflect the complexity of population distribution andsettlement patterns. Secondly, the unit sparsity cost can be too low andfail to cover fully the costs of rural service provision. The research12 alsonoted that the extent to which services may also incur increased costs inrural areas is dependent on the amount of travel required. It suggested,“travel related costs and scale inefficiencies account for a much largershare of total budgets than is often realised”.
Resource allocation formulae for rural service provision seem to betreated differently in different policy areas. For example, a weighting forsparsity is included in some parts of the finance for local government butthere seems to be little allowance for rurality in health funding. Therehave been a number of assessments made of funding for health servicesthrough the NHS and a number of studies have argued13 that the need forhealth care in rural areas and the cost of rural service provision are notadequately reflected.
Our review has also found that there are difficulties in measuring thelevel of need in rural areas compared to service use. Research on health,for example, has shown the low level of use of GPs by some in ruralareas, despite their health needs. A further difficulty in relation toresource allocation formulae for rural public services can arise wherethey are based on measures of usage rather than need for services andso may not always take account of rural circumstances.
Assessment of the extent to which funding for other services (apart fromlocal government and health services) reflects the needs and costs ofprovision in rural areas does not seem to be available.
9. Hindle et. al. (2004) op. cit.10. Secta MSA Ferndale (2004) Developing Indicators
of Population Distribution and Settlement Patterns.The Countryside Agency
11. Hindle et. al. (2004) op. cit.12. Hindle et. al. (2004) op. cit.13. For example, Asthana S., Gibson A., Moon G. and
Brigham P. (2003) Allocating Resources for Healthand Social Care: The significance of rurality. Healthand social care in the community 11, 6, 486-493;and Asthana S., Halliday J., Brigham P. and GibsonA. (2002) Rural Deprivation and Service Need:A review of the literature and an assessment ofindicators for rural service planning, South WestPublic health Observatory
CC32EvidenceSect3_AW 26/9/06 5:03 pm Page 213

CC32EvidenceSect4_AW 26/9/06 5:04 pm Page 214

Rural disadvantage Reviewing the evidence
Vulnerablegroups
215
CC32EvidenceSect4_AW 26/9/06 5:04 pm Page 215
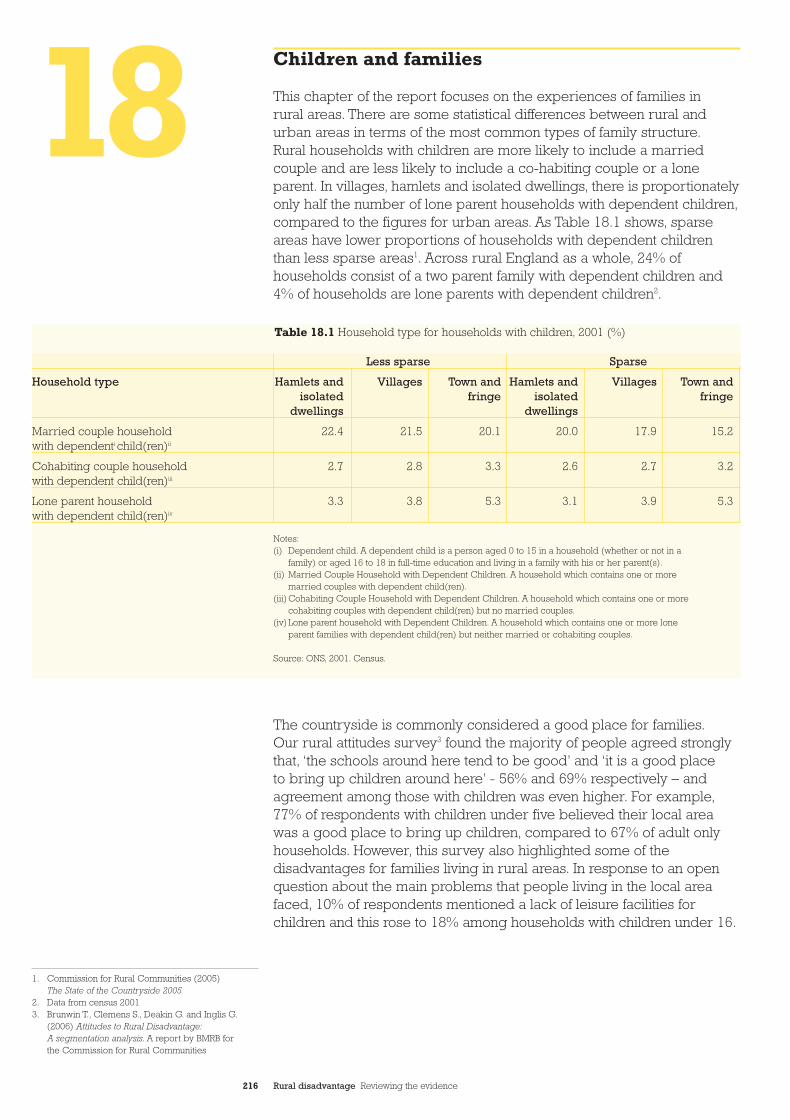
216 Rural disadvantage Reviewing the evidence
Children and families
This chapter of the report focuses on the experiences of families in rural areas. There are some statistical differences between rural andurban areas in terms of the most common types of family structure.Rural households with children are more likely to include a marriedcouple and are less likely to include a co-habiting couple or a loneparent. In villages, hamlets and isolated dwellings, there is proportionatelyonly half the number of lone parent households with dependent children,compared to the figures for urban areas. As Table 18.1 shows, sparseareas have lower proportions of households with dependent childrenthan less sparse areas1. Across rural England as a whole, 24% ofhouseholds consist of a two parent family with dependent children and4% of households are lone parents with dependent children2.
The countryside is commonly considered a good place for families.Our rural attitudes survey3 found the majority of people agreed stronglythat, ‘the schools around here tend to be good’ and ‘it is a good place to bring up children around here’ - 56% and 69% respectively – andagreement among those with children was even higher. For example,77% of respondents with children under five believed their local areawas a good place to bring up children, compared to 67% of adult onlyhouseholds. However, this survey also highlighted some of thedisadvantages for families living in rural areas. In response to an openquestion about the main problems that people living in the local areafaced, 10% of respondents mentioned a lack of leisure facilities forchildren and this rose to 18% among households with children under 16.
1. Commission for Rural Communities (2005) The State of the Countryside 2005
2. Data from census 20013. Brunwin T., Clemens S., Deakin G. and Inglis G.
(2006) Attitudes to Rural Disadvantage:A segmentation analysis. A report by BMRB for the Commission for Rural Communities
Table 18.1 Household type for households with children, 2001 (%)
Less sparse Sparse
Household type Hamlets and Villages Town and Hamlets and Villages Town andisolated fringe isolated fringe
dwellings dwellings
Married couple household 22.4 21.5 20.1 20.0 17.9 15.2with dependenti child(ren)ii
Cohabiting couple household 2.7 2.8 3.3 2.6 2.7 3.2with dependent child(ren)iii
Lone parent household 3.3 3.8 5.3 3.1 3.9 5.3with dependent child(ren)iv
Notes:(i) Dependent child. A dependent child is a person aged 0 to 15 in a household (whether or not in a
family) or aged 16 to 18 in full-time education and living in a family with his or her parent(s).(ii) Married Couple Household with Dependent Children. A household which contains one or more
married couples with dependent child(ren).(iii) Cohabiting Couple Household with Dependent Children. A household which contains one or more
cohabiting couples with dependent child(ren) but no married couples.(iv) Lone parent household with Dependent Children. A household which contains one or more lone
parent families with dependent child(ren) but neither married or cohabiting couples.
Source: ONS, 2001. Census.
18CC32EvidenceSect4_AW 26/9/06 5:04 pm Page 216
217 Rural disadvantage Reviewing the evidence
Income disadvantageResearch4 has shown that whilst some children do benefit from an “idyllicrural lifestyle”, others have a less positive experience of growing up inthe countryside, particularly those from low income families who sufferthe most from difficulties with transport and limited access to activitiesand services. Overall, 700,000 children living in rural areas in England(23% of rural children) live in poverty. Lone parents and families withthree or more children are two of the groups most at risk of incomepoverty in rural areas.
Nationally, lone parent families are at greater risk of poverty than couplefamilies. Families without a working adult, with a disabled parent or childand large families are also at risk.5
Employment disadvantageA lack of suitable childcare and limited transport options are likely torestrict the opportunities for employment among those with children,particularly for lone parents and those, usually mothers, with the maincaring responsibilities. Self-employment is often considered to offer ameans of balancing work and family commitments, but research6 into the impacts of self-employment on family life has found that this is notalways successful. This study of the members of 30 self-employedhouseholds, including children in rural-urban fringe areas in the NorthEast of England, found that livelihood pressures meant that self-employedhouseholds tended to exploit themselves in terms of working hours andfamily well being. A business in the family often involved work on thepart of owners’ spouses, even when they had other jobs and the demandsof the business could make it hard to find time together as a family.
Health disadvantageResearch7 has identified a number of health-related disadvantagesexperienced by families in rural areas. Parents are concerned aboutbeing able to contact a GP out of hours when emergencies arise withtheir children and about the length of time it would take on-call doctors,who may be some distance away, to reach them. Families may experienceproblems when children have to stay in hospital overnight, particularlylone parents who have to rely on friends and neighbours to look aftertheir other children and those without their own transport. There is aserious lack of support for families whose children have been diagnosedas suffering from behavioural problems. Rural families caring for childrenwith disabilities can face particular problems due to discriminatoryattitudes and often, a total lack of social contact with other children.
Social disadvantageThere are often limited opportunities for both formal and informal socialactivities for families and children in rural areas with a lack of safe andappropriate play facilities and access to organised activities for children8.Some rural parents regularly travel long distances to allow their childrento participate in clubs and activities, but travel costs and fees place these activities beyond the reach of families on low incomes. The costs of participating in organised activities can be a particular barrier forlarger families and those on low incomes.
After-school activities may be the only form of organised social activitiesavailable to many rural children. However, free school transport may only
4. Davis J. and Ridge T. (1997) Same Scenery,Different Lifestyle – rural children on a low income,The Children’s Society
5. Millar J. and Ridge T. (2001) Families, Poverty, Workand Care – A review of the literature on lone parentsand low-income couple families with children. DWPResearch Report No. 153
6. Wheelock J. and Baines S. (2004) Self-employmentand the problem of balancing work and family life.in Northern Economic Review
7. Mullins A., McCluskey J. and Taylor-Browne J.(undated) Challenging the Rural Idyll - children andfamilies speak out about life in rural England in the21st century. The Countryside Agency
8. ibid.
CC32EvidenceSect4_AW 26/9/06 5:04 pm Page 217
be provided at the end of the school day, meaning that those whoseparents are unable to collect them later, or who cannot afford to makealternative arrangements, may not be able to stay on to take part in after-school activities. Where children travel some distance to school,it is likely that their friends also live some distance away making it hardto see friends outside school since their opportunities for independenttravel are very limited.
Rural parents have also expressed concerns about the risks of lettingtheir children out on their own, particularly because of the volume andspeed of traffic9 thus limiting the opportunities available for children to‘play out’ locally.
Rural children can often feel observed and censured by adults. It is low income children who are most likely to be visible within theircommunities, as they lack the opportunities to participate in activitieselsewhere or are less likely to have private space to play in, thus leadingto some being labelled as ‘troublemakers’. In rural areas there is verylittle land that is not privately owned, either as farmland or as personalproperty and whereas children from more wealthy families are likely tohave large gardens to play in, those from low income families are likelyto find the spaces they can use are severely restricted and usuallyclosely observed by adults, such as bus stops or the village green.
Other research into the use of out-of-school clubs by rural children10
supports these findings, concluding that “play opportunities are limitedowing to geographical isolation from other children, the privatisation ofrural land and fear over children’s unsupervised use of public space”.The authors of this research argue that whilst there are many positiveaspects to the use of private out-of-school clubs for those who can affordthem, they are adding to the exclusion felt by those unable to benefitfrom them.
Transport disadvantageMany rural families regard car ownership as necessary for survival, dueto the limitations of rural public transport11, but in many cases the car isused by one parent to travel to work so that the parent and children left at home are cut off from wider social networks. Lift sharing is commonamong rural parents, given the long distances that may be involved intravelling to school and other children’s activities. However, research amongst low income families12 has found that some families without carsare reluctant to take-up the offer of lifts as they are embarrassed by thefact that they can not reciprocate. This research also found that where lowincome families are struggling to maintain private transport, children areacutely aware of the cost of using it, so may be reluctant to ask for liftsand that access for children may not be a high priority within familiesstruggling to meet the costs of running a car.
For those without a car the need to take children with them by publictransport or when using a taxi, adds considerably to the cost of a weeklysupermarket shop.
9. ibid.10. Smith F. and Barker J. (2001) Commodifying the
Countryside: the impact of out-of-school care onrural landscapes of children’s play, Area (2001) 33.2, 169-176
11. Mullins A., McCluskey J. and Taylor-Browne J.(undated) op. cit.
12. Davis J. and Ridge T. (1997) op. cit.
218 Rural disadvantage Reviewing the evidence
CC32EvidenceSect4_AW 26/9/06 5:04 pm Page 218
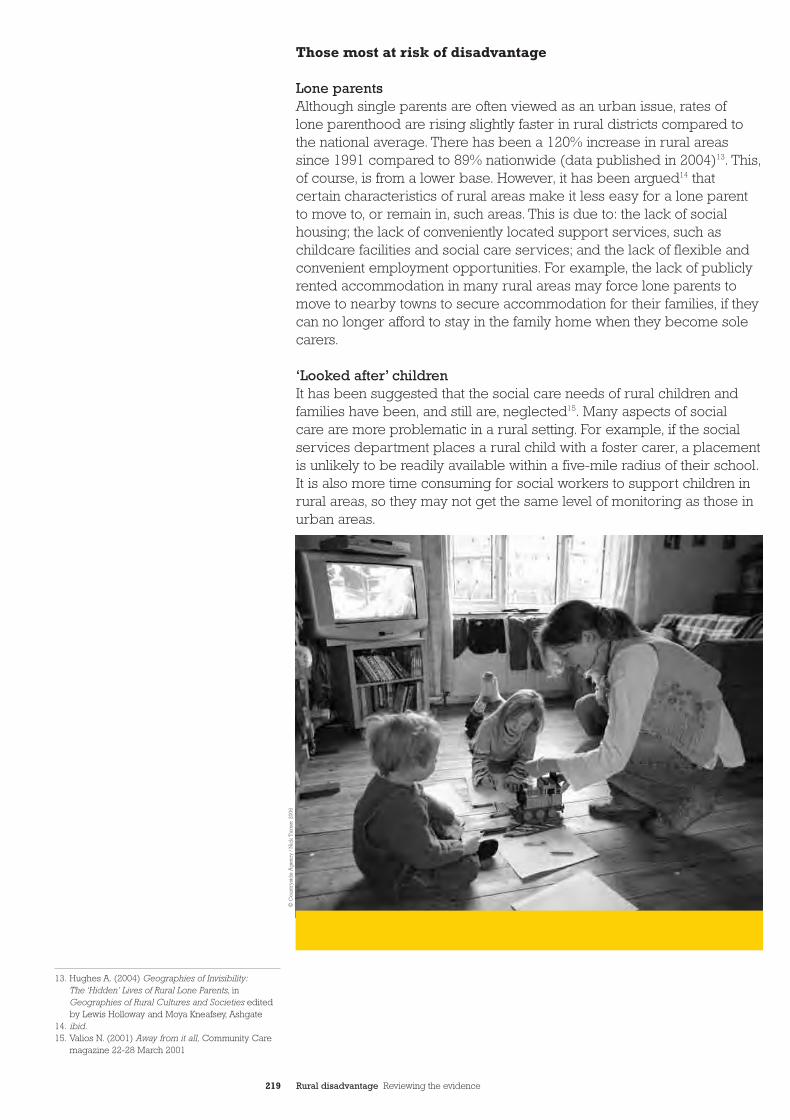
Those most at risk of disadvantage
Lone parentsAlthough single parents are often viewed as an urban issue, rates of lone parenthood are rising slightly faster in rural districts compared tothe national average. There has been a 120% increase in rural areassince 1991 compared to 89% nationwide (data published in 2004)13. This,of course, is from a lower base. However, it has been argued14 thatcertain characteristics of rural areas make it less easy for a lone parentto move to, or remain in, such areas. This is due to: the lack of socialhousing; the lack of conveniently located support services, such aschildcare facilities and social care services; and the lack of flexible andconvenient employment opportunities. For example, the lack of publiclyrented accommodation in many rural areas may force lone parents tomove to nearby towns to secure accommodation for their families, if theycan no longer afford to stay in the family home when they become solecarers.
‘Looked after’ childrenIt has been suggested that the social care needs of rural children andfamilies have been, and still are, neglected15. Many aspects of social care are more problematic in a rural setting. For example, if the socialservices department places a rural child with a foster carer, a placementis unlikely to be readily available within a five-mile radius of their school.It is also more time consuming for social workers to support children inrural areas, so they may not get the same level of monitoring as those inurban areas.
13. Hughes A. (2004) Geographies of Invisibility:The ‘Hidden’ Lives of Rural Lone Parents, inGeographies of Rural Cultures and Societies editedby Lewis Holloway and Moya Kneafsey, Ashgate
14. ibid.15. Valios N. (2001) Away from it all, Community Care
magazine 22-28 March 2001
© C
ount
rysi
de
Ag
ency
/ N
ick
Tur
ner
2006
219 Rural disadvantage Reviewing the evidence
CC32EvidenceSect4_AW 26/9/06 5:04 pm Page 219
Young people
Our focus here is young people between the ages of 13-241. In recentyears there has been a great deal of research on the experiences of youngpeople in rural areas, although much does not define what is meant byyoung people, most appear to refer to those in their teens and earlytwenties.
Table 19.1 illustrates that young people make up a smaller proportion ofthe population in rural, than in urban areas. This is largely due to the factthat many young people move from rural to urban areas, either fromchoice or necessity, to take-up employment or further education. This hasa number of implications, not least of which is that those young peopleremaining in rural areas may feel increasingly isolated. They are also lesslikely to benefit from services aimed at young people, if provision of suchservices relies on having sufficient numbers available to make themviable. There is evidence that the delivery of youth services has reducedover recent years and become non-existent in many rural areas2.
Just as in urban areas, young people growing up in rural areas have very different experiences of disadvantage, according to their familycircumstances, household incomes, proximity to friends, services andtransport and their own abilities and interests.
Transport disadvantageOne form of disadvantage that almost all young people in rural areasunder the age of 17 face is a lack of, or very limited, opportunity forindependent travel, since they are too young to drive and even if they livein an area served by public transport, it is unlikely to run at the times,such as week-ends and evenings, when they want to travel. Those tooyoung to drive often rely heavily on parental lifts, but the extent to whichsuch lifts are available is dependent on household car ownership andparents’ work and other responsibilities. For example, in one study4
young people living in households, with only one or no car, reported lessattendance at out-of-hours school activities than young people living inhouseholds with two or more cars.
Young people living in rural areas learn to drive at a younger age thanthose living in urban areas. Most pass their driving test and get their own cars before they reach the age of 205, often with financial supportfrom their parents. This reflects the importance attached to car ownershipand use among the rural population generally, but means that thoseyoung people whose families lack the financial resources to pay fordriving lessons and a car, or who are prevented from learning due toillness or disability, are at particular risk of disadvantage. They may alsofeel excluded from their peer group in a culture where such highimportance is placed on the ability to drive.
Table 19.1 Age groups by area definition (%)3
Age group Rural Urban
13-16 5.0 5.2
17-20 4.1 5.0
21-24 3.2 5.1
All aged 13-24 12.3 15.3
1. There is some overlap between this section and the Families and Children section which focusesprimarily on issues affecting younger children asthere are many issues which affect both childrenand young people
2. The Howard League for Penal Reform (undated)Once Upon A Time in The West: Social deprivationand rural youth crime
3. Source: ONS, 2001 Census4. Storey P. and Brannen J. (2000) Young People and
Transport in Rural Areas. The National Youth Agency5. ibid.
19
220 Rural disadvantage Reviewing the evidence
CC32EvidenceSect4_AW 26/9/06 5:04 pm Page 220
The cost of public transport may also be a problem, with young peoplein rural areas being less likely to benefit from concessionary faresschemes6. They are more likely to have to pay full fare from a youngerage and the discounts available are generally less generous (65% ofurban districts offer a 50% discount compared to 51% of rural districts).
Employment and educational disadvantageResearch in Scotland7 found that long-term youth unemployment tends to be less common in rural than in urban areas. However, rural labourmarkets are characterised by low skilled and insecure employment andlimited opportunities for young people to undergo training or to upgradetheir skills (since much rural employment is concentrated in small firms).This research also found that many rural employers have a poorknowledge of the New Deal for Young People and even those who areaware of the programme frequently feel unable to become involved.
Jobs in rural areas tend to be filled through personal contacts and thisstrong reliance on informal networks to secure employment means thatthose young people who lack local contacts or who do not have accessto these networks are at a disadvantage. There are a range of reasonswhy certain young people might be disadvantaged in this way, forexample, they may have been living in care, or they or their family maybe perceived as ‘troublemakers’.
Nationally more than 10% of young people aged 16-18 are not inemployment, education or training (known as NEET). Research in Suffolkfound that some rural areas have a high percentage of NEET8. They alsofound that individual schools show a wide variation in the numbers ofyoung people who are recorded as NEET in the autumn after they leaveschool. Research in Scotland9 identified transport and access issuesassociated with living in a rural area as one of the factors contributing to people being NEET. This research also found that certain NEET sub-groups experienced particular problems in rural areas, for example,recovering drug users suffer from a lack of specialist support servicesand problems associated with stigma.
The lack of employment and further education opportunities in manyrural areas leads to a ‘to get on, you have to get out’ mentality amongsome and low aspirations among those left behind.
Income disadvantageYoung workers are one of the groups most likely to be experiencing lowpay. Workers under 16 years old are excluded from the provisions of theNational Minimum Wage and to encourage their employment, the rate for16-17 year olds is only £3 an hour compared to £4.25 for 18 to 21 yearolds and £5.05 for workers aged 22 and over.
It has been suggested that there is lower uptake of benefits by eligibleyoung people in rural areas. In one recent piece of research10 practitionerssuggested that young people in cyclical and seasonal employmentperceive it to be too complex to complete and re-complete benefit claimforms every time their employment status changes. Instead, they preferto subsist on lower incomes and on family support.
6. The TAS Partnership Limited (2005) Research intothe Provision of Concessionary Fares for YoungPeople in Rural Areas: A report for the Commissionfor Rural Communities
7. Cartmel F. and Furlong A. (2000) YouthUnemployment in Rural Areas. York PublishingServices
8. Suffolk NEET Research Working Group (2005)Suffolk NEET Research Report
9. Scottish Executive (2005) Literature Review of theNEET Group
10. ECOTEC (2006) Research into the Aspirations of Young People in Rural West Midlands. Anunpublished report for the Commission for RuralCommunities
221 Rural disadvantage Reviewing the evidence
CC32EvidenceSect4_AW 26/9/06 5:04 pm Page 221
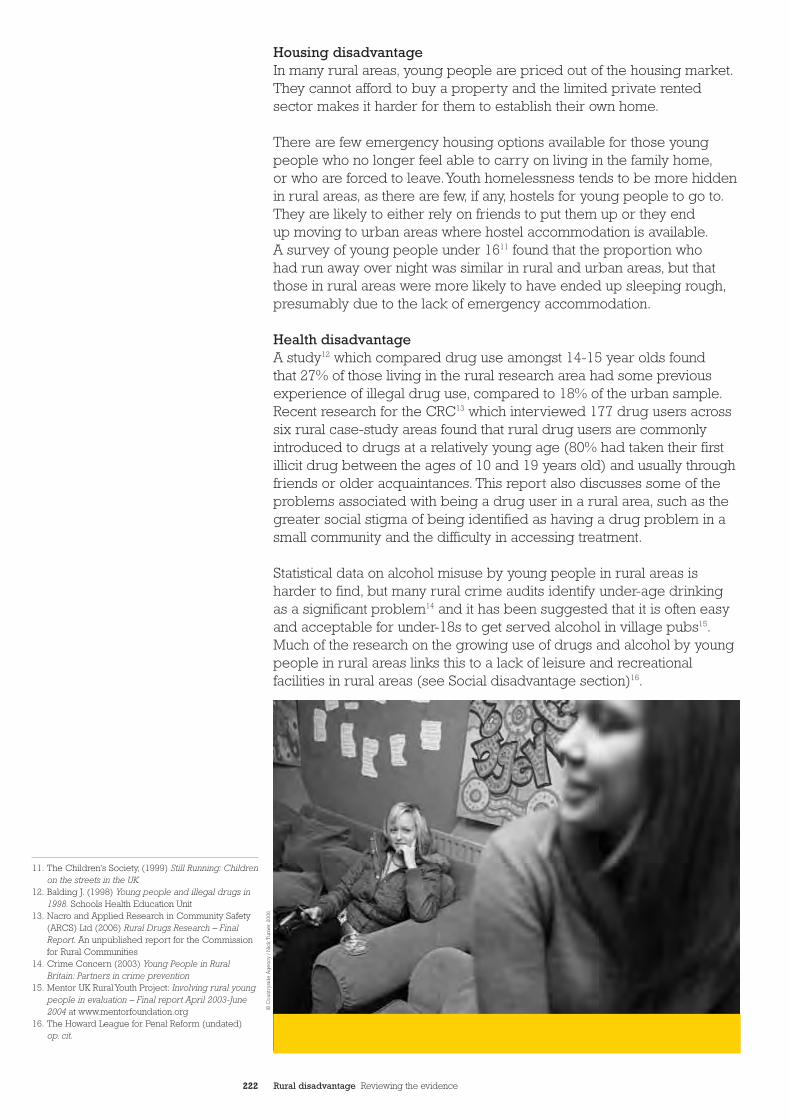
Housing disadvantageIn many rural areas, young people are priced out of the housing market.They cannot afford to buy a property and the limited private rentedsector makes it harder for them to establish their own home.
There are few emergency housing options available for those youngpeople who no longer feel able to carry on living in the family home,or who are forced to leave.Youth homelessness tends to be more hiddenin rural areas, as there are few, if any, hostels for young people to go to.They are likely to either rely on friends to put them up or they end up moving to urban areas where hostel accommodation is available.A survey of young people under 1611 found that the proportion who had run away over night was similar in rural and urban areas, but thatthose in rural areas were more likely to have ended up sleeping rough,presumably due to the lack of emergency accommodation.
Health disadvantageA study12 which compared drug use amongst 14-15 year olds found that 27% of those living in the rural research area had some previousexperience of illegal drug use, compared to 18% of the urban sample.Recent research for the CRC13 which interviewed 177 drug users acrosssix rural case-study areas found that rural drug users are commonlyintroduced to drugs at a relatively young age (80% had taken their firstillicit drug between the ages of 10 and 19 years old) and usually throughfriends or older acquaintances. This report also discusses some of theproblems associated with being a drug user in a rural area, such as thegreater social stigma of being identified as having a drug problem in asmall community and the difficulty in accessing treatment.
Statistical data on alcohol misuse by young people in rural areas isharder to find, but many rural crime audits identify under-age drinkingas a significant problem14 and it has been suggested that it is often easyand acceptable for under-18s to get served alcohol in village pubs15.Much of the research on the growing use of drugs and alcohol by youngpeople in rural areas links this to a lack of leisure and recreationalfacilities in rural areas (see Social disadvantage section)16.
11. The Children’s Society, (1999) Still Running: Childrenon the streets in the UK
12. Balding J. (1998) Young people and illegal drugs in1998. Schools Health Education Unit
13. Nacro and Applied Research in Community Safety(ARCS) Ltd (2006) Rural Drugs Research – FinalReport. An unpublished report for the Commissionfor Rural Communities
14. Crime Concern (2003) Young People in RuralBritain: Partners in crime prevention
15. Mentor UK Rural Youth Project: Involving rural youngpeople in evaluation – Final report April 2003-June2004 at www.mentorfoundation.org
16. The Howard League for Penal Reform (undated) op. cit.
© C
ount
rysi
de
Ag
ency
/ N
ick
Tur
ner
2006
222 Rural disadvantage Reviewing the evidence
CC32EvidenceSect4_AW 26/9/06 5:04 pm Page 222
It has been suggested that easy access to alcohol in rural areasincreases the likelihood of risky sexual behaviour. Research17 into thefactors that shape young people’s attitudes to, and experiences of, sexualbehaviour and young parenthood in seaside and rural areas, found thatthe isolation, difficulties in accessing services and heightened ‘visibility’in rural areas often accentuated the difficulties that young peopleexperienced around these issues. Embarrassment, low aspirations, lowfamily expectations and lack of self-esteem were seen to be associatedwith risky behaviours.Young people in rural areas also describedgendered roles and rules for sexual behaviour. Scarcity of sexual health services, transport problems and high visibility heightened thedifficulties that some young people experienced.Young people in moreremote rural areas often had access to a limited range of professionals,usually known to them and their families, which acted as a significantbarrier to seeking advice. The research also identified that youngpeople’s ability to approach sexual health services was compromised by dependence on their parents for transport.
Social disadvantageHanging out with friends appears to be the major leisure activity ofyoung people in both rural and urban areas18.Young people need thisopportunity in order to be able to develop their own identities separatelyfrom their parents. This may be harder in small communities whereyoung people are highly visible and are more likely to be observed bythose who know them, or their parents. There is evidence that youngpeople in rural areas are limited in where they can get away from adultsand restricted in their use of public spaces19.
There also appears to be less tolerance of young people in many smallcommunities and a readiness to describe their behaviour as anti-social,with the result that young people can feel stigmatised and marginalised.In one study20 in a small town in Somerset, 77% of the young peoplesurveyed agreed with the statement ‘adults in my community see youngpeople as a problem’.
The ability to be recognised and known in your community can be apositive aspect of rural life. However, for young people who rightly orwrongly develop a bad reputation, this visibility can be a disadvantage.A study of young offenders from rural areas21 found that many felt unableto return to the small communities they had grown up in after their release,as everyone would know they had been in prison and it would beimpossible to shake off their reputation.
Those most at risk of disadvantageThere is evidence that young people who have been in care are atparticular risk of disadvantage in rural areas22, both while they are incare and subsequently. While they are in care, placements may be some distance from their home area making it difficult to maintaincontact with family and friends. It can also be difficult to ensure youngpeople continue at the same school when placements break down, dueto the longer distances involved. This is likely to have a negative impacton their educational achievements. Once young people leave care,transport and financial barriers may limit their ability to maintain contactwith whatever support networks they have developed.
17. Teenage Pregnancy Unit (2004) Living on the Edge:Sexual behaviour and young parenthood in seasideand rural areas
18. Moore S. (2003) Hanging About: The importance of bus-stop culture, Youth and Policy No. 82,Winter 2003/4, pp47-59
19. The Howard League for Penal Reform (undated) op.cit.
20. The Howard League for Penal Reform (undated) op.cit.
21. The Howard League for Penal Reform (undated) op. cit.
22. Allen M. (2003) Into the Mainstream: Care leaversentering work, education and training
223 Rural disadvantage Reviewing the evidence
CC32EvidenceSect4_AW 26/9/06 5:04 pm Page 223
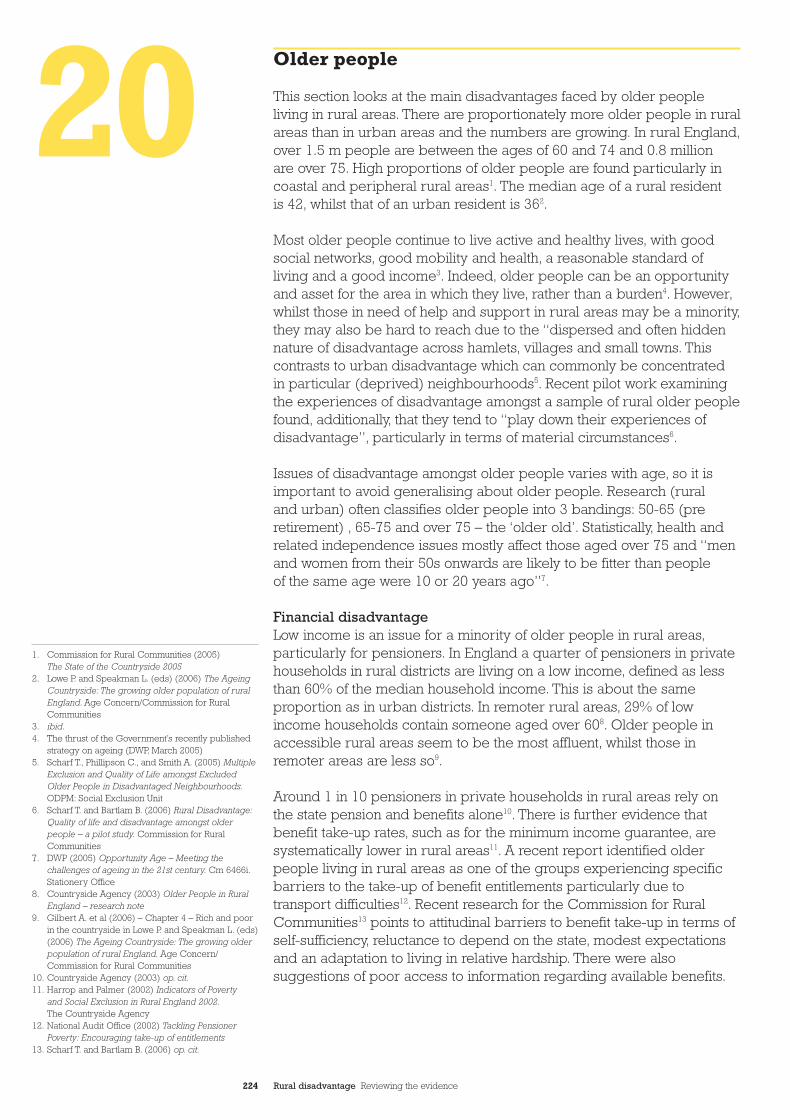
Older people
This section looks at the main disadvantages faced by older peopleliving in rural areas. There are proportionately more older people in ruralareas than in urban areas and the numbers are growing. In rural England,over 1.5 m people are between the ages of 60 and 74 and 0.8 million are over 75. High proportions of older people are found particularly incoastal and peripheral rural areas1. The median age of a rural resident is 42, whilst that of an urban resident is 362.
Most older people continue to live active and healthy lives, with goodsocial networks, good mobility and health, a reasonable standard ofliving and a good income3. Indeed, older people can be an opportunityand asset for the area in which they live, rather than a burden4. However,whilst those in need of help and support in rural areas may be a minority,they may also be hard to reach due to the “dispersed and often hiddennature of disadvantage across hamlets, villages and small towns. Thiscontrasts to urban disadvantage which can commonly be concentrated in particular (deprived) neighbourhoods5. Recent pilot work examiningthe experiences of disadvantage amongst a sample of rural older peoplefound, additionally, that they tend to “play down their experiences ofdisadvantage”, particularly in terms of material circumstances6.
Issues of disadvantage amongst older people varies with age, so it isimportant to avoid generalising about older people. Research (rural and urban) often classifies older people into 3 bandings: 50-65 (preretirement) , 65-75 and over 75 – the ‘older old’. Statistically, health andrelated independence issues mostly affect those aged over 75 and “menand women from their 50s onwards are likely to be fitter than people of the same age were 10 or 20 years ago”7.
Financial disadvantageLow income is an issue for a minority of older people in rural areas,particularly for pensioners. In England a quarter of pensioners in privatehouseholds in rural districts are living on a low income, defined as lessthan 60% of the median household income. This is about the sameproportion as in urban districts. In remoter rural areas, 29% of lowincome households contain someone aged over 608. Older people inaccessible rural areas seem to be the most affluent, whilst those inremoter areas are less so9.
Around 1 in 10 pensioners in private households in rural areas rely onthe state pension and benefits alone10. There is further evidence thatbenefit take-up rates, such as for the minimum income guarantee, aresystematically lower in rural areas11. A recent report identified olderpeople living in rural areas as one of the groups experiencing specificbarriers to the take-up of benefit entitlements particularly due totransport difficulties12. Recent research for the Commission for RuralCommunities13 points to attitudinal barriers to benefit take-up in terms ofself-sufficiency, reluctance to depend on the state, modest expectationsand an adaptation to living in relative hardship. There were alsosuggestions of poor access to information regarding available benefits.
1. Commission for Rural Communities (2005) The State of the Countryside 2005
2. Lowe P. and Speakman L. (eds) (2006) The AgeingCountryside: The growing older population of ruralEngland. Age Concern/Commission for RuralCommunities
3. ibid.4. The thrust of the Government’s recently published
strategy on ageing (DWP, March 2005)5. Scharf T., Phillipson C., and Smith A. (2005) Multiple
Exclusion and Quality of Life amongst ExcludedOlder People in Disadvantaged Neighbourhoods.ODPM: Social Exclusion Unit
6. Scharf T. and Bartlam B. (2006) Rural Disadvantage:Quality of life and disadvantage amongst olderpeople – a pilot study. Commission for RuralCommunities
7. DWP (2005) Opportunity Age – Meeting thechallenges of ageing in the 21st century. Cm 6466i.Stationery Office
8. Countryside Agency (2003) Older People in RuralEngland – research note
9. Gilbert A. et al (2006) – Chapter 4 – Rich and poorin the countryside in Lowe P. and Speakman L. (eds)(2006) The Ageing Countryside: The growing olderpopulation of rural England. Age Concern/Commission for Rural Communities
10. Countryside Agency (2003) op. cit.11. Harrop and Palmer (2002) Indicators of Poverty
and Social Exclusion in Rural England 2002.The Countryside Agency
12. National Audit Office (2002) Tackling PensionerPoverty: Encouraging take-up of entitlements
13. Scharf T. and Bartlam B. (2006) op. cit.
20
224 Rural disadvantage Reviewing the evidence
CC32EvidenceSect4_AW 26/9/06 5:04 pm Page 224
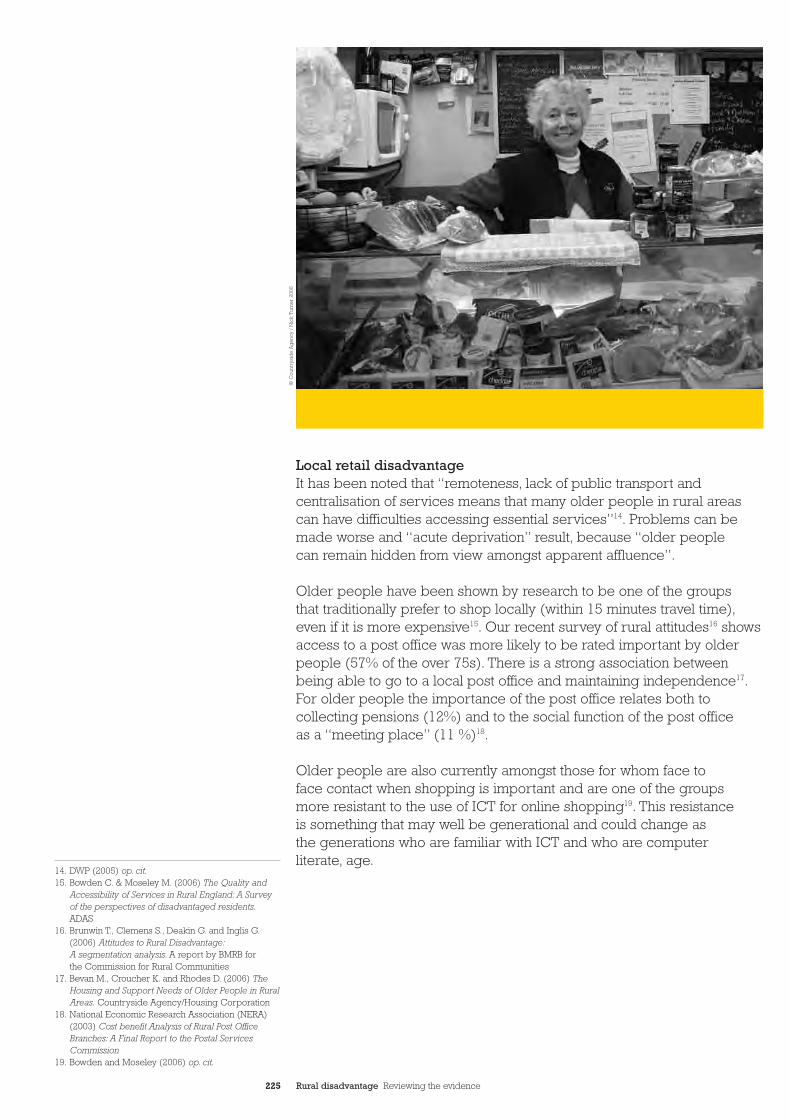
Local retail disadvantageIt has been noted that “remoteness, lack of public transport andcentralisation of services means that many older people in rural areascan have difficulties accessing essential services”14. Problems can bemade worse and “acute deprivation” result, because “older people can remain hidden from view amongst apparent affluence”.
Older people have been shown by research to be one of the groups that traditionally prefer to shop locally (within 15 minutes travel time),even if it is more expensive15. Our recent survey of rural attitudes16 showsaccess to a post office was more likely to be rated important by olderpeople (57% of the over 75s). There is a strong association betweenbeing able to go to a local post office and maintaining independence17.For older people the importance of the post office relates both tocollecting pensions (12%) and to the social function of the post office as a “meeting place” (11 %)18.
Older people are also currently amongst those for whom face to face contact when shopping is important and are one of the groups more resistant to the use of ICT for online shopping19. This resistance is something that may well be generational and could change as the generations who are familiar with ICT and who are computer literate, age.
14. DWP (2005) op. cit.15. Bowden C. & Moseley M. (2006) The Quality and
Accessibility of Services in Rural England: A Surveyof the perspectives of disadvantaged residents.ADAS
16. Brunwin T., Clemens S., Deakin G. and Inglis G.(2006) Attitudes to Rural Disadvantage:A segmentation analysis. A report by BMRB for the Commission for Rural Communities
17. Bevan M., Croucher K. and Rhodes D. (2006) TheHousing and Support Needs of Older People in RuralAreas. Countryside Agency/Housing Corporation
18. National Economic Research Association (NERA)(2003) Cost benefit Analysis of Rural Post OfficeBranches: A Final Report to the Postal ServicesCommission
19. Bowden and Moseley (2006) op. cit.
© C
ount
rysi
de
Ag
ency
/ N
ick
Tur
ner
2006
225 Rural disadvantage Reviewing the evidence
CC32EvidenceSect4_AW 26/9/06 5:04 pm Page 225
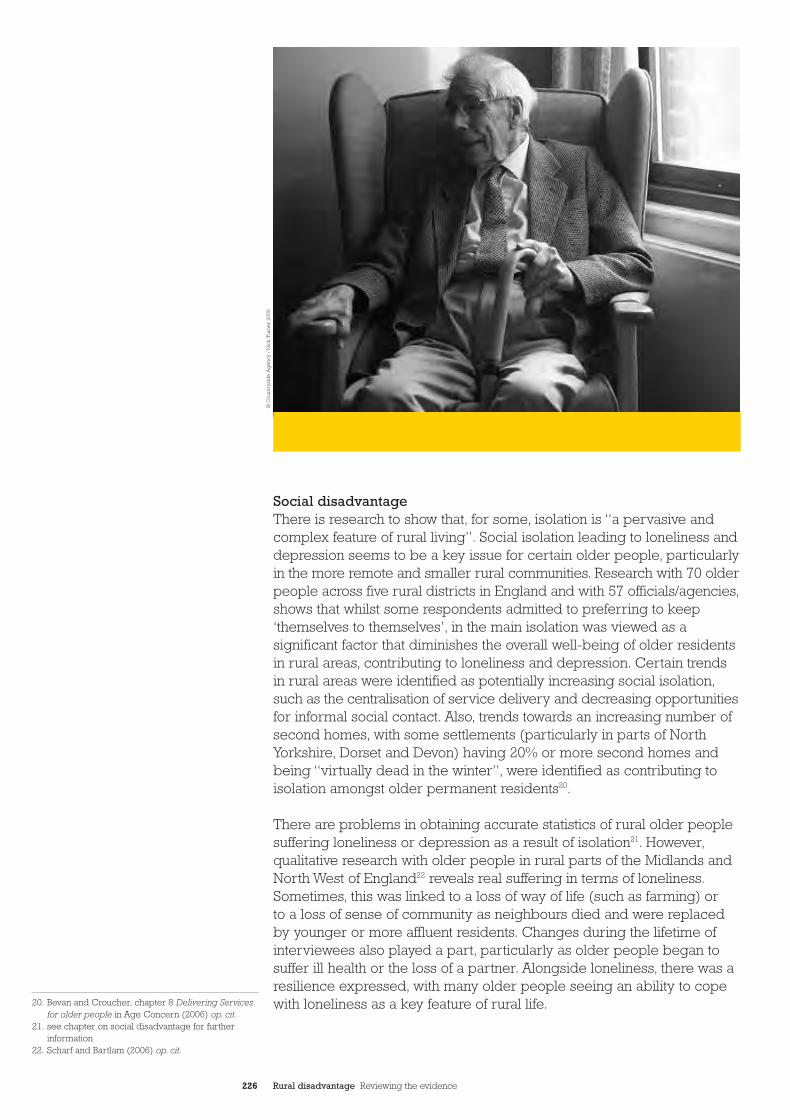
Social disadvantage There is research to show that, for some, isolation is “a pervasive andcomplex feature of rural living”. Social isolation leading to loneliness anddepression seems to be a key issue for certain older people, particularlyin the more remote and smaller rural communities. Research with 70 olderpeople across five rural districts in England and with 57 officials/agencies,shows that whilst some respondents admitted to preferring to keep‘themselves to themselves’, in the main isolation was viewed as asignificant factor that diminishes the overall well-being of older residentsin rural areas, contributing to loneliness and depression. Certain trendsin rural areas were identified as potentially increasing social isolation,such as the centralisation of service delivery and decreasing opportunitiesfor informal social contact. Also, trends towards an increasing number ofsecond homes, with some settlements (particularly in parts of NorthYorkshire, Dorset and Devon) having 20% or more second homes andbeing “virtually dead in the winter”, were identified as contributing toisolation amongst older permanent residents20.
There are problems in obtaining accurate statistics of rural older peoplesuffering loneliness or depression as a result of isolation21. However,qualitative research with older people in rural parts of the Midlands andNorth West of England22 reveals real suffering in terms of loneliness.Sometimes, this was linked to a loss of way of life (such as farming) or to a loss of sense of community as neighbours died and were replacedby younger or more affluent residents. Changes during the lifetime ofinterviewees also played a part, particularly as older people began tosuffer ill health or the loss of a partner. Alongside loneliness, there was aresilience expressed, with many older people seeing an ability to copewith loneliness as a key feature of rural life.20. Bevan and Croucher, chapter 8 Delivering Services
for older people in Age Concern (2006) op. cit.21. see chapter on social disadvantage for further
information22. Scharf and Bartlam (2006) op. cit.
© C
ount
rysi
de
Ag
ency
/ N
ick
Tur
ner
2006
226 Rural disadvantage Reviewing the evidence
CC32EvidenceSect4_AW 26/9/06 5:04 pm Page 226
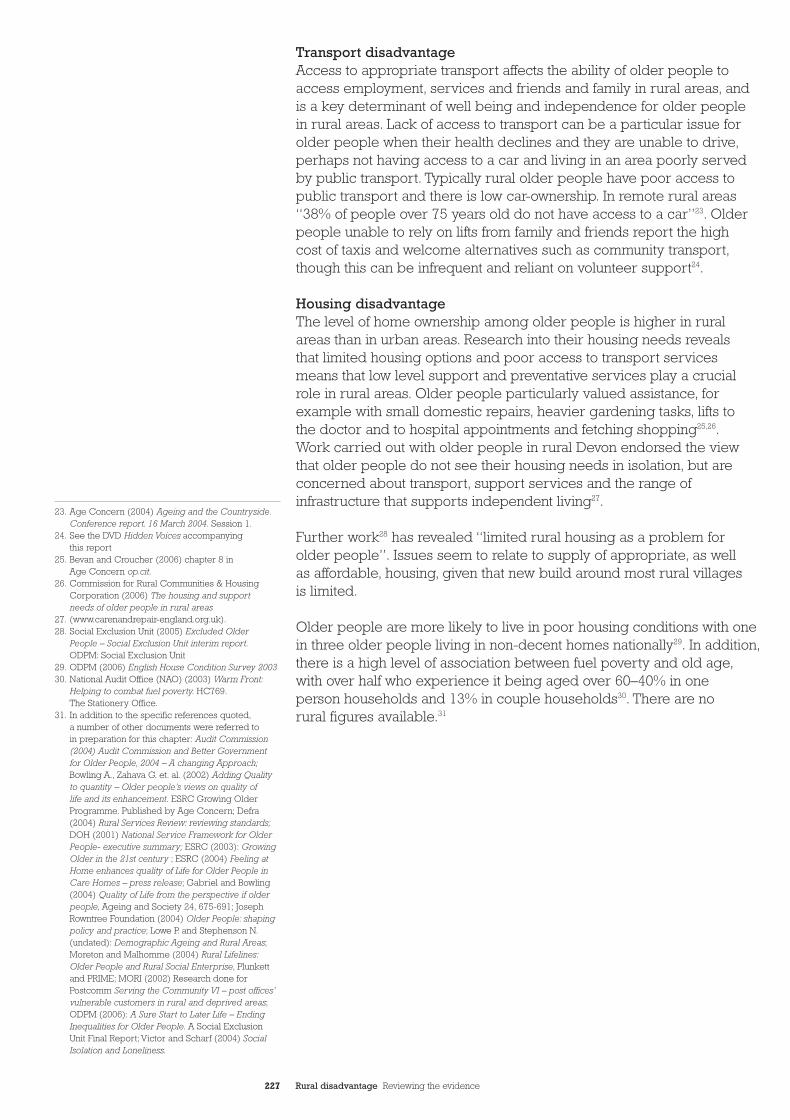
Transport disadvantageAccess to appropriate transport affects the ability of older people toaccess employment, services and friends and family in rural areas, andis a key determinant of well being and independence for older people in rural areas. Lack of access to transport can be a particular issue forolder people when their health declines and they are unable to drive,perhaps not having access to a car and living in an area poorly servedby public transport. Typically rural older people have poor access topublic transport and there is low car-ownership. In remote rural areas“38% of people over 75 years old do not have access to a car”23. Olderpeople unable to rely on lifts from family and friends report the high cost of taxis and welcome alternatives such as community transport,though this can be infrequent and reliant on volunteer support24.
Housing disadvantageThe level of home ownership among older people is higher in ruralareas than in urban areas. Research into their housing needs reveals that limited housing options and poor access to transport servicesmeans that low level support and preventative services play a crucialrole in rural areas. Older people particularly valued assistance, forexample with small domestic repairs, heavier gardening tasks, lifts to the doctor and to hospital appointments and fetching shopping25,26.Work carried out with older people in rural Devon endorsed the viewthat older people do not see their housing needs in isolation, but areconcerned about transport, support services and the range ofinfrastructure that supports independent living27.
Further work28 has revealed “limited rural housing as a problem for older people”. Issues seem to relate to supply of appropriate, as well as affordable, housing, given that new build around most rural villages is limited.
Older people are more likely to live in poor housing conditions with onein three older people living in non-decent homes nationally29. In addition,there is a high level of association between fuel poverty and old age,with over half who experience it being aged over 60–40% in one person households and 13% in couple households30. There are no rural figures available.31
23. Age Concern (2004) Ageing and the Countryside.Conference report. 16 March 2004. Session 1.
24. See the DVD Hidden Voices accompanying this report
25. Bevan and Croucher (2006) chapter 8 in Age Concern op.cit.
26. Commission for Rural Communities & HousingCorporation (2006) The housing and support needs of older people in rural areas
27. (www.carenandrepair-england.org.uk).28. Social Exclusion Unit (2005) Excluded Older
People – Social Exclusion Unit interim report.ODPM: Social Exclusion Unit
29. ODPM (2006) English House Condition Survey 200330. National Audit Office (NAO) (2003) Warm Front:
Helping to combat fuel poverty. HC769.The Stationery Office.
31. In addition to the specific references quoted,a number of other documents were referred to in preparation for this chapter: Audit Commission(2004) Audit Commission and Better Government for Older People, 2004 – A changing Approach;Bowling A., Zahava G. et. al. (2002) Adding Qualityto quantity – Older people’s views on quality of life and its enhancement. ESRC Growing OlderProgramme. Published by Age Concern; Defra(2004) Rural Services Review: reviewing standards;DOH (2001) National Service Framework for OlderPeople- executive summary; ESRC (2003): GrowingOlder in the 21st century ; ESRC (2004) Feeling atHome enhances quality of Life for Older People inCare Homes – press release; Gabriel and Bowling(2004) Quality of Life from the perspective if olderpeople, Ageing and Society 24, 675-691; JosephRowntree Foundation (2004) Older People: shapingpolicy and practice; Lowe P. and Stephenson N.(undated): Demographic Ageing and Rural Areas;Moreton and Malhomme (2004) Rural Lifelines:Older People and Rural Social Enterprise, Plunkettand PRIME; MORI (2002) Research done forPostcomm Serving the Community VI – post offices’vulnerable customers in rural and deprived areas;ODPM (2006): A Sure Start to Later Life – EndingInequalities for Older People. A Social ExclusionUnit Final Report; Victor and Scharf (2004) SocialIsolation and Loneliness.
227 Rural disadvantage Reviewing the evidence
CC32EvidenceSect4_AW 26/9/06 5:04 pm Page 227
228 Rural disadvantage Reviewing the evidence
Women
This section looks at the main disadvantages faced by some womenliving in rural areas. There is relatively little specific research into genderand rural disadvantage and much is now in need of expanding as itrelates mainly to women in farming families. More recent work hasfocussed on women’s contribution to the rural economy and barriers to their participation in employment1. There remains limited research into women’s disadvantage by type of rural area2 or into the differentcharacteristics of women (for example by age, race, or marital status).It has been argued that evidence of a low priority given to women’sneeds in rural areas is indicative of a view that gender inequality isessentially an urban issue3. This lack of in depth research tends toundermine assertions that social capital has been sustained in Britain largely by virtue of the increasing participation of women in the community4.
Some research has pointed to the hidden nature of the problem.Research in rural Cumbria estimated there were 400 women carers,although the three agencies responsible for carers in the area hadrecords for only one, none and one carer respectively5. Support workaimed at women on low incomes in the Peak District6 encountereddifficulties, both from the hidden nature of the issue and the negativeperception of the project’s focus.
Employment disadvantageThe key disadvantages seem to centre on women being amongst thosefrequently in low paid or poorly skilled employment. Research carriedout in Wiltshire, Cornwall and Derbyshire7 concluded that women’semployment rates in the countryside were below national rates andshowed evidence of a small group of women working for extremely lowwages with poor job security and little occupational choice. More recentresearch8 confirms the poor range of job opportunities for women withinrural areas, with available employment opportunities predominantlypoorly paid, low or unskilled and part-time.
Barriers women face in entering employment include: long travel times;limited transport, and/or costly public transport; poor roads; lack ofchildcare; and lack of health care for their caring responsibilities9. Under-provision of various forms of childcare services in rural areas anddifficulties accessing appropriate and affordable childcare seems to be aparticular barrier10. Other barriers may include low levels of confidence,unattractively low wages and lack of experience11, 12.
There is some debate about the extent to which rurality is a constraint to women’s employment in itself or rather reinforces the effect of otherstructural, cultural and individual restrictions. Recent research on womenand employment in Eastern England13 suggests that a rural location ismostly a “re-enforcer of constraints and difficulties” faced by womenseeking employment. Furthermore, the research suggests this constrainingeffect is stronger with increasing remoteness and spatial isolation.
1. Little J. & Morris C. (2002) The Role andContribution of Women to Rural Economies.Countryside Agency; Little J. (2002) Gender andRural Geography. Harlow Prentice Hall; Commissionfor Rural Communities (2005) Factsheet: Women inRural Areas
2. Little and Morris (2002) op. cit. is one exception asit took three rural case study areas
3. Little J. (2002) op. cit.4. Hall P. (1999) Social Capital in Britain. British Journal
of Political Science (Vol 29, pp 417-661)5. Cornish S. et. al. ( 2002) Under the Stones: Hidden
needs in Cumbria. Northern Fells Project6. Peak District Deprivation Forum (2001) Amethyst
Project Interim Evaluation Report. Derbyshire7. Little, Ross and Collins (1991) Women and
Employment in Rural Areas. Rural DevelopmentCommission Research Report 10
8. Little (1997) Women and voluntary work in ruralcommunities: Gender, place and culture. 4. 197-209
9. Woodward R. & Halfacree K. (2002) Influences onLeadership and Local Power in European RuralDevelopment; Alsop R. (2002) Beyond the BusShelter: Young women’s choices and challenges in rural areas. YWCA; Lindsay et. al. (2003)Unemployment Duration and Employability inRemote Rural Labour Markets. Journal of RuralStudies, 19, pp 187-200, Commission for RuralCommunities (2005) op. cit.
10. Stone M. (1990) Rural Childcare. Rural DevelopmentCommission Research report 9
11. Commission for Rural Communities (2005)Factsheet. op. cit.
12. The Commission for Rural Communities, with theWomen in Rural England network (WIRE), iscurrently undertaking research to understandbarriers to employment such as lack of confidenceand self-belief
13. Henderson S. R. & Hoggart K. (2003) Ruralities andGender Divisions of Labour in Eastern England.Sociologia Ruralis 43, 4, 349-378
21CC32EvidenceSect4_AW 26/9/06 5:04 pm Page 228
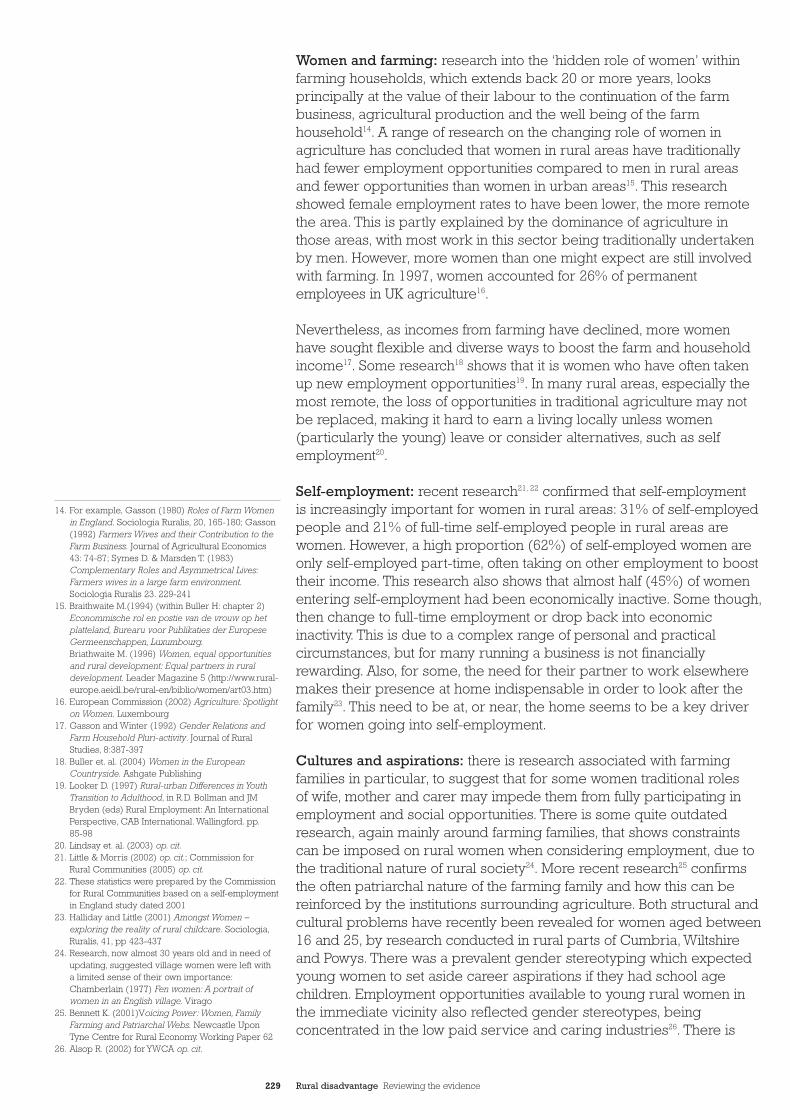
229 Rural disadvantage Reviewing the evidence
Women and farming: research into the ‘hidden role of women’ withinfarming households, which extends back 20 or more years, looksprincipally at the value of their labour to the continuation of the farmbusiness, agricultural production and the well being of the farmhousehold14. A range of research on the changing role of women inagriculture has concluded that women in rural areas have traditionallyhad fewer employment opportunities compared to men in rural areasand fewer opportunities than women in urban areas15. This researchshowed female employment rates to have been lower, the more remotethe area. This is partly explained by the dominance of agriculture inthose areas, with most work in this sector being traditionally undertakenby men. However, more women than one might expect are still involvedwith farming. In 1997, women accounted for 26% of permanentemployees in UK agriculture16.
Nevertheless, as incomes from farming have declined, more womenhave sought flexible and diverse ways to boost the farm and householdincome17. Some research18 shows that it is women who have often takenup new employment opportunities19. In many rural areas, especially themost remote, the loss of opportunities in traditional agriculture may notbe replaced, making it hard to earn a living locally unless women(particularly the young) leave or consider alternatives, such as selfemployment20.
Self-employment: recent research21, 22 confirmed that self-employment is increasingly important for women in rural areas: 31% of self-employedpeople and 21% of full-time self-employed people in rural areas arewomen. However, a high proportion (62%) of self-employed women areonly self-employed part-time, often taking on other employment to boosttheir income. This research also shows that almost half (45%) of womenentering self-employment had been economically inactive. Some though,then change to full-time employment or drop back into economicinactivity. This is due to a complex range of personal and practicalcircumstances, but for many running a business is not financiallyrewarding. Also, for some, the need for their partner to work elsewheremakes their presence at home indispensable in order to look after thefamily23. This need to be at, or near, the home seems to be a key driverfor women going into self-employment.
Cultures and aspirations: there is research associated with farmingfamilies in particular, to suggest that for some women traditional roles of wife, mother and carer may impede them from fully participating inemployment and social opportunities. There is some quite outdatedresearch, again mainly around farming families, that shows constraintscan be imposed on rural women when considering employment, due tothe traditional nature of rural society24. More recent research25 confirmsthe often patriarchal nature of the farming family and how this can bereinforced by the institutions surrounding agriculture. Both structural andcultural problems have recently been revealed for women aged between16 and 25, by research conducted in rural parts of Cumbria, Wiltshireand Powys. There was a prevalent gender stereotyping which expectedyoung women to set aside career aspirations if they had school agechildren. Employment opportunities available to young rural women inthe immediate vicinity also reflected gender stereotypes, beingconcentrated in the low paid service and caring industries26. There is
14. For example, Gasson (1980) Roles of Farm Womenin England. Sociologia Ruralis, 20, 165-180; Gasson(1992) Farmers Wives and their Contribution to theFarm Business. Journal of Agricultural Economics43: 74-87; Symes D. & Marsden T. (1983)Complementary Roles and Asymmetrical Lives:Farmers wives in a large farm environment.Sociologia Ruralis 23. 229-241
15. Braithwaite M.(1994) (within Buller H: chapter 2)Econommische rol en postie van de vrouw op hetplatteland, Burearu voor Publikaties der EuropeseGermeenschappen, Luxumbourg.Briathwaite M. (1996) Women, equal opportunitiesand rural development: Equal partners in ruraldevelopment. Leader Magazine 5 (http://www.rural-europe.aeidl.be/rural-en/biblio/women/art03.htm)
16. European Commission (2002) Agriculture: Spotlighton Women. Luxembourg
17. Gasson and Winter (1992) Gender Relations andFarm Household Pluri-activity. Journal of RuralStudies, 8:387-397
18. Buller et. al. (2004) Women in the EuropeanCountryside. Ashgate Publishing
19. Looker D. (1997) Rural-urban Differences in YouthTransition to Adulthood, in R.D. Bollman and JMBryden (eds) Rural Employment: An InternationalPerspective, CAB International. Wallingford. pp.85-98
20. Lindsay et. al. (2003) op. cit.21. Little & Morris (2002) op. cit.; Commission for
Rural Communities (2005) op. cit.22. These statistics were prepared by the Commission
for Rural Communities based on a self-employmentin England study dated 2001
23. Halliday and Little (2001) Amongst Women –exploring the reality of rural childcare. Sociologia,Ruralis, 41, pp 423-437
24. Research, now almost 30 years old and in need ofupdating, suggested village women were left with a limited sense of their own importance:Chamberlain (1977) Fen women: A portrait ofwomen in an English village. Virago
25. Bennett K. (2001)Voicing Power: Women, FamilyFarming and Patriarchal Webs. Newcastle UponTyne Centre for Rural Economy. Working Paper 62
26. Alsop R. (2002) for YWCA op. cit.
CC32EvidenceSect4_AW 26/9/06 5:04 pm Page 229
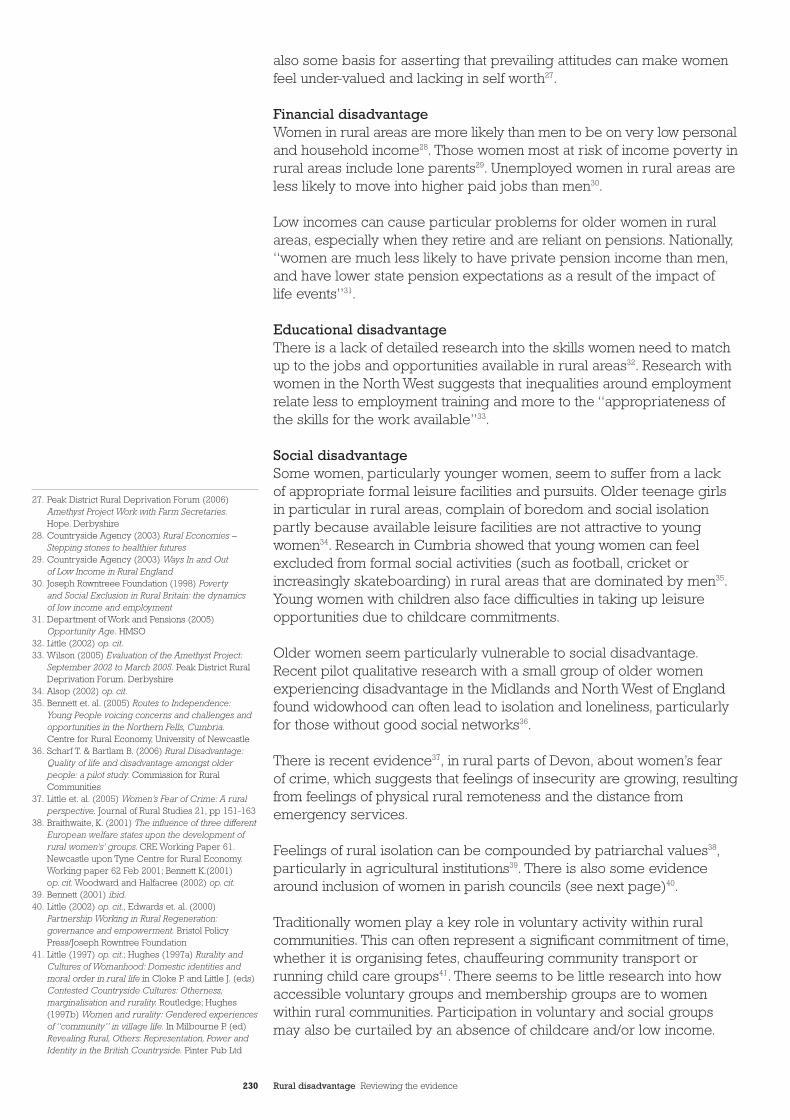
230 Rural disadvantage Reviewing the evidence
also some basis for asserting that prevailing attitudes can make womenfeel under-valued and lacking in self worth27.
Financial disadvantageWomen in rural areas are more likely than men to be on very low personaland household income28. Those women most at risk of income poverty inrural areas include lone parents29. Unemployed women in rural areas areless likely to move into higher paid jobs than men30.
Low incomes can cause particular problems for older women in ruralareas, especially when they retire and are reliant on pensions. Nationally,“women are much less likely to have private pension income than men,and have lower state pension expectations as a result of the impact of life events”31.
Educational disadvantageThere is a lack of detailed research into the skills women need to matchup to the jobs and opportunities available in rural areas32. Research withwomen in the North West suggests that inequalities around employmentrelate less to employment training and more to the “appropriateness ofthe skills for the work available”33.
Social disadvantageSome women, particularly younger women, seem to suffer from a lack of appropriate formal leisure facilities and pursuits. Older teenage girlsin particular in rural areas, complain of boredom and social isolationpartly because available leisure facilities are not attractive to youngwomen34. Research in Cumbria showed that young women can feelexcluded from formal social activities (such as football, cricket orincreasingly skateboarding) in rural areas that are dominated by men35.Young women with children also face difficulties in taking up leisureopportunities due to childcare commitments.
Older women seem particularly vulnerable to social disadvantage.Recent pilot qualitative research with a small group of older womenexperiencing disadvantage in the Midlands and North West of Englandfound widowhood can often lead to isolation and loneliness, particularlyfor those without good social networks36.
There is recent evidence37, in rural parts of Devon, about women’s fear of crime, which suggests that feelings of insecurity are growing, resultingfrom feelings of physical rural remoteness and the distance fromemergency services.
Feelings of rural isolation can be compounded by patriarchal values38,particularly in agricultural institutions39. There is also some evidencearound inclusion of women in parish councils (see next page)40.
Traditionally women play a key role in voluntary activity within ruralcommunities. This can often represent a significant commitment of time,whether it is organising fetes, chauffeuring community transport orrunning child care groups41. There seems to be little research into howaccessible voluntary groups and membership groups are to womenwithin rural communities. Participation in voluntary and social groupsmay also be curtailed by an absence of childcare and/or low income.
27. Peak District Rural Deprivation Forum (2006)Amethyst Project Work with Farm Secretaries.Hope. Derbyshire
28. Countryside Agency (2003) Rural Economies –Stepping stones to healthier futures
29. Countryside Agency (2003) Ways In and Out of Low Income in Rural England
30. Joseph Rowntreee Foundation (1998) Poverty and Social Exclusion in Rural Britain: the dynamics of low income and employment
31. Department of Work and Pensions (2005)Opportunity Age. HMSO
32. Little (2002) op. cit.33. Wilson (2005) Evaluation of the Amethyst Project:
September 2002 to March 2005. Peak District RuralDeprivation Forum. Derbyshire
34. Alsop (2002) op. cit.35. Bennett et. al. (2005) Routes to Independence:
Young People voicing concerns and challenges andopportunities in the Northern Fells, Cumbria.Centre for Rural Economy, University of Newcastle
36. Scharf T. & Bartlam B. (2006) Rural Disadvantage:Quality of life and disadvantage amongst olderpeople: a pilot study. Commission for RuralCommunities
37. Little et. al. (2005) Women’s Fear of Crime: A ruralperspective. Journal of Rural Studies 21, pp 151-163
38. Braithwaite, K. (2001) The influence of three differentEuropean welfare states upon the development ofrural women’s’ groups. CRE Working Paper 61.Newcastle upon Tyne Centre for Rural Economy.Working paper 62 Feb 2001; Bennett K.(2001) op. cit. Woodward and Halfacree (2002) op. cit.
39. Bennett (2001) ibid.40. Little (2002) op. cit., Edwards et. al. (2000)
Partnership Working in Rural Regeneration:governance and empowerment. Bristol PolicyPress/Joseph Rowntree Foundation
41. Little (1997) op. cit.; Hughes (1997a) Rurality andCultures of Womanhood: Domestic identities andmoral order in rural life in Cloke P. and Little J. (eds)Contested Countryside Cultures: Otherness,marginalisation and rurality. Routledge; Hughes(1997b) Women and rurality: Gendered experiencesof “community” in village life. In Milbourne P. (ed)Revealing Rural, Others: Representation, Power andIdentity in the British Countryside. Pinter Pub Ltd
CC32EvidenceSect4_AW 26/9/06 5:04 pm Page 230
231 Rural disadvantage Reviewing the evidence
Given the high numbers of women in rural areas that work from home,isolation can result from a lack of social contact within the work place42.Although formal women’s networks, often framed around self-help,business and employment, exist in some rural areas, there seems to be limited information on how widespread these are and the extent towhich women participate in them43.
Civic disadvantageReasons for non-participation by women in terms of civic activity andmembership of decision making and lobbying groups is complex andcould relate to practical obstacles such as poor transport, or lack ofchildcare. Obstacles to civic participation may also relate to issues suchas a lack of skills, confidence, or even motivation. More research into thisarea would be useful.
There is some research, now six years old, to suggest that there is agender bias within the composition of parish councils and therefore,women’s voices are insufficiently heard in local decision making44.More recently45, research on women’s participation in civic activities notes that whilst there are more women on parish councils than ondistrict or county councils, they are generally in “lesser roles”. Forexample, in the district of South Devon, “only 4 of the 48 parish councilshave more women councillors than men and overall there are twice asmany male councillors. Only 7 of the parish councils have womenchairs”. However, more extensive and updated information is needed on parish council composition by gender, the obstacles to participationand any disadvantages that might result.
Additionally, there are a range of other organisations through which ruralwomen can participate and influence local decision making and womenare heavily involved in the voluntary sector. Research46 carried out intoRural Challenge projects in the mid 1990s found partnerships weredominated by male chairs who were often from the private sector,bringing a culture of competitive bidding and aggressive presentation.
Within the European Leader 2 programme for example, (now replacedby Leader Plus), there was a programme called “adding value towomen”, which recognised that many women were undervalued and less likely to participate in decision making47. Unfortunately, within thisprogramme ‘under achieving women’ are discussed in the same termsand paragraphs as ‘under achieving woodland’, as a commodity. It hasbeen suggested that these programmes are seen primarily as a meansof improving rural economic growth rather than aiming to improvewomen’s social position or challenge traditional perceptions of the femalerole within development48. The focus of many such programmes is still on women from farming families.
New structures are also emerging with potential to empower and giverural women a voice, such as the Leader programme and RenaissanceMarket Towns. Other more traditional bodies such as the Women’sInstitute also offer rural women an outlet through which to expressthemselves49. There is little research into the impact and effectiveness of such structures for women50.
42. Dwelly T. et. al. ( 2006) Under the Radar: Trackingand supporting rural home based businesses.www.livenetwork.com
43. See www.ruralwomen.org.uk (Rural WomensNetwork website) & www.wireuk.org (Women inRural Enterprise) for two examples of networks.
44. Edwards et. al. (2000) op. cit.45. Little (2002) op. cit.46. Little (2002) ibid.47. Moseley M. (2003) Rural Development: Principles
and practice. London48. pers. comm. Duncan Scott, Senior Research Fellow,
Manchester University, 200649. See discussion of the voluntary sector in the civic
chapter of this report50. In addition to the specific references referred to,
other references read in support of this chapterinclude: Bevan M. et. al. (2006) The Housing andSupport Needs of Older People in Rural Areas.Commission for Rural Communities; Braithwaite K.(2006) Ph D material: Women in Rural Areas - inprogress; Countryside Agency (2003) The Role ofWomen in the Rural Economy: An important ruralresource; National Council of VoluntaryOrganisations (2003) Its Who You Know that Counts;New Policy Institute (2002) Indicators of poverty andsocial exclusion I rural England: 2002. CountrysideAgency; O’ Hara (1998) Partners in Production?Women, Farm and Family in Ireland. Berhahn;Shorthall, S. (1999) Women and Farming: Propertyand Power. Macmillan; Stone M. (1990) RuralChildcare. Rural Development CommissionResearch Report 9; Symes D. and Marsden T.(1983) Complementary roles and asymmetricallives: Farmers wives in a large farm environment.In Sociologia Ruralis 23. 229-241; Whatmore S.(1991) Farming Women. Macmillan
CC32EvidenceSect4_AW 26/9/06 5:04 pm Page 231
232 Rural disadvantage Reviewing the evidence
Minority groups
In general, there is little rural research on the experiences of minoritygroups such as Black and Minority Ethnic Groups (BMEs), Gypsies andTravellers and migrant workers. Each of these groups is itself diverse andwhilst some generalisations can be made about the disadvantage theymay face, more research would be useful.
Black and minority ethnic groups (BMEs)There is little ethnic diversity as a whole in rural England and mostpeople from Black and Minority Ethnic (BME)1 groups live in urbanareas. In other words, rural England is overwhelmingly white. In total,there are an estimated 136,000 people in BME groups living in ruralEngland. Only 1.4% of the population in the less sparse areas of ruralEngland is non-white or mixed, primarily in central and southern ruralareas alongside England’s core urban belt and even fewer live in thesparsely populated areas2.
There is very little research available on the disadvantages that may befaced by people in BME groups in rural England. Some information isavailable on racial discrimination3,4, but this tends to be based on small,local surveys rather than nationwide analysis5. Research has mainlyexplored the use of the countryside by BME visitors, rather than theexperience of BME rural residents. National research, however, points to the considerable differences within and between BME groups.Nevertheless, there are clearly issues which all BME groups face. Arecent review of ethnicity in rural Britain6 highlights findings from someanthropological studies, which reveal the association of perceptions ofrural with ‘whiteness’. In particular, problems can arise because peoplefrom BME groups can be very visible in rural areas.
Social and safety disadvantageMost research has focused on the social participation of BME groups in rural areas. The Commission for Racial Equality suggests that wherethere are few people with non-white ethnicity, they are more vulnerableto racial discrimination and are less likely to take action against theperpetrators for fear of reprisals. Although the numbers from BMEgroups are low in rural areas, those that do live there may be particularlyvulnerable. This does not mean, of course, that all will experiencedisadvantage or indeed racism, but that they are more at risk. Researchshows that people from ethnic minorities living in rural areas may feelparticularly marginalised7 and have little access to support, either frompeer groups or service providers. Some may experience difficulties informing cross-cultural friendships and lack contact with other BMEpeople, leading to a sense of social isolation8.
Some studies9 have pointed to the way that white rural residents haveprohibited the participation of people from BME groups in local social,leisure and charitable activities.
1. Gypsies and Travellers are considered in a separate section in this report
2. Commission for Rural Communities (2005) The State of the Countryside 2005, based on ONS 2001 census data
3. Chakraborti N and Garland J. (eds) (2004) Rural Racism. Willan Publishing
4. The first research on rural racism was undertakenin the early 1990’s - Jay E. (1992) Keep Them inBirmingham: Challenging racism in South-WestEngland. Commission for Racial Equality (CRE)
5. The same was found for rural Scotland in an auditfor the Scottish Executive, and there is thereforelittle information to draw on from elsewhere.
6. Neal S. and Agyeman J. (eds) (2006) The NewCountryside? Ethnicity, nation and exclusion incontemporary rural Britain. The Policy Press
7. Dialog (2003) Race is Relevant. Implementing raceequality schemes in a rural/semi-rural context.Employers Organisation for Local Government
8. Netto G., Arshad R., de Lima P., Almeida Diniz. F.,MacEwen M, Patel V. and Syed R. (2001) Audit ofResearch on Minority Ethnic Issues in Scotland froma ‘Race’ Perspective. Scottish Executive CentralResearch Unit
9. Tyler K. (2006) Village People: Race, class, nationand the community spirit. Chapter five in Neal S.and Agyeman J. (eds) (2006) The New Countryside?Ethnicity, nation and exclusion in contemporary ruralBritain. The Policy Press
22CC32EvidenceSect4_AW 26/9/06 5:04 pm Page 232
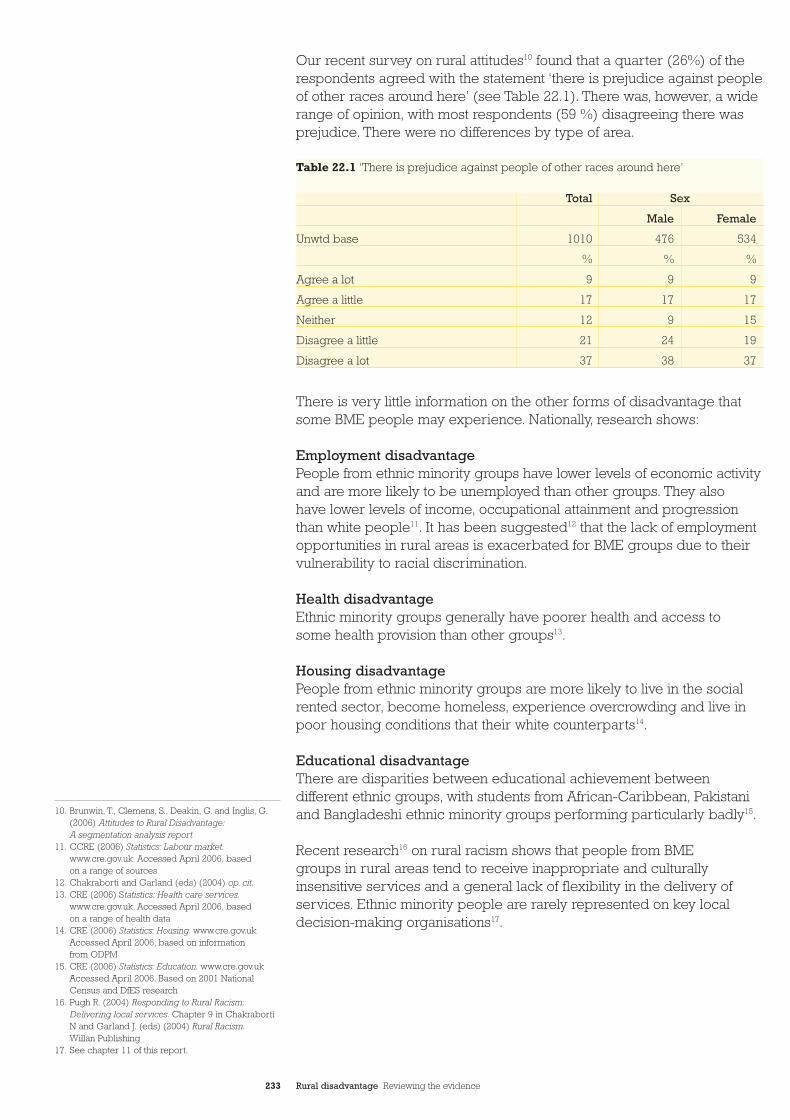
233 Rural disadvantage Reviewing the evidence
Our recent survey on rural attitudes10 found that a quarter (26%) of therespondents agreed with the statement ‘there is prejudice against peopleof other races around here’ (see Table 22.1). There was, however, a widerange of opinion, with most respondents (59 %) disagreeing there wasprejudice. There were no differences by type of area.
There is very little information on the other forms of disadvantage thatsome BME people may experience. Nationally, research shows:
Employment disadvantagePeople from ethnic minority groups have lower levels of economic activityand are more likely to be unemployed than other groups. They also have lower levels of income, occupational attainment and progressionthan white people11. It has been suggested12 that the lack of employmentopportunities in rural areas is exacerbated for BME groups due to theirvulnerability to racial discrimination.
Health disadvantageEthnic minority groups generally have poorer health and access to some health provision than other groups13.
Housing disadvantagePeople from ethnic minority groups are more likely to live in the socialrented sector, become homeless, experience overcrowding and live inpoor housing conditions that their white counterparts14.
Educational disadvantageThere are disparities between educational achievement betweendifferent ethnic groups, with students from African-Caribbean, Pakistaniand Bangladeshi ethnic minority groups performing particularly badly15.
Recent research16 on rural racism shows that people from BME groups in rural areas tend to receive inappropriate and culturallyinsensitive services and a general lack of flexibility in the delivery ofservices. Ethnic minority people are rarely represented on key localdecision-making organisations17.
Total Sex
Male Female
Unwtd base 1010 476 534
% % %
Agree a lot 9 9 9
Agree a little 17 17 17
Neither 12 9 15
Disagree a little 21 24 19
Disagree a lot 37 38 37
Table 22.1 ‘There is prejudice against people of other races around here’
10. Brunwin, T., Clemens, S., Deakin, G. and Inglis, G.(2006) Attitudes to Rural Disadvantage:A segmentation analysis report
11. CCRE (2006) Statistics: Labour market.www.cre.gov.uk. Accessed April 2006, based on a range of sources
12. Chakraborti and Garland (eds) (2004) op. cit.13. CRE (2006) Statistics: Health care services.
www.cre.gov.uk. Accessed April 2006, based on a range of health data
14. CRE (2006) Statistics: Housing. www.cre.gov.ukAccessed April 2006, based on information from ODPM
15. CRE (2006) Statistics: Education. www.cre.gov.ukAccessed April 2006. Based on 2001 NationalCensus and DfES research
16. Pugh R. (2004) Responding to Rural Racism:Delivering local services. Chapter 9 in ChakrabortiN and Garland J. (eds) (2004) Rural Racism.Willan Publishing
17. See chapter 11 of this report.
CC32EvidenceSect4_AW 26/9/06 5:04 pm Page 233
234 Rural disadvantage Reviewing the evidence
Gypsies and TravellersGypsies and Travellers18 “have the poorest life chances of any ethnicgroup today”19. It is estimated that between 90,000 and 120,000 Gypsiesand Travellers live in caravans in England20. Up to three times as manylive in conventional housing21, although little is known about the reasonsfor this choice. There seems to be little research available on theexperiences of Gypsies and Travellers in rural areas.
Housing disadvantageMany Gypsies and Travellers do not travel regularly, but live in caravans.Many authorised sites provided for Gypsies and Travellers are poorlylocated, often close to motorways or major roads, rubbish tips, industrialactivity or sewage works and at a distance from services22. Some siteslack basic services, such as rubbish collection, water supply and toilets.In addition, there is an acute shortage of authorised public sites23 andmany find themselves “caught up in a cycle of enforced nomadism...because of the shortage of authorised sites”24.
Health disadvantageThe health of Gypsies and Travellers is generally much worse than forother groups. Life expectancy is ten years lower than the nationalaverage, and infant mortality higher25. Research has also found thatGypsy and Traveller mothers are 20 times more likely than other mothersto have experienced the death of a child26. Some of these health issuesmay be due to the difficulties they face in accessing health services27.
Educational disadvantageGypsy and Traveller children often have poor levels of educationalattainment. Less than a quarter of Gypsy children achieved five GCSEsat A* to C grades in 2003, compared to a national average of just overhalf28. Education can be interrupted due to travel by mobile groups andenrolment of children at schools declines over the years in secondaryeducation29. There is some evidence of bullying of Gypsy and Travellerchildren. There are also low levels of adult literacy and skills.
Social and safety disadvantageOne survey30 found that more than one-third of adults admitted to beingpersonally prejudiced against Gypsies and Travellers. There is evidencethat nationally, Gypsies and Travellers routinely experience prejudice,harassment and discrimination. Though there is limited information onthe extent to which this occurs in rural areas, research shows that, overall,local authorities in rural areas have made least progress in meeting theduty to promote race equality and good race relations31. In particular,Gypsies and Travellers were least likely to be involved in local decisionmaking in rural areas, due to misconceptions that race equality is simplyabout non-white populations32.
18. Planning law defines Gypsies and Irish Travellers as people with a nomadic way of life; Gypsies andIrish Travellers are recognised ethnic groups for the purposes of the Race Relations Act (1976),identified as having a shared culture, language and beliefs
19. Commission for Racial Equality (CRE) websitewww.cre.gov.uk
20. Niner P. (2002) The Provision and Condition of Local Authority Gypsy and traveller Sites in England.University of Birmingham
21. Ivatts A. (2005) The Education of Gypsy/RomaTraveller and Travelling children. Position paper for the National Strategy Group. Department forEducation and Skills
22..Niner P. (2002) op.cit.23. The ODPM estimates that by 2007 between 2,500
and 4,000 extra pitches may be needed onresidential and transit sites.
24. CRE (2006) Common Ground: equality, good racerelations and site for Gypsies and Irish Travellers.Report of a CRE inquiry in England and Wales
25. ibid.26. Van Cleemput P. et. al. (2004) The Health Status of
Gypsies and Travellers in England. Report of theDepartment of Health Inequalities. Health researchInitiative Project. University of Sheffield
27. CRE Gypsies and Travellers: A strategy for the CRE,2004-7.
28. CRE (2006) op. cit. based on DfES (2005) Ethnicityand Education: The evidence on monitoring ethnicpupils. Research topic paper RTP01-05
29. CRE strategy. Based on evidence from the TravellerEducation Services
30. Stonewall (2003) Profiles of Prejudice: The nature of prejudice in England. Stonewall/citizenship 21Project.
31. CRE (2006) op.cit.32. ibid.
CC32EvidenceSect4_AW 26/9/06 5:04 pm Page 234
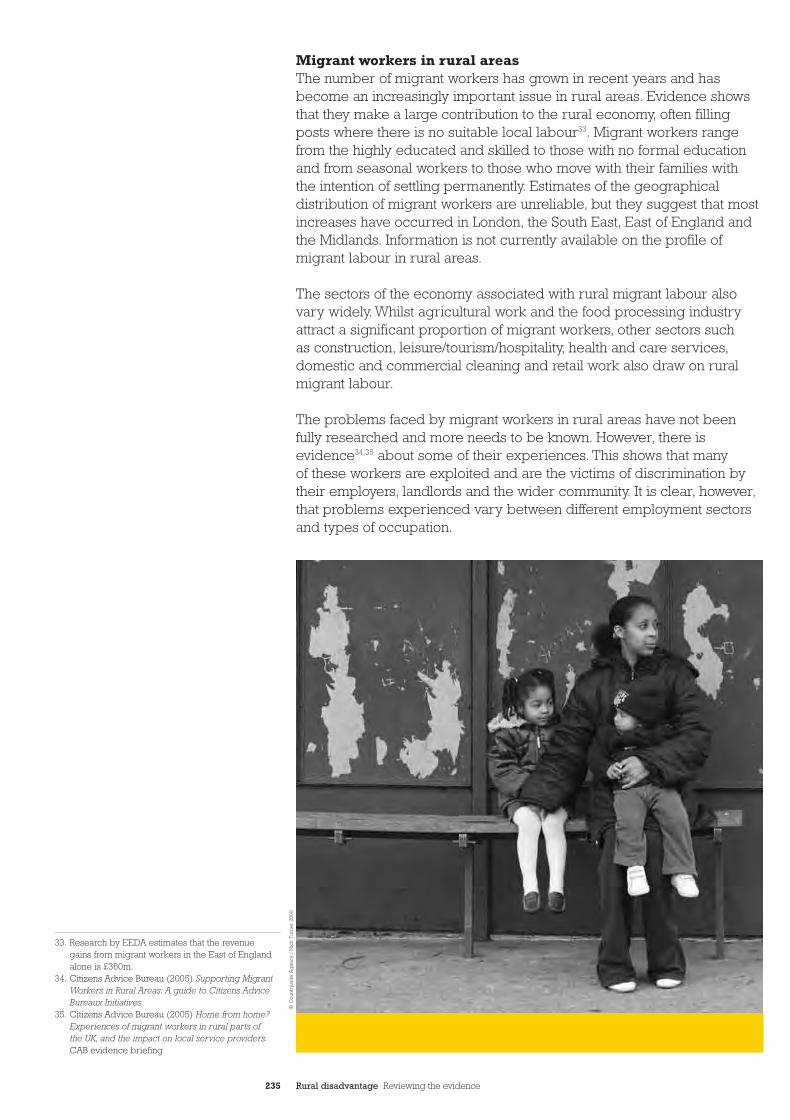
235 Rural disadvantage Reviewing the evidence
Migrant workers in rural areasThe number of migrant workers has grown in recent years and hasbecome an increasingly important issue in rural areas. Evidence showsthat they make a large contribution to the rural economy, often fillingposts where there is no suitable local labour33. Migrant workers rangefrom the highly educated and skilled to those with no formal educationand from seasonal workers to those who move with their families with the intention of settling permanently. Estimates of the geographicaldistribution of migrant workers are unreliable, but they suggest that mostincreases have occurred in London, the South East, East of England andthe Midlands. Information is not currently available on the profile ofmigrant labour in rural areas.
The sectors of the economy associated with rural migrant labour alsovary widely. Whilst agricultural work and the food processing industryattract a significant proportion of migrant workers, other sectors such as construction, leisure/tourism/hospitality, health and care services,domestic and commercial cleaning and retail work also draw on ruralmigrant labour.
The problems faced by migrant workers in rural areas have not beenfully researched and more needs to be known. However, there isevidence34,35 about some of their experiences. This shows that many of these workers are exploited and are the victims of discrimination by their employers, landlords and the wider community. It is clear, however,that problems experienced vary between different employment sectorsand types of occupation.
33. Research by EEDA estimates that the revenue gains from migrant workers in the East of Englandalone is £360m.
34. Citizens Advice Bureau (2005) Supporting MigrantWorkers in Rural Areas: A guide to Citizens AdviceBureaux Initiatives
35. Citizens Advice Bureau (2005) Home from home?Experiences of migrant workers in rural parts of the UK, and the impact on local service providers.CAB evidence briefing
© C
ount
rysi
de
Ag
ency
/ N
ick
Tur
ner
2006
CC32EvidenceSect4_AW 26/9/06 5:04 pm Page 235
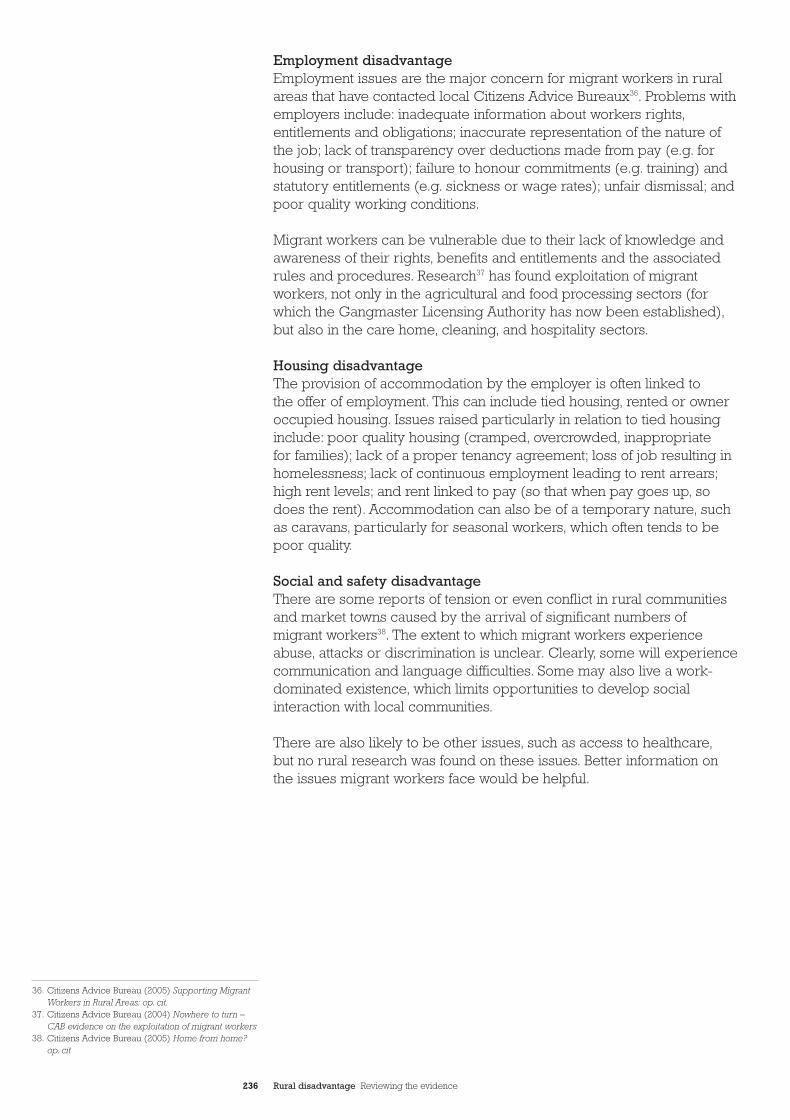
236 Rural disadvantage Reviewing the evidence
Employment disadvantageEmployment issues are the major concern for migrant workers in ruralareas that have contacted local Citizens Advice Bureaux36. Problems withemployers include: inadequate information about workers rights,entitlements and obligations; inaccurate representation of the nature ofthe job; lack of transparency over deductions made from pay (e.g. forhousing or transport); failure to honour commitments (e.g. training) andstatutory entitlements (e.g. sickness or wage rates); unfair dismissal; andpoor quality working conditions.
Migrant workers can be vulnerable due to their lack of knowledge andawareness of their rights, benefits and entitlements and the associatedrules and procedures. Research37 has found exploitation of migrantworkers, not only in the agricultural and food processing sectors (forwhich the Gangmaster Licensing Authority has now been established),but also in the care home, cleaning, and hospitality sectors.
Housing disadvantageThe provision of accommodation by the employer is often linked to the offer of employment. This can include tied housing, rented or owneroccupied housing. Issues raised particularly in relation to tied housinginclude: poor quality housing (cramped, overcrowded, inappropriate for families); lack of a proper tenancy agreement; loss of job resulting inhomelessness; lack of continuous employment leading to rent arrears;high rent levels; and rent linked to pay (so that when pay goes up, sodoes the rent). Accommodation can also be of a temporary nature, suchas caravans, particularly for seasonal workers, which often tends to bepoor quality.
Social and safety disadvantageThere are some reports of tension or even conflict in rural communitiesand market towns caused by the arrival of significant numbers of migrant workers38. The extent to which migrant workers experienceabuse, attacks or discrimination is unclear. Clearly, some will experiencecommunication and language difficulties. Some may also live a work-dominated existence, which limits opportunities to develop socialinteraction with local communities.
There are also likely to be other issues, such as access to healthcare,but no rural research was found on these issues. Better information onthe issues migrant workers face would be helpful.
36. Citizens Advice Bureau (2005) Supporting MigrantWorkers in Rural Areas: op. cit.
37. Citizens Advice Bureau (2004) Nowhere to turn –CAB evidence on the exploitation of migrant workers
38. Citizens Advice Bureau (2005) Home from home?op. cit
CC32EvidenceSect4_AW 26/9/06 5:04 pm Page 236
237 Rural disadvantage Reviewing the evidence
CC32EvidenceSect4_AW 26/9/06 5:05 pm Page 237
238 Rural disadvantage Reviewing the evidence
Appendix 1. Definitions of rural
Wherever possible, the study adopted the new definition of rural that was set out in the Government’s Rural Strategy, published in 20041.This covers all settlements with a population of under 10,000 and is furthersubdivided by settlement size (‘small town and fringe’, ‘village’ and‘hamlets and isolated dwellings’) and population sparsity (‘sparse’ and‘less sparse’). Further information on this new definition is available inCommission for Rural Communities (2006) State of the Countryside 2006.
Where information is only available at the level of unitary authority/localauthority districts, a classification of districts has also been developedusing this new definition. Predominanly rural districts comprise of ‘Rural-80’ (districts with at least 90% of their population in ruralsettlements and larger market towns) and ‘Rural –50’ (districts with at least 50% but less than 80% of their population in rural settlements and larger market towns). Other urban and mixed/urban rural districtscomprise of ‘significant rural’ (districts with more than 37,000 people or more than 26% of their population in rural settlements and largermarket towns) and ‘other urban’ districts with less than 37,000 people orless than 26% of their population in rural settlements and larger markettowns). See Defra (2005) Classification of Local Authority Districts andUnitary Authorities for further information.
Another definition that has been commonly used is sometimes referredto as the ‘Tarling’ definition and divides unitary/local authority districtsinto remote and accessible areas. In particular, this definition is used inthe monitoring of poverty and social exclusion indicators by the NewPolicy Institute. See www.poverty.org.uk
However, a large number of different definitions of rural have been usedin the evidence, ranging from administrative area classifications to moresubjective definitions, such as that used in the English House ConditionSurvey (where the surveyor notes whether the house is in a rural orurban area). In addition, some research does not differentiate betweendifferent types of rural areas. The new rural definition has only beenapplied to some datasets and, so far, used only in a small number ofresearch projects.
Often the research cited has been based on rural case study areas.The original research must be referred to in order to obtain furtherinformation about the choice of case study areas.
1. The rural definition was developed by theCountryside Agency, Defra, the Office of the Deputy Prime Minister, the Office for NationalStatistics and the Welsh Assembly
A1CC32EvidenceSect4_AW 26/9/06 5:05 pm Page 238
239 Rural disadvantage Reviewing the evidence
Appendix 2. Our approach
This report has been very much a team effort. We have drawn on theexpertise of staff within the Commission for Rural Communities. We havealso drawn on the knowledge of several external academics who actedas advisers during the course of the study. In particular, thanks are due to Dr. Duncan Scott (Manchester University), Prof. Malcolm Moseley(University of Gloucester) and Dr. Paul Milbourne (University of Cardiff),who were most closely involved in the study and gave us valuableadvice. Any errors or omissions are, of course, entirely ours.
We are also grateful to those who gave us an early steer either throughresponding to our discussion document published in March 20051,attending our ‘blue skies’ research seminar in July 20052, or throughdiscussions and meetings in Summer 2005. These include NCVO, LGA,Citizens Advice, Rural Youth Network and think-tanks such as IPPR (North)and NEF.
Chapter leads are as follows:
• Ruth Bradshaw – financial disadvantage, employment disadvantage,educational disadvantage, transport disadvantage, children andfamilies, young people and the new survey on rural attitudes
• Jacqui Cuff – local retail disadvantage, social disadvantage, civicdisadvantage, older people, women and the dvd film
• Julie Rogers – local environmental disadvantage, ICT disadvantage
• Lynn Watkins – housing disadvantage, health disadvantage, safetydisadvantage, minority groups and overall project manager.
A2
1. Commission for Rural Communities (2005) Rural Disadvantage: Our first thematic study
2. Commission for Rural Communities (2005)Research Seminar: Rural Disadvantage 1 July 2005.Photo report by the Commission for RuralCommunities
CC32EvidenceSect4_AW 26/9/06 5:05 pm Page 239

240 Rural disadvantage Reviewing the evidence
CC32EvidenceSect4_AW 26/9/06 5:05 pm Page 240

241 Rural disadvantage Reviewing the evidence
CC32EvidenceSect4_AW 26/9/06 5:05 pm Page 241

Rural disadvantageReviewing the evidence
Commission for Rural Communities
Rural disadvantageHidden voicesa DVD film of real life experiences of living in rural England.
The people that speak out in this film tell of real life experiences of living in rural England. They reveal how many of the things we take for grantedcan be lacking in rural areas and explain their frustrations. Things suchas a decently paid job, nearby schools, shops and post offices, affordablehousing, good public transport links, a social life, and things to do. Theirstories show the many good aspects of rural living but also how theexperience of disadvantage can often be hard felt, yet hidden from view.In many cases communities show great resilience and imagination andthe film shows some examples of community led initiatives.
Filming took place in a sample of rural areas across England. TheCommission would like to thank all the individuals that took part in thisfilm. Special thanks also to: Hereford and Worcester Community Council,Norfolk Rural Community Council, Peak District Rural Deprivation Forum,Sompriti, Sussex Rural Community Council, Sulfolk ACRE.
Thanks to the Rural Media Company, who produced this film.
Thi
sd
ocum
enti
sp
rint
edon
recy
cled
pap
erco
mp
risi
ng75
%p
ostc
onsu
mer
was
te
Commission forRural Communities
London Office20th Floor Portland House Stag Place London SW1E 5RS Telephone 0207 932 5800 Facsimile 0207 932 5811
Cheltenham OfficeJohn Dower House Crescent Place Cheltenham Glos. GL50 3RATelephone 01242 521381Facsimile 01242 584270
Email [email protected]
CRC 31 / September 2006
Ru
ral
disa
dva
nta
ge
Review
ingthe
evidence
Cover photography ©Countryside Agency/Jim Hodson September 2006