rr-634 - state of michigan
TRANSCRIPT
I I .
· TWELFTH ANI\\Ui'L REPORT OF
r~~i~A~~~Rg~~:~~ ~~g~~~~ July l, 1984- June 30, 1985
August 31 , 1985
This report was prepared by the Traffic and Safety Division. The opinions, findings, and conclusions expressed in this publication are those of the Traffic and Safety Division and not necessarily those of the Federal Highway Administration.
i
TABLE OF CONTENTS Page
Introduction ••• l
Highway Safety in Michigan - The Year in Review 2
Highway Safety Program Summary •• 3
Federal Funding of Highway Safety Improvements in Michigan. 4
HES Program Evaluation Data ••• 6
Other Federal/State Funded Project Evaluation Data 7
Safety Program Activities •••••••••• . . . 16
Appendix I Safety Improvement Process
Appendix II Guideline for Federal Funding for Safety Projects
ii
) ... . '
Introduction
This is the Twelfth Annual Report of Michigan's Highway Safety Improvement Program. The report covers the period July 1, 1984 through June 30, 1985.
The Highway Safety Program summary is found on page 3. In general, all of the categorical projects were identified and selected following the Highway Safety Improvement Process, outlined in the Appendix of this report. Over $82 million of safety projects were identified in this years report. This is significiantly greater then in recent years, reflecting the greater availability of funds at the federal and state level.
In addition to implementing safety justified projects, the department continues to emphasize the 3R/4R type construction program. These projects are all reviewed to insure that appropriate "safety enhancements" are included with particular attention to the roadside environment and to locations experiencing documented concentrations of accidents.
This report includes evaluation of the HES program. The evaluation incorporates statistical controls which account for accident trends and "expected" changes in before-and-after accidents.
Also in this report is a revised Highway Safety Improvement Process (HSIP). The major revision of the HSIP is inclusion of guidelines for federal funding of safety projects on the nontrunkline system. These guidelines were prepared by the Department's Local Services Division and approved by the FHWA.

Highway Safety in Michigan - The Year in Review
For the first time since 1978, Michigan experienced an increase in highway fatalities in 1984. There were 1,556 deaths statewide, 16.9 percent more than reported in 1983, and the most since 1981 (1,589). Total accidents and injuries were also up in 1984 to 335,200 (300,800 in 1983) and 150,800 (135,800 in 1983) respectively. On the positive side, the death total was 15.8 percent below the 1,849 killed in 1979 and 37.4 percent below the 2,487 fatalities re-corded in the record year of 1969. We are also encouraged by 1985 accident data, through July. While vehicle miles traveled continue to increase, fatalities, through September, were about 4 percent below the same period in 1984.
The 1984 fatality rate was 2.4 per 100 million vehicle miles, a 14.3 percent increase over the 1983 rate of 2.1, but still below the national rate of 2.7. Travel increased by over three percent between 1983 and 1984 from 63.6 to 65.7 billion vehicle miles traveled.
Enactment ·of a mandatory front seat safety belt law culminated long term efforts of Michigan's safety community. The law took effect on July 1, 1985, and results appear promising. Preliminary data indicates that 134 roadway fatalities occurred between July 1, and September 31, 1985 compared to 484 killed during the same 1984 period. Pre-law publicity apparently resulted in a seat belt usage increase to 23 percent in 1984 among accident victims, compared to 18 percent in 1983. Observation studies conducted subsequent to enactment of the law indicates that seat belt use has increased to about 60 percent. Statistical analyses of the law's effects will be conducted by the University of Michigan's Transportation Research Institue under contract to the Michigan Office of Highway Safety Planning.
Child restraint use also continues to increase and safety benefits are being documented as a result of Michigan's child restraint law. Casualties involving children covered by the law have decreased by about 25 percent since enactment of this legislation.
Continued enforcement of Michigan's drunk driving laws is indicated by arrests for drinking drivers which increased 22 percent from 65,451 in 1982 to 79,812 in 1984. The involvement rate of drinking drivers in fatal accidents dropped about thre·e percent (53.3 to 50.6 percent) during the same time period. However, public controversy and debate have, at least temporarily, stalled initiatives to implement a statewide sobriety check lane program .
. Compliance with the 55 mph speed limit remains a major concern. Federal transportation funds are threatened by the slow but steady escalation of speeds in Michigan and in other states. Federal law provides for a penalty of up to 10 percent of funds allocated for primary, secondary, and urban systems highways if more than half of a state's motorists exceed the 55 mph speed limit. Adjusted survey data for 1984 shows 50.3 percent of Michigan drivers within the limit, compared to 51.5 percent in 1983. In response to this trend the Michigan Department of State Police increased enforcement efforts in August, 1985, including use of aerial surveillance units.
Obviously, the accident/casualty increase in 1984 is cause for concern. However, we are confident that the setback is temporary, even though reasons for the increase are not clear. With continued federal support for improved highway facilities, agressive law enforcement and education efforts and increased safety belt use, we anticipate an improved record in 1985 and beyond.
2
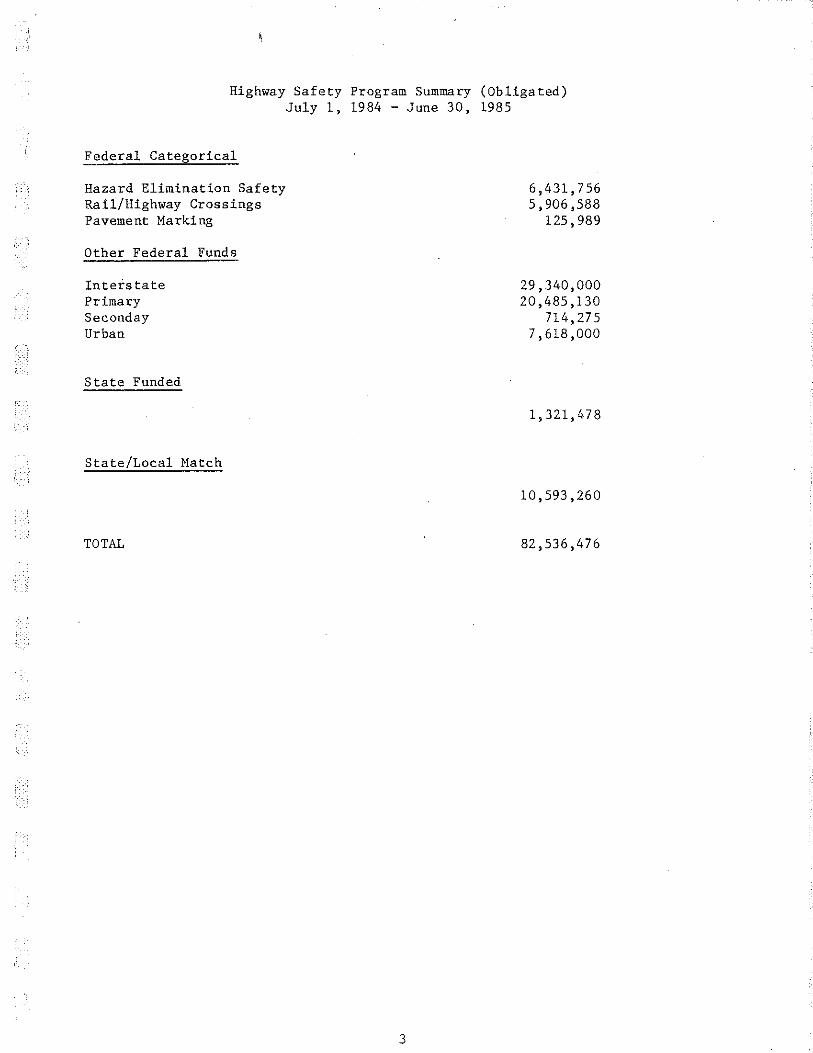
Highway Safety Program Summary (Obligated) July 1, 1984 - June 30, 1985
Federal Categorical
Hazard Elimination Safety Rail/Highway Crossings Pavement Marking
Other Federal Funds
Interstate Primary Seconday Urban
State Funded
State/Local Match
TOTAL
3
6,431,756 5,906,588
125,989
29,340,000 20,485,130
714,275 7,618,000
1,321,478
10,593,260
82,536,476
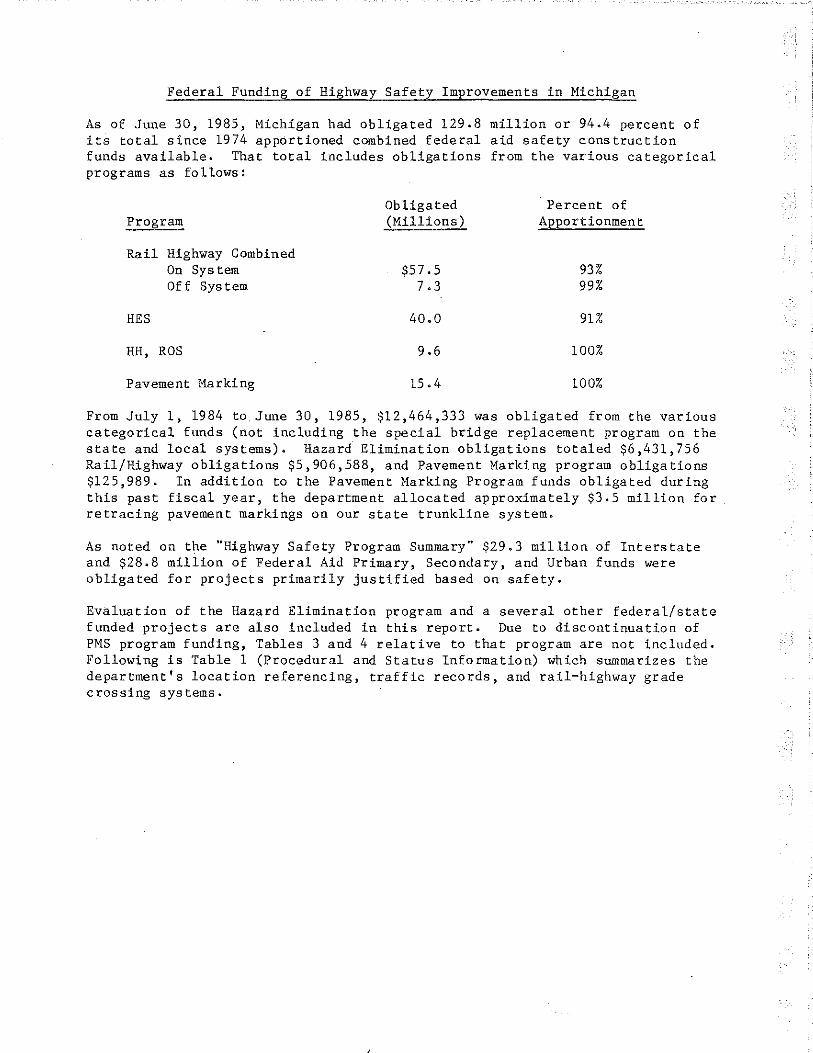
Federal Funding of Highway Safety Improvements in Michigan
As of June 30, 1985, Michigan had obligated 129.8 million or 94.4 percent of its total since 1974 apportioned combined federal aid safety construction funds available. That total includes obligations from the various categorical programs as follows:
Program
Rail Highway Combined On System Off System
HES
HH, ROS
Pavement Marking
Obligated (Millions)
$57 .s 7.3
40.0
9.6
15.4
Percent of Apportionment
93% 99%
91%
100%
100%
From July 1, 1984 to June 30, 1985, $12,464,333 was obligated from the various categorical funds (not including the special bridge replacement program on the state and local systems). Hazard Elimination obligations totaled $6,431,756 Rail/Highway obligations $5,906,588, and Pavement Marking program obligations $125,989. In addition to the Pavement Marking Program funds obligated during this past fiscal year, the department allocated approximately $3.5 million for retracing pavement markings on our state trunkline system.
As noted on the "Highway Safety Program Summary" $29.3 million of Interstate and $28.8 million of Federal Aid Primary, Secondary, and Urban funds were obligated for projects primarily justified based on safety.
Evaluation of the Hazard Elimination program and a several other federal/state funded projects are also included in this report. Due to discontinuation of PMS program funding, Tables 3 and 4 relative to that program are not included. Following is Table 1 (Procedural and Status Information) which summarizes the department's location referencing, traffic records, and rail-highway grade crossing systems.
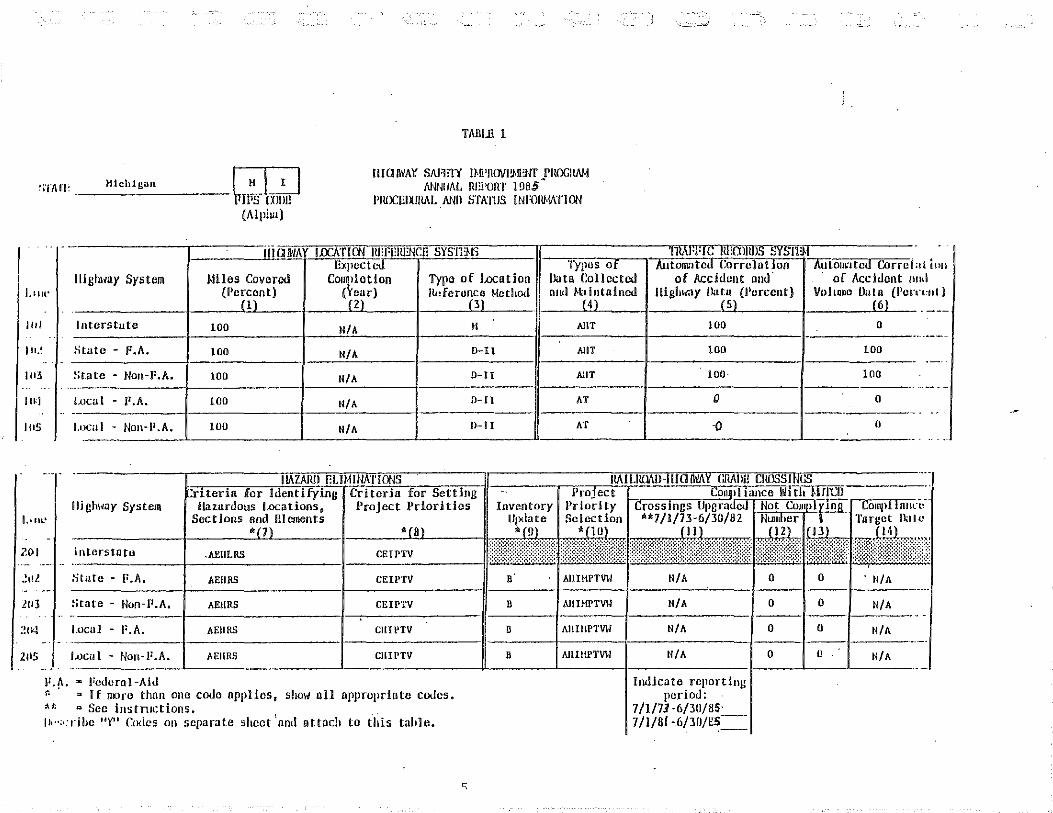
"lArl: Michigan ---------------- II'S COilll (Alplu•)
TAlllll 1
IIIGIWAY SAB!Ti' !}.fi'llOVI!I>fiNr PllflGIWI ANNIIAL llEI'OllT !D85.
PIIOCEIXJMI. ANil STA:IlJS INFOHMAJION
'.
.. ·- iiJGIWAY UJCATICN IU:PEIU!NCf: SYS'IHti liW·I'I[; HI:OJIUIS SYSil:J. Expcctetl
lllgh,ay System ~Iiles Covered Couq>lotlon Typo of Location (Pc~~~nt) C}Wl ncferonl Hethed l.llll'
1111 lntcrstute 100 N/A It
State - F.A. 100 II/A D-H
103 State • Non·F.A. 100 N/A o-n ...
I Ill l.oca l · P.A. 100 N/A 0-!I .
IllS J,uca 1 · Non·I1.A. IUO N/A n-n
lligh~<ay System I.• nt•
201 lnterstotl.l
.!11J. State · F.A • AEIIRS CEIPTV B
2113 ~aate - Non·P.A. AEIIRS CEIPTV B
:!cr-.:. l.ocul • I'.A. AEIIRS CIIIPTV n
2115 l.oca 1 • Non·F.A. AEIIRS CIIIPTV B
l'.h. ~·Fcdcrol·Aid " · • If moro thnn ono cedo opplies, show oil npproprlotc cedes. -At; A Sec instnJctions. p, .. ,,:rihe "¥" Codes on separate sheet 'ond attach to this table.
Typos ot ·-AUtomated CorrcloiTon !lata Collected of Accident ond · ouJ ~tf !\'talnc'<l llighway !Jato (l'crcent)
(SJ
AliT 100
AliT 100
AliT 100·
AT 0
AT -o
Al!IHPTVlJ N/A 0
1\llllll'TV\l N/A 0
All IIIPTVlJ N/A 0
1\llliiPTVlJ N/A 0
Indicate reporting period:
7/1/71 ·6/30/85· 7/1/Sf -6/311/es=
"Tuioun tcil Corrci • 11 iuu I< I
n.:ul) of Accident "'
Volume Uala (l'cr (6)
0 .
100 .
100
0 -
{J
0 . N/A
0 N/A
0 II/A
0 N/A
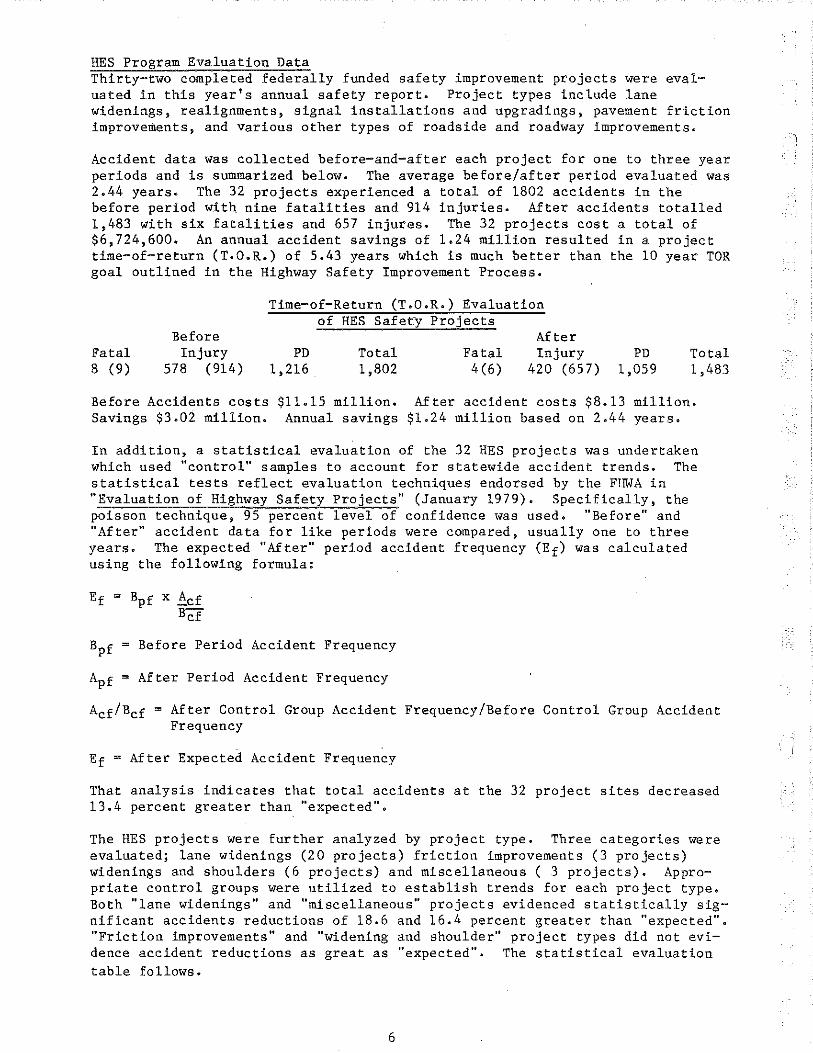
HES Program Evaluation Data Thirty-two completed federally funded safety improvement projects were evaluated in this year's annual safety report. Project types include lane widenings, realignments, signal installations and upgradings, pavement friction improvements, and various other types of roadside and roadway improvements.
Accident data was collected before-and-after each project for one to three year periods and is summarized below. The average before/after period evaluated was 2.44 years. The 32 projects experienced a total of 1802 accidents in the before period with. nine fatalities and 914 injuries. After accidents totalled 1,483 with six fatalities and 657 injures. The 32 projects cost a total of $6,724,600. An annual accident savings of 1.24 million resulted in a project time-of-return (T.O.R.) of 5.43 years which is much better than the 10 year TOR goal outlined in the Highway Safety Improvement Process.
Fatal 8 (9)
Before Injury
578 (914)
Time-of-Return (T.O.R.) Evaluation of HES Safety Projects
PD 1,216
Total 1,802
Fatal 4 (6)
After Injury
420 (65 7) PD
1,059 Total 1,483
Before Accidents costs $11.15 million. After accident costs $8.13 million. Savings $3.02 million. Annual savings $1.24 million based on 2.44 years.
In addition, a statistical evaluation of the 32 HES projects was undertaken which used "control" samples to account for statewide accident trends. The statistical tests reflect evaluation techniques endorsed by the FHWA in "Evaluation of Highway Safety Projects" (January 1979). Specifically, the poisson technique, 95 percent level of confidence was used. "Before" and "After" accident data for like periods were compared, usually one to three years. The expected "After" period accident frequency (Ef) was calculated using the following formula:
Bpf Before Period Accident Frequency
Apf After Period Accident Frequency
Acf/Bcf = After Control Group Accident Frequency/Before Control Group Accident Frequency
Ef = After Expected Accident Frequency
That analysis indicates that total accidents at the 32 project sites decreased 13.4 percent greater than "expected",
The HES projects were further analyzed by project type. Three categories were evaluated; lane widenings (20 projects) friction improvements (3 projects) widenings and shoulders (6 projects) and miscellaneous ( 3 projects). Appropriate control groups were utilized to establish trends for each project type. Both "lane widenings" and "miscellaneous" projects evidenced statistically significant accidents reductions of 18.6 and 16.4 percent greater than "expected". "Friction improvements" and "widening and shoulder" project types did not evidence accident reductions as great as "expected". The statistical evaluation table follows.
6
l i
i
Project Type All
Projects (32)
lA lD lG 3B Lane Widening (20 Projects)
1D 3F Friction Improvement (3 Projects)
3A 38 3D 3E 3R Widening & Shoulders (6 Projects)
1C 1F 1G Miscellaneous (3 Projects)
Other Federal/State
Bpf
1802
843
7l
249
639
Funded
Statistical Evaluation of HES Safety Projects
Apf Acf/Bcf Ef %Reduc .. Significant
483 0.951 1713 13.4 Yes
655 0.955 805 18.6 Yes
74 0.925 66 0.0 No
244 0.925 233 o.oo No
510 0.955 610 16.4 Yes
Project Evaluation Data
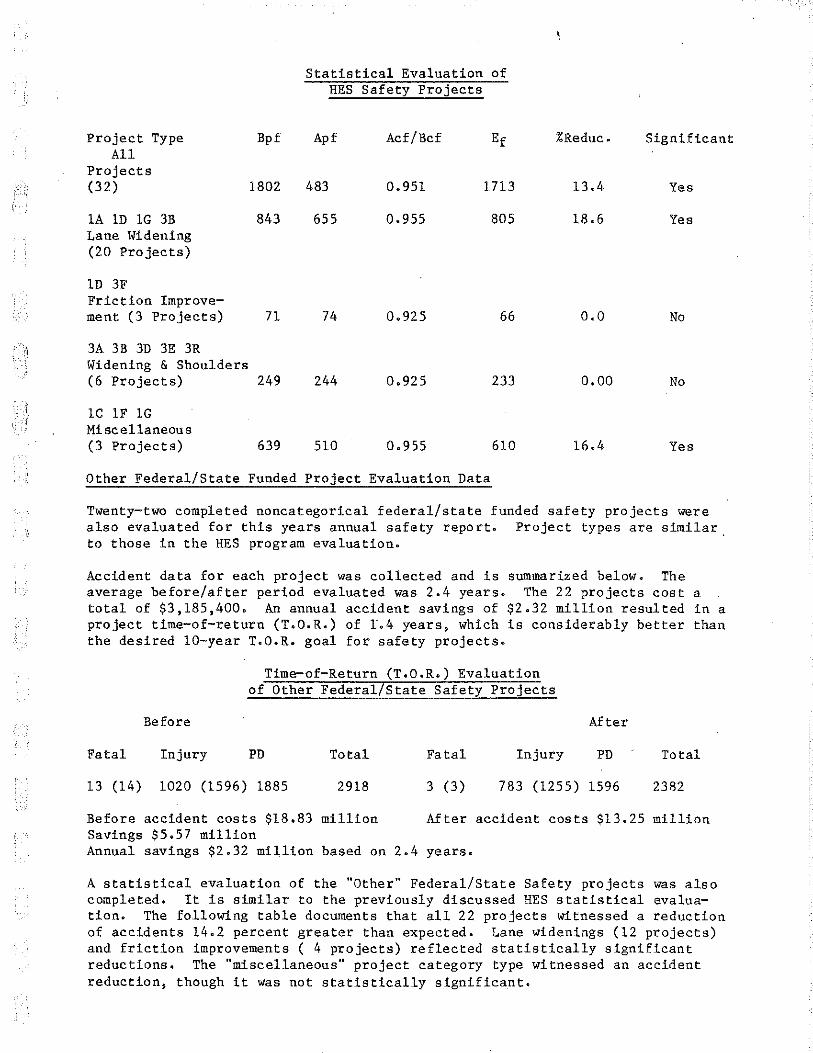
Twenty-two completed noncategorical federal/state funded safety projects were also evaluated for this years annual safety report. Project types are similar to those in the HES program evaluation.
Accident data for each project was collected and is summarized below. The average before/after period evaluated was 2.4 years. The 22 projects cost a total of $3,185,400. An annual accident savings of $2.32 million resulted in a project time-of-return (T.O.R.) of L4 years, which is considerably better than the desired 10-year T.O.R. goal for safety projects.
Fatal
13 (14)
Before
Injury
Time-of-Return (T.O.R.) Evaluation of Other Federal/State Safety Projects
PD Total Fatal Injury
1020 (1596) 1885 2918 3 (3) 783 (1255)
After
PD
1596
Before accident costs $18.83 million After accident costs $13.25 Savings $5.57 million Annual savings $2.32 million based on 2.4 years.
Total
2382
million
A statistical evaluation of the "Other" Federal/State Safety projects was also completed. It is similar to the previously discussed HES statistical evaluation. The following table documents that all 22 projects witnessed a reduction of accidents 14.2 percent greater than expected. Lane widenings (12 projects) and friction improvements ( 4 projects) reflected statistically significant reductions. The "miscellaneous" project category type witnessed an accident reduction, though it was not statistically significant.

Statistical Evaluation of Other Federal/State Safety Projects
Project Type Bpf Apf Acf /Bcf Ef %Reduc. Significant
All Projects (22) 2918 2382 0.951 2775 14.2 Yes
1A, 1G, 3B Lane Widening (12 Projects) 522 276 0.955 499 44.5 Yes
3F Friction Improve-ment (4 Projects) 447 322 0.925 413 22.0 Yes
3A, 3B, 3D 3E, 3K, 3R Miscellaneous (6 Projects) 1949 1785 0.925 1803 1.0 No
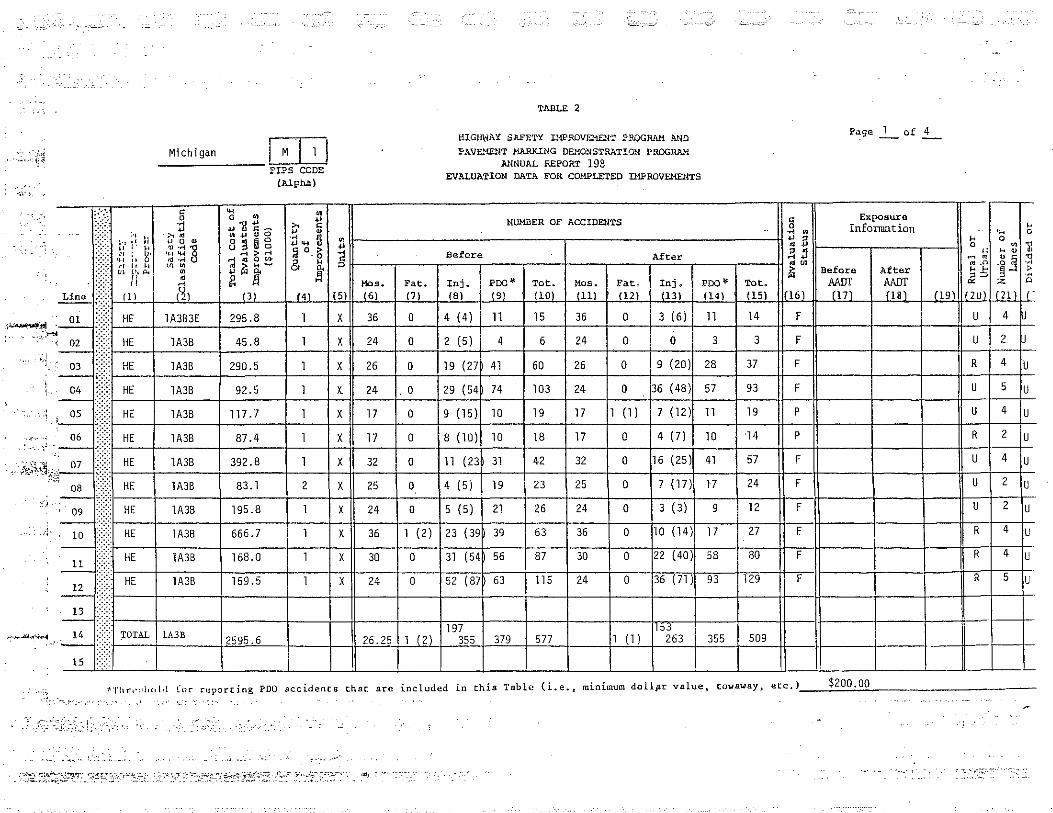
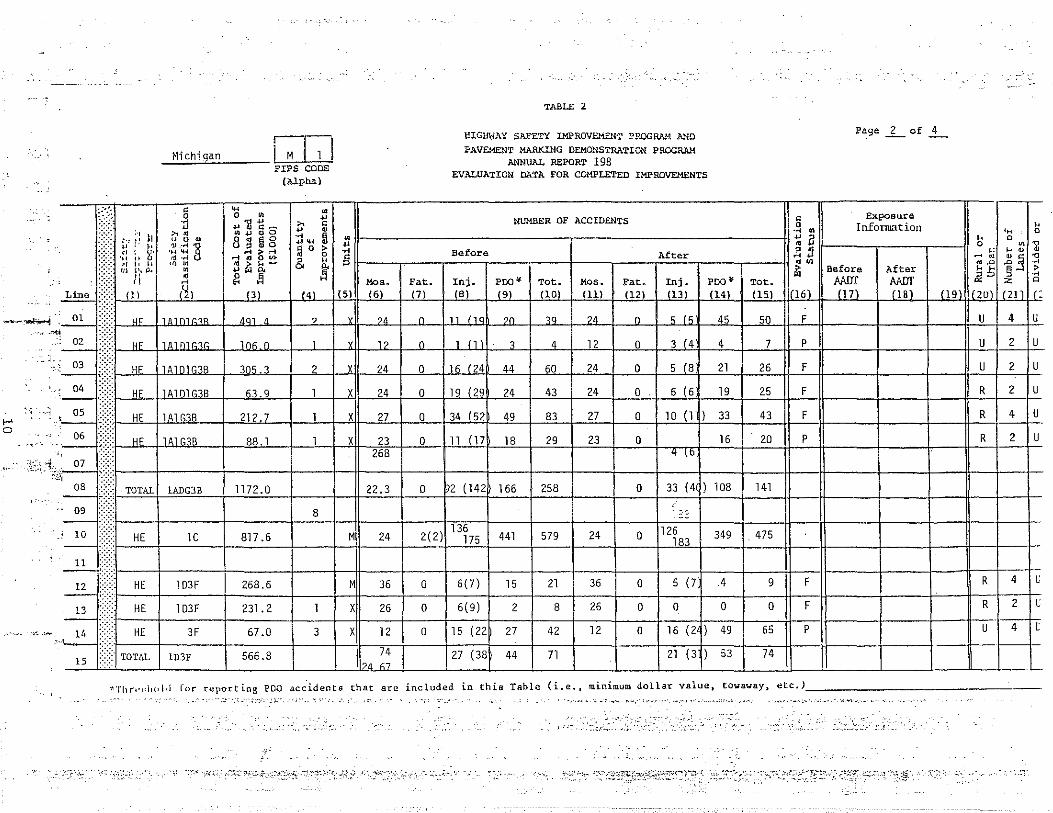
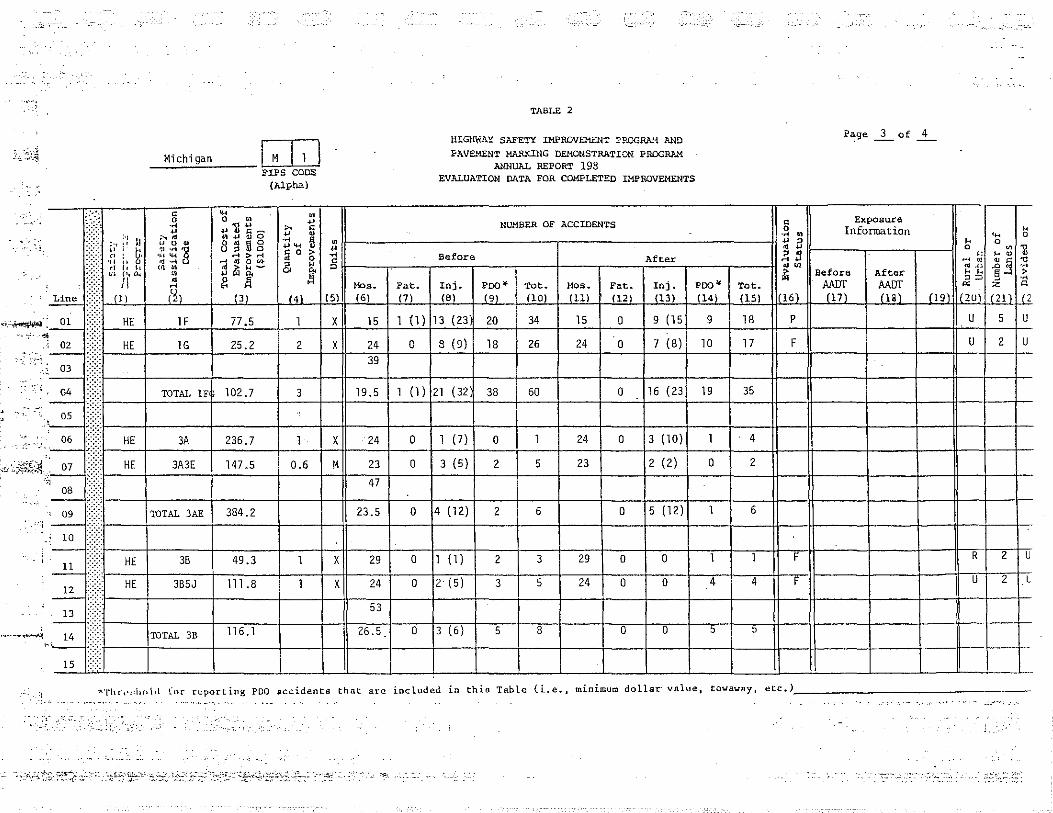
Following are completed FHWA "Table 2's .. for all of the 54 projects. 10-11-85
8
._;,.
···'"
Michigan
TABLE 2
lHGHWAY SAFETY IMPRDVE.'1EN"::: :?RQGR!I..'-1 AND I'AVE!1.E.~T MARKING DEMONSTRATION PSDGRA.H.
ANNUAL REPORT 198 EVALUATION DATA FOR COMPLETED IMPROVEMENTS
Page _1_ of 4
5 ~ Ill !II ·j .u ] -g .- >< ~ NUMBER OF ACCIDENTS § Exposure ~-< ;.., ~ Ill .u o:.~ 0 .u .u -~ 111 Infonuation ''"" 0
:-:-:- ~-. 11 p o Q) 8 •• o0
:;1 ..... m Ill 11---------------.---------------!l .u :1 .... o ·.·.. '' , ~:. ,;: ;j ~ ~ ~ .-i ~ 0 ~ ~ Before ~ j 1\-----,.-----,--11 ° 1.: 1-o ~ ]
;::::: ,f: , 2 t~ -~ rJ ~ n:1 o (1)- & H § 1\----.,.---r---r---.,----!----,,-------,;A::f.::te:;:r~----,r---l-l 1<1 .u 5 'tl ;:;::; ~l '• .._ cn .u ~ lt...... ! ~ UJ Before After ~ ~ "§ ..:.l :~
~lt:J-'(_!lc!_l\-j--"IC:q:c!_l_-f-_ll _ _B(3~L-t-.l.!!.''4L'-J-!'I52Jl1J-~.lC6~;'-·-f-.C~l.!;1-~-·+.J.~;~;L·.-f--~~~u_•+_!~.!o.~~~oi4_MJJ!~C!~c!-j+_!~.!.~~bj4-~i!:~"~'l.j+...!~.!.~~4lL•...J-.!.~~~~!!j-\j/cl~6!.!..jli!-~..l.!.I7!..J_l--J. _ _iAAJJrl.!;ll8!.1_l+JIJl19l.jjJ1'J.~.'!Ul.tJ1f"'.}.21_11l.tJ~~··
~- :: ,l!r-:-:::::-t-l..:.::.:. A::::::-E-1-:...::.:.::..: .: ::._-f_...::-+:1_::_:;---jf-=::._-f-~.:.9..:.~.:.: 2:.._; 7+-~-;:._+6...:1
::._+2.:.:;.:._+_::_-f-_:_:;::_:-~ )f-2-l :=-...J--~7.:._: -fl-.:..;-lf---f---+---!J--~::._;~_:::-J::.._U ~ t:'t--H_E_t-_lA_3_B_-I-_9_2._5_-f-_l_-f-X-jf-2-4-lr0-+2-9__:_(5_4f-7-4_-f-l-0_3-j-2-4_+-0-+3-6...:(_48_).j-5-7_...J-_93--!J--F-II-----+---+--1!-U-I-5-j::_U
:i ,~ ::::~--:-:-t--:A-A:-:--f--1-:;...: :-:--+-;-f-:-lf_...:;.:..: ---jf-=:--1-:~~.:..; ::..:;+-;...::-+:'-:-+1-l :-+1-::...1:._) -1--:...:~-:-~ )i-l-l:-+.-: :--J.l--:-IJ-----.J----J.--IJ---~-J-:-l::.._~ .. .,.,.,r---t---t----t--Ht---t---t-'--+---t---l--l---t----:4-+--+I--Jt--+--+-4-1----f::_
, , }Jii;j .ii 07 (I-H_E_j--_l_A3_B_--j-_3_9_2 _. B--f-1-+X-1!_3_2--jf-0--f-1-1_..:_( 2_3+--3-1-+4_2_+_32-+-0--f-1-6_(_2_5 )+-_41-...J--57--J.l--F -~---f---+---!J--U-Ji-:4-J.:.__U
·'·' , :: -,fJ. -:--::-+---:;--::-:-::...--t-l:-:-:-::--J....-~-+-:11--:-:-t-:_..:_-+-:-~:-::-:+-::...-+:-::...-+:-::-:-t--:--l-::...--~:,.:-l) -'.,..:-i-:~-:-:-+J-.-::-fi---+--....J----1\...--~-f--::,.--.:l-~ - ·:•:•:r· -:::-t--:-:-::::---t-:-:-:-:--t-:--+-:-:+-....-.--+-:---:-:::+:-::-=l-:......--+=-t--::-...--+-:---l::-:-;-;-:+=--l-::c,--lt-...,.--H----+---t-~~+..-+ , 10 :•:•••• HE 1A3B 666.7 1 X 36 1 (2) 23 (39 39 63 36 0 10 (14) 17 27 f R 4 U - :•.:r-:-:::--t--.:-:c,..--\--:-=-,:--t--:--l--ll----l---l-~+-+-::---!-.-:---l----k-o-~k,.---!k-lh-~---l----l--h-1--c-l-
~ ' ::r.:::::-+--:::-::::::...---t-.... ;:-:::-:-:-.: ::----t-..:-+:::-1f-..:,...:-l---::...--+::c::.,-;-~ 5
c::8:±--:-:::...-+:c~~"'5c-lf.--..,.:::-+-::--+:c:~-~,..,:,_~J; --,.::~--J-.,1~:0
~9 -I.J.....--,:-111----l-----l---1t-:n-h:c-l-~ - •:::J-· --t---t----l-4-ll---+-+--l-----+-+-+-+--l--l----J.I.--I~---1---i--1!--l--\-13 ... - r---t-----+-----+--+-ll-----+---+~-+---+---+---+--~r.-+---+--~~-l~----+----+--~-1-~~ 197 \loJ
'' -~.c,;.; .. ~ }j--T-OT_AL-t_l_AJ_B __ T25e..;9a5-". 6"--t--+-1~26e_,._£25"-j-.J.l _j(_f :2Lj.l____,3;.;!52.5 +.2.37!.29'--f---'-5'-'77'--j---f-l'.._l.( 1:.,)'-+_::2~6 3"-J_::3:.:55::_t---:5~0:_9 -11--fl---+---l---l\---- f-- _ 15 :•:•::
"'Tlln•:d,,,[d l"or t"l!portiog PDO accidents that are included in this Table (i.e., minimum dollJlr value, towaway. etc.)• __ .::;$_::20~0:.;·;00~0 ________ _ -~· ~ : ..
··'
1-' 0
'
'
.:~ . .. 01
.. :--·.~ .<>ti
:: 02 ·-
03
··~ "
., OS ,_ 06 ,, .. ··.-
:;;·,1·· 07 •·ce,
08 ,. .-
.. 09 -
.: 10 .-' ~
12 -13 -
, ..... ~ 14 ',__:::__
15
Michigan
::·-~: " 0
r~: ·;j
' ,.
II fi' ' " 0 •
~~ g· 'll-·""s " '>I '4-1
'" ' .... ,, ' "
,, • "' .... • I • .... (ll /2)
"" l1 n1 n1 r.1a
l oF 11A1nlC10
HE 11Al01G3B
HE lAlOlG1B
HE l A1 G3B
_:::::: oE i1A1C38 -:-:·:·
:~}~ ,., .. ·
!II
TOTAL 1ADG3B
1C HE
~:[/ HE 1 03F
~<:
::: HE 103F
HE 3F
::::::· TOTAL lD3F
M I 1 I PIPS CODE
(Alpha)
'H ~ 0 • ... -~-~'2~.-. "' " 1/) +I Ill 0 ... • ....
~ 8Hg ""' ~ 0 > .... > ... 0 ~.UOtn- & " Iii"- ! ... "' g ~
(3) 141
dOl A ?
1n" o 1
30,.3 2
63.9 1
212.7 1
88.1 1
1172.0
8
817.6
268.6
231.2 1
67.0 3
566.8
~ ... -a "
Mos. Fat. (51 (6) (7)
y ?A n
y 1? 0
X 24 0
X 24 0
X 27 0
X 23 0 268
22.3 0
M 24 2(2}
M 36 0
X 26 0
X 12 0
74 loo C7
TABLE 2
l!IGHWAY SAFETY IMPROVEM.EW::• !?ROGRA.'i AND
F~\VE..'1ENT MARKING DEMONSTRATION PROGRAM ANNUAL REPORT 198
EVALUATION DATA FOR COMPLETED IMPROVEMENTS
NUMBER OF ACCIDENTS
Before After
Inje PDO • Tat. Mas~ Fate Inj. (B) (9) (10) (11) (12) (13)
In 11a ?0 39 24 0 ' ('
1 (1 3 4 12 0 3 ( 4
16 (24 44 60 24 0 5 (8
19 (29 24 43 24 0 6 (6
34 (52 49 83 27 0 10 (1 }
11 ( 17 18 29 23 0 4 \b
2 ( 142 166 258 0 33 (4 }
' . :--:. .. 136
24 126 175 441 579 0 183
6(7} 15 21 36 0 5 (7
6(9} 2 8 26 0 0
15 (22 27 42 12 0 16 (2 }
27 (38 44 71 21 (3 } '
F~ge _2_ of _4_
" Exposure
0 Infonuation ... • ·c; ' " il k • 0 ~
.':!I " k • ~ _g!j . "' • .o Iii Before After "5 &! §
PDO • Tot. AAIJr AAIJr "' (14) (15) 16) (17) (J8) fl91 2U) I 12ll
45 50 F u 4
4 7 p u 2
21 26 F u 2
19 25 F R 2
33 43 F R 4
)6 20 p R 2
108 141
349 475
4 9 F R 4
0 0 F R 2
49 65 p u 4
53 74 1---
"'Thn·:di!d·l [or r~porting PDO accidents that are included in thie Table (i.e., minimum dollar value. towaway, etc.)• _____________ ..:_ ', .. -
' --;"_-.-:·--_;_ .
' - ~- .
" 0
a: "' .... > .... " I r: u
u
u
u
u
u
c
c
c -
- •. · ,
_:,:M':.:· c::.:h..:.i go.:a:;;n ___ l M 11 I PIPS COOS
(Alph.c;)
TABLE 2
liiGi!WAY SAFETY IMPROVJ::MEN·:: !?~AA..o.t AND ~AVL~NT MARKING DEMONSTRATION PEOGRAM
ANNUAL REPORT 198 EVALUATION DATA FOR COMPLETED IMPROVEMENTS
,.--
P~ge 3 of 4
lii'" ;:· :: ~ .d ~ l H ~ ~ ~ ~ ~ ft-------.-.-f-or_a ___ N_uMB_E_R_OF-rA-c_c_m_EN_T_s ___ A_f_t_er-------IJ j j 11---I-nE_£~.~-~=_t_i~_'_' ~--11 S J.: ·~ ~ ~ , : \: .. ~I.~·. ;: )\· 5; '" ~ g ~ r & j " Has. PDO ¥ £
00 a:~%e AAf~t~ ] ~ j j ~ Fat~ Inj. PDQ¥ Tot. Mos. Fat. Inj. Tot. JVUJ~ IV\Ut ........
~ ~{j-...l!.. Cl IL-t--t'-"'!1"--l--]f-...1=. 1:3 1~_--t-'l:! •4.J_ '-pi 5"-1 it--'-" I ·6 lL---j--ll-!.7 lL---j-l(-"'a lL-t--'2. cs IL_-j--!1~1 O~lj-~ C :11!o!.1 +.J.!l±.e20J.I +.l. 11;_;3!.!.1 +.!.< 1~4!.!....: 1~1 l!o.:5:.Ll -1Jl'"-162J51yt._·.l. fl!.!7L l+.J.J.: f 118!L 14-.J. f:ll-'!9Cl.jj.l '.£2;;.Ul!.f'J. C2f!lJ.t.IU (2
··'-;__;::_~:_::_,:_. HE 1F 77.5 1 X 15 1 (1) 13 (23 20 34 15 0 9 (15 9 18 P U 5 U .. -+· "' .t-.:.:.::..-t--.:..:_-t......c..:...:..::~-t--'--+-"it-'-"-1-'-..!..:..!F-=+..::::..-+..::.:.--l--..:~r-~+:....!..:+--=-t-.:.::._l+---ll---f---+--ll-'--=-~~.::..
,., ; :: .,;;_r-..:.H;:E-t--'-1.:.G -t--2:.:5.:.·.:.2 --f--2=--+-"Xij-..._;~i;i:+-'O:..._rS-"( 9.:.)-f-..:.1::.8 -1r2::.6_!-.:::2..:.4 +--=0--f-7:..._:_(.:.;8 )+_1__:0_f-1__:7_.J1-..:F-jf---+--+---!f-U-..j....::.2-J--U
'·- ;;::::~-t--+-·--t--+-lt--+-t----11---t-+--t--+---+--+--11----it--+-+-ll-+---+-. ! .. . I . ~}:!---t_::TO..:.T:.::AL::..:.l:.::Ff-_10_2:.:.·;....7_-f-_3:..._+-J\-'19:..:·.:::5+_1_(;....1..:.)f2:.:.1_(:.:.3_2+-.::.38:_+__:6.:_0__Jf--+__::O__:_.j-:-16:....:.(2::.3+-1.:.9_j.....:3:..:5_.j.j...._.I\-----\--___:\--.JI--\--J-
05 ·.· ..
'-- ;<r--i---j---il--i-l!---il--l---t--+--+-+-+-+-+--ll--H---+---I:--ll--l--+-06 ·:::::: HE 3A 236.7 1 X 24 0 1 ( 7) 0 1 24 0 3 ( 10) 1 4
· ·· · .. -:: :::r..:.-+-..:.:..._+-:.:..__+_;....__rll-~--+-__;....+.....:_+--t--=---+--=--+=.....:..:.:+-+---lt--fl----l--1--ll--l--t-"' ·~};11\:,j 07 -:-:·:·[-_H_E+ __ 3A_3_E--t_1_47..:._5 --j-o_._6-t-M-jj--2;;-c;3,-t-O-t-3:.:.(_5;....) r-.:.2-t--5-lf--23-1--+2-(:._2.:.) +-O-I--2-\.f--!fl-----J----J---1J--.\--l-
·: :: :;::,·~---j-TO-TAL_3_AE-1-3-84-.-2--f---t-H-2-3-~:--~-_:_0_f4-( 1-2-) +--2-+--6-f--+-0-1-5-( 1-2.,.-) \--1-\--6___:1-\--1\----l---+--...JI..-..\--.\--
i - ::::::·1--+---t--+-Hir---t---t--l-+--l--t-+--l--t--1+--fl---l----l--+--l--l....,. : 10 :::::::
~ ::~-• -H-E-..J--:3:::B--f---:-49:::-.-:3-+-::-1-J-:X:tl--:::-29-f:.._::O-l:::-1-;(::-1:::-) -l---::2-.\--:3-:.\--;2:-:9-..J-0:--+-0::-+--::1,-.J..--1,---Jl.--.,.F-I-J.--'--.\---..\---It-.....,R .\-,2rl"u
- ':}' j---:H-:::E-J--:::3~85:::-J:-f---;1--;-1 :::-1.-:8-+-1::--f-:::-X l\----::24:-\--:::-0 --\,2,.-·7( 5;:-;)--!--:3::-.J--;5:-.\--:2:;-4+~0-.\-.,-0-J-...,4.-J--.4-\t-..,F- 1-----1---J.--fhur+-oz -1-;-L 12
_;__ •:::::j-· --t---t-----l--+1---::-+--1--t-----I--+-+-+--I---+---Jt.-i+---1---+-+--l--+-l3 .. . 53
'"'"-' ·---;,;- .. t --+-ro_T_AL_3_n-i-:;1-:;-16:=-. ..,-1-+--f--jj--,2"'6"'.54 -"o-I-::3'("'6'J +.......,s-+-""8:-.J---+---,o~+-o""'+-..,..... s-+-s.--+l---11----+---+---11---1--t-
-~..-- ,.,.,.t--t-----l----t--+-l~--I--+-+-+---I----I--\..--1---J.---ll--11----l----1---ll--1---
"'-Thr 1·,]w\.t for- r<!porting PDQ accidents that arc included in this Table (i.e .• minimum dollar value, towaway, etc.)·-------------
··.;-_
~ . OJ ----; 02 -: 03 --
.• ,· .l <04 -OS ,_ 06
-.~ 1
08 -' 09 -' 10 -...2!._
12 -. 13 ---·~
15
(i :-I
;-, I r tJ p
~-" '" i: ,, " "' {1, ll.
II
lll ( 1)
HE
HE
HE \-:·:-
~~ HE
~~ 32
f---
:~:} ,._._.,
••.·.·
:·
- -'1M'!.!. c"-hui~g,_an"---- M I Pll'S CODE
(AJ.plu.)
" ... w . 0 0 • +' •;J .. 1! ,.. ,;, " c- ... ~ ,.,. • " • 0
" 0 • 8 • mg -~ ~ "" ~J ·.-I 8 .:l ~ 'H ~ ..... ~ 0
"'-~ ';I "' o~ " • i.\ tt- & k
• ... ! • ll ti .... r'21 (3) (4)
303E 264.9 0.25
303R 447.8 8.6
3E 41.1 1
3E 170.8 3
TOTAL 3DER 924.6
TOTAL ALL 6724.6
• ... -;! "
Mos. FatQ ( 5) (6) (7)
M 15 0
M 36 3 ( 3)
X 29 1 ( 1 )
X 36 0 116
29 4 (4)
8 (9)
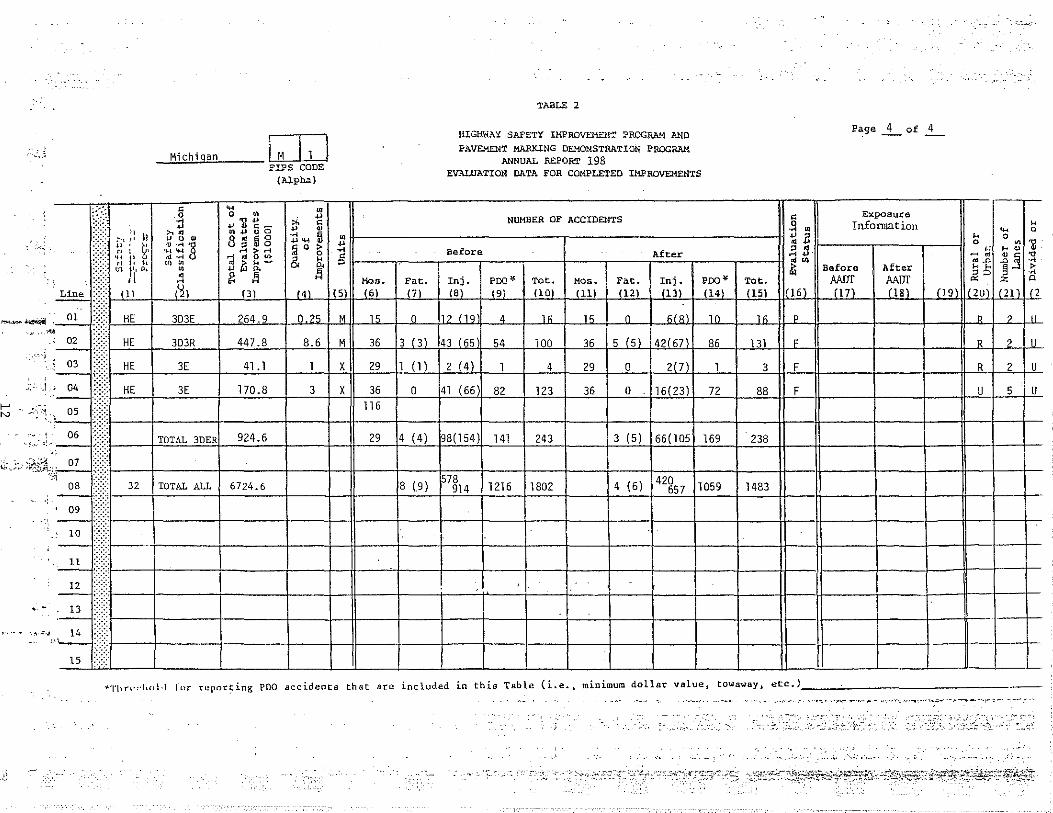
TABLE 2
liiGI-fuAY SAFETY IMPROVE.MEN·!' :?ROGRAH A."'D
F.\VEHENT MARKING DEMONSTRATION PROGRAM ANNUAL REPORT 198
EVALUATION DATA FOR COMPLETED IMPROVEMENTS
NUMBER OF ACCIDENTS
Before After
Inj. poo• Tot • Mos. Fat. Inj. •oo• (8) (9) !10) !lll (12) (Ill (14)
h2 f19' 4 lfi 15 0 6(8) 10
43 (65 54 100 36 5 ( 5) 42( 67) 86
2 ( 4) 1 4 29 0 2(7) 1
41 (66) 82 123 36 0 16(23) 72
98(154) 141 243 3 (5) 66(105 169
~78 914 1216 1802 4 420 (6) 657 1059
. -
.
Pa:ge ..1._ of _4_
" Exposure
0 Infonuation -~ • ·~ " il h 0 • 0 • " tl j.; " ~ .... • ~_j • "' •.n i.\ Before After 5:5 ~
Tot. AAJJr AAJJr "' z (15) 16) (17) (18) (19 2U) : (21)
lfi p D 2
131 E R 2
3 F R 2
88 F u 5
238
1483
""'Thn•:d,old (or- rl!porting PDO accidents that arc included in this Table (i.e .. minimum dollar value, towa-way, etc.)·---'------------
" 0
1l "' -~ > -~
" lfl _lL
U_
u
u
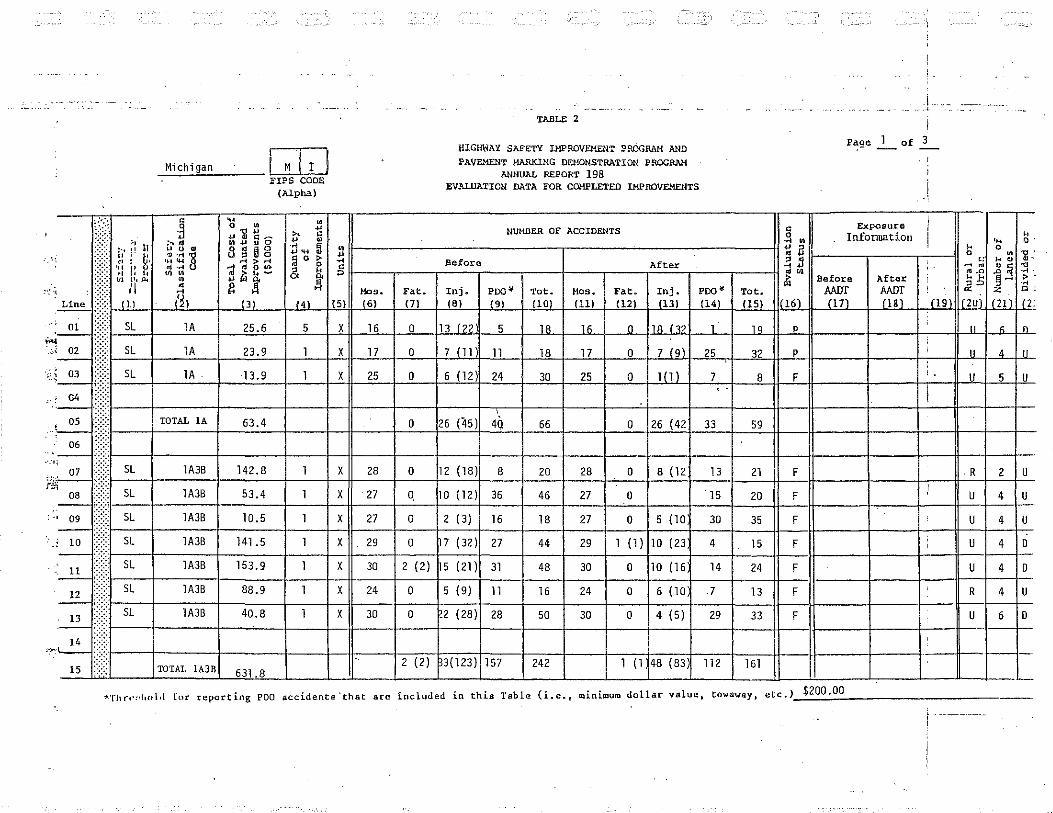
Michigan M I J _:_:;_:::=:::._ ___ ~IPS CODE
(Alpha)
TABLE 2
lUGH\'iAll SAFETY I.MPROVEMEN·!' l"ROGRA.."f. AND
fAVE.MENT HARKING DEMONSTRATION PROGRAM .ANNUAL REPORT 198
EVALUATION DATA FOR COMPLETED IMP.ROVEME.NTS
! "
.i
Page 1 of 3 . --
;:·:: ·~ ~ 111 !': c:: Exposure /
{{i :-. ~·~ 11 ~ ~ ~8 u~ ~ ~ ~ .ff ~ i ..., 1!-----------"-"_MB_E_R_O-,-FA_c_cr_o_"" __ Ts-----------fl ~ B Infonnation i ~ ':) ~ . ;::::: ~: ! g. '~ ~ ~ ~ > M ~ O ~ ~ Before After ~ j ~~----,---,--,---\1 : ~ ~ ~ ~ .: ::;::: ·~: i: lt <~ ·;;: ~ ~ ~!:! & ~ >:l ~ lA Before After ' . 5 ~ 1.J :E ;.
; ~j( fll Jl' ~ 3 ,g ~ H Has. Fat. Inj. pool~#- Tot. Mos. Fat. Inj. POO ~ Tot. til AMJf AAIJf 1 ~ z 0
~ :(:!-.l il!ll-!_J.! (~~ ~~~..l!J (:3 )1_-+...W t •4 lL__iJ.I?JS l:.Jl-'ll!:! •6Ll -+..li.LJ7l'-f-.1! I 18!ll -I-ll'!~ 'L__f-.!I!Jl QJ_!Ljf--1!1 le±lLI -j--!1Jc.l2~ lj-..i (Jl!.,!l!Ll +L!I l"!l4..ll±l511_l--1Jl±l62.J~'--jf--L!(ilc!_7lL_f-l.!(:l_2.8ly-..i (l:.=9lljfl II I.=_ :2 u~uituf i2..:.ll'f~ f :2:
~~ :t~---:S~l-l _ __!;lA~+---'2::!5.:..!. 6!._+-_l5_f-..iX.JI-_llQ.6 -+-O!L_-j.L13,L~ ( i2'"2Jj-._;5L_f-..i 11!.Lj; Rf-llJL fif-_!L_Oj.JilRJUf~ 1?_J..l·-j--..li..ll-Jt-.Lj Pl!---f---j-,~-it-..JL JLr'"-t.lL. n
' ; :: ::::::r-:::::~~~__;;:.::-+~~::0::.:: :!.-+-..!;-.j.-!:'-j\-....!.!:::__j---C:'--+:L..l. ((.!.!; :~)f--!:.!.: -jf-.U::!._f-:L!:-+-.!L:-+-'~:_ (].;1( ':Uf )__fi2:L_,-f-_;3!f.:-Jt_r:-1f---f---j-;:~-f-'~"-j·--" 45-j-JLUII
: : 'll--+r-o-rAL--lA--+--6-3-.4-+---+-ll--+-o-+26-(4-5-j)i--4,,o-ll--6-6--t--+--o4 2-6-(4-2+--33_'-+-5-9-!t--1t---f:---l-l'--ll--+-t-
o6 :'::·: - <<<·l---l----l---1---l-lf---ll--t--t--+--t--+-+-+-+---H--ti--+--+-+-t·-t-
i~ o1 ;::::f--s_L_+-__ 1A_3_a-+_1:..;4_2.,_.a_+_1:_+:...x1!-:...2:.:a_l-o:_-+1::..2:...(c:l::..Bl+--_:a:_+_:z:.:o-j_z:.:a-Jr_:o:_t-=a-(:.:1::..2+--1:.:3-+-2:.:1-jt-:...F_H----t---t-,--jj--'. R-'-1--=2-r-=-u 08 ;:;:::; SL 1A3B 53.4 1 X 27 0. 10 (12) 36 46 27 0 ·15 20 F ! U 4 U
: :: ij\:I:J-:-~-f--;-:-::-t-1-:-~-::-+--:-+-:-lt--:-:-l-:.:_+~.:_~-:~..:.)l-:-~-l--:-:-t-:-:-l--1~~~-)+-1 :-::-:+--:-o-+-~-:-tt-:-ij----l---ll-'-, -ij-~-j-:-j--~ - :::::::I---J.---+----t---.J-H----1---+_:_+-+--I----+__:_+__:_+--I---tii--H----+--+--t--I--J··.~ ::}:if-Sc-L-j-_1_A_3B--J.-1-5_3_. 9-+--1-+-X-Jl--30-f-2 _(_2 )+5__:_( 2_1.:_)1--3-1 -i-4-8-l-3-0--J.--0-J-1-0.__:_( 1_6+-_1_4-+_2_4-+f-F-Ii---f---f:--1f-U-j-4-j--D
_E_ :::}• ~SL--f--::-1.,-A3:c:B-f--8:-::8-.9:--+--:-1-J-X-lf--2-4_+--0-+5-(-;9-)+-1-l_j--16_j-_24_f-_o_.j-6-.,.(l..,.0+-·-7--i--13-fi-.-F-H---+--+--1f-R-f--4-j--U .~ :{t-s_L_i-_1_A_3B-f--4-0~.8--I--1--I-X-Jt-30_i-o---J--2-(_2B_)i-2-8-t--50-f-3-0-If--O-f-4-(5_)-l--29--t-3-3-J1f-F-If----I---T---Jt--U- 6 D
'"'~i}r--+---t------t--t---lb--+-::-2-;(72);-b3c:;(:c12:::37i)-:1:::57;---!-:2::-42:--!----l--:1-:(::-1t4::::8-;(783::)!-:-1:-:12--t-:-:1671-tt--ff---t---J-'--It--t---!-15 :::;:; TOTAL 1A3B 631.8
-t..Thrt•!<ltol·l for reporting PDQ accidents ·that are. included in this Table. (i.e., minimum dollar value, towa,.,ay, etc.)'_::$.::2:.:00:.:·.::0.:.0 _________ _
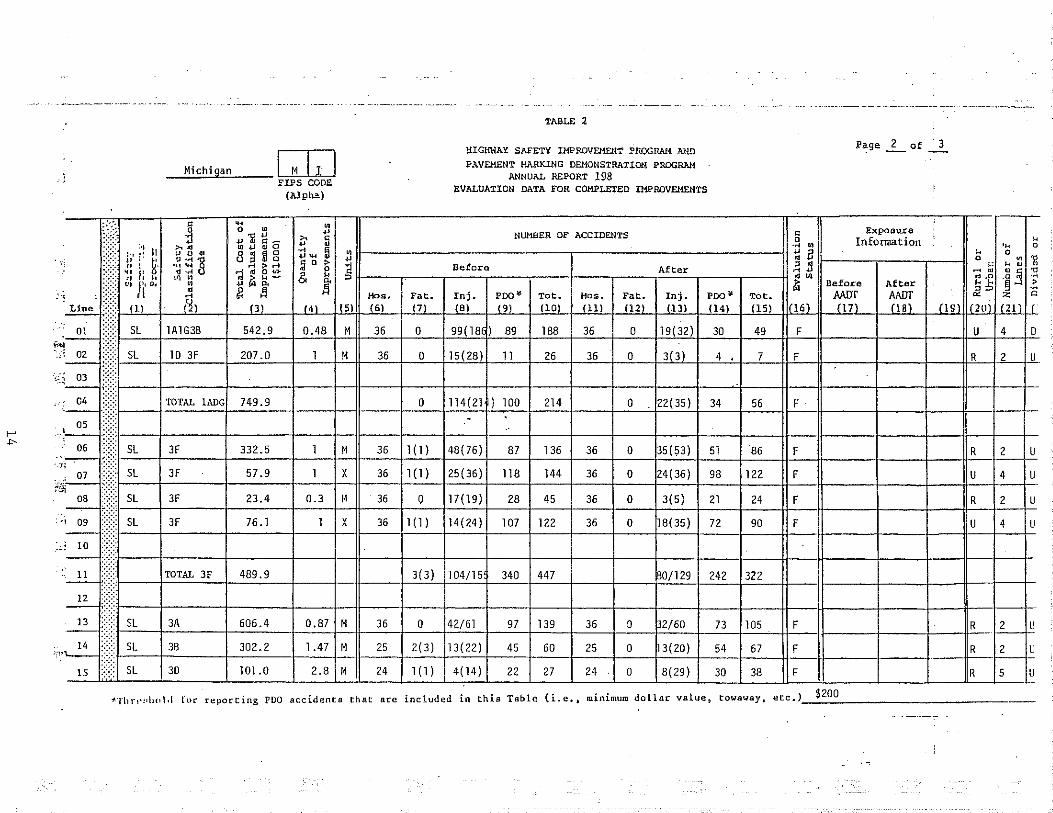
-~M~i~ch~i~g~a~n _____ l M I I I ~IPS CODE
(Alpha)
TABLE 2
tllGliWAY SAFETY IMPROVEMENT PROGRAM AND
F!I..VE.'-!ENT MARKING DEMONSTRATION PROGRAM ANNUAL REPORT !98
EVALUATION nATA FOR COMPLETED IMPROVEMENTS
Page _2_ of 3
:::·;. ,, :; 11
~ L ~ ~ h t ~ " II----------------N-u_MB_E_R __ o.-FA_c_c_rn_EN_Ts _________________ -H ~ B ln~~~tl~n h ·~ ~ :·:-:· t: ; g. ·~ ~ 8 ..-~ > ~ 5 o ~ ~ Before After ~ jU------.----r---U o ,.: ~ :::: 'g
; : ::::: ~l J\• J: <o ~ ~ ~ r & i 0
Mos. Fat. Inj. poo¥ Tot. Mos. Fat. Inj. Poo• Tot. ~ 01 8~r0 A;;;; ] £ p ~
·~ :;::;:l-..1!1 !lll-J_.L c''2,ul_-J--~ (.3)L_-+-lf.:!J•4lL..,fi(215l.Jl-'(l-"!'6Ll -+..ll.u7l!__jf-Ji(B~l-j....:f'-''9L-I-I--'I"-'1Qoylf-_i-'"lc:1Ll -f--'1'-'1""21-+..l {:l"-'3'.Ll+~ll.:!<yl_:f'-'l"-'5l-lful,.§l'--lt--_(-'"l"-IlL--J-..il.w1"'-llyf-.JJ.l.<i!~Ujf'lG"'-2"'Ui'tl-'" (;2._.1)"11-'-f
~~ :::::J-:SC:L_~1 A~1;:G~3B:_--J.__:5:_::4.:_2 :.:· 9~+0~·::!4;?_8+:!.M .jj-..:3~6--jf---CO:_+_:c99'-!(~1~8 :j!)---'8~9~_.!.18~8'--!~3~6 --jf---~0 -j-1C::9:l.( 3~2'1)f-_:.30~+_c4_;c9 -j~F-j/----j----j---~U--j_;4,__T'-D i--'!:_ j}t-::.SL~+~1D:...;_3Fc__--j__:2:::;07c_:.c:O_.j--1!__-j-'lM-If-~36~f--~O--jf-!1..:'.5~(2~8Lj) f--1!..!1--jf--'2~6-j--"3~6-+~0--j--=3.L(:3<L)f--'4'-'-f-.!.7_frF:.._1)--,----t--+--Jt~R--j-'2~rU
·,:; 03 :::::: . ·-;:::::I-__JI---I---1--I-II--I---t--+--l---l---l---l---+--4---H--III---l---l--+-t--t-'~ ::fJ---J.:C:TO:_:T:::AL~I:::AD~Gf-.:_74::_:9:_;·::_9_+--l-.JI---,f--:C0_\-1:_:1_::4"':2:_:1f'-) _,:1::_00::....t_..:;2:.:_1::_4+--i~0:_-'-f:2.:_2(c:3:::5!...) f-3:_:4!__+::_:56:_-lJ-.c_F_II----J.---J.--Il---l--t--
f; : lj-::=-~ -+-=:-'-:----1-...:;_3:::.~::.:::.:-+--'-; -j.C.:'-Jt-=-::=---1-':'-'-:-'-: :'--1-:::.:::.: 3::.7 ::..:;+--1-'-~:-1---';::.:::.: -j-.C.:::.:-lf-:=--+:=-: ::..::::.::...: +-:=-:-+1 8::.2:=----+J--'-: -li----+---+--H-:"-+:::__-r~ oa ::::::: SL 3F 23.4 0.3 11 36 0 17(19) 28 45 36 0 3(5) 21 24 F R 2 U
,--;- ~ :m:f-S-L -f-3-F---t--76-.-1-+-1-Jf-X--fl--36-f-'1-(.:_1_) -t1-4:_:(..:.24_:)f--1-07-j-1-2-2-jf-3-6-f-O--t1-8(::.3.:.5_) f-7-2-+-90--jj--F-H----t---t--tf-U"---j-4--J--U
- ·'·'·'·l--l---,l---1--l--11--ll---1--'--'+--l---t---+--l---'-l---+---H--It---+--t--ll---1-+ ; 10 ·:-:-:·
- ·.·.·.·J---t---l----l--.J--fl--1--l--+-+--l---l---l--+--1---ti---H----t---t--ll--1--+ ··._2!._ ; {,f---tTC:CO:C::TAL=-:3::F-j__:4::.89:_:·::.9 -f---t-Jf---+_:3_,_,( 3'-')+1::.04_:/.:_15+...:3:..:4.::.0 -j-4'-4"-7-J--+--f~:::(0'-/1:::2.:_9 +2:_:4.::.2-+::32:::2_tf--j f------1----+--+-J---J-
~ :r+-· --l---+---+--l--il---+--+--1:--+--+-+--+---,i---+---+l---l+---+--ll---ll--+-t-~ :;j-s_L_+3...:A __ -j__:6_06_._4_-j-_o_._87+M-1!--'-36'--f--'O-f4...:2::./.:.61-1_..:.9_7+_13c;c9_f--3'-'6'--f-O'---fp..::;2'-/6:...:0-j-7_;3'--ll-1"-05.:_-ft::.F_It----t----t---JrR __ 1 ~2:_-J."U
,,.~ ::~-· ::.S::.L --j-=-38::_ __ i--=3-'-02::.·_::.2_+_:_1 :_· 4_:_7+M-1~_::2::.5 -+_:2_,_( 3:_:)-+1_:3_,_,( 2::2::...) t--4_:5+.:_6:_:0_r-:2::5--ii--=0-+3-'-( 2:.:0:.:_) +_:5:_:4-j_6:_:7_*F--ff----+---+--JrR-r2:_+C
15 ::} SL 30 101.0 2.8 M 24 1 (1) 4(14) 22 27 24 0 8(29) 30 38 F R 5 u
"'Thr 1·;dwl.l fur reporting PDQ accidents that arc included in this Table (i.e., minimum dollar value~ towaway, etc.),_.:_$2_0..;.0 ____________ _
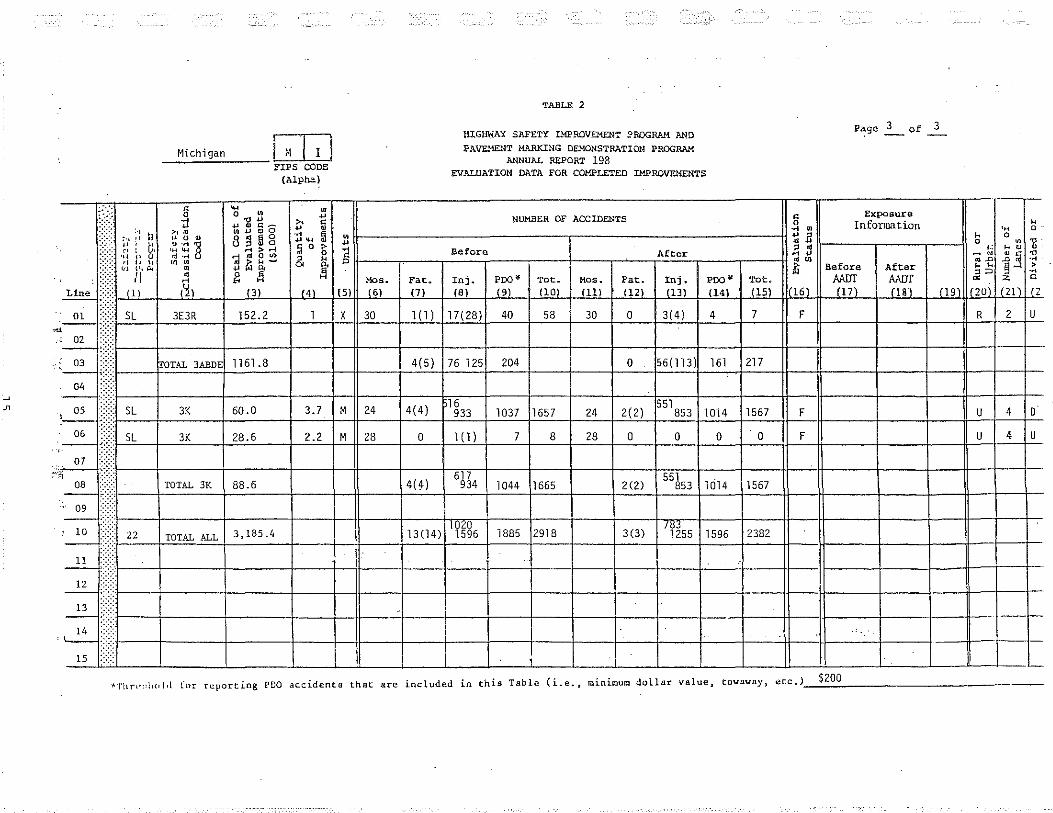
Michigan H II _..;.:_:..;.:.:=:::...--- PIPS CODE
(Alph.o)
n~: " ~ ~ 0 0 • .., ·j .,11 " o-
, " :·>:· " • ;.l
II ,. • " 0 0 ... li ·.·.·.
ii' " " u • 8 ~ ~g "~ •
·:-:
;
~- " .. 8 " " '~I 4-.1: .-< >--' ~ 0 > 1 '" ;, .... ';j • 0 ~ 0
& " . , ,, ,, <0 • li s.- ~ " " ('• Ill • " I I • g 11 ... Mos. Fate Line
~~ (1) N1 (3) ( 4) {5) (6) (7)
01 SL 3E3R 152.2 1 X 30 1 ( 1 ) :-
"' .•: 02 -03 ITO TAL 3ABDE 1161 '8 4(5) ·-G4 .::;::: 05 SL 3K 60.0 3.7 M 24 4(4) ,_
~}! 06 SL 3K 28.6 2.2 M 28 0 .·,,-
rm 07 c·-•, ~;:;::
·.•.· 08 TOTAL 3K 88.6 4(4) .- .... ·.·;
' 09 -·
10 ... 22 TOTAL ALL 3,185.4 13(14) -
...12:_ !::;::;
_E._ i(r 13 ·.·.·.
- : . . c.2:_ 15 :::: ~:
TABLE 2
li!GH\'(AY SAFETY IMPRDVEMEN'!" .?ROGRA."i AND
l?~11,.VE.'1ENT MARKING DEMONSTRATION PROGRAM
ANNUAL REPORT 198 EVALUATION DATA FOR COMPLETED IMPROVEMENTS
NUMBER OF ACCIDENTS
Before After
Inj. poo• Tot. Mos. Fat • Inj. Poo• (8) (9) (10) (11) (12) (13) (14)
17(28) 40 58 30 0 3(4) 4
76 125 204 0 56(113) 161
16 551 933 1037 1657 24 2(2) 853 1014
1(1) 7 8 28 0 0 0
617 551 934 1044 1665 2(2) 853 1014
1n9 1596 1885 2918 3(3) 1~ss 1596
i .
P":ge _3 _ of _3_
" Exposure
0 Infonuation " ... • 'H o·
" il h 0 • 0 ~ 'l1 " j j.: h 0 ... ~ ru _gj "' • "' ru.n . .. li Before After !;:S ~ > ...
Tot. ~~ ANJr: "' "' Q
(15) 1'161 -~-t81 119\ I 1201 I rz1 1 I rz
7 F R 2 u
217
1567 F u 4 D
0 F u 4 u
1567
2382
.
1-- -
"'Thn•:d,old [or re.porting PDO accidents that are included in this Table (i.e., minimum dollar value, to"'a"'ay, etc.)• _ _:$::20::;0::._ _________ _
Safety Program Activities
A Safety Improvement process was first outlined in our Eighth Annual Report in 1981 and revised last year. This years report includes a further revision of the Safety Improvement Process, located in the Appendix. Major changes include a process for developing and implementing non state trunkline HES projects.
As outlined in last years report, engineering evaluation and analysis on the sta.te trunkline system continues to be the primary responsibility of the Traffic and Safety Division's Safety Program's Unit. Major activities of the Safety Program Unit are discussed below.
Crash Analysis/Roadside Safety Program
The Crash Analysis/Roadside Safety group evaluates approximately 2,000 trunkline locations which exceed predetermined threshold numbers of total accidents or accident types (including ran-off-road), in a two-year period. A more detailed discussion of the data analysis/evaluation/project selection process is included in the appendix "Safety Improvement Process."
In addition, in response to a Federal Highway Administration mandate that a safety analysis on all 3R/4R type projects be completed, last year approximately 150 accident analyses were conducted for road and bridge projects.
TOPICS Program
The Traffic Operations Program to Increase Capacity and Safety (TOPICS) is the traffic engineering element of the department 1 s Transportation System Management (TSM) process.
The program encompasses both state trunklines and local streets in 32 cities with populations greater than 10,000 to assure a comprehensive, integrated effort to indentify and solve traffic engineering problems. The local street review is accomplished by our Community Assistance group funded by Federal Section 402 funds distributed through the Office of Highway Safety Planning. The TOPICS reviews are closely coordinated with the Metropolitan Planning Organization (MPO) in 15 larger urbanized areas and with appropriate local officials in the smaller communities.
During the past year, we completed TOPICS studies in Adrian, Owosso, Monroe, Traverse City, Niles, and Flint (Genesee County). The six studies involved review of 204 locations experiencing concentrations of accidents or congestion. Fifty-four percent of the locations were on the state trunkline system and 46 percent were on local street systems. Corrective recommendations totaled 291 and consisted of 249 low-cost operational actions and 42 capital outlay (construction) projects. Based on a conservative five percent expected reduction in total accidents for each of the operational recommendations and a $2,000 average implementation cost, the time of return (TOR) for the operational improvements is estimated to be less than one year.
Construction projects ranged from pavement friction improvements to intersection and corridor widenings. Thirty-four of the 42 projects potentially qualified for HES funding. Additional considerations, such as capacity, were involved in recommending the eight other projects. The average cost of the 34 safety justified construction improvements was estimated to be $123,000 and the average annual benefit was estimated at $30,000, providing an average TOR of
about four years. By December 1984, 50 percent of all 1984 calendar year recommendations had already been implemented. A minimum 90 percent final implementation recorded is anticipated.
Community Assistance Program
The Community Assistance Program assists in the identification, analysis, and correction of locations experiencing accident concentrations. The program is funded by a Section 402 grant administered by the Michigan Office of Highway Safety Planning.
We continue to emphasize integration of the Community Assistance Program with our TOPICS program as discussed previously. This results in a much higher level of activity and, we believe, a more efficient, cost-effective use of personnel. The Community Assistance Program does, however, continue to respond to any local agency requesting its services.
During fiscal 1984-85, the Community Assistance Program analyzed 108 locations. Ninety-four were included as part of TOPICS reviews and 14 were completed on a special request basis.
17
APPENDIX I SAFETY IMPROVEMENT PROCESS
Table of Contents
I. Planning
A.
l. 2. 3.
B.
c.
L 2. 3.
D.
1. 2. 3.
Data Collection
Accident Data • Traffic Volume Data Highway Data. • a) Photolog ••• b) Sufficient Rating. c) Pavement Management System d) Railroad Crossing Inventory.
Data Analysis
Engineering Studies
Location Review List. Preliminary Analysis. Final Analysis and Identification of Corrective Countermeasures.
Establishing Priorities
Time-of-Return Analysis Cost and Resources. • • Rail/Highway Grade Crossing Improvement Program
II. Implementation. • • •••
III. Evaluation and Reporting.
A. B. c. D.
Exhibit Exhibit Exhibit Exhibit Exhibit Exhibit Exhibit Exhibit
I II III IV v VI VII
Time-of-Return Statistical Analysis Program Analysis Type of Improvement Analysis
PTR Location Map Speed Monitoring Location Sufficiency Rating Accident Threshold Table
Map
Intersection Threshold Listing MIDAS Reports Sample TOR Worksheet
VIII Grade Crossing Inspection Report
Page
1
1 l 4 4 6 6 6
6
8
20 20
21
21
21 22 22
25
26
26 26 27 27
I. i,
I. Planning
A. Data Collection
1. Accident Data
2.
The Michigan Department of Transportation utilizes a computerized crash location reference and analysis system referred to as the Michigan Accident Location Index (MALI). The MALI system generates computerized descriptions of traffic crash locations directly from the information reported by the police officer. The system uses a street index composed of distances between intersections, alternate street names, and accurate city and township boundaries.
The MALI system enables the user to identify locations on all roads and streets with concentrations of correctable accident types.
Traffic Volume Data
The department utilizes Permanent (automatic) Traffic Recorders (PTR), portable traffic recorders, and manual recording techniques to collect traffic volume data on the trunkline syst~n. The counting network consists of 110 PTR's 393 portable traffic recorder "A: stations, and 2858 portable traffic recorder "C" stations. ATR data is used to establish seasonal and annual volume trends (refer to Exhibit I). "A" stations are counted for one week, three times a year and are used to determine where patterns change& '"C" stations (short counts) are counted once a year for 48 to 96 hours and are used to identify volume changes.
Vehicle classification surveys are conducted year-round at all the permanent traffic count stations by manual observation for 8- and 16-hour periods. This data is used to determine the mix of commercial traffic on the trunkline system.
Special intersection traf fie surveys are conducted on a "request basis" primarily for traffic engineering analyses •. These surveys usually include 8-hour manual turning movement counts and 24-hour machine counts. Backup, gap-and-delay studies and pedestrian volumes are included, when appropriate.
All traffic volume data is stored on magnetic tape in the department's central computer. This information is used to estimate present and future traffic on the state trunkline system, analyze traffic flow at specific locations, and monitor annual and seasonal traffic trends.
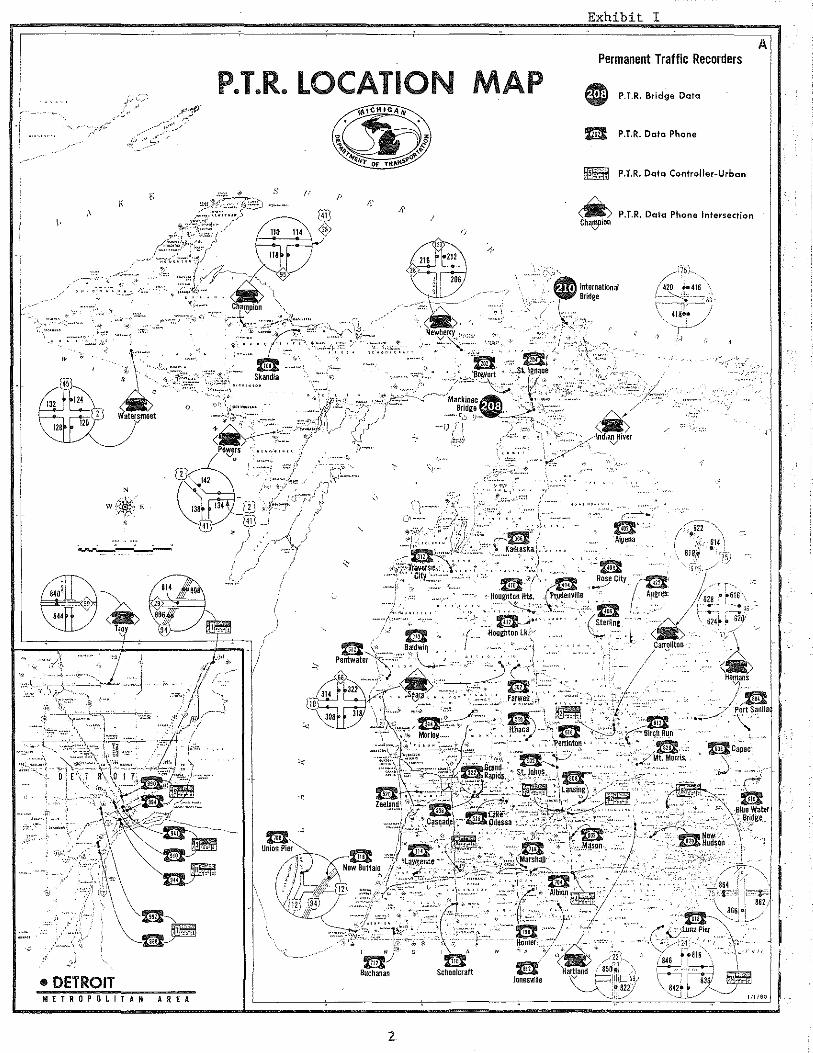
Exhibit I
AI Permanent Traffic Recorders
l P.T.R. LOCATION MAP G P.T.R. Bridge Data
'
R P.T.R. Data Phone
ffis/#Jffil P.T.R. Data Controller-Urban
K P.T.R. Data Phone Intersection
N ., w~~F.
a ~
Union Pier
• DETROIT METROPOLITAN A R E A
2
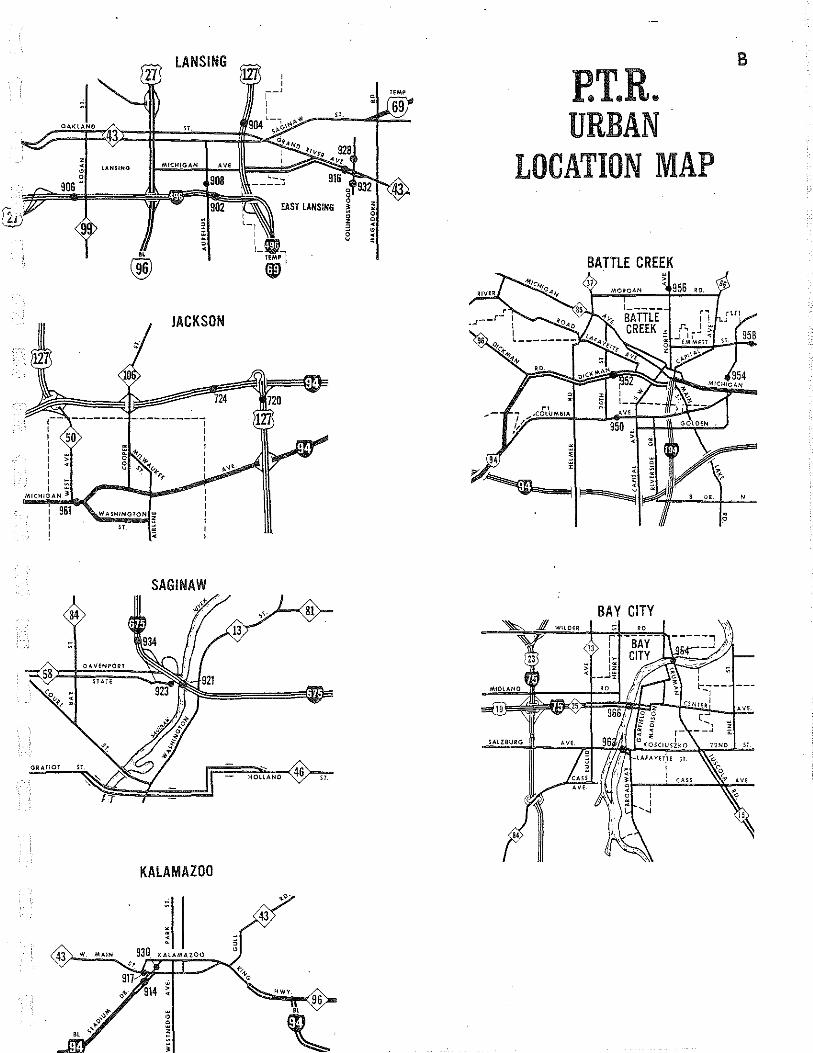
LANSING B
"'
HMI' P.T.R. URBAN OAKlAND H.
43 z LOCATION MAP < LAN$1N(I M!<:HIGAN "' 0 0 908 906"
(;;-. EAST lANSING • ® I 0 0 '-, <
I 0 <
II~ z
" @) - fEM'i BATTLE CREEK <W
JACKSON
724
~-- ------- ----------1 I
\ 50 l I ~ ~ I I > o "t.~t- I I .c 8 ,( I I "'> <-.r I I :;; . "'"'
MICHIJAN 3: 961 WASHINGTON ~
0
ST. ~ <
SAGINAW
BAY CITY
KALAMAZOO
Data from the PTR stations are published in a monthly report (MOOT #65) which is available to the public. A magnetic tape of this information is also transmitted to the FHWA in Washington, D.C., to assist in identifying national traffic trends.
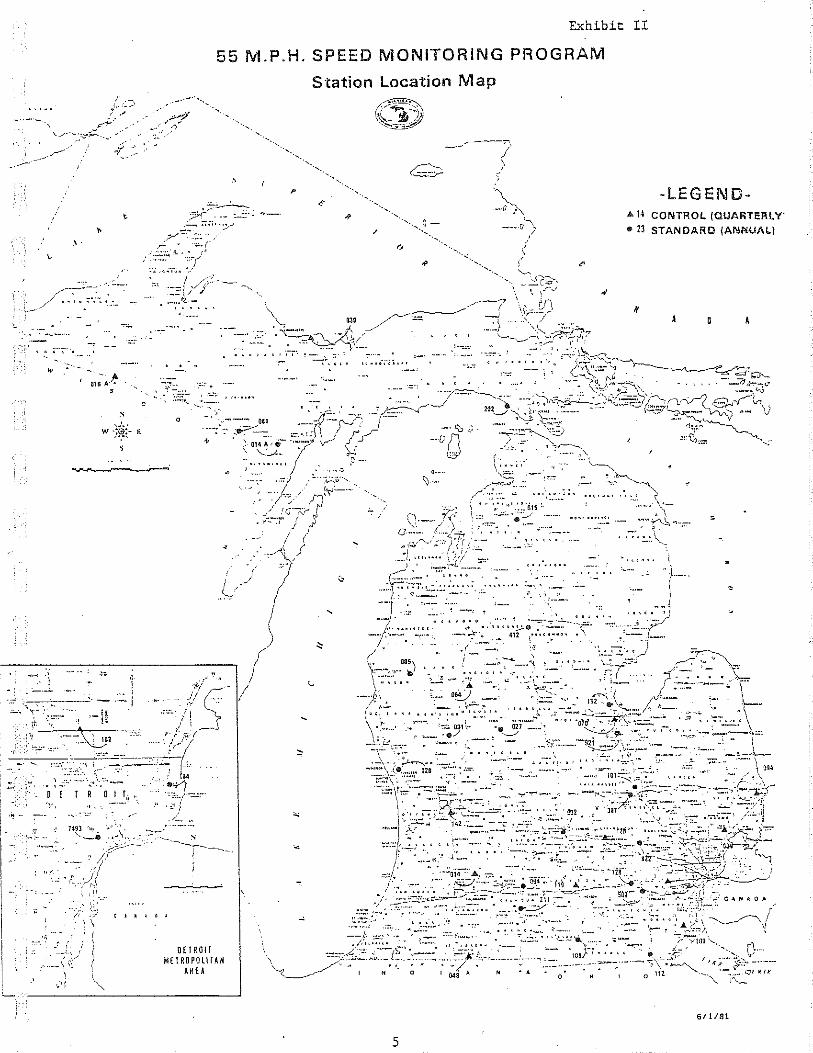
As a result of the Surface Transportation Act, vehicle speed data is also collected statewide. This information is collected using automatic equipment from 44 stations (see Exhibit II) and is reported on a quarterly and annual basis (MOOT #66). The data is sent to the FHWA in Washington D.C. on a quarterly and annual basis as part of Michigan's Annual Certification. This certification is accomplished in cooperation with the Department of State Police and the Office of Highway Safety Planning.
The department also conducts spot speed surveys, primarily to evaluate the need for new or modified speed limits. This data is maintained in a computerized file, tabulations of which are available in the Traffic and Safety Division.
3. Highway Data
Many different inventories are maintained which include highway data. These files can be generally characterized as length or point highway data. Length data includes roadway features and roadway alignment. Examples of roadway features include facility type, tyoe of parking, surface type, and roadside type. Roadway alignment data is not generally available from a single source and is usually collected and stored in response to specific needs.
Point highway data includes traffic control devices (signs and signals), guardrail, interchange configuration, intersection geometry, structure, and bridge data, railroad crossing information, (see d below), and utility placement.
The computerization of the department's highway related data is the subject of continuing review. The task force, which was formed last year, has developed several recommendations to improve the integration and accessibility of our highway data sys terns.
These highway data systems warrant special mention:
Photolog
The department maintains a photolog system which provides a 35mm sequential film library of all state trunkline roadways and federal forest highways. The system includes a control section-milepoint reference system which is coordinated with the MALI system.
The photolog and viewing equipment are located in the department's Traffic and Safety Division.
-
·~ -
)' .-J·.• .-____ ,
' ·' ;--V ->,._.,-· ~ :;;;:--:::.. .---··
,.....--:------<---:· // ........ .
·-
•
'
~·· .... ; •' '!
'~·. ''·.
. ' .. ;- .
;;
14~3 ,,~, . >· ·---· .. ~\ .
- . __ .. ,_, , ·/ -·- \ \~
' .
'
Exhibit II
55 M.P.H. SPEED MONITORING PROGRAM
·:::-,.-'
-~ .,~o:. •. _/
•--,.-· ·~ "' ~---
' . DETROIT
METROPOL!fAN AREA
s
( _j
p
Station Location Map
~~ "~-..!!!#
-~~ ---')
(
'
-LEGEND-"14 CONTROL (QUAIHEF\l y·
• 13 STANDARD (ANNUAL)
' A
."' ~--·-~----~----------~
6/1/81
5
The system is used to document and evaluate roadway geometries traffic control devices and is updated periodically.
b) Sufficiency Rating
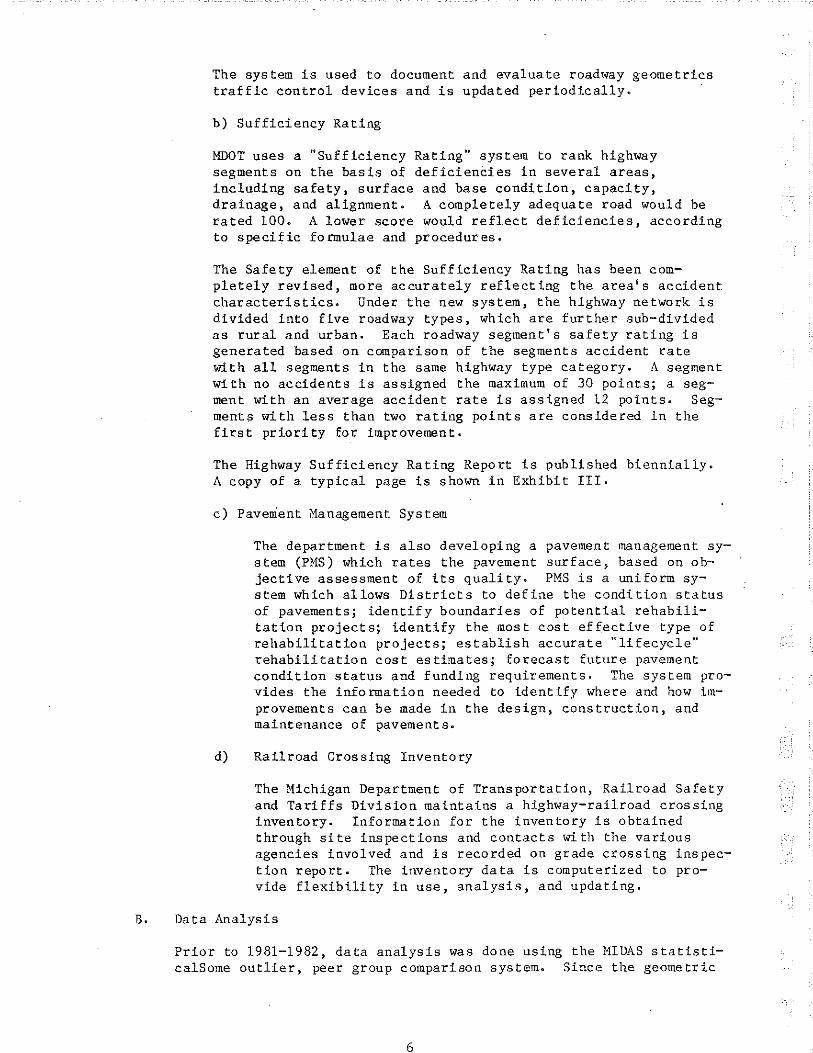
MDOT uses a "Sufficiency Rating" system to rank highway segments on the basis of deficiencies in several areas, including safety, surface and base condition, capacity, drainage, and alignment. A completely adequate road would be rated 100. A lower score would reflect deficiencies, according to specific formulae and procedures.
The Safety element of the Sufficiency Rating has been completely revised, more accurately reflecting the area's accident characteristics. Under the new system, the highway network is divided into five roadway types, which are further sub-divided as rural and urban. Each roadway segment's safety rating is generated based on comparison of the segments accident rate with all segments in the same highway type category. A segment with no accidents is assigned the maximum of 30 points; a segment with an average accident rate is assigned 12 points. Segments with less than two rating points are considered in the first priority for improvement.
The Highway Sufficiency Rating Report is published biennially. A copy of a typical page is shown in Exhibit III.
c) Pavement Management System
The department is also developing a pavement management system (PMS) which rates the pavement surface, based on objective assessment of its quality. PMS is a uniform system which allows Districts to define the condition status of pavements; identify boundaries of potential rehabilitation projects; identify the most cost effective type of rehabilitation projects; establish accurate "lifecycle" rehabilitation cost estimates; forecast future pavement condition status and funding requirements. The system provides the information needed to identify where and how improvements can be made in the design, construction, and maintenance of pavements.
d) Railroad Crossing Inventory
The Michigan Department of Transportation, Railroad Safety and Tariffs Division maintains a highway-railroad crossing inventory. Information for the inventory is obtained through site inspections and contacts with the various agencies involved and is recorded on grade crossing inspection report. The inventory data is computerized to provide flexibility in use, analysis, and updating.
B. Data Analysis
Prior to 1981-1982, data analysis was done using the MIDAS statisticalSome outlier, peer group comparison system. Since the geometric
6
I
~-:RTIH(; MIL[ POH lfHGTH
YR. OF LHE!T IMPROV.
URB4tl OR RUR4L
PRE00Miti4HT WlllTH
P4Rt:IHG
lG1J. HIGH HOUR IH IO'o
4.0. T. Ill 100" •
"COJ.IMERCI4L VEH.
"SIGHT REHRICTIOH
4CC. PER 10e VEH. MI.
CJ.P4CITY RATIHG
!URFJ.CE RA.TlHG
BASE RATIHC
SHETY RATIHC
SUFFICIENCY RATIHG
REC. ~-YR. PERIOD
·,.,~i TO~AL ~AVE~ ffl~
6f.9 I~TAL T.L. ;!. 5C.I lSI P•l~~ IMP HI
r-ifutiHC ouLE I
I I I I
'
~ ·-=~: ~~i~-;r-n ~-~
cu .... ~~· -~u·R t t.-.PAOV.
"
I .. ··" I ~0•. 'li_~.H} ••D!..l!.__
t , •• 1>•(,
.. W• .. lt." HO\i . ··- ..... ~ ·~•o·, 4 II ' '" ,.._,., , ..
I l (~.,..•(Hh I· ! \\•"."'IHII I •• : rra ,y
1 .:.fi(Jif ••
---L_ ~!tl~ .,, 110>1 -· . -Vttt. WI.
··-
''"" -
... --·· .... ~.,, .. , '"' -• ••t •• ''"'-' ••• t r r a 1 ''" '
'
··--
- ..
I. WJ,JClfHC · hiiHC.
·i,(ID·-r>· .. _ ... ··--
! l '"' t ~ .. II ( ''"" ·--· ..
-..l)· 0 ' . ' ' .u .. 4 • I
" 72 T2 12 R u u
_L< • 8 • c 2 2 0 52 52 55 55 40 40 42 42
' " 26 __11 0 ~
c 0 , 0 l 40 40
1 7 1 7
1---,~ ' blt?.tJr
'" IR " 12 11 ., " "" . .z. ' ' '
lUObl
---IH I D CAfB CAPAt;ITY RATIHG CONTROL
• ' t ' '
UU( TO UIHIHG!PARI<IHG. ____ _ l:tli<JI[~ !ST. PRIORITY f Oft J t\f'ROYE11ENT
' ' . . ..L JhL
4:? 0.7 ·.I 72 72 74 74
l u u • • 0
0 c 0 2 5 I 66 I J~ 130 43 52 II~ 110 2& ze 1 5 IS 21 c 0 0
0 G •l 0
'" ? I " 7 ' 6 __u__ 6 6 6
4 I a 18
'·' 4? " 77
' . 2 2
' +:::WIDER BY 9 OR MORE
P =-PROGRAMMED
FA
' .J! _b_f!_ rt• .4 0.2
l.L_ =u.. 1< u " R
• 2 • • 2' 0 0 (
79 54 71 65 45 4! 22 29 2(
0 __;_L_ (
J 0 (
29 4 ( 6 a f
II lr 1 A I 6 f 6 •• 6•. z;
_lh 49 7f
I _I .
30062
PAGECl
I I I I
7 ·' :.1.
_ii •2
c 11 !I 23 49 c
2 _j_
€ li_
" f5P2
I
I .. (7
_ii -+.1..4
c 17 49 p 76 c
• "2,. "" ••• 3 • •
• !..6_• •
,. !l2f
/
/ / ...
c...JL f,L
.1'_ _2_4
0 94 54 II &l c
*. ~-'--** ... .. li
" 165FL
DISTRICT 6
/ ~-~ ·········f"c /
1> 18.7 ' _ll.L
~.L I f o. o...L .Jl.2. E9 6J_ li _u_ ~9
_fc Jt u ....!1. u •• 4 • ..z..• •li _2_4
0 c 0 _l_ 0 90 I ' 1~ U)] t02 ~0 8! 99 02 105 I- f 7 7 7 ~2 2~ 0 0 0
0 ( 0 0 _!l I I ... • ... '!.L•
•* JH .. ,..1,. ··~· ,.. • •_Z_• .... ~. ... Jrlt;0.tlt11111 •• !.2..• a•~a " • -!2..*
• !.it_ • .. ._!,_ 12..
'" ll ?9 ...ll. 15 . :l..5..l _l 1 I
4 6_FL1.
Q/424!06 101(5/82
12
. .2..l.Jo. -'LJ. _r,_9 _.ii .1._1,
_j) _
I 0 I 98
7 67 _j)_
J2. • '"~-.3• ••U•
..1_
__iL_
1
- • . l1i.
.1'_
2.! _j)_
90 66 I 1.8 _jl_
__ Ll ..5..
~
2
81 OJI
"" c. j::. <7 r'· rt
H H H
cc~r.
features and traffic control devices weere not updated, the "peer group" analysis has been suspended temporarily.
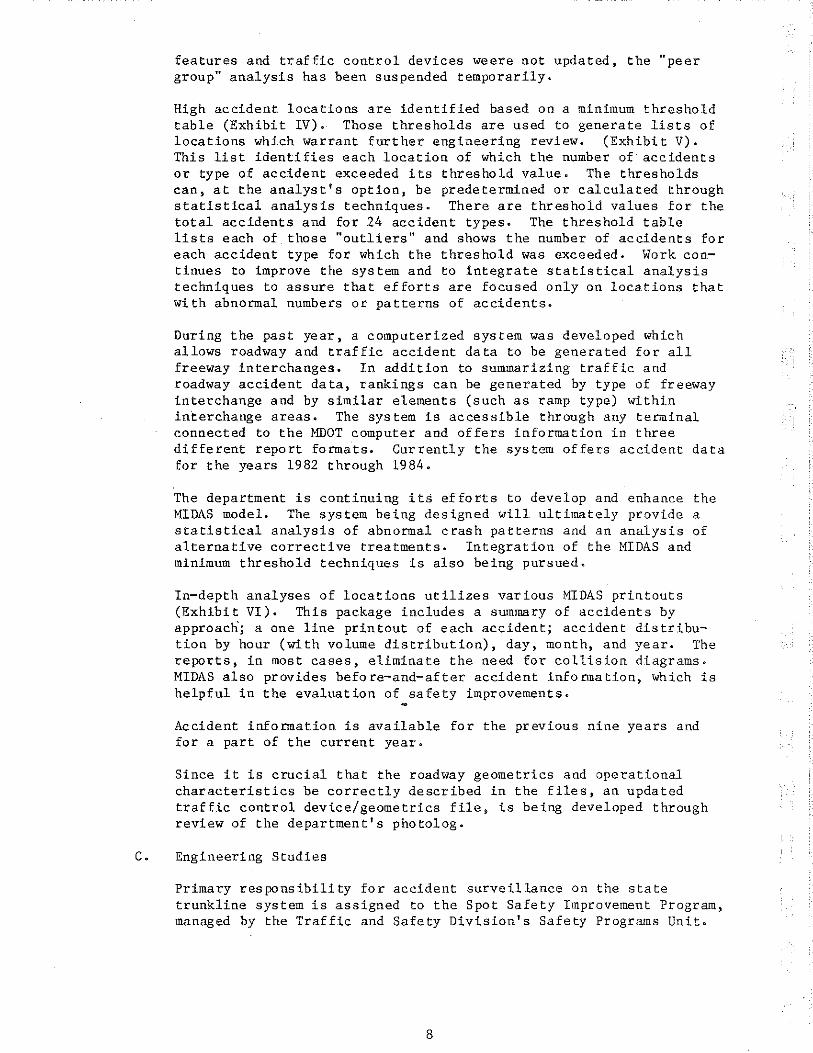
High accident locations are identified based on a minimum threshold table (Exhibit IV). Those thresholds are used to generate lists of locations which warrant further engineering review. (Exhibit V). This list identifies each location of which the number of· accidents or type of accident exceeded its threshold value. The thresholds can, at the analyst's option, be predetermined or calculated through statistical analysis techniques. There are threshold values for the total accidents and for 24 accident types. The threshold table lists each of those "outliers" and shows the number of accidents for each accident type for which the threshold was exceeded. Work continues to improve the system and to integrate statistical analysis techniques to assure that efforts are focused only on locations that with abnormal numbers or patterns of accidents.
During the past year, a computerized system was developed which allows roadway and traffic accident data to be generated for all freeway interchanges. In addition to summarizing traffic and roadway accident data, rankings can be generated by type of freeway interchange and by similar elements (such as ramp type) within interchange areas. The system is accessible through any terminal connected to the MDOT computer and offers information in three different report formats. Currently the system offers accident data for the years 1982 through 1984.
The department is continuing its efforts to develop and enhance the MIDAS model. The system being designed will ultimately provide a statistical analysis of abnormal crash patterns and an analysis of alternative corrective treatments. Integration of the MIDAS and minimum threshold techniques is also being pursued.
In-depth analyses of locations utilizes various MIDAS printouts (Exhibit VI). This package includes a summary of accidents by approacn; a one line printout of each accident; accident distribution by hour (with volume distribution), day, month, and year. The reports, in most cases, eliminate the need for collision diagrams. MIDAS also provides before-and-after accident information, which is helpful in the evaluation of safety improvements.
Accident information is available for the previous nine years and for a part of the current year.
Since it is crucial that the roadway geometries and operational characteristics be correctly described in the files, an updated traffic control device/geometries file, is being developed through review of the department's photolog.
C. Engineering Studies
Primary responsibility for accident surveillance on the state trunkline system is assigned to the Spot Safety Improvement Program, managed by the Traffic and Safety Division's Safety Programs Unit.
8
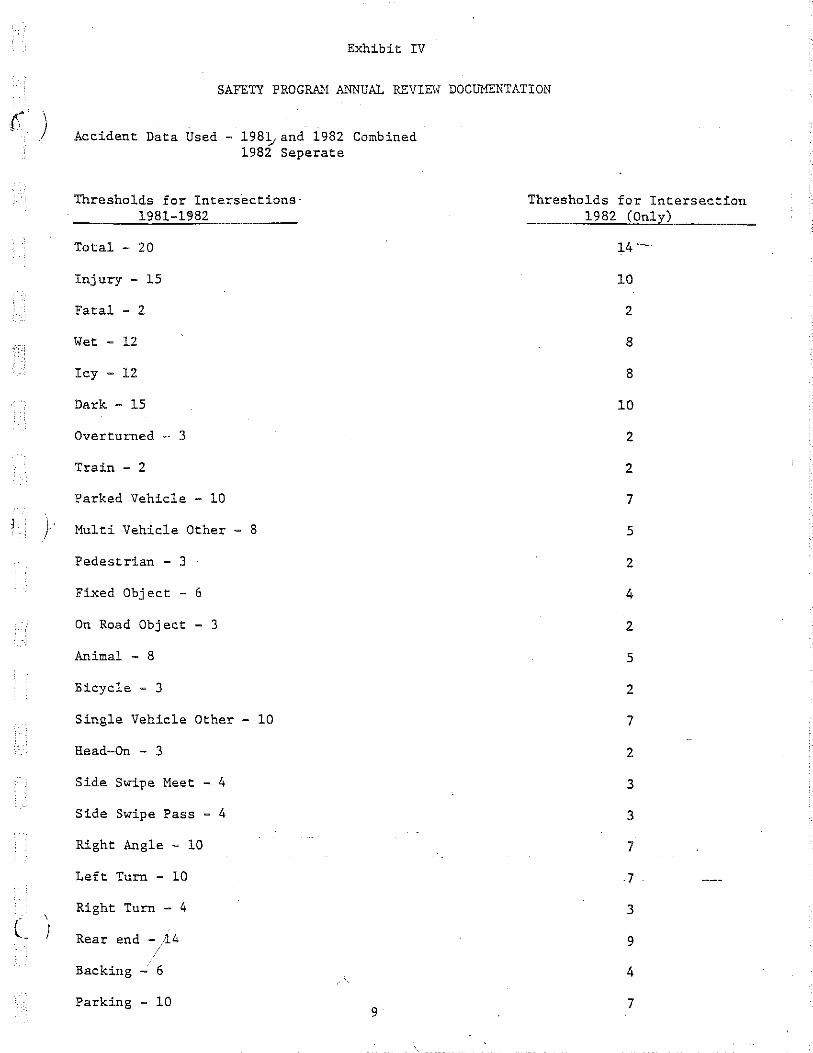
Exhibit IV
SAFETY PROGRA}! ANNUAL REVIEH DOCTJMENTATION
r:· ) ' ' Accident Data Used - 1981,. and 1982 Combined 1982 Seperate
Thresholds for Intersections· Thresholds for Intersection 1981-1~82 1982 (Only)
Total - 20 14'-
Injury - 15 10
Fatal - 2 2
Wet - 12 8
Icy - 12 8
Dark - 15 10
Overturned - 3 2
Train - 2 2
Parked Vehicle - 10 7
)' Multi Vehicle Other - 8 5
Pedestrian - 3 2
Fixed Object - 6 4
On Road Object - 3 2
Animal - 8 5
Bicycle - 3 2
Single Vehicle Other - 10 7
Head-On - 3 2
Side Swipe Meet - 4 3
Side Swipe Pass - 4 3
Right Angle - 10 7
Left Turn - 10 -7
Right Turn - 4 3
c \
I Rear end -;14 9
Backing - 6 4
Parking - 10 7 9
(
(
(
Exhibit V 1981-1982 INTERSECTION THRESHOLD LISTING
DISTRICT 9
ACC TYPE
N ACC
82062 00.70 US-12 s Lane Divided/Tangent Total 20
REMARKS:
82062 5 Lane-2 Total Injury Wet
01.11 US-12 Way/Tangerit
39 16 16
Right Angle 10
REMARKS:
82062 01.29 US-12 5 Lane-2 Way/Tangent Tota 1 34 Rear-End 2.2
REMARKS:
THRESHOLD NUMBER
NOWLIN STREET Urban/Signal
000020
Ml LIT AR Y STREET Urban/Signal
000020 000015 000012 000010
HOWARD STREET Urban/Signal
000020 000014
DEARBORN CY. 20 TOTAL ACCIDENTS 12 ft. Lane/Curb
DEARBORN CY. 39 TOTAL ACCIDENTS 12 ft. Lane/Curb
DEARBORN CY. 34 TOTAL ACCIDENTS 12 ft. Lane/Curb
PAGE 189
82062 01.:~a us~12 MASON ST~EET
Urban/Signal DEARBORN CY. 65 TOTAl ACC ~·.:Jt::."-N"'T""S,_--------
5 Lane-2 Total Injury Wet
Way/Tangent 65 27 18
Right Turn Rear-End
4 42
REMARKS:
82062 01.50 US-12 5 Lane-2 Way/Tangent Total 58 Injury :24 Wet 17 Pedestrian 3 Rear-End 38
REMARKS:
82062 01.56 US-12 5 Lane-:2 Way/Tangent Total 54 Right Angle 16 Rear-End 22
000020 000015 000012 000004 000014
MONROE STREET Urban/Signal
000020 000015 000012 000003 000014
OAKWOOD BLVD. .Urban/Signal
000020 000010 000014
i2 ft. Lane/Curb
DEARBORN CY. 58 TOTAL ACCIDENTS 12 ft. Lane/Curb
DEARBORN CY. 54 TOTAL ACCIDENTS 10 ft. Lane/Curb
-----------------------------------------=-----~------~-------~---~--~~--~~--~-~----------------REMARKS:
10
..... ..... DATE REQUESTED:
··-ci-UC:-·;-- ·DfP/""'-··-:-~· TRN'.'.''~~·nAT·~··
f'J~-1\t 1"1 C i'ol'JD-- , n 'f () 1\t-1 :.l-1 ON ·: .
MICHIGAN Dll-lcNSIONAL ACCI0£1~..--- >UilVULlANCt SYS[EM (MIDAS)
I N T E R ~ E C T I 0 N P R 0 f I l E
LOCATION: M-100 AT GRAND RIVER AVE
CITY/VILLAGE/TOWNSHIP: EAGLE TWP
COUNTY: CLINTON COUNTY
INTERSECTION TYPE: 4 LEGS - CROSS
DISTRICT
5
CONTROL SECTION
f.lllEPOINT MAll PHOTOUJG
19011 1. 92 L90
- FLASHER
JANUARY 1, 1979 THRU DECEMBER 31, 1983 ( 5 YEARS, 0 MONTHS, 0 DAYS)
REPORT RUN BY: J. SALLER
REASON FOR RUN; r.t-100 AT GRAND RIVER AVE.
AUGUST OB, 1984
J PAG£ 2
~ .... o' .... rt
<1 H Ill
MICHtG:;.N otPARTt-tUH Uf TRAN5POIHAllOH IRAFFIC AND SAfETY U!VISION
08/0B/84 M!CIIIGAN OIMENSIOI<AL ACCIDENT SURVEILlANCE SVSHM !MIDAS) PAGE 3
I N T f R S E C T I 0 N P R ll f I l E
DIST 5 CS 19011 MP 1.92 (~IALI), 1. 90 ( PliOTOLOG) M-100 AT GI!ANO RIVER AVE EAGLE TWP CliNTON COUNTY
I N T E R S E C T 0 N G E 0 M E T R I C S
APPROACH DIRECTION
NORTH· BOUND SOUTH BOUND EAST BOUND IIEST BOUND OTHER
SPEED (MPH)
55 55
I N T E R 5 E C T -1 0 N
DAILY VOLUME L A N E A G E L E f T
2,430 2,430
BASIC lEFT RIGHT PROHIBITED
NO NO NO NO NO
T U R N S PHASE
NONE NONE NONE NONE NONE
A C C I 0 E N T S 1- 1-79 THRU 12-31 -OJ
!liST cs
5 5 5 5 5
19011 19011 190 I I 19011 1901 I
( 5.00 YEARS)
I N f L U E N c E Z 0 N E MALl MP LENGTH
1.~5- 2.00 0.55Ml 2904fT 0.00- 0.00 O.OOMI OFT
NUMBER Of ACCIDENTS BY TYPE P E R C E N T ACC pER APPROACH INJ FAT ·I TOTLI NEAO ss ss ANGl LffT RIGHT REAR BACK PARK OTHER MILLiON DIRECTION ACC ACC ACC . ON PASS MEET TU~N TURN END U? WET lCY DARK VEHICLES
----------------------------+-----~--·~--------------------------------------------------------------------------------------------NORHI BOUND 2 0 6 0 0 0 2 2 0 0 · 0 33. 3 33.3 33. 3 1. 35
SOUTH BOUND 5 0 9 0 0 ·0 6 0 0 0 0 2 22.2 11.1 22.2 2.03
EAST BOUND 9 0 12 0 0 0 9 0 0 I.
0 16.7 33.3 25,0 0.00
\<EST BOUND G 0 12 0 0 0 6 0 0 0 0 3 25.0 25.0 16.7 0.00
OTHER 0 0 0 0 0 0 0 0 0 0 0.0 0.0 0.0 0.00
. ' ---------------------------+-----+-------------------~~--------------------------------------------------------------------------5.00 YEAR TOTAL 23 0 40 0 0 0 21 B 0 0 6
AVERAGE PER YEAR 4.6 0.0 8.0 0.0 0.0 0.0 '4.2 1.6 0.2 0.8 0.0 0.0 1.2
PERCENT Of TOTAL 57.5 0.0 100.0 0.0 0.0 0.0 52.5 20.0 2.5 10.0 0.0 0.0 15.0 22.5 25.0 22.5
----------------------------+-----t----------------------------------------------------------------------------------------------EXPECTED ACC. 2.2 0.0 3.5 0. I 0.0 0.2 2.0 o.u 0.3 0.6 0. 1 0.3 0.5 2.5 1.4 1.6
Olff IN ACCIDNT 2.4 -o.o 4.5 -0.1 -0.0 -0.2 2.2 0.8 ·-0.1 -0.0 -0.1 -0.3 0- 'I -0.7 0.6 0.2
------------------------------------------------------~~------------~-----------------------------------------------··------------
i
,';-
'
~ _,; i
'.' '. ··' :~ -~'
????f
09/08/84
DIST cs 19011
20
15 p
E
..... w R
c 10
E
N
T 5
MP
. ,.--...,.
MICHIGAN DEPARTMENT Of TRANSPORTATION TRAFFIC AND SAfETY DIVISION
MICHIGAN OIMENSIONALJZED ACCIDENT SURVEILANCE SYSTEM (MIDAS)
I N T E R S E C T I 0 N P R 0 f l E - H I S T 0 G R A M
1.92{MALI) t. 90( PH,OTOLOG) M-100 AT GRANO RIVER AVE
DISTRIBUTION BY HOUR Of DAY
PAGE 4
EAGLE TWP CLINTON COUNTY
+---+---+---+---·---+---·---+---+---+---+---·---+---+---+---+---+---+---+---+---+---+---+---+---+ -+ +- 20
I -! I
I I
-I I
! I -! I
I I -I I
I I
-+ ;1. +- 15
I X -I X
I X -I X
I X X
-I X X
I X X
-I X X
I X X -· X X X X 0 X +- 10
! X X X X 0 X
-I X X X X 0 X 0
I X X X X 0 X 0 -I X X X 0 X 0 X 0
I X X X 0 X 0 X 0 -I X X X 0 X 0 X 0 0
I X X X 0 X 0 X 0 0 -I 0 X X 0 0 X 0· X 0 X 0 0 0
I 0 X X 0 0 X 0 X 0 X 0 0 0 -+ X 0 X 0 0 X X 0 0 X O· X 0 X 0 X 0 0 X 0 0 X +- 5
I X 0 X 0 0 X X 0 0 X 0 X 0 X 0 X 0 0 X 0 0 X
-I 0 X 0 X 0 0 X 0 X 0 0 0 X 0 X 0 X 0 X 0 0 X 0 0 0 X I 0 X 0 X 0 0 X 0 X 0 0 0 X 0 X 0 X 0 X 0 Q X 0 0 0 X I
-I 0 X 0 X 0 0 X 0 X 0 0 0 X 0 X 0 X 0 X 0 0 X 0 0 0 0 X I
I X X X 0 X 0 X 0 0 X 0 X 0 0 X 0 X 0 X 0 X 0 X 0 0 X 0 X 0 X 0 X 0 X I -I X X X 0 X 0 X 0 0 X 0 X 0 0 X 0 X 0 X 0 X 0 X 0 0 X 0 X 0 X 0 X 0 X 0
I X X X 0 X 0 X 0 0 X 0 X 0 0 X 0 X 0 X 0 X 0 X 0 0 X 0 X 0 X 0 X 0 X 0
-I X X X 0 0 X 0 X 0 0 X 0 X 0 0 X o X 0 X 0 X 0 X 0 0 X 0 X 0 X 0 X 0 X 0
I X X X 0 0 X 0 X 0 0 X 0 X 0 0 X 0 X 0 X 0 X 0 X 0 0 X 0 X 0 X 0 X 0 X 0
o-x-o-x-o-x-o-x-o-x-o-x-o-x-o-x-o-x-o-x-o-x-o-x-o-x-o-x-o-x-o-x-o-x-o-x-o-x-o-x-o-x-o-x-o-x-o-x-o M 1 2 3 4 5 6 1 B 9 10 11 N 1 2 3 4 5 6 7 8 9 10 11 M
0 AM I PM D
X • ACCIDENT OISTRIBUT!IlN JANUARY 01, 1979 THHU DECEMBER 31. 1983
0 • VOLUME DISTRIBUTION
"' & ,_.. <T ,_.. rt
< H n
?'1?11
MICHIGAN !JfPAJ~it.tHH Of 1 flANSPOI~l AT I Ohl i TRArf IC ANO SAHTV OIVJSION
06/0B/64 MICHIGAN 01MfNSIONAL1ZfO ACCIDENT SUI~VE I lANCE svsrw (MIDAS l PAGE 5 !
I N T E R s f c l I 0 N p R 0 f I L E - H I s T 0 G R A M l i
I I DIST cs 19011 MP 1.92(MALI) I. 90( PHOTOLOG) M- 100 AT GRANO RRVfR AVE EAGLE HIP CliNTON COUNTY
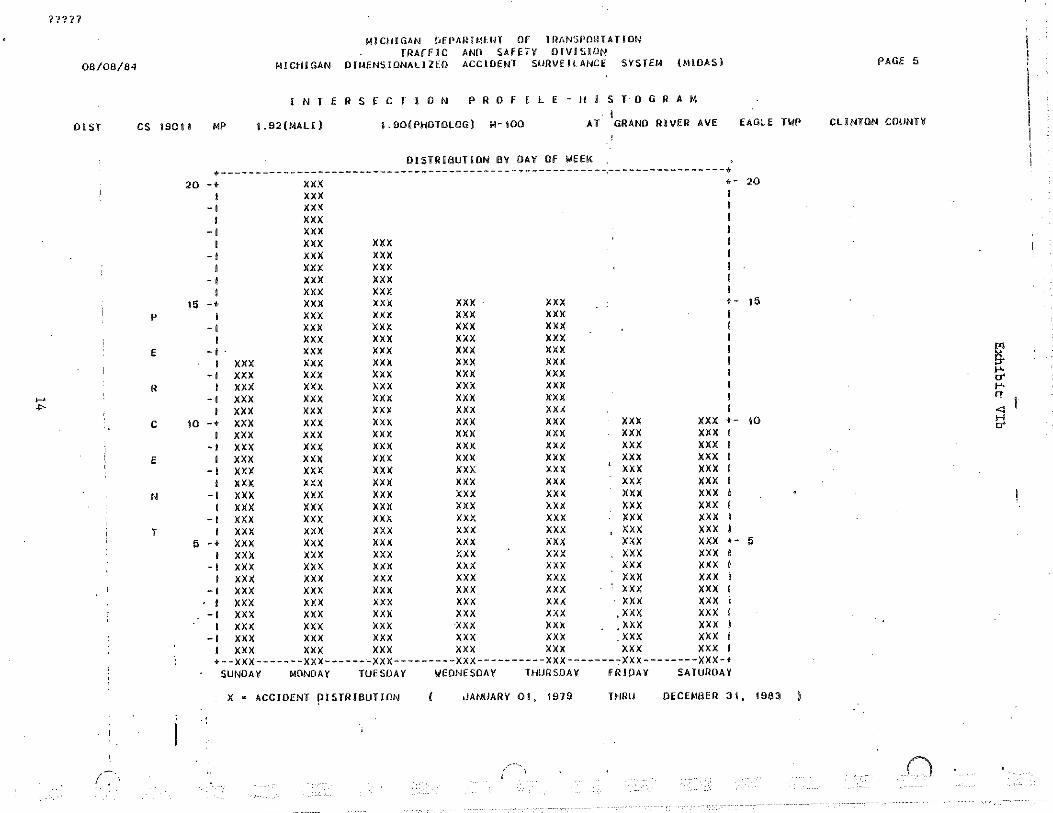
I DISTRIBUTION 6Y DAY Of WEEK
·-------------------------------------------~-----------~-----------------· 20 -· XXX ·- 20
I XXX I
-I XXX I
I XXX I -I XXX I
I XXX XXX I -I XXX XXX I
I XXX XXX I -I XXX XXX I
I XXX XXX I
15 -· XXX XXX XXX XXX ·- 15 p I XXX XXX XXX XXX
-I XXX XXX XXX XXX I XXX XXX XXX XXX
E -I . XXX XXX XXX XXX ~ I XXX XXX XXX XXX XXX -I XXX XXX XXX XXX XXX \;:
R I XXX XXX XXX XXX XXX p. ,_. -I XXX XXX XXX XXX x-xx rt ..,_
I XXX XXX XXX XXX XXA <: c 10 -· XXX XXX XXX XXX XXX XXX XXX ·- 10 H
I XXX XXX XXX XXX XXX XXX XXX I tT
-I XXX XXX XXX XXX XXX XXX XXX I f I XXX XXX XXX XMX XXX XXX XXX I
-I XXX XXX XXX XXX XXX XXX XXX I I XXX XXX XXX XXX XXX XXX XXX I
N -I XXX XXX XXX XXX XXX XXX XXX I
I XXX XXX XXX XXX XXX XXX XXX I -I XXX XXX XXX XXX XXX XXX XXX I
T I XXX XXX XXX XXX XXX XXX XXX I
~ -· XXX XXX XXX XXX XXX XXX XXX ·- ~
I XXX XXX XXX XXX XXX XXX XXX I -I XXX XXX XXX XXX XXX XXX xxx I
I XXX XXX XXX XXX XXX XXX XXX I -I XXX XXX XXX XXX XXX XXX XXX I
I XXX XY.X XXX XXX XX.< XXX XXX I -I XXX XXX XXX XXX XXX .xxx XXX I
I XXX XXX XXX ·xxx XXX .xxx XXX I -I XXX XXX XXX XXX XXX .XXX XXX I
I XXX XXX XXX XXX XXX XXX XXX I +--xxx----~--xxx-------xxx---------xxx----------xxx-------~xxx--------xxx-•
SUNDAY MONOA't' TUESDAY WEDNESDAY THURSDAY fR !PAY SATURDAY
X • ACCIDENT p1HRIBUTION dANUARV 01, 1979 THRU DECEMBER 31, l963
·:
i ' n

- 0 ' . : :
,,, ::;
J -'
08/GB/84
DIST
A
c
c
!
D
E
N
T
MICHIGAN OEPARlt.lt:l"'a Of Tr~t.H~iPDRIATJOr~ TRAFFIC ANU SAFETY UIVlSION
MICHIGAN OIMENSIONAL!ZED ACCIDENT SURVEILANCE SYSTEM (MIDAS)
! N T E R S E C T l 0 N P R n f I l E - H I 5 T 0 G R A M
cs 19011 MP 1.92(MALI) 1.90(PHOTOL0Gj M-100 AT GRANO RIVER AVE EAGLE HIP
DISTRIBUTION BY MONTH OF All YEARS +------------------------ ·--------------------------------------------------+
40 -+ +- 40 -, -! I
I -1 I
I I -1 I
I I -I
i 30 -+
I -I
I -I
I -I
I -I
I 20 -+
I -I
I -I
I -I
I -I
I
·-
. -
30
20
10 -+ +- 10 I
s -1 I XXX
-1 XXX XXX XXX I XXX XXX XXX X:<X XXX
-1 XXX XXX XXX XXX XXX XXX XXX I XXX XXX XXX XXX XXX XXX XXX
-1 XXX XXX XXX XXX XXX XXX XXX XXX I XXX XXX XXX XXX XXX XXX XXX XXX XXX I •---xxx---xxx---xxx---xxx---xxx---xxx---xxx---xxx---xxx---xxx---xxx---xxx---+ I JAN FEB MAR APR MAY JUN JUL AUG SEP -OCT NOV DEC I
X • ACCIDENT,DISTAIBUTIDN JANUARY 01. 1979 THRU DECEMBER 31, 1983
PAGE G
CLINTON COUNTY
t>j
& I-'• o' 1-'· rt
<: H {!)
7?7?7
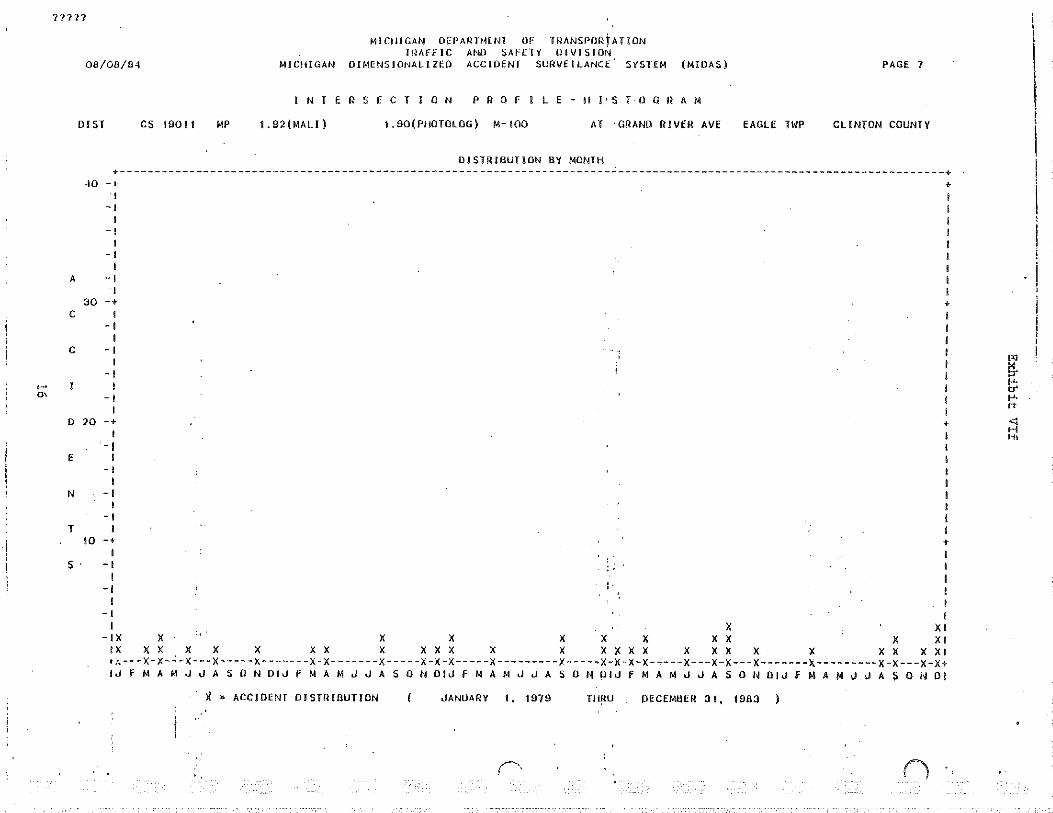
M!CIIJGAN O£PAJHHENl Of TRANSPOf~tATION TI~AffiC AND SAFETY O!VISION
06/06/64 MICHIGAN OIMENSIONALIZ~O ACCIDENT SURVfiLANCf SYSTEM (MIDAS) PAGE 7
I N T E R S E C T I 0 N P R 0 F L E -II J•S 1 ll G!! AM
0151 cs 19011 MP 1.92(MALI) 1. 90( PIIOTOLOG) M- 100 AT ·GRANO RIVER AVE EAGLE TWP Cll NTON COUNTY
DiSTRJBUTlON BY MONTH +-----------------------------------------------------------------------~-----------------------------------------------+
-10 -1 + I
-I I
-I I
-I I
A -I 1
30 -· • c I I -I I
I I c -I I
I I -I I ,_.
"' I I
-I I I I
D 10 -· • I
-I E I
-I I
N -I I
-I T I
to -· . I I
s· -I :. I I I
-I :. t
I I -1 I
I X XI -IX X X X X X X X X X XI
IX X X X X X X X X X X X X X X X X X X X X X X X X X XI ,, ___ x-x-"-x---x-----x-------x-x-------x-----x-•-x-----x---------x-----x-x-x-x-----x---x-x---x-------x---------x-x---X-X+ IJ F M A M J u A S 0 N DIJ F M A M J J A S 0 N DIJ f M A M J J A S D N OIJ f M A M J J A S 0 N OIJ f M A M J J A S 0 N Dl
X • ACCIDENT OISTRJBUT!DN .JANUARY 1, 1979 TliRU DECEMBER 31, 1983
"' & 1-'· .,. !-'· rT
<: H o-n
\ !
I I
I I

. ·;j
. ·-t U IJ:~:-:··. l)fli .. ·.t:NT Til. - ·11HA
-1 rtJri·'f J L AMJ 51ft t I i 0 1'\t! S-1 ON
OB/08/04 MICHIGAN DIMENSIONAl ACCJOHH SURVEILLANCE SYSTEM (>IIDAS) PAGE 9 \'!"
I N T f R S E C T I 0 N A C c I D E N r·· P R 0 f I L E
INTERSECTION TYP~ 2 LANE 2-WAY FLASHER
lOCATION M-100 AT GRAND RIVER AVE EAGLE TWP CLINTON COUNTY . I
DISTRICT 5 CONTROL SECTION 19011 IHLEPOINT 1.92
OIST ACCIDENT VIOLATOR (01: V.Ht I I SECOND VEHICLE ,, NUMBER Of INJURIES DATE ACCONT .
FROM TYPE HAZRO HAZRO SRF VE!i/ INJURY CLASS PRP OF REPORT
ISCN DR INTENT JMPACT ACT'N OR INTENT IMPACT ACT'N WEATH CNO LIGHT C Ill CUM f A a c 0 OMG ACCIDENT NUMBER
. '. NORH-tBOUNO APPROACH
1.92 2-VEH ANGlE N R-TURN fRNT-L CLOSE w GO STR S IOE -L NONE ClEAR ICY OUSK 1/SKIO 0 0 0 0 2 X fRI 1/ 5/79 5PM 9543
1. 92 2-VEH ANGLE N R-TURN fRNT-l fAST w GO STR SIDE -L NONE ClEAR ICY DAY 0 0 0 0 2 X THU 1/ 4/79 BAM 5234
1.92 2-VEH L-TRN N L-TURN fRNT-L TURN s GO STR fRNT-L NONE CLfAR DRY DAY 0 0 I 0 I TUf 8/26/80 lOAM 155325
I. 92 2-VfH R-TRN N GO STfl SIDE-R NONE N R-TURN S IDf-R NONE RAIN WH DAilK 0 0 0 0 4 X nou 9/ 3/8 I 9PI·I 110718
I. 92 2-Vfli R-ENO N GO SIR fRONT CLOSE N L-WRN REAR NONE CLEAR PRY OAV· 0 0 0 3 4 SAT 9/24/ll3 lOAM 167156
1.96 2-VEH R-ENO N GO SIR REAR-L NONE N GO STR fRNT-R NONE IIA IN WET DARK 0 0 0 0 3 X TUE ~/24/79 '/PM 98032
"' SOUTHBOUND APPIWACU & t. B9 1-VEH fX 08 s AV VHI fRNT-R NONE DITCH CLEAR WET PAY. 0 D 0 0 2 X MON 12/ 5/03 5PM 23~460 b:
"" I. 92 2-VEH L-TRN s L-TUfW RfAR-R TURN N GO STR fRNT-n NONE CLEAR onv 0Af{t< 0 • 0 • 2 FRI II/ 16/79 1tJ>M 2G t7 11 rt
>--' 1.92 t-VEH ROLL s L-TURN OTHER TURN CLEAR .DH¥ OAf~)< 1/RECK 0 0 I 0 I SAT 8/11/79 2AJ.I 191301 _, <l I. 92 2-VEH L-[RN S l-TURN SIOE-n ru1m " on ~n~ 1=RONT NONf CLEAU: OU¥ DAY 0 0 0 2 I · Wf:'O 4/30/00 2PM 80054 H
1.92 2-VEII ANGLE 'S GO STR SIDE-R NONE E GO STR fRNT-L NONE ClEAR OilY DAY 0 0 0 0 4 X SUN 9/12/82 IPM 21•1'175 P'
I. 92 2-V.EH L-TRN S L-TURN fRONT TURN N GO STR fRNT-L NONE CLEAR Din DAY 0 0 0 I 2 MON 0/30/82 10At4 170973
I. 92 3-VEH L-TRN S L-TURN FRNT-R f YLO N GO STR FRNT-R NONE CLEAR I'H DAY 0 0 I 0 3 SAT 1/30/82 2Pt.t 26Jit
I. 92 2-VHI L-THN S L-TUilN SIOE·fl f YLO N GO STR FllNT-R NONE SNOW ICY DUSK 0 0 0 0 2 X WE 12/ 6/03 5PI~ 234457
I. 02 2-VEH L-TRN S L-TURN SIDE-R TURN N GO STR FRONT NONE CLEAR OilY DAY 0 0 0 0 4 X SUN 0/ 7/83 11AM 150006
EASTaOUNQ APPROACH
I. 92 2-VEil ANGLE E GO STR FRONT f VLO N GO STR S JOE-l NONE CLEAR DRY OA-{' 1/i:Ja v 0 3 0 2 I MON 6/18/79 5PM 139429
I. 92 2-VEII ANGLE E GO STR SIDE-R f YLO N GO STR FRONT NONE SNOw WET DAY 0 0 I 0 I MON ~/31/80 11AI.t 53547
I. 92 2-VEH R-ENO .E GO STR fRONT FAST E STOP PO REAR NONE CLEAR ICY DAY 0 0 0 5 I WED 12/16/81 4P~I 250146
1.92 1-VEH fX 08 E GO STR fRNT-~ CLOSE SIGN ClEAR ICY DARK 1/SKID 0 ·0 0 0 I X WED 12/16/UI 1 tPM 26018
1.92 2-VEH ANGLE E GO SIR fRIJT-R F YLO N GO STR fRONT NONE CLEAR ORY OAY 0 I 0 0 2 SUN 9/12/82 3PM 173014
1. 92 2-VEH ANGLE E GO STR REAR-L f VLO s GO STR FRONT NONE CLEAU OilY DAY 0 0 t 0 2 THU 8/ 5/82 10Af.1 152413
I. 92 2-VEH ANGLE E GO STR fRNT-L CLOSE s GO STR fRNT-R NONE CLEAR ICY DAY 0 0 0 0 3 X ww 2/ 3/82 lOAM 46260
I. 92 3-VEH ANGLE E ~ GO STR REAR-R f VLO N Go sm FIWNT NONE ClfAil \-JET OAY 0 0 0 I 2 l-ION 12/ 5/83 4PM 2344<5
I ,92 2-VEH L-TRN E GO STR FRNT-R CLOSE w l- TUI~N SIDE-R NJJNE ClEAR DRY DARK' 0 0 0 0 2 X TUf 9/27/03 10Pr-1 169179
I. 92 2-VEH ANGLE E GO STR SIDE-R f YLO N GO STU fRONT NONE ClfAR ORY DARK 0 0 ' 0 I Tl1U 3/ H/03 OPf-.1 -167 1·1
t .97 2-VEII ANGtE E GO STR fRtH-l f YLO s GO SIR FRNT-R NONE ClEAR Dl~'t DAY 0 0 0 t ' TUE 3/23/82 •I PH 56163
1.98 2-VEH ANGL;E E GO STR fRNT-l f YlO s GO Sln ffWNT NONE CLEAR ICY DAY 0 0 I I 3 \olEO 12/24/00 2PM 24-165t
WESTBOUND APPROACH
1. 92 2-VEH ANGLE w l-Tulm fRONT f VlO N GO ST~ fRONT NONE ClEAR WET OAY 0 0 0 0 2 X MON 4/30/79 OAM 90038
I. 92 3-VHI R-EJiO w ·GO STR fiWNT ClOSE II STOP PO FRONT NONE CLEAR ICY DAVI 0 0 0 0 3 X TUE 3/ 6/79 7AM 72526
1.92 ;2~Vfli ANGqf w GO STR fRNT-L f YLO s L- TURN REAR-L NONE CLEAR DRY DAY 0 0 0 0 2 X MON t 1/ 3/60 OAM 2t80t5
1.92 2-VEfl ANG~E w L-TURN fRNT-R f YLO N GO STR fliNT -R NONE C:i EAR DRY OA'/ 0 0 0 I 5 Fill 4/10/81 lOAM 71623
,.--.... !) '
?7?7? ,..---.
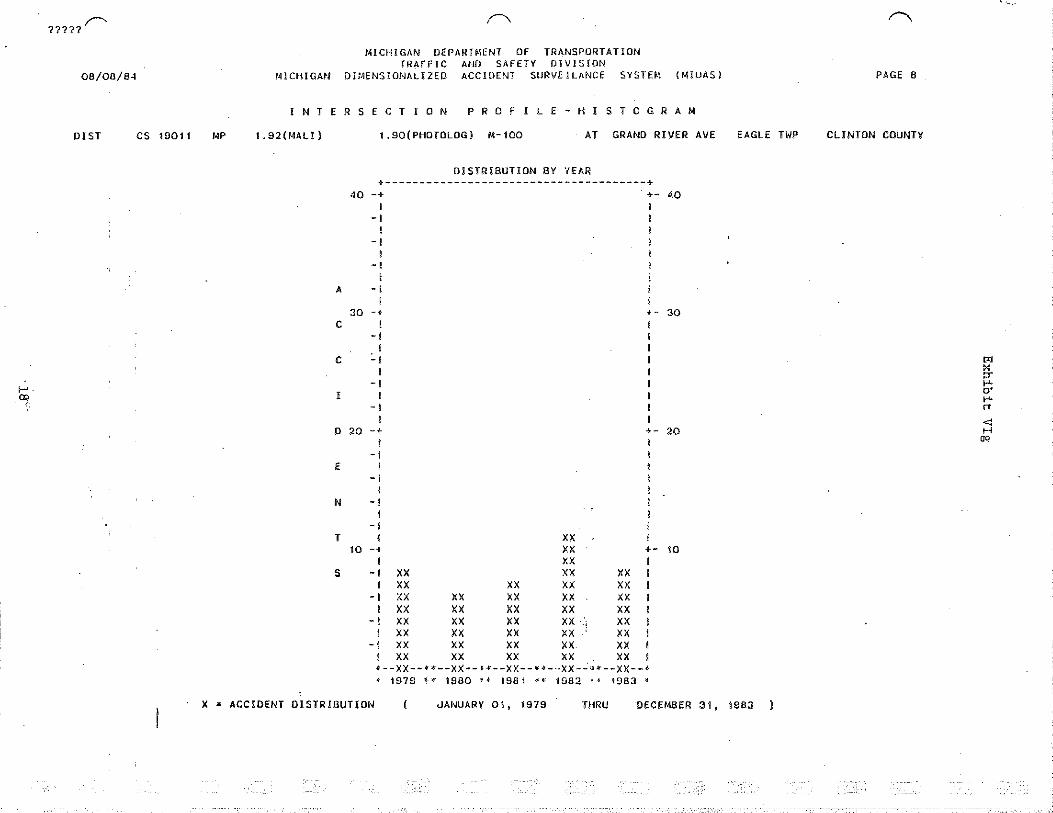
08/00/84
DIST cs 1901'
,... "!.
MP
MICHiGAN DEPARHIENT Of TRANSPORTATION TRAffiC ANO SAFETY DIVISION
MICHIGAN DIMENSIONAUZED ACCIDENT SURVElLANCE SYSTEM {MJUAS)
I N T E R S E C T I 0 N P R 0 f I L E - H I 5 T 0 G R A M
1 .92(MALI)
40
A
30 c
c
I
0 20
E
N
T 10
s
1.90(PHOTOLOG) M-100 AT GRANO RIVER AVE
DISTRIBUTION BY YEAR +--------------------------------------+ -· I
-I
-I I
-I I
-I I -· I
-I I
~I I
-I I
-I I -· I
-I I
-I I
-I I
-I I -· I
-I XX I XX XX
-I XX XX XX I XX XX XX
-I XX XX XX I XX XX XX
-I XX XX XX I XX XX XX
XX XX XX XX XX XX XX XX XX XX XX XX ·! XX XX XX XX XX XX XX
+- 40 I I I I I I I I I v- 30
·- 20
·- 10 I I I I I I I I I
•--xx--•*--xx--••--xx--~·-··xx-~~•--xx--• + 1979 ~~ 1960 'l'.t 1981 ·H f!)82 'I i98J ~
EAGLE TWP
X • ACCIDENT DISTRIBUTION ~ANUARY 01 1 1979 THRU DECEMBER 31, 1983
PAGE 8
CLINTON COUNTY
"' :< ::r I"· ::r 1-'-rt
<I H
OQ

CHJ UEP ~r-,r TRti !HAl ihAf-FIC ANO .f:TV · OI'il~~~ON
08:08/U·l M!CiiJGMJ Dl/.11.f~SJOHAL ACCIUHn SUf~\'[llL\Nt:r; 5YSllf.1 IMIUASJ PAGE !0
I N T E R S .E C T I 0 N A C C ! D E N T P R 0 F ! l E
INTERSECTION TYPE 2 LANE 2-WAY flASHER
LOCATION M-100 AT GRAND RIVER AVE EAGLE TWP CLINTON COUNTY
DISTRICT 5 CONTROL SECTION 19011 MILEPOINT 1.92
OlST ACCIDENT VIOLATOR (OR VEH 1) SECOND VEHICLE NUMBER OF INJURIES DATE ACCONT FROM TYPE HAZRO HA2RO SRF VEH/ INJURY CLASS PRP OF REPORT ISCN OR INTENT IMPACT ACT'N DR INTENT IMPACT ACT'N \~EATH CNU LIGHT CIRCUM F A B c 0 DMG A:CIDENT NUMBER
1. 92 1-VEH FX DB w GO STR SIOE-L CLOSE ON RD FOG WET DAY 1/SKIO 0 0 0 1 0 NON 9/ 14/111 7AM 160G77 1. 92 2-VEH ANGLE w GO STR FRONT F YLO s L-TURN SIOE-L NONE SNOW ICY DAY 0 0 0 0 2 X HIU 1/15/61 3PM '1620 1.92 1-VEH FX DB w GO STR SIDE-R FAST SIGN CLEAR DRY DARK 0 0 0 0 1 X SAT 1/ 10/B t 3At-1 7730 1.92 2-VEH ANGLE I~ GO STR FRNT-L F YLO N AV VEI-l FRNT-R NONE CLEM~ DRY DAY 0 0 0 I 3 \1ED 9/ 1/82 2PM 173015 1. 92 2-VEH ANGLE N -GO STR SIDE-R NONE >I GO STI~ FRONT UNKN RAIN ltiET DARK 0 1 0 0 I SUN G/!3/02 1AM 12-1175 1 .92 2-VEfl ANGLE " GO STR FRNT-L F YLO N GO sm FRONT NONE CLEAR DRY DAY 0 1 0 2 2 TIIU 1 1/ 3/03 4PM 201928 1.94 2-VEH ANGLE w GO STR FRONT FAST s GO STR FRNT-L NONE RAIN ICY DAY 0 5 0 1 SUN H/28/82 BAM 226050 1. 96 1-VEH PARKO w L-TURN FRNT-R CLOSE CLEAR DRY DAY 0 0 0 0 X TUE 3/23/82 5Pt.t 56169
OTHER
"" 1. 92 2-VEH ANGLE NW GO STR FRNT-R F VLO N GO STR SJOE-R NONE CLEAR OR¥ DAY 0 0 0 3 FRI B/15/00 7PM 155297 ~ ::r 1-'· ..... tT
"' 1-'· rt
<: H 1-'·
This surveillance/analysis effort is accomplished annually using the most recent two years of accident data as a basis. The threshold tables described in (B) is the source of the location review list.
In addition, a TOPICS Program (Traffic Operations Program to Improve Capacity and Safety), managed by the Safety Programs Unit, is responsible for more intensive review on a 3-5 year cycle in 15 large urbanized areas and 17 smaller cities with population greater than 10,000. That effort includes coordinated identification and analysis of deficiencies on the local system by staff in the Safety Programs Unit funded by a Section 402 Community Assistance grant. The TOPICS studies are very comprehensive, including the identification of operational and capacity deficiencies. The program emphasizes lower cost corrective countermeasures such as improved signs, signals or pavement markings, parking prohibitions, traffic signal modifications, and minor construction projects.
The process followed by these two programs to carry out accident surveillance differs somewhat. The annual Spot Safety reviews are completed as follows:
L Location Review List
Computer listings of all locations exceeding minimum thresholds of accidents or exceeding a minimum threshold for any of 24 accident types. The listing can also be generated using statistical techniques. We are working to integrate the statistical and threshold generation of location.
A second source of review locations are Traffic and Safety engineers, located in the department's district offices who are very familiar with all state trunkline highways in their area. They are aware of new and proposed development and other conditions which will impact safety. In addition, the department receivew from the public, police agencies, local governmental officials, and others calling attention to locations where accident concentrations are, or may be developing.
2. Preliminary Analysis
Additional accident data developed in conjunction with the location review list is preliminarily reviewed in the office. That effort may include review of the photolog, traffic signal inventory, signal timing, intersection drawing, and other information included in Traffic and Safety Division files. The purpose of this preliminary review is to determine if the identified accident concentration is unusual and warrants further review of if action has been initiated which addresses the accident concentration.
The entire list and those locations noted for further review are then sent to the district traffic and safety engineers and affected units in the Traffic and Safety Division for further review and comment.
20
3. Final Analysis and Identification of Corrective Countermeasures
After preliminary analysis, a field review may be scheduled including a Safety Programs Unit representative, the district traffic and safety engineer, and other affected Traffic and Safety Division staff and local interests. At that time any corrective countermeasures are identified. Final action is documented in correspondence prepared by the Safety Programs Unit.
If the proposed corrective countermeasure requires construction, the following process is followed:
a) The Geometries Coordination Unit develops proposed alternate geometric schemes with cost estimates and transmits a recommended plan to the Safety Programs Unit.
b) Funding may be recommended by the Safety Programs Unit based on the projects anticipated cost-effectiveness. Candidate projects are generally recommended when the expected return in safety benefits is less than 10 years.
c) State and federal environmental requirements are fulfilled and any impact reviews of the proposed project are initiated.
d) The recommended functional layout is transmitted to the district for review and for discussion with local officials. The district traffic and safety engineer obtains unofficial written concurrence from local agencies required to participate in the ·project.
e) The Geometries Coordination Unit makes necessary changes resulting from the district review and transmits the plan to the Design Division for completion and letting.
The TOPICS Program reviews follow basically the same procedures, except that it includes both the state trunkline and nontrunkline systems. The resultant review is more comprehensive and detailed, identifying significant accident concentrations and operational deficiencies. The TOPICS reviews are conducted within the framework of local Metro Planning Organizations (MPOs) responsible for managing and coordinating transportation activities in the urbanized areas. The final TOPICS reports are offered as the traffic engineering element of the TSM process. Local agencies may apply for non trunkline HES funding through the Local Services Division (See Appendix II).
D. Establishing Priorities
1. Time-of-Return Analysis.
?1
The Department determines the time-of-return (T.O.R.) or the number of years to amortize safety projects. If the anticipated TOR is less than ten years, programming of the project may be requested.
The anticipated reduction in accidents at a given location is estimated using data collected from previous beforeand-after accident studies. National Safety Council accident costs are used to establish economic benefits. Attached is a copy of a worksheet (Exhibit VII) used to evaluate accident costs, expected accident reductions, and to determine anticipated benefits.
The estimated cost of each improvement is compared to the anticipated yearly benefit, resulting in the T.O.R. Presently, most safety related projects programmed amortize costs in approximately five to eight years. In general, a TOR of less than ten years is sufficient to justify a safety improvement project.
2. Cost and Resources
The ability of the department to program the recommended safety projects is, or course, limited by their cost and by available funds. All designated categorical funds (HES and R.R. Safety) are earmarked for safety projects. Other state and federal aid funds are used for safety projects as described in "Implementation" (II).
3. Rail/Highway Grade Crossings Improvement Program
The Railroad Safety and Tariffs Division utilizes the Hazard Index Rating (HIR) described below to initiate grade inspections. Grade inspections can also be initiated by:
a. Complaints with regards to safety of the crossing. b. Public or local agencies. c. Railroad companies. d. Private industries.
A diagnostic team is formed consisting of the inspector from the Railroad Safety Section as team leader and representatives of the railroad company, road authority, state, county, city or village, police, school, private industry and concerned citizens. The team reviews the safety conditions at the crossing and develops recommendations for improvements. The team leaders is responsible for completing the Grade Inspection Report form (Exhibit VIII).
The HIR is then utilized to determine the order in which improvement projects are submitted for programming. In addition, projects to upgrade or modernize signal devices to current standards, eliminate crossings, reduce the number of tracks in a crossing, research, and reconstruction of crossing surfaces, which are not recognized in the H.I.R., are submitted by the road authorities for programming. Further flexibility in the program is ·maintained by taking advantage of scheduled
22
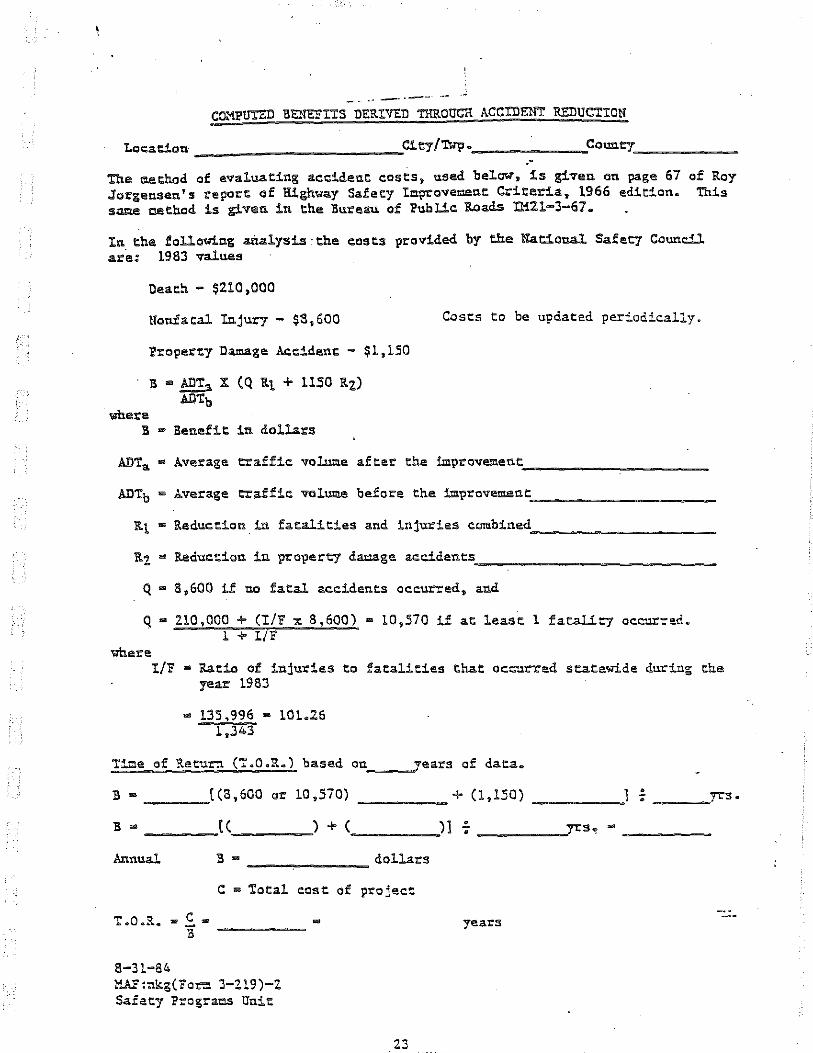
Loca:ion ______________________ ~ctey/TWp •. ____________ ~county _____________ ___
.· The ~echod of evaluating accident costs, used bel~, is given on page 67 of Roy Jorgensen's report of Highway Safety Improvecent Criteria, 1966 edition. This s~ cethad is given in the Bureau of Public Roads !MZl-3-67.
In the follo~ng analysis·the costs provided by the National Safety Council are: 1983 values
Death - $210,000
Nonfatal InjurJ - $3,600 Costs to be updated periodically.
Property Damage Accident - $1,150
B • ADT, X (Q Rt + 11.50 Rz) AilTb
where B • Benefit in dollars
ADTa • Average traffic volume after the improvement ~------------------
ADTb • Average traffic volum.e before the improvement. ___________ _
Rt • Reduction in fatalities and injuries combined ~--------------
Rz • Reduction in property damage accidents. ______________________ __
Q • 8,600 if no fatal accidents occurred, and
Q • 210,000 + (!/F x 8,600) • 10,570 if at least l fatality occur~ad. 1 + I/F
where I/F • Ratio of injuries to fatalities that oc~~rred statewide during the
year 1983
- 135,996 - 101.26 1,343
Til:!e of Retun ("Z .0 .R.) based on'-----' ears of dat:a.
B • ____ [(8,600 or 10,570) ____ + (1,1.50) • o ___ Y'!'.S •
B • ____ [,(. ____ ) + ( ____ ).1 -; ___ _.yes, • ----
Annual
'I' .. O .. R .. D £2111 ll
8-31-84
B • __ ...,.. ____ dollars
C • Total eos~ of projee:
-------
MAF:nkg(co~ 3-219)-2 Safety Progra~ Unit:
23
years
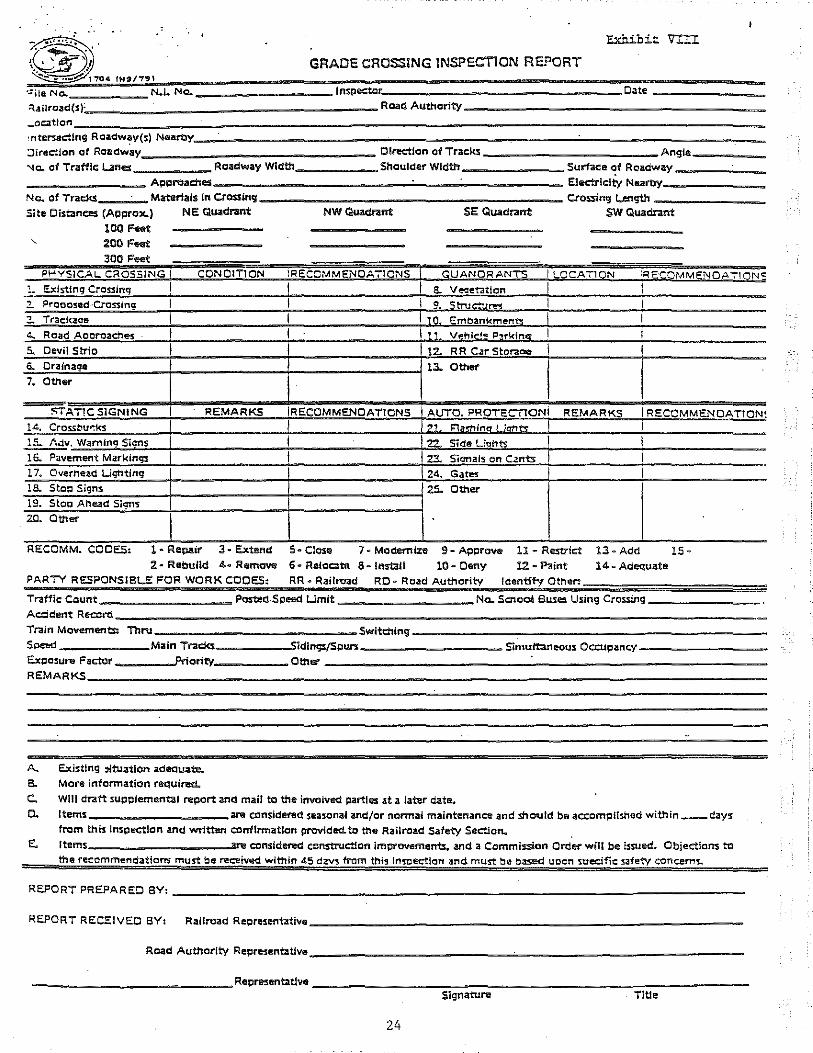
Exhibit: VUI
GRADE CROSSING INS!'ECTION REPORT
·-=iie No. N.L. No.. Inspector. Oate ~ailroad(s)·:_· -~------------------Road Authority ____________________ _ _ ocatlon ______________________________________________________________________________________________ _
~ntersect:lng Roadw~y(s) Neartly:· _ _: _____________________________________ _; ____________________ _
:JirectJon of Roadway ____________________ Olrection ot Tracks -----------------Angte _____ _
"\\a.. of Traffic Lanes ______ Raadway Wldtn _________ snaulder Width Surf;ace ~t Roadway---------------- Approad1 .. ______________ '---.;_ ______ Eledrldty Noarby·-------
Nc. of Trad<s Materials In Crossing Crossing Length --------Site OistanC2S (APill'OX.) NE Quadrant NW Quadrant SE Quadrant SW Quadrant
100 Feet 200 F..,t 300 Feet
PHYSICAL CROSSING I CONOITION !RECOMMENOA71CNS QUANORANTS
a. Vecer.Jtlon I LOCATION IRErQMMENOAT1QNS
!. Existing Cros:sinq I I I I 2. Prooosed-·Crossinq
' T k a " rae aoe l • _mbanl<men~
"' Road Aocroaches I I 1, V•hi,. ... !=1-.rkinn I I 5. Devil Strio I I 12. R R C.ar Storaae I I 6. Draina9e lJ.. Oth.,.
7. Oth..-
:'ITAT!C SIGNING I REMARKS IRECOMMENOATIONS AUTO. PROTECTION! REMARKS I RECOMMENDATION! 14. Crossbu~ks 15- ra w mlng s·ans • v. • I
16. Pavement Markings 17. Overnead Wt;ntlnq 18. Stcc Signs
19. Stop Ahead Sic;ns
2.0. Otne!'
RECOMM. CODES:
l 1 .. "t~nnJ;;;.,,;. I 122. S'd L' nt> I 0 '9
I 123. Sionats on Cants I I 24. Gates
25. Other
l .. Re~ar 3 .. E.xtenct 5 .. Close 7 .. Modernize 9- Approve
10· Oeny l1 - Restru::t 12..,P<!int % • Rebuild 4• Remaw 6 • Rei cote 8 • Install
PARTY RESPONSlBLO: FOR WORK COOES: RR .. Railroad RD e Road Authority Identify Other:
I I
13 ·Add lS • 14 ~ Adequate
Traffic Count _________ Posted-Speed Umit -----------Na. Scnool Buses Using Crossing--------Acddent Reecrd __________________________________________________________________ __
Train Movements: Thru ________________ Switd'tinq -----------------------------5~------M•in Trac:J<s ________ .,!Sldlngs/Spurs __________ Simulbneous O=.~pan"'!-----------
Expcsure Factor Priority Otn"" ----------------------------------REMARKS _______________________________________________________________________________ __
A.. Existing :tituatton adeQuate. a More information required.. C.. Will dntt suc:rplemental report and mail to the involved parties at a later data.. 0.. Items are c:onsiden~d seasonat and/or normal maintenance and :should be ac:ompiished within __ c:tays
frt~m this ins;lection and written conttrmatlon provided. to the Railroad Satety Section.. E. Items•-----------''"' considered ccnstructfon im;n'ovements. and a Commission Order will be i5sued~ Objections to
the reeommendat!om murt be received within 45 daY'S' from this ln'Soectlon and must be based uocn 'Soedfic safety eoncem"t.
REPORT PREPARED BY: ______________________________________________________________________ _
REPORT RECO:IVED BY: Railroad Representative _______________________________ _
Road Authority Represantatlvo ______________ ~---------------
-------------------------R•p~entati~--------------------------------------------------------Signature Title
24
highway improvements to improve a rail-highway crossing. The crossing improved by not be the highest priority; but significant savings are realized by combining the two projects.
Hazard Index Ratings (HIR)
(HIR) = Average Daily Traffic (A.D.T.) x Average 24-hour Train movements x Protection Factor.
Protection Factors
1.00 - Reflectorized Crossbuck Sign 0.30 - Flashing Light Signals 0.27 - Flashing Light Signals with Cantilever Arms 0.24 - Flashing Light Signals with Cantilever Arms and
Half-Roadway Gates 0.11- Flashing Light Signals with Half-Roadway Gates 0.08 Flashing Light Signals with Cantilever Arms and
Half-Roadway Gates 0.05 -Flashing Light Signals with Cantilever Arms, Half-Roadway
Gates, and Traffic Signal Interconnection
II. Implementation
The Department of Transportation schedules and implements safety projects through its Programming Section of the Bureau of Highways. The process is in accord with criteria outlined in the Federal-Aid Highway Program Manual, Volume 6, Chapter 3, Section 2, Subsection 2. The safety project identification/evaluation/selection process is described in Section I (Planning) of the Safety Improvement Process.
Hazard Elimination Funds are used to implement safety justified projects on all state roads, except Interstate. Approximately 50 percent of the HES funds are allocated to the state trunkline and 50 percent to the local system. State. trunkline projects are primarily recommended by the Traffic and Safety Division and projects on local roads are administered by the Local Services Division. Guidelines for Federal funding of local road HES projects are included in Appendix II.
Rail Highway Crossing funds are selected based on the criteria outlined in I, D., 3 of the Safety Improvement Process. The projects are identified and selected based primarily on evaluation by the Railroad Safety Section. The Railroad Safety Section administers state trunkline projects and the Local Government Division those on the local system.
Section 144 of Title 23 of the United States Code provides financial assistance for replacing bridges over significant waterways or other topographical barriers which are unsafe because of structural deficiencies, physical deterioration, or functional obsolescence. The program in Michigan is administered by the department's Local Services Division.
Bridges under local jurisdiction have been surveyed for structural adequacy and are ranked for priority of replacement in accordance with critical need based on the local agency's financial resources, importance of the bridge to the area, and the structural condition of the existing bridge.
Other highway safety projects are funded with Federal-Aid Urban, Primary, and Secondary funds. Interstate safety projects are funded with interstate funds.
Contracts for highway safety improvements are awarded in accord with criteria and requirements outlined in FllPM 6-4-l-14.
III. Evaluation and Reporting
Evaluation of highway safety improvements are done in accord with reporting requirements outlined in the Federal Aid Highway Program Manual, Volume 8, Chapter 2, Section 3, Paragraph 8. Results of these evaluations are included in Michigan's annual report to the Federal Highway Administration of its overall highway safety improvement program.
The basic element of the evaluation process is completion of the "Table 2'" for the federal categorical Hazard Elimination Safety (H.E.S.) programs. In addition, that form has been, and is, used to tabulate before-and-after data for safety projects funded by other federal/state highway funds. Since Rail Highway Safety Program projects are not justified primarily by accident data, other "program" analysis methods are used (see C).
The "Table 2" includes the following information:
Funding Source (Column 1) .- Improvement Type (Column 2)
Cost (Column 3) · Before-and-After Accident Data, Including Severity (Columns 7-15) Traffic Volume (Columns 17 and 18)
The data summarized in the "Table 2's" is assessed in different ways.
A. Time-of-Return
The time-of-return analysis computes before-and-after accident costs, utilizing National Safety Council cost data for fatalities, injuries, and property damage only crashes. Comparing the reduction of these costs (the "benefit") to project costs yields the time to recover the investment.
B. Statistical Analysis
Long term accident data is subject to increasing and decreasing trends, resulting from well known factors, such as safer vehicle designs, seat belt usage, the lower national speed limit, enforcement of drunk driving laws, and other less well understood factors which seem to affect crash and crash severity data. MDOt therefore utilizes statistically valid "control" groups to assess the expected impact of the "no build" alternative. This affords a more accurate assessment of the benefits of safety projects. "Controls" are usually groups of locations with characteristics similar to the project location. When entire safety programs are evaluated, statewide or system classification data may be used as a control.
26
C. Program Analysis
After several years of experience with one or more safety programs directed at specific road systems, or with similar types of projects or locations, a program analysis may be undertaken. Examples of such analyses included in previous annual safety reports are the Pavement Marking Demonstration Program (1981), the Rail/Highway Crossing Safety Program (1982), and the Roadside Safety Improvement Program on the Interstate System (1983). These types of analyses yield a broad perspective overview of the long term effect of safety programs on the targeted roadway systems.
D. Type of Improvement Analysis
MDOT regularly analyzes the impact of various types of roadside "hardware .. and operational improvements. Examples include concrete median barrier walls, paved shoulders, traffic signal systems, 4-way stops in rural areas, and 2-way center left-turn lanes. These studies allow us to assess new "state of the art" traffic control devices and new or unique uses of existing devices.
The body of knowledge accumulated through these evaluations allows MDOT to assess the cost-effectiveness of specific safety programs, their impact on specific roadway classifications, and the impact of new or modified traffic control devices, highway appurtenance, or design techniques. This data assists us in future decisions as to what countermeasures will be most effective in alleviating accidents or reducing their severity.
27

Appendix II Guideline for Federal Funding of Safety Projects
Local System
I. Guideline
II. Goal
III. Project Types
IV. Data Collection and Analysis
Vc Evaluation Prior to Construction
VI. Nationally Recognized Cost Effective Safety Projects
VII. Small Safety Projects
VIII. Administrative Development for Federal Funds
IX. Rail-Highway Crossings .••••.
X. Reporting Evaluation of Completed HES Projects
page
1
1
1
l
2
2
3
3
3
4
MICHIGAN DEPARTMENT
OF
TRANSPORTATION
Local Services Division
Guideline for Federal Funding
of
Safety Projects
May 1985
I. GUIDELINE - Local Highway Agency Projects
This document is the guideline for accepting safety related projects for Federal Safety Funding. It applies to MDOT Local Services Division and Local Highway Agencies throughout the State. The Federal Programs involved are HES and RRS.
II. GOAL:
The Goal of this program is to reduce highway related accidents through Federal funding of projects determined to be at bazardous locations. Improvements are aimed at specific locations rather than general roadway construction. Funds are not intended for the purpose of increasing roadway capacity, however, capacity can be the primary cause of accidents and these projects will be eligible.
III. PROJECT TYPES
This guideline shall apply to the following types of projects described herein ..
1. General Time of Return (TOR) Projects. 2. Nationally Recognized Cost Effective Projects. 3. Small Safety Projects.
IV. DATA COLLECTION & ANALYSIS
It is the responsibility of the Local Highway Agency to set priorities, collect and analyze accident information and to select projects for Federal funding. Those chosen should be the most effective in accident reduction for the individual governmental jurisdictional area.
Accident information available from Michigan's MALI system should be used as the basis for Priority setting by the Local Agency.
Information gathered and analyzed shall be retained in the Local Agency file.
To assist smaller agencies, MDOT makes available a section of its Traffic and Safety Division (402 Federally funded) to develop projects for funding. The service is available upon request and on a limited basis.
1

-2-
The following reports are desirable to properly develop a safety project and should be retained by the Local Agency.
1. Accident Reports - 01ALI) A 3 year period is desirable. 2. ·collision·Diagrams- Helpful in analyzing accident problems. 3. · ·sketch'of·EXisting Conditions- Sketch should show relevent informa
tion such as street and lane widths, alignment, and cross-section. 4. Traffic Volumes - Actual counts are desirable, however, estimates
will suffice on low volume roads. Actual counts will be necessary where traffic signals are involved.
5. Photographs - Before and after are helpful in evaluation.
V. EVALUATION PRIOR TO PROJECT CONSTRUCTION
Cost Benefit Evaluation Prediction
Evaluation of projects shall be accomplished using the estimated time of return (T.O.R.) Formula included herein, using current National Safety Council values for property damage accidents, injuries, and fatalities. Those projects exhibiting the lowest T.O.R. factors are deemed to be the most cost effective and are therefore given the highest priority in the programming process.
The T.O.R. of the project cost, due to accident reduction, shall be 15 years for Local Highway Agency Projects. This will allow greater coverage of Safety projects in local areas that do not have an intense accident problem.
The T.O.R. computation shall be based on the engineers estimate as submitted for programming and shall be re-evaluated at a later date if cost has increased excessively.
This policy will apply to all Safety Projects, except those indicated as "Small Safety Projects" listed herein, Nationally Recognized Safety Projects and Rail-Highway Safety Projects.
'Environmental Assessment
Environmental Evaluation shall follow the currect Federal Aid Urban and Federal Aid Secondary Guidelines for assessment and classification. It is expected that a consid'erable number of Safety projec.ts will be classed as categorical exclusions. This will aid in limiting the time required for the development of projects and insure obligation of Federal funds in a timely manner.
VI. NATIONALLY RECOGNIZED COST EFFECTIVE SAFETY PROJECTS
The MDOT Local Services Division will allow certain types of safety improvement projects which have been shown to be cost effective by previous nationwide studies· to be implemented without individual T.O.R. prediction. These projects are:
1 • Traffic Sign 2. Railroad Signs, Markings, Signals & Gates 3. Pavement Markings and/or Delineators 4. Upgraded and New Guard Rail
2

-3-
5. Bridge Approach Guard Rail 6. Railroad Crossing Alignment Improvement 7. Removal of Roadside Obstacles 8. Upgrade Bridge Rail
The above Will be eligible for Federal Funding without ADT limitations as this criteria is not relative.
VII. SMALL SAFETY PROJECTS
The Goal of this Policy is to better dispense and balance distribution. of Federal Safety funds on a state-wide basis, by insuring that all Local Agencies are eligibie to receive Federal Safaty Funds.
Past experience bas shown that very few outs.tate Local Agencies have the intense hazard problems as associated with the Detroit Metro and large city areas of the Stace. Yet these outstate areas have a strong need for Safety funds for worthy projects.
To further the Goal of highway safety awareness on a state-wide basis, "SMALL SAFETY PROJECTS" will be accepted for Federal Funding without individual T.O.R. procedures. This policy may involve approximately 30% of the HES state-wide Local Services Allocation per year. Each project will be reviewed for its worthiness and its overall cost, so as to keep it in the realm of a "SMALL SAFETY PROJECT." Each project will be accepted on the basis of a known history of accidents and/or has the potential for such accidents as determined by the city/county engineer. Projects shall be chosen as the most cost effective in accident reduction for the individual governmental jurisdictional areas. Types of projects are:
1. Intersectional improvements 2. Roadside obstacle removals 3. Guard rail installation and slope flattening 4. Shoulder widening and paving 5. Signal installation and modernization 6. Vertical and horizontal alignments improvements 7. Adding lanes (channelizing and turning) 8. Installation of attenuators 9. Texturizing of roadway surfaces
10. Traffic Signals - Sa:!i.ety related
Project selection will not be limited to the above and on a limited basis may include other highway safety imp)'ovements as· "SMALL SAFETY PROJECTS."
VIII. ADMINISTRATIVE DEVELOPMENT FOR FEDERAL FUNDS
To develop funding procedures, after safety evaluation and priority selection, the regular Urban and Secondary guidelines will apply, as appropriate.
IX. RAIL-HIGHWAY CROSSINGS
The Grade Crossing Improvement Program utilizes the Hazard Index Rating (H.I.R.) to initiate grade inspections by a diagnostic team. Inspectors from the Department's Railroad Safety Section are the team leaders and are respons:Lble for completing the Grade Inspection Report ~EKhlMt-¥-III"}T
3

-4-
The remarks section of the form would include data relative to people, factors, and hazardous materials. The H.I.R. is then again utilized to determine the order in which improvement projects are submitted with one exception: Flexibility in the program is maintained by being able to take advantage of a scheduled highway improvement to include an improvement in a rail-highway· crossing. Tlie crossing improved may not appear near the top of the project listing, but by incorporating the two projects a lower cost can be utilized.
a. Hazard Ind2X from State Inventory Program
Hazard ·Index Rating · (11; LR.) = Average Daily Traffic (A.D. T.) x Average 24-hour Train Movemen~s x Protection Factor
B.rotection Factors
1.-00 - Reflectorized Crossbuck Sign 0.30 -Flashing Light Signals 0.27 -Flashing Light Signals with Cantilever Arms 0.24 -Flashing Light Signals with Cantilever Arms and Half-Roadway Gates 0.11 -Flashing Light wi.th Half-Roadway Ga~es 0.0~ -Flashing Light Signals with Cantilever Arms and Half-Roadway Gates 0.05- Flashing Light Signals with Cantilever Arms, Half-Roadway Gates,
and Traf£ic Signal Interconnection
NOTE: Railroad Safety does not accoun.t for interconnected traffic lights in their inventory data.
The MOOT Local Services Division may reserve certain portions of the annual RRS appropriation to fund worthy specialty projects such as, but not limited to, railroad consolidation projects. Evaluation and selection of these projeCts shall receive individual attention.
X. REPORTING EVALUATION OF COMPLETED RES PROJECTS
The Local Highway Agency shall be responsible for reporting to MDOT, evalation of the Safety ProjeCt af~er construction and trial period. This may consist of the time of return comparison, before and after and/or a word report of the evaluation of the safety aspects of xhe project. The evaluation sliall include as a minimum, a two year before/af.:tter accidenx comparison for the accident categories whi:ch the project was expected to address (shown on T&R analysis), and for overall accidents .at that location. This report sliall Cie sulimftted to the MDOT Local Services Division. Reporting Ciefore and after evaluations will hot be required for "SMALL SAFETY PROJECTS\.' and ''NATIONWIDE COST EFFECTIVE PROJECTS" as previously listed herein.
4