roles and behaviors in technology- integrated precalculus classrooms
TRANSCRIPT
JOURNAL OF MATHEMATICAL BEHAVIOR 15, 35-53 (1996)
Roles and Behaviors in Technology- Integrated Precalculus Classrooms
ANN M. FARRELL
Wright State University
This study was designed to obtain a description of the learning and teaching activities that
take place in classrooms in which graphing calculators are integrated with the curriculum.
Videotapes of six lessons from each of six teachers were coded using a modified version
of the Systematic Classroom Analysis Notation Matrix (Fraser et al., 1987). Observers
categorized teacher and student roles as manager, task setter, explainer, consultant, fellow
investigator, or resource. There is evidence that students and teachers shifted their roles
when technology was in use. Observers categorized teaching and “pupiling” acrivities.
Differences were observed between teaching activities with and without technology and
student behavior with and without technology.
Several types of change can occur when graphing technology is used in the teaching and learning of mathematics. These include changes in course goals and content (Ruthven, 1993), changes in assessment methods (Harvey, 1990; Ken- elly, 1989), changes in attitude (Alkalay, 1993), changes in the structure of lessons or the use of time, or changes in student and teacher behavior and interactions. This study was undertaken to determine whether there are changes in student and teacher behavior and interactions when graphing calculators are integrated into a high school precalculus curriculum.
INTRODUCTION TO THE STUDY
The primary purpose of this article is to provide a description of the activities of teaching and “pupiling” when graphing utilities on hand-held calculators and computers were integrated into a precalculus classroom. A secondary purpose is to offer to readers a method for recording and analyzing such activities using videotaping and a modified version of the Systematic Classroom Analysis cate- gories (Beeby, Burkhardt, & Fraser, 1979).
The Systematic Classroom Analysis Notation (SCAN) was developed by Beeby, Burkhardt, and Fraser (1979) in order to provide a means for interpreting how educational computer programs were being used by teachers in various subjects, including mathematics. This observation system allows the observer to
Correspondence and requests for reprints should be sent to Ann M. Farrell, Department of Mathematics and Statistics, Wright State University, Dayton, OH 45435.
35
36 FARRELL
record concurrently the teaching activities, learning activities, and teaching and learning roles evident in the classroom. In a study of the effect of the computer on classroom behavior of teachers and students in 17 elementary mathematics classes, Fraser et al. (1987) used interpretations from SCAN records to describe the role shifts made by teachers and students. They found that the use of a single classroom microcomputer suitably programmed for use as a teaching aid affected the role that the teacher played in the classroom. Furthermore, the researchers found a relationship between the roles undertaken by the teacher and the learning activities engaged in by the students. When teachers allowed the computer to take over the traditional, more authoritarian roles of manager and task setter, the teacher was free to move on to the more demanding roles of consultant, fellow investigator, and resource person. In addition, allowing the students to assume the roles of manager, task setter, and explainer made them take on more respon- sibility for their own learning and use more higher level thinking skills than in their traditional role as passive learners.
Not only did the categories on the SCAN matrix seem to fit well with the current goals of the mathematics education reform movement, but they seemed to echo what other researchers had been observing in classrooms where technolo- gy was in use.
Kellogg and Leonard (1987) observed eight teachers and their students using a single microcomputer in high school science and biology classes. The software consisted of four instructional programs designed to be used for four consecutive lessons in a genetics unit. The researchers found that the teacher’s role shifted from being lecturer and conclusion giver to initiator and facilitator: “[Tlhe computer was given the role of the information authority while the teacher was freed to assume a facilitator role” (p. 9). The teachers used about the same total number of questions, but more higher level inquiry questions than traditionally reported in the literature. Students became more engaged in the lessons. They asked questions, tested hypotheses, and were actively involved in using the scientific method.
Wiske et al. (1988) and Lampert (1988) stated that when using the tech- nology-rich curriculum developed around the Geometric Supposer, students be- gan forming their own hypotheses, actively testing things out, and making generalizations. They shared ideas, talked about mathematics, and interacted in group problem solving in a way that differed from traditional classroom interac- tions.
Heid (1988) saw students develop greater independence and interact more with each other when they studied an Algebra I curriculum that integrated tech- nology with the mathematics. However, Dick and Shaughnessy (1988) said they found only minor changes in the dynamics of classroom interaction when stu- dents in Algebra II, Trigonometry, and Calculus at two high schools used a powerful hand-held programmable symbolic/graphic calculator, the HP-28, for 6 months. The calculator was used with the standard textbook and curriculum.
ROLES AND BEHAVIORS 37
They did note that four of the five teachers reported taking a more “exploratory”
approach to teaching graphing then they ever had before. Teachers and students
were able to cover some more complicated topics and some topics in more depth than without the technology.
Picciotto and Wah (1993) observed students using a wide variety of tools integrated with the curriculum. The tools included geoboards, dot paper, graph paper, Algebra Lab Gear, calculators, and graphing calculators. The researchers describe four advantages to a “tool-based approach”; namely, it increases student access to significant mathematical concepts, facilitates student-student and stu- dent-teacher discourse, fosters student independence, and encourages use of multiple representations.
Schofield, Eurich-Fulcer, and Britt (1994-a, 1994-b) want researchers study- ing educational technology to look at the “package of changes” in “content, process, and context of social learning” that occur when technology is introduced into the teaching and learning environment. They found that use of GPTutor, a computerized, artificially intelligent geometry tutor, prompted changes in class- room roles and structure. The tutor gave students more control over the kind and amount of teacher help they received. Teacher help became more individualized and more private (and thus potentially less embarrassing). Students could pro- gress at their own pace and appeared to be more engrossed in their work- starting to work before the bell and continuing to work after class ended. The tutor operated as an additional resource for students.
Technology was used as a supplement to the regular curriculum in the class- rooms studied by Fraser et al. (1987), Kellogg and Leonard (1987), and Dick and Shaughnessy (1988) and it was integral to the curriculum in the studies by Wiske et al. (1988), Lampert (1988), Heid (1988), Picciotto and Wah (1993), and Schofield, Eurich-Fulcer, and Britt (1994-a). Dick and Shaughnessy (1988) and Picciotto and Wah (1993) studied the use of a hand-held calculator, whereas Fraser et al. (1987) and Kellogg and Leonard (1987) looked at classrooms using a demonstration computer. Students in the classrooms observed by Wiske et al. (1988), Lampert (1988), and Schofield et al. (1994-a) had access to computers. The computer and calculator graphing utilities in this study are an integral part of instruction rather than a supplement. The textbook was designed for use with graphing utilities. As in the earlier studies, teachers used computers for demon- stration. However, students also had frequent access to the computers and contin- uous access to the calculators.
For this study, 1 observed, documented, and analyzed student and teacher behaviors and roles in high school precalculus classes where graphing technolo- gy was integrated with the text, all students had complete access to graphing calculators, the teacher used an overhead display device attached to a graphing utility (calculator or computer), and students had frequent access to computers with graphing software. The goal is to obtain a description of the learning and teaching activities that take place in these classrooms.
38 FARRELL
ROLES AND BEHAVIORS IN TYPICAL MATHEMATICS CLASSROOMS
To set the context for this study, it helps to review some findings from the literature on teaching and learning mathematics in the typical classroom. These descriptions will be used to guide the discussion of results.
Fey (198 1) and the Research Advisory Committee of NCTM (1988) noted that the prevailing pattern of instruction in mathematics classrooms is homework- lecture-new homework. That routine consists of listing answers for the previous day’s assignment, working the more difficult problems at the chalkboard, giving a brief explanation or none at all of the new material, assigning problems for the next day, and spending the remainder of the class period working on the new assignment with the teacher walking around answering questions.
The role of the teacher in traditional classrooms is managerial (Romberg, 1985, cited in Romberg & Carpenter, 1986, p. 85 1). The teacher talks 2/3 of the time and the predominant pattern in traditional classrooms is extensive teacher- directed explanation and questioning (Suydam & Osborne, 1977).
In traditional classrooms, “the text is followed fairly closely, but students are likely to read at most one or two pages out of five pages of textual materials other than problems” (Conference Board of Mathematical Sciences, 1975, cited in Romberg & Carpenter, 1986, p. 851). Students normally use the text as little more than a source of problem lists.
In traditional classrooms, seatwork consumes up to 50% of the time in class and little time is spent in small groups or on independent activities such as
projects or investigations (Research Advisory Committee, 1988).
METHOD
I recruited six teachers involved in a curriculum development project designed to implement calculators and computers in high school mathematics. The teachers were nearing the end of their first year of teaching precalculus mathematics using the Calculators and Computers in Precalculus (C2PC) materials (Demana & Waits, 1989). In an effort to minimize disruption to the normal classroom rou- tine, the only request made of the teachers was to videotape 10 consecutive, nontesting lessons. Three teachers set up the camera in a stationary position in the back of the classroom, showing three to five students and the teacher. Three teachers were able to arrange for a student aide to operate the camera and make periodic sweeps of the room to show the entire class.
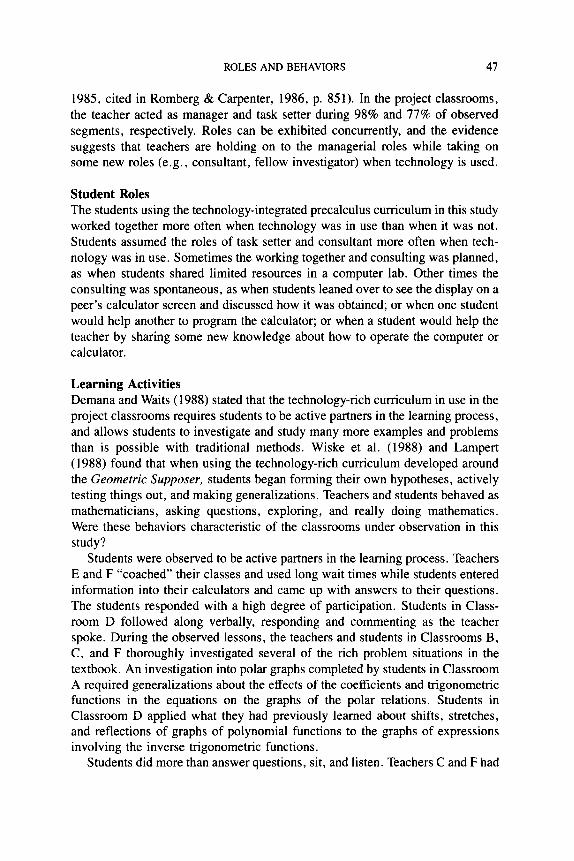
The instrument chosen for recording events in the C*PC classrooms is a modified version of the Systematic Classroom Analysis Notation (SCAN) Matrix (Fraser et al., 1987). The first section of the instrument provides information about the teaching activity in use, the number of questions asked by the teacher and students, the type of lesson segment, and what technology is in use (see Figure 1). The next section of the instrument lists roles that the teacher, students,
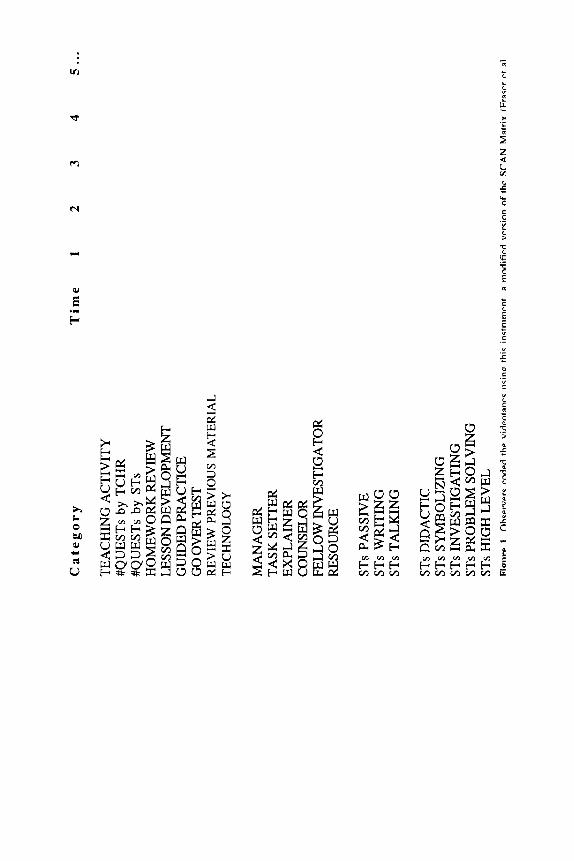
Cat
egor
y T
ime
1 2
3 4
5 . .
.
TE
AC
HIN
G
AC
TIV
ITY
#Q
UE
STS
by
TC
HR
#Q
UE
STS
by
STs
HO
ME
WO
RK
R
EV
IEW
L
ESS
ON
D
EV
EL
OPM
EN
T
GU
IDE
D
PRA
CT
ICE
G
OO
VE
RT
EST
R
EV
IEW
P
RE
VIO
US
M
AT
ER
IAL
T
EC
HN
OL
OG
Y
MA
NA
GE
R
TA
SK
SET
TE
R
EX
PLA
INE
R
CO
UN
SEL
OR
FE
LL
OW
IN
VE
STIG
AT
OR
R
ESO
UR
CE
STs
PASS
IVE
ST
s W
RIT
ING
ST
s T
AL
KIN
G
STs
DID
AC
TIC
ST
s SY
MB
OL
IZIN
G
STs
INV
EST
IGA
TIN
G
STs
PRO
BL
EM
SO
LV
ING
ST
s H
IGH
L
EV
EL
40 FARRELL
or the technology may assume in the classroom. Listed in the final sections are learning activities that describe what students are doing.
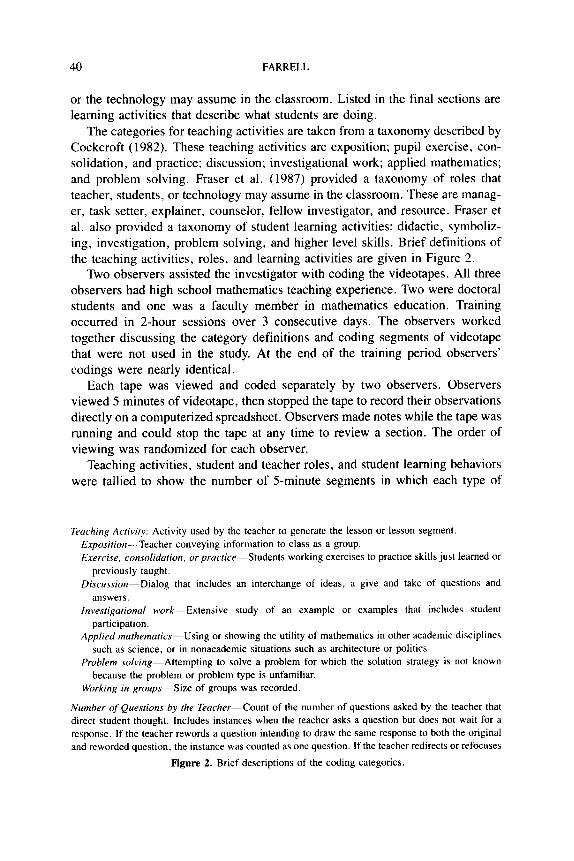
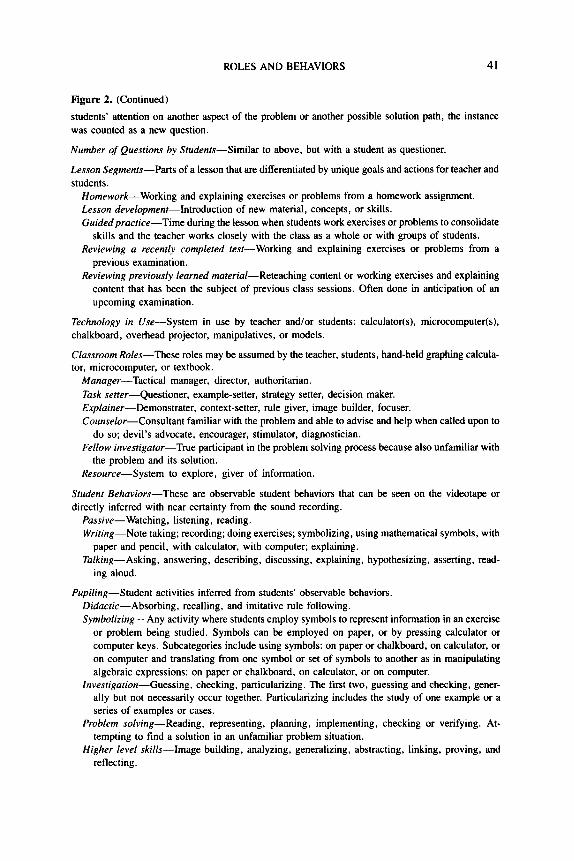
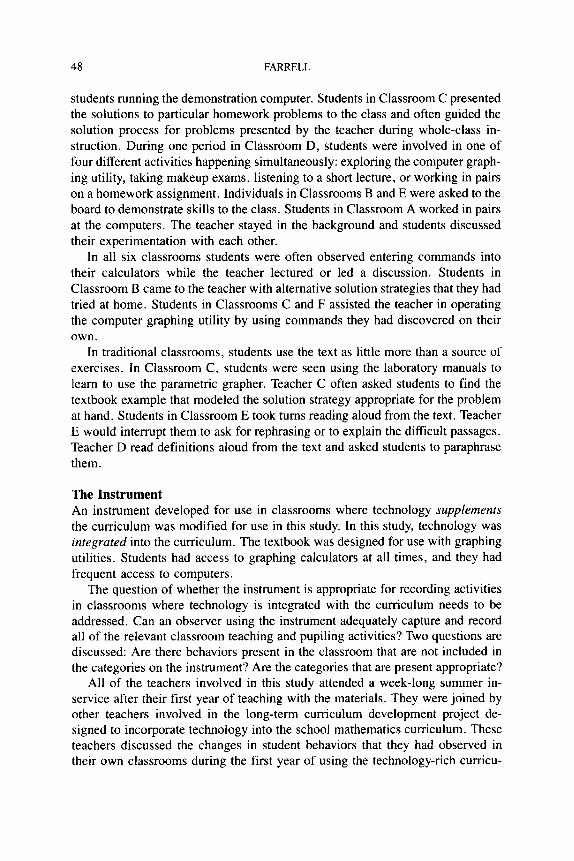
The categories for teaching activities are taken from a taxonomy described by Cockcroft (1982). These teaching activities are exposition; pupil exercise, con- solidation, and practice; discussion; investigational work; applied mathematics; and problem solving. Fraser et al. (1987) provided a taxonomy of roles that teacher, students, or technology may assume in the classroom. These are manag- er, task setter, explainer, counselor, fellow investigator, and resource. Fraser et al. also provided a taxonomy of student learning activities: didactic, symboliz- ing, investigation, problem solving, and higher level skills. Brief definitions of the teaching activities, roles, and learning activities are given in Figure 2.
Two observers assisted the investigator with coding the videotapes. All three observers had high school mathematics teaching experience. Two were doctoral students and one was a faculty member in mathematics education. Training occurred in 2-hour sessions over 3 consecutive days. The observers worked together discussing the category definitions and coding segments of videotape that were not used in the study. At the end of the training period observers’ codings were nearly identical.
Each tape was viewed and coded separately by two observers. Observers viewed 5 minutes of videotape, then stopped the tape to record their observations directly on a computerized spreadsheet. Observers made notes while the tape was running and could stop the tape at any time to review a section. The order of viewing was randomized for each observer.
Teaching activities, student and teacher roles, and student learning behaviors
were tallied to show the number of Sminute segments in which each type of
Eachin~ Activiry Activity used by the teacher to generate the lesson or lesson segment.
Exposition-Teacher conveying information to class as a group.
Exercise. consalidurion, orpracrice--Students working exercises to practice skills just learned or
previously taught.
Discussion-Dialog that includes an interchange of ideas, a give and take of questions and
answers. Investipztional work-Extensive study of an example or examples that includes student
participation. Applied mathematics--Using or showing the utility of mathematics in other academic disciplines
such as science, or in nonacademic situations such as architecture or politics.
Problem solving--Attempting to solve a problem for which the solution strategy is not known because the problem or problem type is unfamiliar.
Working in groups-size of groups was recorded
Number of Quesfions by the Teacher-Count of the number of questions asked by the teacher that direct student thought. Includes instances when the teacher asks a question but does not wait for a
response. If the teacher rewords a question intending to draw the same response to both the original
and reworded question, the instance was counted as one question. If the teacher redirects or refocuses
Figure 2. Brief descriptions of the coding categories.
ROLES AND BEHAVIORS 41
Figure 2. (Continued)
students’ attention on another aspect of the problem or another possible solution path, the instance
was counted as a new question.
Number of Quesrions by Students-Similar to above, but with a student as questioner.
Lesson Segments-Parts of a lesson that are differentiated by unique goals and actions for teacher and
students. Homework-Working and explaining exercises or problems from a homework assignment.
Lesson development-Introduction of new material, concepts, or skills.
Guidedpractice-Time during the lesson when students work exercises or problems to consolidate
skills and the teacher works closely with the class as a whole or with groups of students.
Reviewing a recently completed test-Working and explaining exercises or problems from a
previous examination.
Reviewing previously learned material-Reteaching content or working exercises and explaining
content that has been the subject of previous class sessions. Often done in anticipation of an
upcoming examination.
Technology in Use-System in use by teacher and/or students: calculator(s), microcomputer(s),
chalkboard, overhead projector, manipulatives, or models.
Classroom Roles-These roles may be assumed by the teacher, students, hand-held graphing calcula- tor, microcomputer, or textbook.
Manager-Tactical manager, director, authoritarian.
Tusk setter-Questioner, example-setter, strategy setter, decision maker.
Explainer-Demonstrater, context-setter, rule giver, image builder, focuser.
Counselor-Consultant familiar with the problem and able to advise and help when called upon to
do so; devil’s advocate, encourage& stimulator, diagnostician.
Fellow investigator-True participant in the problem solving process because also unfamiliar with the problem and its solution.
Resource-System to explore, giver of information.
Student Behaviors-These are observable student behaviors that can be seen on the videotape or
directly inferred with near certainty from the sound recording.
Passive-Watching, listening, reading.
Writing-Note taking; recording; doing exercises; symbolizing, using mathematical symbols, with
paper and pencil, with calculator, with computer; explaining.
Talking-Asking, answering, describing, discussing, explaining, hypothesizing, asserting, read-
ing aloud.
Pupiling-Student activities inferred from students’ observable behaviors.
Didactic-Absorbing, recalling, and imitative rule following.
Symbolizing-Any activity where students employ symbols to represent information in an exercise
or problem being studied. Symbols can be employed on paper, or by pressing calculator or
computer keys. Subcategories include using symbols: on paper or chalkboard, on calculator, or
on computer and translating from one symbol or set of symbols to another as in manipulating
algebraic expressions: on paper or chalkboard, on calculator, or on computer. /nvesti@on-Guessing, checking, particularizing. The first two, guessing and checking, gener-
ally but not necessarily occur together. Particularizing includes the study of one example or a
series of examples or cases. Problem solving-Reading, representing, planning, implementing, checking or verifying. At-
tempting to find a solution in an unfamiliar problem situation.
Higher level skills--Image building, analyzing, generalizing, abstracting, linking, proving, and
reflecting.
42 FARRELL
activity, role, or behavior was observed and what type of technology was in use at that time.
RESULTS
The sample coded consisted of six lessons for each teacher. To provide the opportunity to view introductory and summary lessons on a topic, the first six consecutive class sessions were coded. The total number of 5-minute segments coded was 283. During 158 (56%) of the segments, calculators or computers were in use. During the remaining 125 (44%) of the segments, no calculators or computers were in use. When technology was in use, 43% of the time it was calculators alone; 27% of the time it was computers alone; and in 30% of the segments in which technology was in use, both calculators and computers were used.
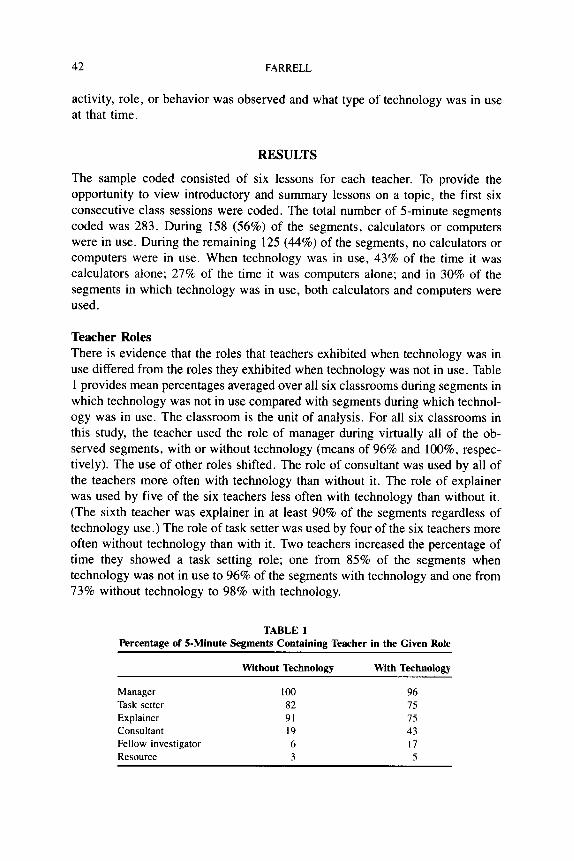
Teacher Roles There is evidence that the roles that teachers exhibited when technology was in use differed from the roles they exhibited when technology was not in use. Table 1 provides mean percentages averaged over all six classrooms during segments in which technology was not in use compared with segments during which technol- ogy was in use. The classroom is the unit of analysis. For all six classrooms in this study, the teacher used the role of manager during virtually all of the ob- served segments, with or without technology (means of 96% and lOO%, respec- tively). The use of other roles shifted. The role of consultant was used by all of the teachers more often with technology than without it. The role of explainer was used by five of the six teachers less often with technology than without it. (The sixth teacher was explainer in at least 90% of the segments regardless of technology use.) The role of task setter was used by four of the six teachers more often without technology than with it. Two teachers increased the percentage of time they showed a task setting role; one from 85% of the segments when technology was not in use to 96% of the segments with technology and one from
73% without technology to 98% with technology.
TABLE 1 Percentage of S-Minute Segments Containing Teacher in the Given Role
Without Technology With Technology
Manager 100 96
Task setter 82 75
Explainer 91 15
Consultant 19 43
Fellow investigator 6 17
Resource 3 5
ROLES AND BEHAVIORS 43
Overall, the mean percentage of segments in which the teacher acted as fellow investigator also increased with the use of technology; however there was a large amount of variability across classrooms for this role.
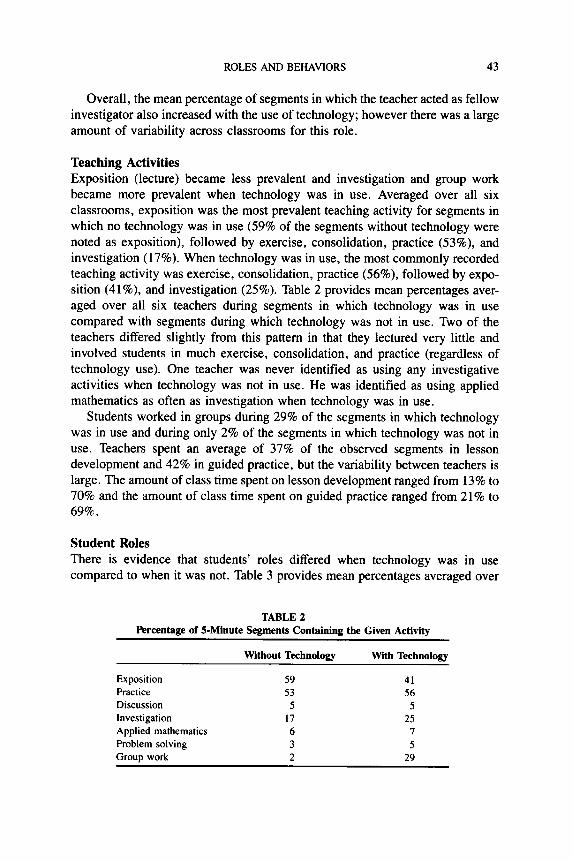
Teaching Activities Exposition (lecture) became less prevalent and investigation and group work became more prevalent when technology was in use. Averaged over all six classrooms, exposition was the most prevalent teaching activity for segments in which no technology was in use (59% of the segments without technology were noted as exposition), followed by exercise, consolidation, practice (53%), and investigation (17%). When technology was in use, the most commonly recorded teaching activity was exercise, consolidation, practice (56%), followed by expo- sition (41%), and investigation (25%). Table 2 provides mean percentages aver- aged over all six teachers during segments in which technology was in use compared with segments during which technology was not in use. Two of the teachers differed slightly from this pattern in that they lectured very little and involved students in much exercise, consolidation, and practice (regardless of technology use). One teacher was never identified as using any investigative activities when technology was not in use. He was identified as using applied mathematics as often as investigation when technology was in use.
Students worked in groups during 29% of the segments in which technology was in use and during only 2% of the segments in which technology was not in use. Teachers spent an average of 37% of the observed segments in lesson development and 42% in guided practice, but the variability between teachers is large. The amount of class time spent on lesson development ranged from 13% to 70% and the amount of class time spent on guided practice ranged from 21% to 69%.
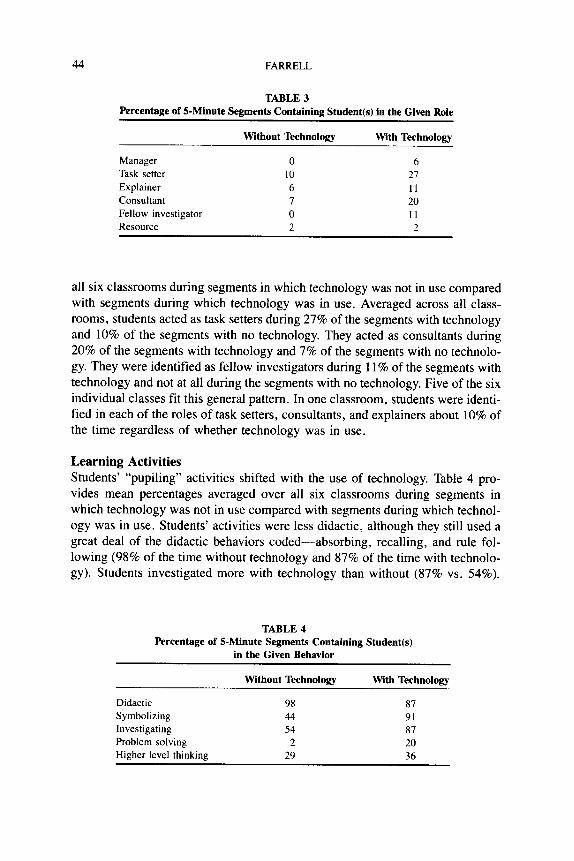
Student Roles There is evidence that students’ roles differed when technology was in use compared to when it was not. Table 3 provides mean percentages averaged over
TABLE 2
Percentage of 5-Minute Segments Containing the Given Activity
Exposition Practice
Discussion
Investigation Applied mathematics
Problem solving Group work
Without Technology With Technology
59 41
53 56
5 5
17 25
6 7
3 5 2 29
44 FARRELL
TABLE 3
Percentage of J-Minute Segments Containing Student(s) in the Given Role
Manager
Task setter
Explainer
Consultant Fellow investigator
Resource
Without Technology With Technology
0 6
10 21
6 11
7 20 0 II
2 2
all six classrooms during segments in which technology was not in use compared with segments during which technology was in use. Averaged across all class- rooms, students acted as task setters during 27% of the segments with technology and 10% of the segments with no technology. They acted as consultants during 20% of the segments with technology and 7% of the segments with no technolo- gy. They were identified as fellow investigators during 11% of the segments with technology and not at all during the segments with no technology. Five of the six individual classes fit this general pattern. In one classroom, students were identi- fied in each of the roles of task setters, consultants, and explainers about 10% of the time regardless of whether technology was in use.
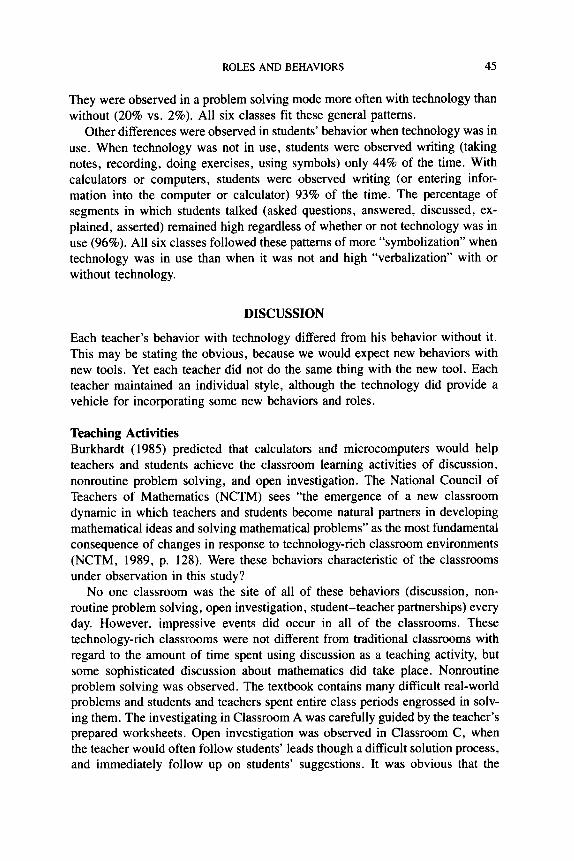
Learning Activities Students’ “pupiling” activities shifted with the use of technology. Table 4 pro- vides mean percentages averaged over all six classrooms during segments in which technology was not in use compared with segments during which technol- ogy was in use. Students’ activities were less didactic, although they still used a great deal of the didactic behaviors coded-absorbing, recalling, and rule fol- lowing (98% of the time without technology and 87% of the time with technolo- gy). Students investigated more with technology than without (87% vs. 54%).
TABLE 4 Percentage of S-Minute Segments Containing Student(s)
in the Given Behavior
Didactic
Symbolizing Investigating
Problem solving
Higher level thinking
Without Technology With Technology
98 87
44 91
54 87
2 20
29 36
ROLES AND BEHAVIORS 45
They were observed in a problem solving mode more often with technology than without (20% vs. 2%). All six classes fit these general patterns.
Other differences were observed in students’ behavior when technology was in
use. When technology was not in use, students were observed writing (taking notes, recording, doing exercises, using symbols) only 44% of the time. With calculators or computers, students were observed writing (or entering infor- mation into the computer or calculator) 93% of the time. The percentage of segments in which students talked (asked questions, answered, discussed, ex- plained, asserted) remained high regardless of whether or not technology was in use (96%). All six classes followed these patterns of more “symbolization” when technology was in use than when it was not and high “verbalization” with or without technology.
DISCUSSION
Each teacher’s behavior with technology differed from his behavior without it. This may be stating the obvious, because we would expect new behaviors with new tools. Yet each teacher did not do the same thing with the new tool. Each teacher maintained an individual style, although the technology did provide a vehicle for incorporating some new behaviors and roles.
Teaching Activities Burkhardt (1985) predicted that calculators and microcomputers would help teachers and students achieve the classroom learning activities of discussion, nonroutine problem solving, and open investigation. The National Council of Teachers of Mathematics (NCTM) sees “the emergence of a new classroom dynamic in which teachers and students become natural partners in developing mathematical ideas and solving mathematical problems” as the most fundamental consequence of changes in response to technology-rich classroom environments (NCTM, 1989, p. 128). Were these behaviors characteristic of the classrooms under observation in this study?
No one classroom was the site of all of these behaviors (discussion, non- routine problem solving, open investigation, student-teacher partnerships) every day. However, impressive events did occur in all of the classrooms. These technology-rich classrooms were not different from traditional classrooms with regard to the amount of time spent using discussion as a teaching activity, but some sophisticated discussion about mathematics did take place. Nonroutine problem solving was observed. The textbook contains many difficult real-world problems and students and teachers spent entire class periods engrossed in solv- ing them. The investigating in Classroom A was carefully guided by the teacher’s prepared worksheets. Open investigation was observed in Classroom C, when the teacher would often follow students’ leads though a difficult solution process, and immediately follow up on students’ suggestions. It was obvious that the
46 FARRELL
teacher and some of the students in Classroom B carried out extensive investiga- tions into alternative solution strategies outside of class. During class, the results of these investigations would be shared. Teacher and students in both of these classrooms were at times partners in developing solution strategies and solving mathematical problems.
The teachers and students avoided falling into the homework-lecture-new homework routine noted by Fey (198 1) and the Research Advisory Committee of NCTM (1988). Although homework was assigned and homework review did occur during whole-class instruction, the problems in the textbook were rich enough to allow for extensive discussion and development to be woven into the solution process. Sometimes an entire class period was spent solving a group of problems all relating to the same problem situation. Some class periods were devoted entirely to laboratory work. Other times the teacher would spend an entire class period explaining new content, interspersing lecture with guided practice and perhaps an explanation of how to operate some new features of the technology.
In traditional classrooms, seatwork consumes up to 50% of the time in class. In the project classrooms, guided practice was noted for 42% of the segments and exercise, consolidation, or practice was noted for 56% of the segments, but these practice sessions did not look like traditional “seatwork.” Students were rarely observed working alone on homework exercises at the end of the class period. The practice was teacher-led. Even if teachers were turning off the camera when students began seatwork, on the average it could not consume more than 10 minutes of class time, because the 36 lessons that were taped lasted an average of 40 minutes. Class periods were 50 minutes or less.
In traditional classrooms little time is spent in small groups or on independent activities such as projects or investigations (Research Advisory Committee, 1988). In the project classrooms, students worked in small groups during 17% of the observed segments and during 29% of the segments in which technology was in use.
Teacher Roles With respect to the amount of teacher talk and the teacher’s managerial role, the descriptions of teaching and pupiling with technology look similar to the descrip- tions of teaching and pupiling in traditional classrooms. In the project class- rooms, the teacher acted as explainer during more than 80% of the observed segments and lectured during nearly half of the segments. Because this study used a sign system for recording activities, a direct comparison between the findings here and the real-clock measures made in prior research (e.g., Suydam & Osborne, 1977) cannot be made. It can be said that the teachers did continue to exhibit some of the characteristics of direct, teacher-led instruction during most of the observed segments.
The role of the teacher in traditional classrooms is managerial (Romberg,
ROLES AND BEHAVIORS 47
1985, cited in Romberg & Carpenter, 1986, p. 851). In the project classrooms, the teacher acted as manager and task setter during 98% and 77% of observed segments, respectively. Roles can be exhibited concurrently, and the evidence suggests that teachers are holding on to the managerial roles while taking on some new roles (e.g., consultant, fellow investigator) when technology is used.
Student Roles The students using the technology-integrated precalculus curriculum in this study worked together more often when technology was in use than when it was not. Students assumed the roles of task setter and consultant more often when tech- nology was in use. Sometimes the working together and consulting was planned, as when students shared limited resources in a computer lab. Other times the consulting was spontaneous, as when students leaned over to see the display on a peer’s calculator screen and discussed how it was obtained; or when one student would help another to program the calculator; or when a student would help the teacher by sharing some new knowledge about how to operate the computer or calculator.
Learning Activities Demana and Waits (1988) stated that the technology-rich curriculum in use in the project classrooms requires students to be active partners in the learning process, and allows students to investigate and study many more examples and problems than is possible with traditional methods. Wiske et al. (1988) and Lampert (1988) found that when using the technology-rich curriculum developed around the Geometric Supposer, students began forming their own hypotheses, actively testing things out, and making generalizations. Teachers and students behaved as mathematicians, asking questions, exploring, and really doing mathematics. Were these behaviors characteristic of the classrooms under observation in this study?
Students were observed to be active partners in the learning process. Teachers E and F “coached” their classes and used long wait times while students entered information into their calculators and came up with answers to their questions. The students responded with a high degree of participation. Students in Class- room D followed along verbally, responding and commenting as the teacher spoke. During the observed lessons, the teachers and students in Classrooms B, C, and F thoroughly investigated several of the rich problem situations in the textbook. An investigation into polar graphs completed by students in Classroom A required generalizations about the effects of the coefficients and trigonometric functions in the equations on the graphs of the polar relations. Students in Classroom D applied what they had previously learned about shifts, stretches, and reflections of graphs of polynomial functions to the graphs of expressions involving the inverse trigonometric functions.
Students did more than answer questions, sit, and listen. Teachers C and F had
48 FARRELL
students running the demonstration computer. Students in Classroom C presented the solutions to particular homework problems to the class and often guided the solution process for problems presented by the teacher during whole-class in- struction. During one period in Classroom D, students were involved in one of four different activities happening simultaneously: exploring the computer graph- ing utility, taking makeup exams. listening to a short lecture, or working in pairs on a homework assignment. Individuals in Classrooms B and E were asked to the board to demonstrate skills to the class. Students in Classroom A worked in pairs at the computers. The teacher stayed in the background and students discussed their experimentation with each other.
In all six classrooms students were often observed entering commands into their calculators while the teacher lectured or led a discussion. Students in Classroom B came to the teacher with alternative solution strategies that they had tried at home. Students in Classrooms C and F assisted the teacher in operating the computer graphing utility by using commands they had discovered on their own.
In traditional classrooms, students use the text as little more than a source of exercises. In Classroom C, students were seen using the laboratory manuals to learn to use the parametric grapher. Teacher C often asked students to find the textbook example that modeled the solution strategy appropriate for the problem at hand. Students in Classroom E took turns reading aloud from the text. Teacher E would interrupt them to ask for rephrasing or to explain the difficult passages. Teacher D read definitions aloud from the text and asked students to paraphrase them.
The Instrument An instrument developed for use in classrooms where technology supplements
the curriculum was modified for use in this study. In this study, technology was integrated into the curriculum. The textbook was designed for use with graphing utilities. Students had access to graphing calculators at all times, and they had frequent access to computers.
The question of whether the instrument is appropriate for recording activities in classrooms where technology is integrated with the curriculum needs to be addressed. Can an observer using the instrument adequately capture and record all of the relevant classroom teaching and pupiling activities? Two questions are discussed: Are there behaviors present in the classroom that are not included in the categories on the instrument? Are the categories that are present appropriate?
All of the teachers involved in this study attended a week-long summer in- service after their first year of teaching with the materials. They were joined by other teachers involved in the long-term curriculum development project de- signed to incorporate technology into the school mathematics curriculum. These teachers discussed the changes in student behaviors that they had observed in their own classrooms during the first year of using the technology-rich curricu-
ROLES AND BEHAVIORS 49
lum. They mentioned several pupiling activities that are not explicitly mentioned on the instrument. These teachers said that in addition to abstracting, reflecting, analyzing, and generalizing, their students began “networking, challenging, di-
recting, and venturing.” If the students in the technology-oriented curriculum are using these types of pupiling activities and the observers are not able to capture these activities using the instrument, then the instrument would not be adequate for characterizing important changes in pupiling.
The suggestion that students were “networking” implies a complex of behav- iors and activities including: students working together on a common problem; students communicating with each other about the problem; students consulting with persons who have particular strengths necessary for solving the problem. It would be difficult to read this activity from the SCAN record. An observer using SCAN would be able to record students working in groups, discussing mathe- matics, and problem solving. However, the subtleties implied by the term “net- working” may not come across. I recommend adding the activity “networking” to the student behaviors on the instrument.
The project teachers noted that at times students began “challenging” each other or the teacher in these classrooms. Students would want to have the most unique graph, or a better solution method, or the best program. Similarly, Schof- ield, Eurich-Fulcer, and Britt (1994-a) noted an increased level of “friendly com- petition” in their geometry classes using a computerized tutor. An observer using SCAN would have a dilIicult time recording this behavior on the instrument. The student could be noted as explaining, consulting, or asserting, but none of these seems to capture the entire meaning of “challenging” or “friendly competition.” I recommend adding the activity “challenging” to the student behaviors on the instrument.
The instrument can be used to record instances where students are “directing” the activity in the classroom. The students can be recorded as assuming the roles of task setter and manager. This implies that they are making decisions regarding what task to perform, how to perform it, and who will perform it. These are essentially the tasks of the director.
The project teachers agreed that their students at times showed an activity they labeled as “venturing.” Venturing would include the following behaviors. The students took risks. They attempted to solve problems that students in precal- culus classes usually would not attempt. They tried to solve problems when they knew that they were not sure what solution strategy to use. They spent time on a problem and then abandoned a strategy in favor of others. Using the methods of this study (the videotaping procedure and the instrument) this activity could not be recorded. Because the teachers were instructed to videotape “classroom” activities, there are very few segments in which one or two students are followed closely as they attempt to solve a problem. So, in order to be captured on the videotape, the whole class would have to be involved. In that case, the best that the observer could do is to record the teaching and pupiling activities as investi-
50 FARRELL
gation or problem solving. The record is simply not complete enough to read back the particulars of a solution process. In order to capture a record of this type of activity, it would be necessary to conduct a thorough study of two or three students solving problems, in a manner similar to the work done by Schoenfeld (1981).
So the procedures used in this study may not be up to the task of capturing all of the subtleties in pupiling behavior observed by the teachers. What about the behaviors and activities that are present on the instrument? Are the categories that are present appropriate? Two issues arise: the use of a sign system (Dunkin & Biddle, 1974) and the use of high inference categories (Cooney, 1980).
The unit of observation used in this study was time: 5-minute segments of class time. In all but two cases, the categories were coded using a sign system, in which only the first instance of a given event during the time segment is tallied. The sign system may make the instrument less sensitive to classroom differences. In all of the classrooms in this study, students were noted to be talking in nearly every time segment. However, during follow-up interviews the observers charac- terized the students in Classroom C as quiet. The instrument did include a category for counting the number of student questions. The number of student questions for Classroom C was low, indicating that this category may be a more sensitive indicator of students’ verbal participation than the category on the instrument called Students Talking.
The content of students’ talk may be more important for characterizing class- room interaction than a measure of the amount of student talk. A record of who initiates the verbal interaction (Friedman & Stomper, 1988), or the structure of the explanations that students and teachers use (Leinhardt, 1989) may provide more complete information about classroom participation.
The second important issue related to the robustness of the instrument is the degree to which observers were required to make inferences when categorizing behavior. In order to avoid a situation in which the behaviors categorized were too trivial or too mechanical to capture the complexity of classroom interaction, it was necessary that the categories involve some inference on the part of the observers. It was assumed that because the observers had experience teaching secondary mathematics, the inferences and subjective decisions they made would be valid. Although their decisions may have been valid, the reliability of ob- server categorizations needs to be examined. The definitions of categories can be improved and throughout the viewing and coding process, periodic checks should be made to ensure consistency in the use of the categories.
DIRECTIONS FOR FURTHER RESEARCH
The teachers volunteered to be a part of the C*PC project and this study. They chose to do these particular lessons during the videotaping period, so the study does not have the safeguards of an experiment. From the results, one can see
ROLES AND BEHAVIORS 51
what is possible when graphing technology is integrated with the high school precalculus curriculum, but not what is necessarily going to occur in every classroom.
This study provides evidence that teachers and students who want to bring to classrooms a different type of teaching and pupiling may be able to do so. There were differences in the roles and behaviors used by teachers and students when technology was being used and when it was not. There were differences between interactions in these classrooms and what is reported in the literature for tradi- tional classrooms.
A caveat: In no way is this report meant to imply that the graphing technology causes the reported differences. It is up to teachers to make use of available tools in ways that support desired student behaviors. As Magidson (1992) cautioned, the technology itself does “not dictate a sense-making environment, but merely facilitate[s] it. . . . [I]t is certainly possible to do rote work with GRAPHER or Logo or any other computer tool intended for exploration” (p. 362).
This study lends support to Hawkins and Sheingold’s (1986) prediction that:
The technology may support much more collaborative work on the part of students. Because of the increasing opportunities for paired and small group activities, changes in curriculum, and the capacity of the technology to support students’ learning of academic content, teachers may need to become less the providers of content-specific knowledge and more the facilitators of students’ acquisition of knowledge. Instruction might shift away from emphasis on information-giving to emphasis on helping students to find relevant information, learn how to solve problems, ask questions, think critically, and communicate ideas. (p. 50, italics added)
Future studies should incorporate a longitudinal analysis. This study used observations of teaching made at the end of the first year of using the graphing calculators and curriculum materials. A future study should include observations made throughout the first year and into subsequent years to determine whether any differences are a function of familiarity and experience.
An ethnographic study would provide valuable insights into the mechanisms of change in classrooms adopting a technology-based curriculum. Schofield, Eurich-Fulcer, and Britt’s (1994-a) study provides a model. An observer present in the classroom every day for several weeks could note the behaviors of students and teacher and not be limited to a predetermined set of behaviors. The findings from this study would assist the observer by providing a starting place, but the subtle behaviors described by teachers that were not included as separate descrip- tors on the SCAN instrument (venturing, challenging, directing, networking) could also be investigated.
The research reported here concentrates on the processes occurring in the
classrooms. At a future stage, the products of learning classrooms should also be
52 FARRELL
investigated. These products would include achievement on concepts and proce- dures and success in subsequent courses.
Romberg and Carpenter (1986) lamented that students see mathematics as a static discipline and that “such essential characteristics as abstracting, inventing, proving, and applying are often lost” (p. 85 1). Higher level thinking skills were observed in the project classrooms. Further study of students’ use of higher level thinking skills should be made.
REFERENCES
Alkalay, Marcy (1993). The use of computers for independent exploration in precalculus: Effect on
attitudes. Journal of Computers in Mathematics and Science Teaching, 12, 111-I 19.
Beeby, Terry, Burkhardt, Hugh, & Fraser, Rosemary (1979). Systematic classroom analysis notation.
Nottingham, England: Shell Centre for Mathematical Education.
Burkhardt, Hugh (1985). Curricula for active mathematics. In 1. Wirszup & R. Streit (Eds.), Devel-
opments in school mathematics education around the world. Proceedings of the UCSMP
Iniernational Conference on Mathematics Education (pp. 321-361). Reston, VA: National
Council of Teachers of Mathematics.
Cockcroft, Wilfred H. (Ed.). (1982). Mathematics counts. London: Her Majesty’s Stationery Office.
Cooney, Thomas J. (1980). Research on teaching and teacher education. In R. Shumway (Ed.),
Research in mathematics education (pp. 433-474). Reston, VA: National Council of Teachers
of Mathematics.
Demana, Franklin, & Waits, Bert K. (1988). The Ohio State University Calculator and Computer
Precalculus Project: The mathematics of tomorrow today! AMATYC Review IO(I), 46-55.
Demana, Franklin, & Waits, Bert K. (1989). Precalculus mathematics: A graphing approach. Read-
ing, MA: Addison-Wesley.
Dick, Thomas P., & Shaughnessy, J. Michael (1988). The influence of symbolic/graphic calculators
on the perceptions of students and teachers toward mathematics. In M.J. Behr, C.B. Lacam-
pagne, & M.M. Wheeler (Eds.), Proceedings of the Tenth Annual Meeting of PME-NA
(pp. 327-333). DeKalb, IL: Northern Illinois University.
Dunkin, Michael J., & Biddle, Bruce J. (1974). The study of teaching. New York: Holt, Rinehart,
and Winston.
Fey, James (1981). Mathematics teaching today: Perspectives from three national surveys. The
Mathematics Teacher, 72, 490-504.
Fraser, Rosemary, Burkhardt, Hugh, Coupland, Jon, Phillips, Richard, Pimm, David, & Ridgway,
Jim (1987). Learning activities and classroom roles with and without computers. The Journal
of Mathematical Behavior, 6, 305-338.
Friedman, Mordechai, & Stomper, Connie (1988). Effective college instruction in basic mathemat- ics. Journal for Research in Mathematics Education. 19. 169- 174.
Harvey, John (1990). The least of these: Graphing calculators and computer graphing tools. Un-
published manuscript, University of Wisconsin at Madison Hawkins, Jan, & Sheingold, Karen (1986). The beginning of a story: Computers and the organization
of learning in classrooms. In J.A. Culbertson & L.L. Cunningham (Eds.), Microcomputers
and education: Eight-y-fifth yearbook of the National Society for the Study of Education
(pp. 40-58). Chicago: The University of Chicago Press. Heid, M. Kathleen (1988, April). The learning and teaching of algebra in a computer-intensive
curriculum. Paper presented at the meeting of the National Council of Teachers of Mathemat-
ics, Chicago.
Kellogg, Theodore M., & Leonard, Carol (1987, April). Teacher behavior in whole class computer-
mediated instruction. Paper presented at the meeting of the National Association for Research
ROLES AND BEHAVIORS 53
in Science Teaching, Washington, DC. (ERIC Document Reproduction Service No. ED 284
723)
Kenelly, John W. (Ed.). (1989). The use of calculators in the standardized resting of mathematics.
New York: College Entrance Examination Board.
Lampert, Magdalene (1988). Teachers’ thinking about students’ thinking about geometry: The effects
of new teaching tools (Report No. 88- 1). Cambridge, MA: Educational Technology Center.
(ERIC Document Reproduction Service No. ED 294 724)
Leinhardt, Gaea (1989). Math lessons: A contrast of novice and expert competence. Journal for
Research in Mathematics Education, 20, 52-75.
Magidson, Susan (1992). From the laboratory to the classroom: A technology-intensive curriculum
for functions and graphs. The Journal of Mathematical Behavior, 11, 361-376.
National Council of Teachers of Mathematics. (1989). Curriculum and evaluation standards for
school mathematics. Reston, VA: Author.
Picciotto, Henri, & Wah, Anita (1993). A new algebra: Tools, themes, concepts. The Journal of
Mathematical Behavior, 12, 19-42.
Research Advisory Committee. (1988). NCIM curriculum and evaluation standards for school math-
ematics: Responses from the research community. Journal for Research in Mathematics
Education, 19, 338-344.
Romberg, Thomas A., & Carpenter, Thomas P. (1986). Research on teaching and learning mathe-
matics: Two disciplines of scientific inquiry. In M.C. Wittrock (Ed.), Handbook of research
on teaching (3rd ed., pp. 850-873). New York: Macmillan.
Ruthven, Kenneth (1993). Developing algebra with the supercalculator. Micromath, 9, 23-25.
Schocnfeld, Alan H. (1981). Episodes in executive decision-making. (ERIC Document Reproduction
Service No. ED 201 505)
Schofield, Janet W., Eurich-Fulcer, Rebecca, & Britt, Cheri L. (1994-a). Teachers, computer tutors,
and teaching: The artificailly intelligent tutor as an agent for classroom change. American
Educational Research Journal, 31(3), 579-607.
Schofield, Janet W., Eurich-Fulcer, Rebecca, & Britt, Cheri L. (1994-b). New theoretical insights
suggest new approaches to research: A rejoinder to Davis. American Educational Research
Journal, 32(3), 619-625.
Suydam, Marilyn N., & Osborne, Alan (1977). The status of pre-college science, mathematics, and
social science education: 1955-1975. Volume II: Mathematics education. Columbus, OH:
Center for Science and Mathematics Education.
Wiske, Martha S., Zodhiates, Philip, Wilson, Beth, Gordon, Myles, Harvey, Wayne, Krensky,
Lynne, Lord, Brian, Watt, Molly, & Williams, Katherine (1988). How technology affects
teaching. Cambridge, MA: Educational Technology Center.