role of phosphorus in synthesis of phosphated mesoporous tio2 photocatalytic materials by eisa...
TRANSCRIPT
www.elsevier.com/locate/apsusc
Available online at www.sciencedirect.com
4 (2008) 5191–5198
Applied Surface Science 25Role of phosphorus in synthesis of phosphated mesoporous TiO2
photocatalytic materials by EISA method
Xiaoxing Fan a,b, Tao Yu a,c, Ying Wang a,d, Jing Zheng a,b, Ling Gao d,Zhaosheng Li a,b,c, Jinhua Ye e, Zhigang Zou a,c,*
a Eco-materials and Renewable Energy Research Center (ERERC), Department of Physics, Nanjing University, Nanjing 210093,
People’s Republic of Chinab Department of Materials Science and Engineering, Nanjing University, Nanjing 210093, People’s Republic of Chinac National Laboratory of Solid State Microstructures, Nanjing University, Nanjing 210093, People’s Republic of China
d School of Chemistry and Chemical Engineering, Nanjing University, Nanjing 210093, People’s Republic of Chinae Photocatalytic Materials Center (PCMC), National Institute for Materials Science (NIMS), 1-2-1 Sengen, Tsukuba, Ibaraki 305-0047, Japan
Received 5 July 2007; received in revised form 23 January 2008; accepted 9 February 2008
Available online 20 February 2008
Abstract
The phosphated mesoporous TiO2 (PMT) were synthesized by using evaporation-induced self-assembly approach (EISA) with phosphorus
content from 1 to 15 mol%. The X-ray diffraction and N2 adsorption–desorption isothermal results reveal that the incorporating of phosphorus is of
benefit to improving the thermal stability and enhancing the surface area of mesoporous TiO2 by constraining the growth of anatase crystallite. XPS
confirms the phosphorus in the calcined PMT exists as amorphous titanium phosphate in a pentavalent-oxidation state (P5+) and embedded into the
nanocrystalline anatase TiO2. In photodegradation gas phase acetaldehyde, the photocatalytic activity of PMT samples is higher than that of pure
mesoporous TiO2 and P25. It is believed that the enhancing photocatalytic activity of phosphated mesoporous TiO2 is mainly caused by two factors
relative with the incorporating of phosphorus in framework.
# 2008 Elsevier B.V. All rights reserved.
Keywords: Phosphated mesoporous TiO2; Amorphous titanium phosphate; Photocatalysis; Acetaldehyde
1. Introduction
In the past three decades, much attention has been paid to the
metal-oxide photocatalysts due to their possible application in
degradation of environmental pollutants [1–4] and conversion
of solar energy [5,6]. Among all these photocatalysts, P25
(TiO2) is one of the most popular and promising presently
known material because of its high photocatalytic activity, non-
toxicity, long-term stability, and low price [7]. Recently,
mesoporous TiO2 has attracted much interest because it
performs better photocatalytic properties than P25 [8–12]. The
higher photocatalytic activity of mesoporous TiO2 can be
attributed to the mesoporous structure that offers more active
sites for catalytic reactions and improves diffusion of gaseous
* Corresponding author at: Eco-materials and Renewable Energy Research
Center (ERERC), Department of Physics, Nanjing University, Nanjing 210093,
People’s Republic of China. Fax: +86 25 8368 6632.
E-mail address: [email protected] (Z. Zou).
0169-4332/$ – see front matter # 2008 Elsevier B.V. All rights reserved.
doi:10.1016/j.apsusc.2008.02.038
molecules [12,13]. Unfortunately, it is difficult to synthesize a
mesoporous TiO2 possessing both large surface area and high
crystallite. Since during the process of removing surfactants,
solvent extraction or calcination at lower temperature usually
leads to an inactive amorphous TiO2 [14,15]. In order to remove
the surfactants completely and obtain high-crystalline meso-
porous TiO2, the higher calcination temperatures are always
adopted. But high temperature may cause the collapse of the
mesoporous framework and decrease the surface area. Much
effort, for example, incorporating phosphorus, has been
devoted to increase the surface area and improve the thermal
stability of the mesoporous TiO2 materials.
In 1998, Stone and Davies synthesized large surface area but
poor crystalline mesoporous TiO2 by using dodecyl phosphate
surfactant. The poor crystallinity is due to the remained phos-
phorus from surfactant that very strongly bond to the titania wall
[14]. The photocatalytic activity of this amorphous photocatalyst
in the photo-oxidation of 2-propanol to acetone was much lower
than that on P25, the low activity was attributed to the detrimental
X. Fan et al. / Applied Surface Science 254 (2008) 5191–51985192
effect of surface defects on amorphous photocatalyst. After-
wards, Yu et al. synthesized phosphated mesoporous titanium
dioxide by incorporating phosphorus from H3PO4 directly into
the framework of TiO2. They found that the incorporation of
phosphorus could stabilize the TiO2 framework of mesoporous
TiO2 when calcined at high temperature. In their study, the
phosphated mesoporous TiO2 exhibited a higher photocatalytic
activity than P25 [10]. Recently, Dekany et al. prepared a
phosphated mesoporous TiO2 with high surface area by varying
the P/Ti molar ratio between 1 and 10 mol% in a non-template
sol–gel system. An optimum phosphorus content corresponding
to high photocatalytic activity in phosphated mesoporous TiO2
was obtained [16]. Surprisingly, very little attention has been
paid to clarify the relationship of phosphorus content with the
surface area and give a conclusion on the mechanism of
enhancing photocatalytic activity of the phosphated mesoporous
TiO2. Thus, it is necessary to judge the delicate role of
phosphorus in mesoporous TiO2 and obtain further insight into
material synthesize science and photocatalysis.
In the current work, phosphated mesoporous TiO2 (PMT)
photocatalyst were synthesized by an evaporation-induced self-
assembly approach (EISA) which is generally adept to synthesize
mesoporous transition metal oxide [17,18]. To investigate the
effects of phosphorous content on the surface area of meso-
structure, the content of phosphorus was changed in a wide range
from 1 to 15 mol%. High phosphorus content PMT (100 mol% of
P/Ti molar ratio) was also synthesized for deducting the
mechanism of enhancement in photocatalytic activity of PMT.
The photocatalytic activities of these samples were valued on
acetaldehyde photodegradation under UV irradiation.
2. Experimental
2.1. Preparation of catalysts
The samples of PMT were prepared by an EISA process. In a
typical synthesis, 1 g of pluronic P123 (EO20PO70EO20,
M = 5800, Aldrich) was dissolved in 10 g of ethanol, then
0.01 mol of titanium chloride (TiCl4) was added with vigorous
stirring for 0.5 h. After then, 1 � 10�4, 5 � 10�4, 1 � 10�3 and
1.5 � 10�3 mol H3PO4 was added to above solution for
synthesizing 1 mol% (0.84 wt%, P2O5wt%), 5 mol%
(4.2 wt.%), 10 mol% (8.4 wt.%) and 15 mol% (12.7 wt.%)
phosphated samples. The resulting sol was gelled in an open
Petri dish at 40 8C oven for 4 days (static state). The as-made bulk
sample was then calcined at 400, 600 and 800 8C for 5 h in air
with the heating rate of 3 8C min�1 to remove the surfactant,
respectively. The calcined samples were labeled according to its
phosphorus content and calcination temperature. For example,
pure mesoporous TiO2 calcined at 400 8C was labeled as MT-0-
400. Similarly, the label of MT-1-400 indicates the sample
containing 1 mol% phosphorus and calcined at 400 8C.
2.2. Structure characterization
X-ray powder diffraction measurements were performed on
a Rigaku Ultima III X-ray diffractometer using Cu Ka radiation
(l = 1.54056 A). Nitrogen adsorption–desorption isotherms
were collected on a Micromeritics Tristar-3000 surface area
and porosity analyzer at 77 K after the samples had been
degassed in the flows of N2 at 180 8C for 5 h. The Brunauer–
Emmett–Teller (BET) surface area was calculated from the
linear part of the BET plot (P/P0 = 0.1–0.25). The pore size
distribution plots were obtained by using the Barret–Joyner–
Halenda (BJH) model. Images of high-resolution transmission
electron microscope (HRTEM) were obtained by employing a
FEI Tecnai G2 20 S-TWIN high-resolution transmission
electron microscope with a 200 kV accelerating voltage. The
samples for TEM were prepared by dispersing the final powders
in ethanol and the dispersion was dropped on carbon-copper
grids. The X-ray photoelectron spectroscopy (XPS) measure-
ments were carried out on an ESCALAB Mark II (VG
Company, UK); all binding energies were referenced to the C1s
peak at 284.6 eV of the surface adventitious carbon. The
infrared spectroscopy spectra were obtained on Brucker Vector
22. The UV–vis diffuse reflectance spectrum was recorded with
a UV–vis spectrometer (UV-2550, Shimadzu) at room
temperature and transformed to the absorption spectrum
according to the Kubelka–Munk relationship. The absorption
band edge was determined by extrapolating the linear part of
the plot to wavelength axis (Abs. = 0).
2.3. Photocatalytic activities evaluation
The photocatalytic activities of the calcined samples were
performed by oxidizing acetaldehyde in air using a gastight
system with a quartz window. In a typical process, 0.1 g of
powder photocatalysts with adding several drops of water was
smeared on a 4-cm2 glass groove and dried in oven. The
purpose of adding little water is to forming a uniform coating
adhering on glass substrate. The glass with powder photo-
catalyst was then put into a 224-ml reactor, filled with air to one
atmospheric pressure. Then, acetaldehyde (10 ml of 40%
CH3CHO aqueous solution) was injected into the reactor to
generate a high-concentration acetaldehyde gas. The light
source for the catalytic reaction was utilized a 300-W Xe arc
lamp. In addition, a gas pump was used for accelerating gas
diffusion. Carbon dioxide was detected by a gas chromato-
graphy (CO2, GC-8A with TCD detector, Shimadzu).
3. Results and discussion
3.1. Powder X-ray diffraction analysis
Fig. 1 shows the wide-angle XRD patterns of PMT and MT
calcined at different temperature. When calcined at 800 8C, two
peaks at 22.558 (d = 3.9 A) and 27.658 (d = 3.2 A) appeared in
spectrum of MT-15-800 correspond to the (600) and (721) XRD
diffraction peak of crystalline TiP2O7 (JCPDS, No. 38-1468).
The intensity of the two peaks was weak in XRD pattern of MT-
10-800 (see Supplementary data). The appearance of TiP2O7
peaks in MT-10-800 and MT-15-800 indicates that the
phosphorus still remained in PMT samples and did not
evaporate even at 800 8C calcination. At low calcination

Fig. 1. Wide-angle XRD patterns of pure mesoporous TiO2 and PMT of
containing 1 mol% phosphorus calcined at 400, 600 and 800 8C and MT-15-
800.Fig. 2. N2 adsorption–desorption isotherms and Barret–Joyner–Halenda (BJH)
pore size (inset) of pure mesoporus TiO2 and 1 mol% phosphorus content of
PMT.
X. Fan et al. / Applied Surface Science 254 (2008) 5191–5198 5193
temperature of 400 and 600 8C, only pure anatase phases
(JCPDS, No. 21-1272) and no obvious XRD peaks corre-
sponded to titanium phosphate are observed for PMT samples.
The absence of TiP2O7 peaks in sample calcined at 400 and
600 8C may indicate the phosphorus exists as amorphous
phosphate. Additionally, the rutile (2u = 27.458) phase emerged
in MT, but absent in all spectra of PMT samples [19]. Table 1
summarizes the crystalline size of the samples calcined at
different temperatures, which is calculated from the Scherrer
equation by using the (1 0 1) XRD peaks of anatase phase. At
calcination temperature of 400 8C, the crystallite size of MT-0-
400 is 12.4 nm. However, those of the PMT samples are not
larger than 7.9 nm. All wide-angle XRD patterns show that the
size of crystallite becomes larger with the increase of the
calcination temperature. The results of XRD characterization
obviously clarify that the function of phosphorus in framework
is not only constraining the form of rutile phase but also
inhibiting the growth of anatase TiO2 crystal. It is well known
that the growth of nanocrystal usually leads to the collapse of
Table 1
Summary of the physicochemical Properties of samples calcined at different temp
Samples 400 600
Surface area
(m2 g�1)
Pore
size (nm)
Crystalline
size (A)
Surface
area (m2 g�1)
MT-0- 111 8.4 124 (4) 52
MT-1- 171 6.8 79 (1) 106
MT-5- 206 6.3 72 (2) 134
MT-10- 217 6.5 75 (2) 142
MT-15- 208 5.1 68 (4) 125
mesoporous framework, which broadens the diameter distribu-
tion of channels [20]. In other words, phosphorus in framework
can increase the thermal stability and surface area by inhibiting
the growth of grains and protect the mesoporous structure from
collapsing.
3.2. Nitrogen physisorption
The pore size distributions and N2 adsorption–desorption
isotherms of PMT calcined at different temperatures are shown
in Fig. 2. All the isotherms are type IV with a clear
characteristic hysteresis loop of mesoporous materials. The
BET surface areas of samples calcined at different temperatures
are summarized in Table 1. At the same calcination temperature
of 400 8C, the surface area of MT-1-400, MT-5-400, MT-10-
400, MT-15-400 is 171, 206, 217 and 208 m2 g�1, respectively,
which is much larger than that of MT-0-400 (111 m2 g�1). The
eratures
800
Pore
size (nm)
Crystalline
size (A)
Surface
area (m2 g�1)
Pore
size (nm)
Crystalline
size (A)
8.8 224 (7) 7 21.6 592 (14)
8.7 117 (2) 41 18.5 221 (3)
7.2 88 (2) 50 15.9 172 (2)
6.8 86 (2) 34 19.0 177 (2)
7.0 90 (3) 22 19.0 192 (2)
X. Fan et al. / Applied Surface Science 254 (2008) 5191–51985194
surface area of MT-1-400 increases by 54% through
incorporated 1 mol% P, and increases further by 20%
incorporated 5 mol% P, and do not increase further when the
content of P is over 5 mol%. At higher calcined temperature of
600 and 800 8C, the PMT samples also characterized a larger
surface area than that of mesoporous TiO2. Based on the results
of N2 adsorption isothermal, the relation between the BET
surface areas and phosphate content could be clarified. Take
example for the PMT samples calcined at 400 8C, the surface
area increased monotonously with phosphate content (phos-
phorus content<5 mol%), then slowly increased when the ratio
of phosphor/titanium over 5 mol%. The large surface area of
PMT samples were attributed to their small crystalline size
caused by phosphorus incorporation. The surface area of MT-
15-400 is slight smaller than MT-10-400 is probably due to the
remaining carbon caused by more phosphorus incorporation.
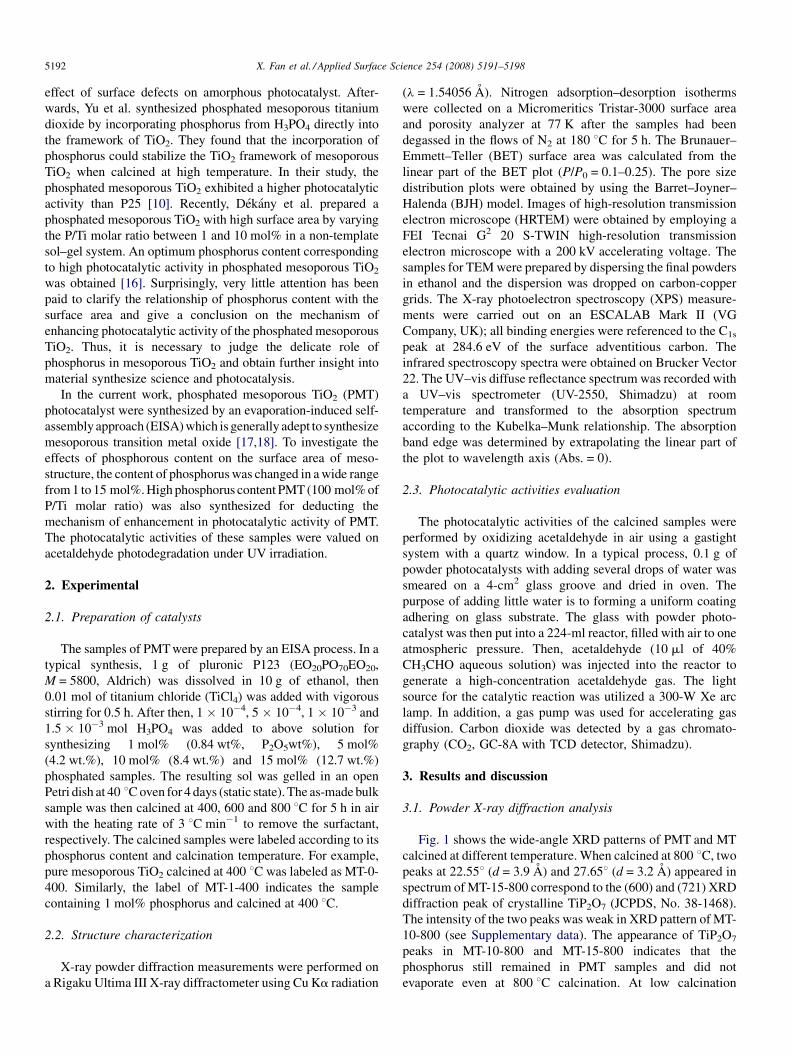
3.3. TEM and HRTEM characterization
TEM and HRTEM observation was performed. In the TEM
images (Fig. 3), a wormhole-like mesostructure without long-
range order was observed in MT-0-400, MT-1-400, MT-5-400
and MT-1-600. In contrast with MT-0-400, the sample of MT-1-
400 and MT-5-400 show a thinner pore wall which results in a
high surface area. Because of the growth of grain, the pore wall
of MT-1-600 is thicker than MT-1-400, indicating that a certain
extent collapses of mesostructure at high calcination tempera-
Fig. 3. TEM images of MT-0-400 (a), MT-1-
ture. As shown in HRTEM images (Fig. 4), the nanocrystal
anatase TiO2 with a clear lattice (d = 3.5 A) connect with each
other to form crystalline framework walls of the mesopore. It
was estimated that the size of nanocrystals of MT-0-400, MT-1-
400, MT-5-400 and MT-1-600 is approximately 13, 8, 8 and
14 nm as marketed in Fig. 4, respectively. This is in agreement
with the result of XRD. Additionally, no crystalline phosphate
lattice was observed on these PMT samples and only anatase
lattice was clear shown in HRTEM, it is speculated that the
amorphous titanium phosphate should embedded in the TiO2
crystalline grains and acted as a diffusion barrier to inhibit
crystal growth of TiO2 during calcinations.
3.4. Infrared spectroscopy (FT-IR) and XPS performance
The FT-IR spectra of MT-400, MT-1-400, MT-5-400 and
MT-10-400 are shown in Fig. 5. The bond at 1600 cm�1
appeared in the spectra of all samples is corresponded to O–H
stretching vibration due to the surface-absorbed water and
hydroxyl groups [21,22], while the bond at 1100 cm�1 is
assigned to Ti–O–P vibrations that corresponds to the
phosphate in the frame of TiO2 [9,23,24]. The intensity of
absorption peak (1100 cm�1) turns stronger may be result form
the increasing concentration of phosphate content in mesos-
tructure. As expected, the bond at 1100 cm�1 was absent in
pure mesoporous TiO2. It was also noticed that the
transmittance of all curves were gradually weaken with the
400 (b), MT-5-400 (c) and MT-1-600 (d).

Fig. 4. HRTEM images of MT-0-400 (a), MT-1-400 (b), MT-5-400 (c) and MT-1-600 (d).
X. Fan et al. / Applied Surface Science 254 (2008) 5191–5198 5195
increasing phosphorus content in PMT samples when
wavenumber was lower than 900 cm�1 corresponding to Ti–
O–Ti (ca. 850 cm�1). This can be explained that the relative
content of pure TiO2 is decreased result from the increasing
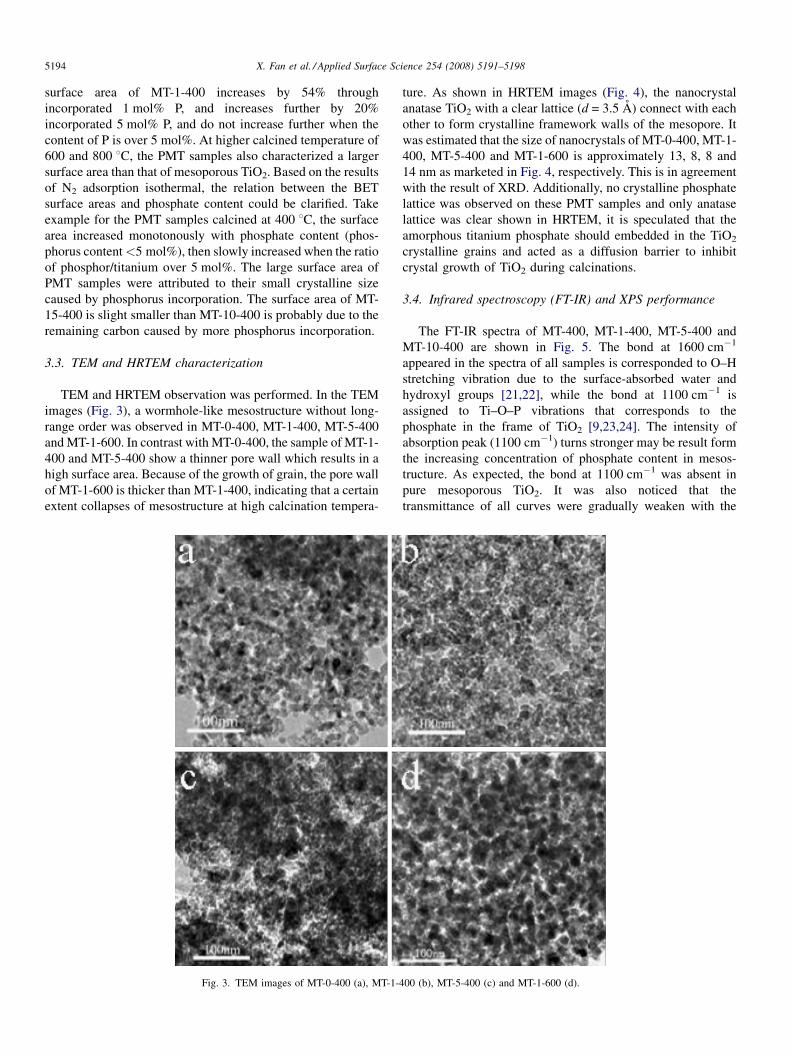
concentration of amorphous phosphated titania. Fig. 6 shows
the full XPS spectra of MT-10-400, which indicates the PMT
sample contains only Ti, O, C and P. The high-resolution XPS
spectra of Ti2p show that the peak of Ti2p (458.05 eV) in MT
samples shifts toward higher energy (458.15 eV) in PMT,
Fig. 5. FT-IR spectrum of MT-0-400 (a), MT-1-400 (b), MT-5-400 (c) and MT-
10-400 (d).
which indicates that the local chemical environment of Ti has
been significantly influenced by phosphorus incorporation in
amorphous titanium phosphate. While the binding energy of P2p
peak centered at 133 eV suggests that the phosphorus in calcined
PMT exists in a pentavalent-oxidation state (P5+). Since H3PO4
was used as the starting material to synthesize phosphated TiO2.
There are three possible chemical states of amorphous titanium
phosphate, including Ti3(PO4)4, Ti(HPO4)2 and Ti(H2PO4)4. The
high-resolution XPS spectrum of P2p reveals the derivation of
three peaks at 132.4, 133.4, and 134.7 eV, which correspond
to the binding energies of PO43�, HPO4
2�, and H2PO4�,
respectively. According to the area of three peaks, the phosphorus
atomic ratio of PO43�, HPO4
2�, and H2PO4� is calculated to be
12:76:12, which implies that the main phosphoric type presented
in the phosphated mesoporous TiO2 is HPO42� [10]. On the basis
of the results of XRD, phosphorus exists as amorphous titanium
phosphate that embedded in the TiO2 crystalline grain at low
calcination temperature (<600 8C), while the FT-IR spectra
support a Ti–O–P structure in the titanium phosphate samples.
From the information given by XPS and IR spectra, It is
speculated that amorphous titanium phosphate is mainly
composed of Ti(HPO4)2.
3.5. Photocatalytic activity studies
Fig. 7 shows the UV–vis absorption spectra of phosphated
mesoporous TiO2 calcined at 400 8C. The absorption band
edge of phosphorus free sample MT-0-400 is 379 nm, while
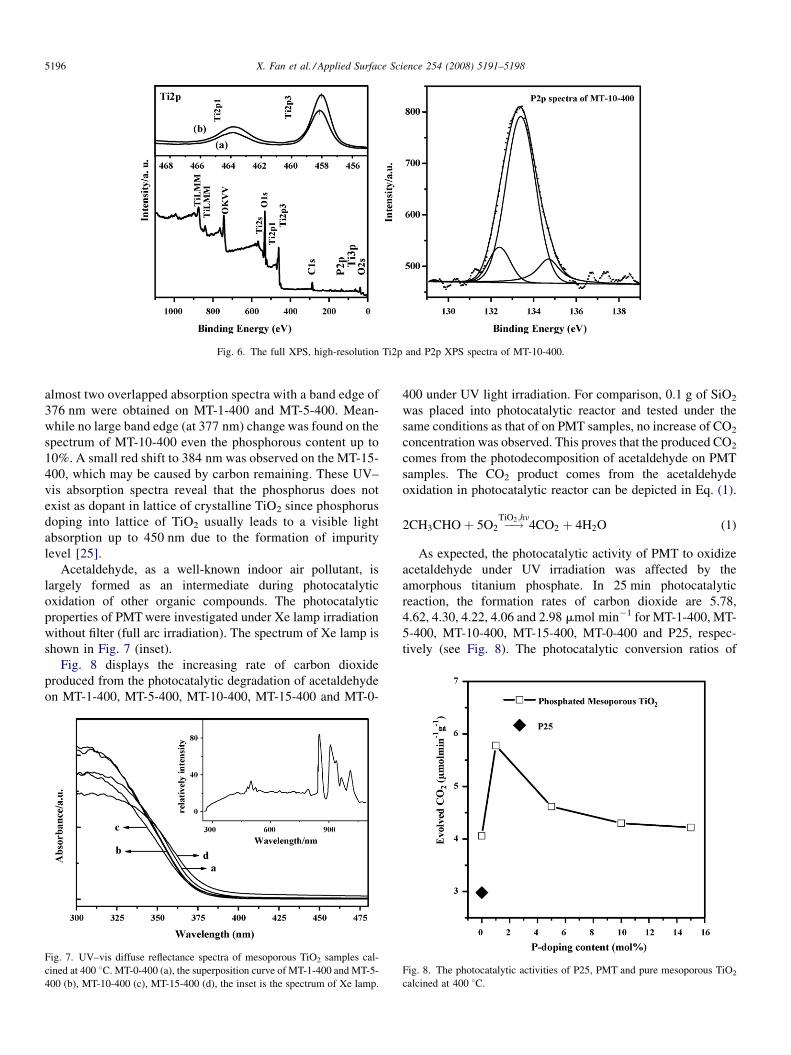
Fig. 6. The full XPS, high-resolution Ti2p and P2p XPS spectra of MT-10-400.
X. Fan et al. / Applied Surface Science 254 (2008) 5191–51985196
almost two overlapped absorption spectra with a band edge of
376 nm were obtained on MT-1-400 and MT-5-400. Mean-
while no large band edge (at 377 nm) change was found on the
spectrum of MT-10-400 even the phosphorous content up to
10%. A small red shift to 384 nm was observed on the MT-15-
400, which may be caused by carbon remaining. These UV–
vis absorption spectra reveal that the phosphorus does not
exist as dopant in lattice of crystalline TiO2 since phosphorus
doping into lattice of TiO2 usually leads to a visible light
absorption up to 450 nm due to the formation of impurity
level [25].
Acetaldehyde, as a well-known indoor air pollutant, is
largely formed as an intermediate during photocatalytic
oxidation of other organic compounds. The photocatalytic
properties of PMT were investigated under Xe lamp irradiation
without filter (full arc irradiation). The spectrum of Xe lamp is
shown in Fig. 7 (inset).
Fig. 8 displays the increasing rate of carbon dioxide
produced from the photocatalytic degradation of acetaldehyde
on MT-1-400, MT-5-400, MT-10-400, MT-15-400 and MT-0-
Fig. 7. UV–vis diffuse reflectance spectra of mesoporous TiO2 samples cal-
cined at 400 8C. MT-0-400 (a), the superposition curve of MT-1-400 and MT-5-
400 (b), MT-10-400 (c), MT-15-400 (d), the inset is the spectrum of Xe lamp.
400 under UV light irradiation. For comparison, 0.1 g of SiO2
was placed into photocatalytic reactor and tested under the
same conditions as that of on PMT samples, no increase of CO2
concentration was observed. This proves that the produced CO2
comes from the photodecomposition of acetaldehyde on PMT
samples. The CO2 product comes from the acetaldehyde
oxidation in photocatalytic reactor can be depicted in Eq. (1).
2CH3CHOþ 5O2 �!TiO2;hn
4CO2 þ 4H2O (1)
As expected, the photocatalytic activity of PMT to oxidize
acetaldehyde under UV irradiation was affected by the
amorphous titanium phosphate. In 25 min photocatalytic
reaction, the formation rates of carbon dioxide are 5.78,
4.62, 4.30, 4.22, 4.06 and 2.98 mmol min�1 for MT-1-400, MT-
5-400, MT-10-400, MT-15-400, MT-0-400 and P25, respec-
tively (see Fig. 8). The photocatalytic conversion ratios of
Fig. 8. The photocatalytic activities of P25, PMT and pure mesoporous TiO2
calcined at 400 8C.

Scheme 1. Characterization of phosphated mesoporous titanium by using P123
surfactant H3PO4 as phosphorus source.
X. Fan et al. / Applied Surface Science 254 (2008) 5191–5198 5197
acetaldehyde to carbon dioxide were 82, 66, 61, 60, 58 and 42%
for MT-1-400, MT-5-400, MT-10-400, MT-15-400, MT-0-400
and P25, respectively. The activities of PMT are gradually
decreasing with the increase of titanium phosphate content in
mesoporous TiO2. The photocatalytic activity of MT-1-400 is
40% higher than that of MT-0-400 and 90% higher than that of
P25. In the same photocatalytic reaction condition, the
photocatalytic activity of amorphous titanium phosphate is
only 0.16 mmol min�1 even though it possesses a higher BET
surface area than 200 m2/g. It is noticed that the affection of
incorporating phosphorus into mesoporous TiO2 in our PMT
samples is different from that reported by Stone and Davis [14].
Their investigation revealed that the photocatalytic activity of
PMT synthesized by using dodecyl phosphate surfactant as a
template was much lower than that of P25. While similarly to
our results, an improve affection of incorporating phosphorus
on the photocatalytic activity of PMT synthesized by directly
using H3PO4 as phosphorus source was reported [10,16]. These
contradictory conclusions imply that phosphorus acts as a
complex role in synthesis process. Different phosphorous
precursor will influence the surface properties and crystalline of
the resulted photocatalysts. As well known, photocatalytic
reaction is carried out on the surface of photocatalyst. The
larger the surface area of the photocatalyst is, the more reaction
sites are, which is in favor of the activity. Crystallinity is
another important factor to influence the ability because the
crystal defects are always recombination centers of photo-
generated electrons and holes. From the synthesis process
reported by Stone and Davis, it is speculated that the surface of
PMT synthesized by using phosphate surfactant was mainly
coated with amorphous titanium phosphate. Since the forma-
tion of mesoporous materials was directed by surfactants, the
anionic titaniums were deposited around the positively charged
surfactant templated to form inorganic–organic mesostructures
via electrostatic interactions. When using phosphate surfac-
tants, after calcination, the phosphorus will react with the
titanium on the surface of pore wall and form amorphous
titanium phosphate. While when directly incorporating H3PO4
and using non-phosphate surfactant such as P123, a different
structure was obtained. In this synthesis condition, the
phosphorus was dispersed in the framework of mesoporous
TiO2 and exists as amorphous titanium phosphate, which
mainly embedded in the TiO2 crystalline grains.
It was known that, amorphous materials, as well as amorphous
titanium phosphate, generally contain many imperfections, i.e.,
impurities, dangling bonds, or microvoids, which lead to
electronic states in the band gap, and they act as a recombination
center of e� and h+ [15]. Therefore, the existence of amorphous
titanium phosphate is disadvantage to the photocatalytic activity
by decreasing the quantity of e� and h+ for photocatalytic
reaction. Basis on the analysis above, it is concluded that the low
photocatalytic activity of PMT synthesized by using phosphate
surfactant may be resulted from its surface that was full coated by
amorphous titanium phosphate which inhibited the inside e�
and h+ transporting to surface, thus lead to performing low
photocatalytic activity. Additionally, the low photocatalytic
activity is also partly caused by the amorphous titanium
phosphate which cannot provide photogenerated e� and h+. On
the contrary, the PMT samples by directly using H3PO4
performed high photocatalytic activity. This is due to the
different position of amorphous phosphate. As illuminated in
Scheme 1, the amorphous phosphate was embedded into the
nanocrystalline anatase TiO2 but not on the surface completely.
Thus, the inside e� and h+ can easily transport to surface through
crystalline TiO2.
Contrasted with pure mesoporous TiO2, as shown in Fig. 7,
there is no difference in photoabsorption for mesoporous TiO2
and phosphated mesoporous TiO2 calcined at 400 8C. The
photocatalytic activity of PMT containing 1 mol% phosphorus is
about two times higher than that of P25 in photodegradation gas
phase acetaldehyde. The higher activity can be attributed to the
balance of two factors. One is the large surface area caused by
incorporating phosphorus in framework, the large surface area
provided more active sites for catalysis and enhanced the
photocatalytic activity, thus, the phosphorus play a positive role.
The other is the concentration of amorphous titanium phosphate
in framework of mesostructure. The amorphous titanium
phosphate is a poor photocatalyst itself; it does not provide
much e� and h+ when irradiated by ultraviolet radiation. In
addition, the amorphous titanium phosphate acts as a recombi-
nation centers by trapping photogenerated electrons e� or holes
h+ and inhibits the inside e� and h+ transport to surface.
Therefore, incorporating phosphorus will be of benefit to
improving photocatalytic activity of mesoporous when the two
the factors balanced at optimum phosphorus content. On the
basis of our photocatalysis performs, the content of incorporated
1 mol% P may be very close to the optimum.
4. Conclusions
Phosphated mesoporous TiO2 materials have been synthe-
sized by using evaporation-induced self-assembly method. The

X. Fan et al. / Applied Surface Science 254 (2008) 5191–51985198
incorporation of phosphorus in mesoporous TiO2 constrains the
growth of crystals of PMT and improves thermal stability. The
surface areas increased remarkably with the increase of phos-
phorus content when phosphorus content was less than 5 mol%.
Over 10 mol% phosphorus incorporating, the function is not
obviously for enhancing surface area and thermal stability of
PMT. The increasing surface area of PMT is caused by the incor-
porated phosphorus inhibiting the anatase growth. The phos-
phorus species exist as amorphous titanium phosphate which
embed in anatase nanocrystal and is mainly composed of
Ti(HPO4)2.
The incorporating phosphorus exists as amorphous titanium
play two roles. One is enhancing the surface area, which is
beneficial for photocatalytic activity. The other is forming
recombination center of e� and h+ and decreasing photocatalytic
activity. The optimum phosphorus content of 1 mol% P/Ti mole
ratio is the balance of two factors for photocatalytic activity.
Acknowledgements
Financial support from the National Natural Science
Foundation of China (Nos. 20603017 and 20528302), the
National High Technology Research and Development Program
of China (No. 2006AA05Z113), the Science and Technology
Research Program of the Ministry of Education (MOE) of China
(No. 307012) and the National Basic Research Program of China
(973 Program, 2007CB613301, 2007CB613305) is gratefully
acknowledged. This work was also supported by the Scientific
Research Foundation of Graduate School of Nanjing University
(2006CL05). Prof. Z.G. Zou and T. Yu would like to thank the
Jiangsu Provincial Talent Scholars Program.
Appendix A. Supplementary data
Supplementary data associated with this article can be found,
in the online version, at doi:10.1016/j.apsusc.2008.02.038.
References
[1] A. Fujishima, K. Honda, Nature 238 (1972) 37–38.
[2] A. Mills, S.L. Hunte, J. Photochem. Photobiol. A 108 (1997) 1–35.
[3] D.A. Tryk, A. Fujishima, K. Honda, Electrochim. Acta 45 (2000) 2363–
2376.
[4] M.R. Hoffmann, S.T. Martin, W. Choi, D.W. Bahnemann, Chem. Rev. 95
(1995) 69–96.
[5] Z. Zou, J. Ye, K. Sayama, H. Arakawa, Nature 414 (2001) 625–627.
[6] A. Hagfeldt, M. Gratzel, Acc. Chem. Res. 33 (2000) 269–277.
[7] T. Kawahara, Y. Konishi, H. Tada, N. Tohge, J. Nishii, S. Ito, Angew.
Chem. Int. Ed. 41 (2002) 2811–2813.
[8] J.C. Yu, L. Zhang, Z. Zheng, J. Zhao, Chem. Mater. 15 (2003) 2280–
2286.
[9] J.C. Yu, L. Zhang, J. Yu, Chem. Mater. 14 (2002) 4647–4653.
[10] L. Saadoun, J.A. Ayllon, J. Jimenez-Becerril, J. Peral, X. Domenech, R.
Rodrıguez-Clemente, Mater. Res. Bull. 35 (2000) 193–202.
[11] X. Wang, J.C. Yu, C. Ho, Y. Hou, X. Fu, Langmuir 21 (2005) 2552–
2559.
[12] D.M. Antonelli, J.Y. Ying, Angew. Chem. Int. Ed. Engl. 34 (1995) 2014–
2017.
[13] J.Y. Ying, AIChE J. 46 (2000) 1902–1906.
[14] V.F. Stone Jr., R.J. Davis, Chem. Mater. 10 (1998) 1468–1474.
[15] B. Ohtani, Y. Ogawa, S.I. Nishimoto, J. Phys. Chem. B 101 (1997) 3746–
3750.
[16] L. Korosi, I. Dekany, Colloids Surf. A: Physicochem. Eng. Aspects 280
(2006) 146–154.
[17] G.J. de, A.A. Soler-Illia, A. Louis, C. Sanchez, Chem. Mater. 14 (2002)
750–759.
[18] P. Yang, D. Zhao, D.I. Margolese, B.F. Chmelka, G.D. Stucky, Nature 396
(1998) 152–155.
[19] E. Ortiz-Islas, R. Gomez, T. Lopez, J. Navarrete, D.H. Aguilar, P.
Quintana, Appl. Surf. Sci. 252 (2005) 807–812.
[20] B. Smarsly, D. Grosso, T. Brezesinski, N. Pinna, C. Boissiere, M.
Antonietti, C. Sanchez, Chem. Mater. 16 (2004) 2948–2952.
[21] M.P. Kapoor, S. Inagaki, H. Yoshida, J. Phys. Chem. B 109 (2005) 9231–
9238.
[22] Z. Ding, G.Q. Lu, P.F. Greenfield, J. Phys. Chem. B 104 (2000) 4815–
4820.
[23] A. Bhaumik, S. Inagaki, J. Am. Chem. Soc. 123 (2001) 691–696.
[24] Q. Wang, L. Zhong, J. Sun, J. Shen, Chem. Mater. 17 (2005) 3563–3569.
[25] Q. Shi, D. Yang, Z. Jiang, J. Li, J. Mol. Catal. B: Enzyme 43 (2006) 44–48.