role of nanoparticle dispersion and filler-matrix interface on the matrix dominated failure of rigid...
TRANSCRIPT

at SciVerse ScienceDirect
Polymer 54 (2013) 2565e2576
Contents lists available
Polymer
journal homepage: www.elsevier .com/locate/polymer
Role of nanoparticle dispersion and filler-matrix interface on the matrixdominated failure of rigid C60-PE nanocomposites: A molecular dynamicssimulation study
Sheikh F. Ferdous, Md. Farzad Sarker, Ashfaq Adnan*
Department of Mechanical and Aerospace Engineering, University of Texas at Arlington, Arlington, TX 76019, USA
a r t i c l e i n f o
Article history:Received 20 December 2012Received in revised form5 March 2013Accepted 9 March 2013Available online 21 March 2013
Keywords:Particle-reinforced compositesPolymer nanocompositesNanostructures
* Corresponding author. Tel.: þ1 817 272 2006.E-mail addresses: [email protected], ashfaqadnan@
0032-3861/$ e see front matter � 2013 Elsevier Ltd.http://dx.doi.org/10.1016/j.polymer.2013.03.014
a b s t r a c t
In this study, using classical molecular dynamics simulation approach, we have investigated the effectsof nanoparticle dispersion and the intensity of filler and matrix interface attractions on the mechanicalproperties of buckyball reinforced polyethylene nanocomposites. The dispersion state of nanoparticleswas studied by modeling nanoparticles either in a homogenously distributed form or in a clusteredform. The quality of polymerematrix interface was varied by altering the van der Waals interactionenergy potential between the polymer and nanoparticle. Mechanical properties of the neat and nano-composite systems were then evaluated using simulated hydrostatic tension tests. We have shown thatthe quality of nanoparticle dispersion can modify matrix morphology differently, which ultimately canalter the deformation and failure of the matrix material. We have demonstrated that the quality ofnanoparticleepolymer interface affects the matrix morphology and the mechanical properties ofnanocomposites. We have also shown that the enhancement in mechanical properties of nano-composites depend solely on the extent of increase in overall matrix density, regardless the condition ofthe interface.
� 2013 Elsevier Ltd. All rights reserved.
1. Introduction
Nanoparticle (NP) reinforced polymer composites or polymernanocomposites (PNC) have received enormous attention in bothscientific and industrial communities primarily because of theirsynergistically enhanced mechanical, physical, chemical, electrical,optical and barrier properties [1e5]. It appears from experimentalstudies [6e13] that improvements in mechanical strength andstiffness properties of nanocomposites depend on a set of param-eters including nanoparticle size, shape, volume fraction, degree ofdispersion, characteristics of polymer matrix, characteristics ofnanoparticles, characteristic of polymer-filler inter-phase and in-teractions between filler and matrix at their interface. By carefullymanipulating these controlling parameters, one, in principle,should be able to tailor the mechanical properties of nano-composite to the specific design needs. Unfortunately, it is still agreat challenge, if not impossible, to acquire complete control inprocess-parameter specific control of nanocomposite properties.
gmail.com (A. Adnan).
All rights reserved.
To obtain some insight on this issue, several researchers haveattempted to perform molecular level computations to understandthe parameter specific mechanics of nanocomposites [14e22].Adnan et al. [14] studied the influence of filler size on the elasticproperties of buckyball reinforced polyethylene composites usingmolecular dynamics (MD) simulations and found that the elasticproperties of nanocomposites are significantly enhanced with thereduction of buckyball size. Note that the influence of nano-scalefiller size on the elastic properties of nanocomposites is not typi-cally observed in conventional composite materials [23]. Indepen-dently conducted studies also confirm such effect [24e26]. The roleof nanoparticle shapes, if expressed in terms of aspect ratio, can beexplained from mechanics of composites which suggests thatproperties of composites will be enhanced if aspect ratio is higher[23]. Studies by Toth et al. [27] also suggest that shape effects arepresent only at the nanoscale.
While it is commonly believed that good nanoparticle dispersionis the key to maximize nanoparticleepolymer interface interaction,which, in turn, enhances the overall mechanical properties of nano-composites [28], it is still being debated whether good nanoparticledispersion is sufficient to ensure improved mechanical properties ofnanocomposites. It is often argued that a good dispersion during the
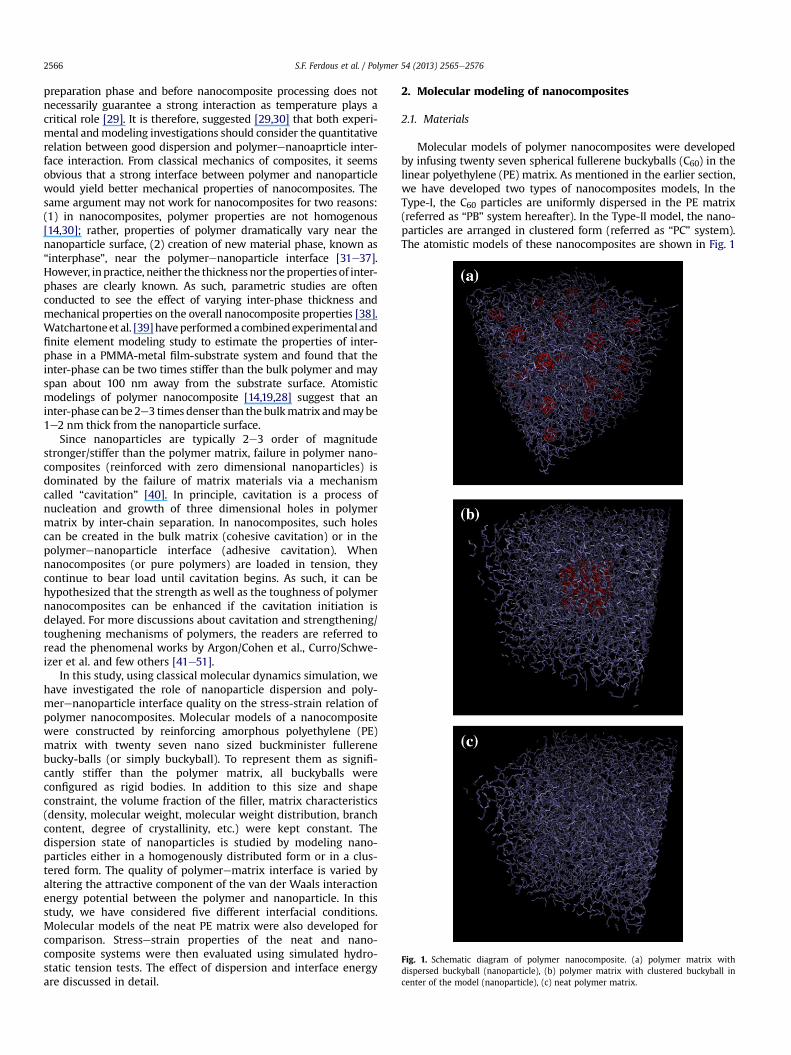
Fig. 1. Schematic diagram of polymer nanocomposite. (a) polymer matrix withdispersed buckyball (nanoparticle), (b) polymer matrix with clustered buckyball incenter of the model (nanoparticle), (c) neat polymer matrix.
S.F. Ferdous et al. / Polymer 54 (2013) 2565e25762566
preparation phase and before nanocomposite processing does notnecessarily guarantee a strong interaction as temperature plays acritical role [29]. It is therefore, suggested [29,30] that both experi-mental andmodeling investigations should consider the quantitativerelation between good dispersion and polymerenanoaprticle inter-face interaction. From classical mechanics of composites, it seemsobvious that a strong interface between polymer and nanoparticlewould yield better mechanical properties of nanocomposites. Thesame argument may not work for nanocomposites for two reasons:(1) in nanocomposites, polymer properties are not homogenous[14,30]; rather, properties of polymer dramatically vary near thenanoparticle surface, (2) creation of new material phase, known as“interphase”, near the polymerenanoparticle interface [31e37].However, inpractice, neither the thickness nor the properties of inter-phases are clearly known. As such, parametric studies are oftenconducted to see the effect of varying inter-phase thickness andmechanical properties on the overall nanocomposite properties [38].Watchartoneet al. [39]haveperformedacombinedexperimental andfinite element modeling study to estimate the properties of inter-phase in a PMMA-metal film-substrate system and found that theinter-phase can be two times stiffer than the bulk polymer and mayspan about 100 nm away from the substrate surface. Atomisticmodelings of polymer nanocomposite [14,19,28] suggest that aninter-phase can be2e3 times denser than thebulkmatrix andmaybe1e2 nm thick from the nanoparticle surface.
Since nanoparticles are typically 2e3 order of magnitudestronger/stiffer than the polymer matrix, failure in polymer nano-composites (reinforced with zero dimensional nanoparticles) isdominated by the failure of matrix materials via a mechanismcalled “cavitation” [40]. In principle, cavitation is a process ofnucleation and growth of three dimensional holes in polymermatrix by inter-chain separation. In nanocomposites, such holescan be created in the bulk matrix (cohesive cavitation) or in thepolymerenanoparticle interface (adhesive cavitation). Whennanocomposites (or pure polymers) are loaded in tension, theycontinue to bear load until cavitation begins. As such, it can behypothesized that the strength as well as the toughness of polymernanocomposites can be enhanced if the cavitation initiation isdelayed. For more discussions about cavitation and strengthening/toughening mechanisms of polymers, the readers are referred toread the phenomenal works by Argon/Cohen et al., Curro/Schwe-izer et al. and few others [41e51].
In this study, using classical molecular dynamics simulation, wehave investigated the role of nanoparticle dispersion and poly-merenanoparticle interface quality on the stress-strain relation ofpolymer nanocomposites. Molecular models of a nanocompositewere constructed by reinforcing amorphous polyethylene (PE)matrix with twenty seven nano sized buckminister fullerenebucky-balls (or simply buckyball). To represent them as signifi-cantly stiffer than the polymer matrix, all buckyballs wereconfigured as rigid bodies. In addition to this size and shapeconstraint, the volume fraction of the filler, matrix characteristics(density, molecular weight, molecular weight distribution, branchcontent, degree of crystallinity, etc.) were kept constant. Thedispersion state of nanoparticles is studied by modeling nano-particles either in a homogenously distributed form or in a clus-tered form. The quality of polymerematrix interface is varied byaltering the attractive component of the van der Waals interactionenergy potential between the polymer and nanoparticle. In thisstudy, we have considered five different interfacial conditions.Molecular models of the neat PE matrix were also developed forcomparison. Stressestrain properties of the neat and nano-composite systems were then evaluated using simulated hydro-static tension tests. The effect of dispersion and interface energyare discussed in detail.
2. Molecular modeling of nanocomposites
2.1. Materials
Molecular models of polymer nanocomposites were developedby infusing twenty seven spherical fullerene buckyballs (C60) in thelinear polyethylene (PE) matrix. As mentioned in the earlier section,we have developed two types of nanocomposites models, In theType-I, the C60 particles are uniformly dispersed in the PE matrix(referred as “PB” system hereafter). In the Type-II model, the nano-particles are arranged in clustered form (referred as “PC” system).The atomistic models of these nanocomposites are shown in Fig. 1

Fig. 2. Schematic diagram showing the application of hydrostatic tension on themolecular models. Deformed and un-deformed are shown in dashed and solid lines,respectively.
S.F. Ferdous et al. / Polymer 54 (2013) 2565e2576 2567
along with the pure PE model (the “PE” system). The diameter ofeach C60 particles is roughly 0.7 nm. In this study, all C60s’ wereinfused in the PE matrix by approximately 4.5-vol%. Periodicboundary conditions were employed to replicate the unit cells inthree dimensions. In the nanocomposites, the PE matrix was re-presented by united atom (UA) eCH2e units where their initialstructures were constructed by self-avoiding random walk (SARW)process [14,40] to yield an initial density of 0.85 gm/cm3 [52].Each simulation unit cell contains 27 chains with 493 beads perchain.
In the simulation, all PE chains are described by appropriatepotential functions that include 2 body, 3 body and 4 body poten-tials between eCH2e UA units [53,54]. The C60 particle wasmodeled as a non-deformable solid inclusion by “freezing” all Catoms during the MD simulation [55,56]. The non-bonded in-teractions between PE and frozen buckyballs were, modeled andevaluated by the LJ potential [57]:
UAB ¼ Ar12
� Br6
(1)
where ULJ(r) is the potential energy between a pair of atoms, r is theseparation distance between them, u is the potential well depth,and a is the VDW separation distance. In our study, the corre-sponding parameters for are A ¼ 4,209,171.4274 kcal-Å12/mol andB ¼ 1344.0266 kcal-Å6/mol [53,54]. It should be noted that the firstterm and the second term in the Eqn. (1) represents repulsive andattractive interaction respectively. In order to study the role ofinterface attraction on the mechanical properties of nano-composites, the attractive part of the C60-PE potential (the value ofB) is scaled between a factor 0 and 1 with an increment of 0.25,where “1” means 100% (full) attraction and “0” means 0% (zero)attraction. There are total five different levels of interface attractionstudied. In the remaining part of this manuscript, we used asubscript to specify the interface conditions for a particular model.For example PB0% will imply PB system with 0% PE-C60 attractive
Fig. 3. Effect of nanoparticle dispersion on the bulk st
interaction. If the interface interaction remains unchanged (e.g.100%), we designate that system without any subscript exceptwhen we compare the same system against different level ofinterface condition. We added the subscript “100%” for thatparticular model. To clarify this further, the readers should notethat the PB and PB100% refer to identical models, so as PC and PC100%.
2.2. Methods: mechanical properties
The MD simulations were performed using DL-POLY (version2.20) simulation package developed by Daresbury Laboratory(Daresbury, Warrington, Cheshire, UK) [58,59]. All simulationswere carried out at 300 K with 1 fs time steps. The mechanicalproperties of neat polymer and nanocomposites were evaluated
ressestrain response of polymer nanocomposites.
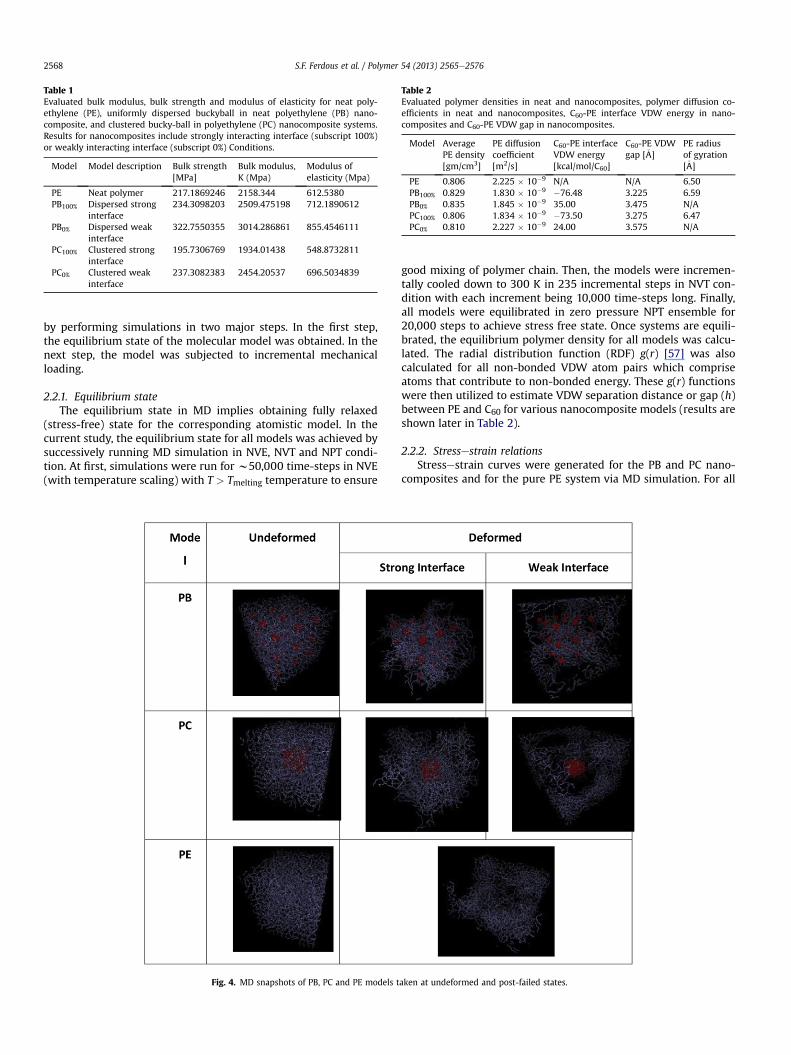
Table 1Evaluated bulk modulus, bulk strength and modulus of elasticity for neat poly-ethylene (PE), uniformly dispersed buckyball in neat polyethylene (PB) nano-composite, and clustered bucky-ball in polyethylene (PC) nanocomposite systems.Results for nanocomposites include strongly interacting interface (subscript 100%)or weakly interacting interface (subscript 0%) Conditions.
Model Model description Bulk strength[MPa]
Bulk modulus,K (Mpa)
Modulus ofelasticity (Mpa)
PE Neat polymer 217.1869246 2158.344 612.5380PB100% Dispersed strong
interface234.3098203 2509.475198 712.1890612
PB0% Dispersed weakinterface
322.7550355 3014.286861 855.4546111
PC100% Clustered stronginterface
195.7306769 1934.01438 548.8732811
PC0% Clustered weakinterface
237.3082383 2454.20537 696.5034839
Table 2Evaluated polymer densities in neat and nanocomposites, polymer diffusion co-efficients in neat and nanocomposites, C60-PE interface VDW energy in nano-composites and C60-PE VDW gap in nanocomposites.
Model AveragePE density[gm/cm3]
PE diffusioncoefficient[m2/s]
C60-PE interfaceVDW energy[kcal/mol/C60]
C60-PE VDWgap [�A]
PE radiusof gyration[�A]
PE 0.806 2.225 � 10�9 N/A N/A 6.50PB100% 0.829 1.830 � 10�9 �76.48 3.225 6.59PB0% 0.835 1.845 � 10�9 35.00 3.475 N/APC100% 0.806 1.834 � 10�9 �73.50 3.275 6.47PC0% 0.810 2.227 � 10�9 24.00 3.575 N/A
S.F. Ferdous et al. / Polymer 54 (2013) 2565e25762568
by performing simulations in two major steps. In the first step,the equilibrium state of the molecular model was obtained. In thenext step, the model was subjected to incremental mechanicalloading.
2.2.1. Equilibrium stateThe equilibrium state in MD implies obtaining fully relaxed
(stress-free) state for the corresponding atomistic model. In thecurrent study, the equilibrium state for all models was achieved bysuccessively running MD simulation in NVE, NVT and NPT condi-tion. At first, simulations were run for w50,000 time-steps in NVE(with temperature scaling) with T > Tmelting temperature to ensure
Fig. 4. MD snapshots of PB, PC and PE models t
good mixing of polymer chain. Then, the models were incremen-tally cooled down to 300 K in 235 incremental steps in NVT con-dition with each increment being 10,000 time-steps long. Finally,all models were equilibrated in zero pressure NPT ensemble for20,000 steps to achieve stress free state. Once systems are equili-brated, the equilibrium polymer density for all models was calcu-lated. The radial distribution function (RDF) g(r) [57] was alsocalculated for all non-bonded VDW atom pairs which compriseatoms that contribute to non-bonded energy. These g(r) functionswere then utilized to estimate VDW separation distance or gap (h)between PE and C60 for various nanocomposite models (results areshown later in Table 2).
2.2.2. Stressestrain relationsStressestrain curves were generated for the PB and PC nano-
composites and for the pure PE system via MD simulation. For all
aken at undeformed and post-failed states.

0.780
0.790
0.800
0.810
0.820
0.830
0.840
0.850
0.860
PE PB PC
Ave
rage
Pol
ymer
Den
sity
[g
m/c
m3 ]
Fig. 5. Effect of nanoparticle dispersion on the average density of polymer matrix innanocomposites.
Fig. 7. Effect of nanoparticle dispersion on the polymer diffusion coefficient in the neatpolymer and nanocomposites. Note that higher values of diffusion coefficient representincreased chain mobility.
S.F. Ferdous et al. / Polymer 54 (2013) 2565e2576 2569
models, the hydrostatic tension test was simulated by applyingincremental displacement field. For each nanocomposite model,the effect of PE-C60 interface attraction was also studied by simu-lating the system with different level of attractive interactions, asdiscussed in Section 2.1. In order to make sure that the altered PE-C60 LJ parameter does not affect the bulkmatrix properties, we havecarefully the monitored the unloaded matrix morphology. Adetailed discussion is provided in the Appendix A. For each incre-ment of applied deformation, a uniform strain was prescribed onthe entire MD model (see Fig. 2). This is done by uniformly scaling(expanding) the dimensions of the MD cell in the direction of thedeformation and re-scaling the new coordinates of the atoms to fitwithin the new dimensions. After this initial deformation, the MDsimulation was continued and the atoms were allowed to equili-brate within the new MD cell dimensions [14,21]. This process wasrepeated for the subsequent increments of deformation. Theapplied strain increment was set at 0.25%. After that, the systemwas relaxed for 2 ps, and then the stress on the system was aver-aged over an interval of 10 ps [21]. The response of the PB, PC and PEstructures under different applied displacement (strain) field ismonitored by computing the developed “engineering virial”stresses in these systems [14].
2.3. Methods: physical properties
The physical properties of neat polymer and nanocompositeswere evaluated once the equilibration state of the molecular
Fig. 6. Effect of nanoparticle dispersion on the average radius of gyration of polymermatrix in the neat and nanocomposite systems.
models (see Section 2.2.1) was obtained. We have estimated thedensity, the radius of gyration and the self-diffusion coefficients ofthe polymers for the PE, PB and PC models.
2.3.1. DensityThe equilibrium densities of polymers were estimated by using
the following relation:
rpolymer ¼ CMNX�Vtotal �
�Vnp þ 0:5VVDW
� gm=cm3 (2)
Here, C is the unit conversion factor (C ¼ 1.6650402) is, M is themonomermass (M¼ 14.022 amu), N is the number of monomers inpolymer chain (N ¼ 493), X is the number of polymer chain (X ¼ 27in PB and PE model, and ¼ 26 in the PC model), Vtotal is the equi-librium volume of the MD model, Vnp is the equilibrium total vol-ume of C60’s (Vnp ¼ 27pr2np) and VVDW is the equilibrium emptyvolume occupied by the VDW gaps. It is assumed that the emptyVDW volume is equally shared by polymer and nanoparticle. Assuch, the effective nanoparticle volume is estimated asVnp þ 0:5VVDW. The VDW gaps for each nanocomposite models areobtained from the PE-C60 RDF plot (discussed in Section 2.2.1).
2.3.2. Radius of gyrationThe radius of gyration of the polymer chains was computed
using the following relations
R2g ¼ 1N
XN
k¼1
ðrk � rCMÞ2 (3)
where Rgis the radius of gyration, N is the number of monomers, rkis the spatial position of the kth monomer (0 < k < N) and rCMis thecenter-of-mass for the entire polymer chain.
2.3.3. Self-diffusion constantThe self-diffusion constants D of polymers are calculated based
on “mean-squared displacement” data. It is known that D is relatedto the mean-squared displacement, <r2>(t) as:
Dr2E
¼ limt/N6Dt (4)
The mean-squared displacement, <r2>(t) data is obtained the“long-term” or second “linear” slope of thehr2i vs time plot. We areaware the first slope or the short term slope refers to the ballistic

Fig. 8. Schematic diagram showing the effect of denser interphase on the remaining density of polymer matrix. The density of interphone and thickness is taken from Ref. [15].
S.F. Ferdous et al. / Polymer 54 (2013) 2565e25762570
motion. The data was collected prior to apply any loading. The timeframe in our calculation covers time between t > t and end ofsimulation during the equilibration run. Here, t means the criticaltime threshold for “ballistic” motion. In other words, we ensured
Fig. 9. Stressestrain response of (a) PB and (b) PC models as a function of varying C60-PE interface interaction strengths.
that our calculation only based on diffusive motion, and it does notinclude any ballistic motion.
3. Results and discussion
Based on the applied incremental deformation and the resultingstresses, several stressestrain curves were generated for the PB, PCnanocomposites and for the pure PE systemvia MD simulation. Therole of C60 dispersion in the composites and the PE-C60 interfaceattraction on the mechanical properties of nanocomposites arestudied.
3.1. Effect of C60 dispersion
As discussed earlier, two types of nanocomposites, the PB sys-tem and the PC are modeled. As shown in Fig. 1, the C60 nano-particles are uniformly distributed in the PB system but theyremain in clustered form in the PC system. The bulk stressestrainresponse for the PB, PC and PE systems in tension is shown in Fig. 3.The evaluated bulk modulus and strength, both in tension andcompression, is tabulated in Table 1. It can be seen from Fig. 3 andTable 1 that nanoparticle dispersion has positive role on the bulktensile failure of nanocomposites. In particular, the PB system ex-hibits w7.8% improvement in bulk failure strength and 16%improvement in bulk stiffness, respectively. On the other hand, theperformance of the clustered system is poorer than the matrixsystem, both in stiffness and strength. It is also evident from Fig. 3that the strain-at-failure for the PB model (w18%) is slightly higherthan the PE model (w17%), and the strain-at-failure for the PCmodel is slightly lower (w16%) than the PEmodel. It can be inferredthat the failure is slightly delayed in the PBmodel but accelerated inthe PC model compared to the PE model.
In order to understand why PB system is performing better, wehave inspected the post-failure MD snapshots, as shown in Fig. 4. Itcan be inferred from Fig. 4 that the failures in both nanocompositesand pure polymer have occurred due to matrix (PE) failure viacavitation [40]. It can thus be argued that the reasons for the betterperformance of PB system over the PE system or the worse per-formance of the PC system over the PE system should depend eitheron the matrix-dominated events or on the interface-dominatedevents during loading. We argue that there are two possible

Fig. 10. Boundary conditions and model properties of the FEM analysis.
S.F. Ferdous et al. / Polymer 54 (2013) 2565e2576 2571
events that might have played significant roles are (1) PE-C60interface attraction (interface-dominated) or by the altered matrixproperty [14] (e.g. density) due to nanoparticle dispersion (matrix-dominated). Note that the PE-C60 interface was modeled as“perfectly strong, or 100%” when we studied the effect of nano-particle dispersion. Table 2 shows the PE-C60 interface energy forboth PB and PC model. It is evident from Table 2 that the interfaceenergy is attractive (negative) for both PB and PC model. Based onknown PEePE VDW energy/chain length [53], we have estimatedthe PEePE VDW energy for our polymers as �9.03 kcal/mol/monomer, which is about an order of magnitude smaller than thePE-C60 interface energy (w�76.45 kcal/mol/C60 atom). We believe,this is why polymer always fails in cohesive manner in both neatsystem and nanocomposite system. In other words, the failuremechanisms in the nanocomposites are matrix-dominated.
To explain why the failure is delayed in the PB model butaccelerated in the PC model compared to the PE model, as shownearlier in Fig. 3, we argue that the equilibrium morphology of thepolymer is responsible for the failure acceleration or decelerationin the nanocomposite models. From polymer physics point of view[60], there are three parameters that can reveal the state of poly-mer morphology: (1) density, (2) chain radius of gyration and (3)chain self-diffusion coefficient. Qualitatively, any increase in thedensity and the radius of gyration implies reduced flexibility andstrength but increase in the self-diffusion coefficient is an indica-tion of increased chain mobility and flexibility. Figs. 5e7 show theaverage polymer density, average radius of gyration and self-diffusion coefficients of polymers in the PE, PB and PC models.Table 2 also lists the same. We observe that the average densities ofpolymer in the PE and PB systems are very consistent with ourprevious studies [14].
It can be further found from Fig. 5 that average polymer densityin the PB model is about 2.85% higher than the PE model. On theother hand, average polymer density in the PCmodel is almost sameas the PE model. Note that the density of polymer represents theaverage density estimated from Eqn. (2). In reality, in nano-composites, the density of polymer is not same everywhere, but adenser polymer layer is always formed near the nanoparticle
interface [14,15,20], referred here as the interphase zone. As totalmass of polymer is conserved, the excludeddensityof polymer (totalpolymer volume minus inter-phase volume) in nanocompositesshould be less than the average polymer density found in the neatsystem (i.e systemwithout interphase). Based on the knowndensity(w1.6 g/cm3) and thickness of interphase (w1 nm) [14,15,20], thebulk density of polymer in the excluded volumes (total polymervolume e interphase volume) of the PB and PC system can be esti-mated. The result is schematically shown in Fig. 8. A rough calcu-lation reveals that the excluded density of polymer in the PB systemshould be higher than the average PE density in the neat polymermodel but the excluded density of polymer in the PC system shouldbe lower than the average PE density in the neat polymer model.Since the failure is matrix-dominated, this result qualitativelyproves why PB system is performing better and PC system is per-forming poorer compared to the PE system.
It can be observed from Fig. 6 that the average radius of gyrationof polymer chain in neat polymer is lower than the PB model buthigher than the PCmodel. On the other hand, as shown in Fig. 7, theself-diffusion coefficient of polymer molecules in PE model ishigher than the PB and PC model. Both PB and PC model has almostidentical self-diffusion coefficients. We can infer from the resultsshown in Figs. 5e7 that the presence of uniformly dispersednanoparticles makes the polymer stiffer and stronger (high densityand radius of gyration) and less flexible (low self-diffusion coeffi-cient). On the other hand, the clustered arrangement of nano-particles makes polymer chains less stiff and weaker (low densityand radius of gyration) and less flexible (high self-diffusion coef-ficient). The collective contribution of these three factors is con-trolling the overall structureeproperty relations of the neatpolymer and polymer nanocomposites.
3.2. Effect of C60-PE interface interaction
In this part of the study, we have modified the interfaceattraction between C60 and PE by adjusting the corresponding VDWattraction potential, as described earlier in Section 2.2.1. In partic-ular, we have multiplied the attractive potential parameter (the

Fig. 11. FEM results showing stress contours on the six different models. The appliedstress was 10 MPa for all cases.
S.F. Ferdous et al. / Polymer 54 (2013) 2565e25762572
parameter “B” in Eqn. (2)) by 0, 0.25, 0.5, 0.75 and 1 to represent 0%,25%, 50%, 75% and 100% strong interface. Fig. 9 shows the stress-strain response of the PB and PC systems. It can be observed fromFig. 9 that the role of C60-PE interface interaction on the mechanicalbehavior of the PB and PC system is significant and perhapssomewhat counterintuitive. For instance, when the interfaceattraction between C60 and PE is changed from “100%” to “0%” in thePB system, the failure stress is increased from w230 MPa tow310MPa. Similarly, when the interface attraction is changed from“100%” to “0%” in the PC system, the failure stress also increases(from w190 MPa to w235 MPa). It is evident from the MD snap-shots shown in Fig. 4 that the failure of the nanocomposites iscaused by cavitation only when interface 100% strong. However, forthe perfectly poor interface (0% attraction) models, both bulk ma-trix cavitations and PE-C60 interface failure are observed. Thereason for interface failure at 0% interface-interaction is obviousfrom Table 2 that shows there is no bonding between polymer andC60 (positive interaction energy implies repulsion). What is notobvious is why the weaker interface systems are performing betterthan the stronger interface systems, regardless the state of nano-particle dispersions. In order to gain further insight, we comparedthe bulk polymer densities for both “100%” and “0%” strong systemsand reported in Table 2 (PB and PC for 100% interaction and PB0%
and PC0% for 0% interaction). It is evident from Table 2 that the zerobonding condition increases the polymer densities by about 0.8% inthe PB system and by 0.5% in the PC system. The increase in densityis due to increase in VDW gap for the weak interface condition, asshown in Table 2. Since it is known that denser polymer arestronger and stiffer [40,41], we can argue that there are at least twocompeting factors involved in the failure of weaker interface sys-tems: (i) interface property degradation by the reduced interfaceenergy at the weakened interface and (ii) bulk property enhance-ment due to polymer densification. We, therefore, hypothesize thatthe positive contributions from the factor (ii) outperformed thatnegative contributions from the factor (i).
Before we justify our hypothesis, we first studied how the twofactors collectively contribute to the overall stressestrain response,at least from continuum perspective, we have carried out a set ofFinite Element Analysis (FEA) using ANSYS 12.0 Mechanical APDLsoftware [61]. In the 2D FEA, we have developed nanocompositemodels with the following conditions:
a) Rigid inclusion with perfect interface þ NO interphase þ“standard” polymer stiffness
b) Rigid inclusion with perfect interface þ YES interphase þ“standard” polymer stiffness
c) Rigid inclusionwithweak interfaceþNOinterphaseþ “standard”polymer stiffness
d) Rigid inclusion with weak interface þ YES interphase þ“standard” polymer stiffness
e) Rigid inclusion with weak interface þ NO interphase þ“Enhanced” polymer stiffness
f) Rigid inclusion with weak interface þ YES interphase þ“Enhanced” polymer stiffness
In all cases, 8-noded solid quadratic element (ANSYS ID SOLID-183) was selected. Full integration with plane stress condition isassumed. In order to model inclusion (nanoparticle), inter-phaseand bulk polymer, three linear elastic isotropic material prop-erties (elastic moduli Enp, Eip, Em) were used in every simulationwith constant Poisson’s ratio v. Due to symmetry, only a quarterof the overall geometry was modeled. Fig. 10 shows the sche-matics of the FEA model with some details on boundary con-ditions and material properties. The volume fraction of inclusionwas kept consistent with MD model. The perfect interface

Fig. 12. MD snapshots of (a) PBF and (b) PBZ model showing the failure process as hydrostatic deformation continued. The yellow and purple circles show cohesive and interfacefailure respectively. (For interpretation of the references to color in this figure legend, the reader is referred to the web version of this article.)
S.F. Ferdous et al. / Polymer 54 (2013) 2565e2576 2573
condition was modeled by “gluing” the np-interphase (polymer)interface and the weak non-bonded interface condition wasmodel by removing “glue” from the interface. As discussed, thepresence of inter-phase was also considered and explicitlymodeled. The elastic modulus of the inter-phase was assumedas 2 times stiffer than the bulk polymer [50]. The thickness of
the inter-phase was estimated from Ref. [14]. The stiffness ofthe inclusion was assumed as 100 times more than the matrixstiffness. The purpose of the “enhanced” polymer stiffnesscondition is to mimic the enhanced polymer density conditionwhen interface is weak. In this study, the “enhanced” polymerstiffness is 1.5 higher than the “standard” polymer stiffness

Fig. 13. Effect of interface attraction on the bulk stress-strain response of polymernanocomposites simulated with modified interatomic potential to produce samedensity in both “0%” type and “100%” type models.
S.F. Ferdous et al. / Polymer 54 (2013) 2565e25762574
where the “standard” polymer stiffness reflects “bulk” polymerproperties. It should be noted that the value of these stiffnessproperties is somewhat arbitrary that are chosen phenomeno-logically. As such, the results of the FEA models are predomi-nantly qualitative and should not be considered as the directcomparison of the MD model. The sole purpose of the FEAmodel is to gain a first order insight on the failure mechanismof nanocomposites for different interface condition by trackingthe magnitude and location of maximum Von Mises stressesproduced due to applied hydrostatic stress (10 MPa). Bycomparing the maximum Von Mises stresses and specially thelocation of maximum stresses for all six cases discussed above,we may find some insight.
The FEA results are shown in Fig. 11. It can be revealed fromFig. 11 that the maximumVonMises stresses are always occurred atthe np-ip interface. The magnitude of maximum VonMises stress isabout 3 times lower for perfect bonded model than then non-bonded models, regardless interphase is present or not. The trendremains same even when matrix properties are higher for the non-bonded model. The FEA results suggest that failure should alwaysinitiate from the np-ip interface for the non-bonded case. For theperfectly bonded case, even though maximum stress is at the np-ipinterface, failure may not begin from the interface. By preciselyknowing the interface strength and bulk strength of polymers, arigorous analysis involving failure criteria would reveal how thismaterial would fail.
The FEA study essentially suggests that some additional factorsare involved in the failure process of the non-bonded systems. Inorder to obtain further insight, we resort to the MD snapshots ofboth PB and PBZ models taken at different strain state. Two sets ofMD snapshots are shown in Fig. 12. It is evident from Fig. 12 (a) thatthe 100% strong PB model, as expected, fails by cavitation in thematrix. Because there is no bonding between C60 and PE, thedeformation in the 0% strong PB nanocomposite model essentiallyimplies the deformation of solid PE matrix with spherical cavities.When this material is loaded hydrostatically, according to thestress-strain curve shown in Fig. 9(a), the 0% strong PB modelreaches its peaks stress at wεkk ¼ 23% and then failed. It can beobserved from Fig. 12(b) that at wεkk ¼ 23, the overall materialintegrity prevails even though no bonding exists between the C60and PE. It can be further observed that any additional loadingcauses this material to fail from the bulk matrix, not from the C60-PE interface (see the snapshot for εkk ¼ 30%). The failure mode ofthe 0% strong PC follows similar trend. The next question arises,why the matrix in the “0% strong” system performs better than the“100% strong” system. We argue that since both systems are failedby cavitation in the matrix, the “0% strong” systems offer moreresistance to deformation and failure because the matrix densitiesfor the “0% strong” systems are higher than that of the “100%strong” systems (see Table 2). The matrix densities in the “0%strong” systems are higher than the “100% strong” systems becauseof VDW Z-gap. It can be noticed from Table 2 that the C60-PE VDWgap is higher in the “0% strong” systems which implies that poly-mers in the “0% strong” systems are more densely packed. Since,higher density refers to improved mechanical properties, webelieve, this is the reason why “0% strong” systems performedbetter than the “100% strong” systems.
In order to obtain more insight on this matter, we have devel-oped another set of “0% strong” type molecular models (both PBand PC) by adjusting some potential parameters (based on trial anderror) of the OPLS force field [54] such that the bulk polymerdensities of the “0% strong” type models are very similar to the bulkdensities of the “0% strong” type models. By this, we have elimi-nated the “density” factor in the comparative stressestrain re-sponses of “0% strong” type and “100% strong” type models. Fig. 13shows the new stress-strain curve. It can be observed that the “0%strong” models are no longer performing better than the “100%strong” models. The new study essentially suggests that “poor”interface condition does not necessarily imply overall poor per-formance of nanocomposites.
4. Summary and conclusions
The following conclusions can be drawn from the current study.
� The effects of filler dispersion and fillerematrix interfacestrength on the mechanical properties of buckyball reinforcedpolyethylene nanocomposites are studied using moleculardynamics simulations.
� To simulate well-dispersed condition, twenty seven C60buckyballs are uniformly placed in the PE matrix. The poorly-dispersed state was modeled by clustering all C60s together.
� The effect of polymerenanoparticle interface condition wasmodeled by scaling PE-C60 LJ van der Waals attraction param-eters from 0 to 1 to represent weakest to strongest interfaceattraction between C60 and PE.
� The stressestrain responsewas developed by applying uniformhydrostatic strain fields to all equilibrated models.
� Our study reveals that failure of nanocomposites always occursby matrix failure, regardless a system has well dispersed/poorly dispersed or strong/weak fillerematrix interface.

S.F. Ferdous et al. / Polymer 54 (2013) 2565e2576 2575
� We have shown that the mechanical properties of nano-composites are significantly improved if nanoparticles arenicely dispersed in the matrix. We have found that differentlevel of nanoparticle dispersion canmodify matrix morphologydifferently, which ultimately alters the deformation and failureof the matrix material.
� We have monitored polymer density variation, radius of gy-ration, radial distribution functions to characterize the polymermorphology.
� Our results also demonstrate that the presence of strong inter-face attraction between the polymer and nanoparticle is not veryimportant; rather the lack of attraction between the polymerand nanoparticle may be advantageous. It is concluded thatincreased in polymer bulk density is one of the key contributorsin gaining improved properties in polymer nanocomposites.
Acknowledgment
This work was supported by UTA faculty startup fund. Wegratefully thank Dr W. Smith and the Daresbury Laboratory forproviding the Molecular Dynamics Simulation PackageDLPOLY(2.20) (Smith and Forester, 1996).
Figure A. RDF plot for different LJ interaction potentials used for defining PE-C60 interaction splot for the PB system, (b) PEePE plot for the PC system, (c) PE-C60 plot for the PB system,
Appendix
Effect of PE-C60 LJ parameter scaling on the bulk matrixconfiguration
In order to check, whether the altered LJ potential parametersinduce spurious cavitation/delamination in the polymer evenwithout any applied stress, we studied the RDFs of the equilibrated0%e100% stronger model prior to applying any mechanical loading.Knowing that RDF plot provides a quantitative measure of polymere polymer or polymer e nanoparticle atoms separation relative toeach other, we calculated RDFs for PE-C60 and PE e PE interactionsprior to apply any loading. We considered five different PE-C60 LJinteractions, namely 0%, 25%, 50%, 75% and 100%. We did these cal-culations for both PB and PE systems. The results are shown in Fig. A.
It is evident from Fig. 2(a) and (b) that the structure of bulkpolymer does not change when PE-C60 interaction potentialchanges. These results clearly demonstrate that delamination/cavitation is not possible if stress is not applied to the polymernanocomposites. The PE-C60 RDF plots suggests that the distancebetween C60 atoms and PE atoms will increase if the attractionsbetween PE and C60 reduce. This is, however, expected.
trengths. Here subscript refers to the percentage of full interaction strengths. (a) PEePE(d) PE-C60 plot for the PC system.

S.F. Ferdous et al. / Polymer 54 (2013) 2565e25762576
References
[1] Wiley-Scrivener edited by Vikash MittalPolymer nanotube nanocompositessynthesis properties and applications. Scrivener Publishing LLC; 2010.
[2] Winey Karen I, . Vaia Richard A, editors. Polymer nanocomposites, vol. 32.MRS Bulletin; 2007.
[3] Merhari Lhari. Hybrid nanocomposites for nanotechnology: electronic, optical,magnetic and biomedical applications. Springer Science þ Business Media,LLC; 2009.
[4] Jancar J, Douglas JF, Starr FW, et al. Current issues in research on structure-property relationships in polymer nanocomposites. Polymer 2010;51:3321e43.
[5] Hussain Farzana, Hojjati Mehdi, Okamoto Masami, . Gorga Russell E. Reviewarticle: polymer-matrix nanocomposites, processing, manufacturing, andapplication: an overview. Journal of Composite Materials 2006;40(17).
[6] Jordan J, Jackob KI, Tannenbaum R, Sharaf MA, Jasiuk I. Experimental trends inpolymer nanocomposites e a review. Materials Science and Engineering A2005;393:1e11.
[7] Crosby Alfred J, Lee Jong-Young. Polymer nanocomposites: the “Nano” effecton mechanical properties. Polymer Review 2007;47:217e29.
[8] Hu Hurang, Onyebueke Landon, Abatan Ayo. Characterizing and modelingmechanical properties of nanocomposites-review and evaluation. Journal ofMinerals & Materials Characterization & Engineering 2010;9(4):275e319.
[9] Boudenne Abderrahim, Ibos Laurent, Candau Yves. Handbook of multiphasepolymer systems, vol. 1. John Wiley and Sons Ltd; 2011.
[10] Chisholm Nathaniel, Mahfuz Hassan, Rangari Vijaya K, Ashfaq Adnan,Jeelani Shaik. Fabrication and mechanical characterization of carbon/SiC-epoxy nanocomposites. Composite Structures 2005;67(1):115e24.
[11] Koo Joseph H. Polymer nanocomposites: processing, characterization & ap-plications. 1st ed. Mcgraw-Hill Nanoscience and Technology Series; 2006.
[12] Altavilla Claudia, Ciliberto Enrico. Inorganic nanoparticles: synthesis, appli-cations, and perspectives. 1st ed. Taylor and Francis Group, LLC; 2011.
[13] Fedlheim Daniel L, Foss Jr Colby A. Metal nanoparticles: synthesis character-ization & applications. 1st ed. Marcel Dekker Inc; 2002.
[14] Adnan Ashfaq C, . Sun T, Mahfuz Hassan. A molecular dynamics simulationstudy to investigate the effect of filler size on elastic properties of polymernanocomposites. Composites Science and Technology 2007;67:348e56.
[15] Adnan Ashfaq C, . Sun T. Effect of thickness and interface strength on defor-mation and failure of glassy polymer adhesives: a molecular dynamicssimulation study. Journal of Adhesion 2008;84(5):401e20.
[16] Zeng QH, Yua AB, Lu GQ. Multiscale modeling and simulation of polymernanocomposites. Progress in Polymer Science 2008;33:191e269.
[17] Kalra Vibha, Escobedo Fernando, Joo Yong Lak. Effect of shear on nanoparticledispersion in polymer melts: a course grained molecular dynamics study, vol.132. American Institute of Physics; 2010. 024901.
[18] Desai Tapan, Keblinsk Pawel, Kuma Sanat K. Molecular dynamics simulationsof polymer transport in nanocomposites. Journal of Chemical Physics2005;122:134910.
[19] Valavala PK, Odegard GM. Modeling techniques for determination of me-chanical properties of polymer nanocomposites. Advanced Materials Science2005;9(1):34e44.
[20] Odegard GM, Clancy TC, Gates TS. Modeling of the mechanical properties ofnanoparticle/polymer composites. Polymer 2005;46(2):553e62.
[21] Frankland SJV, Harik VM, Odegard GM, Brenner DW, Gates TS. The stressestrain behavior of polymerenanotube composites from molecular dynamicssimulation. Composites Science and Technology 2003;63:1655e61.
[22] Vacatello M. Monte carlo simulations of polymer melts filled with solidnanoparticles. Macromolecules 2001;34:1946e52.
[23] Mallick PK. Fiber-reinforced composites: materials, manufacturing, anddesign. New York (USA): Marcel Dekker, Inc; 1993.
[24] Vollenburg PHT, Heikens TD. Particle size dependence of the Young’s modulus offilled polymers: 1. Preliminarily experiments. Polymer 1989;30(9):1656e62.
[25] Reynaud E, Jouen T, Gauthier C, Vigier G, Varlet J. Nanofillers in polymericmatrix: a study on silica reinforced PA6. Polymer 2001;42(21):8759e68.
[26] Jiang L, Lam YC, Tam KC, Chua TH, Sim GW, Ang LS. Strengthening acryloni-trileenutadieneestyrene (ABS) with nano-sized and micron-sized calciumcarbonate. Polymer 2005;46(1):243e52.
[27] Toth Radovan, Santese Francesca, et al. Size and shape matter! A multiscalemolecular simulation approach to polymer nanocomposites. Journal of Ma-terials Chemistry 2012;22:5398e409.
[28] Hamming Lesley M, Qiao Rui, Catherine Brinson L, et al. Effects of dispersion andinterfacial modification on the macroscale properties of TiO2 polymerematrixnanocomposites. Composites Science and Technology 2009;69:1880e6.
[29] Liu Jun, Gao Yangyang, Cao Dapeng, et al. Nanoparticle dispersion and ag-gregation in polymer nanocomposites: insights from molecular dynamicssimulation. Langmuir 2011;27:7926e33.
[30] Shen Jianxiang, Liu Jun, Gao Yangyang, et al. Revisiting the dispersionmechanism of grafted nanoparticles in polymer matrix: a detailed moleculardynamics simulation. Langmuir 2011;27:15213e22.
[31] Sinha Ray Suprakas, Okamoto Masami. Progress in polymer Science2003;28(11):1517e642.
[32] Zeng Qinghua, . Mrayed Sabri M, Yu Aibing. Interfacial interactions in clay-based polymer nanocomposites: effect of surfactant. Advanced MaterialsResearch 2010;129e131:607e11.
[33] Ghanbari Azadeh, Ndoro Tinashe VM, Rahimi Mohammad, et al. Interphasestructure in silica�polystyrene nanocomposites: a Coarse-Grained moleculardynamics study. Macromolecules 2012;45:572e84.
[34] Pitsa Despoina, Danikas Michael G. Interfaces features in polymer nano-composites: a review of proposed model. World Scientific Publishing Com-pany6(6):497e508.
[35] Yang Seunghwa, Yu Suyoung, Kyoung Woomin. Multiscale modeling of size-dependent elastic properties of carbon nanotube/polymer nanocompositeswith interfacial imperfections. Polymer 2012;53:623e33.
[36] Deng Fei, Van Vliet Krystyn J. Prediction of elastic properties for polymereparticle nanocomposites exhibiting an interphase. Nanotechnology 2011;22:165703 (7pp).
[37] Snipes JS, Robinson CT, Baxter SC. Effects of scale and interface on the three-dimensional micromechanics of polymer nanocomposites. Journal of Com-posite Materials 2011;45(24):2537e46.
[38] Qiao Rui, Deng Hua, . Putz Karl W. Effect of particle agglomeration andinterphase on the glass transition temperature of polymer nanocomposites.Journal of Polymer Science Part B: Polymer Physics 2011;49:740e8.
[39] Watcharotone S, Wood CD, Friedrich R, Chen X, Qiao R, Putz K, et al. Interfacialand substrate effects on local elastic properties of polymers using coupledexperiments and modeling of nanoindentation. Advanced Engineering Ma-terials 2011;13:400e4. http://dx.doi.org/10.1002/adem.201000277.
[40] Binder K. Monte carlo and molecular dynamics simulations in polymerscience.
[41] Argon AS, Cohen RE. Toughen ability of polymers. Polymer 2003;44:6013e32.[42] Thio YS, Argon AS, Cohen RE. Role of interfacial adhesion strength on
toughening polypropylene with rigid particles. Polymer 2004;45:3139e47.[43] Bartczak Z, Argon AS, Cohen RE, Weinberg M. Toughness mechanism in semi-
crystalline polymer blends: II. High-density polyethylene toughened withcalcium carbonate filler particles. Polymer 1999;40:2347e65.
[44] Bartczak Z, Argon AS, Cohen RE, Weinberg M. Toughness mechanism in semi-crystalline polymer blends: I. High-density polyethylene toughened withrubbers. Polymer 1999;40:2331e46.
[45] Shah Deepak, Maiti Pralay, Jiang David D, Batt Carl A, Giannelis Emmnauel P.Effect of nanoparticle mobility on toughness of polymer nanocomposites.Advance Materials 2005;17(5).
[46] Curro John G, Schweizer Kenneth S. Equilibrium theory of polymer liquids:linear chains. Journal of Chemical Physics 1987;87(3).
[47] Curro John G, Schweizer Kenneth S, Grest Gary S, Kremer Kurt.A comparison between integral equation theory and molecular dynamicssimulations of dense, flexible polymer liquid. Journal of Chemical Physics1989;91(2).
[48] Chatterjee Avik P, Schweizer Kenneth S. Microscopic theory of polymer-mediated interactions between spherical particles. Chemical Physics 1989;91(2). Journal of Chemical Physics 1998;109(23).
[49] Chen Yeng-Long, Schweizer Kenneth S. Microscopic theory of gelation andelasticity in polymereparticle suspensions. Journal of Chemical Physics2004;120(15).
[50] Hooper Justin B, Schweizer Kenneth S. Contact aggregation, bridging, andsteric stabilization in dense polymer-particle mixtures. Macromolecules2005;38:8858e69.
[51] Schweizer Kenneth S, Curro John G. Micropscopic theory of the structure,thermodynamics, and apparent Z parameter of polymer blends. Physical Re-view Letters 1988;60(9).
[52] Peacock AJ. Handbook of polyethylene: structures, properties and applica-tions. New York (USA): Marcel Dekker Inc; 2000.
[53] Mayo SL, Olafson BD, Goddard III WA. DREIDING: a generic force field formolecular simulations. Journal of Physical Chemistry 1990;94:8897e909.
[54] Jorgensen WL, Madura JD, Swenson CJ. Journal of the American ChemicalSociety 1984;106:6638. 14.
[55] Smith W, Rodger PM. The pressure in systems with frozen atoms. http://www.ccp5.ac.uk/infoweb/wsmith22/wsmith22.pdf; 2002.
[56] Smith W, Forester TR. DLPOLY-2.14 manual. http://www.cse.clrc.ac.uk/msi/software/DL_POLY/MANUALS/USRMAN2.pdf; 2004.
[57] Allen MP, Tildesley DJ. Computer simulations of liquids. New York (USA):Oxford University Press; 1987.
[58] Smith W, Forester TR. DL_POLY_2.0: a general-purpose parallel molecular dy-namics simulation package. Journal of Molecular Graphics 1996;14:136e41.
[59] Smith W, Forester TR, Todorov IT. DLPOLY (version-2.20).STFC DaresburyLaboratory; section-1.2.5.2, 2.5, 4.1.1.
[60] Sperling LH. Introduction to physical polymer science. 4th ed. John Wiley &Sons, Inc; 2006.
[61] http://www.ansys.com/.