role of community tolerance level (ctl) in predicting the prevalence of the annoyance of road and...
TRANSCRIPT

Role of community tolerance level (CTL) in predicting theprevalence of the annoyance of road and rail noise
Paul SchomerSchomer and Associates, Inc., 2117 Robert Drive, Champaign, Illinois 61821
Vincent Mestrea)
Mestre Greve Associates Division of Landrum and Brown, 27812 El Lazo Road, Laguna Niguel,California 92677
Sanford FidellFidell Associates, 23139 Erwin Street, Woodland Hills, California 91367
Bernard BerryBerry Environmental Ltd., 49 Squires Bridge Road, Shepperton, Surrey TW17 0JZ, United Kingdom
Truls GjestlandSINTEF ICT, N-7465 Trondheim, Norway
Michel ValletInstitut AEDIFICE, 59 Avenue Lacassagne, 69003 Lyon, France
Timothy ReidMestre Greve Associates Division of Landrum and Brown, 27812 El Lazo Road, Laguna Niguel,California 92677
(Received 16 June 2011; revised 1 February 2012; accepted 3 February 2012)
Fidell et al. [(2011), J. Acoust. Soc. Am. 130(2), 791-806] have shown (1) that the rate of growth of
annoyance with noise exposure reported in attitudinal surveys of the annoyance of aircraft noise
closely resembles the exponential rate of change of loudness with sound level, and (2) that the pro-
portion of a community highly annoyed and the variability in annoyance prevalence rates in com-
munities are well accounted for by a simple model with a single free parameter: a community
tolerance level (abbreviated CTL, and represented symbolically in mathematical expressions as Lct),
expressed in units of DNL. The current study applies the same modeling approach to predicting the
prevalence of annoyance of road traffic and rail noise. The prevalence of noise-induced annoyance of
all forms of transportation noise is well accounted for by a simple, loudness-like exponential function
with community-specific offsets. The model fits all of the road traffic findings well, but the preva-
lence of annoyance due to rail noise is more accurately predicted separately for interviewing sites
with and without high levels of vibration and/or rattle. VC 2012 Acoustical Society of America.
[http://dx.doi.org/10.1121/1.3688762]
PACS number(s): 43.50.Qp, 43.50.Sr [BSF] Pages: 2772–2786
I. INTRODUCTION
The prevalence of annoyance produced by road traffic
and rail noise varies considerably from one community to the
next (cf. Fig. 1), just as does the annoyance of aircraft noise
(Schultz, 1978; FICON, 1992; Miedema and Vos, 1998;
Fidell et al., 2011). The great variability of annoyance preva-
lence rates in communities with similar levels of exposure to
road and rail noise complicates interpretations of dosage-
response relationships intended to predict transportation noise
impacts in environmental impact disclosure analyses.
Fidell et al. (2011) show that the rate of change of
annoyance with the day-night average sound level (DNL) of
aircraft noise exposure closely resembles the rate of change
of loudness with sound level. They also demonstrate that
variability in annoyance prevalence rates in communities is
well accounted for by a simple model with a single free pa-
rameter: a community tolerance level (abbreviated CTL and
represented symbolically in mathematical expressions as
Lct), expressed in units of DNL.
CTL analysis is based on several simple assumptions.
Very low levels of transportation noise exposure are
assumed to highly annoy few if any residents of a commu-
nity, while very high levels of transportation noise exposure
are assumed to highly annoy all or nearly all residents. The
transition from the lower asymptote (hardly any residents
highly annoyed) to the upper asymptote (nearly all residents
highly annoyed) is further assumed to be monotonic with cu-
mulative noise exposure as measured in units of DNL. To-
gether, these assumptions specify the behavior of a transition
function for the annoyance of transportation noise exposure
that is asymptotic to 0% at low noise exposure values and to
100% for high values of DNL. None of these fundamental
a)Author to whom correspondence should be addressed. Electronic mail:
2772 J. Acoust. Soc. Am. 131 (4), April 2012 0001-4966/2012/131(4)/2772/15/$30.00 VC 2012 Acoustical Society of America
Redistribution subject to ASA license or copyright; see http://acousticalsociety.org/content/terms. Download to IP: 78.91.103.24 On: Wed, 17 Jun 2015 10:12:08

assumptions is new or controversial. All have been widely
accepted as part of the standard analysis of dosage-response
relationships for the annoyance of community noise exposure,
at least since the publication of EPA’s “Levels Document”
(Environmental Protection Agency, 1974) and Schultz (1978).
Three further simple assumptions encompass what is
novel about the approach described by Fidell et al. (2011).
Fidell et al. chose a very simple, one parameter function
(e�x, where x is a function of DNL) to describe the shape of
the transition from the lower to the upper asymptote. They
further assumed that the annoyance of transportation noise
exposure is a monotonic function of its cumulative sound
energy, i.e., 10(Ldn/10). Their final assumption was that annoy-
ance is proportional to the “effective” (duration-adjusted)
loudness of cumulative noise exposure. This assumption
requires that the quantity 10(Ldn/10) be raised to the 0.3 power
because loudness is proportional to sound pressure raised to
0.3 power. In other words, it is assumed that the growth in
annoyance with sound level—as measured in this case by
DNL—closely resembles the rate of growth of loudness with
sound level.1
Taken together, these assumptions permit the percentage
of a community highly annoyed (“%HA”) to be predicted
from DNL as shown in Eq. (1):
%HA ¼ 100�EXP � 1= 10 LdnþKð Þ=10ð Þh i0:3
� ��; (1)
in which the shape of the function is given by e-x.
Equation (1) is readily plotted as a dosage-response rela-
tionship, with DNL (the predictor variable) on the abscissa
and %HA (the dependent or predicted variable) plotted on
the ordinate. The percent highly annoyed specified by Eq.
(1) transitions smoothly and monotonically from 0% to
100% as DNL increases. The constant, K, adjusts the hori-
zontal position of the transition function along the DNL axis.
For example, if K¼�10, then the numerical value of DNL
is 10 dB larger than for K¼ 0 for the same predicted annoy-
ance prevalence rate (%HA).
Field surveys of the annoyance of transportation noise
exposure produce paired estimates of DNL and %HA at each
interviewing site. As demonstrated by Green and Fidell
(1991), the value of K in Eq. (1) for a given set of field
observations may be identified by minimizing the root mean
square (rms) error between the assumed exponential transi-
tion function and the field observations. A value of K so-
identified for a given set of attitudinal survey data thus
anchors the transition function to the abscissa (DNL axis).
The choice of the point on the transition function at
which it is anchored to the abscissa is arbitrary because it
changes only the numeric value of the arbitrary constant K
without affecting the transition function’s shape. For exam-
ple, the transition function could be anchored to the abscissa
at %(HA) values of 10%, 90%, or 73.85%. Fidell et al.(2011) chose the 50% highly annoyed point—its middle—as
the anchor point for any particular transition function. The
choice of the 50% point has neither any inherent meaning
nor any mathematical importance. Given this choice of
anchor point, however, a CTL value corresponds to the
DNL value at which half of the people in a community
describe themselves as highly annoyed by transportation
noise exposure.
Fidell et al. next identified two components of K: a vari-
able that they termed “community tolerance level,” repre-
sented symbolically in mathematical expressions as Lct, and
a new constant with a value of 5.306 dB. Both Lct and the
constant 5.306 have units of DNL. The value of the new con-
stant (5.306 dB) is a mathematical artifact of the decision to
anchor the transition function to the abscissa at its “middle”
[%(HA)¼ 50%]. CTL reflects all non-DNL related factors
that influence annoyance judgments in a given set of noise
survey data.2 The utility of CTL for explanatory purposes is
that it expresses community-level differences in reactions to
transportation noise exposure in simple decibel form, in units
of DNL. Equation 2 expresses the percent highly annoyed
directly as a function of DNL and CTL:
%HA ¼ 100�EXP � 1= 10 Ldn�Lctþ5:306ð Þ=10ð Þ� �0:3
� �� �: (2)
In practice, the value of CTL for a community is established
empirically by finding the value of DNL that minimizes the
root mean square (rms) difference between Eq. (2) and pairs
of empirical (DNL, %HA) observations from interviewing
sites within a social survey. This is done iteratively, by slid-
ing Eq. (2) along the DNL axis and computing the rms values
of differences between predicted [per Eq. (3)] and observed
annoyance prevalence rates. Figure 2 illustrates the process
FIG. 2. Figure 2. Examples of several fits of the effective loudness function
within a single set of social survey data observations: Lct¼ 64 (dashed line);
Lct¼ 69 (solid line); Lct¼ 79 (dotted-dashed line).
FIG. 1. Illustration of the variability of annoyance prevalence rates due to
road traffic and rail noise as tabulated in Appendices A and B.
J. Acoust. Soc. Am., Vol. 131, No. 4, April 2012 Schomer et al.: Road and rail community tolerance level 2773
Redistribution subject to ASA license or copyright; see http://acousticalsociety.org/content/terms. Download to IP: 78.91.103.24 On: Wed, 17 Jun 2015 10:12:08

with respect to pairs of (DNL, %HA) values observed in an
Austrian road traffic social survey (Lercher, 1998).
Setting the value of Lct¼ 64 dB in Eq. (3) yields the
uppermost dashed curve. Respondents in this survey are
clearly more tolerant of road traffic noise than implied by
this value of CTL, since the curve lies above most of the
data points. Selecting a value of Lct¼ 79 dB in Eq. (3)
yields the lowermost dashed curve. Respondents in this sur-
vey are clearly less tolerant of road traffic noise than
implied by this value of CTL because the curve lies below
all of the data points. The best fitting (minimal rms error)
position for the predictive function for these data is at
Lct¼ 69.3 dB.
The present study investigates whether the model
described by Fidell et al. (2011), previously shown to
provide a good account for the annoyance of aircraft noise
exposure, supports similarly useful prediction of the annoy-
ance of road traffic and rail noise.
II. METHOD
Separate databases (contained in Appendices A and B)
of social survey findings were constructed for the prevalence
of road traffic and rail noise-induced annoyance from site-
wise pairs of observations of DNL values and percentages of
respondents highly annoyed. The databases contain informa-
tion consolidated from several sources: (1) a database con-
taining about 35 road traffic surveys and ten rail surveys
originally compiled by the Netherlands Organization for
Applied Scientific Research (TNO); (2) databases contained
in Fidell et al. (1989)3 and Fidell and Silvati (2004); and (3)
the archival literature.
FIG. 3. Examples of best fits of four road traffic studies (a through d) and two rail (e and f) studies to Eq. (3).
2774 J. Acoust. Soc. Am., Vol. 131, No. 4, April 2012 Schomer et al.: Road and rail community tolerance level
Redistribution subject to ASA license or copyright; see http://acousticalsociety.org/content/terms. Download to IP: 78.91.103.24 On: Wed, 17 Jun 2015 10:12:08

Information in the TNO database had been rescaled to a
common range of numerical values and combined by expo-
sure levels across individuals at multiple interviewing sites,
so it did not permit site-wise characterization of annoyance
prevalence rates. When multiple sources of information were
available for the same study, data were utilized preferentially
from original sources or from the Fidell and Silvati (2004)
database, which contains what are essentially original data.
Information in the archival literature typically reported noise
exposure in units of Leq24 rather than DNL. Unless otherwise
noted, conversion to DNL for road traffic noise was accom-
plished in accordance with information provided in the origi-
nal reference or by assuming that Ldn¼ Leq24þ 3 dB. Rail
noise studies, largely European, were assumed to have rela-
tively more nighttime exposure than road noise, so conver-
sions of rail noise exposures to DNL were accomplished in
accordance with information provided in the original refer-
ence, or from the assumption that Ldn¼ Leq24þ 4 dB.
TABLE I. Study information, results, and inclusion in summaries for road traffic noise.
Study
Year of
study
Number of
subjects CTL R2
Studies used
in this papera
Studies used by
Miedema and Vos Metricb Reference
AUS329 1989 1989 69.3 0.92 O DNL Lecher, 1998
BEL122 1975 1319 85 0.44 F X DNL Myncke et al., 1977
BEL137 1976 495 81.3 0.67 F X DNL Myncke et al., 1977
CAN120 1975 1150 74.6 0.53 T X DNL Bradley and Jonah, 1977
CAN121 1975 1786 87.6 0.67 F X DNL Hall and Taylor, 1977
CAN168 1978 965 78.6 0.75 F X DNL Hall et al., 1981, Table 3, pp.1693
DEN075 1972 960 77.3 0.59 F DNL Relster, 1975
DEN529 2002 1149 86 0.99 T DNL Bjørner, 2004
FRA041 1969 700 79.6 0.95 F DNL Aubree et al., 1971
FRA092c
FRA239
1973
1984
1200
1032 84.6 0.1 T
X
X
DNL
DNL
Vallet et al., 1978
Vallet et al., 1988
FRA364 1993 895 78.3 0.66 T X DNL Vallet et al., 1996
GER192 1977 1080 77.6 0.67 O X Ld/Ln Plannungsburo Obermyer, 1983, IF- Studie II A
7.3.2.2-30 pp. 295;
Knall and Schumer, 1983
GER372 1985 564 82 0.18 T X DNL Kastka et al., 1995
GER373 1987 516 74.6 1 T X DNL Kastka et al., 1995
GER374 1993 578 74 0.88 T DNL
ITL350 1990 908 73 1 T DNL Bertoni et al., 1993
JAP369 1996 837 78 0.92 O LEQ 24 Sato et al., 2002, Fig. 3
JAP382 1997 780 79 0.86 T DNL Sato et al., 2000
NET106 1974 383 68.6 0.96 O X LEQ 24 de Jong, 1983, Fig. 6
NET240 1984 581 75.3 0.64 T X DNL Diamond and Walker, 1986
NET258 1975 622 7.3 0.66 O X LEQ 24 Bitter et al,. 1982, Fig. 3
NET276 1983 798 69.6 0.36 O X LEQ 24 Miedema and van den Berg, 1985, Fig. 10, p.78
NET361 1993 4038 78.3 0.74 T X DNL de Jong et al., 1995
NET362 1984 1322 75 0.96 T X DNL Ericz et al., 1986
SWE142 1976 1377 85.3 0.5 O X LEQ 24 Rylander et al,. 1977, Table 2
SWE165 1976 464 92 0.45 F X DNL Rylander et al., 1977, Table 2
SWE368 1996 1316 76.6 0.92 T DNL Sato et al., 2000
SWE526 2000 956 78.3 0.88 O Ld/Ln Ohrstrom et al., 2006
SWI053 1971 3939 81.6 0.93 F X DNL Graf et al,.1974 Table 4.18 pp. 114
SWI173d 1978 1607 O X Ld/Ln Wehrli et al., 1978
TRK367 1995 154 74.3 1 T DNL Kurra et al., 1995
UKD071 1972 2933 77 0.65 F X DNL Langdon, 1976 a, 1976 b
UKDO72c 1972 1235 X DNL Hapuarachchi, 1980
UKD157 1977 1363 78.3 0.9 T X DNL Atkins Research and Devel, 1979
UKD238 1984 608 78.3 0.88 T X DNL Diamond and Walker, 1986
UKD242 1982 2097 77.3 0.59 T X DNL Atkins et al., 1984
37e 78.3 0.7 35 26/26
aSource of data used in this paper: F, Fidell; O, original; T, TNO.bMetric indicates this study’s data source metric. DNL was (1) supplied, (2) calculated from Ld/Ln, (3) estimated as LEQ-24þ 3 dB for road traffic noise, or
estimated as LEQ-24þ 4 dB for rail noise.cData for FRA-092 and UKD-072 were supplied by TNO but were not considered in the current analysis because too few interviews per site were conducted
to yield stable estimates of population proportions.dSWI-173 contains annoyance judgments separately by day and night only (briefly mentioned).eThe bottom line contains totals or averages as appropriate.
J. Acoust. Soc. Am., Vol. 131, No. 4, April 2012 Schomer et al.: Road and rail community tolerance level 2775
Redistribution subject to ASA license or copyright; see http://acousticalsociety.org/content/terms. Download to IP: 78.91.103.24 On: Wed, 17 Jun 2015 10:12:08

III. RESULTS
A. General findings
The panels of Fig. 3 display the fits of findings of sev-
eral road traffic and rail noise social surveys to Eq. (2) (“the
effective loudness function”). Each data point represents a
paired observation of the prevalence of high annoyance
among respondents at an interviewing site with the site’s
transportation noise exposure level. The solid portion of the
effective loudness function in each panel of Fig. 3 is the
range of primary interest for policy and regulatory analyses.
The dashed extensions plot the behavior of the function out-
side the range of primary interest.
Table I summarizes estimates of CTL values and coeffi-
cients of determination (R2) for surveys of the annoyance of
road traffic noise. Each survey is characterized in the table
by its Bassarab et al. (2009) catalog number, the year in
which the study started, and numbers of completed inter-
views. Data for FRA-092 (Vallet et al., 1978) and UKD-072
(Hapuarachchi, 1980) were supplied by TNO but were not
considered in the current analysis because too few interviews
per site were conducted to yield stable estimates of popula-
tion proportions, and because no information was reported to
permit combination of responses across interviewing sites.
The findings of SWI-173 were not combined with those of
other studies because no overall (day and night together)
annoyance judgment was reported.
B. Road traffic noise studies
Thirty-four studies were available for CTL analysis. The
mean CTL in the 34 studies included in the general analysis
of Table I is Lct¼ 78.3 dB, with a standard deviation of
5.1 dB. The average R2 value for predicted vs. observed
annoyance prevalence rates in these studies is 0.7.
Figure 4 shows (1) the entire set of road traffic noise
data, (2) the fit of these data to the average effective loudness
function from Table I, and (3) the Miedema and Vos (1998)
function for road traffic noise. The two functions differ from
each other by no more than 62.5% throughout the range of
primary interest. The correlations between observed and pre-
dicted annoyance prevalence rates for the two functions in
the region from 55 dB�Ldn� 75 dB are indistinguishable:
r¼ 0.52206 and r¼ 0.52202, respectively, for the CTL anal-
ysis and that of Miedema and Vos (1998).4
The form of the distribution of CTL values for the 34
road traffic noise surveys in Table I does not differ signifi-
cantly (Kolmogorov–Smirnov statistic¼ 0.17, critical
value¼ 0.27 for N¼ 34) from a Gaussian distribution with a
mean and standard deviation of 78.3 and 5.1 dB. The standard
error of Lct¼ 0.9 dB, and the 95% confidence bounds on the
statistic, are 76.5 dB� Lct� 80.1 dB. It follows that CTL val-
ues in 68% of communities lie within in the range
73.2 dB� Lct� 83.4 dB and that CTL values in 95% of
communities lie within the range 68.1 dB� Lct� 88.5 dB. In
other words, the 62 r range of Lct (from 68 to 89 dB) is
approximately equal to the 95% prediction interval. This
range is quite similar to the roughly 20 dB range in DNL for
any given annoyance prevalence rate greater than about 20%
(see Fig. 4).
C. Rail noise studies
Table II summarizes estimates of CTL and coefficients
of determination (R2) for surveys of the annoyance of rail
noise. Data for NET-361 (de Jong et al., 1995) were not con-
sidered in the current analysis because too few interviews
per site were conducted to yield stable estimates of popula-
tion proportions, and because no information was reported to
permit combination of responses across interviewing sites.
Unless otherwise noted, DNL values were supplied by the
reference or estimated as the 24-h LEQþ 4 dB.
Estimates of CTL are preferably based on observations
made within definable communities. Fidell et al. (2011)
observe that the fit of data sets to the assumed growth rate
function is poorer when a CTL is inferred from question-
naire responses that have been combined across multiple
communities. For example, segregating the data of Ohr-
strom and Skanberg (1995) on the annoyance of rail noise
into six separate cities yielded much better fits than for the
combined data set. Moreover, the six cities were clearly di-
visible into sets of three cities with high and three cities
with low vibration levels. The average difference in CTL
between the cities with high vibration levels and the cities
with low vibration levels is about 15 dB. Because the data
for the six cities provide such good individual community
fits and divide so clearly on the basis of vibration levels, the
six cities have been considered individually in the current
analysis.
Table III contains the same information as Table II
(except the data for the six individual cities have been substi-
tuted for SWE–365), and Table III is divided into three
groups. Two of the groups represent conventional (lower
speed) freight or passenger trains. The first group includes
surveys for which high levels of vibration and/or rattles were
reported.5 NET-276 has been included in the high vibration
group for two reasons. First, the authors of NET-276 indicate
that vibration was especially important in one layout condi-
tion, and important in the second of three layout conditions.
Second, the study concerned street-running tram noise rather
than noise from trains on separate rights of way. Homes of
respondents may have been closer to the tracks than in theFIG. 4. Comparison of the average effective loudness function and the Mie-
dema and Vos function for road traffic noise data.
2776 J. Acoust. Soc. Am., Vol. 131, No. 4, April 2012 Schomer et al.: Road and rail community tolerance level
Redistribution subject to ASA license or copyright; see http://acousticalsociety.org/content/terms. Download to IP: 78.91.103.24 On: Wed, 17 Jun 2015 10:12:08

case of many railroad alignments because they lack a back-
yard buffer distance.
The low and high vibration trains form readily apparent
groups in which high levels of vibrations and rattles appear
to be associated with low tolerance for noise exposure and
vice versa. The Shinkansen train does not fit well in either
group. Rather, it forms a third group7 composed solely of the
Japanese high speed Shinkansen train (Yano et al., 2004;
Bassarab et al. 2009, JPN-530). Thus the three groups of
train data are plotted separately in Fig. 5 and separate effec-
tive loudness functions are fitted to each group.
Estimates of CTL values for the low vibration trains are
Lct¼ 87.8 dB (with a standard deviation of 3.5 dB) for the
low vibration group and Lct¼ 75.8 dB (with a standard devi-
ation of 4.0 dB) for the high vibration group. In other words,
communities grouped as described in the preceding text are
about 12 dB more tolerant of train noise accompanied by
low vibration levels than of the noise of trains accompanied
by high vibration levels. By way of contrast, the average
CTL for all trains (except the Shinkansen) grouped together
is 83.5 dB (see Table II). Tolerance for the noise of a high
speed train in a single study was found to be about 15 dB
lower than for trains accompanied by high vibration levels.
IV. DISCUSSION
A. Adequacy of duration-corrected loudnesshypothesis
Causality is difficult to establish in any non-experimental
analysis.8 The present findings nonetheless indicate that the
prevalence of annoyance with transportation noise in com-
munities may be usefully predicted from the duration-
corrected loudness of their noise exposures. The predictive
utility of community-specific offsets (tolerance levels) is par-
ticularly clear among respondents interviewed within bonafide communities. The close resemblance of the Miedema and
Vos (1998) descriptive curve and effective loudness functions
to the road traffic noise data (Fig. 4) provides further prag-
matic reason to believe that the dose-related determinants of
annoyance are driven by duration-corrected loudness.
B. Stability of estimates of CTL values
The mean and standard deviation of CTL for the set of
road and rail studies summarized in Appendices A and B
(mean Lct¼ 78.3 dB, standard deviation of Lct¼ 5.1 dB) differ
little from those calculated from information assembled by
Miedema and Vos (1998) and by Fidell et al. (1989). The
mean for the studies analyzed by Miedema and Vos (1998)
was Lct¼ 79.0, and the average for studies included in Fidell
et al. (1989) or that come from original data is within 0.1 dB
of the same value. The respective standard deviations of these
subsets of the data are 5.5 and 6.3 dB, respectively. The minor
variations in community tolerances for road and rail exposure
from one published analysis to the next, along with the rela-
tively small standard deviations, suggest that additional sur-
vey findings are unlikely to greatly affect these values.
C. Comparison of CTL and regression approaches
Even though predictions of annoyance prevalence rates
based on the mean CTL for road noise hardly differ from
those of the descriptive function of Miedema and Vos
(1998), the former predictive approach offers a number of
advantages over the latter. First, predictions made on the ba-
sis of both DNL values and community-specific tolerances
for noise exposure account for half-again as much variance
as predictions based on DNL alone (Fidell et al., 2011). Sec-
ond, knowledge of a CTL for a particular community
TABLE II. Study information, results, and inclusion in summaries for rail noise.
Study
Year of
study
Number of
subjects CTL R2
Studies used in
this papera
Studies used by
Miedema and Vos Metricb Reference
DEN200 1979 615 78.3 0.56 F DNL Anderson et al., 1980
FRA063 1972 350 84.3 0.95 P X DNL Aubree, 1973
GER192 1977 1080 86.3 0.34 O X Ld/Ln Plannungsburo Obermyer, 1983,
IF- Studie II A 7.3.2.2-30 pp. 295;
Knall and Schumer, 1983
JAP370 1994 1828 75 0.86 O LEQ-24 Yano et al., 1998
JAP530 2003 724 60.6 0.96 LEQ-24 Yano et al., 2004
NET153 1977 671 91.6 0 V X DNL de Jong, 1979
NET276 1983 798 78.6 0.34 T X DNL Miedema and van den Berg, 1985
NET361c X DNL de Jong et al., 1995
SWE165 1976 464 84.6 0.2 F X DNL Ahrlin and Rylander, 1979
SWE228 1978 877 83.6 0.47 F X DNL Ahrlin and Rylander, 1979
SWE365 1989 3216 81 0.34 O X LEQ-24 Ohrstrom and Skanberg, 1996
UKD116 1975 1453 92 0.33 F X DNL Fields and Walker, 1977
11d 83.5 0.49 10 9/9
aSource of data used in this paper: F, Fidell; O, original; T, TNO.bMetric indicates this study’s data source metric. DNL was (1) supplied, (2) calculated from Ld/Ln, (3) estimated as LEQ-24þ 3 dB for road traffic noise, or
estimated as LEQ-24þ 4 dB for rail noise.cData for NET-361 (rail) were supplied by TNO but were not considered in the current analysis because too few interviews per site were conducted to yield
stable estimates of population proportions.dThe bottom line contains totals or averages as appropriate; the averages exclude JAP-530.
J. Acoust. Soc. Am., Vol. 131, No. 4, April 2012 Schomer et al.: Road and rail community tolerance level 2777
Redistribution subject to ASA license or copyright; see http://acousticalsociety.org/content/terms. Download to IP: 78.91.103.24 On: Wed, 17 Jun 2015 10:12:08

permits more accurate and precise prediction of its reactions
to changes in noise exposure than a generic description of
reactions in a nominally average community. Third, expres-
sion of differences among communities in their annoyance
prevalence rates in units of DNL aids policy decisions about
matters such as the recommended dimensions of buffer
zones around different noise sources in different commun-
ities. In general, a systematic framework for modeling reac-
tions to transportation noise exposure also improves the
rationale for policy debate and suggests directions for further
research that can improve genuine understanding of commu-
nity response to noise exposure.
D. Definition of community
Not all of the data sets fit the effective-loudness function
as well as the examples shown in Fig. 3. Fidell et al. (2011)
observe that the fit of data sets to the assumed growth rate
function is better when response information is not combined
across multiple communities. They noted, for example, that
TABLE III. CTL values for three categories of rail noise studies.
Study Sourcea CTI R2 Notes Groupb Metric Reference for vibration level
DEN-200 F 78.3 0.56 H DNL Anderson et al., 1980 Found diesel and especially freight
trains more annoying than electric passenger trains. Listed in the following
order for predicting annoyance: noise, repair work at night, vibrations,
acceleration noise, breaking noise, and dust. pp. 2-3.
JAP-370 O 75.0 0.86 H LEQ 24 hrþ 4 Yano et al., 1998, Fig. 6: Vibration is the second biggest
factor affecting annoyance in this study.
NET-276 T 78.6 0.34 trams H DNL This study concerned tram noise rather than rail noise so the
houses should be closer to the tracks than in the case of most railroads
because there is no backyard buffer distance, and the authors indicate
that vibration was especially important in one tram layout configuration
(37% HA), and important in the 2nd (18% HA) of 3 (10% HA) configurations.
Miedema and van den Berg, 1985, pp. 63, vraag 40, 41
SWE-365 A O 75.0 0.95 Saffle H LEQ24hrþ 4 Orstrom and Skanberg, 1996, Table 2. Data source:
Orstrom and Skanberg, 1995, Table 10
SWE-365 B O 68.6 0.86 Kungsbacka H LEQ24hrþ 4 Orstrom and Skanberg, 1996. Table 2. Data source:
Orstrom and Skanberg. 1995 Table 10
SWE-365 C O 79.3 0.94 Partille H LEQ24hrþ 4 Orstrom and Skanberg, 1996, Table 2. Data source:
Orstrom and Skanberg, 1995, Table 10
75.3 0.8 Average
4.2 0.3 Standard deviation
FRA-063 F 84.3 0.95 L DNL Aubree, 1973. Finds “distance from the tracks” the
least important variable of 7 that correlate with annoyance (R2¼ 0.015).
Vibration was the third of four variables cited as distance dependent.
The other 3 were odor, dust, and fear of accidents. pp. 5-7
GER-192 O 86.3 0.34 L DNL calculated
from Ld and Ln
Knall and Schumer, 1983. Although noise-induced vibrations
and rattles were 1 of 13 predictor variables in the study, they
were not included in the group of 8 more important variables
demonstrating an effect (see Tables 2 and 3 and pp. 325).
Data Source: Planugsburo Obermeyer, 1983, pp. 24 IF - studie II 4.3
and 295 IF - studie II A 7.3.2.2-30
NET-153 T 91.6 0 9 different cities L DNL de Jong, 1979. There is no mention of vibration as an issue or factor.
SWE-165 F 84.6 0.2 tram and rail L DNL Ahrlin and Rylander, 1979, “…the indications of
vibrations was higher for road traffic noise but lower for noise
from trains and tramways,” pp. 461
SWE-228 F 83.6 0.47 L DNL Ahrlin and Rylander, 1979, “…the indications of
vibrations was higher for road traffic noise but lower for noise
from trains and tramways,” pp. 461
SWE-365 D O 90.6 0.97 Hassleholm L LEQ24hrþ 4 Orstrom et al., 1996, Table 2. Data source:
Orstrom and Skanberg, 1995, Table 10
SWE-365 E O 91.3 0.7 Huskvarna L LEQ24hrþ 4 Orstrom et al. 1996 Table 2. Data source:
Orstrom and Skanberg. 1995 Table 10
SWE-365 F O 86.0 0.98 Lund L LEQ24hrþ 4 Orstrom et al. 1996 Table 2. Data source:
Orstrom and Skanberg. 1995 Table 10
UKD-116 O 92.0 0.55 L DNL Fields and Walker 1977 vibration levels unclear,
seem to be mainly low.4 Data source: Fields and Walker 1977 p7.13 fig 7.3
87.8 0.6 Average
3.5 0.4 Standard deviation
JAP-530 O 60.6 0.96 Shinkansen S LEQ24hrþ 4 Yano et al., 2004
aData sources: F, Fidell et al. 1991; O, original data; T, TNO.bGroup: L, low vibration levels; H, high vibration levels; S, Shinkansen.
2778 J. Acoust. Soc. Am., Vol. 131, No. 4, April 2012 Schomer et al.: Road and rail community tolerance level
Redistribution subject to ASA license or copyright; see http://acousticalsociety.org/content/terms. Download to IP: 78.91.103.24 On: Wed, 17 Jun 2015 10:12:08

separating the data of Ohrstrom and Skanberg (1995) on the
annoyance of rail noise by city yielded far better fits than for
the combined set of half a dozen cities. Figure 3(f) contains
the data and CTL curve for Partille, one of the six cities.
Some surveys are designed to interview respondents in
multiple neighborhoods of different cities to solicit annoyance
self-reports under the widest possible range of noise doses.
This design tacitly assumes that community-level influences
on annoyance prevalence rates are considerably weaker than
those associated with exposure level alone. One such study is
that of Rylander (1977; Bassarab et al. (2009) SWE-142),
conducted in Gothenburg, Stockholm, and Visby. According
to Rylander, “Investigation areas were chosen along streets in
residential zones in the city center, as well as in suburban
areas where the traffic flow pattern varied between free flow
and intermittent flow.” Rylander further indicates that “The
areas were chosen as to include the largest variation practi-
cally possible in terms of number of vehicles, number of
heavy vehicles (lorries and buses) as well as LAq levels.”
A sampling plan that calls for interviews to be conducted
in different cities, inner-city and suburban neighborhoods,
under high and low and continuous and intermittent traffic
flow conditions, make it unlikely that the resulting data points
reflect the opinions of distinct communities. Regions, housing
patterns, and noise sources all differ from one interviewing
site to another. It is therefore not surprising that Fig. 6 depicts
a cloud of data points, which do not fit an effective-loudness
function well. The data divided by city also do not fit a single
effective loudness function well, perhaps because each of the
cities includes a range of communities (urban downtown to
suburban) and exposure conditions.
This example suggests that study designs which attempt to
maximize noise exposure differences at the expense of ignoring
potential community-level differences may not be the most pro-
ductive. The term “community” in community tolerance level
is specific with respect to geographic region and, very probably,
with respect to other social factors as well.
E. Penalties and bonuses
Based on the CTL values derived in the preceding text
and by Fidell et al. (2011), the grand average CTL for air-
craft, road traffic, and conventional rail noise are
Lct¼ 73.3 dB, Lct¼ 78.3 dB, and Lct¼ 83.5 dB, respectively.
Communities are thus 5 dB less tolerant on average of air-
craft noise than of road traffic noise. (In other words, decibel
for decibel of exposure level, aircraft are reported to be 5 dB
more annoying than road traffic noise.) Mean CTL values
for conventional trains are 5 dB greater than for road traffic
noise; i.e., trains are reported to be 5 dB less annoying than
road traffic noise. This 5 dB aircraft penalty and this 5 dB
railroad bonus each compares quite favorably with ISO
1996-1 (ISO 2003), which gives the range of þ 3 toþ 6 dB
as the aircraft penalty and �3 to �6 dB as the railroad bonus,
both with midranges of 4.5 dB.
However, as shown in the preceding text, the annoyance
of rail noise appears to be strongly related to the presence or
absence of vibration and/or rattles, and hence, two predictions
are preferable for trains: one for trains inducing appreciable
vibration and/or rattle and the other for train noise unaccom-
panied by such vibration. The corresponding average CTLs
are 75.8 and 87.8, respectively. That is, compared to road traf-
fic, trains accompanied by appreciable vibration are about 2-
3 dB more annoying; and conventional trains unaccompanied
by appreciable vibration are about 9-10 dB less annoying.
These findings help to resolve some of the controversy
about a “5 dB bonus” for railroad noise. While 5 dB is the
correct average difference in CTL, such a simple solution as
a universal railroad bonus would be a mistake. A railroad bo-
nus appears justifiable only for conventional trains without
vibration, whereas a small penalty is justifiable for conven-
tional trains accompanied by appreciable vibration. The
12 dB difference in CTL values for trains with and without
significant vibrations and/or rattles seems to justify a penalty
for the presence of noise induced vibration and/or rattles,
consistent with other research findings, (Schomer and Neat-
hammer, 1987; Fidell et al., 2002). The finding further dem-
onstrates the utility of CTL-based analyses.
F. Uncertainty of estimates of annoyance prevalencerates
A prediction interval quantifies a range of values that
encompass a stated proportion of a set of empirical estimates
of annoyance prevalence rates (cf. Fidell and Schomer,
2007). Fidell et al. (2011) find the mean CTL for aircraft to
be 73.3 dB with a standard deviation of 7.0 dB. These
FIG. 5. Effective loudness functions overlaid on corresponding rail noise
survey data.
FIG. 6. Fit of data for SWE-142 to community tolerance function.
J. Acoust. Soc. Am., Vol. 131, No. 4, April 2012 Schomer et al.: Road and rail community tolerance level 2779
Redistribution subject to ASA license or copyright; see http://acousticalsociety.org/content/terms. Download to IP: 78.91.103.24 On: Wed, 17 Jun 2015 10:12:08

statistics imply a 95% prediction interval of about
73.3 6 14 dB. Like CTLs for aircraft noise, CTLs for road
traffic are plausibly normally distributed. Since the mean
value of CTL for road traffic noise is Lct¼ 78.3 dB (with a
standard deviation of 5.1 dB), the 95% prediction interval is
78.3 6 10.2 dB.
Two predictions are preferable for conventional trains:
one for trains inducing appreciable vibration and/or rattle
and the other for train noise unaccompanied by such vibra-
tion. The corresponding means and standard deviations are
Lct¼ 75.8 dB with a standard deviation of 4.0 dB for rail
noise that includes appreciable vibration and rattles and
Lct¼ 87.8 dB with a standard deviation of 3.5 dB for rail
noise lacking appreciable vibration or rattle. The 5% predic-
tion intervals for these two vibration conditions (high and
low) are 75.8 6 8.0 dB and 87.8 6 7.0 dB, respectively.
If it is not known whether a new rail line will produce
appreciable vibration or rattle, prediction interval bounds
should be based on the lower bound of the lower distribution
and the upper bound on the upper distribution. The mean
and standard deviation of the entire set of rail noise data
should not be used to estimate prediction intervals because
the distribution must be bimodal rather than normal. For the
present example, the 95% prediction interval would extend
from 67.8 to 94.8 dB.
G. Changes in community tolerance for noiseexposure over time
Figure 7 is a plot of CTLs for road and rail noise by year.
The slope of a linear regression line fit to the entire set of 34
studies over 34 yr is �0.09 dB/yr, which does not differ sig-
nificantly from zero. Table IV illustrates the range of slopes
during various multi-year time periods. The slopes are mostly
positive or zero, suggesting that community tolerance for
road and rail noise is not systematically decreasing over time.
H. A potential linkage between CTLs andsoundscapes
The current study and that of Fidell et al. (2011) reveal
high correlations between effective loudness functions and
the prevalence of annoyance when interviewing sites all lie
within a well defined community. Researchers interested in
community-wide assessments of soundscapes (cf. Schomer
et al., 2010) are currently seeking ways to quantify the non-
acoustic factors that contribute to definitions of soundscapes.
Just as a CTL provides a single number quantity that
expresses the aggregate influence of non-DNL related influ-
ences on annoyance, it may also express the aggregate influ-
ence all of the non-acoustic factors inherent in soundscapes.
These may include attitudes toward noise source operators,
the familiarity of certain noises, and expectations about
noises that may or may not be considered appropriate in par-
ticular residential or other settings.
I. Applications of CTL to noise research and noiseassessment
One of the benefits of CTL analyses is that they permit
expression of differences in reaction to transportation noise
among different communities, noise sources, and noise expo-
sure conditions in decibel units of DNL. The position of
FICON (1992) is that “one size fits all”: for all forms of
transportation noise, in all communities. CTL analysis per-
mits categorization of exposure conditions without dictating
policy interpretations for the various conditions.
CTL may also permit examination of factors inherent in
DNL that are currently assumed to be correct. For example, it
is assumed, for a variety of reasons, that nighttime noise expo-
sure warrants a 10 dB annoyance penalty. At least two of the
studies recently reviewed, SWI-173 and GER-192, examined
annoyance separately by daytime and nighttime. SWI-173
indicated, for road traffic, about a 3 dB increase in sensitivity
to nighttime versus daytime noise exposure. GER-192 studied
both road traffic noise and rail noise but found no appreciable
difference attributable to time of day of noise exposure. Such
results resemble those of Fields (1985), who found no particu-
lar justification for the 10 dB nighttime penalty, and with
those of Fidell and Schultz (1980), who concluded that avail-
able data did “not support rigorous arguments for or against
time-of-day weighting factors.”
TABLE IV. Slopes of linear regressions of year of study on CTL values during various time periods.
Annual period Number of studies Studies per Year Slope (dB/decade) Description Time period
1969 to 2003 34 0.97 �0.9 Not different from zero Last 34 years
1979 to 2003 19 0.79 þ 1.9 Weakly positive Last 24 years
1989 to 2003 11 0.79 þ 9.2 Strongly positive Last 14 years
1969 to 2003 34 0.97 �0.9 Not different from zero First 34 years
1969 to1993 25 1.00 �3.4 Negative First 24 years
1969 to 1983 16 1.07 þ 0.8 Not different from zero First 14 years
FIG. 7. Community tolerance for road and rail noise by year in which study
began.
2780 J. Acoust. Soc. Am., Vol. 131, No. 4, April 2012 Schomer et al.: Road and rail community tolerance level
Redistribution subject to ASA license or copyright; see http://acousticalsociety.org/content/terms. Download to IP: 78.91.103.24 On: Wed, 17 Jun 2015 10:12:08
Such observations, however sketchy, suggest that a fur-
ther review of the 10 dB nighttime penalty might be in order.
In a similar fashion, CTL analysis permits quantitative com-
parisons of the benefit of residential home insulation efforts
around airports and other noise sources. Two road noise
studies in the current compilation (NET-106 and NET-276)
speak to this issue.
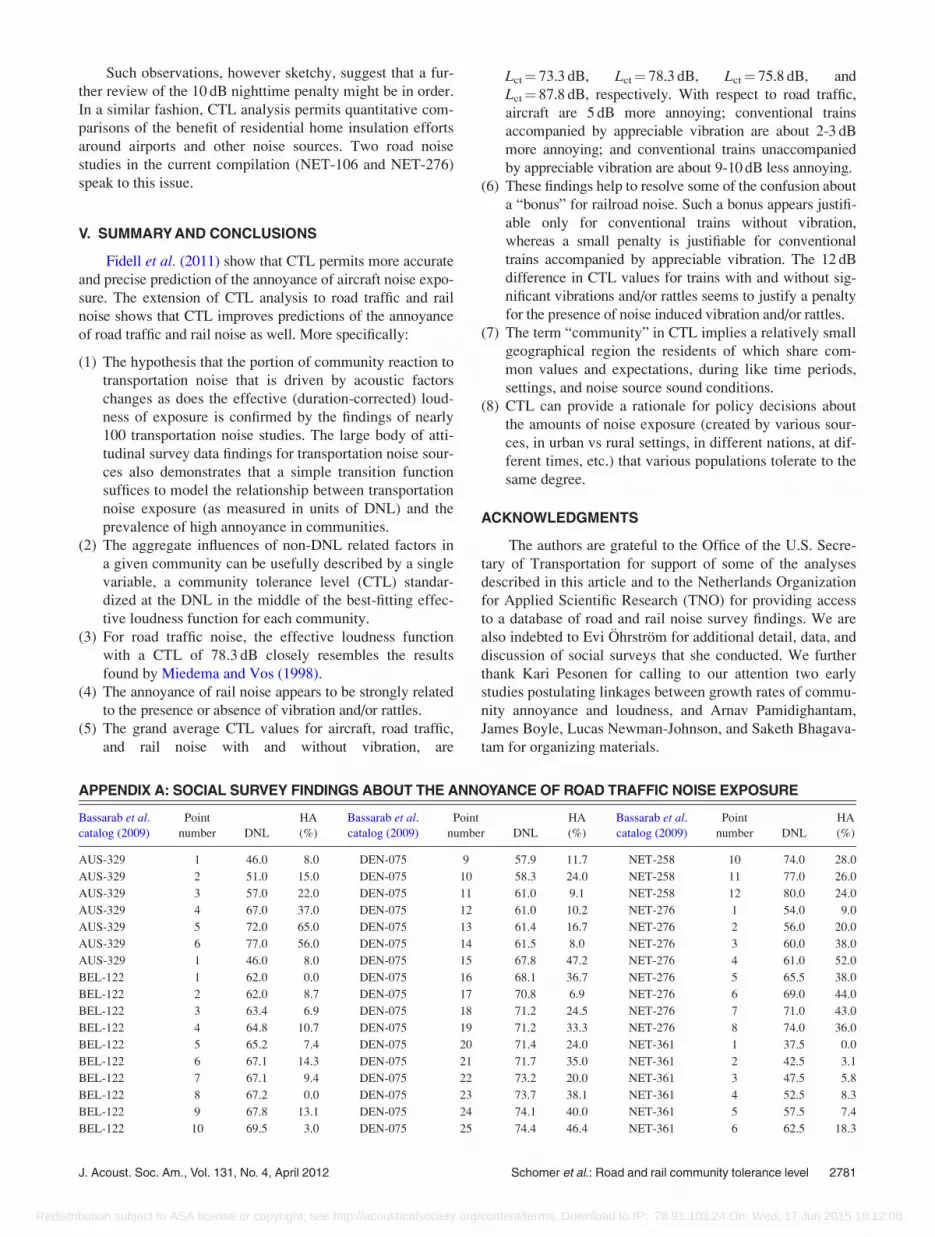
V. SUMMARY AND CONCLUSIONS
Fidell et al. (2011) show that CTL permits more accurate
and precise prediction of the annoyance of aircraft noise expo-
sure. The extension of CTL analysis to road traffic and rail
noise shows that CTL improves predictions of the annoyance
of road traffic and rail noise as well. More specifically:
(1) The hypothesis that the portion of community reaction to
transportation noise that is driven by acoustic factors
changes as does the effective (duration-corrected) loud-
ness of exposure is confirmed by the findings of nearly
100 transportation noise studies. The large body of atti-
tudinal survey data findings for transportation noise sour-
ces also demonstrates that a simple transition function
suffices to model the relationship between transportation
noise exposure (as measured in units of DNL) and the
prevalence of high annoyance in communities.
(2) The aggregate influences of non-DNL related factors in
a given community can be usefully described by a single
variable, a community tolerance level (CTL) standar-
dized at the DNL in the middle of the best-fitting effec-
tive loudness function for each community.
(3) For road traffic noise, the effective loudness function
with a CTL of 78.3 dB closely resembles the results
found by Miedema and Vos (1998).
(4) The annoyance of rail noise appears to be strongly related
to the presence or absence of vibration and/or rattles.
(5) The grand average CTL values for aircraft, road traffic,
and rail noise with and without vibration, are
Lct¼ 73.3 dB, Lct¼ 78.3 dB, Lct¼ 75.8 dB, and
Lct¼ 87.8 dB, respectively. With respect to road traffic,
aircraft are 5 dB more annoying; conventional trains
accompanied by appreciable vibration are about 2-3 dB
more annoying; and conventional trains unaccompanied
by appreciable vibration are about 9-10 dB less annoying.
(6) These findings help to resolve some of the confusion about
a “bonus” for railroad noise. Such a bonus appears justifi-
able only for conventional trains without vibration,
whereas a small penalty is justifiable for conventional
trains accompanied by appreciable vibration. The 12 dB
difference in CTL values for trains with and without sig-
nificant vibrations and/or rattles seems to justify a penalty
for the presence of noise induced vibration and/or rattles.
(7) The term “community” in CTL implies a relatively small
geographical region the residents of which share com-
mon values and expectations, during like time periods,
settings, and noise source sound conditions.
(8) CTL can provide a rationale for policy decisions about
the amounts of noise exposure (created by various sour-
ces, in urban vs rural settings, in different nations, at dif-
ferent times, etc.) that various populations tolerate to the
same degree.
ACKNOWLEDGMENTS
The authors are grateful to the Office of the U.S. Secre-
tary of Transportation for support of some of the analyses
described in this article and to the Netherlands Organization
for Applied Scientific Research (TNO) for providing access
to a database of road and rail noise survey findings. We are
also indebted to Evi Ohrstrom for additional detail, data, and
discussion of social surveys that she conducted. We further
thank Kari Pesonen for calling to our attention two early
studies postulating linkages between growth rates of commu-
nity annoyance and loudness, and Arnav Pamidighantam,
James Boyle, Lucas Newman-Johnson, and Saketh Bhagava-
tam for organizing materials.
APPENDIX A: SOCIAL SURVEY FINDINGS ABOUT THE ANNOYANCE OF ROAD TRAFFIC NOISE EXPOSURE
Bassarab et al.
catalog (2009)
Point
number DNL
HA
(%)
Bassarab et al.
catalog (2009)
Point
number DNL
HA
(%)
Bassarab et al.
catalog (2009)
Point
number DNL
HA
(%)
AUS-329 1 46.0 8.0 DEN-075 9 57.9 11.7 NET-258 10 74.0 28.0
AUS-329 2 51.0 15.0 DEN-075 10 58.3 24.0 NET-258 11 77.0 26.0
AUS-329 3 57.0 22.0 DEN-075 11 61.0 9.1 NET-258 12 80.0 24.0
AUS-329 4 67.0 37.0 DEN-075 12 61.0 10.2 NET-276 1 54.0 9.0
AUS-329 5 72.0 65.0 DEN-075 13 61.4 16.7 NET-276 2 56.0 20.0
AUS-329 6 77.0 56.0 DEN-075 14 61.5 8.0 NET-276 3 60.0 38.0
AUS-329 1 46.0 8.0 DEN-075 15 67.8 47.2 NET-276 4 61.0 52.0
BEL-122 1 62.0 0.0 DEN-075 16 68.1 36.7 NET-276 5 65.5 38.0
BEL-122 2 62.0 8.7 DEN-075 17 70.8 6.9 NET-276 6 69.0 44.0
BEL-122 3 63.4 6.9 DEN-075 18 71.2 24.5 NET-276 7 71.0 43.0
BEL-122 4 64.8 10.7 DEN-075 19 71.2 33.3 NET-276 8 74.0 36.0
BEL-122 5 65.2 7.4 DEN-075 20 71.4 24.0 NET-361 1 37.5 0.0
BEL-122 6 67.1 14.3 DEN-075 21 71.7 35.0 NET-361 2 42.5 3.1
BEL-122 7 67.1 9.4 DEN-075 22 73.2 20.0 NET-361 3 47.5 5.8
BEL-122 8 67.2 0.0 DEN-075 23 73.7 38.1 NET-361 4 52.5 8.3
BEL-122 9 67.8 13.1 DEN-075 24 74.1 40.0 NET-361 5 57.5 7.4
BEL-122 10 69.5 3.0 DEN-075 25 74.4 46.4 NET-361 6 62.5 18.3
J. Acoust. Soc. Am., Vol. 131, No. 4, April 2012 Schomer et al.: Road and rail community tolerance level 2781
Redistribution subject to ASA license or copyright; see http://acousticalsociety.org/content/terms. Download to IP: 78.91.103.24 On: Wed, 17 Jun 2015 10:12:08

Bassarab et al.catalog (2009)
Point
number DNL
HA
(%)
Bassarab et al.catalog (2009)
Point
number DNL
HA
(%)
Bassarab et al.catalog (2009)
Point
number DNL
HA
(%)
BEL-122 11 69.6 19.2 DEN-075 26 74.4 43.6 NET-361 7 67.5 16.7
BEL-122 12 70.3 16.0 DEN-075 27 75.1 30.0 NET-362 1 62.5 15.1
BEL-122 13 71.3 10.7 DEN-075 28 76.1 83.3 NET-362 2 67.5 36.2
BEL-122 14 71.7 17.2 DEN-529 1 62.5 4.8 NET-362 3 52.5 1.8
BEL-122 15 72.6 11.1 DEN-529 2 67.5 7.2 NET-362 4 57.5 8.8
BEL-122 16 72.6 16.7 DEN-529 3 72.5 17.0 SWE-142 1 73.0 23.0
BEL-122 17 72.8 13.9 DEN-529 4 77.5 28.7 SWE-142 2 71.0 34.0
BEL-122 18 73.0 9.1 FRA-041 1 63.9 16.0 SWE-142 3 76.0 46.0
BEL-122 19 73.0 20.0 FRA-041 2 66.6 13.0 SWE-142 4 79.0 32.0
BEL-122 20 73.6 17.5 FRA-041 3 69.4 27.5 SWE-142 5 73.0 12.0
BEL-122 21 73.7 18.5 FRA-041 4 72.1 28.0 SWE-142 6 74.0 32.0
BEL-122 22 74.3 7.1 FRA-041 5 74.9 44.0 SWE-142 7 73.0 14.0
BEL-122 23 74.4 31.7 FRA-041 6 77.6 43.0 SWE-142 8 71.0 0.0
BEL-122 24 74.5 12.2 FRA-041 7 80.4 50.0 SWE-142 9 64.0 1.0
BEL-122 25 75.0 55.6 FRA-041 8 83.1 60.0 SWE-142 10 68.0 4.0
BEL-122 26 75.2 50.0 FRA-239 1 72.5 27.8 SWE-142 11 64.0 6.0
BEL-122 27 75.5 28.6 FRA-239 2 62.5 4.4 SWE-142 12 70.0 9.0
BEL-122 28 75.5 11.1 FRA-239 3 72.5 11.4 SWE-142 13 63.0 3.0
BEL-122 29 75.7 38.5 FRA-239 4 72.5 2.4 SWE-142 14 72.0 25.0
BEL-122 30 76.5 42.9 FRA-239 5 57.5 12.3 SWE-142 15 71.0 25.0
BEL-122 31 78.2 31.3 FRA-239 6 67.5 16.9 SWE-142 16 75.0 19.0
BEL-137 1 66.7 0.0 FRA-239 7 57.5 3.5 SWE-142 17 70.0 11.0
BEL-137 2 69.3 16.7 FRA-239 8 62.5 12.6 SWE-142 18 77.0 16.0
BEL-137 3 64.7 17.7 FRA-239 9 67.5 20.8 SWE-142 19 64.0 0.0
BEL-137 4 70.2 26.1 FRA-364 1 57.5 22.5 SWE-165 1 73.8 14.0
BEL-137 5 76.2 38.1 FRA-364 2 62.5 16.6 SWE-165 2 63.1 0.0
BEL-137 6 64.9 3.9 FRA-364 3 67.5 26.5 SWE-165 3 70.6 1.0
BEL-137 7 75.5 53.3 FRA-364 4 72.5 23.8 SWE-165 4 71.7 0.0
BEL-137 8 79.2 41.2 FRA-364 5 77.5 45.5 SWE-165 5 73.8 7.0
BEL-137 9 65.3 6.7 GER-192 1 74.6 41.7 SWE-165 6 63.1 3.0
BEL-137 10 65.6 0.0 GER-192 2 62.7 12.3 SWE-368 1 52.5 1.8
BEL-137 11 72.4 38.5 GER-192 3 57.0 16.0 SWE-368 2 57.5 12.2
BEL-137 12 61.5 20.0 GER-192 4 72.9 27.1 SWE-368 3 62.5 14.2
BEL-137 13 71.6 26.1 GER-192 5 74.8 60.4 SWE-368 4 67.5 29.4
BEL-137 14 75.7 16.7 GER-192 6 68.3 20.4 SWE-368 5 72.5 45.6
BEL-137 15 70.2 23.1 GER-192 7 62.0 10.2 SWE-368 6 77.5 43.0
BEL-137 16 68.7 16.1 GER-192 8 67.9 27.5 SWE-526 1 55.0 0.0
BEL-137 17 77.8 44.0 GER-192 9 58.0 19.1 SWE-526 2 60.0 9.0
BEL-137 18 72.0 28.6 GER-192 10 68.9 26.2 SWE-526 3 65.0 8.0
BEL-137 19 68.6 10.0 GER-192 11 57.4 6.2 SWE-526 4 69.0 33.0
BEL-137 20 77.5 70.8 GER-192 12 52.0 0.0 SWE-526 5 47.0 1.0
BEL-137 21 62.6 0.0 GER-192 13 49.7 4.8 SWE-526 6 56.0 0.0
BEL-137 22 70.3 14.8 GER-372 1 52.5 0.0 SWE-526 7 60.0 10.0
BEL-137 23 62.9 5.9 GER-372 2 67.5 3.5 SWE-526 8 65.0 18.0
CAN-120 1 62.5 26.7 GER-372 3 72.5 14.4 SWE-526 9 69.0 30.0
CAN-120 2 67.5 27.1 GER-372 4 52.5 0.0 SWI-053 1 55.0 5.1
CAN-120 3 72.5 54.0 GER-372 5 62.5 3.2 SWI-053 2 58.5 2.4
CAN-120 4 47.5 4.4 GER-372 6 67.5 18.0 SWI-053 3 62.0 4.8
CAN-120 5 57.5 4.5 GER-372 7 47.5 5.0 SWI-053 4 65.0 12.3
CAN-120 6 57.5 0.0 GER-372 8 57.5 22.8 SWI-053 5 68.5 19.8
CAN-120 7 67.5 12.9 GER-372 9 62.5 27.5 SWI-053 6 72.0 23.3
CAN-120 8 67.5 55.5 GER-372 10 67.5 27.9 TRK-367 1 77.5 60.7
CAN-120 9 67.5 17.4 GER-372 11 72.5 21.8 TRK-367 2 72.5 44.7
CAN-120 10 52.5 12.9 GER-373 1 52.5 9.7 TRK-367 3 57.5 9.6
CAN-120 11 57.5 25.9 GER-373 2 57.5 7.4 TRK-367 4 52.5 1.8
CAN-120 12 67.5 49.5 GER-374 1 52.5 16.2 UKD-071 1 64.3 11.6
CAN-120 13 67.5 12.3 GER-374 2 57.5 19.9 UKD-071 2 65.1 30.8
CAN-120 14 77.5 49.5 GER-374 3 62.5 28.8 UKD-071 3 68.0 30.9
CAN-120 15 52.5 4.2 GER-374 4 67.5 30.5 UKD-071 4 69.1 43.7
CAN-120 16 62.5 8.2 GER-374 5 72.5 32.8 UKD-071 5 69.7 31.0
CAN-120 17 67.5 23.7 ITA-350 1 57.5 3.4 UKD-071 6 69.7 45.5
2782 J. Acoust. Soc. Am., Vol. 131, No. 4, April 2012 Schomer et al.: Road and rail community tolerance level
Redistribution subject to ASA license or copyright; see http://acousticalsociety.org/content/terms. Download to IP: 78.91.103.24 On: Wed, 17 Jun 2015 10:12:08

Bassarab et al.catalog (2009)
Point
number DNL
HA
(%)
Bassarab et al.catalog (2009)
Point
number DNL
HA
(%)
Bassarab et al.catalog (2009)
Point
number DNL
HA
(%)
CAN-120 18 67.5 43.5 ITA-350 2 62.5 16.4 UKD-071 7 70.2 27.6
CAN-120 19 62.5 23.8 ITA-350 3 67.5 35.3 UKD-071 8 70.3 27.7
CAN-120 20 62.5 19.8 ITA-350 4 72.5 55.0 UKD-071 9 70.4 23.6
CAN-120 21 67.5 43.8 ITA-350 5 77.5 72.8 UKD-071 10 70.6 25.9
CAN-120 22 67.5 20.0 JPN-369 1 55.5 3.0 UKD-071 11 70.9 22.0
CAN-120 23 52.5 11.7 JPN-369 2 60.5 12.0 UKD-071 12 73.4 33.3
CAN-120 24 52.5 4.0 JPN-369 3 65.5 23.0 UKD-071 13 74.2 47.4
CAN-120 25 57.5 23.5 JPN-369 4 70.5 28.0 UKD-071 14 74.4 58.7
CAN-120 26 57.5 8.0 JPN-369 5 75.5 52.0 UKD-071 15 75.2 41.1
CAN-120 27 62.5 12.0 JPN-369 6 60.5 10.0 UKD-071 16 75.9 50.0
CAN-120 28 62.5 27.5 JPN-369 7 65.5 18.0 UKD-071 17 78.4 41.5
CAN-121 1 57.3 4.5 JPN-369 8 70.5 29.0 UKD-071 18 78.6 66.0
CAN-121 2 63.0 0.0 JPN-369 9 75.5 37.0 UKD-071 19 78.8 46.6
CAN-121 3 61.9 6.0 JPN-382 1 77.5 42.5 UKD-071 20 79.2 58.3
CAN-121 4 64.3 8.0 JPN-382 2 62.5 9.0 UKD-071 21 79.2 51.4
CAN-121 5 68.0 4.0 JPN-382 3 67.5 20.9 UKD-071 22 79.6 64.5
CAN-121 6 68.4 8.0 JPN-382 4 67.5 22.0 UKD-071 23 80.2 54.5
CAN-121 7 69.4 26.0 JPN-382 5 62.5 12.3 UKD-071 24 80.5 54.4
CAN-121 8 76.0 6.0 JPN-382 6 67.5 13.4 UKD-157 1 77.5 37.0
CAN-121 9 75.3 26.0 JPN-382 7 72.5 43.4 UKD-157 2 62.5 22.0
CAN-121 10 74.8 17.0 JPN-382 8 67.5 20.0 UKD-157 3 57.5 6.6
CAN-121 11 76.0 12.5 JPN-382 9 72.5 38.1 UKD-157 4 52.5 10.9
CAN-121 12 76.8 8.0 NET-106 1 61.0 22.7 UKD-157 5 57.5 8.1
CAN-121 13 83.0 44.5 NET-106 2 64.0 31.5 UKD-157 6 72.5 35.4
CAN-121 14 84.5 58.0 NET-106 3 66.0 39.7 UKD-238 1 67.5 14.1
CAN-168 1 53.0 5.4 NET-106 4 69.0 53.6 UKD-238 2 62.5 12.9
CAN-168 2 55.0 3.0 NET-106 5 71.0 68.1 UKD-238 3 52.5 0.0
CAN-168 3 57.0 8.3 NET-106 6 76.0 72.5 UKD-238 4 67.5 20.0
CAN-168 4 59.0 4.5 NET-240 1 62.5 26.2 UKD-238 5 62.5 10.3
CAN-168 5 61.0 5.7 NET-240 2 57.5 0.0 UKD-238 6 72.5 46.0
CAN-168 6 63.0 8.6 NET-240 3 62.5 17.8 UKD-238 7 47.5 1.8
CAN-168 7 65.0 25.6 NET-240 4 52.5 4.1 UKD-238 8 67.5 26.7
CAN-168 8 67.0 35.0 NET-240 5 47.5 8.8 UKD-238 9 52.5 1.5
CAN-168 9 69.0 23.1 NET-240 6 47.5 4.7 UKD-238 10 52.5 3.9
CAN-168 10 71.0 26.7 NET-240 7 62.5 17.5 UKD-242 1 52.5 7.3
CAN-168 11 73.0 22.7 NET-240 8 52.5 2.0 UKD-242 2 72.5 28.6
CAN-168 12 75.0 48.6 NET-258 1 65.0 21.0 UKD-242 3 57.5 8.4
DEN-075 1 51.0 0.0 NET-258 2 68.0 40.0 UKD-242 4 67.5 48.5
DEN-075 2 51.0 4.0 NET-258 3 71.0 36.0 UKD-242 5 52.5 5.2
DEN-075 3 51.2 11.4 NET-258 4 74.0 34.0 UKD-242 6 67.5 25.9
DEN-075 4 51.3 5.0 NET-258 5 77.0 48.0 UKD-242 7 52.5 4.1
DEN-075 5 51.9 4.0 NET-258 6 80.0 47.0 UKD-242 8 67.5 18.6
DEN-075 6 54.1 0.0 NET-258 7 65.0 18.0 UKD-242 9 47.5 2.9
DEN-075 7 56.5 10.3 NET-258 8 68.0 30.0 UKD-242 10 67.5 13.8
DEN-075 8 57.3 19.4 NET-258 9 71.0 21.0
APPENDIX B: SOCIAL SURVEY FINDINGS ABOUT THE ANNOYANCE OF RAIL NOISE EXPOSURE SEPARATEDINTO LOW AND HIGH VIBRATION SITES
High vibration
Bassarab et al.catalog (2009)
Point
number DNL
HA
(%)
Bassarab et al.catalog (2009)
Point
number DNL
HA
(%)
Bassarab et al.catalog (2009)
Point
number DNL
HA
(%)
DEN-200 1 45.0 0.0 JAP-370 1 41.5 0.0 JAP-370 27 66.5 22.0
DEN-200 2 48.2 0.0 JAP-370 2 46.5 5.0 JAP-370 28 71.5 27.0
DEN-200 3 49.3 0.0 JAP-370 3 51.5 14.0 NET-276 1 62.5 13.3
DEN-200 4 50.4 0.0 JAP-370 4 56.5 16.0 NET-276 2 62.5 34.6
DEN-200 5 52.5 8.5 JAP-370 5 61.5 24.0 NET-276 3 62.5 23.3
DEN-200 6 54.6 0.0 JAP-370 6 66.5 38.0 NET-276 4 62.5 10.9
DEN-200 7 54.6 7.5 JAP-370 7 71.5 37.0 NET-276 5 67.5 28.7
J. Acoust. Soc. Am., Vol. 131, No. 4, April 2012 Schomer et al.: Road and rail community tolerance level 2783
Redistribution subject to ASA license or copyright; see http://acousticalsociety.org/content/terms. Download to IP: 78.91.103.24 On: Wed, 17 Jun 2015 10:12:08

1Precursors to these assumptions may be found throughout the technical lit-
erature on individual and community response to noise exposure over the
last several decades. For example, Fig. 1 of Berglund et al. (1976) clearly
suggests that the slopes of growth functions for loudness and annoyance
are indistinguishable. Maurin (1981) explicitly predicts the rate of growth
of the prevalence of community annoyance from the rate of growth of
loudness with sound level and develops a dosage-response relationship
based on his analysis. Fidell et al. (1988) and Green and Fidell (1991)
developed preliminary theory- and empirically based dosage-response
analyses based on the same assumptions.
2The present definition of a community-specific noise tolerance level is
intended to distinguish DNL-related from all other influences on observed
annoyance prevalence rates. In practice, however, random errors of mea-
surement and methodological peculiarities of studies can also influence
CTL values as may physical factors (such as vibration levels, low fre-
quency spectral content, and onset rates) to which DNL measurements are
insensitive. Refinements of the present estimation method could, in princi-
ple, segregate error of measurement and other physical factors not
reflected in DNL measurements from CTL. However, for lack of a
straightforward or standardized method of estimating these factors, and for
High vibration
Bassarab et al.
catalog (2009)
Point
number DNL
HA
(%)
Bassarab et al.
catalog (2009)
Point
number DNL
HA
(%)
Bassarab et al.
catalog (2009)
Point
number DNL
HA
(%)
DEN-200 8 55.7 2.5 JAP-370 8 41.5 0.0 NET-276 6 72.5 16.0
DEN-200 9 56.8 2.0 JAP-370 9 46.5 0.0 NET-276 7 72.5 23.0
DEN-200 10 57.8 0.0 JAP-370 10 51.5 7.0 SWE-365 A 1 46.5 0.0
DEN-200 11 58.8 6.0 JAP-370 11 56.5 14.0 SWE-365 A 2 51.5 0.0
DEN-200 12 60.0 5.5 JAP-370 12 61.5 18.0 SWE-365 A 3 56.5 10.8
DEN-200 13 61.0 4.5 JAP-370 13 66.5 24.0 SWE-365 A 4 61.5 19.6
DEN-200 14 62.1 4.5 JAP-370 14 71.5 33.0 SWE-365 A 5 66.5 26.7
DEN-200 15 63.1 0.0 JAP-370 15 41.5 0.0 SWE-365B 1 51.5 4.5
DEN-200 16 64.2 2.0 JAP-370 16 46.5 0.0 SWE-365B 2 56.5 9.6
DEN-200 17 65.3 29.5 JAP-370 17 51.5 2.0 SWE-365B 3 61.5 22.8
DEN-200 18 66.3 19.0 JAP-370 18 56.5 11.0 SWE-365B 4 66.5 68.3
DEN-200 19 67.4 13.5 JAP-370 19 61.5 23.0 SWE-365 C 1 51.5 0.0
DEN-200 20 68.5 10.5 JAP-370 20 66.5 30.0 SWE-365 C 2 56.5 5.1
DEN-200 21 69.5 31.5 JAP-370 21 71.5 40.0 SWE-365 C 3 61.5 4.3
DEN-200 22 70.6 40.5 JAP-370 22 41.5 0.0 SWE-365 C 4 66.5 10.1
DEN-200 23 71.7 0.0 JAP-370 23 46.5 10.0 SWE-365 C 5 71.5 35.5
DEN-200 24 72.7 49.0 JAP-370 24 51.5 4.0 SWE-365 C 6 76.5 48.4
DEN-200 25 73.8 32.5 JAP-370 25 56.5 15.0
DEN-200 26 74.9 100.0 JAP-370 26 61.5 22.0
Low vibration
FRA-063 1 62.0 9.1 SWE-165 2 62.1 3.0 SWE-365E 6 71.5 5.0
FRA-063 2 66.0 8.6 SWE-165 3 69.5 23.0 SWE-365D 1 51.5 0.0
FRA-063 3 70.0 19.6 SWE-165 4 64.2 1.0 SWE-365D 2 56.5 0.6
FRA-063 4 74.0 22.9 SWE-165 5 71.7 9.0 SWE-365D 3 61.5 0.0
FRA-063 5 78.0 31.3 SWE-165 6 62.1 14.0 SWE-365D 4 66.5 1.8
GER-192 1 75.6 13.5 SWE-228 1 53.6 2.0 SWE-365D 5 71.5 7.9
GER-192 2 73.4 16.7 SWE-228 2 54.6 3.5 SWE-365F 1 46.5 0.0
GER-192 3 64.3 23.1 SWE-228 3 54.6 6.5 SWE-365F 2 51.5 0.0
GER-192 4 74.4 19.5 SWE-228 4 56.0 9.5 SWE-365F 3 56.5 0.0
GER-192 5 74.4 23.5 SWE-228 5 55.7 10.0 SWE-365F 4 61.5 1.7
GER-192 6 67.3 4.9 SWE-228 6 61.3 3.5 SWE-365F 5 66.5 8.6
GER-192 7 59.8 11.8 SWE-228 7 61.3 12.5 SWE-365F 6 71.5 14.7
GER-192 8 73.3 29.0 SWE-228 8 61.3 9.5 UKD-116 1 29.2 0.0
GER-192 9 60.3 11.8 SWE-228 9 64.2 12.0 UKD-116 2 37.3 0.0
GER-192 10 74.3 9.7 SWE-228 10 64.4 21.0 UKD-116 3 42.3 1.5
GER-192 11 68.2 6.8 SWE-228 11 64.8 20.0 UKD-116 4 47.3 1.4
GER-192 12 53.0 0.0 SWE-228 12 66.8 16.5 UKD-116 5 52.1 2.5
GER-192 13 53.8 2.4 SWE-228 13 68.3 5.3 UKD-116 6 56.7 5.4
NET-153 1 72.5 1.6 SWE-228 14 72.2 10.3 UKD-116 7 61.8 8.9
NET-153 2 47.5 0.0 SWE-228 15 80.2 30.0 UKD-116 8 67.0 9.1
NET-153 3 62.5 12.5 SWE-365E 1 46.5 0.0 UKD-116 9 71.4 8.3
NET-153 4 42.5 0.4 SWE-365E 2 51.5 0.0 UKD-116 10 76.9 25.9
NET-153 5 47.5 0.0 SWE-365E 3 56.5 0.4 UKD-116 11 82.7 9.6
NET-153 6 67.5 11.2 SWE-365E 4 61.5 1.2
SWE-165 1 64.2 5.0 SWE-365E 5 66.5 5.0
Shinkansen
JAP-530 1 46.5 11.0 JAP-530 2 51.5 33.0 JAP-530 3 41.5 4.0
2784 J. Acoust. Soc. Am., Vol. 131, No. 4, April 2012 Schomer et al.: Road and rail community tolerance level
Redistribution subject to ASA license or copyright; see http://acousticalsociety.org/content/terms. Download to IP: 78.91.103.24 On: Wed, 17 Jun 2015 10:12:08

reasons of parsimony, no effort is made at present to isolate estimates of
CTL from study-specific errors of measurement or other factors not
reflected in DNL measurements.3The individual survey data—in the form of (DNL, %HA) pairs—may be
found in Fidell et al. (1989). Green and Fidell (1991), an earlier revision
of Schultz (1978), describes the surveys included in Fidell et al. (1989).4Differences beyond the first decimal place of product-moment correlations
are meaningless in the present context. The correlation between observed
values of annoyance prevalence rates and predictions derived from the
effective loudness function is 0.00004 higher than it is for the Miedema
and Vos (1998) function in the range 55 dB�Ldn� 75 dB. Over the entire
data range, the Miedema and Vos (1998) correlation is higher in the fourth
decimal place. Such differences are of no pragmatic interest.5Notes in Table III describe vibration levels in each rail survey. In some
cases, vibration levels are directly stated in the original reference. In other
cases, vibration levels were classified as “high” or “low” from mention of
vibration as the second or third most important variable, or identified as
being important. In contrast, the studies in group two either stated that
vibrations and rattles were a small to negligible problem, or did not men-
tion vibrations at all. In one study, UKD-116, the level of vibration is
unclear but appears to be low (see footnote 6).6Fields and Walker (1977) ask a number of questions related to vibration but
have no vibration data with which to correlate them. Instead, they link vibra-
tion level to noise level and find that higher noise zones have higher levels
of annoyance to noise and higher levels of vibration and annoyance to vibra-
tion. That is, they correlate the noise response with the vibration response
by linking the two together without measurement. It appears from the per-
cent severely disturbed data (Fields and Walker 1977 Fig. 7.3) that most
respondents were in low noise and low percent highly annoyed zones and
thus presumably experienced little vibration. Fields and Walker interviewed
514 respondents at sites with Ldn� 54 dB, among whom the percent highly
annoyed was less than 1%. Another 760 respondents were interviewed at
sites for which 55 dB�Ldn� 72 The percent of these respondents highly
annoyed was 6.5%, also a low value. Another 169 respondents at sites for
which Ldn> 72 dB, 18% were highly annoyed. Thus it appears from the
Fields and Walker description that only 169 of 1443 respondents were sub-
ject to higher levels of vibration. Although actual vibration levels are
unknown, the incidence of high vibration appears to be low.7The high speed Shinkansen train produces impulsive and aerodynamic noise
that conventional (lower speed) trains do not. Moreover, the onset rate of
the train noise signature close to the tracks is very rapid, and the sound can
be startling even though DNL measurements do not reflect these differences.
Some differences in CTL for high speed and lower speed trains are thus not
unexpected. The CTL for the Shinkansen train (about 60 dB) is clearly dif-
ferent from CTLs for all other trains. On average, communities are about
15 dB more tolerant of trains producing high vibration levels than of noise
from Shinkansen trains; and about 28 dB more tolerant of trains generating
low vibration levels than of the Shinkansen train. It therefore appears that
communities are uniquely intolerant of noise from the Shinkansen, and that
findings from the study of (Yano et al., 2004) should not be averaged with
those of studies of reactions to other train noise.8These observations, stated by Fidell et al. (2011) for aircraft noise, are
equally true and relevant for road traffic and railroad noise and have been
restated here as applied to road traffic noise.
Ahrlin, U., and Rylander, R. (1979). “Annoyance caused by different envi-
ronmental noises,” J. Sound Vib. 66(3), 459–462.
Anderson, T. V., Kuhl, K., and Relster, E. (1980). Reactions to Railway Noisein Denmark, (National Agency for Environmental Protection, Denmark).
Atkins, C. L. R., Nurse, K., and Richmond, C., (1984). “1982 Aircraft Noise
Index Study: tabulations of the responses to the social surveys,” DR Com-
munication, Civil Aviation Authority, London. 8312.
Atkins Research and Development(1979). “Subjective effects of traffic noise
exposure: reliability, seasonal effects and correlation with noise indices,”
Atkins Research and Development, Survey, April, 1979.
Aubree, D. (1973). “Statistical and sociological survey to define a scale of
annoyance felt by people in their homes due to the noise of railroad
trains,” C.S.T.B., Nantes, France.
Aubree, D., Auzou, S., and Rapin, J. M. (1971). “Study of annoyance due to
urban automobile traffic. Scientific report,” NASA TM-77514 (National
Aeronautics and Space Administration, Washington, DC), July 1984.
(Translation of “ Etude de la gene due au trafic urbain. Compte rendu
scientifique”).
Bassarab, R., Sharp, B., and Robinette, B. (2009). “An updated catalog of
628 social surveys of residents’ reaction to environmental noise (1943-
2008),” Report No. DOT-VNTSC-FAA-10-02, Wyle Laboratories Con-
tractor Report, prepared for U.S. Department of Transportation, John, A.
Volpe National Transportation Systems Center, and Federal Aviation
Administration Office of Energy and Environment.
Berglund, B., Berglund, U., and Lindvall, T. (1976). “Scaling loudness,
noisiness, and annoyance of community noises,” J. Acoust. Soc. Am.
50(5),1119–1125.
Bertoni, D., Franchini, A., Magnoni, M., Tartoni, P., and Vallet, M. (1993).
“Reactions of people to urban traffic noise in Modena, Italy,” Noise andMan’93, Noise as a Public Health Problem (Sixth International Congress),
INTRETS, Arcueil, France, 2, pp. 593–596.
Bitter, C., Hols, J. H. K., and Kandelaar, H. A. C. (1982). “Beleving Geluid-
werende Voorzieningen in de woonsituatie langs rijksweg 10 in Amster-
dam (Effects of noise abatement measures on residences alongside
highway 10 in Amsterdam),” ICG-VL-DR-14-02. Ministerie van Volksge-
zonhied en Milieuhygiene, Leidschendam.
Bradley, J. S., and Jonah, B. A. (1977). “A field study of human response to
traffic noise,” University of Western Ontario, Canada.
Bjørner, T. B. (2004). “Combining socio-acoustic and contingent valuation
surveys to value noise reduction,” Transportation Research Part D 9
(AKF, Institute of Local Government Studies, Nyropsgade 37, DK-1602
Copenhagen V, Denmark), pp. 341–356.
de Jong, R. G. (1979). “A Dutch study on railway traffic noise,” J. Sound
Vib. 66(3), 497–502.
de Jong, R. G. (1983). “Some developments in community response
research since the second international workshop on railway and tracked
transit system noise in 1978,” J. Sound Vib. 87(2), 297–309.
de Jong, R. G., Opmeer, C. H. J. M., and Miedema, H. M. E. (1995).
“Annoyance caused by environmental pollutants in the Netherlands,” 15thInternational Congress on Acoustics, June 1995, Trondheim, Norway,
Vol. 2, pp. 65–68.
Diamond, J., and Walker, J. (1986). “An international study of the influence
on residual noise on community disturbance to aircraft noise,” Inter-Noise86, July 21–23, Cambridge, MA, pp. 941–946.
Environmental Protection Agency. (1974). “Information on levels of envi-
ronmental noise requisite to protect public health and welfare with an
adequate margin of safety,” EPA/ONAC 550/9-74-004, U.S. Environmen-
tal Protection Agency, Washington, DC.
Ericz, W. J., Noordam, A., and Schoonderbeek, W. (1986). “Trollificering Van
Buslijn 9 in Arnhem. Onderzoek Naar De Effecten Van Geluidhinder. (Trol-
ley conversion of busline 9 in arnhem. reasearch on the effects on noise
annoyance),” Noise Series GA-HR-12-1, Ministerie VROM, Leidschendam.
FICON. (1992). “Federal agency review of selected airport noise analysis
issues,” Report by the Federal Interagency Committee on Noise, Report
for the Department of Defense, Washington, DC.
Fidell, S., Barber, D., and Schultz, T. J. (1989). “Updating a dosage-effect
relationship for the prevalence of annoyance due to general transportation
noise,” U.S. Air Force Technical Report HSD-TR-89-009.
Fidell, S., Mestre, V., Schomer, P., Berry, B., Gjestland, T., Vallet, M., and
Reid, T. (2011). “A first-principles model for estimating the prevalence of
annoyance with aircraft noise exposure,” J. Acoust. Soc. Am. 130(2),
791–806.
Fidell, S., and Schomer, P. (2007). “Uncertainties in measuring aircraft
noise and predicting community response to it,” Noise Control Eng. J.
55(1), 82–88.
Fidell, S., and Schultz, T. (1980). “A critical review of time-of-day weight-
ing factors for cumulative measures of community noise exposure,” BBN
Report prepared for U.S. EPA Office of Noise Abatement and Control,
Washington, DC, 4216.
Fidell, S., and Silvati, L. (2004). “Parsimonious alternatives to regression
analysis for characterizing prevalence rates of aircraft noise annoyance,”
Noise Control Eng. J. 52(2), 56–68.
Fidell, S., Silvati, L., and Haboly, E. (2002). “Social survey of community
response to a step change in aircraft noise exposure,” J. Acoust. Soc. Am.
111(1), 200–209.
Fields, J. M. (1985). “Research on the effect of noise at different times of
day: models, methods and findings,” NASA CR-3888.
Fields, J. M., and Walker, J. G. (1977) “The effects of railway noise and
vibration on the community.” ISVR report to Science Research Council
and British Railways Board.
Graf, R., Mueller, R., and Heier, H. P. (1974). “Socio-psychological airplane
noise investigation in the districts of three Swiss Airports, Zurich, Cern,
J. Acoust. Soc. Am., Vol. 131, No. 4, April 2012 Schomer et al.: Road and rail community tolerance level 2785
Redistribution subject to ASA license or copyright; see http://acousticalsociety.org/content/terms. Download to IP: 78.91.103.24 On: Wed, 17 Jun 2015 10:12:08

and Basel.” NASA TM-75787. National Aeronautics and Space Adminis-
tration, Washington, DC, September 1980. (Translation of “Sozio-
psychologische Fluglaermuntersuchung im ceblet der drei scweizer flugh-
aefen Zuerich, Genf, Basel, Arbettsgemelnschaft fuer Sozio-
Psychologische Flugluermuntersuchung”).
Green, D. M., and Fidell, S. (1991). “Variability in the criterion for reporting
annoyance in community noise surveys,” J. Acoust. Soc. Am. 89(1), 234–243.
Hall, F. L., Birnie, S. E., Taylor, S. M., and Palmer, J. E. (1981). “Direct
comparison of community response to road traffic noise and to aircraft
noise,” J. Acoust. Soc. Am. 70(6), 1690–1698.
Hall, F. L., and Taylor, S. M. (1977). “Prediction of community response to
road traffic noise,” J. Sound Vib. 52(3), 387–399.
Hapuarachchi, K. P. (1980). “Investigation into the validity of Kish and
Frankel’s conjectures on complex statistics by using annoyance data from
road traffic and the environment survey,” MSC 1980, Southampton.
ISO 1996-1. (2003). “Acoustics—Description, Assessment, and Measure-ment of Environmental Noise—Part 1. Basic Quantities and AssessmentProcedures,” (International Organization for Standardization, Geneva,
Switzerland).
Kastka, J., Borsch-Galetke, E., Guski, R., Krauth, J., Paulsen, R., Schumer,
R., and Oliva, C. (1995). “Longitudinal study on aircraft noise effects at
Dusseldorf Airport 15th International Congress on Acoustics, Trondheim,
Norway, 1981-1993,” Vol. 4, pp. 447–451,
Knall, V., and Schumer, R. (1983). “The differing annoyance levels of rail
and road traffic noise,” J. Sound Vib. 87(2), 321–326.
Kurra, S., Tamer, N., and Rice, C. G. (1995). “Environmental Noise Pollu-
tion Research Project Report,” Istanbul Technical University, Istanbul.
Langdon, F. J. (1976a). “Noise nuisance caused by road traffic in residential
areas: part I.,” J. Sound Vib. 47(2), 243–263.
Langdon, F. J. (1976b). “Noise nuisance caused by road traffic in residential
areas: part II.,” J. Sound Vib. 47(2), 265–282.
Lercher, P. (1998). “Deviant dose response curves for traffic noise in
‘sensitive areas,’” Internoise 98, Christchurch, New Zealand, pp.
1141–1145.
Maurin, M. (1981). “Community noise impact indicators,” J. Sound Vibr.
79(4), 479–499.
Miedema, H., and van den Berg, R. (1985). “Hinder door geluid ven tram-
en wegverkeer (Noise nuisance caused by trams and road traffic)” Report
GA-HR-08-02. Miniserie van, Volkhuisvesting, Ruimtelijke Ordening en
Milieuberheer (Ministry of Housing, Physical Planning and Environment),
The Hague.
Miedema, H., and Vos, H. (1998). “Exposure-response relationships for
transportation noise,” J. Acoust. Soc. Am. 104(6), 3432–3445.
Myncke, H., Cops, A., Steenackers, P., Bruyninckx, W., Gambert, R., and
Verlysen, P. (1977) “Studie ven het verkeerslawaai iun steden en de hinder
ervan voor de bevolking (Study of Urban Traffic Noise and the Annoyance
Felt by the Population),” from the Laboratory for Acoustics and Thermal
Conductivity of the Catholic University of Lueven and the Ministry of
Public Health and of the Environment of Belgium.
Ohrstrom, E., and Skanberg, A. B. (1995) “Effeckter av exponering for bul-
ler och vibrationer fran tagtrafik-undersokninga i 15 (Effects of exposure
to noise and vibrations from railways traffic),” Report i/95. Departments
of Environmental Hygiene, University of Gothenberg.
Ohrstrom, E., and Skanberg, A. (1996). “A field survey on effects of expo-
sure to noise and vibration from railway traffic, Pat I: annoyance and ac-
tivity disturbance effects,” J. Sound Vib. 193(1), 39–47.
Ohrstrom, E., Skanberg, A., Svensson, H., Gidlof-Gunnarsson, A. (2006).
“Effects of road traffic noise and the benefit of access to quietness,” J.
Sound Vib. 295(1), 40–59.
Planungsburo Obermeyer (1983). Interdiziplinare feldstudie II uber die
besonderheiten des schienenverkehrslarms gegenober dem strassenver-
kehrslarm (erweiterte untersuchung) [Interdisciplinary field of study II on
the specifics of rail traffic noise over road traffic noise (Extended Investi-
gation)]. Bericht uber ein forschungsvorhaben zum verkehrslarmschutzge-
setz im auftrag des bundesministers for verkehr (Federal Ministry of
Transport, Building and Urban Development).
Relster, E. (1975). Traffic Noise Annoyance, the Psychological Effect ofTraffic Noise in Housing Areas (Polyteknisk Forlag, Lyngby, Denmark).
Rylander, R. (1977). Traffic Noise Annoyance With Relation to Vehicle Pat-tern (Institute of Acoustics) May 1977, pp. 12.6.1–12.6.4.
Rylander, R., Ahrlin, U., and Bjorkman, M. (1977). “Traffic noise annoy-
ance with relation to vehicle patter,” Report 1-77, Department of Environ-
mental Hygiene, University of Gothenburg, Gothengurg, Sweden.
Sato, T., Yano, T., Bjorkman, M., and Rylander, R. (2000) “Comparison of
community response to road traffic noise in Japan and Sweden. Part I: Out-
line of surveys and dose-response relationships,” Inter-Noise 2000, August
27–30, Nice, France, Vol. 5, pp. 3189–3194.
Sato, T., Yano, T., Bjorkman, M., Rylander, R. (2002). “Comparison of com-
munity response to road traffic noise in Japan and Sweden. Part I: Outline of
surveys and dose-response relationships,” J. Sound Vib. 250(1), 161–167.
Schomer, P., and Neathammer, R. (1987). “The role of helicopter noise-
induced vibration and rattle in human response,” J. Acoust. Soc. Am.
81(4), 966–976.
Schomer, P., Brown, A. L., De Coensel, B., Genuit, K., Gjestland, T., Yong
Jeon, J., Kang, J., Newman, P., Schulte-Fortkamp, B., and Watts, G. R.
(2010). “On efforts to standardize a graphical description of the sound-
scape concept,” Internoise 2010, June 13–16, Lisbon, Portugal.
Schultz, T. J. (1978). “Synthesis of social surveys on noise annoyance,” J.
Acoust. Soc. Am. 64(2), 377–405.
Vallet, M., Maurin, M., Page, M. A., Favre, B., and Pachiaudi, G. (1978).
“Annoyance from and habituation to road traffic noise from urban
expressways,” J. Sound Vib. 60(3), pp. 423–440.
Vallet, M., Pachiaudi, G., Depitre, A., Tanguy, Y., and Francois, J. (1988).
“Community reactions to aircraft and residual noise,” Noise as a Public
Health Problem, Fifth International Congress, Performance, Behaviour,
Animal, Combined Agents and Community Responses, Swedish Council
for Building Research, August 21–25, Stockholm, Sweden, Vol. 3, pp.
289–294.
Vallet, M., Vernet, I., Champelovier, P., and Maurin, M., (1996). “A road
traffic noise index for the night time,” Inter-Noise 1996, July 30–August
2, Liverpool, England, pp. 2345–2350.
Wehrli, B., Nemecek, J., Turrian, V., Hoffman, R., Wanner, H. (1978).
“Effects of street traffic noise in the night,” Kampf. Laerm, 25,
138–149.
Yano, T., Y. Murakami, K. Kawai, and T. Sato (1998). “Comparison of
responses to road traffic and railway noises,” Noise Effects’98: Noise as a
Public Health Problem (7th Intl. Cong. on Noise as a Public HealthProblem), Sydney, Australia, Vol. 2, pp. 582–585.
Yano, T., Sato, T., Morihara, T., and Hashimoto, Y. (2004). “On the percent
highly annoyed in community responses to noise as measure by the
ICBEN 5-point scale in Japanese,” Inter-Noise 2004, August 22–25,
Prague, Czech Republic.
2786 J. Acoust. Soc. Am., Vol. 131, No. 4, April 2012 Schomer et al.: Road and rail community tolerance level
Redistribution subject to ASA license or copyright; see http://acousticalsociety.org/content/terms. Download to IP: 78.91.103.24 On: Wed, 17 Jun 2015 10:12:08