rocking stability of masonry arches in seismic regions
TRANSCRIPT
Rocking Stability of Masonry Archesin Seismic Regions
Matthew J. DeJong,a) Laura De Lorenzis,b) Stuart Adams,c) andJohn A. Ochsendorfd)
This study evaluates the susceptibility of masonry arches to earthquakeloading through experimental testing and progresses toward a specific criterionby which arches can be quickly assessed. Five different earthquake timehistories, as well as harmonic base excitations of increasing amplitude, wereapplied to model arches, and the magnitude of the base motion resulting incollapse was determined repeatedly. Results are compared with failurepredictions of an analytical model which describes the rocking motion ofmasonry arches under base excitation. The primary impulse of the baseexcitation is found to be of critical importance in causing collapse of themasonry arch. Accordingly, a suite of failure curves are presented which canbe used to determine the rocking stability of masonry arches under a primarybase acceleration impulse which has been extracted from an expectedearthquake motion. �DOI: 10.1193/1.2985763�
INTRODUCTION
Recent seismic events have led to an increased demand for analysis methods whichverify the safety of existing unreinforced masonry structures, of which arches and vaultsare often primary components. However, a better understanding of the response of ma-sonry vaults and arches to dynamic loading is necessary in order to develop tools whichcan be used to quickly assess the safety of these structures which exist in seismicallyactive areas.
Static analysis methods for masonry arches are well established, many of which arebased upon the analytical framework of limit analysis proposed by Heyman (1966,1982). His work focused the assessment of masonry on the stability of masonry struc-tures, not on the strength, effectively making the governing behavior dependent on ge-ometry rather than material properties. While including dynamics certainly limits thisapproach in many cases, his emphasis remains the foundation for determining governingfailure in this study.
Dynamic analysis of masonry arches has its basis in the single rocking block prob-lem. Following the fundamental work by Housner (1963), this problem has been exten-sively studied both analytically (e.g., Spanos and Koh 1984, Shenton 1996) and experi-
a) Research Assistant, Massachusetts Institute of Technology, Cambridge, MA 02139b) Assistant Professor, University of Salento, Lecce, Italyc) Research Intern, Louisiana State University, Baton Rouge, LA 70803d)
Associate Professor, Massachusetts Institute of Technology, Cambridge, MA 02139847Earthquake Spectra, Volume 24, No. 4, pages 847–865, November 2008; © 2008, Earthquake Engineering Research Institute
848 DEJONG ET AL.
mentally (e.g., Yim et al. 1980, Peña et al. 2007). Additionally, Zhang and Makris (2001)identified two failure modes for the rocking block subjected to pulse-type base accelera-tions extracted from more chaotic earthquake loading and showed rocking blocks to bemore susceptible to a one-sine impulse than a one-cosine impulse.
Considerably less effort has been devoted to the dynamic response of masonryarches to earthquake excitation. Oppenheim (1992) developed an analytical model whichdescribes the arch as a rigid-body, four-link mechanism and predicts failure of the archin response to a given base impulse excitation. Although Oppenheim did not address theproblem of what occurs if the arch recovers from the single impulse and “rocks” in theother direction, his analytical model effectively poses the problem as a “rocking arch”which is similar to the rocking block. DeJong and Ochsendorf (2006) compared Oppen-heim’s results with discrete element modeling results and found that assuming failuredue to direct overturning without rocking is unconservative. A second rocking failuremode was identified for arches subjected to pulse-type excitations, which parallels ModeI failure identified by Zhang and Makris (2001) for rocking blocks.
De Lorenzis et al. (2007) built upon the work by Oppenheim (1992) and developedan analytical model for the rocking arch which addresses the impact problem and cantherefore describe the motion of the arch through continued cycles of rocking. Similar torocking block models, the rocking arch model assumes rigid blocks and rigid supportsand is therefore only dependent on geometric properties. Analytical model predictionsregarding the response of an arch to pulse-type excitations compared well with discreteelement modeling results, which were found to be relatively insensitive to modeling in-puts (joint stiffness and damping ratio).
In this paper, the analytical model proposed by De Lorenzis et al. (2007) is brieflyreviewed, and the limitations of the model are discussed. Subsequently, the experimentalprocedure is presented, and experimental results are compared with predictions from theanalytical model. Results are used to make steps toward a criterion for evaluating thesafety of masonry arches in seismic regions. Although other assessment procedures havebeen developed (e.g., De Luca et al. 2004), they have been based on static analyseswhich do not incorporate the dynamics of the problem.
REVIEW OF THE ANALYTICAL MODEL
For more details regarding the analytical model presented here, refer to the paper byDe Lorenzis et al. (2007). Modeling assumptions and their justifications are discussedextensively in this previous work and at the end of this section. Clearly, the model andthe included impact formulation is a simplification of the actual response of the masonryarch under dynamic loading, but this study will attempt to illuminate the utility of sucha model.
ANALYSIS OF THE ARCH AS A FOUR-LINK MECHANISM
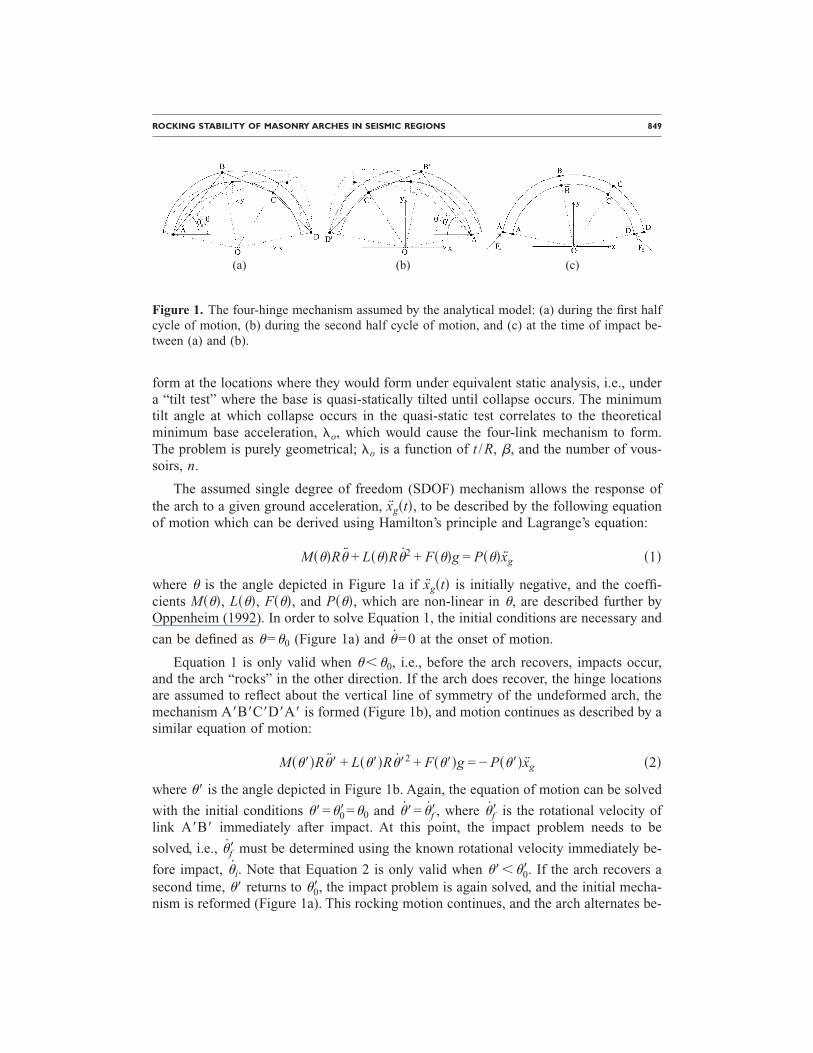
Following the work by Oppenheim (1992), the part-circular arch with center-line ra-dius R, thickness t, and angle of embrace �, is modeled as a four-link mechanism. Thefour hinges which create the four-link mechanism ABCDA (Figure 1a) are assumed to
ROCKING STABILITY OF MASONRY ARCHES IN SEISMIC REGIONS 849
form at the locations where they would form under equivalent static analysis, i.e., undera “tilt test” where the base is quasi-statically tilted until collapse occurs. The minimumtilt angle at which collapse occurs in the quasi-static test correlates to the theoreticalminimum base acceleration, �o, which would cause the four-link mechanism to form.The problem is purely geometrical; �o is a function of t /R, �, and the number of vous-soirs, n.
The assumed single degree of freedom (SDOF) mechanism allows the response ofthe arch to a given ground acceleration, xg�t�, to be described by the following equationof motion which can be derived using Hamilton’s principle and Lagrange’s equation:
M���R� + L���R�2 + F���g = P���xg �1�
where � is the angle depicted in Figure 1a if xg�t� is initially negative, and the coeffi-cients M���, L���, F���, and P���, which are non-linear in �, are described further byOppenheim (1992). In order to solve Equation 1, the initial conditions are necessary and
can be defined as �=�0 (Figure 1a) and �=0 at the onset of motion.
Equation 1 is only valid when ���0, i.e., before the arch recovers, impacts occur,and the arch “rocks” in the other direction. If the arch does recover, the hinge locationsare assumed to reflect about the vertical line of symmetry of the undeformed arch, themechanism A�B�C�D�A� is formed (Figure 1b), and motion continues as described by asimilar equation of motion:
M����R�� + L����R��2 + F����g = − P����xg �2�
where �� is the angle depicted in Figure 1b. Again, the equation of motion can be solved
with the initial conditions ��=�0�=�0 and ��= �f�, where �f� is the rotational velocity oflink A�B� immediately after impact. At this point, the impact problem needs to be
solved, i.e., �f� must be determined using the known rotational velocity immediately be-
fore impact, �i. Note that Equation 2 is only valid when ����0�. If the arch recovers asecond time, �� returns to �0�, the impact problem is again solved, and the initial mecha-nism is reformed (Figure 1a). This rocking motion continues, and the arch alternates be-
(a) (b) (c)
Figure 1. The four-hinge mechanism assumed by the analytical model: (a) during the first halfcycle of motion, (b) during the second half cycle of motion, and (c) at the time of impact be-tween (a) and (b).
850 DEJONG ET AL.
tween the symmetric kinematic mechanisms until failure occurs or the arch returns torest in its initial configuration.
THE IMPACT PROBLEM
Each time the arch recovers to its initial configuration and the symmetric mechanismis formed, impacts occur, and energy is dissipated. In order to account for the energy
dissipation at impact, the rotational velocity immediately after impact, �f�, is calculatedusing the geometrical properties of the arch, and the known rotational velocity immedi-
ately before impact, �i. Consistent with the formulation by Housner (1963), the impul-sive forces are assumed to act at the opposite side of the arch thickness at the closing
hinges, i.e., at points A, B, C, and D (Figure 1c), inducing the external forces FA and FD.Conservation of angular and linear momentum (5 equations total) are used to solve for
the five unknowns of the problem: FAx, FAy, FDx, FDy, and �f�. The resulting coefficient
of restitution indicates the dissipation of energy induced by each impact: cv= �f� / �i
=�Tf /Ti, where Tf and Ti represent the kinetic energy of the system immediately afterand immediately before impact, respectively. Similar to �o, the resulting cv is a functionof geometry (t /R, �, and n).
PREDICTIONS OF THE ANALYTICAL MODEL
Results from both the analytical model and discrete element modeling indicate thatunder base impulse loading, a relatively large impulse will cause the arch to collapseimmediately without recovering, which parallels Mode 2 failure for the rocking block(Zhang and Makris 2001). Under a smaller impulse, however, the arch will rock in onedirection, recover, and then fail in the other direction during what is referred to as the“second half cycle of motion” (De Lorenzis et al. 2007), which parallels Mode 1 failurefor the rocking block (Zhang and Makris 2001). Failure during the second half cycle ofmotion was found to be the critical failure mechanism, and is therefore the mechanismfor which the analytical results are plotted throughout this paper. There is a small rangeof impulses above the Mode 1 failure curve for which the arch would recover (depictedby Zhang and Makris (2001) for the rocking block), but this range is conservatively ig-nored when assessing masonry arches because expected ground motions cannot be iden-tified with enough accuracy to rely upon this safe region.
LIMITATIONS OF THE ANALYTICAL MODEL
Based on the assumptions included in the analytical model, there are clearly somelimitations. First, the assumption of fixed hinge locations does not allow: (1) free initialhinge formation, (2) free hinge formation after impact, (3) opening at any non-hingedjoint, or (4) sliding between blocks. Second, the assumption of rigid blocks does not al-low elastic deformation, meaning that resonance cannot be modeled, and does not allowmaterial failure during impact. Third, the assumption of perfectly rigid supports does notallow for support deformation which could reduce stability.
ROCKING STABILITY OF MASONRY ARCHES IN SEISMIC REGIONS 851
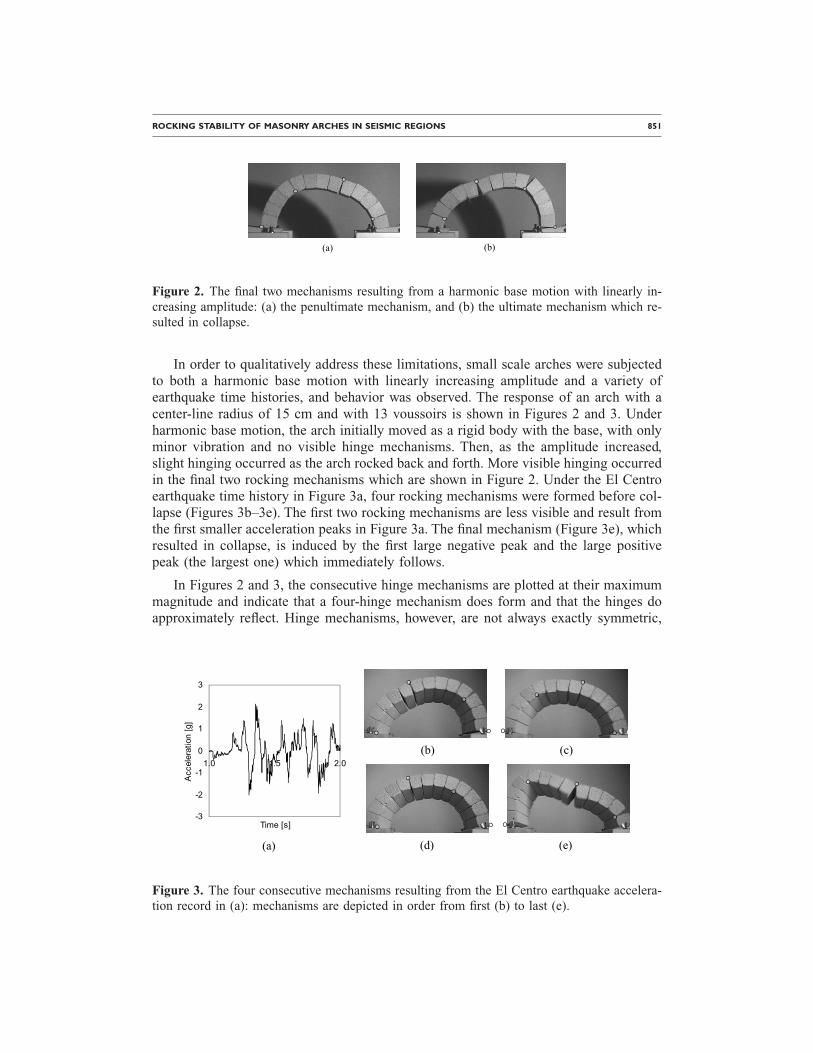
In order to qualitatively address these limitations, small scale arches were subjectedto both a harmonic base motion with linearly increasing amplitude and a variety ofearthquake time histories, and behavior was observed. The response of an arch with acenter-line radius of 15 cm and with 13 voussoirs is shown in Figures 2 and 3. Underharmonic base motion, the arch initially moved as a rigid body with the base, with onlyminor vibration and no visible hinge mechanisms. Then, as the amplitude increased,slight hinging occurred as the arch rocked back and forth. More visible hinging occurredin the final two rocking mechanisms which are shown in Figure 2. Under the El Centroearthquake time history in Figure 3a, four rocking mechanisms were formed before col-lapse (Figures 3b–3e). The first two rocking mechanisms are less visible and result fromthe first smaller acceleration peaks in Figure 3a. The final mechanism (Figure 3e), whichresulted in collapse, is induced by the first large negative peak and the large positivepeak (the largest one) which immediately follows.
In Figures 2 and 3, the consecutive hinge mechanisms are plotted at their maximummagnitude and indicate that a four-hinge mechanism does form and that the hinges doapproximately reflect. Hinge mechanisms, however, are not always exactly symmetric,
(a) (b)
Figure 2. The final two mechanisms resulting from a harmonic base motion with linearly in-creasing amplitude: (a) the penultimate mechanism, and (b) the ultimate mechanism which re-sulted in collapse.
-3
-2
-1
0
1
2
3
1.0 1.5 2.0
Time [s]
Acc
eler
atio
n[g
]
(a)
(b) (c)
(d) (e)
Figure 3. The four consecutive mechanisms resulting from the El Centro earthquake accelera-
tion record in (a): mechanisms are depicted in order from first (b) to last (e).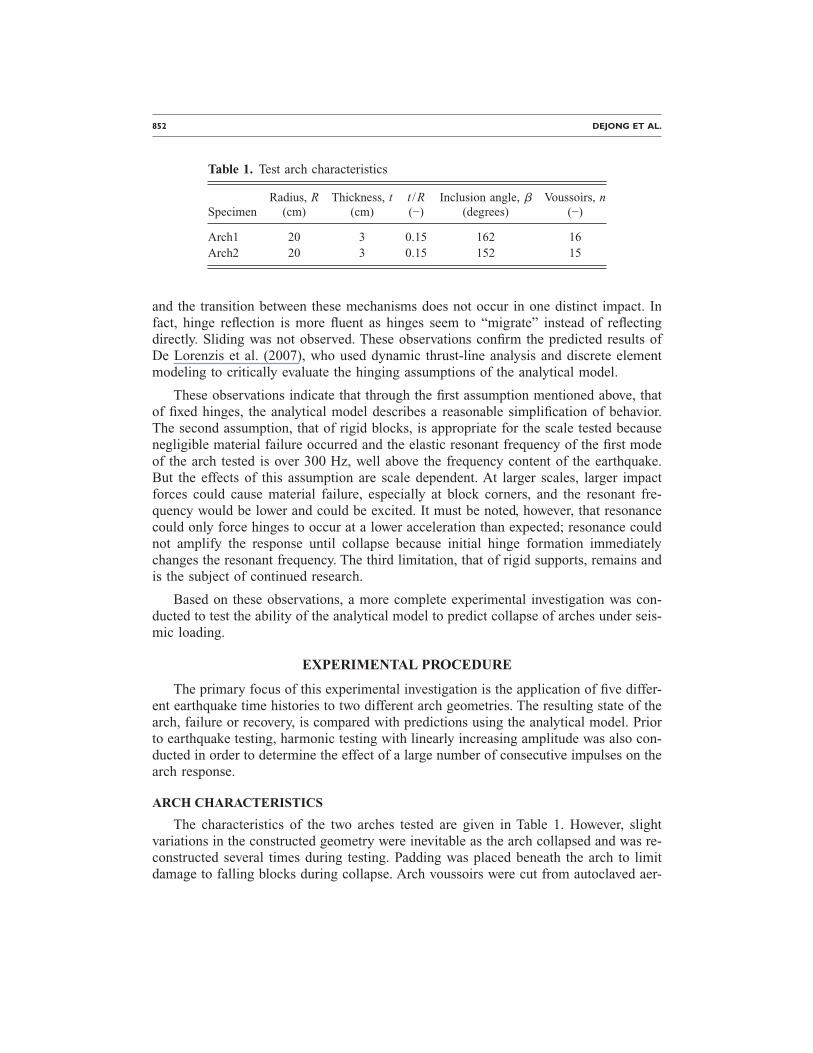
852 DEJONG ET AL.
and the transition between these mechanisms does not occur in one distinct impact. Infact, hinge reflection is more fluent as hinges seem to “migrate” instead of reflectingdirectly. Sliding was not observed. These observations confirm the predicted results ofDe Lorenzis et al. (2007), who used dynamic thrust-line analysis and discrete elementmodeling to critically evaluate the hinging assumptions of the analytical model.
These observations indicate that through the first assumption mentioned above, thatof fixed hinges, the analytical model describes a reasonable simplification of behavior.The second assumption, that of rigid blocks, is appropriate for the scale tested becausenegligible material failure occurred and the elastic resonant frequency of the first modeof the arch tested is over 300 Hz, well above the frequency content of the earthquake.But the effects of this assumption are scale dependent. At larger scales, larger impactforces could cause material failure, especially at block corners, and the resonant fre-quency would be lower and could be excited. It must be noted, however, that resonancecould only force hinges to occur at a lower acceleration than expected; resonance couldnot amplify the response until collapse because initial hinge formation immediatelychanges the resonant frequency. The third limitation, that of rigid supports, remains andis the subject of continued research.
Based on these observations, a more complete experimental investigation was con-ducted to test the ability of the analytical model to predict collapse of arches under seis-mic loading.
EXPERIMENTAL PROCEDURE
The primary focus of this experimental investigation is the application of five differ-ent earthquake time histories to two different arch geometries. The resulting state of thearch, failure or recovery, is compared with predictions using the analytical model. Priorto earthquake testing, harmonic testing with linearly increasing amplitude was also con-ducted in order to determine the effect of a large number of consecutive impulses on thearch response.
ARCH CHARACTERISTICS
The characteristics of the two arches tested are given in Table 1. However, slightvariations in the constructed geometry were inevitable as the arch collapsed and was re-constructed several times during testing. Padding was placed beneath the arch to limitdamage to falling blocks during collapse. Arch voussoirs were cut from autoclaved aer-
Table 1. Test arch characteristics
SpecimenRadius, R
(cm)Thickness, t
(cm)t /R(−)
Inclusion angle, �(degrees)
Voussoirs, n(−)
Arch1 20 3 0.15 162 16Arch2 20 3 0.15 152 15
ROCKING STABILITY OF MASONRY ARCHES IN SEISMIC REGIONS 853
ated concrete (AAC) blocks to the required dimensions, including an out-of-plane thick-ness of �10 cm. Base supports were also cut from AAC to maintain a consistent frictionangle.
SEISMIC TESTING
Seismic shake table tests were performed using the commercially available QuanserShake Table 2. Time histories from the following earthquakes were used for testing:Parkfield 1966, El Centro 1940, Golden Gate 1957, Northridge 1994, and Helena 1935.These earthquakes were chosen because they differ considerably in their frequency con-tent and maximum amplitude (Figure 4). Time scaling of all earthquake records was ap-
-1.5
-1
-0.5
0
0.5
1
1.5
2.7 3.2 3.7
Time [s]
Acce
lera
tion
[g]
Acceleration dataPrimary impulse
-1.5
-1
-0.5
0
0.5
1
1.5
1.2 1.7 2.2
Time [s]
Acce
lera
tion
[g]
Acceleration dataPrimary impulse
(a) (b)
-1.5
-1
-0.5
0
0.5
1
1.5
2.4 2.9 3.4
Time [s]
Acce
lera
tion
[g]
Acceleration dataPrimary impulse
-1.5
-1
-0.5
0
0.5
1
1.5
2.1 2.6 3.1
Time [s]
Acce
lera
tion
[g]
Acceleration dataPrimary impulse
(c) (d)
-1.5
-1
-0.5
0
0.5
1
1.5
1.7 2.2 2.7
Time [s]
Acce
lera
tion
[g]
Acceleration dataPrimary impulse
-1.5
-1
-0.5
0
0.5
1
1.5
0 0.05 0.1 0.15
Time [s]
Acce
lera
tion
[g]
ParkfieldEl CentroNorthridgeHelena
(e) (f)
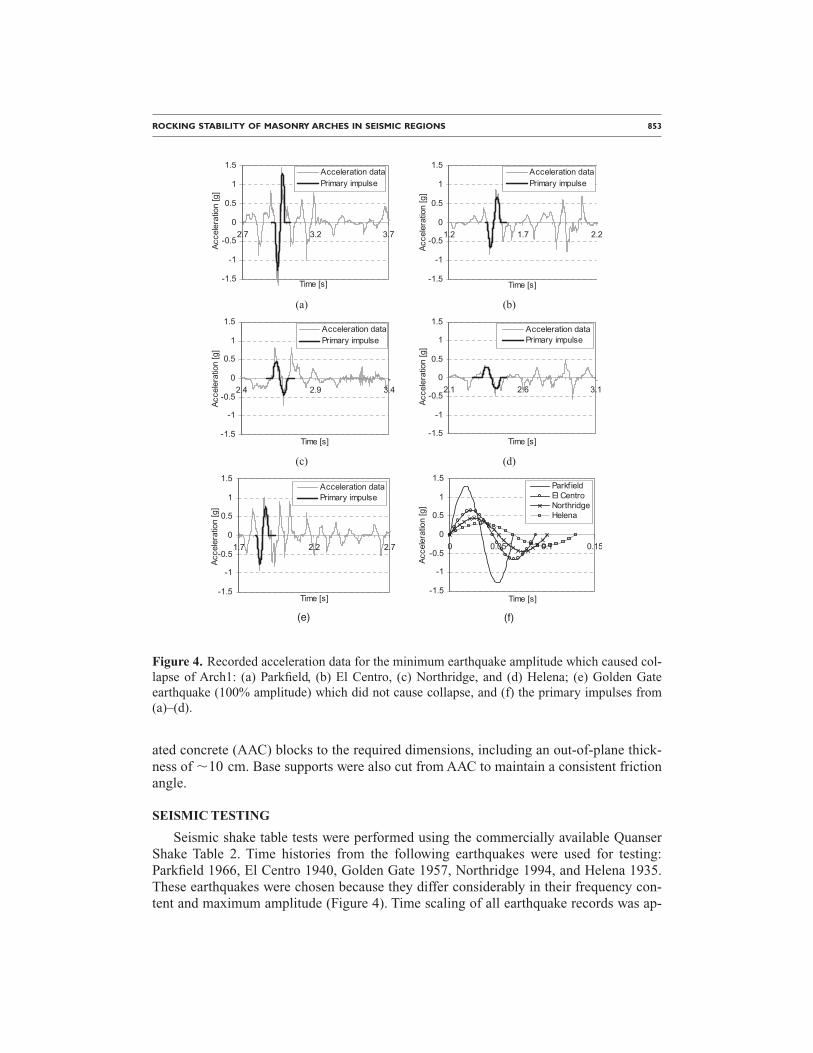
Figure 4. Recorded acceleration data for the minimum earthquake amplitude which caused col-lapse of Arch1: (a) Parkfield, (b) El Centro, (c) Northridge, and (d) Helena; (e) Golden Gateearthquake (100% amplitude) which did not cause collapse, and (f) the primary impulses from(a)–(d).
854 DEJONG ET AL.
plied to comply with the maximum stroke of the table �±7.5 cm�. While time scaling isoften implemented to account for scale effects between the model and the representedstructure, this was not necessary because analyzing a specific structure is not the goal.Instead, a suite of time histories with significantly different primary impulse character-istics is desired.
The acceleration magnitude of each earthquake was scaled repeatedly so that an ar-ray of time histories was created consisting of even percentages (2%, 4%, …100%) ofthe full amplitude of the earthquake. Using these arrays, the earthquake magnitude wasscaled down and then incrementally increased until failure occurred. When failure didoccur, the earthquake magnitude was decreased slightly and then again incremented un-til failure. This process was repeated until a minimum of three failure points were ob-tained for each earthquake. The base motion during each test was obtained from an ac-celerometer mounted to the table, and the tests were recorded on video so failuremechanisms could be observed. Approximately 70 tests were run on each arch to obtainthe desired data.
While it would be possible to input the recorded earthquake time history directly intothe analytical model and view the response, the exact behavior of a specific arch to aspecific earthquake is not of much use for assessing arches of different geometries forwhich different types of ground motion are expected. Instead, the goal remains to de-velop a simplified method which can be broadly applied to predict the stability of ma-sonry arches.
As mentioned previously, discontinuous masonry structures, or rocking-type struc-tures, are particularly susceptible to impulse loading as opposed to resonant frequencyamplification as in the case of continuous structures governed by the elastic response. Inorder to test the hypothesis that the primary impulse of an acceleration time history isthe governing factor affecting failure, the acceleration impulse characteristics (magni-tude �ap� and period �tp�) were extracted from the primary impulse in the recorded tableacceleration data for each test using a least-squares fitting method (Figure 4). Thesecharacteristics (ap, tp) were used for comparison with analytical results. The validity ofthis “primary impulse method,” extracting a primary impulse to represent a more com-plicated acceleration record, will be evaluated in later sections.
HARMONIC TESTING
Harmonic testing was performed using the shake table constructed in the civil engi-neering lab at the Massachusetts Institute of Technology. The single-axis shake tablerides on four Thomson self-aligning linear bearings and is driven by MTS model 506.00pump which supplies an MTS model 204.08 hydraulic actuator. The actuator is con-trolled by a Moog model 760C260 servovalve with an MTS 406 Controller and an ex-ternal HP 33120 A function generator. The base motion was recorded using a Crossbow±4 g LF series accelerometer mounted to the table. The arch response was recorded onvideo.
The waveform generator was used to provide a harmonic excitation of constant fre-quency with a sinusoidal increase in acceleration magnitude (carrier wave). The carrier
ROCKING STABILITY OF MASONRY ARCHES IN SEISMIC REGIONS 855
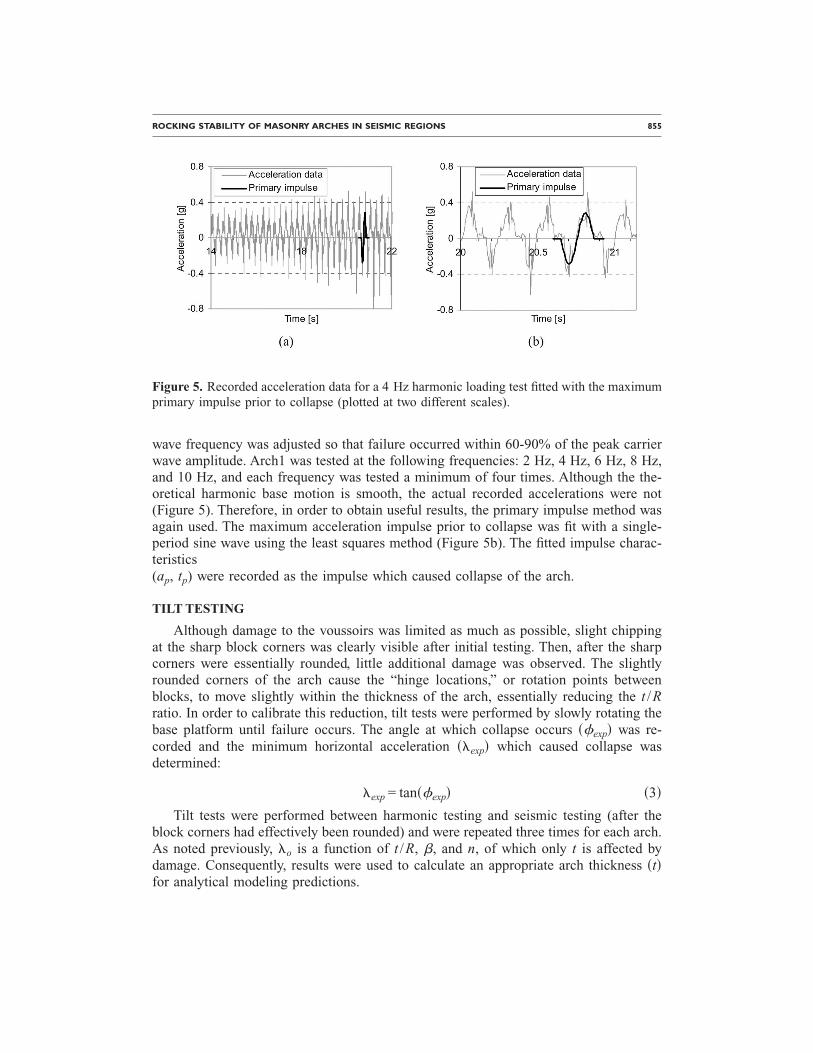
wave frequency was adjusted so that failure occurred within 60-90% of the peak carrierwave amplitude. Arch1 was tested at the following frequencies: 2 Hz, 4 Hz, 6 Hz, 8 Hz,and 10 Hz, and each frequency was tested a minimum of four times. Although the the-oretical harmonic base motion is smooth, the actual recorded accelerations were not(Figure 5). Therefore, in order to obtain useful results, the primary impulse method wasagain used. The maximum acceleration impulse prior to collapse was fit with a single-period sine wave using the least squares method (Figure 5b). The fitted impulse charac-teristics(ap, tp) were recorded as the impulse which caused collapse of the arch.
TILT TESTING
Although damage to the voussoirs was limited as much as possible, slight chippingat the sharp block corners was clearly visible after initial testing. Then, after the sharpcorners were essentially rounded, little additional damage was observed. The slightlyrounded corners of the arch cause the “hinge locations,” or rotation points betweenblocks, to move slightly within the thickness of the arch, essentially reducing the t /Rratio. In order to calibrate this reduction, tilt tests were performed by slowly rotating thebase platform until failure occurs. The angle at which collapse occurs ��exp� was re-corded and the minimum horizontal acceleration ��exp� which caused collapse wasdetermined:
�exp = tan��exp� �3�Tilt tests were performed between harmonic testing and seismic testing (after the
block corners had effectively been rounded) and were repeated three times for each arch.As noted previously, �o is a function of t /R, �, and n, of which only t is affected bydamage. Consequently, results were used to calculate an appropriate arch thickness �t�for analytical modeling predictions.
Figure 5. Recorded acceleration data for a 4 Hz harmonic loading test fitted with the maximumprimary impulse prior to collapse (plotted at two different scales).
856 DEJONG ET AL.
COMPARISON OF EXPERIMENTAL AND ANALYTICAL RESULTS
TILT TEST RESULTS
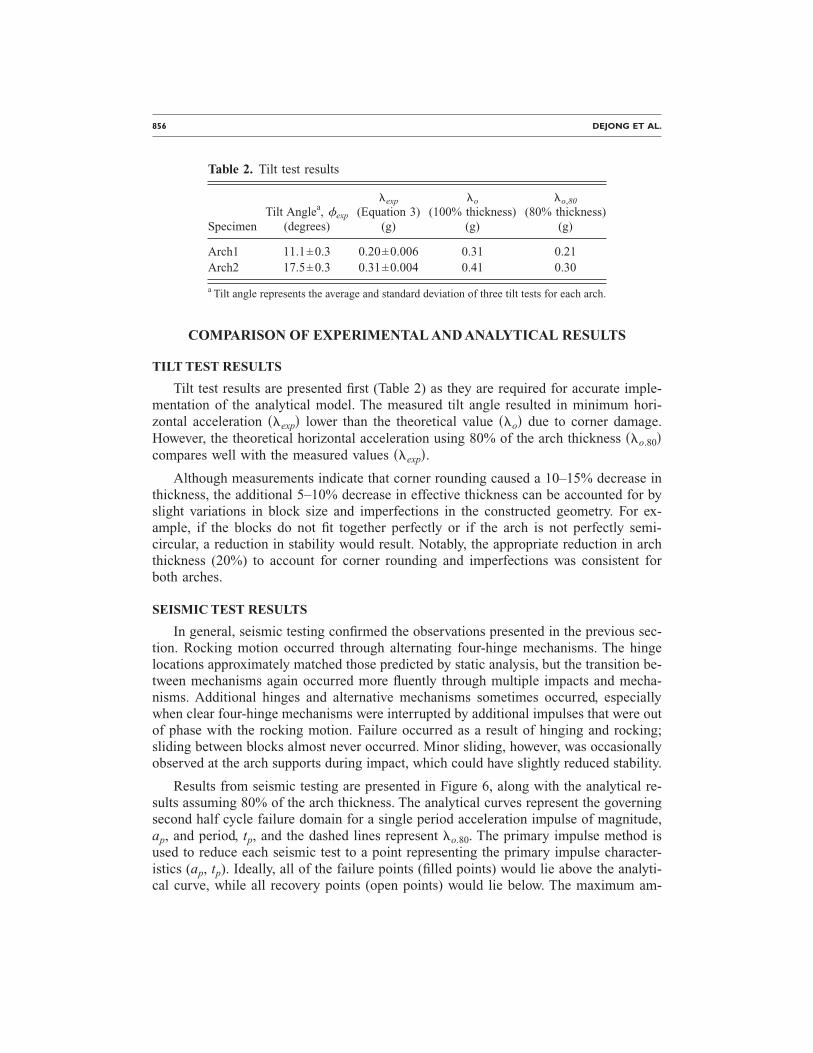
Tilt test results are presented first (Table 2) as they are required for accurate imple-mentation of the analytical model. The measured tilt angle resulted in minimum hori-zontal acceleration ��exp� lower than the theoretical value ��o� due to corner damage.However, the theoretical horizontal acceleration using 80% of the arch thickness ��o.80�compares well with the measured values ��exp�.
Although measurements indicate that corner rounding caused a 10–15% decrease inthickness, the additional 5–10% decrease in effective thickness can be accounted for byslight variations in block size and imperfections in the constructed geometry. For ex-ample, if the blocks do not fit together perfectly or if the arch is not perfectly semi-circular, a reduction in stability would result. Notably, the appropriate reduction in archthickness (20%) to account for corner rounding and imperfections was consistent forboth arches.
SEISMIC TEST RESULTS
In general, seismic testing confirmed the observations presented in the previous sec-tion. Rocking motion occurred through alternating four-hinge mechanisms. The hingelocations approximately matched those predicted by static analysis, but the transition be-tween mechanisms again occurred more fluently through multiple impacts and mecha-nisms. Additional hinges and alternative mechanisms sometimes occurred, especiallywhen clear four-hinge mechanisms were interrupted by additional impulses that were outof phase with the rocking motion. Failure occurred as a result of hinging and rocking;sliding between blocks almost never occurred. Minor sliding, however, was occasionallyobserved at the arch supports during impact, which could have slightly reduced stability.
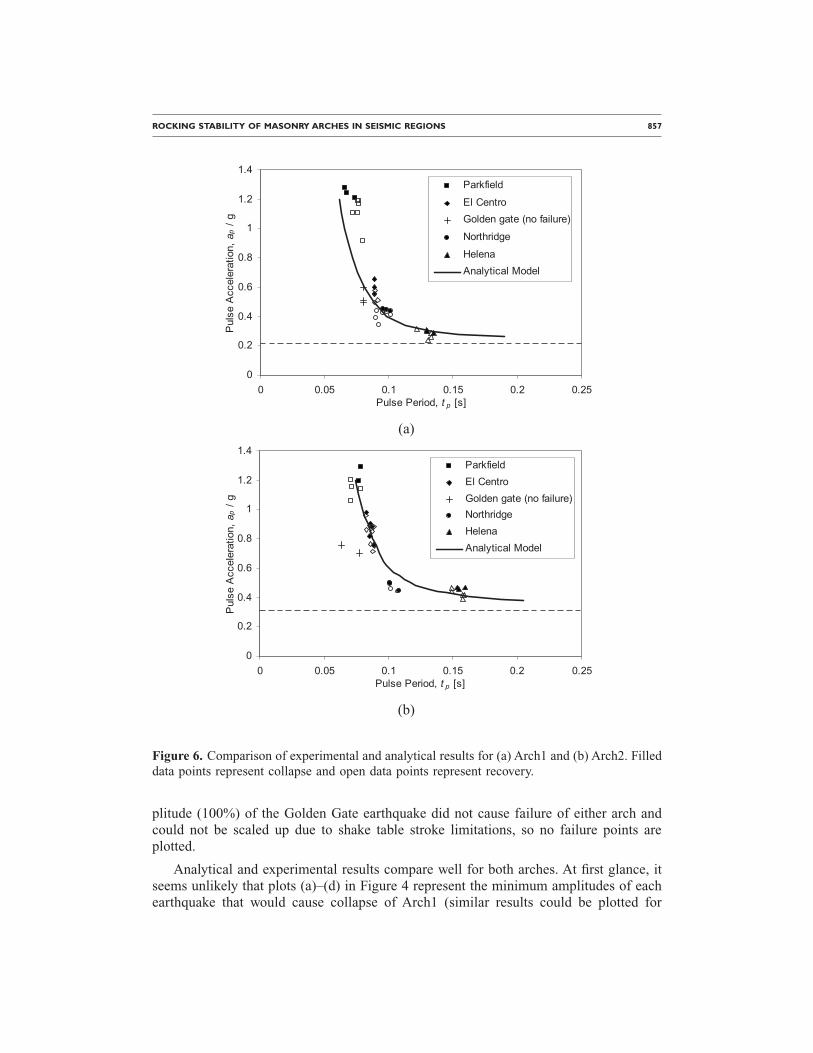
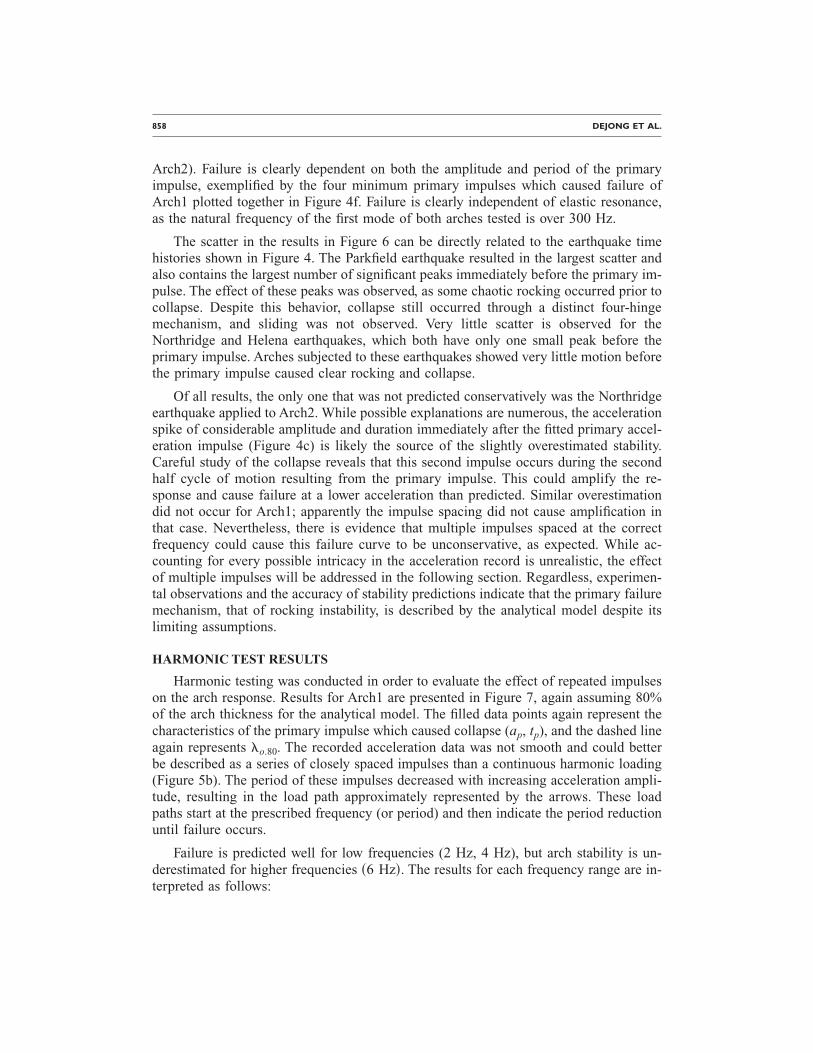
Results from seismic testing are presented in Figure 6, along with the analytical re-sults assuming 80% of the arch thickness. The analytical curves represent the governingsecond half cycle failure domain for a single period acceleration impulse of magnitude,ap, and period, tp, and the dashed lines represent �o.80. The primary impulse method isused to reduce each seismic test to a point representing the primary impulse character-istics (ap, tp). Ideally, all of the failure points (filled points) would lie above the analyti-cal curve, while all recovery points (open points) would lie below. The maximum am-
Table 2. Tilt test results
SpecimenTilt Anglea, �exp
(degrees)
�exp
(Equation 3)(g)
�o
(100% thickness)(g)
�o,80
(80% thickness)(g)
Arch1 11.1±0.3 0.20±0.006 0.31 0.21Arch2 17.5±0.3 0.31±0.004 0.41 0.30
a Tilt angle represents the average and standard deviation of three tilt tests for each arch.
ROCKING STABILITY OF MASONRY ARCHES IN SEISMIC REGIONS 857
plitude (100%) of the Golden Gate earthquake did not cause failure of either arch andcould not be scaled up due to shake table stroke limitations, so no failure points areplotted.
Analytical and experimental results compare well for both arches. At first glance, itseems unlikely that plots (a)–(d) in Figure 4 represent the minimum amplitudes of eachearthquake that would cause collapse of Arch1 (similar results could be plotted for
0
0.2
0.4
0.6
0.8
1
1.2
1.4
0 0.05 0.1 0.15 0.2 0.25Pulse Period, t p [s]
PulseAcceleration,a p/g
Parkfield
El CentroGolden gate (no failure)
Northridge
HelenaAnalytical Model
(a)
0
0.2
0.4
0.6
0.8
1
1.2
1.4
0 0.05 0.1 0.15 0.2 0.25Pulse Period, t p [s]
PulseAcceleration,a p/g
ParkfieldEl CentroGolden gate (no failure)NorthridgeHelenaAnalytical Model
(b)
Figure 6. Comparison of experimental and analytical results for (a) Arch1 and (b) Arch2. Filleddata points represent collapse and open data points represent recovery.
858 DEJONG ET AL.
Arch2). Failure is clearly dependent on both the amplitude and period of the primaryimpulse, exemplified by the four minimum primary impulses which caused failure ofArch1 plotted together in Figure 4f. Failure is clearly independent of elastic resonance,as the natural frequency of the first mode of both arches tested is over 300 Hz.
The scatter in the results in Figure 6 can be directly related to the earthquake timehistories shown in Figure 4. The Parkfield earthquake resulted in the largest scatter andalso contains the largest number of significant peaks immediately before the primary im-pulse. The effect of these peaks was observed, as some chaotic rocking occurred prior tocollapse. Despite this behavior, collapse still occurred through a distinct four-hingemechanism, and sliding was not observed. Very little scatter is observed for theNorthridge and Helena earthquakes, which both have only one small peak before theprimary impulse. Arches subjected to these earthquakes showed very little motion beforethe primary impulse caused clear rocking and collapse.
Of all results, the only one that was not predicted conservatively was the Northridgeearthquake applied to Arch2. While possible explanations are numerous, the accelerationspike of considerable amplitude and duration immediately after the fitted primary accel-eration impulse (Figure 4c) is likely the source of the slightly overestimated stability.Careful study of the collapse reveals that this second impulse occurs during the secondhalf cycle of motion resulting from the primary impulse. This could amplify the re-sponse and cause failure at a lower acceleration than predicted. Similar overestimationdid not occur for Arch1; apparently the impulse spacing did not cause amplification inthat case. Nevertheless, there is evidence that multiple impulses spaced at the correctfrequency could cause this failure curve to be unconservative, as expected. While ac-counting for every possible intricacy in the acceleration record is unrealistic, the effectof multiple impulses will be addressed in the following section. Regardless, experimen-tal observations and the accuracy of stability predictions indicate that the primary failuremechanism, that of rocking instability, is described by the analytical model despite itslimiting assumptions.
HARMONIC TEST RESULTS
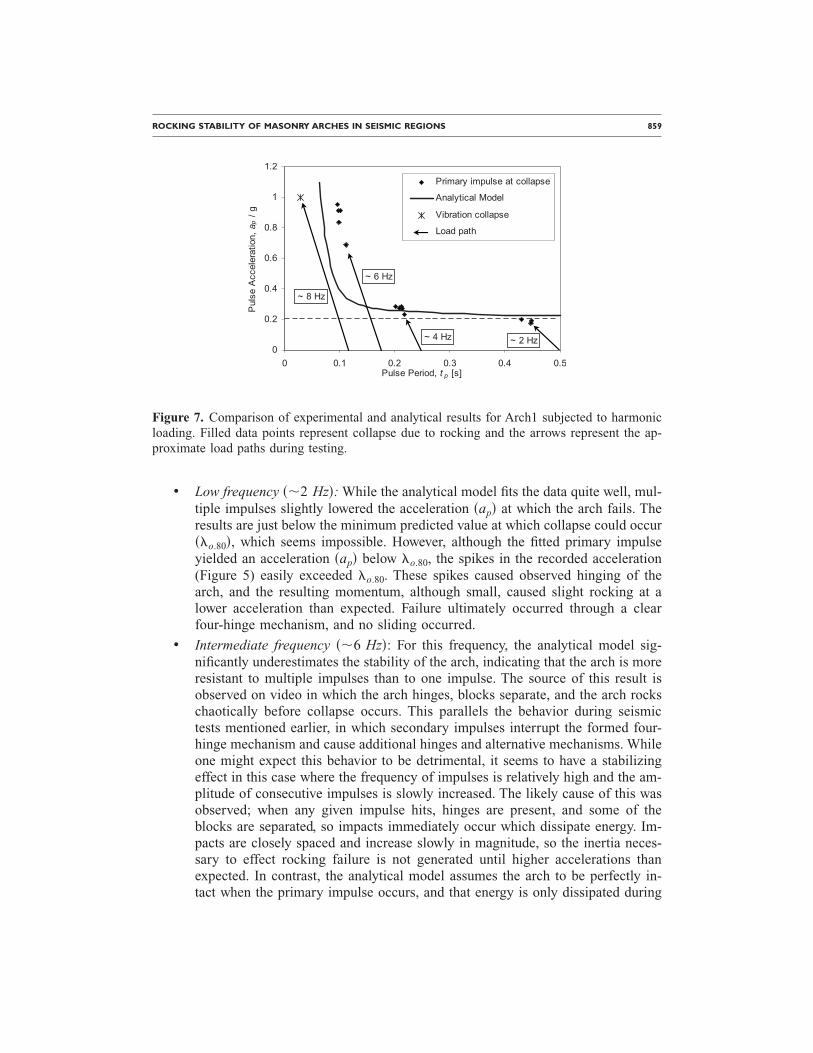
Harmonic testing was conducted in order to evaluate the effect of repeated impulseson the arch response. Results for Arch1 are presented in Figure 7, again assuming 80%of the arch thickness for the analytical model. The filled data points again represent thecharacteristics of the primary impulse which caused collapse (ap, tp), and the dashed lineagain represents �o.80. The recorded acceleration data was not smooth and could betterbe described as a series of closely spaced impulses than a continuous harmonic loading(Figure 5b). The period of these impulses decreased with increasing acceleration ampli-tude, resulting in the load path approximately represented by the arrows. These loadpaths start at the prescribed frequency (or period) and then indicate the period reductionuntil failure occurs.
Failure is predicted well for low frequencies (2 Hz, 4 Hz), but arch stability is un-derestimated for higher frequencies �6 Hz�. The results for each frequency range are in-terpreted as follows:
ROCKING STABILITY OF MASONRY ARCHES IN SEISMIC REGIONS 859
• Low frequency ��2 Hz�: While the analytical model fits the data quite well, mul-tiple impulses slightly lowered the acceleration �ap� at which the arch fails. Theresults are just below the minimum predicted value at which collapse could occur��o.80�, which seems impossible. However, although the fitted primary impulseyielded an acceleration �ap� below �o.80, the spikes in the recorded acceleration(Figure 5) easily exceeded �o.80. These spikes caused observed hinging of thearch, and the resulting momentum, although small, caused slight rocking at alower acceleration than expected. Failure ultimately occurred through a clearfour-hinge mechanism, and no sliding occurred.
• Intermediate frequency ��6 Hz�: For this frequency, the analytical model sig-nificantly underestimates the stability of the arch, indicating that the arch is moreresistant to multiple impulses than to one impulse. The source of this result isobserved on video in which the arch hinges, blocks separate, and the arch rockschaotically before collapse occurs. This parallels the behavior during seismictests mentioned earlier, in which secondary impulses interrupt the formed four-hinge mechanism and cause additional hinges and alternative mechanisms. Whileone might expect this behavior to be detrimental, it seems to have a stabilizingeffect in this case where the frequency of impulses is relatively high and the am-plitude of consecutive impulses is slowly increased. The likely cause of this wasobserved; when any given impulse hits, hinges are present, and some of theblocks are separated, so impacts immediately occur which dissipate energy. Im-pacts are closely spaced and increase slowly in magnitude, so the inertia neces-sary to effect rocking failure is not generated until higher accelerations thanexpected. In contrast, the analytical model assumes the arch to be perfectly in-tact when the primary impulse occurs, and that energy is only dissipated during
0
0.2
0.4
0.6
0.8
1
1.2
0 0.1 0.2 0.3 0.4 0.5Pulse Period, t p [s]
PulseAcceleration,a p/g
Primary impulse at collapse
Analytical Model
Vibration collapse
Load path
~ 8 Hz
~ 6 Hz
~ 4 Hz ~ 2 Hz
Figure 7. Comparison of experimental and analytical results for Arch1 subjected to harmonicloading. Filled data points represent collapse due to rocking and the arrows represent the ap-proximate load paths during testing.
860 DEJONG ET AL.
the single impact in which the hinges reflect, causing the stability to beunderestimated.
• High frequencies ��8 Hz�: At high frequencies the arch did not fail by hingingand rocking, but instead failed due to vibration displacements between the stones(De Lorenzis et al. 2007, Meyer et al. 2007). Essentially, no single impulse waslarge enough to create failure due to a hinging mechanism, but the arch insteadvibrated apart. The lack of hinging failure is predicted by the analytical model, asthe load path never intersects the analytically predicted failure domain (Figure 7),but illuminates the fact that the failure domain does not incorporate vibrationcollapse. Although several tests were run, only one representative failure point isplotted because vibration failure is dependent on the duration of the vibrationwhich cannot be visualized in Figure 7.
In general, applying multiple impulses with increasing amplitude and constant fre-quency instead of a single impulse had either a stabilizing effect or very little effect atall. Although this result was unexpected, it does not mean that multiple impulses couldnot have a detrimental effect. The rocking arch parallels the rocking block, in which thenatural frequency of rocking decreases with the rocking amplitude (Housner 1963).Thus, multiple impulses spaced at a decreasing frequency would be more likely to acttogether to amplify the response, and lower the impulse magnitude necessary to causecollapse.
TOWARD AN ASSESSMENT CRITERION
Although the analytical model has been shown to be effective in predicting collapse,it is of little use if a prohibitive amount of work is required to obtain a first-order failurecurve for each possible arch geometry. Thus, working toward an applicable tool for as-sessment of existing arches, the analytical model is used as a basis to develop a suite offailure curves which predict the stability of a wide range of arch geometries.
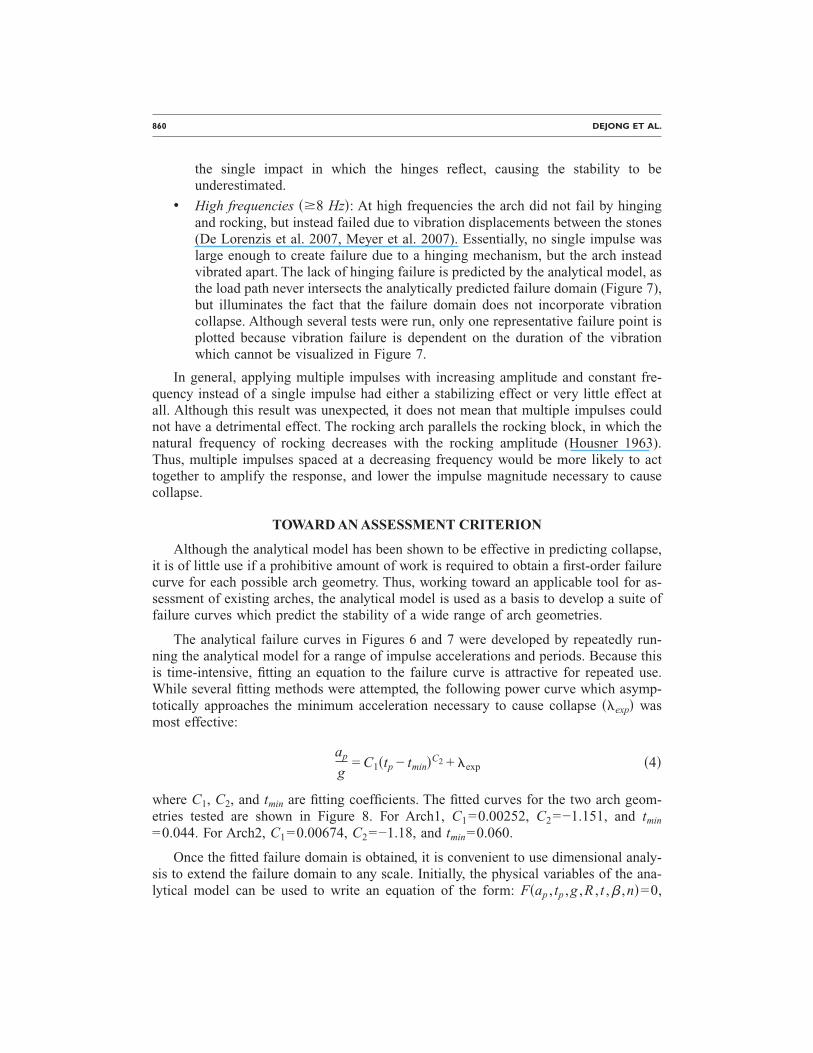
The analytical failure curves in Figures 6 and 7 were developed by repeatedly run-ning the analytical model for a range of impulse accelerations and periods. Because thisis time-intensive, fitting an equation to the failure curve is attractive for repeated use.While several fitting methods were attempted, the following power curve which asymp-totically approaches the minimum acceleration necessary to cause collapse ��exp� wasmost effective:
ap
g= C1�tp − tmin�C2 + �exp �4�
where C1, C2, and tmin are fitting coefficients. The fitted curves for the two arch geom-etries tested are shown in Figure 8. For Arch1, C1=0.00252, C2=−1.151, and tmin
=0.044. For Arch2, C1=0.00674, C2=−1.18, and tmin=0.060.
Once the fitted failure domain is obtained, it is convenient to use dimensional analy-sis to extend the failure domain to any scale. Initially, the physical variables of the ana-lytical model can be used to write an equation of the form: F�ap , tp ,g ,R , t ,� ,n�=0,
ROCKING STABILITY OF MASONRY ARCHES IN SEISMIC REGIONS 861
where F is a function of the m previously defined variables. Note that the physical vari-ables exist in only two fundamental dimensions: length, L, and time, T. Hence, two di-mensionally independent variables �tp ,R� are used to create five �m−2� dimensionlessproducts (�-terms) which represent the complete set of physical variables. For the ana-lytical model to remain dimensionally homogeneous:
G��1 =aptp
2
R,�2 =
gtp2
R,�3 =
t
R,�4 = �,�5 = n� = 0 �5�
For complete similarity between scales, the dimensionless products in Equation 5 mustremain constant at all scales. While �3, �4, and �5 are unaffected by scale, �1 and �2
are affected. Using �2, the known similitude requirement that the time must be scaled bythe square root of the scale factor (e.g., Harris and Sabnis 1999) is derived:
tp,2 = tp,1�R2/R1 �6�
where the subscript 1 indicates the original scale, and the subscript 2 indicates the newscale. Note that Equation 6 also fulfills the similitude requirement for �1. This scalingrelation was also mentioned by Housner (1968) for the rocking block and by Oppenheim(1992) and De Lorenzis et al. (2007) for the arch. While this scaling relation is expected,dimensional analysis clearly demonstrates that material properties (density, elasticity,strength, etc.) do not enter the problem, so no other scaling relationship is necessary.
Failure curves can now be calculated and fit at a single scale �R=1 m�, and theneasily extended to any other scale. The following failure curve results:
0
0.2
0.4
0.6
0.8
1
1.2
1.4
0 0.05 0.1 0.15 0.2 0.25Pulse Period, t p [s]
PulseAcceleration,a p/g
Arch1 (analytical)
Arch2 (analytical)
Fit of analytical data (Eq. 4)
Assessment criterion (Eq. 7)
Figure 8. Comparison of analytical failure points for Arch1 and Arch2 to fitted failure curves(Equation 4) and the general failure curves (Equation 7).
862 DEJONG ET AL.
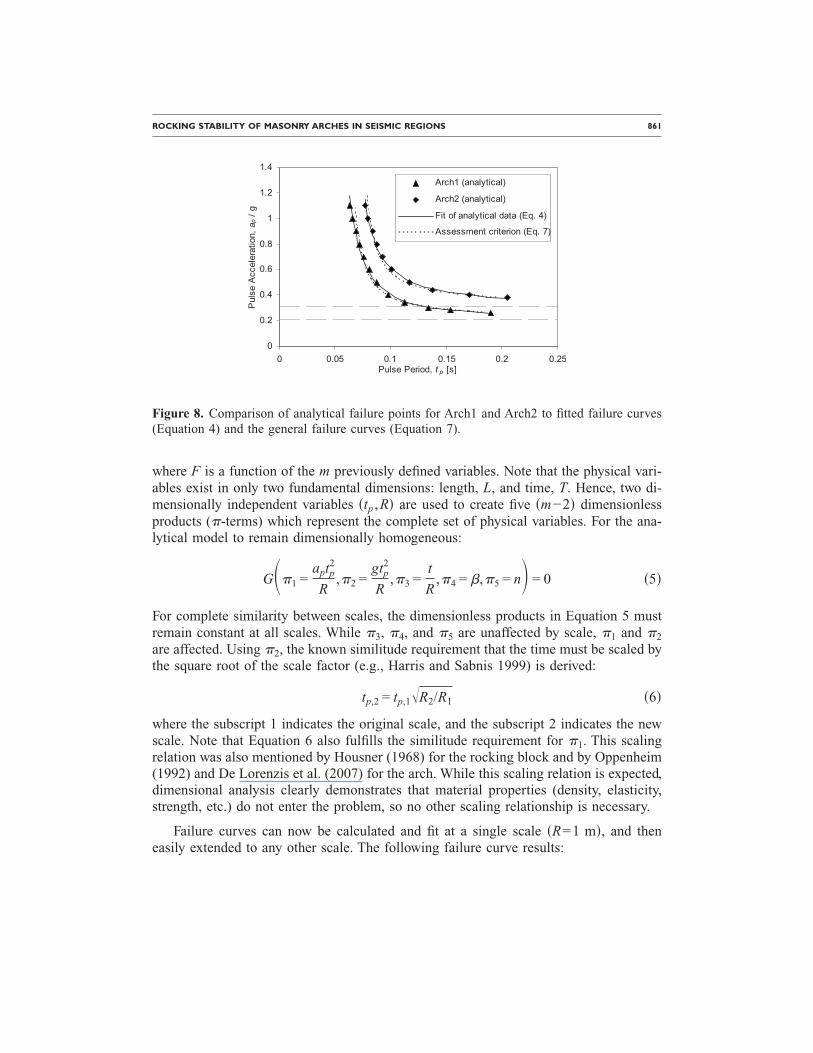
ap
g= C1� tp
�R− tmin�C2
+ � �7�
where R is the centerline radius in meters, tp is in seconds, and C1, C2, and tmin are di-mensionless fitting coefficients which need to be defined.
Assuming that each voussoir encompasses an angle of five degrees (i.e., n=� /5), thefitting coefficients are dependent only on t /R and � and are presented in Table 3. In theanalytical model the voussoirs only act to discretize the problem by defining the possiblehinge locations. Assuming too few voussoirs typically causes an overestimation of sta-bility and vice versa. Additionally, if a sufficient number of voussoirs results in failurecurves which are relatively insensitive to increased refinement, typical of many discreti-zation problems. Therefore, a relatively large number of voussoirs were chosen as con-servative.
The failure curves which result from Equation 7 and Table 3 were also plotted inFigure 8 for the arches which were experimentally tested. These curves compare wellwith the failure curves generated using Equation 4, indicating that the scaling relationand the assumption of the number of voussoirs �n=� /5� are effective.
Using Equation 7 and Table 3, the stability of an arch during an expected groundmotion can be predicted through the following procedure:
Table 3. Coefficients C1, C2, tmin, and � for use inEquation 7
t /R
Inclusion Angle, � [degrees]
140 150 160 170 180
0.12 C1 0.040 0.030 0.018 0.008 —C2 −0.69 −0.80 −0.92 −1.20tmin 0.20 0.17 0.14 0.11� 0.42 0.32 0.23 0.14
0.15 C1 0.061 0.048 0.032 0.018 0.008C2 −0.54 −0.59 −0.76 −1.00 −1.31tmin 0.28 0.26 0.21 0.16 0.11� 0.55 0.43 0.33 0.24 0.14
0.18 C1 0.082 0.063 0.050 0.032 0.018C2 −0.41 −0.51 −0.57 −0.79 −1.04tmin 0.39 0.33 0.30 0.23 0.17� 0.69 0.54 0.43 0.33 0.23
0.21 C1 0.101 0.080 0.063 0.047 0.028C2 −0.41 −0.42 −0.50 −0.64 −0.89tmin 0.48 0.41 0.35 0.28 0.22� 0.82 0.65 0.52 0.41 0.31
ROCKING STABILITY OF MASONRY ARCHES IN SEISMIC REGIONS 863
1. Measure the arch geometry, and reduce the arch thickness to account for geo-metrical imperfections. A 20% reduction in thickness is recommended but alarger reduction is recommended if the arch is significantly deformed.
2. Using the reduced thickness, extract the appropriate values from Table 3 (inter-polate if necessary), and apply Equation 7 to obtain the predicted failure curve.
3. Extract the primary impulse from the expected ground motion and compare. Ifthe primary impulse falls above the curve, failure is predicted and vice versa.
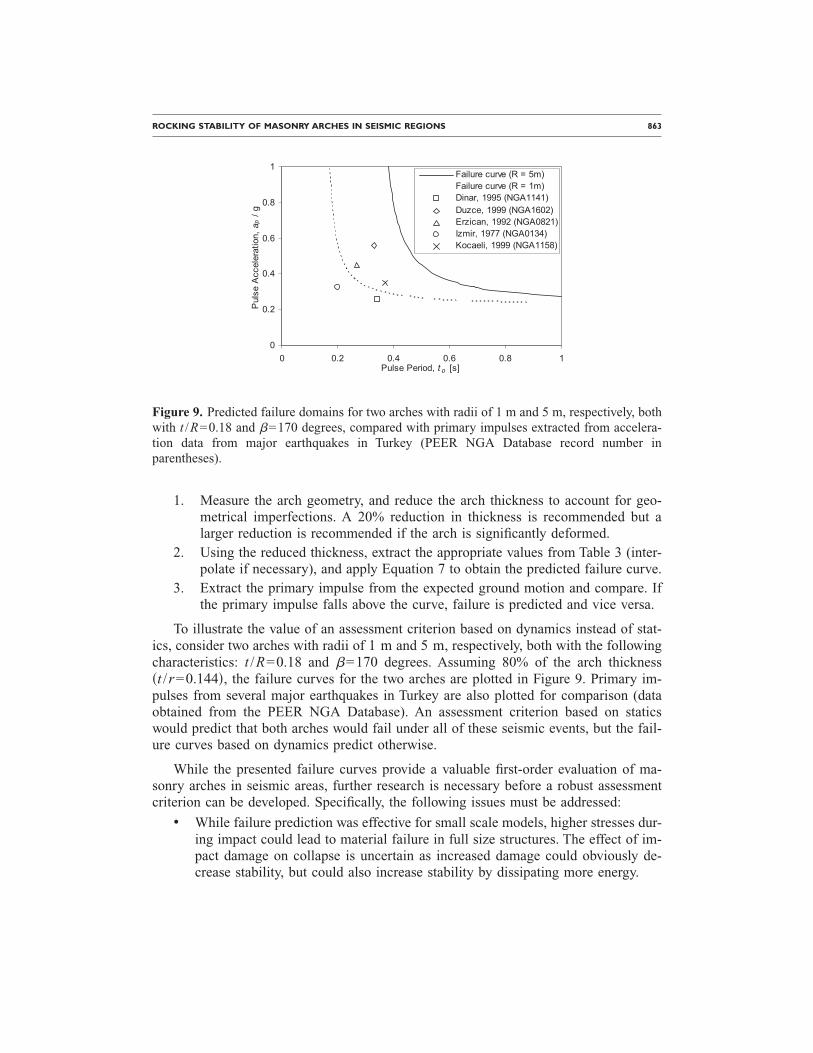
To illustrate the value of an assessment criterion based on dynamics instead of stat-ics, consider two arches with radii of 1 m and 5 m, respectively, both with the followingcharacteristics: t /R=0.18 and �=170 degrees. Assuming 80% of the arch thickness�t /r=0.144�, the failure curves for the two arches are plotted in Figure 9. Primary im-pulses from several major earthquakes in Turkey are also plotted for comparison (dataobtained from the PEER NGA Database). An assessment criterion based on staticswould predict that both arches would fail under all of these seismic events, but the fail-ure curves based on dynamics predict otherwise.
While the presented failure curves provide a valuable first-order evaluation of ma-sonry arches in seismic areas, further research is necessary before a robust assessmentcriterion can be developed. Specifically, the following issues must be addressed:
• While failure prediction was effective for small scale models, higher stresses dur-ing impact could lead to material failure in full size structures. The effect of im-pact damage on collapse is uncertain as increased damage could obviously de-crease stability, but could also increase stability by dissipating more energy.
0
0.2
0.4
0.6
0.8
1
0 0.2 0.4 0.6 0.8 1Pulse Period, t p [s]
PulseAcceleration,a p/g
Failure curve (R = 5m)Failure curve (R = 1m)Dinar, 1995 (NGA1141)Duzce, 1999 (NGA1602)Erzican, 1992 (NGA0821)Izmir, 1977 (NGA0134)Kocaeli, 1999 (NGA1158)
Figure 9. Predicted failure domains for two arches with radii of 1 m and 5 m, respectively, bothwith t /R=0.18 and �=170 degrees, compared with primary impulses extracted from accelera-tion data from major earthquakes in Turkey (PEER NGA Database record number inparentheses).
864 DEJONG ET AL.
• Extraction of the primary impulse is particularly appropriate for near-sourceearthquake loading which can be described by a primary acceleration pulse.While this study showed that primary impulse extraction is also effective for pre-dicting rocking-type collapse resulting from a variety of earthquake time histo-ries, further research is needed to confirm this. Specifically, the possible ampli-fication of response through critically spaced impulses must be evaluated.
• For long duration, high frequency base motion, an additional failure criterionbased on vibration displacements should be considered.
• In reality, arches do not rest on rigid supports, and support deformation must beconsidered. Arches which rest on highly deformable supports (e.g., an arch ontall buttresses) could be of significantly lower stability (DeJong and Ochsendorf2006).
CONCLUSIONS
This experimental investigation provides new insight into the dynamic behavior ofmasonry arches under base motion. Alternating four-hinge mechanisms formed duringmotion and rocking-type failure governed, confirming previous analytical and numericalpredictions (De Lorenzis et al. 2007). Elastic resonance did not occur and furthermorecould not cause amplification of the rocking motion.
The analytical model combined with the primary impulse method, extracting the pri-mary impulse of an acceleration record, provided accurate failure predictions for thearches tested. In the process, further evidence that rocking type structures are particu-larly vulnerable to impulse-type base motions was presented. Additionally, the accelera-tion magnitude and period of the impulse were both shown to be critical in causing fail-ure. The effects of vibration displacements and multiple impulses were tested andobserved, and require future investigation.
Results led to the development of a suite of failure curves which predict the rockingstability of a range of masonry arch geometries. While the failure curves accurately pre-dicted failure of the small scale arches tested, application to full scale structures requiresfurther research. Several areas of future research have been specifically identified andcould lead to a broadly applicable, rapid-assessment tool which would be of great utilityin evaluating the safety of vaulted masonry structures around the world.
ACKNOWLEDGMENTS
The authors gratefully acknowledge Dr. John Germaine and David Lallemant for as-sistance with laboratory testing. Financial support for this research was provided to thefirst author by the MIT presidential fellowship.
ROCKING STABILITY OF MASONRY ARCHES IN SEISMIC REGIONS 865
REFERENCES
DeJong, M., and Ochsendorf, J., 2006. Analysis of vaulted masonry structures subjected tohorizontal ground motion, in Proceedings, Fifth International Conference on StructuralAnalysis of Historical Constructions, P. B. Lourenço, P. Roca, C. Modena, S. Agrawal (edi-tors), vol. 2, New Delhi, pp. 973–980.
De Lorenzis, L., DeJong, M., and Ochsendorf, J., 2007. Failure of masonry arches under im-pulse base motion, Earthquake Eng. Struct. Dyn. 36, 2119–2136.
De Luca, A., Giordano, A., and Mele, E., 2004. A simplified procedure for assessing the seis-mic capacity of masonry arches, Eng. Struct. 26, 1915–1929.
Harris, H. G., and Sabnis, G. M., 1999. Structural modeling and experimental techniques (2ndedition), CRC Press Inc., Boca Raton, FL.
Heyman, J., 1966. The stone skeleton, Int. J. Solids Struct. 2, 249–279.
Heyman, J., 1982. The masonry arch, Ellis Horwood-Wiley, West Sussex, UK.
Housner, G. W., 1963. The behavior of inverted pendulum structures during earthquakes, Bull.Seismol. Soc. Am. 53, 403–417.
Meyer, P., Germaine, J., Kausel, E., and Ochsendorf, J., 2007. The impact of high-frequency/low energy seismic waves on unreinforced masonry. Earthquake Spectra 23, 77–94.
Oppenheim, I. J., 1992. The masonry arch as a four-link mechanism under base motion, Earth-quake Eng. Struct. Dyn. 21, 1005–1017.
Peña, F., Prieto, F., Lourenço, P. B., Campos Costa, A., and Lemos, J. V., 2007. On the dynamicsof rocking motions of single rigid-block structures, Earthquake Eng. Struct. Dyn. 36, 2383–2399.
Shenton, H. W., 1996. Criteria for initiation of slide, rock, and slide-rock rigid-body modes, J.Eng. Mech. 122, 690–693.
Spanos, P. D., and Koh, A., 1984. Rocking of rigid blocks due to harmonic shaking, J. Eng.Mech. 110, 1627–1642.
Yim, C., Chopra, A. K., and Penzien, J., 1980. Rocking response of rigid blocks to earthquakes,Earthquake Eng. Struct. Dyn. 8, 565–587.
Zhang, J., and Makris, N., 2001. Rocking response of free-standing blocks under cycloidalpulses, J. Eng. Mech. 127, 473–483.
(Received 8 January 2008; accepted 12 July 2008�