rigorous evaluation of roads to success: design report
TRANSCRIPT

Contract No.: 6388 MPR Reference No.: 6388-600
Rigorous Evaluation of Roads to Success: Design Report May 14, 2009 Duncan Chaplin Martha Bleeker Claire Smither
Submitted to:
Roads to Success Program 307 West 38th Street Suite 101 New York, NY 10018
Project Officer:
Jonathan Rosenberg Executive Director Roads to Success
Submitted by:
Mathematica Policy Research, Inc. 600 Maryland Ave. S.W., Suite 550 Washington, DC 20024-2512 Telephone: (202) 484-9220 Facsimile: (202) 863-1763
Project Director:
Duncan Chaplin

iii
ACKNOWLEDGMENTS
The authors would like to thank the many people who contributed to this report. These include Jonathan Rosenberg and Kate Cushing at Roads to Success (RTS) and James Rosenbaum at Northwestern University, who are collaborating with us in this evaluation work. It also includes the many RTS facilitators at the study schools who administered the student surveys.
A number of staff at Mathematica Policy Research, Inc. also played important roles in the
creation of this report. Gail Baxter provided guidance and advice on survey matters, and Alicia Leonard, Marcia Comly, and Stacie Feldman carried out the data collection efforts. Neil Seftor provided quality assurance review, Dorothy Bellow provided word processing support, Carol Soble and Amanda Bernhardt provided editing support, and Donna Dorsey and Alfreda Holmes provided production support.

v
CONTENTS
Page
RIGOROUS EVALUATION OF ROADS TO SUCCESS DESIGN MEMORANDUM ..........................................................................................................1
BACKGROUND ............................................................................................................1
THE RTS INTERVENTION ..........................................................................................2
Comprehensive and Consistent College and Career Planning Curriculum .............4 Engaging Teaching Methods ...................................................................................7 High Dosage.............................................................................................................8 Feasibility .................................................................................................................8 Potential Efficacy .....................................................................................................9
RESEARCH DESIGN ....................................................................................................9
COMPARISON OF BASELINE CHARACTERISTICS .............................................11
THE EVALUATION DATA ........................................................................................12
Measures ................................................................................................................12 Data Collection Methods .......................................................................................14
ANALYSIS METHODS ...............................................................................................16
Statistical Power.....................................................................................................19
CONCLUSION .............................................................................................................20
REFERENCES ..............................................................................................................21
vi
CONTENTS (continued) APPENDIX A: RTS GRADE OVERVIEWS ........................................................... A-1
APPENDIX B: LESSON PLAN .................................................................................B-1
APPENDIX C: PARENT NEWSLETTER ................................................................C-1
APPENDIX D: CLASSROOM OBSERVATION PROTOCOL .............................. D-1
APPENDIX E: LIST OF RTS SCHOOLS ................................................................. E-1
APPENDIX F: FACILITATOR IMPLEMENTATION FORM ................................ F-1
APPENDIX G: FOLLOW-UP SURVEY .................................................................. G-1
APPENDIX H: FUTURE OUTCOME VARIABLES .............................................. H-1
APPENDIX I: IMPLEMENTATION METHODS ..................................................... I-1
APPENDIX J: FACILITATOR JOUNRAL ................................................................ J-1

1
RIGOROUS EVALUATION OF ROADS TO SUCCESS DESIGN MEMORANDUM
The Roads to Success (RTS) program was launched in early 2005 to help forge connections between students’ school experiences and their aspirations for adulthood, as an ongoing part of their middle and high school programs. In 2006, RTS partnered with Mathematica Policy Research, Inc. (MPR), to conduct an eight-year evaluation of the intervention. This evaluation was designed to estimate impacts of RTS by using random assignment. This report describes the RTS intervention, the research design, the evaluation data, the analysis methods, and a comparison of baseline characteristics of the treatment and control groups.
Unfortunately, funding for the RTS program and study was cut severely in 2008 due to health problems of the funder. Consequently, the intervention and study are both currently scheduled to conclude in 2009. The report discusses the evaluation plan both under current funding and if funding is restored for both the intervention and study.
MPR is producing this report now in part to show that we developed the design before looking at our follow-up data. This ensures that our design was not influenced by the data. While we had received follow-up data from eleven schools by May 14, 2009, we had not entered those data, cleaned them, or looked at any of the data before writing this report.
BACKGROUND
In fall 2006, MPR randomly assigned 25 schools, each with two cohorts of students, to one of two treatment conditions. Cohort 1 students started 7th grade in 2007–2008 and Cohort 2 students started seventh grade in 2008–2009. Combined, the sample includes more than 4,000 students. Random assignment determined which of these two cohorts of students at each school would receive the intervention. Thirteen of the schools were randomly assigned to deliver the RTS intervention to Cohort 1 students, and the other 12 schools were randomly assigned to deliver the RTS intervention to Cohort 2 students. The current study design calls for the collection of baseline administrative data for Cohort 1 from the end of grade 6, the collection of baseline survey data for both cohorts of students at the beginning of grade 7, and the collection of follow-up survey data for Cohort 1 at the end of grade 8. The current project is designed to answer two sets of research questions.
1. What are the short-term impacts of the RTS program at the end of grade 8 for all students?
2. How do the impacts vary by student and school characteristics?
If additional funding is secured, future research could answer two more sets of research questions:

2
3. What are the intermediate and long-term impacts of the RTS program at the end of grades 9, 10 and 12 overall and for various subgroups based on student and school characteristics?
4. How well is the intervention implemented, do the activities of the treatment group differ from those of the control group, and what implementation barriers are encountered?
THE RTS INTERVENTION
RTS is an in-school guidance program designed to address (1) the lack of systematic guidance offered to students regarding their future and (2) the lack of engagement with school as reported by many youth. Unlike the wide array of college access and guidance programs that are operating in high schools, RTS is a classroom-based program serving whole-grade cohorts at a low cost per student. Specially trained facilitators implement RTS. Key features of RTS include:
• A Comprehensive and Consistent College and Career Planning Curriculum. A standardized curriculum covering career exploration, education planning, and education/workplace skills
• Engaging Teaching Methods. Active classroom methods, technology, project-based learning activities, and student accountability
• High Dosage. Three-quarters of an hour per week for six school years (grades 7–12)
The RTS curriculum is intended to improve postsecondary education and career outcomes by helping students (1) learn about future career opportunities, (2) plan for their education appropriately, and (3) develop the skills needed to take full advantage of future educational and workplace opportunities (Figure 1). The early focus on career exploration is designed to increase student engagement by ensuring that youth see how their education relates to their future careers. The focus on education planning helps ensure that students complete the relevant high school coursework and related preparation activities in time to take full advantage of potential postsecondary and early career options. All three curriculum components are designed to help students succeed in critical transitions between grades, between schools, and when entering the workforce.
RTS was created by a nonprofit organization (the RTS organization) that started designing the intervention in 2004. First, the organization examined the theoretical and empirical research base for a career and education planning program. It also met with numerous individuals and organizations to seek advice about specific program elements. Based on this work, the RTS organization staff created a scope and sequence of thematic units and lesson plans, which are summarized in the Grade Overviews in Appendix A. Outlines were developed for each lesson and then sent to professional curriculum writers who developed complete lesson plans and related student handbook and portfolio materials. A sample lesson plan is available in Appendix B. The scope and sequence has been revised several times over the past four years, with input from content experts, an RTS advisory board, and school district partners. Quantitative and

3
qualitative feedback is also obtained from RTS facilitators after each lesson and from RTS students at the middle and end of each school year.
The design of RTS is based in part on recommendations of the American School Counselors Association (ASCA) (Bowers and Hatch 2005). While RTS is intended to help facilitate the work of school counselors, it is not designed to replace them. Rather, by providing schools with a means of addressing the career and education planning needs of students, RTS allows school counselors to focus on the tasks that already consume much of their time—in particular, responding to the short-term needs of youth who require individual counseling, crisis management, referrals, and/or consultations (Bowers and Hatch 2005). Even though ASCA standards also call for counselors to develop classroom-based guidance programs, the reality is that most counselors, especially in low-income schools, do not have the time to do so (Lee and Ekstrom 1987). RTS helps address this reality.
FIGURE 1
LOGIC MODEL FOR RTS PROGRAM
Background Factors
The Intervention
• Comprehensive and Consistent College and Career Planning Curriculum − Career exploration − Education planning − Education and workplace
skills
• Engaging Teaching Methods − Active classroom methods − Technology − Project-based learning − Student accountability
• High Dosage − Grades 7 through 12 − Weekly classes − All students in a grade
Intermediate Outcomes
• Increased engagement in school
• Improved plans for education and career paths
• Increased completion of college-preparatory activities, including rigorous high school coursework and college and job applications
• Successful transitions between schools and into the workforce, including high school completion and work during postsecondary education
Long-Term Outcomes
• Postsecondary education or training: enrollment, persistence, and completion
• Career attainment
School quality, peer effects Pre-program student skills, knowledge, beliefs and behaviors
Parent and community characteristics

4
Following is a more detailed description of the key features of the RTS program, a discussion of its feasibility, and preliminary evidence of its efficacy.
Comprehensive and Consistent College and Career Planning Curriculum
The ASCA calls for the “systematic delivery” of a comprehensive guidance program (Bowers and Hatch 2005). In line with this recommendation, RTS lessons are part of a standardized, fully articulated six-year program. As noted earlier, the RTS curriculum follows a scope and sequence for each grade level (within a larger six-year scope) and includes detailed lesson plans (see Appendix B for a sample lesson plan). It also uses student handbooks and portfolios and monthly parent newsletters that are aligned with program content (see Appendix C for a sample parent newsletter). Although the balance of content differs by grade level, each year of the RTS program contains elements of career exploration, education planning, and education/workplace skills. To help ensure that RTS is implemented consistently at all sites, national RTS staff carefully train and supervise the RTS facilitators at each school who deliver the intervention to students. Staff from the national organization conduct biannual classroom observations of the facilitators as they deliver RTS lessons (see Appendix D for a sample classroom observation protocol).
In contrast, many interventions with similar goals are implemented inconsistently both within and across schools or program sites. For example, the federal Gaining Early Awareness and Readiness for Undergraduate Programs (GEAR UP) provides nearly 300 different local grants, each supporting a different program mix developed from a general set of guidelines; the federal Talent Search program consists of approximately 360 grants with a similar framework (Humphrey et al. 2002). Evaluations of both programs have noted the difficulty of assessing their effectiveness due to the variable nature of what “the program” actually is (U.S. Department of Education 2002a, 2002b).
A related issue is that many programs similar to RTS are targeted at only a subset of students. In contrast, RTS is intended as a treatment for an entire cohort, serving all students in a school, in a given grade, and during the school day as a mandatory program and a regular part of each student’s schedule. This treatment regimen helps ensure that the program is delivered in a consistent manner and has the potential to create a peer culture focused on motivation, planning, and educational attainment (Hossler et al. 1999; McDonough 2005). Programs that operate as more of a “pullout” for a subset of students (for example, Talent Search) can suffer from highly variable student participation, particularly over successive years of enrollment in a program. Similarly, programs that are offered after school, during the summer, or as electives also suffer from highly variable participation and limit which students may participate (U.S. Department of Education 2002b). Following is a detailed description of the curriculum elements of the RTS intervention.
Career Exploration
Career exploration is a key early component of the RTS intervention because of the need to motivate students to plan for their education and develop appropriate education and workplace skills. Research suggests that career planning is positively associated with student engagement in

5
both middle and high school (Kenny et al. 2006; Lapan et al. 2001; Lapan 2004). Hossler et al. (1999) argue that, in order to maximize their chances of postsecondary and career success, students should develop career and educational aspirations in grades 7 to 9. Meta-analyses suggest that career guidance activities may have the largest positive effects in junior high or middle school (Oliver and Spokane 1988; Whiston et al. 1998).
Consistent with these findings, the RTS program contains a significant yearly focus on career exploration and planning starting in grade 7, when students may still be deciding whether or not to go to college. The goal is to increase student motivation through the development of career aspirations before students enter high school. The content for grades 7 through 9 includes interest inventories, a grade 7 student-led career fair; and specific lessons on identifying careers of interest, the education required to enter those careers, and the benefits of a college education. In later grades, additional career exploration activities are presented, including a grade 11 job-shadowing project. Appendix A includes an overview of the RTS curriculum by grade.
Education Planning
Students who decide to go to college must have sufficient information for how to search successfully for appropriate postsecondary alternatives and how to choose among them (Hossler and Gallagher 1987). Many students and their families lack this information (Cabrera and La Nasa 2000; McDonough 1997). Some overestimate the cost of college and are unaware of available financial assistance (U.S. Department of Education 2003). The RTS program provides students and their families with this information.
While good information is important, that alone is not enough. Many students can state their career aspirations but do not understand what makes those aspirations desirable, what it would be like to have those jobs, or what actions they must take to make their goals a reality. Bridging this gap in understanding may be difficult for guidance counselors with a typical 15-minute session with a student. Consequently, RTS incorporates planning skills into its curriculum.
The importance of planning is suggested by the fact that adolescents with coherent, aligned plans demonstrate greater motivation and effort and have an increased capacity to draw on resources (Schneider and Stevenson 1999). More generally, experts suggest that helping students plan for their education and careers appears to be important for high school completion and later outcomes (Dynarski et al. 2008; Woloszyk 1996; Hayward and Tallmadge 1995; Bragg 1997; Bauer and Michael 1993).
The RTS six-year sequence of activities for students and monthly newsletters for parents is designed to ensure that students and families have sufficient information and planning skills to make informed educational choices. Beginning in grade 7, students learn about postsecondary options, and in grade 10, students take part in a college visit and prepare for the PSAT during class time. RTS activities in grades 11 and 12 focus class time on the specific activities in which students must engage to attend college—including preparing for the SAT/ACT; filling out college and financial aid applications; and engaging in scholarship search and postsecondary budgeting activities. They also participate in job shadowing in grade 11 and in informational interviewing in grade 12. RTS students develop education plans early in the process, revisit the

6
plans each year, and receive advice to help them understand their plans as well as encouragement to make sure that their plans are aligned with career goals, personal interests, values, and academic preparation.
Students from a low socioeconomic background are less likely to have access to education planning and other related guidance activities needed for a successful secondary and postsecondary experience. Furthermore, students who lack access to guidance counseling are more likely to be placed in non-academic curricular tracks and take fewer mathematics courses (Lee and Ekstrom 1987). Consequently, all RTS students participate in the planning and researching of education options, helping ensure that all students receive the counseling and information they need to make informed decisions about the courses they take in high school and their post–high school careers.
Education and Workplace Skills
Employers readily acknowledge that America’s high school graduates lack many non-academic skills needed for success in the workplace (Olson 2007) and the competitive global economy (Hamilton and Hamilton 1999; Orfield 1997; Conley 2007). Similarly, educators feel that many college students lack key skills necessary for postsecondary success (Rosenbaum et al. 2006). Indeed, these skills, many of which overlap, receive scant attention in most secondary schools in the United States compared to other nations (Stevenson and Stigler 1992). To address these issues, RTS includes components designed to teach a number of non-academic skills, including information gathering, planning, group work, presentation methods, and financial management.
The RTS middle school program includes lessons on short-term planning, study skills, note-taking, managing stress, and budgeting. The grade 7 career fair introduces students to the rudiments of research and public speaking as does a grade 8 project-based learning unit on improving one’s community. Students learn how to work in groups effectively, reflect on projects, and complete tasks in long-term projects.
The high school program covers information-gathering skills through lessons on researching postsecondary and career opportunities. Self-presentation skills are enhanced through lessons on interviewing, networking, and preparing a résumé. Finally, financial literacy activities include planning a postsecondary budget and learning about credit, insurance, and consumer rights.
Both the middle and high school components of RTS cover test-taking lessons, with a focus on the PSAT and SAT/ACT. Test-taking skills taught in a vacuum may yield little benefit (Allensworth 2008). Therefore, RTS embeds this work into a broader focus on the development of general reasoning skills and career and education planning to help ensure that students are engaged when developing these skills. The lessons cover samples of tests required in non-college contexts, such as tests for employment as a FedEx courier or admission to an electrical apprenticeship program. The lessons are designed to inform students of the existence and purpose of these tests, to familiarize them with the types of questions they will encounter, to connect them with other resources to help them prepare for future tests, to walk them through the

7
registration process for the SAT or ACT, and, more generally, to underscore the need for good mathematics and reading skills for a variety of postsecondary paths.
Engaging Teaching Methods
To ensure that students learn the topics covered in the curriculum, RTS uses methods designed to maximize student engagement, including the use of active teaching methods, technology, annual project-based learning activities, and student accountability.
Active Teaching Methods
Research suggests that students learn and retain more when they are active participants and can relate to the content that is taught (Akey 2006). Career exploration appears to encourage student engagement (Kenny et al. 2006). The evidence also suggests that students benefit when teachers use a wide range of instructional strategies to engage divergent student interest in learning, such as group activities, long-term projects, hands-on activities, lessons that draw from student interests, and cooperative learning (Garcia-Reid et al. 2005; Akey 2006; Heller et al. 2003; Wynne 1995). This means that the RTS instructional methods require a minimum of amount of lecturing.
Technology
RTS uses educational technologies to encourage student engagement (Sivin-Kachala and Bialo 1999) primarily through the use of web-based career exploration and college research programs such as Career Cruising (www.careercruising.com). Some evidence on career planning interventions suggests that combining individual counseling with computer applications is more effective than individual counseling alone (Whiston et al. 1998).
Project-Based Learning
Experiential education has demonstrated the ability to raise student engagement in learning (Akey 2006; Heller et al. 2003). In RTS, students participate in many types of project-based learning as discussed earlier, including a grade 7 career fair project, a grade 8 community-improvement project, and a grade 9 workplace-simulation project. In grade 10, RTS students make a college visit; in grade 11, they participate in a job-shadowing experience; and in grade 12, students apply for colleges and/or jobs.
Student Accountability
Being held accountable for their performance in school activities can also encourage students to be more engaged. RTS students receive pass/fail grades that are reported to parents either by the school or RTS. In some cases, performance in RTS counts toward student grades in non–RTS classes.

8
High Dosage
RTS is a relatively high-dosage and long-term intervention. It includes approximately 30 lessons per year, each 45-minutes-long, beginning in grade 7 and continuing through grade 12. By contrast, most career-related interventions are short-term (Herr et al. 2003), and many college-preparatory interventions are designed for a narrow grade span (for example, College Summit). This creates the risk of getting to students too late to help many of them and not persisting long enough to make a difference (Oliver and Spokane 1988; Whiston et al. 1998).
Feasibility
RTS has been designed to be implemented without undue effort on a school’s part. Time demands on a school’s academic schedule are minimal—about 2 percent of a student’s school time over the course of a year—but the cumulative program dosage is sizable. The format reflects the reality that the demands of state standards and federal law (including No Child Left Behind requirements) prevent a greater allocation of time to classroom-based guidance activities.
Direct program costs—including facilitator compensation, training and support, student materials, classroom supplies, and technology—average about $300 per student per year, or about 3 percent of the average 2006 public school spending rate of more than $9,000 per student (U.S. Census Bureau 2008). As important, RTS meets many of the requirements of existing funding streams such as the federal GEAR UP program and thus may be incorporated into current and new GEAR UP grants as a standardized component of such programs.
There is significant evidence of RTS feasibility in authentic education delivery settings. Since 2005, RTS has been implemented in public secondary schools in three states—New York, Pennsylvania, and West Virginia. For the 2008–2009 school year, it is being implemented in a mix of 30 urban and rural low-income schools (see Appendix E for a complete list) and serves more than 4,000 students (an increase from 3,500 students in 23 schools during the 2007–2008 school year).
In addition to evidence reflecting the commitment of schools and districts to the program, the RTS organization has collected evidence of site-specific implementation. During the 2007–2008 school year, the RTS organization gathered information from its 23 partner schools about the number of RTS sessions implemented over the course of the year within each grade served. Out of a potential of 30 lessons per year, the 23 sites averaged 28.5 lessons implemented (94.9 percent), with only one school reporting fewer than 27 lessons (due to staffing issues, the program did not start in the school until January 2008).
The RTS organization also gathered information about completion of activities within each lesson. Each week, RTS facilitators filled out implementation forms listing the percentages of each lesson delivered to each class (see the Facilitator Implementation Form in Appendix F). Across the 23 school sites, for lessons delivered at least in part, the facilitators reported that an average of 91.5 percent of each lesson was implemented. Combining the average percent of lessons delivered with the average completion rate for each lesson, reports showed an aggregate program implementation of RTS lessons at 86.8 percent. Using these data, the RTS staff

9
reviewed lessons with low implementation rates for comparison with written comments provided in journals by the facilitators and then revised and/or compressed several lessons.
Potential Efficacy
To obtain early evidence on the potential efficacy of the RTS intervention, the RTS organization administered anonymous end-of-year student feedback forms to RTS students with several questions taken from the High School Survey of Student Engagement (HSSSE). The HSSSE was administered in the same year (2006–2007) to a diverse sample of students spread across 26 states (Yazzie-Mintz 2007). The HSSSE students were asked how much their overall school experience had helped them learn work skills, work well with others, solve real-world problems, develop career goals, and understand themselves; the RTS feedback form asked the same questions with respect to how much RTS had helped RTS students in the same areas. For each question, student choices included Very Much, Some, A Little, and Not at All. Table 1 presents the percentages of students responding Very Much to each question. The results suggest that RTS participants felt that the RTS program helped them learn these types of skills more than students in the HSSSE study felt that their school experiences helped them.
TABLE 1
STUDENT REPORTS ON WHETHER RTS/SCHOOL EXPERIENCES HELP LEARNING, BY TOPIC
Skill
Percent Answering Very Much
RTS Students HSSSE Students
Work skills 38% 23%
Working well with others 45% 29%
Solving real-world problems 38% 20%
Developing career goals 53% 23%
Understanding yourself 56% 25% Note: There are 1,100 RTS students from 7 schools and 81,499 HSSSE students from 110 schools covered in
this table. All data are for the 2006–2007 school year. RESEARCH DESIGN
In fall 2006, MPR randomly assigned 25 schools, each with two cohorts of students, to one of two treatment conditions. Cohort 1 students started grade 7 in 2007–2008 and Cohort 2 students started grade 7 in 2008–2009. Random assignment determined which of these two cohorts of students at each school would receive the intervention. Thirteen of the schools were randomly assigned to deliver the RTS intervention to Cohort 1 students, and the other 12 schools were randomly assigned to deliver the RTS intervention to Cohort 2 students. In this design, the treatment and control groups were selected to be balanced by school, cohort, and baseline

10
characteristics within cohort. To increase precision, the schools were selected so that those offering RTS to Cohort 1 students were similar to those offering RTS to Cohort 2 students. Table 2 illustrates the design.
TABLE 2
TREATMENT STATUS AND GRADE LEVELS OF STUDENTS BY SCHOOL GROUP AND YEAR
Grade Levels of Students by School Year
2007–2008
2008–2009
2009-2010
2010–2011
2011-2012
2012–2013
2013–2014
Cohort 1 Schools (N = 13)
Treatment Group (Cohort 1 students) 7 8 9 10 11 12
Control Group (Cohort 2 students) 7 8 9 10 11 12
Cohort 2 Schools (N = 12)
Control Group (Cohort 1 students) 7 8 9 10 11 12
Treatment Group (Cohort 2 students) 7 8 9 10 11 12
Note: Cohort 1 schools have Cohort 1 students in the treatment group. Cohort 2 schools have Cohort 2
students in the treatment group.
To ensure that the sample was balanced within cohorts, MPR grouped the 25 schools into blocks of two or three schools each before random assignment. These blocks were chosen so that schools in each block came from one of three geographic areas—Western New York and two parts of rural West Virginia. Within these areas, MPR matched schools based on the fraction of students eligible for free or reduced-price lunch and school average test scores. This resulted in 12 blocks of schools, 11 blocks with 2 schools each and 1 block with 3 schools. One school was chosen randomly within each block to have its first cohort of grade 7 students start the program during the 2007–2008 school year except in the block with 3 schools, where 2 of the 3 schools were chosen. The remaining schools were allowed to have their second cohort of grade 7 students participate in RTS starting in the 2008–2009 school year.
Impacts of the RTS intervention will be estimated by comparing outcomes for the treatment and control groups. The research design ensures that the estimates are unbiased, but we control for background factors to add precision to the estimates by using appropriate multivariate regression methods. The analysis methods (described below) are designed so that the estimated impacts are based on both the variation between cohorts within each school and the variation between schools within each cohort. Throughout the evaluation, we will adjust standard errors for clustering caused by correlations of outcomes within school/cohort units.

11
COMPARISON OF BASELINE CHARACTERISTICS
RTS recruited the 25 schools in this study based on their regional proximity to each other, their willingness to participate in the study, and the apparent availability of data that would facilitate the proposed analyses. The schools were also selected so that (1) most students in each of the selected middle/junior high schools attend only one corresponding high school and (2) each high school in the study receives students from only one middle/junior high school in the study. This helps ensure that treatment and control group members from the same cohort in junior high/middle school do not end up in a single high school. Within the original sample of 25 schools, only 23 will be used when estimating impacts at the end of grade 8 because one matched pair of schools dropped out of the study. MPR will adjust estimates for non-response by the two schools that dropped out.
The districts participating in the program are low-income rural districts with lower income and education levels than the averages for their state. The 25 schools that were randomly assigned came from three geographic areas—9 schools in New York; 6 in Wayne County, West Virginia (where the program is expected to end after grade 8); and 10 in other counties in West Virginia. All of the schools are in rural counties, are more than 94 percent white, and have attendance rates of at least 89 percent.
To combine the data on free-lunch eligibility and test scores used to match schools, we first calculated an average test score variable equal to the average of the z-scores for each relevant test score variable we had in the data.1 cThe test score variables covered the fractions of students proficient in mathematics, science, and English (separately). We then took an average of a z-score transformation of the average test score variable and a negative z-score transformation of the free-lunch variable.
Table 5 presents means of these variables for the two groups of matched schools—those where Cohort 1 students participate in RTS and those where Cohort 2 students participate. None of these differences is statistically significant, and neither is a joint significance test of the differences for the free lunch and test score variables combined. The differences between the two group means are also generally small in a substantive sense. For example, there is only a 5 percentage point difference in the free and reduced-price eligibility rate, around 0.1 of a standard deviation. That is similar to the year-to-year changes observed in many of these schools. The differences in the remaining variables are even smaller in terms of standard deviation units, as shown in the last column of Table 3.
1 The z-scores were created by subtracting the mean within the geographic area and then dividing by the
standard deviation at the school level for that area; the test scores were analyzed separately for each grade and subject.

12
TABLE 3
COMPARING MATCHED SCHOOL GROUP MEANS
Variable Cohort 1 School
Cohort 2 School Difference
Standard Deviation
Difference/Standard Deviation
Free and Reduced Price Lunch 0.51 0.56 0.05 0.50 0.10
Mathematics 0.66 0.67 0.01 0.47 0.02
English 0.67 0.70 0.03 0.46 0.06
Science 0.83 0.82 -0.01 0.38 -0.03
Attendance 0.95 0.96 0.01 0.21 0.05
Notes: Cohort 1 schools provided RTS to students in grade 7 in 2007–2008. Cohort 2 schools provided RTS to students in grade 7 in 2008–2009. Standard deviation is at student level.
No differences are statistically significant at the 10 percent level. FRPL = Fraction with free and reduced-price–lunch eligibility for 2006–2007 school year. Mathematics/English/Science = Fraction of students tested proficient in subject.
West Virginia tests combined grade 7 results from the 2004–2005 school year with grade 6 results from the 2003–2004 school year’s West Virginia Educational Standards Test (Westest). New York tests based on grade 8 results from the 2004–2005 school year intermediate-level tests.
Attendance = Attendance rate at school in 2005–2006.
THE EVALUATION DATA
To estimate program impacts, MPR will use student survey data and school administrative data. The survey data will enable MPR to estimate impacts on a number of outcomes not available in administrative data, such as students’ opinions, habits, attitudes, and plans and any early activities students take part in as they prepare for postsecondary education (for example, applying to colleges and/or for financial aid) and careers. Data on demographic characteristics (age, gender, race, and language spoken at home) will also be collected in the survey and will enable us to analyze how estimated impacts of RTS vary with these characteristics. The administrative data collected from schools (or school districts when possible) will enable MPR to ascertain how impacts vary with characteristics such as pre–RTS grade 6 test scores and school characteristics.
Measures
We are choosing two types of outcomes for our analyses—a confirmatory set and an exploratory set. The confirmatory outcomes will be used to test how well our pre-specified hypotheses are supported by the data. Our main findings will be based on these results. The exploratory outcomes will be used to test additional hypotheses that might be the basis for more rigorous testing in later studies. We are making this distinction in order to reduce the likelihood

13
of reporting both false positives and false negatives in our results. This distinction is recommended by Schochet (2008).
With this distinction in mind, MPR, Professor Rosenbaum, and the RTS organization have worked together to select a set of intermediate indicators of success for the RTS intervention, choosing confirmatory and exploratory sets of outcomes for grades 8, 9, 10, and 12. When making these choices, we considered the design of the RTS intervention and the degree to which similar variables have been shown to be associated with later measures of success, such as postsecondary educational and career outcomes. Given current funding, our analyses will focus on estimating impacts of RTS on the grade 8 outcomes for the first cohort of students. With additional funding, we would expand our analyses to look at variables in later grades and at the full sample of students.
In this section, we describe the confirmatory and exploratory outcomes for the grade 8 analyses. Outcomes for later grades are described in Appendix H.
Grade 8 Confirmatory Outcomes. The three confirmatory outcomes of interest for grade 8 will be (1) motivation to go to school to learn job skills (Question A.1b in the follow-up survey in Appendix G), (2) learning and study habits/preparation (Question B.1 in the follow-up survey), and (3) school attendance and negative behaviors (Question B.3 in the follow-up survey).2 Research by Rosenbaum (2001) suggests that students’ motivation to go to school (i.e., future relevance) strongly predicts their efforts in school, and that poor attendance and discipline problems have significant negative effects on future earnings 10 years after high school.
We will estimate the impacts of assignment to RTS on these three main outcomes separately, as they are viewed as being in different domains. In addition, we will test for the joint significance of these coefficient estimates, one of the options recommended by Schochet (2008) when doing confirmatory analyses for outcomes from more than one domain. This reduces the likelihood of having a false positive finding and avoids complications associated with choosing how to combine outcomes across domains.
Grade 8 Exploratory Outcomes. For our exploratory analyses, we will estimate impacts of RTS on a number of other outcomes at the end of grade 8, including (1) career exploration behavior (Questions A.6 and A.7 in the follow-up student survey)3, (2) school engagement (Questions A.1a and A2 in the follow-up survey), and (2) career exploration efficacy (Question C.11 in the follow-up survey). Such measures have been validated by previous research (Kirschner 1989; Glanville and Wildhagen 2007; Ogbu 2003; Nichols 2003; Ehrenberg et al. 1991; Balfanz and Herzog 2006; Smerdon 1999; and Coleman and Delaire 2003), and have been shown to be correlated with later measures of success (Buchanan 1998). We will also test to see
2 Questions B.1 and B.3 contain multiple sub-questions. We would take the average response across the sub-
questions.
3 This could be viewed as a confirmatory outcome but some might argue that it is too close to being a measure of program fidelity.

14
if the estimated impacts of RTS on these outcomes vary with baseline student characteristics such as career exploration behavior, student test scores, and parent socioeconomic status.
Outcomes in Later Grades. If additional funding allows for continuation of both the intervention and the evaluation, future analyses would investigate impacts of RTS in grades 9, 10, and 12. These possible future outcomes are described in Appendix H.
Data Collection Methods
MPR has collected baseline grade 6 test scores for students in Cohort 1 (those in grade 7 during the 2007–2008 school year), conducted baseline surveys for all students in the study at the beginning of grade 7, and conducted a follow-up survey at the end grade 8 with Cohort 1 students. With additional funding, MPR could collect further administrative data for Cohort 1 students (covering grades 7 through 10) as well as survey data at the end of grades 10 and 12. For Cohort 2, MPR could collect administrative data (covering grades 6 through 9, which would include the grade 6 “baseline” scores) as well as survey data covering grades 8 and 10. Table 4 presents a schedule of currently funded data collection and reporting activities and includes future data collection activities and reports that would be possible with additional funding.
Consent and Assent. We are using an informed consent procedure based on a process approved by the Public/Private Ventures Internal Review Board. Parents and students are sent letters describing the study and the types of data to be collected. Parents are given the option to contact MPR to request that their child not participate in the study, and students may decline at the time they are offered the survey. During both the 2007–2008 and 2008–2009 school years, three schools in the study required active consent such that parents had to sign and return a consent form to their child’s school in order for their children to participate during that year of the study. MPR obtained a 79 percent response rate for the baseline survey of students in Cohort 1 and more than 80 percent for the grade 6 test scores (including the two schools that dropped out of the study and the three schools that required active consent).4 MPR obtained a 74 percent response rate for the baseline survey of students in Cohort 2 (including the two schools that dropped out of the study and the three schools that required active consent) and has not yet collected grade 6 test scores for Cohort 2.
4 MPR might collect baseline administrative data for the two schools that dropped out of the study, which
would increase the administrative data response rates.

15
TABLE 4
PROJECT DATA COLLECTION AND REPORTING SCHEDULE
Calendar Year
Current Study Possible Data Collection Activities for the Future
2007–2008
2008–2009
2009–2010
2010–2011
2011–2012
2012–2013
2013–2014
2014–2015
RTS Implementation Year 1 2 3 4 5 6 7 8
Grade Levels of Cohorts Cohort 1 7 8 9 10 11 12 Cohort 2 7 8 9 10 11 12
MPR Data Collection Administrative x x x x x Baseline student surveys x x Follow-up student surveys x x x x x x Site visits x x x School counselor surveys x x x
MPR Reports x x x x x x Administrative Data. MPR has already collected grade 6 baseline test score data for Cohort
1. Administrative data on course taking, grade point average (GPA), grade in school, and test scores could be collected for both cohorts in future years, contingent on additional funding. MPR worked with study schools and districts during the 2007–2008 school year to determine the most appropriate method for collecting administrative data. Some schools/districts are able to export electronic files containing administrative data; others may send hard-copy transcripts and test score reports to MPR or manually complete brief student records forms developed by MPR in conjunction with the schools and districts.
Student Surveys. MPR has already developed and administered a baseline survey to students in Cohort 1 and Cohort 2 at the beginning of grade 7. MPR has also developed a follow-up survey for Cohort 1 students at the end of grade 8 (see follow-up survey in Appendix G). With additional funding, MPR could carry out other follow-up surveys with both cohorts in later years.
To administer student surveys, MPR disseminates survey packets to the relevant teachers by relying on class rosters provided by the schools. Packets contain a survey and an envelope for each eligible student, an instruction sheet for the teacher, and postage-paid return materials. Teachers ask students to complete the 30-minute paper-pencil survey during class, seal it in the envelope provided, and hand it in. Teachers then express mail the surveys to MPR. When needed, MPR makes reminder calls to RTS facilitators or other school liaisons to prompt teachers to return the surveys.

16
ANALYSIS METHODS
To estimate impacts, we will regress outcomes at the student level measured at the end of grade 8 or later on treatment status; a dummy variable indicating the cohort (when appropriate); a measure of the outcome variable from the beginning of grade 7, if available; and controls for student and school characteristics. In all analyses, weights adjust for nonresponse. In addition, standard errors are adjusted for clustering of students within cohorts within schools and for heteroskedasticity. The following equation illustrates the model.
Yi = α + Ti’β1 + Ci’β2 + YLi’β3 + Ss’β4 +Xi’β5 + εcs + ei where Yi = the outcome variable for individual i Ti = treatment status (1 if treatment, 0 if control) Ci = cohort indicator (1 if student entered grade 7 in 2007, 0 otherwise) Yli = a pre-random assignment value of the outcome variable (if available) Ss = controls for baseline school-level characteristics
Xi = student baseline characteristics (grade 6 test scores, race, gender, age, parent education, main language spoken at home, and Internet access at home)
εcs = unobserved school-/cohort-level factors ei = unobserved student-level factors α, β1-β5 = parameters to be estimated
If we are able to obtain additional funding, we will estimate two sets of models—one set based on both cohorts of students combined and the other based on one cohort at a time. However, if we are limited to current funding, we will be able to estimate impacts associated only with the first cohort. In the models with two cohorts of students per school, we will use dummy variables indicating the school attended in grade 7 in order to control for school characteristics (Ss). In the models using only one cohort of students, we will replace the school dummy variables with school-level controls for school average test scores and the fractions of students eligible for free and reduced-price lunch.
Using school dummy variables in the models with two cohorts of students will enable us to control for differences in unobserved school-level factors that might occur by chance. The use of school-level covariates (fraction with free-lunch eligibility and average test scores) as controls in the models with only one cohort will help reduce unexplained variance between schools.
This work will be complicated by three important factors—students changing grades, student mobility, and the possibility of contamination of the control group by the treatment group through the sharing of information across grade levels within schools. All of these factors are likely to reduce estimated impacts. MPR will deal with these problems in the analyses, as explained below.
Changing Grades. Students who start grade 7 in an RTS group may be held back or skip a grade during the course of the study, meaning that they may enter or exit the grade receiving the RTS intervention. When students change grades in this way, MPR will still include them in the

17
analyses based on the treatment status of their original cohort/school group. MPR will also document the degree to which this type of movement occurs and test to see if the intervention appears to have any impact on movement. In addition, MPR will document the degree to which students in the control group switch into the treatment grades because this could also dilute estimated program impacts.
Student Mobility. Students often change schools within districts and sometimes move between districts. Although it is somewhat less common in the small rural districts in this study, mobility could still be an issue over the course of the six years of the RTS intervention. MPR will address this issue in a number of ways. First, students will be analyzed based on their treatment/control group status at the beginning of the study, not on the school/cohort group they end up in if they change schools. Thus, we will be doing an “Intent to Treat” analysis.5 Second, the RTS organization selected middle schools where a high fraction of students attend a single high school, enabling the RTS facilitators to continue serving students as they switch from middle schools to the corresponding high schools. This, in turn, will enable MPR to obtain data from the majority of students more easily because the RTS facilitators will help distribute the student surveys. Third, MPR is working to obtain administrative data directly from districts so that it can follow students who move between schools within districts. Fourth, MPR will use the baseline administrative data to test for whether the RTS intervention appears to have any impact on student mobility either within or between districts and for whether the impact differs with baseline student characteristics. RTS could affect student mobility if, for example, the presence of the RTS intervention encourages some students to remain in their current school and perhaps even attracts others to that school.
Contamination Bias. This estimation method relies heavily on the assumption that the control group is not affected by the presence of the RTS program in its school. This assumption could be violated in at least three ways.
1. Schoolwide Elements. Within each school, the control group students will either start grade 7 a year before or after the treatment group and may change from a middle school to a high school during the course of the study. In the end, most control group students will be in the same schools as treatment group students for at least three years and will be exposed to any schoolwide elements of the RTS intervention during this period. Counselors (and other staff) at these schools are likely to learn at least some information from the RTS facilitator and may use it to improve outcomes for control group students. In addition, the RTS organization has purchased a license for the Career Cruising web site that will provide students with career planning information. Members of the control group as well as the treatment group may access the web site.
2. Teachers with RTS Experience. Teachers who previously taught students participating in the RTS intervention may use information obtained during that time
5 On a related note, students not in the study who move into these schools will be omitted from all analyses
since their movement into these schools could have been influenced by the presence of RTS.

18
when teaching control group students or designing activities related to career planning for this group. This could cause bias in the schools where the control group is in the second cohort and the treatment group is in the first.
3. Siblings with RTS Exposure. Students in the control group may have siblings in the RTS treatment group. These siblings could share information obtained from RTS, either directly or through their parents, who will receive an RTS newsletter.
RTS staff believe that these spillover effects will be negligible because the program is implemented in only one grade at a time so that the sharing of information would have to occur across grade levels. Because some sharing of information is likely for the reasons given above, MPR will, in effect, be estimating the impacts of that type of sharing for the control group compared to a far more intensive intervention for the treatment group that includes 45 minutes per week of instruction. If the information shared across grades creates impacts comparable to the intensive RTS intervention, this would suggest that a less time-intensive intervention might be sufficient to obtain similar impacts. Thus, bias caused by these types of spillovers will not invalidate the usefulness of the results of this study.
Contingent on future funding, MPR could collect additional data to test for possible contamination bias in a number of ways. For instance, to test for the possibility of schoolwide bias, MPR could collect aggregate administrative data for earlier cohorts of students, including students from treatment schools who will likely have finished high school before RTS has been implemented and students from comparison schools not slated to receive the RTS intervention. MPR could then compare time trends for outcomes for the non–RTS cohorts in the treatment schools with outcomes for students from the same cohorts in the comparison schools to see if there is any evidence of a spillover impact of the RTS intervention.
To test for bias caused by a teacher with RTS experience, MPR will determine if the impacts of the intervention for Cohort 1 differ from the impacts for Cohort 2. To estimate these models, MPR will add an interaction between cohort and treatment status and drop the school dummy variables and replace them with the continuous school characteristics.6 To test for the possibility of contamination bias caused by a sibling who received RTS in the past, MPR will estimate interactions between being in the treatment group and having a sibling in the control/treatment group. Finally, MPR will include questions in the student surveys to help identify any possible exposure of the control group to the RTS program elements. Table 5 summarizes how MPR will deal with each of the three possible sources of bias.
6Otherwise, the models are not identified because the treatment/cohort interaction does not vary across cohorts
within schools.

19
TABLE 5
METHODS FOR DEALING WITH CONTAMINATION BIAS
Problem Solution
Schoolwide dissemination Compare time trends of treatment schools with those of comparison schools receiving no RTS intervention
Teachers with RTS experience Compare impacts for Cohorts 1 and 2
Siblings with ongoing RTS experience Estimate interactions with having a sibling in the study
All Ask students about RTS exposure
Statistical Power
To describe how well we can estimate impacts, we present minimum detectable effects (MDEs). These are estimates of how large the true effects would have to be in standard deviation units in order to detect them with some certainty. Table 6 shows the MDEs (and their percentage point equivalents for binary variables given a mean of 50 percent) for two samples—one cohort and both cohorts combined. The power calculations are based on the sample sizes available at the time we were preparing to collect the follow-up data for Cohort 1. The calculations for both cohorts combined are relevant only if additional funding is secured. The power for outcomes measured in later grades may be reduced if additional schools drop out and/or if there is substantial student attrition. Non-random attrition may also cause bias.
The calculations are based on two-tailed tests with 80 percent power and a 5 percent significance level. All comparisons are made with controls for clustering of the data, which means that we can distinguish between the impacts of the RTS program and unobserved factors that vary by school/cohort unit. The calculations assume that the extent to which outcomes for students in the same school/cohort unit are correlated (the “cluster correlation coefficient”) equals 10 percent. We assume that adding the school dummies (when both cohorts are used) increases the R-squared statistics from 10 to 20 percent at the school/cohort level. The sample sizes of students and schools have been adjusted for non-response. These calculations suggest that we would need to see impacts around 0.26 standard deviations when both cohorts are combined in order for the result to be statistically significant. Estimates of this size are moderate in size compared to other estimates found in the literature based on the work of Cohen (1988). It seems reasonable to expect impacts this large on the confirmatory outcomes since the RTS program focuses directly on those outcomes. Estimated effects will have to be somewhat larger (around 0.39 standard deviations) in order for us to be able to detect them using only one cohort of students. This may mean limiting our analysis to outcomes where such large impacts seem plausible. For example, we might expect to see impacts this large in grade 8 outcomes such as career planning, which the program directly targets.

20
TABLE 6
MINIMUM DETECTABLE EFFECTS OF RTS
Model Students Schools/ Cohorts MDE
Percentage Points
One cohort 1,653 23 0.39 20
Both cohorts 3,400 46 0.26 13
CONCLUSION
This evaluation presents an important opportunity to gain a deeper understanding of the impacts of a program designed to improve career planning of students in grades 7 through 12. The evaluation is unique in that it uses random assignment to evaluate a career planning program that starts in an early grade. Unfortunately, due to an unexpected loss in funding, the study had to be cut short and may not achieve its full potential. Nevertheless, the results should be informative to stakeholders interested in designing or implementing similar interventions.

21
REFERENCES
Akey, T. M. “School Context, Student Attitudes and Behavior, and Academic Achievement: An Exploratory Analysis.” New York: MDRC, January 2006. Available at [www.mdrc.org/publications/419.full.pdf].
Allensworth, Elaine, Macarena Correa, and Steve Ponisciak. “From High School to the Future: ACT Preparation—Too Much, Too Late: Why ACT Scores Are Low in Chicago and What It Means for Schools.” Chicago: Consortium on Chicago School Research, May 2008.
Allensworth, Elaine, and John Q. Easton. “The On-Track Indicator as a Predictor of High School Graduation.” Chicago: Consortium on Chicago School Research, June 2005.
Balfanz, Robert, and Liza Herzog. “Keeping Middle Grades Students on Track to Graduation: Initial Analysis and Implications.” Paper presented at Johns Hopkins University, Baltimore, May 2006.
Bauer, R., and R. Michael. “They’re Still in School? Results of an Intervention Program for At-Risk High School Students.” Paper presented at the annual meeting of the American Educational Research Association, Atlanta, 1993.
Bowers, Judy, and Trish Hatch. “The ASCA National Model: A Framework for School Counseling Programs.” Alexandria, VA: American School Counselor Association, 2005.
Bragg, D.D. “Educator, Student, and Employer Priorities for Tech Prep Outcomes.” Berkeley, CA: National Center for Research in Vocational Education, 1997.
Bridgeland, J., J. DiIulio, and K. Morison. “The Silent Epidemic: Perspectives of High School Dropouts.” Washington, DC: Civic Enterprises in association with Peter D. Hart Research Associates for the Bill & Melinda Gates Foundation, 2006.
Buchanan, Nancy. “The Effects of Parental Involvement on 12th Grade Achievement.” Georgetown Public Policy Review, vol. 4, no. 1, fall/winter 1998, pp. 75-98.
Cabrera, A.F., and S.M. La Nasa. “Overcoming the Tasks on the Path to College for America’s Disadvantaged.” New Directions for Institutional Research, vol. 27, no. 3, fall 2000, pp. 31-44.
Card, D. “The Causal Effect of Education on Earnings.” In Handbook of Labor Economics, edited by O. Ashenfelter and D. Card. Amsterdam, The Netherlands: North-Holland, 1999.
Chaplin, Duncan. “Raising Standards: The Effects of High School Math and Science Courses on Future Earnings.” Virginia Journal of Social Policy and the Law, vol. 6, no. 1, 1998, pp. 115-126.
Cohen, J. Statistical Power Analysis for the Behavioral Sciences (2nd ed.). Hillsdale, NJ: Lawrence Earlbaum Associates, 1988.
Coleman, Margo, and Thomas Delaire. “An Economic Model of Locus of Control and the Human Capital Investment Decision.” Journal of Human Resources, vol. 38, no. 3, 2003, pp. 701-721.

22
Conley, D.T. Towards a More Comprehensive Conception of College Readiness. Eugene, OR: Education Policy Improvement Center, 2007.
Deluca, Stefanie, and James E. Rosenbaum. “Individual Agency and the Life Course: Do Low-SES Students Get Less Long-Term Payoff for their School Efforts?” Sociological Focus, vol. 34, no. 4, October/November 2001, pp. 357-376.
Dohm, Alrene, and Lynn Shniper. “Employment Outlook: 2006–16: Occupational Employment Projections to 2016.” Monthly Labor Review, vol. 130, no. 11, November 2007, pp. 86-125.
Dykeman, Cass, Chris Wood, Michael Ingram, Alix Gitelman, Naomi Mandsager, Meng-Yin Chen, and Edwin Herr. Career Development Interventions and Academic Self-Efficacy and Motivation: A Pilot Study. Columbus, OH: National Dissemination Center for Career and Technical Education, 2003.
Dynarski, M., Clarke, L., Cobb, B., Finn, J., Rumberger, R., and Smink, J. (2008). Dropout Prevention: A Practice Guide (NCEE 2008–4025). Washington, DC: National Center for Education Evaluation and Regional Assistance, Institute of Education Sciences, U.S. Department of Education, September 2008. Available at [http://ies.ed.gov/ncee/wwc].
Ehrenberg, Ronald G., Randy A. Ehrenberg, Daniel I. Rees, and Eric L. Ehrenberg. “School District Leave Policies, Teacher Absenteeism, and Student Achievement.” Journal of Human Resources, vol. 26, no. 1, 1991, pp. 72-105.
Gamoran, Adam, and Eileen C. Hannigan. “Algebra for Everyone? Benefits of College-Preparatory Mathematics for Students with Diverse Abilities in Early Secondary School.” Educational Evaluation and Policy Analysis, vol. 22, no. 3, 2000, pp. 241-254.
Garcia-Reid, P., R. Reid, and N.A. Peterson. “School Engagement Among Latino Youth in an Urban Middle School Context: Valuing the Role of Social Support.” Education and Urban Society, vol. 37, no. 3, May 2005, pp. 257-275.
Glanville, J., and T. Wildhagen. “The Measure of School Engagement: Assessing Dimensionality and Measurement Invariance Across Race and Ethnicity.” Educational and Psychological Measurement, vol. 67, no. 6, 2007, pp. 1019-1041.
Goble, L., A. Person, and J. Rosenbaum. “Institutional Characteristics and Degree Completion Across Student and College Types.” Paper presented at the Annual Meeting of AERA, Chicago, April 2006.
Hamilton, S., and M. Hamilton. “Creating New Pathways to Adulthood by Adapting German Apprenticeship in the United States.” In From Education to Work: Cross-National Perspectives, edited by W. Heinz. New York: Cambridge University Press, 1999.
Hayward, B.J., and G.K. Tallmadge. “Strategies for Keeping Kids in School: Evaluation of Dropout Prevention and Reentry Projects in Vocational Education.” Washington, DC: American Institutes for Research in the Behavioral Sciences, Research Triangle Institute, and RMC Corporation, 1995.
Heckman, J., and P. Lafontaine. “The American High School Graduation Rate: Trends and Levels.” Working paper. Bonn, Germany: Institute for the Study of Labor, 2007.

23
Heller, R., S. Calderon, and E. Medrich. “Academic Achievement in the Middle Grades: What Does Research Tell Us? A Review of the Literature.” Atlanta: Southern Regional Education Board, 2003. Available at [http://www.sreb.org/programs/hstw/publications/pubs/02V47_AchievementReview.pdf].
Hong, Guanglei, and Stephen W. Raudenbush. “Effects of Kindergarten Retention Policy on Children’s Cognitive Growth in Reading and Mathematics.” Educational Evaluation and Policy Analysis, vol. 27, no. 3, 2005, pp. 205-224.
Hossler, D., and K.S. Gallagher. “Studying Student College Choice: A Three-Phase Model and the Implications for Policymakers.” College and University, vol. 2, no. 3, 1987, pp. 207-221.
Hossler, D., J. Schmidt and N. Vesper. Going to College: How Social, Economic, and Educational Factors Influence the Decisions Students Make. Baltimore: Johns Hopkins University Press, 1999.
Humphrey, Justin G., Nancy L. Carey, and Wendy Mansfield. “A Profile of the Talent Search Program: 1999–2000.” Washington, DC: Mathematica Policy Research, Inc., September 2002.
Ikenberry, S., and T. Hartle. “Too Little Knowledge Is a Dangerous Thing: What the Public Knows and Thinks It Knows about Paying for College.” Washington DC: American Council on Education, 1998.
Kagan, Spencer. Cooperative Learning. San Clemente, CA: Resources for Teachers, 1994.
Kenny, M., D. Blustein, R. Haase, J. Jackson, and J. Perry. “Setting the Stage: Career Development and the Student Engagement Process.” Journal of Counseling Psychology, vol. 53, no. 2, April 2006, pp. 272-279.
Kirschner, J.E. “Congruent versus Incongruent Vocational Treatments for Career Indecision in College Students: A Comparison of DISCOVER and a Career Workshop.” (Doctoral dissertation, University of Maryland College Park, 1989). Dissertation Abstracts International, 50, 3163A.
Kirst, Michael, and Andrea Venezia. From High School to College: Improving Opportunities for Success in Postsecondary Education. San Francisco: Jossey-Bass, 2004.
Lapan, P., N. Gysbers, and G. Petroski. “Helping 7th Graders to be Safe and Successful: A Statewide Study of the Impact of Comprehensive Guidance Counseling Programs.” Journal of Counseling and Development, vol. 79, no. 3, summer 2001, pp. 320-330.
Lapan, R.T. “Career Development Across the K–16 Years: Bridging the Present to Satisfying and Successful Futures.” Alexandria, VA: American Counseling Association, 2004.
Lapan, R.T., N.C. Gysbers, and Y. Sun. “The Impact of More Fully Implemented Guidance Programs on the School Experiences of High School Students: A Statewide Evaluation Study.” Journal of Counseling and Development, vol. 75, March/April 1997, pp. 292-302.
Lee, V., and R. Ekstrom. “Student Access to Guidance Counseling in High School.” American Educational Research Journal, vol. 24, no. 2, 1987, pp. 287-310.

24
McDonough, P. “Counseling Matters: Knowledge, Assistance, and Organizational Commitment in College Preparation.” In Preparing for College, edited by William Tierney, Zoe Corwin, and Juliet Colyar. Albany, NY: SUNY Press, 2005.
Nichols, Joe D. “Prediction Indicators for Students Failing the State of Indiana High School Graduation Exam.” Preventing School Failure, vol. 47, no. 3, 2003, pp. 112-123.
Ogbu, J.U. Black American Students in an Affluent Suburb: A Study of Academic Disengagement. Mahwah, NJ: Lawrence Erlbaum, 2003.
Oliver, L.W., and A.R. Spokane. “Career Intervention Outcomes: What Contributes to Client Gain?” Journal of Counseling Psychology, vol. 35, no. 4, October 1988, pp. 447-462.
Olson, Lynn. “What Does ‘Ready’ Mean?” Education Week, vol. 26, no.40, June 12, 2007, pp. 7-12.
Orfield, Myron. Metropolitics: A Regional Agenda for Community and Stability. Washington, DC: Brookings Institution Press, 1997.
Roderick, Melissa, and Jenny Nagaoka. “Retention Under Chicago’s High-Stakes Testing Program: Helpful, Harmful, or Harmless?” Educational Evaluation and Policy Analysis, vol. 27, no. 4, 2005, pp. 309-340.
Roderick, Melissa, Jenny Nagaoka, Elaine Allensworth, Vanessa Coca, Macarena Correa, and Ginger Stoker. “From High School to the Future: A First Look at Chicago Public School Graduates’ College Enrollment, College Preparation, and Graduation from Four-Year Colleges.” Chicago: Consortium on Chicago School Research, 2006.
Rosenbaum, James, Regina Deil-Amen, and Ann Person. After Admission: From College Access to College Success. New York: Russell Sage Foundation Press, 2006.
Rosenbaum, James E. Beyond College for All: Career Paths for the Forgotten Half. American Sociological Association’s Rose Series in Sociology. New York: Russell Sage Foundation, 2001.
Rossi, Peter H., and Howard E. Freeman. Evaluation: A Systematic Approach, Fourth Edition. Newbury Park, CA: Sage Publications, 1989.
Schneider, B., and D. Stevenson. The Ambitious Generation: America’s Teenagers, Motivated but Directionless. New Haven, CT: Yale University Press, 1999.
Schochet, Peter. “Guidelines for Multiple Testing in Impact Evaluations of Educational Interventions.” Princeton, NJ: Mathematica Policy Research, Inc., 2008.
Sivin-Kachala, J., and E.R. Bialo. “Research Report on the Effectiveness of Technology in Schools.” 6th Edition. Washington, DC: Software and Information Industry Association, 1999.
Smerdon, Becky A. “Engagement and Achievement: Differences between African-American and White High School Students.” Research in Sociology of Education and Socialization, vol. 12, 1999, pp. 103-134.
Steinberg, Laurence. Beyond the Classroom: Why School Reform Has Failed and What Parents Need to Do. New York: Simon and Schuster, 1996.

25
Stevenson, H.W., and J.W. Stigler. The Learning Gap: Why Our Schools Are Failing and What We Can Learn from Japanese and Chinese Education. New York: Summit Books, 1992.
Teitelbaum, Peter. “The Influence of High School Graduation Requirement Policy in Mathematics and Science on Student Course-Taking Patterns and Achievement.” Educational Evaluation and Policy Analysis, vol. 25, no. 1, 2003, pp. 31-57.
U.S. Census Bureau, Governments Division. “Public Education Finances: 2006.” Available at [http://ftp2.census.gov/govs/school/06f33pub.pdf], 2008.
U.S. Department of Education. “Getting Ready to Pay for College: What Students and Their Parents Know About the Cost of College Tuition and What They Are Doing to Find Out.” Washington, DC: U.S. Government Printing Office, 2003.
U.S. Department of Education. “National Evaluation of GEAR UP: A Summary of the First Two Years.” Washington, DC: Office of the Under Secretary, Policy and Program Studies Service, 2002a.
U.S. Department of Education. “A Profile of the Talent Search Program: 1999–2000.” Washington, DC: Office of Postsecondary Education, 2002b.
Whiston, S.C., T.L. Secton, and D.L. Lasoff. “Career-intervention Outcome: A Replication and Extension of Oliver and Spokane.” Journal of Counseling Psychology, vol. 45, 1988, pp. 150-165.
Woloszyk, C.A. “Models for At-Risk Youth: Final Report.” Kalamazoo, MI: Upjohn Institute for Employment Research, 1996.
Wynne, Edward A. “Cooperation-Competition: An Instructional Strategy.” Bloomington, IN: Phi Delta Kappa Educational Foundation, 1995.
Yazzie-Mintz, Ethan. “Voices of Students on Engagement: A Report on the 2006 High School Survey of Student Engagement.” Bloomington, IN: Indiana University, Center for Evaluation and Education Policy, 2007.

APPENDIX A
RTS GRADE OVERVIEWS

APPENDIX A: RTS GRADE OVERVIEWS GRADE 7 Study Skills (6 lessons) Students learn the basics of how to study effectively including finding a time and place to study, note-taking, studying for tests, short-term planning, and stress management. Grow Your Intelligence (4 lessons) Students learn about the structure of the brain and study recent research that supports the “growth” mindset: that intelligence can be improved through effort and practice. (Based on the malleability of intelligence research of Dr. Carol Dweck and Dr. Lisa Blackwell and the stereotype threat research of Dr. Joshua Aronson and Dr. Claude Steele.) Careers (10 lessons) Through a Roads to Success site license with Career Cruising, students take an interest inventory on the web, then research the career of their choice and present it at a 7th-grade Career Fair. Students also consider Bureau of Labor statistics that show the relationship between education and earnings. Financial Education (3 lessons) Lessons on budgeting and “being a smart consumer” show students how planning can help them reach goals. Values and Success (2 lessons) Students consider what’s important to them and how their values might impact their career and education plans. GRADE 8 Careers (5 lessons) 8th-graders continue to explore careers using the interest inventory and profiles found on Career Cruising, focusing on job description, working conditions, education needed, and the likes and dislikes of people working in the field. Setting Goals (4 lessons) Goal-setting and decision-making strategies taught in the context of selecting high school courses. Education After High School (5 lessons) Students are introduced to the range of post-secondary options, from apprenticeships to 4-year colleges, and beyond. They learn how to evaluate 1- and 2-year programs, and develop a list of colleges of interest, choosing one to research in more detail. Communication and Networking (4 lessons) 8th-graders make their first foray into workplace communication. How is business phone and e-mail communication different from conversation with friends? Who’s in their personal network and how
A.1

can friends and acquaintances connect them with jobs? What kinds of questions yield information about business opportunities? Experiential Learning: Makeover Challenge (6 lessons) In a multi-week unit, students identify a community problem and create a proposal for its solution. At each school, a panel of judges reviews proposals, with the winning class receiving up to $500 to make their plan a reality. Financial Ed (2 lessons) How far could a $60 weekly paycheck stretch if you had a part-time job? Students allocate their hypothetical resources and are faced with unplanned-for dilemmas like buying an expensive pair of sneakers and replacing a lost CD. In a separate lesson, they figure out how long it would take to save for an I-pod, a year of community college, or another big-ticket item. GRADE 9 Careers (6 lessons) 9th-graders are introduced to the idea of matching their skills and interests to career types. They use Career Cruising to explore job descriptions, earnings, and education needed for several careers, examine their personal values as they relate to the world of work, and review the daily activities of people who hold their favorite jobs. Getting a Job (4 lessons) Students learn about jobs appropriate for 15- and 16-year-olds and the pros and cons of working while still in high school. They create an information card to assist in completing a job application, and practice interviewing skills. They discuss the expectations bosses have for employees and the things workers have a right to expect in return. Education After High School (5 lessons) Students explore college entrance requirements and various forms of financial aid. They learn how employers and colleges use work experience and extracurricular activities to compare candidates. They discuss the pros and cons of going to college. Financial Education (2 lessons) In this two-lesson unit, students take on the salaries and financial responsibilities of adult life. In week 1, students select careers obtainable with a high school education, then choose housing, transportation, and leisure options, attempting to create a balanced budget. In week 2, they try again, selecting careers from those requiring 2-year, 4-year, and graduate degrees. Experiential Learning: Ad Apprentices (5 lessons) In this unit, students are charged with planning a 30-second videotaped public service announcement that conveys a key concept from Roads to Success. They work together in teams – analyzing existing public service announcements, selecting a topic, and figuring out what story they want to tell and how to tell it. The winning proposal is videotaped, edited, and made available for viewing on the Roads to Success website.
A.2

GRADE 10 Careers (6 lessons) Career research continues to be a main theme. Students examine career outlooks for various fields and compare their own values, interests, and abilities with job requirements. They identify the characteristics of their ideal jobs, and make tentative career choices. Finding a Job (6 lessons) Students explore the benefits of entry-level jobs, then survey local employers regarding qualities most desired in job candidates. Students identify their own workplace skills and give examples that demonstrate their acquisition of these skills. This unit concludes with mock interview participation and feedback. Test Prep (3 lessons) Students discuss reasons to take the PSAT (or, where applicable, the ACT Plan) and review the types of questions included on the test. This unit also includes a review of sample post-secondary tests required for job placement and advancement, an illustration that reading and math skills are needed by both college- and workforce-bound students. Education After High School (7 lessons) Students compare tech/trade school, community college, and 4-year college options, and get an overview of the path to college application and acceptance. Students compare their academic achievement with the proficiency required in their chosen fields, and set short-term goals for improvement as needed. Students list questions about college, and go on a campus visit to get them answered. The financial aid process is explored. Money Matters (5 lessons) A senior-year scenario gives students a chance to consider some of the financial decisions they’ll soon face: saving for school expenses, ATM/debit card use, credit card considerations, and reading the fine print in a contract. GRADE 11 In Grades 11 and 12, the focus shifts from exploration and self-discovery to identifying post-secondary training opportunities and completing the steps needed to access them. Test Prep (4 lessons) Students receive information about the ACT and SAT, and become familiar with the format of the test most commonly taken in their region. One class period is spent working through sample problems together; another is devoted to online registration. A final lesson explores standardized tests commonly used in workforce development and employee screening: the Test of Adult Basic Education (TABE), the Armed Services Vocational Aptitude Battery (ASVAB), and the ACT WorkKeys Foundational and Personal Assessments. Job Shadow (11 lessons) In this project-based learning unit, students create resumes and cover letters, research companies, and practice informational interviewing skills. Workplace behavior – including everything from
A.3

A.4
attire to office gossip to personal phone calls – is discussed. (Tie-tying instructions are provided.) This unit culminates in a structured visit to a workplace. Education After High School (8 lessons) Students compare their district’s high school graduation requirements, a list of recommended courses for college-bound students, and Career Cruising’s list of suggested courses for their chosen careers. Based on this information, they select courses for their senior year. College majors are discussed. Two lessons are devoted to educational options other than 4-year colleges, including community colleges, tech and trade schools, apprenticeships, and the military. Money Matters (6 lessons) Students consider the advantages and disadvantages of credit card use and the reasons why good credit is important. They investigate potential car purchases and the cost of buying, operating, and insuring a car. Finally, they examine cost and other considerations when renting an apartment and explore their rights and responsibilities as spelled out in a typical lease. GRADE 12 Grade 12 will focus on the activities students need to make the transition to the next step, whether it’s college or career. Your College/Work Application (9 lessons) Students will spend five weeks writing a personal essay suitable for a college application or self-presentation during a job interview. This essay will serve as a way for students to crystallize their thoughts about what they have to offer the world, whether they’re workforce- or college-bound. Financial Aid (8 lessons) Students will conduct scholarship searches and complete the Free Application for Federal Student Aid (FAFSA). They’ll be provided with guidelines for comparing financial aid packages. Getting Ready for the Workforce (11 lessons) Continuing the work begun in the Grade 11 Job Shadow unit, students will practice the skills needed to successfully search for work. They’ll focus on company research, interviewing techniques, and successful job-hunting strategies. All students will submit a Post-Graduation Action Plan that details next steps for college or career attainment. “Freshman Year” Budget (2 lessons) Students will create a budget based on their anticipated career or education path following graduation. Next Steps Students will consider what it takes to get ahead in the workplace and make the most of their college experience.

APPENDIX B
LESSON PLAN
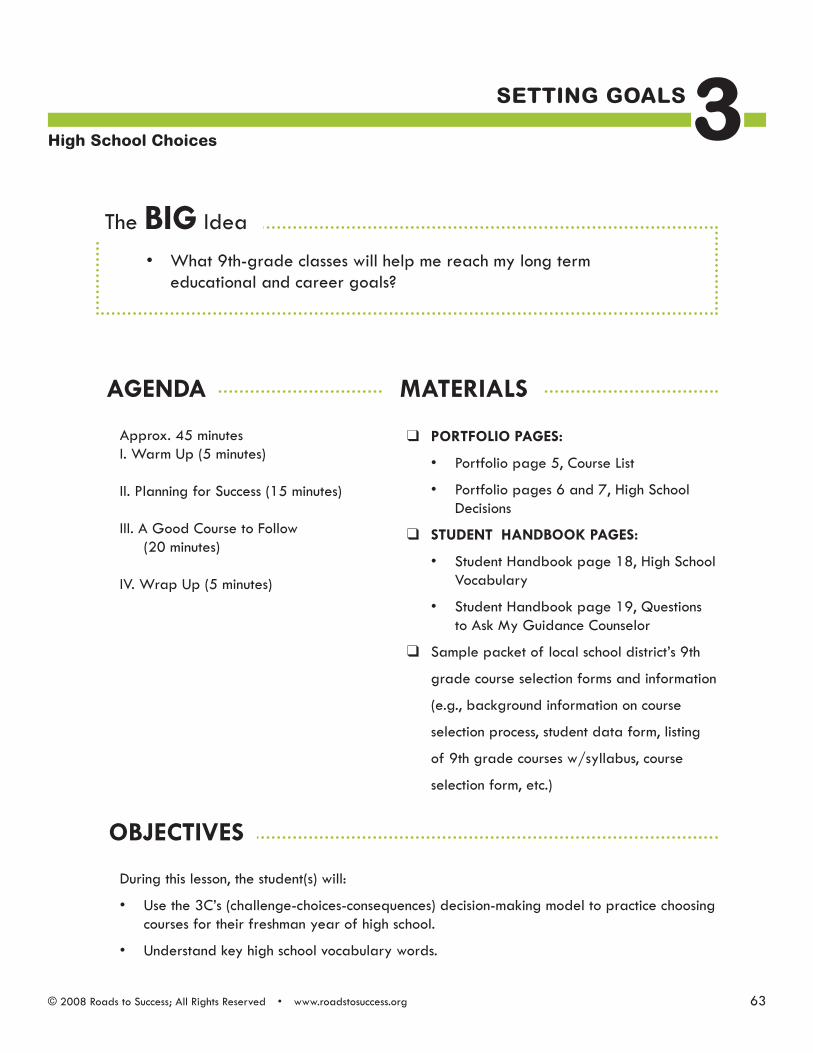
63© 2008 Roads to Success; All Rights Reserved • www.roadstosuccess.org
seTTINg goals
AGENDA
oBJECtIVES
❑ PoRtfoLIo PAGES:
Portfolio page 5, Course List•
Portfolio pages 6 and 7, High School • Decisions
❑ StUDENt HANDBooK PAGES:
Student Handbook page 18, High School • Vocabulary
Student Handbook page 19, Questions • to Ask My Guidance Counselor
❑ Sample packet of local school district’s 9th
grade course selection forms and information
(e.g., background information on course
selection process, student data form, listing
of 9th grade courses w/syllabus, course
selection form, etc.)
Approx. 45 minutesI. Warm Up (5 minutes)
II. Planning for Success (15 minutes)
III. A Good Course to Follow (20 minutes)
IV. Wrap Up (5 minutes)
During this lesson, the student(s) will:
Use the 3C’s (challenge-choices-consequences) decision-making model to practice choosing • courses for their freshman year of high school.
Understand key high school vocabulary words. •
What 9th-grade classes will help me reach my long term • educational and career goals?
High school Choices 3
MAtERIALS
The BIG Idea

66 © 2008 Roads to Success; All Rights Reserved • www.roadstosuccess.org
Grade 8, Setting Goals 3: High School Choices
I. WARM-UP (5 minutes) 1. SAY SoMEtHING LIKE: Pop quiz. How many of you can remember all three words
that the Cs stand for in the decision making strategy that we learned last week? If you don’t remember, you can refresh your memory on Student Handbook page 14, Decision Making 101. Once you know what each of the three Cs stand for, hold up three fingers in the air. [Call on students to tell you what they stand for and to summa-rize each step.]
2. The real-world challenge that each of you are going to be facing later this year is picking your courses for 9th grade. By the end of the class today, you should have a pretty good idea of classes that you’ll be interested in taking next year, as well as an understanding of what the pros and cons of certain choices are.
II. Planning for Success (15 minutes) 1. SAY SoMEtHING LIKE: There are a few vocabulary words that are essential to navi-
gating the high school material that we need to make sure everyone is familiar with before we begin researching and selecting courses.
[Refer students to Student Handbook page 18, High School Vocabulary. Read each one aloud. If there are additional vocabulary words that are specific to your local high school, write them on the board and have students add them to their sheets.]
2. As you probably gathered from the word “requirements,” you don’t get to pick all of your classes in high school. Some of them are picked for you by your guidance coun-selor depending on the courses you’ve taken in middle school and your performance in them. Today you are going to be making a preliminary list of courses for next year [refer students to the definition on the board]. Your final course selection will be made with your guidance counselor in the spring. My goal for you is to become familiar with the material and to start you thinking about what you might like to take so that when it comes time to pick your ninth grade classes for real, you’ll already be ahead of the game.
3. What things should you consider when picking your courses? [Write the ideas that they come up with on the board. Encourage them to think of things like: college; what they’re interested in; how challenging a particular course is; what job they hope to even-tually have; what they’re good at and what they’d like to get better at; what fits into
ACtIVItY StEPS ..................................................................................

67© 2008 Roads to Success; All Rights Reserved • www.roadstosuccess.org
Grade 8, Setting Goals 3: High School Choices
their schedule; what classes they’ve enjoyed in the past; what the prerequisites are for the class.]
4. What if you’re not certain what you want to do when you graduate? You may want to get advice from the guidance counselor about courses that will prepare you for col-lege if you decide later that you want to go.
[If you have capable students who aren’t planning on taking college courses, you may point out that people can decide to enter college at any age, and can take courses to get ready at a local community college if they haven’t had them before. But the opportunity cost for postponing these pre-college courses is that 1) these courses will cost money later on, and 2) adult students often have to fit school into a schedule that includes other responsibilities – like a job or family. Now is a great time to take col-lege prep courses – while it costs them nothing and school is their main responsibility.]
III. A Good Course to follow (20 minutes)1. [Tell students that they are going to spend the remainder of the class figuring out what
courses to take next year.]
[Give each student a copy of your district’s 9th grade courses (course syllabus should be included).
Instruct students to turn to Portfolio page 5, Course List. Remind students that the chances are extremely high that each and everyone of them will be enrolled in an English, math, science, and social studies course next year. As they can see, there are already spaces marked off for each of these classes. Instruct students to look through the courses for each subject listed on the 9th grade course listing. If they have any choices, they can write the type of English, math or science that they’d prefer to take next to it. Note: If you are using the official course selection form from the school, stu-dents do not need to write their selections on Portfolio page 5, Course List. Photocopy the official course selection forms and add then to the students’ portfolio.]
2. [Once students have completed their required course selection, direct their attention to Portfolio pages 6 and 7, High School Decisions.]
SAY SoMEtHING LIKE: Of course, the “challenge” is finding high school courses that will lead to the kind of work you’re interested in. How do you determine what your “choices” are? You all just decided between courses that will fulfill a particular
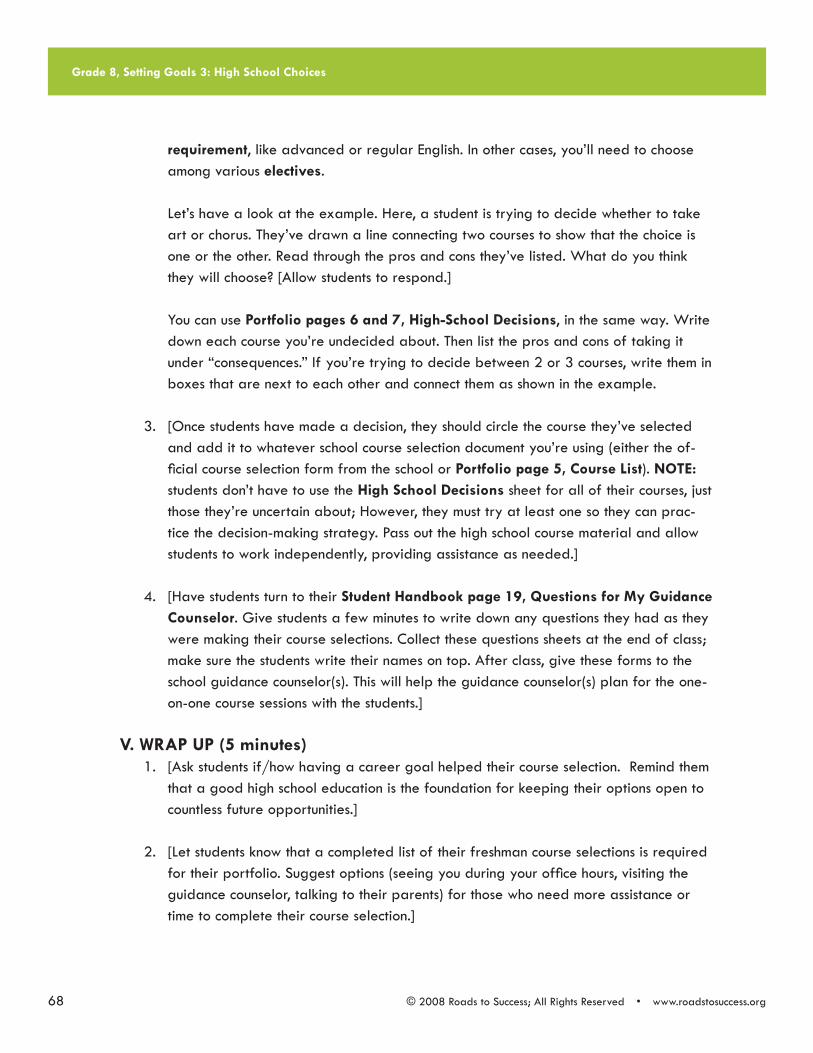
68 © 2008 Roads to Success; All Rights Reserved • www.roadstosuccess.org
Grade 8, Setting Goals 3: High School Choices
requirement, like advanced or regular English. In other cases, you’ll need to choose among various electives.
Let’s have a look at the example. Here, a student is trying to decide whether to take art or chorus. They’ve drawn a line connecting two courses to show that the choice is one or the other. Read through the pros and cons they’ve listed. What do you think they will choose? [Allow students to respond.]
You can use Portfolio pages 6 and 7, High-School Decisions, in the same way. Write down each course you’re undecided about. Then list the pros and cons of taking it under “consequences.” If you’re trying to decide between 2 or 3 courses, write them in boxes that are next to each other and connect them as shown in the example.
3. [Once students have made a decision, they should circle the course they’ve selected and add it to whatever school course selection document you’re using (either the of-ficial course selection form from the school or Portfolio page 5, Course List). NotE: students don’t have to use the High School Decisions sheet for all of their courses, just those they’re uncertain about; However, they must try at least one so they can prac-tice the decision-making strategy. Pass out the high school course material and allow students to work independently, providing assistance as needed.]
4. [Have students turn to their Student Handbook page 19, Questions for My Guidance Counselor. Give students a few minutes to write down any questions they had as they were making their course selections. Collect these questions sheets at the end of class; make sure the students write their names on top. After class, give these forms to the school guidance counselor(s). This will help the guidance counselor(s) plan for the one-on-one course sessions with the students.]
V. WRAP UP (5 minutes)1. [Ask students if/how having a career goal helped their course selection. Remind them
that a good high school education is the foundation for keeping their options open to countless future opportunities.]
2. [Let students know that a completed list of their freshman course selections is required for their portfolio. Suggest options (seeing you during your office hours, visiting the guidance counselor, talking to their parents) for those who need more assistance or time to complete their course selection.]

APPENDIX C
PARENT NEWSLETTER

Did you know?
The teen brain is a work in progress! New research shows that the part of the brain that guides planning doesn’t reach maturity until after age 20. Scientists believe that discussing choices with your teen may build decision-making skills that last a lifetime.
Grade by Grade: Decision Making
Figuring out what high school courses to take isn’t the only decision facing your teen.
The smaller decisions they make each day can make a difference. Teens may have diffi-culty seeing the impor-tance of schoolwork until the moment of truth: the test, the report card, graduation.
Young people often need adult help thinking through consequences that are days or weeks away.
This year, we’re getting eighth-graders to think about the cost of a missed opportunity. (If your son or daughter decides to spend the night playing video games, the opportunity
cost is the chance to study for tomorrow’s test.) Life is full of these trade-offs, big and small.
Steps for making tough decisions:
-List possible choices.
-Think of the consequences (good and bad) for each choice.
-Weigh your options, then decide.
What special courses does your high school offer? Many schools offer courses with a career focus, from auto mechanics to aviation, computers to cosmetol-ogy. Some offer courses that count toward college credit while a student is still in high school.
What electives are available? Once your teen has signed up for all the required courses, there may be time left in the school day for other courses she’d like to take. Electives are a great way to learn new skills or discover new interests.
For more about college and careers, visit us at www.roadstosuccess.org.
Remember your child’s first day of school? Maybe you sent her off with new supplies, a specially chosen outfit, or a pep talk about what to expect.
Getting ready for high school is just as impor-tant. You’ve probably talked to your teen about making responsi-ble decisions when it comes to issues like drugs and alcohol. But he can also use your advice on the academic choices he’s facing—what courses to take and why.
Here are some things to consider:
What courses are re-quired for graduation? This varies from state to state and district to
district. Your son or daughter’s guidance counselor will provide details.
What does she want to do when she graduates? Students planning to at-tend college will want to sign up for challenging math and science courses and a foreign language, too. They’ll also want to aim for at least a B aver-age. Most colleges expect good high school grades as evidence that students are ready for college work.
Getting Ready for High School
Family Newsletter
High School Planning Grade 8
Roads to Success is a new program designed to help middle and high school students prepare for their futures. This news-letter will keep you posted on what we’re doing in school, and how families can follow through at home.
© 2006 Roads to Success; All Rights Reserved

APPENDIX D
CLASSROOM OBSERVATION PROTOCOL

APPENDIX D: ROADS TO SUCCESS CLASSROOM OBSERVATION PROTOCOL
Date: ____________ Facilitator: ________________________ School: ______________________ Grade: _______Period:_____________ Lesson Title: _______________________________ Characteristics of Class (i.e. mostly boys, Special Ed, Inclusion, etc.): __________________
FIDELITY OF IMPLEMENTATION
LEVEL OF IMPLEMENTATION
1=Beginner 2=Intermediate 3=Advanced
EVIDENCE
Was the lesson presented as written?
STUDENT ENGAGEMENT
LEVEL OF IMPLEMENTATION
1=Beginner 2=Intermediate 3=Advanced
EVIDENCE
Did the Facilitator encourage students to generate and ask questions?
Did the Facilitator solicit student participation during the lesson?
Was there evidence of the Facilitator having a rapport with students?
CLASSROOM MANAGMENT
LEVEL OF IMPLEMENTATION
1=Beginner 2=Intermediate 3=Advanced
EVIDENCE
Was there evidence of rules and procedures in place? Did the Facilitator manage issues that arose in a quick and efficient way so as not to further disrupt instruction?
Did the Facilitator both show and command respect from students?
D.1

D.2
INSTRUCTION LEVEL OF
IMPLEMENTATION 1=Beginner
2=Intermediate 3=Advanced
EVIDENCE
Did the Facilitator set a purpose for the lesson? Did the Facilitator give clear instructions? Did the Facilitator provide clear transitions between activities? Did the Facilitator model activities for the students? Did the Facilitator manage time spent on each activity? Did the Facilitator provide structure for working in groups or pairs?
Did the Facilitator ask questions that require critical thinking? Did the Facilitator re-cap the material at the end of the lesson?
DIFFERENTIATION LEVEL OF
IMPLEMENTATION 1=Beginner
2=Intermediate 3=Advanced
EVIDENCE
Did the Facilitator vary expectations depending on the skill level of students?
Did the Facilitator provide extra time and assistance to students who needed it?
Did the Facilitator utilize a variety of instructional practices to aid student learning (examples: chart paper with relevant information, verbal instructions, activities with movement, etc)?
AMBASSADOR TO THE PROGRAM LEVEL OF
IMPLEMENTATION 1=Beginner
2=Intermediate 3=Advanced
EVIDENCE
Was there evidence of a positive RTS presence in the school (ex: bulletin boards, rapport with host teachers, etc)?
What strengths did the Facilitator demonstrate in his/her instruction? Recommendations for Professional Development –

APPENDIX E
LIST OF RTS SCHOOLS

APPENDIX E: LIST OF PARTNER SCHOOLS
Roads to Success has been implemented in the following schools. Schools in Study
State of West Virginia (n=16) Wayne County (Buffalo MS, Ceredo-Kenova MS, Crum MS, Fort Gay MS, Vinson MS, Wayne MS); Braxton County (Braxton MS); Calhoun County (Calhoun HS); Gilmer County (Gilmer HS); Logan County (Chapmanville MS, Man MS, Logan MS); Mason County (Hannan HS, Pt. Pleasant HS, Wahama HS); Wirt County (Wirt MS/HS) State of New York (n=7) Belfast Central (Belfast Central HS); Fillmore Central (Fillmore Central HS); Friendship Central (Friendship Central HS); Hinsdale Central (Hinsdale Central HS); Portville Central (Portville Central HS); Scio Central (Scio Central HS); Whitesville Central (Whitesville Central HS) Wellsville MS and Genessee Valley Central HS in New York dropped out of the study after random assignment though Genesee Valley Central HS did participate in the baseline survey and MPR is going to try to get administrative data from both of these schools. Additional Schools Using RTS but not in Study (n=7) Academy of Environmental Sciences, NYC; Collegiate Institute of Math and Science, NYC; Truman High School, NYC; Otto Eldred Jr/Sr High School, PA; Andover Central HS, NY; Ripley MS, WV; Braxton HS, WV.
E.1

APPENDIX F
FACILITATOR IMPLEMENTATION FORM
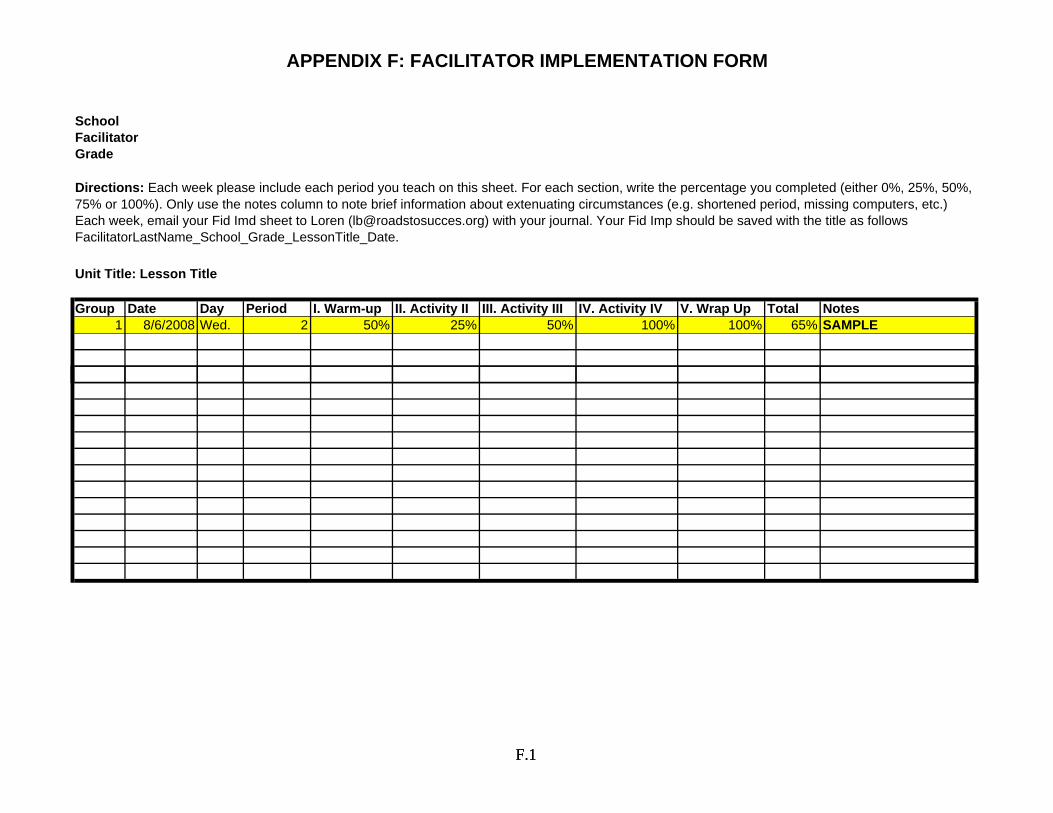
APPENDIX F: FACILITATOR IMPLEMENTATION FORM
25%, 50%, ng computers, etc.) tle as follows
F.1F.1
SchoolFacilitatorGrade
Directions: Each week please include each period you teach on this sheet. For each section, write the percentage you completed (either 0%,75% or 100%). Only use the notes column to note brief information about extenuating circumstances (e.g. shortened period, missiEach week, email your Fid Imd sheet to Loren ([email protected]) with your journal. Your Fid Imp should be saved with the tiFacilitatorLastName_School_Grade_LessonTitle_Date.
Unit Title: Lesson Title
Group Date Day Period I. Warm-up II. Activity II III. Activity III IV. Activity IV V. Wrap Up Total Notes1 8/6/2008 Wed. 2 50% 25% 50% 100% 100% 65% SAMPLE

APPENDIX G
FOLLOW-UP SURVEY

6388-501
Student ID
Follow-up Survey Spring 2009
INSTRUCTIONS
• This survey asks about your involvement in school and the community, learning and study habits, and plans for the future. The survey should take about 30 minutes.
• Mark only one answer for each question, unless the directions tell you to mark more
than one answer. You may use a pen or pencil. • Your answers are very important to us. This is not a test. There are no right or
wrong answers. You may skip any question you do not wish to answer. • If you have a question about the survey, raise your hand and someone will help you.

Prepared by Mathematica Policy Research, Inc. 1 1/29/09
A. SCHOOL AND COMMUNITY INVOLVEMENT
A1. How much do you agree or disagree with each of the following statements?
MARK ONE FOR EACH ROW Strongly
Disagree Disagree Agree Strongly
Agree
a. I go to school because I think the subjects I’m taking are interesting .......................................................................................... 1 2 3 4
b. I go to school because I’m learning skills that I will need for a job ... 1 2 3 4
c. I go to school because my parents or guardians expect me to succeed ............................................................................................. 1 2 3 4
A2. How important are good grades to you? MARK ONE ONLY
1 Not important at all
2 Somewhat important
3 Important
4 Very important A3. NOT IN THIS VERSION A4. In the last year, how often have you discussed the following with a parent or guardian?
MARK ONE FOR EACH ROW
Never Not Very
Often Sometimes Often Very Often
a. Selecting courses or programs at school ........... 1 2 3 4 5
b. School activities or events .................................. 1 2 3 4 5
c. Topics you’ve studied in class ............................ 1 2 3 4 5
d. Your grades ........................................................ 1 2 3 4 5
A5. NOT IN THIS VERSION

Prepared by Mathematica Policy Research, Inc. 2 1/29/09
A6. In the last year, how often have you discussed the following with a parent or guardian?
MARK ONE FOR EACH ROW
Never Not Very
Often Sometimes Often Very Often
a. Taking college entrance exams (like the SAT or ACT) ................................................................... 1 2 3 4 5
b. Whether to go to college .................................... 1 2 3 4 5
c. What college to choose ...................................... 1 2 3 4 5
d. Different college majors and programs .............. 1 2 3 4 5
e. Possible jobs or careers ..................................... 1 2 3 4 5
A7. In the last year, how often have you discussed the following with one or more teachers or school staff
(such as a guidance counselor)?
MARK ONE FOR EACH ROW
Never Not Very
Often Sometimes Often Very Often
a. Taking college entrance exams (like the SAT or ACT) ................................................................... 1 2 3 4 5
b. Whether to go to college .................................... 1 2 3 4 5
c. What college to choose ...................................... 1 2 3 4 5
d. Different college majors and programs .............. 1 2 3 4 5
e. Possible jobs or careers ..................................... 1 2 3 4 5

Prepared by Mathematica Policy Research, Inc. 3 1/29/09
B. LEARNING AND STUDY HABITS
B1. Do you . . .
MARK ONE FOR EACH ROW
Never Not Very
Often Sometimes Often
Always or Almost Always
a. stick with a class assignment or task until it is done? .... 1 2 3 4 5
b. put in your best effort on class assignments, projects, and homework? .............................................................. 1 2 3 4 5
c. ask a teacher or another student for help when you don’t understand an assignment? .................................. 1 2 3 4 5
d. take part in class discussions or activities? ................... 1 2 3 4 5
e. come to your classes prepared with what you need (books, paper, and something to write with)? ................ 1 2 3 4 5
f. complete class assignments, projects, and homework on time? .......................................................................... 1 2 3 4 5
B2. NOT IN THIS VERSION B3. During the current school year . . .
MARK ONE FOR EACH ROW
Never 1 – 4
Times 5 – 9
Times 10 or More
Times
a. How many times were you late for school? ....................................... 1 2 3 4
b. How many times did you cut or skip classes? ................................... 1 2 3 4
c. How many times were you absent from school? ............................... 1 2 3 4
d. How many times were you sent out of class for bad behavior? ......... 1 2 3 4
e. How many times were you given a detention? .................................. 1 2 3 4

Prepared by Mathematica Policy Research, Inc. 4 1/29/09
C1. How important is each of the following to you in your life?
MARK ONE FOR EACH ROW Not
Important Somewhat Important Important
Very Important
a. Being successful in my line of work ........................................ 1 2 3 4
b. Having a happy family life ....................................................... 1 2 3 4
c. Having lots of money ............................................................... 1 2 3 4
d. Having strong friendships ........................................................ 1 2 3 4
e. Being able to find steady work ................................................ 1 2 3 4
f. Helping other people in my community ................................... 1 2 3 4
g. Getting a good education ........................................................ 1 2 3 4
h. Getting a good job ................................................................... 1 2 3 4
C2. As things stand now, l think I will . . . MARK ONE ONLY
1 Complete high school and graduate with a diploma 2 Drop out of high school and complete the GED 3 Not finish high school C3. How far would you like to get in school? MARK ONE ONLY
1 High school graduate/GED 2 Technical or trade school 3 Associates degree (2 year college degree) 4 Bachelors degree (4 year college degree) 5 Masters degree or equivalent 6 Ph.D., MD or other advanced degree (like a medical or law degree) C4. How likely is it that you will get this far in school?
MARK ONE ONLY
Not Very Likely Very Likely
1 2 3 4 5 0% - 20% 21% - 40% 41% - 60% 61% - 80% 81% - 100%
C. PLANS FOR THE FUTURE

Prepared by Mathematica Policy Research, Inc. 5 1/29/09
C5. What reasons might keep you from achieving your educational goals? MARK ONE FOR EACH ROW Yes No
a. I don’t like school .............................................................................................................. 1 0
b. My grades aren’t high enough .......................................................................................... 1 0
c. Courses are too difficult for me ........................................................................................ 1 0
d. I can’t afford it ................................................................................................................... 1 0
e. I plan to join the military ................................................................................................... 1 0
f. No one in my family has ever gone on to school after high school .................................. 1 0
g. I’d rather work and make money than go to school ......................................................... 1 0
h. I don’t think that going to school is important ................................................................... 1 0
i. I need to help support my family ...................................................................................... 1 0
j. Some other reason (name this reason) ___________________________________ 1 0 C6. Tell us a little about your career goals. In the boxes below, name up to three careers you would most like
to have and answer the three related questions about each career.
MARK ONE FOR EACH ROW
Name the career or careers you would most like to have: Answer these related questions:
Not Very Very
1. ________________________
a. How interested are you in this career? ............ 1 2 3 4 5
b. How likely are you to enter this career? .......... 1 2 3 4 5
c. How well would you perform in this career? .... 1 2 3 4 5
2. ________________________
a. How interested are you in this career? ............ 1 2 3 4 5
b. How likely are you to enter this career? .......... 1 2 3 4 5
c. How well would you perform in this career? .... 1 2 3 4 5
3. ________________________
a. How interested are you in this career? ............ 1 2 3 4 5
b. How likely are you to enter this career? .......... 1 2 3 4 5
c. How well would you perform in this career? .... 1 2 3 4 5

Prepared by Mathematica Policy Research, Inc. 6 1/29/09
C7. Name the career you expect to be working in by age 30 and answer the three related questions. ____________________________________________________________________________________
Answer these related questions: MARK ONE FOR EACH ROW
Not Very Very
a. How interested are you in this career? ........... 1 2 3 4 5
b. How likely are you to enter this career? .......... 1 2 3 4 5
c. How well would you perform in this career? ... 1 2 3 4 5
C8. What education or training do you need for this career? MARK ONE ONLY
1 No education after high school is needed
2 Military training
3 Technical or trade school
4 Associates degree (2 year college degree)
5 Bachelors degree (4 year college degree)
6 Masters degree or equivalent
7 Ph.D., MD or other advanced degree (like a medical or law degree)
8 Other (Please describe) _______________________________________________________
d Don’t know C9. How likely is it that you could successfully complete the education and/or training required to enter this
career?
MARK ONE ONLY
Not Very Likely Very Likely
1 2 3 4 5
0% - 20% 21% - 40% 41% - 60% 61% - 80% 81% - 100%
C10. What reasons might keep you from achieving your career goals by age 30?
MARK ALL THAT APPLY
1 Not enough education
2 Need to work to support my family
3 My parent or guardian wants me to have a different career
4 Other (Please describe) _______________________________________________________
5 I can’t think of a reason that will keep me from achieving my career goals

Prepared by Mathematica Policy Research, Inc. 7 1/29/09
C11. How much do you agree or disagree with each of the following statements?
MARK ONE FOR EACH ROW Strongly
Disagree Disagree Agree Strongly
Agree
a. I know what is required to succeed in different careers ...................... 1 2 3 4
b. I know how to find out about what types of jobs are best for me ........ 1 2 3 4
c. I have a good idea about the kinds of jobs I would be good at .......... 1 2 3 4
d. I will be able to overcome barriers that stand in the way of achieving my career goals .................................................................. 1 2 3 4

Prepared by Mathematica Policy Research, Inc. 8 1/29/09
D. BACKGROUND INFORMATION
D1. When were you born? | | | / | | | / | 1 | 9 | | | Month Day Year D2. Are you: 1 Male?
2 Female? D3. How do you describe yourself? MARK ALL THAT APPLY
1 White
2 Black or African-American
3 Hispanic or Latino/Latina
4 Asian
5 Native Hawaiian or Other Pacific Islander
6 American Indian or Alaskan Native
7 Other (Please describe) ________________________________________________________ D4. What is the highest level of education completed by your mother or female guardian? MARK ONE ONLY
1 Some high school
2 GED
3 High school graduate
4 Technical or trade school
5 Associates degree (2 year college degree)
6 Bachelors degree (4 year college degree)
7 Masters degree or equivalent
8 Ph.D., MD or other advanced degree (like a medical or law degree)
9 Other (Please describe) ________________________________________________________
d Don’t know

Prepared by Mathematica Policy Research, Inc. 9 1/29/09
D5. What is the highest level of education completed by your father or male guardian? MARK ONE ONLY
1 Some high school
2 GED
3 High school graduate
4 Technical or trade school
5 Associates degree (2 year college degree)
6 Bachelors degree (4 year college degree)
7 Masters degree or equivalent
8 Ph.D., MD or other advanced degree (like a medical or law degree)
9 Other (Please describe) ________________________________________________________
d Don’t know D6. What is the main language spoken at home? MARK ONE ONLY
1 English
2 Spanish
3 English and Spanish equally
4 Other (Please describe) ________________________________________________________ D7. Do you have a computer at home with access to the internet? 1 Yes 0 No D8. Please fill in today’s date. | | | / | | | / | 2 | 0 | 0 | 9 | Month Day Year D9. Do you have any siblings or anyone else in your home who currently attend the 7th grade at this school? 1 Yes 0 No D10. Have you participated in a program or class called Roads to Success? 1 Yes 0 No
Thank you very much for completing this survey.

APPENDIX H
FUTURE OUTCOME VARIABLES

H-1
In this appendix we describe outcomes we could measure with additional funding for the evaluation. If additional funding is also available for the program, then these outcomes could be used to estimate effects of the full program. If funding is available for the evaluation but not for the program, then these outcomes could still be valuable for capturing long-term impacts of the grade 7 and 8 version of the program.
Grade 9 Confirmatory Outcome. If additional funding allows for continuation of the RTS evaluation, future analyses would investigate the impacts of RTS in grade 9. We could use the “on-track” indicator, previously described by the Chicago Consortium (Allensworth & Easton, 2005), as our confirmatory outcome for grade 9. The Chicago Consortium has used this “on-track” indicator as an intermediate indicator of school performance, and has found that it is highly predictive of whether students eventually graduate from high school. Among students entering a high school in the Chicago Public School District in 1999, those who were on-track by the end of grade 9 were about three and one-half times more likely to graduate in four years than off-track students (Allensworth & Easton, 2005). Consistent with the Chicago Consortium’s research, we will consider a student as “on-track” at the end of grade 9 if both of the following criteria are met: (1) the student has accumulated the number of credits needed to be promoted to grade 10 according to district policy, and (2) the student has no more than one semester F (that is, one-half of a full credit) in a core subject (e.g., English, math, science, or social studies).
Grade 9 Exploratory Outcomes. Contingent on additional funding, we could also conduct exploratory analyses of other outcomes in grade 9, including (1) all of those listed for grade 8 (confirmatory and exploratory), (2) grade 9 grade-point average in core courses, and (3) number of accumulated credits in grade 9.
Grade 10 Confirmatory Outcome. If additional funding allows for continuation of both the intervention and the evaluation, future analyses could investigate impacts of RTS in grade 10. The confirmatory outcome for grade 10 would be a weighted average of the number of credits students have completed with a grade of C or better by course type (for example, algebra, other college-preparatory work, and vocational education). We could weigh the types of credits by using their estimated impacts on later outcomes, such as college completion or the log of earnings based on data from the National Educational Longitudinal Study (NELS) for students with similar characteristics to those in the RTS program. This measure would incorporate information about courses taken and student performance in those courses and should be affected by increases in student engagement in school caused by RTS.
While some of the literature suggests that the impacts of course taking on test scores are ambiguous (Teitelbaum 2003), most research suggests that more rigorous courses have positive impacts on test scores (Gamoran and Hannigan 2000), years of education (Allensworth and Easton 2005), and later career success (Chaplin 1998) compared to less rigorous courses. The confirmatory grade 10 outcome also incorporates course performance that affects grade promotion, which in turn is highly correlated with later measures of success (Roderick and Nagaoka 2005; Hong and Raudenbush 2005; and Allensworth and Easton 2005).
Grade 10 Exploratory Outcomes. Contingent on additional funding, we could also conduct exploratory analyses of other outcomes in grade 10, including (1) all of those listed for grade 8 (confirmatory and exploratory), (2) the percentages of students taking the SAT, ACT, PSAT, or

H-2
Pre-ACT in schools where these tests are not mandatory, and (3) scores on standardized tests such as those taken for school accountability purposes.
Grade 12 Confirmatory Outcome. Contingent on future funding of both the intervention and the evaluation, we could also use the point system described below to measure the degree to which students make progress toward a successful career by the end of grade 12.
For students on track to graduate on time (within six years after entering grade 7) and with a regular high school degree, the point system is as follows:
1. Accepted to college or secured a job that is reasonably ambitious given the student’s preparation7
2. Applied to at least one college or job that is both reasonably ambitious and realistically attainable8
3. Applied to at least one college or job, but plans are either not ambitious enough or not realistically attainable
4. On track to graduate but not in the first three categories
For students not on track to graduate on time with a regular degree:
5. Still attending high school
6. Dropped out but have a GED
7. Dropped out; no GED
This grade 12 outcome measure incorporates completed years of education, a factor that is highly correlated with later labor market success. In addition, it incorporates information on career planning, an important focus of the RTS program. In particular, the “reasonably ambitious” and “realistically attainable” caveats for outcomes 1 and 2 help capture the fact that RTS is designed to help students align their career and education plans and preparation.
7 A reasonably ambitious job will be defined as one with earnings in the upper three quartiles at age 28 in data from NELS for students with similar grade 12 characteristics (grades and test scores). Thus, for example, starting work as an apprentice to an electrician, plumber, mechanic, or carpenter would likely qualify for a student with average characteristics. A reasonably ambitious college is one in the upper three quartiles of what students with similar characteristics attended in NELS based on one of the standard measures of college quality (e.g., average freshman SAT scores). Students with below-average test scores would likely satisfy this by obtaining admission to any college, including one that is not selective (i.e., does not require SAT or ACT scores for admission).
8 A “Realistically attainable” college/job would be based on whether the student is in the top three quartiles based on their grades and test scores compared to students entering that college/job category in NELS. Thus, even if a student is rejected by all colleges and jobs, their applications could still count as realistically attainable.

H-3
The impacts of RTS on this outcome may not be linear. To allow for this possibility, we will also estimate an ordered logit model and test for the possibility that the impacts of RTS vary depending on the level of the variable considered.
Grade 12 Exploratory Outcomes. Contingent on additional funding, the exploratory outcomes for grade 12 could include all of the variables listed above for grades 8 and 10. In addition, we could analyze the fraction of students who fill out financial aid forms for college (if not required to do so by their high school). With additional funding, MPR could obtain postsecondary enrollment data on students in this study from the National Student Clearinghouse in order to estimate impacts on these important longer-term post grade 12 outcomes.

APPENDIX I
IMPLEMENTATION METHODS

I-1
If additional funding is secured to continue the intervention and the study, MPR could also evaluate the implementation of the RTS program in the study schools. The implementation component of this study would help us understand how well the intervention is implemented, how the activities of the treatment group differ from those of the control group, and what barriers are encountered in implementation. Understanding these factors will be useful for interpreting the results of the impact study. For example, if the program does not appear to be effective (that is, outcomes for the treatment and control groups are similar), it will be informative to know which components of the program were not implemented as planned. Alternatively, if the program does have positive estimated impacts (that is, the treatment group has better outcomes than the control group), it will be useful to know which components of the program were implemented, whether they created a noticeable change in student activities, what challenges were encountered during implementation, and whether the program appears to be a good candidate for a larger-scale study. Thus, this implementation component of our study will play a key role in developing our understanding of the impacts of the RTS program and the program’s ability to “go to scale” (Rossi and Freeman 1989).
Implementation Research Design
The implementation part of the study would rely on four key sources of information. First, RTS staff has supplied MPR with a thorough description of the program and will keep MPR staff apprised of any changes so that MPR has a complete understanding of the program when measuring its implementation. Second, RTS would supply us with implementation data that its staff collects on a daily basis in order to inform ongoing program development efforts. Third, MPR staff could conduct site visits to help validate the implementation information that has been collected and to provide richer information on certain topics, such as challenges staff face when implementing RTS. Finally, MPR staff could use data collected in our student and school counselor surveys to help capture whether or not the treatment group activities related to key program components differ noticeably from those of the control group.
Implementation Sample
For most of the implementation study, we will use data from all participating schools (23 schools when the students are in grades 7 and 8, 17 schools in the later years) and all students in the relevant cohorts. If additional funding is secured, case studies could be conducted in different schools each year in order to analyze more fully the reliability of the RTS facilitator measures of implementation. The schools would be chosen randomly within subgroups so that our sample is generally representative of the schools in the study based on geographic location and previous student performance.
Implementation Data Collection Methods
As discussed above, MPR could use four sources of data to evaluate implementation of the RTS program—two from RTS staff and two collected by MPR staff. Following are more detailed descriptions of each of these sources of data and how they would be used.

I-2
RTS Data
RTS Program Descriptions. With additional funding, MPR could collect information on how the RTS program should be implemented by using both program records (summary program descriptions, course curriculum, daily lesson plans, staff descriptions, and class schedules) and interviews with key national program staff (the CEO of RTS and the curriculum developer). This information could then be summarized in a report that focuses on the three elements that RTS staff consider key for program success—a comprehensive and consistent curriculum, engaging teaching methods, and high dosage. This work would help us understand how each of these key program elements should look in practice and guide the development of site visit protocols and benchmarks used to assess program fidelity.
RTS Implementation Data. To measure program implementation, RTS staff use detailed data collection instruments that are refined based on feedback from MPR staff (see Facilitator Implementation Form in Appendix F). They cover up to five subsections of each lesson for each class period. RTS staff are asked to report on the degree to which each subsection was completed by using a scale of 0 to100, having received training in how to report on this information. The subsections are aligned directly to the lesson plans. The RTS facilitators are also asked to describe in some detail any implementation issues related to lesson delivery, student engagement, alignment with the curriculum, level of difficulty, amount of material, and order of activities (see Facilitator Journal in Appendix J). MPR staff could use these data to understand how the RTS program is administered relative to the “ideal” by examining variation across sites and between classrooms within sites and by focusing on components that appear to be most challenging to implement.
MPR Data
Site Visit Data. Site visits are not currently part of the study design. With additional funding of both the RTS program and the evaluation, MPR could conduct four site visits per year during the next four school years so that we could observe the RTS program in grades 8 to 12 (grade 7 is now completed for both cohorts of the study sample). MPR staff could (1) conduct in-person interviews with the RTS school-level staff and non–RTS teachers; (2) conduct focus groups of parents and students; and (3) conduct structured observations of two classrooms during each visit. A structured observation protocol could be developed to allow observers to measure the extent to which that day’s lesson plan was implemented. The protocol could be based in large part on the protocol that the RTS facilitators use to measure program implementation (see Appendix F, Facilitator Implementation Form). Using this source of data, MPR staff would be able to validate the implementation data collected from RTS staff and develop a better understanding of actual program implementation.
Student and School Counselor Surveys. These data will be used to analyze whether the components received by the treatment group differ from those of the control group. A school counselor survey is not currently part of the study design. But with additional funding, a school counselor survey would enable MPR to determine whether counselors believe that the control group was affected by the presence of RTS at the school and whether the treatment group experienced any changes other than the addition of RTS—for example, the counselor might have

I-3
reduced career planning activities for the treatment group (since the group is getting RTS) and increased them for the control group.
The student surveys used to measure program implementation will be the follow-up student surveys that are also used to measure student outcomes. These surveys will include questions about student activities related to each of the key components of the program such as talking to school staff about career and education planning.
With additional funding, the school counselor surveys could be developed by MPR and would focus on key program components. They would be given to one non–RTS staff person at each school. MPR staff would ask each school’s principal to identify a staff member who is most likely to know about the types of career planning activities that the students would be exposed to in the absence of the RTS program; in most cases, this would probably be a school counselor. MPR staff could then conduct a telephone survey with these school staff members to gather information about RTS and non–RTS activities offered at each school that are related to the key components of the RTS curriculum (career exploration, education planning, and education/workplace skills). Like the site visits, the school counselor surveys could be conducted over the next four years and would cover as many grades as possible (8 through 12).
Implementation Analysis Methods
With additional funding of both the RTS program and the evaluation, our implementation analysis could use both quantitative and qualitative analysis methods.
Quantitative Methods. We could use quantitative data on program implementation in three
ways. First, to determine whether the activities of students in the treatment group differ from those in the control group, MPR staff could estimate the impacts of being in the treatment group on student activities, employing the same statistical methods used to estimate program impacts on short- and intermediate-term student outcomes. These methods were described in the impact section above. Second, to understand how well the program was implemented, MPR staff could use simple descriptive statistics (for example, the mean level of implementation of each program component) to analyze the implementation data provided by RTS staff. Third, to validate the RTS implementation data, MPR staff could compare these measures with those observed by MPR staff. In this analysis, MPR staff could use each subsection of the class period as the unit of analysis, adjust for clustering of the data by classroom and facilitator, and test to see if the reported measures differ, on average, from those observed by MPR staff.
Qualitative Methods. The qualitative data collected in possible MPR site visits could shed light on the RTS implementation process and provide a context for interpreting the administrative and survey data. The main sources of qualitative data would be classroom observations, focus groups, and interviews with RTS facilitators, career planning counselors or guidance counselors, and principals. MPR could analyze classroom observation data to examine variations in fidelity of implementation (supplementing RTS’s implementation tracking forms), quality of instruction, and content covered. This information may explain why impacts vary across schools or grade levels.

I-4
Analysis of the focus group data would center on students’ views of program benefits and limitations, challenges they encountered in implementing program strategies, and their recommendations for program improvement. This information may inform our understanding of variations in impacts across different types of students. Data from interviews with RTS facilitators, career planning or guidance counselors, and principals would provide information about how staff see the RTS program compared to other career planning programs, school support for the program, the benefits and limitations of the RTS program, student struggles in implementing program strategies, whether information may spill over to non–RTS grades, and suggestions for program improvement. This information may clarify why impacts vary by school and/or type of student.

APPENDIX J
FACILITATOR JOURNAL

J.1
APPENDIX J: FACILITATOR JOURNAL FORM (WITH SPACES FOR ANSWERS REMOVED)
Lesson number and title: Classroom grade level(s): Dates completed: Please use a check mark to identify any problems you experienced in delivering this lesson. This section will help us differentiate between lessons that need minor changes and those that need to be completely reworked. Note specifics in the blank spaces after the questions.
Y/N General 1 Are any small changes needed in the lesson? (Typos, concept that needs clarification, student
handbook item doesn’t match teacher’s guide, a reference is outdated) 2 Does the lesson teach what it intends to teach according to the lesson objectives? 3 Were you able to secure all of the needed technology for this lesson? 4 Was there too much writing or paper-shuffling in this lesson? 5 Was there too much material for one class period? 6 Was there too little material for one class period? Y/N Lesson Delivery 7 Is the lesson difficult to execute? (For example, video viewing and computer lab in same lesson) 8 Are one or more activities not working as written? 9 Would the activities work better in a different order? 10 Did you make any adaptations to this lesson? Were they successful? 11 Is an additional worksheet needed to focus student attention? Y/N Student Engagement 12 Were students not engaged or off-task for major parts of the lesson? (If student reaction varied,
describe those who had difficulty below.) 13 Was the lesson too juvenile for this age group? 14 Did students need more background info on this topic? (For example, we investigated a specific
post-secondary option without adequate description of the choices available.) 15 Did students lack the skills needed to complete the lesson? (For example, they couldn’t calculate
percentages.) 16 Was the material too difficult conceptually? (For example, students couldn’t figure out why
career outlook might be important to them.) 17 Did lower-level learners struggle?

J.2
The Lesson 1. What worked well? 2. What was frustrating? (for you or your students) 3. What knowledge did your students gain as a result of this lesson? 4. Please describe students’ level of engagement with the Student Handbook
and Portfolio pages. Place an “X” next to the description(s) that best apply, and give specific details to support your answer. • Students completed the written materials and found them useful. • Students completed the written materials without much engagement –
responses lacked / effort. • Students lacked the time needed to complete the written materials.
(Please specify what didn’t get done, and whether there was a special circumstance, e.g., a fire drill, that prevented completion.)
• Students found the written materials difficult to understand.
5. Describe any additional classroom management concerns that related to the way the lesson was written or structured.
6. If there were any opportunities to celebrate student achievement with prizes,
acknowledgements, treasure box, etc., please tell us what the student reaction was.
7. What recommendations would you make, if any, about changing this lesson
for next year?
Personal Reflection 8. If you were to teach this lesson again, what would you change in your
facilitation? Why? 9. What do you think you did well?