right ventricular pressure during ventricular arrhythmias in humans: potential implications for...
TRANSCRIPT
648 JACC Vol. 15, No. 3 March I, 1990:648-55
CARDIAC PACING
Right Ventricular Pressure During Ventricular Arrhythmias in Humans: Potential Implications for Implantable Antitachycardia Devices
ARJUN D. SHARMA, MD, FACC, FRCPC, TOM D. BENNETT, PHD,” MARK ERICKSON, BS,
GEORGE J. KLEIN, MD, FACC, FRCPC,+ RAYMOND YEE, MD, FACC, FRCPC,t
GERARD GUIRAUDON, FACC, FRCSCt
Sacramento, California and London, Ontario, Canada
Implantable defibrillators use algorithms based on ventric- ular electrographic data to detect the onset and termination of arrhythmias, but these algorithms do not always differ- entiate hemodynamically stable from unstable arrhyth- mias. Although, ideally, left ventricular function should be used to assess the hemodynamic state, right ventricular pulse pressure can be assessed in humans on a long-term basis with a transvenous lead. The potential utility of right ventricular pulse pressure to assess hemodynamic stability was studied in 22 patients with induced ventricular ar- rhythmias. Right ventricular pressure was measured with use of a transvenous right ventricular endocardial pacing lead with a piezoelectric bender pressure sensor 3 cm from its tip. Single ventricular premature paced beats adminis- tered in up to a bigeminal frequency did not alter the mean right ventricular pulse pressure (control 33.7 f 26, bigem- iny 35.7 + 26 mm Hg):
Twenty-one episodes of induced ventricular tachycardia were studied in the electrophysiology laboratory. Five seconds after tachycardia induction, hemodynamically sta- ble ventricular tachycardia had a longer cycle length (294 +
41 ms) and the right ventricular pulse pressure ratio was higher (0.55 + 0.26) than that in unstable ventricular tachycardia (cycle length 256 + 55 ms, p = 0.06; pulse pressure ratio 0.26 f 0.09, p < 0.05). Twenty episodes of ventricular fibrillation were induced in eight patients. One second after induction, right ventricular pulse pressure decreased from 25 f 5 to 6 +. 3 mm Hg (p < 0.05). On the first beat after defibrillation, right ventricular pulse pres- sure increased to 24 zk 14 mm Hg, a level not significantly different from that before the induction of ventricular fibrillation.
This rapid decrease of right ventricular pulse pressure during ventricular fibrillation and immediate recovery af- ter defibrillation is useful for detecting ventricular fibrilla- tion onset and termination. Right ventricular pulse pres- sure can differentiate hemodynamically stable from unstable ventricular tachycardia. These data suggest that this variable may be of use in automatic implantable antitachycardia/defibrillation devices.
(J Am Co11 Cardiol1990;15:648-55)
Currently manufactured antitachycardia/defibrillation de- vices use algorithms based on electrographic data to detect the onset and termination of arrhythmias (1). Their primary criterion for detecting the onset of arrhythmia is an electro-
From the Mercy General and Sutter Memorial Hospitals. Sacramento, California, the tDepartments of Medicine and Surgery, University Hospital, London, Ontario, Canada and *Pacing Research, Medtronic, Minneapolis, Minnesota. This study was presented at the 61st Annual Scientific Session of the American Heart Association, Washington, D.C., November 1988.
Manuscript received April 3, 1989; revised manuscript received August 23, 1989, accepted October 1, 1989.
Address for reurints: Ajun D. Sharma, MD, 3941 J Street, Suite 260, Sacramento, California 95819.
01990 by the American College of Cardiology 0735-1097/90/$3.50
graphic rate above a predefined limit. In addition, change in cycle length, stability of cycle length and data on electro- graphic configuration such as the probability density func- tion may be used (2-4). These algorithms do not always differentiate hemodynamically stable from hemodynamically unstable cardiac arrhythmias. As a result, patients with both conditions may receive painful defibrillation shocks while conscious (5). In addition to causing psychologic trauma, frequent use of high energy defibrillation shocks for ventric- ular tachycardia depletes the battery and limits the longevity of the device. It would therefore be extremely useful to determine whether a simple measure of hemodynamic func- tion could be used to differentiate unstable arrhythmias requiring defibrillation therapy from other arrhythmias re-
JACC Vol. IS, No. 3 SHARMA ET AL. 649 March 1, 1990:648-55 RIGHT VENTRICULAR PRESSURE DURING ARRHYTHMIAS
quiring low energy therapy, such as pacing (6) or cardiover- sion (7).
The concept of detecting arrhythmias using right ventric- ular pressure was originally described by Mirowski et al. (8). but implantable devices based on this concept have not previously been developed. A permanent ventricular pacing lead has been manufactured (9) that incorporates a piezo- electric bender pressure sensor 3 cm from its tip. This lead is capable of both pacing and recording right ventricular pres- sure on a long-term, continuous basis (IO). Because this provides a simple estimate of ventricular function, we sought to determine whether changes in right ventricular pulse pressure could be used to detect the onset and termination of hemodynamically unstable arrhythmias.
Methods Twenty-two patients with a mean age of 53.2 +- 18 years
were studied. Sixteen patients were male and six female. All patients provided informed consent as approved by the University of Western Ontario standing committee on hu- man research.
Ventricular premature paced complexes. Four patients (mean age 56.8 years) with complete heart block underwent long-term implantation of a ventricular demand pacemaker (Medtronic 2451) and a permanent endocardial pacing lead that incorporated a piezoelectric bender sensor 3 cm from its distal tip (Medtronic 6220). The right ventricular pressure was monitored continuously during the investigation with use of radiofrequency telemetry. During ventricular pacing at a rate of 70 pulsesimin (VVT mode), the pulse generator was externally triggered by way of chest wall skin elec- trodes. The external stimuli were synchronized to the sur- face electrocardiogram (ECG) and a premature stimulus was delivered at a mean coupling interval of 515 +- 60 ms (range 460 to 600). The frequency of premature stimulation was varied from I:8 to 1:2 (bigeminy). The telemetered pressure signal was received by a programmer (Medtronic 9701). amplified and recorded on a frequency-modulated (FM) tape recorder.
Ventricular tachycardia. Twenty-one episodes of ventric- ular tachycardia were induced in 10 patients (mean age 58. I years) in the unsedated antiarrhythmic drug-free state. All but one patient had a history of prior myocardial infarction. and all patients underwent electrophysiologic testing indi- cated for the management of a spontaneous episode of ventricular tachycardia. One patient had recurrent ventric- ular tachycardia associated with arrhythmogenic right ven- tricular dysplasia. All patients had a modified pacing lead (Medtronic 6220) passed to the right ventricular apex. Ven- tricular tachycardia was induced with programmed ventric- ular extrastimuli while the patient was supine. Hemody- namic measurements were made from the onset of the ventricular tachycardia. Hemodynamic instability was de-
fined as loss of consciousness. In the event of loss of consciousness, tachycardia was terminated by pacing, en- docardial cardioversion or transthoracic cardioversion. Ten episodes of unstable ventricular tachycardia were induced in seven patients (mean age 59.1 years); I1 episodes of stable ventricular tachycardia were induced in six patients (mean age 57.8 years). Three patients had episodes of both stable and unstable ventricular tachycardia.
Ventricular fibrillation. Twenty episodes of ventricular fibrillation were observed in eight patients (six men and two women with a mean age of 45.3 years [range 22 to 761). Seven patients were studied intraoperatively and one patient was studied in the electrophysiology laboratory. Two pa- tients had marked left ventricular dysfunction, and one patient had mild left ventricular dysfunction with an ejection fraction of 50%. slight dyssynergy present on the left ven- tricular angiogram and a cardiac output of 4.6 litersimin at rest. The other five patients had normal left ventricular function as determined by echocardiographic and radionu- elide wall motion studies. The presenting cardiac arrhyth- mias in the eight patients included two episodes of ventric- ular tachycardia, 1 episode of ventricular fibrillation and five arrhythmias associated with Wolff-Parkinson-White syn- drome. The latter five patients were studied intraoperatively during surgical ablation of the accessory pathway. Two of the patients with a history of spontaneous ventricular ar- rhythmia had ventricular fibrillation induced intraoperatively as part of the procedure for defibrillator implantation. In all the patients with intraoperatively induced ventricular fibril- lation, epicardial application of 60 Hz alternative current for approximately 10 s was used to induce ventricular fibrilla- tion. One patient with ventricular tachycardia had ventricu- lar fibrillation induced by programmed stimulation in the electrophysiology laboratory using an endocardial right ven- tricular catheter.
Monitoring equipment. All patients had an endocardial pacing lead placed with its tip in the right ventricular apex (Medtronic, model 6220). This pacing lead consists of a unipolar pacing electrode and a piezoelectric bender type of pressure sensor located 3 cm proximal to the tip. The sensor is capable of measuring right ventricular pressure on a chronic basis. In the studies of ventricular tachycardia and ventricular fibrillation, the lead was modified by removal of the tines to enable temporary use. The lead was connected to an interface box (Medtronic, model 2357) and the resultant signal was amplified (Grass instruments). The pressure sig- nal was filtered with a band pass of 0.1 to 100 Hz. Among patients with ventricular fibrillation, radial arterial pressure and central venous pressure were monitored continuously in five and four patients, respectively. One surface ECG lead, the right ventricular pulse pressure. radial arterial pressure and central venous pressure were recorded on a four channel FM tape recorder (Hewlett-Packard).
650 SHARMA ET AL. JACC Vol. IS, No. 3 RIGHT VENTRICULAR PRESSURE DURING ARRHYTHMIAS March 1, 1990648-55
0t.i -_i---,--i_--d 1 I -7----i- 1
1.5 -- 8
* * * * 1-l ,' * /T, I' .I' / ,,'
,,'
o.of ’ ~-c----I--~ J 2.5 I-- ---f -1
s 2.0 -: * * * 0 t * z 1.5.:
* * .’ ,k
b? ,’
,’ F 1.0.--._ 11 d *.
0.5 “.:u__.____+___ __.. {....... f..._ _.+_..._f~.~~~“’ ”
0.0 ’ + _ . . _ ~ ~ _ ~ _ ( ~ J
CONTROL 5s 10s 15s 20s 30s END PBT5 P3OS
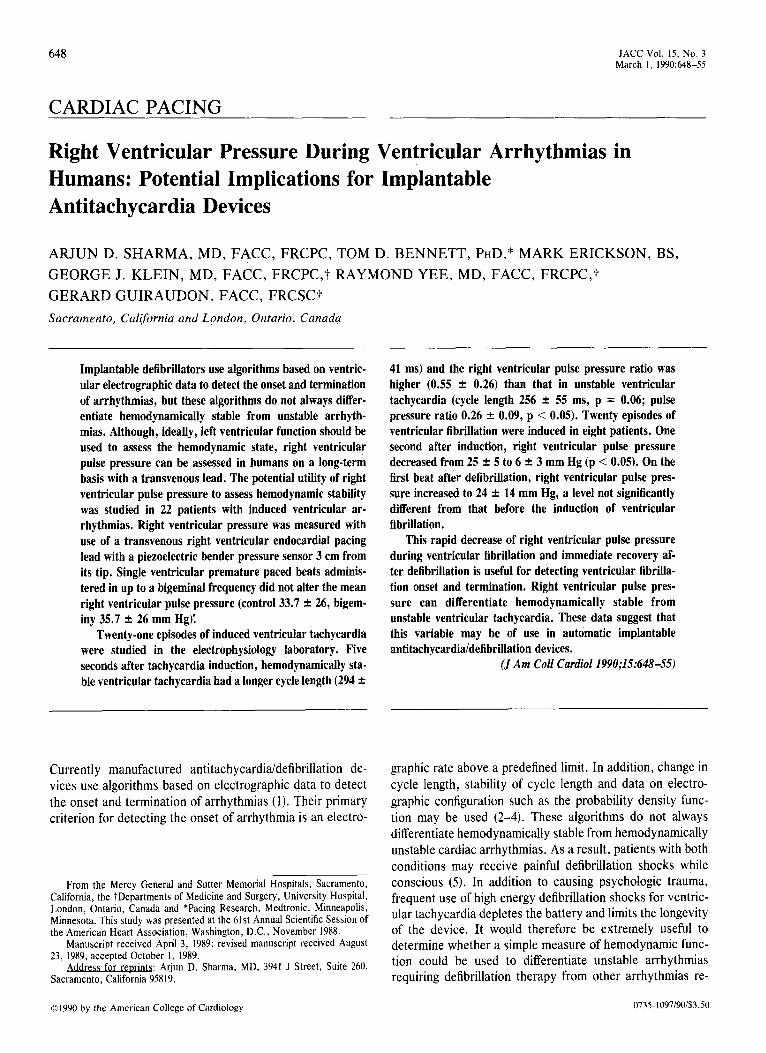
Figure 1. The effect of ventricular tachycardia on cycle length and right ventricular (RV) hemodynamics. Right ventricular pulse pres- sure is expressed as a ratio of the pretachycardia value (i.e., control = 1) (ratio pulse pressure). Similarly, right ventricular dP/dt is also expressed as a ratio (Ratio RV dP/dt). Hemodynamically stable (solid line) and hemodynamically unstable (dashed line) episodes are plotted. *p < 0.05 stable versus unstable. PBTS = post beat 5; P3OS = post 30 s.
Data analysis. All data were analyzed from strip chart recordings made at a speed of 50 mm/s. Data were measured directly and compared with the calibration pulse amplitudes for each signal. Each piezoelectric crystal was individually calibrated before use and its known calibration factor (mm Hg/mV) was then used to determine right ventricular pres- sure. Calibration pulses from the physiologic amplifier were displayed on the strip chart recorder. The amplifier produced a signal gain of 1 mV/mm on the strip chart, and with a lead calibration of approximately 0.5 mm Hg/mV, the expected resolution is <l mm Hg. Data were measured from the two cardiac cycles preceding the induction of arrhythmia
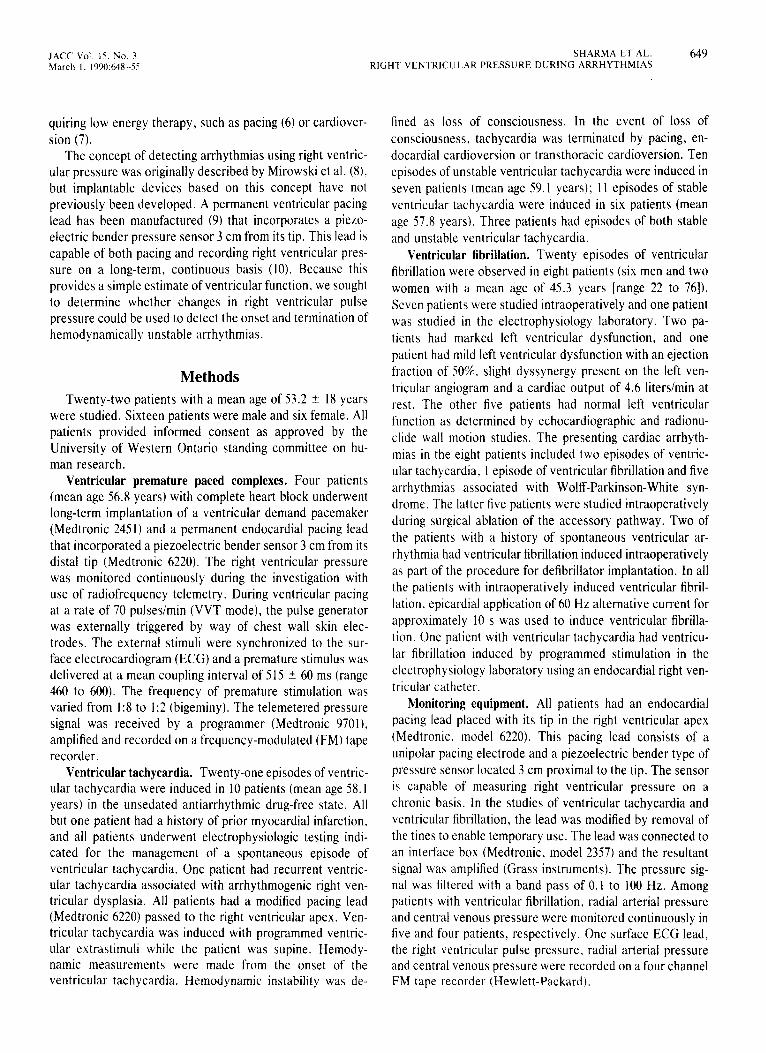
Ventricular tachycardia was induced by programmed extrastimuli and right ventricular pressure was measured at intervals as indicated in Figure 1. Ventricular fibrillation was induced with use of 30 ma of 60 Hz alternating current applied for approximately 10 s (Fig. 2). Measurements were made serially (Fig. 2), starting when the delivered current reached 30 mA. After the cessation of 60 Hz alternating current, 8 to 12 s were allowed to elapse before defibrillation was performed. Thus, the total duration of fibrillation was approximately 20 s before delivery of the defibrillating shock. After defibrillation, data were measured on the first five cardiac cycles and then all variables were measured 30 s after defibrillation. Data measured included right ventricular pulse pressure, systolic and diastolic arterial pressure and ventricular cycle length.
Variables derived from the right ventricular pressure signal included the maximal positive first derivative (dP/dt) and right ventricular pulse pressure, which was measured from the peak systolic to minimal value. To normalize the data to the pretachycardia value, right ventricular dP/dt and pulse pressure were expressed as a ratio of the initial value. That is, the baseline value was 1 and any drop in dP/dt or pulse pressure resulted in values <l. The particular sensor used accurately measures changes in right ventricular pres- sure but does not measure an absolute pressure (floating 0). To approximate the absolute value of right ventricular
Figure 2. The surface electrocardiogram (ECG) lead II, right ventricular pressure (RVP) and arte- rial pressure (AP) are shown during a typical episode of ventricular fibrillation induced by 60 Hz alternating current (30 mA). The defibrillating shock transiently distorts the surface ECG and right ventricular pressure tracing. However, the right ventricular pulse pressure can still be deter- mined. The paper speed is 10 mm/s.
JACC Vol. IS, No. 3 March I. 1990:648-S!
SHARMA ET AL. 651 RIGHT VENTRICULAR PRESSURE DURING ARRHYTHMIAS
ONSET , - -~---- - TERMINATION
PES BURST
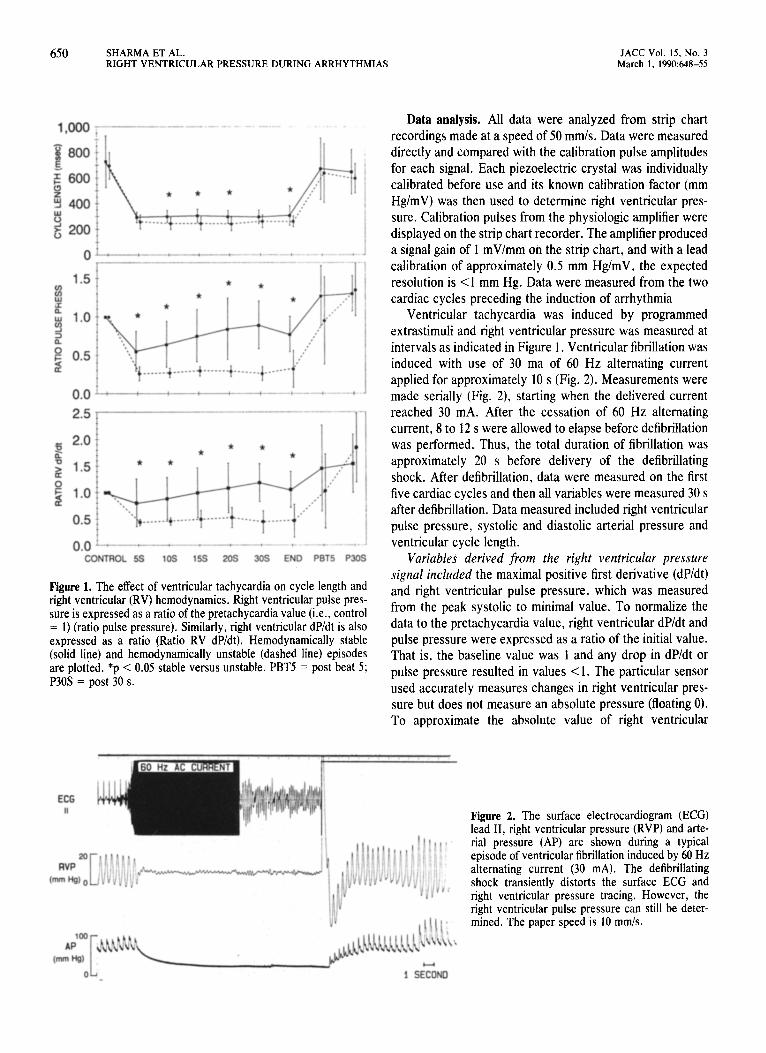
Figure 3. The surface electrocardiogram (ECG lead II) and right ventricular pressure (RVP) are shown during an episode of ventricular tachycar- dia induced by programmed electric stimulation (PES). The tracing is discontinuous as several attempts were made to terminate the tachycardia over 2 min. The termination of tachycardia is shown on the right. Note that previous burst (mm Hg) pacing had changed the tachycardia configuration and slowed the cycle length to 400 ms.
pressure, this pressure was referenced to the central venous pressure in patients with ventricular fibrillation. Mean arte- rial pressure was electronically determined with a 0.55 s time constant filter.
The manual measurements were validated in four epi- sodes of ventricu/arJihrillation with a digitizing oscilloscope (Nicolet). The calibration pulses were entered and stored on the oscilloscope: then marking cursors were moved to mea- sure points on the pressure data. Multiplying measured voltage times the calibration voltage produced values for each individual point. Minimal differences (~5%) were ob- served between the data calculated from the oscilloscope versus those obtained by manual measurement. Data are expressed as mean values -+ SD.
Results Ventricular premature paced complexes. The right ven-
tricular dP/dt during steady state right ventricular pacing was 344 + 233 mm Hgis with a pulse pressure of 33.7 ? 26.3 mm Hg. As the frequency of premature complexes was increased from 1:8 to 1:2, there was a progressive increase in dP/dt of the nonpremature beats to 413 t 328, which represented an increase of 11 2 23% and did not achieve statistical signifi- cance. Similarly, pulse pressure increased from 33.7 ? 26.3 to 43.7 2 35 mm Hg (p = NS). The dP/dt and pulse pressure of the premature complexes decreased. As a consequence, the mean dP/dt for all beats with 1:2 premature complexes (bigeminy) was 367 2 261 mm Hg and the pulse pressure was 35.7 ? 26 mm Hg, unchanged from baseline.
Ventricular tachycardia (Fig. 1). Hemodynamically sta- ble ventricular tachycardia (Fig. 3) had a slower rate than did unstable tachycardia, the difference in cycle length reaching statistical significance 10 s after tachycardia induction (sta- ble 301 t 47 ms, unstable 244 -t 47 ms, p < 0.05). However,
- 1 SECONO
the cycle length for stable ventricular tachycardia at 5 s ranged from 235 to 381 ms and for unstable tachycardia ranged from 202 to 351 ms. As a consequence, there was considerable overlap between the two groups. However, the pulse pressure decreased significantly from 45.7 + 17.8 mm Hg during sinus rhythm to 12.9 * 6.6 mm Hg (p < 0.05) 5 s after ventricular tachycardia onset in hemodynamically un- stable episodes (Fig. 4). At 5 s, and for all intervals thereaf- ter, the ratio of the pulse pressure to control value was significantly different between stable and unstable episodes, with hemodynamically unstable episodes having a lower pulse pressure ratio (5 s stable 0.55 2 0.26, unstable 0.26 + 0.09, p < 0.05). Only episodes of stable ventricular tachy- cardia showed a progressive trend for pulse pressure to recover toward pretachycardia levels. At 5 s after induction of tachycardia, there was overlap of the ratio of pulse pressure in only three episodes of tachycardia and by 30 s there was no overlap between stable and unstable episodes of tachycardia.
The ratio of right ventricular dPldt during tachycardia to normal sinus rhythm was also determined. Again there were significant differences between stable and unstable episodes of ventricular tachycardia at all time intervals (5 s, stable 0.81 2 0.45, unstable 0.44 i 0.06, p < 0.05). Right ventric- ular dP/dt also tended to recover to control (sinus rhythm) levels during 30 s of stable ventricular tachycardia but remained constantly low in unstable ventricular tachycardia. Right ventricular dP/dt demonstrated poorer discrimination of hemodynamic stability than did pulse pressure because there was overlap of at least one episode of tachycardia at all intervals.
Ventricular fibrillation. Ventricular fibrillation was initi- ated by 60 Hz alternating current in 19 of 20 episodes and by programmed electrical stimulation in one. In all instances, electric current resulted in the surface ECG and was accom-
652 SHARMA ET AL. RIGHT VENTRICULAR PRESSU:; ‘; DURING ARRHYTHMIAS
JACC Vol. 15, No. 3 March 1, 1990:648-S
E;G
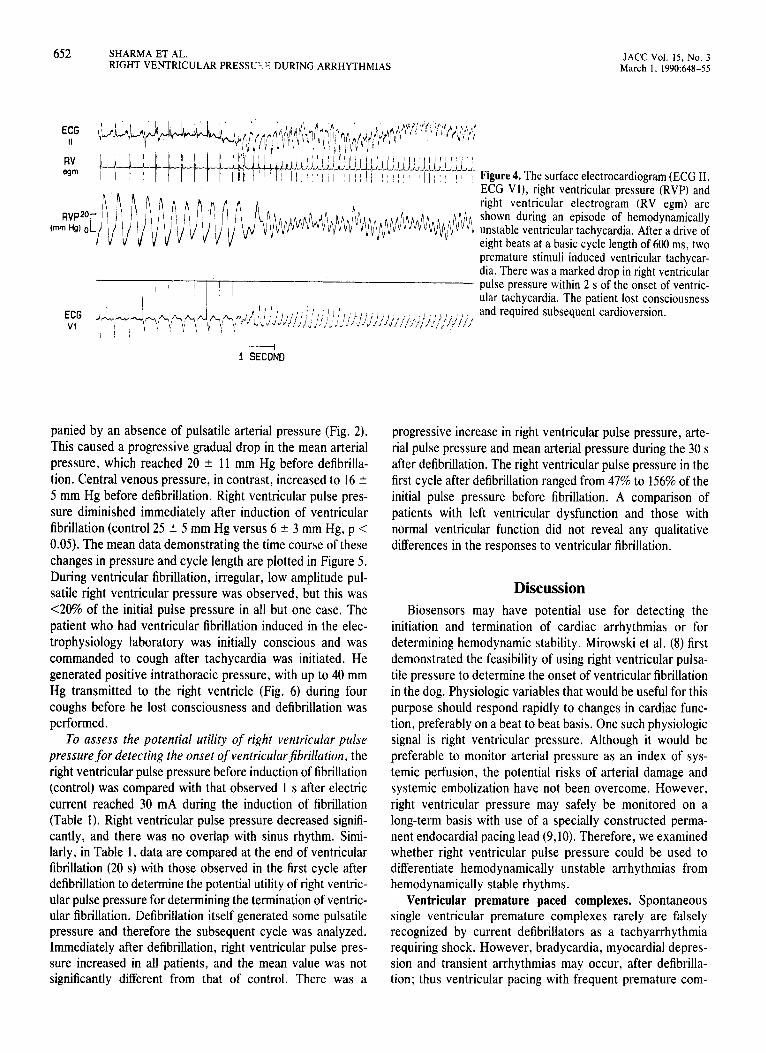
RV em Figure 4. The surface electrocardiogram (ECG II,
ECG Vl), right ventricular pressure (RVP) and right ventricular electrogram (RV egm) are shown during an episode of hemodynamically unstable ventricular tachycardia. After a drive of eight beats at a basic cycle length of 600 ms, two premature stimuli induced ventricular tachycar- dia. There was a marked drop in right ventricular pulse pressure within 2 s of the onset of ventric- ular tachycardia. The patient lost consciousness and required subsequent cardioversion.
panied by an absence of pulsatile arterial pressure (Fig. 2). This caused a progressive gradual drop in the mean arterial pressure, which reached 20 ? 11 mm Hg before defibrilla- tion. Central venous pressure, in contrast, increased to 16 2 5 mm Hg before defibrillation. Right ventricular pulse pres- sure diminished immediately after induction of ventricular fibrillation (control 25 + 5 mm Hg versus 6 t 3 mm Hg, p < 0.05). The mean data demonstrating the time course of these changes in pressure and cycle length are plotted in Figure 5. During ventricular fibrillation, irregular, low amplitude pul- satile right ventricular pressure was observed, but this was <20% of the initial pulse pressure in all but one case. The patient who had ventricular fibrillation induced in the elec- trophysiology laboratory was initially conscious and was commanded to cough after tachycardia was initiated. He generated positive intrathoracic pressure, with up to 40 mm Hg transmitted to the right ventricle (Fig. 6) during four coughs before he lost consciousness and defibrillation was performed.
To assess the potential utility of right ventricular pulse pressure for detecting the onset of ventricularjbrillation, the right ventricular pulse pressure before induction of fibrillation (control) was compared with that observed 1 s after electric current reached 30 mA during the induction of fibrillation (Table 1). Right ventricular pulse pressure decreased signifi- cantly, and there was no overlap with sinus rhythm. Simi- larly, in Table 1, data are compared at the end of ventricular fibrillation (20 s) with those observed in the first cycle after defibrillation to determine the potential utility of right ventric- ular pulse pressure for determining the termination of ventric- ular fibrillation. Defibrillation itself generated some pulsatile pressure and therefore the subsequent cycle was analyzed. Immediately after defibrillation, right ventricular pulse pres- sure increased in all patients, and the mean value was not significantly different from that of control. There was a
progressive increase in right ventricular pulse pressure, arte- rial pulse pressure and mean arterial pressure during the 30 s after defibrillation. The right ventricular pulse pressure in the first cycle after defibrillation ranged from 47% to 156% of the initial pulse pressure before fibrillation. A comparison of patients with left ventricular dysfunction and those with normal ventricular function did not reveal any qualitative differences in the responses to ventricular fibrillation.
Discussion Biosensors may have potential use for detecting the
initiation and termination of cardiac arrhythmias or for determining hemodynamic stability. Mirowski et al. (8) first demonstrated the feasibility of using right ventricular pulsa- tile pressure to determine the onset of ventricular fibrillation in the dog. Physiologic variables that would be useful for this purpose should respond rapidly to changes in cardiac func- tion, preferably on a beat to beat basis. One such physiologic signal is right ventricular pressure. Although it would be preferable to monitor arterial pressure as an index of sys- temic perfusion, the potential risks of arterial damage and systemic embolization have not been overcome. However, right ventricular pressure may safely be monitored on a long-term basis with use of a specially constructed perma- nent endocardial pacing lead (9,lO). Therefore, we examined whether right ventricular pulse pressure could be used to differentiate hemodynamically unstable arrhythmias from hemodynamically stable rhythms.
Ventricular premature paced complexes. Spontaneous single ventricular premature complexes rarely are falsely recognized by current defibrillators as a tachyarrhythmia requiring shock. However, bradycardia, myocardial depres- sion and transient arrhythmias may occur, after defibrilla- tion; thus ventricular pacing with frequent premature com-
JACC Vol. 1s. No. 3 March I, 1990:648-55
SHARMA ET AL. 653 RIGHT VENTRICULAR PRESSURE DURING ARRHYTHMIAS
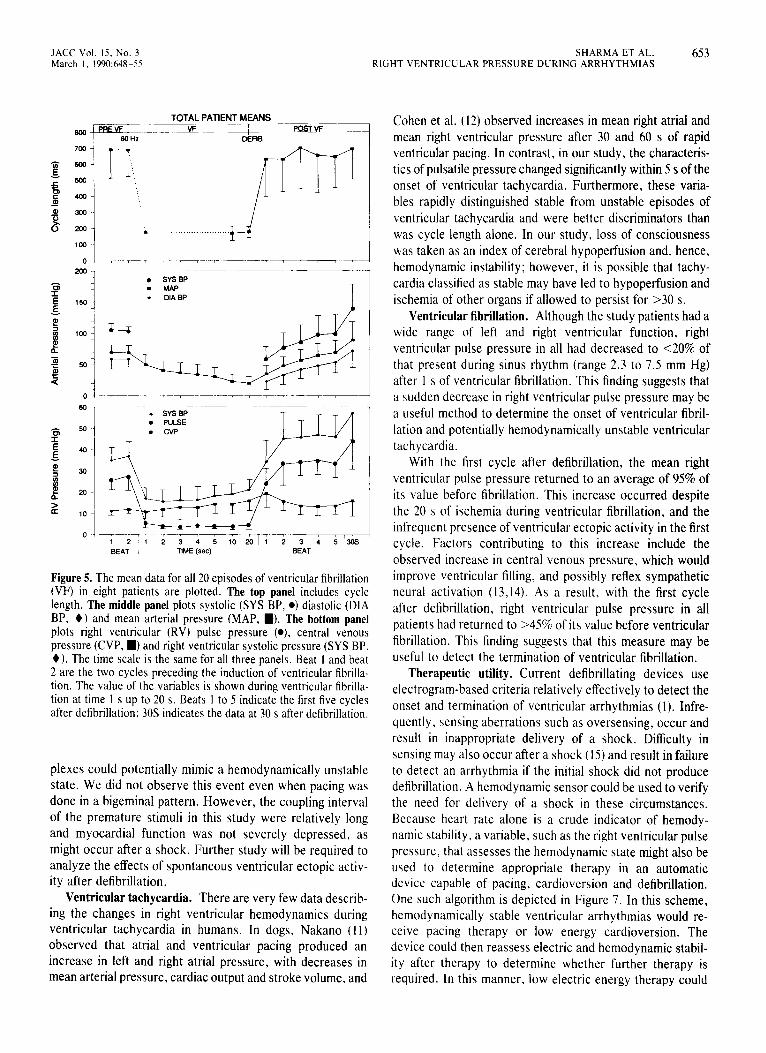
. SYSBP
. PULSE
. CVP
Figure 5. The mean data for all 20 episodes of ventricular fibrillation (VF) in eight patients are plotted. The top panel includes cycle length. The middle panel plots systolic (SYS BP, 0) diastolic (DIA BP, +) and mean arterial pressure (MAP, I). The bottom panel plots right ventricular (RV) pulse pressure (0) central venous pressure (CVP, I) and right ventricular systolic pressure (SYS BP, +). The time scale is the same for all three panels. Beat I and beat 2 are the two cycles preceding the induction of ventricular fibrilla- tion. The value of the variables is shown during ventricular fibrilla- tion at time I s up to 20 s. Beats I to 5 indicate the first five cycles after defibrillation: 30s indicates the data at 30 s after defibrillation.
plexes could potentially mimic a hemodynamically unstable state. We did not observe this event even when pacing was done in a bigeminal pattern. However, the coupling interval of the premature stimuli in this study were relatively long and myocardial function was not severely depressed, as might occur after a shock. Further study will be required to analyze the effects of spontaneous ventricular ectopic activ- ity after defibrillation.
Ventricular tachycardia. There are very few data describ- ing the changes in right ventricular hemodynamics during ventricular tachycardia in humans. In dogs, Nakano (I I) observed that atria1 and ventricular pacing produced an increase in left and right atria1 pressure, with decreases in mean arterial pressure, cardiac output and stroke volume, and
Cohen et al. (12) observed increases in mean right atrial and mean right ventricular pressure after 30 and 60 s of rapid ventricular pacing. In contrast, in our study, the characteris- tics of pulsatile pressure changed significantly within 5 s of the onset of ventricular tachycardia. Furthermore, these varia- bles rapidly distinguished stable from unstable episodes of ventricular tachycardia and were better discriminators than was cycle length alone. In our study, loss of consciousness was taken as an index of cerebral hypoperfusion and, hence, hemodynamic instability; however, it is possible that tachy- cardia classified as stable may have led to hypoperfusion and ischemia of other organs if allowed to persist for >30 s.
Ventricular fibrillation. Although the study patients had a wide range of left and right ventricular function, right ventricular pulse pressure in all had decreased to ~20% of that present during sinus rhythm (range 2.3 to 7.5 mm Hg) after I s of ventricular fibrillation. This finding suggests that a sudden decrease in right ventricular pulse pressure may be a useful method to determine the onset of ventricular fibril- lation and potentially hemodynamically unstable ventricular tachycardia.
With the first cycle after defibrillation, the mean right ventricular pulse pressure returned to an average of 95% of its value before fibrillation. This increase occurred despite the 20 s of ischemia during ventricular fibrillation, and the infrequent presence of ventricular ectopic activity in the first cycle. Factors contributing to this increase include the observed increase in central venous pressure, which would improve ventricular filling, and possibly reflex sympathetic neural activation (13,14). As a result, with the first cycle after defibrillation, right ventricular pulse pressure in all patients had returned to >45% of its value before ventricular fibrillation. This finding suggests that this measure may be useful to detect the termination of ventricular fibrillation.
Therapeutic utility. Current defibrillating devices use electrogram-based criteria relatively effectively to detect the onset and termination of ventricular arrhythmias (1). Infre- quently, sensing aberrations such as oversensing, occur and result in inappropriate delivery of a shock. Difficulty in sensing may also occur after a shock (15) and result in failure to detect an arrhythmia if the initial shock did not produce defibrillation. A hemodynamic sensor could be used to verify the need for delivery of a shock in these circumstances. Because heart rate alone is a crude indicator of hemody- namic stability, a variable, such as the right ventricular pulse pressure, that assesses the hemodynamic state might also be used to determine appropriate therapy in an automatic device capable of pacing, cardioversion and defibrillation. One such algorithm is depicted in Figure 7. In this scheme, hemodynamically stable ventricular arrhythmias would re- ceive pacing therapy or low energy cardioversion. The device could then reassess electric and hemodynamic stabil- ity after therapy to determine whether further therapy is required. In this manner, low electric energy therapy could
654 SHARMA ET AL. RIGHT VENTRICULAR PRESSURE DURING ARRHYTHMIAS
JACC Vol. 15, No. 3 March 1, 1990:648-55
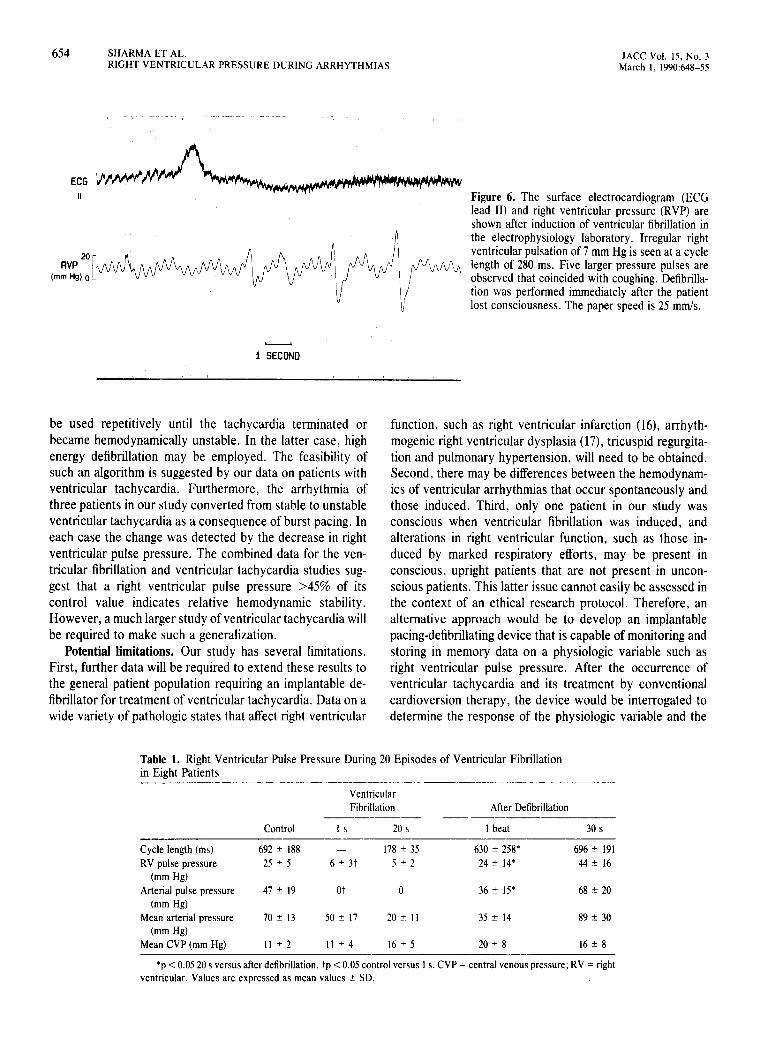
Figure 6. The surface electrocardiogram (ECG lead II) and right ventricular pressure (RVP) are shown after induction of ventricular fibrillation in the electrophysiology laboratory. Irregular right ventricular pulsation of 7 mm Hg is seen at a cycle length of 280 ms. Five larger pressure pulses are observed that coincided with coughing. Defibrilla- tion was performed immediately after the patient lost consciousness. The paper speed is 25 mm/s.
be used repetitively until the tachycardia terminated or became hemodynamically unstable. In the latter case, high energy defibrillation may be employed. The feasibility of such an algorithm is suggested by our data on patients with ventricular tachycardia. Furthermore, the arrhythmia of three patients in our study converted from stable to unstable ventricular tachycardia as a consequence of burst pacing. In each case the change was detected by the decrease in right ventricular pulse pressure. The combined data for the ven- tricular fibrillation and ventricular tachycardia studies sug- gest that a right ventricular pulse pressure >45% of its control value indicates relative hemodynamic stability. However, a much larger study of ventricular tachycardia will be required to make such a generalization.
Potential limitations. Our study has several limitations. First, further data will be required to extend these results to the general patient population requiring an implantable de- fibrillator for treatment of ventricular tachycardia. Data on a wide variety of pathologic states that affect right ventricular
function, such as right ventricular infarction (16), arrhyth- mogenic right ventricular dysplasia (17), tricuspid regurgita- tion and pulmonary hypertension, will need to be obtained. Second, there may be differences between the hemodynam- its of ventricular arrhythmias that occur spontaneously and those induced. Third, only one patient in our study was conscious when ventricular fibrillation was induced, and alterations in right ventricular function, such as those in- duced by marked respiratory efforts, may be present in conscious, upright patients that are not present in uncon- scious patients. This latter issue cannot easily be assessed in the context of an ethical research protocol. Therefore, an alternative approach would be to develop an implantable pacing-defibrillating device that is capable of monitoring and storing in memory data on a physiologic variable such as right ventricular pulse pressure. After the occurrence of ventricular tachycardia and its treatment by conventional cardioversion therapy, the device would be interrogated to determine the response of the physiologic variable and the
Table 1. Right Ventricular Pulse Pressure During 20 Episodes of Ventricular Fibrillation in Eight Patients - -._-...--_- ---- ~-.--
Ventricular Fibrillation After Defibrillation
-__-__I Control Is 20 s 1 beat 30 s
_-______ -~-- --___i Cycle length (ms) 692 I 188 - 178 t 35 630 * 258* 696 + 191 RV pulse pressure 25 + 5 6 ” 3t 5+2 24 ? 14* 44 2 16
(mm Hg) Arterial pulse pressure 47 + 19 ot 0 36 ? IS* 68 If: 20
(mm Hg) Mean arterial pressure 70+ 13 50 + 17 20+ 11 35 ? 14 89 2 30
(mm Hg) Mean CVP (mm Hg) 11 +2 11 k4 16 ? 5 20 + 8 16 k 8
-.-- - *p < 0.05 20 s versus after defibrillation. tp < 0.05 control versus 1 s. CVP = central venous pressure; RV = right
ventricular. Values are expressed as mean values + SD.
JACC Vol. 15, No. 3 SHARMA ET AL. 655 March I. 1990:648-55 RIGHT VENTRICULAR PRESSURE DURING ARRHYTHMIAS
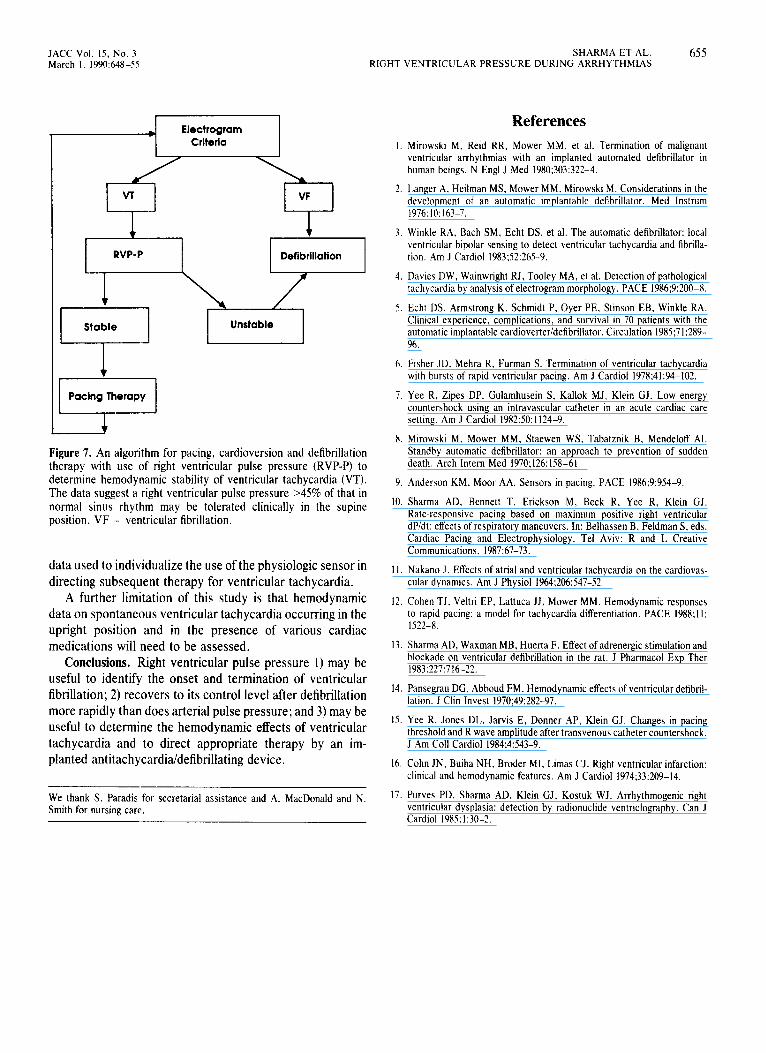
T b Electrogram
Criteria
Figure 7. An algorithm for pacing, cardioversion and defibrillation therapy with use of right ventricular pulse pressure (RVP-P) to determine hemodynamic stability of ventricular tachycardia (VT). The data suggest a right ventricular pulse pressure ~45% of that in normal sinus rhythm may be tolerated clinically in the supine position. VF = ventricular fibrillation.
data used to individualize the use of the physiologic sensor in directing subsequent therapy for ventricular tachycardia.
A further limitation of this study is that hemodynamic data on spontaneous ventricular tachycardia occurring in the upright position and in the presence of various cardiac medications will need to be assessed.
Conclusions. Right ventricular pulse pressure 1) may be useful to identify the onset and termination of ventricular fibrillation; 2) recovers to its control level after defibrillation more rapidly than does arterial pulse pressure; and 3) may be useful to determine the hemodynamic effects of ventricular tachycardia and to direct appropriate therapy by an im- planted antitachycardia/defibrillating device.
We thank S. Paradis for secretarial assistance and A. MacDonald and N. Smith for nursing care.
References
I. Mirowski M, Reid RR, Mower MM, et al. Termination of malignam ventricular arrhythmias with an implanted automated defibrillator in human beings. N Engl J Med 1980;303:322-4.
7. Langer A, Heilman MS, Mower MM. Mirowski M. Considerations in the development of an automatic implantable defibrillator. Med Instrum 1976:10:163-7.
3. Winkle RA. Bach SM, Echt DS, et al. The automatic defibrillator: local ventricular bipolar sensing to detect ventricular tachycardia and fibtilla- tion. Am J Cardiol 1983;52:265-9.
4. Davies DW, Wainwright RJ, Tooley MA, et al. Detection of pathological tachycardia by analysis of electrogram morphology. PACE 1986:9:200-S.
5. Echt DS, Armstrong K, Schmidt P. Oyer PE. Stinson EB, Winkle RA. Clinical experience, complications, and survival in 70 patients with the automatic implantable cardioverteridefibrillator. Circulation 1985;71:289- 96.
6. Fisher JD. Mehra R. Furman S. Termination of ventricular tachycardia with bursts of rapid ventricular pacing. Am J Cardiol 1978;41:94-102.
7. Yee R, Zipes DP. Gulamhusein S. Kallok MJ, Klein GJ. Low energy countershock using an intravascular catheter in an acute cardiac care setting. Am J Cardiol 1982:50: 1124-9.
8. Mirowski M. Mower MM, Staewen WS, Tabatznik B. Mendeloff Al. Standby automatic defibrillator: an approach to prevention of sudden death. Arch Intern Med 1970;126:158-61.
9. Anderson KM. Moor AA. Sensors in pacing. PACE 1986;9:954-9.
I I. Nakano J. Effects of atrial and ventricular tachycardia on the cardiovas- cular dynamics. Am J Physiol 1964;206:547-52.
IO. Sharma AD. Bennett T, Erickson M, Beck R, Yee R, Klein GJ. Rate-responsive pacing based on maximum positive right ventricular dP/dt: effects of respiratory maneuvers. In: Belhassen B, Feldman S, eds. Cardiac Pacing and Electrophysiology. Tel Aviv: R and L Creative Communications. 1987:67-73.
I?. Cohen TJ. Veltri EP, Lattuca JJ, Mower MM. Hemodynamic responses to rapid pacing: a model for tachycardia differentiation. PACE 1988;l I: 1522-S.
13. Sharma AD, Waxman MB, Huerta F. Effect of adrenergic stimulation and blockade on ventricular defibrillation in the rat. J Pharmacol Exp Ther 1983:227:716-22,
14. Pansegrau DG, Abboud FM. Hemodynamic effects of ventricular defibril- lation. J Clin Invest 1970;49:282-97.
15. Yee R, Jones DL. Jarvis E, Donner AP, Klein GJ. Changes in pacing threshold and R wave amplitude after transvenous catheter countershock. J Am Coll Cardiol 1984;4:543-9.
16. Cohn JN. Buiha NH, Broder MI, Limas CJ. Right ventricular infarction: clinical and hemodynamic features. Am J Cardiol 1974;33:209-14.
17. Purves PD. Sharma AD. Klein GJ, Kostuk WJ. Arrhythmogenic right ventricular dysplasia: detection by radionuclide ventriclography. Can J Cardiol 1985:1:30-2.