rhyme generation in deaf students: the effect of exposure to cued speech
TRANSCRIPT

Rhyme Generation in Deaf Students The Effect of Exposure to
Cued Speech
Carol LaSassoKelly CrainGallaudet University
Jacqueline LeybaertFree University of Brussels
Correspondence should be sent to Carol LaSasso Department of Audi-ology and Speech-Language Pathology Fowler Hall Gallaudet Univer-sity 800 Florida Avenue Washington DC 20002 (e-mail carollasassogallaudetedu)
This study compares the rhyme-generation ability of deaf par-ticipants with severe to profound hearing losses from cuedspeech (CS) and non-cued speech (NCS) backgrounds witha hearing comparison group for consistent orthography-to-phonology (O-P) rhyming elements or rimes (eg -ailin sail is always pronounced the same) and inconsistentorthography-to-phonology (I-O-P) rhyming elements wherethe orthographic rime (eg -ear) has different pronunciationsin words such as bear and rear Rhyming accuracy was betterfor O-P target words than for I-O-P target words The per-formance of the deaf participants from CS backgroundsalthough falling between that of the hearing and the NCSgroups did not differ significantly from that of the hearinggroup By contrast the performance of the NCS group waslower than that of the hearing group Hearing and CS parti-cipants produced more orthographically different responses(eg blue-few) whereas participants from the NCS groupproduced more responses that are orthographically similar(eg blue-true) indicating that the hearing and CS groups relymore on phonology and the NCS group more on spelling togenerate rhymes The results support the use of cued speechfor developing phonological abilities of deaf students to pro-mote their reading abilities
Recently in the educational field there has been a resur-gence of emphasis on the development of phonologicalabilities in hearing students This phenomenon is re-lated in large part to the substantial body of researchcorrelating phonological awareness (including rhym-ing) in young hearing children with their subsequentreading achievement (Bradley 1988 Bradley amp Bryant
1983 1985 Bryant MacLean amp Bradley 1990 BryantMacLean Bradley amp Crossland 1990 Ellis amp Large1987 Lundberg Olofsson amp Wall 1980 MacLeanBryant amp Bradley 1987) Specifically phonologicalawareness tasks (eg rhyming) have been shown to havea causal link to subsequent reading achievement in hear-ing individuals (Bryant MacLean amp Bradley 1990)
In hearing children the ability to produce and judgerhymes spontaneously is already present between 2 and3 years of age (Read 1978 Slobin 1978) with some in-dividual differences linked to the quality of their oralproductions (Webster amp Plante 1995) Rhyming abilityusually emerges spontaneously as a result of natural lin-guistic development and before any contact with liter-acy (Morais Bertelson Cary amp Alegria 1986) Theprocesses used for rhyming seem to change with the ac-quisition of literacy whereas preliterate children detectrhymes on the basis of global phonological similarityfirst-graders pay more attention to phonemes (Cardoso-Martins 1994 Lenel amp Cantor 1981)
Research related to phonological abilities of deafstudents from oral or signing backgrounds (Campbellamp Wright 1988 Dodd amp Hermelin 1977 Hanson ampFowler 1987 Hanson amp McGarr 1989 Parasnis 1996)taken collectively suggests that deaf students with severeto profound hearing losses (ie 70 dB or greater unaidedpure tone average) from oral or signing backgroundsare able to develop phonological abilities although at alevel lower than that of hearing peers Furthermore re-search findings suggest that rhyming judgments of deafstudents are strongly influenced by spelling similar-
Journal of Deaf Studies and Deaf Education vol 8 no 3 copy Oxford University Press 2003 all rights reserved DOI 101093deafedeng014
by guest on July 13 2011jdsdeoxfordjournalsorg
Dow
nloaded from
ity (Campbell amp Wright 1988 Hanson amp Fowler 1987Hanson amp McGarr 1989) as well as by articulatory sim-ilarity detected by speechreading (Charlier amp Leybaert2000 Dodd amp Hermelin 1977 Hanson amp McGarr 1989)
Hanson and McGarr (1989) conducted one of the fewrhyme-generation tasks involving college-age deaf read-ers Participants for that study consisted of 15 congeni-tally deaf undergraduate students at Gallaudet Universityincluding 8 participants with two deaf parents No infor-mation was provided about communication backgroundprior to coming to Gallaudet however it can be presumedthat all participants were currently using signs to commu-nicate because Gallaudet University is a bilingual univer-sity using American Sign Language (ASL) and Englishwith a communication policy that includes direct visualcommunication Participants were given a list of 49 targetsand asked to write as many responses as possible thatrhymed with the targets Data analysis consisted of clas-sifying responses as correct or incorrect and dividing cor-rect responses into orthographically similar and ortho-graphically different responses Incorrect responses weredivided into four error categories and tabulated Thosecategories included vowel errors (ie responses that hadthe same vowel as the targets but did not rhyme such aspail-pay) orthographic errors (ie responses in whichthe final spelling pattern was the same as the target suchas bear-dear) speech-related errors (ie responses thatwould look similar to the target on the lips of the speakersuch as one-want) and unclassified errors Hanson andMcGarr (1989) found that approximately 50 of deafparticipantsrsquo responses correctly rhymed with the tar-gets Of those there were more orthographically sim-ilar responses (eg blue-true 365 of total responses)than orthographically dissimilar responses (eg blue-few 157 of total responses)
Three conclusions emerged from these data Firstas Hanson and McGarr (1989) noted ldquoorthographicallydifferent responses represent the clearest case for rhymegeneration because the participant cannot have gener-ated this response based on the orthographic represen-tation of the wordrdquo (p 4) The presence of orthographi-cally dissimilar correct responses thus suggests that deafparticipants had developed an ability to identify rhymesindependent of orthographic similarity Consistent withthis conclusion was the fact that many of the incorrectresponses had the same vowel sound as the target (eg
pail-pay) and thus can be considered to be approximaterhymes Second the high proportion of orthographi-cally similar rhyming responses (eg blue-true) indi-cated that orthographic properties of written wordsweigh heavily in deaf participantsrsquo judgments of rhymeThe error analysis which shows that half of the incor-rect responses had some orthographic similarity to thetarget (eg eight-right bear-dear) supports this viewThird these deaf participants also generated rhymeresponses on the basis of speech information that isvisual characteristics of the words on the speakersrsquo lips(see Dodd amp Hermelin 1977 for a similar view) or thecharacteristics of their own productions Some errors(eg red-ran) were explained in terms of visibility andother errors (eg phone-phony blue-balloon) suggestedintrusion of segments in the speech of the participantsFinally despite no available control data it seems obvi-ous that these deaf participants were not able to gener-ate words at the level expected of hearing peers of thesame reading age If the errors made by deaf individualsin rhyme-generation tasks originate in speech-readingas a partial coding of the phonemic contrasts it followsthat any system that makes visible all the phonologicalcontrasts of a given language should be able to generatephonological representations suitable for rhyme pro-cessing One of these systems using manual clues to dis-ambiguate speechreading is Cued Speech (CS)
Cued Speech (CS) developed by Orin Cornett in1966 and adapted to more than 56 languages and majordialects (Cornett 1994) is neither a language nor a man-ually coded English system that uses ASL signs in En-glish word order Instead CS is a mode of communicationfor visually conveying traditionally spoken languages atthe phonemic level (the same linguistic level conveyed viaspeech to hearing individuals) The American Englishform of CS uses eight handshapes corresponding togroups of consonants and four hand placements to con-vey vowels and diphthongs (see Figure 1) The differentplacements and handshapes combined with nonmanualsignals (eg mouth shapes) clearly distinguish the 40 orso phonemes of English For example the bilabials pb and m are visually indistinguishable withoutvoice for hearing individuals or without cues to deaf indi-viduals however they are readily differentiated by deafindividuals when cued
Because CS distinguishes between and among the
Rhyming Abilities of Deaf Students 251
by guest on July 13 2011jdsdeoxfordjournalsorg
Dow
nloaded from
40 or so phonemes and resulting syllables cueing alsoprovides access to morphemes syntactic structures andsociolinguistic information related to the languageincluding rhyming alliteration onomatopoeia accentsand dialects (Cornett amp Daisey 1992 Kipila amp Williams-Scott 1990 LaSasso amp Metzger 1998) By using hand-shapes hand placements and nonmanual signals CS
has been shown to enable deaf individuals to obtain thesame linguistic and paralinguistic information visuallythat hearing individuals obtain auditorially (AlegriaCharlier amp Mattys 1999 Hage Alegria amp Perier 1990Nicholls amp Ling 1982 Perier Charlier Hage amp Ale-gria l988 Tammasaeng 1985)
Recent research findings related to CS indicate thatdeaf individuals from early and intensive CS back-grounds perform more like hearing peers in rhymejudgment tasks than do deaf peers from oral or signingbackgrounds (Charlier amp Leybaert 2000) The sameauthors asked participants to generate rhyming re-sponses for written French targets that had either con-sistent orthography-to-phonology (O-P) rimes or in-consistent orthography-to-phonology (I-O-P) rimesExamples of O-P rhyming elements or rimes are -eeland -ote In all monosyllabic English words when -eelor -ote appear as rimes they have consistent pronun-ciations meaning a single pronunciation Examples ofrimes with I-O-P in English are -ere and -ood In En-glish the rime -ere has a different pronunciation in merethan in were and the rime -ood has a different pronun-ciation in wood than in blood (Ziegler Stone amp Jacobs1997) The interest in the O-P versus I-O-P variablewas the following If deaf participants were to take ashortcut and generate rhyming responses that havethe same orthographic rime as the target word theywould obtain a high level of correct response for O-Ptargets but a low level of correct response for I-O-Ptargets
The results reported by Charlier and Leybaert(2000) showed that early CS users achieved a higherpercentage of correct responses than did late CS usersalthough a lower percentage than the hearing group andproduced many more orthographically dissimilar rhym-ing responses (411 of the total of the responses) thanthe late CS group (239 of the total of their re-sponses) Unexpectedly however the early CS groupshowed a consistency effect (122) which althoughlower than that observed for the late CS group (155)was higher than that displayed by the hearing controlgroup (04) This could be interpreted as indicatingthat orthography is more important in their rhymingabilities than it is for hearing children A more detaileddiscussion of this was presented by Charlier and Ley-baert (2000)
252 Journal of Deaf Studies and Deaf Education 83 Summer 2003
Figure 1 Cued Speech handshapes and placements
by guest on July 13 2011jdsdeoxfordjournalsorg
Dow
nloaded from
Purpose of the Study
The purpose of this study was to determine whether ex-posure to Cued Speech is a variable that can explainrhyming abilities of older deaf students by using amethodology similar to that employed by Hanson andMcGarr (1989) This study however differs from theHanson and McGarr study in several respects Firstthis study compared two groups of deaf participantsthat varied according to linguistic input related to tradi-tionally spoken English (ie cued English or non-cuedEnglish) Second the set of targets used by Hanson andMcGarr was split in two sets based on the statisticalanalysis provided by Ziegler Stone and Jacobs (1997)The first set consisted of O-P targets with rhymingelements (or rimes) that have consistent pronuncia-tions in all English monosyllabic words The second setconsisted of targets with I-O-P rhyming elements (orrimes) meaning that not all English words ending withthe particular rhyming element necessarily rhyme withthe targets Third whereas Hanson and McGarr (1989)used a reading comprehension measure that was not de-signed for deaf students (the Gates-MacGinitie Read-ing Comprehension Test [1969]) this study employedthe 1996 Reading Comprehension Subtest of the 1996Stanfordndash9 Achievement Test (SAT-9) that has beenspecifically modified for use with deaf students Finallyunlike the Hanson and McGarr (1989) study this studyincluded a control group consisting of participants withnormal hearing who were matched for age and readinglevel with deaf participants
This study was designed to provide additionalneeded insight into phonological abilities of deaf stu-dents for researchers and practitioners working withdeaf students Specifically participants who are usingorthographic information to generate rhyme responsescould get correct responses for the O-P targets (eg truefor the target blue) however using this strategy theywould get incorrect responses for the I-O-P targets (egrear for the target bear) They would show a consistencyeffect (better performance for O-P targets than forI-O-P targets) If however participants relied on pho-nological information to generate rhyme responses theycould produce correct responses both for the O-P and I-O-P targets thus not showing a consistency effect Inaddition this study classified correct responses as either
orthographically similar (O-S) or orthographicallydifferent (O-D) as did the Hanson and McGarr study(1989) Orthographically different correct rhyming re-sponses (eg bear for the target hair) would providecompelling evidence that counter-intuitively deaf indi-viduals are able to appreciate rhyme at a phonologicallevel and possibly develop other phonological abilitiesrelated to phonological recoding and phonics that arecomparable to those of hearing peers and would be help-ful for reading development
Research Questions and Hypotheses
The following research questions are addressed in thisstudy
1 Does the level of accuracy on rhyme-generationtasks differ for the following groups of participants whoare matched on both age and reading level participantswith normal hearing deaf participants from CS back-grounds and deaf participants from NCS backgrounds
2 Is there an effect of orthography-to-phonologyrime consistency and does this effect interact withgroups (hearing CS NCS)
3 Does the nature of correct responses (ortho-graphically similar or dissimilar) differ in the threegroups (hearing CS NCS)
4 Is there a relationship between reading abilityand rhyme generation
5 Do the analyses of errors indicate differences be-tween hearing CS and NCS participants How do theresults of CS participants and the results of the NCSparticipants parallel those of the Hanson and McGarr(1989) participants
It was hypothesized that there would be (a) a signifi-
cant effect of group with hearing = CS gt NCS or hear-ing gt CS gt NCS and (b) a significant effect of phonology-to-orthography consistency with O-P items leading tomore correct rhyming responses than I-O-P items and asignificant interaction between group and the effect ofconsistency The NCS group was expected to show alarger effect of consistency than both the hearing andCS groups the CS group was expected to show a largereffect of consistency than the hearing group In addi-tion we expected that although all groups would attemptto generate orthographically different responses more
Rhyming Abilities of Deaf Students 253
by guest on July 13 2011jdsdeoxfordjournalsorg
Dow
nloaded from
correct responses that are orthographically different thanorthographically similar were expected for the hearingand the CS groups (see Charlier amp Leybaert 2000) forthe NCS group more O-S than O-D responses wereexpected (see Hanson amp McGarr 1989) We also ex-pected a correlation between reading ability andrhyming More specifically reading ability should cor-relate with the ability to generate correct rhymes in re-sponse to I-O-P words and to generate orthographicallydissimilar rhymes (see Campbell amp Wright 1988 Ley-baert 1993 for a review) Further we expected to ob-serve different error patterns that is we expected thatmore errors based on phonological information wouldbe observed in the hearing group and possibly in the deafCS group whereas more errors based on orthographicinformation would be observed in the NCS group Fi-nally we expected that the results of the NCS partici-pants would be similar to the results achieved by the col-lege students communicating primarily through signlanguage tested by Hanson and McGarr (1989) and thatthe results from the CS participants would differ more
Method
Participants
Participants included 20 prelingually deaf participantswho reported that they had either severe or profoundhearing losses and 10 hearing participants Unfortu-nately we did not have access to the precise decibel levelof hearing loss of each of the deaf participants Of thedeaf participants 10 came from CS backgrounds inwhich they had early exposure to CS both at home andat school and 10 came from NCS backgrounds All deafparticipants reside in the Washington DC metropoli-tan area which includes the District of Columbia andMaryland and Virginia suburbs None of the deaf par-
ticipants reported any additional handicapping condi-tions The mean SAT scaled scores of the three groupsare reported in Table 1
Deaf cuers The 10 CS participants from CS back-grounds ranged in age from 16 to 24 years with a meanage of 192 years Of the 10 participants 8 were univer-sity students including 3 from Gallaudet UniversityThe other two were high school juniors in the Washing-ton DC area In response to a question asking whethertheir hearing loss was moderate severe or profound9 CS participants reported having profound hearinglosses and one reported having a severe hearing loss Ofthe 10 participants there were 6 men and 4 women Interms of onset of deafness five participants reported be-ing deaf at birth four reported becoming deaf prior tothe age of 20 months and one reported becoming deafprior to the age of 36 months All CS participants indi-cated that they had been exposed to CS by one or bothparents at home prior to the age of 5 years Specificallyseven reported being cued to by one or both parents be-fore 3 years of age two reported being cued to before 4years and one participant indicated being cued to at 5years of age All participants reported that CS was usedas the primary means to convey English conversation-ally at home and in school during the elementary gradesand middle school
Deaf non-cuers Deaf participants from NCS back-grounds ranged in age from 17 to 26 years with a meanage of 213 years All participants were students at Gal-laudet University who reported that they were cur-rently using signs primarily to communicate conversa-tionally including ASL andor sign systems that utilizesigns in various degrees of English word order In re-sponse to a question about whether their hearing losswas moderate severe or profound seven of the stu-
254 Journal of Deaf Studies and Deaf Education 83 Summer 2003
Table 1 Mean percentage of correct responses (standard deviations in brackets) to O-Ptargets and I-O-P targets and for total responses for hearing CS and NCS participantgroups and mean SAT scaled scores
Hearing Deaf cuers Deaf noncuers
O-P targets 9750 (337) 9544 (587) 8564 (2039)I-O-P targets 9756 (263) 8726 (1019) 7564 (2168)Total correct responses 9758 (300) 9243 (674) 8196 (951)Mean SAT scaled scores 728 (30) 725 (26) 709 (43)
by guest on July 13 2011jdsdeoxfordjournalsorg
Dow
nloaded from
dents reported profound hearing losses and three re-ported severe hearing losses Of the 10 participants therewere 4 men and 6 women In terms of onset of deafnesssix reported being born deaf two reported becomingdeaf prior to the age of 18 months one reported becom-ing deaf prior to 30 months and one reported onset ofdeafness at 60 months Five of the NCS participants in-dicated that they had been exposed to signs by either oneor both parents at home prior to the age of 5 years Ofthose four have deaf parents who signed from birth andone has hearing parents who began to sign before theparticipant was 3 years old The other five participantsreported that they began signing after the age of 6 yearswith two of them not learning to sign until college andthree of them reported that their parents never learnedto sign
Hearing participants Hearing participants were en-rolled in a sign language class at Longwood College inVirginia They ranged in age from 19 to 21 years with amean age of 201 years
Stimuli
For the sake of comparison with the Hanson and Mc-Garr study (1989) we initially planned to use the sameset of 49 targets however that set contained more O-Pwords than I-O-P words Therefore we decided to addfive I-O-P targets thus obtaining a set of 54 targets1
Thirty-one targets have O-P rimes and the other 23 tar-gets have I-O-P rimes Targets in the O-P and I-O-Pconditions were randomly sequenced in the list of tar-gets (see Appendix A for the complete list of stimuli)
Data Collection
Most deaf participants in the present study were testedindividually however for logistics purposes four of theCS participants were tested in two groups of two stu-dents each Hearing participants were tested together ina classroom setting at Longwood College in VirginiaThe rhyming test packet given to participants consistedof five pages The first page contained the instructionsto write as many rhyming words as possible for each tar-get listed in two columns on the following four pagesParticipants were instructed that responses could be
written more than once for different targets They werealso reminded that words do not need to be spelled thesame in order to rhyme Before taking the test studentshad demonstrated to the examiner that they understoodthe concept of rhyme including the fact that words donot need to be spelled the same in order to rhyme Therewas no time limit however the time taken to completethe task for each participant was recorded All partici-pants completed the task in 30ndash45 min
Scoring of Responses
The scoring procedure consisted of rating responses asbeing words or nonwords rating responses judged to bewords in terms of whether they rhymed with the targetsclassifying rhyming responses as either O-S or O-D tothe target and classifying error responses into the fourcategories (two of which have subcategories) used byHanson and McGarr (1989) Ratings were done by twoof the authors and a third evaluator who is an experi-enced teacher of deaf students Ratings were first doneindependently then compared until consensus wasreached This was an informal consensus and no inter-rater reliability coefficient was computed Figure 2 de-picts the scoring procedure used
Words Versus Nonwords
Written responses of participants to targets in the pres-ent study were first judged in terms of whether they rep-resented words or nonwords Most responses were fairlystraightforward If they were correctly spelled English
Rhyming Abilities of Deaf Students 255
Figure 2 Graphic representation of scoring procedure
by guest on July 13 2011jdsdeoxfordjournalsorg
Dow
nloaded from
words they were accepted as words The Random HouseCollege Dictionary (1988) was consulted as a final arbiterof disagreements about whether a response was a wordExamples of responses that were questioned by one ormore of the raters requiring verification as being in thedictionary in order to be included as words were wrightrover cleave joules and pied
Responses that were less straightforward in terms ofbeing judged to be words or nonwords were responsesthat were incorrectly spelled but could be pronouncedlike a correct English word using phonics generaliza-tions For example the response moure could be consid-ered to be a misspelling of more After some discussion itwas decided that because this study relates to studentsrsquorhyming abilities there seemed to be some merit incounting incorrectly spelled responses as correct if theywere phonically rendered versions of words that rhymedwith the target word Using this decision rule the re-sponse moure was considered to be a misspelling of morewhich rhymes with the target pour thus it was countedas a correct response An example of a response thatwas not counted as a misspelled word in the presentstudy is nack which could be a misspelling of knack Be-cause knack does not rhyme with the target tax nackwas counted not as a correct response but as a nonword
The most difficult word-versus-nonword decisionfaced by raters related to single graphemes (letters ofthe alphabet) such as c or b provided by one participantas a rhyming response for the target key Because thesegraphemes have letter names produced with a vowelsound (eg the grapheme b is pronounced bee and thegrapheme c is pronounced see) and meaningfully repre-sent the name of a particular grapheme we countedthese graphemes as spoken words for this study Itshould be noted that only seven of the total responseswere single graphemes
Rhyming Versus Nonrhyming Responses
After responses were judged to be words or nonwordsthe responses that had been judged to be words wererated in terms of whether they rhymed with the targetNonrhyming responses were counted as errors Mostdecisions about whether responses rhymed with the tar-get were fairly straightforward with raters being incomplete agreement Two types of responses for which
rhyming decisions were less straightforward requiringdiscussion among raters in order to reach consensuswere (a) multisyllabic responses in which the final syl-lable to be judged for its rhyming characteristic was un-stressed (eg city) and (b) responses with multiplepronunciations such as present which is pronounceddifferently when used to refer to a noun (ie gift) thanwhen used as a verb (ie give)
The first type of response for which rhyming deci-sions were not always straightforward was multisyllabicresponses in which the final syllable being judged forits rhyming characteristic was an unstressed syllable(eg city and pity) Technically because the y in wordssuch as cit-y and pit-y is not stressed it is transcribed asa short i i as in cit-ih in accordance with the Interna-tional Phonetic Alphabet (IPA 1996) and is thus trans-literated as i when cued Therefore such responseswere counted as incorrect in this study when providedas rhyming responses for key words with a long e rime(eg key) It should be noted that only one response fellinto this category We considered this technicality how-ever we considered the change in pronunciation to beminimal and thus determined the y in the unstressedsyllable to be merely an allophone of the vowel thatcould be judged for its rhyming relationship to targets
The second type of response for which rhyming de-cisions were less than straightforward was responsesthat had more than one pronunciation For exampleread can be pronounced with either a long or short e de-pending on whether the word is present or past tense Inthese situations participants were given the benefit ofthe doubt for purposes of rhyming decisions
Categories of Correct Rhyme Responses
Responses that were judged to be correct rhyming re-sponses for targets were then classified as being eitherO-S to the target (eg O-P target blue-glue I-O-P tar-get school-cool ) or O-D to the target (eg O-P targetblue-few I-O-P target bear-fare)
Categories of Errors
Incorrect rhyme responses were classified as errors Er-rors were then classified into one of four categories twoof which had subcategories resulting in a total of six er-
256 Journal of Deaf Studies and Deaf Education 83 Summer 2003
by guest on July 13 2011jdsdeoxfordjournalsorg
Dow
nloaded from
ror categories that had been employed by Hanson andMcGarr (1989) First using the same procedure asHanson and McGarr in the same specified sequence in-correct responses in this study were examined to deter-mine whether the vowel portion of the response re-gardless of other portions of the response was the sameas the vowel portion of the target Responses that con-tained the same vowel sounds were classified in termsof whether they were vowels orthographically similar(VO) to the target or orthographically dissimilar (V)Responses that were not classified as vowel responseswere examined for orthographic (O) similarity Specifi-
cally they were examined to determine whether the finalportion of the response carrying the rime was identicalto that in the target Examples of responses with (O)similarity are eight-weigh dear-wear or one-throne Re-sponses that were not classified as V VO or O wereevaluated to determine whether they had some but notcomplete orthographic similarity (SO) to the target Ex-amples of SO responses are feel-fell or bear-beer Re-sponses that were not classified as V VO O or SO werejudged in terms of whether or not they were speech re-lated (SR) meaning that they looked similar to the tar-get on the mouth of the speaker Examples of SR re-sponses from the Hanson and McGarr study (1989) areone-want and box-mat Examples of SR responses fromthis study are door-tour bear-peer and pail-bell Finallyresponses that were not classified as V VO S or SR er-rors were classified as unclassifiable (U) Examples ofunclassifiable responses in this study are feel-kill andhair-rear To summarize at the completion of the anal-ysis all errors were classified into one of the following sixcategories vowel (V) vowel with orthographic similar-ity (VO) orthographic (O) some orthography (SO)speech related (SR) or unclassified (U)
Results
Questions 1 and 2
The first two questions were Does the level of accuracydiffer for hearing CS and NCS matched for readinglevel and Is there an I-O-P effect of orthography-to-phonology inconsistency and if so does this effect inter-act with groups
Because this experiment is concerned with rhyme
generation as a function of a variable (O-P) associatedwith reading ability it is important to verify that thethree groups did not differ regarding their measuredreading level Table 1 contains the mean percentage ofcorrect responses to O-P targets and correct responsesto I-O-P targets for the different participant groups(hearing CS NCS) together with their SAT scores Aone-way ANOVA with group (three levels hearing CSand NCS) performed on the SAT scores revealed nosignificant effect of group F(2 27) = 084 p gt 10 Ourthree groups could thus be considered as equivalent re-garding their measured reading level
The mean percentages of correct rhyming re-sponses for O-P targets and I-O-P targets were analyzedwith a mixed ANOVA with group (three levels hear-ing CS and NCS) as the between-participants factorand orthography-to-phonology consistency (two levelsconsistent inconsistent) as the within-participants fac-tor2 The ANOVA was run on the mean percentage ofcorrect responses by participant The ANOVA yieldedsignificant effects of O-P consistency F(127) = 948 plt 01 and of group F(227) = 498 p lt 05 The inter-action between group and O-P consistency failed toreach significance F(227) = 245 p = 11 A post-hocTukey HSD test revealed that hearing participants di-ffered significantly from NCS participants (p lt 05) butnot from CS participants and that CS participants didnot differ from NCS participants (p = 14)
The mean percentage of correct responses by targetwas also computed for each group of participants Amixed ANOVA with O-P consistency (two levels consis-tent inconsistent) as the between factor and group of par-ticipants (three levels CS NCS hearing) as the withinfactor was run on these data The analysis yielded signifi-
cant effects of group F(152) = 1122 p lt 005 and O-Pconsistency F(1 52) = 525 p lt 05 The group by O-Pconsistency was not significant F lt 1
Question 3
The third question was Does the proportion of ortho-graphically similar and dissimilar responses differ in thethree groups
Table 2 showing mean percentages of responsesclassified as correct and incorrect rhyming responses forhearing CS and NCS groups indicates that the major-
Rhyming Abilities of Deaf Students 257
by guest on July 13 2011jdsdeoxfordjournalsorg
Dow
nloaded from
ity of the responses generated by the three groups in thisstudy did correctly rhyme with the target (975 forhearing 924 for CS and 820 for NCS partici-pants) In the hearing and the CS groups correct orth-ographically dissimilar rhymes were produced more of-ten than were orthographically similar rhymes theNCS group produced more orthographically similarthan orthographically dissimilar rhymes For the sake ofcomparison with Hanson and McGarrrsquos (1989) resultswe adopted the same presentation of the data
The percentages of correct orthographically similarresponses were analyzed with a one-way ANOVA withgroup (hearing CS NCS) as the between-subjects fac-tor The group factor was highly significant F(227) =797 p lt 005 A post-hoc Tukey HSD test revealed thatthe NCS group produced significantly more ortho-graphically similar responses than either the CS groupor the hearing group which did not differ from eachother The percentages of correct orthographically dis-similar responses were also analyzed with a one-wayANOVA The group factor was again highly signifi-
cant F(2 27) = 1306 p lt 001 A post-hoc Tukey testshowed that the NCS group produced significantlyfewer orthographically dissimilar responses (p lt 005)than either the CS group or the hearing group whichdid not differ from each other
Question 4
Next we asked the question Is there a relationship be-tween reading ability and rhyming accuracy
In an effort to determine a relationship betweenreading ability and rhyming ability Pearsonrsquos r correla-tion coefficients were computed between the differentmeasures of rhyme generation previously used and theSAT scores including both hearing and deaf partici-
pants (N = 30) The reading score explained a significantvariance of the proportion of correct responses for I-O-P rhymes (r = 0 50 p = 005 two-tailed) but not of theproportion of correct responses to O-P rhymes (r = 021p gt 10) Indeed most of the participants reached morethan 95 of correct responses in this condition It is in-teresting that SAT scores correlated significantly andpositively with the proportion of correct responses thatwere orthographically dissimilar (r = 0 54 p = 002two-tailed) and also significantly but negatively with theproportion of correct responses that were orthographi-cally similar (r = ndash0 50 p = 005 two-tailed) In sumparticipants with higher SAT scores were more able thanparticipants with lower SAT scores to generate rhymesto I-O-P targets and to generate rhymes that were ortho-graphically dissimilar from the targets It is interestingthat these correlations held for the 20 deaf participantsalone SAT and O-P correct responses 15 SAT and I-O-P correct responses 50 ( p lt 05) SAT and ortho-graphically similar responses ndash50 (p lt 05) SAT andorthographically dissimilar responses 53 (p lt 05)
Question 5
Finally we asked Does the analysis of errors indicatedifferences between hearing CS and NCS partici-pants and How do the results of the present study com-pare with those of Hanson and McGarr (1989)
Table 3 compares participant groups (CS NCShearing) in terms of total responses total correct rhymestotal errors total nonwords and proportions of errors ineach of the six error categories For the sake of compar-ison corresponding data from the Hanson and McGarr(1989) study have also been included (see Appendix Bfor a detailed account of the errors)
Vowel errors predominate in all three groups as they
258 Journal of Deaf Studies and Deaf Education 83 Summer 2003
Table 2 Mean percentage classified as correct and incorrect rhyming responses for hearing CS and NCS groups (standarddeviations in brackets)
Hearing () Deaf CS users () Deaf non-CS users ()
Correct responsesOrthographically dissimilar 6250 (513) 5690 (952) 3370 (2047)Orthographically similar 3480 (426) 3560 (510) 4820 (1298)Incorrect responses 240 (291) 760 (659) 1820 (1138)Total 1000 1000 1000
by guest on July 13 2011jdsdeoxfordjournalsorg
Dow
nloaded from
did in the Hanson and McGarr (1989) study The totalcombined vowel (V) errors + vowel orthographic (VO) er-rors represented 58 of the errors of the hearing group42 of the errors of the CS group and 45 of the errorsof the NCS group versus 31 in the Hanson and Mc-Garr (1989) study It is interesting that the percentages ofvowel (V) errors for CS and NCS deaf participants in thepresent study (14 in both groups) were basically thesame as those in the Hanson and McGarr (1989) study(145) but considerably lower than the 36 vowel (V)errors for hearing participants in this study These errorsrepresented approximate rhyming responses
Orthography-related responses accounted for amuch larger proportion of error responses in the deafgroups than in the hearing group Specifically of totalerrors 75 for CS 78 for NCS versus 43 for hear-ing are orthographically related compared with 52 oftotal errors in the Hanson and McGarr (1989) study
Finally to try to understand the large discrepancy inthe error rates in this study (6) compared with that inthe Hanson and McGarr (1989) study (48) we com-
pared the three groups (CS NCS hearing) in this studywith the group in the Hanson and McGarr (1989) studyin terms of proportions of nonword responses totalattempted correct and incorrect responses numbersof multisyllabic responses numbers of responses classi-fied as proper nouns exclamations onomatopoeia non-English words and abbreviations that we accepted inthis study and reading levels of participants
The proportion of nonword responses (see Table 3)to total attempted responses was 03 (CS 04NCS 03 hearing 01) compared with 10 in theHanson and McGarr (1989) study
More important differences were found betweenmean attempted responses in the two studies that is theoverall mean of 215 (CS 259 NCS 134 hearing 250)attempted responses in this study compares with 80 inthe Hanson and McGarr (1989) study Hearing and CSparticipants in this study produced more than threetimes the number of responses as the Hanson andMcGarr participants and NCS participants producedmore than 50 more responses than the Hanson and
Rhyming Abilities of Deaf Students 259
Table 3 Summary data related to age reading level correct rhymes errors and nonwords for participant groups in this studyand in the Hanson and McGarr (1989) study
Deaf CS Deaf non-CS Hearing Hanson and McGarr(n = 10) (n = 10) (N = 10) (1989) (n = 15)
Mean age 192 years 213 years 201 years Ages not reportedGallaudet undergradstudents (typically18-27 yrs)
Mean measured reading level(grade level)a Post-high school Grade 128 Post-high school Grade 101Total attempted responsesb and means 2596 (260) 1345 (135) 2501 (250) 1199 (80)Total correct rhymes and means 2427 (243) 1197 (120) 2443 (244) 626 (42)Total errorsc 169 (6) 148 (11) 58 (2) 573 (48)Vowel errorsd 23 (14) 20 (14) 21 (36) 83 (15)Vowel orthographic errors 47 (27) 46 (31) 13 (22) 94 (16)Orthographic errors 57 (34) 40 (27) 3 (5) 76 (13)Some orthographic errors 24 (14) 30 (20) 9 (16) 136 (24)Speech-related errors 5 (3) 1 (6) 5 (9) 81 (14)Unclassified errors 13 (8) 11 (7) 7 (12) 103 (18)Nonwordse 10 (04) 4 (03) 2 (01) 8 (1)a The SAT-9 (1996 Advanced II Reading Comprehension subtest) was used to determine reading levels of the 30 participants in the present study Hansonand McGarr (1989) reported reading levels for only 8 of their 15 participants They used the Gates-MacGinitie Reading Tests (1969 Survey F Form 2)Scores reported here are grade-level equivalents derived from scaled scores on the SAT-9 and standard scores on the Gates-MacGinitie test
b Based on 49 targets in the Hanson-McGarr (1989) study and 54 targets in this study
c Percentages are of the total responses (minus nonwords)
d Percentages for the error categories are based on incorrect responses in a category
e Percentages are based on the number of total responses
by guest on July 13 2011jdsdeoxfordjournalsorg
Dow
nloaded from
McGarr participants Differences were also found in theproportion of correct rhymes to total responses (total94 CS 93 NCS 89 hearing 98) comparedwith 52 in the Hanson and McGarr study The meannumber of correct rhymes per participant in this studywas 212 (CS 242 NCS 119 hearing 244) comparedwith 42 in the Hanson-McGarr study
Further analyses of response characteristics in thetwo studies produced some interesting differences re-lated to proportions of multisyllabic responses andresponses in the categories of non-American Englishwords (eg quiche) proper nouns onomatopoeia ex-clamations abbreviated forms of words (eg dorm fordormitory) and misspellings
First the proportion of multisyllabic responses inthis study differs from that in the Hanson and McGarr(1989) study Specifically in this study of the 6067 cor-rect responses (CS 2427 NCS 1197 hearing 2443)119 (CS 39 NCS 22 hearing 57) were multisyllabicwhich represents slightly less than 2 (CS 16NCS 18 hearing 23) The mean was 39 multi-syllabic responses per participant (CS 39 NCS 22hearing 58) and a mean of 45 multisyllabic responses(CS 70 NCS 40 hearing 11) for each of the 54 tar-gets In the Hanson and McGarr study of the 626 cor-rect responses only 4 (6) were multisyllabic with amean of 26 multisyllabic responses per participant anda mean of 8 multisyllabic responses per target (n = 49)Of the 375 incorrect responses in this study 23 weremultisyllabic with an overall mean of 76 multisyllabicresponses per participant (CS 6 NCS 12 hearing 4)and a mean of43 incorrect multisyllabic responses foreach of the 54 targets This compares with 38 multisyl-labic responses of 573 incorrect responses in the Han-son and McGarr study with a mean response of 25 in-correct multisyllabic responses per participant in thatstudy and 78 multisyllabic responses for each of the 49targets
Second differences were found between participantgroups in this study and the Hanson and McGarr (1989)group related to non-American English words (eg lieubeaucoup) proper nouns (eg Fred Maine) exclama-tions (eg hey yoo-hoo whoa) shortened or abbreviatedforms of words (eg dorm for dormitory) and ono-matopoeia (ie sounds such as moo or tick-tock that im-itate sounds) See Table 4 for total numbers of responses
in the different categories for the different participantgroups compared with Hanson and McGarrrsquos data (thecomplete list of these responses for the three groups isavailable from the authors)
Finally differences related to misspelled responsesbetween this study and the Hanson and McGarr (1989)study were found In this study 31 misspelled responseswere counted as correct rhyming responses using thedecision rule that if a misspelled response could be pro-nounced like a correctly spelled response that rhymedwith the target it would be counted as correct despite itsmisspelling Using this rule the response dail to the tar-get pail would have been counted as a misspelling of daleand thus a correct rhyming response Using the samedecision rule however if dail had been given as a re-sponse to the target thief it would have been counted asa nonword in the present study The number of mis-spelled responses was 1 for the CS group 6 for the NCSgroup and 0 for the hearing group It is interesting thatno mention of misspellings is made by Hanson and Mc-Garr (1989) and none of the list of total responses inthat studyrsquos appendix contained misspellings Hansonand McGarr (1989) indicate that they gave participantsthe benefit of the doubt when there was more than onepronunciation of written responses For example tear asa response could be pronounced with either a long e or along a sound When that response was produced as arhyming response to bear the response was counted ascorrect
Discussion
The findings of this study provide evidence regardingour five hypotheses The first hypothesis was that deafparticipants from CS backgrounds would achieve ahigher level of correct rhyme production than would
260 Journal of Deaf Studies and Deaf Education 83 Summer 2003
Table 4 Comparison of responses in this study and theHanson and McGarr (1989) study
Hanson-McGarrThis study (1989)
Non-American English 17 0Proper nouns 57 8Shortened forms 21 4Exclamations 28 2Onomatopoeia 7 1
by guest on July 13 2011jdsdeoxfordjournalsorg
Dow
nloaded from
participants from NCS backgrounds and comparable tothat of hearing peers This prediction was partially con-firmed by our data which showed no difference betweenthe hearing and the CS groups and the NCS group scor-ing lower than the hearing group The lower accuracyof the NCS participants could not be ascribed to theirreading levels because the NCS group was indistin-guishable from the hearing group in SAT scores A fullyspecified phonological input appears to be critical in thedevelopment of deaf participantsrsquo rhyming abilities in-dependently of the modality of input (Charlier amp Ley-baert 2000) however it must be noticed that no signifi-
cant difference was obtained between the CS and theNCS groups and the raw level of performance of the CSgroup although not significantly different from that ofthe hearing group fell in between performance levels ofthe hearing and the NCS groups
The second hypothesis was that there would be aneffect of O-P consistency which would be larger in theNCS deaf participants than in either the hearing or CSgroups This prediction was not supported statisticallythat is although there was a significant effect of O-Pconsistency there was no significant interaction betweenthis effect and group in either the analysis by partici-pants or the analysis by items The raw percentage ofcorrect responses for O-P and I-O-P words indicatesthat the two groups of deaf participants were more in-fluenced by word spelling in their attempts to generaterhymes than the hearing participants were This pointwill be discussed in this article after considering the na-ture of the correct responses
The third hypothesis was that although all threegroups would attempt to generate orthographically dif-ferent responses the rate of correct responses that areorthographically different would be higher in the hear-ing and CS groups than in the NCS group The dataconfirm this hypothesis As expected the hearing andCS groups showed significantly more correct responsesthat are orthographically different than did the NCSgroup whereas the NCS group showed more ortho-graphically similar responses than either the hearingor CS group There seems to be a contradiction in thedata discussed up to now On the one hand the rateof orthographically similar and dissimilar correct re-sponses indicates that compared with the hearing andCS groups our NCS participants used more of a
ldquoshortcutrdquo strategy in which they generated words thatcontain the same orthographic rime as the target Onthe other hand the absence of interaction between theeffect of O-P consistency and group indicates that boththe CS and NCS participants generate rhymes moreeasily for O-P targets than for I-O-P targets How canthese two findings be reconciled It could be that deafparticipants from the CS group used the phonologicalinformation to produce rhymes but that in some casesthey have stored inappropriate pronunciations in theirlexicon derived from the word spelling For examplethey could pronounce blood like should and incorrectlygenerate responses such as blood flood to the targetshould which were scored as incorrect The results thuspoint to the complexity of rhyme generation by deafstudents Cued speech aids phonological awareness butsome dependence on orthography remains Charlierand Leybaert (2000) found similar results It must be re-membered that even if the students from the CS grouphad been exposed to CS early (before the age of 5 years)they did not benefit from incidental learning of the pho-nological forms of words to the same degree as did mostof the hearing children Indeed their learning of phon-ological forms was dependent on input from consider-ably fewer people cueing to them Therefore it is notsurprising that they relied more on word reading to de-velop their knowledge of the phonological forms and ofrhyming words
Our data also confirm the fourth hypothesis thatthere is a relationship between deaf peoplersquos rhyme-generation ability and their reading ability (Campbell ampWright 1988 Hanson amp Fowler 1987 see Leybaert1993 for a review) Specifically the readers with higherSAT scores were better at generating responses to I-O-P targets and better at generating correct rhymes thatwere orthographically dissimilar Whether phonologi-cal sensitivity promotes reading or the relationship isthe opposite could not be determined from this studyrsquosdata Longitudinal data measuring rhyme awareness be-fore learning to read and the subsequent development ofreading are needed to disentangle these two possibilities
Our fifth research question was whether erroranalyses would indicate differences between the threegroups and whether the performance of NCS partici-pants in our study would be more similar to that of theparticipants in the Hanson and McGarr (1989) study
Rhyming Abilities of Deaf Students 261
by guest on July 13 2011jdsdeoxfordjournalsorg
Dow
nloaded from
than that of the CS or hearing participants in this studyThe error analysis indicates that the hearing groupmade more vowel errors and fewer orthography-relatederrors than the two deaf groups
However other aspects of the data revealed dif-ferences between our three groups and are worthcom-paring with Hanson and McGarrrsquos (1989) data Oneinteresting finding relates to the number of attemptedresponses between participants in the two studiesWhereas the mean number of attempted responses inthe Hanson and McGarr study was 80 the mean num-ber of attempted responses in our study was 135 for theNCS group 260 for the CS group and 202 for the hear-ing group As expected the results of our NCS par-ticipants were more similar to the results achieved bythe college students tested by Hanson and McGarr andthe results from the CS participants differed moregreatly Hearing and CS participants produced twicethe number of responses than the NCS participants didThis range of responses could give us a hint about thestrength of the representation of rhyme that is thisfinding supports the idea that NCS participants com-pared with CS and hearing participants have a less stableunderstanding of rhyme and that rhyme generation is amore difficult exercise for them It also indicates that theNCS participants in this study could be more skilledat rhyming than Hanson and McGarrrsquos participantsCompared with the 52 correct rhyming responses re-ported by Hanson and McGarr (1989) for deaf signingparticipants the level of accuracy of our deaf partici-pants from NCS backgrounds was surprisingly high(94) despite our control for age and educational set-ting at the time of data collection Specifically deaf par-ticipants from NCS backgrounds in our study like thedeaf participants in the Hanson and McGarr studywere all Gallaudet students of comparable age It is in-teresting that our NCS participants differed from thosein the Hanson and McGarr study more on the rate ofcorrect orthographically dissimilar responses (338versus 157) than on the rate of correct orthographi-cally similar responses (482 versus 365) The num-ber of attempted responses cannot explain this differ-ence In Hanson and McGarrrsquos study the mean numberof attempted responses was 7993 (1199 responsesproduced by 15 participants) In our study this meanreached 1344 responses It is thus not the case that our
deaf participants from NCS backgrounds reached ahigher accuracy level because they wrote fewer re-sponses for each stimulus
There are at least five possible explanations for thesedifferences First our participants were tested individ-ually or in small groups of participants whereas thetesting situation used by Hanson and McGarr (1989)was not described Individual testing might reduceparticipantsrsquo peer pressure as well as time pressure andcould thus be a situation more suitable for testing deafparticipantsrsquo rhyming abilities
Second our NCS participants might have betterreading abilities than those in the Hanson and McGarrstudy Hanson and McGarr reported standard scores for8 of the 15 participants on the 1960 Gates-MacGinitieReading Comprehension Test that reflected a grade-level equivalent of 10th grade We obtained scaled scoresthat reflected grade-level equivalents of post-12th gradeCaution should be exercised in assuming that deaf stu-dents will have the same ldquoreading levelsrdquo or ldquograde-levelequivalentsrdquo on both the Gates-MacGinitie ReadingComprehension Test and the 1996 SAT LaSasso (1987)discusses the inappropriateness of ascribing reading lev-els or grade-level equivalents to deaf students from testsdesigned for hearing students
Third our NCS participants could be more linguis-tically sophisticated than the participants in the Hansonand McGarr (1989) study Indeed our NCS partici-pants produced more responses and more responsesthat were abbreviations proper nouns onomatopoeiawords borrowed from other languages and exclama-tions which arguably reflect a greater linguistic sophis-tication
Fourth approximately half of our participants re-ported having early and ongoing exposure to signswhereas the other half reported later exposure or lessconsistent exposure to signs In the Hanson and Mc-Garr (1989) study no mention was made about the par-ticipantsrsquo communication history
Finally the differences could be related to speech in-telligibility Hanson and McGarr (1989) found that bet-ter speech intelligibility was associated with more correctrhymes generated We did not collect speech intelligi-bility data and thus are unable to discuss any possible re-lationships In any case the results of our deaf partici-pants from NCS backgrounds are striking They show
262 Journal of Deaf Studies and Deaf Education 83 Summer 2003
by guest on July 13 2011jdsdeoxfordjournalsorg
Dow
nloaded from
that achieving a high level of accuracy in phonologicalability is not impossible for deaf people from NCS back-grounds
In conclusion our study demonstrates the degree towhich deaf participants from different communicationbackgrounds can generate rhymes The relationship be-tween measured reading ability and rhyming accuracysupports the view that phonological skills are importantfor deaf people to achieve high measured reading levelsThe causal model linking phonological awareness toreading achievement that has been strongly emphasizedfor hearing children (Bryant McLean amp Bradley 1990)seems valid for deaf youngsters as well In support ofthis hypothesis Harris and Beech (1995) showed thatthe reading progress made by deaf children during theirfirst year of reading instruction was predicted by theirperformance 10 months earlier on a version of Bradleyand Bryantrsquos (1983) ldquoodd-man-outrdquo phonemic sen-sitivity test as well as by their oral skills In additionour data demonstrate that experience with CS can en-hance rhyming ability Specifically the performanceof the deaf participants from CS backgrounds althoughfalling between that of the hearing and the NCS groupsdid not differ significantly from that of the hearing par-ticipants It is likely that the development of good pho-nological representations through experience with CSwould facilitate the acquisition of reading and spellingin an alphabetic writing system in traditionally spoken
languages such as English however longitudinal stud-ies such as that of Harris and Beech (1995) measuringthe predictive power of level of rhyme awareness beforelearning to read and the subsequent development ofreading are needed to establish this point
Appendix A List of Targets in O-P and I-O-P Conditions
O-P Targets I-O-P Targets
blue tie school woncry rain bear keypail hair tea poursteal thief shoe shouldlate rule please saidpeace vote phone newdoor beach one eightbox feel cough lostshirt beef care warmoff lane own greatspeech weigh wood herehurt boat lovesale dayred sockstax tackssee
Rhyming Abilities of Deaf Students 263
Appendix B Errors in This Study Categorized According to Hanson amp McGarrrsquos Error Types
Targets NCS CS Hearing
beach 1 bench (SO) 19 ditch (SO)2 niche (SO) leash (VO)
20 quiche (V)bear 7 near (O) 11 fear (O)
9 hear (O) clear (O)dear (O)
16 rear (O)fear (O)peer (SO)
19 near (O)dear (O)ear (O)fear (O)gear (O)
by guest on July 13 2011jdsdeoxfordjournalsorg
Dow
nloaded from
264 Journal of Deaf Studies and Deaf Education 83 Summer 2003
here (O)hear (O)smear (O)peer (SO)rear (O)year (O)
beef 4 seek (VO) 19 feet (VO) 21 heat (V)8 believe (V) meat (V) eat (V)
27 teeth (VO)beneath (V)bequeath (V)
blue 8 bloom (V)boat 1 boast (VO)
4 oak (VO)box 17 lock (VO) 21 tots (VO)
sock (VO) trots (VO)tock (VO) dots (VO)chock (VO) cots (VO)dock (VO) plots (VO)clock (VO) yachts (V)hock (VO)
19 lock (VO)dock (VO)mock (VO)rock (VO)
care 29 dear (SO)cough 1 rough (O) 12 bought (VO) 21 golf (V)
bought (VO) taught (V) moth (V)4 tough (O) 14 rough (O) 26 soft (V)
tough (O)5 loft (VO) 15 soft (V)
tough (O) loft (V)18 soft (V)19 tough (O)
cryday 1 sad (U)
date (V)Dan (SO)
door 12 tour (SR) 28 tour (SR)13 boor (O) 30 sure (SR)14 tour (SR) cure (SR)15 tour (SR)17 wear (U)18 moor (O)
Targets NCS CS Hearing
by guest on July 13 2011jdsdeoxfordjournalsorg
Dow
nloaded from
Rhyming Abilities of Deaf Students 265
eight 1 either (U)5 cake (V)
feel 19 fail (SO) 23 kill (U)26 will (U)
great 3 cat (SO) 12 treat (O)5 treat (O) heart (SO)
14 meat (O)feet (SO)feat (O)
19 bright (U)fray (V)gray (V)
hair 6 hail (VO) 18 rear (U)here 1 heir (SO)
where (O)3 deaf (U)
hurt 1 burst (VO) 19 nurse (VO)cure (SO)pure (SO)
4 birth (V)key 1 Kay (SO) 12 hey (O)
clay (SR)7 hey (O)
lane 2 hang (SO) 19 man (SO) 26 claim (V)tan (SO) aim (V)ban (SO) fame (VO)fan (SO)
late 4 fake (VO)7 pate (O)
lost 1 host (O) 12 host (O) 30 soft (VO)just (SO) 19 fart (V)
2 moss (VO) dart (V)3 locust (SO) bust (SO)4 fought (V) toss (SO)7 post (O)
host (O)love 1 rove (O) 11 clove (O)
shovel (VO) grove (O)3 cove (O) 13 jove (O)
wove (O) 17 SUV (U)5 cove (O)
wove (O)7 move (O)
cove (O)
Targets NCS CS Hearing
by guest on July 13 2011jdsdeoxfordjournalsorg
Dow
nloaded from
266 Journal of Deaf Studies and Deaf Education 83 Summer 2003
new 1 noon (V) 19 sew (O)3 sew (O)
off 1 golf (V) 12 tough (U) 21 moth (VO)of (SO) huff (SR) golf (VO)
5 soft (VO) 15 soft (VO)loft (VO)
18 soft (VO)19 golf (VO)
one 1 once (VO) 19 tone (O)on (SO) 17 tone (O)
5 bon (SO)7 lone (O)
own 1 owe (VO) 12 town (O) 21 rome (V)owl (SO) 13 renown (O) 26 gone (U)gown (O) 17 chrome (VO)
5 con (U)7 down (O)
gown (O)8 owl (SO)
pail 19 dial (U) 30 bell (SR)fell (U)
peace 1 pea (VO) 17 belief (V) 21 keys (V)ace (O) leaf (VO) tease (VO)ease (VO) 19 fierce (V) 26 east (VO)
2 feast (VO) ease (VO)meet (V) tease (VO)
4 tense (U) yeast (VO)phone 2 phony (VO) 13 renown (U) 21 rome (VO)
foe (VO) 26 on (SO)gone (O)
please 1 pledge (U) 11 peace (VO) 21 cease (VO)2 need (V) fleece (V)
heed (V) cleanse (SO)lead (VO) 12 lease (VO)seed (V) 13 grease (VO)weed (V) 17 lease (VO)pied (U)18 crease (VO)cease (VO) lease (VO)read (VO) cease (VO)
5 deceased (VO) 19 geese (V)7 lease (VO) cease (VO)
cease (VO) 20 lease (VO)pour 1 tour (O) 12 tour (O) 22 tour (O)
our (O) 13 boor (O) 24 lure (SO)
Targets NCS CS Hearing
by guest on July 13 2011jdsdeoxfordjournalsorg
Dow
nloaded from
flour (O) 16 tour (O) 30 sure (SO)5 flour (O) 19 tour (O)6 tour (O) sour (O)
rain 4 ten (U) 12 ran (SO)5 sang (U) 19 faint (VO)
whail (VO)red 1 GED (O) 19 mead (U) 30 kid (U)
mend (VO)den (VO)
rule 1 joules (VO) 17 pull (SO)8 ruler (VO) dull (SO)
19 wool (SR)said 1 aid (O) 12 sad (SO) 30 kid (SO)
sat (SO) 19 mead (U)sad (SO) laid (O)
4 say (SO) paid (O)6 plaid (O)
saleschool 3 wool (O) 15 wool (O) 28 pull (U)
18 whole (SO)see 5 easy (V)shirt 1 sheet (SO)
church (V)shoe 1 hoe (O)
5 foo (V)8 hoe (O)
should 17 flood (U)blood (U)lewd (U)
socks 1 shock (VO) 17 poxs (VO) 26 coxs (VO)cock (VO)
4 lock (VO)5 oxs (VO)8 sock (VO)
speech 1 pinch (SO) 17 leash (V)cleat (V)
19 search (SO)20 quiche (V)
steal 12 stale (SO) 21 veil (SO)26 will (U)
gill (SR)tacks 1 sack (VO) 12 hack (VO)
pack (VO) 19 mack (VO)tax 1 taxi (VO) 19 whack (VO)
Rhyming Abilities of Deaf Students 267
Targets NCS CS Hearing
by guest on July 13 2011jdsdeoxfordjournalsorg
Dow
nloaded from
268 Journal of Deaf Studies and Deaf Education 83 Summer 2003
2 sack (VO) hack (VO)hack (VO)pact (VO)
tea 21 brei (V)thief 1 this (SO) 17 cleave (V) 26 left (SO)
thing (V) niece (VO) 27 bequeath (V)2 sheath (V) teeth (V)
beneath (V)tie 1 tired (VO)
tin (SO)6 time (VO)8 kite (VO)
vote 1 forty (VO) 17 sloat (VO) 29 cot (SO)fool (U) 19 dot (SO)
4 oak (V) hoax (V)loot (SO)
warm 1 carmel (SO) 11 farm (O) 23 torn (V)farm (O) 12 harm (O) mourn (V)
14 charm (O) 28 farm (O)2 farm (O) alarm (O)warn (VO) farm (O)4 worm (SO) 17 forlorn (V)5 farm (VO) adorn (V)9 warn (VO) lorn (V)
swarn (VO)19 farm (O)
harm (O)20 farm (O)
weigh 1 we (SO) 12 wait (V)wright (SO) 17 ale (V)Wes (SO)
5 freight (VO)won 1 want (V) 16 bonbon (O) 26 bond (SO)
would (U) con (O)wore (SO) Todd (O)
5 mon (VO) Mon (VO)17 con (O)19 gone (SO)
wood 1 won (SO) 14 food (O)4 word (V) mood (O)7 mood (O) 17 flood (O)
blood (O)lewd (U)
V vowel VO vowel orthographic O orthographic SO some orthographic SR speech related U unclassifiable Numerals refer to the identification num-bers of participants (1ndash10 NCS 11ndash20 CS 21ndash30 hearing)
Targets NCS CS Hearing
by guest on July 13 2011jdsdeoxfordjournalsorg
Dow
nloaded from
Notes
1 For the purpose of clarity the 54 words presented to studyparticipants are referred to as targets The specific words writtenby the study participants are referred to as responses Targets canbe described as being either O-P or I-O-P A target is consideredO-P if the spelling of its rime (the rhyming element of the word)is always pronounced the same way An example of an O-P targetis blue The rime -ue is consistently pronounced oo A target isconsidered I-O-P if the spelling of its rime is not always pro-nounced the same way An example of an I-O-P target is bear Therime -ear can be pronounced as in bear or ir as in fear These dis-tinctions have nothing to do with participantsrsquo responses Correctresponses (ie responses that rhyme with their targets) can be de-scribed as being either orthographically similar (O-S) or ortho-graphically dissimilar (O-D) to their targets A correct responsemight be orthographically similar to an O-P target (bluetrue) or-thographically similar to an I-O-P target (bearpear) orthograph-ically dissimilar to an OP target (blueflew) or orthographicallydissimilar to an I-O-P target (bearhair) Error responses are sep-arated into six error categories
2 An ANCOVA has also been run with group as the between-subjects factor consistency as the within-subjects factor and SATscores as covariate The effects of consistency and group were sig-nificant whereas the interaction between group and consistencywas not The effect of SAT was not significant therefore the re-sults of the ANOVA were reported here
References
Alegria J Charlier B amp Mattys S (1999) The role of lip-reading and Cued Speech in the processing of phonologicalinformation in French-educated deaf children EuropeanJournal of Cognitive Psychology 11 451ndash452
Bradley L (1988) Rhyme recognition reading and spelling inyoung children In R Masland amp M Masland (Eds) Pre-school prevention of reading failure (pp 143ndash162) ParktonMD York Press
Bradley L amp Bryant P (1983) Categorizing sounds and learn-ing to read A causal connection Nature 301 419ndash421
Bradley L amp Bryant P (1985) Rhyme and reason in reading andspelling (IARLD Monographs No 1) Ann Arbor Univer-sity of Michigan Press
Bryant P MacLean M amp Bradley L (1990) Rhyme languageand childrenrsquos reading Applied Linguistics 11 237ndash252
Bryant P MacLean M Bradley L amp Crossland J (1990)Rhyme and alliteration phoneme detection and learning toreading Developmental Psychology 26 429ndash438
Campbell R amp Wright H (1988) Deafness spelling and rhymeHow spelling supports written words and picture rhymingskills in deaf participants Quarterly Journal in ExperimentalPsychology 40 71ndash778
Cardoso-Martins C (1994) Rhyme perception Global or analyt-ical Quarterly Journal in Experimental Psychology 57 26ndash41
Charlier B amp Leybaert J (2000) The rhyming skills of deafchildren educated with phonetically augmented lipreadingQuarterly Journal of Experimental Psychology 53A 349ndash375
Rhyming Abilities of Deaf Students 269
Cornett O (1994) Adapting Cued Speech to additional lan-guages Cued Speech Journal 5 19ndash36
Cornett R amp Daisey M (1992) The Cued Speech resource bookfor parents of deaf children Raleigh NC National CuedSpeech Corporation
Dodd D amp Hermelin B (1977) Phonological coding by the pre-linguistically deaf Perception and Psychophysics 21 413ndash417
Ellis N amp Large B (1987) The development of reading As youseek so shall you find British Journal of Psychology 78 1ndash28
Gates A amp MacGinitie W (1969) Gates MacGinitie ReadingTests Survey F Form 2 Boston Houghton Mifflin
Hage C Alegria J amp Perier O (1990) Cued Speech and lan-guage acquisition The case of grammatical gender morpho-phonology In D Martin (Ed) Advances in cognition educationand deafness Washington DC Gallaudet University Press
Hanson V amp Fowler C (1987) Phonological coding in wordreading Evidence from hearing and deaf readers Memoryand Cognition 15 199ndash207
Hanson V amp McGarr N (1989) Rhyme generation in deafadults Journal of Speech and Hearing Research 32 2ndash11
Harris M amp Beech J (1995) Reading development in prelin-gually deaf children In K Nelson amp Z Reger (Eds) Chil-drenrsquos language Hillsdale NJ Lawrence Erlbaum Associates
International Phonetic Association (1996) Reproduction of theInternational Phonetic Alphabet Retrieved June 2 2003from International Phonetic Association Web site httpwww2artsglaacukIPAfullcharthtml
Kipila B amp Williams-Scott B (1990) Cued Speech In HBornstein (Ed) Manual communication Implications for edu-cation (pp 139ndash150) Washington DC Gallaudet UniversityPress
LaSasso C (1987) What parents need to know about reading lev-els of hearing impaired students American Annals of the Deaf132 218ndash220
LaSasso C amp Metzger M (1998) An alternate route for prepar-ing deaf children for BiBi programs The home language asL1 and Cued Speech for conveying traditionally-spoken lan-guages Journal of Deaf Studies and Deaf Education 3 264ndash289
Lenel J amp Cantor J (1981) Rhyme recognition and phonemicperception in young children Journal of Psycholinguistic Re-search 10 57ndash67
Leybaert J (1993) Reading in the deaf The roles of phonologi-cal codes In M Marschark amp D Clark (Eds) Psychologicalperspectives on Deafness (pp 269ndash311) Hillsdale LawrenceErlbaum Associates
Leybaert J (2000) Phonology acquired through the eyes andspelling in deaf children Journal of Experimental Child Psy-chology 75 291ndash318
Lundberg I Olofsson A amp Wall S (1980) Reading andspelling skills in the first school years predicted from phone-mic awareness skills in kindergarten Scandinavian Journal ofPsychiatry 21 159ndash173
MacLean M Bryant P amp Bradley L (1987) Rhymes nurseryrhymes and reading in early childhood Merrill-PalmerQuarterly 33 25ndash282
Morais J Bertelson P Cary L amp Alegrica J (1986) Literacytraining and speech segmentation Cognition 24 45ndash64
by guest on July 13 2011jdsdeoxfordjournalsorg
Dow
nloaded from
Nicholls G amp Ling D (1982) Cued Speech and the reception ofspoken language Journal of Speech and Hearing Research 25262ndash269
Parasnis I (1996) Relationship between rhyme generation andEnglish skills in profoundly deaf readers Paper presented atthe 1996 annual meeting of the American Educational Re-search Association New York NY
Perier O Charlier B Hage C amp Alegria J (1988) Evaluationof the effects of prolonged Cued Speech practice upon the re-ception of spoken language In I Taylor (Ed) The educationof the deaf Current perspectives Vol 1 London Croom Helm
Read C (1978) Childrenrsquos awareness of language with an em-phasis on sound systems In A Sinclair R Jarvella amp WLevelt (Eds) The childrsquos conception of language (pp 65ndash92)New York Springer-Verlag
Random House College Dictionary (1988) Random House IncNew York
Slobin C (1978) A case study of early language awareness In ASinclair R Jarvella amp W Levelt (Eds) The childrsquos conceptionof language (pp 45ndash54) New York Spring-Verlag
Stanford Achievement Test (9th Edition) Norms Booklet (1996)New York The Psychological Corporation Harcourt BraceJavanovich
Tammasaeng M (1985) The effects of Cued Speech upon tonal per-ception of the Thai language by hearing-impaired children Un-published doctoral dissertation Gallaudet University Wash-ington DC
Webster P amp Plante A (1995) Productive phonology and pho-nological awareness in preschool children Applied Psycho-linguistics 16 43ndash57
Ziegler J Stone G amp Jacobs A (1997) What is the pronuncia-tion for _OUGH and the spelling for u A database forcomputing feedforward and feedback consistency in EnglishBehavior Research Methods Instruments and Computers 29660ndash678
Received October 10 2001 revisions received March 4 2002 ac-cepted March 14 2002
270 Journal of Deaf Studies and Deaf Education 83 Summer 2003
by guest on July 13 2011jdsdeoxfordjournalsorg
Dow
nloaded from
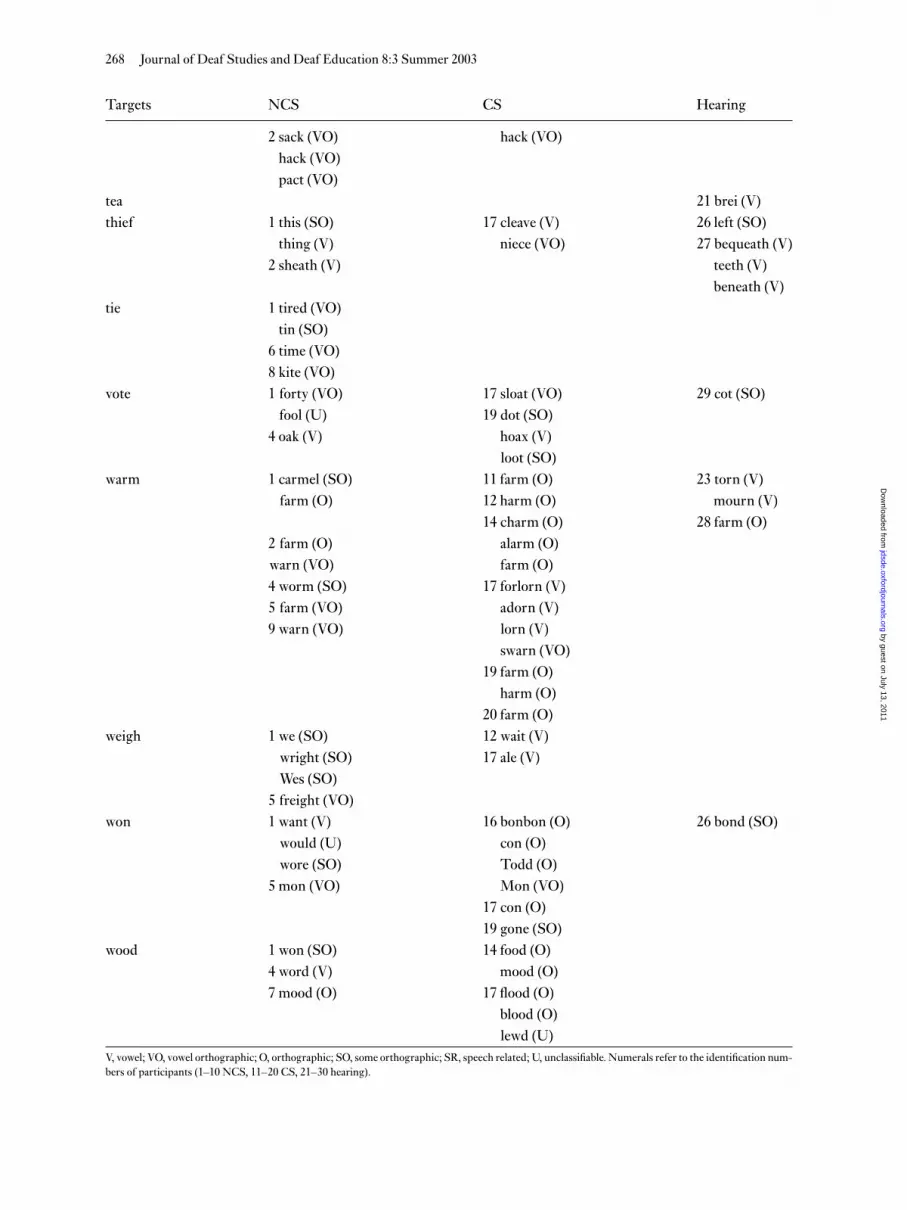