job satisfaction of interpreters for the deaf
TRANSCRIPT

Running head: Interpreter Job Satisfaction
Job Satisfaction of Interpreters for the Deaf
by
Daniel B. Swartz
School of Organization and Management
A Dissertation Submitted in Partial Fulfillment of
the Requirements for the Degree of
Doctor of Philosophy
The Graduate School of America
Minneapolis, Minnesota
1999

Copyright Approval Page

Approval Page

ABSTRACT
The purpose of this study was to examine relationships
between job satisfaction and personal- and job-related
factors among sign language interpreters for the deaf. A
secondary purpose was to examine job satisfaction
differences between staff, dependent contractor, and
independent contractor interpreters. A third purpose of
the study was to estimate a model that predicts job
satisfaction among interpreters for the deaf.
A series of Spearman’s rho rank correlations were
performed to examine which variables most significantly
relate to job satisfaction. Autonomy, workload, education,
and supervision emerged as those variables significantly
related to job satisfaction among interpreters in general.
Finally, a multiple regression analysis was undertaken
to estimate a model that best predicts job satisfaction
among interpreters for the deaf in general. Education
emerged as the most important factor for interpreters,
accounting for 26% of the total variance in job
satisfaction. Autonomy, workload, and supervision all
emerged as weak predictors of job satisfaction, accounting
for only 3% of the total variance in job satisfaction.

Interpreter Job Satisfaction
ii
ACKNOWLEDGEMENTS
Many people made significant contributions in helping
me complete this dissertation. I am very grateful to my
dissertation committee members for their time, feedback,
and expertise throughout the dissertation process and for
their interest in and enthusiasm for this study. I would
especially like to thank Dr. Sybil McClary for chairing my
dissertation committee, as well as for providing guidance,
feedback, and editing of this dissertation. I am also
thankful to Drs. David Balch and Stanley Trollip, Ms. Joyce
Linden, and Mr. Terry Colton (committee members) for
providing valuable input during the writing and refining of
this dissertation. Their collective wisdom and insight
were critical in shaping this study.
I would like to extend my appreciation to many
individuals in the interpreting field for their assistance
in this study. Foremost, I appreciate all the interpreters
in the United States and Canada who completed the surveys.
I am grateful to Kelly MacKenzie, president of the
Association of Visual Language Interpreters in Canada

Interpreter Job Satisfaction
iii
(AVLIC) for her organization’s support of this study. Many
thanks to Marion Jennings of Webster University, Geneva,
Switzerland, for her help in obtaining documentation. I am
grateful to Paul Spector for his time and sharing of
expertise regarding job satisfaction in general. I extend
a special thanks to several individuals in interpreter- and
deaf-related programs who lent their support and knowledge:
Dr. Donna Lewondowski, Oakland Community College; Heidi
Reed, D.E.A.F., Inc.; Ann Topliff, Front Range Community
College; Simone Scholl, Universität Hamburg; The Canadian
Association of the Deaf; and many others too numerous to
mention. I would also like to extend a special thanks to
all of the educators, trainers, and interpreters in the
interpreting profession worldwide who collaborated with me
during the literature collection phase of this study.
Finally, I would like to extend my appreciation for
some special people in my life. I am very grateful to Pat
McCracken, Ron Burke, and Toni Burke for their tremendous
support and patience throughout the doctoral program, and
especially the dissertation process.

Interpreter Job Satisfaction
iv
TABLE OF CONTENTS
ACKNOWLEDGEMENTS.................................... ii
TABLE OF CONTENTS................................... iv
LIST OF TABLES.................................... viii
LIST OF FIGURES...................................... x
INTRODUCTION......................................... 1
Definitions ........................................ 3
Background of the Problem .......................... 4
Statement of the Problem ........................... 6
Rationale and Purpose of the Study ................. 7
Research Questions ................................. 9
Research Question 1 .............................. 9
Research Question 2 .............................. 9
Research Question 3 ............................. 10
A Review of the Literature ........................ 11
Expansion on the Factors of Satisfaction ........ 17
Cross-Cultural Considerations.................. 17
Working Conditions............................. 21
Interpreting Standards......................... 27
Interpreter Shortages.......................... 31
Interpreter Job Satisfaction
v
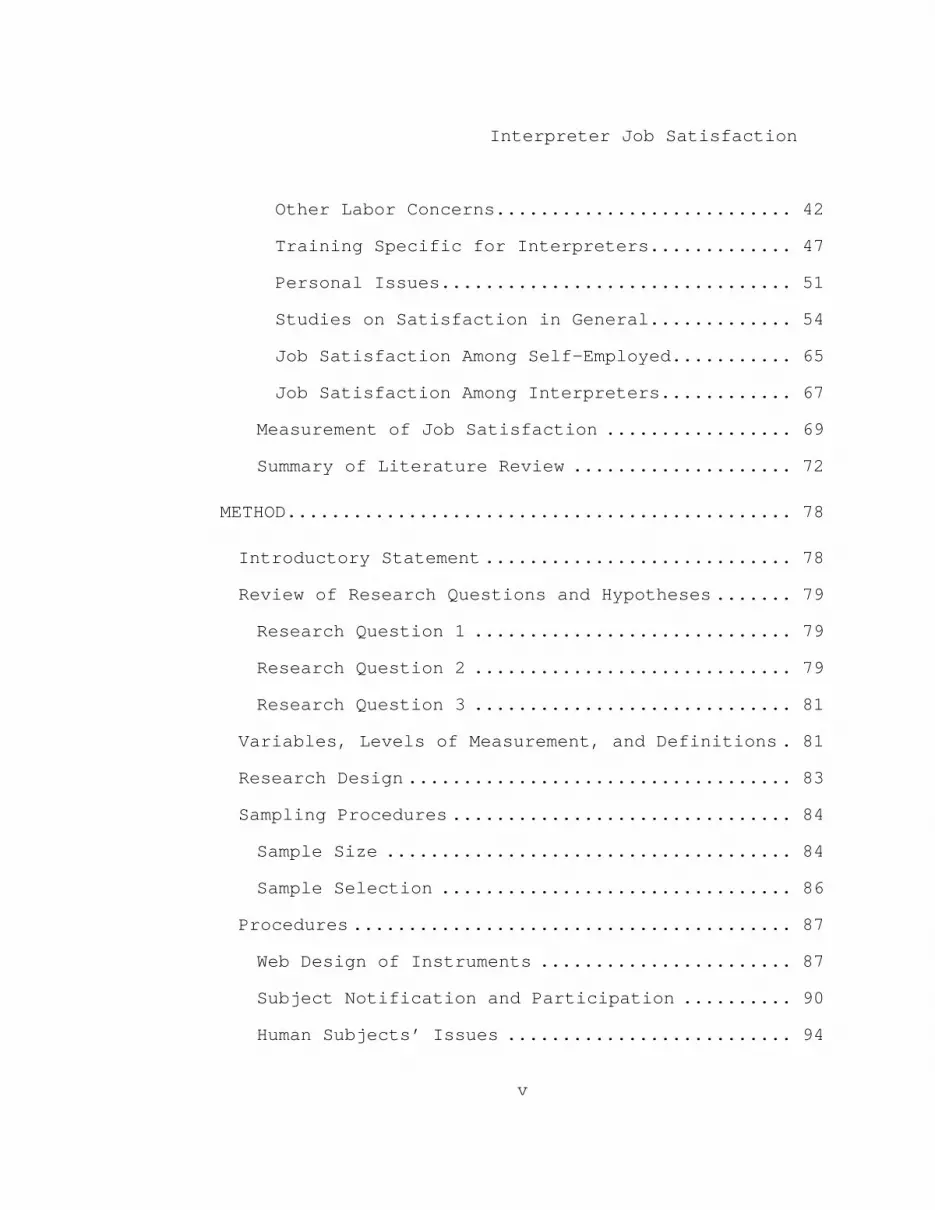
Other Labor Concerns........................... 42
Training Specific for Interpreters............. 47
Personal Issues................................ 51
Studies on Satisfaction in General............. 54
Job Satisfaction Among Self-Employed........... 65
Job Satisfaction Among Interpreters............ 67
Measurement of Job Satisfaction ................. 69
Summary of Literature Review .................... 72
METHOD.............................................. 78
Introductory Statement ............................ 78
Review of Research Questions and Hypotheses ....... 79
Research Question 1 ............................. 79
Research Question 2 ............................. 79
Research Question 3 ............................. 81
Variables, Levels of Measurement, and Definitions . 81
Research Design ................................... 83
Sampling Procedures ............................... 84
Sample Size ..................................... 84
Sample Selection ................................ 86
Procedures ........................................ 87
Web Design of Instruments ....................... 87
Subject Notification and Participation .......... 90
Human Subjects’ Issues .......................... 94

Interpreter Job Satisfaction
vi
Instruments ....................................... 94
Part I: Demographic Variables ................... 95
Part II: Job Satisfaction ....................... 95
Part III: Factors Related to Job Satisfaction ... 97
Autonomy....................................... 98
Workload....................................... 99
Role Conflict.................................. 99
Data Analysis .................................... 100
RESULTS............................................ 102
Introductory Statement ........................... 102
Sample Characteristics ........................... 102
Descriptive Statistics for Job Satisfaction ...... 104
Job Satisfaction.............................. 104
Correlates of Job Satisfaction ................... 105
Research Hypothesis 1 .......................... 106
Research Hypothesis 2 .......................... 109
Research Hypothesis 3 .......................... 112
Research Hypothesis 4 .......................... 114
Multiple Regression Analysis ................... 116
Research Hypothesis 5......................... 117
Demographic Characteristics of Standard Wage Earner
and Contract Interpreters ............................. 118
Summary .......................................... 126

Interpreter Job Satisfaction
vii
DISCUSSION......................................... 129
Summary of the Research Findings ................. 129
Research Question 1 ............................ 131
Correlates of Job Satisfaction................ 131
Research Question 2 ............................ 135
Correlates of Job Satisfaction Among Interpreters
with Differing Job Status.......................... 135
Research Question 3 ............................ 137
Predictors of Job Satisfaction................ 137
Implications for Interpreter Policy Practice ..... 138
Enhancing Interpreters’ Satisfaction ............. 139
Limitations of the Study ......................... 146
Recommendations for Future Research .............. 148
REFERENCES......................................... 151
APPENDIX A......................................... 175
APPENDIX B......................................... 179
APPENDIX C......................................... 196
APPENDIX D......................................... 222
Interpreter Job Satisfaction
viii
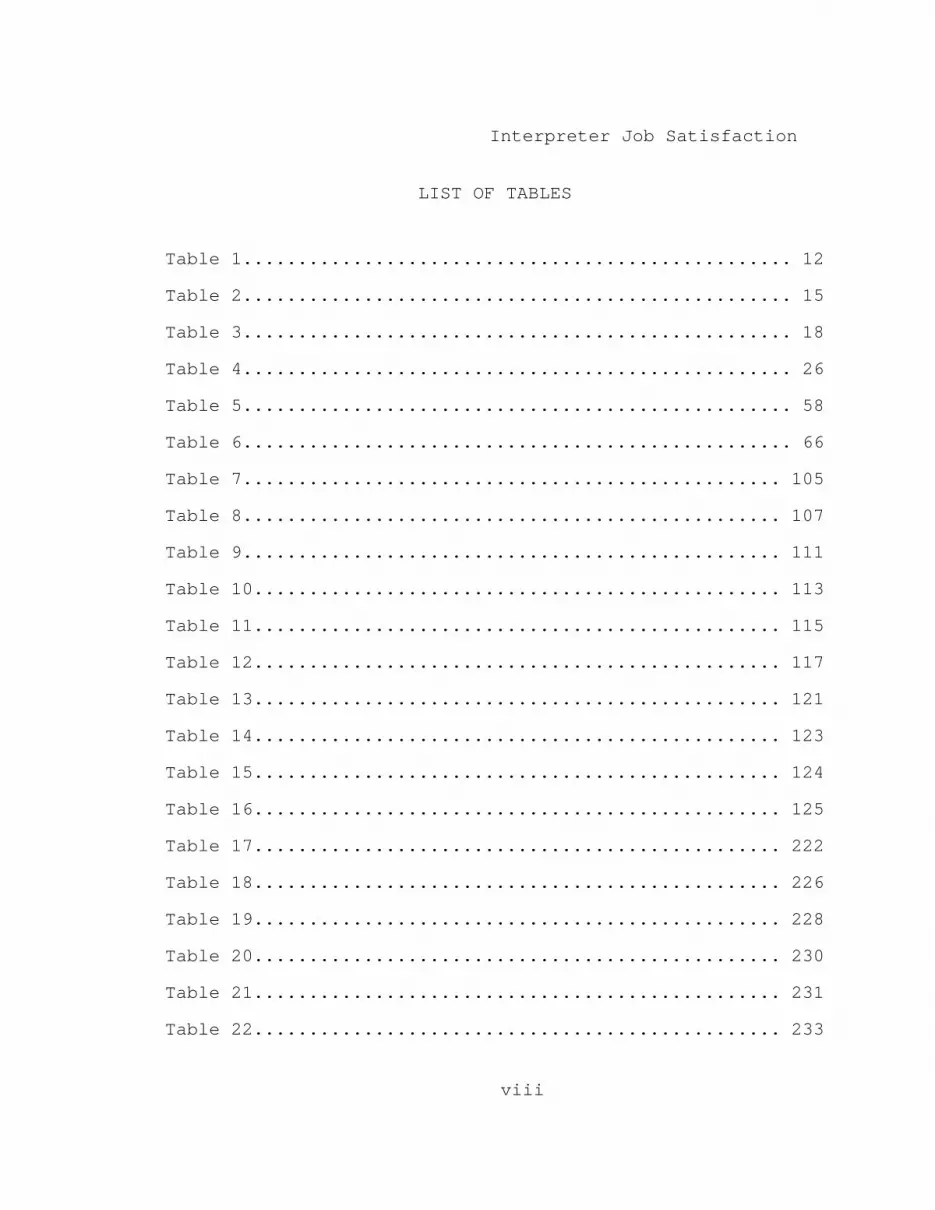
LIST OF TABLES
Table 1.................................................. 12
Table 2.................................................. 15
Table 3.................................................. 18
Table 4.................................................. 26
Table 5.................................................. 58
Table 6.................................................. 66
Table 7................................................. 105
Table 8................................................. 107
Table 9................................................. 111
Table 10................................................ 113
Table 11................................................ 115
Table 12................................................ 117
Table 13................................................ 121
Table 14................................................ 123
Table 15................................................ 124
Table 16................................................ 125
Table 17................................................ 222
Table 18................................................ 226
Table 19................................................ 228
Table 20................................................ 230
Table 21................................................ 231
Table 22................................................ 233

Interpreter Job Satisfaction
ix
Table 23................................................ 234
Table 24................................................ 235
Table 25................................................ 236

Interpreter Job Satisfaction
x
LIST OF FIGURES
Figure 1. Survey Web Site Design......................... 91
Figure 2. Diagram of the Predictors of Job Satisfaction. 138
Figure 3. Web Site Welcome Page......................... 196
Figure 4. Web Site Human Subject’s Issues Page.......... 198
Figure 5. Web Site Decline Page......................... 199
Figure 6. Web Site Decline Exit Page.................... 200
Figure 7. Web Site Introduction to Demographics Page.... 200
Figure 8. Web Site Demographics Page.................... 201
Figure 9. Web Site Job Satisfaction Survey Page......... 210
Figure 10. Web Site Job Satisfaction Survey (Spector, 1994)
Page ................................................ 213
Figure 11. Web Site Autonomy and Role Conflict Subscales
Survey Page ......................................... 217
Figure 12. Web Site Workload Subscale Survey Page....... 219
Figure 13. Web Site Completion/Exit Page................ 220
Figure 14. Web Site Thank You Page...................... 221

INTRODUCTION
Job Satisfaction of Interpreters for the Deaf
Interpreters have been around ever since communication
was possible. If a member of one tribe could not
understand a member of another, an intermediary was used to
enable communication. When we think of interpreters, we
usually think of the spoken language, but we are not
limited in the profession of interpreting by those who use
oral languages. A language interpreter can take a
communication “symbol” from one derivation (source
language) and place it into another (target language),
whether the language is oral or visual. This is the
premise under which sign language interpreters function,
and there are many influencing factors that influence this
process.
Sign language interpreters must consider cultural
variations and nuances when transferring communication from
the source into the target language.
Interpretation is the art and science of receiving a
message from one language and rendering it into
another. It involves the appropriate transfer and
transmission of culturally based linguistic and

Interpreter Job Satisfaction
2
nonlinguistic information. The goal of interpreting
is to transfer a message from a source language into a
target language without skewing it and keeping in mind
the linguistic needs of the recipients of the message.
Interpreting serves a diverse population in a variety
of settings across a broad range of fields and
therefore requires professional interpreters to
possess a breadth and depth of knowledge. (Conference
of Interpreters Trainers, 1995)
In recent years, interpreters for the deaf have become
more visible to the world’s population. In the United
States and Canada, these interpreters, be their method of
interpreting sign language, oral, tactile, or cued speech
can be found almost everywhere. From the emergency rooms
in hospitals to real estate and law offices, wherever there
is a deaf or hard-of-hearing person and a hearing person
who cannot communicate in a mutual language, there is or
should be an interpreter.
The use of interpreters for the deaf has become more
prevalent as more individuals have entered the profession

Interpreter Job Satisfaction
3
of interpreting. This natural progression of the
profession has created the need for work standards, ethics,
and supporting constructs.
Unfortunately, in this new profession, no research has
been conducted in the area of interpreter job satisfaction.
Job satisfaction is a critical concern, especially in light
of the profession’s newness and rapid growth rate, and the
far-reaching impact that interpreters have in the lives of
both deaf and hearing individuals. It is in the
profession’s best interest to know if its members are happy
with their work environment. Such feedback will better
enable recruiters, trainers, and managers to address
effective training of interpreters, hiring, and retention.
Definitions
There are a number of terms used in this paper that
are germane to the interpreting profession, germane to this
research, or both. They are defined here:
Free-lance Interpreter – any professional interpreter
not employed by an agency, company, or corporation on a
full- or part-time basis, but rather working for one or
many such entities on a contractual or “as needed” basis.
Interpreter Job Satisfaction
4
Staff Interpreter – any professional interpreter who
is employed by an agency, company, or corporation on a
full-or part-time basis. These interpreters may also be
referred to as standard wage earner interpreters.
Dependent Contractor – any free-lance interpreter who
works exclusively, or nearly exclusively, for one agency,
company, or corporation, while still maintaining free-lance
status (on a contractual or “as needed” basis).
Independent Contractor – any free-lance interpreter
who does not work exclusively for one agency, company, or
corporation, but rather works for many such entities on a
contractual or “as needed” basis.
Certified – any interpreter who has earned national
certification as recognized by the Registry of Interpreters
for the Deaf, Inc. in the United States, or the Association
of Visual Language Interpreters in Canada.
Employment Status – whether an interpreter works full-
time or part-time.
Background of the Problem
The need for sign language interpreters has increased
greatly since the implementation of the Americans with

Interpreter Job Satisfaction
5
Disabilities Act (Government Printing Office, 1990). Even
though more interpreters are entering the work force than
ever before, there is still a critical shortage of
interpreters throughout the United States and Canada.
Faced with labor shortages, interpreters are finding
themselves working long hours and sometimes under less than
ideal conditions.
Interpreters, functioning as the conduits of
information exchange, cross languages and cultures to
decode and encode messages. Accordingly, interpreters
often find themselves immersed in two cultures--one
grounded in hearing and the other in deafness. In order to
understand how interpreters operate between these two
cultures, Lockmiller (1982) conducted research on the
stressors that interpreters face. Lockmiller (1982) found
that there is a great deal of emotional and job-related
conflict internally for interpreters, who often are left
feeling they must meet the expectations, as unreasonable as
they may seem, of both the hearing and deaf participant in
the interpreting communication process.

Interpreter Job Satisfaction
6
Statement of the Problem
Due to the strains and stresses placed on interpreters
for the deaf, it is prudent to take an analytical look at
how interpreters are handling this situation. Interpreters
often find themselves operating in isolation functioning as
private contract interpreters. Thus they are free from
some of the organizational constraints faced by typical
wage earners. On the other hand, private contract
interpreters may face workplace problems that are different
and/or compounded due to their unique situation.
There are also a growing number of interpreters who
are finding employment as traditional wage earners. Many
companies, organizations, and government agencies are
finding it beneficial to hire interpreters to full-time
positions. This change may be due to the financial benefit
of having an interpreter on the payroll (as opposed to
hiring private contractor interpreters at an inflated cost)
and/or logistic reasons. And such interpreters may be
facing workplace stress that differs from the stress faced
by their private contract counterparts.

Interpreter Job Satisfaction
7
Interpreters often enter the workplace with little
training in the area of people management skills and health
maintenance. Adequate training is critical because most
interpreters, whether traditional wage earners or private
contractors, find themselves as the only individuals in
their vocation at a given job site.
In order to understand how interpreters feel about
their vocation – that is, establishment of a benchmark of
satisfaction among working interpreters. To date, there
has been no research on interpreter satisfaction, with the
exception of two anecdotal studies. Rojas (1987) conducted
one study on spoken language interpreters local to Geneva,
Switzerland, and Watson (1987) studied interpreter burnout.
Rationale and Purpose of the Study
There were five reasons for the present study:
1. Interpreting for the deaf is a burgeoning
profession that needs to be better understood.
2. Interpreters for the deaf have never been
assessed before regarding job satisfaction.
3. There is growing concern among educators and
employers regarding interpreter well-being.

Interpreter Job Satisfaction
8
4. Difficulty has been expressed in recruiting
interpreters who suit the job standards.
5. It is much easier to address and fix problems now
while the profession is young and growing, than
wait until such problems are firmly entrenched in
an establishment that may be reluctant to change.
There present study had four purposes:
1. To clarify and describe the feelings and thoughts
of interpreters about their profession.
2. To explore the implications of satisfaction for
the profession as a whole.
3. To identify methods and policies of increasing
job satisfaction among interpreters for the deaf.
4. To describe the impact, in terms of job
satisfaction and retention of interpreters for
the deaf, of the following variables: gender, job
classification, age, education, tenure,
supervision, salary, promotion, collaboration,
role conflict, workload, autonomy, and working
conditions.

Interpreter Job Satisfaction
9
Research Questions
The results of this study permitted examination of the
bivariate correlations between these variables and job
satisfaction, and it also permitted examination of gender
differences. This study addressed the following research
questions and hypotheses:
Research Question 1
What job-related factors are most highly related to
job satisfaction?
Research Hypothesis 1
There are significant positive correlations between
job satisfaction and the following variables: age, gender,
tenure, supervisory quality, salary, promotion
opportunities, collaboration, workload, role conflict,
working conditions, autonomy, and educational level.
Research Question 2
What job-related factors are related most closely to
job satisfaction among interpreters with different job
statuses (e.g. standard wage earners, independent
contractors, and dependent contractors)?

Interpreter Job Satisfaction
10
Research Hypothesis 2
There are significant positive correlations between
job satisfaction among standard wage earner interpreters
and following variables: supervisory quality, salary,
promotion opportunities, collaboration, workload, role
conflict, working conditions, autonomy, and educational
level.
Research Hypothesis 3
There are significant positive correlations between
job satisfaction among dependent contractor interpreters
and salary, collaboration, role conflict, working
conditions, autonomy, and educational level.
Research Hypothesis 4
There are significant positive correlations between
job satisfaction among independent contractor interpreters
and salary, role conflict, working conditions, autonomy,
and educational level.
Research Question 3
What set of the following variables best predicts work
satisfaction among interpreters for the deaf: age, gender,
tenure, supervisory quality, salary, promotion

Interpreter Job Satisfaction
11
opportunities, collaboration, workload, role conflict,
working conditions, autonomy, or educational level?
Research Hypothesis 5
Collaboration, supervisory quality, and educational
level will emerge as significant predictors of job
satisfaction.
A Review of the Literature
Job satisfaction includes many connecting factors
related to employment. Training, environment, salary,
promotion opportunities, recognition, and ability are a few
of the variables contributing to the larger whole that is
job satisfaction. According to Wood, Chonko, and Hunt
(1993), job satisfaction includes the dimensions of
satisfaction free of cognitive dissonance, variety of
tasks, freedom to perform these tasks, ability to complete
tasks, pay, and security.
When we attempt to identify what makes employees
content, or satisfied, we must first consider what they
want out of an employment relationship. Woolridge (1995)
expresses employee needs while referring to Maslow’s
hierarchy of needs and self-actualization. According to

Interpreter Job Satisfaction
12
Woolridge, business must make the shift from focusing on
the basic needs of employees to those needs that rise above
the survival level.
Table 1
Factors in Herzberg’s Two Factor Theory
Factor Element
Motivators – satisfiers Achievement (pride)
Recognition (praise)
Work (interest/challenge)
Responsibility (tasks)
Advancement (mobility)
Hygiene – dissatisfiers Policy & Administration
Interpersonal Relations
Supervision
Salary
Working Conditions
Motivation theory offers insight into the needs of
employees. One of the better known motivational theories,
Herzberg’s Two Factor theory (Turoff, 1992), is illustrated

Interpreter Job Satisfaction
13
in Table 1. According to this theory, there is a strong
tie between values, goals, and motivation. Additionally,
employees are motivated by considerably more than just a
steady and sufficient paycheck.
Work in its historical perspective, that is, as a
unfortunate necessity, is changing at a rapid pace, and
employers must recognize employee needs at all levels.
Clayton Alderfer (Snavely, 1997) recognized the need for
advancement and friendly competition among coworkers,
issues that were also emphasized by Catlette & Hadden
(1998) in their writings on how organizations strive to
make contented employees.
Herzberg (1968) contends that the opposite of
satisfaction is not dissatisfaction, but rather the absence
of satisfaction. Tietjen and Myers (1996) state, according
to Herzberg’s theory, the presence of motivators creates
job satisfaction, but their absence does not create
dissatisfaction.
Maidani (1991), on the other hand, suggests that
hygiene factors, which include company policy,
administration, supervision, salary, interpersonal

Interpreter Job Satisfaction
14
relations and working conditions, are also sources of
satisfaction, not just dissatisfaction as Herzberg (1968)
contends. While Maidani disputes Herzberg’s findings
regarding hygiene factors, he does support the notion that
motivators are sources of satisfaction.
According to Locke (1976), job satisfaction depends
upon how the individual perceives a discrepancy between
intended performance and achieved or actual performance.
Additionally, satisfaction is achieved when performance is
congruent with one’s values. The closer one gets to
his/her desired performance and the more he/she is in
adherence with his/her values and work ethics, the higher
the level of satisfaction. Values, according to Locke
(1976), have the most significant impact on emotional
response to one’s job.
Tietjen and Myers (1996) interpreted Herzberg’s theory
by contending that attitude is a formidable force in
determining job output and satisfaction. Locke’s (1976)
view that values have a direct impact on work goals and
subsequent satisfaction is complimentary to this
interpretation.

Interpreter Job Satisfaction
15
Table 2
Gallup’s Elements of Job Satisfaction
Element Explanation
Expectations Congruent with values, needs
Materials Tools to do the job
To do what I do best Match with skills
Recognition Management’s appreciation
Supervisor cares Compassion
Encourages development Training is critical
Opinions count Appreciation from others
Mission Tasks count in global objective
Commitment to quality Corporate quality control
Best friend Workplace social interactions
Learn and grow Upward mobility
Progress Can see accomplishments
The Gallup Organization (1999b) has surveyed job
satisfaction extensively. Generally, when a population of
workers is asked how satisfied they are at work, most (79%)
say they are either very satisfied (28%) or satisfied

Interpreter Job Satisfaction
16
(51%). The Gallup Organization (1999c) found a number of
elements that contribute to job satisfaction (see Table 2).
These factors support the idea that job satisfaction is
tied to motivation, with elements of personal growth and
competition playing important contributing factors.
Cooper and Artz (1995) used discrepancy theory to
examine job satisfaction. Discrepancy theory suggests that
individual satisfaction is determined, in part, by whether
there is a “gap” between actual rewards or performance and
individual goals or expectations. This theory also
suggests that satisfaction decreases if there is a gap
between expectations and performance. These expectations
are not only those that a worker places upon him or
herself, but also those that others place on the worker.
Cooper and Artz (1995) found that if they controlled for
performance, entrepreneurs with higher initial expectations
would subsequently have lower levels of satisfaction.
Contrary to discrepancy theory, those who had higher
initial expectations were later more satisfied, not less.
This might suggest, as Staw and Ross (1985) found in a

Interpreter Job Satisfaction
17
longitudinal study of employee satisfaction, that attitudes
are, in part, a function of stable individual traits.
Expansion on the Factors of Satisfaction
As stated earlier, many factors compose what we
consider to be overall job satisfaction. For our purposes,
we will consider factors that are especially important to
interpreters for the deaf. Some of these constructs are
unique to interpreters, although most constructs are shared
across many job categories.
Cross-Cultural Considerations
In 1977, Harboe wrote that sign language interpreters
must take the technical language of judges and lawyers and
make it understandable to deaf people, especially because
deaf people tended to be undereducated (p. 10). Harboe’s
point has validity in terms of the role conflict and
cultural adjustments that interpreters face regularly. An
interpreter is often the only individual in a situation who
is aware of these culture differences.
Harboe (1977) also stated that, “. . . deaf people, by
and large, are not sufficiently trained in how to use an

Interpreter Job Satisfaction
18
interpreter” (p. 10). Presently, deaf people are becoming
better educated and more upwardly mobile. The cause of
their “under education” (and its diminishing continuance)
in the past never reflected the intellect of deaf people,
but rather the ability of the educational systems to
address the different learning styles and needs of deaf
people properly.
Loncke (1995) points out that interpreters, when
working with “minimally language skilled people” (p. 6),
must constantly adjust. He identifies four types of
adjustments. These appear in Table 3.
Table 3
Loncke’s Adjustments
Adjustment Explanation
Linguistic adjustment Vocabulary & repetition
Cognitive adjustment Redundancy and repetition
Adjustment of knowledge World knowledge and reference
point
Adjustment of communication Right style/modality

Interpreter Job Satisfaction
19
These adjustments reflect the paces an interpreter
must go through in order to render the message faithfully
and accurately from the source language to the target
language. Though Loncke’s adjustments are geared towards
those who have lower linguistic skills, these adjustments
are still applicable in varying degrees as interpreters
function in both the hearing world and deaf culture. When
both sides of the language interchange fail to understand
these adjustments, and/or appreciate the difficult
decisions involved, stress for the interpreter can result.
Ultimately, this stress can lead to a lessening of his or
her job satisfaction.
Other researchers agree that interpreters must possess
considerable skill (Anderson & Stauffer, 1991; Bosman,
1995; Irwin & Morgan 1985). Not only must they be fluent
in both the source and the target language, they must also
have skills that allow them to mediate beyond cultural
boundaries. They must be ethical (see Code of Ethics, RID,
1998, p. 34), culturally sensitive, and rhetorically and
pragmatically astute. Professors at the Interpreter
Training Program at Oakland Community College (1991) in

Interpreter Job Satisfaction
20
Oakland, California agree when they report that the
interpreting profession is a demanding one with
considerable physical and intellectual stress.
Interpreters must possess expert knowledge in order to
function effectively using different modes of communication
within a wide variety of environmental settings. They must
be fluent in American Sign Language (ASL), Manually Coded
English (MCE), Signed English (SE), and/or any of the
several Signed Exact English (SEE) systems. They must
interpret in legal, medical, educational, and numerous
other settings with seamless communication. Interpreters
are constantly walking the fine line between explaining the
nuances of language and insulting other participants.
Bourcier (1981) points out that interpreters also feel
a lack of power. According to Herzberg’s theory of
motivation, discussed earlier, interpreters need effective
and strong interpersonal relations (hygiene factors). An
absence of strong interpersonal skills creates
incongruence, as interpreters are often obligated to think
and make decisions for the deaf person, but receive no
Interpreter Job Satisfaction
21
recognition for right decisions and all the blame for wrong
ones.
Working Conditions
Working conditions involve compensation, benefits,
hours and schedules, supervision, evaluation,
mentoring/support, professional development and
advancement, and physical environment. Hurwitz (1995)
states that working conditions and compensation for
interpreters vary widely. The implementation of PL 94-142
in 1974 (implemented in 1976) created a tremendous demand
for sign language interpreters, a demand that increased
significantly with the passage of the Americans with
Disabilities Act in 1990. Both pieces of federal
legislation caught interpreters and educators largely
unprepared. Hurwitz (1995) also makes the following
contentions:
1. The interpreter’s role is largely undefined.
2. There is little training for interpreters who
engage in educational interpreting.
3. In schools where interpreters are employed,
working conditions are poor and turnover is high.

Interpreter Job Satisfaction
22
4. Many people falsely equate signing skill to
interpreting skill.
5. Many interpreters in the U.S. and the world
suffer from repetitive motion injury, or upper
extremity cumulative trauma disorder.
6. Interpreters report that they are isolated.
With regard to #4 above, fluency in any language does
not imply the ability to interpret to and from that
language. A person must engage in a totally different
cognitive process while interpreting, a complex process of
receiving a message in one language and delivering it in
another language.
Hurwitz (1995) suggests that supervision and mentoring
of interpreters can lead to increased stamina and a larger
repertoire of tools with which to handle the multifaceted
tasks of the job. Supervision, mentoring, and training,
according to Hurwitz, are important factors in preparing
interpreters for their critical work. They are also
important variables in the gestalt of job satisfaction
among interpreters.
Interpreter Job Satisfaction
23
Training is an extremely important construct
influencing work conditions and overall job satisfaction.
As early as 1985, Barber-Gonzales, Preston and Sanderson
(1985) reported that the National Center on Deafness at
California State University Northridge provided numerous
programs and avenues for improving working conditions.
These ranged from workshops for stress, performance
recognition, and in-services. It appears that most
training for interpreters regarding stress is directed
toward those who are employed as staff interpreters. This
does not include free-lance and private contract
interpreters who are in essence functioning as self-
employed entrepreneurs or the interpreters who consider
themselves the “lone wolf” (Hurwitz, 1995, p. 9). These
dependent and independent contractors may not be benefiting
from job-based training that alleviates job tension and
improves overall working conditions.
Woll & Porcari (1995) state that there are also some
negative social implications of using, and being, an
interpreter. Interpreters are often the focus of attention
in the working environment, seen as an oddity. This can be

Interpreter Job Satisfaction
24
uncomfortable for the deaf person, especially if they do
not want to draw attention to themselves in a large room.
It also can be disquieting to the interpreter, especially
those with low self-esteem or confidence. It is akin to
being under a magnifying glass, and not everyone is
comfortable in this situation. Cassell (1984) believes
that interpreter training programs (ITP’s) must accept the
responsibility of enabling students to handle themselves in
a professional manner. This type of training should equip
these future interpreters to handle themselves with
confidence and professionalism while under the consumers’
scrutiny.
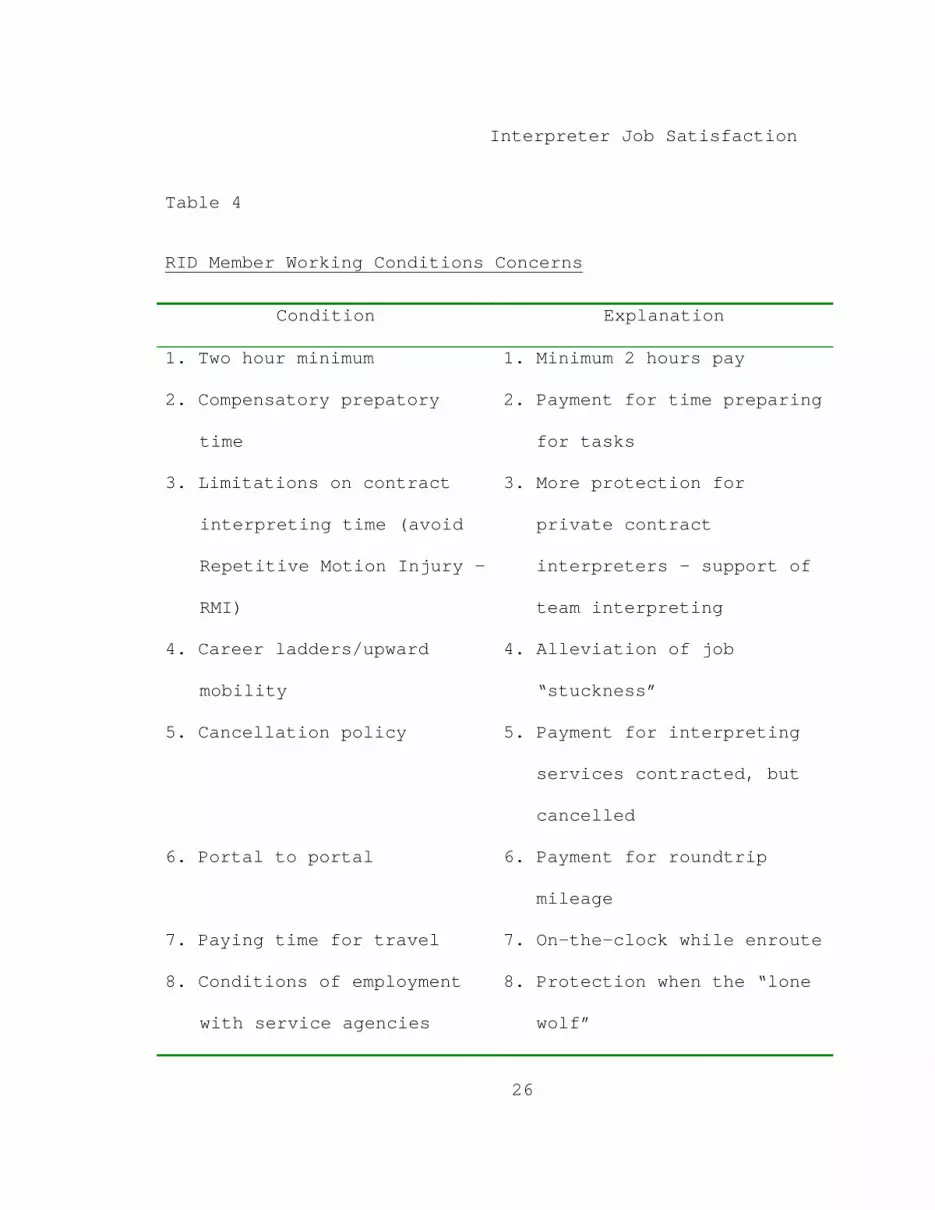
The Registry of Interpreters for the Deaf (1993)
membership discussed the issue of working conditions during
their 1993 convention. Subjects of interest are outlined
and explained in Table 4. Many of the items discussed in
this workshop showed the infancy of the profession and the
lack of standardized practices in the profession. It also
showed a lack of the public’s understanding of the
job/profession. Where working standards in other
professions are well-developed, or at least instituted,

Interpreter Job Satisfaction
25
fought for, and supported by labor unions, interpreters are
now struggling to build a foundation of minimal working
conditions.
Woll (1988) reported that the 12 member countries of
the European Community recognized that some standards need
to be established with regard to working conditions for
interpreters for the deaf. Some six years later, The
European Forum of Sign Language Interpreters (1994)
published a booklet that highlighted working conditions in
over 12 European countries. This booklet demonstrates that
most countries have some form of training for interpreters
as well as written guidelines for working conditions.
Switzerland has a training program that consists of 1800
“lessons” (p.7). They also have rather sophisticated
standards for interpreter working conditions. England,
Wales and Northern Ireland have an extensive training
program for interpreters, as well as an interpreter’s exam
(RSLI examination). However, there seems to be no common
thread between, and even within countries for the most
part.
Interpreter Job Satisfaction
26
Table 4
RID Member Working Conditions Concerns
Condition Explanation
1. Two hour minimum 1. Minimum 2 hours pay
2. Compensatory prepatory
time
2. Payment for time preparing
for tasks
3. Limitations on contract
interpreting time (avoid
Repetitive Motion Injury –
RMI)
3. More protection for
private contract
interpreters – support of
team interpreting
4. Career ladders/upward
mobility
4. Alleviation of job
“stuckness”
5. Cancellation policy 5. Payment for interpreting
services contracted, but
cancelled
6. Portal to portal 6. Payment for roundtrip
mileage
7. Paying time for travel 7. On-the-clock while enroute
8. Conditions of employment
with service agencies
8. Protection when the “lone
wolf”

Interpreter Job Satisfaction
27
Despite growing concern among the interpreting
profession regarding working conditions, limited research
has been done on this subject. Carstensen (1994) discussed
that Denmark issued a survey to interpreters gauging
working conditions, and most reported physical distress
associated with their job. Ninety-five percent said they
had motion disorders in the past year. Among interpreters
for the deaf, physical distress and injury is tantamount to
the potential loss of the very tools (their hands) they
need to perform their vocation.
Interpreting Standards
Interpreting standards concerns the professional
requirements that various entities place upon practicing
interpreters. Utah State Board of Education (1997), like
other states, is aggressively addressing the issue of state
certification for interpreters (Virginia Department of
Education, 1993). These states recognize a shortage of
certified interpreters and want to develop their own state
system. The idea behind establishing a state system is
plausible, as it sets minimum standards for practicing in
the states. However, such state systems (sometimes called

Interpreter Job Satisfaction
28
Quality Assurance systems) have limited reciprocity to
other states.
One problem that states confront when they implement
rigid statewide requirements for interpreters is that they
effectively eliminate many interpreters who are already
working in the system. This problem is indicative of the
less than satisfactory quality of many interpreters who are
already working, causing many states to establish a waiver
system so present interpreters can eventually come into
compliance (Virginia Department of Education, 1993).
Simply because states mandate minimum standards for
interpreters does not automatically lead to compliance.
Stewart and Kluwin (1996) found discrepancies between
guideline recommendations and what actually happened in the
interpreting environment (schools). The implementation of
standards is simplistic compared to the development of
mechanisms by which these standards can be monitored and
compliance ensured.
Many states, such as Ohio, still give the auspices of
awarding certification to national testing bodies (e.g. The
Registry of Interpreters for the Deaf, Inc; The National

Interpreter Job Satisfaction
29
Association of the Deaf, Inc.), but require the interpreter
be certified nonetheless (Ohio Interpreter Standards
Committee, 1998). The problem with requiring national
certification, as with state certification, is that there
are insufficient interpreters who meet these standards.
D. A. Miller (Personal Communication, February 9,
1999) says that Nebraska, while instituting state
certification standards, has a waiting list over one year
long to take the examination. Perhaps states are
establishing unreasonable standards that they cannot meet;
requirements that neglect to recognize the already critical
shortage of interpreters.
Interpreters for the deaf may be able to point to
spoken language interpreters for solace. Viaggio (1996)
states that spoken language interpreters have accomplished
much in the past 50 years. Considering that interpreters
for the deaf did not formally organize until 1964 (Registry
of Interpreters for the Deaf, 1998), perhaps interpreters
for the deaf are about 20 years behind spoken language
interpreters, and improvements will evolve over time.

Interpreter Job Satisfaction
30
Unfortunately, the present situations for
interpreters, who lack professional work standards, can
cause stress and discord. The present situation can lead
to animosity between qualified, trained interpreters and
those who are not qualified but are in high demand due to
the severe shortage of interpreters.
The concept of interpreter standards not only includes
nationally or locally recognized certification, but also
what employers and consumers expect from interpreters.
There is extensive discord among deaf people, educators,
and interpreters with regard to sign language and what may
constitute a “sign system.” Sign systems refer to those
methods of communication for the deaf that usually
constitute a contrived system of symbols, rather than a
natural progression of a maturing language as found in
American Sign Language (ASL). The Canadian Association of
the Deaf (1994b) is in direct opposition to sign systems,
only recognizing American Sign Language (ASL) and la Langue
des Signes du Quebec (LSQ) as the only official, working
sign languages in Canada. This contention within the Deaf
community often places interpreters in the precarious

Interpreter Job Satisfaction
31
position of being required by a school district or other
paying entity to interpret in a given “sign system” with
many political undertones directed towards the interpreter.
In a conflicting report, The Canadian Association of
the Deaf (1994a) supports the right of deaf people to use
sign systems in interpreting situations. This is a
conundrum. This paradox exemplifies the confusion that
many people who are deaf or who work in the field of
deafness face. There is strong public outcry to adhere to
politically correct behavior and “standards,” but sometimes
these requirements neglect to consider the present
condition of the population. This discord and confusion
place the interpreters in the middle, trying to please both
sides of the interpreting equation, but usually only
managing to satisfy one. This disparity among institutions
and people who use interpreters may lead to an erosion of
job satisfaction among interpreters for the deaf.
Interpreter Shortages
As addressed earlier, the demand for interpreters far
surpasses supply. According to the Virginia Department of
Education (1993) there is an inadequate supply of

Interpreter Job Satisfaction
32
interpreters to meet local school division demands.
Despite the implementation of standards, the limited supply
of interpreters cannot be brought into compliance (with
state standards) fast enough.
Supply shortages date back to the beginning of time.
When the caveman realized that he was short on food, he
went out to slay another animal. When the supply of
animals diminished, surely the caveman devised an
alternative solution, lest he painfully experienced his own
demise. The caveman learned that the food supply was
cyclical and he had to plan his hunting and storage of food
to coincide with the supply cycles.
Business addresses the supply-demand equation in a
similar manner to that of the caveman. Demand can create
an abundance or shortage in supplies, as can over- and
under-production. It is the responsibility of business to
constantly have its pulse on economic indicators in order
to plan compensatory measures to achieve a desired balance
of supply and demand. Of course, as history has
demonstrated, supply shortages can be contrived in order to
achieve financial gain, political advantage, and other
Interpreter Job Satisfaction
33
economic, social, and political leverages. A prime example
of this was the oil shortage experienced in North America
(and worldwide) created by the Middle East oil embargo.
Surely some of the shortage was real, but much of it was
contrived in order to manipulate pricing.
Skilled labor is in short supply in a number of
industries. This is due, at least in part, to the
refinement of labor, namely the specialization of skills.
According to Green, Machin, and Wilkinson (1996), this can
be attributed to a number of other factors, including an
expanding product market, and new technology development
with lack of trained labor.
Lewis (1998) suggests that many of our shortages are
self-inflicted. Regarding computer specialists (e.g.
information technology gurus), the personnel pool is
shrinking due to restrictive requirements on applicants to
enter this pool (advanced degrees, numerous years of
experience). Lewis’ (1998) observations suggest that
businesses and trainers have ineffectively predicted future
labor needs.

Interpreter Job Satisfaction
34
Jerry Jasinowski, president of the National
Association of Managers, believes that the greatest
jeopardy to business growth in the U.S. is an
“…[in]adequate supply of workers or adequately trained
workers” (Reuters, 1998). Jasinowski suggests that
increased immigration and earmarking by employers of ample
training dollars may be two methods for alleviating the
human resource supply “pinch” (Reuters, 1998). Detractors
from Jasinowski’s position might point to NAFTA (North
American Free Trade Agreement) as an example of what
happens when labor needs cannot be met and businesses go
elsewhere to manufacture their products.
Others seem to echo Lewis’ (1998) position regarding
corporate America creating its own problem of diminished
labor resources. Donahue (1998) suggests that we have
created our own problem to a great degree – computer
technology has created a huge demand for those with
computer skills and displaced many unskilled, or
differently-skilled workers. In this sense, technology and
its fallout prove to be a double-edged sword.

Interpreter Job Satisfaction
35
Fisher (1997) believes that the fallout of the air
traffic controller strike during the Reagan era, a
revamping of human resource policy, has global
implications. He points out that attracting, motivating,
and retaining employees must be a part of cultural and
institutional norms. If anything, the emphasis in recent
years has been for an employee to go “where the grass is
greener.” Employee loyalty to a firm has become a
negligible issue in many industries. It is rare for the
contemporary employee to work for a company their entire
working lives. We need look no further than free agency in
Major League Baseball, a trend that typifies the American
workers’ changing ethic.
According to Green (1998), demographic changes have
reduced the labor supply, with “. . . fewer people ages 16-
34 are [sic] entering the labor force than was the case
over the past few decades--approximately one-half the rate
of the 1980s--and a growing number of workers are retiring”
(p. 34). Couple this with the fact that the proportion of
older and retired Americans is increasing, we can then see

Interpreter Job Satisfaction
36
that we have a shrinking human resource pool serving a much
larger (and longer living) population.
In the sign language interpreting profession there has
been an unusual situation related to demographics. Until
recently, most interpreters for the deaf were those who had
deaf parents (Children of deaf adults, or Coda’s).
Interpreting, moving from a gratis profession to one that
is legitimate and financially rewarding, is blossoming and
has had to increase the range of its demographic draw.
Other non-Coda’s are entering the field, but they are not
entering fast enough to meet the demand.
Green (1998) also points that out we have experienced
a large number of women entering the work force in the past
50 years. This infiltration seems to be leveling off and
indeed may be shrinking due to the number of women who are
reconsidering their decision to leave the home, now opting
to raising their families as stay-at-home moms.
Many companies are utilizing private contract
individuals in lieu of employees, a trend that the IRS as
undoubtedly opposed. The use of private contractors has
been led to a great degree by the federal government,

Interpreter Job Satisfaction
37
turning to downsizing (right-sizing) and outsourcing to
curb federal spending. This complements those individuals
who wish to work from their home or exercise more freedom
in their degree of mobility. The ability to work from
one’s home is especially important in highly congested
areas where commuting to and from work is counter-
productive. In the interpreting industry, the majority of
interpreters are private contract workers. This has come
out of necessity, mostly due to the “newness” of the
profession and the lack, until recently, of central points
for referral/employment.
Green (1998) points out the companies are shifting
their geographic locations, enticed by the lower cost of
moving to rural areas where they can pay less in the form
of taxes. This does not necessarily mean that the labor
pool they need moves with them. Employers must adapt to
the change, either paying for relocation of employees, or
training the existing labor pool.
Housing shortages (Green, 1998) may also influence the
availability of a sufficient human resource pool. This is
especially true in situations where companies have

Interpreter Job Satisfaction
38
relocated or the rapid growth of companies in certain areas
has exceeded the growth of available housing and/or the
human resource pool. In the interpreting industry this has
far-reaching implications, as the need for interpreters in
certain geographic regions has exceeded their availability.
The Registry of Interpreters for the Deaf (RID),
addresses the shortage of interpreters in its mission
statement: “. . . RID has worked diligently to provide the
three Q’s of interpreting: Quantity, Qualification and
Quality” (Registry of Interpreters for the Deaf, 1998).
However, as suggested earlier, local governments are
becoming less reliant on RID to set a standard of quality
for interpreters and are more frequently establishing their
own local testing and quality controls. Despite RID’s best
efforts, RID membership and/or certification is not seen as
a necessary requirement in order to practice the profession
of interpreting. Many interpreters forgo the expense of
joining RID, opting for a working environment where there
are no ties to a professional association of interpreters.
This could be due to a lack of confidence in RID, monetary
concerns (although RID membership is less than $100

Interpreter Job Satisfaction
39
annually), or fear that RID will require them to adhere to
ethical standards that they do not support or endorse.
Another reason that interpreters are in increasing
demand is the rising number of job opportunities for deaf
people. Deaf people are becoming more upwardly mobile and
need interpreters on a more frequent basis (increased need
to communicate with the hearing majority). There has been
a change in the curriculum for deaf children. Due to PL94-
142 the focus is now on mainstreaming into public school
settings, and this requires an exponential increase in the
number of interpreters in the classroom.
Paradoxically, as the need for interpreters increases,
it has become increasingly difficult to recruit them to the
profession. Interpreter pay, while increasing in recent
years, is not on a par with that of spoken language
interpreters. Interpreting for the deaf is seen as a
social service/civil servant function, with pay that
reflects a lack of understanding or appreciation for the
profession. While referral agencies may wish to increase
the rate of pay to interpreters, third party users of the
service often contest even minimal payment for a service

Interpreter Job Satisfaction
40
they perceive as benefiting a small minority of the
population (akin to funding for “orphan” diseases).
K. Shirley (Personal Communication, February 12, 1999)
suggests that money is not always the deciding factor when
recruiting an interpreter. Often the candidate is more
interested in support they will receive once they are
hired, as well as opportunities for professional growth and
job variety. B. Way (Personal Communication, February 24,
1999) says it is not always money that is the top priority
when hiring interpreters in British Columbia and Alberta,
but also the stability of the position. In Way’s school
district it is often difficult to hire interpreters because
the Ministry personnel are not always receptive to hiring
interpreters on a full-time basis, preferring to only
provide interpreter’s employment for the school year. This
employment is always in jeopardy – if a student withdraws,
the interpreter is terminated. It would appear to be
valuable to recruiters to know what interpreters want and
what creates higher levels of satisfaction.
The crisis of insufficient human resources to meet the
demand for interpreting has led some employers to be novel

Interpreter Job Satisfaction
41
in their approach to a solution. Some interpreter referral
agencies have attempted to thrive without a professional
staff, depending solely, or heavily, on private contract
interpreters (free-lance interpreters) to perform all
revenue producing work (interpreting). This is very risky
in terms of ability to perform the work as private contract
interpreters notoriously have full schedules and are
difficult to retain on short notice.
Additionally, as a serious caveat, the Internal
Revenue Service (IRS) has made it a point to more strictly
define what a private contractor is, especially as it
relates to an employer’s ability to avoid payment of
matching withholding taxes.
The sum result of interpreter shortages has created an
unhealthy and dangerous burden on the interpreters working
in the profession. Frequently one interpreter is sent to
an interpreting situation when two are required. Best
practices in the profession suggest two interpreters on any
engagement that lasts over two hours, and in some instances
one-and-one-half hours. This creates physical and mental
stress on the interpreter who is sent, expected to do the

Interpreter Job Satisfaction
42
job of two. Interpreters who must work in these situations
are endangering their very livelihood with increased
incidence of Cumulative Motion Injury/Repetitive Motion
Injury (RID, 1998), as well as mental fatigue.
All such factors can lead the interpreter to lose
faith in their profession, their job, and their ability to
provide the service in a professional manner.
Subsequently, the interpreter suffers a loss in vocational
satisfaction, prompting the interpreter to leave the
profession for something with less stressors.
Other Labor Concerns
Job satisfaction in general is also affected by other
factors, including how the employees were trained,
recruited, mentored, and what initiatives were instituted
to retain them. Because today’s workforce is highly
mobile, of increasing concern is the issue of training,
especially for new employees and those who are required to
acquire new skills. This coincides with The Gallup
Organization’s (1999c) contention that changing job tasks
creates great tension and lack of satisfaction, while

Interpreter Job Satisfaction
43
training appropriately resolves some of the tension and
dissatisfaction.
Coaching or mentoring employees, whether they are new
to the job or seasoned workers, has gained a great deal of
credibility in the past decade. The concept of mentoring
is not a new one – it has been around, at least informally,
since ancient times. No doubt the experienced hunter
brought the adolescent into the wild to teach, guide, and
support the “recruit.”
What is mentoring on a formal level? In most
instances in vocational settings, mentoring can be
described as a structured, enduring relationship between
two individuals with one providing help, support, and
guidance to the other (Angle, 1998). Though mentoring
shares many of the traits of friendship and can develop
into friendship, its focus is often directed to a
particular skill to be learned, an issue to be examined, or
some other specific problem to be solved.
Another method of alleviating the shrinking human
resource pool in certain trades/professions is through
active and creative recruitment. This does not mean
Interpreter Job Satisfaction
44
recruitment that is unmeasured or haphazard. Bellinger
(1998) points out that companies need to carefully examine
the procedures they use for recruitment, discarding
ineffective measures and capitalizing on the effective
ones. Employers should also consider community college
programs, as these are often successful in attracting
students who can become the company’s future workers.
The Nursing Recruitment and Retention Taskforce (1998)
cites that recruitment in nursing is accomplished by
strengthening partnerships between undergraduate and
graduate programs, clinicians, and others. It is not
significantly different in the interpreting profession.
The Virginia Department of Education (1993) says that those
who are responsible for training educational interpreters
should assume leadership for the recruitment initiative.
If strong relationships are formed between employers and
high schools, interpreter training programs and other
feeder institutions, recruitment efforts are ultimately
improved.
H. L. Reed (Personal Communication, February 17, 1999)
says that it is difficult to recruit interpreters because

Interpreter Job Satisfaction
45
of keen competition from other agencies who need
interpreters. Not only are many organizations looking to
recruit interpreters for employment, many others are also
willing to contract with interpreters on an as-needed
basis. Interpreters can make a comfortable, livable salary
as free-lancers (private, independent contract
interpreters), so there is minimal incentive for these
interpreters to give up this freedom in exchange for full-
time employment. This has led many agencies to contract
for interpreting services.
The Swedish National Association of the Deaf (1991),
along with other special interest associations, are
attempting to address the issue of recruiting interpreters.
They recognize the need will increase, making an already
short supply of interpreters a critical one. Like any
other commodity, educators in Sweden recognize that
interpreters must be actively recruited and the profession
of interpreting must be aggressively marketed as a viable
vocation.
Once the interpreter is recruited, the ideal situation
would be retention of the employee for an extended period

Interpreter Job Satisfaction
46
of time. If employees are not satisfied with their job
situation they will either opt for a new employment
situation or continue in their present job as an unhappy,
dissatisfied, and possibly disgruntled employee. There is,
or at least should be, an obvious relationship between an
organization’s success and its ability to retain satisfied
employees.
Human resource shortages due to the high turnover of
employees are destructive to the stability and growth of
any company unless such turnover is expected and planned
for. Other theories, issues, and forces previously
mentioned focus on alternative strategies to increase the
influx of human resources (supply) into the supply-demand
chain. Retention is the logical issue a company must
consider internally, a force under its own control in most
instances.
According to Catlette and Hadden (1998), one method to
curb human resource shortages is through proactive
retention of employees. Their methods, as outlined in The
Contented Cows Book (Catlette & Hadden, 1998) focus on
getting employees committed, showing them you care, and

Interpreter Job Satisfaction
47
enabling them to achieve their top performance. The
authors (Catlette & Hadden, 1998) suggest such employee
perquisites as flexible work weeks, compressed work
schedule, telecommuting, childcare, and gourmet cafeterias,
to name a few.
Russ and McNeilly (1995) cite experience and
performance as predictors of turnover. Inexperienced
employees tended to leave sooner and firms should try to
improve their satisfaction, promote, and give them a reason
to stay. Performance is an issue because top performers
always see the grass greener on the other side. The
excellent employee tends to experience a loss of
satisfaction with their present situation. They will
always think they should be able to do better elsewhere,
especially if they are dissatisfied with their present
situation.
Training Specific for Interpreters
As previously stated, American workers greatly value
training as a method to alleviate job stress and increase
job satisfaction (The Gallup Organization, 1999c).
However, in the interpreting profession it appears that our

Interpreter Job Satisfaction
48
best efforts may be falling short. Irwin and Morgan (1985)
state that training programs do not provide potential
interpreters with instructions, guidelines, or sufficient
information to make decisions about educational
interpreting. The role of the interpreter needs to be more
clearly defined. The same can be said for interpreters in
all settings, as many enter the field with little
preparation to handle the rigorous requirements of the
profession.
Although this training gap may have narrowed in the
past 14 years, there is reason to believe that there may be
continued inadequate training for educational interpreters,
and interpreters for the deaf in general. Elliott & Povers
(1995) did research that supports this notion; there is a
need for specialized training for educational interpreters.
The U.S. Department of Education (1997) has identified
10 awards of $120,000-$160,000 each that will go to new or
existing programs for interpreter training. A little over
$1 million appears to be inadequate federal support for a
service that is required under The Americans with
Disabilities Act (Government Printing office, 1990). With
Interpreter Job Satisfaction
49
over 500 thousand deaf Americans, this equates to less than
$2 per deaf person in order to insure adequately prepared
interpreters.
In some areas we are losing Interpreter Training
Programs (ITP’s). According to The Canadian Hearing
Society (1996), Sheridan College in Ontario announced the
closing of their ITP. Rather than taking steps forward,
some areas are taking steps backwards by not affording more
training to prepare interpreters. Sheridan closed
reportedly because of provincial government budget cuts.
Tseng (1992), in addressing the problems in Taiwan
regarding spoken language interpreting, states that formal
training programs must have competent trainers. If they do
not exist they must be cultivated. The same must apply to
interpreters for the deaf. The Conference of Interpreter
Trainers (CIT) is a member association in the United States
comprised of sign language interpreter educators. Despite
the best efforts of this association to provide training to
new and working interpreters, it does not seem to be
sufficient. Interpreters, especially in rural areas, go
without new or continued training due to demographic and

Interpreter Job Satisfaction
50
geographic constraints. Additionally, CIT may not be
promoting their own directory of interpreters trainers to
those who can provide and pay for the programs. Even
though CIT trainers may be superbly qualified to train
future and present interpreters, the limited number of
trainers available may not be sufficient to meet demand.
(Conference of Interpreter Trainers, 1998).
Limited research has been done on ITP's. Most of what
has been done was for institutional or "in house" purposes.
Smith and Gorelick (1979) conducted a survey of the
effectiveness and efficiency of recruiting and training in
ITP’s approximately 20 years ago with results that were
inconclusive. Massoud (1994) offered a review of Mott
Community College’s ITP, but the result was actually a
descriptive summary of what the program offered.
Program administrators complain of students entering
interpreting programs ill-prepared. Wilcox (personal
conversation, January 31, 1999) says that students often
have to be “taught” the language (American Sign Language) –
the actual process of learning interpretation cannot begin

Interpreter Job Satisfaction
51
until after the students have effectively become fluent in
the language.
In order for interpreters to enter the profession
fully prepared, ITP's and other training options must be
fully explored, funded, and expanded. A poorly trained
interpreter is likely to become a dissatisfied one,
disillusioned and destined to leave the profession
prematurely, in addition to providing poor or unethical
service to deaf and hearing consumers.
Personal Issues
The personal issues and conflicts that interpreters
face on a daily basis can be alleviated, in large part, by
proper training and preparation. Lockmiller (1982)
contends that interpreters are under a great deal of
pressure, rarely enjoying the satisfaction that they have
had any involvement in resolving any problems that have
arisen during the communication/interpretation process.
They are seen as passive participants in a communication
process, and must be so, according to strict adherence to
RID's Code of Ethics (RID, 1998). For an interpreter to be
truly effective they must be "invisible." Invisibility,
Interpreter Job Satisfaction
52
the concept that the interpreter is a transparent channel
through which communication is encoded and decoded, is a
goal yet a paradox for interpreters. The interpreter who
is successful often feels worthless, meaningless, and never
recognized for their hard work (Lockmiller, 1982). They
feel powerless to influence the outcome of the
communication situation in any way.
As aforementioned, the short supply of interpreters
has led many to work long hours, often out of necessity.
This can result in burnout in the most motivated
interpreters. New interpreters, as well as seasoned ones,
become disillusioned and cite feelings of exhaustion,
depression and being overwhelmed. Lockmiller (1982) says
that interpreting students, or any interpreters entering
the profession, need to be told about burnout and how to
prevent it.
Watson (1987) first examined interpreter burnout,
mostly in an anecdotal manner. The number of interpreters
who were leaving the field due to stress and exhaustion
alarmed her. Two years earlier, the Conference of
Interpreter Trainers (1995) stated in their standards that

Interpreter Job Satisfaction
53
ITP’s must include in their content instruction in stress
management and personal health care. Today, few (if any)
ITP's require or provide stress management classes.
Recruiters should also consider looking for
interpreters who provide the best fit to meet the stress
and other requirements inherent to the profession. Taylor
and Elliott (1994) report, in their survey of interpreters
and trainers, that 75% of all respondents believed that
“attitudinal requirements are equally as important as those
for knowledge and skills” (p. 186). Assuming a valid
survey, it appears that three-fourths of the population
believe that the interpreter’s attitude, and indeed their
personality are integral factors in ensuring an one’s
success in the profession.
Luciano and Swartz (1997) found, as did Blake (1997),
that personality type and job satisfaction are
interrelated. Blake cites Myers (1980) in stating that the
S/N (Sensors/Intuitives) preference is dominant in
predicting career choice (earlier identified by Doerfert
and Wilcox, 1986). Sensors are fact oriented, while
intuitives are drawn to possibilities, and both can be

Interpreter Job Satisfaction
54
profiled in Myers-Briggs as well as the California
Personality Inventory as used by Luciano and Swartz (1997).
As Provost (1990) suggests, if we do not work in a
profession that is congruent to our personality type, then
undue stress can be experienced. Provost also found that
many interpreters were Myers-Briggs NF types
(Intuitive/Feeling). This is not surprising – interpreters
are people who base decisions on values, harmony, and mercy
(Provost, 1990).
Studies on Satisfaction in General
The Gallup Organization (1998a) reported:
Traditional employee attitude/satisfaction surveys
have proven only moderately useful as an instrument
for improving the workplace. Because these surveys
attempt to measure employee attitudes about a range of
often unrelated issues, they lack a central workplace
focus. In addition, such surveys are usually
infrequent, isolated events, occurring every few years
that produce spasms of "fix-it" action plans but no
sustainable improvement.

Interpreter Job Satisfaction
55
Despite this report, we still cannot discount satisfaction
surveys as meaningless, snapshots of employee attitudes
about their employment situation. Perhaps if we collect
data about employee satisfaction, and do nothing with our
findings to improve noted problems and deficiencies, we are
guilty of complacency as charged by Gallup (1998a).
Among survey instruments, the Job Satisfaction Blank
#5 (JSB) was one of the first used, developed by Robert
Hoppock, the pioneer of job satisfaction research (Hoppock,
1935). It is a four-item, 7-point Likert scale measure of
global job satisfaction. Like most job satisfaction survey
instruments used today, subjects respond by checking
weighted value statements that ask how much they like their
jobs, how much of the time they are satisfied with their
jobs, how they view the prospect of changing their jobs,
and how much they enjoy their jobs compared to other people
they know.
Crites (1969) indicated 30 years ago that the JSB is
the "best- known and most widely used measure of job
satisfaction" (p. 480). Crites (1966) says that the
Hoppock Job Satisfaction Blank #5 (JSB) is probably the

Interpreter Job Satisfaction
56
best survey for most purposes because it is easy to
administer and score, takes only a few minutes to complete,
and is applicable to all occupations. The JSB assumes that
global job satisfaction is different than a simple
summation of components of the job (Crites, 1969), i.e. the
whole (gestalt) is greater than the sum of the parts.
Thus, when completing the instrument, employees are
expected to sum their likes and dislikes of the job and
weigh them subjectively by personal importance (Crites,
1969).
Bersani and Heifetz (1985) wrote on job satisfaction
among staff members in community residences for mentally
retarded adults. They identified a separation of stress
between work related and resident-related (violent
behavior). They used the JSB developed by Hoppock in 1935,
and examined both work-related satisfaction, and object-
related satisfaction on the job. Their results indicated a
dual track of job satisfaction, one influenced by clients
and the other influenced by the work that was not directly
influenced by clients. This is one of the earliest surveys

Interpreter Job Satisfaction
57
done where interpersonal behaviors were assessed separately
from actual job duties.
Numerous other studies have examined a multitude of
factors that influence job satisfaction (see Table 5). As
we can see from Table 5, employee satisfaction is related
to age, salary, job stability, management style, and
employee involvement, to name only a few factors. Heneman,
Eskew and Fox (1998) wrote on job satisfaction surveys as
they have been used in the military. They found that
satisfaction is again related to pay, rating of
performance, and pay-for-performance. The latter is a new
policy being implemented by the federal government that
bases employee salary increases on the quality of work
done; a method that has been used by the private sector for
decades.

Interpreter Job Satisfaction
58
Table 5
Job Satisfaction Research Summary
Study Findings
1. George and Baumeister
(1981)
1. low salary and excessive job
variation were major contributors
of stress
2. Campbell et al
(1976); Herzog and
Rogers (1986); Bernal
(1998)
2. have lower expectations and
aspirations as we age – easier to
achieve satisfaction
3. McNeely and Meglino
(1994)
3. a positive relationship between
job satisfaction and extra-role,
prosocial behavior
4. McNeal (1996);
McNeese-Smith (1996);
Jun (1998)
4. satisfaction was related to
management style and ability to
empower employees
6. Lee (1990); Tett
(1993)
6. intention/withdrawal cognitions
and personality type strongly
predict satisfaction

Interpreter Job Satisfaction
59
A number of studies have been done recently in the
computer and technology industries on job satisfaction.
Because this industry is a burgeoning, growth industry,
there is a great deal of interest in how the employees are
faring. Of special interest are effective methods of
attracting and retaining these workers because they are in
such short supply.
In one study, Goff (1998) identified the following
areas when examining Information Technology (IT)
professionals for job satisfaction: salary, opportunity for
advancement, use of new technologies, challenging
assignments, career/goals planning, access to training,
manageable stress, and overall job satisfaction. His
findings suggest that managers create many problems with
regard to employee job satisfaction; in effect, managers do
not understand the employees or their jobs. When asked
what factors would increase their job satisfaction, they
ranked performance bonuses, salary increases, and training
availability. Goff (1998) also found:
1. Women are much less satisfied than men.
2. Satisfaction varies greatly according to age.

Interpreter Job Satisfaction
60
3. Senior computer IT managers have higher stress
but higher satisfaction.
In another study on IT professionals, Paschke (1998)
suggested the following improvements to increase job
satisfaction:
1. Ensure that work is interesting, challenging, and
varying.
2. Establish a work environment where network
professionals feel they are learning and growing
professionally.
3. Implement formal training programs that satisfy
the career objectives of network professionals.
4. Keep overall compensation competitive with the
market.
5. Ensure that compensation programs are equitable
both internally and externally.
6. Implement a performance review process that is
timely, provides valuable feedback, and
establishes clear objectives.
7. Provide network professionals with opportunities
for advancement and ensure that these

Interpreter Job Satisfaction
61
opportunities are clearly communicated and well
understood.
Numerous other studies have been done on finite
professional groups. One such study was done by Black-
Branch (1996) who examined teacher satisfaction along the
constructs of nature of work (teaching responsibilities,
students/parents, and work conditions), context of the job
(physical environment), and the consequences of the job
(remunerations, federation/union, and career development).
He used a three-phase research method: 1) collecting survey
data; 2) interviewing a sample of the respondents; 3) meta-
analysis of the two sets of data from phases one and two.
Black-Branch (1996) found the following among teachers (p.
247):
1. Satisfaction increases with the number of years
of experience.
2. Women were more satisfied than men with their
physical work environment.
3. As age increased, so did satisfaction.
4. Satisfaction is greatly affected by
accomplishments and gains made by the

Interpreter Job Satisfaction
62
federation/union, especially when it relates to
pay.
O’Quin (1998) found that a 2 (number of agencies) x 2
(levels of security, high or low) multivariate analysis of
variance indicated that ratings of job insecurity were
significantly related to job dissatisfaction in the agency
perceived as nonstable, but not in the agency perceived as
stable. Discrepancy theory, as suggested by Locke (1976),
suggests that individual satisfaction is determined, in
part, by whether there is a “gap” between actual rewards or
performance and the individual’s goals or expectations.
Michalos (1986) also discovered a kind of discrepancy
called “expectation-reality gap theory” where there is a
perceived gap between the situation that is achieved now,
and what the individual expected it to be. This theory was
later expounded on by Cooper and Artz (1995, as outlined
earlier). Michalos found that 90% of the studies
investigating the existence of discrepancy theory reported
finding a significant relationship between the satisfaction
levels of individuals and some type of perceived “gap”

Interpreter Job Satisfaction
63
between what they currently have, and what they want to
have.
Paul Spector (1997) has discussed many facets of job
satisfaction:
1. Work and family, and work schedule are work-
related antecedents to job satisfaction.
2. Gender interacts with age to produce differing
patterns of job satisfaction for women and men.
3. Job satisfaction is an independent variable and
it is important to examine the effects of job
satisfaction on a range of outcome variables,
including performance, turnover and emotional
distress, and apparent life satisfaction.
In a recent interview (personal conversation, February
24, 1999) Spector elaborated on his impressions regarding
job satisfaction in today’s workforce in terms of trend
towards a more transient, mobile worker. Spector said that
it is difficult to determine what effect this will have on
job satisfaction. Spector explained:
National surveys have shown that satisfaction has been
high for the vast majority of Americans over time. It

Interpreter Job Satisfaction
64
should have more of an effect on turnover. Unhappy
people are likely to quit. Maybe this means people
will tend to be found more often in jobs they like.
(personal conversation, February 24, 1999)
Spector (personal conversation, February 24, 1999)
further states:
There isn’t much evidence that job satisfaction leads
to job performance directly via effort. There is some
relation, but it seems as likely performance leads to
satisfaction. I don’t buy the Herzberg idea.
However, there can be indirect effects. Unhappy
customer service people likely have unhappy customers,
which results in loss of business in the long run. I
agree with Locke that values and personality are more
related to motivation and thus to performance. Some
might be through goal setting, but it can be through
other mechanisms. (personal conversation, February 24,
1999)
From Spector (personal conversation, February 24, 1999) and
the many other researchers on job satisfaction who have

Interpreter Job Satisfaction
65
come before him, we can clearly see that job satisfaction
is a variable that is influenced by many factors. Only by
understanding and accounting for these factors can we truly
understand what comprises satisfaction and dissatisfaction.
Job Satisfaction Among Self-Employed
Many researchers have found that the self-employed are
more satisfied with their jobs than wage and salary earners
(Hornaday and Vesper, 1982; Duffy and Stevenson, 1984;
Naughton, 1987a, 1987b; Katz, 1993). Spector (personal
conversation, February 24, 1999) notices that all facets of
standard job satisfaction inventories do not apply to
people who are self-employed. Additionally, the self-
employed have no supervision, per se.
VandenHeuvel and Wooden (1997) conducted some
excellent research on job satisfaction among self-employed
contractors. According to them, independence is a misnomer
because contractors depend on organizations for their
income. They may be independent to a degree in that they
can choose the organization with which to be affiliated,
but they still have no true independence. They bear all of
the risks associated with self-employment, such as poor job

Interpreter Job Satisfaction
66
security and the absence of benefits typically available to
employees.
Table 6
Satisfaction Levels: Self-Employed v. Wage Earner
Comparison (VandenHeuvel and Wooden, 1997)
Self-Employed Wage Earners
Overall Satisfaction Higher Lower
Job Security Lower Higher
Income Lower Higher
Amount of Control Higher Lower
Work Hours Higher Lower
VandenHeuvel and Wooden (1997) also found gender
differences, with women exhibiting higher levels of
satisfaction than men. Their research supports earlier
research which showed that older workers are more satisfied
(Campbell et al, 1976; Herzog and Rogers, 1986; Bernal,
1998). However, VandenHeuvel and Wooden (1997) found that
the youngest of workers are also very satisfied, suggesting

Interpreter Job Satisfaction
67
a U-shaped distribution of satisfaction, with those in
their mid-thirties being least satisfied.
It is important to note, as many researchers
discovered, that the term “private contractors” is broad,
encompassing both independent and dependent contractors.
Independent contractors are very different from dependent
contractors, providing their services to many organizations
while dependent contractors provide their services to one
organization. Bearing this in mind, it is important to
note that independent contractors had significantly higher
job satisfaction than dependent contractors (VandenHeuvel
and Wooden, 1997).
Job Satisfaction Among Interpreters
As previously mentioned interpreters for the deaf are
in extremely short supply, mostly as a result of the
incredible demand placed upon the profession with the
passage of ADA (and subsequent requirements under Title
III). Interpreters complain of burnout, being under-
appreciated, having poor working conditions (e.g. carpal
tunnel syndrome, repetitive motion injury, and cumulative
motion injury), consumer’s ignorance or confusion over

Interpreter Job Satisfaction
68
their role, and lack of appropriate training. All of these
factors can lead to low job satisfaction, yet there is no
current literature on job satisfaction among interpreters.
One common theme missing from the research of
recruiters, trainers, and interpreters is a linear and
global approach to satisfaction among interpreters.
Researchers seem able to identify the faults within the
training, employment, and development of interpreters, but
have yet to devise a method for translating solutions into
a logical goal - a satisfied interpreter.
The only job satisfaction research that has been
conducted on interpreters for the deaf was done by Rojas
(1987), and this was conducted using spoken language
interpreters; research regarding job satisfaction has yet
to be conducted using interpreters for the deaf. Rojas’
(1987) research, though based upon an instrument that has
no described validity or reliability, showed that the
majority of interpreters (92.75 percent) were fairly
satisfied to very satisfied with their jobs.
Unfortunately, the researcher did not perform any
sophisticated statistical analysis of the data; the only

Interpreter Job Satisfaction
69
statistics offered are percentile breakdowns across broad
demographic variables. Rojas (1987) did not account for
any demographic variables, so any results must be
considered as truly broad-stroke accounts, nearly anecdotal
in nature. The majority of subjects were free-lance
interpreters (94.5 percent, n=57), indicating that any
results can only be applied to the free-lance population,
excluding standard wage earning interpreters. Confirming
job security issues that independent contractors face
(VandenHeuvel and Wooden, 1997), Rojas’ (1987) found half
of the interpreters surveyed had concerns about their job
security and stability.
Measurement of Job Satisfaction
There exist numerous instruments for the measurement
of job satisfaction (Brayfield & Rothe, 1951; Buckley, M.,
1992; Donovan, M., & Drauden, R.; Edwards, 1978; Holland
and Gottfredson, 1994; Hoppock, 1935; Koustelios, A., &
Bagiatis, 1997; O’Connor, Peters, and Gordon, 1978; Smits,
1972; Spector, 1994; Weiss, D., 1977; Wood, Chonko, & Hunt,
1986;). No research has been performed, prior to this
study, assessing the job satisfaction of sign language

Interpreter Job Satisfaction
70
interpreters using a standardized instrument. Many
inventories for job satisfaction have been developed for
specific populations, such as the one by Koustelios &
Bagiatis (1997), which is for Greek workers, and the
inventory by Edwards (1978), which assesses occupational
attitude among U.S. Air Force airmen.
For assessing job satisfaction among interpreters, an
instrument with application to general populations, as well
as good validity and design, would be preferable. The
Index of Job Satisfaction (IJS) by Brayfield and Rothe
(1951) appears to be a good instrument for this purpose.
Brayfield and Rothe (1951) noted that the IJS had high
validity based on the nature of the items, the means in
which the instrument was constructed, and the ability of
the tool to differentiate job satisfaction between two or
more groups. The IJS had a significant correlation of r =
.92 when correlated with scores on the Hoppock Job
Satisfaction Scale (Miller, 1978).
The IJS has been used with success by McNeely (1984)
and McNeely, Feyerherm, & Johnson (1986) for assessing job
satisfaction among human service populations. Interpreters

Interpreter Job Satisfaction
71
for the deaf are considered to be human service workers, in
that requirements of the job entail characteristics
inherent in other human service professions, such as
sensitivity, compassion, listening skills, and empathy.
While the IJS appears to be an excellent tool for
measuring job satisfaction, another tool, or tools, should
be used to assess the various correlates of job
satisfaction. These variables, such as working with
colleagues, autonomy, and workload, have been measured with
success by Spector (1994), Quinn and Staines (1979), and
Quinn et al. (1971). Paul Spector (1974) has developed the
Job Satisfaction Survey (JSS), a 36 item, nine facet scale
to assess employee attitudes. These nine facets include
pay, promotion, supervision, fringe benefits, contingent
rewards (performance based rewards), operating procedures
(required rules and procedures), coworkers, nature of work,
and communication. The JSS (Spector, 1994) was originally
developed for use in human service organizations, and is
one that would suit the assessment of interpreters for the
deaf.
Quinn and Staines (1979) have developed scales for

Interpreter Job Satisfaction
72
autonomy and role conflict that have been used with
assessment of human service workers (Jayaratne & Chess,
1986; Siefert, Jayaratne, & Chess, 1991). Earlier, Quinn
et al. (1971) developed a 4-item scale that explicitly
examines the variable of workload. This scale was used for
human service workers by Jayaratne & Chess (1986), and
Siefert, Jayaratne & Chess (1991). These three subscales,
examining autonomy, role conflict, and workload, would be a
good complement for the examination of overall job
satisfaction among interpreters for the deaf.
Summary of Literature Review
After a review of the literature, the following
variables seem to be associated with job satisfaction or
dissatisfaction of employees:
1. Age (Bernal, 1998; Campbell, Converse, & Rogers,
W.L., 1976; Goff, 1998; Herzog & Rogers, 1986)
2. Quality of supervision (Gallup, 1999c; Herzberg,
1968; Hurwitz, 1995; Spector, Personal
Communication, February 24, 1999)

Interpreter Job Satisfaction
73
3. Pay/Salary (Black-Branch, 1996; Eskew & Fox,
1998; Herzberg, 1968; Registry of Interpreters
for the Deaf, 1993)
4. Opportunities for promotion (Herzberg, 1968; Russ
& McNeilly, 1995)
5. Working with colleagues (Gallup, 1999c; Herzberg,
1968; Hurwitz, 1995; Maidani, 1991)
6. Workload (Carstensen, 1994; Registry of
Interpreters for the Deaf, 1993; Watson, 1987)
7. Working conditions (Barber-Gonzales, Preston and
Sanderson, 1985; Carstensen, 1994; European Forum
of Sign Language Interpreters, 1994; Registry of
Interpreters for the Deaf, 1993; Woll, 1988)
8. Role conflict (Anderson & Stouffer, 1991; Bosman,
1995; Bourcier, 1981; Canadian Association of the
Deaf, 1994a; Cooper & Artz, 1995; Harboe, 1977;
Hurwitz, 1995; Irwin & Morgan, 1985; Loncke,
1995; Oakland Community College, 1991; Registry
of Interpreters for the Deaf, 1998; Stewart &
Kluwin, 1996; Woll & Porcari, 1995)

Interpreter Job Satisfaction
74
9. Autonomy (Hurwitz, 1995; Registry of Interpreters
for the Deaf, 1993)
10. Length of time at work (Black-Branch, 1996;
Lewis, 1998)
11. Gender (Spector, 1997; VandenHeuven & Wooden,
1997)
12. Training and education (Cassell, 1989; Elliott &
Povers, 1995; European Forum of Sign Language
Interpreters, 1994; Gallup, 1999c; Goff, 1998;
Green, 1998; Hurwitz, 1995; Irwin & Morgan, 1985;
Jasinowski (in Reuters, 1998), 1998; Smith &
Gorelick, 1979; Tseng, 1992; U.S. Department of
Education, 1997; Virginia Department of
Education, 1993)
The literature examined demonstrates that job
satisfaction is based upon many influencing factors. There
is some disagreement regarding how these factors influence
job satisfaction, especially concerning Herzberg’s (1968)
two-factor motivation model. Whether motivational factors
comprise job satisfaction alone, or if they are

Interpreter Job Satisfaction
75
complemented by hygiene factors as well, seems to be open
to debate.
Various studies suggest that training, empowerment,
promotions, performance ratings, mentoring/support, upward
mobility, recognition, general working conditions, and goal
realization are some of the key ingredients contributing to
the gestalt of overall job satisfaction. Other factors,
such as supply shortages, increased demands placed on
employees, and educational preparation are contributory in
affecting an employee’s overall attitude and satisfaction.
Increased interest in recent years expressed by
employers in keeping their employees happy and content has
resulted in a number of job satisfaction surveys (Catlette
& Hadden, 1998; The Gallup Organization, 1999c). Most
surveys demonstrate that the majority of Americans are
satisfied with their working situation. According to P.
Spector (Personal Communication, February 24, 1999),
”National surveys show that satisfaction has been high for
the vast majority of Americans over time.” This makes
sense and follows human nature; an employee would not be
expected to stay in a profession where one-third of their

Interpreter Job Satisfaction
76
adult life is spent in a situation that causes distress or
dissatisfaction.
However, many of these same studies have also
demonstrated variances in job satisfaction according to
gender, age, number of years employed at the job in
question, degree of independence, and management style or
composition of supervision. The research to date suggests
that, while the majority of Americans may be satisfied with
their employment, certain factors can be manipulated to
increase satisfaction.
No research to date has been done with regard to the
job satisfaction of interpreters for the deaf. One cursory
study was conducted by Rojas (1987) on spoken language
interpreters in Switzerland, yielding mostly general
descriptive results that were less than conclusive. Other
studies have been performed using free-lance and
independent contractors, suggesting that this workgroup is
very satisfied with their freedom but is less than
satisfied with their lack of job security – a true paradox.
Interpreting for the deaf, a rather new and recently
organized profession, has grown rapidly in the past decade.

Interpreter Job Satisfaction
77
Many stressors have been placed on the profession, namely
human resource shortages and lack of completely adequate
and accessible training. While the profession began as
mostly a free-lance, private contractor workforce, it has
evolved over time to include more interpreters who have
standard wage earning jobs. There are no contemporary
studies that have examined the job satisfaction of
interpreters for the deaf as either free-lance, private
contractor “employees,” or those who have standard, wage
earning jobs.

METHOD
Introductory Statement
The main purpose of this study was to describe job
satisfaction among interpreters for the deaf. A second
purpose was to examine and develop a model that uses
personal and job-related factors to predict job
satisfaction among interpreters for the deaf in general.
This study tested the relationships between job
satisfaction and various variables, compared job
satisfaction of males and females, and compared job
satisfaction levels of standard wage earner, independent
contractor interpreters, and dependent contractor
interpreters. The study also examined what set of
variables best predicts job satisfaction among standard
wage earner, independent contractor interpreters, and
dependent contractor interpreters. Moreover, this study
examined what set of variables best predicts job
satisfaction among interpreters for the deaf in general.
This chapter identifies the dependent and independent
variables, their levels of measurement, and their
definitions; and describes the research design. The

Interpreter Job Satisfaction
79
chapter also reports the sample size and the methods of
sample selection, data collection, instruments, and the
statistical tests that were used to analyze the data.
Finally, this chapter includes an evaluation of parametric
assumptions and human subjects’ issues.
Review of Research Questions and Hypotheses
Research Question 1
What job-related factors are most highly related to
job satisfaction?
Research Hypothesis 1
There are significant positive correlations between
job satisfaction and the following variables: age, gender,
tenure, supervisory quality, salary, promotion
opportunities, collaboration, workload, role conflict,
working conditions, autonomy, and educational level.
Research Question 2
What job-related factors are related most closely to
job satisfaction among interpreters with different job

Interpreter Job Satisfaction
80
statuses (e.g. standard wage earners, independent
contractors, and dependent contractors)?
Research Hypothesis 2
There are significant positive correlations between
job satisfaction among standard wage earner interpreters
and following variables: supervisory quality, salary,
promotion opportunities, collaboration, workload, role
conflict, working conditions, autonomy, and educational
level.
Research Hypothesis 3
There are significant positive correlations between
job satisfaction among dependent contractor interpreters
and salary, collaboration, role conflict, working
conditions, autonomy, and educational level.
Research Hypothesis 4
There are significant positive correlations between
job satisfaction among independent contractor interpreters
and salary, role conflict, working conditions, autonomy,
and educational level.

Interpreter Job Satisfaction
81
Research Question 3
What set of the following variables best predicts work
satisfaction among interpreters for the deaf: age, gender,
tenure, supervisory quality, salary, promotion
opportunities, collaboration, workload, role conflict,
working conditions, autonomy, or educational level?
Research Hypothesis 5
Collaboration, supervisory quality, and educational
level will emerge as significant predictors of job
satisfaction.
Variables, Levels of Measurement, and Definitions
The main dependent variable in this study is job
satisfaction (interval). The independent variables in this
study included the following: gender (nominal-dichotomous),
job classification which includes standard wage earner,
independent contractor, dependent contractor (nominal-
dichotomous), age (ratio), education (nominal-dichotomous),
time in current job (ratio), supervision (interval), salary
(interval), autonomy (interval), promotion (interval),
working with colleagues (interval), workload (interval),

Interpreter Job Satisfaction
82
role conflict (interval), autonomy (interval), education
(nominal-dichotomous), and working conditions (interval).
For the purpose of this study, these variables were
conceptualized as follows:
Job Satisfaction is the degree to which interpreters
for the deaf view their feelings about their overall work.
Supervision is the extent to which supervision is
available on a regular basis and when needed, that is, a
supportive supervisor.
Salary is the extent to which interpreters for the
deaf believe that they are paid what they deserve and that
this salary is adequate for normal living.
Promotion is the opportunity for advancement,
recognition, and increase in pay associated with
advancement for interpreters for the deaf.
Working with colleagues is the interrelationship
between interpreters for the deaf and colleagues at work
and whether or not interpreters for the deaf share similar
attitudes and values with their colleagues and feel
comfortable working with them.

Interpreter Job Satisfaction
83
Workload is the extent to which the demands made of
interpreters for the deaf are excessive.
Role conflict is the conflict between what
interpreters for the deaf are expected to do and actually
what they are capable of doing.
Working conditions is the extent to which interpreters
for the deaf feel comfortable in the work place and enjoy
being there, that is, a good and pleasant working
environment.
Research Design
The design of this study was a cross-sectional survey.
A cross-sectional survey was used to identify and describe
opinions and attitudes of interpreters about their job and
to test relationships among variables (Heppner, Kivlighan &
Wampold, 1992). Another common use of the survey design is
to compare data collected between groups (e.g. standard
wage earner, independent contractor, and dependent
contractor). Self-administered questionnaires were
provided to interpreters for the deaf working throughout
North America (United States and Canada). In addition to a

Interpreter Job Satisfaction
84
number of demographic questions, the questionnaires
included a number of items measured on a Likert-type scale.
This study employed quantitative methods.
Quantitative methods are the methods of choice because they
are typically “succinct, parsimonious, and easily
aggregated for analysis; they are systematic, standardized,
and easily presented in a short space” (Patton, 1987, p.
11). Unlike qualitative methods, quantitative methods
allow the researcher to summarize the results, compare
groups, and generalize the findings to the population(s)
from which the sample(s) is/are drawn (Patton, 1987).
Sampling Procedures
Sample Size
Data collected in this research study was used in
significance tests in order to assess the viability of the
null hypothesis. The p-value yielded from these
significance tests, and used to reject the null hypotheses,
was dependant on three factors: The larger the observed
effect, the larger the sample size, and/or the more
flexible/liberal the criterion required for significance

Interpreter Job Satisfaction
85
(alpha), the more likely it is that the test will yield a
significant p-value.
Prior to the collection of data a power analysis was
conducted to determine sample size needed for the two-way
analysis of covariance (ANCOVA) (gender x job status) to
yield statistically significant results when the null
hypotheses are false for populations from which the samples
are drawn. As in the actual study itself, this power
analysis is based on the same factors as the significance
test itself.
The goal of a power analysis is to find an appropriate
balance among these factors and to increase the statistical
conclusion validity (Heppner, Kivlighan, & Wampold, 1992).
For a given effect size and alpha, increases in the sample
size will, in turn, increase the potential for
generalization of the results to the population from which
the sample is drawn.
Results of the power analysis indicated that a sample
size of 100 subjects was needed. A power analysis was also
conducted to determine the sample size needed to conduct
multiple regression analysis. The results suggested that a
Interpreter Job Satisfaction
86
sample size of 77 standard wage earner interpreters and 77
free-lance/private contractor interpreters (N = 154) was
needed to detect significant results (R2 > .20, power = .80,
with an alpha level of .05) with 11 independent variables.
A sample size of 150 was considered acceptable for this
study.
Sample Selection
Because all subjects would be contacted by electronic
mail (email), a pool of email addresses obtained from the
following sources in the United States and Canada:
1. ListServe maintained by Terps-L (Cowley, 1999).
2. ListServe maintained by the Texas Society of
Interpreters for the Deaf (Domo, 1999).
3. Membership list maintained by the Utah Registry
of Interpreters for the Deaf, Inc. (Utah Registry
of Interpreters for the Deaf, Inc., 1999).
4. Membership directory maintained by the Potomac
Chapter of the Registry of Interpreters for the
Deaf, Inc. (PCRID, 1999).

Interpreter Job Satisfaction
87
5. Membership directory maintained by the Conference
of Interpreter Trainers (Conference of
Interpreter Trainers, 1999).
Procedures
The administration of surveys for this research was
unique due to the fact that it was conducted entirely over
the Internet (World Wide Web or web). The research, from
web design to administration and collection, was conducted
in the following phases:
Web Design of Instruments
Although all survey instruments existed in paper form,
they had to be adapted to web administration. This
entailed writing all text from the survey instruments into
HTML (Hyper Text Markup Language) code, a complicated
language that is read by various web browsers, such as
Netscape Browser and Internet Explorer. Greg Baugher, of
Sentinel Networks, Inc. (Baugher, 1999) was hired to design
the pages and write the code. The finished pages, as they
appears on the Internet, can be found in Appendix C.

Interpreter Job Satisfaction
88
The web pages were designed with the following
criteria in mind:
1. Easy navigability
2. Ability for the web pages to recognize missing
(required) responses and prompt the user to
complete the missing data
3. Brief instructions that would be read in total,
yet not detract from the integrity of the study
4. Clear separation between questions to avoid
confusion between questions and/or entering data
in the wrong box or field.
In addition to the above criteria, the Internet survey site
was designed so that all completed web forms (surveys) were
fed into a web-based database. The database designed by
Greg Baugher (Baugher, 1999) was a Microsoft Access
database that was designed to be imported directly into the
SPSS software package that was used for statistical
analysis.
The designing of the survey instrument pages was a
long process that required revision through trial and
error, as well as an extensive amount of testing. The goal

Interpreter Job Satisfaction
89
was to write the code for the Internet so that most
browsers would be able to read and decipher the code. This
was a difficult task, mostly because web browsers, and the
code they read (HTML for the most part), are not
standardized. There are many different generations of HTML
code, with each subsequent generation building on (not
replacing) previous editions. However, not all browsers
are able to all generations of HTML code. Additionally,
all browsers cannot read all of the features that HTML
incorporates, such as CGI script and Java Applets.
Bearing this in mind, the web designer (Greg Baugher)
decided to write the pages gearing it towards the lowest
common denominator, or those who had older, slower
browsers. The HTML code is available through site
http://www.pieinc.com/survey/ on the Internet. It can be
viewed by going to this site and then changing the
browser’s view properties to “source.”
Once the pages were initially developed, they were
tested on various browsers. All problems were noted, and
they ranged from the inability of the browser to register
responses on a page, to error messages returned after the

Interpreter Job Satisfaction
90
pages were completed. Once all the problems (bugs) were
resolved, the pages were placed on the Internet at a test
site (http://www.sentinelnet.com/swartz/survey/index.asp).
At this point various individuals were asked to view the
pages and submit suggestions for revision. All suggestions
were collected and, when reasonable or possible, were
incorporated into the design.
A pilot test was then conducted among 12 interpreters
at a local interpreting agency in Laurel, Maryland
(Professional Interpreter Exchange, Inc.). The purpose of
the pilot was only to test the integrity of the web design
as well as the ability to extract the database and import
it into SPSS. The pilot test revealed no problems and the
survey site was considered a fully functioning site, ready
for the actual subjects to complete the surveys. To give a
better understand of how a subject would navigate through
the web pages of the survey, the flow chart showing
progression through the web site is depicted in Figure 1.

Interpreter Job Satisfaction
91
Welcome Page
Human
Subjects Issues Page
Decline Page
Exit Page
Demographics Information
Page
Survey Page 1
Thank You
Page
Exit Page
Survey Page 1
Survey Page 3
Survey Page 2
Survey Page 1
Demographics
Welcome Page
Exit Page
Figure 1. Survey Web Site Design

Interpreter Job Satisfaction
92
Subject Notification and Participation
As stated earlier, subject email addresses were
gathered from various sources. These addresses, a total of
3,000, were entered into a database and arranged in
alphabetical order (by the first character of the actual
address). The database was then manipulated to select
every other address and compile them into a separate data
file. Once this was accomplished the new file of addresses
was imported into E-Mass, a mass email program (Zino,
1998).
All subjects selected were notified (by email using E-
Mass) of their selection by using the standardized cover
letter found in Appendix A. This letter instructed
them of their selection for the research, gave them a brief
background on the research, and provided initial
instructions for the completion of the surveys. In the
mailing, all participants were given a URL (Uniform
Resource Locator) address, e.g.
http://www.pieinc.com/survey/index.asp, the web site they
should go to in order to complete the surveys. The survey
forms on this site were accomplished by filling in

Interpreter Job Satisfaction
93
demographic fields and clicking on Likert-type answer
items. There was no field for name, and names will not be
collected to protect the anonymity of participants. The
participants completed the forms and once they were
completed, they were sent automatically to the web-based
database collection depository located at
http://www.pieinc.com/survey/admin.asp. The subjects were
informed in the email that they had a total of nine days to
complete the survey on-line. At that point the data
generated from the site was downloaded into a Microsoft
Access database file.
Of the 1500 emails that were sent out to subjects, 338
were returned without delivery due to mail delivery
problems. These problems included:
1. Incorrect email address was given from source.
2. Email address was no longer valid – individual
had changed jobs or Internet service provider.
3. Mail server malfunctions at receiving end.
With 1500 emails having been sent out, and 338 returned,
the best guess assumption is that 1162 emails were
delivered. Of these, a total of 177 subjects completed the

Interpreter Job Satisfaction
94
web-based survey. This translated into a response rate of
15 percent.
Human Subjects’ Issues
The Association of Visual Language Interpreters of
Canada (AVLIC) was informed of this study and lent their
cooperation and support for the research. In order to
ensure participants’ rights, all interpreters received,
along with the questionnaires, a cover letter explaining
the purpose of the study and how the data would be used and
for what purpose. Interpreters were also notified that
their participation in this study was completely voluntary
and that their identity would be anonymous. They were not
asked for their names, telephone numbers, or any
identifying information. Thus, the potential risk, if any,
to the participants was be minimal.
Instruments
The questionnaires included information in three
general areas (Appendix B): (a) demographic variables, (b)
job satisfaction, and (c) factors associated with job
satisfaction.

Interpreter Job Satisfaction
95
Part I: Demographic Variables
Subjects were asked to describe their gender, marital
status, age, number of children, education, years of
college, ethnicity, religion, time in current job, title in
current job, monthly income, interpreter training received,
level of certification, job status (standard wage earner or
free-lance/contractor interpreter, with identification of
independent and dependent contractor status), and full- or
part-time status.
Part II: Job Satisfaction
This variable was measured using the Index of Job
Satisfaction (IJS). This is a well-developed and widely
used instrument (McNeely, 1984, 1987, 1989; McNeely,
Feyerherm, & Johnson, 1986; Poulin, 1994, 1995; Poulin &
Walter, 1992; Wright, King, & Berg, 1985), and has been
widely used among human service workers. Because it has
been a widely used instrument, and has been used
extensively with human service workers, it was selected for
use with this study.

Interpreter Job Satisfaction
96
The IJS contains 19 items measuring overall job
satisfaction on a 5-point Likert scale (1 = strongly agree,
2 = agree, 3 = undecided, 4 = disagree, and 5 = strongly
disagree). Possible scores for the IJS range between 18
(low satisfaction) to 95 (high satisfaction), with a score
of 57 as the neutral score. Nearly half of the items
(1,2,5,7,9,12,13,15, and 17) were negatively worded; thus,
for the analysis the scores of these items were reversed (1
to 5, 2 to 4, 4 to 2, and 5 to 1).
The corrected odd-even reliability coefficient for the
IJS is .87 as verified by Miller (1978). Brayfield and
Rothe (1951) noted that the IJS had high validity based on
the nature of the items, the means in which the instrument
was constructed, and the ability of the tool to
differentiate job satisfaction between two or more groups.
Brayfield, Wells, and Strate (1957) found that the IJS had
a correlation of .40 with the Science Research Associates
Inventory and .32 with the Weitz Test of General
Satisfaction. A correlation was also found between the IJS
and the Rundquist-Sletto Morale Scale. The IJS had a
significant correlation of r = .92 when correlated with

Interpreter Job Satisfaction
97
scores on the Hoppock Job Satisfaction Scale (Miller,
1978).
Part III: Factors Related to Job Satisfaction
Spector’s (1986) Job Satisfaction Survey (JSS) was
used to collect data regarding factors related to
interpreter job satisfaction. This inventory has been used
extensively among human service workers, civil servants,
and workers in the medical field (Durr, 1996; Gillispie,
1993; Spector, 1985;). This inventory was selected for use
with this study because of its extensive use with human
service workers.
(The JSS contains nine subscales (Spector, 1994): pay
(4 items, reliability coefficient of .75), promotion (4
items, reliability coefficient of .73), supervision (4
items, reliability coefficient of .82), fringe benefits (4
items, reliability coefficient of .73), contingent rewards
(4 items, reliability coefficient of .76), working
conditions (4 items, reliability coefficient of .62),
colleagues (4 items, reliability coefficient of .60),
nature of work (4 items, reliability coefficient of .78),
and communication (4 items, reliability coefficient of

Interpreter Job Satisfaction
98
.71). Participants in the study were asked to rate their
answers for each item on a 6-point Likert scale (1 =
disagree very much, 2 = disagree moderately, 3 = disagree
slightly, 4 = agree slightly, 5 = agree moderately, 6 =
agree very much). Some of the items in each scale were
negatively worded; thus, for analysis the scores of these
items were reversed (1 to 6, 2 to 5, 3 to 4, 4 to 3, 5 to
2, and 6 to 1).
Autonomy
This variable was measured using a scale of six items
developed by Quinn and Staines (1979) and has a reliability
coefficient of .78 (Quinn & Staines, 1979). This
instrument was selected due to its extensive use with human
service professionals. Participants were asked to rate
their answers to each item on a 4-point Likert scale (1 =
strongly agree, 2 = agree, 3 = disagree, 4 = strongly
disagree). Possible scores range from 4 to 24, with lower
scores indicating high autonomy and high scores indicating
low autonomy at work.

Interpreter Job Satisfaction
99
Workload
This scale consists of four items developed by Caplan,
Cobb, French, Harrison, & Pinneau (1975). It has a
reliability coefficient of .60 (Caplan et al., 1975). This
instrument was selected due to its extensive use with human
service professionals. Participants were asked to rate
their answer to each item on a 5-point Likert scale (1 =
rarely, 2 = occasionally, 3 = sometimes, 4 = fairly often,
and 5 = very often). Possible scores range from 4 to 20,
with lower scores indicating less workload and higher
scores indicating greater workload.
Role Conflict
This variable was measured using a scale first used by
Quinn and Staines (1979). The 4-item scale has a
reliability coefficient of .62 (Quinn & Staines, 1979).
This instrument was selected due to its extensive use with
human service professionals. Participants are asked to
rate their answers for each item on a 4-point Likert scale
(1 = strongly agree, 2 = agree, 3 = disagree, 4 = strongly
disagree). Possible scores for this scale range between 4

Interpreter Job Satisfaction
100
to 16, with higher scores indicating greater conflict and
lower scores indicating less conflict at work.
Data Analysis
Descriptive and inferential statistics were computed
using the Statistical Package for Social Sciences for
Windows Version 8.0 (Norusis, 1998). Measures of central
tendency, variations, Pearson’s skewness coefficient,
distributions, and Fisher’s skewness coefficients were
generated for all variables. The standardized skewness
statistics (Pearson's and Fisher's) were used as they
render the statistic free of scale. The resulting
coefficients can be used to test whether the data was
derived from a normal distribution. If it does, the
statistic will fall between -2 and +2 about 95% of the
time.
The following statistical tests were accomplished to
address the three research questions:
1. Chi-square, Kruskal-Wallis (this test does not
assume that the populations follow Gaussian
distributions), and one-way analysis of variance
(ANOVA) tests was used to test group differences

Interpreter Job Satisfaction
101
(standard wage earner interpreters and free-
lance/private contractor interpreters, and
independent contractor interpreters and dependent
contractor interpreters) regarding gender, age,
employment status (full-time or part-time),
certification, ethnicity, number of children,
marital status, years of education, monthly pay,
and years in current job.
2. Spearman’s rho rank correlation was used to
address the first four research hypotheses
(Research Questions 1 and 2).
3. A multiple regression analyses was conducted to
test the set of variables that best predicts job
satisfaction among interpreters for the deaf
(Research Questions 3).
RESULTS
Introductory Statement
This chapter includes five sections. The first
section is a presentation of sample characteristics. The
second section is a presentation of descriptive statistics
of job satisfaction. The third section includes correlates
of job satisfaction (Research Question 1), job satisfaction
based on job status (Research Question 2), and multiple
regression analyses of predictors of job satisfaction
(Research Question 3). The fourth section is a comparison
of standard wage earner and contract interpreters with
regard to sample characteristics. The last section is a
summary of the results.
Sample Characteristics
Of the 1500 subjects emailed invitation to
participate, 1162 were successfully delivered. Of these
1238 delivered, 177 completed the surveys for a response
rate of 15%. A response rate of 50%, according to Rubin
and Babbie (1997), is considered adequate for analysis and
reporting. Therefore, the response rate obtained falls far
short of what Rubin (1997) considers adequate. Most
respondents were female (81.9%), Caucasian (92.1%), married

Interpreter Job Satisfaction
103
(54.2%), had graduated from an interpreter training program
(71.8%), were not certified (58.2%), and had a Bachelor’s
degree (35.6%). Participants’ ages ranged from 19 to 66
years old, with a mean age of 36 years (Mdn = 37, SD =
9.03). Monthly gross income of all participants ranged
from $50 to $4,489 (U.S. Dollars).
It would have been preferable at this point to compare
this sample with the general population of interpreters,
however, there is no maintained register of interpreter
demographics available. In this study there were more
standard wage earner interpreters (N = 90) than private
contractor interpreters (N = 77). Of the private
contractor interpreters there were more who were
independent (contracting with many agencies, N = 53) than
dependent (contracting exclusively with one agency, N =
24).
In the power analysis discussed earlier, a sample size
of 77 standard wage earner interpreters and 77 free-
lance/private contractor interpreters (N = 154) was needed
to detect significant results (R2 > .20, power = .80, with

Interpreter Job Satisfaction
104
an alpha level of .05) with 11 independent variables. The
sample used minimally satisfies this requirement.
Descriptive Statistics for Job Satisfaction
In addition to the demographic characteristics, data
was collected for 9 subscales: job satisfaction, quality of
supervision, salary, opportunities for promotion, efficient
working with colleagues, workload, role conflict,
comfortable working conditions, and autonomy. Table 7
presents the means, medians, standard deviations, and
ranges of scores for each variable. Appendix D presents
the percentages of respondents for each item in each
subscale. Following are the results of some items
representing job satisfaction. (See Table 7 and Appendix D
for the results of all other subscales.)
Job Satisfaction
One of the 19 items included in the job satisfaction
subscale was “I feel fairly well satisfied with my present
job.” Of the 176 interpreters who answered this item, 83%
agreed or strongly agreed with the statement, 6% could not
decide, and the remainder disagreed or strongly disagreed

Interpreter Job Satisfaction
105
with this statement. Eighty-seven percent of the
respondents agreed or strongly agreed with the statement “I
find real enjoyment in work.”
Table 7
Descriptve Statistics for Subscales (N =177)
Variable N Mdn SD Range
Job satisfaction 174 57.2 58 4.3 39-68
Salary 131 13.2 13 5.6 4-24
Quality of supervision 127 18.7 21 5.6 4-24
Promotion 125 11.3 11 4.8 4-23
Working with colleagues 152 18.3 19 4.1 7-24
Workload 172 12.2 12 3.3 5-20
Role conflict 174 10.4 11 2.5 4-16
Working conditions 151 16.1 16 4.1 5-24
Autonomy 173 13.2 13 3.9 6-22
When presented with the statement “I am disappointed
that I ever took this job,” approximately 92% of the
interpreters disagreed or strongly disagreed with the

Interpreter Job Satisfaction
106
statement. Regarding the statement “I am often bored with
my job,” over 85% of the respondents disagreed or strongly
disagreed. Eighty-five percent of the respondents agreed
or strongly agreed with the statement “There are some
conditions concerning my job that could be improved.”
Overall, the mean score for job satisfaction was 57.2
(SD = 4.3) on scale of 19 to 95, with the higher scores
indicated higher satisfaction.
Correlates of Job Satisfaction
Spearman’s rho rank correlations were undertaken to
address the first four hypotheses (Research Questions 1 and
2).
Research Hypothesis 1
There are significant positive correlations between
job satisfaction and the following variables: age, gender,
tenure, supervisory quality, salary, promotion
opportunities, collaboration, workload, role conflict,
working conditions, autonomy, and educational level.

Interpreter Job Satisfaction
107
Table 8
Correlations Between Job Satisfaction and the Independent
Variables
Variable N R p*
Education 154 -.21 .004
Autonomy 173 .18 .010
Workload 176 -.18 .011
Supervision 127 -.18 .020
Role conflict 174 .11 .079
Age 171 -.10 .087
Working Conditions 151 .11 .094
Promotion 125 -.05 .289
Working with colleagues 152 .04 .322
Salary 131 -.40 .326
Years in current job 174 -.03 .348
*1-tailed p.
Note: High scores of job satisfaction, working with
colleagues, promotion, salary, role conflict, and workload
indicate a greater value of that variable. Low scores of
autonomy, supervision, and comfort indicate a greater value
of that variable.

Interpreter Job Satisfaction
108
Findings
Results of the Spearman’s rho rank correlation test
for the first research hypothesis are presented in Table 8.
These results show significant positive correlations
between job satisfaction and autonomy. Workload is
negatively correlated, meaning that those interpreters who
experienced less workload also experienced higher
satisfaction. In other words, interpreters who have higher
levels of autonomy, and less workload were more satisfied
than interpreters who did not have these conditions.
The results also show negative correlation between job
satisfaction, education and supervision. That is,
interpreters who had less education and less competent
supervision were more satisfied than interpreters who did
not have these conditions.
Older interpreters also reported lower levels of
satisfaction than younger interpreters, although these
findings were not significant (r = 0.10, p = .087). Age
was significantly associated with number of years in
current job (r = .42, p < .001); workload (r = -.17, p =
.014); autonomy (r = -.17, p = .013); and education (r =

Interpreter Job Satisfaction
109
.17, p = .019). In other words, older interpreters had
greater work experience, less excessive work demands, less
independence, and had graduated in greater numbers from
interpreter training programs than younger interpreters.
The results presented in Table 8 also show no
significant correlations between job satisfaction and role
conflict, age, working conditions, promotion, working with
colleagues, and salary. Each variable explained less than
1% of the variance in job satisfaction.
Research Hypothesis 2
There are significant positive correlations between
job satisfaction among standard wage earner interpreters
and following variables: supervisory quality, salary,
promotion opportunities, collaboration, workload, role
conflict, working conditions, autonomy, and educational
level.
Findings
Results of the Spearman’s rho rank correlation test
for the second research hypothesis are presented in Table
9. These results show significant positive correlations

Interpreter Job Satisfaction
110
between job satisfaction and autonomy for staff
interpreters. Workload is negatively correlated, meaning
that those who had less workload had higher satisfaction.
In other words, staff interpreters who have higher levels
of autonomy, and less workload were more satisfied than
interpreters who did not have these conditions.
The results also show negative correlation between job
satisfaction, education and supervision. That is, staff
interpreters who had less education and less competent
supervision were more satisfied than interpreters who did
not have these conditions.
Age was significantly associated with number of years
in current job (r = .41, p < .001); autonomy (r = -.19, p =
.044); and education (r = .22, p = .029). In other words,
older interpreters had greater work experience, less
independence, and more education than younger interpreters.
The results presented in Table 9 show no significant
correlations between job satisfaction and promotion, role
conflict, working with colleagues, salary, age, years in
current job, and working conditions. Each variable
explained less than 1% of the variance in job satisfaction.

Interpreter Job Satisfaction
111
Table 9
Correlations Between Job Satisfaction and the Independent
Variables Among Staff Interpreters
Variable N R P*
Supervision 88 -.31 .001
Education 76 -.23 .023
Autonomy 88 .21 .025
Workload 87 -.20 .033
Promotion 87 -.15 .080
Working conditions 88 .08 .221
Role conflict 88 .08 .223
Age 86 -.05 .318
Working with colleagues 88 -.04 .365
Salary 87 -.03 .381
Years in current job 88 -.03 .407
*1-tailed p.
Note: High scores of job satisfaction, working with
colleagues, promotion, salary, role conflict, and workload
indicate a greater value of that variable. Low scores of
autonomy, supervision, and comfort indicate a greater value
of that variable.

Interpreter Job Satisfaction
112
Research Hypothesis 3
There are significant positive correlations between
job satisfaction among dependent contractor interpreters
and salary, collaboration, role conflict, working
conditions, autonomy, and educational level.
Findings
Results of the Spearman’s rho rank correlation test
for the third research hypothesis are presented in Table
10. These results show significant positive correlations
between job satisfaction and opportunities for promotion (N
= 2). In other words, dependent contractor interpreters
who have good opportunities for promotion were more
satisfied than dependent contractor interpreters who did
not have this condition.
In this study, age was also significantly associated
with supervision (N = 4, r = 1.00, p < .001), and number of
years in current job (r = .60, p = .008) among dependent
contractor interpreters. In other words, older
interpreters had more quality supervision, and greater work
experience than younger interpreters.

Interpreter Job Satisfaction
113
Table 10
Correlations Between Job Satisfaction and the Independent
Variables Among Dependent Contractors
Variable N R p*
Promotion 2 1.00 < .001
Salary 6 .70 .061
Role conflict 16 -.28 .148
Age 16 -.20 .229
Autonomy 16 -.16 .283
Education 14 -.13 .328
Years in current job 16 .02 .328
Working with colleagues 10 .09 .401
Working conditions 9 -.08 .417
Supervision 4 .11 .447
Workload 16 .01 .497
*1-tailed p.
Note: High scores of job satisfaction, working with
colleagues, promotion, salary, role conflict, and workload
indicate a greater value of that variable. Low scores of
autonomy, supervision, and comfort indicate a greater value
of that variable.

Interpreter Job Satisfaction
114
The results presented in Table 10 also show no
significant correlations between job satisfaction and age,
education, years in current job, pay, supervision, working
with colleagues, working conditions, autonomy, workload,
and role conflict for dependent contractor interpreters.
Each variable explained less than 1% of the variance in job
satisfaction.
Research Hypothesis 4
There are significant positive correlations between
job satisfaction among independent contractor interpreters
and salary, role conflict, working conditions, autonomy,
and educational level.
Findings
Results of the Spearman’s rho rank correlation test
for the fourth research hypothesis are presented in Table
11. These results showed significant correlations between
job satisfaction and autonomy. That is, independent
contractor interpreters who had more independence were more
satisfied in their jobs.

Interpreter Job Satisfaction
115
Table 11
Correlations Between Job Satisfaction and the Independent
Variables Among Independent Contractors
Variable N R p*
Autonomy 50 .26 .032
Salary 19 -.23 .171
Promotion 17 -.23 .171
Workload 50 -.17 .118
Age 51 -.12 .200
Role conflict 50 .07 .309
Supervision 16 -.04 .425
Working with colleagues 35 .06 .373
Working conditions 35 .03 .440
Education 47 .01 .484
Years in current job 51 .01 .484
*1-tailed p.
Note: High scores of job satisfaction, working with
colleagues, promotion, salary, role conflict, and workload
indicate a greater value of that variable. Low scores of
autonomy, supervision, and comfort indicate a greater value
of that variable.

Interpreter Job Satisfaction
116
Age was also significantly associated with workload (r
= -.27, p = .026); and number of years in current job (r =
.40, p = .002). In other words, older independent
contractor interpreters had less work-related demands, and
greater work experience than younger independent contractor
interpreters.
Multiple Regression Analysis
A multiple regression analysis was undertaken to
estimate a model that best predicts job satisfaction among
interpreters for the deaf. Three methods of multiple
regression solutions were undertaken: (a) forward; (b)
stepwise, and (c) backward (Munro & Page, 1993). The
results of the three methods were consistent. Thus, the
results of the stepwise method are presented here. A
stepwise method was selected because it combines the
forward and backward solutions, overcoming the difficulties
associated with the other two solutions (Munro & Page,
1993, p. 213).
In the regression analysis, the only independent
variables included were those variables which had
significant relationships with overall job satisfaction.

Interpreter Job Satisfaction
117
These variables were presented in Table 8 and include
autonomy, education, workload, and supervision. Job
satisfaction was entered as the dependent variable.
Research Hypothesis 5
Collaboration, supervisory quality, and educational
level will emerge as significant predictors of job
satisfaction.
Table 12
The Results of the Stepwise Multiple Regression Analysis:
Predictors of Job Satisfaction Among Interpreters (N = 125)
Factor Beta R R2 T p F P
Education -.26 -.51 .26 -2.71 .008 7.36 .008
Workload -.13 -.13 .02 -1.33 .187
Autonomy .07 .07 .01 .76 .448
Supervision -.11 -.01 < .01 -.12 .905
Findings
The results of the stepwise multiple regression
analysis are presented in Table 12. The model explained

Interpreter Job Satisfaction
118
29% of the total variance in job satisfaction scores, with
only education emerging as a significant predictor of
overall job satisfaction.
Demographic Characteristics of Standard Wage Earner and
Contract Interpreters
Tables 13 through 16 describe and compare standard
wage earner (staff) and contract interpreters with regard
to their demographic characteristics. There were
significant differences between staff and contract
interpreters based on employment status (χ2 < 20.92, p <
.001) (Table 7). The ratio between full-time and part-time
interpreters was 67:33 among staff interpreters, whereas
only 31% of contract interpreters worked full-time and the
remaining were part-time (69%). The results presented in
Table 13 show no significant differences between staff and
contract interpreters based on gender, marital status,
education, ITP (graduation from an interpreter training
program), or certification (whether they do or do not
possess nationally recognized certification).

Interpreter Job Satisfaction
119
Table 14 shows significant differences between the two
groups with regard to years interpreting (t = 3.19, p =
.002) and years in current job (t = 4.49, P < .001).
No significant differences were found between the two
groups with regard to age, number of children, and monthly
net pay. With regard to monthly take home pay, monetary
values were converted to U.S. currency equivalents based on
a conversion rate 0.6708 Canadian Dollars per US Dollar, as
of April 13, 1999 (Dynamind, 1999).
A Kruskal-Wallis test of significance was performed to
detect significant differences between staff, dependent
contractor interpreters and independent contractor
interpreters when examining continuous variable data (age,
number of children, years interpreting, years in current
job, and monthly pay.
Table 15 shows significant differences between the two
groups with regard to years in current job status (χ2 <
18.28, p < .001). No significant differences were found
between the three groups with regard to age, number of
children, years interpreting, and monthly net pay.

Interpreter Job Satisfaction
120
A one-way analysis of variance (ANOVA) was also
performed to detect significant differences between staff,
dependent contractor interpreters and independent
contractor interpreters when examining continuous variable
data (age, number of children, years interpreting, years in
current job, and monthly pay. Although the data collected
was from non-random subjects, this inferential test was
conducted to further examine any differences that might
have occurred, either supporting or disputing the findings
of the Kruskal-Wallis examination.
Table 16 shows significant differences between the two
groups with regard to years in current job status (F =
8.69, p < .001). No significant differences were found
between the three groups with regard to age, number of
children, years interpreting, and monthly net pay. These
findings support those of the Kruskal-Wallis test.

Interpreter Job Satisfaction
121
Table 13
Sample Description Regarding Work Status (Categorical Data)
(N = 167)
Variable Staff Contract Total
Chi-
square p
N % N % N %
Gender
Male 17 19 12 16 29 17 .32 .574
Female 73 81 65 84 138 83
Total 90 54 77 46 167 100
Marital Status
Married 42 47 47 61 89 53 3.44 .063
Not Married 48 53 30 39 78 47
Total 90 54 77 46 167 100
Education
High School 14 16 8 10 22 13 8.86 .065
AA 14 16 26 34 40 24
BA 37 41 23 30 60 36
MA 13 14 13 17 26 16
Other 12 13 7 9 19 11
Total 90 54 77 46 167 100

Interpreter Job Satisfaction
122
Variable Staff Contract Total
Chi-
square p
N % N % N %
ITP
Graduate 64 71 55 71 119 71 .002 .964
Non-graduate 26 29 22 29 48 29
Total 90 54 77 46 167 100
Certification
Certified 35 39 33 43 68 41 .27 .603
Non-Certified 55 61 44 57 99 59
Total 90 54 77 46 167 100
Employment
Full-time 60 67 24 31 84 50 20.92 <.001
Part-time 30 33 53 69 83 50
Total 90 54 77 46 167 100

Table 14
Sample Description Regarding Work Status (Continuous Data) (N = 167)
Variable Staff (N = 90) Contractor (N = 77)
t p N SD N SD
Age 90 34.58 8.15 77 37.82 9.39 2.39 .018
Children 90 0.94 1.51 77 1.21 1.44 1.15 .252
Years interpreting 90 8.72 6.13 77 12.73 9.95 3.19 .002
Years in job 90 3.50 2.91 77 6.61 5.78 4.49 < .001
Monthly pay 81 $1,788 $775 59 $1,974 $1,101 1.23 .221
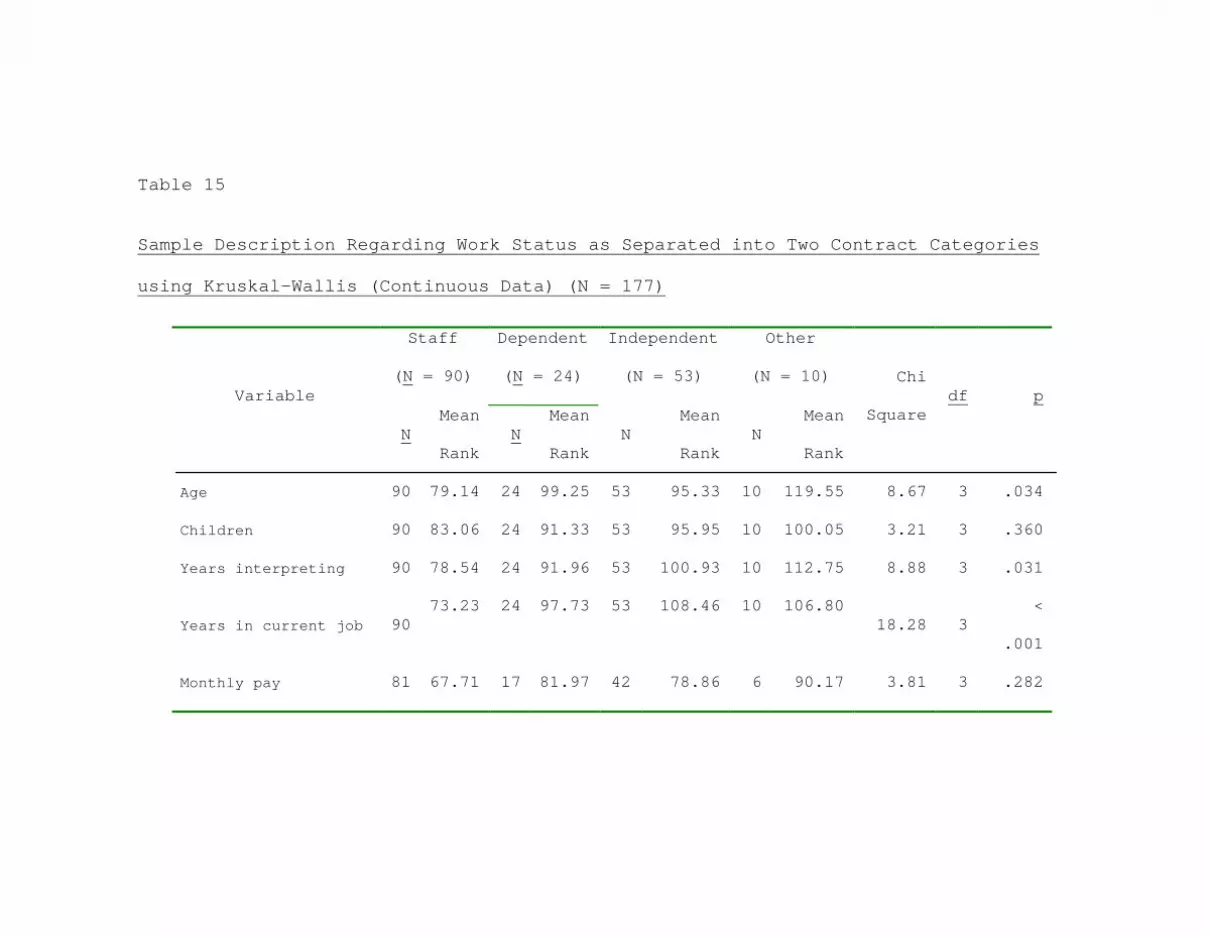
Table 15
Sample Description Regarding Work Status as Separated into Two Contract Categories
using Kruskal-Wallis (Continuous Data) (N = 177)
Variable
Staff
(N = 90)
Dependent
(N = 24)
Independent
(N = 53)
Other
(N = 10) Chi
Square df p
N Mean
Rank N
Mean
Rank N
Mean
Rank N
Mean
Rank
Age 90 79.14 24 99.25 53 95.33 10 119.55 8.67 3 .034
Children 90 83.06 24 91.33 53 95.95 10 100.05 3.21 3 .360
Years interpreting 90 78.54 24 91.96 53 100.93 10 112.75 8.88 3 .031
Years in current job 90 73.23 24 97.73 53 108.46 10 106.80
18.28 3 <
.001
Monthly pay 81 67.71 17 81.97 42 78.86 6 90.17 3.81 3 .282

Table 16
Sample Description Regarding Work Status as Separated into Two Contract Categories
using Oneway ANOVA (Continuous Data) (N = 177)
Source of Variance SS df MS F p
Age 825.76 3 275.25 3.52 .016
Number of children 3.12 3 1.04 .48 .695
Years in current job 578.98 3 192.99 8.69 < .001
Years interpreting 785.36 3 261.79 3.96 .009
Monthly Pay (US Dollars) 1587086.73 3 529028.91 .68 .564
Note: Means examined over three job classifications of staff, independent
contractor, and dependent contractor interpreter, as well as fourth group defined
as “other.”

Interpreter Job Satisfaction
126
Summary
The analyses conducted in this chapter had three
objectives. The first objective was to examine the
relationships between the dependent variable of job
satisfaction, and personal- and job-related factors. The
results presented in Table 8 show significant positive
correlation between job satisfaction and autonomy. The
results also show negative correlation between job
satisfaction and workload (higher workload is associated
with lower satisfaction). Finally, the results show
significant negative correlations between job satisfaction,
education, and supervision.
The second objective was to examine relationships
between the two dependent variables of job satisfaction and
categories of interpreters (staff, independent contractor,
and dependent contractor interpreters), and the independent
variables of time in current job, quality of supervision,
salary, opportunities for promotion, working with
colleagues, workload, role conflict, working conditions,
autonomy, and education. A series of Spearman’s rho rank

Interpreter Job Satisfaction
127
correlations were performed (one for each job category) and
the results were presented in Tables 9, 10, and 11.
The results, with regard to standard wage earner
interpreters (staff interpreters) show significant
correlation between job satisfaction and autonomy. The
results also indicated significant negative correlations
between job satisfaction and education, workload, and
supervision. For dependent contractor interpreters, the
results show significant positive correlation between job
satisfaction and opportunities for promotion (N = 2). The
results, with regard to independent contractor
interpreters, showed significant correlations between job
satisfaction and autonomy.
The third objective was to estimate a model that best
predicts job satisfaction among interpreters for the deaf
in general. The model shows that education emerged as
significant predictors of job satisfaction among
interpreters for the deaf. Education accounted for 26% of
the variance in job satisfaction, with autonomy, workload,
and supervision accounting for another 3% of variance in
job satisfaction.

Interpreter Job Satisfaction
128
Discussion of these results, implications, limitations
of the study, and recommendations for further research are
presented in the next chapter.

DISCUSSION
This chapter contains a summary of the findings, a
discussion of these findings, an examination of
implications for interpreter policy practice, limitations
of the study, and recommendations for further research.
Summary of the Research Findings
Initially, it should be mentioned that the results of
this research represent data that could be biased. It must
be noted that respondents to the survey were self-
selecting, all from a pool of interpreters who have
Internet access and email accounts. This automatically
excludes a large number of interpreters in the United
States and Canada who do not have Internet access and email
accounts. Additionally, it is possible that interpreters
who have Internet access and email accounts are vastly
different in job satisfaction levels, as well as other
factors that influence job satisfaction, from those
interpreters who do not have Internet access and email
accounts. This should be recognized as a possible weakness
of the study, with inferences made from these results with
this caveat in mind.

Interpreter Job Satisfaction
130
The purpose of this study was to examine relationships
between job satisfaction and personal- and job-related
factors among sign language interpreters for the deaf. A
secondary purpose was to examine job satisfaction
differences between staff, dependent contractor, and
independent contractor interpreters. A third purpose of
the study was to estimate a model that predicts job
satisfaction among interpreters for the deaf.
A series of Spearman’s rho rank correlations were
performed to examine which variables most significantly
relate to job satisfaction. Autonomy, workload, education,
and supervision emerged as those variables significantly
related to job satisfaction among interpreters in general.
Finally, a multiple regression analysis was undertaken
to estimate a model that best predicts job satisfaction
among interpreters for the deaf in general. Education
emerged as the most important factor for interpreters,
accounting for 26% of the total variance in job
satisfaction. Autonomy, workload, and supervision all
emerged as weak predictors of job satisfaction, accounting
for only 3% of the total variance in job satisfaction.

Interpreter Job Satisfaction
131
Research Question 1
Correlates of Job Satisfaction
The results of the Spearman’s rho rank correlation
obtained in this study partially supported the first
research hypothesis. This study found significant positive
correlations between job satisfaction and autonomy. In
other words, high satisfaction was associated with high
values for each of these variables. Workload emerged as
significantly negatively correlated to job satisfaction.
However, this meant that a high levels of workload were
associated with low levels of job satisfaction. In other
words, the lower the workload, the higher the job
satisfaction among interpreters. This study also found
significant negative correlations between job satisfaction,
education, and supervision. That is, high satisfaction was
associated with less education and less diligent or
competent supervision.
Autonomy. In this study, high job satisfaction was
significantly associated with higher autonomy at work.
These results support those of Poulin and Walter (1992).

Interpreter Job Satisfaction
132
Regarding interpreters specifically, these results support
the suggestion by Hurwitz (1995) that autonomy among
interpreters for the deaf leads to higher job satisfaction.
This finding suggests the importance of interpreters having
adequate freedom at his/her work to act independently in
determining job satisfaction.
Workload. This study also found a significant correlation
between job satisfaction and workload among dependent
contractor interpreters. That is, higher work satisfaction
was significantly associated with a more manageable,
lighter, or acceptable workload. Carstensen (1994)
previously suggested workload as a significant predictor of
job satisfaction among European interpreters for the deaf.
The results of this study also support Watson’s (1987)
suggestion that excessive workload leads to lesser job
satisfaction and possible job burnout. This study’s
results emphasize the critical effect that manageable
workload has in promoting happiness and satisfaction among
interpreters.
Education and Training. This study found that more
education was associated with lower job satisfaction among
Interpreter Job Satisfaction
133
interpreters for the deaf in general. These results do not
support those of Goff (1998) and Green (1998) in which
employees who had more education had higher job
satisfaction. This study also contradicts Cassell (1989),
and Hurwitz (1998), who suggested that higher education was
a factor attributing to higher job satisfaction among
interpreters. This study examined post-secondary education
as the measurement variable for education. There exists
the possibility that the more educated an interpreter
become, the less likely they are content with their role as
an interpreter. This could be due to factors influencing
the interpreter role, such as limited opportunities for
advancement, or lack of challenge in the work environment.
The results of this study could also mean that
interpreters who are very satisfied with their jobs have no
desire to attend college or further their education.
Finally, the negative correlation of education to job
satisfaction among interpreters may not be an influencing
factor, but rather the result of low job satisfaction.
That is, interpreters who experience low levels of job

Interpreter Job Satisfaction
134
satisfaction may be attending college at higher rates in
order to transition to another career.
Quality of supervision. In this study, a significant
negative correlation was found between job satisfaction and
quality of supervision. That is, higher quality of
supervision was significantly associated with lower job
satisfaction. These results do not support Poulin (1994),
who previously found quality of supervision to be a
significant predictor of work satisfaction. Conversely,
the results of this study support the postulates by
Herzberg’s Motivation-Hygiene Theory (1968). According to
this theory, the absence of good supervision would increase
job satisfaction, whereas its absence would not necessarily
increase job satisfaction. The results of this study
suggest that supervision among interpreters is not an
important factor in promoting happiness and satisfaction
among interpreters. As earlier indicated in this study,
interpreters value autonomy, with a great degree of
independence associated with high job satisfaction. It is
possible that interpreters perceive supervision as an
undesirable condition of employment.

Interpreter Job Satisfaction
135
Research Question 2
Correlates of Job Satisfaction Among Interpreters with
Differing Job Status
Staff Interpreters
The results of the Spearman’s rho rank correlation
obtained in this study partially supported the second
research hypothesis which concerned standard wage earner
(staff) interpreters. This study found significant
positive correlations between job satisfaction and autonomy
among staff interpreters for the deaf. In other words,
high satisfaction was associated with more independence
among staff interpreters. Workload emerged as
significantly negatively correlated to job satisfaction.
However, this meant that a high levels of workload were
associated with low levels of job satisfaction. In other
words, the lower the workload, the higher the job
satisfaction among staff interpreters. This study also
found significant negative correlations between job
satisfaction, supervision, and education. That is, more

Interpreter Job Satisfaction
136
effective supervision, and more education, were associated
with lower job satisfaction among staff interpreters.
Dependent Contractor Interpreters
The results of the Spearman’s rho rank correlation
obtained in this study failed to support the third research
hypothesis which concerned dependent contractor
interpreters. This study failed to find any significant
positive correlations between job satisfaction and salary,
efficient working with colleagues, role conflict,
comfortable working conditions, autonomy, or training among
dependent contractor interpreters. However, this study
found significant positive correlations between job
satisfaction and opportunities for promotion among
dependent contractor interpreters for the deaf. In other
words, high satisfaction was associated with more
opportunities for promotion. However, the results for this
correlation are highly suspect due to the extremely small
sample size (N = 2).
Opportunities for Promotion. This study found that higher
job satisfaction was associated with greater opportunities
for promotion. These results support the findings of

Interpreter Job Satisfaction
137
Herzberg (1968) and Russ and McNeilly (1995). They
suggested that existing opportunities for promotion would
increase employees’ sense of satisfaction. The results of
this study and others emphasize the importance of
opportunities for promotion in increasing job satisfaction
among interpreters for the deaf.
Independent Contractor Interpreters
The results of the Spearman’s rho rank correlation
obtained in this study partially support the fourth
research hypothesis which concerned independent contractor
interpreters. This study found significant positive
correlations between job satisfaction and autonomy.
Research Question 3
Predictors of Job Satisfaction
The results of the multiple regression analysis partially
supported the research hypothesis, and revealed one factor,
that of education, as a significant predictors of job
satisfaction. However, the amount of education was
negatively correlated to job satisfaction. These results
do not support the findings of Black-Branch (1996), Eskew

Interpreter Job Satisfaction
138
and Fox (1998), and Cooper and Artz (1995) as they apply to
the general population, that more education leads to higher
job satisfaction.
Implications for Interpreter Policy Practice
This study had two major findings that have
implications for interpreter policy practice. The first
finding is related to the predictors of job satisfaction,
and the second is the significant differences between
staff, independent contractor, and dependent contractor
interpreters in job satisfaction and other job-related
factors.
Figure 2. Diagram of the Predictors of Job Satisfaction
Job Satisfaction
Supervision(-)
Workload(-)
Autonomy(+)
Education(-)
Note: Education was found to be the most
significant predictor of overall job satisfaction.

Interpreter Job Satisfaction
139
Enhancing Interpreters’ Satisfaction
The diagram presented in Figure 2 shows the importance
of understanding the extent of increased autonomy, less
workload, less supervision, and less education for
predicting levels of satisfaction among interpreters for
the deaf throughout the U.S. and Canada. The findings
suggest that as long as interpreters do not experience
adequate independence, have an excessive workload,
experience close and competent supervision, and have
received more college training, they are likely to
experience some degree of dissatisfaction.
These results are puzzling, but may be explained by
the strong need for autonomy by interpreters. It is
possible that interpreters, including those in staff
positions, may reject the concept of being supervised,
preferring to dictate their own work policy. Additionally,
it is disconcerting to observe, as this study found, that
the more college training interpreters receive, the less
satisfied they are with their jobs. As mentioned earlier
in this study, this could be due to the limited
possibilities for promotion for interpreters. Interpreting

Interpreter Job Satisfaction
140
is a skill-based profession, with little upward mobility.
Most chances for promotion for interpreters would place
them in administrative, managerial, and training positions,
those in which they would do little, if any interpreting.
However, interpreters who do leave the profession of
interpreting often enter teaching and adjunct professions
that complement interpreting. Interpreters rarely leave
the profession for one that is totally detached from
interpreting.
The consequences of ignoring the factors that lead to
higher job satisfaction, and those that lead to lower
satisfaction, could result in work disruption, inflated
administrative and training costs, and reduced productivity
(Barber, 1986). When this situation occurs, the
interpreters, those they serve, and those who employ them
receive diminished returns on their investment in time,
money, and other resources. Those who employ interpreters
for the deaf play a critical role in promoting happiness
and satisfaction among interpreters.
As demonstrated by this study, the nature of
interpreting can be varied, ranging from a succinctly

Interpreter Job Satisfaction
141
defined staff role, to that of an independent contractor
interpreter. In all positions there is often a lack of
supervision by a person familiar with the field, and the
requirements of interpreting (Hurwitz, 1995).
This study emphasizes the need for autonomy among
interpreters, as well as the detrimental effects of
supervision and education upon job satisfaction. Perhaps
the level of supervision that interpreters are receiving is
inappropriate for their job roles, with traditional methods
of employer-employee interaction being ineffectual.
Additionally, while it is suggested that more education
leads to lower job satisfaction, perhaps the methods in
which education are delivered to interpreters do not meet
their needs.
This study examined education in the traditional,
formal sense, that being attendance at a college or
university. Informal training, that which is work-based,
was not examined as a variable influencing job
satisfaction. However, effective training and mentoring
was mentioned earlier in a review of the literature as
critical in ensuring job satisfaction and retention among

Interpreter Job Satisfaction
142
employees (Angle, 1998; Bellinger, 1998; The Gallup
Organization, 1999c; Hurwitz, 1995; The Virginia Department
of Education, 1993). A possible solution for interpreters
for the deaf, and one that may be considered cost-
effective, is effective mentoring and training.
The nature of interpreting, providing services to deaf
and hearing people alike, usually takes the interpreter
away from a static work environment. Interpreters are
constantly traveling from one assignment to another, be it
across town or across a college campus. While autonomy has
been demonstrated by this study as being a significant
correlate to job satisfaction, it should not be concluded
that interpreters should be left without supervision and
effective interactions at the workplace. Interpreters, if
left to function with total independence, and without
necessary support, may experience a loss of satisfaction
over time. While traditional supervision may not be
beneficial for interpreters, there are measures that can
compliment the work experience and satisfaction of
interpreters in general. Mentoring, a close relationship
between a seasoned interpreter and less seasoned

Interpreter Job Satisfaction
143
interpreter, may be a viable alternative to a more formal
supervisory model.
As Hurwitz (1995) suggests, effective mentoring of
interpreters can lead to increased stamina and tools to
handle the multi-faceted tasks of the job. Mentoring,
either directly or indirectly, addresses autonomy and
workload issues, both of which are highly correlated to job
satisfaction as identified in this study. Autonomy, or
independence among interpreters, can be complimented
through proper mentoring and training. If interpreters are
to function independently, regardless of their job status
(staff or contractor), they must have the proper tools,
confidence, and knowledge to act in this capacity.
Additionally, proper mentoring (and training) can
effectively alleviate the stresses associated with
workload. A mentor’s wisdom can provide the interpreter
with knowledge, options, and varying perspectives to better
address issues related to workload. This training should
also extend to contract interpreters as offered by
interpreter referral agencies, government institutions, or

Interpreter Job Satisfaction
144
any entity that employs or utilizes the services of
interpreters for the deaf.
Mentoring, as defined by the Registry of Interpreters
for the Deaf, Inc. (1997), “…can benefit the intern,
mentor, consumers, and the interpreting profession” (p. 1).
The following benefits of mentoring have been identified
(Registry of Interpreters for the Deaf, Inc., 1997):
1. Provide a reduced sense of isolation
2. Provide smoother entry into the interpreting
field
3. Provide a look at interpreting from another's
perspective
4. Provide a challenge to continue developing
professionally
5. Strengthening of specific skills or knowledge
areas
6. Provide real-life interpreting experience with
immediate feedback and guidance
7. Provide expert modeling to observe and emulate

Interpreter Job Satisfaction
145
Benefits to the mentor, as further explained the
Registry of Interpreters for the Deaf, Inc. (1997),
include:
1. A sense of satisfaction for having helped another
interpreter grow professionally
2. Knowledge that they have strengthened the field
of interpreting
3. Have their experience and skills recognized
Finally, the ultimate beneficiary of the mentoring process
is the consumer of interpreting services, both the hearing
and deaf persons involved in the communication process.
Their potential gains through the mentoring of
interpreters, as outlined by the Registry of Interpreters
for the Deaf, Inc. (1997) are:
1. An increase in the number of interpreters skilled
in a variety of settings
2. Direct involvement in the professional growth of
interpreters

Interpreter Job Satisfaction
146
Limitations of the Study
This study has a number of methodological limitations.
These limitations are as follows:
1. Cross-sectional survey. This type of design is
limited in that causality cannot be established. Due to
this limitation it is unknown whether or not the
independent variables preceded the dependent variable(s).
2. Self-selection. Fifteen hundred interpreters in
the United States and Canada received the invitation to
participate in this study, but only 177 visited the web
survey site and completed the questionnaires. No
demographic data were available for nonparticipant
interpreters to compare them with participant interpreters.
A question is raised about who they were and why they chose
not to participate.
3. Self-report. This study used a self-report
questionnaire. Interpreters were asked to read the items
and circle the number (1 to 5, 1 to 4, or 1 to 6) that best
described their feelings about a particular item. When
using a self-report method, the participant makes the
observation or records the data by himself/herself. The
Interpreter Job Satisfaction
147
researcher makes the assumption, either correctly or
incorrectly, that the participants’ responses accurately
reflect their feelings.
4. Sample size. The number of respondents examined,
especially among dependent contractor interpreters, was
insufficient to formulate significant conclusions, or
making applications to the general interpreter population.
5. Response rate. The response rate in this study
was 15%. This rate is inadequate for statistical analysis
according to Rubin and Babbie (1997). Therefore, the
results of this study cannot be generalized to all
interpreters for the deaf throughout the United States and
Canada. If generalizations are made, they should be made
with extreme caution.
5. Technical limitations. The data collection
implemented in this study was novel in that it was entirely
accomplished on the Internet. According to Gopalan (1996),
Internet testing and research provides “limited
possibilities for direct interaction with or observation of
users” (p. 1). Some additional concerns are: lack of
Internet access for all subjects; possible duplicate

Interpreter Job Satisfaction
148
completion of questionnaire by the same subject;
incompatible web browser; and, personality type and
experience of those with Internet access may be greatly
different from those who do not have Internet access.
Recommendations for Future Research
The findings from this study illustrate the importance
of a number of personal- and job-related factors in
predicting job satisfaction among interpreters for the
deaf. Therefore, replication is an important step to
cross-validate the findings and to establish
generalizability of the findings for all interpreters in
the United States and Canada and, perhaps, in other
countries. Further research similar to the present study
should examine the differing effects of personal- and job-
related variables on job satisfaction between Anglo
Americans and minority groups in the United States and
Canada. Because interpreters are highly mobile and
autonomous workers, it is suggested that the variables of
support, transportation, and workspace (private designated
work area, as interpreters who work in the field rarely

Interpreter Job Satisfaction
149
have an office or work area that they can call their own)
be examined in future research.
This study examined the effect of 11 independent
factors (Table 8) on job satisfaction. The results of
multiple regression analysis (Table 12) show that only 1 of
the 11 independent factors was a significant predictor of
job satisfaction, accounting for 26% of the variance. The
remaining 74% is still unexplained and should be examined.
Finally, autonomy and workload emerged as significant
correlates of job satisfaction. It would be appropriate to
perform cost-benefit analyses on implementation of programs
that emphasize these factors. As earlier suggested,
mentoring programs deserve attention and should be
considered as a viable alternative to formal training.
Further research in which job satisfaction, performed pre-
program and post-program implementation, is recommended.
In conclusion, the results of this study should be
considered a preliminary examination of job satisfaction
among interpreters for the deaf. The intent was to
establish correlates of job satisfaction, as well as a
model that best predicts job satisfaction among

Interpreter Job Satisfaction
150
interpreters. Further research is required to establish
appropriate inferences to workers in the profession. Of
prime concern are the influences of the factors of
education and workload. These factors, as well as others
that may emerge as significant correlates or predictors of
job satisfaction, must be examined in depth. The global
goal should always be the improvement of job satisfaction
among interpreters for the deaf.

REFERENCES
Anderson, G.B. & Stauffer, L.K. (1991). Identifying
standards for the training of interpreters for deaf people.
Journal of the American Deafness and Rehabilitation
Association, 25(3), 35-46.
Angle, D. (1998). The Kansas Mentoring Project [WWW
document]. http://www-personal.ksu.edu/~dangle/mentor.html.
Barber, G. (1986). Correlates of job satisfaction
among human service workers. Administration in Social Work,
10(1), 25-38.
Barber-Gonzales, D., Preston, C., & Sanderson, G.
(1985). Taking care of interpreters at California State
University Northridge. In M. McIntire (Ed.), Proceedings of
the Ninth National Convention of the Registry of
Interpreters for the Deaf (pp. 207-214). Silver Spring, MD:
RID Publications.
Baugher, G. (1999). Sentinel Networks, Inc. [WWW
document]. http://www.sentinelnet.net/contact.htm.
Bellinger, B. (1998, October 9). Worker shortage
persists [WWW document].
http://www.techweb.com/wire/finance/story/TWB19981009S0008.

Interpreter Job Satisfaction
152
Bernal, D. (1998). The age and job satisfaction
relationship: does its shape and strength still evade us?
The Journals of Gerontology, 53(5), 287-294.
Bersani, H. A. & Heifetz, L. J. (1985). Perceived
stress and satisfaction of direct-care staff members in
community residences for mentally retarded adults. American
Journal of Mental Deficiency, 90(3), 289-295.
Black-Branch, J.L. (1996). The consequences of
teaching and job satisfaction: Federation/union,
remunerations, and career development, the most important
factors. Journal of Collective Negotiations, 25(3), 247-
269.
Blake, J. (1997). Personality type and interpreters
for the deaf [WWW document].
http://www.terpsnet.com/resources/personality-types.htm.
Bosman, R. (1995). Interpreting in mental health
settings. Report on Working Seminars on Minimal Language
Skills. Symposium conducted at the meeting of the European
Forum of Sign Language Interpreters, Gent, Belgium.

Interpreter Job Satisfaction
153
Bourcier, P., (1981). Consumer education – the
interpreter’s point of view. A Report of the Third
International Symposium of Interpretation of Sign
Languages, Bristol, England, 111-114.
Brayfield, A.H., & Rothe, H.F. (1951). An index of job
satisfaction. Journal of Applied Psychology, 35(5), 307-
311.
Brayfield, A.H., Wells, R.V., & Strate, M.W. (1957).
Interrelationships among measures of job satisfaction and
general satisfaction. Journal of Applied Psychology, 41,
201-205.
Buckley, M. (1992). Measurement issues concerning the
use of inventories of job satisfaction. Educational and
Psychological Measurement, 52(3), 529-543.
Campbell, A., Converse, P.E., & Rogers, W.L. (1976).
The quality of American life... perceptions, evaluations,
and satisfactions. New York: Russell Sage.
The Canadian Association of the Deaf. (1994a, July).
Interpreting. Ottawa: Author.
The Canadian Association of the Deaf. (1994b, July).
Official languages. Ottawa: Author.

Interpreter Job Satisfaction
154
The Canadian Hearing Society (1996, April).
Interpreter training crisis [WWW document].
http://www.chs.ca/vibes/art003.htm.
Caplan, R., Cobb, S., French, J.R.P., Harrison, R.V.,
& Pinneau, S.R. (1975). Job demands on worker's health.
Washington, DC: U.S. Department of Health, Education, and
Welfare.
Carstensen, S. (1994). Working conditions. In European
Forum of Sign Language Interpreters, Blueprint 2000: Sign
language interpreting in Europe. Hamburg, Germany.
Cassell, D. (1984). Innovative strategies for
enhancing professional attitudes and behavior in students
of interpreting. Proceedings of the Fourth National
Conference of Interpreter Trainers Convention, USA, 203-
250.
Catlette, B., & Hadden, R. (1998). Contented cows give
better milk: The plain truth about employee relations &
your bottom line. Germantown, Tennessee: Saltillo Press.
Conference of Interpreter Trainers. (1995, February).
National interpreter education standards. Chicago: Author.

Interpreter Job Satisfaction
155
Conference of Interpreter Trainers (1998). CIT
organizational review [WWW document].
http://www.unm.edu/~wilcox/CIT/cit_info.html#anchor1584167.
Conference of Interpreter Trainers. (1999). CIT
membership directory [Brochure]. Atlanta, Georgia: Author.
Cooper, A.C., & Artz, K.W. (1995). Determinants of
satisfaction for entrepreneurs. Journal of Business
Venturing, 10, 439-457.
Cowley, P. (1999). Terps-L subscribers [WWW document].
http://www.terpsnet.com/resources/TERPS-L-Subscribers.htm.
Crites, J.O. (1966). Test reviews. Journal of
Counseling Psychology, 13, 120-122.
Crites, J.O. (1969). Vocational Psychology. New York:
McGraw-Hill.
Doerfert, K., & Wilcox, S. (1986). Meeting students'
affective needs: personality types and learning
preferences. Journal of Interpretation, 3, 35-43.
Domo, M. (1999). List Serve [WWW document].
http://www.tsid.org/listserve.htm.
Donahue, T. (1998). Coping with more complex laws,
labor shortages. HR Magazine, 43(3), 72.

Interpreter Job Satisfaction
156
Donavan, M., & Drauden, R. (1989). Measuring work
group effectiveness: A comparison of three instruments.
Management Communication Quarterly, 2(3), 424-448.
Duffy, P.B., & Stevenson, H.H. (1984).
Entrepreneurship and self-employment: understanding the
distinctions. In J.A. Horndady, F. Tarpley, Jr., J.A.
Timmons, & K.H. Vesper (Eds.), Frontiers of
entrepreneurship research (pp. 461-477). Wellesley, MA:
Babson College.
Durr, W. (1996). Job satisfaction in human resources:
A state employment agency. Unpublished master’s thesis,
Fort Hays State University, Hays, Kansas.
Dynamind (1999, April 14). Currency calculator [WWW
document]. http://www3.dynamind-
llc.com/currency/calculate.cfm.
Edwards, J. (1978). Comparative analyses of enlisted
job satisfaction as measured by the Occupational Attitude
Inventory, final report (Report No. AFHRL-TR-78-61). Brooks
Air Force Base, TX: Air Force Human Resources Lab. (ERIC
Document Reproduction Service No. ED 164 902).

Interpreter Job Satisfaction
157
Elliott, R.N., & Povers, A.R. (1995). Preparing
interpreters to serve in educational settings. ACEHI
Journal/Revue ACEDA, 21(2-3), 132-140.
European Forum of Sign Language Interpreters. (1994).
Blueprint 2000: Sign language interpreting in Europe.
Hamburg, Germany.
Fisher, E. (1997). Managing human resource shortages
in a unionized setting: Best practices in air traffic
control. Journal of Labor Research, 18(2), 287.
The Gallup Organization (1999a). Building a stronger
workplace [WWW document].
http://www.gallup.com/workplac1.htm.
The Gallup Organization (1999b, February 15).
Employees speak out on job training [WWW document].
http://205.219.140.75/gallup%5Freleases/ddi%5Freport%5F6%5F
98.htm.
The Gallup Organization (1999c, February 24). A hard-
working day of workplace improvement [WWW document].
http://205.219.140.75/workplace%5Fsummit/fromtheceo.htm.

Interpreter Job Satisfaction
158
George, M.J., & Baumeister, A.A. (1981). Employee
withdrawal and job satisfaction in community residential
facilities for mentally retarded persons. American Journal
of Mental Deficiency, 85, 639-647.
Gillispie, M. (1993). Job satisfaction of new nursing
graduates experiencing a mentoring relationship.
Unpublished doctoral dissertation, University of Texas,
Austin.
Goff, L. (1998, April 20). Annual job satisfaction
survey: hallelujahs & heartaches [WWW document].
http://cwstage2.cw.com/home/features.nsf/All/980420careers.
Gopalan, N. (1996). The Internet as a research medium:
on-line user testing of a World Wide Web site [WWW
document]. http://web.cgrg.ohio-
state.edu/~ngopalan/writing/chi/paper.html#11.
Government Printing Office (1990). The Americans with
Disabilities Act. Washington, DC: Department of Justice.
Green, G. (1998). Tight labor markets and wages:
Employer responses to labor shortages. Unpublished
manuscript, University of Wisconsin-Madison.

Interpreter Job Satisfaction
159
Green, F., Machin, S., & Wilkinson, D. (1996). An
analysis of workplace training and skill shortages. London:
The Stationery Office Books.
Harboe, A. (1977). The development of interpretation
for the deaf as a profession. Report of Second
International Symposium of Interpretation of Sign
Languages, Chicago, 7-10.
Heneman, R., Eskew, D., & Fox, J. (1998). Using
employee attitude surveys to evaluate a new incentive pay
program. Compensation & Benefits Review, 30(1), 40-44.
Heppner, P.P., Kivlighan, D.M., & Wampold, B.E.
(1992). Research design in counseling. Pacific Grove, CA:
Brooks/Cole Publishing Company.
Herzberg, F. (1968). One more time: How do you
motivate employees. Harvard Business Review, 53-62.
Herzog, A.R., & Rogers, W.L. (1986). Satisfaction
among older adults. In F.M. Andrews (Ed.), Research on the
quality of life (p. 267-285). Ann Arbor, MI: University of
Michigan Institute for Social Research.

Interpreter Job Satisfaction
160
Holland, J., & Gottfredson, G. (1994). Career
Attitudes and Strategies Inventory: An Inventory for
Understanding Adult Careers. Lutz, Florida: Psychological
Assessment Resources, Inc.
Hoppock, R. (1935). Job satisfaction. New York: Harper
& Brothers.
Hornaday, J.A., & Vesper, K.H. (1982). Entrepreneurial
education and job satisfaction. In K.H. Vesper (Ed.),
Frontiers of entrepreneurship research (pp. 25-29).
Wellesley, MA: Babson College.
Hurwitz, T. (1995). Current issues: Interpreters in
the educational setting. Paper presented at the
International Congress on Education of the Deaf, Tel Aviv,
Israel.
Irwin, C., & Morgan, S. (1985). Educational
interpreters – a new breed. Paper presented at the Annual
Convention of the Council for Exceptional Children,
Anaheim, CA.
Jayaratne, S., & Chess, W. (1984). Job satisfaction: A
comparison of caseworkers and administrators. Social Work,
31(2), 144-146.

Interpreter Job Satisfaction
161
Jayaratne, S., & Chess, W. (1986). Job satisfaction: A
comparison of caseworkers and administrators. Social Work,
31(2), 144-146.
Jun, J. (1998). An exploratory model of the
relationship between empowerment, job involvement, job
satisfaction, organizational commitment, and customer
orientation in the hospitality industry. Unpublished
doctoral dissertation, Virginia Tech, Blacksburg.
Katz, J.A. (1993). How satisfied are the self-
employed: a secondary analysis approach. Entrepreneurship
Theory and Practice, 17, 35-51.
Koustelios, A., & Bagiatis, K. (1997). The Employee
Satisfaction Inventory (ESI): Development of a scale to
measure satisfaction of Greek employees. Educational and
Psychological Measurement, 57(3), 469-476.
Lee, C. (1990). Interactive effects of Type A behavior
and perceived control on worker performance, job
satisfaction, and somatic complaints. Academy of Management
Journal, 33, 870-881.
Interpreter Job Satisfaction
162
Lewis, B (1998, August 10). IS survival guide [WWW
document].
http://www.idg.net/idg_frames/english/content.cgi?vc=docid_
9-67388.html.
Locke, E.A. (1976). The nature and causes of job
satisfaction. In Dunnette, M.D. (Ed.), Handbook of
industrial and organizational psychology (pp. 1297-1349).
Chicago: Rand McNally.
Lockmiller, C., (1982). Interpreter burnout.
Proceedings of the Conference of Interpreter Trainers, USA,
34-40.
Loncke, F. (1995). Minimal language skills and
interpreting: Setting the scene. Report on Working Seminars
on Minimal Language Skills. Symposium conducted at the
meeting of the European Forum of Sign Language
Interpreters, Gent, Belgium.
Luciano, J., & Swartz, D. (1997). An examination of
interpreter personality using the California Personality
Inventory. Paper presented at National Convention of the
Registry of Interpreters for the Deaf, Long Beach, CA.

Interpreter Job Satisfaction
163
Massoud, L. (1994). Interpreter training program:
program review. Flint, MI: Mott Community College. (ERIC
Document Reproduction Service No. ED 376 655).
Maidani, E.A. (1991). Comparative study of Herzberg's
two-factor theory of job satisfaction among public and
private sectors. Public Personnel Management, 20, 441-448.
Maslach, C., Jackson, S.E., & Leiter, M.P. (1994).
Maslach Burnout Inventory manual (3rd ed.). Palo Alto, CA:
Consulting Psychologists Press, Inc..
McNeal, E.N. (1996). Examining job satisfaction levels
of student assistant employees of Akron Summit County
public libraries: a survey. Kent State University. (ERIC
Document Reproduction Service No. ED 401 917).
McNeely, R.L. (1984). Occupation, gender, and work
satisfaction in a comprehensive human services department.
Administration in Social Work, 8(2), 35-47.
McNeely, R.L. (1987). Predictors of job satisfaction
among three racial/ethnic groups of professional human
service workers. Journal of Sociology and Social Welfare,
14(4), 115-136.

Interpreter Job Satisfaction
164
McNeely, R.L. (1989). Race and job satisfaction in
human service employment. Administration in Social Work,
13(1), 75-94.
McNeely, R.L., Feyerherm, W.H., & Johnson, R.E.
(1986). Services integration and job satisfaction reactions
in a comprehensive human resource agency. Administration in
Social Work, 10(1), 39-53.
McNeely, B.L., & Meglino, B.M. (1994). The role of
dispositional and situational antecedents in prosocial
organizational behavior: An examination of the intended
beneficiaries of prosocial behavior. Journal of Applied
Psychology, 79, 836-844.
McNeese-Smith, D. (1996). Increasing employee
productivity, job satisfaction, and organizational
commitment. Hospital & Health Services Administration,
41(2), 160-176.
Michalos, A.C. (1986). Job satisfaction, marital
satisfaction, and the quality of life; a review and
preview. In F.M. Andrews (Ed.), Research on the quality of
life (p. 267-285). Ann Arbor, MI: University of Michigan
Institute for Social Research.

Interpreter Job Satisfaction
165
Miller, D.C. (1978). Handbook of research design and
social measurement (3rd ed.). New York: Longman.
Munro, B., & Page, E. (1993). Statistical methods for
health care research (2nd ed.). Philadelphia: J.B.
Lippincott Company.
Myers, I.B. (1980). Gifts differing. Palo Alto, CA:
Consulting Psychologists Press, Inc.
Naughton, T.J. (1987a) Contrasting models of quality
of working life among the self-employed: an empirical test.
In F. Hoy (Ed.), Best Paper Proceedings Academy of
Management, 47th Annual Meeting (pp. 78-81). New Orleans,
LA.
Naughton, T.J. (1987b). Quality of working life and
the self-employed manager. American Journal of Small
Business, 12, 33-40.
Norusis, M.J. (1998). SPSS 8.0 guide to data analysis.
Upper Saddle River, NJ: Prentice Hall.
Nursing Recruitment and Retention Taskforce (1998,
August 18). Report recommendations 1996 [WWW document].
http://nursesreg.health.nsw.gov.au/corporate-
services/nursing/recruitment.htm.

Interpreter Job Satisfaction
166
Oakland Community College (1991). Sign language
interpreter needs assessment (Report No. JC920276).
Farmington, MI: Office of Institutional Planning and
Analysis. (ERIC Document Reproduction Service No. ED 345
796).
O'Conner, E., Peters., L, & Gordon, S. (1978). The
measurement of job satisfaction: Current practices and
future considerations. Journal of Management, 4, 17-26.
Ohio Interpreter Standards Committee (1998, July 15).
H.B. 205- The Ohio Interpreters Standards Bill Summary [WWW
document]. http://members.tripod.com/oisc/summary.html.
O'Quin, K. (1998). Job satisfaction and intentions to
turnover in human service agencies perceived as stable or
nonstable. Perceptual and Motor Skills, 86(1), 339-345.
Paschke, J. (1998). Network job satisfaction [WWW
document].
http://www.ins.com/surveys/job_results/index.html.
Patton, M.Q. (1987). How to use qualitative methods in
evaluation. Newbury Park, CA: Sage Publications.
PCRID. (1999). Membership Directory [Brochure].
Baltimore, Maryland: Author.

Interpreter Job Satisfaction
167
Poulin, J.E. (1994). Job task and organizational
predictors of social worker job satisfaction change: a
panel study. Administration in Social Work, 18(1), 21-38.
Poulin, J.E. (1995). Job satisfaction of social work
supervisors and administrators. Administration in Social
Work, 19(4), 35-49.
Poulin, J.E., & Walter, C.A. (1992). Retention plans
and job satisfaction of gerontological social workers.
Journal of Gerontological Social Work, 19(1), 99-114.
Provost, J.A. (1990). Work, play, and type. Palo Alto,
CA: Consulting Psychologists Press, Inc.
Quinn, R.P., & Staines, G.L. (1979). The 1977 Quality
of Employment Survey. Ann Arbor, MI: Institute for Social
Research.
Registry of Interpreters for the Deaf. (1993). Working
conditions. Proceedings of the Thirteenth National
Convention of the Registry of Interpreters for the Deaf,
182-184.
Registry of Interpreters for the Deaf, Inc. (1997,
August 12). Mentoring [WWW document].
http://www.rid.org/ment.html.
Interpreter Job Satisfaction
168
Registry of Interpreters for the Deaf. (1998).
Registry of Interpreters for the Deaf [WWW document].
http://www.rid.org/.
Reuters (1998, March 25). Skill shortage threatens
U.S. growth - manufacturing leader [WWW document].
http://www.pathfinder.com/money/latest/rbus/RB/1998Mar25/54
8.html.
Rojas, J. (1987). A survey on job satisfaction of
free-lance (and permanent) conference interpreters,
domiciled in the Geneva area. Unpublished paper, Webster
University, Geneva, Switzerland.
Rubin, A., & Babble, E. (1997). Research methods for
social work (3rd ed.). Pacific Grove, CA: Brooks/Cole
Publishing Company.
Russ, F.A., & McNeilly, K.M. (1995). Links among
satisfaction, commitment, and turnover intentions: the
moderating effect of experience, gender and performance.
Journal of Business Research, 34, 57-65.

Interpreter Job Satisfaction
169
Schaufeli, W.B., Leiter, M.P., & Kalimo, R. (1995,
September). The Maslach Burnout Inventory—General Survey: A
self-report questionnaire to assess burnout at the
workplace. In M.P. Leiter, Extending the Burnout Construct:
Reflecting Changing Career Paths. Symposium conducted at
the APA/NIOSH conference, Work, Stress, and Health ’95:
Creating a Healthier Workplace, Washington, DC.
Siefert, K., Jayaratne, S., & Chess, W. (1991). Job
satisfaction, burnout, and turnover in health care social
workers. Health and Social Work, 16(3), 193-202.
Smith, T.M., & Gorelick, A.J. (1979). The admissions
process of the basic interpreter training program: a
formative evaluation (Tech. Rep. No. 3). Rochester, NY:
National Technical Institute for the Deaf at Rochester
Institute of Technology.
Smits, S. (1972). Counselor job satisfaction and
employment turnover in the state rehabilitation agencies.
Journal of Counseling Psychology, 19(6), 512-517.
Snavely, B. (1997). Dr. Bill Snavely's home page [WWW
document]. http://www.sba.muohio.edu/snavelwb/.

Interpreter Job Satisfaction
170
Spector, P. (1985). Measurement of human service staff
satisfaction: Development of the job satisfaction survey.
American Journal of Community Psychology, 13, 693-713.
Spector, P. (1986). Assessing employee job
satisfaction with the job satisfaction survey. Mental
Retardation Systems, 3, 5-13.
Spector, P.E. (1994). Job Satisfaction Survey, JSS
[WWW document].
http://chuma.cas.usf.edu/~spector/scales/jssovr.html.
Spector, P.E. (1997). Job satisfaction: application,
assessment, causes and consequences. Thousand Oaks, CA:
Sage Publications.
Staw, B.M., & Ross, J. (1985). Stability in the midst
of change: a dispositional approach to job attitudes.
Journal of Applied Psychology, 70, 469-480.
Stewart, D.A., & Kluwin, T.N. (1996). The gap between
guidelines, practice, and knowledge in interpreting
services for deaf students. Journal of Deaf Studies and
Deaf Education, 1(1), 29-39.

Interpreter Job Satisfaction
171
The Swedish National Association of the Deaf. (1991).
Action program on interpreting services. Stockholm: The
Swedish National Association of the Deaf.
Tabachnick, B.G., & Fidell, L.S. (1996). Using
multivariate statistics (3rd ed.). Northridge, CA: Harper
Collins College Publishers.
Taylor, C., & Elliott, R. N. (1994). Identifying areas
of competence needed by educational interpreters. Sign
Language Studies, 83, 179-190.
Tett, R.P. (1993). Job satisfaction, organizational
commitment, turnover intention, and turnover: path analyses
are based on meta-analytic findings. Personnel Psychology,
46, 259-293.
Tietjen, M.A., & Myers, R.M. (1996). Motivation and
job satisfaction. Management Decision, 36(4), 226-231.
Tseng, J. (1992). Interpreting is an emerging
profession in Taiwan - a sociological model. Unpublished
master’s thesis, Fu Jen Catholic University, Taiwan.
Turoff, M. (1992). Development process [WWW document].
http://eies.njit.edu/~turoff/coursenotes/CIS679/vg2679/sld0
01.htm.

Interpreter Job Satisfaction
172
U.S. Department of Education (1997, October 19).
Training interpreters for individuals who are deaf and
individuals who are deaf blind [WWW document].
http://ocfo.ed.gov/grntinfo/forecast/forecast.htm.
Utah Registry of Interpreters for the Deaf, Inc.
(1999). UtRID membership directory [WWW document].
http://www.bolingbroke.com/utrid/membership.htm.
Utah State Board of Education. (1997, January). Draft
policy and procedure manual. Salt Lake City: Utah State
Office of Rehabilitation Division of Services for the Deaf
and Hard of Hearing.
VandenHeuvel, A., & Wooden, M. (1997). Self-employed
contractors and job satisfaction. Journal of Small Business
Management, 35(3), 11-21.
Viaggio, S. (1996, February). A chief interpreter’s
view. Paper presented at the XIV FIT Congress, Melbourne.
Virginia Department of Education (1993). Educational
interpreters in Virginia public schools: Factors affecting
supply, demand, and training. Richmond: State of Virginia.
Watson, J. (1987). Interpreter Burnout. Journal of
Interpretation, 4, 79-86.

Interpreter Job Satisfaction
173
Weiss, D. (1977). Minnesota Satisfaction
Questionnaire. Minneapolis: University of Minnesota.
Woll, B. (1988). Report on a survey of sign language
interpreter training and provision within the member
nations of the European Community. Federation
Internationale des Traducteurs Revue Babel, 34(4), 193-209.
Woll, B., & Porcari, G. (1995). Higher education
interpreting. Paper presented at the International Congress
on Education of the Deaf, Tel Aviv, Israel.
Wood, V., Chonko, L., & Hunt, S. (1986). Social
responsibility and personal success: Are they incompatible?
Journal of Business Research, 14, 193-212.
Wood, V.R., Chonko, L.B., & Hunt, S. (1993). Job
satisfaction. In W.O. Bearden, et al (Ed.), Handbook of
marketing scales: multi-item measures for marketing and
consumer behavior research (p. 275). Newbury Park, CA: Sage
Publications.
Woolridge, E. (1995). Time to stand Maslow's hierarchy
on its head? People Management, 1(25), 17.

Interpreter Job Satisfaction
174
Wright, R., King, S.W., & Berg, W.E. (1985). Job
satisfaction in the workplace: a study of black females in
management positions. Journal of Social Service Research,
8(3), 65-79.
Zino, R. (1998). Abraxis software [WWW document].
http://www.abraxis.com/rzino/emass.htm.

APPENDIX A
COVER LETTER
April 2, 1999
Dear Fellow Interpreter,
You have been randomly selected to participate in
important research related to interpreter job satisfaction.
Please understand from the very beginning that you are
under no obligation to participate in this research. This
research comprises the procedural section of my doctoral
dissertation, and the results are designed to benefit the
field of interpreting.
If you have received this email in error, or in
duplicate, please accept my apology. The design of this
research is random selection with the least intrusion
possible.
The purpose of this study is to describe how you, "The
Interpreter," feel about your work and to identify methods
for improving job satisfaction. You can find the
preliminary work on this dissertation research by going to
the following URL:

Interpreter Job Satisfaction
176
http://www.pieinc.com/dissertation/job_satisfaction_of_inte
rpreters.htm
Even though this study is completely voluntary, you
are encouraged to participate in this landmark research.
Results of this research should help the profession better
understand interpreters and develop a model for improved
recruitment and retention.
I want to thank the Association of Visual Language
Interpreters in Canada (AVLIC) for supporting this
research. Their foresight underscores the importance of
this research.
In order to participate in this research you should go
to the following web location, as all questionnaires are
completely web-based:
http://www.pieinc.com/survey/index.asp
There will be instructions at the web site guiding you
through the entire process. There will also be a form
enabling you to receive the results once they have been
published.

Interpreter Job Satisfaction
177
There are a couple of things to remember:
1. You have until Saturday, April 10, 1999 at 11:59 PM
Eastern Time to complete the survey. The website may be up
longer than this and you may still go to the site after
this date. However, there is no guarantee that your data
will be included in the study if you complete it after the
above date and time.
2. The Internet is still not a totally dependable
communication medium. There is always the possibility that
the website or any portion of the WWW backbone can "go
down." Should this happen, please come back to the site at
a later time to complete the survey.
3. Please read all information and directions in all
portions of the survey very carefully.
4. Allow sufficient time after submitting each
completed form for it to register - do not press the
"submit" buttons more than once - it will corrupt the
results.
5. You must complete the survey in one sitting. You
cannot save your results and then go back later to pick up
where you left off. Therefore, make sure you have ample

Interpreter Job Satisfaction
178
time (at least 30 minutes) to complete the survey once you
begin.
6. If you experience any problems with the forms that
you believe are the result of faulty design, please email
me immediately at [email protected]
7. Do not complete the survey more than once.
You are now ready to complete the survey. Please click
on the web URL http://www.pieinc.com/survey/index.asp to
complete the survey. If you are unable to click through,
simply enter the address above in the address window on
your web browser.
Thank you for your cooperation.
Sincerely,
Daniel B. Swartz, MA, CI/CT, Principal Investigator
Kelly MacKenzie, President, AVLIC

APPENDIX B
INSTRUMENTS
Part I: Demographic Characteristics
Questions in BOLD are required. All information is VERY
important.
Your sex:
______ (1) male
______ (2) female
Your age:
______ years
Are you (check only one group)
______ (1) Asian, Asian American
______ (2) Black, African American
______ (3) Latino, Hispanic, Mexican American
______ (4) Native American, American Indian
______ (5) White, Caucasian
______ (6) Other (please specify___________________)

Interpreter Job Satisfaction
180
Marital status:
______ (1) single
______ (2) married
______ (3) divorced
______ (4) widowed
______ (5) other (please specify ________________)
If married, for how long have you been married to your
current spouse?
______ years
Number of children:
_________ children
Please indicate the highest degree level you have attained:
______ (1) High school
______ (2) Associate’s
______ (3) Bachelor’s
______ (4) Master’s
______ (5) Doctorate
______ (6) Other

Interpreter Job Satisfaction
181
How many years of college have you completed?
______ years
Did you graduate from an interpreter training program?
______ (1) yes
______ (2) no
If you answered yes to the previous question, what level of
education was this?
______ (1) Certificate
______ (2) Associate’s
______ (3) Bachelor’s
______ (4) Master’s
______ (6) Other (specify ___________________________)

Interpreter Job Satisfaction
182
What level(s) of interpreter certification do you have?
______ (1) CI (RID)
______ (2) CT (RID)
______ (3) OIC (RID)
______ (4) SC:L (RID)
______ (5) CDI (RID)
______ (6) TOI (AVLIC)
______ (7) Other
______ (8) None
If you chose other, please specify
___________________________
What is your job title in your present job?
__________________ job title
How many years have you been in your present job?
______ years
How many years have you been interpreting?
______ years

Interpreter Job Satisfaction
183
How many of those years have been full-time (> 35 hours)?
______ years
What is your monthly take-home pay?
______ (__US Dollars or __Canadian Dollars)
Do you have an immediate supervisor?
______ (1) yes
______ (2) no
Which best describes your work as interpreter (check only
one)?
______ (1) Employed as staff interpreter
______ (2) Free-lance mostly for one agency
______ (3) Free-lance for many different agencies
______ (4) Other (specify ____________________________)
How much do you interpret?
______ (1) full-time (> 35 hours per week)
______ (2) part-time (< 35 hours per week)

Interpreter Job Satisfaction
184
Primarily, what type of interpreter/transliterator are you?
______ (1) sign language
______ (2) oral
______ (3) cued speech
______ (4) Other (specify ____________________________)

Interpreter Job Satisfaction
185
Part II: Overall Job Satisfaction (IJS)
This part contains 18 statements about job
satisfaction. Please circle the number (1 through 5) after
each statement that best describes how you feel about your
present job. There are no right or wrong answers. I would
like your honest opinion on each one of these statements.
1=Strongly Agree 2=Agree 3=Undecided 4=Disagree
5=Strongly Disagree
SA A U D SD
1 There are some conditions
concerning my job that could
be improved.
1 2 3 4 5
2 My job is like a hobby to me. 1 2 3 4 5
3 My job is usually interesting
enough to keep me from getting
bored.
1 2 3 4 5
4 It seems that my friends are
more interested in their jobs.
1 2 3 4 5
5 I consider my job rather
unpleasant.
1 2 3 4 5

Interpreter Job Satisfaction
186
6 I enjoy my work more than my
leisure time.
1 2 3 4 5
7 I am often bored with my job. 1 2 3 4 5
8 I feel fairly well satisfied
with my present job.
1 2 3 4 5
9 Most of the time I have to
force myself to go to work.
1 2 3 4 5
10 I am satisfied with my job for
the time being.
1 2 3 4 5
11 I feel that my job is no more
interesting than others I
could get.
1 2 3 4 5
12 I definitely dislike my work. 1 2 3 4 5
13 I feel that I am happier in my
work than most other people.
1 2 3 4 5
14 Most days I am enthusiastic
about my work.
1 2 3 4 5
15 Each day of work seems like it
will never end.
1 2 3 4 5
16 I like my job better than the
average worker does.
1 2 3 4 5

Interpreter Job Satisfaction
187
17 My job is pretty interesting. 1 2 3 4 5
18 I find real enjoyment in work. 1 2 3 4 5
19 I am disappointed that I ever
took this job.
1 2 3 4 5

Interpreter Job Satisfaction
188
Part III: Factors Associated with Job Satisfaction
This part contains statements about pay, promotion,
supervision, fringe benefits, contingent rewards, working
conditions, working with colleagues, nature of work,
communication, autonomy, workload, role conflict, and
burnout. Please circle the number after each statement
that best describes how you feel about your present job.
There are no right or wrong answers. I would like your
honest opinion on each one of these statements.
1=Disagree very much
2=Disagree moderately
3=Disagree slightly
4=Agree slightly
5=Agree moderately
6=Agree very much
Please circle the
one number for each
question that comes
closest to
reflecting your
opinion about it
using the choices to
the left.
1 I feel I am being paid a fair
amount for the work I do.
1 2 3 4 5 6

Interpreter Job Satisfaction
189
2 There is really too little
chance for promotion on my
job.
1 2 3 4 5 6
3 My supervisor is quite
competent in doing his/her
job.
1 2 3 4 5 6
4 I am not satisfied with the
benefits I receive.
1 2 3 4 5 6
5 When I do a good job, I
receive the recognition for it
that I should receive.
1 2 3 4 5 6
6 Many or our rules and
procedures make doing a job
difficult.
1 2 3 4 5 6
7 I like the people I work with. 1 2 3 4 5 6
8 I sometimes feel my job is
meaningless.
1 2 3 4 5 6
9 Communications seem good
within this organization.
1 2 3 4 5 6

Interpreter Job Satisfaction
190
10 Raises are too few and far
between.
1 2 3 4 5 6
11 Those who do well on the job
stand a fair chance of being
promoted.
1 2 3 4 5 6
12 My supervisor is unfair to me. 1 2 3 4 5 6
13 The benefits we receive are as
good as most other
organizations.
1 2 3 4 5 6
14 I do not feel the work I do is
appreciated.
1 2 3 4 5 6
15 My efforts to do a good job
are seldom blocked by red
tape.
1 2 3 4 5 6
16 I find I have to work harder
at my job because of the
incompetence of people I work
with.
1 2 3 4 5 6
17 I like doing the things I do
at work.
1 2 3 4 5 6

Interpreter Job Satisfaction
191
18 The goals of this organization
are not clear to me.
1 2 3 4 5 6
19 I feel unappreciated by the
organization when I think
about what they pay me.
1 2 3 4 5 6
20 People get ahead as fast here
as they do in other places.
1 2 3 4 5 6
21 My supervisor shows too little
interest in the feelings of
subordinates.
1 2 3 4 5 6
22 The benefit package we have is
equitable.
1 2 3 4 5 6
23 There are few rewards for
those who work here.
1 2 3 4 5 6
24 I have too much to do at work. 1 2 3 4 5 6
25 I enjoy my coworkers. 1 2 3 4 5 6
26 I often feel that I do not
know what is going on with the
organization.
1 2 3 4 5 6
27 I feel a sense of pride in
doing my job.
1 2 3 4 5 6

Interpreter Job Satisfaction
192
28 I feel satisfied with my
chances for salary increases.
1 2 3 4 5 6
29 There are benefits we do not
have which we should have.
1 2 3 4 5 6
30 I like my supervisor. 1 2 3 4 5 6
31 I have too much paperwork. 1 2 3 4 5 6
32 I don’t feel my efforts are
rewarded the way they should
be.
1 2 3 4 5 6
33 I am satisfied with my chances
for promotion.
1 2 3 4 5 6
34 There is too much bickering
and fighting at work.
1 2 3 4 5 6
35 My job is enjoyable. 1 2 3 4 5 6
36 Work assignments are not fully
explained.
1 2 3 4 5 6

Interpreter Job Satisfaction
193
1=Strongly Agree
2=Agree
3=Disagree
4=Strongly Disagree
Please circle the
one number for each
question that comes
closest to
reflecting your
opinion about it
using the choices to
the left.
37 I have the freedom to decide
what to do on my job.
1 2 3 4
38 It is basically my own
responsibility to decide how
my job gets done.
1 2 3 4
39 I have a lot of say about what
happens on my job.
1 2 3 4
40 I decide when I take breaks. 1 2 3 4
41 I determine the speed at which
I work.
1 2 3 4
42 I decide who I work with on my
job.
1 2 3 4

Interpreter Job Satisfaction
194
43 On my job, I can’t satisfy
everybody at the same time.
1 2 3 4
44 To satisfy some people on my
job, I have to upset others.
1 2 3 4
45 I have too much work to do
everything well.
1 2 3 4
46 I never seem to have enough
time to get everything done on
my job.
1 2 3 4

Interpreter Job Satisfaction
195
1=Rarely
2=Occasionally
3=Sometimes
4=Fairly Often
5=Very Often
Please circle the
one number for each
question that comes
closest to
reflecting your
opinion about it
using the choices
to the left.
47 How often does your job
require you to work very fast?
1 2 3 4 5
48 How often does your job
require you to work very hard?
1 2 3 4 5
49 How often does your job leave
you with little time to get
things done?
1 2 3 4 5
50 How often is there a great
deal to be done?
1 2 3 4 5

APPENDIX C
WEB PAGES
Figure 3. Web Site Welcome Page
Interpreter Job Satisfaction Research
Welcome to the Internet Site for completing the questionnaire concerning job
satisfaction of interpreters for the deaf.
You have been invited to participate in this research. You are under no
obligation to complete this research.
Before you start I want to give you a little of my background. My name is
Daniel B. Swartz, and I am a Ph.D. candidate at The Graduate School of American,
Minneapolis, Minnesota. I am an interpreter myself, and have been since 1988. I
have always been concerned about the physical and mental well-being of
interpreters. To that end this study has become the focus of my doctoral
dissertation.
The purpose of this study is to describe how you, “The Interpreter,” feel about
your work and to identify methods for improving job satisfaction.
Your participation in the study is completely voluntary, and you can withdraw
at any time. However, if you decide to participate in the study, please complete all
parts of the questionnaire and know that your responses will be completely
anonymous.

Interpreter Job Satisfaction
197
If you have any questions about the study or wish to be informed about the
results, please feel free to contact me at (301) 725-3402. You maybe also contact
my committee chair, Dr. Sybil McClary, at (303) 730-8050, or the Association of
Visual Language Interpreters of Canada (AVLIC), Kelly MacKenzie (416) 588-5073.
AVLIC has been kind enough to support this study.
Thank you very much for your time. This study is very important. Your
participation will allow a comparison that will benefit all interpreters in North
America.
Sincerely,
Daniel B. Swartz, MA, CI/CT
Principal Investigator
Kelly MacKenzie
President, AVLIC Continue to Next Page

Interpreter Job Satisfaction
198
Figure 4. Web Site Human Subject’s Issues Page
Human Subject's Issues
The main purpose of this study is to describe job satisfaction among
interpreters for the deaf. A second purpose is to examine and develop a model that
uses personal and job-related factors to predict job satisfaction among interpreters
for the deaf in general.
Your participation in this study is completely voluntary and your identity will
be anonymous. You will not be asked for your name, telephone number, or any
identifying information. Thus, the potential risk, if any, to you is minimal. By
proceeding to the questionnaire, you accept these minimal risks.
Continue to Next Page Continue to Next Page

Interpreter Job Satisfaction
199
Figure 5. Web Site Decline Page
Decline Page
Even though you have declined to participate in this research, you can still
obtain the results from this study once they are published. By completing the form
below you can receive these results.
If you have changed your mind, and wish to participate in this study, please
click this button.
Enter your e-mail address below to receive the final results from this study.
Accept and Proceed
Submit

Interpreter Job Satisfaction
200
Figure 6. Web Site Decline Exit Page
Thank you very much for providing your email address. The final
results of this research should be completed in mid-May. At that point
your will either be forwarded the research results via email file
attachment, or sent an email that contains the URL (website) where
you can proceed to view the results of this research
Thank you again,
Daniel B. Swartz
Primary Investigator
The Graduate School of America
Figure 7. Web Site Introduction to Demographics Page

Interpreter Job Satisfaction
201
Demographics
Welcome to this important research on interpreter satisfaction.
The only requirement you must meet in order to participate in this study is at
least part-time status as an interpreter for the deaf. If you are not an
interpreter please do not complete the following questionnaires.
Figure 8. Web Site Demographics Page
I am not an interpreter – take me out of here
I am an interpreter - Proceed

Interpreter Job Satisfaction
202
Demographic Characteristics
Questions in BOLD are required. All information is VERY important.
This survey should take approximately 25 - 50 minutes to complete.
Please be patient. This information in being written to a database and it may take a
minute to move to the next page. Please don't click the button more than once.
1. Your sex:
Select One
Male
Female
2. Your age (in years):

Interpreter Job Satisfaction
203
3. Select your ethnic group:
Select One
Asian, Asian American
Black, African American
Latino, Hispanic, Latin American
Native American, American Indian
White, Caucasian
Other
4. If other, please specify:
5. Marital Status:
Select One
Single
Married
Divorced
Widowed
Other (please specify)
6. If “other,” please specify:

Interpreter Job Satisfaction
204
7. If married, how long have you been married to your current
spouse (in years):
8. Number of children:
9. Highest level of education attained:
Select One
High School
Associates
Bachelors
Masters
Doctorate
Other

Interpreter Job Satisfaction
205
10. How many years of college have you completed?
Select One
<1
1
2
3
4
5
6
7
8
>8
11. Did you graduate from an Interpreter Training
Program?
Select One
Yes
No

Interpreter Job Satisfaction
206
12. If you answered yes to the previous questions, what level of
education is this?
Select One
Certificate
Associates
Bachelors
Masters
Other
13. What level(s) of interpreter certification do you have?
Select all that apply
CI (RID)
CT (RID)
OIC (RID)
SC:L (RID)
CDI (RID)
TOI (AVLIC)
None
Other (please specify)

Interpreter Job Satisfaction
207
14. If “Other,” please specify:
15. What is the job title of your present job?
16. How many years have you been at your current job?
17. How many years have you been interpreting?
18. How many of those years have been full-time (> 35
hours per week)?
19. What is your monthly take-home pay?

Interpreter Job Satisfaction
208
20. U.S. or Canadian Dollars?
Select One
US
Canadian
21. Do you have an immediate supervisor?
Select One
Yes
No
22. What best describes your work as an interpreter?
Select One
Employed as staff interpreter
Free-lance mostly for one agency
Free-lance for many different agencies
Other (please specify)
23. If “Other,” please specify:

Interpreter Job Satisfaction
209
24. How much do you interpret?
Select One
Full-time (> 35 hours/week)
Part-time (< 35 hours/week)
25. Primarily, what type of interpreter/transliterator are
you?
Select One
Sign Language
Cued Speech
Oral
Continue to Job Satisfaction Survey
Quit and exit survey

Interpreter Job Satisfaction
210
Figure 9. Web Site Job Satisfaction Survey Page
Job Satisfaction - (Part 1 of 4)
**** Note: Read the instructions for each page very carefully, as they
may be different for each page. ****
This part contains 18 statements about job satisfaction. Please make or enter a
selection after each statement that best describes how you feel about your
current job. There are no right or wrong answers. I would like your honest
opinion about each of these statements. Answers to all questions are
required.
This survey should take approximately 25 - 50 minutes to complete.
Please be patient. This information in being written to a database and it may
take a minute to move to the next page. Please don't click the button more
than once.
Please make a selection for each question that comes closest to reflecting your
opinion about it using the choices to the right. The choices for this page will be:
Strongly Agree, Agree, Undecided, Disagree and Strongly Disagree.
1 There are some conditions concerning my job that could be improved.
2 My job is like a hobby to me.

Interpreter Job Satisfaction
211
3 My job is usually interesting enough to keep me from getting bored.
4 It seems that my friends are more interested in their jobs.
5 I consider my job rather unpleasant.
6 I enjoy my work more than my leisure time.
7 I am often bored with my job.
8 I feel fairly well satisfied with my present job.
9 Most of the time I have to force myself to go to work.
10 I am satisfied with my job for the time being.
11 I feel that my job is no more interesting than others I could get.
12 I definitely dislike my work.
13 I feel that I am happier in my work than most other people.
14 Most days I am enthusiastic about my work.

Interpreter Job Satisfaction
212
15 Each day of work seems like it will never end.
16 I like my job better than the average worker does.
17 My job is pretty interesting.
18 I find real enjoyment in work.
19 I am disappointed that I ever took this job.

Interpreter Job Satisfaction
213
Figure 10. Web Site Job Satisfaction Survey (Spector, 1994)
Page
Job Satisfaction (Part 2 of 4)
**** Note: Read the instructions for each page very carefully, as they
may be different for each page. ****
This part contains statements about pay, promotion, supervision, fringe benefits,
contingent rewards, working conditions, working with colleagues, nature of work,
communication, autonomy, workload, role conflict, and burnout. Please make a
selection after each statement that best describes how you feel about your
present job. There are no right or wrong answers. I would like your honest
opinion on each one of these statements.
NOTE: Several of the statements below are geared to those who work as staff
interpreters, within an organization, and with a supervisor. If you are a free-
lance interpreter you may not be able to respond with certainty to some of these
statements. You are asked here to either: 1) select the item that best describes
your feelings when you are presented with these circumstances, though they be
limited; or 2) select "free-lance - Not-Applicable."
Please make a selection for each question that comes closest to reflecting your
opinion about it using the choices to the right. The choices for this page will be:
Disagree Very Much, Disagree Moderately, Disagree Slightly, Agree
Slightly, Agree Moderately, and Agree Very Much.

Interpreter Job Satisfaction
214
20 I feel I am being paid a fair amount for the work I do.
21 There is really too little chance for promotion on my job.
22 My supervisor is quite competent in doing his/her job.
23 I am not satisfied with the benefits I receive.
24 When I do a good job, I receive the recognition for it that I should receive.
25 Many or our rules and procedures make doing a job difficult.
26 I like the people I work with.
27 I sometimes feel my job is meaningless.
28 Communications seem good within this organization.
29 Raises are too few and far between.
30 Those who do well on the job stand a fair chance of being promoted.
31 My supervisor is unfair to me.

Interpreter Job Satisfaction
215
32 The benefits we receive are as good as most other organizations.
33 I do not feel the work I do is appreciated.
34 My efforts to do a good job are seldom blocked by red tape.
35 I find I have to work harder at my job because of the incompetence of people I
work with.
36 I like doing the things I do at work.
37 The goals of this organization are not clear to me.
38 I feel unappreciated by the organization when I think about what they pay me.
39 People get ahead as fast here as they do in other places.
40 My supervisor shows too little interest in the feelings of subordinates.
41 The benefit package we have is equitable.
42 There are few rewards for those who work here.
43 I have too much to do at work.

Interpreter Job Satisfaction
216
44 I enjoy my coworkers.
45 I often feel that I do not know what is going on with the organization.
46 I feel a sense of pride in doing my job.
47 I feel satisfied with my chances for salary increases.
48 There are benefits we do not have which we should have.
49 I like my supervisor.
50 I have too much paperwork.
51 I don’t feel my efforts are rewarded the way they should be.
52 I am satisfied with my chances for promotion.
53 There is too much bickering and fighting at work.
54 My job is enjoyable.
55 Work assignments are not fully explained.

Interpreter Job Satisfaction
217
Figure 11. Web Site Autonomy and Role Conflict Subscales
Survey Page
Job Satisfaction (Part 3 of 4)
**** Note: Read the instructions for each page very carefully, as they may
be different for each page. ****
Please make a selection for each question that comes closest to reflecting your
opinion about it using the choices to the right. The choices for this page will be:
Strongly Agree, Agree, Disagree, Strongly Disagree.
56 I have the freedom to decide what to do on my job.
57 It is basically my own responsibility to decide how my job gets done.
58 I have a lot of say about what happens on my job.
59 I decide when I take breaks.
60 I determine the speed at which I work.
61 I decide who I work with on my job.
62 On my job, I can’t satisfy everybody at the same time.

Interpreter Job Satisfaction
218
63 To satisfy some people on my job, I have to upset others.
64 I have too much work to do everything well.
65 I never seem to have enough time to get everything done on my job.

Interpreter Job Satisfaction
219
Figure 12. Web Site Workload Subscale Survey Page
Job Satisfaction (Part 4 of 5)
**** Note: Read the instructions for each page very carefully, as
they may be different for each page. ****
Please make a selection for each question that comes closest to reflecting
your opinion about it using the choices to the right. The choices for this page will
be:
Rarely, Occasionally, Sometimes, Fairly Often, and Very Often.
66 How often does your job require you to work very fast?
67 How often does your job require you to work very hard?
68 How often does your job leave you with little time to get things done?
69 How often is there a great deal to be done?

Interpreter Job Satisfaction
220
Figure 13. Web Site Completion/Exit Page
Exit Page
Thank you very much for participating in this study! You have done a great deal in
furthering knowledge in this important facet of the interpreting profession.
If you would like to receive the results of this dissertation, you can complete the
form below. Your email address will be “dumped” anonymously into a large data file
and NOT attached to your questionnaire answers.
Thank you again for your participation,
Daniel B. Swartz, MA, CSA, CI, CT
Primary Investigator
Enter your e-mail address below to receive the final results from this study.
Submit

Interpreter Job Satisfaction
221
Figure 14. Web Site Thank You Page
Thank you very much for providing your email address. The final
results of this research should be completed in mid-May. At that point
your will either be forwarded the research results via email file
attachment, or sent an email that contains the URL (website) where
you can proceed to view the results of this research
Thank you again,
Daniel B. Swartz
Primary Investigator
The Graduate School of America

APPENDIX D
PERCENTAGES OF RESPONDENTS
FOR EACH SUBSCALE
Table 17
Percentages of Respondents on the Index of Job Satisfaction
Subscale
Item Level
1 2 3 4 5
There are some conditions
concerning my job that
could be improved.
33.9 50.8 6.8 6.2 2.3
My job is like a hobby to
me.
7.9 20.3 7.3 29.9 34.5
My job is usually
interesting enough to keep
me from getting bored.
50.8 38.4 6.2 4.0 .6
It seems that my friends
are more interested in
their jobs.
1.1 5.1 15.3 55.9 22.6

Interpreter Job Satisfaction
223
Item Level
1 2 3 4 5
I consider my job rather
unpleasant.
.6 5.6 4.5 30.5 58.8
I enjoy my work more than
my leisure time.
2.8 20.9 22.0 45.8 8.5
I am often bored with my
job.
.6 7.9 6.2 46.9 38.4
I feel fairly well
satisfied with my present
job.
31.1 51.4 6.2 9.6 1.7
Most of the time I have to
force myself to go to
work.
1.1 6.2 2.8 50.8 39.0
I am satisfied with my job
for the time being.
28.2 55.4 4.0 10.7 1.7
I feel that my job is no
more interesting than
others I could get.
13.6 10.7 10.7 39.5 25.4

Interpreter Job Satisfaction
224
Item Level
1 2 3 4 5
I definitely dislike my
work.
0 1.7 3.4 20.9 74.0
I feel that I am happier
in my work than most other
people.
36.7 41.8 16.4 5.1 0
Most days I am
enthusiastic about my
work.
33.9 50.3 9.0 6.2 0.6
Each day of work seems
like it will never end.
1.1 2.8 9.0 62.7 24.3
I like my job better than
the average worker does.
31.1 48.0 16.9 3.4 0.6
My job is pretty
interesting.
56.5 37.3 2.3 2.8 1.1
I find real enjoyment in
work.
51.4 36.2 9.0 2.8 0.6

Interpreter Job Satisfaction
225
Item Level
1 2 3 4 5
I am disappointed that I
ever took this job.
1.1 2.3 5.1 17.5 74.0
Note. 1 = strongly agree, 2 = agree, 3 = undecided, 4 =
disagree, and 5 = strongly disagree

Interpreter Job Satisfaction
226
Table 18
Percentages of Respondents on the Pay Subscale
Item Level
1 2 3 4 5 6 N/A
I feel I am
being paid a
fair amount for
the work I do.
12.4 14.7 14.1 13.0 32.2 13.6 0
Raises are too
few and far
between.
6.2 5.6 10.7 15.3 16.9 27.1 18.1
I feel
unappreciated
by the
organization
when I think
about what they
pay me.
19.2 14.1 9.0 13.6 10.7 10.7 22.6

Interpreter Job Satisfaction
227
Item Level
1 2 3 4 5 6 N/A
I feel
satisfied with
my chances for
salary
increases.
18.6 15.3 14.7 14.7 11.9 7.3 17.5
Note. 1 = Disagree very much, 2 = Disagree moderately, 3 =
Disagree slightly, 4 = Agree slightly, 5 = Agree
moderately, 6 = Agree very much, and N/A – Not answered

Interpreter Job Satisfaction
228
Table 19
Percentages of Respondents on the Promotion Subscale
Item Level
1 2 3 4 5 6 N/A
There is
really too
little chance
for promotion
on my job.
4.0 10.7 10.2 15.3 18.6 23.7 17.5
Those who do
well on the
job stand a
fair chance of
being
promoted.
21.5 12.4 16.9 10.2 9.6 4.0 25.4
People get
ahead as fast
here as they
do in other
places.
15.3 15.3 14.1 12.4 10.7 4.0 28.2

Interpreter Job Satisfaction
229
Item Level
1 2 3 4 5 6 N/A
I am satisfied
with my
chances for
promotion.
22.0 11.9 19.2 7.3 9.6 4.5 25.4
Note. 1 = Disagree very much, 2 = Disagree moderately, 3 =
Disagree slightly, 4 = Agree slightly, 5 = Agree
moderately, 6 = Agree very much, and N/A – Not answered

Interpreter Job Satisfaction
230
Table 20
Percentages of Respondents on the Supervision Subscale
Item Level
1 2 3 4 5 6 N/A
My supervisor is
quite competent
in doing his/her
job.
9.0 6.8 5.1 7.3 21.5 24.9 25.4
My supervisor is
unfair to me.
43.5 10.2 8.5 5.1 4.0 2.3 26.6
My supervisor
shows too little
interest in the
feelings of
subordinates.
32.2 10.2 7.9 10.7 5.6 6.2 27.1
I like my
supervisor.
4.5 2.8 4.0 9.6 18.6 32.8 27.7
Note. 1 = Disagree very much, 2 = Disagree moderately, 3 =
Disagree slightly, 4 = Agree slightly, 5 = Agree
moderately, 6 = Agree very much, and N/A – Not answered

Interpreter Job Satisfaction
231
Table 21
Percentages of Respondents on the Working with Colleagues
Subscale
Item Level
1 2 3 4 5 6 N/A
I like the
people I work
with.
1.1 2.3 1.7 12.4 35.6 46.3 .6
I find I have to
work harder at
my job because
of the
incompetence of
people I work
with.
21.5 21.5 14.1 22.6 11.9 7.9 .6
I enjoy my
coworkers.
1.1 4.0 3.4 9.6 29.9 40.1 11.9

Interpreter Job Satisfaction
232
Item Level
1 2 3 4 5 6 N/A
There is too
much bickering
and fighting at
work.
27.1 17.5 15.8 18.6 12.4 6.8 1.7
Note. 1 = Disagree very much, 2 = Disagree moderately, 3 =
Disagree slightly, 4 = Agree slightly, 5 = Agree
moderately, 6 = Agree very much, and N/A – Not answered
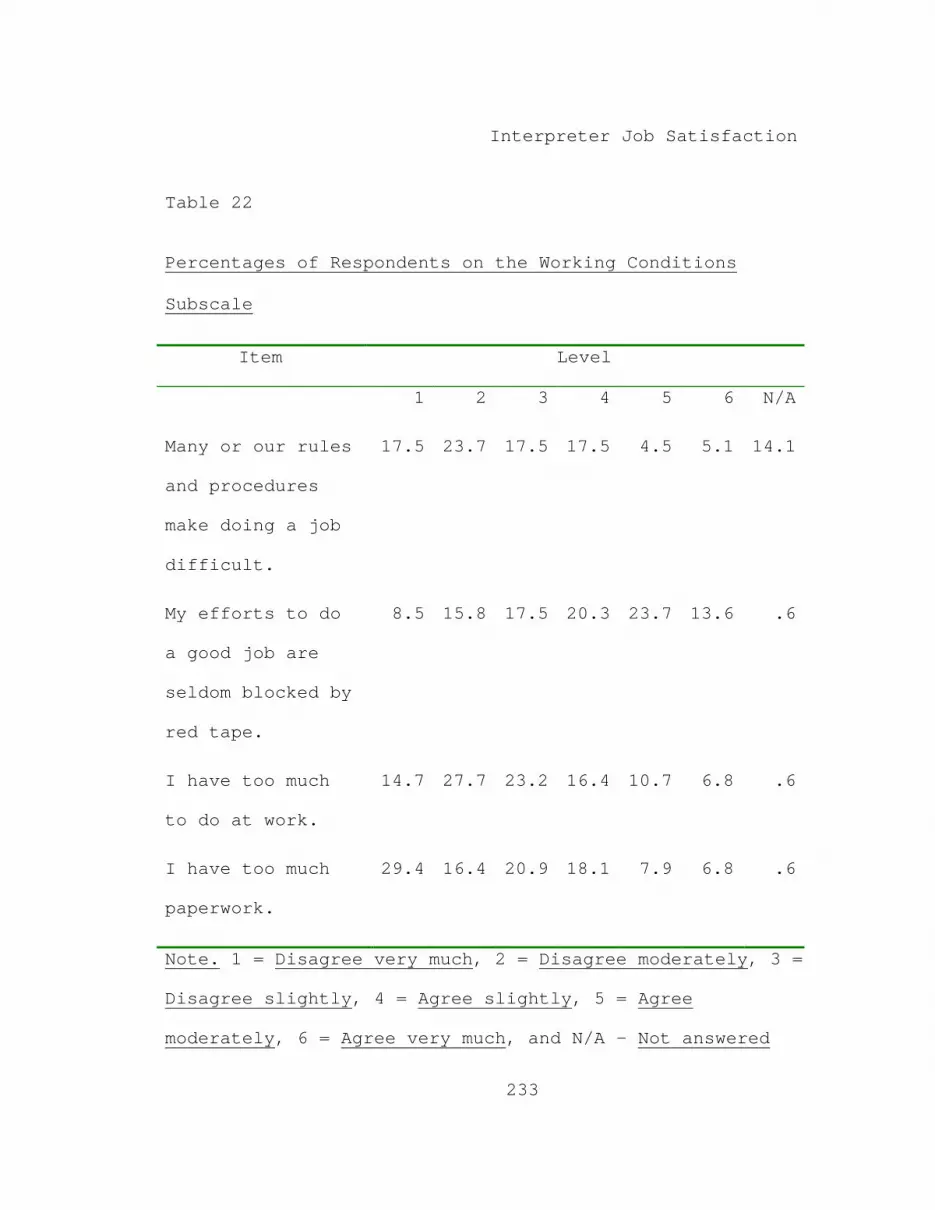
Interpreter Job Satisfaction
233
Table 22
Percentages of Respondents on the Working Conditions
Subscale
Item Level
1 2 3 4 5 6 N/A
Many or our rules
and procedures
make doing a job
difficult.
17.5 23.7 17.5 17.5 4.5 5.1 14.1
My efforts to do
a good job are
seldom blocked by
red tape.
8.5 15.8 17.5 20.3 23.7 13.6 .6
I have too much
to do at work.
14.7 27.7 23.2 16.4 10.7 6.8 .6
I have too much
paperwork.
29.4 16.4 20.9 18.1 7.9 6.8 .6
Note. 1 = Disagree very much, 2 = Disagree moderately, 3 =
Disagree slightly, 4 = Agree slightly, 5 = Agree
moderately, 6 = Agree very much, and N/A – Not answered

Interpreter Job Satisfaction
234
Table 23
Percentages of Respondents on the Autonomy Subscale
Item Level
1 2 3 4 N/A
I have the freedom to
decide what to do on my
job.
33.1 42.7 19.1 4.5 .6
It is basically my own
responsibility to decide
how my job gets done.
42.7 39.9 15.2 1.1 1.1
I have a lot of say about
what happens on my job.
34.3 34.3 27.5 3.4 .6
I decide when I take
breaks.
20.8 29.8 34.8 14.0 .6
I determine the speed at
which I work.
18.5 37.1 29.2 14.6 .6
I decide who I work with
on my job.
14.0 25.3 38.2 21.3 1.1
Note. 1 = Strongly Agree, 2 = Agree, 3 = Disagree, 4 =
Strongly Disagree, and N/A – Not answered

Interpreter Job Satisfaction
235
Table 24
Percentages of Respondents on the Workload Subscale
Item
1 2 3 4 5 N/A
How often does your
job require you to
work very fast?
9.6 26.4 30.3 26.4 6.7 .6
How often does your
job require you to
work very hard?
1.1 14.0 30.9 36.5 15.7 1.7
How often does your
job leave you with
little time to get
things done?
23.6 27.0 27.5 15.2 5.6 1.1
How often is there a
great deal to be done?
8.4 21.3 27.5 26.4 15.2 1.1
Note. 1 = Rarely, 2 = Occasionally, 3 = Sometimes, 4 =
Fairly Often, 5 = Very Often, and N/A – Not answered

Interpreter Job Satisfaction
236
Table 25
Percentages of Respondents on the Role Conflict Subscale
Item Level
1 2 3 4 N/A
On my job, I can’t satisfy
everybody at the same
time.
25.8 46.1 25.8 1.7 .6
To satisfy some people on
my job, I have to upset
others.
7.9 31.5 51.1 9.0 .6
I have too much work to do
everything well.
9.6 11.8 55.6 21.9 1.1
I never seem to have
enough time to get
everything done on my job.
9.6 18.5 52.8 18.0 1.1
Note. 1 = Strongly Agree, 2 = Agree, 3 = Disagree, 4 =
Strongly Disagree, and N/A – Not answered