review of shearography and active thermography for
TRANSCRIPT
Review of Shearography and Active Thermography for Nondestructive Evaluation Y.Y. Hung, Y.S. Chen, S.P. Ng, L. Liu, Y.H. Huang, B.L. Luk, R.W.L. Ip* Dept of Manufacturing Engineering & Engineering Management City University of Hong Kong, Kowloon, Hong Kong Email: [email protected]*Dr. Ip recently joined the Mechanical Engineering Department of Hong Kong University. Abstract Shearography and thermography are optical techniques, both proven to be valuable tools for material nondestructive evaluation. Papers on these topics, however, are scattered and mainly appeared in optical journals. For the convenience of the materials community, this paper aims to present a comprehensive review of shearography and active thermography and their applications in nondestructive evaluation of materials. Both techniques enjoy the merits of full-field, non-contact and allowing speedy detection of material defects in metal, non-metal as well as composites materials. However, they are fundamentally different in flaw detection mechanisms. Shearography measures materials’ mechanical response to stresses, whereas active thermography measures material’s heat-transfer response to an instantaneous thermal excitation. A comparison of the advantages and limitations of two techniques for nondestructive evaluation will also be presented. 1. Introduction With the continuous advancement in new material technologies, it has created a need for better nondestructive testing (NDT) techniques since the integrity of those new materials cannot be examined easily using traditional NDT methods. Common NDT techniques can be classified into seven major categories: visual (e.g., visual inspection using borescope [1]), penetrating radiation (e.g., X-ray [2], and Neutron imaging [3]), magnetic-electrical (e.g., Magnetic particle [4], and Eddy current [5]), mechanical vibration (e.g., Ultrasonic [6], Acoustic emission [7], and Tapping [6]), chemical/electrochemical (e.g. chemical spot testing), thermal (e.g., Infrared thermography [8]) and other optical methods (e.g., Moiré interferometry, Holography, and Shearography [9-12] ). Research efforts are being directed at developing and perfecting NDT techniques capable of monitoring (1) materials production processes [13], (2) material integrity following transport, storage and fabrication [14,15] and (3) the amount and rate of degradation during service [16]. In addition, efforts are underway to develop new NDT techniques capable of measuring the discontinuity of the flaws quantitatively [8,12], permitting determination of material response using fracture mechanics analysis, and replacing the qualitative materials characterization techniques used in the past by quantitative techniques [17]. Among the various new NDT techniques developed recently, shearography and thermography NDT techniques have attracted considerable interest in a wide variety of industries including medical diagnostic, electronic, rubber, aerospace, automotive, and
1/46
construction. Both techniques have been proven to be invaluable inspection tools for many applications; for instance, shearography technique has been endorsed by FAA as a compulsory testing and evaluation method for aircraft tires and thermography has been adopted as the preliminary diagnostic aid for cancer. In order to adapt and develop shearography and thermography NDT techniques for evaluating particular materials processing applications, especially for real-time and mass inspection, it is important to have the knowledge of the capabilities as well as limitations of those techniques. Both shearography and thermography have the merits of fast, full-field, non-contact, and reliable for detecting material defects in metal, non-metal as well as composites materials. However, they are fundamentally different in the flaw detection mechanisms. Shearography measures materials’ mechanical response to stresses, whereas active thermography measures materials’ heat transfer response to the thermal excitation. Several practical examples are used in this paper to illustrate and compare shearography and thermography as the in-process inspection tools; these examples include rubber tire inspection, adhesive bonding integrity inspection in composite structure, space frame structure inspection in automotive and flaws detection in aluminum alloy materials in aerospace, etc.
2/46
Shearography is an interferometric technique for surface deformation measurement (displacement and displacement derivatives). The elimination of reference beam in shearography has simplified the optical setup, and also reduced the requirement of laser coherence length and vibration isolation as compared with the holography technique. These distinct advantages have rendered shearography as a practical measurement tool. The technique reveals flaws by searching flaw-induced deformation anomalies after the object is stressed. Three versions of shearography recording methods are used: (1) photographic recording, (2) thermoplastic recording, and (3) digital recording. The photographic version [18] is a high cost, laborious and time consuming in wet photographic processes since it uses a portrait camera with high-resolution photographic emulsion as the recording media. Besides, it requires sequential recording of two speckle patterns on the same photographic plate, one before and another after the object is slightly deformed. In the thermoplastic version [19], it is same as photographic except that the photographic plate is replaced by a reusable thermoplastic plate. Digital shearography [20] uses video sensors (such as CCD) as the recording media for data acquisition and digital processing technology for image analysis. So, the digital version is more convenient to use and more suitable for real-time applications. In this paper, digital shearography will be emphasized. Thermography is a surface thermal radiation measurement technique to detect the variation of temperature pattern. It reveals the flaw by searching the anomalous hot-spots after the thermal excitation. Two types of thermography inspections are used: Passive and Active. Passive thermography measures the variation of surface radiation to search the anomalous region [8]. Active thermography is to address the limitation of uncontrollable thermal source excitation in passive thermography. It has the advantages in reducing environmental influences such as ambient condition and emissivity variations. In this paper, active thermography is highlighted. For applying shearography and active thermography NDT techniques to new applications or new materials, it is essential to develop a suitable method to provide sufficient excitation to reveal the flaws. In this paper, the basic principles of shearography and active thermography are reviewed, and various loading methods for generating excitations in practical applications are discussed. Several shearographic flaws detection applications for various materials are illustrated with three different loading methods including partial vacuum and pressurization, acoustic wave excitation, and thermal shock excitation. Similarly, in the active thermography technique, two thermal excitations methods, which are direct thermal radiation heating and electromagnetic induction heating, are described for detecting defects in metal or non-metal objects. Furthermore, a comparison between the two techniques for nondestructive testing on the same sample is presented in order to manifest their unique advantages and limitations, e.g. delaminations or skin-to-core disbonds in composite structures, and subsurface flaws in metal structures.
3/46
2. Review of Digital Shearography 2.1. Introduction Shearography, known as speckle pattern shearing interferometry (SPSI), is an interferometric measurement technique using coherent laser illumination. It is developed to address limitations of holography by (1) replacing the reference light beam by common optical path approach, thus leading to simple optical setup, reduced coherence-length requirement of the laser, and lax vibration isolation; (2) direct measurement of surface strains (first derivatives of surface displacements.) These distinct advantages have rendered shearography as a practical measurement tool and it has already gained wide industrial acceptance for nondestructive testing. In particular, shearography was routinely employed for inspecting delaminations and other imperfections in aircraft tires, and the technique was endorsed by the US-Federal Aviation Administration (FAA) [16]. Other applications of shearography include: measurement of strains, residual stresses, 3-D shapes, and vibrations, as well as leakage detection. 2.2. Principal of digital shearography Digital shearography [20] employs solid-state sensors (such as CCD) as the recording media for data acquisition and digital processing technology for image analysis. It addressed the limitation of conventional shearography techniques using photographic [18] and thermoplastic [19] recording methods which involve laborious photographic process and also rely on Fourier filtering for fringe pattern reconstruction. Thus, digital version of shearography enables real-time measurements and inspection. The cutting edge of digital shearography is based on direct and automated measurement of phase-change (and hence, strains) without having to rely on fringe pattern reconstruction. Fig. 2.2.1 Schematic diagram of digital shearography As illustrated in Fig. 2.2.1, digital shearography requires the use of a laser point source for illuminating the test object and an image-shearing video camera connected to a microcomputer for recording and processing. When illuminated by expanded laser light, scattered wave fronts from optically rough surface are sheared and interfered on the solid-state CCD matrix sensor forming objective speckles [22] (specklegram) as shown in Fig. 2.2.2 Fig 2.2.2 Objective laser speckle (specklegram) obtained by the CCD camera Michelson shearing interferometer [23, 24] and double-refractive prism are two commonly employed optical shearing devices. The authors have preference for a double-refractive Wollaston prism, as it is more light efficient, has wider field of view, and produces higher quality fringes. Recently, a unified approach using similar shearing prism to practice both shearographic and holographic measurement is reported [25]. In Fig. 2.2.1, it illustrates the states of the test object before applying stress. The simplified mathematical equation of the intensity on the specklegram detected on every pixel of the CCD matrix is:
4/46
cos( )I A B φ= + (1) where φ represents the random phase difference between scattered wavelet from two points and ( , )P x y ( ,P x x y)δ+ on the object surface; A is the background brightness; is the modulation term of interference.
B
When the object is deformed slightly by an applied stress, both A and could be regarded as constants. Also, a relative change of surface displacement on
B( , )P x y and
( , )P x x yδ+ will produce a relative change of optical phase difference , while the rest of Eq. (1) remains unchanged. Therefore, image intensity function after applying stress can be written as:
Δ
' cos(I A B )φ= + + Δ (2) By mutual subtraction of the two digitized images using Eq. (3) in a computer and
displaying the absolute value onto the monitor, visible fringes sin2Δ⎛ ⎞
⎜ ⎟⎝ ⎠
embedded with
random speckle sin2
φ Δ⎛ +⎜⎝ ⎠
⎞⎟ will be displayed, with dark fringes corresponding to the
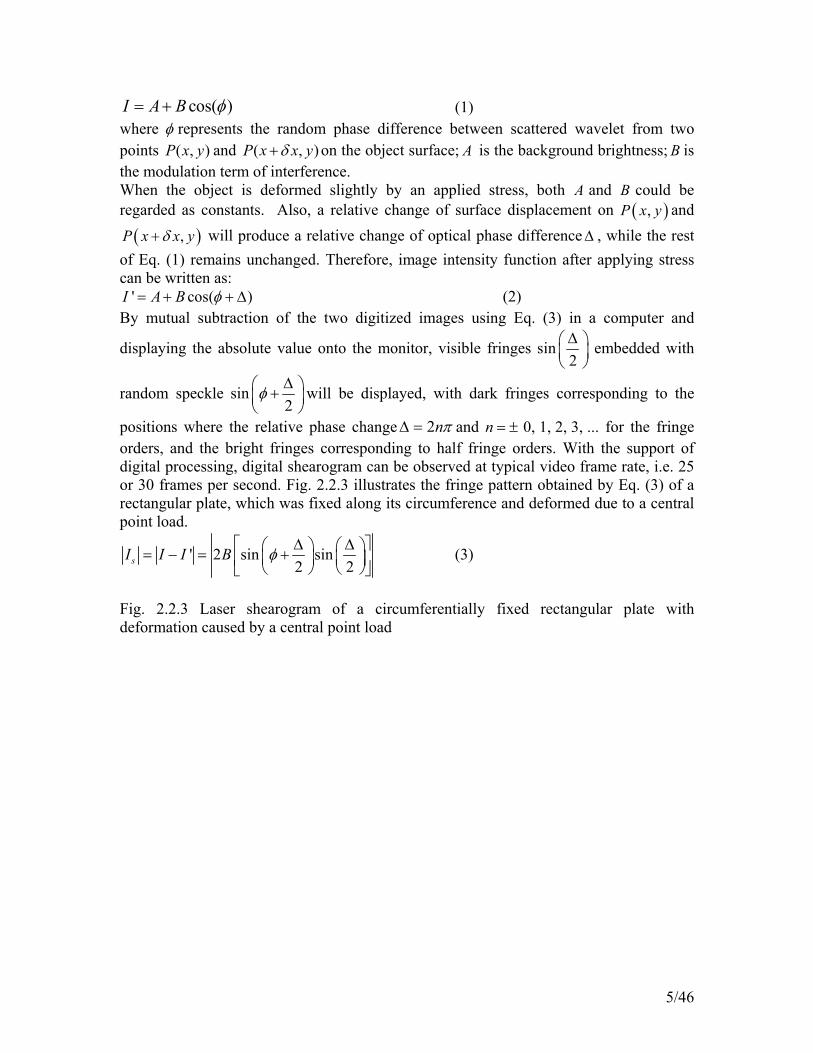
positions where the relative phase change 2nπΔ = and 0, 1, 2, 3, ...n = ± for the fringe orders, and the bright fringes corresponding to half fringe orders. With the support of digital processing, digital shearogram can be observed at typical video frame rate, i.e. 25 or 30 frames per second. Fig. 2.2.3 illustrates the fringe pattern obtained by Eq. (3) of a rectangular plate, which was fixed along its circumference and deformed due to a central point load.
' 2 sin sin2 2sI I I B φ⎡ Δ Δ⎛ ⎞ ⎛= − = +⎜ ⎟ ⎜⎢ ⎝ ⎠ ⎝⎣ ⎦
⎤⎞⎟⎥⎠
(3)
Fig. 2.2.3 Laser shearogram of a circumferentially fixed rectangular plate with deformation caused by a central point load
5/46
2.3. Fringe interpretation In addition to the optical setup and interference theory of shearography, the relationship between the relative phase change Δ and the surface deformation of the object is evaluated. This section depicted the fringe pattern interpretation of shearography in measuring deformation derivatives. While the image is optically sheared in x-direction, the change of phase Δ in Eq. (2) is induced by the change in relative optical path length of light scattered from two neighboring surface points ( ), ,P x y z and ( ), ,P x x y zδ+ to the CCD sensor in Cartesian coordinate. It is possible to show that Δ is related to the relative displacement ( ), , u v wδ δ δ of the two neighboring points as:
(2 )A u B v C wπ δ δ δλ
Δ = + + (4)
where and ( ), , u v w ( , , u u v v w w)δ δ δ+ + + are the displacement vector of and
( , , )P x y z( , ,P x x y z)δ+ respectively, λ is the wavelength of laser, and A , , are
sensitivity factors which are determined by the positions of the illumination point B C
( ), , s s sS x y z and the camera ( ), , o o oO x y z as following:
( ) ( )
( ) ( )
( ) ( )
o s
o s
o
o s
o s
o s
s
x x x xA
R Ry y y y
BR Rz z z z
CR R
− −= +
− −= +
− −= +
(5)
with 2 2 2o o o
2oR x y z= + + and 2 2 2 2
s s s sR x y z= + + . It is also noted that ( , )z z x y= describes the object surface and is not an independent variable when surface points are considered. Assuming the small image-shearing direction is parallel to the x direction as xδ , Eq. (4) may be revised as:
2 u v wA B Cx x x
π δ δ δ xδλ δ δ δ⎛Δ = + +⎜⎝ ⎠
⎞⎟ (6)
The relative displacement term in Eq. (6) may be subsequently treated as the partial derivative of u , , and w with respect to the direction of image-shearing v x . Thus, Eq. (6) may be rewritten as:
2 u v wA B Cx x x
π xδλ
∂ ∂ ∂⎛Δ = + +⎜ ∂ ∂ ∂⎝ ⎠⎞⎟ (7)
Alternating the image shearing direction by rotating the image-shearing device about its optical axis will result fringe pattern depicting displacement–derivatives with respect to the current shearing direction. Therefore, if it is sheared in the y direction by amount of yδ , Eq. (7) is revised as following:
2 u v wA B Cy y y
π yδλ⎛ ∂ ∂ ∂
Δ = + +⎜ ∂ ∂ ∂⎝ ⎠
⎞⎟ (8)
6/46
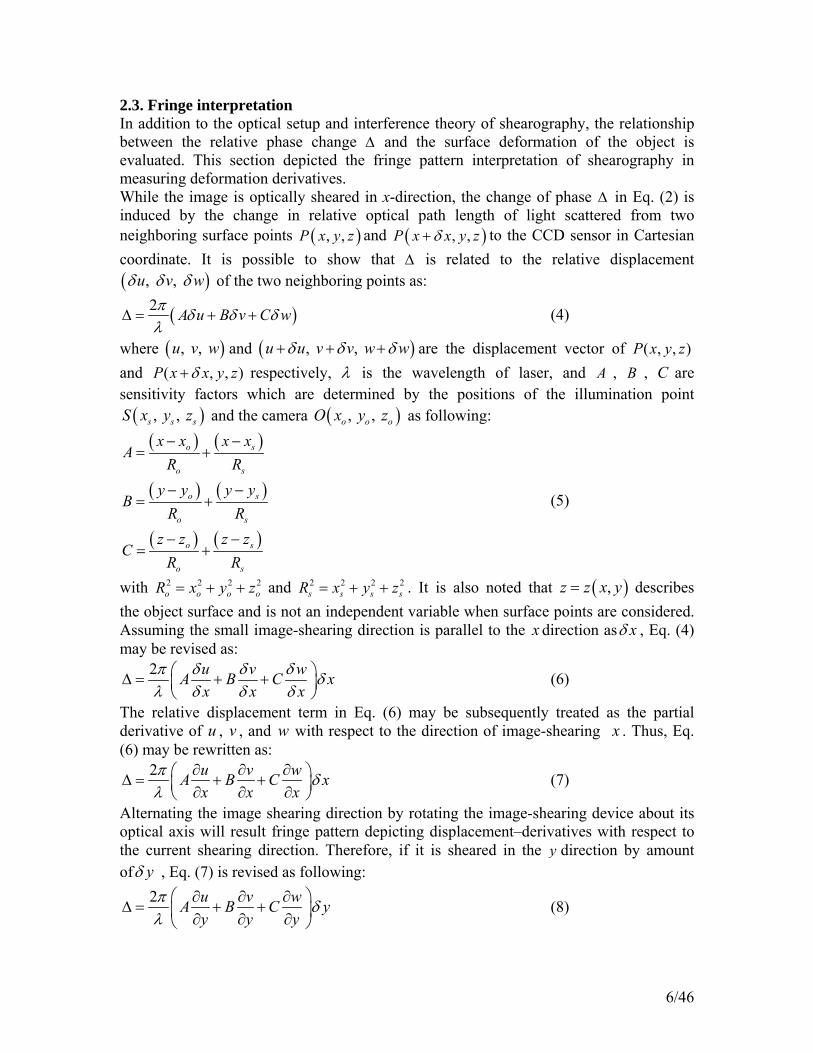
The fringe pattern shown in Fig. 2.3 (a) and (b) indicated a laterally deflected plate representing w x∂ ∂ and w y∂ ∂ respectively.
Fig. 2.3 The fringe pattern obtained by Eq. (7) and Eq. (8) of a laterally deflected plate fixed along its boundaries and subjected to uniform pressure: (a) w x∂ ∂ and (b) w y∂ ∂
Eq. (7) contains three displacement-derivatives, u x∂ ∂ , v x∂ ∂ and w x∂ ∂ so that three measurements with different sensitivity factors A , , are required to separate these displacement derivatives. However, if the geometrical dimensions of the observed area are small compared to the distance of illumination and recording, the sensitivity factors may be approximated as following:
B C
( )
sinsin1 cos
ABC
αβ
γ
==
= +
(9)
where α and β are the angles of illumination with respective to the yz-plane and the xz-plane in Cartesian coordinate, and γ is the angle between the illumination beam and the z-axis, which is regarded as the image recording direction. By arranging the optical layout in such a way that the direction of expanded laser source is perpendicular to the object surface, sensitivity factors A and will attain a zero-value and Eq. (7) becomes:
B
2 C w xx
π δλ
∂⎛ ⎞Δ = ⎜ ⎟∂⎝ ⎠ (10)
Therefore, this optical arrangement only measures the out-of-plane derivative w x∂ ∂ . The deformation fringes shown in Fig. 2.2.3 and 2.3(a) are obtained with such an optical setup. In addition to single-beam illumination above, shearography with dual-beam illumination were also developed for in-plane strain measurement [21]. However, for the purpose of nondestructive testing, it is generally sufficient to measure only the out-of-plane deformation. So, the single-beam illumination setup is usually employed for its operational simplicity and cost effectiveness. 2.4. Phase-shift technique The first generation of photographic shearography inspection relies on human interpretation of fringe patterns as an indication of deformation anomaly, so it is not possible to quantitatively measure the deformation derivative. As a result of this, it cannot determine the dimensions of the flaw. With the introduction of phase-shift technique, automated fringe-phase interpretation becomes feasible and the deformation derivative can be represented by phase maps. This is regarded as a significant contribution to digital shearography. Eq. (1) and (2) contain four unknowns A , , B φ , and Δ , while I is the digitized pixel intensity recorded by the camera. The idea of phase-shift is to superimpose known phases using whatever means to generate a system of equations to solve for the unknownsΔ . There are many effective phase-shifting methods [21], among those the authors prefer the use of variable wave retarder as shown in Fig. 2.4.1.
7/46
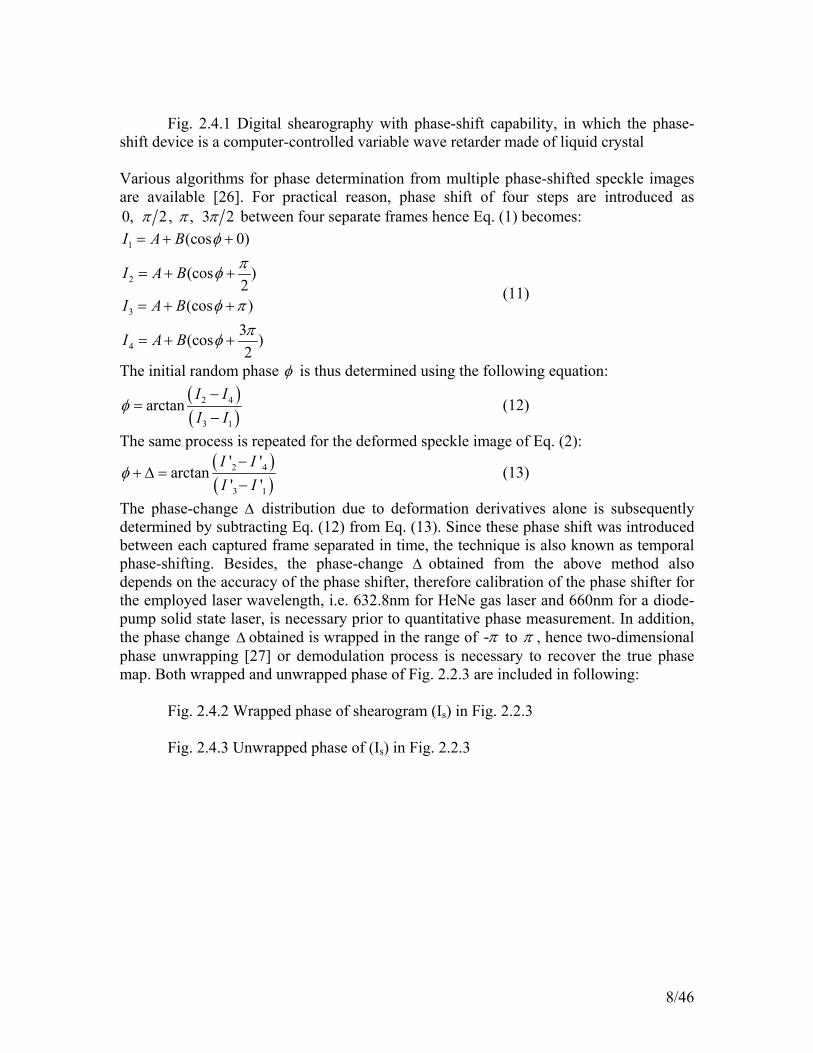
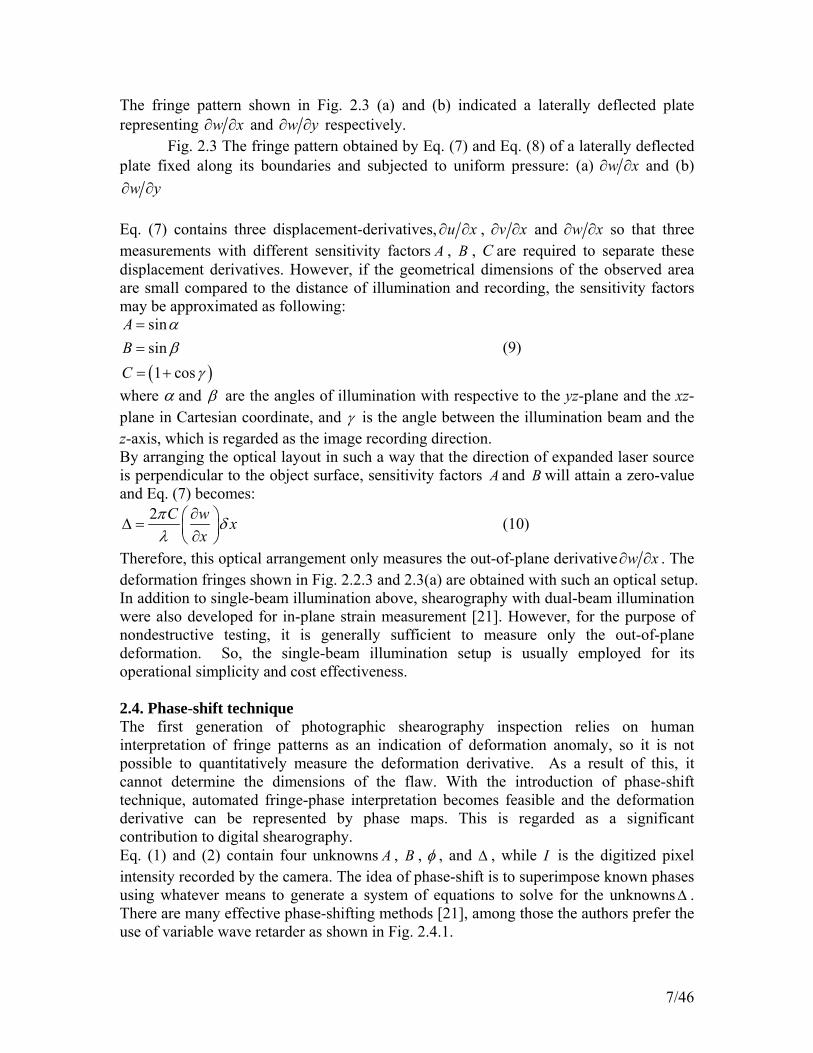
Fig. 2.4.1 Digital shearography with phase-shift capability, in which the phase-
shift device is a computer-controlled variable wave retarder made of liquid crystal Various algorithms for phase determination from multiple phase-shifted speckle images are available [26]. For practical reason, phase shift of four steps are introduced as 0, 2, , 3 2π π π between four separate frames hence Eq. (1) becomes:
1
2
3
4
(cos 0)
(cos )2
(cos )3(cos )2
I A B
I A B
I A B
I A B
φπφ
φ ππφ
= + +
= + +
= + +
= + +
(11)
The initial random phase φ is thus determined using the following equation: ( )( )
2 4
3 1
arctanI II I
φ−
=−
(12)
The same process is repeated for the deformed speckle image of Eq. (2): ( )( )
2 4
3 1
' 'arctan
' 'I II I
φ−
+ Δ =−
(13)
The phase-change Δ distribution due to deformation derivatives alone is subsequently determined by subtracting Eq. (12) from Eq. (13). Since these phase shift was introduced between each captured frame separated in time, the technique is also known as temporal phase-shifting. Besides, the phase-change Δ obtained from the above method also depends on the accuracy of the phase shifter, therefore calibration of the phase shifter for the employed laser wavelength, i.e. 632.8nm for HeNe gas laser and 660nm for a diode-pump solid state laser, is necessary prior to quantitative phase measurement. In addition, the phase change Δ obtained is wrapped in the range of -π to π , hence two-dimensional phase unwrapping [27] or demodulation process is necessary to recover the true phase map. Both wrapped and unwrapped phase of Fig. 2.2.3 are included in following: Fig. 2.4.2 Wrapped phase of shearogram (Is) in Fig. 2.2.3 Fig. 2.4.3 Unwrapped phase of (Is) in Fig. 2.2.3
8/46
2.5. Nondestructive Testing with Shearography For nondestructive testing, shearography reveals a material defect by detecting the defect-induced deformation anomaly. Since the underlying principle of this technique is based upon the response of a defect to the applied stress, it is necessary to apply suitable stress to deform the test object during inspection. The development of shearographic NDT technology has therefore become the research of a practical means of stressing the object that would readily reveal flaws. Ideally, the stress mode should be similar to the service stresses, so flaws that are critical and detrimental to the service life of the object would be revealed, and cosmetic flaws that do not undermine the structural integrity of the test object can be ignored. This would minimize false rejection during inspection. In this regard, shearography has an advantage over ultrasonic testing, as the latter detects flaws by identifying inhomogeneities in the object and does not provide direct information on the criticality of the flaws [21]. Moreover, advanced composites are usually heterogeneous by formation, so flaw detection by inhomogeneity could become a handicap to conventional ultrasonic practice, yet material composition has little effect to shearography inspection. Therefore, shearography excels ultrasonic methods from a number of perspectives. For large structures, such as a bridge or a pressure vessel, the application of shearography is very difficult, as it is not practical to stress the entire structure. Furthermore, shearography has very limited tolerance to rigid body movement which is likely to occur in large structures during stressing; excessive rigid-body movement could cause speckles de-correlation, resulting in degradation of fringe quality. Some of the methods that do not cause any intolerable rigid-body movement on the test object include the use of pressurization, partial vacuum, acoustic, and thermal-shock excitations. 2.5.1. Partial vacuum and pressurization For partial vacuum stressing, the specimen is placed in an airtight chamber and a vacuum pump exercises a negative pressure difference between the inspected surface and the enclosed space. Since the specimen is uniformly stretched by negative pressure difference, faults such as debonds, air bubble, as well as non-adhesive regions will bulge and manifest themselves as fringe anomaly by shearography inspection. Similar to vacuum stressing, pressurization requires the specimen to be self-enclosed for an air pump to produce a positive pressure in the enclosed space. Since these two loadings are static, vacuum and pressurization can also be regarded as static stressing methods. A simplified setup of partial vacuum stressing is shown in Fig. 2.5.1. Fig. 2.5.1 Schematic of partial vacuum stressing 2.5.2. Acoustic wave excitation To address some limitations of vacuum loading, dynamic stressing technique using acoustic wave was developed for inspecting open-boundary debonds [28-30]. The source of excitation is a powerful horn speaker, which was driven by an amplifier with frequency signals generated from a microcomputer. A multi-frequency sweep technique with a synthesized intensity map was employed for flaw identification. This technique was published as one of the authors’ early effort to alleviate difficulties that were encountered with the use of single excitation frequency [28, 29]. In addition, a modulated phase-shift technique with refreshed reference frame was also introduced to minimize
9/46

environmental disturbance and to enhance robustness of shearography as an NDT tool in real life environments. To explain the dynamic stressing technique and the phase modulation method, it is necessary to refer to the mathematical equation of speckle wave front in Eq. (1). It represents the stationary state of the object and the captured speckle image, and can be treated as the reference frame.
cosrI A B φ= + (14) When the object is excited due to acoustic stressing, speckle intensity becomes:
( ) cos[ ( )]I t A B tφ= + + Δ (15) where represents the relative phase change that is due to the change of optical path length caused by the vibration. However, the excitation frequency is usually ranged from several hundred-hertz to kilohertz, which is much higher than the video frame rate of the CCD camera. Therefore, the image recorded in the current frame is a time-averaged specklegram.
( )tΔ
[ ]{0 0
1 1( ) cos ( )T T
avg }I I t dt A B t dtT T
φ= = + + Δ∫ ∫ (16)
For sinusoidal vibration and normal illumination with one laser, the relative phase change ( , , )x y tΔ is related only to the out-of-plane displacement gradients,
4( ) sinwt xx
π tδ ωλ
⎡ ∂ ⎤⎛ ⎞Δ = ⎜ ⎟⎢ ⎥∂⎝ ⎠⎣ ⎦ (17)
where xδ is the shearing amount in the x -direction, λ is the wavelength of the laser, ω is the angular frequency of vibration and w x∂ ∂ is the out-of-plane displacement derivative in the x -direction. Combining Eq. (16) and Eq. (17), the average intensity recorded by the CCD is:
( )
0
0
0
1 4cos sin
4 cos
cos
T
avgwI A B x t dt
T x
wA B J xx
A B J
πφ δ ωλ
πφ δλ
φ
⎧ ⎫⎡ ∂⎛ ⎞= + +⎨ ⎬⎜ ⎟⎢ ⎥∂⎝ ⎠⎣ ⎦⎩ ⎭⎡ ∂ ⎤⎛ ⎞= + ⎜ ⎟⎢ ⎥∂⎝ ⎠⎣ ⎦
= + Ω
∫⎤
(18)
where is the zero-order Bessel function of the first kind and is equal to ( )0J Ω Ω
4 wxx
πδλ
∂⎛⎜ ∂⎝ ⎠
⎞⎟ . By conventional subtraction technique with a fixed reference frame, the
result of real-time subtraction between Eq. (14) and (18) is: 0cos [1 ( )]r avgI I I B Jφ= − = − Ωs (19)
On the other hand, if an object is vibrating in steady state and phase-shift of 180° (i.e.π ) is introduced in a new frame, Eq. (18) for the frame becomes: thn
, 0 0cos( ) ( ) cos( ) ( )n avgI A B J A B Jφ π= + + Ω = − Ωφ (20)
For the frame without phase-shift, it will be the same as Eq. (18), and the mutual subtraction of these two sequential frames will yield:
( 1)thn −
10/46
1, ,
0
0
cos ( ) cos ( )2 cos ( )
n avg n avgI I
A B J A B JB J
φφ
− −
= + Ω − + Ω= Ω
0φ
Ω
)
)
(21)
By taking the square of Eq. (21) and displaying the results onto the monitor, 2 2 2
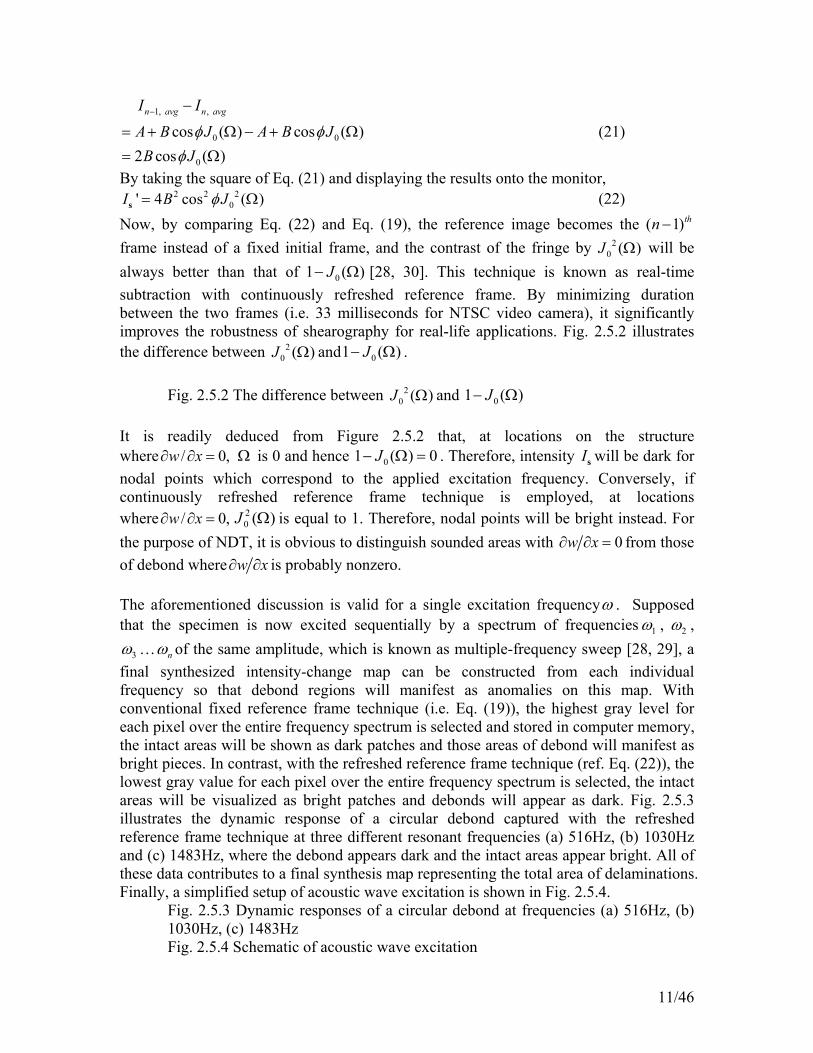
0' 4 cos ( )I B Jφ=s (22) Now, by comparing Eq. (22) and Eq. (19), the reference image becomes the ( frame instead of a fixed initial frame, and the contrast of the fringe by will be always better than that of [28, 30]. This technique is known as real-time subtraction with continuously refreshed reference frame. By minimizing duration between the two frames (i.e. 33 milliseconds for NTSC video camera), it significantly improves the robustness of shearography for real-life applications. Fig. 2.5.2 illustrates the difference between and
1)thn −2
0 ( )J Ω
01 (J− Ω
20 ( )J Ω 01 (J− Ω .
Fig. 2.5.2 The difference between 2
0 ( )J Ω and 01 (J )− Ω It is readily deduced from Figure 2.5.2 that, at locations on the structure where Ω is 0 and hence ,0/ =∂∂ xw 01 ( )J 0− Ω = . Therefore, intensity Is will be dark for nodal points which correspond to the applied excitation frequency. Conversely, if continuously refreshed reference frame technique is employed, at locations where is equal to 1. Therefore, nodal points will be bright instead. For the purpose of NDT, it is obvious to distinguish sounded areas with
,0/ =∂∂ xw )(20J Ω
0w x∂ ∂ = from those of debond where w x∂ ∂ is probably nonzero. The aforementioned discussion is valid for a single excitation frequencyω . Supposed that the specimen is now excited sequentially by a spectrum of frequencies 1ω , 2ω ,
3ω … nω of the same amplitude, which is known as multiple-frequency sweep [28, 29], a final synthesized intensity-change map can be constructed from each individual frequency so that debond regions will manifest as anomalies on this map. With conventional fixed reference frame technique (i.e. Eq. (19)), the highest gray level for each pixel over the entire frequency spectrum is selected and stored in computer memory, the intact areas will be shown as dark patches and those areas of debond will manifest as bright pieces. In contrast, with the refreshed reference frame technique (ref. Eq. (22)), the lowest gray value for each pixel over the entire frequency spectrum is selected, the intact areas will be visualized as bright patches and debonds will appear as dark. Fig. 2.5.3 illustrates the dynamic response of a circular debond captured with the refreshed reference frame technique at three different resonant frequencies (a) 516Hz, (b) 1030Hz and (c) 1483Hz, where the debond appears dark and the intact areas appear bright. All of these data contributes to a final synthesis map representing the total area of delaminations. Finally, a simplified setup of acoustic wave excitation is shown in Fig. 2.5.4.
Fig. 2.5.3 Dynamic responses of a circular debond at frequencies (a) 516Hz, (b) 1030Hz, (c) 1483Hz
Fig. 2.5.4 Schematic of acoustic wave excitation
11/46
2.5.3. Thermal shock excitation In addition to vacuum and acoustic stressing, thermal excitations by means of hot air jet, heat lamp, and high power argon laser [31,32] were also developed for debond inspection and deformation monitoring with shearography. A novel thermal shock stressing technique has recently been developed by the author’s research group by employing high power Xenon flash lamps. The new method provides significant advantages which include: (1) Localized stressing to large structures without introducing excessive rigid-body movement to the entire structure; (2) Much simpler testing preparation than vacuum and vibration stressing; (3) Speedy inspection for evaluation of metal and other materials with high thermal diffusivity; (4) Larger examination area than argon laser spot heating and (5) Much less air fluctuation than hot air jet. It is also discovered that subsurface discontinuity such as crack, corrosion thinning and delaminations can be instantaneously identified by the new thermal shock stressing method. So, debond inspection and crack identification could be unified using one stressing mechanism. A simplified schematic diagram is shown on Fig. 2.5.5, Fig. 2.5.5 Schematic of thermal shock stressing The principle of the technique is straightforward. Before applying thermal shock stressing, a reference specklegram is captured at rest, then a pair of Xenon flashes deliver an instantaneous 9.6 kilojoules energy of heat pulse for a few milliseconds onto the specimen and a series of specklegrams are captured and post-processed with Eq. (3). The results are then displayed onto the computer monitor. It is assumed that light energy is uniformly distributed onto the inspected surface and partially converted into heat. Therefore a thermal gradient is immediately developed between the exposed surface and the relatively cool interior of the specimen. According to the classical thin-plate model of thermal stresses [28], a thermally induced bending moment is created by the thermal gradient.
2 2 2 1(
1 ) TMv D
ω∇ ∇ = − ∇−
(23)
Eq. (23) represents the governing equation for out-of-plane thermal deflection ω of a uniform rectangular plate with fixed edges. D and stand for the bending rigidity of the plate and Poisson ratio respectively, and
vTM is the thermally induced bending moment
due to temperature gradientτ in the thickness direction. With presence of subsurface flaws i.e. debonds and cracks, it is believed that the reduced local bending rigidity in vicinity of the flaw could lead to localized out-of-plane deformation anomaly which manifest itself as fringe condensation and is utilized as flaw indicators. Therefore, the shearography system, which is configured for highly sensitive out-of-plane deformation measurement, could identify the subsurface flaws almost instantly.
12/46
3. Review of Active thermography 3.1. Introduction Infrared thermography is a contact-less optical imaging technique for detecting the invisible infrared radiation. It can be used to assess and predict the structure or behavior beneath the surface by measuring the distribution of infrared radiation, which can be converted to temperature scale. Thermography technique is generally divided into two main streams: Passive and Active thermography. In passive thermography, abnormal temperature profiles indicate suspicious problem. The technique is mainly used for qualitative inspection to pinpoint the anomalies. For reducing the sensitivity to variations in ambient condition and obtaining more accurate measurement, active thermography is developed to provide more accurate information by considering the amount of thermal radiation and heat transfer. The common thermal stimulation techniques in active thermography are [34]: transient pulse, step heating (long pulse), periodic heating (lock-in), and thermal mechanical vibration. Active thermography has been successfully employed for flaws inspection in many industrial applications, such as, aircraft and automotive components inspection, adhesive bonding and spot welding investigation, pressure vessel and pipeline inspection, etc. In this review paper, two types of active thermography loading methods are chosen for further discussion in the following sections: (1) traditional thermal irradiation heating, and (2) Electromagnetic Induction heating. Those principles and their inspection mechanisms are depicted in more details in the following sections. 3.2. Thermal irradiation heating The traditional thermal radiation heating method is the earliest and the simplest direct technique in active thermography. It uses a lighting source or irradiative heat source to heat up the surface of the test object. Flaws or suspicious response can be captured, according to the low heat transfer, by an infrared (IR) camera inspecting system. The method can be applied to many different materials depending on their thermal conductivity. The irradiation techniques can be classified into two types: (1) one time excitation; and (2) periodic excitation. As the one-time excitation method can provide fast inspection speed and wide applicability, it has attracted a lot of interests from wide variety of industries. In the one time excitation, it can be simply divided into two types according to its length of exposure time: long excitation time [35] and transient pulse excitation [36]. Both types are presented and illustrated in this paper. The applicability of these two excitation methods greatly depends on the materials’ properties, such as thermal conductivity, diffusion or effusivity. In general, the long thermal excitation method is applied for inspecting envelope structure in civil engineering. Since this excitation method has the distinct merit of relatively higher input thermal energy than other artificial irradiation techniques, it has been adapted to suit applications involving sandwich structure, deep flaws and low thermal conductivity materials, such as ceramic tile wall, fiber materials, etc.
13/46

In the implementation of long excitation technique, the object is exposed to the lighting source/ thermal radiation (~2kJ) with a rather long exposure time (~ 1 to 30 minutes). The heat is absorbed and transmitted to the interior part of the sample until some thermal obstacles or flaws. These obstacles and flaws can cause localized temperature increase at the surface, and thus anomalous “hot-spots” are created. The size and shape of flaws can be determined from the thermal image. Moreover, the sequence of such thermal images can provide the information of temperature variation with respect to time, and can be used to estimate the depth of the flaws. In addition, the temporal noise, which is mainly from hardware, in the thermal image data can be improved and depressed by using algorithmic least-squares fitting method. This improvement enhances its visibility, and increases the ability for further image processing such as convolution, subtraction and stretching. As considering its complicated thermal dynamic conduction, it is difficult to apply the technique for quantitative analysis. So, this excitation method is mainly focused on qualitative analysis. Later on, the transient pulse excitation method was developed to address the lack of ability for carrying out quantitative analysis. This technique retains the advantages of fast inspection speed, full-field, and non interaction with the sample. Its mechanism is similar to those used in the long pulse stimulation method except that extremely short exposure time (~3ms) and larger power of transient light sources (~ 4kJ) are used to generate the excitation. During an inspection, the surface of sample is heated with a short and spatially uniform pulse of light. An IR camera interfaced to a PC is used to monitor and analyze the time-dependent response of the sample surface temperature to the thermal pulse (Fig. 3.3.1). The performance of this technique provides a good quality inspection tool for detecting surface and subsurface flaws. Since the thermal conductivity of metal is rather large as compared with others materials, it has already proved that this method is suitable for flaw detection in metal [37-41], Fig. 3.2.1 Schematic diagrams for transient pulse thermography in flaws detection During the thermal excitation to a sample with a subsurface defect, the transient heat flowing from surface into the sample interior can be partially obstructed by the flaw. This will cause an increase in the local transient temperature on the surface directly above the subsurface defect. Consequently, the anomalous “hot-spots” are revealed with time, and its transition time depends on the material’s characteristics (e.g. diffusivity, and depth). For instance, the thermal diffusivity can be calculated based on the relationship
2Lt
απ
= (24)
where L is the thickness of the sample, α is the diffusivity, and t is the transient time. In the flaw detection process, the sequential data sets are treated as a collection of independent time histories of the temperature of pixel, which can be described and analyzed with a one-dimensional diffusion model. For a semi-infinite and defect-free sample, the time-dependent surface temperature variation caused by an instantaneous heat pulse is given by [42]:
14/46
( ) (0)surf surfQT t Tc tκρ π
− = (25)
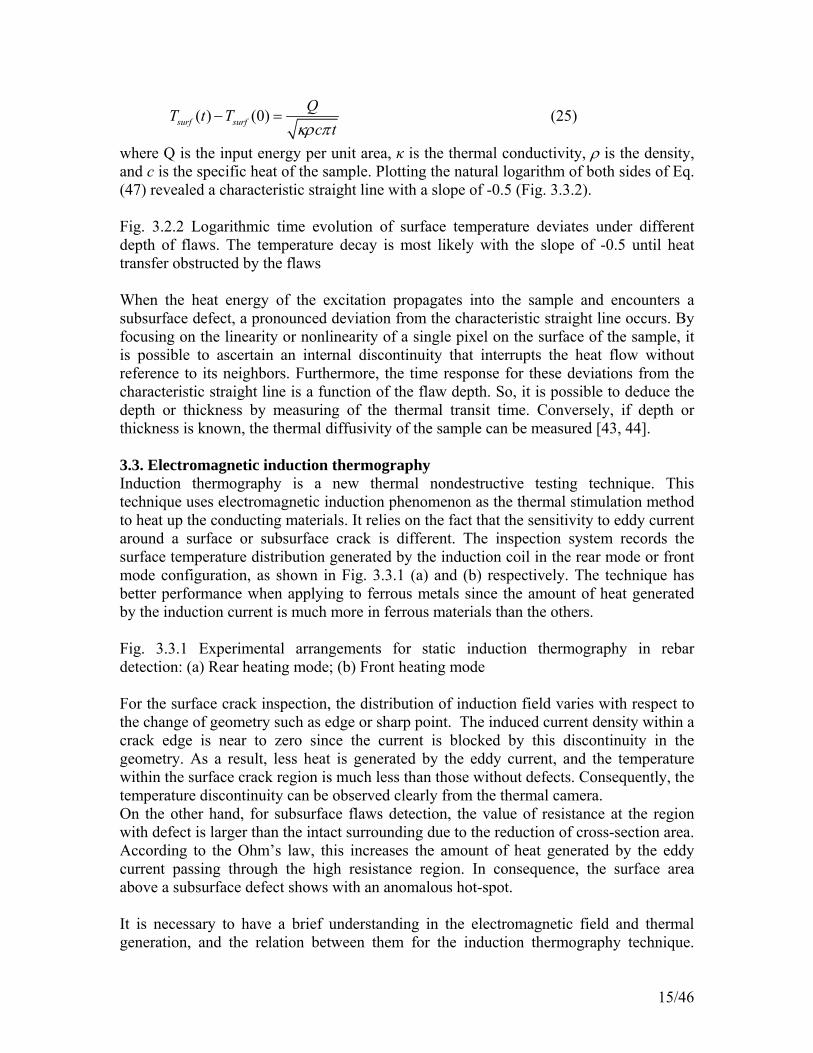
where Q is the input energy per unit area, κ is the thermal conductivity, ρ is the density, and c is the specific heat of the sample. Plotting the natural logarithm of both sides of Eq. (47) revealed a characteristic straight line with a slope of -0.5 (Fig. 3.3.2). Fig. 3.2.2 Logarithmic time evolution of surface temperature deviates under different depth of flaws. The temperature decay is most likely with the slope of -0.5 until heat transfer obstructed by the flaws When the heat energy of the excitation propagates into the sample and encounters a subsurface defect, a pronounced deviation from the characteristic straight line occurs. By focusing on the linearity or nonlinearity of a single pixel on the surface of the sample, it is possible to ascertain an internal discontinuity that interrupts the heat flow without reference to its neighbors. Furthermore, the time response for these deviations from the characteristic straight line is a function of the flaw depth. So, it is possible to deduce the depth or thickness by measuring of the thermal transit time. Conversely, if depth or thickness is known, the thermal diffusivity of the sample can be measured [43, 44]. 3.3. Electromagnetic induction thermography Induction thermography is a new thermal nondestructive testing technique. This technique uses electromagnetic induction phenomenon as the thermal stimulation method to heat up the conducting materials. It relies on the fact that the sensitivity to eddy current around a surface or subsurface crack is different. The inspection system records the surface temperature distribution generated by the induction coil in the rear mode or front mode configuration, as shown in Fig. 3.3.1 (a) and (b) respectively. The technique has better performance when applying to ferrous metals since the amount of heat generated by the induction current is much more in ferrous materials than the others. Fig. 3.3.1 Experimental arrangements for static induction thermography in rebar detection: (a) Rear heating mode; (b) Front heating mode For the surface crack inspection, the distribution of induction field varies with respect to the change of geometry such as edge or sharp point. The induced current density within a crack edge is near to zero since the current is blocked by this discontinuity in the geometry. As a result, less heat is generated by the eddy current, and the temperature within the surface crack region is much less than those without defects. Consequently, the temperature discontinuity can be observed clearly from the thermal camera. On the other hand, for subsurface flaws detection, the value of resistance at the region with defect is larger than the intact surrounding due to the reduction of cross-section area. According to the Ohm’s law, this increases the amount of heat generated by the eddy current passing through the high resistance region. In consequence, the surface area above a subsurface defect shows with an anomalous hot-spot. It is necessary to have a brief understanding in the electromagnetic field and thermal generation, and the relation between them for the induction thermography technique.
15/46
According to the Biot-Savart Law [45, 46], the magnetic field density generated from the circular coil was given as follows:
2 2 2
2 22 2
( ) 1( , , ) ( ) ( )2 ( )( )oI t b r zB x y t E m K m
b r zb r zμπ
⎡ ⎤− −= × +⎢ ⎥− ++ + ⎣ ⎦
(26)
where 22 yxr += , , and K(m) and E(m) are the complete
elliptic integrals of the first and second kind respectively, z is the distance between the coil and the sample surface. As alternating current is used to generate the magnetic field, the penetration depth of magnetic field is given as
( )2 24 /m br b r z⎡= + +⎣⎤⎦
2 /δ μσω= , where μ is the permeability, σ is the conductivity, and ω is the frequency of the applied field variation. The heating power generated by eddy current, which are used as the thermal source of the process, can be expressed as:
2 2
( , , ) x yJ Jp x y t
σ+
= (27)
where Jx and Jy are the eddy current density for the two dimensional components. The plate temperature value through all kind of thermal sources can be expressed as [47]:
2 24 41 21 2
2 2
( ) ( , , ) 1( ) ( )SBa a
h hT T p x y tT T T T Tx y wk wk k
ε ε σα
+−∂ ∂ ∂+ − − − − + =
∂ ∂ ∂t (28)
where the first term is the temperature diffusion throughout the plate, and the last term is heat generated by the eddy current, which has mentioned in the part of electromagnetic induction. On the other hand, the induction heating is relatively short. Therefore, we can assume that no energy convection and radiation are transferred to the plate surface during the heating operation. Therefore, Eq. (28) can be simplified as:
( , , ) 1p x y t Tk tα
∂=
∂ (29)
In the induction thermography technique, the inspection is mainly focused on cooling nature since it can avoid the radiation of the induction coil through reflection.
16/46

3.4. Digital image post-processing and image enhancement In the thermography technique, the greatest problem in analyzing the thermal image is the noise from hardware and surrounding environment. Many image post-processing methods have been developed for enhancing the reliability of the thermal image. These methods are mainly to limit the influence of hardware noise, emissivity problem, and non-thermal environmental signal appeared in the thermal image. In this section, two image processing methods are illustrated: (1) Thermographic signal reconstruction (TSR) and (2) Computerized tomography reconstruction (CTR). 3.4.1. Thermographic signal reconstruction (TSR) Thermographic signal reconstruction (TSR) method is a signal reconstruction technique which is developed specifically for the cooling image after a transient pulse. It is used to remove noise and extraneous non-thermal components, and to accentuate signal components from the raw signal. It also highlights signals that deviate from typical cooling behavior [48-50]. From the solution of one-dimensional heat diffusion, the surface temperature can be expressed in the logarithmic domain as follows:
( )1ln( ) ln ln2
QTe
tπ⎛ ⎞= −⎜ ⎟⎝ ⎠
(30)
Additional, Eq. (30) can be rewritten again for the digital logarithmic data analysis as:
0ln[ ( )] [ln( )]
Nn
nn
T t a t=
= ∑ (31)
where N is the order of the polynomial. The TSR process generates an equation based on a least-squares fit of a low-order polynomial to the logarithmic time history of each pixel, as depicted in Eq. (31). Moreover, the derivative with respect to ln (t) provides an increased sensitivity. For an ideal infinitely thick solid sample, the first derivative will have a constant value of -0.5. This value will increase but be bounded by zero (since the sample is cooling, the derivative is always negative) if the heat flow is interrupted by a thermally insulating discontinuity. Conversely, the value will fall if the discontinuity acts as a heat sink. Similarly, the second derivative has a value of zero for an ideal sample, rising to a positive peak at an insulating interface and a negative one for a heat-absorbing interface. Unlike the raw temperature image, which may vary due to ambient conditions, surface emissivity variations, or input energy non-uniformity, the derivatives are largely impervious to these factors, and behave in remarkably predictable manner. The slope and amplitude of the derivative are independent of the material, provided that the surface is sufficiently optically opaque and IR-emissive. The shape and characteristics of log plot and its derivatives remain the same over a vast range of materials [50].
17/46
3.4.2. Computerized tomography reconstruction (CTR) Computerized tomography reconstruction (CTR) method is a 2D image reconstruction method that it is developed to reduce or overcome the extraneous signal such as reflection or other uncontrollable heat source disturbance. Those signals give faults thermal response to the object, and therefore it is necessary to reduce or eliminate this situation. Consequently, this reconstruction technique uses the algorithmic calculation to reconstruct the fault image according to its boundary condition of the selected mask. CTR technique assists to recover the actual response of the testing object, and provides a better inspection result for interpretation. In the implementation of the computerized tomography reconstruction, line integrations are used for data reconstruction of the unknown areas. The temperature values on reconstruction region (Region R) can hence be obtained by a simple integration process after the determination of the partial derivatives. The mathematical description is shown below:
)1()2(2
1pTpTdL
LTP
P−=
∂∂
∫ (32)
where, LT∂∂ is the temperature directional derivative between the points (P1 & P2) on the
boundary, is the infinitesimal line segment between P1 & P2, and & are the temperature values on boundary points P1 and P2. As computerized the image data, Eq. (32) is digitized as follow:
dL )1( pT )2( pT
)1()2()(*)sin),(cos),((1
pTpTSLyxTyxT iiiy
K
iiix −=∗+∗∑
=
θθ (33)
where, is the length of segment S)( iSL i, and are the temperature derivatives at the i
),( iix yxT ),( iiy yxTth intervals. A group of equations with unknown of and
are generated after connecting every two points on the boundary, and then the unknown area temperature distribution can be reconstructed. The reconstruction result will be illustrated in the later experimental section.
),( iix yxT),( iiy yxT
18/46
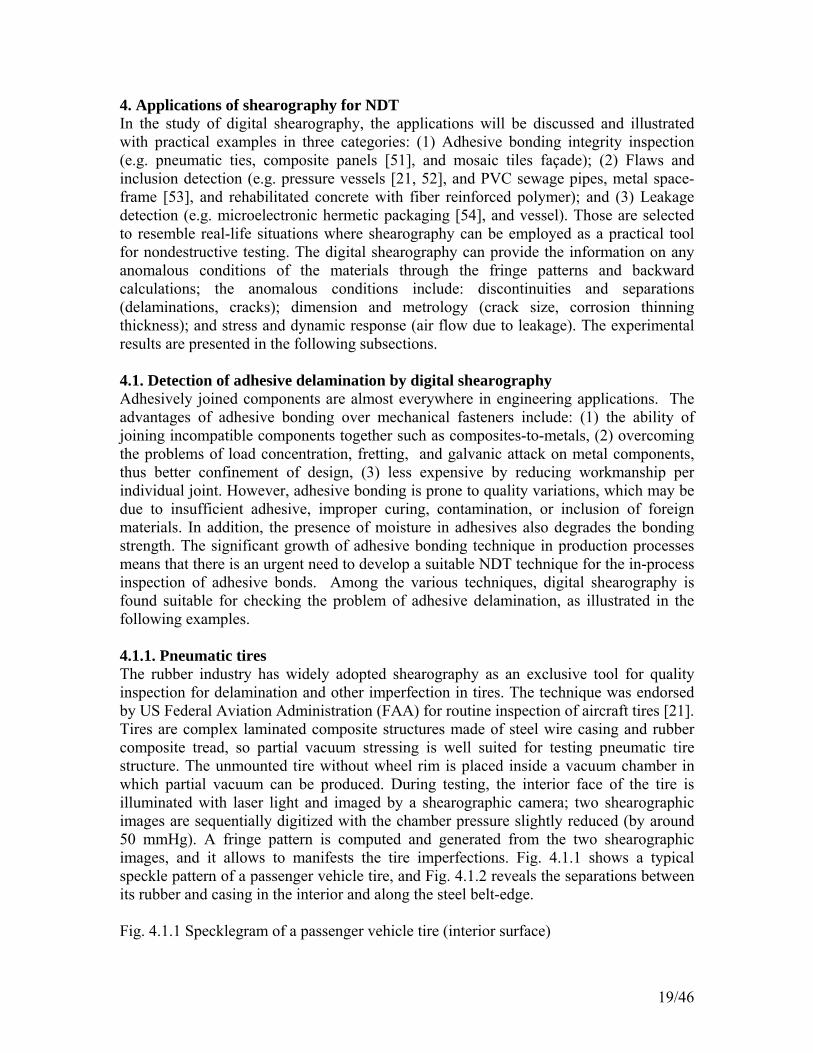
4. Applications of shearography for NDT In the study of digital shearography, the applications will be discussed and illustrated with practical examples in three categories: (1) Adhesive bonding integrity inspection (e.g. pneumatic ties, composite panels [51], and mosaic tiles façade); (2) Flaws and inclusion detection (e.g. pressure vessels [21, 52], and PVC sewage pipes, metal space-frame [53], and rehabilitated concrete with fiber reinforced polymer); and (3) Leakage detection (e.g. microelectronic hermetic packaging [54], and vessel). Those are selected to resemble real-life situations where shearography can be employed as a practical tool for nondestructive testing. The digital shearography can provide the information on any anomalous conditions of the materials through the fringe patterns and backward calculations; the anomalous conditions include: discontinuities and separations (delaminations, cracks); dimension and metrology (crack size, corrosion thinning thickness); and stress and dynamic response (air flow due to leakage). The experimental results are presented in the following subsections. 4.1. Detection of adhesive delamination by digital shearography Adhesively joined components are almost everywhere in engineering applications. The advantages of adhesive bonding over mechanical fasteners include: (1) the ability of joining incompatible components together such as composites-to-metals, (2) overcoming the problems of load concentration, fretting, and galvanic attack on metal components, thus better confinement of design, (3) less expensive by reducing workmanship per individual joint. However, adhesive bonding is prone to quality variations, which may be due to insufficient adhesive, improper curing, contamination, or inclusion of foreign materials. In addition, the presence of moisture in adhesives also degrades the bonding strength. The significant growth of adhesive bonding technique in production processes means that there is an urgent need to develop a suitable NDT technique for the in-process inspection of adhesive bonds. Among the various techniques, digital shearography is found suitable for checking the problem of adhesive delamination, as illustrated in the following examples. 4.1.1. Pneumatic tires The rubber industry has widely adopted shearography as an exclusive tool for quality inspection for delamination and other imperfection in tires. The technique was endorsed by US Federal Aviation Administration (FAA) for routine inspection of aircraft tires [21]. Tires are complex laminated composite structures made of steel wire casing and rubber composite tread, so partial vacuum stressing is well suited for testing pneumatic tire structure. The unmounted tire without wheel rim is placed inside a vacuum chamber in which partial vacuum can be produced. During testing, the interior face of the tire is illuminated with laser light and imaged by a shearographic camera; two shearographic images are sequentially digitized with the chamber pressure slightly reduced (by around 50 mmHg). A fringe pattern is computed and generated from the two shearographic images, and it allows to manifests the tire imperfections. Fig. 4.1.1 shows a typical speckle pattern of a passenger vehicle tire, and Fig. 4.1.2 reveals the separations between its rubber and casing in the interior and along the steel belt-edge. Fig. 4.1.1 Specklegram of a passenger vehicle tire (interior surface)
19/46
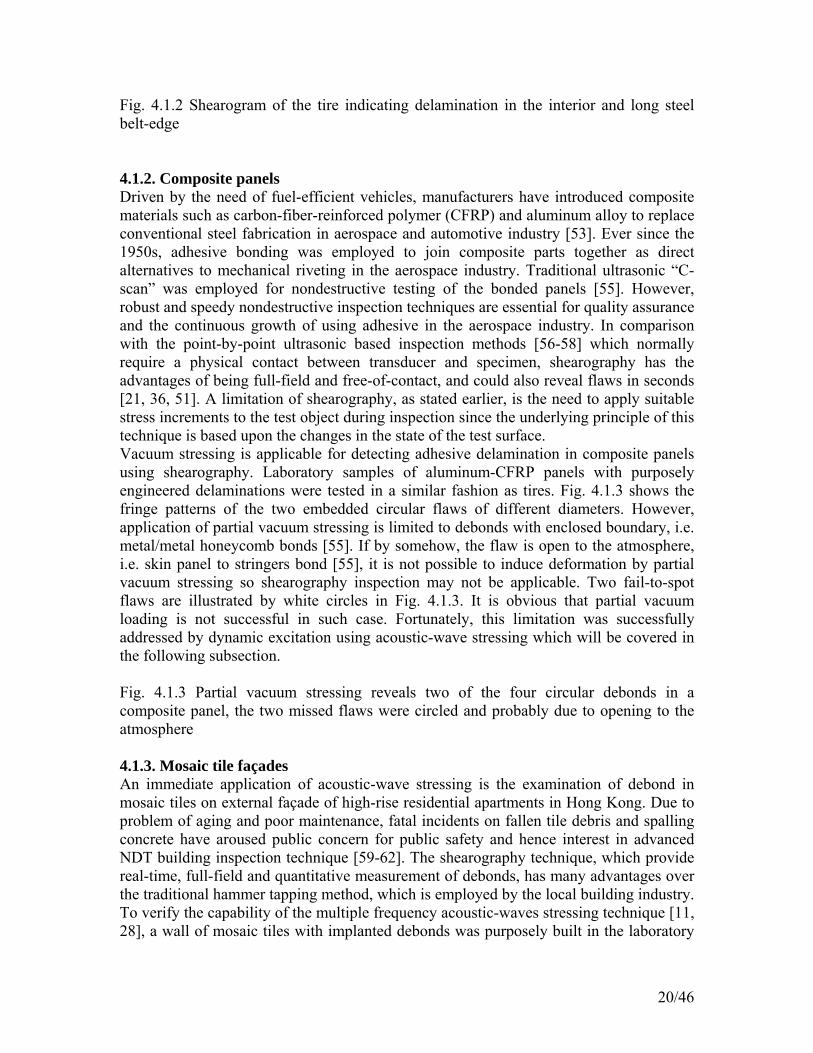
Fig. 4.1.2 Shearogram of the tire indicating delamination in the interior and long steel belt-edge 4.1.2. Composite panels Driven by the need of fuel-efficient vehicles, manufacturers have introduced composite materials such as carbon-fiber-reinforced polymer (CFRP) and aluminum alloy to replace conventional steel fabrication in aerospace and automotive industry [53]. Ever since the 1950s, adhesive bonding was employed to join composite parts together as direct alternatives to mechanical riveting in the aerospace industry. Traditional ultrasonic “C-scan” was employed for nondestructive testing of the bonded panels [55]. However, robust and speedy nondestructive inspection techniques are essential for quality assurance and the continuous growth of using adhesive in the aerospace industry. In comparison with the point-by-point ultrasonic based inspection methods [56-58] which normally require a physical contact between transducer and specimen, shearography has the advantages of being full-field and free-of-contact, and could also reveal flaws in seconds [21, 36, 51]. A limitation of shearography, as stated earlier, is the need to apply suitable stress increments to the test object during inspection since the underlying principle of this technique is based upon the changes in the state of the test surface. Vacuum stressing is applicable for detecting adhesive delamination in composite panels using shearography. Laboratory samples of aluminum-CFRP panels with purposely engineered delaminations were tested in a similar fashion as tires. Fig. 4.1.3 shows the fringe patterns of the two embedded circular flaws of different diameters. However, application of partial vacuum stressing is limited to debonds with enclosed boundary, i.e. metal/metal honeycomb bonds [55]. If by somehow, the flaw is open to the atmosphere, i.e. skin panel to stringers bond [55], it is not possible to induce deformation by partial vacuum stressing so shearography inspection may not be applicable. Two fail-to-spot flaws are illustrated by white circles in Fig. 4.1.3. It is obvious that partial vacuum loading is not successful in such case. Fortunately, this limitation was successfully addressed by dynamic excitation using acoustic-wave stressing which will be covered in the following subsection. Fig. 4.1.3 Partial vacuum stressing reveals two of the four circular debonds in a composite panel, the two missed flaws were circled and probably due to opening to the atmosphere 4.1.3. Mosaic tile façades An immediate application of acoustic-wave stressing is the examination of debond in mosaic tiles on external façade of high-rise residential apartments in Hong Kong. Due to problem of aging and poor maintenance, fatal incidents on fallen tile debris and spalling concrete have aroused public concern for public safety and hence interest in advanced NDT building inspection technique [59-62]. The shearography technique, which provide real-time, full-field and quantitative measurement of debonds, has many advantages over the traditional hammer tapping method, which is employed by the local building industry. To verify the capability of the multiple frequency acoustic-waves stressing technique [11, 28], a wall of mosaic tiles with implanted debonds was purposely built in the laboratory
20/46
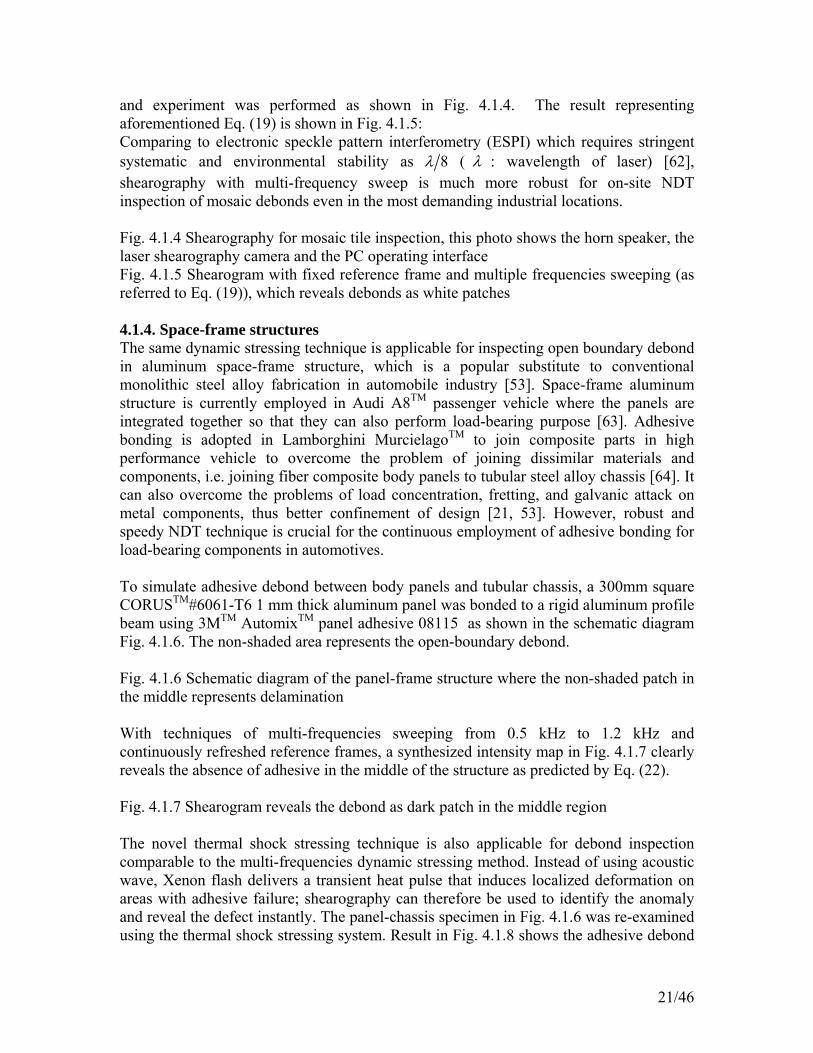
and experiment was performed as shown in Fig. 4.1.4. The result representing aforementioned Eq. (19) is shown in Fig. 4.1.5: Comparing to electronic speckle pattern interferometry (ESPI) which requires stringent systematic and environmental stability as 8λ ( λ : wavelength of laser) [62], shearography with multi-frequency sweep is much more robust for on-site NDT inspection of mosaic debonds even in the most demanding industrial locations. Fig. 4.1.4 Shearography for mosaic tile inspection, this photo shows the horn speaker, the laser shearography camera and the PC operating interface Fig. 4.1.5 Shearogram with fixed reference frame and multiple frequencies sweeping (as referred to Eq. (19)), which reveals debonds as white patches 4.1.4. Space-frame structures The same dynamic stressing technique is applicable for inspecting open boundary debond in aluminum space-frame structure, which is a popular substitute to conventional monolithic steel alloy fabrication in automobile industry [53]. Space-frame aluminum structure is currently employed in Audi A8TM passenger vehicle where the panels are integrated together so that they can also perform load-bearing purpose [63]. Adhesive bonding is adopted in Lamborghini MurcielagoTM to join composite parts in high performance vehicle to overcome the problem of joining dissimilar materials and components, i.e. joining fiber composite body panels to tubular steel alloy chassis [64]. It can also overcome the problems of load concentration, fretting, and galvanic attack on metal components, thus better confinement of design [21, 53]. However, robust and speedy NDT technique is crucial for the continuous employment of adhesive bonding for load-bearing components in automotives. To simulate adhesive debond between body panels and tubular chassis, a 300mm square CORUSTM#6061-T6 1 mm thick aluminum panel was bonded to a rigid aluminum profile beam using 3MTM AutomixTM panel adhesive 08115 as shown in the schematic diagram Fig. 4.1.6. The non-shaded area represents the open-boundary debond. Fig. 4.1.6 Schematic diagram of the panel-frame structure where the non-shaded patch in the middle represents delamination With techniques of multi-frequencies sweeping from 0.5 kHz to 1.2 kHz and continuously refreshed reference frames, a synthesized intensity map in Fig. 4.1.7 clearly reveals the absence of adhesive in the middle of the structure as predicted by Eq. (22). Fig. 4.1.7 Shearogram reveals the debond as dark patch in the middle region The novel thermal shock stressing technique is also applicable for debond inspection comparable to the multi-frequencies dynamic stressing method. Instead of using acoustic wave, Xenon flash delivers a transient heat pulse that induces localized deformation on areas with adhesive failure; shearography can therefore be used to identify the anomaly and reveal the defect instantly. The panel-chassis specimen in Fig. 4.1.6 was re-examined using the thermal shock stressing system. Result in Fig. 4.1.8 shows the adhesive debond
21/46
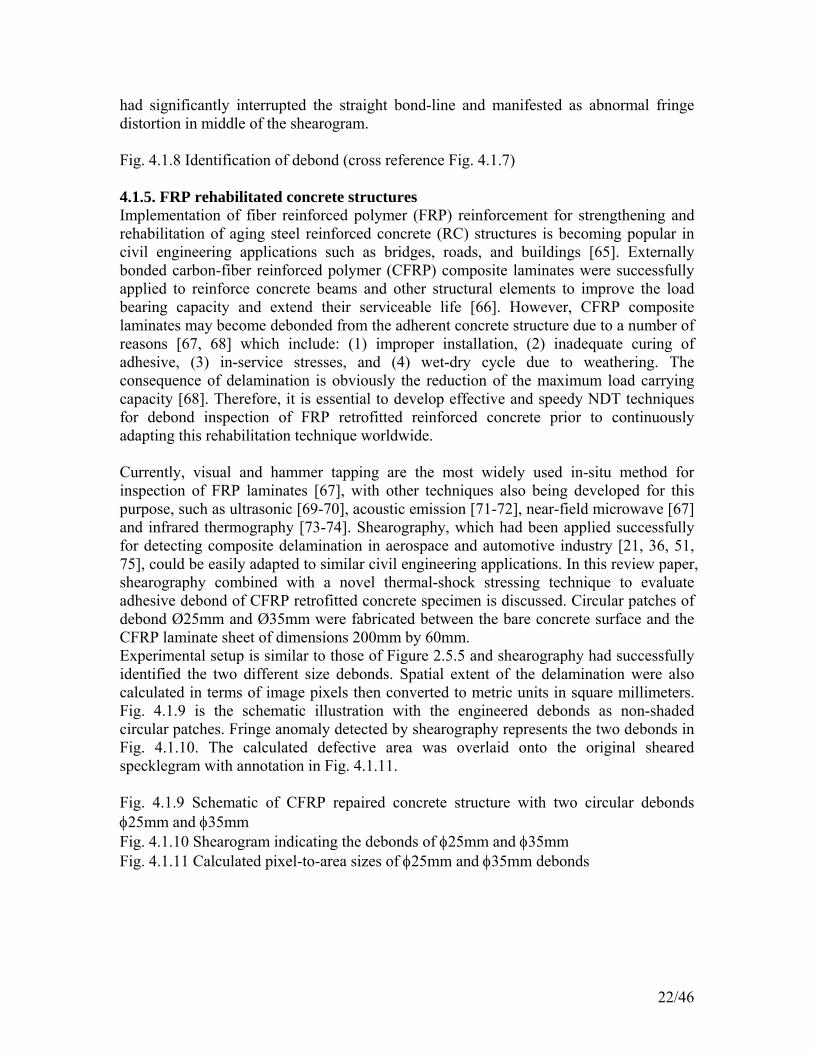
had significantly interrupted the straight bond-line and manifested as abnormal fringe distortion in middle of the shearogram. Fig. 4.1.8 Identification of debond (cross reference Fig. 4.1.7) 4.1.5. FRP rehabilitated concrete structures Implementation of fiber reinforced polymer (FRP) reinforcement for strengthening and rehabilitation of aging steel reinforced concrete (RC) structures is becoming popular in civil engineering applications such as bridges, roads, and buildings [65]. Externally bonded carbon-fiber reinforced polymer (CFRP) composite laminates were successfully applied to reinforce concrete beams and other structural elements to improve the load bearing capacity and extend their serviceable life [66]. However, CFRP composite laminates may become debonded from the adherent concrete structure due to a number of reasons [67, 68] which include: (1) improper installation, (2) inadequate curing of adhesive, (3) in-service stresses, and (4) wet-dry cycle due to weathering. The consequence of delamination is obviously the reduction of the maximum load carrying capacity [68]. Therefore, it is essential to develop effective and speedy NDT techniques for debond inspection of FRP retrofitted reinforced concrete prior to continuously adapting this rehabilitation technique worldwide. Currently, visual and hammer tapping are the most widely used in-situ method for inspection of FRP laminates [67], with other techniques also being developed for this purpose, such as ultrasonic [69-70], acoustic emission [71-72], near-field microwave [67] and infrared thermography [73-74]. Shearography, which had been applied successfully for detecting composite delamination in aerospace and automotive industry [21, 36, 51, 75], could be easily adapted to similar civil engineering applications. In this review paper, shearography combined with a novel thermal-shock stressing technique to evaluate adhesive debond of CFRP retrofitted concrete specimen is discussed. Circular patches of debond Ø25mm and Ø35mm were fabricated between the bare concrete surface and the CFRP laminate sheet of dimensions 200mm by 60mm. Experimental setup is similar to those of Figure 2.5.5 and shearography had successfully identified the two different size debonds. Spatial extent of the delamination were also calculated in terms of image pixels then converted to metric units in square millimeters. Fig. 4.1.9 is the schematic illustration with the engineered debonds as non-shaded circular patches. Fringe anomaly detected by shearography represents the two debonds in Fig. 4.1.10. The calculated defective area was overlaid onto the original sheared specklegram with annotation in Fig. 4.1.11. Fig. 4.1.9 Schematic of CFRP repaired concrete structure with two circular debonds φ25mm and φ35mm Fig. 4.1.10 Shearogram indicating the debonds of φ25mm and φ35mm Fig. 4.1.11 Calculated pixel-to-area sizes of φ25mm and φ35mm debonds
22/46
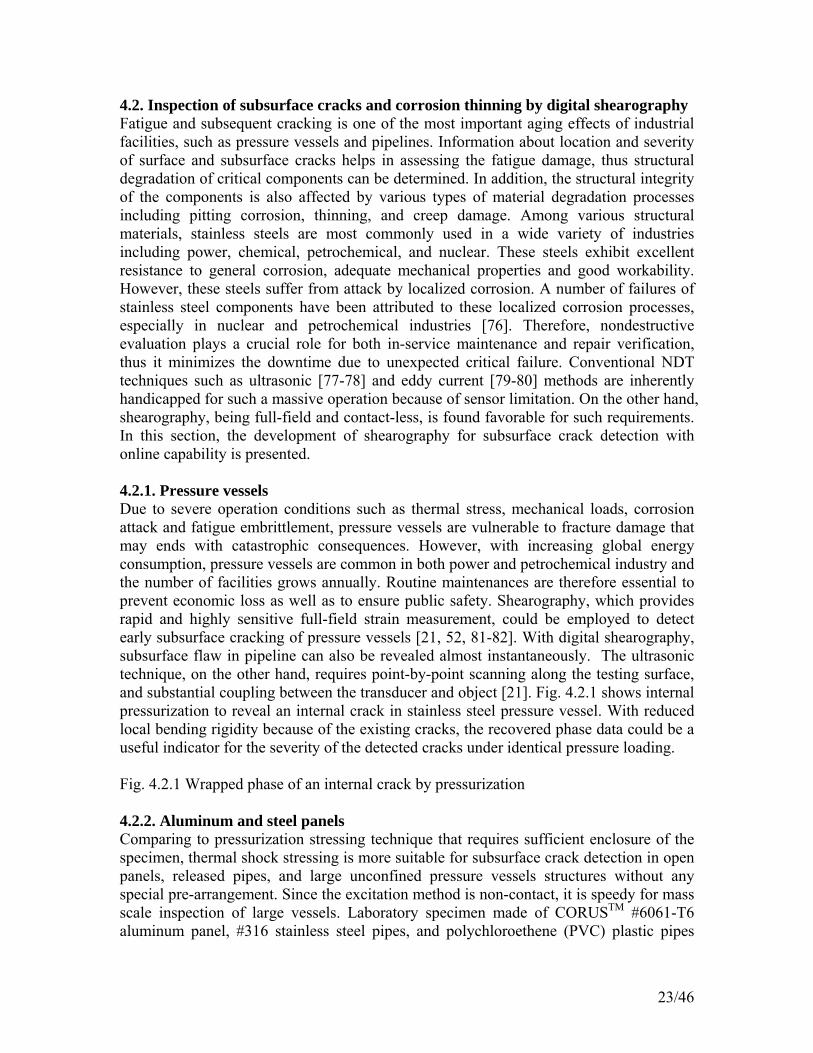
4.2. Inspection of subsurface cracks and corrosion thinning by digital shearography Fatigue and subsequent cracking is one of the most important aging effects of industrial facilities, such as pressure vessels and pipelines. Information about location and severity of surface and subsurface cracks helps in assessing the fatigue damage, thus structural degradation of critical components can be determined. In addition, the structural integrity of the components is also affected by various types of material degradation processes including pitting corrosion, thinning, and creep damage. Among various structural materials, stainless steels are most commonly used in a wide variety of industries including power, chemical, petrochemical, and nuclear. These steels exhibit excellent resistance to general corrosion, adequate mechanical properties and good workability. However, these steels suffer from attack by localized corrosion. A number of failures of stainless steel components have been attributed to these localized corrosion processes, especially in nuclear and petrochemical industries [76]. Therefore, nondestructive evaluation plays a crucial role for both in-service maintenance and repair verification, thus it minimizes the downtime due to unexpected critical failure. Conventional NDT techniques such as ultrasonic [77-78] and eddy current [79-80] methods are inherently handicapped for such a massive operation because of sensor limitation. On the other hand, shearography, being full-field and contact-less, is found favorable for such requirements. In this section, the development of shearography for subsurface crack detection with online capability is presented. 4.2.1. Pressure vessels Due to severe operation conditions such as thermal stress, mechanical loads, corrosion attack and fatigue embrittlement, pressure vessels are vulnerable to fracture damage that may ends with catastrophic consequences. However, with increasing global energy consumption, pressure vessels are common in both power and petrochemical industry and the number of facilities grows annually. Routine maintenances are therefore essential to prevent economic loss as well as to ensure public safety. Shearography, which provides rapid and highly sensitive full-field strain measurement, could be employed to detect early subsurface cracking of pressure vessels [21, 52, 81-82]. With digital shearography, subsurface flaw in pipeline can also be revealed almost instantaneously. The ultrasonic technique, on the other hand, requires point-by-point scanning along the testing surface, and substantial coupling between the transducer and object [21]. Fig. 4.2.1 shows internal pressurization to reveal an internal crack in stainless steel pressure vessel. With reduced local bending rigidity because of the existing cracks, the recovered phase data could be a useful indicator for the severity of the detected cracks under identical pressure loading. Fig. 4.2.1 Wrapped phase of an internal crack by pressurization 4.2.2. Aluminum and steel panels Comparing to pressurization stressing technique that requires sufficient enclosure of the specimen, thermal shock stressing is more suitable for subsurface crack detection in open panels, released pipes, and large unconfined pressure vessels structures without any special pre-arrangement. Since the excitation method is non-contact, it is speedy for mass scale inspection of large vessels. Laboratory specimen made of CORUSTM #6061-T6 aluminum panel, #316 stainless steel pipes, and polychloroethene (PVC) plastic pipes
23/46
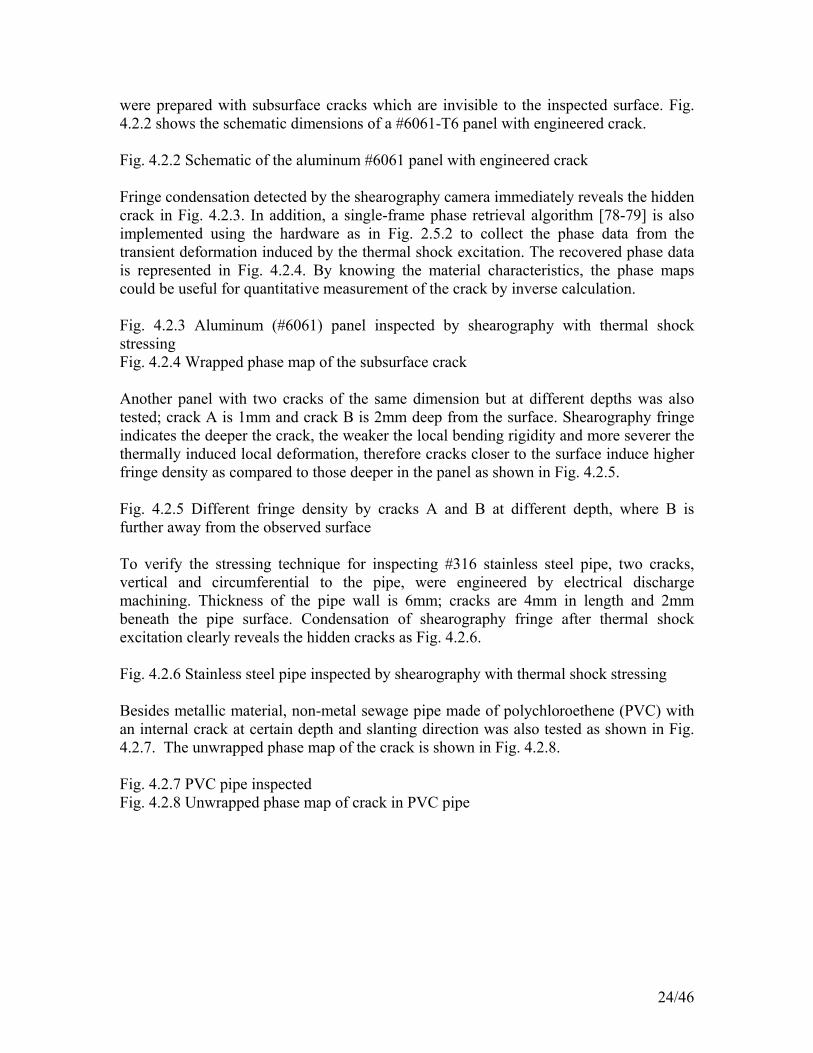
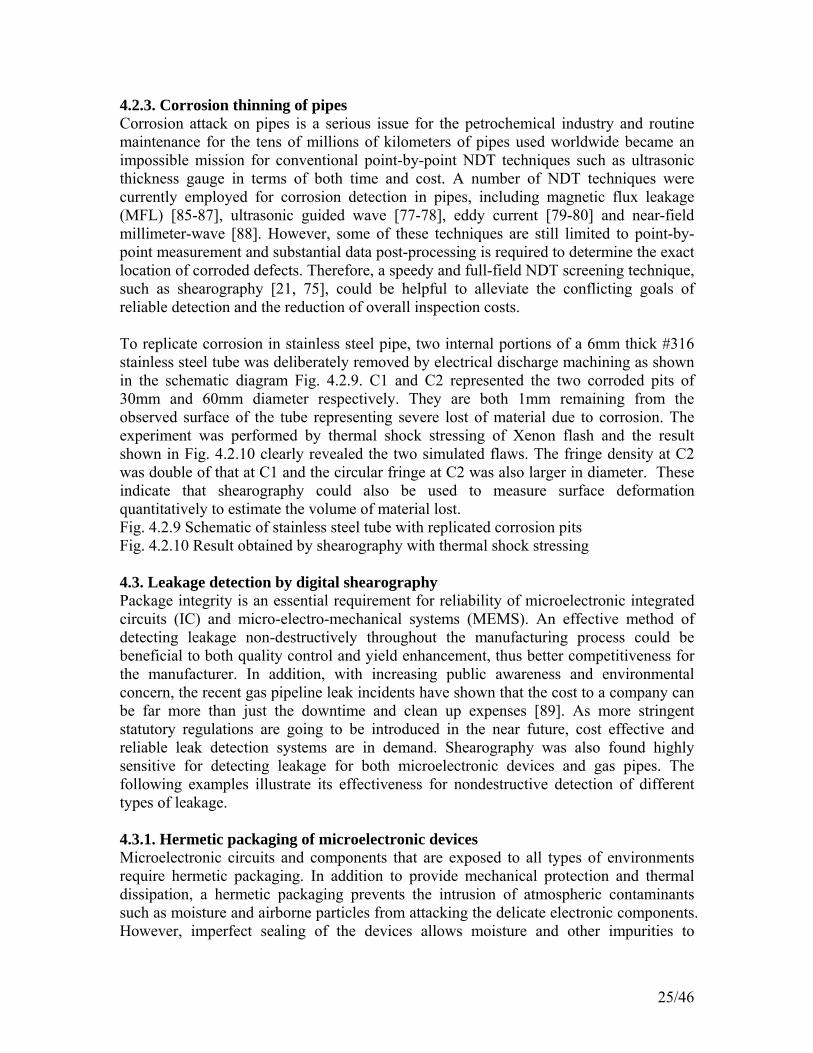
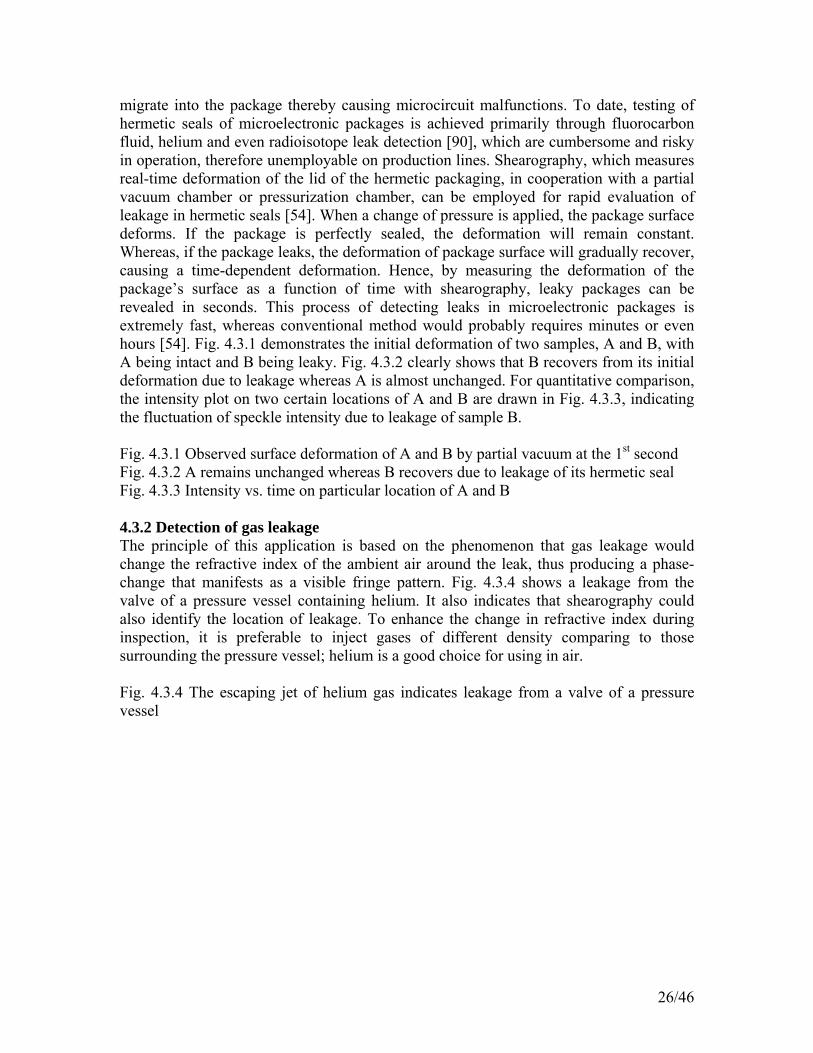
were prepared with subsurface cracks which are invisible to the inspected surface. Fig. 4.2.2 shows the schematic dimensions of a #6061-T6 panel with engineered crack. Fig. 4.2.2 Schematic of the aluminum #6061 panel with engineered crack Fringe condensation detected by the shearography camera immediately reveals the hidden crack in Fig. 4.2.3. In addition, a single-frame phase retrieval algorithm [78-79] is also implemented using the hardware as in Fig. 2.5.2 to collect the phase data from the transient deformation induced by the thermal shock excitation. The recovered phase data is represented in Fig. 4.2.4. By knowing the material characteristics, the phase maps could be useful for quantitative measurement of the crack by inverse calculation. Fig. 4.2.3 Aluminum (#6061) panel inspected by shearography with thermal shock stressing Fig. 4.2.4 Wrapped phase map of the subsurface crack Another panel with two cracks of the same dimension but at different depths was also tested; crack A is 1mm and crack B is 2mm deep from the surface. Shearography fringe indicates the deeper the crack, the weaker the local bending rigidity and more severer the thermally induced local deformation, therefore cracks closer to the surface induce higher fringe density as compared to those deeper in the panel as shown in Fig. 4.2.5. Fig. 4.2.5 Different fringe density by cracks A and B at different depth, where B is further away from the observed surface To verify the stressing technique for inspecting #316 stainless steel pipe, two cracks, vertical and circumferential to the pipe, were engineered by electrical discharge machining. Thickness of the pipe wall is 6mm; cracks are 4mm in length and 2mm beneath the pipe surface. Condensation of shearography fringe after thermal shock excitation clearly reveals the hidden cracks as Fig. 4.2.6. Fig. 4.2.6 Stainless steel pipe inspected by shearography with thermal shock stressing Besides metallic material, non-metal sewage pipe made of polychloroethene (PVC) with an internal crack at certain depth and slanting direction was also tested as shown in Fig. 4.2.7. The unwrapped phase map of the crack is shown in Fig. 4.2.8. Fig. 4.2.7 PVC pipe inspected Fig. 4.2.8 Unwrapped phase map of crack in PVC pipe
24/46
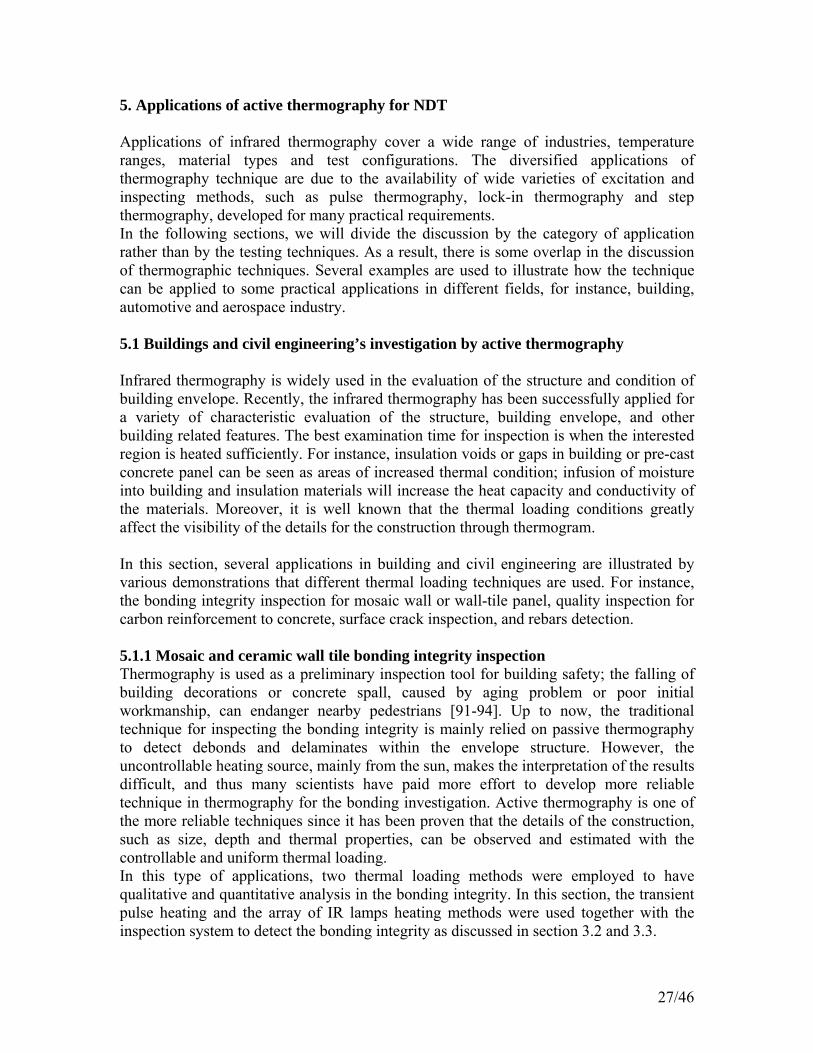
4.2.3. Corrosion thinning of pipes Corrosion attack on pipes is a serious issue for the petrochemical industry and routine maintenance for the tens of millions of kilometers of pipes used worldwide became an impossible mission for conventional point-by-point NDT techniques such as ultrasonic thickness gauge in terms of both time and cost. A number of NDT techniques were currently employed for corrosion detection in pipes, including magnetic flux leakage (MFL) [85-87], ultrasonic guided wave [77-78], eddy current [79-80] and near-field millimeter-wave [88]. However, some of these techniques are still limited to point-by-point measurement and substantial data post-processing is required to determine the exact location of corroded defects. Therefore, a speedy and full-field NDT screening technique, such as shearography [21, 75], could be helpful to alleviate the conflicting goals of reliable detection and the reduction of overall inspection costs. To replicate corrosion in stainless steel pipe, two internal portions of a 6mm thick #316 stainless steel tube was deliberately removed by electrical discharge machining as shown in the schematic diagram Fig. 4.2.9. C1 and C2 represented the two corroded pits of 30mm and 60mm diameter respectively. They are both 1mm remaining from the observed surface of the tube representing severe lost of material due to corrosion. The experiment was performed by thermal shock stressing of Xenon flash and the result shown in Fig. 4.2.10 clearly revealed the two simulated flaws. The fringe density at C2 was double of that at C1 and the circular fringe at C2 was also larger in diameter. These indicate that shearography could also be used to measure surface deformation quantitatively to estimate the volume of material lost. Fig. 4.2.9 Schematic of stainless steel tube with replicated corrosion pits Fig. 4.2.10 Result obtained by shearography with thermal shock stressing 4.3. Leakage detection by digital shearography Package integrity is an essential requirement for reliability of microelectronic integrated circuits (IC) and micro-electro-mechanical systems (MEMS). An effective method of detecting leakage non-destructively throughout the manufacturing process could be beneficial to both quality control and yield enhancement, thus better competitiveness for the manufacturer. In addition, with increasing public awareness and environmental concern, the recent gas pipeline leak incidents have shown that the cost to a company can be far more than just the downtime and clean up expenses [89]. As more stringent statutory regulations are going to be introduced in the near future, cost effective and reliable leak detection systems are in demand. Shearography was also found highly sensitive for detecting leakage for both microelectronic devices and gas pipes. The following examples illustrate its effectiveness for nondestructive detection of different types of leakage. 4.3.1. Hermetic packaging of microelectronic devices Microelectronic circuits and components that are exposed to all types of environments require hermetic packaging. In addition to provide mechanical protection and thermal dissipation, a hermetic packaging prevents the intrusion of atmospheric contaminants such as moisture and airborne particles from attacking the delicate electronic components. However, imperfect sealing of the devices allows moisture and other impurities to
25/46
migrate into the package thereby causing microcircuit malfunctions. To date, testing of hermetic seals of microelectronic packages is achieved primarily through fluorocarbon fluid, helium and even radioisotope leak detection [90], which are cumbersome and risky in operation, therefore unemployable on production lines. Shearography, which measures real-time deformation of the lid of the hermetic packaging, in cooperation with a partial vacuum chamber or pressurization chamber, can be employed for rapid evaluation of leakage in hermetic seals [54]. When a change of pressure is applied, the package surface deforms. If the package is perfectly sealed, the deformation will remain constant. Whereas, if the package leaks, the deformation of package surface will gradually recover, causing a time-dependent deformation. Hence, by measuring the deformation of the package’s surface as a function of time with shearography, leaky packages can be revealed in seconds. This process of detecting leaks in microelectronic packages is extremely fast, whereas conventional method would probably requires minutes or even hours [54]. Fig. 4.3.1 demonstrates the initial deformation of two samples, A and B, with A being intact and B being leaky. Fig. 4.3.2 clearly shows that B recovers from its initial deformation due to leakage whereas A is almost unchanged. For quantitative comparison, the intensity plot on two certain locations of A and B are drawn in Fig. 4.3.3, indicating the fluctuation of speckle intensity due to leakage of sample B. Fig. 4.3.1 Observed surface deformation of A and B by partial vacuum at the 1st second Fig. 4.3.2 A remains unchanged whereas B recovers due to leakage of its hermetic seal Fig. 4.3.3 Intensity vs. time on particular location of A and B 4.3.2 Detection of gas leakage The principle of this application is based on the phenomenon that gas leakage would change the refractive index of the ambient air around the leak, thus producing a phase-change that manifests as a visible fringe pattern. Fig. 4.3.4 shows a leakage from the valve of a pressure vessel containing helium. It also indicates that shearography could also identify the location of leakage. To enhance the change in refractive index during inspection, it is preferable to inject gases of different density comparing to those surrounding the pressure vessel; helium is a good choice for using in air. Fig. 4.3.4 The escaping jet of helium gas indicates leakage from a valve of a pressure vessel
26/46
5. Applications of active thermography for NDT Applications of infrared thermography cover a wide range of industries, temperature ranges, material types and test configurations. The diversified applications of thermography technique are due to the availability of wide varieties of excitation and inspecting methods, such as pulse thermography, lock-in thermography and step thermography, developed for many practical requirements. In the following sections, we will divide the discussion by the category of application rather than by the testing techniques. As a result, there is some overlap in the discussion of thermographic techniques. Several examples are used to illustrate how the technique can be applied to some practical applications in different fields, for instance, building, automotive and aerospace industry. 5.1 Buildings and civil engineering’s investigation by active thermography Infrared thermography is widely used in the evaluation of the structure and condition of building envelope. Recently, the infrared thermography has been successfully applied for a variety of characteristic evaluation of the structure, building envelope, and other building related features. The best examination time for inspection is when the interested region is heated sufficiently. For instance, insulation voids or gaps in building or pre-cast concrete panel can be seen as areas of increased thermal condition; infusion of moisture into building and insulation materials will increase the heat capacity and conductivity of the materials. Moreover, it is well known that the thermal loading conditions greatly affect the visibility of the details for the construction through thermogram. In this section, several applications in building and civil engineering are illustrated by various demonstrations that different thermal loading techniques are used. For instance, the bonding integrity inspection for mosaic wall or wall-tile panel, quality inspection for carbon reinforcement to concrete, surface crack inspection, and rebars detection. 5.1.1 Mosaic and ceramic wall tile bonding integrity inspection Thermography is used as a preliminary inspection tool for building safety; the falling of building decorations or concrete spall, caused by aging problem or poor initial workmanship, can endanger nearby pedestrians [91-94]. Up to now, the traditional technique for inspecting the bonding integrity is mainly relied on passive thermography to detect debonds and delaminates within the envelope structure. However, the uncontrollable heating source, mainly from the sun, makes the interpretation of the results difficult, and thus many scientists have paid more effort to develop more reliable technique in thermography for the bonding investigation. Active thermography is one of the more reliable techniques since it has been proven that the details of the construction, such as size, depth and thermal properties, can be observed and estimated with the controllable and uniform thermal loading. In this type of applications, two thermal loading methods were employed to have qualitative and quantitative analysis in the bonding integrity. In this section, the transient pulse heating and the array of IR lamps heating methods were used together with the inspection system to detect the bonding integrity as discussed in section 3.2 and 3.3.
27/46
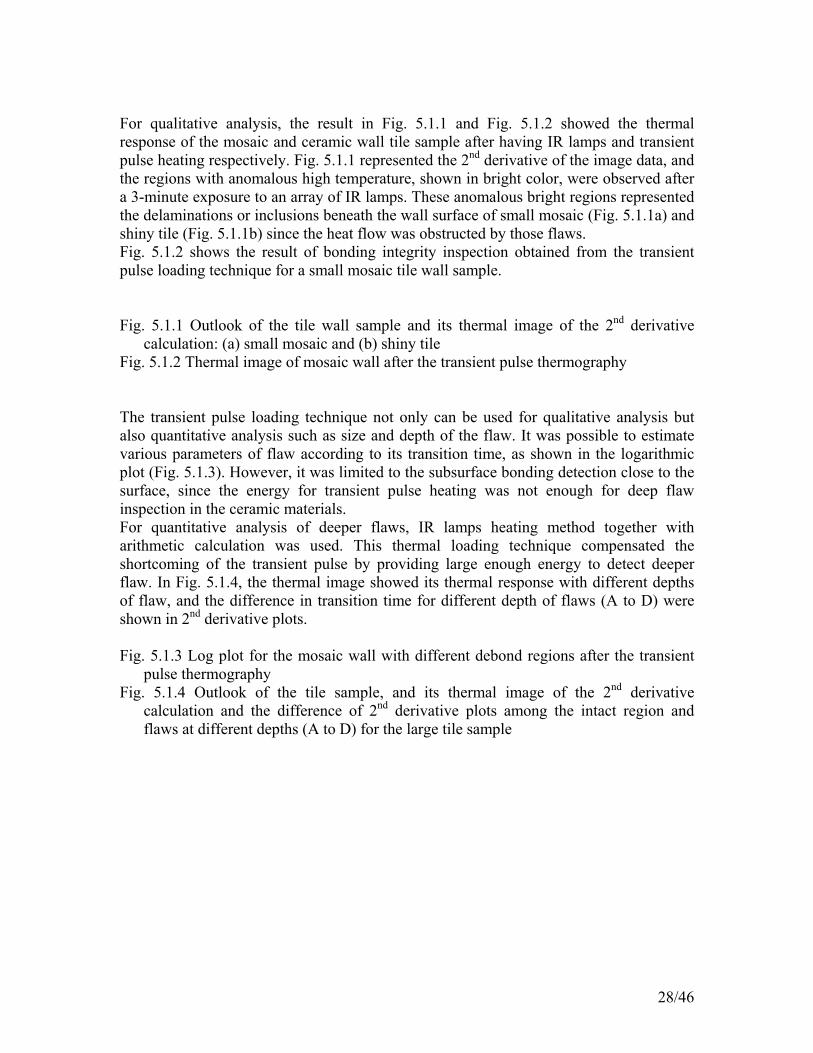
For qualitative analysis, the result in Fig. 5.1.1 and Fig. 5.1.2 showed the thermal response of the mosaic and ceramic wall tile sample after having IR lamps and transient pulse heating respectively. Fig. 5.1.1 represented the 2nd derivative of the image data, and the regions with anomalous high temperature, shown in bright color, were observed after a 3-minute exposure to an array of IR lamps. These anomalous bright regions represented the delaminations or inclusions beneath the wall surface of small mosaic (Fig. 5.1.1a) and shiny tile (Fig. 5.1.1b) since the heat flow was obstructed by those flaws. Fig. 5.1.2 shows the result of bonding integrity inspection obtained from the transient pulse loading technique for a small mosaic tile wall sample. Fig. 5.1.1 Outlook of the tile wall sample and its thermal image of the 2nd derivative
calculation: (a) small mosaic and (b) shiny tile Fig. 5.1.2 Thermal image of mosaic wall after the transient pulse thermography The transient pulse loading technique not only can be used for qualitative analysis but also quantitative analysis such as size and depth of the flaw. It was possible to estimate various parameters of flaw according to its transition time, as shown in the logarithmic plot (Fig. 5.1.3). However, it was limited to the subsurface bonding detection close to the surface, since the energy for transient pulse heating was not enough for deep flaw inspection in the ceramic materials. For quantitative analysis of deeper flaws, IR lamps heating method together with arithmetic calculation was used. This thermal loading technique compensated the shortcoming of the transient pulse by providing large enough energy to detect deeper flaw. In Fig. 5.1.4, the thermal image showed its thermal response with different depths of flaw, and the difference in transition time for different depth of flaws (A to D) were shown in 2nd derivative plots. Fig. 5.1.3 Log plot for the mosaic wall with different debond regions after the transient
pulse thermography Fig. 5.1.4 Outlook of the tile sample, and its thermal image of the 2nd derivative
calculation and the difference of 2nd derivative plots among the intact region and flaws at different depths (A to D) for the large tile sample
28/46
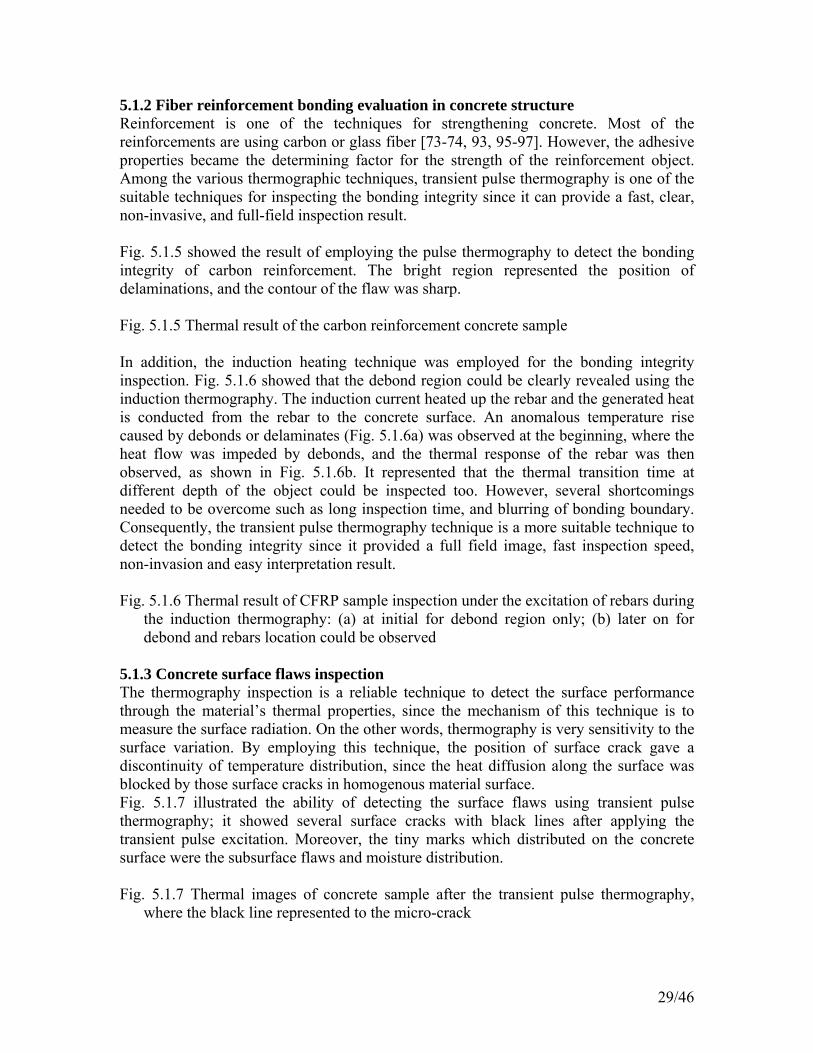
5.1.2 Fiber reinforcement bonding evaluation in concrete structure Reinforcement is one of the techniques for strengthening concrete. Most of the reinforcements are using carbon or glass fiber [73-74, 93, 95-97]. However, the adhesive properties became the determining factor for the strength of the reinforcement object. Among the various thermographic techniques, transient pulse thermography is one of the suitable techniques for inspecting the bonding integrity since it can provide a fast, clear, non-invasive, and full-field inspection result. Fig. 5.1.5 showed the result of employing the pulse thermography to detect the bonding integrity of carbon reinforcement. The bright region represented the position of delaminations, and the contour of the flaw was sharp. Fig. 5.1.5 Thermal result of the carbon reinforcement concrete sample In addition, the induction heating technique was employed for the bonding integrity inspection. Fig. 5.1.6 showed that the debond region could be clearly revealed using the induction thermography. The induction current heated up the rebar and the generated heat is conducted from the rebar to the concrete surface. An anomalous temperature rise caused by debonds or delaminates (Fig. 5.1.6a) was observed at the beginning, where the heat flow was impeded by debonds, and the thermal response of the rebar was then observed, as shown in Fig. 5.1.6b. It represented that the thermal transition time at different depth of the object could be inspected too. However, several shortcomings needed to be overcome such as long inspection time, and blurring of bonding boundary. Consequently, the transient pulse thermography technique is a more suitable technique to detect the bonding integrity since it provided a full field image, fast inspection speed, non-invasion and easy interpretation result. Fig. 5.1.6 Thermal result of CFRP sample inspection under the excitation of rebars during
the induction thermography: (a) at initial for debond region only; (b) later on for debond and rebars location could be observed
5.1.3 Concrete surface flaws inspection The thermography inspection is a reliable technique to detect the surface performance through the material’s thermal properties, since the mechanism of this technique is to measure the surface radiation. On the other words, thermography is very sensitivity to the surface variation. By employing this technique, the position of surface crack gave a discontinuity of temperature distribution, since the heat diffusion along the surface was blocked by those surface cracks in homogenous material surface. Fig. 5.1.7 illustrated the ability of detecting the surface flaws using transient pulse thermography; it showed several surface cracks with black lines after applying the transient pulse excitation. Moreover, the tiny marks which distributed on the concrete surface were the subsurface flaws and moisture distribution. Fig. 5.1.7 Thermal images of concrete sample after the transient pulse thermography,
where the black line represented to the micro-crack
29/46
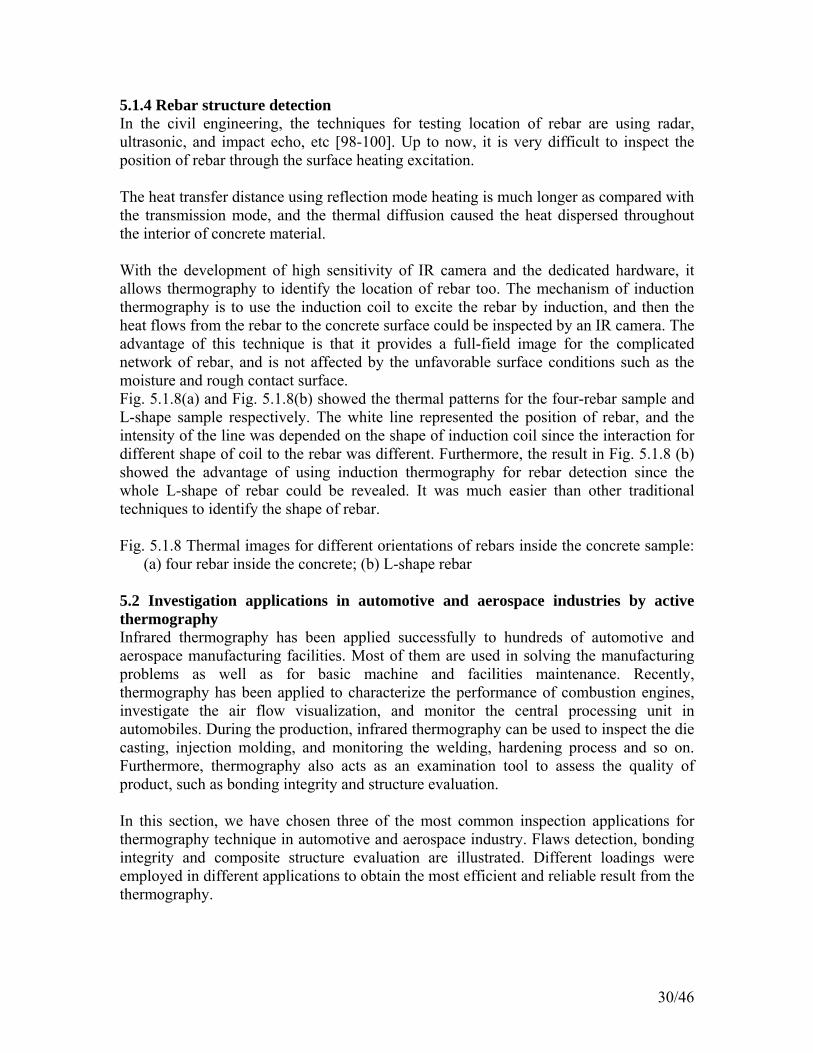
5.1.4 Rebar structure detection In the civil engineering, the techniques for testing location of rebar are using radar, ultrasonic, and impact echo, etc [98-100]. Up to now, it is very difficult to inspect the position of rebar through the surface heating excitation. The heat transfer distance using reflection mode heating is much longer as compared with the transmission mode, and the thermal diffusion caused the heat dispersed throughout the interior of concrete material. With the development of high sensitivity of IR camera and the dedicated hardware, it allows thermography to identify the location of rebar too. The mechanism of induction thermography is to use the induction coil to excite the rebar by induction, and then the heat flows from the rebar to the concrete surface could be inspected by an IR camera. The advantage of this technique is that it provides a full-field image for the complicated network of rebar, and is not affected by the unfavorable surface conditions such as the moisture and rough contact surface. Fig. 5.1.8(a) and Fig. 5.1.8(b) showed the thermal patterns for the four-rebar sample and L-shape sample respectively. The white line represented the position of rebar, and the intensity of the line was depended on the shape of induction coil since the interaction for different shape of coil to the rebar was different. Furthermore, the result in Fig. 5.1.8 (b) showed the advantage of using induction thermography for rebar detection since the whole L-shape of rebar could be revealed. It was much easier than other traditional techniques to identify the shape of rebar. Fig. 5.1.8 Thermal images for different orientations of rebars inside the concrete sample:
(a) four rebar inside the concrete; (b) L-shape rebar 5.2 Investigation applications in automotive and aerospace industries by active thermography Infrared thermography has been applied successfully to hundreds of automotive and aerospace manufacturing facilities. Most of them are used in solving the manufacturing problems as well as for basic machine and facilities maintenance. Recently, thermography has been applied to characterize the performance of combustion engines, investigate the air flow visualization, and monitor the central processing unit in automobiles. During the production, infrared thermography can be used to inspect the die casting, injection molding, and monitoring the welding, hardening process and so on. Furthermore, thermography also acts as an examination tool to assess the quality of product, such as bonding integrity and structure evaluation. In this section, we have chosen three of the most common inspection applications for thermography technique in automotive and aerospace industry. Flaws detection, bonding integrity and composite structure evaluation are illustrated. Different loadings were employed in different applications to obtain the most efficient and reliable result from the thermography.
30/46
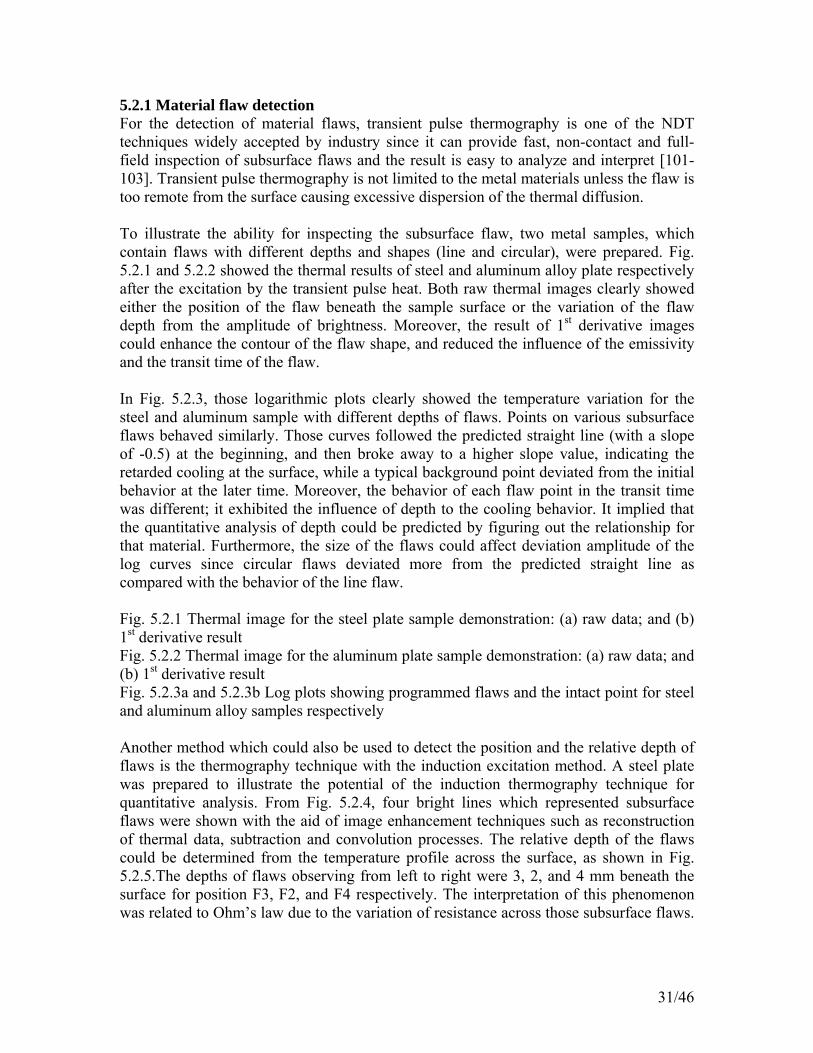
5.2.1 Material flaw detection For the detection of material flaws, transient pulse thermography is one of the NDT techniques widely accepted by industry since it can provide fast, non-contact and full-field inspection of subsurface flaws and the result is easy to analyze and interpret [101-103]. Transient pulse thermography is not limited to the metal materials unless the flaw is too remote from the surface causing excessive dispersion of the thermal diffusion. To illustrate the ability for inspecting the subsurface flaw, two metal samples, which contain flaws with different depths and shapes (line and circular), were prepared. Fig. 5.2.1 and 5.2.2 showed the thermal results of steel and aluminum alloy plate respectively after the excitation by the transient pulse heat. Both raw thermal images clearly showed either the position of the flaw beneath the sample surface or the variation of the flaw depth from the amplitude of brightness. Moreover, the result of 1st derivative images could enhance the contour of the flaw shape, and reduced the influence of the emissivity and the transit time of the flaw. In Fig. 5.2.3, those logarithmic plots clearly showed the temperature variation for the steel and aluminum sample with different depths of flaws. Points on various subsurface flaws behaved similarly. Those curves followed the predicted straight line (with a slope of -0.5) at the beginning, and then broke away to a higher slope value, indicating the retarded cooling at the surface, while a typical background point deviated from the initial behavior at the later time. Moreover, the behavior of each flaw point in the transit time was different; it exhibited the influence of depth to the cooling behavior. It implied that the quantitative analysis of depth could be predicted by figuring out the relationship for that material. Furthermore, the size of the flaws could affect deviation amplitude of the log curves since circular flaws deviated more from the predicted straight line as compared with the behavior of the line flaw. Fig. 5.2.1 Thermal image for the steel plate sample demonstration: (a) raw data; and (b) 1st derivative result Fig. 5.2.2 Thermal image for the aluminum plate sample demonstration: (a) raw data; and (b) 1st derivative result Fig. 5.2.3a and 5.2.3b Log plots showing programmed flaws and the intact point for steel and aluminum alloy samples respectively Another method which could also be used to detect the position and the relative depth of flaws is the thermography technique with the induction excitation method. A steel plate was prepared to illustrate the potential of the induction thermography technique for quantitative analysis. From Fig. 5.2.4, four bright lines which represented subsurface flaws were shown with the aid of image enhancement techniques such as reconstruction of thermal data, subtraction and convolution processes. The relative depth of the flaws could be determined from the temperature profile across the surface, as shown in Fig. 5.2.5.The depths of flaws observing from left to right were 3, 2, and 4 mm beneath the surface for position F3, F2, and F4 respectively. The interpretation of this phenomenon was related to Ohm’s law due to the variation of resistance across those subsurface flaws.
31/46
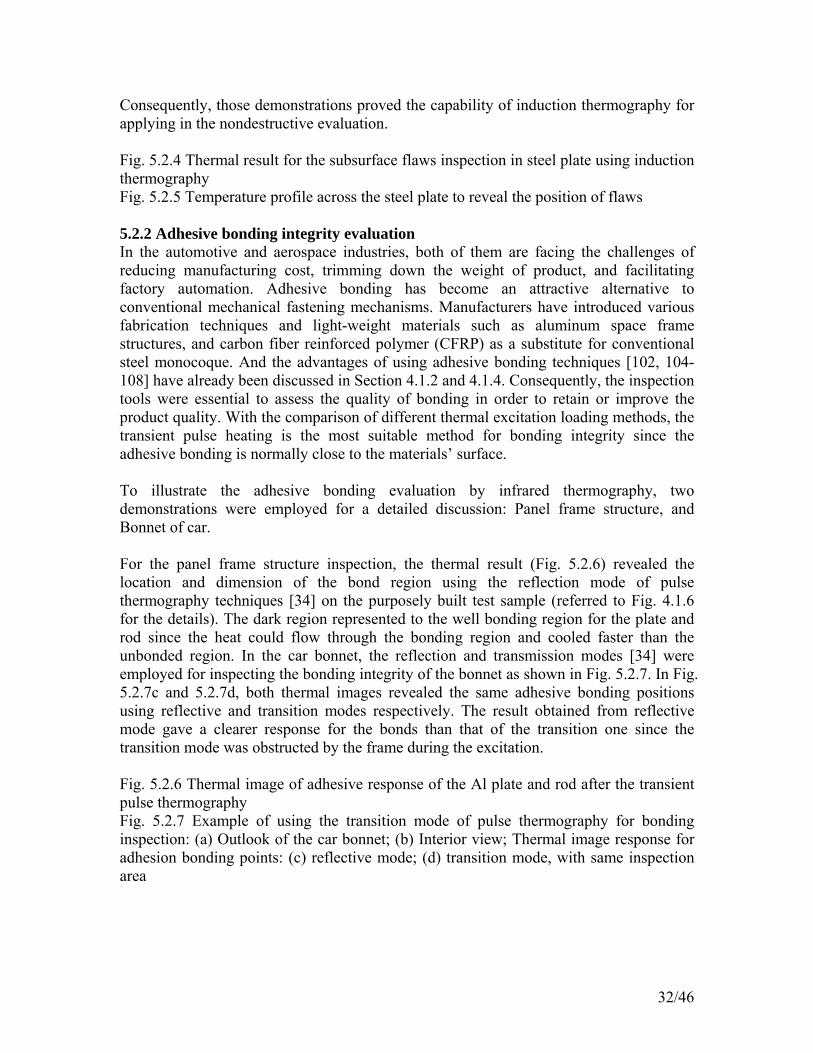
Consequently, those demonstrations proved the capability of induction thermography for applying in the nondestructive evaluation. Fig. 5.2.4 Thermal result for the subsurface flaws inspection in steel plate using induction thermography Fig. 5.2.5 Temperature profile across the steel plate to reveal the position of flaws 5.2.2 Adhesive bonding integrity evaluation In the automotive and aerospace industries, both of them are facing the challenges of reducing manufacturing cost, trimming down the weight of product, and facilitating factory automation. Adhesive bonding has become an attractive alternative to conventional mechanical fastening mechanisms. Manufacturers have introduced various fabrication techniques and light-weight materials such as aluminum space frame structures, and carbon fiber reinforced polymer (CFRP) as a substitute for conventional steel monocoque. And the advantages of using adhesive bonding techniques [102, 104-108] have already been discussed in Section 4.1.2 and 4.1.4. Consequently, the inspection tools were essential to assess the quality of bonding in order to retain or improve the product quality. With the comparison of different thermal excitation loading methods, the transient pulse heating is the most suitable method for bonding integrity since the adhesive bonding is normally close to the materials’ surface. To illustrate the adhesive bonding evaluation by infrared thermography, two demonstrations were employed for a detailed discussion: Panel frame structure, and Bonnet of car. For the panel frame structure inspection, the thermal result (Fig. 5.2.6) revealed the location and dimension of the bond region using the reflection mode of pulse thermography techniques [34] on the purposely built test sample (referred to Fig. 4.1.6 for the details). The dark region represented to the well bonding region for the plate and rod since the heat could flow through the bonding region and cooled faster than the unbonded region. In the car bonnet, the reflection and transmission modes [34] were employed for inspecting the bonding integrity of the bonnet as shown in Fig. 5.2.7. In Fig. 5.2.7c and 5.2.7d, both thermal images revealed the same adhesive bonding positions using reflective and transition modes respectively. The result obtained from reflective mode gave a clearer response for the bonds than that of the transition one since the transition mode was obstructed by the frame during the excitation. Fig. 5.2.6 Thermal image of adhesive response of the Al plate and rod after the transient pulse thermography Fig. 5.2.7 Example of using the transition mode of pulse thermography for bonding inspection: (a) Outlook of the car bonnet; (b) Interior view; Thermal image response for adhesion bonding points: (c) reflective mode; (d) transition mode, with same inspection area
32/46
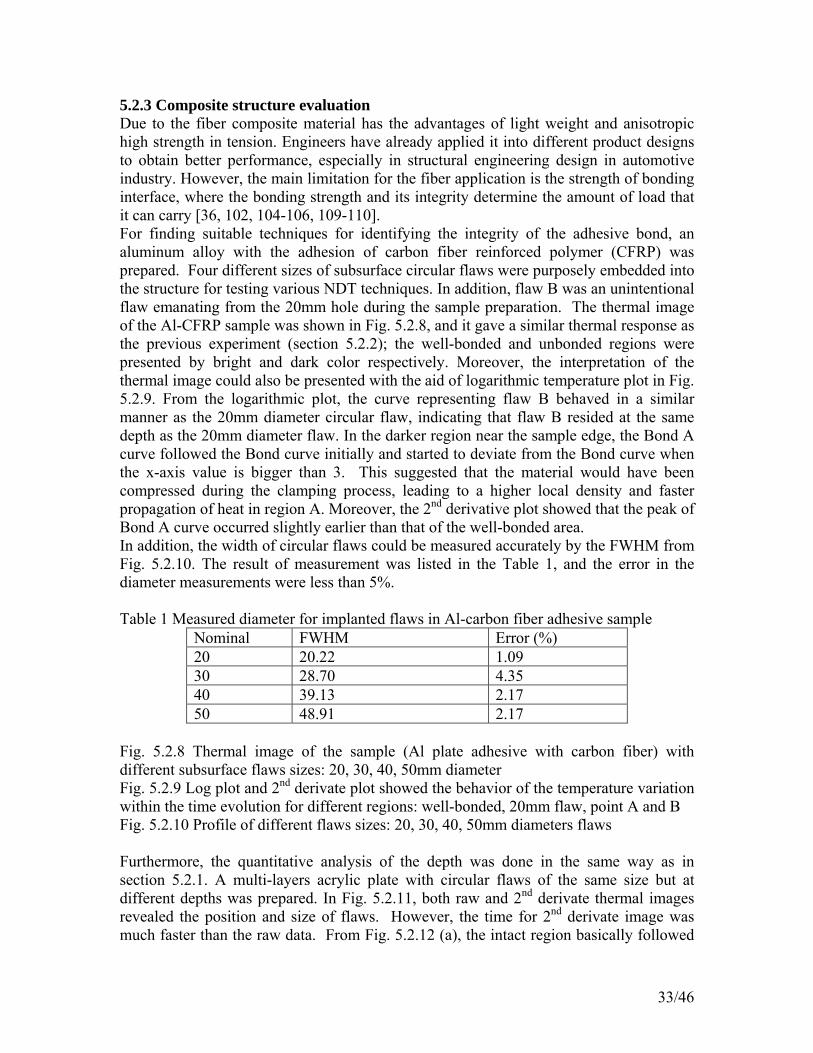
5.2.3 Composite structure evaluation Due to the fiber composite material has the advantages of light weight and anisotropic high strength in tension. Engineers have already applied it into different product designs to obtain better performance, especially in structural engineering design in automotive industry. However, the main limitation for the fiber application is the strength of bonding interface, where the bonding strength and its integrity determine the amount of load that it can carry [36, 102, 104-106, 109-110]. For finding suitable techniques for identifying the integrity of the adhesive bond, an aluminum alloy with the adhesion of carbon fiber reinforced polymer (CFRP) was prepared. Four different sizes of subsurface circular flaws were purposely embedded into the structure for testing various NDT techniques. In addition, flaw B was an unintentional flaw emanating from the 20mm hole during the sample preparation. The thermal image of the Al-CFRP sample was shown in Fig. 5.2.8, and it gave a similar thermal response as the previous experiment (section 5.2.2); the well-bonded and unbonded regions were presented by bright and dark color respectively. Moreover, the interpretation of the thermal image could also be presented with the aid of logarithmic temperature plot in Fig. 5.2.9. From the logarithmic plot, the curve representing flaw B behaved in a similar manner as the 20mm diameter circular flaw, indicating that flaw B resided at the same depth as the 20mm diameter flaw. In the darker region near the sample edge, the Bond A curve followed the Bond curve initially and started to deviate from the Bond curve when the x-axis value is bigger than 3. This suggested that the material would have been compressed during the clamping process, leading to a higher local density and faster propagation of heat in region A. Moreover, the 2nd derivative plot showed that the peak of Bond A curve occurred slightly earlier than that of the well-bonded area. In addition, the width of circular flaws could be measured accurately by the FWHM from Fig. 5.2.10. The result of measurement was listed in the Table 1, and the error in the diameter measurements were less than 5%. Table 1 Measured diameter for implanted flaws in Al-carbon fiber adhesive sample
Nominal FWHM Error (%) 20 20.22 1.09 30 28.70 4.35 40 39.13 2.17 50 48.91 2.17
Fig. 5.2.8 Thermal image of the sample (Al plate adhesive with carbon fiber) with different subsurface flaws sizes: 20, 30, 40, 50mm diameter Fig. 5.2.9 Log plot and 2nd derivate plot showed the behavior of the temperature variation within the time evolution for different regions: well-bonded, 20mm flaw, point A and B Fig. 5.2.10 Profile of different flaws sizes: 20, 30, 40, 50mm diameters flaws Furthermore, the quantitative analysis of the depth was done in the same way as in section 5.2.1. A multi-layers acrylic plate with circular flaws of the same size but at different depths was prepared. In Fig. 5.2.11, both raw and 2nd derivate thermal images revealed the position and size of flaws. However, the time for 2nd derivate image was much faster than the raw data. From Fig. 5.2.12 (a), the intact region basically followed
33/46
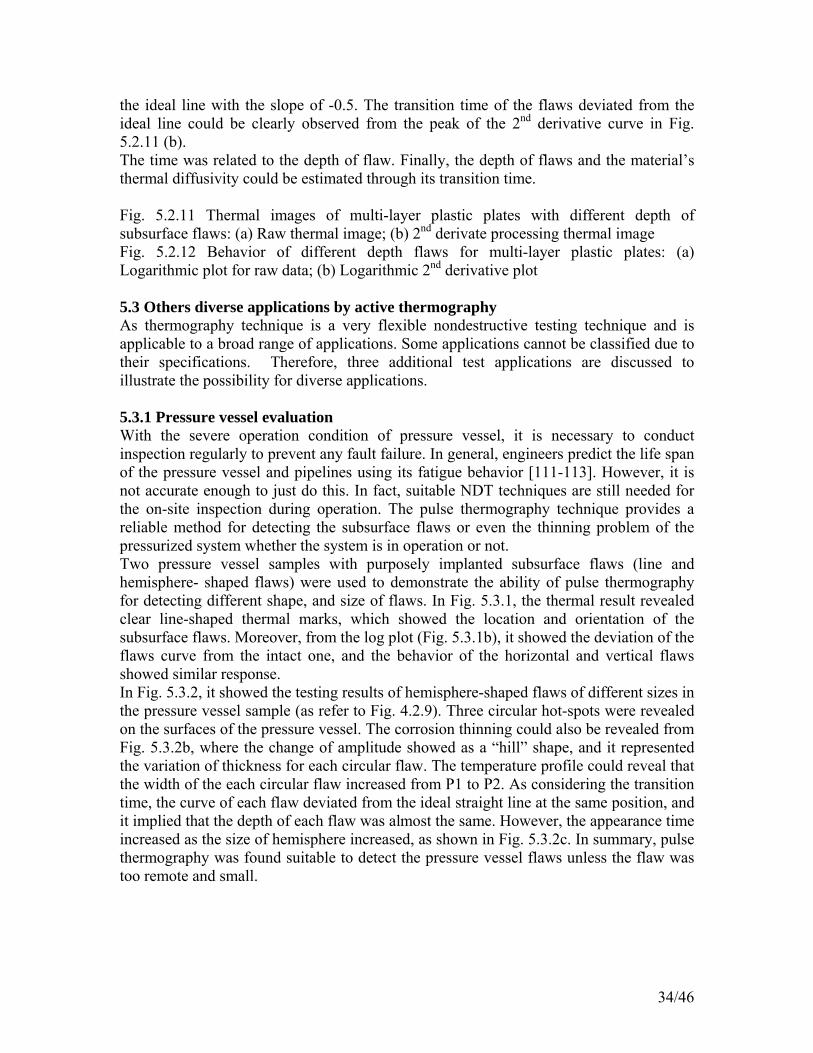
the ideal line with the slope of -0.5. The transition time of the flaws deviated from the ideal line could be clearly observed from the peak of the 2nd derivative curve in Fig. 5.2.11 (b). The time was related to the depth of flaw. Finally, the depth of flaws and the material’s thermal diffusivity could be estimated through its transition time. Fig. 5.2.11 Thermal images of multi-layer plastic plates with different depth of subsurface flaws: (a) Raw thermal image; (b) 2nd derivate processing thermal image Fig. 5.2.12 Behavior of different depth flaws for multi-layer plastic plates: (a) Logarithmic plot for raw data; (b) Logarithmic 2nd derivative plot 5.3 Others diverse applications by active thermography As thermography technique is a very flexible nondestructive testing technique and is applicable to a broad range of applications. Some applications cannot be classified due to their specifications. Therefore, three additional test applications are discussed to illustrate the possibility for diverse applications. 5.3.1 Pressure vessel evaluation With the severe operation condition of pressure vessel, it is necessary to conduct inspection regularly to prevent any fault failure. In general, engineers predict the life span of the pressure vessel and pipelines using its fatigue behavior [111-113]. However, it is not accurate enough to just do this. In fact, suitable NDT techniques are still needed for the on-site inspection during operation. The pulse thermography technique provides a reliable method for detecting the subsurface flaws or even the thinning problem of the pressurized system whether the system is in operation or not. Two pressure vessel samples with purposely implanted subsurface flaws (line and hemisphere- shaped flaws) were used to demonstrate the ability of pulse thermography for detecting different shape, and size of flaws. In Fig. 5.3.1, the thermal result revealed clear line-shaped thermal marks, which showed the location and orientation of the subsurface flaws. Moreover, from the log plot (Fig. 5.3.1b), it showed the deviation of the flaws curve from the intact one, and the behavior of the horizontal and vertical flaws showed similar response. In Fig. 5.3.2, it showed the testing results of hemisphere-shaped flaws of different sizes in the pressure vessel sample (as refer to Fig. 4.2.9). Three circular hot-spots were revealed on the surfaces of the pressure vessel. The corrosion thinning could also be revealed from Fig. 5.3.2b, where the change of amplitude showed as a “hill” shape, and it represented the variation of thickness for each circular flaw. The temperature profile could reveal that the width of the each circular flaw increased from P1 to P2. As considering the transition time, the curve of each flaw deviated from the ideal straight line at the same position, and it implied that the depth of each flaw was almost the same. However, the appearance time increased as the size of hemisphere increased, as shown in Fig. 5.3.2c. In summary, pulse thermography was found suitable to detect the pressure vessel flaws unless the flaw was too remote and small.
34/46
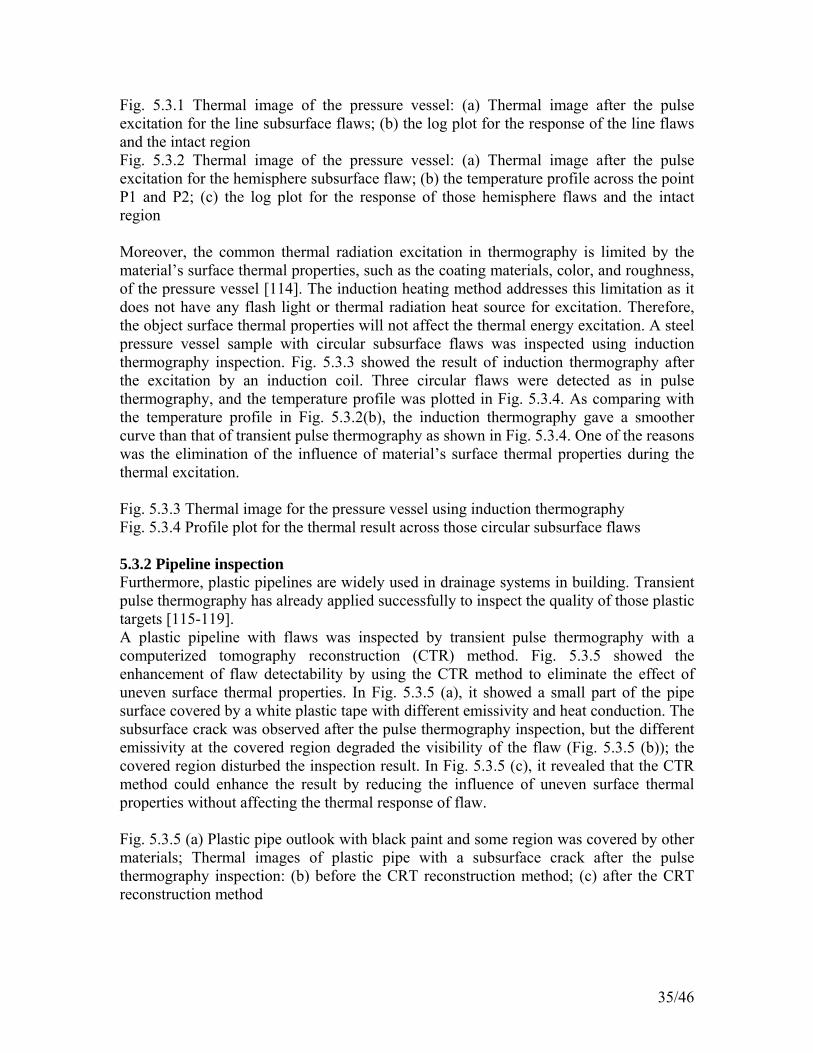
Fig. 5.3.1 Thermal image of the pressure vessel: (a) Thermal image after the pulse excitation for the line subsurface flaws; (b) the log plot for the response of the line flaws and the intact region Fig. 5.3.2 Thermal image of the pressure vessel: (a) Thermal image after the pulse excitation for the hemisphere subsurface flaw; (b) the temperature profile across the point P1 and P2; (c) the log plot for the response of those hemisphere flaws and the intact region Moreover, the common thermal radiation excitation in thermography is limited by the material’s surface thermal properties, such as the coating materials, color, and roughness, of the pressure vessel [114]. The induction heating method addresses this limitation as it does not have any flash light or thermal radiation heat source for excitation. Therefore, the object surface thermal properties will not affect the thermal energy excitation. A steel pressure vessel sample with circular subsurface flaws was inspected using induction thermography inspection. Fig. 5.3.3 showed the result of induction thermography after the excitation by an induction coil. Three circular flaws were detected as in pulse thermography, and the temperature profile was plotted in Fig. 5.3.4. As comparing with the temperature profile in Fig. 5.3.2(b), the induction thermography gave a smoother curve than that of transient pulse thermography as shown in Fig. 5.3.4. One of the reasons was the elimination of the influence of material’s surface thermal properties during the thermal excitation. Fig. 5.3.3 Thermal image for the pressure vessel using induction thermography Fig. 5.3.4 Profile plot for the thermal result across those circular subsurface flaws 5.3.2 Pipeline inspection Furthermore, plastic pipelines are widely used in drainage systems in building. Transient pulse thermography has already applied successfully to inspect the quality of those plastic targets [115-119]. A plastic pipeline with flaws was inspected by transient pulse thermography with a computerized tomography reconstruction (CTR) method. Fig. 5.3.5 showed the enhancement of flaw detectability by using the CTR method to eliminate the effect of uneven surface thermal properties. In Fig. 5.3.5 (a), it showed a small part of the pipe surface covered by a white plastic tape with different emissivity and heat conduction. The subsurface crack was observed after the pulse thermography inspection, but the different emissivity at the covered region degraded the visibility of the flaw (Fig. 5.3.5 (b)); the covered region disturbed the inspection result. In Fig. 5.3.5 (c), it revealed that the CTR method could enhance the result by reducing the influence of uneven surface thermal properties without affecting the thermal response of flaw. Fig. 5.3.5 (a) Plastic pipe outlook with black paint and some region was covered by other materials; Thermal images of plastic pipe with a subsurface crack after the pulse thermography inspection: (b) before the CRT reconstruction method; (c) after the CRT reconstruction method
35/46
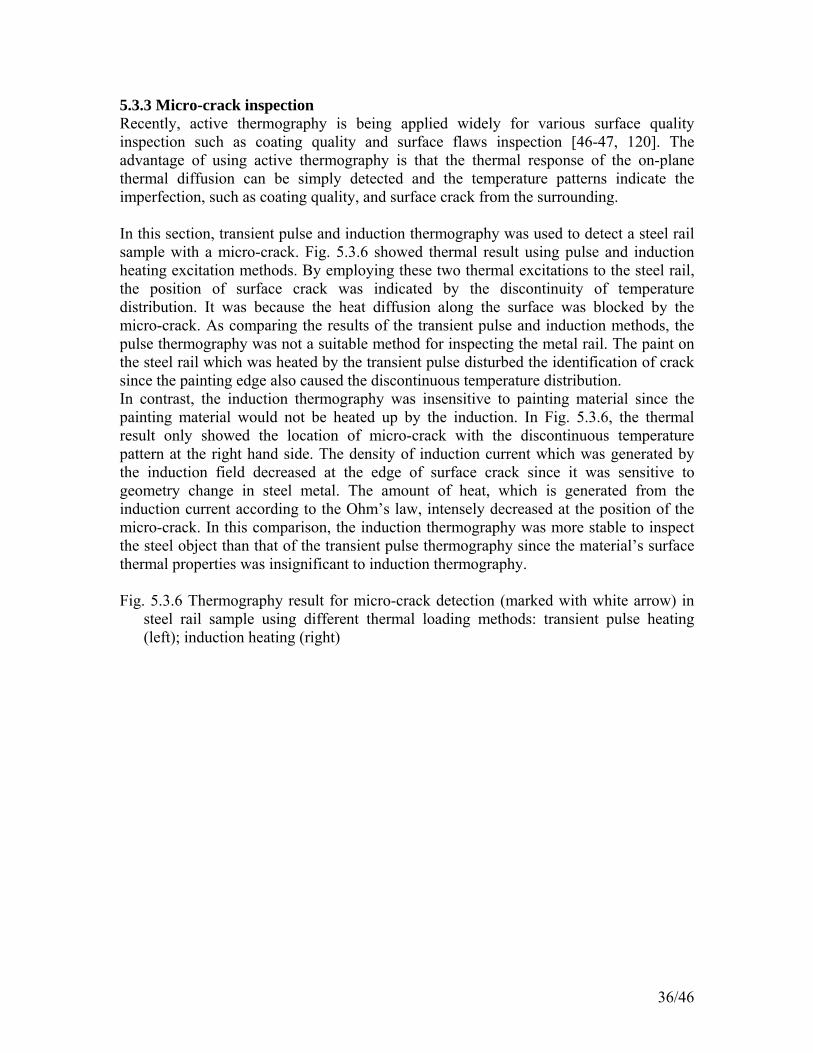
5.3.3 Micro-crack inspection Recently, active thermography is being applied widely for various surface quality inspection such as coating quality and surface flaws inspection [46-47, 120]. The advantage of using active thermography is that the thermal response of the on-plane thermal diffusion can be simply detected and the temperature patterns indicate the imperfection, such as coating quality, and surface crack from the surrounding. In this section, transient pulse and induction thermography was used to detect a steel rail sample with a micro-crack. Fig. 5.3.6 showed thermal result using pulse and induction heating excitation methods. By employing these two thermal excitations to the steel rail, the position of surface crack was indicated by the discontinuity of temperature distribution. It was because the heat diffusion along the surface was blocked by the micro-crack. As comparing the results of the transient pulse and induction methods, the pulse thermography was not a suitable method for inspecting the metal rail. The paint on the steel rail which was heated by the transient pulse disturbed the identification of crack since the painting edge also caused the discontinuous temperature distribution. In contrast, the induction thermography was insensitive to painting material since the painting material would not be heated up by the induction. In Fig. 5.3.6, the thermal result only showed the location of micro-crack with the discontinuous temperature pattern at the right hand side. The density of induction current which was generated by the induction field decreased at the edge of surface crack since it was sensitive to geometry change in steel metal. The amount of heat, which is generated from the induction current according to the Ohm’s law, intensely decreased at the position of the micro-crack. In this comparison, the induction thermography was more stable to inspect the steel object than that of the transient pulse thermography since the material’s surface thermal properties was insignificant to induction thermography. Fig. 5.3.6 Thermography result for micro-crack detection (marked with white arrow) in
steel rail sample using different thermal loading methods: transient pulse heating (left); induction heating (right)
36/46
6. Comparison of Shearography and Active Thermography Being the nondestructive testing techniques, both digital shearography and active thermography succeed to detect all of the embedded and unexpected flaws. Each technique has its own particular limitations, and these limitations are related to the fundamental mechanism of the technique. Table 2 shows the summary of each technique’s characteristics. Shearography enjoys the desirable features of non-contact, full-field, no reference beam required, and extremely stable testing environment. These characteristics of the technique allow a direct assessment of structural integrity. In particular, if excitation stresses similar to the service stresses can be used, defects that are detrimental to the service life of the object will be revealed, and cosmetic flaws can be ignored. Higher sensitivity of deformation detection can be achieved by using shorter wavelengths of the laser source (e.g. green light). Moreover, the shearography has the fundamental advantage in vibration isolation as compared with holography since it measures and reveals the result of the displacement variation. Unfortunately, shearography still suffers a severe drawback in the limitation of tolerance to rigid body motion. Therefore it is important to develop loading methods which will not introduce excessive rigid-body movement between the test sample and the measurement system; this movement can cause the de-correlation of speckle patterns and the deterioration of the fringe visibility, and thus reduces the flaw detectability [121-122]. To reduce such problem, an effective method is to attach the shearography inspection system to the test object. Active thermography detects infrared radiation from the test object to measure the surface temperature response to the thermal excitation. This technique can be employed in various kinds of materials and environment, and the thermal image is generally easier to interpret as compared with shearographic image. However, its fundamental mechanism for detecting flaws is heat conduction, i.e., diffusion of thermal energy from the sample’s surface to its interior. This mechanism affects the minimum detectable defect size [39-41], which is determined by the ratio of the defect’s diameter to its depth, as well as by the relative difference between the thermal diffusivity of the defect and the surrounding host material. Besides, the variation of emissivity on the surface can be misinterpreted as deflects. Therefore, the data acquisition process in thermography is essential. It requires forethought with regard to acquisition period and frame rate due to different material properties, while the data acquisition of shearography needs to co-operate with the speed of loading methods. However, those aforementioned limitations in thermography have been overcome by signal processing and dedicated hardware [123]. Direct comparisons of image results from the two techniques are presented in Fig. 7.1. Both techniques were able to detect all subsurface flaws in the test samples. It appears that thermography is able to extract more information from Sample A, such as inclusions and the deboned region. In Sample B, both techniques can identify the locations of bonded and debonded region in the space frame structure. In sample C, the depth of the subsurface defect can be determined by the density of fringes and the gray intensity corresponding to shearography and active thermography technique. Thermography was
37/46
able to detect the unintentional defect, and reveal more clearly in samples D and E than shearography, while shearography provides significantly sharper image for the bonding integrity information in Sample A and B than the thermography. Both digital shearography and active thermography have their advantages and disadvantages. Therefore, it is difficult to determine which technique is more valuable, and it mainly depends on the inspection criteria for the applications. Both of them have ability to provide qualitative and quantitative analysis in material characterizations, such as depth, or thickness measurement. Table 2 Characteristics of digital shearography and active thermography Digital Shearography Active Thermography Full field Full field Non-contact inspection Non-contact inspection Measures mechanical deformation Measures thermal radiation Loading methods: Partial vacuum pressure, acoustic wave, and thermal shock excitation
Loading methods: Long heating pulse, transient pulse excitation, and induction heating
Capture the speckle patterns for analysis Capture a sequence of thermal images for analysis
Fringe pattern distribution in shearography image
Anomalous “hot-spot” deviated from the ideal flawless region, and derivative value in TSR value
Qualitative and quantitative analysis through density of fringe pattern
Qualitative and quantitative analysis through temperature distribution and its transition time
Rigid-body movement influence Material’s surface thermal properties influence
Indication detected by contrast with flaw-free background
Indication detected by temperature contrast with the numerical value of derivative
38/46
8. Conclusion A review of shearography and active thermography NDT techniques is given in this paper. In order to test the performance of both techniques, a number of experiments were set up to resemble real-life industrial NDT applications. Artificial flaws were deliberately implanted into the test samples. Both techniques were capable of detecting all the implanted as well as unintentional flaws. Also, during the experiments, no effort had been applied to optimize the experimental setup for each test case. As such, the actual performances of both techniques would be better than those reported in this paper. So, both techniques have proved themselves to be more than just laboratory demonstrations but practical enough for many different real-life applications in industries. The key factor for applying the techniques in any new application is whether a suitable excitation method can be found. For example, for inspecting subsurface cracks in PVC pipe using shearography, the advanced thermal shock loading method was found suitable to address the difficulty in providing excitation for large objects without causing any excessive rigid-body movement to the entire structure. Similarly, for inspecting steel rail using thermography technique, the induction method was found suitable since no thermal radiation heat source was needed and hence overcome the adverse effect of uneven surface thermal properties. With the continuous advancement in material technologies and processes such as composite materials and their related manufacturing processes, it is envisaged that both shearography and active thermography NDT technique would become more and more popular since the traditional NDT techniques such as ultrasonic based NDT methods were found ineffective and time consuming for inspecting some of the new materials such as composite materials. Acknowledgement The work described in this paper has been supported by the grants CityU 1/01C and CityU 1196/02E of the Research Grants Council of Hong Kong, China. References [1] M. Allgaier, S. Ness, P. McIntire, P. Moore, Nondestructive testing handbook: Visual and optical testing, vol. 8, ASNT, 1993. [2] V. V. Nagarkar, S. R Miller, et al, A high-resolution, high speed CT/radiography system for NDT of adhesive bonded composites, Development in X-Ray Tomography III, Proceeding of SPIE 4503 (2002) 265-273 [3] M. Michaloudaki, E. Lehmann, D. Kosteas, Neutron imaging as tool for the nondestructive evaluation of adhesive joints in aluminum, International Journal of Adhesion and Adhesives 25 (2005) 257-267 [4] D. Lovejoy, Magnetic particle inspection: a practical guide, Chapman & Hall, New York, 1993. [5] S. Udpa, P. Moore, Nondestructive testing handbook: Electromagnetic testing, vol. 5, ASNT, 2002. [6] A. Birks, R. Green, P. McIntire, Nondestructive testing handbook: Ultrasonic testing, vol. 7, ASNT, 1991.
39/46
[7] R. Miller, P. McIntire, Nondestructive testing handbook: Acoustic emission testing, vol. 5, ASNT, 1987. [8] X.P. Maldague, Nondestructive evaluation of materials by infrared thermography, Springer-Verlag, 1993. [9] Y. Y. Hung, Shearography for Non-destructive Evaluation of Composite Structures, Optics and lasers in Engineering 24 (1996) 161-182 [10] Y. Y. Hung, Application of digital shearography for testing of composite structures, Composites Part B: Engineering 30 (1999) 765-773 [11] Hung Y.Y., Luo W.D., Lin L., Shang H.M., NDT of joined surfaces using digital time-integrated shearography with multiple-frequency sweep, Optics and lasers in Engineering 33 (2000) 369-382 [12] Y. Y. Hung, W. D. Luo, L. Lin, H. M. Shang, Evaluating the soundness of bonding using Shearography, Composite Structures 50 (2000) 353-362 [13] Riichi Murayama, Kazuo Fujisawa, Hidekazu Fukuoka and Masahiko Hirao, Development of an on-line evaluation system of formability in cold-rolled steel sheets using electromagnetic acoustic transducers (EMATs), NDT & E International, 29 (3) (1996) 141-146 [14] Riichi Murayama, Kazuo Fujisawa, Masahiko Hirao and Hidekazu Fukuoka, Non-destructive evaluation of formability of zinc-coated steel sheets using electromagnetic acoustic transducer, NDT & E International, 30 (6) (1997) 377-382 [15] T. D’Orazio, M. Leo, A. Distante, C. Guaragnella, V. Pianese and G. Cavaccini, Automatic ultrasonic inspection for internal defect detection in composite materials, NDT & E International, 41 (2) (2008) 145-154 [16] Ogawa Kazuhiro, Minkov Dorian, Shoji Tetsuo, Sato Minoru and Hashimoto Hideo, NDE of degradation of thermal barrier coating by means of impedance spectroscopy, NDT & E International, 32 (3) (1999) 177-185 [17] E.A.Fuchs, P. Hughett, D.C. MacMillan, Quantitative infrared thermography for measurement of temperature- dependent material properties, Experimental Techniques, 12 (9) (1988) 18-21 [18] Y.Y. Hung, Shearography: a new optical method for strain measurement and nondestructive testing, Opt. Eng. 21 (3) (1982) 391-395 [19] Y.Y. Hung, J.D. Hovanesian, Fast detection of residual stresses in an industrial environment by thermoplastic –based shearography, in: Proceedings of the 1990 SEM Spring Conference on Experimental Mechanics, Albuquerque, New Mexico, June 4-6 (1990) 769-775 [20] Y.Y. Hung, Nondestructive Evaluation by Electronic Shearography, Presented at the 16th Symposium on Nondestructive Evaluation, San Antonio, Texas, April 21–23 (1987) also, Apparatus and Method for Electronic Analysis of Test Object. US Patent 4,887,899, 1989. [21] Y.Y. Hung, H.P. Ho, Shearography: An optical measurement technique and applications, Materials Science and Engineering R 49 (2005) 61-87 [22] J. W. Goodman, “Statistical properties of laser speckle patterns in laser speckle and related phenomena”, Dainty J.C., ed., Springer-Verlag, New York, (1975) 9-75 [23] Y.Y. Hung, “A speckle-shearing interferometer: a tool for measuring derivatives of surface displacement”, Optical Communications 11 (2) (1974) 132–135
40/46
[24] J.A. Leendertz, J.N. Butters, “An image shearing speckle pattern interferometer for measuring bending moments”, Journal of Physics: E Scientific Instrument 6 (11) (1973) 1107–1110 [25] Y.Y Hung, H.M. Shang, L. Yang, “Unified approach for holography and shearography in surface deformation measurement and nondestructive testing”, Optical Engineering 42 (5) (2000) 1197–1207 [26] K. Creath, Phase-measurement technique for nondestructive testing, in: Proceeding of SEM Conference on Hologram Interferometry and Speckle Metrology, Baltimore, Maryland, November 5-8 (1990) page 473-478 [27] Ghiglia C. D., Pritt D. M., Two-Dimensional Phase Unwrapping: Theory, Algorithm, and Software, John Wiley &Sons, NY, 1998. [28] Y.Y. Hung, W.D. Luo, H.M. Shang, NDT of joined surfaces using digital time-integrated shearography with multiple-frequency sweep, Optics and Lasers in Engineering 33 (2000) 369-382 [29] Y.Y. Hung, W.D. Luo, L. Lin, H.M. Shang, Evaluating the soundness of bonding using shearography, Composite Structures 50 (2000) 353-362 [30] W. Steinchen, L.X. Yang, Digital shearography: Theory and application of digital speckle shearing interferometry, Chapter 8, SPIE Press, Washington, (2003) 203-212 [31] F. Lanza di Scalea, J.B. Spicer, R.E.Green, Electronic Shearography with Thermal Loading for Detecting Debonds in Thick Polyurethane/Steel Panels for Marine Applications, Research in Nondestructive Evaluation 12 (1) (2000) 43-51 [32] J. L. Champion, J. B. Spicer, R. Osiander, J. W. M. Spicer, Shearographic Monitoring of Time-Dependent Thermoelastic Deformations, Research in Nondestructive Evaluation 13 (4) (2001) 173-187 [33] N. Noda, R.B. Hetnarski, Y. Tanigawa, “Thermal Stresses, 2nd Edition”, Taylor & Francis, NY, 2003 [34] X. P. Maldague, Theory and Practice of Infrared Technology for Nondestructive Testing, Wiley, N.Y., 2001. [35] Ch. Maierhofer, A. Brink, M. Röllig, H. Wiggenhauser, Quantitative impulse-thermography as non-destructive testing method in civil engineering – Experimental results and numerical simulations, Construction and Building Materials 19 (2005) 731–737 [36] Y.Y. Hung, Y.S. Chen, S.P. Ng, Review and comparison of shearography and pulse thermography for adhesive bond, Opt. Eng. 46(5) (May 2007) pp.051007-1– pp.051007-16 [37] W.N. Reynolds, Thermographic Methods Applied to Industrial Materials, Can. J. Phys., vol. 64 (1986) 1150-1154 [38] J.M. Mile, W.N. Reynolds, The Non-Destructive Evaluation of Composites and other Materials by Thermal Pulse Video Thermography, Proc. SPIE, Thermosense VII, no. 520 (1984) 119-122 [39] D.P. Almond, S.K. Lau, Defect Sizing by Transient Thermography I: An analytical Treatment, J. Phys., D: Appl. Phys., vol. 27 (1994) 1063-1069 [40] D.P. Almond, S.K. Lau, Edge Effects and a Method of Defect Sizing by Transient Thermography, Appl. Phys. Lett., vol. 62, no. 25 (1993) 3369-3371 [41] M.B. Seintey, D.P. Almond, Defect Sizing by Transient Thermography II: A Numerical Treatment, J. Phys. D: Appl. Phys., vol. 28 (1995) 2539-2546
41/46
[42] H.S. Carslaw, J.C. Jaeger, Conduction of Heat in Solids, Clarendon Press, Oxford, 1986. [43] W.J. Parker, R.J. Jenkins, C.P. Butler, G.L. Abbott, Flash Method of Determining Thermal Diffusivity, Heat Capacity, and Thermal Conductivity, J. Appl. Phys., vol. 32, no. 9 (1961) 1679-1684 [44] P. Robert, Brady, Manohar R. Kulkarni, Determination of thermal diffusivity distribution for three types of materials by transient thermography, NDT&E international, vol.29, no. 4 (1996) 205-211 [45] Z.J. Yang, J.R. Hull, Magnetic fields of cylindrical coils, Int. J. Apply Electromagnetic Mech., vol. 10 (1999) 351-367 [46] N.Tsopelas, N.J. Siakavellas, Performance of circular and square coils in electromagnetic–thermal non-destructive inspection, NDT&E, vol. 40 (2006) 12-28 [47] N.Tsopelas, N.J. Siakavellas, Electromagnetic-thermal NDT in thin conducting plates, NDT&E 39 (2006) 391-399 [48] S.M. Shepard, Temporal noise reduction, compression and analysis of the thermographic image data sequences, U.S. Patent No. 6,516,084 (2003) [49] S.M. Shepard, Advances in pulsed thermography, In Proc. SPIE 4360 (2001) 511-515 [50] S.M. Shepard, J.R. Lhota, B.A. Rubadeux, D. Wang, and T. Ahmed, Reconstruction and enhancement of active thermographic image sequences, Opt. Eng. 42(5) (2003) 1337-1341 [51] W. Steinchen, L. Yang, G. Kupfer, and P. Mackel, Non-destructive testing of aerospace composite materials using digital shearography, Proceedings of the Institution of Mechanical Engineers, Part G: Journal of Aerospace Engineering 212 (1998) 21-30 [52] A. Ettemeyer, Laser shearography for inspection of pipelines, Nuclear Engineering and Design 160 (1996) 237-240 [53] T.A. Barnes, I. R. Pashby, Joining techniques for aluminum space frames used in automobiles Part II - adhesive bonding and mechanical fasteners, Journal of Material Processing Technology 99 (2000) 72-79 [54] Y.Y. Hung, D.H. Shi, Technique for rapid inspection of hermetic seals of microelectronic packages using shearography, Optical Engineering 37(5) (1998) 1406-1409 [55] A. Higgins, Adhesive bonding of aircraft structures, International Journal of Adhesion & Adhesives 20 (2000) 367-376 [56] P. Mylavarapu, E. Woldesenbet, Non-destructive characterization of bondlines in composite adhesive joints, Journal of Adhesion Science and Technology 20-7 (2006) 647-660 [57] A.M. Robinson, B.W. Drinkwater, J. Allin, Dry-coupled low-frequency ultrasonic wheel probed: application to adhesive bond inspection, NDT&E International 36 (2003) 27-36 [58] J.M. Allin, P. Cawley, M.J.S. Lowe, Adhesive disband detection of automotive components using first mode ultrasonic resonance, NDT&E International 36 (2003) 503-514 [59] F. Tong, S.K. Tso, Y.Y. Hung, Impact-acoustics-based health monitoring of tile-wall bonding integrity using principal component analysis, Journal of Sound and Vibration 249 (2006) 329-340
42/46
[60] D. Defer, J. Shen, S. Lassue, B. Duthoit, Nondestructive testing of a building wall by studying natural thermal signals, Energy and Bulding 34 (2002) 63-69 [61] O.N. Budadin, E.V. Abramov, M.A. Rodin, O.V. Lebedev, Thermal Nondestructive Testing of Buildings and Builded Constructions, Russian Journal of Nondestructive Testing 39 (5) (2003) 395-409 [62] G. Schirripa Spagnolo, D. Ambrosini, D. Paoletti, An NDT electro-optic system for mosaics investigations, Journal of Cultural Heritage 4 (2003) 369-376 [63] Audi AG, www.audi.com[64] P. Feraboli, A. Masini, Development of carbon/epoxy structural components for a high performance vehicle, Composites: Part B 35 (2004) 323-330 [65] A. Nanni, Fiber-reinforced-plastic (FRP) Reinforcement for Concrete Structures: properties and applications, Elsevier (1993) [66] S.F. Brena, M.A. Steves, Increasing the flexural capacity of an existing reinforced concrete bridge in Texas using CFRP composites, in Rizkalla S.and Nanni A., ed., Field application of FRP reinforcement: case studies, American Concrete Institute SP-215, Michigan, USA (2003) 203 - 218 [67] B. Akuthota, D. Hughes, R. Zoughi, J. Myers, A. Nanni, Near-field microwave detection of disband in CFRP composites used for strengthening cement-based structures and disband repair verification, Journal of Materials in Civil Engineering 16 (6) (2004) 540-546, ASCE [68] K. Soudki, E. El-Salakawy, B. Craig, Behavior of CFRP strengthened reinforced concrete beams in corrosive environment, Journal of Composites for Construction 11 (3) 2007, ASCE [69] N. Ruiz-Reyes, P. Vera-Candeas, J. Curpián-Alonso, J.C. Cuevas-Martínez and J.L. Blanco-Claraco, High-resolution pursuit for detecting flaw echoes close to the material surface in ultrasonic NDT, NDT&E International 39 (2006) 487-492 [70] F. Bastianini, A.D. Tommaso, G. Pascale, Ultrasonic non-destructive assessment of bonding defects in composite structural strengthenings, Composite Structures 53 (2001) 463-467 [71] S.D. Kim, C.W. In, K.E. Cronin, H. Sohn, K. Harries, Reference-free NDT technique for debonding detection in CFRP-strengthened RC Structures, Journal of Structural Engineering 133 (8) 2007 1080-1091 [72] J.M.L. Reis, R. de Oliveira, A.J.M. Ferreira, A.T. Marques, A NDT assessment of fracture mechanics properties of fiber reinforced polymer concrete, Polymer Testing 22 (2003) 395-401 [73] L. Huang, Q.Z. Li, X.H. Song, A nondestructive testing method for crack in carbon fiber reinforced concrete with infrared thermography, Key Engineering Material 297-300 (2005) 2128-2133 [74] J.M. Levar, H.R. Hamilton III, Nondestructive evaluation of carbon fiber-reinforced polymer-concrete bond using infrared thermography, ACI Materials Journal 100 (1) 2003 63-72 [75] F. Jin, F.P. Chiang, ESPI and digital speckle correlation applied to inspection of crevice corrosion on aging aircraft, Research in Nondestructive Evaluation 10 (1998) 63-73 [76] D.G. Chakrapani In: K.A. Esakul, Editor, Handbook of Case Histories of Failure Analysis, ASM International, Metals Park, OH, 1992.
43/46
[77] I.K. Park, T.H. Kim, H.M. Kim, Y.K. Kim, Y.S. Cho, W.J. Song, Evaluation of hidden corrosion in a thin plate using non-contact guided wave technique, Key Engineering Materials 321-323 (2006) 492-496 [78] A. Demma, P. Cawley, M. Lowe, A.G. Roosenbrand, B. Pavlakovic, The reflection of guided waves from notches in pipes: a guide for interpreting corrosion measurements, NDT&E International 37 (2004) 167-180 [79] J.B. Nestleroth, R.J. Davis, Application of eddy current induced by permanent magnets for pipeline inspection, NDT&E International 40 (2007) 77-84 [80] M. Cacciola, S. Calcagno, F.C. Morabito, M. Versaci, Swarm optimization for imaging of corrosion by impedance measurement in eddy current test, IEEE Transactions on Magnetics 43 (4) (2007) 1853-1856 [81] J. Gryzagoridis, D. Findeis, D.R. Schneider, The Impact of Optical NDE Methods in Vessel Fracture Protection, International Journal of Pressure Vessel & Piping 61 (2-3) (1995) 457-469 [82] K.S. Kim, K.S. Kang, Y.J. Kang, S.K. Cheong, Analysis of an internal crack of pressure pipeline using ESPI and shearography, Optics & Laser Technology 35 (2003) 639-643 [83] T.E. Carlsson, A. Wei, Phase evaluation of speckle pattern during continuous deformation by using a phase-shifting speckle interferometry, Applied Optics 39(16) (2000) 2628–2636 [84] S.P. Ng, Development of a novel stressing method by means of thermal shock for non-destructive testing of large structures using shearography, Master of Philosophy thesis, (2007) June, City University of Hong Kong [85] Y. Li, J. Wilson, G.Y. Tian, Experiment and simulation study of 3D magnetic field sensing for magnetic flux leakage defect characterization, NDT&E International 40 (2007) 179-184 [86] V. Babbar, L. Clapham, Residual magnetic flux leakage: a possible tool for studying pipeline defects, Journal of Nondestructive Evaluation 22(4) (2003) 117-125 [87] C.R. Coughlin, L. Clapham, D.L. Atherton, Effect of stress on MFL response from elongated corrosion pits in pipeline steel, NDT&E International 33 (2000) 181-188 [88] M.T. Ghasr, B. Carroll, S. Kharkovsky, R. Austin, R. Zoughi, Millimeter-wave differential probe for nondestructive detection of corrosion precursor pitting, IEEE Transaction on Instrumentation and Measurement 55 (5) (2006) 1620-1627 [89] L. Clifford, L. Paggie, Woman fighting for life after blast, South China Morning Post, Hong Kong, 12-April-2006, www.scmp.com.hk [90] R. Mohanty, J. Lee, Hermetis Packaging Systems: Adhesive and Getter, Gilleo K., ed., “Area Array Packaging Materials – Chapter 2”, McGraw-Hill, New York, (2004) 25-47 [91] D.M. McCann, M.C. Forde, Review of NDT methods in the assessment of concrete and masonry structures, NDT&E, vol.34 (2001) 71-84 [92] Ch. Maierhofer, R. Arndt, M. Röllig, C. Rieck, A. Walther, H. Scheel, B. Hillemeier, Application of impulse-thermography for non-destructive assessment of concrete structures, Cement & Concrete Composites, vol. 28 (2006) 393-401 [93] ASTM Standard D4788-88 (reapproved 1997): Standard test method for detecting delaminations in bridge decks using infrared thermography.
44/46
[94] O. Robert, W.M. Spicer Jane, Time-resolved infrared radiometry with step heating: A review, Rev. Gén. Therm., vol. 37 (1998) 680-692 [95] John M. Levar, H.R. Hamilton III, Nondestructive Evaluation of Carbon Fiber-Rienforced Polymer-Concrete Bond Using Infrared Thermography, ACI materials journal, vol. 100, no.1 (Jan-Feb 2003) 63-72 [96] Osman Hag-Elsafi, Sreenivas Alampalli, Jonathan Kunin, In-service evaluation of a reinforced concrete T-beam bridge FRP strengthening system, Composite Structures, vol. 64 (2004) 179-188 [97] Steve E. Watkins, James W. Fonda, Antonio Nanni, Assessment of an instrumented reinforced concrete bridge with fiber-reinforced polymer strengthening, Optical Engineering, vol. 46, no. 5 (2007) 051010-1 to 051010-10 [98]Vincenzo Barrilea, Raffaele Pucinotti, Application of radar technology to reinforced concrete structures: a case study, NDT&E International, vol. 38 (2005) 596-604 [99] Johannes Hugenschmidt, Roman Mastrangelo, GPR inspection of concrete bridges, Cement & Concrete Composites, vol. 28 (2006) 384-392 [100] Ming-Te Liang, Po-Jen Su, Detection of the corrosion damage of rebar in concrete using impact-echo method, Cement and Concrete Research, vol. 31 (2001) 1427-1436 [101] N.P. Avdelidis, B.C. Hawtin, D.P. Almond, Transient thermography in the assessment of defects of aircraft composites, NDT&E international, vol. 36 (2003) 433-439 [102] D. Bates, G. Smith, D. Lu, J. Hewitt, Rapid thermal non-destructive testing of aircraft components, Composites: part B, vol. 31, (2004) 175-185. [103] N.P. Avdelidis, D.P. Almond, A. Dobbinson, B.C. Hawtin C. Ibarra-Castanedod, X. Maldague, Aircraft composites assessment by means of transient thermal NDT, progress in aerospace sciences, vol. 40 (2004) 143-162 [104] Carosena Meola, Giovanni Maria Carlomagno, Application of infrared thermography to adhesion science, J. Adhesion Sci. Technol. Vol. 20, no. 7 (2006) 589-632 [105] J.A. Schroeder, T. Ahmed, B. Chaudhry, S. Shepard, Non-destructive testing of structural composites and adhesively bonded composite joints: pulsed thermography, Composites part A, vol. 33 (2002) 1511-1517 [106] Carosena Meola, Giovanni Maria Carlomagno, Giuseppe Giorleo, Using infrared thermography to analyze substrate and adhesive effects in bonded structures, J. Adhesion Sci. Technol. Vol. 18, no. 6 (2004) 617-634 [107] N.P. Avdelidis, D.P. Almond, Through skin assessment of aircraft structures using pulsed thermography, NDT&E international, vol. 37 (2004) 353-359 [108] N.P. Avdelidis, A. Moropoulou, Z.P. Marioli Riga, The technology of composite patches and their structural reliability inspection using infrared imaging, Progress in Aerospace Sciences, vol. 39 (2003) 317-328 [109] R. J. Ball, D. P. Almond, The detection and measurement of impact damage in thick carbon fibre reinforced laminates by transient thermography, NDT&E International, vol. 31, no. 3 (1998) 165-173 [110] Carosena Meola, Giovanni M. Carlomagno, Antonino Squillace, Giuseppe Giorleo, The use of infrared thermography for nondestructive evaluation of joints, Infrared Physics & Technology, vol. 46, Issues 1-2 (2004) 93-99
45/46
[111] P.K. Liaw, H. Wang, L. Jiang, B. Yang, J.Y. Huang, R.C. Kuo, J.G. Huang, Thermographic detection of fatigue damage of pressure vessel steels at 1,000 Hz and 20 Hz, Scripta mater., vol. 42 (2000) 389-395 [112] B. Yang, P.K. Liaw, H. Wang, L. Jiang, J.Y. Huang, R.C. Kuo, J.G. Huang, Thermographic investigation of the fatigue behavior of reactor pressure vessel steels, Materials Science and Engineering A, vol. 314 (2001) 131-139 [113] B. Yang, P.K. Liaw, M. Morrison, C.T. Liu, R.A. Buchanan, J.Y. Huang, R.C. Kuo, J.G. Huang, D.E. Fielden, Temperature evolution during fatigue damage, Intermetallics, vol. 13 (2005) 419-428 [114] J.Bruce Nestleroth, Richard J. Davis, Application of eddy currents induced by permanent magnets for pipeline inspection, NDT&E International, vol. 40 (2007) 77-84 [115] Carlo Santulli, Impact damage characterization of thermoplastic matrix composites using transmission transient thermography, Nondestructive testing and evaluation, vol. 19, no. 3 (2003) 79-90 [116] Carosena Meola, Giovanni Maria Carlomagno,Luca Giorleo, Geometrical limitations to detection of defects in composites by means of infrared thermography, J. Nondestructive Evaluation, vol. 23, no. 4 (2004) 125-132 [117] M. Omar, M. Hassan, K. Donohue, K. Saito, R. Alloo, Infrared thermography for inspecting the adhesion integrity of plastic welded joints, NDT&E international, vol.39 (2006) 1-7 [118] D.L. Balageas, J.C. Krapez, P. Cielo, Pulsed photothermal modeling of layered materials, J. Appl. Phys. 59(2) (1986) 348-357 [119] Giuseppe Giorleo, Carosena Meola, Comparison between pulse and modulated thermography in glass-epoxy laminates, NDT&E international, vol. 35 (2002) 287-292 [120] S. Marinetti, D. Robba, F. Cernuschi, P.G. Bison, E. Grinzato, Thermographic inspection of TBC coated gas turbine blades: Discrimination between coating over-thicknesses and adhesion defects, Infrared Physics & Technology, vol. 49 (2007) 281-285 [121] M.O. Petersen, Decorrelation and fringe visibility: on the limiting behaviour of various electronic speckle pattern correlation interferometers, J. Opt. Soc. Am. A 8 (7) (1991) 1082-1089 [122] H.T. Yura, S.G. Hanson, T.P. Grum, Speckle statistics and interferometric decorrelation effects in complex ABCD optical systems, J. Opt. Soc. Am. A 10 (2) (1993) 316-323 [123] X. Maldague, Advances in signal processing for nondestructive evaluation of materials, Kluwer Academic Publisher, 1994.
46/46