mia evaluation of material defects detected using espi and shearography
TRANSCRIPT
MIA Evaluation of Material Defects Detected using ESPI and Shearography
D M Findeis and J Gryzagoridis Mech. Eng. Dept
University of Cape Town
ABSTRACT
Most manufactured components have to undergo routine maintenance inspections. This
paper presents two non-contacting NDE techniques known as Electronic Speckle Pattern
Interferometry (ESPI) and Shearography which, through rapid inspection, produce real
time qualitative results. A third technique known as Mechanical Impedance Analysis
(MIA), which evaluates an object’s vibrational response to an audible signal, is also
outlined. The authors show how MIA can be used to supplement ESPI and
Shearography by quantifying flaws initially detected by the optical interference
techniques. The principles of the optical NDE methods are described as applied using a
portable NDT unit. Samples are inspected and defects are located in the fringe patterns
obtained. MIA is applied to the samples in the vicinity of the suspected flaws and a clear
outline of the boundary of the defect in obtained. Discussion of the advantages and
limitations of ESPI and Shearography as well as the benefits of MIA conclude this paper.
Keywords: Interferometry, Shearography, composite pipes and vessels, non-destructive
evaluation, mechanical impedance analysis, defects, flaws
NOMENCLATURE A , amplitude of the laser light I , image intensity θ , phase of the laser light ∆φ , change in phase of the laser light Subscripts: a , first image b , second image r , resultant image x , adjacent points of interest δx , magnitude of object shear
INTRODUCTION
Almost all of today’s manufactured components, which are used in industrial and domestic
applications, undergo some form of inspection. This mostly is in the form of prescribed quality

control inspections during the manufacturing process and routine maintenance inspections
[3,4,5]. In industrial applications such as piping networks where on site assembly is required, it is
good practice to conduct a final inspection prior to commissioning of the equipment. Non
destructive Evaluation (NDE) methods such as dye penetrants, X-Ray, ultrasound, and acoustic
emission [6] are well established methods which are widely used. Modern materials such as
glass reinforced plastics (GRP) and fibreglass and aluminium composites are a lot more difficult
to inspect using these conventional NDE methods and are only capable of detecting certain
defect aspects [6]. This is mainly due to the structure of the material or makeup of the
compostite.
INSPECTION THECHNIQUES
Two non-contacting optical interference techniques which have been used for non destructive
evaluation of composites are Electronic Speckle Pattern Interferometry (ESPI)[1,2], sometimes
referred to as Digital Interferometry, and Shearography. Although derived from the principles of
holographic interferometry, ESPI differs in that the interference fringes are produced digitally
through image addition and subtraction routines.
A typical ESPI set-up as outlined in Figure 1
utilises a laser beam which is split into a
reference and object beam. The object beam
is directed onto the object and expanded to
illuminate the required inspection area. The
object is then viewed through a CCD video
camera on a personal computer (PC), which is
equipped with video digitisation hardware. By
placing a partially reflecting mirror directly in
front of the CCD camera, the reference beam is
superimposed onto the image of object under
inspection. If the object and reference beam
paths are equal in length, the interference of the
two beams produces a speckled image. Any
movement of the object causes the object beam pat
modulation in the speckle image.
Partial Mirror
Mirror
Beam Splitter
Mirror
Beam Expander
Object
Laser
MirrorCamera
Computer+
Digitiser
Video Monitor
p
Shearography on the other hand utilises only a sing
object. The object is then viewed through a shearin
beamsplitter splits the single incoming image into tw
Figure 1. Typical ESPI set-u
h to be altered which generates a phase
le laser beam which is used to illuminate the
g device as outlined in Figure 2. The
o separate images which are directed onto
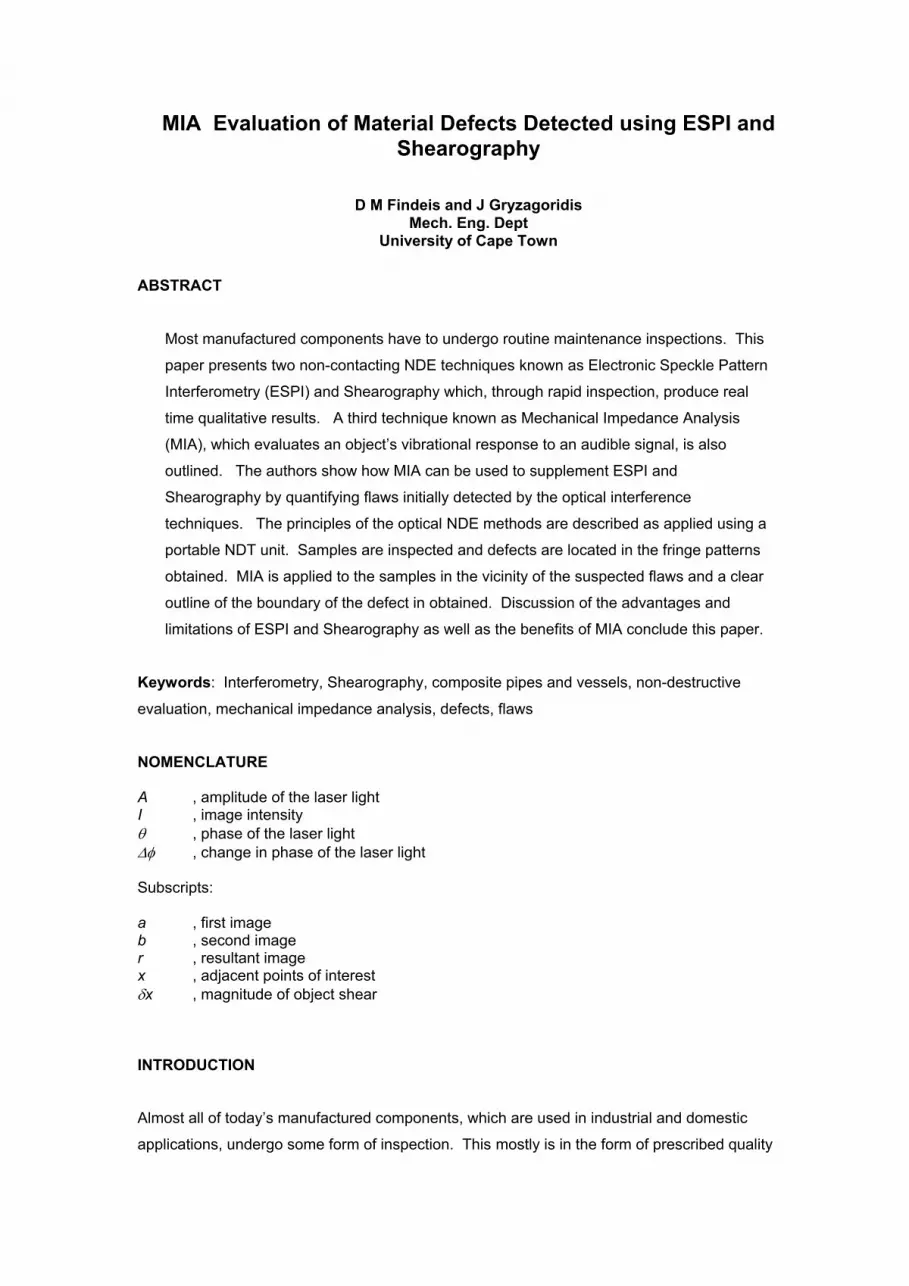
and reflected off mirrors 1 and 2. The two
images are then recombined at the beamsplitter
and viewed via the CCD camera on a personal
computer. By adjusting the tilt of mirror 1 and
thereby the angle of reflection, one of the
combined images can be sheared with respect
to the other. Due to the temporal coherence
length of the laser, the area of overlap of the
combined images will interfere and produce a
speckled image. When the object is displaced,
both image path lengths are altered. Phase
modulation will only occur when there is a
change in the relative object displacement from
point to point. This also implies that the set-up
is only sensitive to the displacement gradient in the d
displacement gradient which is at 90º to the direction
Camera
Mirror
Beam Expander
Object
Partial Mirror
Mirror1
Laser
Mirror2
Computer+
Digitiser
Video Monitor
(I A A A Aa = + + −12
22
12
22 1 22 cos θ θ )
( )(I A A A Ab = + + − +12
22
12
22 1 22 cos θ θ φ∆ )
( )( )I I I A Ar a b= − = − +4 0512
22 1 2sin . sin .θ θ φ∆ 0 5 φ∆
))x x
))φ
Due to the different methods of generating the speck
object surface displacement and shearography the ra
Mathematically this is presented in equations (1) – (3
[8]. The method used to produce an interferogram is
speckle image of the object is digitised and stored in
mathematical model of the phase interference which
then stressed using either vibrational, thermal of mec
of the object to displace, the magnitude of which is in
second speckle image is then digitised and subtracte
The intensity of the resultant interferogram is as a res
equations (3) and (6). Regions of phase correlation p
decorrelation produce bright bands which are commo
((I Aa x= + −+2 12 cos θ θδ
( )((I Ab x x x= + − ++2 12 cos θ θδ ∆
( )( )I I I Ar a b x x x= − = − ++4 052 sin . sin .θ θ φδ ∆ 05 φ∆
Figure 2. Typical Shearography set-up
irection of image shearing and ignores the
of image shearing.
(1)
(2)
(3)
le images, ESPI is capable of detecting
te of change in object surface displacement.
) for ESPI [7] and (4) – (6) for Shearohraphy
the same for both methods. First a
the PC. Equations (1) and (4) provide a
governs the speckle intensity. The object is
hanical methods. This causes the surface
troduced as ∆φ in equations (2) and (5). A
d from or added to the first stored image.
ult of the magnitude of sin 0.5∆φ in
roduce dark bands and regions of
nly referred to as fringes.
(4)
(5)
(6)

The presence of a defect will alter the surface displacement due to localised weakening of the
structure in that region. ESPI and shearography are able to detect the area in which the flaw is
located as fringe irregularities in the generated interferograms.
Mechanical Impedance Analysis (MIA) employs mechanical vibration, which is applied to the
object surface via a probe, to analyse the local stiffness of a structure. The probe consists of two
piezo-electric crystals. One of the crystals converts electrical signals into vibrations. By resting
the probe on the object surface the vibrations are transferred to the structure under investigation.
The other crystal picks up the objects response to the applied vibration, converts it back an
electrical signal which is then compared with the source signal. Any change in the structural
rigidity due to the presence of a flaw will affect the objects response to the mechanical vibration,
which can be detected when compared with the response of an unflawed section. By using low
frequencies, the need for coupling fluid at the probe structure interface is eliminated.
APPLICATION
ESPI and Shearography have the ability to rapidly inspect large surface areas qualitatively. MIA,
on the other hand can provide quantitative results, but is a very laborious inspection method, as
the whole object has to be scanned with the probe. By combining the two inspection methods,
quantitative results should be attainable much more rapidly. The authors demonstrated this in
the following manner.
Two samples were selected and put to the test. The first was a cross-section of a composite
aircraft wing. The composite consisted of a fibreglass honeycomb core which was covered on
both sides with a fibreglass skin. This construction made the wing section extremely light, but at
the same time rigid. A sharp knife was used to delaminate a 15 mm * 40 mm section of the
inner skin from the honeycomb filler. As the flaw was created on the inner side of the wing
structure and the wing was painted a matt grey, no outer surface deformation was visible. The
second sample, which was made from a GRP, was a 90º elbow tube with an internal diameter of
100 mm and an average wall thickness of 6 mm. The tube was flawed in that a star shaped
internal impact crack, which penetrated approximately 10% of the wall thickness, had been
created. As a grey pigment had been added to the resin, the flaw was not visible from the
outside.
RESULTS
The two samples were first inspected using ESPI and Shearography. The inspection was carried
out at the University of Cape Town’s NDE laboratory. Both the ESPI and Shearography set-ups
were located on a vibration isolation table. A Helium Neon laser was used as the light source.
The two samples were simply propped on a separate wooden bench, with no special vibration
isolation procedures. A Matrox digitiser, which was operated via custom written software, was
used to capture the incoming video signal. The testing procedure was conducted as follows.
Firstly an image of the sample was digitised and stored. The software was then set into real time
mode and the object was stressed thermally. In this mode, the incoming video stream is instantly
subtracted from the stored initial image and the resultant fringe pattern displayed on the video
monitor. The process could be stopped at any time and the frozen image then stored on the
system’s hard drive.
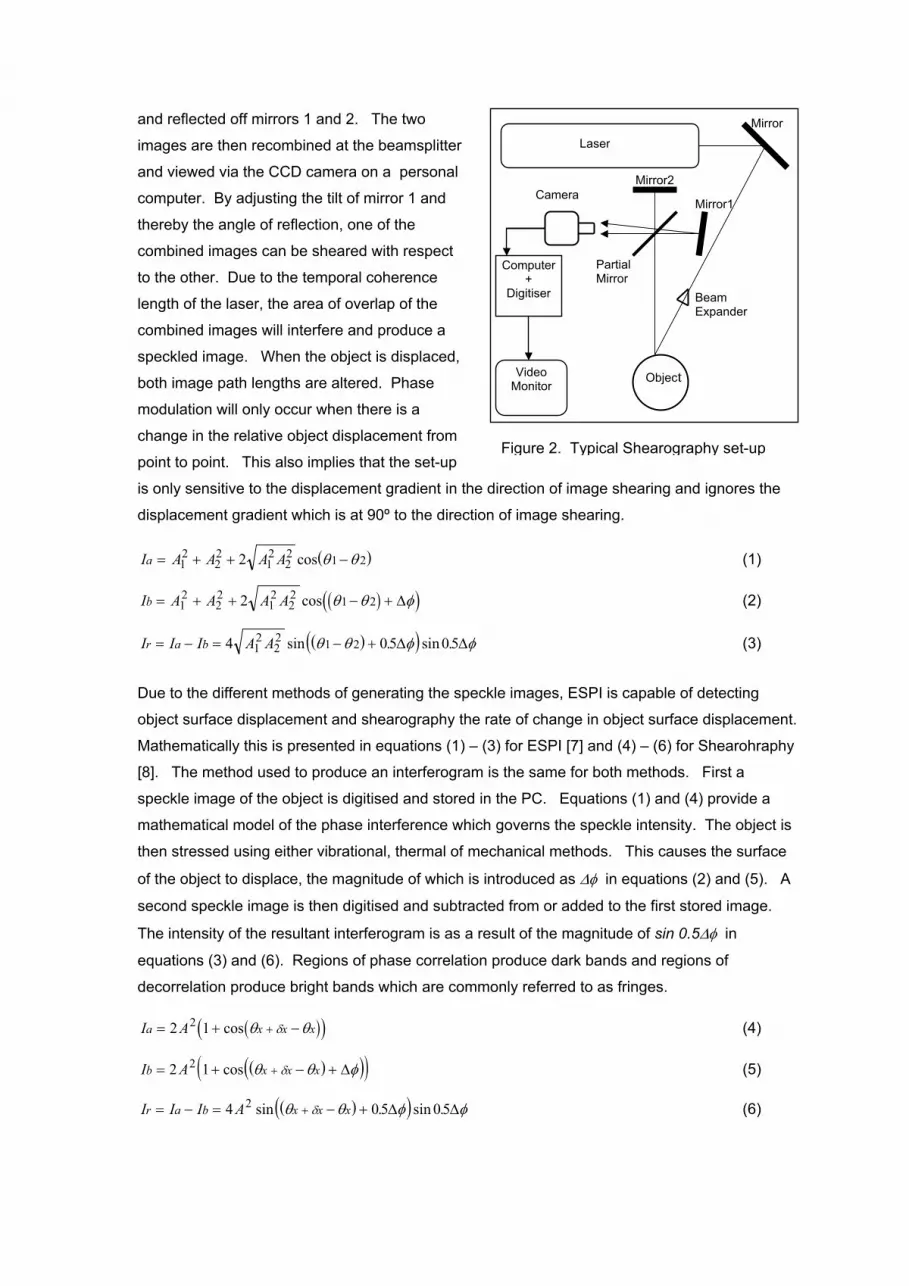
Figure 3a. Elbow result using ESPI 3b. Elbow result using Shearography
Figure 3 a & b above list the results obtained from the ESPI and Shearography investigation of
the GRP elbow. Note the circular fringe which is formed in the ESPI interferogram, which
indicates a localised deformation peak and is indicative of the presence of a defect. This is
supported in the result from the Sherography investigation, where the location is indicated at the
fringe junction in the centre of the image. This junction is as a result of a localised change in the
rate of displacement. For this investigation the images were sheared horizontally and as the flaw
was detected with this set-up, there was no need to perform vertical shearing.
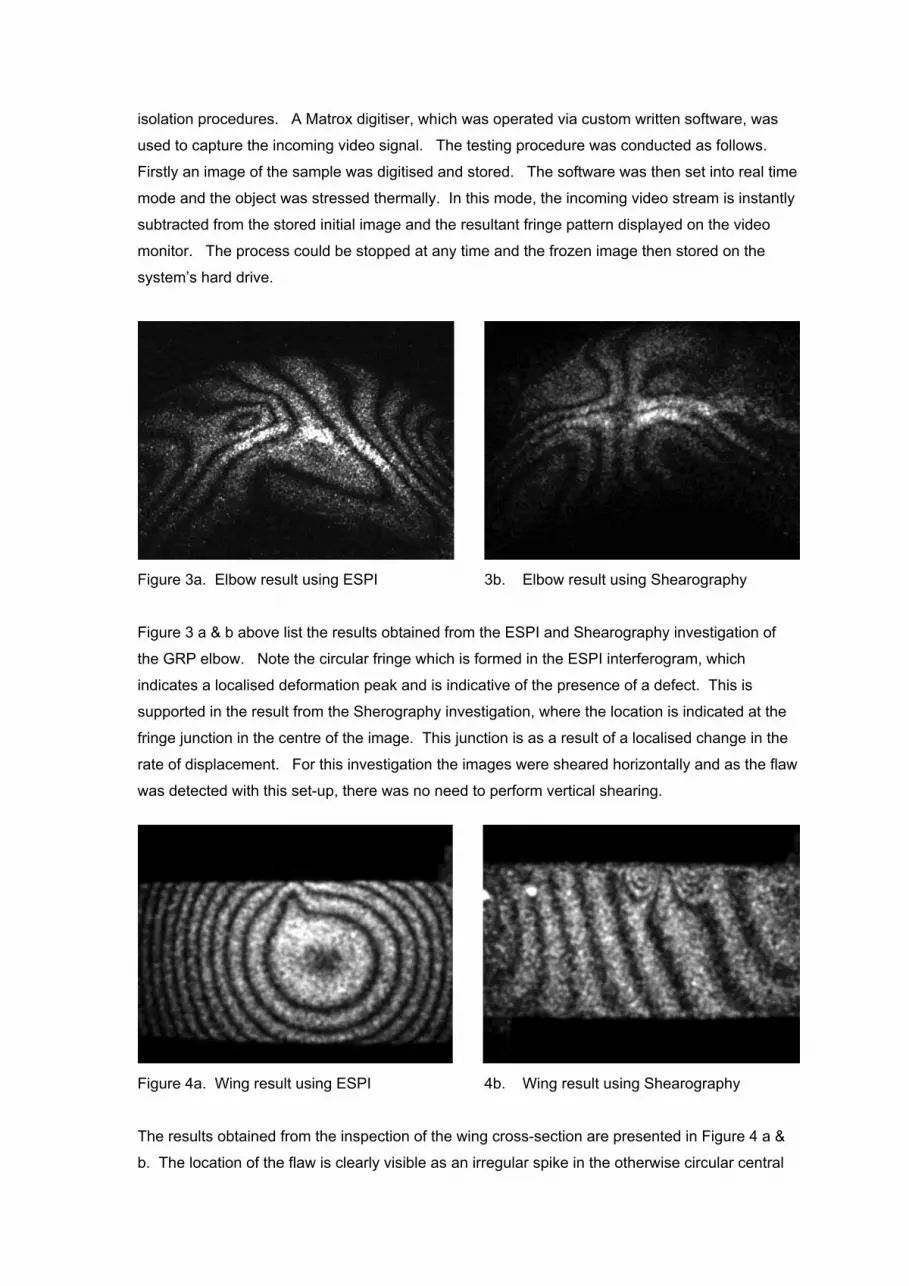
Figure 4a. Wing result using ESPI 4b. Wing result using Shearography
The results obtained from the inspection of the wing cross-section are presented in Figure 4 a &
b. The location of the flaw is clearly visible as an irregular spike in the otherwise circular central
fringe. This irregularity is carried through to the next fringe immediately above the spike. The
otherwise symmetrical fringe spacing across the rest of the wing section indicates that the
remaining sub-structure is free of flaws. The second interferogram, which was obtained using
Shearography, also reveals the flawed region in the top centre. The close fringe spacing, which
is flanked by two circular fringes, is as a result of a large localised displacement gradient.
After the two flawed sections had been marked, MIA was applied to the two samples. The unit
used was a Staveley NDT Tchnologies MIA2500 Portable Bond Tester. In order to calibrate the
instrument, the probe is applied to a flawless section of the sample. The frequency range, which
is from 1 kHz to 8kHz, is scanned and the amplitude and phase of the returned spectra recorded.
The probe is then applied to a flawed section and the scan repeated. The two spectra are then
compared to determine at which frequency the amplitude and phase are most sensitive to a
change in the structural stiffness of the test piece.
For the GRP elbow it was determined that
the reading of the amplitude was too erratic
to produce any reliable results and was
ignored. This was due to the poor contact
between the probe and the irregular
surface. The phase response however
was insensitive to the rough surface, but
showed very little variation in magnitude
between a good and bad section. A
maximum variation of 10 units on a scale of
100 units occurred at 2600Hz. Using the
optimum frequency, the unit was set to
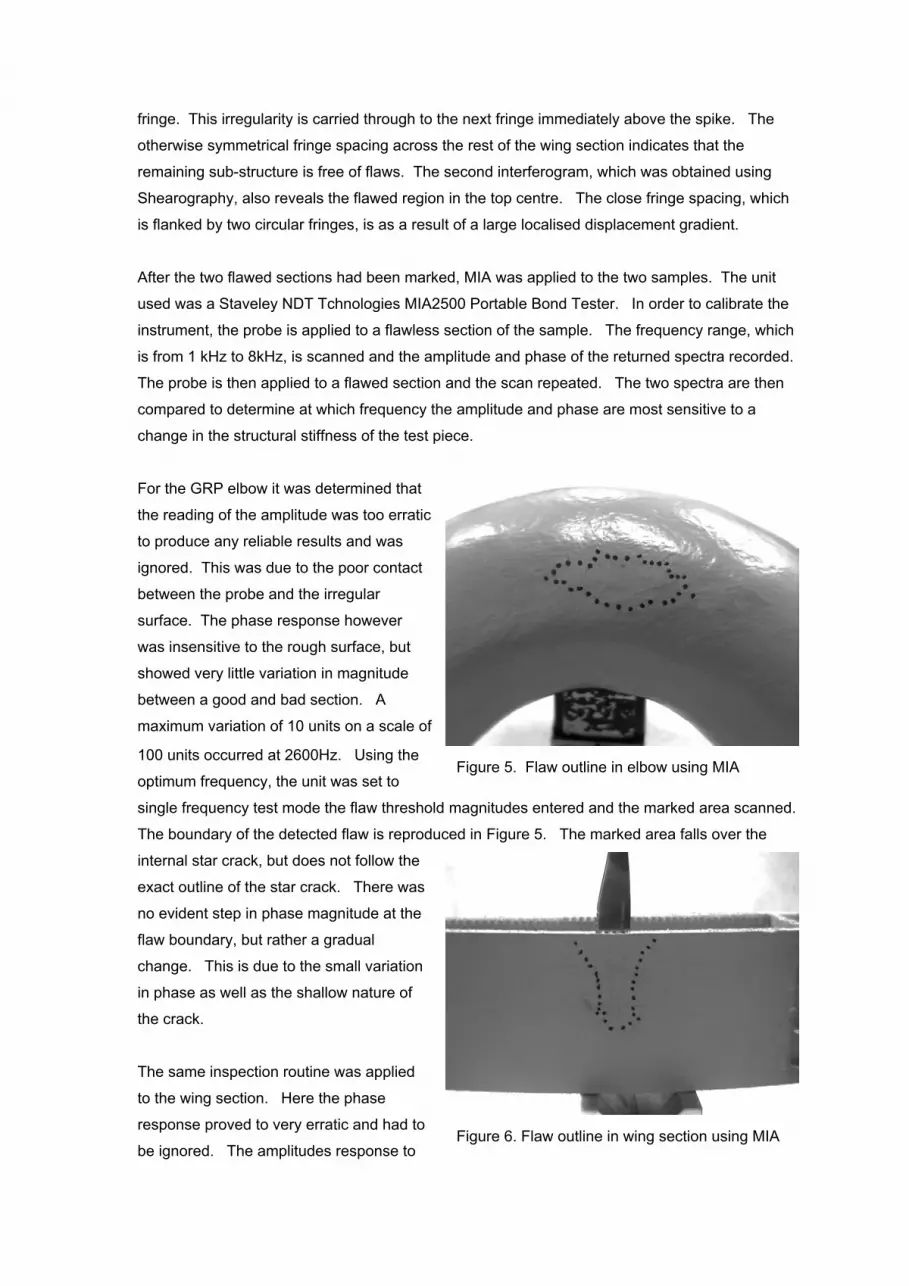
single frequency test mode the flaw threshold magnitudes entered and the marked area scanned.
The boundary of the detected flaw is reproduced in Figure 5. The marked area falls over the
internal star crack, but does not follow the
exact outline of the star crack. There was
no evident step in phase magnitude at the
flaw boundary, but rather a gradual
change. This is due to the small variation
in phase as well as the shallow nature of
the crack.
Figure 5. Flaw outline in elbow using MIA
The same inspection routine was applied
to the wing section. Here the phase
response proved to very erratic and had to
be ignored. The amplitudes response to Figure 6. Flaw outline in wing section using MIA

structural integrity was good and the variation in reading was 35 units on a scale of 100. The
most suited frequency was found to be 1500 Hz. The change in magnitude of the amplitude
provided a clear separation at the flaw boundary. The result of the investigation is given in
Figure 6. The outline of the flaw has been clearly identified and follows the internal flaw
geometry. The knife used to create the flaw has been inserted to note the location. Note how
the defect area widens at the edge of the wing section, which was only noted after MIA had been
applied to the marked section. The closely spaced circular fringes in the interferogram obtained
using shearography supports this finding.
CONCLUSIONS
The authors have successfully demonstrated that MIA, in conjunction with ESPI and
Shearography, can be used to quantify the location of flaws in GRP and composite materials. By
using ESPI and Shearography to perform the initial investigation, the time consuming process of
scanning the entire object surface with a probe can be reduced to only those areas containing a
flaw. This process also reduces the possibility of missing a flaw, as flawed areas are located
prior to the scanning procedure.
REFERENCES
1. Hertwig M., Flemming T., Usinger R., Speckle Interferometry for Detection of Subsurface
damage in Fibre-reinforced Composites, Meas. Sci. Technol. 5,1994, pp 100-104. 2. Findeis D, Gryzagoridis J, Inspecting Glassfibre Reinforced Plastic Piping using Portable ESPI
and Shearography, , Proceedings 14th WCNDT 1996, pp 1521-1524. 3. Gryzagoridis J, Findeis D., Schneider D.R., The Impact of Optical NDE Methods in Vessel
Fracture Protection, Int. J. Pres. Ves. & Piping Vol. 61, 1995, pp 457-469. 4. Maji A K, Satpathi D, Zawaydeh, Assesment of Electronic Shearography for Structural
Inspection, Exp. Meas. Vol. 37, No.2, 1997, pp 197-204. 5. Gryzagoridis J, Findeis D, ESPI Testing of Arcton Containers, Int, J. Pres. Ves. & Piping, 59,
1994, pp 275-280. 6. Muralidhar C, Siddalingaiah D L, Sreenivasa Reddy K, NDE of Defects in Different Fibre
Reinforced Composites using Ultrasound and X-Ray Radiography, Proceedings 14th WCNDT 1996, pp 517-521.
7. Jones R., & Wykes C., Holographic and Speckle Interferometry , University Press, 1988. 8. Chau F.S., Ng T.W., A real-time Digital Shearing Speckle Interferometer. Meas. Sci. Technol.,
Vol. 3, 1992, pp. 181-183.