response of maize to phosphorus and sulphur
TRANSCRIPT
RESPONSE OF MAIZE TO PHOSPHORUS AND SULPHUR FERTILIZATION
By
MD. SAKIB SIDDIQUE Reg. No. 02162
A Thesis
Submitted to the Department of Soil Science Shcr-e-E3angla Agricultural University. Dhaka
in parlial fulfilment of the reqtiiremcnis for the degree of
MASTER OF SCIENCE (MS.) IN
SOIL SCIENCE
Semester: July - December, 2007
Approved By:
cSeo (Dr. Sirajul Hoque)
Pro lessor Dept. of Soil. Water and Environment
University of Dhaka Dhaka- 1000
VDpCrvi-so-r (Dr. Md. Nurul Islam)
Professor Department of Soil Science
Sher-e-Barigla Agricultural University, Dhaka-1 207
Chairman (A.T.M. Shamsuddoha)
Associate professor Department of Soil Science
Shcr-c-E3angla Agricultural University, Dhaka- 1207

Supervisor
This is to certify that thesis entitled, "fiS"FO?VYE O'F S%QIJZffi W
'PHOSQ'J[OQVS )t7'.D SVEQ.'J(Vt PJiRJ1LJZfl97O'X' submitted to the
7 lY:7[ 2, Sher-e-Bangla Agricultural University,
Dhaka in partial fulfilment of the requirements for the degree of WASTEROIF
SCIcEJJ'TOE (MS.) in SOIL SCI'EWUE embodies the result of a piece of hona tide
research work carried out by fcfl. £4JCJcB SrnDJQUE Registration No. 02162
under my supervision and guidance. No part of the thesis has been submitted
for any other degree or diploma.
I further certify that such help or source of information, as has been
availed of during the course of this investigation has duly been acknowledged
by him.
Dated...
Place: Dhaka, Bangladesh
(Dr. Md. Nurul Islam) Professor
r)epartment of Soil Science Sher-c-Bangla Agricultural University,
Dhaka-I 207

Dedicated
Beloved Parents

ACV(cYWLTAqESWEYT
Aff praises are cThe toft(m:glz.tyjlffafi Qab&uCfll-,,4min H/lw kjndiy enablet me to complete
this wo,* I wish to express my sincere apprt'ciat ion antprofountgratitute to my rcverctst
supervisor 'Dr. Md &irn( Islam, 'Professor, Department qf Soil Science, Slzer-e-cJJang(a
Agricultural Vniversity for his constant guitance, k,çen interest, immense advice and
encouragement diving the perktqftfw research worf<
I wish to express my exjremc gratitu&i to my co-supervisor Dr.Sirajuliloquc. Prqfessor,
Department of soil: 1 Vater ant "Environment, ?Jniversity of 'Dhia€a for providing me with
affpossi6le help Luring the period of this research work
It is a great pleasure ant privilege to cypress my profoundgratitude and sincere regards to
21r .$.Q&W. Slzamsuto/ia Associate 'Professor, Chairman, 'Department qf Soil Science, Slier-
e-Q3angla Agricuñural Vnk'ersity, cDfiag, for his help, heartiest co-operation, valuable
advice, qonstrzzctive criticism anifaci/Ities and supports needd to untena4ç this research
work,
Specialappreciation a ntwannest gratitude are e4ented'to my estcemed'teac hers Prqfessor
'Dr. )lloICJ(umar 'Paul: Trofessor'Dr qopi XatIi Chantra SutradTuzr Associate rrofessor
'Dr. Asafu:zaman ic/ian, 'Depa it ment of Soil Science, Sher-e-(Ba,,gla .J4gricultural
t)niversity, 'DlsaI.jç, who provitet creative suggestions, guidance ant constant inspiration
from the beginning to the completion of the research work, 'Their contribution, hove and
affect ion would persist in my memory for countless days.

I ftc! to express my sincere appreciation and ine[efitedi,ess to my teachers )Issistant
professor Mst. )lfrose Jaiwn an1 Assistant professor 211 Mos/iarraf ilossain, :DepL qf
Soil Science, Slzer-e-(Bangla Agricultural V'niversity, 'VIm kg for their valna file teaching,
direct ancfindia'ct advice, encouragement and cooperation during the whoTh study period
Again I e.wresse my cordial tfian€s to lecturers 5111 Safizl Is&zm 'i3fiuiyan, 51(d Jssal<
Saikgt ('hawdfiury, Jitarna Sar*gr, 'Depart merit of Soilscience, j'Iier-e-angfii Agricultural
'University, 'Vfiakjz, for their encouragement and active co-operation luring the entire
period of the nrsea it/i
'The author would' Ii/& to tttpress cordial tlzanks to his younger firother (j3o,lan Uda%n for
ltisgenial1ielp regarding of his tireless effort in completing this thesis writing.
I want to say tlzankj-, to my classmates and'frienls, for their active encouragement and
inspiration; persorw(ackjiowledjement are male to, Wiger 5uitana. (Prince, _4nf, fFirdousi,
94u1&er.
(Ware: 'DIla&a SWL Sahjjb Siddique
'Dated 06-02162
It
ABSTRACT
A field experiment was conducted at the research farm of Sher-e-Bangla Agricultural
University, Dhaka, Bangladesh during the rc,hi season of 2006-07 to study the
response of maize to phosphorus and sulphur fertilization. The experimental soil was
silty clay loam and the pit was 48. The experiment was laid out in a Randomized
Complete Block Design (RCBD) with 3 (three) replications of each treatment. There
were lb treatments. The treatments consisted of4 (four) levels of P (0. 35, 50 and 65
kg P/ha) designated as Po. Pc, Ps0 and Pc,c respectively and 4 (four) levels of S (0. 25,
40 and 55 kg S/ha) designated as SI). S25. S.u,. and S.s. respectively. 'ISP and Gypsum
were used as the sources of phosphorus and sulphur. respectively. Phosphorus and
sulphur fertilizers were applied according to fertilizer recomniendation of BARE.
There was a positive impact of P and S and their interaction on growth, yield and
yield attributes of maize. Application of 50 kg P/ha resulted tallest plant, highest
number of cobs/plant, maximum cob length, maximum grains/cob, highest
circumference of cob, highest grain and Mover yield, N and S uptake by plant and
available P in post harvest soil. Highest values in respect of plant height, cobs/plant,
cob length. grains/cob, circumference of cob, grain yield. Mover yield, shelling
percentage, N content in maize plant, N, K and S uptake by maize plant, organic
carbon and available P in post harvest soil were obtained with 40 kg S/ha. Combined
application of P and S had significant effect on plant height, number of cobs/plant,
cob length, grain/cob, circumference of cob. 1000-grain weight, grain yield, Mover
yield. N, P. K and S content in maize plant. N, P, K and S uptake by maize plant,
organic carbon and total N in post harvest soil. Phosphorus 50 kg/ha with sulphur
Q). 40 kg/ha gave the highest plant height, number of cobs/plant, cob length, grain/cob,
circumference of cob- 1000-grain weight, grain yield, stover yield and S uptake by
maize plant. Therefore, application of 50 kg P along with 40 kg S/ha and
recommended other nutrients is the most suitable treatment combination for the
efficient production of maize in the soils of the Modhupur Tract. Application of
phosphorus and sulphur at their higher levels of combination showed antagonistic
effects on both the concentrations and uptake of phosphorus and sulphur and on the
concentration of potassium in maize plant.
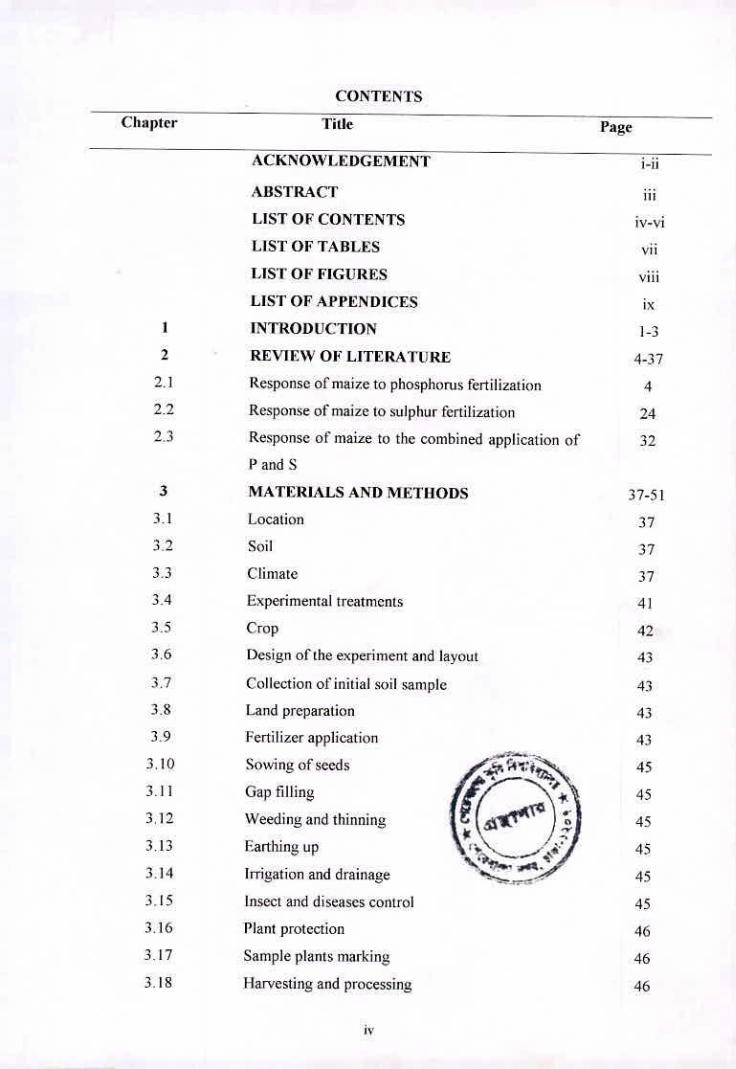
CONTENTS
Chapter
Title Page
ACKNOWIkDGEMENT -
ABSTRACT iii
LIST OF CONTENTS iv-vi
LIST OF TABLES vii
LIST OF FIGURES viii
LIST OF APPENDICES ix
I INTRODUCTION 1-3
2 REVIEW OF LITERATURE 4-37
2.1 Response of maize to phosphorus fertilization 4
2.2 Response of maize to sulphur fertilization 24
2.3 Response of maize to the combined application of 32
P and S
3 MATERIALS AND METHODS 37-51
3.1 Location 37
3.2 Soil 37
3.3 Climate 37
3.4 Experimental treatments 41
3.5 Crop 42
3.6 I)csign of the experiment and layout 43
3.7 Collection of initial soil sample 43
3.8 Land preparation 43
3.9 Fertilizer application 43
3.10 Sowing of seeds 45
3.12 Weedg and thinning 45 If
3.13 Farthingup 45
3.14 Irrigation and drainage 45
3.15 Insect and diseases control 45
3.16 Plant protection 46
3.17 Sample plants marking 46
3.18 Harvesting and processing 46
iv
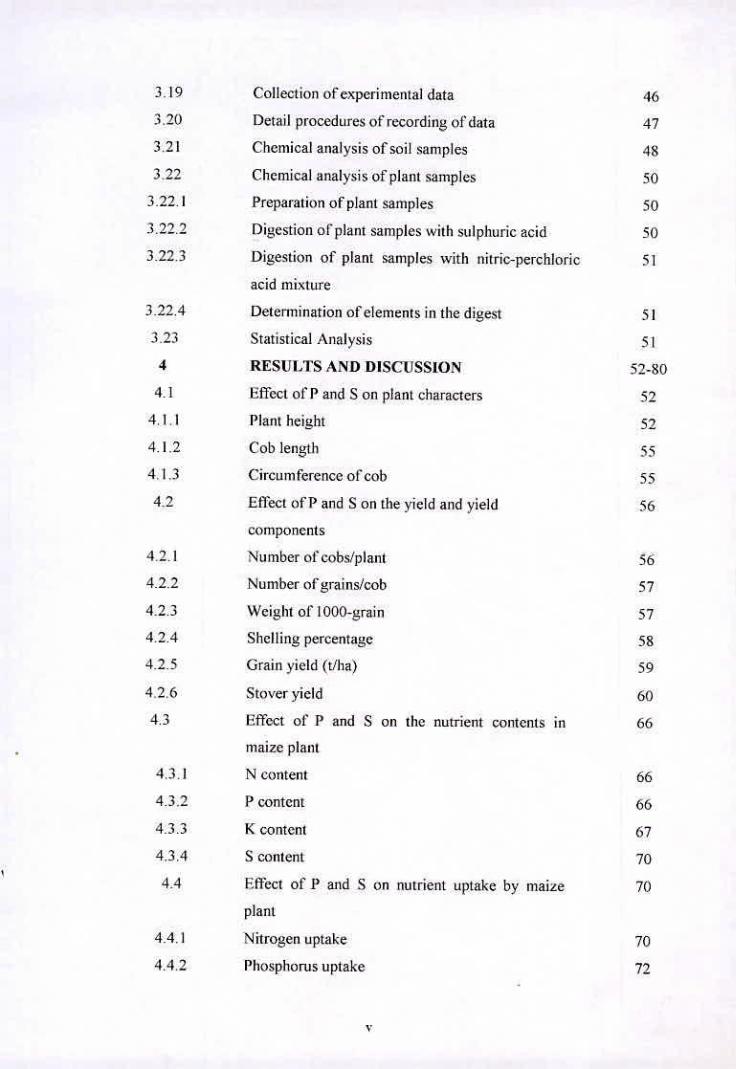
3.19 Collection of experimental data 46
3.20 Detail procedures of recording oldata 47
3.21 Chemical analysis of soil samples 48
3.22 Chcmical analysis of plant samples 50
3.22.1 Preparation of plant samples 50
3.22.2 Digestion of plant samples with sulphuric acid 50
3.22.3 Digestion of plant samples with nicric-perchloric 51
acid mixture
3.22.4 Determination of elements in the digest SI
3.23 Statistical Analysis
4 RESULTS AND DISCUSSION 52-80
4.1 Effect of P and Son plant characters 52
4.1,1 Plant height 52
4.1.2 ('oblength 55
4. 1.3 Circumference of cob 55
4.2 Effect of P and S on the yield and yield 56
components
4.2.1 Number of cobs/plans 56
4.2.2 Number ofgrains/cob 57
4.2.3 Weight ol' 1000-grain 57
4.2.4 Shelling percentage 58
4.2.5 Grain yield (t/ha) 59
4.2.6 Stover yield 60
4.3 Effect of P and S on the nutrient contents in 66
maize plant
4.3.1 N content oo
4.3.2 P content 66
4.3.3 K content 67
4.3.4 S content 70
4.4 Effect of P and S on nutrient uptake by maize 70
plant
4.4.1 Nitrogen uptake 70
4.4.2 Phosphorus uptake 72
V
4.4.3 Potassium uptake 73
4.4.4 Sulphur uptake 74
4.5 Effect of P and S on the characteristics of the post 74
harvest soil
4.5.1 Organic carbon content (%) 75 4.5.2 Total nitrogen 75
4.5.3 Available phosphorus 77
4.5.4 Exchangeable potassium 79
4.5.5 Available sulphur 79
5 Summary and Conclusion 81-82 6 References 83-96
Appendices iv
vi
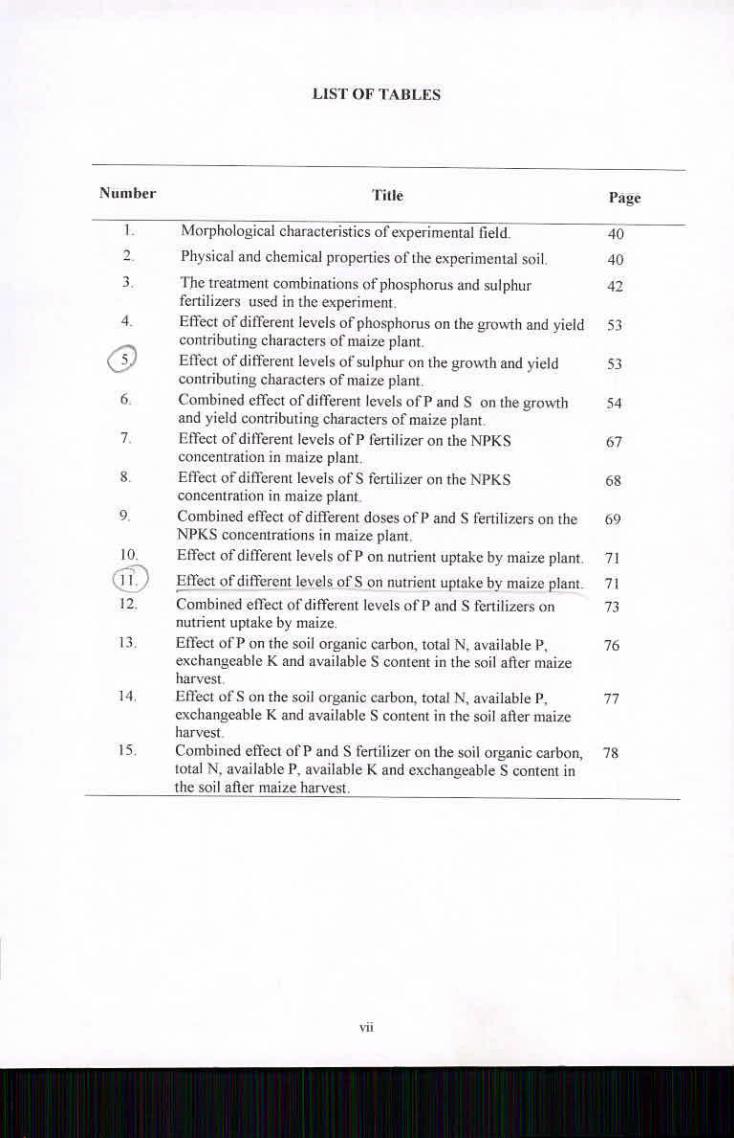
LIST OF TABLES
Number Title Page
1 Morphological characteristics of experimental field. - 40 - 2 Physical and chemical properties of the experimental soil.
3
40
The treat,nent combinations of phosphorus and sulphur 42 fertilizers used in the experinieni.
4 Effect of different levels of phosphorus on the growth and yield 53 - con tn bin mu characters of maize plant
Effect Of dificient levels of sulphur on the growth and yield 53 -- cent nibu dug characters of maize plant
6 Combined effect ofditi'erent levels of' P and S on the growth 54 and yield contributing characters of maize plant
7 NtThct of different levels ofP fertilizer on the NPKS 67 concern at ion in maize plant
8. Effect of different levels of S fertilizer on the NPKS 68 concentration in maize plant
9. Combined effect ofdi!lèrent doses ofP and S lèntilizers on the 69 NPKS concentrations in maize plant.
I?. Effect ot'ditferent levels oiP on nutrient uptake by maize plant 71
II. Elfect ofdifl'erent levels ofS on nutrient uptake by maize plant. 71
12. Combined effect of different levels off' and S fertilizers on 73 nutrient uptake by maize.
13. Effect of"P on the soil organic carbon, total N. available P. 76 exchangeable K and available S content in the soil after maize harvest
14. Effect of S on the soil organic carbon, total N, available P. 77 exchangeable K and available S content in the soil aller maize harvest
IS. Combined effect of P and S fertilizer on the soil organic carbon, 78 total N. available P. available K and exchangeable S content in the soil after maize harvest.
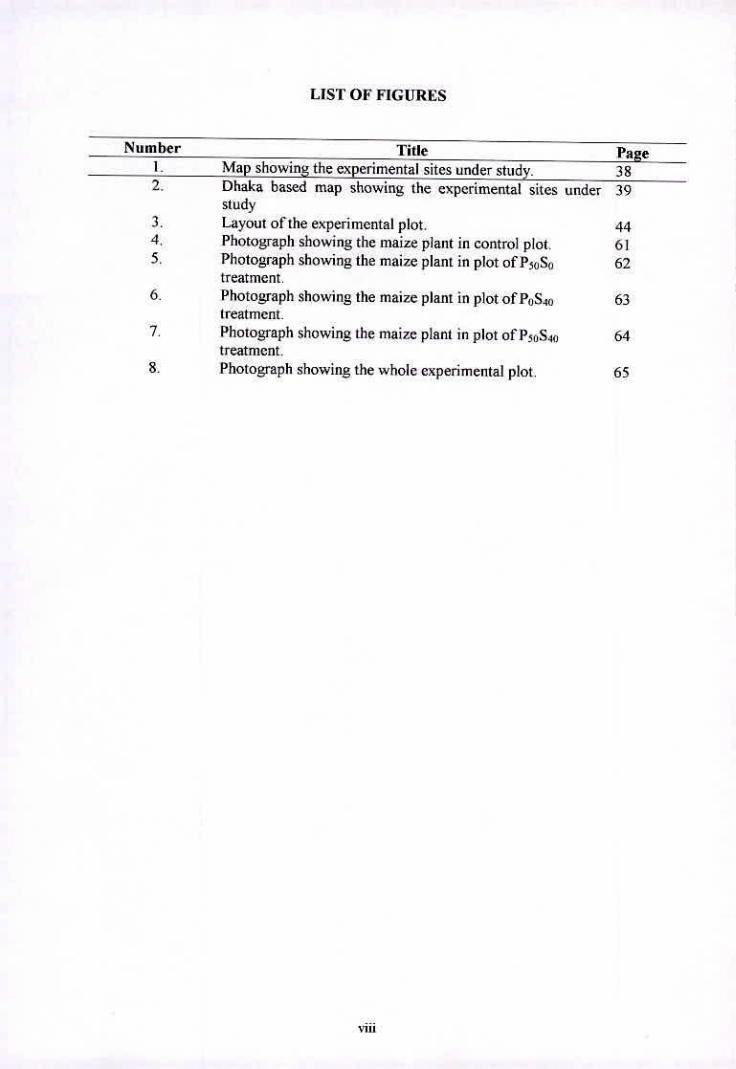
LIST OF FIGURES
nber 1.
- Title Map showing the experimental sites under study.
Page 38
2. Ohaka based map showing the experimental sites under 39 study
3. Layout of the experimental plot. 44 4. Photograph showing the maize plant in control plot. 61 5. Photograph showing the maize plant in plot of P50S0 62
treatment. 6. Photograph showing the maize plant in plot of P0S40 63
treatment. 7. Photograph showing the maize plant in plot of P50S40 64
treatment. 8. Photograph showing the whole experimental plot. 65
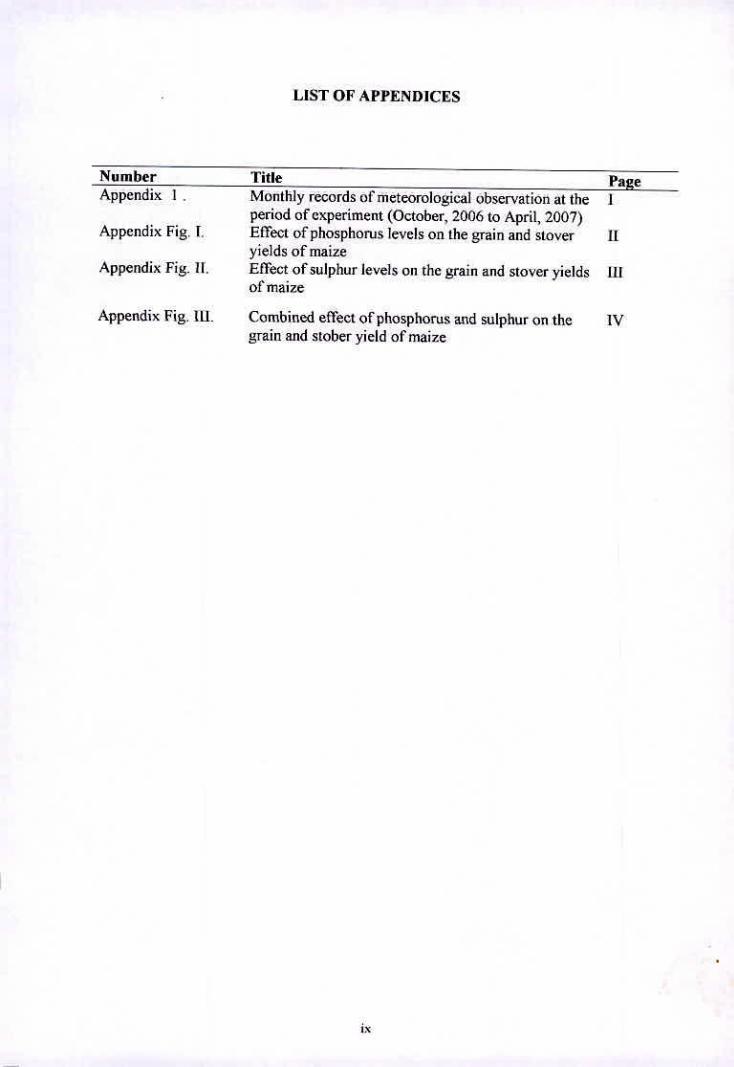
LIST OF APPENDICES
Appendix Fig. I
Appendix Fig. I!.
Appendix Fig. 1(1.
Title Page Monthly records of meteorological observation at the I period of experiment (October. 2006 to April. 2007) Effect of phosphorus levels on the grain and stover II yields of maize Effect of sulphur levels on the grain and stover yields III of maize
Combined efThet of phosphorus and sulphur on the IV grain and stober yield of maize
ix

Chapter 1
ntroducti'on
m Tl Chapter 1 Nt
'rn I INTRODUCTION
Maize (Zecs maize I) is one of the most important cereal crops of the world and
hence it may be acceptable as a third cereal crop in Bangladesh for its higher
productivity Maize is a multi-purpose crop. Every part of the plant and its
products are used in one form or other As food, it can be consumed directly as
green cob, roasted cob or popped grain. Its grain can be used for human
Consumption in various ways, such as, corn meal, fried grain and flour. its grain
has high nutritive value containine 66.2% starch. I [1% protein. 7.12% oil and
1 .5% minerals. Moreover, it contains 90 rug carotene, 1.8 mg niacin. 0.8 mg
thiamine and 0.1 mg riboflavin per 100 g grains (Chowdhury and Islam. 1993).
Maize oil is used as the bcst quality edible oil The by-product of the oil extraction
is valued as livestock feed. Green parts of the plant and grain are used as livestock
and poultry feed. Sheaths of cobs arc used to make paper of improved quality
cigarettes. Stover, thy leaves, coverings of cobs and shelled cobs are used as good
ftiel (Ahmed. 1994) Maize has a great utility in industrial purpose for the
production ol' pop corn syrup. soft drink, juice. beer. ehewng gum, eandy chips,
corn flakes and starch. Maize starch is also used as raw martial in the chemical
industry, plant varnish, artificial rubber, soap and bakery. Maize has starch-rich
endosperm and fat-rich embryo. Nutritionally it can be compared with rice and
wheat. Maize is the staple carbohydrate food in many American. African and
Asian countries. In 1999, world cereal crop production was highest as maize
followed by wheat and rice, their average yields were 4.39, 2.63 and 3.75 t!ha,
respectively (FAO. 1999). About 45% of the total would maize crop is grown in
the United States. Other important maize growing countries are China. Brazil,
Mexico. India and Thailand.
In Bangladesli the cultivation of maize has been gaining popularity in recent
years. It is now becoming an important cereal crop for its higher productivity and
diversified uses (Islam and Kaul, 1986). It covers about 2429 hectares of land
producing 2000 tons of grains annually (BBS. 1999). Maize crop has been
included as a major enterprise in the crop diversification and intensive cropping
programmes (Kaul and Rahman, 1983)
Moderate temperature of 24°C to 30°C and abotit 800 mm of well distributed
rainfall are conducive to good growth of maize (Ihakur, 1980). The agroclimatie
condition of Bangladesh is favorable for its cultivation round the year. Pest and
disease infestations are comparatively less in maize than in other cereals. Maize
may offer a partial solution to the food shortage of Bangladesh if its present yield
level and total production can be thrther raised. Maize can contribute significantly
in this respect because of its higher productivity per unit area than wheat or rice.
The problem of low grain yield of maize in our country may be associated with
declining productivity of high to medium lands tinder continuous intensive
cropping, low soil fertility thus declining at rapid rate. This problem may be
overcomed by judicious application of fertilizers, especially with phosphorus and
sulphur.
Phosphorus nutrition is a major consideration for increasing grain yield and
quality of maize. Phosphorus should be applied in such a way that would
maximize its utilization for grain production. It appears that there is a need to tnd
out a fertilizer management system using a combinatkm of sulphur with
phosphorus fertilizer, for better utilization of the latter.
Recently sulphur deficiency has been found to be widespread in soils of
Bangladesh. Intensive use of higher analysis fertilizers like urea, TSP and NIP,
high yielding varieties (HYV), higher cropping intensity without any
2
replenishment and limited use of organic manures are the most probable reasons
for sulphur deficiency. Sulphur deficiencies affect not only yield of crop but also
protein quality through its effects on the synthesis of certain amino acids. cystine
and methionine as well as plant hormones and vitamins. II is reported that
significant responses of maize to S. generally in the range of 12 to 20% yield
increase [Allen (1976) in Western Kenya. Grant and Rowell (1976) in Zimbabwe.
and Kang and Osinanie (1976) in Nigeria].
Recently farmers of Bangladesh are advised to use gypsum along with TSP for
higher yield. But research on examining the best combination of phosphorus and
sulphur for higher maize yield is still meager. Therefore, an attempt was made
with the obieclive to identify the suitable doses of phosphorus and sulphur in order
to achieve both quantitative and qualitative improvement of maize production. The
average yield of maize in the country is not satisfactory. It is rather low compared
with leading maize growing countries of the world. The national average yield is
only 1.06 t/ha, whereas, the newly released varieties have the potential to produce
more than II I/ha (BBS, 2005)
Considering the above thets the present investigation has been undertaken with the
following objectives:
to study the individual effects of phosphorus and sulphur on the yield of
nia i ze.
to study the combined effect of phosphorus and sulphur for maximizing the
yield of maize,
to determine ihe appropriate doses of phosphorus and sulphur fertilizer for
maxinhlzinQ the yield of maize.
Ii

Chapter 2 Review of Li'leralure
E IL
L1
Chapter 2
REVIEW OF Lli'ERATURE
2.1 Response of maize to Phosphorus fertilization
Dhakshinamoorthv and Rani Perumal (2001) conducted a held experiment in
Tamil Nadu. India to evaluate the effects of different P sources viz, single
superphosphate (SSP), rock phosphate (RP). RP F coirpith compost (CPC) and
diammonium phosphate (DAP), with 1120 rates (30. 60. 90 and 120 kg/ha), on
linger millet (first crop), maize (second crop) and black grani (third crop) Finger
millet and maize were fertilized with phosphatic fertilizers while black gram was
not to study the direct effect of fertilizers on linger millet, cumulative effect on
maize and residual effect on black gram. Phosphorus fertilization enhanced grain
and straw yields of the three crops. Water soluble sources like I)AP and SSP was
more advantageous in terms of crop yield and yield atthbutes than water insoluble
sources (RP alone or in combination with CPC) However, the residual effect of
RP + CPC was superior over that of other tcatments.
and Abbasi (2000) studied the interactive effect of phosphorus (P) and
Copper (Cu) on maize growth in pots P at 0, 25, 50 mg/kg and Cu at 0. 2 5, 5
mg/kg were applied in all possible combinations to a sandy loam soil. Five plants
oiniaize in each pot were gro\fl to tasseling stage which received N and K at 75
and 50 mg/kg, respectively. Fresh and dry weights of maize fodder increased upon
P and ('u applications but decreased at higher treatment combinations N
concentration increased with Cu application whereas, P concentration was
decreased. P application increased P concentration but decreased Cit concentration
in maize plants, leading to the conclusion that an interaction between P and Cu in
soil occurs affecting the production of maize fodder significantly
rd
S Prado ci til (2001) studied the efiects and doses 01 phospho er under a
maintenance of fertilizer application on a maize crop in a dark red latosol in
Triangulo Minciro, Uberaba (Minas Gerais, Brazil). from October 1995 to April
1996. The treatments consisted of the following applications of triple
superphosphate: broadcasting, single tbrrow and double furrow and the following
doses of 0, 450, 675. 90.0, 112.5 and 135.0 kg ha4 of P05. Doses of P were
estimated based on 0. 050, 0.75, 1.00, 1 .25, 1.50 times the dose recommended for
maintenance fertilizer application, 90 kg hi' of P2O. It was found thai the use of
increasing P doses increased maize grain yield; the phosphorus fertilizer
applications in single furrows and double furrows were more efficient than
broadcasting; double thrrow application was the most outstanding mode of
application; Ibliar P content varied from 2.1 to 2.4, 2.1 to 27 and from 2 I to 2.9 g
kg'. respectively, for broadcasting, single furrows and double furrows. Maize
yield increased from 0.45 to 3.04 t ha4 for single furrows and from 0.21 to 4.4 t
hi' for double furrows.
Reichbuch (1987) examined the effects of 0-200 kg N (to potatoes. sugarbeet and
maize) and 0-160 kg N (to winter wheat) 4- 0-160 kg 11205 1 o or 100 kg K20/ha
on soil 1)11 and soluble P. K. Al and Fe contents of a chernozeni soil at Suceava in
1968-84. Soil acidity increased with long term N applications alone or with low P
rates which had a negative eflect on sugar beet root and maize grain yields. Potato
tuber yields increased with increase in N rate only, 20 kg N/ha were the optimum
economical rate. Winter wheat grain yields ranged from 3.02 t/ha with 80 kg P-Os
to 4.95 t with 120 kg N ± 160 kg P'Oc; 80 kg N 1 40 kg POc/ha were the most
economical rate. The hiLzhest sugar beet root yields were achieved with 100-150
kg N I 120-160 kg P2O Tha. The most efficient NP rates for maize were 100-120
kg N 120-160 kg P204/ha.
5
Barreto and Serpa (1988) conducted field trials at Poco Verde. SerQipe. Brazil in
1979, with maize cv. Centralmex and Pizasco/iss i'u/garis cv. I PA-74 119 grown in
pure stand, at 50 000 and 200 000 plants/ha or intereropped in a I row maize (25
000 plains): 3 rows P. ru/guns (150 000 plants/ha) arrangement. P was applied at
0-300 kg PO Tha as supc.rphosphate. Intereropped P. vu/guns yields with 0. 1(X),
200 and 300 kg P 20 were 29, 40, 44 and 47% of pure stand yields, respectively;
corresponding intercropped maize yields were 56, 87. 85 and 67% of pure stand
yields. Land equivalent ratios of the intercrops were 0.85, 1.27, 1.29 and 1.14 with
O. 100. 200 and 300 kg P 20c. respectively Maize showed a lmcar response to P in
pure stands and a quadratic response when intcrcropped. P. 1w/guri.c response was
similar in both systems. Plant P concentrations of both crops was similar in both
systems
Slianna ci at (2002) conducted field experiments during 1998-99 and 1999-2000
at lJdatpur. Rajasthan, India to study the residual effect of weed management and
P applied to the preceding Indian mustard crop on the content and uptake of N and
P by the succeeding fodder maize cv. 0-2 crop and its weeds. The treatments
applied to the preceding Indian mustard crop comprised 6 weed management
practices (weedy control, hand weeding at 30 days after sowing, pre-plant
incorporation of tiuchioralin at. I .0 kg/ha, pendimethaim applied at 0.75 kg/ha.
alachlor applied at 1.5 kg/ha and pre-ernergence application of oxytluorfen at
0.125 kgTha) and 4 levels of P (0, 20. 40 and 60 P'Ocilia). There was no significzuit
residual effect of different weed management practices on N and P uptake and
concentration in weeds or the fodder maize crop, except for the increase in P and
N uptake recorded during the second year. P applied to the preceding Indian
mustard crop signilicantly increased the P content as well as N and P uptake by
the succeeding I'odder maize crop and its associated weeds during both years
6
Tawm (1995) can-lcd out greenhouse and field experiments to assess the effect
of lime and phosphate application on growth. yield, and phosphorus and zinc
uptake by maize grown on the two major agricultural soils of Zimbabwe. Liming
improved yield where p11 was below 4.8 (001 N CaD2) but there was generally
no yield benefit in liming the soil beyond p1-I 5.0. In greenhouse experiments,
applications of 120 and 240 kg/ha P205 increased yield very significantly In the
field experiment, results were variable. Yield respon.sc to zinc application was
observed in fields which were limed or received 240 kg/ha P205. Liming increased
phosphate availability and concentration in maize plants. Both lime and phosphate
applications reduced concentration of zinc in maize plants.
y Shanria and Sharma (1991) added nitrogen (0, 30. 60 and 90 kg/ha) and
phosphorus (0, 20, 40 and 60 kg P20s/ha) fertilizers to maize cv. \'ijay crops
planted in iharnapani, Nagaland. India, in an attempt to control infection by
/;XsCm/tl/l,tfl tu/Vicillfl [Setavphaeriez Iurcicul. At harvest, grain yield significantly
increased with P levels up to 40 kg/ha followed by a decline at higher levels. The
optimum combination for highest grain yield and maximum disease control was
90 kg/ha N and 40 kg/ha P205. It is concluded that a balanced dose of N and P is
required for low disease incidence and optimum grain yield.
Jiarig ci at (2006) conducted a 20-year field experiment to (I ) assess the effect of
inorganic and organic nutrient sources on yield and yield trends of both winter
wheat and maize; (2) monitor the changes in soil organic matter content under
continuous wheat-maize cropping with different soil fertility management
seheines and (3) identiFy reasons for yield trends observed in Xuzhou City,
Jiangsu Province, China, There were eight treatments applied to both wheat and
maize: a control treatment (C) three inorganic fertilizers, that is, nitrogen (N),
nitrogen arid phosphorus (NP), and nitrogen, phosphorus and potassium (NPK);
and addition of farmyard manure (FYM) to these four treatments, that is, M, MN,
7
MNP, and MNPK At the end of the experiment the MN, MNP. and MNPIC
treatments had the highest yields, approximately 7 tonnes wheat ha" and 7.5
tomies maize ha", with each approximately I toil ha" more than the NPK
treatments. Over 20 years with FYM, soil organic matter increased by 800 /G
compared to only 10% with NPK, which explained yield increases. However, from
an environmental and agronomic perspective, manure application was not a
superior strategy to NPK fertilizers. If manure was to be applied, it would be best
applied to the wheat crop, which showed a better response than maize.
Arvind and KanthaIivj004) conducted a field experiment during 1997 to 2001-
02 on Typic lJstoehrept (Ineeptisols) of tJdaipur (Rajasthan) under the aegis of All
India Coordinated Research Project on long-tern) fertilizer experiments with
dilThrent fertilizer combinations following maize (Zea mmc)-wheat (i)-ificn,n
aesuvum) cropping system. Soil test based 100% optimum dose of N. P20c and
K20 (90:30:15) for maize and wheat showed significantly higher grain and straw
or stover yields than unfertilized, 100% N. 100% NP and FYM at 20 tones ha".
Maize and wheat exhibited maximum yields by applying 1001NO NPK + FYM 10
tones ha' and statistical equivalence of 150% NPK. The lack of potassium in the
fertilizer application schedule did not have any delctcrious effect on yield, while
the lack of both phosphorus and potassium, remarkably decreased the yield of
crop Like nitrogen, even phosphorus application also started to decrease crop
yields from 4th cropping cycle. However, application of FYM along with NPK
sustained crop yield and nutrient status of the soil
Akinrinde ci al. (2005) conducted investigation to evaluate the relative agronomic
efficiency (RAE), phosphorus recoveiy (PR) and added benefits (AB) of
combining organo-mineral (OM) fertilizer with Ogun rock phosphate, ORP
(31.00/'o P2O), Sokoto rock phosphate. SRP (360% P2O) or single super
phosphate. SSP (18% P20) using maize (Zea tnavc) and watermelon (Citrullus
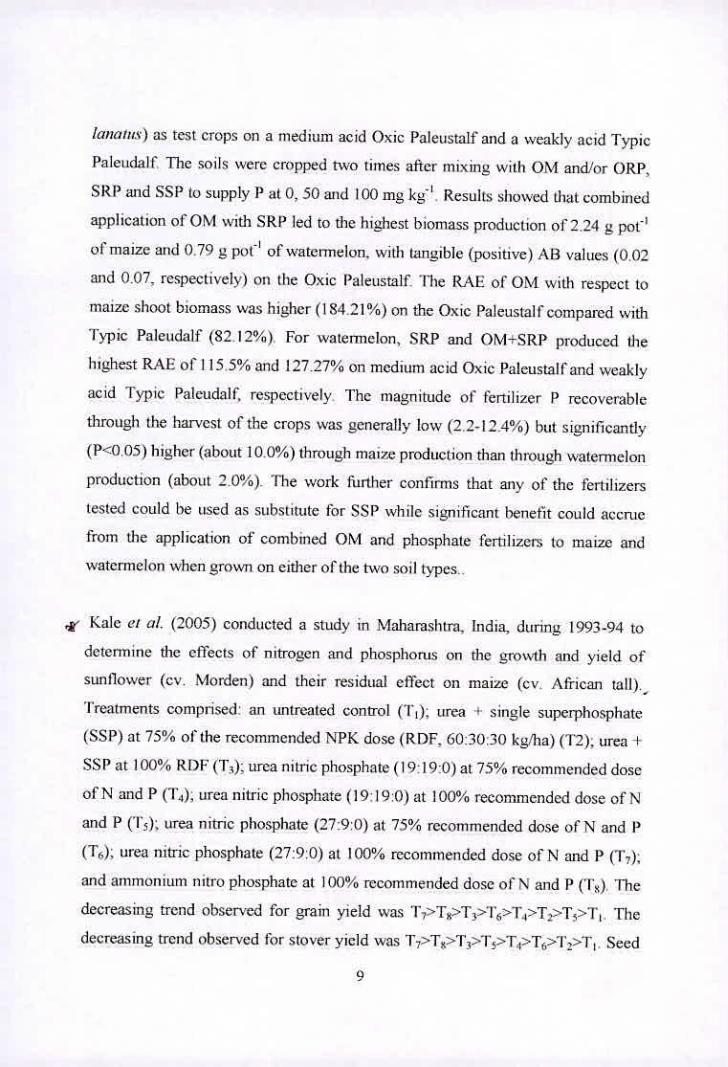
lanains) as test crops on a medium acid Oxic Paleustaif and a weakly acid Typic
Pakticlali The soils were cropped two times after mixing with OM and'or ORE,
SRI and SSP to supply Pat 0,50 and 100mg ki' . Results showed that combined
application of OM with SRI led to the highest hiomass production of 2.24 g pof'
of maize and 0.79 g pol' of watermelon, with tangible (positive) AR values (0.02
and 0.07, respectively) on the Oxic Paleustaif. The RAE of OM with respect to
maize shoot biomass was higher (184.21%) on the Oxic Paleustalicompared with
lypic Paleudalf (8212%). For watennelon, SRP and OM-rSRP produced the
highest RAE of ] 15.5% and 127.27% on medium acid Oxic Paleustall and weakly
acid Typic Paleudaif, respectively The magnitude of fertilizer P recoverable
through the harvest of the crops was generally low (2.2-12.4%) but significantly
(P<0,05) higher (about 10.0%) through maize production than through watermelon
production (about 2.0%). The work further confirms that any of the fertilizers
tested could he used as substitute for SSP while significant benefit could accrue
from the application of combined OM and phosphate fertilizers to maize and
watermelon when grown on either of the two soil types..
' Kale ci at (2005) conducted a study in Maharashtra, India. during 1993-94 to
determine the etTeets of nitrogen and phosphorus on the growTh and yield of
sunflower (cv. Morden) and their residual effect on maize (cv. African tall).,,
Treatments comprised: an untreated control (1',); urea I single superphosphate
(SSP) at 75% of the recommended NPK dose (RDF 60:30:30 kg/ha) ('12). urea I
SSP at 100% RDF (T3): urea nitric phosphate (19:19:0) at 75% recommended dose
of N and P 0'4; urea nitric phosphate (l9:19:0)at 100% recommended dose of N
and P ('1'5); urea nitric phosphate (27:9:0) at 75% recommended dose of N and P
(T6); urea nitric phosphate (27:9:0) at 100% recommended dose of N and P (F,);
and ammonium nitro phosphate at 100% recommended dose of N and P ('l') The
decreasing trend observed for grain yield was T*T?T 4>'1'6>i'.i>T,>Tc>'l'i. The
decreasing trend observed for stover yield was 1'7>T>T3>71'5>T4>T,>1',>T, Seed
0
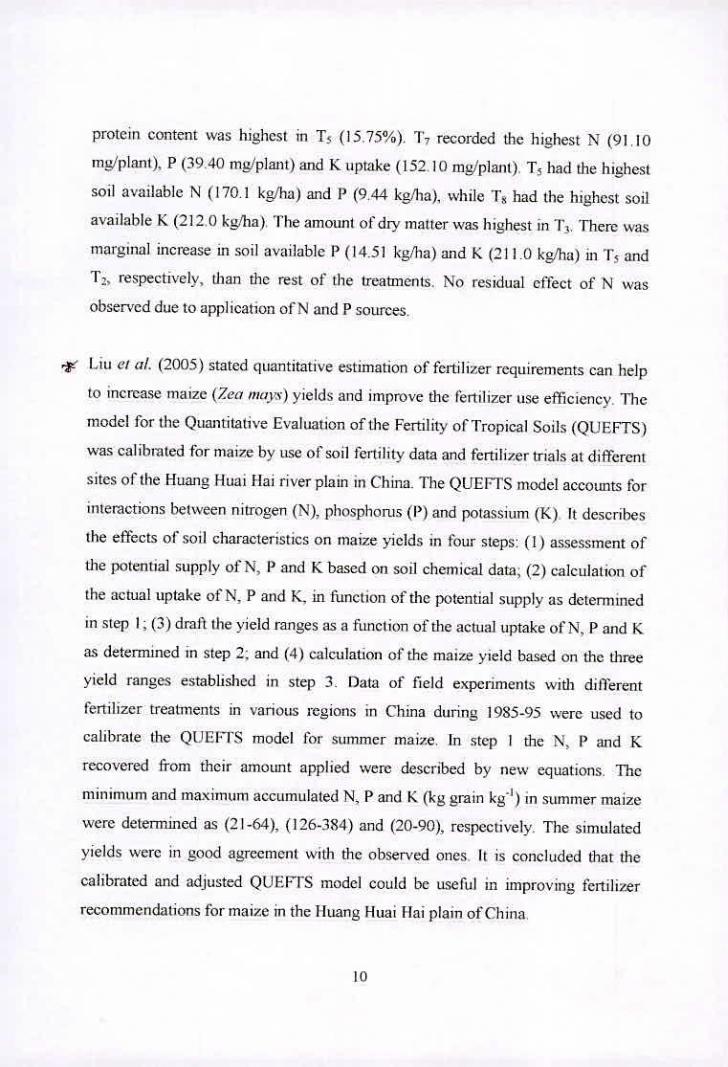
protein content was highest in T 5 (1575%). 17 recorded the highest N (91.10
mg/plant). P (39.40 mg/plant) and K uptake (152. IC) mg/plant) T 5 had the highest
soil available N (170.1 kg/ha) and P (9.44 kg/ha), while T8 had the highest soil
available K (212.0 kg/ha). The amount ofdiv matter was highest in T1. There was
margmal increase in soil available P (14.51 kg/ha) and K (211.0 kg'ha) in 'F 5 and
T 2, respectively, than the rest of the treatments. No residual effect of N was
observed due to application of N and P sources.
-w Liu et al. (2005) stated quantitative estimation of fertilizer requirements can help
to increase maize (Zea muvc) yields and improve the lertilizer use efficiency. The
model for the Quantitative Evaluation of the Fertility of Tropical Soils (QIJ EElS)
was calibrated for maize by use 01' soil fertility data and fertilizer trials at different
sites of the Kuang Huai Fbi river plain in China. The QLFEFTS model accounts for
inteietions between nitrogen (N), phosphonis (P) and potassium (K) It describes
the effects of soil characteristics on maize yields in four steps: (I) assessment of
the potential supply of N, P and K based on soil chemical data; (2) calculatioii of
the actual uptake of N, P and K, in function of the potential supply as determined
in step I; (3) draft the yield ranges as a funcil ion of the actual uptake of N, P and K
as determined in step 2: and (4) calculation of the maize yield based on the three
yield ranges established in step 3. Data of field experiments with different
fertilizer treatments in various regions in China during 1985-95 were used to
calibrate the QUEll'S model for summer maize. In step I the N. P and K
recovered from their amount applied were described by new equations. The
minimum and maximum accumulated N. P and K (kg grain kg'1 ) in summer maize
were determined as (21-64). (126-384) and (20-90), respectively. The simulated
yields were in good agreement with the observed ones It is concluded that the
calibrated and adjusted QUEFTS model could be uselul in improving fertilizer
recommendations for maize in the Iluang Huai iIai plain of China
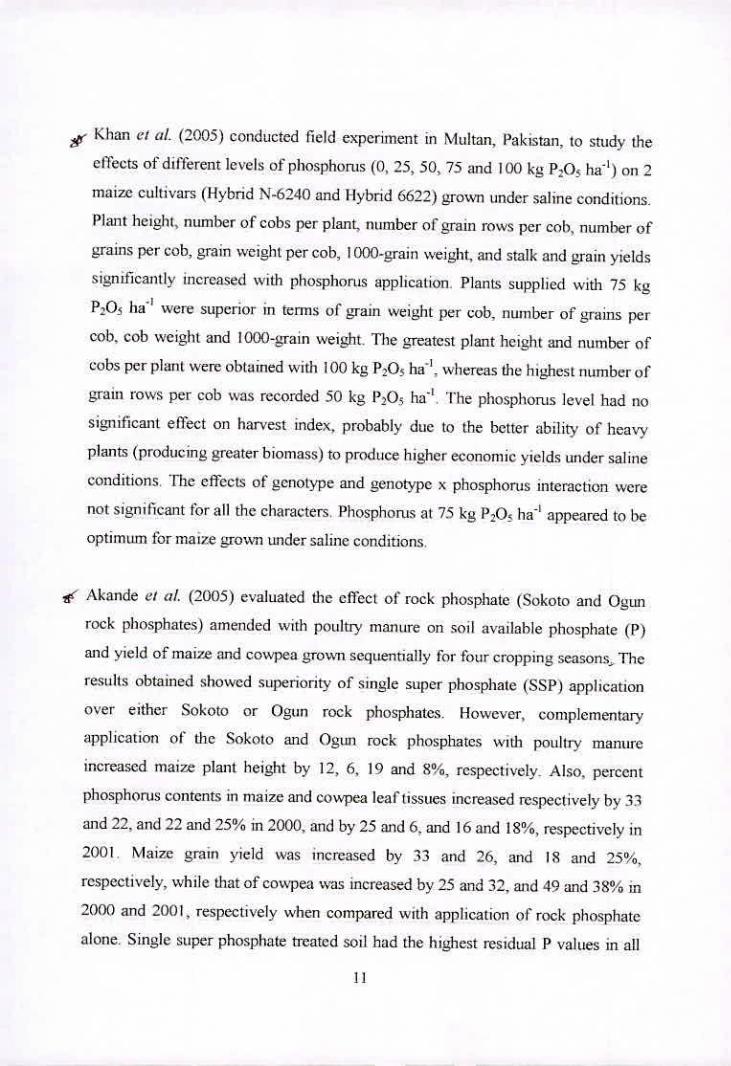
AK Khan ci at (2005) conducted field experiment in Multan, Pakistan, to study the
effects of different levels of phosphorus (0,25,50,75 and lOU kg P:O ha") on 2
maize eultivars (Hybrid N-6240 and 1-lybrid 6622) grown under saline conditions.
Plain height, number of cobs per plant, number of grain rows per cob, number of
grains per cob, grain weight per cob, I 000-grain weight, and stalk and grain yields
significantly increased with phosphorus application. Plants supplied with 75 kg
P205 ha" were superior in terms of grain weight per cob. number of grains per
cob, cob weight and 1000-grain weight. The greatest plant height and number of
cobs per plant were obtained with 100 kg P20c hi', whereas the highest number of
grain rows per cob was recorded 50 kg 13205 ha". The phosphorus level had no
sitznificant effect on harvest index, probably due to the better ability of heavy
plants (producing greater biomass) to produce higher economic yields under saline
conditions. The effects of genotype and genotype x phosphorus interaction were
not significant for all the characters. Phosphorus at 75 kg P20 ha" appeared to he
optimum for maize grown under saline conditions.
Akande ci a,. (2005) evaluated the effect of rock phosphate (Sokoto and Ogwi
rock phosphates) amended with poultiy manure on soil available phosphate (P)
and yield of maize and cowpea gro\1i sequentially for four cropping seasons The
resLills obtained showed superiority of single super phosphate (SSP) application
over either Sokoto or Ogun rock phosphates. However, complementary
application of' the Sokoto and Ogwi rock phosphates with poultry manure
increased maize plant height by 12, 6, 19 and 8%, respectively. Also, percent
phosphorus contents in maize and cowpea leaf tissues increased respectively by 33
and 22, and 22 and 25% in 2000, and by 25 and 6. and 16 and 189 /0, respectively in
2001. Maize grain yield was increased by 33 and 26, and IS and 25%,
respectively, while that of cowpea was increased by 25 and 32. and 49 and 38110 in
2000 and 2001, respectively when compared with application of rock phosphate
alone. Single super phosphate treated soil had the highest residual P values in all
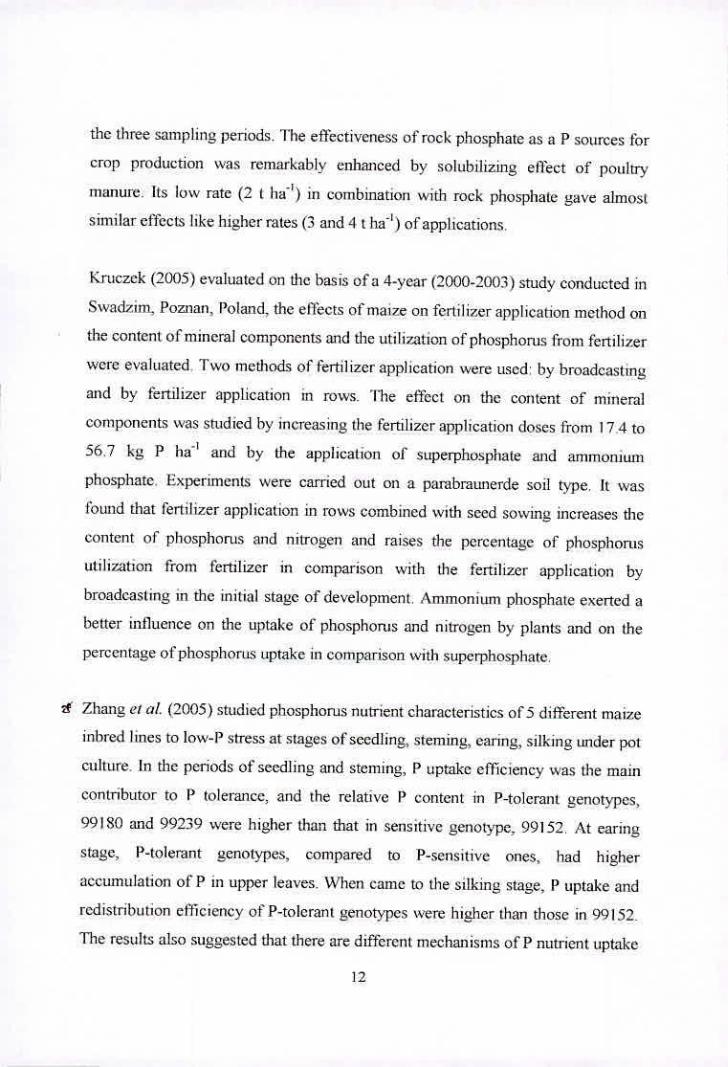
the three sampling periods. The effectiveness of rock phosphate as a P sources for
crop production was remarkably enhanced by solubilizing effect of poultry
manure. Its low rate (2 t h&) in combination with rock phosphate gave almost
similar effects like higher rates (3 and 4 t ha4 ) of applications.
Kruczck (2005) evaluated on the basis of a 4-year (2000-2003) study conducted in
Swadzim, Poznan, Poland, the effects of maize on fertilizer application method on
the content of mineral components and the utilization of phosphorus from fertilizer
were evaluated Two methods of fertilizer application were used: by broadcasting
and by fertilizer application in rows. The effect on the content of mineral
components was studied by increasing the fertilizer application doses from 174 to
56.7 kg P ha4 and by the application of superphospliate and ammonluin
phosphate. Experiments were carried out on a parabraunerde soil type. It was
found that fertilizer application in rows combined with seed sowing increases the
content of phosphorus and nitrogen and raises the percentage of phosphorus
utilization from fertilizer in comparison with the fertilizer application by
broadcasting in the initial stage of development. Animonium phosphate exerted a
better influence on the uptake of phosphorus and nitrogen by plants and on the
perccntaue of phosphorus uptake in comparison with superphosphate.
Zhang etal. (2005) studied phosphorus nutrient characteristics of 5 different maize
inbred lines to low-P stress at stages of seedling, steming, earing, silking tinder pot
culture. In the periods of seedling and steming, P uptake efficiency was the main
contributor to P tolerance, and the relative P content in P-tolerant genotypes,
99180 and 99239 were higher than that in sensitive genotype, 99152. At earing
stage. P-tolerant genotypes, compared to P-sensitive ones, had higher
accumulation of P in upper leaves. When came to the silking stage, P uptake and
redistribution efticicncy of P-tolerant genotypes were higher than those in 99152.
The results also suggested that there are different mechanisms of P nutrient uptake
12
and distribution in diflèrent P-tolerant genotypes. Inbred line 99239, aecordinQ to
the investigation, was considered as an efficient stock in the P-uptake while 99180
fallen to the efficient stock of P redistribution.
Araujo ci at (2004) determined the afThcrs of triple superphosphate. maunesium
Ihennophosphate. And reactive rock phosphate and Araxa rock phosphate,
applied on the whole plantation area or banded in sowing furrow at ISO kg P20,
on the yield and nutrition of maize in a field experiment conducted in Minas
Germs, Brazil. Yield was higher with the application of the most soluble forms of
phosphorus viz triple superphosphate and magnesium thermophosphate on the
whole plantation area and with reactive phosphate banded in the sowing furrow.
Triple superphosphate applied in sowing furrow decreased the yield of the crop.
Leaf analysis during the flowering stage was the most suitable for the evaluation
of P and Zn balance in the crop.
' Wang c/at (2004) grew inbred lines of maize in a field experiment and supplied
with phosphorus (P) at 2 rates (10.5 and 84kg P205/ha, respectively). Low P stress
enlarged the gap between different maize genotypes in their major yield-
contributing characteristics. Classification of lines on P use-efficiency based on
yield reduction percentage under low P stress showed that high P use-efficient
genotypes had relatively low response to P application, averaging 692, while the
response to P was much higher in low P-efficient genotypes. averaging 25.60.
Correlation analysis indicated that the yield reduction percentage showed a highly
significant positive correlation with P response.
Selassie et at (2003) conducted field and laboratory experiments to develop
equations I'or estimating phosphorus fertilizer requirements of maize on Alfisols of
Northwestern Ethiopia. The field experiment on 20 sites was arranged in
randomized complete block design with five fertilizer rates (0. 30, 60. 90 and 150
13
kg P205Iha) aM four replications. At maturity, three cenni rows were harvested
and yield and yield component data were collected Laboratory analysis of soil
samples was conducted following chemical soil analysis methods: Bray-I. Bray-I
Olsen, Mehl,ch-1, anion exchange resin and extraction with 0.0IN CaCl 2
Parameters of the quantity/intensity relationships were also determined. Reliable
methods were identified by fitting relative grain; relative dry biomass and P yields
in a double log curvilinear regression model and those availability indices giving
superior correlation were selected. Consequently, grain yield data and phosphorus
availability indices were fitted into the Mitscherlich-Bray model to develop
fertilizer recommendation equations. Among the methods giving quantity of
available P. Bray-2 and Olsen methods gave the most reliable indices. Moreover,
the intensity parameters in combination with the quantity parameters gave slightly
superior correlation coefficient with yield parameters compared with their
individual effects, 'Ilie equations developed (or estimating P fertilizer
requirements of maize from soil analysis were: (a) log 000-v)=2-0.1468b-
0.007546x and ('b) log (100-y)2-0 I 167b-0.007546x for Olsen and l3ray-2
methods, respectively, where y was desired relative grain yield (%); h was soil P
availability index (mg kg''); and x was P fertilizer requirement (kg had) The two
equations were statistically proven to provide equally reliable estimates of P
fertilizer requirement of maize on Allisols ofNorthwesteni Fihiopia.
Kruczek and Szule (2004) stated that as a result of row application of a fertilizer at
sowing time, a significantly higher infestation of maize (Zea mayc) plants by
f'usanosis than in ease of broadcast fertilizer application. Using polidap, the
infestation of maize by flisariosis increased as compared to superphosphate. As
rates olphosphorus increased from 40 to l3C) kM P205 ha". percent invasion by flit
fly plants gradually increased from 4.9%, in the case of rate 40 kg Poi ha4 and to
6.6% when rate of 130 kg P20 ha" was used. Using polidap increased the
percentage of invasion by flit fly as compared to superphosphate. Row fertilizer
14
application at sowing time increased the percentage of plant invasion by flit fly as
compared to broadcast fertilizer application.
Li-Shao Chang u/ui (2004) plantcd maize variety KH5 with high phosphorus use
efficiency (HPE) and the low efficient (LPE) variety Xi502 in sand. Pots were
supplied with P at a low rate (Pt of 25 micro niol/litre) and normal rate (Pi of 2 in
mol!litre). The IEPE variety exhibited higher N and K uptake efficiency in the low
P regime. Its nitrogen (N) and potassium (K) uptake and dry matter accumulation
were less afThcted by low P supply With lower P rate, N and K uptake by plants
and dry matter production of the LPE variety were much lower than that of HPE,
though the LPE variety had significantly higher N and K uptake and dry matter
accumulation when growi under normal P regime. Low P supply induced an
increase in dry matter accumulation rate and N and K distribution in the roots, and
this trend was more striking in the LPE variety, indicating its lower tolerance to
low P stress.
Thind ci of. (2003) carried out a screenhouse study to evaluate the relative
efficiency of five methods viz., Olsen, Bray, Morgan, Double acid and CaCh for
deterniining P availability to winter maize (2cc, mavc cv. Par-tap). Twenty nine
alluvial soils from Ludhiana, Punjab. India, van'ing in available P stattEs were used
to grow the crop for 60 days with P applied at 10. 20, 30 and 40 mg/kg soil.
Phosphonis extracted with Olsen's method (0.5 M NaHCO3, p11 8.5) showed the
highest correlation with crop dry matter yield (r 0.72*). A value of 5.5 mg P/kg
soil determined with this method "as fbund to be the critical deficiency level
below which maize may respond to P application.
Kumaresan ci of. (2003) conducted a field experiment durinu 1997-98 and 1998-
99 in Tamil Nadu, India. to determine the phosphorus (P) balance in a maize-
sunflower-cowpea fodder cropping system. P sources used in the main plots were
15
Mussoorie rock phosphate (MItP) 1 microbial inoculants, MRP alone, single
superphosphate (SSP) - microbial inoculants and SSP alone, while in suhplots. 50.
75 and 100% recommended level of P205 were used The P205 uptake was higher
in the treatment with SSP + microbial inoculants followed by SSP alone. The
recommended level of P205 when applied for all the crops in the system increased
the PO5 uptake which was attril)uted to increase soil available P205. The 11205
application also showed a theoretical positive balance.
Simonete ci a/i (2003) studied the effect of sewage sludge on the chemical
prO])erties of a Red-Yellow Pov.olk soil (Ijltisol), and on nutrient accumulation
and dry matter yield of maize plants. The experiment was carried out in a
greenhouse, in a completely randomized design and treatments were arranged in a
6x2x2 factorial. Soil (3 kg) inside pots was treated with 0. tO, 20. 30. 40 and 50
tones ha' (dry-basis) of sludge. Thirty clays after incubation, soil samples were
taken for analysis, complementatioji with P(0 and 100 Mg lui') and K (0 and 100
Mg haS') was done and five maize plants were grown in each pot for 50 days. The
application of sewage sludge increased organic matter. P. K, Ca, Mg. 5, Al and
HAI and reduced the pt-I The accumulation of nutrients and dry matter yield
were higher with sewage sludge application and increased with the application of
K, but not with the application of phosphorus
Shiluli c/ (z/i (2003) conducted experiments in faniiers' fields in 2 locations
(l.ihanda and Jina) in western Kenya from 1994 to 1996 to determine the
agronomic and economic benefits of applying nitrogen (N) and phosphorus (P) to
maize. The soils were well-drained sandy clay barns of moderate to high fertility.
Treatments comprised four N levels (0, 30, 60 and 90 kg/ha, applied as urea)
combined with three P levels (0. 40 and 80 kg/ha, applied as triple
superphosphate). Statistical analyses of yield data revealed that N application
consistently affected grain yield significantly at both locations. P had a significant
16
effect on yield once at each location. There was significant N x P interaction
effects once at each location Analysis across sites .slioved that N and interactions
were statistically significant. The statistically significant treatments were subjected
to economic analysis using the partial budget procedure to determine the N: P
rates that would give acceptable returns at low risk to farmers. Economic analysis
on the interaction across location showed that two N:P combinations. i.e. 30:0 and
60:40 kg/ha, were economically superior and stable within a price variability range
of 20%..
Alexandrova and Donov (2003) conducted a field experiment on leached
Srnolnitza soil during 1982-1987 at Sredec. Stara Zagora region. Pakistan, to study
the response of two maize hybrids (300 and 700 FAO) to five levels of nitrogen (0.
302. 242. 182, 121 kg N ha4 ) and phosphorus (0, 65, 52, 39. 26 kg P ha4). Plant
samples were evaluated for dry biomass and total nitrogen content at 14 days after
gennination. The uptake of nitrogen was evaluated based on these parameters.
During the vegetative period, some meteorological parameters that influence
maize growth, and N content and uptake were measured daily (at 7.00, 14.00 and
21.00 h). Regression equations describing the relationship between temperature
sum, precipitation sum, and saturation deficit sum and nitrogen uptake for each
nitrogen and phosphorus fertilizer rate were determined. The effects of
meteorological conditions on the uptake of nitrogen were influenced more by the
fertilizer level than by the hybrids.
Jibrin ci aL (2002) opined that phosphorus deficiency is the major constraint to
maize (Zea ,nac) production in acidic soil of Heipane in Northern Guinea
Savanna of Nigeria The soil is high in sesquioxides and soluble aluminium and
has high phosphate soiption capacity To address this problem, a field trial was
conducted between 1996-97 to assess the responses of six tropical cover crops
(Glycine max, Chaniacerista rotundifhlia, Lablab purpureus, Mucuna pruriens,
17
Phaseolus vulgaris and Cajanus cajan) and maize to lime and applied rock
phosphate and to evaluate the effect of these treatments on the perfot-mance and P
nutrition of succeeding maize. Results of the trial showed that planting
Chamacerista roturidifolia, labtab purpiireus. Mucuna pruriens. and maize-C
rotundifolia intercrop reduced die leaf Al concentration of succeeding maize by
more than 38% Although none of the six cover crops significantly increased grain
yields of succeeding maize, C. rotundifolia was the most consistent in improving
maize performance while Glycine max produced the least performance.
Concentration of Mn in the index leaves of maize was significantly higher on plots
where G. max preceded maize, thus accounting for the poor performance of maize
on these plots. Application of Sokoto phosphate rock at 30kg hii' to cover crops
produced very similficant improvement in the yields of succeeding maize While
liming with 1.35 t GaO ha in 1997 increased the soil p11 value by 0.2 and
significantly improved total P uptake by maize.
Punishotham et at (2002) conducted a study in Tiptur, Kamataka, India, to
investigate the response of fodder maize to different levels of Nit (lOU, 75 and
50% recommended dose of fertilizer (RDF)) and sulffir (0. 20, 40 and 60 kg
sulfur/ha) under imgation during late rahi seasons of 1994 and 1995. Most growth
parameters, except leaf area and green fodder yield, were not significantly
influenced by the different fertility levels and sulfur nutrition. The leaf area was
significantly increased (II 11/0) at 40 kg S/ha. It is suggested that the fertility level
0150% RDF - 75:375:25 kg NPK/ha is the optimum for fodder maize in late rahi
season under irrigation.
Manoj-Kumar and Sungh (2003) conducted a field experiment during the rainy
season (k/tar/fl of 2000 at SASRD. Mcdzipliema, under rainfed condition of
Nagaland. India to study the effect of nitrogen and phosphorus levels on yield and
nutrient uptake of maize (7. mays) cv Vijay. The treatments comprised four
18
nitrogen levels (N(,. Ns0, N,00 and N,51) and three phosphorus levels (1)(1. P4 , and
P 1). The stover and grain yield increased significantly with the increasing level of
nitrogen and phosphorus. The highest stover and grain yiclds were 6492 and 30.0
qiha, respectively, with the highest level of nitrogen and phosphorus (N, 0 and P)
combination. Interaction among different rates of nitrogen and phosphorus did not
show any significant eulèct on slover and grain yields. The nitrogen arid
phosphorus uptake by grain and straw increased significantly upto 150 and 80
kg/ha. respectively. The highest N uptake was 52.89 and 33.76 kg/ha in grain and
straw- respectively. The highest phosphorus uptake by grain was 12.68 kg/ha and
straw 2077 kg/ha with N,, and P 0 combination. The highest K uptake by straw
and grain was 9.89 and $0.94 kg/ha, respectively, and it increased with increasing
levels of nitrogen and phosphorus.
Singh CI 0/. (2002) studied the grovth responses of maize genotypes. i.e., VL90
and VL 16 of low and \'L89 and filM 129 of relatively high P requirements, to
inoculation with a native consortium of arhuseular rnvcorrhizal (AM) studied in a
sandy loam soil fertilized with single superphosphatc (SSP) to provide 0 (P,), 60
(P,), 90 (P) and 120 (P3) mg P kg' soil. AM colonization significantly increased
vegetative plant growth after 45 days at Po and P, levels for genotype V1.90 and
VLI 6, at P2 and P3 levels for \'L89 and 130. P1 and P2 levels in FIlM 129. Except for
a growth depression in roots and shoots of AM plants was observed at
either 132 or P3 levels. This was most pronounced in VL9O and VL 16 In contrast,
in non-mycorrhizal plants no growth depression was observed; genotype VL90 at
P3 was an exception. Root and shoot P. and shoot Zn concentrations were
significantly higher in AM compared with non-mycorrhizal plants, at various P
levels. However, the pattern of phosphorus and zinc uptake in mycorrhizal and
non-mycorrhizal shoots was genotype specific. Alkaline phosphatase (Al. Pase)
activity of mycorrhizaf and non-mycorrhizl roots was variable with respect to
genotype and soil P level. In mycorrhizal roots ALPase activity was significantly
19
higher at P0 and P1 levels in V1.90, P0, P1 . P2 level in VL 16. P2 and P3 levels in
VL89 and at all P levels in genotype HIM 129.
Stanchev (2001) investigated the cilect of phosphorus and zinc fertilization on the
accumulation ol biornass olthe maize hybrids P3978 (FA03I 0). Kneja 430 (FAO
430) and 4708 (FAO 650) grown monoculture and the removal of phosphorus with
over ground povet of maize in a field fertilized trail without irrigation on
calcareous chemozem in North-East Bulgaria. it was found that the contents of
phosphorus increased and the biomass decreased from the high rates of P
fertilization. The dry matter of maize hybrids increased, but the P contents
decreased from the zinc fertilizer more clearly expressed for vegetative mass
compared to the effect of maize. The formation of biomass is in direct dependence
with the level of phosphorus and the applied zinc fertilizing as well as with the
meteorological conditions during the vegetation of the maize hybrids. The hybrid
133978 (FA03I0) was formed 10.3-16.6 Uha biomass in the over ground part of
the plants and removed 44.8-60.1 kg/ha 1?20 and hybrid 4708 (FA0680) was
tbniied 7.7-1968 t/ha biomass and 19.2-82.6 kg/ba P,O removed with it. It was
found that the hybrid 133978 consumed 7.0-15.4 kg P204. Kneja 430-7.4-16.4 kg.
and H708-5.5-16.7 kg per It of grain and vegetative mass. With the aid of derived
regression equations the removal of phosphorus along with the yields of organic
mass of maize hybrid in Northwest Bulgaria. Values are suggested for the
consumption of P. which may be applied in determined fertilization rates for
yields olniaize hybrids
Leach and Hanieleers (2001 ) grew forage maize (Zea mczvv) in areas where spring
temperatures are low and accumulated heat is limited will be restricted in terms or maturity and thus nutritional value S A stagnant growth phase is commonly caused
by low temperatures between germination and the five-teal stage, which could be
caused by reduced mineral availability. The effects on maize plant development
20
and harvest characteristics 01' supplying phosphorus and zinc to young plants in a
foliar spray were investigated Three different application dates, between the four-
leaf and the seven-leaf stage, were compared. Applying the phosphorus and zinc
foliar spray at the four-leaf stage resulted in a significant (P<005) increase in
starch content at harvest. Cob index (proportion of plant dry matter (DM) in the
cob) was increased (P<0 05) by applying the nutrient spray at the four-, five- and
seven-leaf stages. llowevcr. there was no effect on DM yield, suggesting some
alteration in partitioning within the plant.
Sankhyan C al. (2001) conducted a study in an Alfisol at Palampur. Himachal
Pradesh, India, during 1994 and 1995, to determine the effect of mulching with an
organic waste from wild sage (Lantana camara), farmyard manure (FYM) and
phosphorus on soil moisture and productivity of maize. Results showed that there
was no significant effect of phosphorus levels on soil moisture content at 0-15. 15-
30 and 30-45 cm depth in both years. Application of I .antana mulch improved the
soil moisture content. Application of FYM increased the soil moisture content at
0-I5 and 15-30 cm depths at flowering in 1994 and 1995, but there was no
significant effect at 30-45 cm depth. There was a significant and consistent
increase in the productivity of maize at each levcl of phosphorus over control
during years. Lantana mulch increased dry matter production and grain and stover
yields. The dry matter productivity and graiti and stover yields recorded a
significant increase with the application of 10 t FYM per ha over no FYM
application. Interaction effect involving FYM and mulch on soil moisture at 0-I5
and 15-30 cm depths was found significant in 1995, whereas, in the other depths
and year, 110 significant effect was observed in the treatment
Ortas ci at (2001) investigated the effects of selected mycorthizal inoculates on
growth, zinc (Zn), and phosphorus (P) uptake of maize and green pepper in a Zn-
and P-deficient calcarcous soil from the Central Anatolia, Turkey The soil was
21
stenlized by autoclavinq and plants were groii for 7 weeks in pots tinder
greenhouse conditions with inoculation of two selected arbuscular mycorThizal
(AM) species ((I. mosseae and G. etunicatum) at three rates of P (0. 25 and 125
mg P kg soil) and two rates of Zn (0 and 5 mg Zn kg" soil). Without mycorrhizal
inoculation, shoot and root dry matter production were severely affected by P and
Zn deficiencies, and supply of adequate amounts of P and Zn significantly
enhanced plant growth. When the soil was inoculated with mycon-hizal inoculates,
the positive effects of P and Zn fertilization on plant growth remained less
pronounced. In agreement with growth data, mycorrhizae inoculation enhanced P
and Zn concentration of plants, especially tinder low supply of P and Zn. The
results indicate that maize and green pepper [('ups/cnn; sp.j are highly
rnyeorrhizal-dependent plant species tinder both low P and Zn supply and
mycorrhizae play an essential role in P and Zn nutrition of plants in P and Zn
deficient soils.
Ilussaini ci cii (2001) carried out a field study from 1996 to 1998 at the Sudan
Savanna region of Nigeria to evaluate the effects ol' four levels of nitrogen (0, 60,
120 and 180 kg N/ha), three irrigation regimes based on irrigation
water:eumulative pan evaporation ratios (lW:CPIi) of 0.6, 0.8 and I 0, and three
phosphorus levels (0. 20 and 40 kg P/ha) on the growth and development of maize.
Nitogen fertilization signilicantly enhanced the growth of maize in tentis of total
dry matter, plant height, growth rate and leaf area index, while the effect of P was
not so pronounced Increasing frequency of irrigation resulted to a positive
response in the growth and development of maize, with lW:CPE ratio of 1.0
outperforming the other irrigation levels.
Patel ci cii (2000) conducted a field experiment to study the response of
phosphorus (P) level on the growth and yield of maize in Gujarat, India, during the
khurif seasons of 1995-97. Treatments comprised: 4 P levels (0, 20, 40 and 60
22
kg/ha). The highest plant height (161 cm) and thy matter production (3680 kg/ha)
were observed upon treatment with 60 kg P/ha. The highest number of cobs per
hectare (69 167) and test weight (195 g) were recorded upon treatment with 60 kg
P/ha, which were at par with those obtained upon the 40 kg P/ha treatment. The
highest net return (Rs, 9772/ha) was obtained upon treatment with 60 kg P/ha with
a cost leneflt ratio of 1:2.58, tbllowed by treatment with 40 kg P/ha which
recorded Its. 8942/ha net return and 1:2.55 cost benefit ratio. Treatment with 60 kg
P/ha recorded the highest yield (2453 kg/ba).
Nziguheha ci al. (2002) conducted a field experiment on a P-fixing Acrisol in
western Kenya to study the possibilities of replenishing soil P with seasonal
additions oismall rates of P fertilizers..riple superphosphate was applied at 0. 10,
25, 50 and 150 kg P ha for 5 consecutive maize growing seasons followed by 4
seasons of residual crops. Maize yields and soil P fractions were detenined.
Although maize responded to additions of 10 kg P ha' with a cumulative grain
yield of 16.8 t hi', at the end of the experiment, compared to 8.8 t hi' in the non-
P fertilized plots, soil labile P did not increase correspondingly. Seasonal additions
of 150 kg P had increased maize yields to a cumulative value of 39 t ha1 at the
end of the experiment, and increased all soil inorganic P fractions. At the third
season of residual phase, treatment with a cumulative addition of 750 kg P ha
gave the highest yields compared to treatments in the same residual stage, but
these yields were considered less than the maximum yield of the season. This
indicates that the large build tip of soil P was not available for crop uptake. The
inorganic P fraction extracted by NaHCO 3 was the most affected by changes in
management, increasing during the input phase and decreasing afler interruption
of P addition, for all P rates. The deemase in this pool during the residual phase
could he explained by the maize uptake This study showed that seasonal additions
of 25 kg P ha" can increase maize yield with gradual replenishment of soil P.
23
Lrng-Fan and Silberbush (2001 ) conducted an experiment to determine the
efficiency of different forms of nitrogen-phosphorus-potassium (NPK) fertilizers
applied to maize (Zea lncwv), either to the soil or to the leaves. Two sweet corn
plants (cv. Jubilee) were grown in plastic bags with 10.5 kg silt loam desert soil
(Typic Haplocalcid). Before planting, the soil was mixed with zero (control), half'
or fill (lose of 06 g, N, 0.4 g P, and 0.3 g K per pot as mineral forms. or as the
"Global-Green" (GG) foliar fertilizer. Three forms of foliar fertilization were
applied once a week in equivalent concentrations of N, P. and K (0.12 g N. 0.08 g
P. and 0.06 g K5: Mineral forms (NPK), 0(1. and "Fertilizers & Chemicals" foliar
fertilizer-.,, plain water acted as the control. The plants were harvested after 55
days. The roots were washed from the soil and length measured. The shoots were
measured for leaf area, fresh and dry weight, and leaf contents of chlorophyll, N,
P, and K. All indices increased in response to all forms of foliar fertilization (FE),
but no significant difference was obtained between the different fonns. Global-
Green was less effective as a soil fertilizer (SF) than NPK. The effectiveness of FE
appeared to be limited by the holding capacity of leaf surface area for the liquid
fertilizer. It was concluded that FE may partially compensate for insufficient
uptake by the roots, but requires sufficient leaf area to become effective.
2.2 Response of maize to sulphur fertilization
Khan ci at (2006) conducted a field experiment to assess the effect of different
levels of sulfir ('5) on yield and yield components of maize crop grown on silt
loam soils at the Agriculture Research Station Haifa. district Mansehra The soil
contained 1.17% organic mattei', 10% CaCO3. and 39 ing $04-S kg'. Sulfur was
applied at 0,20.40,60, 80. 100, and 120 kg ha" as gypsum along with 120 kg N.
90 kg P1O. and 60 kg K20 ha" replicated thrice in RCI3 design. Soil samples at
silking and harvesting stage from each treatment plot along with leaf samples were
collected for die determination of S. Yield and yield components of maize were
significantly (p<0.05) enhanced with the application of S compared with control.
24
SultI.rr at 60 kg ha' produced the highest yield of fresh matter, dn' matter. stover,
1000-grain and total wain, resulting in increases of 41, 55, 58. 5. and 43%,
respectively. Application of S above 60 kg S hal' reduced yield and yield
components., stlesting a classical yield response curve. The analysis of soil
samples at silking and harvesting stage from each treatment plot revealed that soil
504-S concentration increased significantly by S application reaching the level of
108.4 and 99.7 rug kg1,respectively, with 120 kg S ha1. Suiflir concen&atiori of C) leaves was significantly increased with the application of S compared with the
control. Application of sulfur at 60 kg hal' produced leaf S concentrations of
0.46%. which is less than the critical level of 0.5%. whereas higher treatments
increased S concentration ranging from 0.67 to 0.94%, which exceeded the value
'Th considered as high (0.5%) and excessive (0.8%). Elevated tissue sulthte
concentrations induced by treatments greater than 60 kg ha" corroborate with the
corresponding yield decreases of maize. Maize growers of the area may add S up
to 60 kg ha-Ito obtain maximum yield.
0
Mehta cial. (2005) conducted a field experiment during the rainy (k/writ) seasons
of 1999 and 2000, on clay loam soil, in Iidaipur, Rajasthan. Jndia. to study the
effects of sulfur (0. 30 and 60 kw'lia), phosphorus (20. 40 and 60 kg/ha) and
farmyard manure (FYM) (0 and 10 t/ha) on the productivity of maize. Data were
recorded for cobs per plant, rows per cob, cob weight, grain weight per cob,
shelling percentage, seed index, seed and stover yields, and N, P, S and Fe uptake.
All parameters increased with increasing levels of sulfur, phosphorus and [-'YM
However, no significant differences were observed between the two higher rates of
phosphorus.
2L
Fonseca ci at (2005) carried out an experiment to study the effects of maize to
irrigation with secondary-treated sewage effluent (51SF) on soil pH. electrical
conductivity (Ec), and on the available soil concentrations of calcium (Ca),
25
magnesium (Mg), potassium (K), sodium (Na). aluminium (Al), sulttir (5), boron
(B), and of heavy metals and to investigate the plant element accumulation, except
for Al, The treatments consisted of mineral fertilization and irrigation with the
STSE. After 58 days, maize plants were harvested, and soil and plant were
analysed. The STSE effectively reduced the mineral nitrogen fertilizer soil-
acidifying effect, induced increases in the EC. and in the base saturation, and did
not significantly alter the available concentrations of S, B, and heavy metals. The
STSE irrigation did not affect the shoot S. B, copper (Cu), iron (Fe), and
manganese (Mn) contents in plants properly fertilized, but it induced a decrease in
shoot zinc (Zn) content. Sodium was the most affected element by the STSE
irrigation.
Cui c/ui. (2004) conducted a pot experiment to study the influence of elemental
sulfur (S) on soluhility of soil Pb, Zn and ('d and uptake by maize (Zecs ,navc L.)
Two rates of elemental sulfur (5) applied at 0(S0) and 200 (S) rnrnol kg soil
with three rates of each heavy metal at Pb. 0 (Pb1). 200 (Pb,0), 400 (Pb.,) mg kg
soil. Zn. 0 (Zn,)). 100 (Zn10 ). 200 (Zn,) mg kg ' soil and Cd, 0 ((d<,), 50 (Cd)).
100 (C:d1 ) nig kg' soil, respectively. The result showed that with S application at
200 mmol S kg'. soil p11 decreased about 0.3 units and the solubility of the Zn
and Cd was significantly increased, but the solubility of Pb had no significant
influence. The concentration of Pb. Zn and Cd in maize shoots and roots were
increased with increasing rates of heavy metals. However, the concentration of Zn
and Cd in shoots and roots were higher with application of S rather than without S
but no siwiificant difference was found for Pb. The highest concentration of Zn in
the shoots was 2.3 times higher with application of S rather than without at the
same rate of Zn, 200mg kg-I Plant biomass was also significantly affected by the
application of S and of heavy metals. With heavy metal addition, the shoot and
root biomass were decreased with the rates of those of heavy metals increased
either with or without application of S. However, the shoot biomass was
26
signthcijy decreased with S application at the same rate of heavy metals except
that with Zn addition The removal of Cd and Pb by maize uptake and
accumulation with application of S had no significant increase compared to that
without, but the removal of Zn by maize uptake from tFie soil increased by
application ol S. 90.9 micro g plaiW' contrasts to 25 7 micro g planr! at Zn 200
within a growth period of only 40 days.
Pandey ci of. (2002) studied the effects of sulfur (0, 10, 20, and 30 mg/kg soil) on
div matter yield and plant nutrition in maize (hybrid Deccan 103) grown in pots
containing soil types (25 soil types categorized as Inceptisol. Altisol. Mollisol, and
Vertisol) of various physicochemical properties and available sulfur content,
which were collected from India (Uttar Pradesh, Bihar, Madhya Pradesh. Andhra
Pradesh. Karnataka, New Delhi. and Haryana). Sulfur application up to 20 mg/kg
significantly increased dry matter yield, sulfur content, and sulfur uptake In
general. the response to applied sulfur was greater in soils with low content of
available sulfur (<10 mg/kg soil) than in soils with high content of available sulfur
(>10 mg/kg).
\Iajurndar ci at (2002) conducted a field experiment in tfrniarn, Meghalaya,
India, for two consecutive years (1999-2000) with 3 levels of N (0, 50 and 100
kg/ha). 2 levels of") (0 and 20 kgTha), and 2 levels of pig manure (0 and 5 I/ha).
ftc incieasIn2 levels of N. S and pig manure were found to increase the yield.
introizen and sulfur uptake and crude protein content of maize and residual
mustard crop significantly. The oil content of mustard decreased with N
application but increased with S and pig manure application. The post harvest
contents of available S. N and inorganic. N-fractions in soil significantly increased
with N, S and pig manure application. The interaction effects of nitrogen and
sulfur and nitrogen and pig manure significantly influenced the yields and nutrient
uptake of both maize and mustard crops. Nitrogen use efficiency estimated as
27
agronomic efficiency, physiological efficiency and also apparent N recovery were
found to be higher at 50 kg N in comparison to 100 kg N/ha for both the crops
Application of lOU kg N, 20 kg 5+5 t pig manure/ha was found suitable to get
maximum grain yields and better quality for both the crops
Sankaran ci at (2002) carried out an investigation to study the available S status
of some soils of Coimbatore district. Tamil Nadu, India, and to evaluate the direct
and residual effect of S application on maize-green grain cropping system. Sulfur
deficiency was greater in red soils (Lidic Haplustalf) than in alluvial soils
(Fluventic Flaplustalt). A positive correlation was observed between available S
and organic carbon. Results of field experiments conducted in two locations
showed that maize responded to direct application of S tip to 45 kg ha" as judged
by increased yield of grain and straw. S uptake and available S status. A residual
effect of S on succeeding green grain was also observed. Based on S use
efficiency and value cost ratio, 30 kg S ha" was found to be optimum for the
maize-green grain cropping system.
l)hananpaya and Basavaraj (2002) conducted a field experiment in Dharwad,
Kamataka, India, during the summer season of' 1997-98 in an Alfisol to study the
effect of different levels of sulfur application on fl'ansformation and uptake by
maize cv. 'Deccon-103' Sulfur was applied at four levels viz., 0. 15. 30 and 45
k&ha throuwJi single superphosphate. Results showed that maize decreased the
Contents of soil stittlir fractions originally present in soil compared to 0 kg S/ha.
Flowever the values of different fractions of sulfur in soil increased with increased
level of sulfur A close relationship existed between different fractions of sulfur
and plant uptake of S and crop yield. Organic S content had a significant positive
relation with total water soluble S and available sulfur. The grain and stover yields
of maize increased significantly with the application of S at 15, 30 or 45 kg S/ha.
28
N. P. and S uptake increased due to the application of sulfur. The N: S and P: S
ratio decreased siptficantly due to S application.
Patel ci at (2002) has been reported, the deficiency of S in Gujarat soils to the
extent of 40%. As the deficiencies are mostly observed in middle (hujarat and
Saurashtra regions, a delineation programme tinder TS1IFAIIIFA sponsored
project was carricd out in selected npresentative blocks of these regions, In all
237, 210 and 240 surface soil samples were collected from Dhari. Lunawada and
Devgadhbaria blocks, respectively The overall mean of S was 19.2. 133 and 152
ppm for corresponding sites. Field experiments were conducted on farmer's fields
for groLLndnut-wheat sequence on clay loam calcareotis (Lythic Ustorthents) soils
in Anireli district (Saurashtra region) at Dhargani; and on sandy loan) (Fluventic:
Ustochrepts) soils at Dhesia in Panchmahal district; maize and gram in sequence
on silty loam (Fluventic Uslochrepts) soil at Dudhia in Dahod dthict (Middle
GlLjarat) in order to study the crop response to applied sulfur (5) tinder different
levels to the first crop and its residual effects on succeeding crop. The soils were
deficient to marginal in S status and p11 was in alkaline range at Dhargani &
Dhesia while it was nearly neutral at Dudhia. The results or field experiments
indicated that the S application increased the yields of groundnut at both the sites
and of maize at Dudhia. At Dhargani, maximum yield of groundnut due to S
application was found tinder the medium level i.e. 30 kg/ha, while at Dhesia the
maximum yield was recorded tinder maximum (i.e. 45 kg S/ba) level of S
application: but this improvement was at par with medium level of S application
(30 kg/ha). The residual effect of S applied to the first crop at both the sites was
found significantly superior in increasing wheat grain and straw yields The
pattern of increase in yield was reflected in the utilization of S also. The overall
results indicated that the S application 30 kg/ha was beneficial and
economically superior over other levels as well. Thus, the results revealed the
importance of S in balanced fertilization for higher crop yields.
29
Lw ci ci. (2002) conducted a field experiment with maize cv. 1)1(3112 in 1995 in
the expenmental farm of Shandong Agricultural University, China. Sulñir
fertilizer (as base fertilizer) was applied at 0 (control), 36.3 (Si ) and 413.85 kg/ha (S2) in the (NH4ISO4 form. Sulfur application (SA) increased grain yield, cob
length, rows/cob and kernels/cob significantly, but had no obvious effects on
1000-kernel weight. Absorption amounts in single plant of N, P. K. Mn. Zn and
Mg ranked as S, >S >eontrol. The pH values at the soil layers (SLs)of 0-20, 21-
40. and 41-60 cm decreased significantly in the SA treannents. The pH value at
each SL ranked in control >S1 >S2. Total N and available K contents at the SI. of
0-60 cm and available P content at 0-20 cm increased in SA treatments. but
available P content at 21-40cm showed insignificant change and a trend at 41-60
cm fora significant increase.
Liu ei ci (2001) found in a field test in 1995, sulfur applications of 36.3 and
413.85 kg/ha resulted in maize yields of' 10639.5 and 11322 kg/ha. respectively.
These yields were 8.73 and 15.7 1% higher than control plots,respeetively Sulfur
application increased ear length, rows/ear, grains/row and grains/ear, but not grain
weight. Dry matter, leaf area assimilation (NAR.), uptake of N, P. K. Mn. and Zn,
as well as Fe. Mn, and Zn levels in leaves increased with increasing level of sulfur
application.
Ramirez ci ci. (1999) in greenhouse experiments studied the effects of ammonium
thiosulphate (ATS) on maize dry matter and nitrogen (N) and sulfur (S) uptake in
a sodie soil. In a first experiment ATS was mixed with the soil at S rates of 0, 30,
50, 70 and 100 mg/kg soil In a second experiment, ATS was hand-applied to the
soil at rates of 0. 140. 270 and 400 mu/kg soil. In both experiments, dry matter
yields were significantly increased with the increment of the ATS dose applied to
the soil. Banded ATS produced higher maize dry matter. N: and S uptake than ATS
mixed with the soil.
30
Gordon c/ at (1992) conducted two trials in 1990 in the zone of Azuero (Panama)
to observe the response of maize to the residual effect of sulfur (CaSO4. gypsum)
under two application methods. In 1989, sulfur was broadcasted at rates of 0. 20,
40 and 80 kg/ha or handspiked at rates of 0. 20 and 40 kg/ha During the second
cycle (1990), only 100 kg N/ha was applicd to the plots to determine the residual
effect of the treatments. There was a lineal response fbr the two gypsum
application methods in the first cycle, but there was no interaction among these
two independent variables. The fact that one of the highest yields was obtained
with 20 kg Silia shows that a low rate of this element is enough to have significant
responses. The residual effect of sulfur application (1990) was highly significant,
resulting in yield increments ranging front 0.483 to 1.682 1/ha. The economic
analysis of the two cycles (1989-90) showed that tile sulfur application was
profitable with respect to Orates, given the low cost of the agricultural gypsum.
Singh and Chhihba (1991) reported that maize (Zecs ways) and wheat (Trincun,
ac's//rum) grown under greenhouse conditions on a S-deficient Typic
Ustipsamnient responded significantly to S applied through ammoni urn stil Late.
superphosphate. gypsum, elemental S and pyrites irrespective of the carriers. For
maize, animoniurn sulfate, superphosphate. gypsum and elemental S proved
equally efficient. For wheat on the other hand, ammonium sulfur was the most
efficient. Superphosphate and uypsum were significantly better than elemental S
and pynte.
Sachdev and l)eb (1990) found in wials in 1986-88 with 2 cycles of a Bracsica
/UflCCU ii 'gna aureus [l' racJiatal/maize rotation, B. juncea was given 0, 30 or 60
kg N is and 0. 2Oor 40 kg S/ha USing N- and S-labelled fertilizers. Effects oldie
treatments on N and S uptake and utilization in the cropping sequence were
studied, Both N and S showed a synergistic effect on DXI yield and N and S
uptake in B. /uncea The utilization of fertilizer N and S was 53-69 and 20-39%.
31
respectively, in B. /!mcea. Application of 20 kg S increascd the seed oil content
from 38.2-38.5% with no S to 39.3-39.5% and oil yield by 10.6% (76 kg/ha).
Uptake of residual fertilizer N and S was only 1-3% in F m/k.zft: and maize
2.3 Response of maize to the combined application of P and S:
Sctia and Sharma (2005) found that the available, water soluble and heat soluble
sulfur (S) contents over a profile depth of tip to 120cm were determined in a long-
term experiment which was continuously cropped with maize [Zea nc;vsJ-wheat
[&iticim, c:cch'unzJ sequence at the Punjab Agricultural University Farm in
ludhiana (Punjab. India). The mmimum amount ol'S was found in water soluble
form. All the forms of S decreased with increasing soil depth but this effect was
more noticeable tip to 45-60 cm soil depth. The increasing level of N. P and K
affected depth-wise distribution of S. The content of all the forms of S increased
with application of 40 kg P205 ha-I but the trend reversed with the application of
80 kg P205 ha4, irrespective of N levels. Application of 40 kg K20 ha4 at all the
levels of N and P resulted in a decline in all the forms of S. The accumulation of
sulfur was lower in the NPK treated plots than N- and NP-treated plots. The
amount of water soluble S in lower soil depth was found to be very low
Regression equations were used to predict S uptake by wheat using S status in
different soil layers as independent variables. Multiple regression analysis
indicated that the coefficient of determination (R2) value between S uptake and
available S improved significantly when its status up to 60-90 cm soil depth was
included. Heat arid water soluble S contributed significantly towards S uptake by
wheat when accumulation of forms of S in the soil profile tip to depth of 60-90cm
included in the regression analysis.
Yadav and Souza (1992) conducted a pot expenment in a greenhouse, maize was
given equivalent to 0,6.0 or 120 kg P205/ha as ammonium polyphosphate (APP) or
diammonium orthophosphate (DAP) and 0,5 or 10 kg Zn/ha as zinc sulphate and
32
0. 10 or 20 kg Fe as iron sulphate. After maize harvest, blackgram (Phasco/us
Inungo I 'igna ,nungoj) was sown in the same pots. P, Zn and Fe applications (and
their residual effects) increased plant DM and uptakes of the 3 elements in both
species. Interaction between P source and Zn and Fe was either slight (maize) or
inconsistent (blackgrarn).
Debreezeni and I3erecz (2000) reported that the nutrient responses of eight
different maize hybrids differing in the duration of the growth period (FAO 200-
430) were studied in field fertilizer trials conducted in four different agro-
ecological regions of Hungary Four treatments were applied (I) minimum NPK
dose. (2) NPK dose corresponding to the nutrient requirements of maize, (3) NPK
dose exceeding the nutrient requirements of maize, (4) famiyard manure (FYM)
The NPK contents of the grains were measured in addition to the grain yields. In
most cases, nutrient supply exceeding the demand of the maize plants did not
result in significantly higher grain, nitrogen, phosphorus or potassium yields at
any of the sites. Compared with the minimum mineral fertilizer dose, FYM did not
result in higher grain, nitrogen, phosphorus or potassium yields: in fact, these
parameters were significantly lower in some cases. Considerable site and eultivar
differences could be detected in the experimental parameters.
Dilip-Singh and Singh (2000) conducted an experiment at Udaipur during the
summer and rainy seasons of 1995-96 to stu(Iy the response of groundnut (Arac/zis
hypogaca) and succeeding maize (Zea mm's) to sulphur and phosphorus
fertilization The pooled data revealed that summer groundnut fertilized with 60 kg
S/ha gave significantly higher pod yield (2.84 tIha), grain yield (2.74 t/ha) of
succeeding maize crop and net returns (Rs 41 400) over 30 and 0 kg S/ha
Similarly, phosphorus application up to 50 kg/ha recorded significantly higher
yield (2.84 t/ha) and net returns (I(s 41 600/ha) over no P application But its
residual effect did not influence production of succeeding maize crop.
33
Jena ci at (2004) conducted a field experiment in Kaudharnal district (Orissa,
India) during klzarif 1997 and nthi I 997-98 with maize-mustard cropping
sequence grown on moderately acidic sandy loam soil (Typic Ilaplaquept) to
evaluate the efficiency of Jhamarkota phosphate rock (JPR) compacted with
monoammonwm phosphate (MAP). MAP I Sulfur (S) and single superphosphate
(SSP) alone with granular MAP and granular SSP The highest grain and Mover
yields of maize were recorded in granular MAP treatment closely followed by
compacted fertilizer treatments. However, in the mustard crop, N4AP+S and SSP
were compacted sources out yielded water soluble P sources. Considerine both the
crops in sequence, MAP±S and SSP compacted P sources were found to give
higher crop yields and better agronomic efficiency compared to other P sources
Both compacted and water soluble P sources significantly influenced the P. S and
Ca uptake by crops over 'one phosphate rock sources. The apparent phosphorus
recoven: from granular MAP was highest followed by granular SSP and
compacted P sources with SSP, MAP+S and MAP.
Alvarez ci of. (1987) reported that effects of 0 and tOO kg kg N/ha applied as
KNO3 at the 4-leaf state were studied on maize cv, Dekalb 4F 34. N treatment had
no effect on shoot total S and P contents. Between the end of pollination and the
final harvest there was an increase in mature grain S content in N-treated plants
equivalent to 44% more than that in controls. The increased demand for S during
grain development was apparently provided by remobilization of sugar from the
leaves. The N: S ratios in mature shoots were 16.0 and 11.4 for N-eated and
control plants; respectively. P distribution was similar to that ofS N treatment had
no effect on total hiomass accumulation The N: P ratios in mature shoots were 4.9
and 3.3 in treated and control plants, respectively.
Lopez ci at (1991) reported that response of maize (Zca ntvs) to P1-IS (a
hiofertilizer obtained by the fusion of rock phosphate with elemental S followed
34
by inoculation with Thiobacillus), layer 2 Monte Fresco rock phosphate
and ME2 -f S (added in the same proportion as in Pt-IS) was evaluated in the
greenhouse against tnple superphosphate (iS). Response was in the following
order 1S > ME > ME2 + 5> Pt-IS. Yields increased linearly with increasing rates
of 1'S and ME2 (100 to 400 ppm P). but there were no significant differences
between the S fertilizers at the higher rates.
Ramirez (1980) stated that step-wise multiple regression was used to analyse data
from 28 experiments in Venezuela in which the leaf opposite and below the ear of
maize was harvested at silking from plants given 0-150 kg N. 0-100 kg P205 and 0-100 kg K20'ha. Linear and positive effects were found for N. P. Ca and Mg
concentrations. Optimum levels of various elements in leaves were calculated and
standard values for a yield of 7 t/ha Optimum and standard levels were 2.6 and
33 .5%. respectively for N. 0.2 and 0.4% for P, 0.25 and 0.500/0 for Ca. 1.3 and 2.0%
for K and 0.25 and 0.5% for Mg.
Taltil<der and Islam (1982) reported that during the k/tar/f (monsoon) season of
1981 at 4 sues in Bangladesh, maize was growl) with 0- 120 kg P2O and 0-50 kg
S plus basal applications of 160 kg N 60 kg K20fha. Grain yield increased with
increasing P and S rates at all sites from 0.68-2.89 tiha and with no fertilizer to
3.71-5.79 tiha with the highest rates of P and S.
Pierre etal. (1990) reported that in a field trial at Luperon in 1984-89, the effects
of 40 kg N/ha. 0, 12, 20 and 40 kg P/ha and 0 and 43 kg S/ha on yields of maize
cv. bth;zcec Inrgo under no tillage and conventional tillage systems were
evaluated. l.Tnlited N supply atTected the response to P and S under no tillage
Both P and S increased maize yields and root and stalk loading. Sulphur
volatilization due to burning in conventional tillage was important as the S
response under no tillage was minimal.
is
Raun and Barreto (I 991) reported that maize grain yields were increased by P and
S in both the residual and treated cycles. In the treated cycles, yields when no P
was applied were 4.95, 5.75 and 5.95 t/ha, at 0, 57 and 114 kg S/ha, respectively:
when 22 kg P/ha was applied with 100 kg N/ha, yields were 5.38. 6.38 and 5.48
tTha at the same S rates. Over the 4-cycle, yields were highest with 100. 22 and 57
kg/ha of N, P and 5, respectively.
Sinha ci al. (1995) conducted a field experiment at Dholi, Bihar on P and S
deficient calciorthent (12.8 kg S/ha and 15.6 kg PO2/ha) during the winter season
of maize cv. Laks/uni was given 0-80 kg S/ha as ammonium sulphate and 0-120 kg
P2O/ha as triple super phosphate Application of P or S (except at the highest
rates) increased chlorophyll content in foliage, which was maximized when both
elements were applied together. Grain and Mover yields also increased with P and
S applications. The highest grain yield of 7.64 t/ha was ohtiined with 60 kg P205
± 40kg S.
36

Maleil'81s amd Mel ods in
Chapter 3
MATERIALS 1tN1) METHoDS
The present piece of research work was carried out at Sher-c-Harigla Agricultural
University Fann, Dhaka during the rabi season of 2006-2007 to study the response
of maize to phosphorus and sulphur feililization. Details of the materials and
methodology are presented in this chapter
Description of the experimental site
3.1 Location
The experimental field is located at 23°77' N latitude and 90°3 F longitude with
an clevation of 1.0 meter above sea level (Fie. I).
3.2 Soil
The soil of the experimental field belongs to the Teigoan series of the Madhupur
Tract (Agro Ecological Zone AEZ 28). The General Soil Type at the
experimental field is Deep Red Brown Terrace Soil Topsoil is silty clay loam in
texture. Organic matter content is very low (134 96) and soil p11 is 4.8. The land is
above flood level and well drained. The initial morpholoeical. physical and
chemical characteristics of soil are presented in Table I mid 2.
3.3 Climate
The annual precipitation of the site is 2152mm and potential evapotranspiration is
1297mm. The average maximum temperature is 30.34 C and average minimum
temperature is 21.21 Üç The average mean temperature is 25,117 T. The
experiment was done during the rahi season. Temperature during the cropping
period was ranged between 12.20 "C to 29.2 CJ. The humidity varies from 71.52
% to $1.2 5%.
37
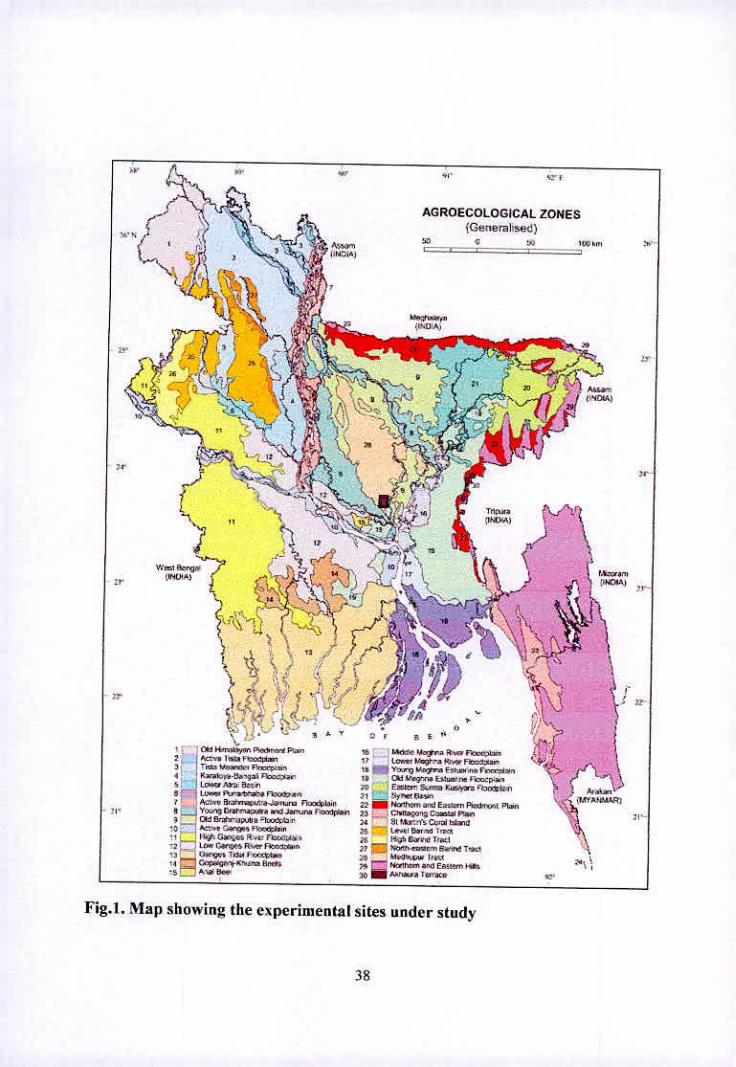
s- ..., lTA4p MIUWHIg tilt experirneniat sties turner study
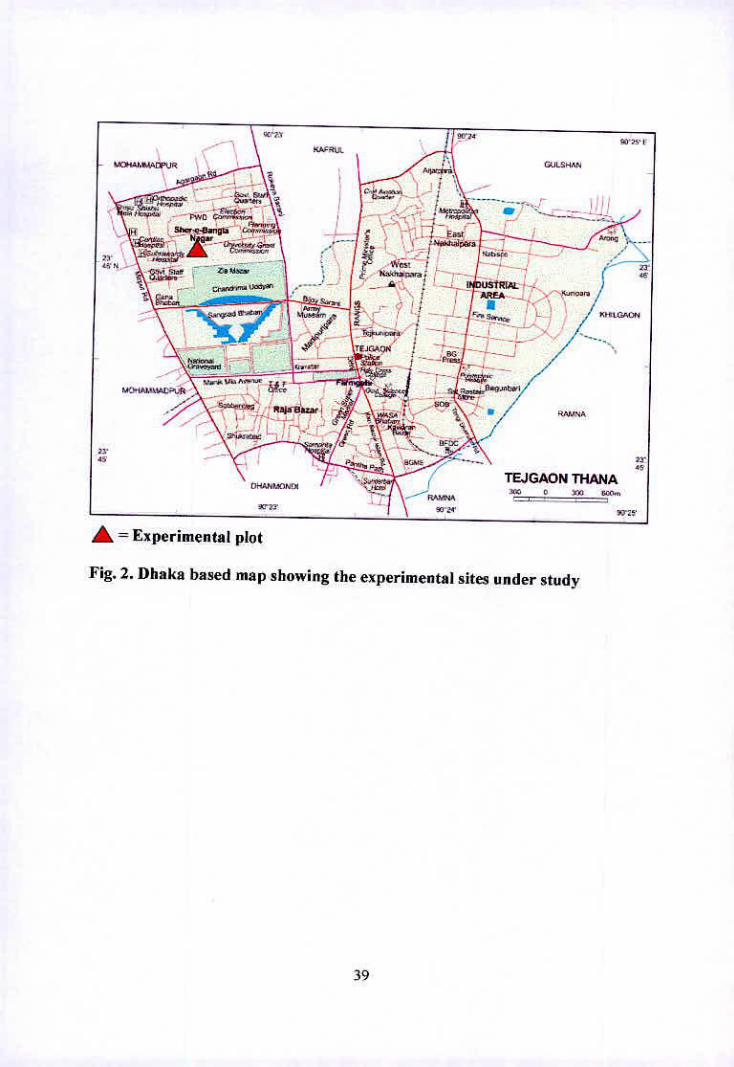
KAqtfi.
GUI SMAN
Ew
( I!
- . GAON
— 4' tTEJGAQJ.. --
AtC M' -tW
rA TIjI,tF 4
- RWNA
\-w/ •t\ v-; 45
I TEJGAON THANA -.
S = Experimental plot
Fig. 2. Dhaka based map showing the experimental sites under study
39
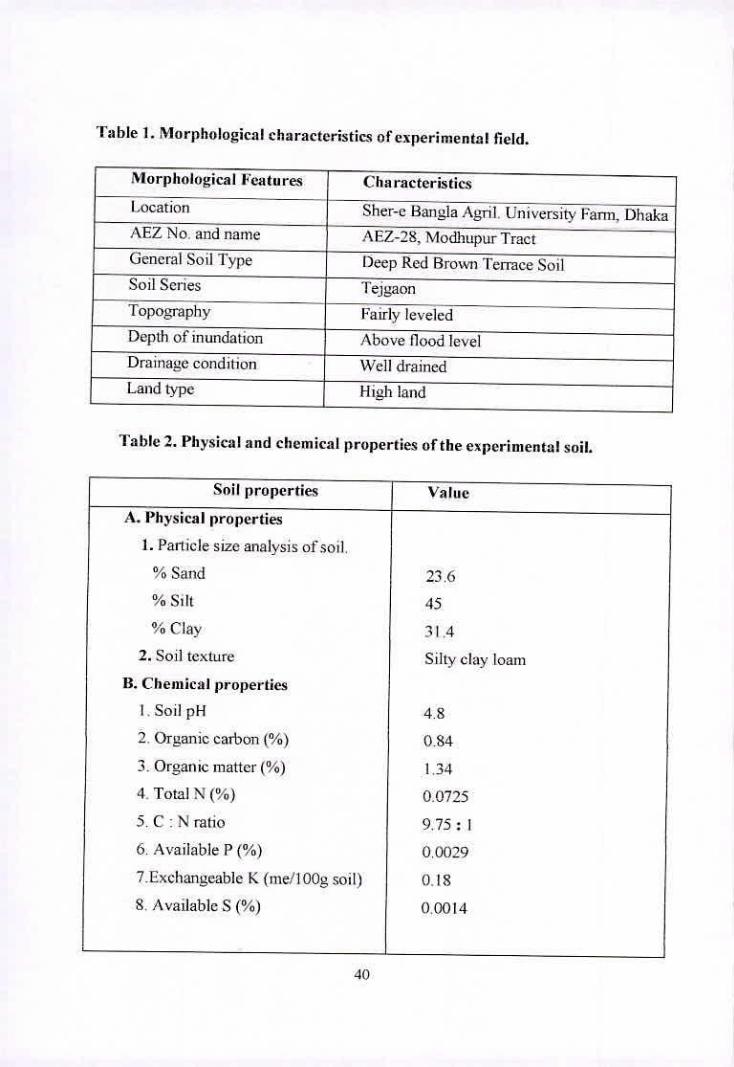
'Fable 1. Morphological characteristics of experimental field.
Morphological Features
l.ocation
I Characteristics
Sher-c Bangla Agril. tiniversitv Farm. Dhak AEZ No. and name AEZ-28, Modbupur tract
General Soil Type l)eep Red Brown Terrnce Soil
Soil Scries
Topography -
Tejgaon
Fairly leveled
Depth of inundation Above flood level
Drainage condition Well drained
Land type High land
Table 2. Physical and chemical properties of the experimental soil.
Soil properties Value
A. Physical properties
Panicle size analysis of soil.
% Sand 23.6
%Silt 45
%Clay 3L4
Soil texture Silty clay loam
B. Chemical properties
I. Soil pH 4.8
2. Organic cathon (%) 0.84
Organic matter (%) 1.34
Total N (%) 0.0725
5.C:Nratjo 9.75:1
6. Available P (%) 0.0029
7.Exchangeabic K (me/lOOg soil) 0.18
8. Available S (%) 0.0014
40
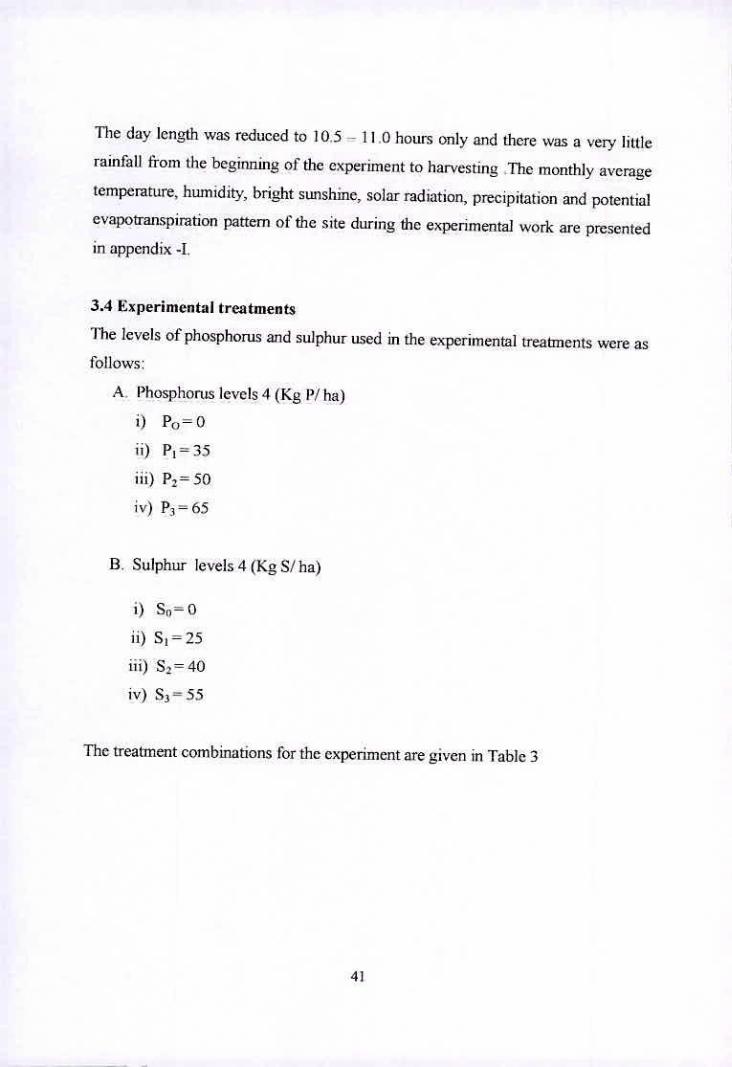
The day length was reduced to 10.5 - II 0 hours only and there was a very little
rainfall from the beginning of the experiment to harvesting The monthly avenge
temperature, humidity, hrittht sunshine, solar radiation, precipitation and potential
cvapotl-anspiration pattern of the site during the experimental work are presented
in appendix -I.
3.4 Experimental treatments
The levels of phosphorus and sulphur used in the experimental treathlcnts were as
follows:
A. Phosphorus levels 4 (Kg Pt ha)
P0 O
P,=35
P2=50
P3 aa65
B. Sulphur levels 4 (Kg S/ha)
S=O
S1 =25
S2=40
S3 =55
The treatment combinations for the experiment are given in Table 3
41
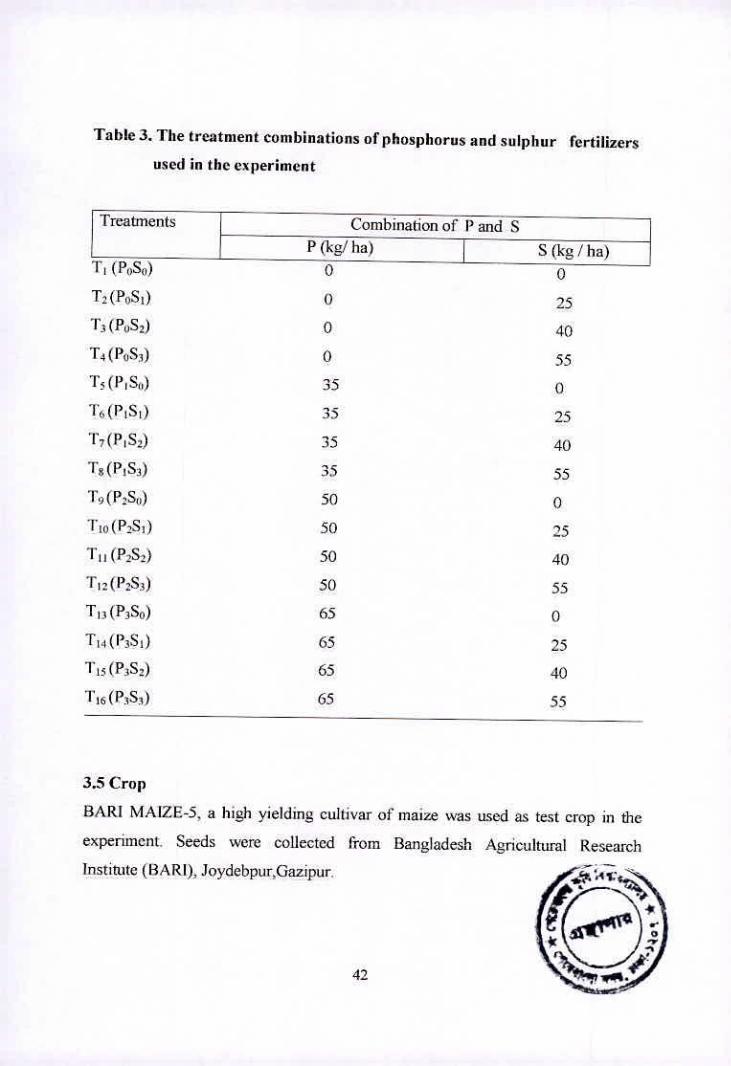
Table 3. The treatment combinations of phosphorus and sulphur fertilizers
used in the experiment
[teatments Combination of P and S P(kg/ha) S('kgfha)
T1 (P0S0) 0 - - 0
T2(P0S) 0 25
i' (P0S2) 0 40
T4 (PQS3) 0 55
T5(P1S 1) 35 0
l( (PlSI) 35 25
17 (P1 S2) 35 40 1'
8 (P1S3) 35 55
'Fc,(P'So) 50 0
50 25
' I' ll (P2S2 ) 50 40
T12 (P2S3) 50 55
T13 (P3S0) 65 0
T14P3S1) 65 25
Ttc(P;Si) 65 40
F15 (P3S1) 65 55
3.5 Crop
BAR! MAIZE-S, a high yielding cultivar of maize was used as test crop in the
experiment. Seeds were collected from Bangladesh Agricultural Research
Institute (SARI), Joydehpur,Gazipur.
(a 41
3.6 Design of the experiment and layout
The experiment was laid out in a Randomized Complete Block Design (RCBI))
with three replications. The whole experiment area was first divided into three
blocks. Each block was later divided into sixteen plots. The SIZC ol' each unit plot
was 3m x 3m. Iotal number of unit plots was 43. The individual plots and the
blocks were separated for wrtgation and drainage by I .51n and 20m channels,
respectively. The layout of the experiment is shoii in Fig.2.
3.7 Collection of initial soil sample
Initial soil samples were collected before land preparation from 0-I5 cm soil
depth. The samples were drawn by means of an auger from different location
covering the whole experimental plot and mixed thoroughly to make a composite
sample. After collection of soil samples, the plant roots, leaves etc. were picked up
and removed. 'then the samples were air dried and sieved through a 10-mesh sieve
and stored in a clean plastic container for physical and chemical analysis.
3.8 Land preparation
The experimental land was opened by power tiller driven rotovalor on 26 October,
2006. The land was prepared by repeated plowing until the soil achieved a good
tilth and was ready for sowing. Weeds and stubbles were removed and the plots
were leveled by small ladder and the experiment filed was partitioned into unit
plots in accordance with the experimental design mentioned in the section 3.6.
3.9 Fertilizer application
The required amounts of phosphonis and sulphur fertilizers were applied as per
weatment combinations. Basal dose of N, K, Zn and B fertilizers were applied
according to the fertilizers recommendation guide (BARC, 2005), Full doses of P
(triple super phosphate) and S (gypsum) and one third of the urea and the whole
43
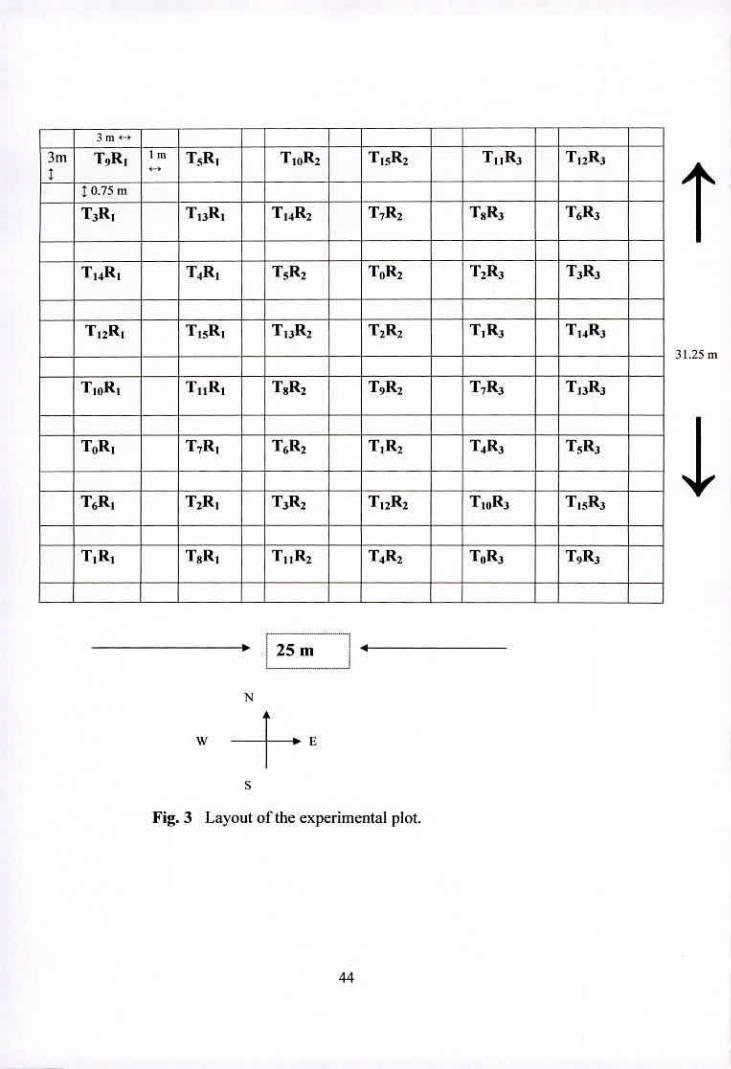
3m
3m T9R, Im T5R, T10R2 T15R2 T71R3 T32R3
0.75 rn
T3R T13R1 - T14R2 T7R2 - T8R3 - T6R3
T14R, T4R1 T5R2 TR2 T2R3 T3R3
T12R1 T15R, - T13R2 T2R2 T1 R3 T14R3
T10R1 T11R, T3R2 T9R2 T7R3 T13R3
T0R1 T,E1, TA - T1 R2 - T4R3 - T5R3
T3R2 T6R1 T2R1 T12R2 T10R3 T15R3
T11t1 T8R1 T11R2 T4R2 T0R3 T9R3
25m
N
w
Fig. 3 Layout of the experimental plot.
T
31.25 m
I
required amounts of K, Zn and B fertilizers were applied at the time of final land
prepamtion. The remaining urea was applied in two equal splits on 30 and 60 days
after sowing (DAS).
3.10 Sowing of seeds
Seeds were sovm on 27 October, 2006 in lines following the recommended tine to
line distance of 75cm and plant to plant distance of 20 cm.
3.11 Gap filling
The seedlings of the crop emerged out within 6-8 DAS. Necessaiy gap tilling was
done at 12 DAS.
3.12 Weeding and thinning
Weediim was done three times, at 30, 45 and 70 EMS. Thinning was done after 25
DAS. One healthy plant was retained per hills and the other plant was removed.
3.13 Earthing up
Earthmg up was done by spade at 45 DAS to prevent lodging of plants.
3.14 Irrigation and drainage
The plot was irrigated two times during the growing period of crop. Irrigation was
applied first after 40 days and second after 70 DAS. Drainage was done when
necessary by using drainage channels.
3.15 Insect and diseases control
There was no major incidence of insects or diseases So, no pest control measure
was adopted in the experiment. The experimental crop was grown with proper care
and agronornic management to ensure satisfactory crop growth and development.
45

3.16 Plant protection
The damage of maize crops by jackals at hooting and young cob stage was a big
problem in the experimental area. Another greater problem in this locality was the
damage of mature grains at the full mature cob stage by parakeets. Therefore
necessary measures were taken to protect the crop from the probable damage by
parakeets, jackals and birds.
3.17 Sample plants marking
For collecting data on plant characters and yield and yield components, five plants
were randomly selected and marked with bamboo sticks in each plot.
3.18 Harvesting and processing
The experimental crop was harvested plot wise at full maturity on I 7April 2007
The sample plants were harvested separately for recording data on plant characters
and yield and yield components. The harvested crop of each plot was bundled
separately, tagged and taken to threshing floor. These were dried in bright
sunshine, shelled and the grains were cleaned properly. Grains and stovers were
sun dried thoroughly before their weights were recorded. Grain and stover yields
were then converted into t/ ha.
3.19 Collection of experimental data
Data on the following plant characters and yield and yield components were
collected from the sample plants of each plot.
I ) Plant height (cm)
(2) Number of cobs/plant
(3)Cob length (cm)
Circumference of cob (cm)
Number of grains /cob
Weight of] 000-grain (g)
46
Shelling percentage
(8)Grain yield (t/ha)
(10) Stover yield (I/ha)
3.20 Details procedures of recording of data
A brief out line of the data recording procedure is given bclow:
(I) Plants height at harvest (cm)
Plant height was measured from the base of the plants up to the tip of the tallest
lea I
Number of cobs plants
Number of total cobs were counted from the sample plants and then averaged and
recorded.
Cob length (cm)
Cob length was recorded from the base to the apex of each cob and averaged
(4) Circumference of cob (cm)
Circumference of cob was recorded at the lower and upper ends, and the middle of
the cob and then averaged and recorded.
Number of grains/cob
Total number of grains/cob from the sample plants were counted averaged and
recorded.
Weight of 1000-grain (g)
One thousand clean fried grains were counted form the seed obtained from sample
plants of each plot and weighed by using an electrical balance and recorded.
47
Shelling Percentage
It denotes the ratio of total grain weight/cob and total cob weight and was
calculated with the following formula:
Total grain weight/cob (g) Shelling percentage
100 Total cob weight (g)
Grain yield (tlha)
Grains obtained from each unit plot were sun-dried and weighed carefully. The
dry weight of grains of five sample plants were added to the respective plot yield
to record the final grain yield /plot (kg) The grain yield was converted to ton/ha.
Stover yield (tJha)
Stover obtained from each unit plot including the stover of the sample plants of
respective unit plot were dried in sun and weighed to record the final stover yield
'plot (kg) and finally converted to ton/ha.
3.21 Chemical analysis of soil samples
Soil samples collected before starting the experiment (Initial soil samples) and
after harvest of the crop. were analyzed for both physical and chemical properties.
The analysis was done at the Labomtoiy of the Department of Soil, Water and
Environment, University of Dhaka. The properties studied included soil texture,
pH. organic matter, total N. available P. exchangeable K and available S. The
physical and chemical properties of the initial soils have been presented in Table I
and 2. The soil was analyzed following standard methods:
Particle-size analysis: Particle size analysis of soil was done by Hydrometer
method (Bouyoucos, 1926) and the textural class was determined by plotting the
value of % sand. % silt and % clay on the "Marshall s Textural Triangular
Coordinate".
48
Soil pH: pH was measured with the help of a glass electrode p11 meter using soil
water suspension of 1:2.5 ratio as described by Jackson (1962).
Organic carbon (%): Organic carbon in soil was dctermtned by Walk Icy and
Black's (1934) wet oxidation method.
C/N ratio: The C;'N ratio was calculated from the percentage of organic carbon
and total N.
Soil organic matter (%): Soil organic matter content was calculated by
multiplying the percent value of organic carbon with the Van Bemmelen thctor.
1.724 as described by Piper (1942).
% organic matter - % organic carbon x 1.724
Total nitrogen (%): Total nitrogen of soil was determined by micro Kjcldahl
method, where soil was digested with 30% 11202. and cone. l-12SO4 and catalyst
mixture (K2S0.1:CuSO4.51- 20: Sc powder in the ratio of 100:10:1). Nitrogen in the
digest was estimated by distillation with 40°% NaOH followed by titrations of the
distillate trapped in 11130 with 0.01 N F12S0. (Bremner and Mulvancy, 1982).
Available Phosphorus (ppm): Available P was extracted from soil by shaking
wiih 0.5 NI NaIfC0 j solution ofpH 8.5 (Olsen et at 1954) The Phosphorus in the
extract was then determined by developing blue colour using ascorbic acid
reduction of phosphomolybdate complex. The absorbance of the
molybdophosphate blue colour was measured at 660 urn wave length by
spcctropliotometer and available P was calculated with the help of standard curvc.
Exchangeable potassium (meq/lOOg soil): Exchangeable K was determined by
IN NH40AC (p'1 7.0) extract of the soil by using flame photometer (Black, 1965)
49
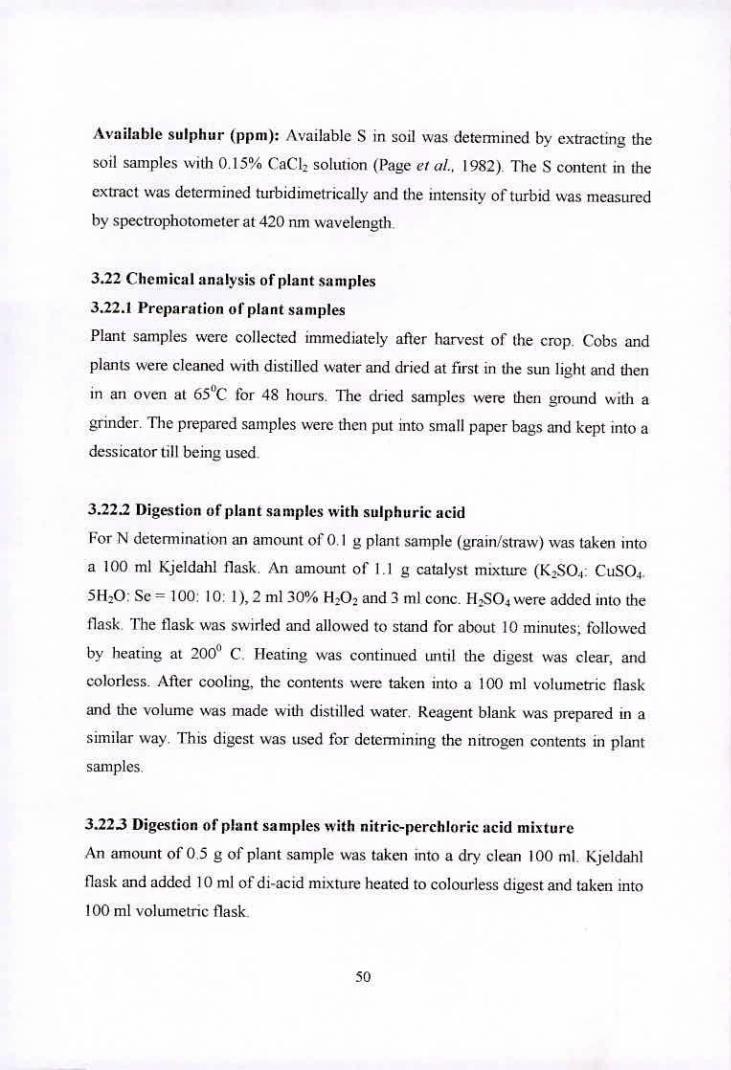
Available sulphur (ppm): Available S in soil was determined by extracting the
soil samples with 0.15% CaCl2 solution (Page et aL, 1982). The S content in the
extract was dctcrmined turbidimetrically and the intensity Of turbid was measured
by spectrophotometer at 420 nm wavelength.
3.22 Chemical analysis of plant samples
3.22.1 Preparation of plant samples
Plant samples were collected immediately after harvest of the crop. ('ohs and
plants were cleaned with distilled water and dried at first in the sun light and then
in an oven at 65°C for 48 hours. The dried samples were then ground with a
grinder. The prepared samples were then put into small paper bags and kept into a
dessicator till being used.
3.22.2 Digestion of plant samples with sulphuric acid
For N determination an amount of 0.1 g plant sample (grain/straw) was taken into
a 100 ml Kjeldahl flask. An amount of' 1.1 g catalyst mixture (K2SO.1: CuSO4 .
51-1,0: Sc = 100: JO: I), 2 ml 30% 1-1202 and 3 ml cone. F1'SO4 were added into the
flask. The flask was swirled and allowed to stand for about tO minutes; followed
by heating at 2000 C. Heating was continued until the digest was clear, and
colorless. After cooling, the contents were taken into a 100 ml volumetric flask
and the volume was made with distilled water. Reagent blank was prepared in a
similar way. This digest was used for determining the nitrogen contents in plant
samples.
3.22.3 Digestion of plant samples with nitric-perchloric acid mixture
An amount of 0.5 g of plant sample was taken into a dry clean 100 ml. Kjeldalil
flask and added 10 nil of di-acid mixture heated to colourless digest and taken into
tOO ml volumetric flask
50
3.22.4 Determination of elements in the digest
Nitrogen. P, K and S contents in the digest were determined by similar method as
described in the soil analysis.
3.23 Statistical Analysis
The collected data were statistically analyzed by using the ANOVA technique.
The test of significance of all parameters was done. The E)uncan's Multiple Range
Test (DMRT) with Least Significant Difference value was determined with
appropriate levels of significance and the means were tabulated. The mean
comparison was carried out by DMRT technique (Gomez and Gomez, 1984).
51

ha pter 4
Resulls 8md D iscussiom NH
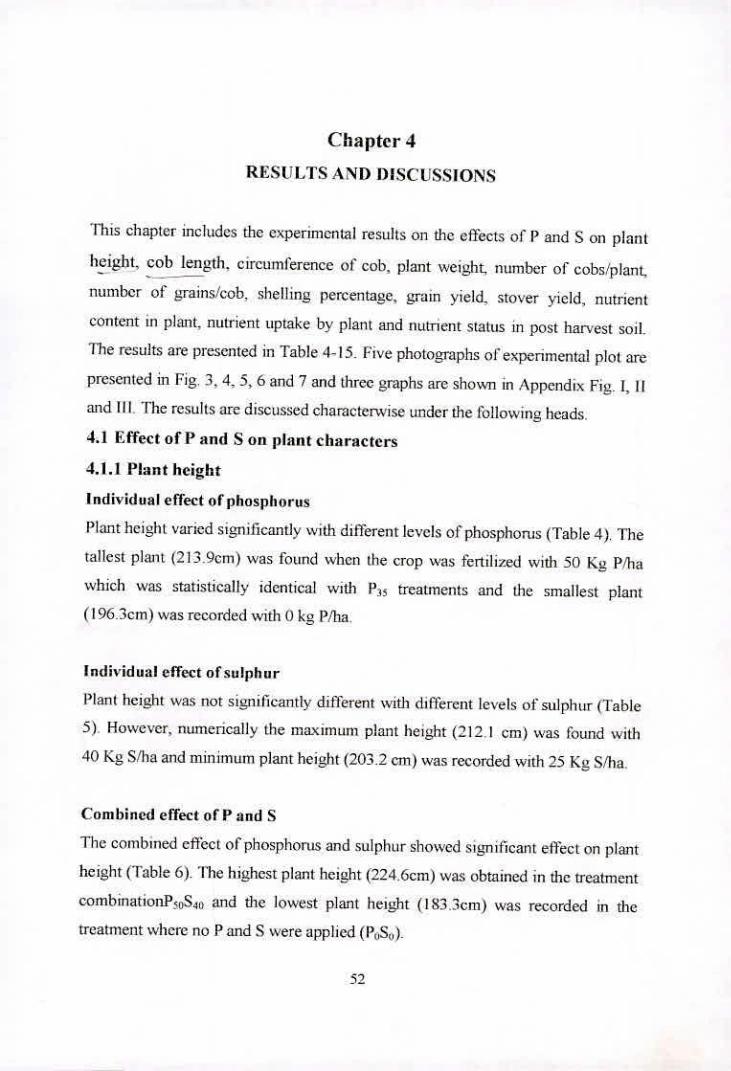
Chapter 4
RESULTS AND DISCUSSIONS
This chaptcr includes the experimental results on the effects of P and S on plant
height. cob length. circumference of cob, plant weight, number of cobs/plant.
number of grains/cob. shelling percentage, grain yield. stover yield, nutrient
content in plain, nutrient uptake by plant and nutrient status in post harvest soil.
The results are presented in Table 4- IS. Five photorn-aphs of experimental plot are
presented in Fig.3 4.5, band 7 and three graphs are shown in Appendix Fig. I, II
and Ill The results are discussed charactenvise under the following heads.
4.1 Effect of P and S on plant characters
4.1.1 Plant height
Individual effect of phosphorus
Plant height varied significantly with different levels of phosphorus (Table 4). The
tallest plant (213.9cm) was found when the crop was fertilized with 50 Kg P/ha
which was statistically identical with 1135 treatments and the smallest plant
(196.3cm) was recorded with 0kg P/ha.
Individual effect of sulphur
Plant height was not signiticantiv different with different levels of sulphur (Table
5). However, numerically the maximum plant height (212.! cm) was found with
40 Kg S/ha and niinimurn plant height (203.2 cm) was recorded with 25 Kg S/ha
Cornl)ine(J effect of P and S
The combined effect of phosphorus and sulphur showed significant effect on plant
height (Table 6). The highest plant height (224.6cm) was obtained in die treatment
cornbinationP50S40 and die lowest plant height (183.3cm) was recorded in the
treatment where no P and S were applied (Pc SQ ).
52
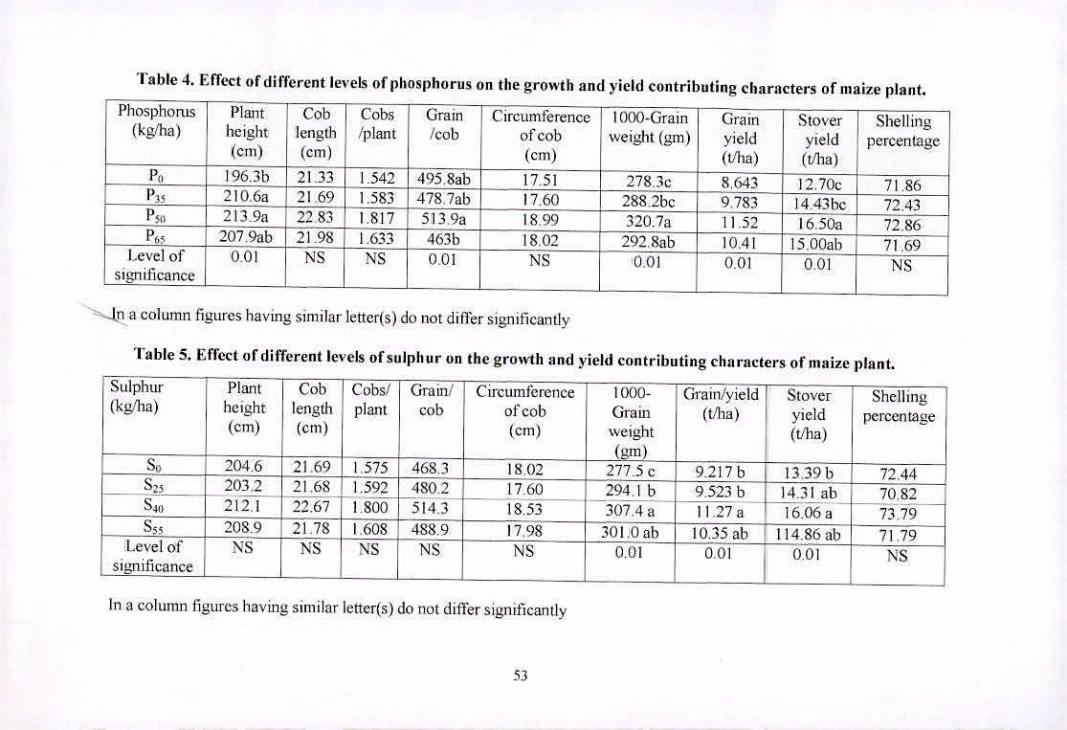
Sulphur Plant Cob Cobs! (kg/ba) height length plant
(cm) (cm)
R. 7046 1 ')IAO icic
203.2 21.68 1.592 212.1 22.67 1.800 208.9 21.78
_
1.608 NS NS NS
S40
Level of significance
Table 4. Effect of different levels of phosphorus on the growth and yield contril)uting characters of maize plant.
Phosphorus Plant Cob (kg/ha) height length
(cm) (cm)
- P0 - 196.31) 21.33 _______
P35 210.6a2169 P50 213.9a 2283 i
25 l.eve] of 0.01 NS
stwiific.ance_.L.
In a column figures having similar letter(s) do not diIièr significandy
'Fable 5. Effect of different levels of suipli ur on the growth and yield contributing characters of maize plant.
- P,c 2OT9abl.98L- ____ ____
Cobs Stover Shellinq /plant /cob of cob weight (gm) yield yield percentage
_________ (cm) (t/ha) (t/ha)
1.542 495.Sab 17.51 _278k 8.643 12.70c L 71.86 1.583 478.7ab 17.60 288.2hc 9.783 14.43hc 72.43 1.817 513.9a ' 18.99 320.7a 1.52 1 6.50a 72.86 1.633 46Th 18.02 292.Sab 10.41 15.00th _71.69 NS 0.01 NS 0,01 0.01 aoi NS
Grain! Circumference cob of cob
(cm)
468.3 1 18. 02 480.2 L 17.60 514.3 18.53 488.9 17.98 NS NS
1000- Grain/yield I Stover Shelling
Grain (t/lia) r yield percentage
weight (t!ha)
~(
227T5
_____
c 9.217h 1 13.391) 72.44 294.1 h 9.523 b 14.31 ab 7 0. 821 -
307.4a 11.27a 16.06a 73.79
301.0ab 10.35*114.86ab 71 79 -
0.01 - 0.01 0:01 NS
In a column figures having similar letter(s) do not difièr significantly
53
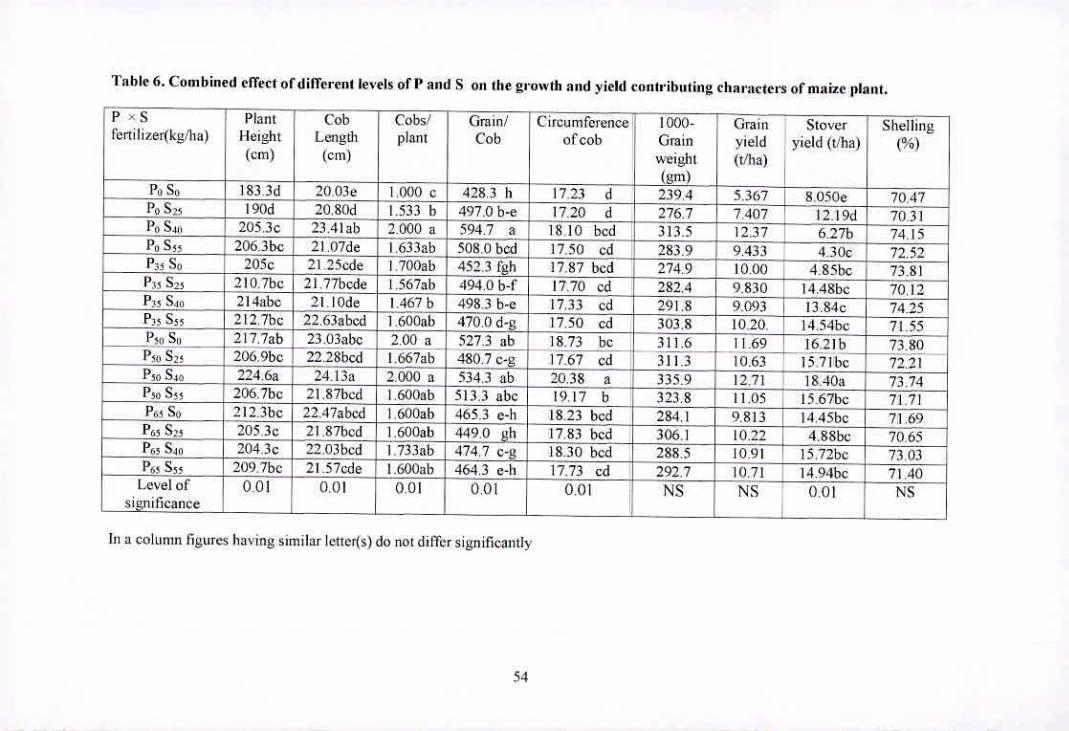
Table 6. Combinetl effect of different levels of P and S on she growth and yield contributing characters of maize plans.
x 5 Plant 1 Cob - 7obstl Grain! Cireun'ifcre nce7 1000fertilizer(kglha) Height Length Cob of cob Grain yield yield (/ha) (%)
(Gin) (em) weighi (t/ha)
183 -3-d7 20.03e 1,000 e I 428.3 Ii 17.23 d 239.4_j 5.367 8.0500j 7047 P0 515 190d I 20.80d 1 1.533 h 497.0h-e 17.20 d 276.7 I 7.407 1219d 7(13i Po S411 205.3c23.4lab2.000 a 594.7 a 1810bcd 323.5 12.37 6.27b J 74.15 PO S55 206.3hcp21.07de _I ,6331b 508.0 bed 1750 ed 283.9 , 9.433 4.30c 72.52 P55 So 205e 21_25cde I.700th 452.3fgh 1787bed , - 274.9- - 10.00 45bc 7381
P3 5 S25 2lQ.7b2L77hcde 1.567th j 494.0b-f j 17.70ed 282.4 1 9.830 14.48bc 70.12 PS.m 2I4abc 2l.IOde 1.467 b
4983 be-
-291.8 9.0
-.
13.84c
-
74,25 600aJ00 7.0P,ssss J2j 2 .7 bcJ 22 .63abcdH 7 cd_303.8 10.20. i&S4bc 71.55
P e 311.6 11.69 1621h 7380 . . . a . b S O6 22.28bcd1667 2 I7.67cd 311.3 10.63 71hc
72.21 PSO S40 224.6a 24.13a 2,000 aJ_534.3 ab 20.38 a I 3359 12.71 18.40a 73.74J P50 Sss _2063bc 21.87bcd I.óOOab 513.3abcL12.I7_b 323.8 11.05I567bc 71.71 P65 SO 212,3bc 22.47abcd 1.600th 465.3 c-li 18.23bed 284.1 9.8)3 I I4,45be 71.69 P65 S 205.3c 21,87bc.dióOOab 449.0h 17.83 bed 306J [0.22 4.S8be 70.65F
204.3c 22.03bcdi1.733ab _474.7c-g18.30bed - 288.5 _10.91 15.72bc 7303 PS55 209.7be 21.57cde I.GOOab 464.3c-h 17.73cd 292.7 10.7114.94be 71.40
Levelof 0.01 0.01 0.01 0.01 0.01 NS NS 0.01 NS significance
In a column figures having similar letter(s) do not differ significantly
54
4.1.2 Cob length
Individual effect of phosphorus
Cob length was not significantly affected by phosphorus levels (Table 4).The
highest cob length( 22.83cm) was found with 50 kg P/ha The lowest cob length
(21.33cm) was obtained with 0kg P/ha.
Individual effect of sulphur
Cob length was not significantly affected by sulphur levels (Table 5). However,
numerically the longest cob (22.67cm) was found with 40 kg S/ha and the shortest
cob length (21 .68cm) was obtained with 25 kg S/ha.
Combined effect P and S
Cob length was significantly influenced by the combined application of P and S at
various levels (Table 6), The highest cob length (24.13cm) was obtained in the
treatment combination of Pç54() and the lowest one (20.03cm) was obtained in the
treatment were no P and S was applied (P0S0 ).
4.1.3 Circumference of cob
Individual effect of phosphorus
There was no significant difference in the circumference of cob among the
phosphorus levels (Table 4). The highesi circumference of cob (18.99cm) was
recorded with 50 kg P/ha. The lowest circwiifercnce of cob (17.51cm) was
obtained with 0 kg P/ha
Individual effect of sulphur
Circumference of cob was not significantly affected with sulphur fertilization
(Table 5). However, numerically the highest circumference (18.53cm) was found
with 40 kg S/ha and the lowest circumference (17.60cm) was obtained with 25 kg
S/ha.
55
Combined effect of P and S
Circumference of cob showed significant variation due to the combined
application of P and Sat various levels (Table 6). The maximum and the minimum
eirctrmfei-eiice of cob were obtained with PcOS.I() and P1 S25 treatment combinations,
respectively.
4.2 Effect of P and S on the yield and yield components
4.2.1Nuniber of cobs/plant
Individual effect of phosphorus
The number of cobs per plant was not significantly influenced by different
phosphorus levels. I lowever, numerically maximum number of cobs per plant
(1.817) was obtained with 50 kg P/ha and minimum number of cobs per plant 1.54
with 0 kg P/ha (Table 4). Therefore, it was observed that number of cobs per plant
increased with increasing phosphorus levels
Individual effect of sulphur
The number of cobs per plant was not significantly influenced by different sulphur
levels. however, numerically maximum number of cobs per plant (I 80) was
found with 40 kg S/ha and minimum number of cobs per plant (I 5) with 0 kg S/ha
(Table 5).
Combined effect of P and S
The combined etlects of P and S at various levels showed significant influence on
the number of cobs per plant. The highest number of cobs per plant (2.00) were
recorded in the treatment combination of (P5,S10), 0150S}). (P0S40) and the lowest
number of cobs per plant (1.00) was recorded in the treatnicnt where no P and S
were applied.
56
4.2.2 Number of grains/cob
Individual effect of phosphorus
The number of grains per cob was significantly influenced by different phosphorus
levels The highest number of grains per cob (5139) was found with 50 kg P/ha
which was statistically identical to P0 and P;s treatments (Table 4). The lowest
number of grains per cob (4633) was obtained with 65 kg P/ha which indicated a
suppressive effect on grain due to increased application oIP.
Individual effect of sulphur
The number of grains per plant was not significantly influenced by different
sulphur levcls. However, numerically maximum number of cobs per plant (514.3)
was found with 40 kg S/ha and minimum number of grains per plant 468.3 with U
kg S/ha (Table 5).
Combined effect of P and S
The combined effects of P and S fertilizers showed the significant effect on the
number of grains per cob. The highest number of grains per cob (549.7) was
obtained in the treatment combination P,S,10 and the lowest number of grain per
cob (428.3) was obtained in the control plot (Table 6),
4.2.3 \Veight of 1000-grain
Individual effect of phosphorus
Phophosnis had signilicant effect on the weight of 1000-grain. The highest of
1000-grain weight (320.7g) was obtained by the application of 50 kg P,ha which
was statistically identical to 65 kg P/ha and the lowest one (278.3 g) was recorded
where no P was applied (Table 4).
57
Individual effect of sulphur
There was a significant influence on weight of 1000-grain by sulphur application
The highest 1000-grain weight (307.4g) was recorded with 40 kg S/ha which was
statistically identical to 55 kg S/ha and the lowest one (277.5 g) was recorded with
0 k€z S/ha (Table 5).
Combined effect of P and S
The combined effect of phosphorus and sulphur levels failed to show the
significant effect on the weight of 1000-grain. IloweveL numerically the highest
weight of 1000-grain (335.9 g) was found in the treatment combination of(PcS40)
and the lowest one (239.4 g) in the treatment were no P and S were applied (Table
6).
4.2.4 Shelling percentage
Individual effect of phosphorus
Phosphorus fertilizer showed not significantly variable effect on shelling
percentage. The highest shelling percentage (72.86%) was observed by the
application of 50 kg P/ha and the lowest one (71691/0) was observed by the
application of 0 kg P/ha (Table 4). Therefore, increasing shelling percentage was
observed with increasing phosphorus levels. Similar result was reported by
Hamniam (1995).
Individual effect of sulphur
Shelline percentage was not significantly influenced by sulphur levels However,
numerically the highest shelling percentage (73.79%) was found with 40 kg S/ha
and the lowest shelling percentage (7082%) was found with 25 kg S/ha (Table 5).
58
Combined effect of P and S
The combined effects of P and S levels railed to show significant effect on the
shelling percentage. However, numerically the highest shelling percentage
(74.25%) was found in the treatment combination of (P351S, 40 ) and the lowest one
(70.12%) was found in the combination of P35S25 (Table 6).
4.2.5 Grain yield (t/lui)
Individual effect of phosphorus
Grain yield did not show significant variation due to different levels of phosphorus
application (Table 4). Ii was noted that application of phosphorus increased the
grain yield over no phosphorus application Among the lreatnienl& the highest
grain yield (11.52 IJha) was obtained by the application of 50 kg P/ha and the
lowest yield (8.643 t!ha) was achieved with 0 kg P/ha (Fable 4 and Appendix Fig
I). Application of 50 kg P/ha produced maximum number of grains/cob 1000-
grain weight, which resulted the highest grain yield compared with other
treatments.
Individual effect of sulphur
Sulphur treatment had a significant influence on grain yield of maize. The
maximum grain yield (II .27 t/ha) was obtained by the application of 40 kg S/ha
which was statistically identical to 55 kg S/ha. The minimum grain yield (9.21
tilia) was obtained by no sulphur application ('Fable 5 and Appendix Fig. II).
Therefore, it was observed that grain yield was increased with increasing level of
sulphur. This result was in agreement with Sinha ci at (1995) who reported that
grain yield increased with S application. Similar result was also reported by
Talukdcr and Islam (1982).
59
Combined effect of Pand S
The combined effects of P and S had no significant influence on grain yield (Table
6 and Appendix Fig. Ill). However, the highest grain yield (1271 LIha) was
obtained in the treatment combination of P4S4g and the lowest grain yield (5.367
I/ha) was obtained in the treatment combination where no P and S were applied.
4.2.6 Stover yield
Individual effect of phosphorus
Stover yield significantly varied due to phosphorus application (Table 4). The
highest stover yield (16.50 tIha) was obtained by the application oiSO kg P/ha and
the lowest (12.70 tIha) with 0kg P/ha (Table 4 and Appendix Fig. I).
Individual effect of sulphur
Sulphur treatment,; showed significant influence on stover yield (Table 5 and
Appendix Fig 11). The highest stover yield (16.06 tlha) was found with 40k9 S/ha
and the lowest stover yield (13.39 t/ha) was found with 0 kg S/ha.
Combined effect of P and S
Stover yield significantly varied due to the combined effect of phosphorus and
sulphur levels (Table 6 and Appendix Fig.11l). The highest stover yield (18.40
t/ha) was obtained in the treatment combination of P50S30 and the lowest stover
yield (8.05 tiha) was obtained in the control treatment (P0S0).
Mal
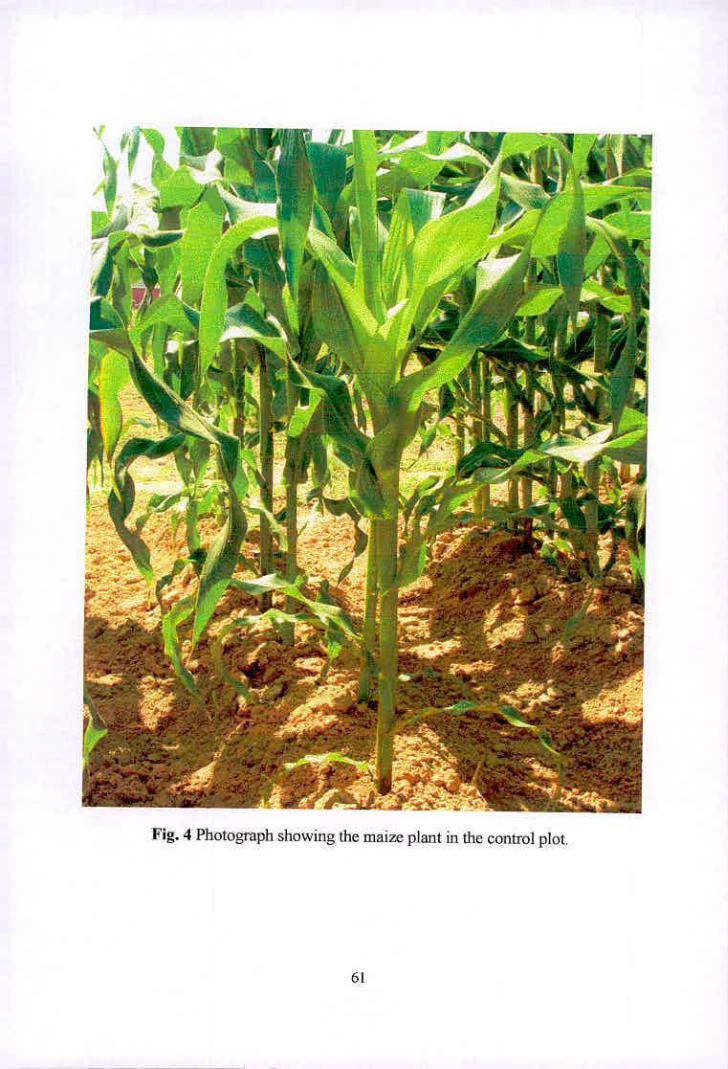
tW TV
siarct'
zz
- 4 -
- :-•jr .7
i- -
- -
•'.'_' -I •i-- - - - - • ,: '*:--•
Fig. 4 Photograph slio ing the maize plant in the control plot
91
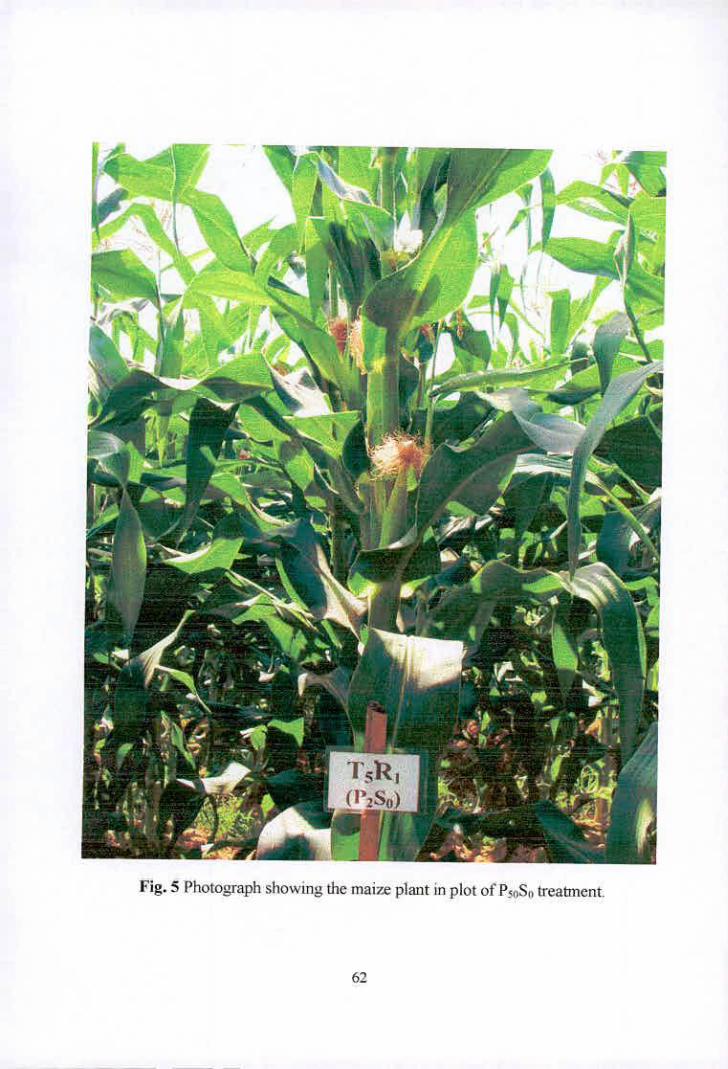
V
1'ig. 5 Photograph showing thc maize plant in plotof P<S Ireaunent.
62
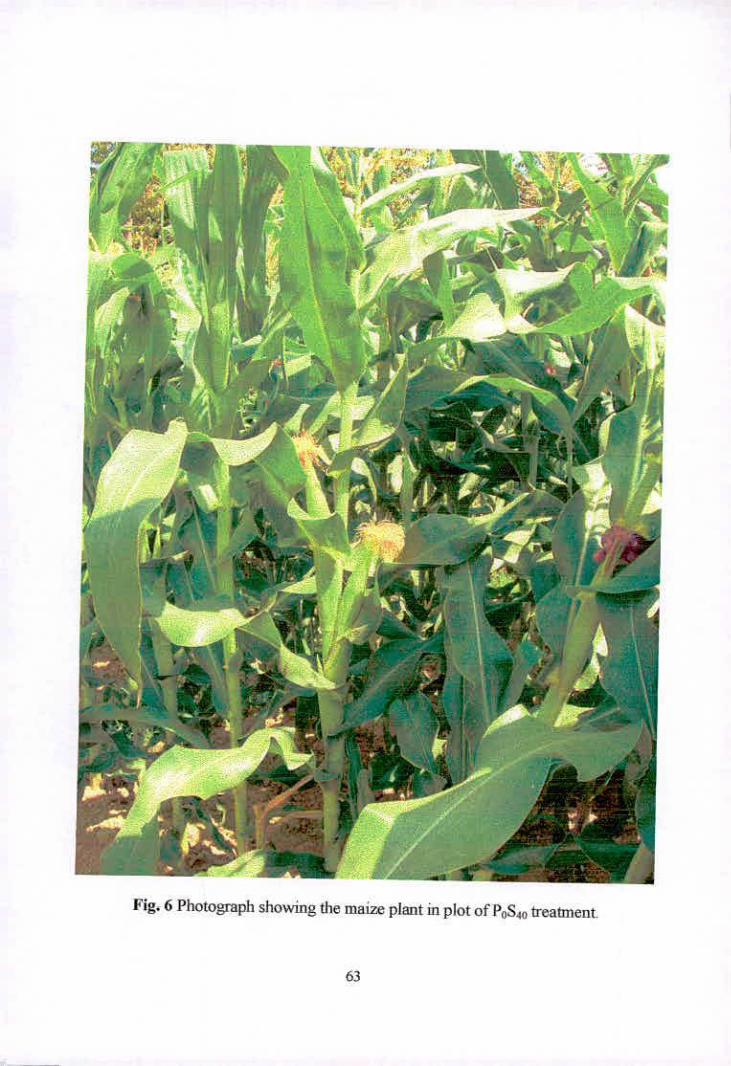
JA41 - 4441 't I ? I Iø3t, *
7¼1g k7i
_i< •1
Vt \. A -
I - 4- t ' - I 7/c -ii
AIr
-4 C Fig. 6 Photograph showing the maize plant in plot of P0S40 treatment.
63
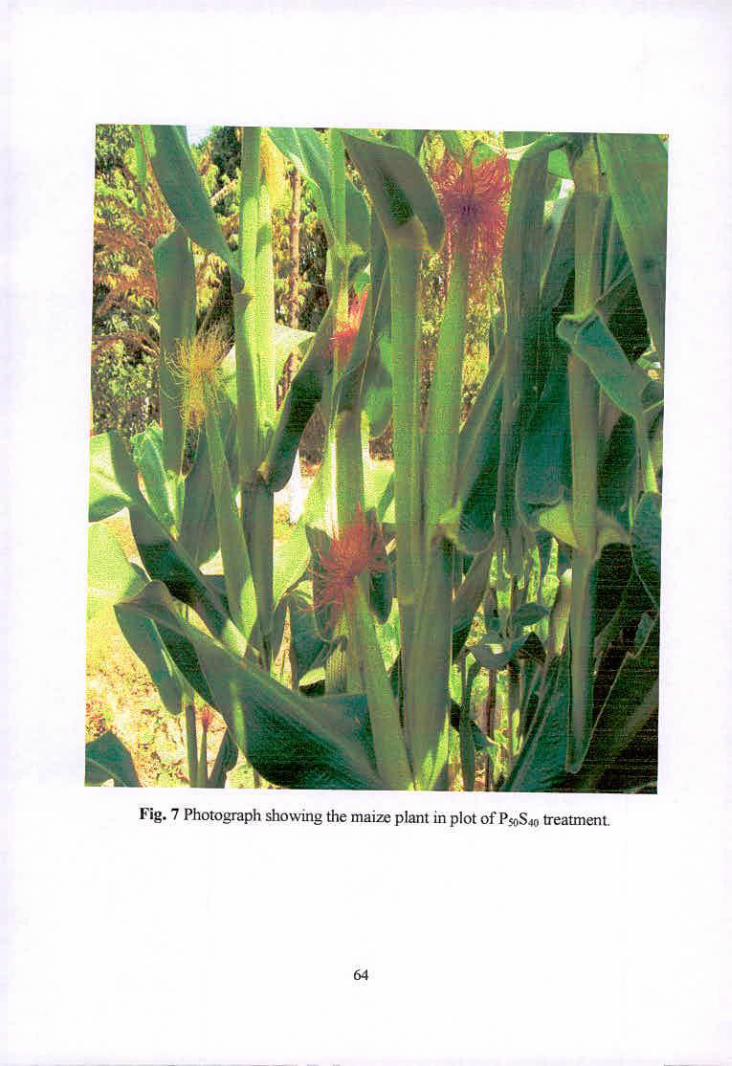
it& 43 t 4
'p
iii - - - r• yr. *
1 , 3r -
4(1
- 4k. Jai
tip
- I'
4, Al
Fig. 7 Photograph showing the maize plant in plot of P50S40 treatment
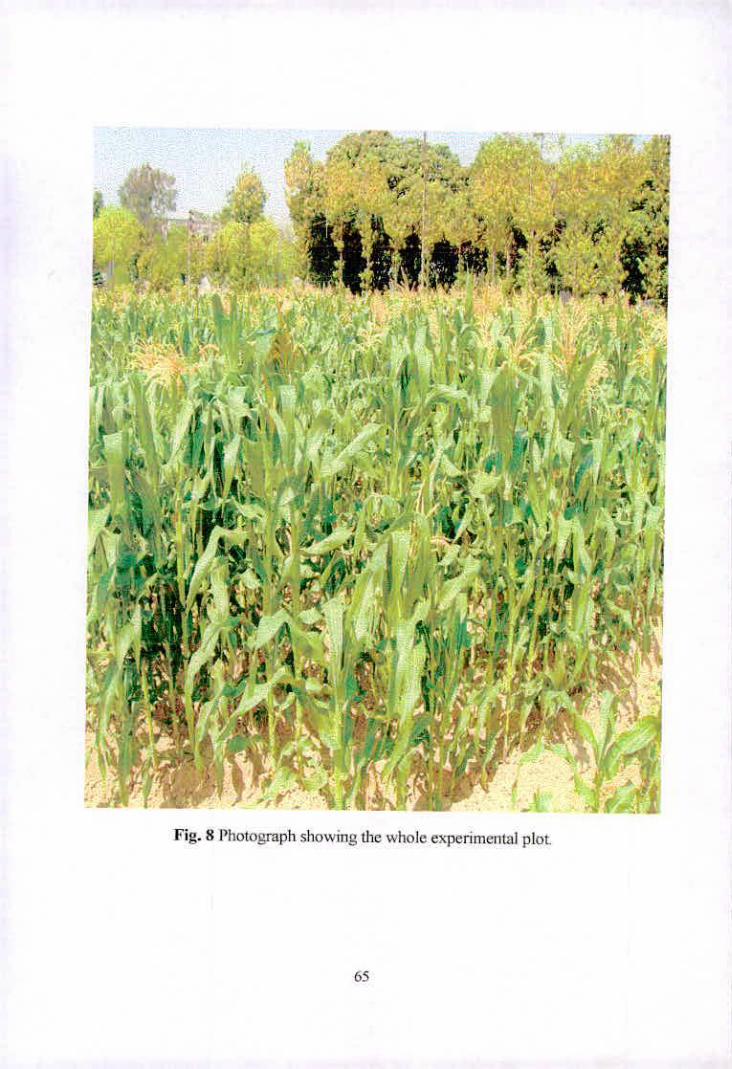
Fig. 8 Photograph showing the whole experimental plot.
65
4.3. Effect of P and S on the nutrient contents in maize plant.
4.3.1 N content
The N content in plant was not statistically significant due to different treatments
of phosphorus (Table 7). The N content in plant at different P treatments ranged
from 1-122 to 1.225 % The highest N content in plant (1.225 %) was observed in
P35 treatment and the lowest N content in plant (1 122%) was noted in control
Nitrogen content in plant did not show significant influence by different sulphur
level (Table 8). The N content in plant at different S treatments ranged from 1.095
to 1.2183 %. The highest N content in plant (1.283 %) was observed in S,1 ,
treatment and the lowest N content (I 095 %) was noted in S35. The low content of
N at the highest level of S indicated an antagonistic effect of S at its highest level
on the content of N, in maize plant.
The combined effect of P and S on N content in plant was significant (Table 9).
The N' content in plant ranged from 1.02%to The highest N content (1.41
was obtamed with PS40 treatment. The minimum N content in stover (1.02%)
was found in P0S55 .
4.3.2 P content
A significant increase in P content in plant was recorded due to different
treatments of phosphorus (Table 7), The P content ranged from 0.5238 to 0.7778
%. The highest value (0.7778 %) was obtained in 1365 treatment and the minimum
P content (0,5238 %) was obtained in control treatment. Increase in the rates of P
showed significant increase in the P content in maize plant.
Phosphorus content in stover was also influenced by different levels of S (Table
8). Phosphorus content in stover ranged from 0.6068 % to 0.6815 % The highest
Phosphorus content of straw (0.6815 %) was found in 835 kgtha. The lowest
66
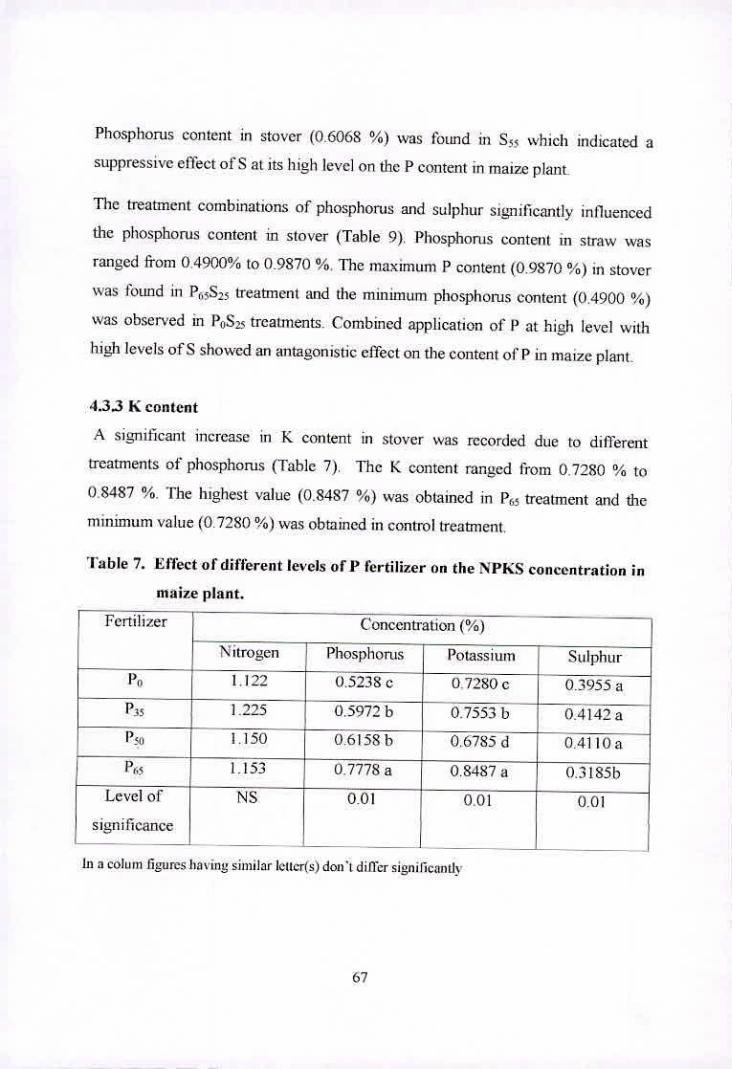
Phosphorus content in stover (0.6068 %) was found in S55 which indicated a
suppressive effect of S at its high level on the P content in maize plant
The treatment combinations of phosphorus and sulphur significantly influenced
the phosphorus content in stover (Table 9). Phosphorus content in straw was
ranged from 0.4900% to 0.9870 %. The maximum P content (0.9870 %) in stover
was found in P,iS25 treatment and the minimum phosphorus content (0.4900 %)
was observed in P0S25 treatments. Combined application of P at high level with
high levels of S showed an antagonistic effect on the content of P in maize plant.
4.3.3 K content
A significant increase in K content in stover was recorded due to difièrent
treatments of phosphorus (Table 7). The K content ranged from 0.7280 % to
0.8487 %. The highest value (0.8487 %) was obtained in P65 treatment and the
minimum value (0.7280 %) was obtained in control treatment.
Table 7. Effect of different levels of P fertilizer on the NPKS concentration in
maize plant.
r Fertilizer Concentration (%)
Nitrogen I Phosphorus - Potassium Sulphur
— - p0 1.122 0.5238 c 0,7280c 0.3955a
P35 1.225 0.5972 b - 0.7553 b 0.4142 a
1.150 0.6158b - 0.6785d 0.4110a
PM 1.153 0.7778a j
0.8487a 0.3185b
Level of NS 0.01 0.01 0.01
significance
In a COILIII1 figures having similar letter(s) do&t differ signilicantly
67
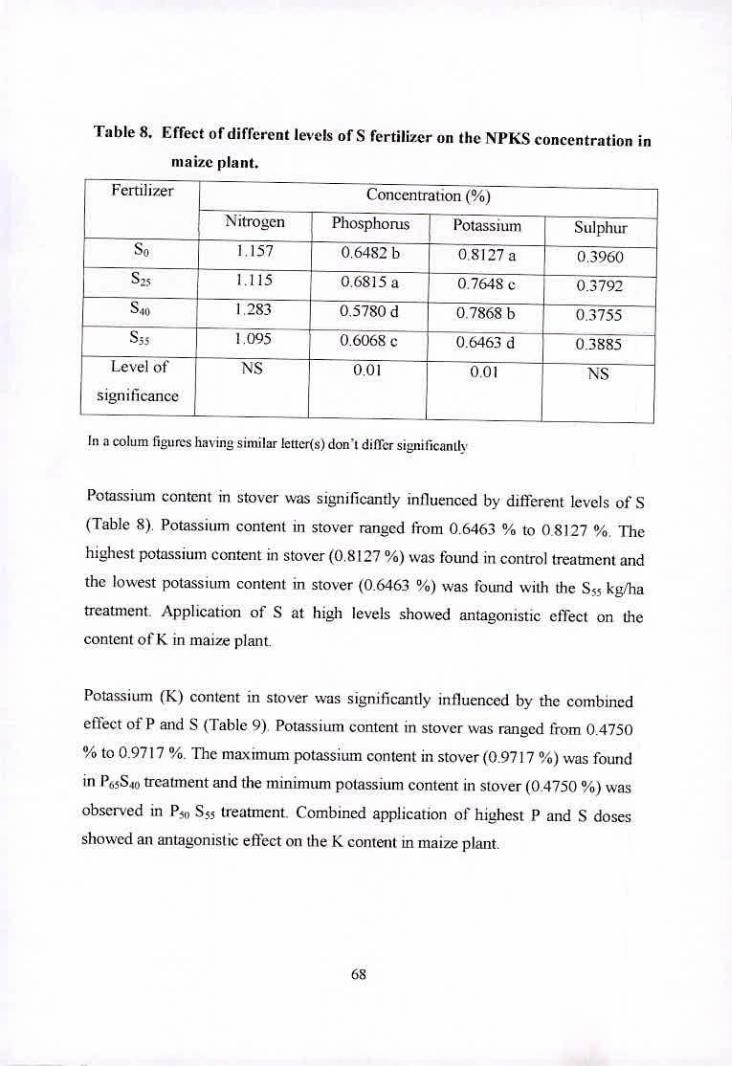
NS
Table S. Effect of different levels of S fertilizer on the NPKS concentration in
Concentration (%)
maize plant.
Fertilizer
1c itrogen
so 1.157
S25
Level
significance
Phosphorus
0.6482 b
0.6815 a
0.5780 d
0.6068 c
0.01
Potassium
0.8)27 a
0.7648 c
0.7868 b
0.6463 d
xff
Sul phtu
0.3960
0.3792
0.3755
0.3885
NS
In a colum figures having similar letter(s) doni differ signiJicintIv
Potassium content in stover was significantly influenced by different levels of S
(Table 8). Potassium content in stover ranged from 0.6463 % to 08127 % The
highest potassium content in stover (0.8127%) was found in control treatment and
the lowest potassium content in stover (0.6463 %) was found with the Sç kg/ha
treatment. Application of S at high levels showed antagonistic effect on the
content olK in maize plant.
Potassium (K) content in stover was significantly influenced by the combined
efThct of P and S (Table 9) Potassium content in stover was ranged from 0.4750
% to 0.9717 0/0. The maximum potassiwii content in stover(0.9717 %)was found
in P(5S4() treatment and the minimum potassium content in stover (0.4750%) was
observed in P 1, S55 treatment. Combined application of highest P and S doses
showed an antagonistic effect on the K content in maize plant.
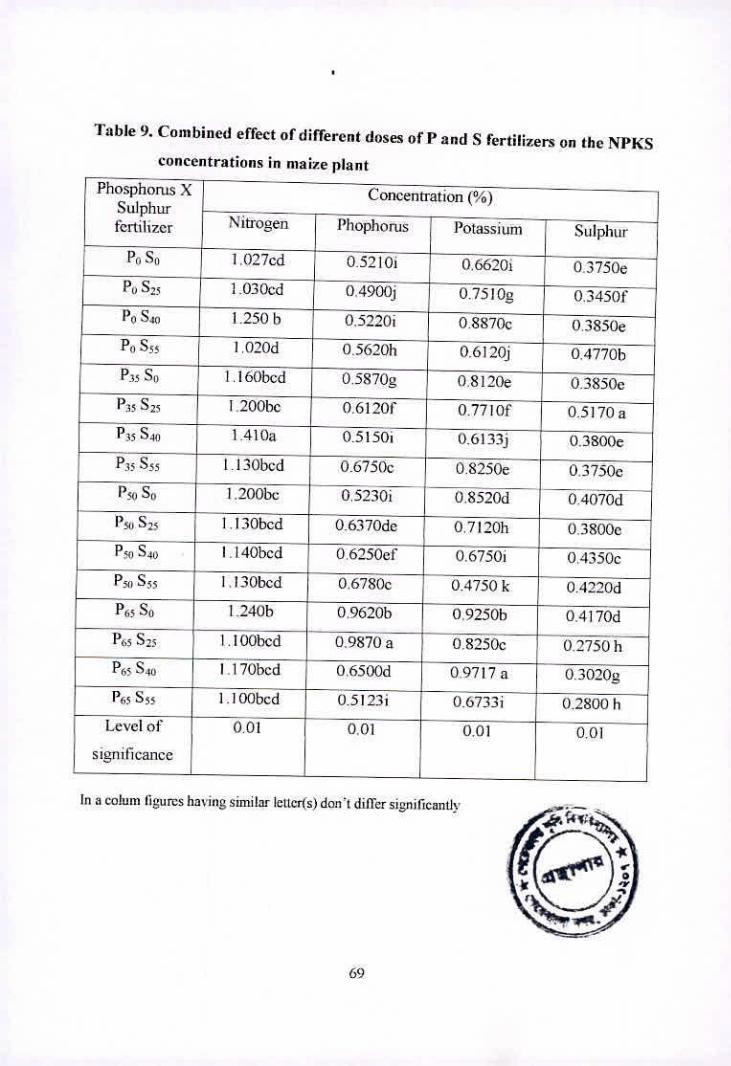
Table 9. Combined effect of different doses of P and S fertilizers on the NPKS
concentrations in maize plant
PhosPhontJ SUIPIlUr fertilizer
- Con&at ion (%)
r NUD iss T P0S0 l.027cd 0.52101 0.66201 0.3750e P0 25 j1.O3OcdJ-4900J
C1 0.7510g 0.34501 r P0 S'40 1.250b 0.52201 0.8870c
0.61 20j
0.3850e
0.47701, PU S5 1.020 0.5620h
P35 SI) 1 I. 160bcd 0.5370g
0.61201
- 0.5150PJ
0.52301
0.5750c T0.8250e
0.8 120e
0.77101
0.6133j
0.8520d
0.3850c
0.5170a
0.3800e
I.200bc
l.410a
I.l3Obcd
I .200bc
- S410
P35 5cc 0.3750c
O.4070c1 P40 S0
PS24 1.I3Obcd - O.6370de
0.6250ef
0.6780c
0.9620b
0.9870 a
0.7120h 0.3800e - - P 0 S40
P S55
P64 S0
- i I4Obcd
I .1 30bcd
I .240b
I. lOObed
I.l7Obed
1.1OObcd
0.01
0.67501
0.4750 k
0.92501,
0.8250c
0.4350c
0.4220d
0.41 70d
0.2750 h P65 S25
0.6500d
0.51231
0.01
0.97l7a
0.6733j
0.01
O.3020g
0.2800h
0.01
P(,5 S55
Level of
significance
In a colum figures having similar letter(s) do&t differ sinhficantIv a
69
4.3.4 S content
A significant increase in S content in stover was recorded due to different
treatments of P (Table 7). The S content ranged from 0.3185% to 0.4142%. The
highest value (04142 %) was obtained in P35 treatment which was statistically
similar with P, and 115,. The minimum value (0.3185 %) was obtained with Pc,
which showed antagonistic effect of high P dose on S content in maize plant.
Sulphur content in stover was not sipificantly influenced by different levels of S
(Table 8)
The combined effect of P and Son S content in stover was sianificantly influenced
(Table 9). Sulphur content in stover was ranged from 0.2750% to 0.5170 O/ The
maximum sulphur content (0.5170 %) in stover was found in P3 S2, treatment and
the minimum sulphur content (0.2750 %) was observed in 1165 Sr treatments. This
showed antagonistic effect of P and S on S content when P at high level was
applied.
4.4 Effect of Phosphorus and Sulphur on nutrient uptake by maize plant.
4.4.1 Nitrogen uptake
The N uptake by the stover of maize was found statistically significant due to
different treatments of phosphorus (TablelO) The N uptake by stover due to
different treatments ranged from 145.7 kg/ha to 189.1 kg/ha The highest N uptake
(189.1 kg ha") was observed in P50 treatment and the lowest N uptake (145.7 kg
ha") was noted in P0. Application of P at its highest level (P(,5) showed a
suppressive effect on the N uptake by the maize plant.
Nitrogen uptake by stover was significantly affected by different sulphur levels
(Table I I), The N uptake by stover due to different S treatments ranged from
156.5 kg/ha to 204.5 kg/ha The highest N uptake (204.5 kg ha") was observed in
540 treatment and the lowest N uptake (156.5 kg ha") was noted in S'0. S at the
70
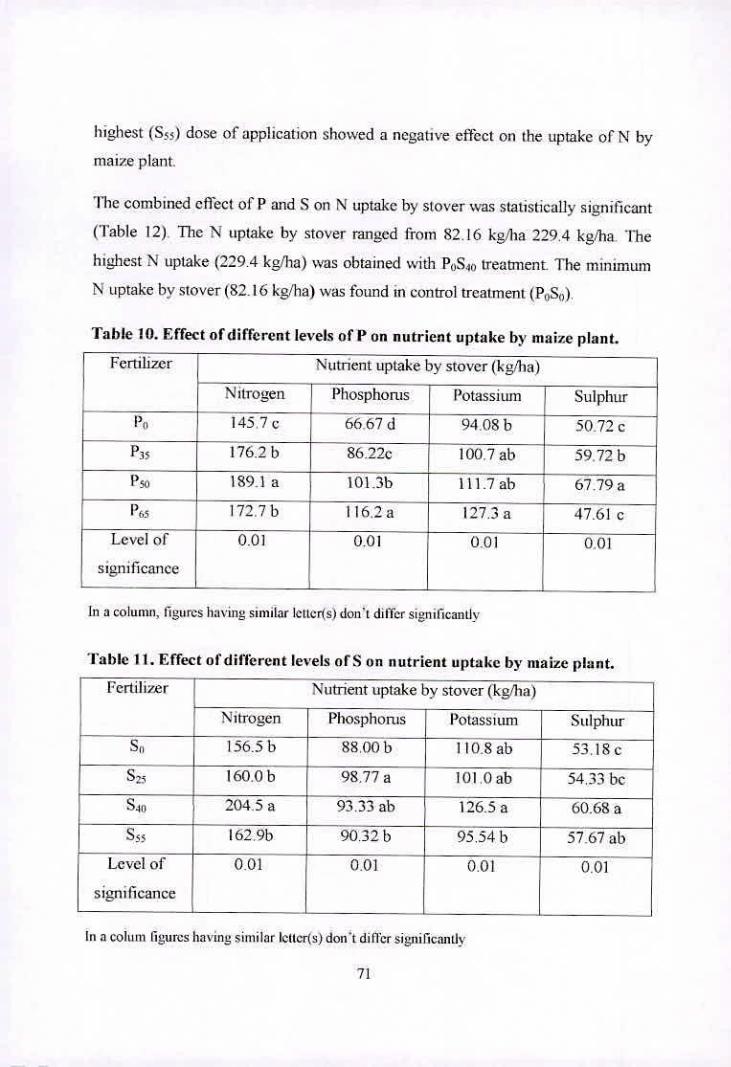
highest (S55 ) dose of application showed a negative effect on the uptake of N by
maize plant.
The combined effect of P and S on N uptake by stover was statistically significant
(Table 12). Die N uptake by stover ranged from $2.16 kg/ha 229.4 kg/ha The
highest N uptake (229.4 kg/ha) was obtained with P0S40 treatment. The minimum
N uptake by stover (82.16 kg/ha) was found in control treatment (P0S0 ).
Table 10. Effect ofclifferent levels of P on nutrient uptake by maize plant.
Fertilizer Nutrient uptake by stover (kg/ha)
Nitrogen P Phosphorus I Potassium Suinhur
P0
- 145.7 c
. 66.67 d
]86.22c
50.72 e 94.08 b
- 100.7 ab -. P35 176.2 b 59.72 b
P50 189.1a I01.3b 111.7ah 67.79a
- Level of [
172.7b
0.01
116.2 a
0.01
127.3 a
0.01
47.61 c
0.01
significance
In a column, figurvs having similar letter(s) doift differ signilicantiv
Table 11. Effect ofdilTerent levels ofS on nutrient uptake by maize plant.
Fertilizer Nutrient uptake by -stover (kg/ha) - - Nitrogen Phosphorus I Potasslu Ij2iilphtrr -
S0 156.5 b 88,00 h II OSab ]
53.18 c
160.6b 98.77 a 101.0ab 54.33 be
204.5 a 93.33 ab 126.5 a 60.68 a
162.9b
0.01 - 90.32b 95.54b 57.67ab
0.01 - Level of 0.01 0.01
significance
In a colurn flgurcs having similar letter(s) doni diIlbr signiflcantiv
71
4.4.2 Phosphorus uptake
Phosphorus uptake by the stover of maize was found statistically significant due to
different treatments of phosphorus (Table ID). •Fhe P uptake by stover due to
different treatments ranged from 66.67 kg/ha to 116 2 kg/ha The highest P uptake
(116.2 kg ha4 ) was observed in P65 treatment and the lowest P uptake (66.67 kg
had ) was noted in P. The uptake of P showed increase with increase in the levels
of P.
Phosphorus uptake by stover was significantly affected by different sulphur levels
(Table 11). Phosphorus uptake by stover was ranged from 88.00 kg/ha to 98.77
kg/ha. The highest P uptake by stover (98.77 kg/ha) was found intreatment
and lowest P uptake (8800 kgTha) was found with S0 treatment. Application of S
at its higher levels showed a negative effect on the uptake of P by the maize plant.
The treatment combinations of phosphorus and sulphur significantly influenced
the phosphorus uptake by stover (Table 12). Phosphorus uptake by stover was
ranged from 41.68 kg/ha to 146.9 kg/ha. The highest P uptake by stover (146,9
kg/ha) was obtained from the treatment 136cS2 and the lowest values (41.68 kg/ha)
was obtained from control treatment (1',S1,). The highest level of P (F61) combined
with higher S levels( S4L, and S5 5) showed an antagonistic effect on Ihe P uptake by
maize plant
4.4.3 Potassium uptake
Etiect of phosphorus levels on K uptake by stover responded significantly due to
difIercnt treatments (Table 10) and ranged from 94.08 kgha to 1273 kgha'. The
highest K uptake (127.3 kg ha1) was noted in P<.3 treatment and the lowest value
(94.08 kg ha1) was found in P0. K uptake by plant showed a progressive increase
with the increase in the levels of P.
72
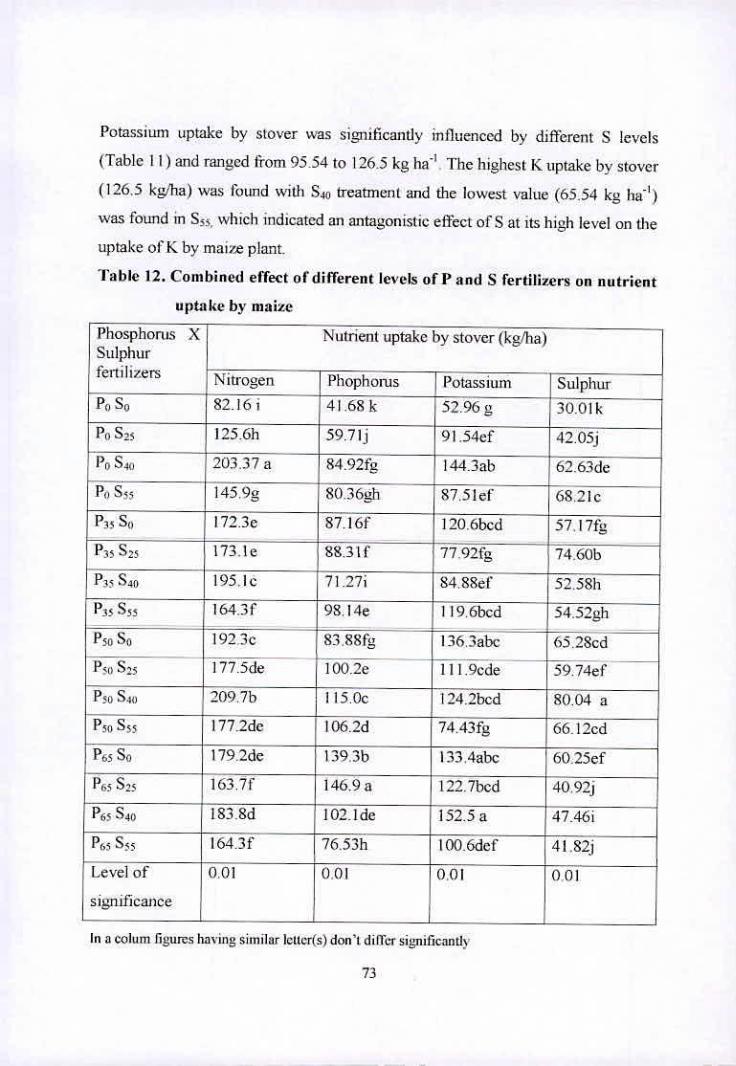
Potassium uptake by stover was siiificant1y intluenccd by different S levels
(Table I I) and ranged from 95.54 to 126.5 kg haS ' The highest K uptake by stover
(126.5 kg'lia) was found with S40 treatmern and the lowest value (65.54 kg 1*1')
was found in Si5, which indicated an antagonistic effect of S at its high level cii the
uptake of K by maize plant.
Fable 12. Combined effect of different levels of P and S fertilizers on nutrient
uptake by maize
Phosphorus X Sulphur fertilizers
P0 S0
Nutrient uptake by stover (kg/ha)
Nitrogen Phophorus Potassium Sulphur 82.16i 41.68k 5196g 1 30.01k -
P0 S25 125.6h 59.71j
84.92fg
91.54ef
P0 S40 203.37 a - 144.3ab 62.63de
87.5 lef 68.21c
120.ôbcd 57.I7fg
7792fg 74.60b
84.88e1 52.58h
119.6hcd -. 54.52gh
I36.3abe 65.28cd
Ill .9cde 59.74ef
l24.2bcd 80.04 a
74.43fg 66.12cd
133.4abc 60.25ef
122.7bed 40.92j
152.5 a 47.46i
100.6dcf 41.82j
PS 145.9g 8().36zh
87.lof 7S8311
P35S0 172.3e
P'zcS40 - 173.1e
195.1c 71.27i
P50 S0
1 17 S25
164.31
1923c -
I 77.5de
98.14e
j 83.88fg
I 00.2e
I 15.Oc
106.2d
139,3b
P50 S40
1350 Sç
P65 50
209.7b
177.2de
179.2de
163.71 p6i S25 146.9 a
P6 40
S55
183.8d
I64.3f
102.Ide
76.53h
Level of
significance
0.01 0,01 (lOt 001
In a colum figures having similar letter(s) don't diller significanth
73
Potassium (K) uptake by stover was significantly affected by the combined effect
of phosphorus and sulphur (Table 12). The K uptake ranged from 52.96 tol52.5
kg ha The treatment combination P1 S40 gave the highest K uptake by stover
(152.5 kg/ha), which was significantly different from other treatments. The lowest
K uptake by (52.96 kg/ha) was found in control treatment (P0S),
4.4.4 Sulphur uptake
Effect of phosphorus levels on S uptake by maize stover responded significantly
due to different treatments of P. The S uptake ranged from 47.61 to 67,79 kg ha"
(Table 10). The highest S uptake (67.79 kg ha") was obtained in 13 0 treatment
and the lowest value (47.61 kg ha") was found in P65 which is an indication of
the suppressive effect of high P dose (s) on the uptake of S by maize plant.
Sulphur uptake by stover was significantly influenced by different levels of S
(Table I I). Sulphur uptake by straw ranged from 53.18 kg/ha to 6068 kg/ha. The
highest S uptake by stover (60.68 kg/ha) was found in S.p, and the lowest S uptake
by stover (53.18 kg/ha) was found in Sa treatment.
Combined effect of different levels of phosphorus and sulphur on S uptake by
stover was significantly influenced (TabIel 2). Sulphur uptake by stover was
ranged from 30.01 kg/ha to 80.04 kg/ha. The maximum sulphur uptake by stover
(80.04 kg/ha) was found in P5()S40 treatment and the minimum sulphur uptake
(30.01 kg/ha) was observed in control treatment. Application of P and S at their
highest levels (P( 5S55) showed an antagonistic effect on the uptake of S by the
maize plant.
74
4.5 Effect of P and Son the characteristics of the post harvest soil
The characteristics ofihe post harvest soils as influenced by different treatments of
P and S showed a markcd variation on the soil organic carbon, N. F, K and S
contents in soil.
4.5.1 Organic carbon content (%)
A significant variation was observed on the organic carbon content in soil after
maize harvest where various levels of phosphorus was incorporated in soil The
organic carbon content of the post harvest soil ranged from 0 730 %to 1 .269%
(Table l3). The maximum organic carbon content (1.269%) was obtained in the
P5 treatment and the minimum organic carbon content (0.730/u) was obtained in
the P,0 treatment.
A significant variation was observed on the organic carbon content after maize
harvest where different levels of sulphur were incorporated in soil. The organic
carbon content in the post harvest soil ranged from 0.7825 % to 1.01 1% (Table
14). The maximum organic carbon content (1.01 1%) was obtained in the S40
treatment and the minimum organic carbon content (0.78250/0) was obtained in the
S0 treatment.
Combined application of different doses of phosphorus and sulphur showed a
significant effect on the organic carbon content in the postharvest soil (Table 15).
The organic carbon content in the post harvest soil ranged from 0.82% to 1.763 %.
The highest organic carbon content (1.763 %) was recorded in the treatment
combination of PM S and the minimum organic carbon content (0.82%) was
obtained in the control treatment
4.5.2 Total nitrogen
A statistically significant variation was observed in the total N content in the post
harvest soil. The total N content of the post harvest soil varied from 0.077 % to
75
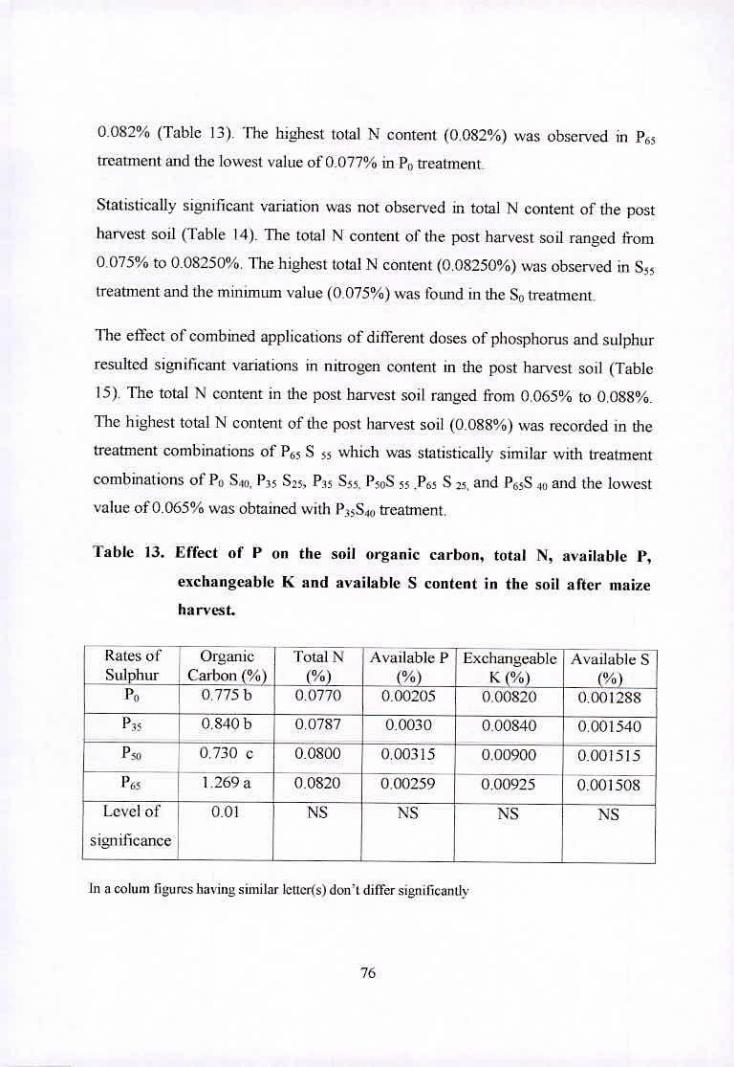
0.082% (Table 13). The highest total N content (0.032%) was observed in 1365
treatment and the lowest value of 0.077% in RI) treatment.
Statistically significant variation was not observed in total N content of the post
harvest soil (Table 14). The total N content of the post harvest soil ranged from
0.0759/o to 0.08250%. The highest total N content (0.08250%) was observed in S
treatment and the minmiium value (0.075%) was found in the S0 treatment.
The effect of combined applications of different doses of phosphorus and sulphur
resultcd signiAcarit variations in nitrogen content in the post harvest soil (Table
IS). The total N content in the post harvest soil ranged from 0.065% to 0.088%.
The highest total N content of the post harvest soil (0.088%) was recorded in the
treatment combinations of P5 S s5 which was statistically similar with treatment
combinations of P0 S.10, 1315 S25, Ri5 S5 5 P)S 55.P65 S 25. and P65S . and tFie lowest
value of 0.065% was obtained with PsS4çj treatment.
Table 13. Effect of P on the soil organic carbon, total N, available P,
exchangeable K and available S content in the soil after maize
harvest.
Rates of Organic Total N Available PJ Exchangeable 'Available S Sulphur Carbon (%) (%) (%) K (%)
0.775 h - 0.0770 0.00205 0.00820 0.001288
i0.840b 0.0787 - 0.0030
0.00840 I 0.001
0.730 c LTh.osoo 1 0.00315
IJ.UU',uu
0.001515
P6c I 1.269 a 0.0320 1 0.00259
0.00925
0.00 1508
Level of 0.01 NS
NS
significance i
In a colurn figures having similar letter(s) dont differ siguificandv
76
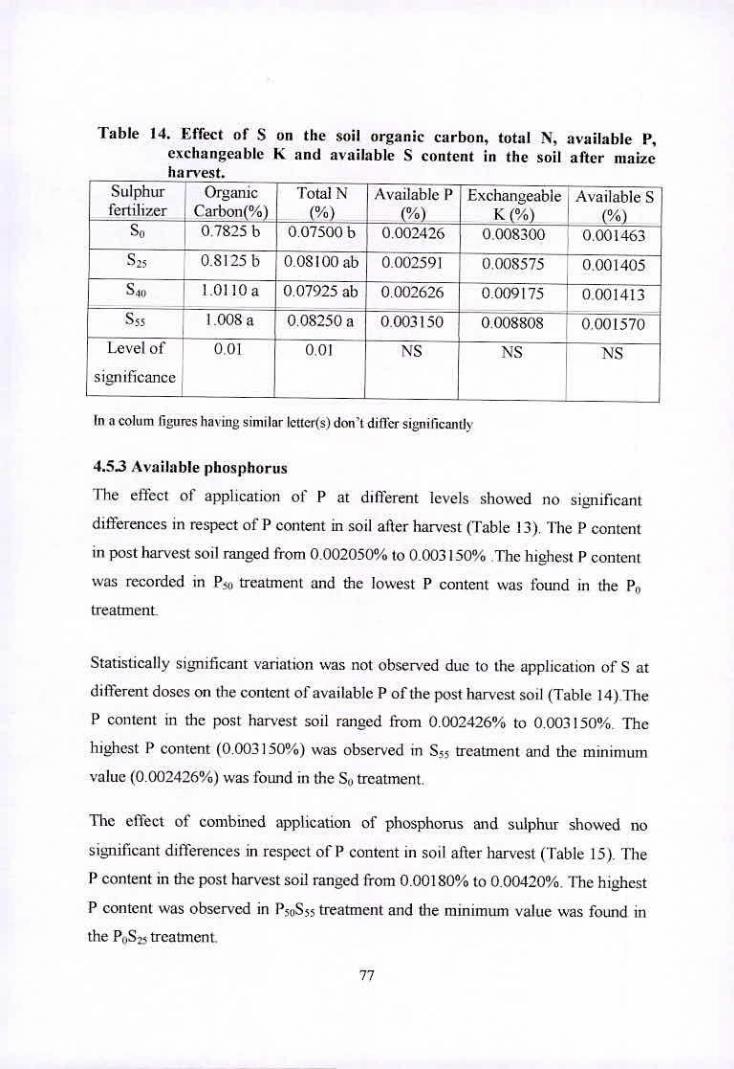
Table 14. Effect of S on the soil organic carbon, total N, available P. exchangeable K and available S content in the soil after maize harvest.
Sulphur Organic Total N AvailaleP Exchangeable Available S fertilizer
S0
Carbon(%) 0.7825h
(%) 0.07500 b
0.081 00th
O.07925ahj
(%) K (%)
00024261 0008300
0.002591 0.008575
0.002626 0.009175
(%) 0001463
0.001405
0.001413
0.8125 h
S.10 F 1.0110a
S55 - 1.008a j
0.08250a
- - 0.01
0.003150 10.008808 0.001570
Level of 0,01 iNS NS F NS
slenificance
In a colum flgurcs having similar letter(s) don't diflër signilicanth
4.53 Available phosphorus
The effcct of application of P at different levels showed no significant
differences in respect of P content in soil after harvest (Table 13). The P content
in post harvest soil ranged from 0.002050% to 0.003150% The highest P content
was recorded in P treatment and the lowest P content was found in the P
treatment.
Statistically significant variation was not observed due to the application of S at
different doses on the content of available P of the post harvest soil (Table I 4).The
P content in the post harvest soil ranged from 0.002426°/s to 0.003150%. The
highest P content (0.003150%) was observed in Sc treatment and the minimum
value (0.002426%) was found in the S treatment
The effect of combined application of phosphorus and sulphur showed no
significant differences in respect of , P content in soil aller harvest (Table 15). The
P content in the post harvest soil ranged from 0.00180% to 0.00420%. The highest
P content was observed in PccpSjs treatment and the minimum value was found in
the P,S- treatment.
77
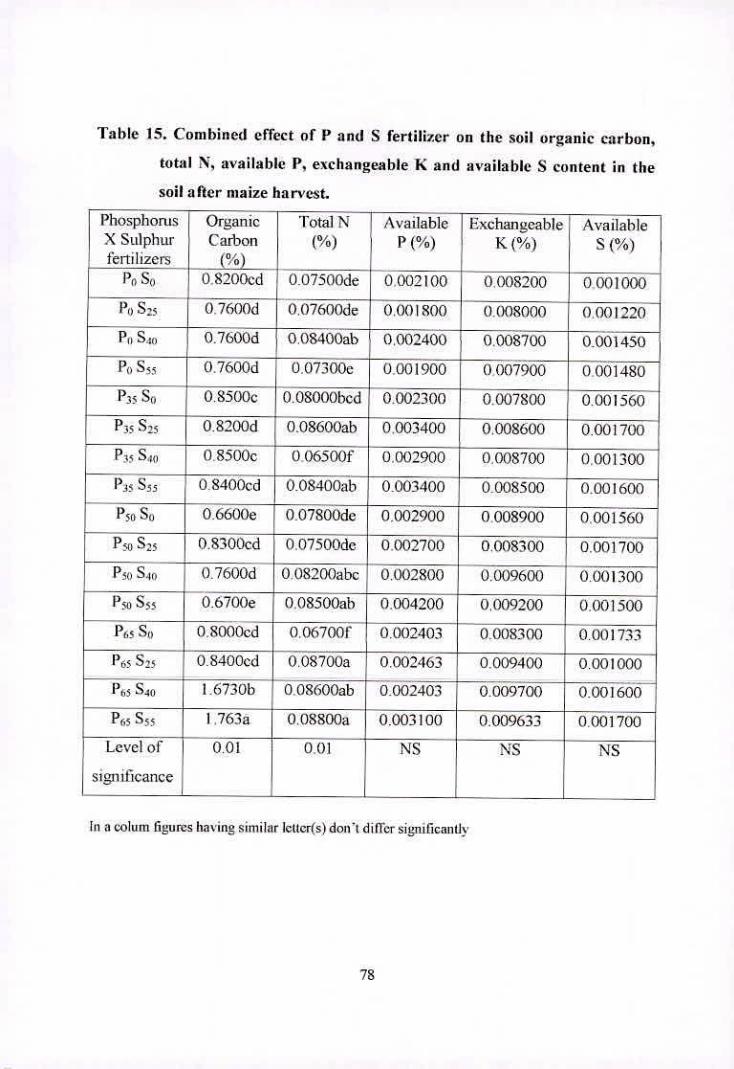
Table 15. Combined effect of P and S fertilizer on the soil organic carbon,
total N, available P. exchangeable K and available S content in the
soil after maize han'est.
Phosphorus Organic - Total N Available Echangcable' Availa}1 X Sulphur Carbon (%) P (%) K (%) S (%) fertilizers
P0 S0 0.8200ed i 0.07500de 0.002100 0.008200 0.001000
0.7600d O.O7bOOde 0.001800 0.008000 1
0.001220
P0 S,, a7600d 0.08400ab 0.002400 0.008700 0.1450
PO SSS 0.7600d 0.07300e 0.001900 0007900 0001480
P3 S0 0.850Cc O.O8000hcd - 0.002300 0.007800 0.001560
P35 S,5 0.8200d 0.08600ab 0.003400 0.008600 0.001700
P5 S. 0.8500c 0 06500f 0.002900 0.008700 0,001300
1), 3~ S55 0.8400ccJ 0.08400th 0.003400 -. 0.008500 0.001600
P50 S0 0.6600e 0.07800de0.002900 0.008900 0.001560
P S25 0.8300cd 0.07500de 0.002700 0.008300 0.001700
P. Q S4() 0.7600d 0.08200abc 1 0.002800 0.009600 6001300
P< 5 0.6700e 0.08500aK 0.004200 0.009200 ~-O.001500
P11cS0 0.S000cd 0.06700f 0.002403 - - 0.008300 0.001733
P65 S-,c - 0.8400cd -. 0.08700a 0.002463 0.009400 0.00 1600 -
P 0 S40 1.6730b 0.08600th 0.002403 0.009700 0.001600
PMS 1.763 - 0.08800a ' 0.003 100 0.009633 0.171 Level of 0.01 0,01
I NS -. NS NS I
significance
In a colum flgurcs having similar letter(s) do&t differ significantly
78
4.5.4 Available potassium
The effect of application of P showed no significant differences in respect of K
content in soil after harvest (Table 13). The K content in post harvest soil ranged
from (0.0082% to .000925 %).The highest K content was recorded in P65
treatment and the lowest K content was found in the P0 treatment.
Statistically signiticant variation was not observed in K content of the post harvest
soil with the application of various levels of S (Table 14) The K content of thc
post harvest soil ranged from 0.0083 % to 0.0091 %. The highest K content was
observed in 540 treatment and the minimum value was found in the SI) treatment.
The effect of combined application of phosphorus and sulphur showed no
significant differences in respect of K content in soil after harvest (Table 15). The
K content in die post harvest soil ranged from 0.00780% to 0.00970%. The highest
K content was observed in P,5S40 treatment and the minimum value was found in
the 1133S(, treatment.
4.5.5 Available sulphur
The effect of application of P showed no sienificant differences in respect of S
content of soil aller harvest (Table 13). The S content iii post harvest soil ranged
from 0.001288% to 0.001540% The highest S content was recorded in P35
treatment and the lowest S content was found in the P0 treatment.
Statistically significant variation was not observed in sulphur content in of the
post harvest soil (Table 14). The S content in the posi harvest soil ranged from
0.001 405% to 0.001570%. The highest P content in was observed in S55 treatment
and the minimum value was found in the S 5 treatment.
79

The effect of combined application of phosphorus and sulphur showed no
significant differences in respect of S content of soil after maize harvest (Table
15). The S content of the post harvest soil ranged from 0.00100% to 0.001733%.
The highest S content was observed in P65S0 and the minimum value was found in
the control treatment (P0S9).

Thapter 5
Summa and Conclusion
Chapter 5
SUMMARY AN!) CONCLUSION
A field experiment was conducted at Sher-c- Bangla Agricultural University Farm,
Dhaka during the period from October. 2006 to April, 2007 to study the response
of maize to phosphorus and sulphur fertilization. The study included four levels of
phophorus, viz., 0,35, 50 and 65 kg P/ha and four levels of sulphur. viz., 0, 25.40
and 50 kg S/ha. Triple Super Phosphate and Gypsum were used as the sources of P
and S. respectively. The experiment was laid out in a Randomized Complete
Block Design (RCBD) with three replications. The size of each unit plot was 3m
3111 91n 2 . The individual plots and the blocks were separated for irrigation and
drainage by I and 1.5 in canals, respectively. The sccds of maize (BARI Maize-5)
were sown on 27 October, 2006 and the crop was harvested on 17 April 2007.
Phosphorus and sulphur fertilizers were applied as per treatment combinations.
Full doses of potash (MP), Boron and Zinc and one-third of the N (urea) were
applied at the time of tinal land preparation. The rest of the urea was applied in
two equal splits on 30 and 60 days after sowing (DAS).
Data were collected in respect of plant height, number of cobs per plant, cob
length. circumference of cob, number of grains per cob. I 000-grain weight,
shelling percentage. grain yield and stover yield
Plant heights, grains/cob, 1000-grain weight, stover yield, P. K and S content in
maize plant, N, P, K and S uptake by maize plant and organic carbon in post
haivest soil were significantly influenced by phosphorus application. Application
of 50 kg P/ha resulted tallest plant, highest number of cobs/plant, maximum cob
length, maximum grains/cob, highest circumference of cob, highest grain and
stover yield. N and S uptake by plant and available P in post harvest soil
81
Results showed that the effect of sulphur fertilization was significant on 1000-
£!rain weight, grain and stover yields, P and K content in maize plant, N. P, K and
S uptake by maize plant, organic carbon and total N in post harvest soil. Highest
values in respect of plant height, cobs/plant. cob length, grains/cob. circumference
of grain yield, stover yield, shelling percentage, N content in maize plant. N. K
and S uptake by maize plant, organic carbon and available P in post harvest soil
were obtained with 40 kg S/ba.
The experimental data also showed that the combined effect of phosphorus and
sulphur on various parameters was found positive and significant Combined
application of P and S had significant effect on plant height. number of cobs/plant,
cob length, grains/cob, circumference of cob, 1000-grain weight, grain yield,
stover yield. N. P. K and S content in maize plant. N. P. K and S uptake by maize
plant, organic carbon and total N in post harvest soil. Phosphorus c, 50 kg/ha with
sulphur @ 40 kg/ha gave the highest plant height, number of cobs/plant, cob
Length, grain/cob, circumference of cob. 1000-grain weight, grain yield, stover
yield and S uptake by maize plant. Therefore, it can be concluded that the
application of 50 kg P and 40 kg S/ha is suitable for the efficient production of
maize in the soils of the Modhupur Tract. Application of phosphorus and sulphur
at their higher levels showed antagonistic effects on both the concentrations and
uptake of phosphorus and sulphur and on the concentration of potassium in maize
plant.
82

iter ;
References
Chapter 6
REFERENCES
Ahmed, F. (1994). Maize production techonology (in Bengali). Published by
lnternationai Fertilizer Development Centre Consultant of Ministry of
Agriculture, Bangladesh. pp. 13-15.
Akande, MO., Adediran, J.A. and Oluwatoyinbo, F.I. (2005). Effects of rock
phosphate amended with poulny manure on soil available P and yield of
maize and eowpea. Institute of Agricultural Research and Training,
Obafemi Awolowo University, P.M.B 5029 Moor Plantation. (badan,
Nigeria. African.!. Biotech. 4(5): 444-443.
Akinrinde, LA.. Bello, O.S. Ayegboyin, K.O. and !roh. L. (2005). Added benefits
of combrned organic and mineral phosphate fertilizers applied to maize and
melon. Agronomy Dcpartnient. University of I'badan, Ibadan, Nigeria. J.
Rod, AgrEe, and Eni'ir. 3 (3/4): 75-80
Alcxandrova, P. and Donov, D. (2003). Nitrogen content and its uptake by maize
as influenced by some meteorological elements and fertilization. N.
Poushkarov lnstttute of Soi] Science, Sofia 1080, 7, Shosse Bankja str.,
Bulgaria. Imernaiwnal Agrop/nsk's. 17(2): 4145,
Allen, A.Y. 1976 The effects of sulphur on maize yields in western Kenya. East
Afrk'aAgric 142: 3 13-322.
83
Alvarez. R., Lencotil J. and Daniel. P.E. (1987). Accumulation and distribution of
sulphur and phosphorus durmg growth of maize in relation to N fertilizer
application. Cent. Radiobiol., Univ. Buenos Aires. Argentina. 8: 1-2, 77-80;
14,
Araujo. I.B., Furtini Neto, A.L. Resende, AN., Alves. V.M.f. and Mendes, B.R.
2004. p sources and placement on maize yield and mineral nutrition.
Rev/sic Brasileira c/c Mi/lw e .Srgc. 3(2): 250-264.
Arvind. V., Kanthaliya. P.C. (2004). Crop yields and changes in soil fertility status
of a typic ustochrepts under continuous use Of fertilizers in maize wheat
cropping system. .1. LCO P/zycio/. 7(3/4): 125-128,
Astolfi. S.. Zuchi, S.. Cesco, S., Varanini, Z. and Pinton, R. (2004). Influence of
iron nutrition on sulphur uptake and metabolism in maize (Zea ,navc L.)
roots. So//Sd. and P/wit Nit/ri! ion. 50(7): 1079-1083.
Awan. Z.I. and Abbast. M.K. (2000). Interactive effect of phosphorus and copper
on niaizegrowth. Pukixia,,]. Agric. Rex. 16(2): 105-108.
BARC. 1997. Fertilizer Recommendation Guide. Bangladesh Agricultural
Research Council. Farrngate, l)haka. p. 45.
Harreto. AC..Serpa, J.E.S. (1988). Effects of phosphorus on maize and bean
yields in monoculture and inter-crops. EMBRAPA/Centro Nacional de
Pesquisa de Coco, 49,000 Aracalu, SE. Brazrl.Pcsquisa Agropeeuaria
Brasileira. 23:10,1073-1081; 10 ref.
84
BBS. 1999. Statistical Pocket book of Bangladesh. Stat. Div. Ministry of
Planning. Govt. People's Repub. Bangladesh. I)haka. p 186.
BBS. 1995. Statistical Pocket 1)00k of Bangladesh. Stat. Div.. Ministry of
Planning. Govt. People's Repub. Bangladesh. Dhaka. p. 306.
Black, C. A. (1965). Methods of Soil Analysis. Pan 2, American Soci. Agro. Inc.,
Madison, Wisconsin, U.S.A.
Bouyoucos, (1. J. (1927). The hydrometer as a new method for the mechanical
analysis of soils. Soil Sc!. 23: 343-353,
Bremner, J.M. and Mulvaney. C.S.(1982).Total Nitrogen. In: Methods of Soil Analysis.
Miller. RU. and Xeeny, D.R. Am. Soc. Agron. Inc. Madi. Wis. USA. pp. 595-
622.
Chowdhurv, M.K. and Islam, M.A. (1993). Production and uses of maize (in
Bengali). Pub. by On Faim Res. Div. Bangladesh Agril. Rcs. Inst,
Joydebpur, C,azipur. Pp. 1-189.
On Yan Shan. DongYi Ting, LiHai Feng, Wang Qin (hen (2004), Effect of
elemental sulphur on soluhility of soil heavy metals and their uptake by
maize. L,n'iromncnt InternationaL 30(3): 323-328.
Dehreczeni. K. and Berecz. K. (2000). Effect of nutrient supply and site
characteristics on NPK yield of different maize hybrids. Ac/ct Agnmo,nka
ihingarica. 48(1): 51-63.
Dhakshinamoorthy, M. and Rani Perumal (2001). Direct, residual and cumulative
effects of phosphatie fertilizers on the yield of tinuer millet, maize and
hlackgram grown in a cropping syseni. Ta.mil Nadu Agricultural
Liniversity, Coimbatore 641 003, India. .J. Ecobiof. 13(I): 9-16.
Dhananiava. B.C. and Basavaraj, B. (2002). Effect of siLIphur application on
sulphur fractions in soil as influenced by maize rhizosphcre. I)epartrnent of
Soil Science and Agril. Chernistiy. College of Agriculture, Dharwad - 580
005, India. Kamataka J. Agric.Sci. 2002; 15(I): 148-I50.
Dilip Singh and Singh. S. M. (2000). Response of summer groundnut
(Arachtv /1rJ)ogae(I) and succeeding maize (Zea 'navy) to sulphur and
phosphorus fertilization. Indian Journal of Agricultural Sciences. 70(10):
657-660.
FAO. 1999. Production Yearbook. Food and Agricultural Organization of the
United Nations. Rome. 52:62-71.
Fonseca, A.F., Mclii, AT and Montes. C.R. (2005). Maize growth and changes in
soil fertility after irrigation with treated sewage effluent. H. Soil acidity,
exchangeable cations, and sulfur. boron, and heavy metals availability.
('olnIn,uzications in Soil Science and P/ant Aizalysi.c. 36(13114): 1983-2003.
Gomez, A. K. and Gomez, A. A (1984) Statistical Procedure for Agricultural
Research. Intl. Rice Res. Inst., John Wily and Sons. New York, Chickcstcr,
Brisbanc. Toronto, Singapore. P. 680.
86
Gordon. R., Gonzalez. A.. Franco, J., Gracia, N. Herrera, A. and Raun. W. (1992),
lvaluation of dosage and method of application of sulphur and the residual
effects on maize cultivars in two localities of Azuero, Panama. 14g,vnomk:
Mesoaniencanu. 3' 52-56.
Grant, P. M. and Rowell, A. W. G. 1976. Studies on sulphate fertilizers for
Rhodesian crops. Effect of sulfur in fertilizer components on the yield and
sulfur status of maize. Rhod.J.14gric. Res. 14: 101-109.
1-lammam. G.Y. 1995. Effect of nitrification inhibitor (nitrapyrin) and nitrogen
levels on growth and yield of maize (Zea Inayc L.). Ann. Agril.Sci.
ivfoshiolior. 33(2); 495-506.
Ilussaini. MA.. Ogunleta. V.13., Ramalan, A.A. and Falaki. A.M. (2001), Growth
and development of maize (Zea ways I ..) in response to different levels of
nitrogen, phosphorus and irrigation. (.rop Research Hisar. 22(2): 141-149,
Islam. 1'. M. T. and Kaul. A. K. 1986. Prospect of maize in Bangladesh.
FAO/UNDP Publication, Dhaka.
Jackson, M. L. (1973). Soil Chemical Analysis. Prentice hall Inc.. Engle-wood,
Cliffs, N.Y.
Jena, D., Jena, M.K., Pattanayak, S.K., Sahu, D. and Mitra, G.N. (2004).
Evaluation of compacted phosphate rocks for maize-mustard cropping
sequence in a Typic Haplaquept of North Eastern Ghat zone. .1. Indian
Soc. Soil Sd. 2004 52(t): 80-84.
Jiang Don, Hcngsdijk, H., Dai Ting Bo., Doer, W.. Jing Q and ('ao Wei Xiniz
(2006). Long term effects of manure and inorganic fertilizers on yield and
soil fertility for a winter wheat-maize system in Jianesu, China. 16(1): 25-
32
Jibrin. J.M.. Chude. V.0., Horst. W.J. and Arnapu, IV. (2002). Effect of cover
crops, lime and rock phosphate on maize (Zen 'fl(iys L.) in an acidic soil of
Northern Guinea Savanna of Nigeria National Agricultural Extension and
Research Liaison Services, Ahmadu Bello University. Zaria, Nigeria. .1.
Agric. and Rural Dept. in 'he Iropics and Subtropics. 103(2): 1 69-I 76.
t Kale. K.D,, Patil, A.S. and Pharande. AL. (2005). Response of sunflower to
application of sources of N and P and their residual effect on maize for
fodder in an alfisol. J. Maharas/uraAgric. Univ. 30(2): 220-222.
Kang, B. T. and Osinanie. 0. A. 1976. Sulphur response to maize in Western
Nigeria. .4gron. J. 68: 333-336.
Kaul, A. K. and Rabman. M. M. 1983. Crop diversification for intensive cropping.
Paper presented at First Workshop on National Cropping System Research.
BARI. Joydebpur, Gazipur. 10-13:16 p.
'4Chan, MA.. Abid, M., Ilussain. N. and Masood. M.U. (2005). Effect of
phosphorous levels on growth and yield of maize (Zen ways L.) cultivars
tinder sal inc conditions. Internalional .1. Agric. and B/al. 7(3): 5 I I -514.
Khan. M.J., Khan, M.H., Khattak. R.A. and Jan, M.T. (20(6). Response of maize
to different levels of sulfur. Communications in Soil Science cuid Plant
Analy.cis. 37(1/2): 41-51.
Kruczek. A. (2005). Phosphorus utilization from fertilizer and accumulation of
mineral components in the initial stage of maize development. Pu/is/i .1.
Em'. Slut/icc. 14(4): 467-475.
Kruczek. A. and Szulc. P. (2004). Occurrence of diseases and insects on maize as
influenced by phosphorus fertilization. Progress in P/ant /'roseclion. 44(2):
873 -S76.
Kumar, M. and Singh. M. (2003). Effect of nitrogen and phosphorus levels on
yield and nutrient uptake in maize (Zea wags L.) under rainfed condition of
Nagaland. ('mp Rescaivh flExor. 25(1): 46-49.
Kumaresan, M.. Shanmugasundharani. VS., Govindasamy, Mj3alasubramaniam,
T.N. (2003). Phosphorus balance in maize sunflower cowpea fodder
cropping system. Agrk.Sct Digest. 23(1): 65-66.
Leach, K.A and Flameleers. A. (2001). The effects of a foliar spray containing
phosphorus and zinc on the development, composition and yield of forage
maize. Grass and hragc Science. 56(3): 311-315.
Li Shao ChanQ, Hu Changilao. Gong Jiang and Yang GuanYin (2004). EffectS of
phosphorus suppiy on nitrogen and potassium uptake and distribution in
maize varieties difibring in their phosphorus use efficiency. P/ant Nutrition
and Eerii/izerSciencc 10(3): 237-240.
Ling Fan and Silhcrbush, M. (2002). Response of maize to foliar vs. soil
application of nitrogen phosphorus potassium fertilizers. Israeli. P/ant
Nit/ri/km. 25(11): 2333-2342.
89
Liii Cun 1-Jut, Dong Shu Ting and 1-lu Chang 1-lao (2001). Effects of sulfi.tr nutrient
in high yield summer maize. J. .S'/zandongAgric. Univ. 32(1 ): 11-16.
Liii Cun Hiji. Dong Shu Ting. Hu Chang I-lao (2002). Effects of sulfur fertilizer
application on mineral clement absorption of high yielding slimmer maize.
J. Maize Sd. 10(3): 86.
Lw Mirig Qiang, Yu Zhen Rong and Liu Vim Hui (2005) Modelling the
relationship between summer maize NPK uptake and yield on the basis of
soil fertility indices. Agricultural Sciences in China. 4(10): 774-780
Lopez. P. A., Paz, P.M., Chacon, LA. and Guerrero, J.R. (1991). Response of
maize (Zea ,nac L.) to the biofertilizer PHS compared to other sources of
phosphorus under glasshouse conditions. Ret/sia ('lent/flea-UN/fYi 5: 1,
37-43.
Majumdar, B.. \'cnkatesh, MS., Kumar, K. and Patiram (2002). Effect of
nitrogen, sulphur and pig manure application on yields, nutrient uptake and
quality parameters of maize-mustard crop rotation and msidual nutrient
build tip in an acidic altisol of Meg( ,halaya..J.IIi/I Res. 15(2): 63-70
Manoj Kumar and Singh. M. (2003). Effect of nitrogen and phosphoms levels on
yield and nutrient uptake in maize (Zea ,naic L.) under rainfed condition of
Nagaland. ('mp Research Hisar. 25(l): 46-49.
Martins. AG., Alvarez V.V.H., Novais, R.F.. Galvao, J.C.C. and Silva. A.P.
(2005). Effects of the localization of the phosphate fertilizers on the growth
of maize plants. Ncr/s/a ('crc's. 52(304): 939-953.
90
Mehta. Y.K., Shaktawat M.S. and Sinahi, S.M. (2005). Influence of sulphur,
phosphorus and farmyard manure on yield attributes and yield of maize
(Zea ,navv L.) in southern Rajasthan conditions In(/ian .1. Agmn.5O(3):
203-205.
Niiauheba, G., Merckx. R. and Palm. C.A. (2002). Soil phosphorus dynamics and
maize response to different rates of phosphorus fertilizer applied to an
Aridisol in western Kenya. I1Iani and Soil 243(1): 1-10.
Olsen, S. R., Cole. C. V.. Watanahie, F. S. and Dean. L. A.(l954). Estimation of
available phosphorus in soil by extraction with sodium bicarbonate. U. S
Dept Agr. Cire. p. 939.
Ortas, I.. Kaya. Z. and Cakmak, I. (2001). Influence of arhuscular rnycorrhizae
inoculation on growth of maize and green pepper plants in phosphorus and
zinc deficient soil. Departhient of Soil Science, The University of
Cukurova, Adana, Turkey. Plant nutrition: food security and sustainability
of agro ecosystems through basic and applied research Fourteenth
International Plant Nutrition Colloquium, Flannover, Germany. 632-633.
Page, A. L., Miller, R. H. and Keeney. D. R. (1982). Methods of Soil Analysis,
Part 2 (2 Mn.) Amer. Soc. Agron., Inc.. Madi., USA
Pandey, R.N.. Girish. B.H. and Brajendra (2002). Influence of sulphur application
on dry matter yield and sulphur nutrition of maize (Zea inays L.) in major
soil orders in India. Annals ofAgrknliuml Research. 23(2): 263-270.
91
Paid. U i.. Patel, U.N., Goyal, S.N. and Patel, B.Ci (2000). Effect of phosphorus
on the growth and yield of hybrid maize (7cc: ways L.). Gu/arat 4gric.
Unit'. Res.j. 26(1): 59-60
Patel, J R., Thaker, K R., Sadhu, AC.. Patel. P.C. and Parmar. H.P. (1997). Effect
of seedrates and nitrogen and phosphorus levels on forage maize (Zea maps
L.) varieties. (in/am! Agric. Liner. Res..J 23(1): 1-8.
Patel, [(P.. Ramani V.P. and Patel, K.C. (2002). Evaluation of sulphur response in
groundnut wheat and maize gram cropping systcms in soils of middle
Ciujarat and Saumshtra Region. Feniliscrz%farkcyingNeuc 33(4): 7-17,
Pierre, R., Robbles. A.. ('elado, R., Raun, W.R. and Bareto, Hi. (1990) Maize
yield response to sulphur and phosphorus applied tinder different tillage
systems in the 1)onionican Republic. Sulphur in Agriculture. 14. 16-19.
Piper, C. B. (1942). Soil and Plant Analysis Adellide Univ. Press. Australia.
j' Prado. R.M.. Fernaridcs, FM. and Roque. C.G. (2001). Response of maize
cultivation to application methods and doses of phosphorus. in maintenance
fertilizing. Revisit: Jirasilcira tie (Tie,zcia do Solo. 25(l): 83-90.
Purushotham, S., Siddaraju. R. and Clopinathan. N. (2002). Response of fodder
maize to ditlérent levels of N. P. K. and sulphur under irrigation during late
rabi. Current Research University of Agricultural Sciences Ilangalore.
31(5/6) 87-88.
92
Ram irez, R. (1980). Nutrition of corn (Zec, mats L.) in Venezuela. IV. Standard
and adequate values of nitrogen, phosphorus, potassium, calcium and
magnesium for the interpretation of foliar analysis on corn leaves.
4gro,nnnia-i'ropica/. 30: 1-6, 125-133
Ramtrcz, R.. Montilla. M. and Zamora, J (1999). Maize response to amrnonilLm
thiosulfate application to a sodic soil. Imerciencia. 24(2): 124-126.
Raun. W.R. and Barreto, Hi. (1991). Maize yield response as affected by
phosphorus, sulphur and nitrogen as banded applications on a volcanic ash
derived tropical soil Coinniunicatiom in Soil Xci. and P/wzi Analv.cis. 22
(15-16): 1651-1676
Reichbuch L. ( 1987). Effect of long term fertilizer applications with nitrogen and
phosphorus on the chemical processes in the soil and the implications on
yields of potatoes-wheat-sugarbeet and maize. Aim/c/c Inslituin/ni c/c
Cercetaripentru ('erect/c siP/ante Telinice, Pnnclu/ea. 54: 255-273.
Sachdev M.S. and Deb D.L. (1990) Nitrogen and sulphur uptake and efficiency in
the mustard-moong-maize cropping system. l4rti/iser Neis's. 35: 7. 49-55
Sankarun, K.. Savithri, P., PoonQothai, S. and Sakthikumaran, S. (2002). Direct
and residual effect of sulphur application on maize-greengram cropping
system. Perti/iserMarkeung Nets's. 33(7): 1-8
Sankhyan N.K., Rharat 13. and Sharma. PlC. (2001). Effect of phosphorus. mulch
and farmyard manure on soil moisture and productivity of maize in mid
hills of Ilimachal Pradesh. 1?esearc/, on ('raps. 2(2): 116-119.
93
Selassie, VU., Suwanarit. A.. Suwannarat. C. and Sarohol, F. (2003). Equations
for estimating phosphorus fertilizer requirements from soil analysis for
maize (Zen maps L.) grown on Al i'isols of Northwestern Ethiopia. Kascisari
I. Natural Sd. 37(3): 284-295.
Setia. R.K.. Sharma, K.N. (2005). Effect of long term differential lertilizer
application on depth distribution of forms of sulfur and their relationship
with sulfur nutrition of wheat under maize wheat sequence..!. hid/an Soil
Sc,. 53(I): 91-96
Shanna. JP. and Sharma, U.C. (1991) Effect of nitrogen and phosphorus on the
yield and severity of turcicum blight of maize in Nagaland. Indian
Pltojxulzologv. 44(3): 383-385.
Shamia, R.P., Singh E and Gupta T.C. (2002) Residual effect of weed
management and phosphorus on succeeding fodder maize : a study on N
and P concentration and their uptake Annals ofAgri. Rio. l?esearc/i. 7 I,
13-16.
Shiluli. MC., Macharia. C.N, and Kamau, NW (2003). Economic analysis of
maize yield response to nitrogen and phosphorus in the sub-humid zones of
western Kenya. African ('rap SciL 11(3): 181-187.
Simonete, MA.. Kiehi, iDe. C., Andrade. C.A. and l'eixeira. C.F.A. (2003).
Effect of sewage sludge in a Ultisol and on growth and nutrition of maize.
Fesquisa Agmpecuaria lirasik'ira. 38(1 0): I I 87-I I 95
Sinth, C., Sharma. A.K. and John. B.N. (2002). Host genotype determines the
impact of soil phosphorus on arbusculan mycorrhizal symbiosis in maize
(Zea 'nayc L.). Synthiosis-I?e/ioi'oi. 33(2): I 45-164.
94
Singh. I). and Chhibba. I.M. (1991). Evaluation of some sources of sulphur using
maize and wheat as test crops. I. indian Soc....oil Set 39(3): 514-516
Singh, D. and Singh. S.M. (2000). Response of summer groundnut (Arac/zis
/:ypogaea) and succeeding maize (Zea maps) to sulphur and phosphorus
fertilization. imliam: .1. '1 gric. Sc!. 70(10): 657-660.
Sit, RB.. Sakal. R. and Kumar, S. (1995). Effect of sulphur and phosphorus
nutrition of winter maize in calcareous soil. .J Inc/icin Soc. S'oi/ Sc!. 43 (3
41 3-4 18.
Stanchev, A., Tzolova, V.. Dirnitrova, F. and Peneva, N. (2001). Effect of
phosphorus and zinc fertilization on the removal of biogenic elements of
maize hybrids, grown on calcareous chemozem. I. Removal oiphosphorus.
"I grokhimh'a Ekologiva. 36(4/6) 201 -204.
Tagwira, F. (1995). Growth, yield, phosphorus and zinc uptake by maize as
affected by lime and phosphate applieationsZi,nbahwe J. .4gri. Res. 33(1):
69-82.
Talukder, M.K.H. and Islam, M.S. (1982). Yield responses of maize to different
rates of phosphorus and sulphur during the K/zarf season of Bangladesh.
Bangladesh .1. 4 grit Res. 7 (2): I 08-113.
Thakur, C. 1980. Scientific crop production. Vol. 1, Food crops. Metopolitan
Book Co. New Delhi. pp. 145-185.
95
Thind, S.S.. Chibba. F.M. and Sidhu, A.S. (2003). Evaluation of different soil test
methods to predict phosphorus availability to winter maize in alluvial soils.
Annals Agric. Rex. 24(3): 474-477.
Wang Rong Ping, Wang Yan. Huang Jian Guo (2004). Effects of low phosphorus
stress on yield contributing characters of different maize genotypes. J.
Southwest Agric. (Ink. 26(6): 715-71 7&722.
Yadav, V.8., Souza, Ti. (1992). Direct and residual effects of ammoniurn ortho-
and polyphosphates with zinc and iron for a maize-blackgrani sequence in a
Vertisol. I. Rex. IlirsoAgric. Un/i'. 4: 1,5-10.
Zhang Li Mci, He Li Yuan, Li Jian Sheng, Xu Shang Zhong (2005). Phosphorus
nutrient characteristics of different maize (Zea /navx L) inbreeds for
tolerance to low-P stress. Agricultural Sciences in China. 4(4): 281-287.
96
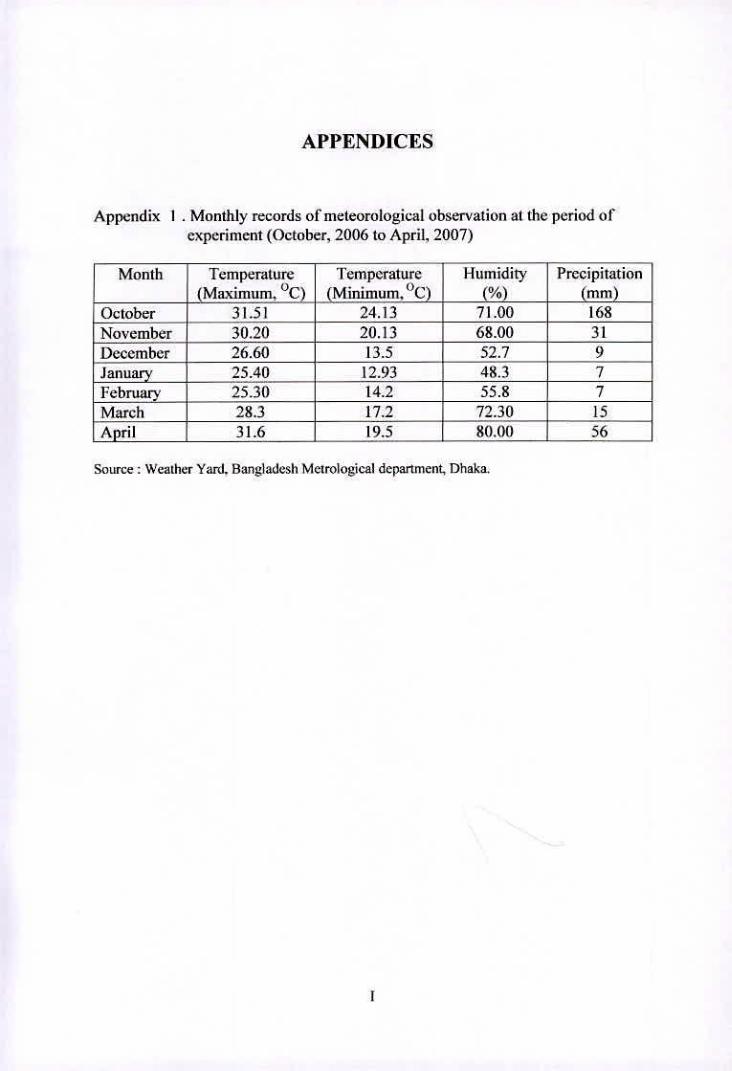
APPENDICES
Appendix I . Monthly records of meteorological observation at the period of experiment (October, 2006 to April. 2007)
Month Temperature (Maximum. °C)
Temperature - (Minimum. °C)
Humidity (%)
Precipitation (mm)
October 31.51 24.13 71.00 168 November - 30.20 20.13 68.00 31 December 26.60 13.5 52.7 9 January 25.40 12.93 48.3 7 February 25.30 14.2 55.8 7 March 28.3 17.2 72.30 15 April 31.6 19.5 L 80.00 56
Source: Weather Yank Hangladesh Meirological department, Dhaka.
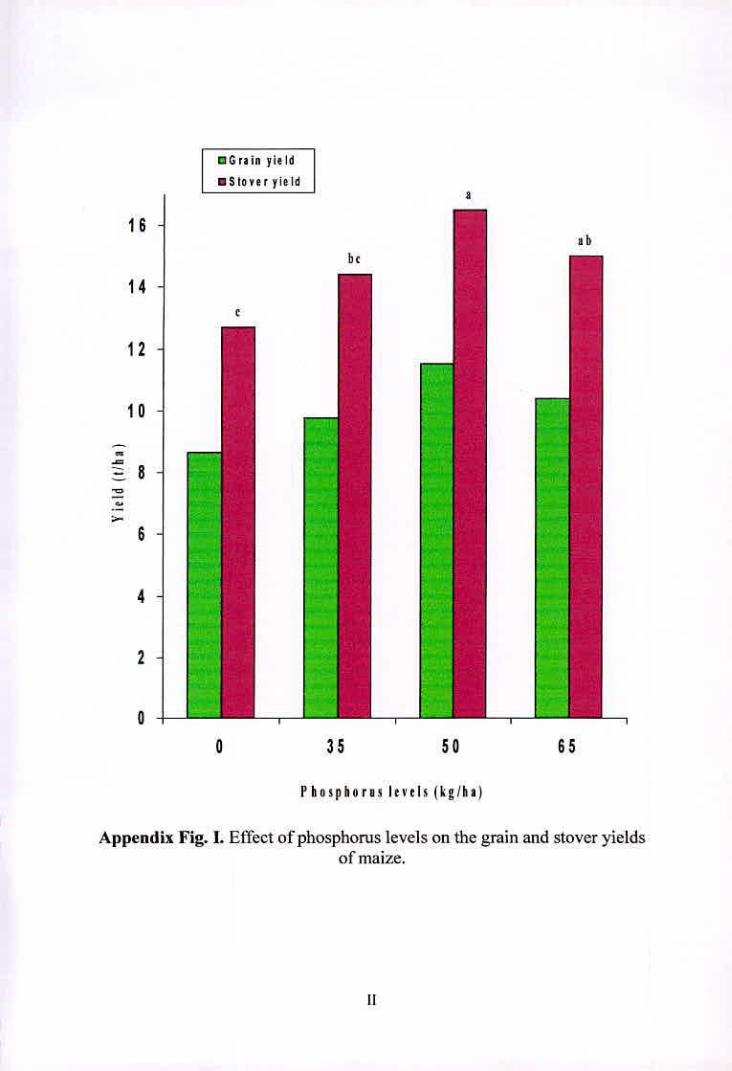
16
14
12
10
4
OGrain yield
USlover yield
0 35 50 65
Pho sp horns levels (kg/h )
Appendix Fig. 1. Effect of phosphorus levels on the grain and stover yields of maize.
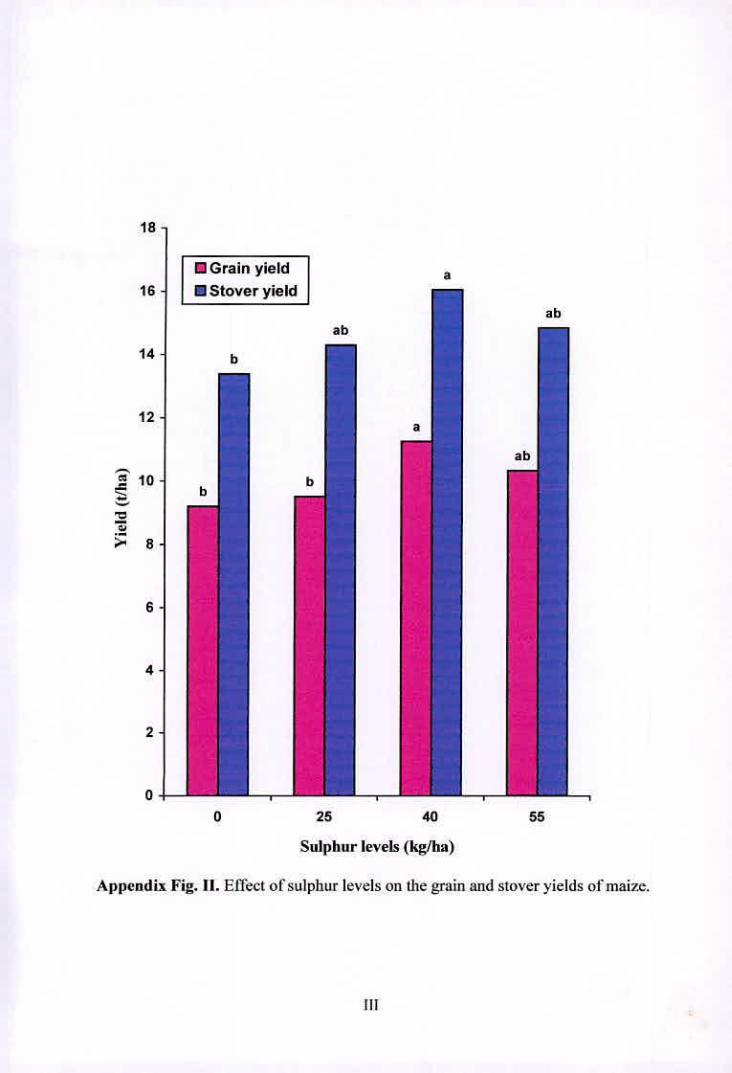
18
16
14
12
410
0 25 40 55
Sulphur levels (kg/ba)
Appendix Fig. If. Effect of sulphur levels on the grain and stover yields of maize.
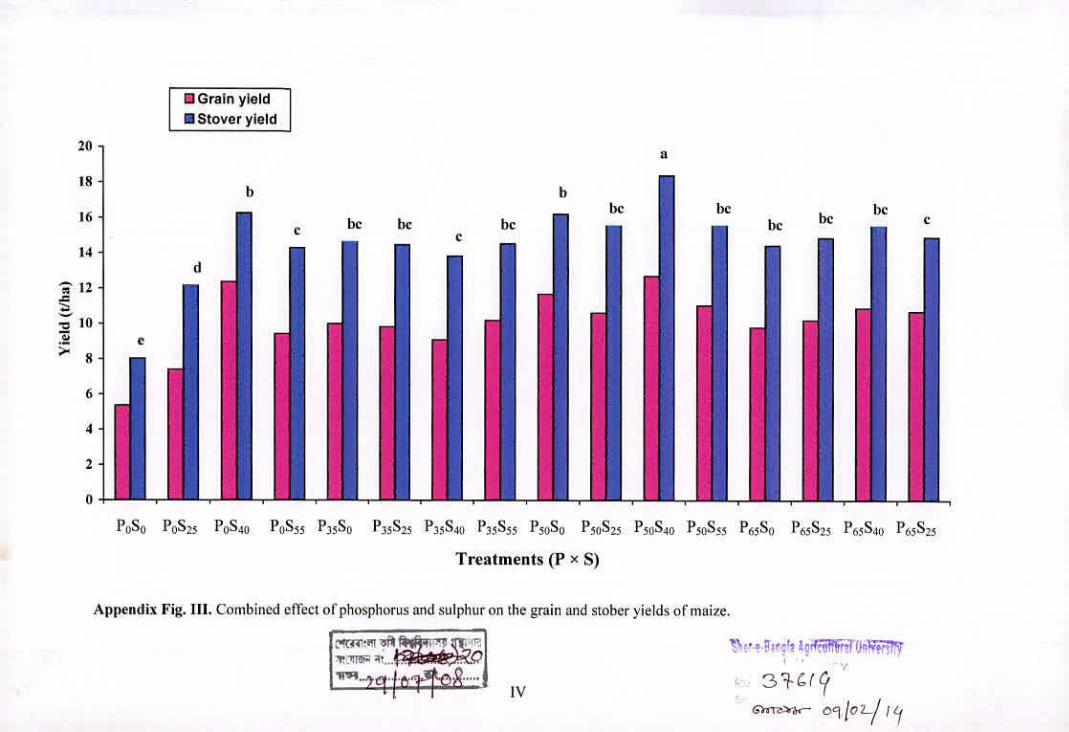
20
18
16
14
6
4
2
0
0 Grain yield
Stover yield
P0S0 P0S2 P0S40 P0S55 P35% P35S2c P35S4 P35S5 PS0 P50S25 P59S40 P50S55 P6580 P65S2 P(,jS40 P65S15
Treatments (P x S)
Appendix Fig. lii. Combined eflèct of phosphorus and sulphur on the grain and stober yields of maize.
It'
a . 71F
IV
Cwraec— 09/0 L/