resource-based product and process innovation model - mdpi
TRANSCRIPT
sustainability
Article
Resource-Based Product and Process InnovationModel: Theory Development andEmpirical Validation
Young Sik Cho 1,* and Kevin Linderman 2
1 College of Business, Jackson State University, Jackson, MS 39217, USA2 Carlson School of Management, University of Minnesota, Minneapolis, MN 55455, USA; [email protected]* Correspondence: [email protected]
Received: 20 December 2019; Accepted: 21 January 2020; Published: 26 January 2020�����������������
Abstract: Using a resource-based approach to innovation, this study proposes an alternativeinnovation model to the existing market-based Product Life Cycle (PLC) model. In particular, thisstudy explores how the attributes of corporate strategic resources affect product and process innovationpatterns. This study covers the development of new theory, as well as the empirical validation of theinnovation model proposed in this study. Based on survey data from 257 chief operations officers inthe United States, the ‘resource-based innovation model’ was tested and validated through variousanalytical methods, such as clustering, discriminant, and structural equation modeling analysis.The main findings are that (1) companies relying on both knowledge-based resources (KBR) andproperty-based resources (PBR) tend to focus on product and process innovation at the same time,(2) companies relying heavily on KBR tend to centralize their efforts for process innovation ratherthan product innovation, (3) companies with low reliance on KBR and PBR tend to minimize R&Defforts in product and process innovation, and (4) in a dynamic market condition, process innovationsserves as order winners, while product innovations serves as order winners in a stable market. Thisresearch contributes to the operational management literature by proposing a new resource-basedinnovation algorithm that helps to understand innovation phenomena that are difficult to explainthrough the lens of the PLC-based innovation paradigm.
Keywords: product innovation; process innovation; property-based resource; knowledge-basedresource; resource-based view; market dynamism; sustainable competitive advantage; cluster analysis;discriminant analysis; structural equation modeling
1. Introduction
Innovation is generally perceived as a significant driving force in corporate success, but innovationis also often recognized as a critical cause of risk, social and environmental turmoil, the so-called ‘doubleedges of innovation’ [1–3]. The literature has shown that decision-making on innovation activities canhave a significant impact on the creation or destruction of an organization’s competitive advantage [4,5].Since Utterback and Abernathy [6] introduced a product life cycle (PLC) model for innovation, thePLC model has become the dominant basis for how product and process innovation patterns evolveover the life of the product. This model supports the ‘product–process innovation’ flow, where thecompany’s process innovation follows the product innovation according to the product life cycle. Later,Barras [7] proposed a ‘reverse product life cycle’ model to illustrate the ‘process–product innovation’flow that is often seen in the service industry. As such, these two model frames provide complementaryinsights into the enterprise’s decision-making processes for product and process innovation. However,neither the models of Utterback and Abernathy [6] nor of Barras [7] fully explain the existence of
Sustainability 2020, 12, 913; doi:10.3390/su12030913 www.mdpi.com/journal/sustainability
Sustainability 2020, 12, 913 2 of 23
an organization that pursues product innovation and process innovation simultaneously, such assemiconductor and biotechnology companies. In addition, the two models cannot fully justify theexistence of an organization that essentially focuses on only one type of innovation—either processinnovation or product innovation. The limitations of existing PLC-based models can be attributedto the theoretical background that the models depend on. The PLC-based models emphasized a‘market-based’ perspective in which organizations are considered to be systems that continuouslyadapt to changing business environments for survival [8–12]. Regarding this market-based perspective,Hayes et al. [13] (p. 52) asserted that “a strategy based solely on such static concepts as fit, trade-offs,and focus seemed lacking in an important respect: a more dynamic framework was needed for therapidly changing global competition.” In a similar vein, Gagnon [14] has also argued that the paradigmshift has begun, with evidence that high performance is largely explained by the strength of corporateresources rather than market position. Further, many previous studies have shown that the disciplineof competitive advantage has been transferring from a ‘market-based’ perspective to a ‘resource-based’perspective [14–16]. Despite the paradigm shift in competitive advantage, research on the impact ofcorporate strategic resources on a company’s innovation decisions is very limited, and there has beenno empirical study to investigate the relationship between strategic resource attributes and innovationpatterns. This gap in the literature has led to a key research question of this study, and more detailsabout the research gap are discussed in the next section. In short, the main purpose of this study is toexplore how the attributes of a company’s strategic resources affect product and process innovation patterns,from a ‘resource-based’ perspective.
To investigate this research question, the remainder of this study includes the followingorganizations. This study begins with a brief overview of the existing PLC-based innovation modelsand their limitations. The discussion then leads to the theoretical underpinnings and hypotheses aboutthe role of corporate strategic resources in innovation strategy decisions. In particular, we propose a‘resources-based innovation model’ that can explain the phenomenon of innovation that is difficultto explain through the lens of the existing PLC-based innovation model. The following sectiondiscusses our methodology that describes our measures, sample data, and survey procedure. Next,various validation tests were conducted for the measurements and data used in this study, includingconfirmative factor analysis, non-response bias test, and common method variance assessment. Then,based on survey data from 257 chief operations officers in the United States, the ‘resource-basedinnovation model’ proposed in this study was tested through cluster analysis and the results wereverified through discriminant analysis. In addition, some of the issues raised in this study were testedthrough structural equation modeling analyses. Finally, we conclude by discussing some theoreticaland managerial implications, the limitations of the study, and suggestions for future research.
This study covers not only the development of new theory, but also the empirical validationof the model proposed in this study. The study contributes to operation management literature bysuggesting a new resource-based innovation model that helps explain innovation phenomena that aredifficult to understand through the PLC-based innovation paradigm. In other words, by integratingthe literature on product and process innovation with a resource-based view, the study provides anew paradigm for understanding the mechanisms by which corporate strategic resources influenceinnovation strategy decisions.
2. Theory and Hypotheses Development
2.1. What Is Innovation
Gopalakrishnan and Damanpour [17] argued that innovation cannot be described as a unifieddefinition but can only be defined in the context of a particular field. For example, on the economicside, innovation can be described as a factor that significantly improves productivity at the industrylevel; on the other hand, in the context of technology, innovation is seen as “a continuous processduring which the innovation changes form as it is used and assimilated” [17] (p. 20). In terms of

Sustainability 2020, 12, 913 3 of 23
management, innovation can be defined as “the generation, evaluation, and implementation of newideas to meet organizational objectives” [18] (p. 6). In the context of manufacturing, innovation canbe depicted as “the application of new or different approaches or methods or technologies resultingin improved quality or reduced cost relative to competition” [18] (p. 6). Further, innovation can betaxonomically categorized into the following three sets of types: administrative vs. technical, radical vs.incremental, and product vs. process [17,19,20]. However, the main purpose of this study is to proposean alternative innovation algorithm that can account for innovation phenomena that are difficult tounderstand (especially with respect to the idiosyncratic patterns of product and process innovation)through the lens of PLC-based innovation models. Therefore, to clarify the boundaries of the research,this study focuses taxonomically on product versus process innovation in the context of operationsmanagement. Product innovation is illustrated as (i) a change made to the existing product or servicefor the benefit of customers [17,21,22] and (ii) a creation of entirely new product or service [23–25].On the other hand, process innovation refers to a change in the method and knowledge that transforminputs into outputs [6,17,22,26]. In other words, product innovation is considered improvement andcreation at the end of the product or service offering [21,25,27], while process innovation is considereda change in the way a firm produces a product or service [19,28–30].
2.2. PLC-Based Innovation Models
Abernathy and Utterback [6,31] introduced the product lifecycle innovation model to show howinnovation strategies change over the product life cycle (PLC) phases. In the early stage of PLC,the ‘fluid phase,’ corporate R&D activities are mainly focused on product innovation [32]. As a result,the rate of product innovation is much higher than the rate of process innovation. However, once thedominant design of a product appears in the industry, the main competition tends to move towardsreducing general design costs, and product improvements are gradual [13,33]. As a result, in the secondphase, the ‘transitional phase,’ companies begin to invest more R&D budgets in process innovation(e.g., ERP, Six Sigma, JIT system, and Lean production) and the level of process innovation exceeds thelevel of product innovation. In the final phase, the ‘specific phase,’ companies rarely perform R&Don both product and process innovation. Accordingly, both types of innovation activities shrink andeventually converge to a more balanced level [31,34]. That is, the PLC innovation model assumesthat the strategy of innovation moves from product innovation to process innovation according to thestages of PLC [6,31].
However, since the PLC model was initially developed to explain the patterns of innovationoccurring in the manufacturing industry, the PLC model has inherent limitations in explaining theinnovation patterns of the service industry. For this reason, Barras [7,35] proposed a ‘reverse PLCinnovation’ model to illustrate the innovation patterns that occur in the service industry, whichgenerally adopt new technologies developed in the manufacturing industry. Here, in the early stage ofreverse PLC, the company’s innovation efforts begin with incremental process innovations to improvethe efficiency of existing service delivery [7]. In the next phase, the company’s innovation activitiesfocus on more radical process innovations to not only improve service quality but to also maximizeservice efficiency [7,34]. In the final stages, radical product innovation is dominant in creating a newtype of service [7,35]. In brief, the reverse PLC model argues that major innovation activities in theservice industry can be transformed from process innovation to product innovation, depending on thePLC stages.
2.3. Limitations of PLC-based Innovation Models
PLC-based models provide excellent logic that can be applied to describe innovation patternsin various industries. Furthermore, the PLC model and reverse PLC model complemented theshortcomings of each model. Nonetheless, there are still some innovations patterns that cannot befully explained by the logic of these PLC-based innovation models. According to the PLC-basedmodel, corporate innovation patterns must show the ‘product–process’ or ‘process–product’ flow
Sustainability 2020, 12, 913 4 of 23
to survive in the industry they are competing with. However, as a matter of fact, companies donot always follow one of them. For instance, companies in sectors such as pharmaceuticals andsemiconductors continue to pursue product and process innovation at the same time, regardless ofthe PLC stage. Moreover, shipping delivery service companies such as FedEx and UPS mostly spendmore R&D expenditure on process innovation than product innovation, regardless of the phase ofthe PLC. This limitation of the PLC-based model is mainly due to the theoretical view that the PLCmodels rely on. Namely, the PLC-based models stand on a market-based competition view (MBV),where the company’s strategy follows the guidelines set by market functions [14,36]. From an MBVperspective, an enterprise’s operating system is considered a fully tunable system that adheres tothe rules defined by the market [14]. In particular, the PLC-based models are based broadly on theconcept of ‘contingency theory’ [8,10], which emphasizes the strategic fit between organizationalstructure and environmental contingencies [37,38]. However, Hayes and Wheelwright [39] argue thatvarious unexpected factors, such as economic swing, government regulation, and learning curve, oftenchange the firm’s position on product–process matrices [40]. In addition, supporters of MBV suggestthat strategic choices should be made in the event of a conflict of competition in accordance withthe ‘trade-off’ principle [37,41]. However, some companies have challenged the ‘trade-off’ conceptbecause they operate with higher quality, lower cost, and faster delivery than competitors [40]. In fact,“Japanese factories appeared to surpass their American counterparts on several competitive dimensionssuch as lower cost, higher quality, greater flexibility, and faster product introductions-all at the sametime” [13] (p. 50). Besides, traditional PLC models are motivated to innovate processes only at anintermediate stage of product life because the core purpose of process innovation is simply cost savingsof the product [13]. Strictly speaking, the PLC model regards process innovation simply as an auxiliarymeans of improving the product’s cost leadership in the marketplace. However, Hayes et al. [13]argued that new products could not be commercialized without significant advancements in processtechnology in biotechnology, semiconductors, advanced materials, medical, and many other servicesindustries. In summary, MBV may not be the single framework that describes all sorts of product orprocess innovation patterns. A more dynamic theoretical framework is needed to explain and fill thelimitations of MBV-based models.
2.4. Resource-Based Perspective for Alternative Innovation Paradigm
While the contingency theory assumes that most resources within a particular industry arehomogeneous because they are highly mobile, the resource-based view (RBV) starts with two alternativeassumptions: ‘resource heterogeneity’ and ‘resource mobility’ [42,43]. RBV claims that organizationscan manage multiple resource bundles and that resource bundles are not easy to move across enterprises,increasing the heterogeneity of enterprise resources [15]. Based on these two alternative assumptions,the RBV suggests that a company is consistently superior to other companies if the resource hasthe following four attributes: valuable, rare, imperfectly imitable, and non-substitutable [42,44–47].In short, the RBV ascertains that the potential to create a competitive advantage is related to thestrength of the corporate resources, but MBV assumes that the competitive advantage of the firm isachieved by the strength of the firm’s market position [14,15,43,48]. Hence, proponents of the RBVassert that the paradigm is moving from the power of a firm’s market position to the power of a firm’sstrategic resource [13,14,42,49,50]. Table 1 summarizes the differences between MBV and RBV; thesecomparisons reflect relative differences rather than the absolute nature of each view.
Table 1. Comparison of market-based and resource-based perspectives.
Market-Based View Resource-Based View Supporting Literature
Assumption on resources Mobility and homogeneity Immobility and heterogeneity [15,42]
Strategic approach Fit to market rules Change market rules [10,13,14,36,41]
Source of competitive advantage The power of a firm’s market position The power of a firm’s strategic resource [14,15,37,43,49]
Operating focus Superior performance Sustainability [51–53]
Sustainability 2020, 12, 913 5 of 23
2.5. Resource-based Innovation Model
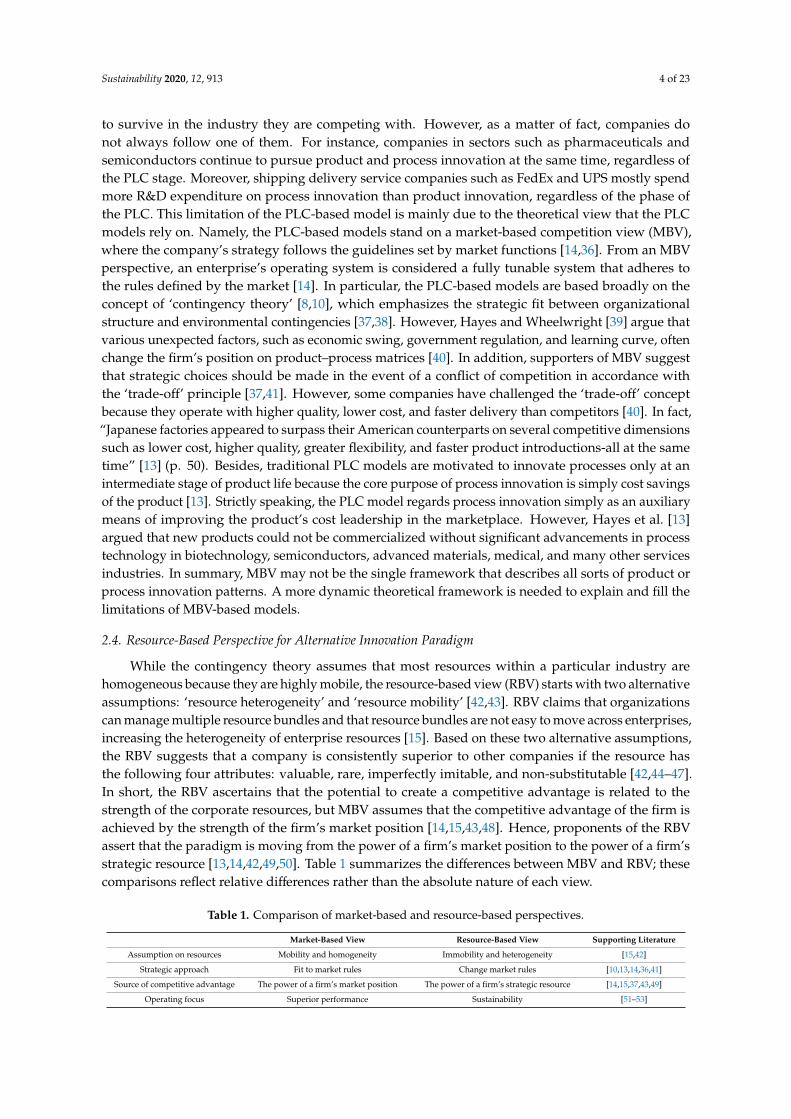
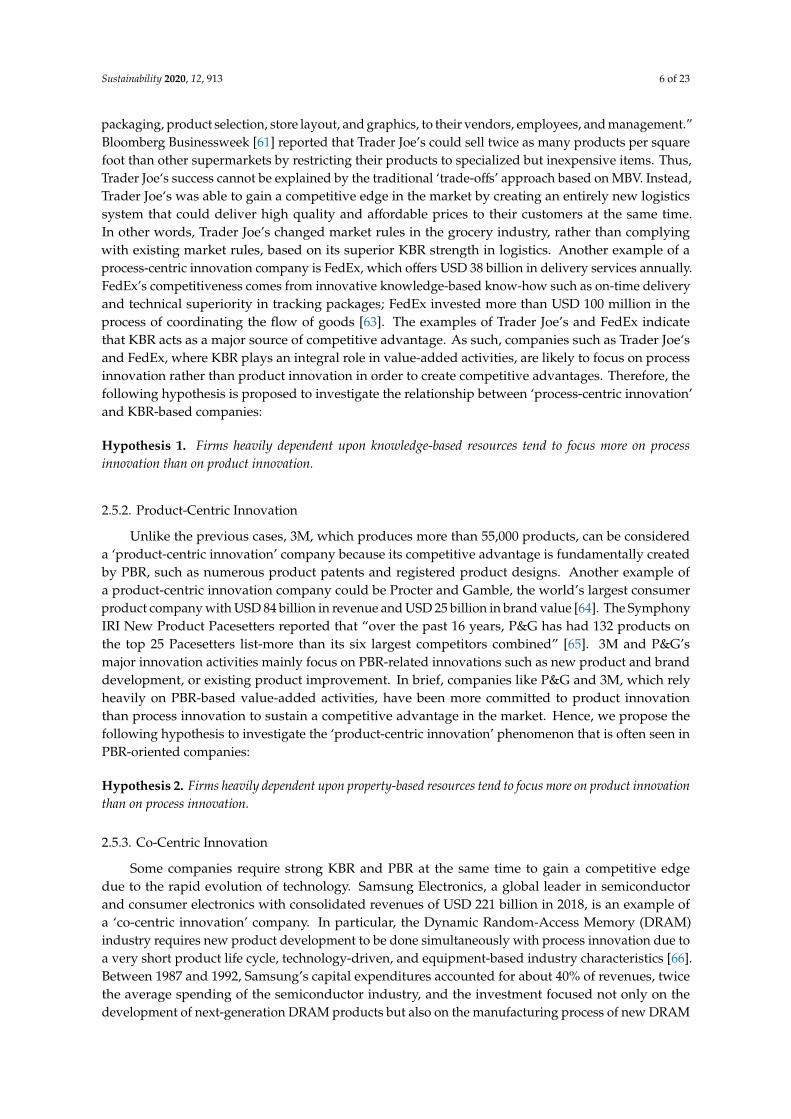
Taxonomically, a company’s resources can be defined as a set of different types. For example,Grant [54] suggested that resources could be classified into two categories: tangible resources andintangible resources. Das and Teng [55] argued that corporate resources could be classified intofour types, such as technological, physical, managerial, and financial resources. Barney [42] (p. 100)described corporate resources as “all assets, capabilities, organizational processes, firm attributes,information, knowledge, etc. controlled by a firm that enable the firm to conceive and implementstrategies that improve its efficiency and effectiveness.” In terms of resource theory, corporate resourcesinclude technology [49], leadership [56], organizational culture [57], innovation climate [58], productand service reputation [58], organizational structure [46], and workforce [45]. Based on the idea ofbarriers to imitability in the context of RBV, Miller and Shamsie [59] classified corporate resourcesinto two groups: ‘knowledge-based’ resources and ‘property-based’ resources. According to theirclassification, property-based resources (PBR) are defined as some resources that can be protected byproperty rights such as patents, ownership, contracts, copyrights, trademarks and registered designs,while knowledge-based resources (KBR) are described as other resources that can be protected byknowledge barriers such as the company’s expertise, know-how, managerial system and processesthat competitors cannot easily identify or imitate [59,60]. In other words, PBR is difficult to imitateby market competitors due to the granting of exclusive property rights; on the other hand, KBRcannot easily be imitated by competitors because of its ambiguous nature [60]. In short, KBR and PBRare resource types conceptualized based on RBV. Thus, this study adopts the resource typology ofMiller and Shamsie [59] to develop a new theoretical framework of innovative patterns based on RBV.Figure 1 presents our research model called the ‘resource-based innovation matrix’ developed with theassumption that the pattern for product and process innovation can vary depending on the nature ofthe enterprise’s strategic resources. A detailed discussion of each innovation pattern in this innovationmatrix is provided below, along with real industry examples:
Sustainability 2020, 12, 913 5 of 23
Taxonomically, a company’s resources can be defined as a set of different types. For example, Grant [54] suggested that resources could be classified into two categories: tangible resources and intangible resources. Das and Teng [55] argued that corporate resources could be classified into four types, such as technological, physical, managerial, and financial resources. Barney [42] (p. 100) described corporate resources as “all assets, capabilities, organizational processes, firm attributes, information, knowledge, etc. controlled by a firm that enable the firm to conceive and implement strategies that improve its efficiency and effectiveness.” In terms of resource theory, corporate resources include technology [49], leadership [56], organizational culture [57], innovation climate [58], product and service reputation [58], organizational structure [46], and workforce [45]. Based on the idea of barriers to imitability in the context of RBV, Miller and Shamsie [59] classified corporate resources into two groups: ‘knowledge-based’ resources and ‘property-based’ resources. According to their classification, property-based resources (PBR) are defined as some resources that can be protected by property rights such as patents, ownership, contracts, copyrights, trademarks and registered designs, while knowledge-based resources (KBR) are described as other resources that can be protected by knowledge barriers such as the company’s expertise, know-how, managerial system and processes that competitors cannot easily identify or imitate [59,60]. In other words, PBR is difficult to imitate by market competitors due to the granting of exclusive property rights; on the other hand, KBR cannot easily be imitated by competitors because of its ambiguous nature [60]. In short, KBR and PBR are resource types conceptualized based on RBV. Thus, this study adopts the resource typology of Miller and Shamsie [59] to develop a new theoretical framework of innovative patterns based on RBV. Figure 1 presents our research model called the ‘resource-based innovation matrix’ developed with the assumption that the pattern for product and process innovation can vary depending on the nature of the enterprise’s strategic resources. A detailed discussion of each innovation pattern in this innovation matrix is provided below, along with real industry examples:
Figure 1. Resource-based product and process innovation model.
2.5.1. Process-Centric Innovation.
Trader Joe’s, operating more than 500 grocery stores in the U.S. as of 2019, is an example of a ‘process-centric innovation’ company because their competitiveness is derived primarily from their superior tacit know-how and innovative supply chain systems related to gourmet and organic foods. Trader Joe‘s founder, Coulombe, said in an interview with Business Week, “we adopted a policy of not carrying anything we could not be outstanding in, in terms of price … we had to create a whole new chain of logistics” [61]. In an article on why Trader Joe’s stands out from all the rest in the grocery business, Llopis [62] noted that “their (Trader Joe’s) non-conventional culturally-tailored approach and attitude is one that is deeply embedded in the roots of their business model: from their packaging, product selection, store layout, and graphics, to their vendors, employees, and management.” Bloomberg Businessweek [61] reported that Trader Joe’s could sell twice as many products per square foot than other supermarkets by restricting their products to specialized but inexpensive items. Thus,
Figure 1. Resource-based product and process innovation model.
2.5.1. Process-Centric Innovation
Trader Joe’s, operating more than 500 grocery stores in the U.S. as of 2019, is an example of a‘process-centric innovation’ company because their competitiveness is derived primarily from theirsuperior tacit know-how and innovative supply chain systems related to gourmet and organic foods.Trader Joe‘s founder, Coulombe, said in an interview with Business Week, “we adopted a policyof not carrying anything we could not be outstanding in, in terms of price . . . we had to create awhole new chain of logistics” [61]. In an article on why Trader Joe’s stands out from all the rest inthe grocery business, Llopis [62] noted that “their (Trader Joe’s) non-conventional culturally-tailoredapproach and attitude is one that is deeply embedded in the roots of their business model: from their
Sustainability 2020, 12, 913 6 of 23
packaging, product selection, store layout, and graphics, to their vendors, employees, and management.”Bloomberg Businessweek [61] reported that Trader Joe’s could sell twice as many products per squarefoot than other supermarkets by restricting their products to specialized but inexpensive items. Thus,Trader Joe‘s success cannot be explained by the traditional ‘trade-offs’ approach based on MBV. Instead,Trader Joe‘s was able to gain a competitive edge in the market by creating an entirely new logisticssystem that could deliver high quality and affordable prices to their customers at the same time.In other words, Trader Joe’s changed market rules in the grocery industry, rather than complyingwith existing market rules, based on its superior KBR strength in logistics. Another example of aprocess-centric innovation company is FedEx, which offers USD 38 billion in delivery services annually.FedEx’s competitiveness comes from innovative knowledge-based know-how such as on-time deliveryand technical superiority in tracking packages; FedEx invested more than USD 100 million in theprocess of coordinating the flow of goods [63]. The examples of Trader Joe’s and FedEx indicatethat KBR acts as a major source of competitive advantage. As such, companies such as Trader Joe‘sand FedEx, where KBR plays an integral role in value-added activities, are likely to focus on processinnovation rather than product innovation in order to create competitive advantages. Therefore, thefollowing hypothesis is proposed to investigate the relationship between ‘process-centric innovation’and KBR-based companies:
Hypothesis 1. Firms heavily dependent upon knowledge-based resources tend to focus more on processinnovation than on product innovation.
2.5.2. Product-Centric Innovation
Unlike the previous cases, 3M, which produces more than 55,000 products, can be considereda ‘product-centric innovation’ company because its competitive advantage is fundamentally createdby PBR, such as numerous product patents and registered product designs. Another example ofa product-centric innovation company could be Procter and Gamble, the world’s largest consumerproduct company with USD 84 billion in revenue and USD 25 billion in brand value [64]. The SymphonyIRI New Product Pacesetters reported that “over the past 16 years, P&G has had 132 products onthe top 25 Pacesetters list-more than its six largest competitors combined” [65]. 3M and P&G’smajor innovation activities mainly focus on PBR-related innovations such as new product and branddevelopment, or existing product improvement. In brief, companies like P&G and 3M, which relyheavily on PBR-based value-added activities, have been more committed to product innovationthan process innovation to sustain a competitive advantage in the market. Hence, we propose thefollowing hypothesis to investigate the ‘product-centric innovation’ phenomenon that is often seen inPBR-oriented companies:
Hypothesis 2. Firms heavily dependent upon property-based resources tend to focus more on product innovationthan on process innovation.
2.5.3. Co-Centric Innovation
Some companies require strong KBR and PBR at the same time to gain a competitive edgedue to the rapid evolution of technology. Samsung Electronics, a global leader in semiconductorand consumer electronics with consolidated revenues of USD 221 billion in 2018, is an example ofa ‘co-centric innovation’ company. In particular, the Dynamic Random-Access Memory (DRAM)industry requires new product development to be done simultaneously with process innovation due toa very short product life cycle, technology-driven, and equipment-based industry characteristics [66].Between 1987 and 1992, Samsung’s capital expenditures accounted for about 40% of revenues, twicethe average spending of the semiconductor industry, and the investment focused not only on thedevelopment of next-generation DRAM products but also on the manufacturing process of new DRAM

Sustainability 2020, 12, 913 7 of 23
products [66]. In addition, Samsung has been able to shorten development lead times through itsspecialized ‘concurrent engineering’ process know-how, which is an alternative to the traditionalsequential development approach, where multiple development phases overlap [67]. Due to thesesimultaneous product and process innovations, Samsung’s DRAM became a leading company in 1992and has accounted for more than 40% of the global market share since 2012. Other industry examplesof ‘co-centered innovation’ are biotechnology enterprises such as Vertex Pharmaceuticals and GileadSciences, because new products cannot be commercialized without significant progress in processtechnology in the biotechnology industry [13]. In a nutshell, for some companies, the simultaneousinnovation of products and processes is a prerequisite condition to remain competitive in the industry.Therefore, the following hypothesis is proposed to examine the ‘co-centric innovation’ phenomenonthat is frequently observed in companies that heavily rely on both KBR and PBR:
Hypothesis 3. Firms heavily dependent upon both knowledge-based and property-based resources tend to focuson process and product innovation at the same time.
2.5.4. Marginal Innovation
Finally, some companies, such as spring water and paper manufacturers, tend to minimize productand process innovation efforts because there is limited room for improvement through any innovationactivities related to KBR or PBR. Instead, competitive advantage is simply generated by more effectivemarketing or lower prices than competitors. Accordingly, the following hypothesis is presented toverify the ‘marginal innovation’ phenomenon that is often found in companies that do not heavily relyon KBR as well as PBR:
Hypothesis 4. Firms marginally dependent upon knowledge-based and property-based resources tend tominimize process and product innovation efforts.
3. Methodology
3.1. Measures
Multi-item scales were designed based on previous studies to test the hypotheses of this study.Survey respondents were asked to indicate their agreement with each statement on a seven-pointLikert-type scale (e.g., 1 = strongly disagree and 7 = strongly agree). A detailed description of eachitem is given in Appendix A.
3.1.1. Product Innovation Intensity
Product innovation scales identify the extent of the company’s product innovation activities suchas the improvements of existing products or services and the creation of entirely new products orservices [17,23,25,34,68,69]. The high score on these scales means that the company tends to maintain acompetitive advantage in the market by implementing a wider range of product innovation activitiesthan their competitors [70–73]. Scale items PdI1 and PdI2 were adapted from [68]; PdI3 was developedbased on [21,72]; PdI4 was developed, referring to [17,34,69]; PdI5 was adapted from [19].
3.1.2. Process Innovation Intensity
Process innovation scales capture the extent of the company’s process innovation activities, suchas improving the way a company produces a product or service [17,19,22,26,68,74]. The high scoreson these scales mean that the company tends to focus on process innovation to sustain a competitiveadvantage in the market [17,70,72,73]. In particular, scale item PcI1 was adapted from [68]; PcI2 wasdeveloped, referring to [17,70,72]; PcI3 was developed based on [17,19,74]; PcI4 was adapted from [73].
Sustainability 2020, 12, 913 8 of 23
3.1.3. Property-Based Resource
The scale of property-based resources determines how much a company relies on property-basedresources to maintain a competitive edge [13,14,42,59]. The high scores for these items indicate that thecompany relies heavily on property-based resources such as patents, ownership, contracts, copyrights,trademarks, and registered designs [19,59,60]. Item Pr1 was developed based on [59,60]; Pr2 wasdeveloped, referring to [13,14,42,49,59]; Pr3 was adapted from [19]; Pr4 was developed, referringto [63]; Pr5 was developed, referring to [59,60]; Pr6 was developed based on [13,14,19,59]
3.1.4. Knowledge-Based Resource
The scale of knowledge-based resources determines how much a company depends uponknowledge-based resources to sustain a competitive advantage [13,14,42,59]. High scores on these itemsdenote that the company greatly depends on knowledge-based resources such as a firm’s specializedskills, processes, technical and managerial systems, and know-how to attain their competitive edgein the market [59,60,75,76]. Item Kr1 was developed based on [59,60]; Kr2 was developed, referringto [13,14,42,59,77]; items Kr3–Kr6 were adapted from [76].
In addition, a composite index of six variables, which includes a firm’s sales growth, market sharegrowth, net profit margin, return on assets, customer satisfaction, and customer retention, was used todetermine a firm’s sustainable competitive advantage in its competition [60,78]. Survey participantswere asked to indicate their opinion about how their firm’s performance over the last three yearscompared with its competition in their industry on a scale of 1 to 7, with 1 being ‘low end of theindustry,’ 2 being ‘much worse than average,’ 3 being ‘worse than average,’ 4 being ‘average,’ 5 being‘better than average,’ 6 being ‘much better than average,’ 7 being ‘superior’ [79]. Furthermore, we havecontrolled for some theoretically relevant variables such as the size of the firm (i.e., the number ofemployees), the age of the firm (i.e., the length of time in business), and the dynamics of the market,because previous studies have suggested that the likelihood of R&D activities in firms is related to thefirm’s size [80–83], the firm’s age [84], and market dynamism [85,86].
3.2. Sample
A survey method was used to collect the primary data, following the online survey design andprocedure of Dillman et al. [87]. Our target respondents were chief operations officers or business owners(for relatively small businesses) in the U.S.-based companies because they were considered to have acomprehensive knowledge of the company’s resources, operations, and performance [88,89]. “Surveyresearch has played a prominent role in testing theorized relationships that have collectively enhancedthe operations management (OM) and supply chain management bodies of knowledge” [90] (p. 578).However, previous OM scholars acknowledged the potential threat of a common method variance(CMV) on the validity of the survey results due to the self-reported nature of data [91,92]. Therefore, asex-ante remedies for controlling CMV, we applied the following criteria to recruit appropriate surveyparticipants; (i) the participant must have a full-time position in his/her organization, and (ii) theparticipant must be fully aware of his/her organization’s resources and innovation activities, and (iii) ifthere are two or more respondents in the same organization, the survey participants are selected basedon the position of the organization, that is, the top level information provider of the respondents [93,94].We also asked respondents to participate in the survey anonymously to minimize the likelihood ofCMV in the data [95]. Invitations to the survey were sent to a total of 346 target respondents andfinally, 257 useful responses were collected with a response rate of 74.27%. A detailed description ofthe sample data is provided in Appendix B (Table A1).
3.3. Assessment of Sample Data
After collecting data from the survey respondents, the presence of non-response bias was assessedby the extrapolation method, comparing early and late survey responses [78,96,97]. The t-test results
Sustainability 2020, 12, 913 9 of 23
showed no significant differences between the two groups, suggesting that non-response bias is notpresent in our sample. We then applied Harman’s single-factor test using CFA settings to assess thepotential threats of CMV [90,98]. As shown in Table 2, while the fit statistics for the measurementmodel showed that all fit statistics fully met the desirable thresholds for each fit index, the single-factormodel revealed poor fit for the data and the items in the single-factor model also significantly sufferedfrom poor path loadings, implying that the CMV threat was unlikely to exist in this study [22].
Table 2. Test results of the model fit (n = 257).
Index (Threshold) Measurement Model (CFA) CMV Testing Model (Single Factor)
Chi-square (X2) 816.549 2109.014The degree of Freedom (d.f.) 314 324
X2/d.f. <3.00 b 2.600 6.509Comparative fit index >0.90 c 0.938 0.781
Parsimony normed fit index >0.50 d 0.809 0.694Tucker-Lewis coefficient index Close to 1.00 e 0.931 0.762
RMSEA a <0.08 f 0.079 (0.072~0.086) g 0.147 (0.141~0.153)
a Root mean square error of approximation; b [99]; c [100]; d [101]; e [102]; f [103]; g RMSEA 90% confidence interval.
4. Data Analysis
4.1. Assessment of Measures
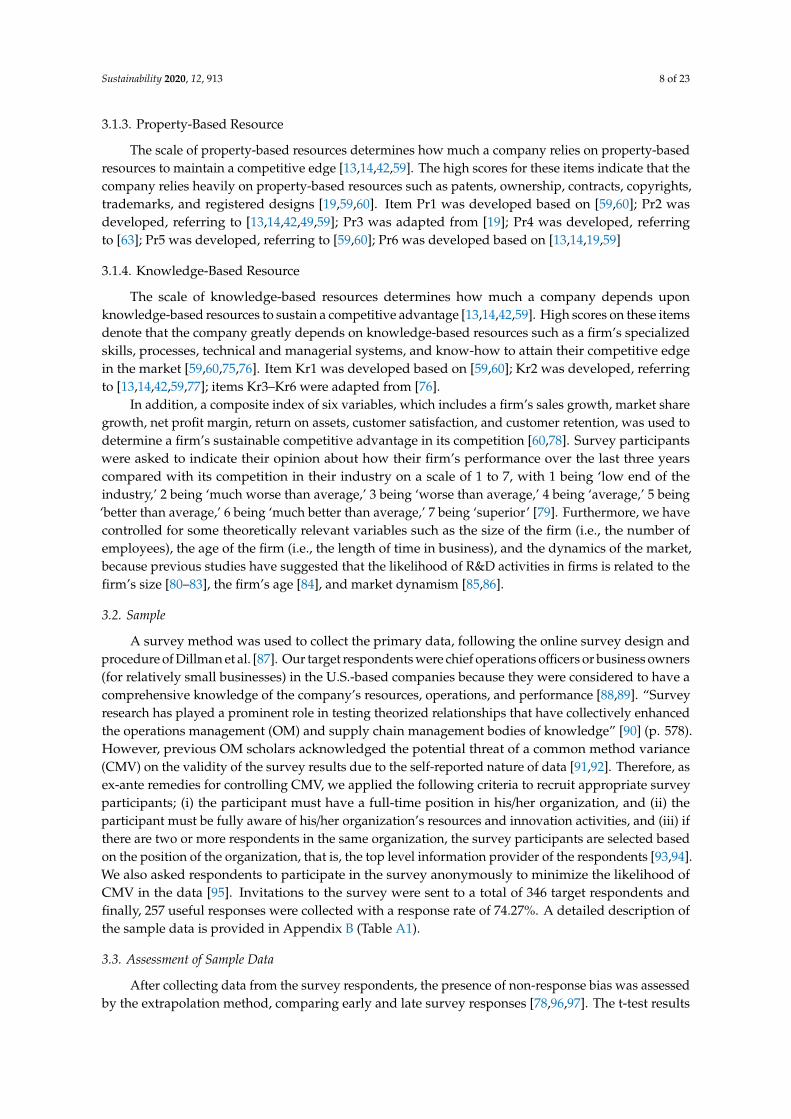
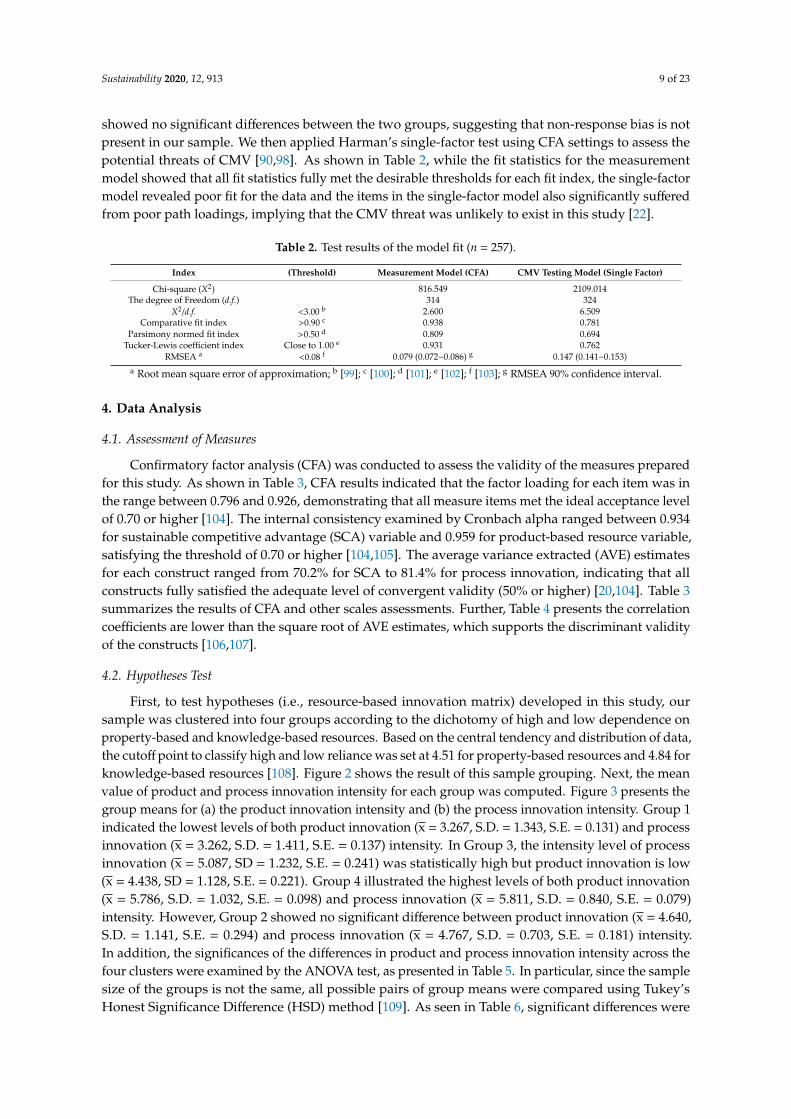
Confirmatory factor analysis (CFA) was conducted to assess the validity of the measures preparedfor this study. As shown in Table 3, CFA results indicated that the factor loading for each item was inthe range between 0.796 and 0.926, demonstrating that all measure items met the ideal acceptance levelof 0.70 or higher [104]. The internal consistency examined by Cronbach alpha ranged between 0.934for sustainable competitive advantage (SCA) variable and 0.959 for product-based resource variable,satisfying the threshold of 0.70 or higher [104,105]. The average variance extracted (AVE) estimatesfor each construct ranged from 70.2% for SCA to 81.4% for process innovation, indicating that allconstructs fully satisfied the adequate level of convergent validity (50% or higher) [20,104]. Table 3summarizes the results of CFA and other scales assessments. Further, Table 4 presents the correlationcoefficients are lower than the square root of AVE estimates, which supports the discriminant validityof the constructs [106,107].
4.2. Hypotheses Test
First, to test hypotheses (i.e., resource-based innovation matrix) developed in this study, oursample was clustered into four groups according to the dichotomy of high and low dependence onproperty-based and knowledge-based resources. Based on the central tendency and distribution of data,the cutoff point to classify high and low reliance was set at 4.51 for property-based resources and 4.84 forknowledge-based resources [108]. Figure 2 shows the result of this sample grouping. Next, the meanvalue of product and process innovation intensity for each group was computed. Figure 3 presents thegroup means for (a) the product innovation intensity and (b) the process innovation intensity. Group 1indicated the lowest levels of both product innovation (x = 3.267, S.D. = 1.343, S.E. = 0.131) and processinnovation (x = 3.262, S.D. = 1.411, S.E. = 0.137) intensity. In Group 3, the intensity level of processinnovation (x = 5.087, SD = 1.232, S.E. = 0.241) was statistically high but product innovation is low(x = 4.438, SD = 1.128, S.E. = 0.221). Group 4 illustrated the highest levels of both product innovation(x = 5.786, S.D. = 1.032, S.E. = 0.098) and process innovation (x = 5.811, S.D. = 0.840, S.E. = 0.079)intensity. However, Group 2 showed no significant difference between product innovation (x = 4.640,S.D. = 1.141, S.E. = 0.294) and process innovation (x = 4.767, S.D. = 0.703, S.E. = 0.181) intensity.In addition, the significances of the differences in product and process innovation intensity across thefour clusters were examined by the ANOVA test, as presented in Table 5. In particular, since the samplesize of the groups is not the same, all possible pairs of group means were compared using Tukey’sHonest Significance Difference (HSD) method [109]. As seen in Table 6, significant differences were
Sustainability 2020, 12, 913 10 of 23
observed between most pairs of group means (significant at p < 0.05) except for the mean betweenGroup 2 and Group 3. Therefore, combining all the above statistics, H1, H3, and H4 were supported,but H2 was not supported on our sample data.
Table 3. CFA results (n = 257).
Factor and Items Loading a S.E. b t-Value Sig. AVE c
Product Innovation (Cronbach α = 0.945)
PdI1 0.860 0.051 19.412 ***
0.774PdI2 0.856 0.050 19.240 ***PdI3 0.888 0.048 20.804 ***PdI4 0.912 0.045 22.131 ***PdI5 0.883
Process Innovation (Cronbach α = 0.946)
PcI1 0.884 0.048 21.409 ***
0.814PcI2 0.921 0.043 23.756 ***PcI3 0.907 0.047 22.848 ***PcI4 0.897
Product-Based Resource (Cronbach α = 0.959)
Pr1 0.926 0.044 22.999 ***
0.795
Pr2 0.914 0.045 22.301 ***Pr3 0.902 0.047 21.615 ***Pr4 0.861 0.048 19.509 ***Pr5 0.865 0.045 19.698 ***Pr6 0.879
Knowledge-Based Resource (Cronbach α = 0.952)
Kr1 0.871 0.050 19.873 ***
0.767
Kr2 0.879 0.049 20.280 ***Kr3 0.906 0.049 21.686 ***Kr4 0.896 0.048 21.125 ***Kr5 0.823 0.053 17.775 ***Kr6 0.878
Sustainable Competitive Advantage (Cronbach α = 0.934)
Sca1 0.852 0.066 15.727 ***
0.702
Sca2 0.868 0.065 16.126 ***Sca3 0.866 0.063 16.078 ***Sca4 0.842 0.065 15.465 ***Sca5 0.801 0.067 14.456 ***Sca6 0.796
a Standardized coefficient; b Standard error; c Average variances extracted; S.E. and t-value were not estimatedwhen loading set to fixed value (i.e., 1.0); *** p < 0.001.
Table 4. Inter-factors correlations matrix.
Factors 1 2 3 4 5 6 7 Mean S.D.
1 Product innovation 0.880 a 4.553 1.6512 Process innovation 0.823 ** 0.902 a 4.635 1.6383 PBR 0.800 ** 0.821 ** 0.892 a 4.496 1.6484 KBR 0.765 ** 0.824 ** 0.834 ** 0.876 a 4.835 1.5485 SCA 0.638 ** 0.669 ** 0.677 ** 0.780 ** 0.838 a 4.717 1.248
(Control Variables)
6 Firm age −0.092 −0.134 * −0.102 −0.128 * −0.016 3.964 1.7057 Firm size 0.160 * 0.112 0.201 ** 0.132 * 0.128 * 0.446 ** 4.470 1.8008 Market dynamism 0.588 ** 0.587 ** 0.660 ** 0.648 ** 0.607 ** −0.154 * 0.118 4.726 1.426
a Square root of AVE; ** Significant at the 0.01 level (2-tailed); * Significant at the 0.05 level (2-tailed);PBR = Property-based resources; KBR = Knowledge-based resources; SCA = Sustainable competitive advantage.

Sustainability 2020, 12, 913 11 of 23
Sustainability 2020, 12, 913 11 of 23
except for the mean between Group 2 and Group 3. Therefore, combining all the above statistics, H1, H3, and H4 were supported, but H2 was not supported on our sample data.
Figure 2. Sample grouping.
(a)
(b)
Figure 3. Group means: (a) product innovation intensity; (b) process innovation intensity.
Table 5. ANOVA test results. Variable Sum of Squares d.f. Mean Square F Sig.
Product Innovation Between Groups 342.832 3 114.277 81.441 0.000 Within Groups 355.008 253 1.403
Total 697.840 256
Process Innovation Between Groups 356.988 3 118.996 91.265 0.000 Within Groups 329.876 253 1.304
Total 686.864 256
Table 6. Tukey’s HSD test results. Variable Group Group Mean Difference Std. Error Sig.
Product innovation
1 2 −1.373 * 0.326 0.000 1 3 −1.171 * 0.259 0.000 1 4 −2.518 * 0.161 0.000 2 3 0.201 0.384 0.953 2 4 −1.145 * 0.325 0.003 3 4 −1.347 * 0.258 0.000
Process innovation
1 2 −1.504 * 0.315 0.000 1 3 −1.824 * 0.250 0.000 1 4 −2.548 * 0.155 0.000 2 3 −0.319 0.370 0.823
Figure 2. Sample grouping.
Sustainability 2020, 12, 913 11 of 23
except for the mean between Group 2 and Group 3. Therefore, combining all the above statistics, H1, H3, and H4 were supported, but H2 was not supported on our sample data.
Figure 2. Sample grouping.
(a)
(b)
Figure 3. Group means: (a) product innovation intensity; (b) process innovation intensity.
Table 5. ANOVA test results. Variable Sum of Squares d.f. Mean Square F Sig.
Product Innovation Between Groups 342.832 3 114.277 81.441 0.000 Within Groups 355.008 253 1.403
Total 697.840 256
Process Innovation Between Groups 356.988 3 118.996 91.265 0.000 Within Groups 329.876 253 1.304
Total 686.864 256
Table 6. Tukey’s HSD test results. Variable Group Group Mean Difference Std. Error Sig.
Product innovation
1 2 −1.373 * 0.326 0.000 1 3 −1.171 * 0.259 0.000 1 4 −2.518 * 0.161 0.000 2 3 0.201 0.384 0.953 2 4 −1.145 * 0.325 0.003 3 4 −1.347 * 0.258 0.000
Process innovation
1 2 −1.504 * 0.315 0.000 1 3 −1.824 * 0.250 0.000 1 4 −2.548 * 0.155 0.000 2 3 −0.319 0.370 0.823
Figure 3. Group means: (a) product innovation intensity; (b) process innovation intensity.
Table 5. ANOVA test results.
Variable Sum of Squares d.f. Mean Square F Sig.
ProductInnovation
Between Groups 342.832 3 114.277 81.441 0.000Within Groups 355.008 253 1.403
Total 697.840 256
ProcessInnovation
Between Groups 356.988 3 118.996 91.265 0.000Within Groups 329.876 253 1.304
Total 686.864 256
Table 6. Tukey’s HSD test results.
Variable Group Group Mean Difference Std. Error Sig.
Productinnovation
1 2 −1.373 * 0.326 0.0001 3 −1.171 * 0.259 0.0001 4 −2.518 * 0.161 0.0002 3 0.201 0.384 0.9532 4 −1.145 * 0.325 0.0033 4 −1.347 * 0.258 0.000
Processinnovation
1 2 −1.504 * 0.315 0.0001 3 −1.824 * 0.250 0.0001 4 −2.548 * 0.155 0.0002 3 −0.319 0.370 0.8232 4 −1.044 * 0.314 0.0063 4 −0.724 * 0.248 0.020
* Significant at the 0.05 level.
Sustainability 2020, 12, 913 12 of 23
4.3. Post hoc Analysis
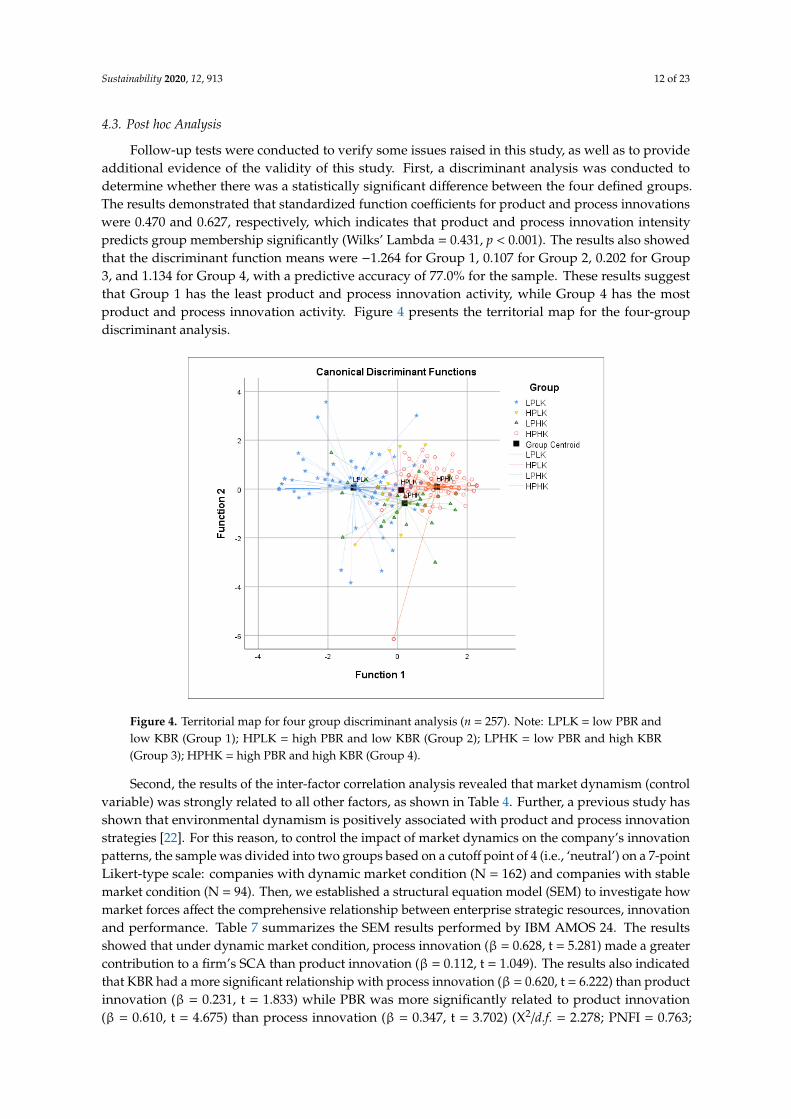
Follow-up tests were conducted to verify some issues raised in this study, as well as to provideadditional evidence of the validity of this study. First, a discriminant analysis was conducted todetermine whether there was a statistically significant difference between the four defined groups.The results demonstrated that standardized function coefficients for product and process innovationswere 0.470 and 0.627, respectively, which indicates that product and process innovation intensitypredicts group membership significantly (Wilks’ Lambda = 0.431, p < 0.001). The results also showedthat the discriminant function means were −1.264 for Group 1, 0.107 for Group 2, 0.202 for Group3, and 1.134 for Group 4, with a predictive accuracy of 77.0% for the sample. These results suggestthat Group 1 has the least product and process innovation activity, while Group 4 has the mostproduct and process innovation activity. Figure 4 presents the territorial map for the four-groupdiscriminant analysis.
Sustainability 2020, 12, 913 12 of 23
2 4 −1.044 * 0.314 0.006 3 4 −0.724 * 0.248 0.020
* Significant at the 0.05 level.
4.3. Post hoc Analysis
Follow-up tests were conducted to verify some issues raised in this study, as well as to provide additional evidence of the validity of this study. First, a discriminant analysis was conducted to determine whether there was a statistically significant difference between the four defined groups. The results demonstrated that standardized function coefficients for product and process innovations were 0.470 and 0.627, respectively, which indicates that product and process innovation intensity predicts group membership significantly (Wilks’ Lambda = 0.431, p < 0.001). The results also showed that the discriminant function means were −1.264 for Group 1, 0.107 for Group 2, 0.202 for Group 3, and 1.134 for Group 4, with a predictive accuracy of 77.0% for the sample. These results suggest that Group 1 has the least product and process innovation activity, while Group 4 has the most product and process innovation activity. Figure 4 presents the territorial map for the four-group discriminant analysis.
Figure 4. Territorial map for four group discriminant analysis (n = 257). Note: LPLK = low PBR and low KBR (Group 1); HPLK = high PBR and low KBR (Group 2); LPHK = low PBR and high KBR (Group 3); HPHK = high PBR and high KBR (Group 4).
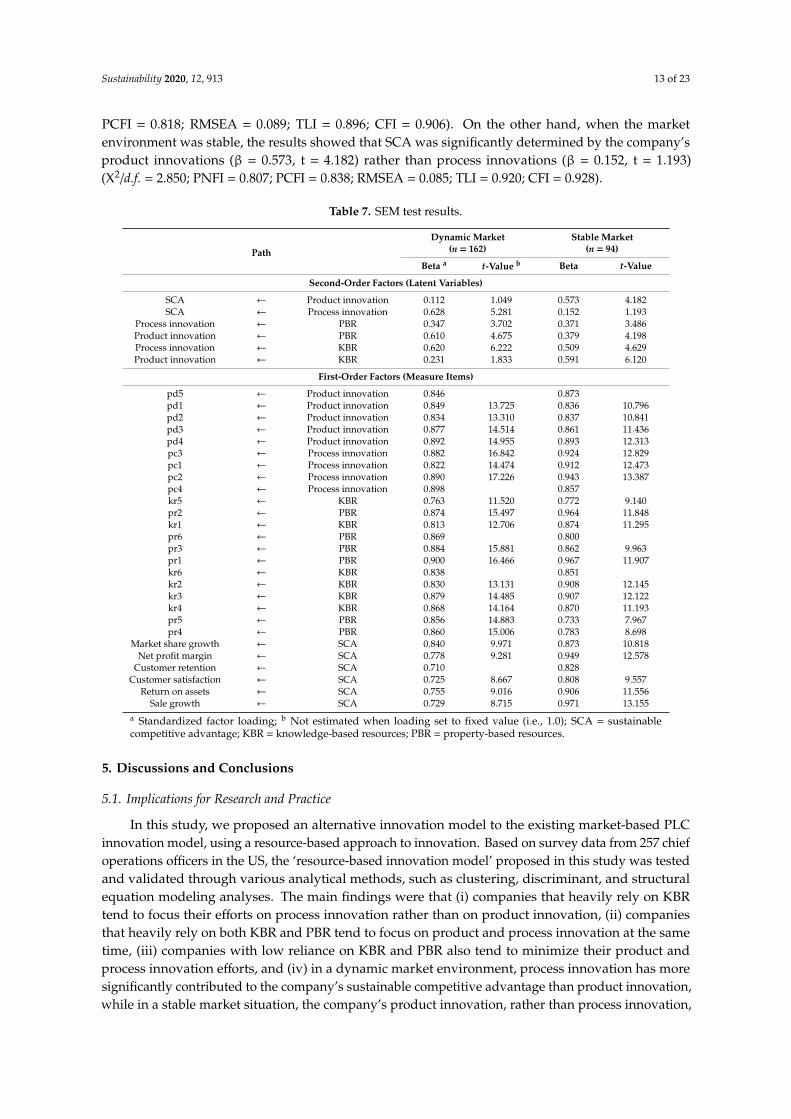
Second, the results of the inter-factor correlation analysis revealed that market dynamism (control variable) was strongly related to all other factors, as shown in Table 4. Further, a previous study has shown that environmental dynamism is positively associated with product and process innovation strategies [22]. For this reason, to control the impact of market dynamics on the company’s innovation patterns, the sample was divided into two groups based on a cutoff point of 4 (i.e., ‘neutral’) on a 7-point Likert-type scale: companies with dynamic market condition (N = 162) and companies with stable market condition (N = 94). Then, we established a structural equation model (SEM) to investigate how market forces affect the comprehensive relationship between enterprise strategic resources, innovation and performance. Table 7 summarizes the SEM results performed by IBM AMOS 24. The results showed that under dynamic market condition, process innovation (β = 0.628, t = 5.281) made a greater contribution to a firm’s SCA than product innovation (β = 0.112, t = 1.049). The results also indicated that KBR had a more significant relationship with process
Figure 4. Territorial map for four group discriminant analysis (n = 257). Note: LPLK = low PBR andlow KBR (Group 1); HPLK = high PBR and low KBR (Group 2); LPHK = low PBR and high KBR(Group 3); HPHK = high PBR and high KBR (Group 4).
Second, the results of the inter-factor correlation analysis revealed that market dynamism (controlvariable) was strongly related to all other factors, as shown in Table 4. Further, a previous study hasshown that environmental dynamism is positively associated with product and process innovationstrategies [22]. For this reason, to control the impact of market dynamics on the company’s innovationpatterns, the sample was divided into two groups based on a cutoff point of 4 (i.e., ‘neutral’) on a 7-pointLikert-type scale: companies with dynamic market condition (N = 162) and companies with stablemarket condition (N = 94). Then, we established a structural equation model (SEM) to investigate howmarket forces affect the comprehensive relationship between enterprise strategic resources, innovationand performance. Table 7 summarizes the SEM results performed by IBM AMOS 24. The resultsshowed that under dynamic market condition, process innovation (β = 0.628, t = 5.281) made a greatercontribution to a firm’s SCA than product innovation (β = 0.112, t = 1.049). The results also indicatedthat KBR had a more significant relationship with process innovation (β = 0.620, t = 6.222) than productinnovation (β = 0.231, t = 1.833) while PBR was more significantly related to product innovation(β = 0.610, t = 4.675) than process innovation (β = 0.347, t = 3.702) (X2/d.f. = 2.278; PNFI = 0.763;
Sustainability 2020, 12, 913 13 of 23
PCFI = 0.818; RMSEA = 0.089; TLI = 0.896; CFI = 0.906). On the other hand, when the marketenvironment was stable, the results showed that SCA was significantly determined by the company’sproduct innovations (β = 0.573, t = 4.182) rather than process innovations (β = 0.152, t = 1.193)(X2/d.f. = 2.850; PNFI = 0.807; PCFI = 0.838; RMSEA = 0.085; TLI = 0.920; CFI = 0.928).
Table 7. SEM test results.
Path
Dynamic Market(n = 162)
Stable Market(n = 94)
Beta a t-Value b Beta t-Value
Second-Order Factors (Latent Variables)
SCA ← Product innovation 0.112 1.049 0.573 4.182SCA ← Process innovation 0.628 5.281 0.152 1.193
Process innovation ← PBR 0.347 3.702 0.371 3.486Product innovation ← PBR 0.610 4.675 0.379 4.198Process innovation ← KBR 0.620 6.222 0.509 4.629Product innovation ← KBR 0.231 1.833 0.591 6.120
First-Order Factors (Measure Items)
pd5 ← Product innovation 0.846 0.873pd1 ← Product innovation 0.849 13.725 0.836 10.796pd2 ← Product innovation 0.834 13.310 0.837 10.841pd3 ← Product innovation 0.877 14.514 0.861 11.436pd4 ← Product innovation 0.892 14.955 0.893 12.313pc3 ← Process innovation 0.882 16.842 0.924 12.829pc1 ← Process innovation 0.822 14.474 0.912 12.473pc2 ← Process innovation 0.890 17.226 0.943 13.387pc4 ← Process innovation 0.898 0.857kr5 ← KBR 0.763 11.520 0.772 9.140pr2 ← PBR 0.874 15.497 0.964 11.848kr1 ← KBR 0.813 12.706 0.874 11.295pr6 ← PBR 0.869 0.800pr3 ← PBR 0.884 15.881 0.862 9.963pr1 ← PBR 0.900 16.466 0.967 11.907kr6 ← KBR 0.838 0.851kr2 ← KBR 0.830 13.131 0.908 12.145kr3 ← KBR 0.879 14.485 0.907 12.122kr4 ← KBR 0.868 14.164 0.870 11.193pr5 ← PBR 0.856 14.883 0.733 7.967pr4 ← PBR 0.860 15.006 0.783 8.698
Market share growth ← SCA 0.840 9.971 0.873 10.818Net profit margin ← SCA 0.778 9.281 0.949 12.578
Customer retention ← SCA 0.710 0.828Customer satisfaction ← SCA 0.725 8.667 0.808 9.557
Return on assets ← SCA 0.755 9.016 0.906 11.556Sale growth ← SCA 0.729 8.715 0.971 13.155
a Standardized factor loading; b Not estimated when loading set to fixed value (i.e., 1.0); SCA = sustainablecompetitive advantage; KBR = knowledge-based resources; PBR = property-based resources.
5. Discussions and Conclusions
5.1. Implications for Research and Practice
In this study, we proposed an alternative innovation model to the existing market-based PLCinnovation model, using a resource-based approach to innovation. Based on survey data from 257 chiefoperations officers in the US, the ‘resource-based innovation model’ proposed in this study was testedand validated through various analytical methods, such as clustering, discriminant, and structuralequation modeling analyses. The main findings were that (i) companies that heavily rely on KBRtend to focus their efforts on process innovation rather than on product innovation, (ii) companiesthat heavily rely on both KBR and PBR tend to focus on product and process innovation at the sametime, (iii) companies with low reliance on KBR and PBR also tend to minimize their product andprocess innovation efforts, and (iv) in a dynamic market environment, process innovation has moresignificantly contributed to the company’s sustainable competitive advantage than product innovation,while in a stable market situation, the company’s product innovation, rather than process innovation,
Sustainability 2020, 12, 913 14 of 23
determined its sustainable competitive advantage. These findings contribute to research and practicein several ways:
Firstly, this study provides new insights that can complement the limitations of the existingPLC-based research paradigm. The most fundamental difference between ‘PLC-based’ and‘resource-based’ innovation models lies in the theoretical perspectives of each model. In terms oforganizational theory, the PLC-based model is consistent with an ‘open system’ in which an organizationis seen as a system that continuously interacts with environmental variations to survive [8,110].Accordingly, in the PLC-based model, external contingencies (e.g., market environment, changesin customer demand, and competition) are considered as crucial determinants of the company’sinnovation strategy [6,111,112]. Contrastingly, the ‘resource-based’ innovation model focuses oninternal coincidence within the organization and assumes that the inherent characteristics of strategicresources serve as the decisive determinants of innovation decision making. In other words,the innovation model proposed in this study is theoretically harmonized with the literature onthe resource-based view of the firm [14,42,49], while the existing PLC-based model is consistent withthe contingency theory [8,10,113]. Therefore, this study contributes to the operation managementliterature by providing new insights into how corporate resources impact innovation strategy decisionsfrom a resource-based perspective.
Secondly, the study also provides new insights to business executives and policy makers byshowing why more attention should be paid to the inherent attributes of corporate resources indetermining innovation strategies. The findings supported the critical role of corporate strategicresources in optimizing product and process innovation. In particular, the ‘resource-based matrix’proposed in this study provides a new algorithm for understanding the mechanism by which corporatestrategic resources influence innovation strategy decisions. That is, the findings suggest that innovationstrategy decisions should begin by identifying which enterprise resources are the primary source ofcompetitive advantage [14,15,49,51]. Accordingly, it might be first asked where the firm’s competitiveedge is derived from PBR, KBR, or both types of resources. The company can then use the intrinsic natureof its strategic resources as a profound guide for identifying the most optimal innovation alternatives:(a) product-centric, (b) process-centric, (c) co-centric, and (d) marginal innovations. This resource-basedinnovation approach is thereby expected to enhance the company’s core competencies and ultimatelylead to a sustainable competitive advantage [15].
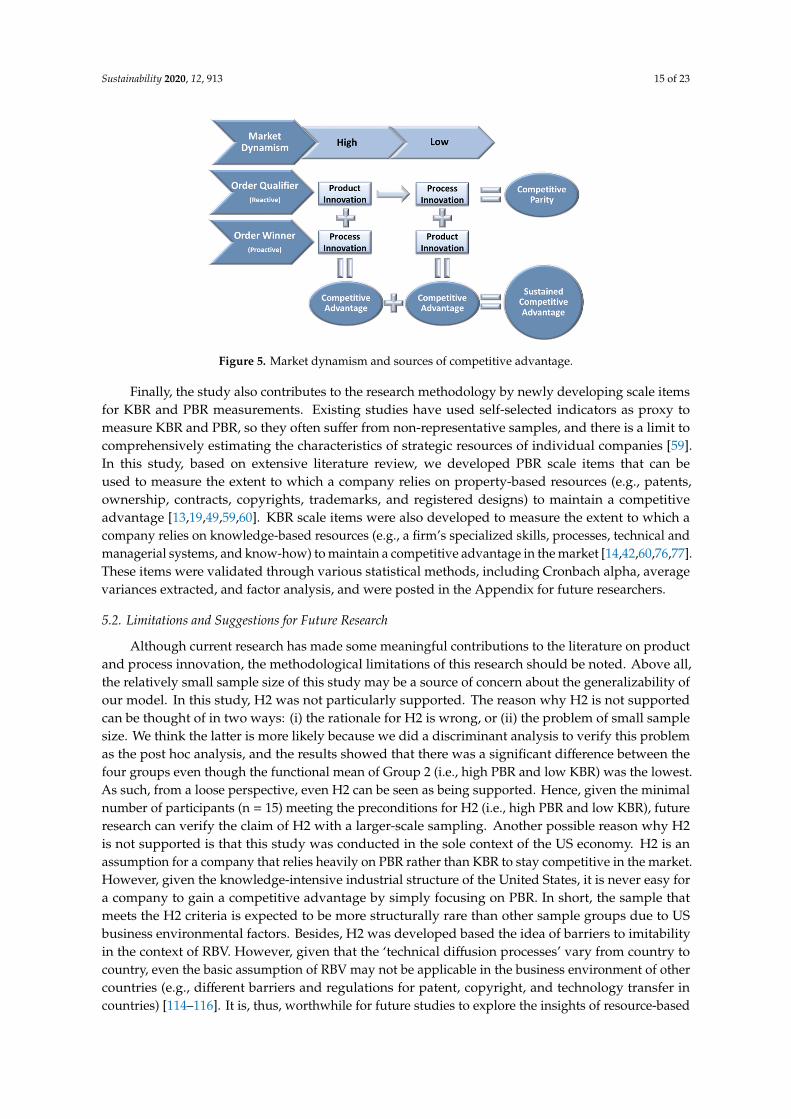
Thirdly, this study raises a fundamental question about the common rationale of the relationshipbetween innovation adoption and competitive advantage. As discussed previously, the PLC modelpostulates that companies are more likely to focus on product innovation during the early dynamicmarket phase until its product design is standardized in an industry [31]. Then, as demand forproducts becomes more stable and predictable, companies accelerate process innovation to reduceproduction costs [13,33]. This logical frame is beneficial in explaining the relationship between industrialvariations and innovation adoption, which can be advocated by the contingency theory [10]. However,a fundamental question arises when companies pursue the same innovation strategy according toindustrial environmental factors; here, companies can face ‘competitive parity’ rather than ‘competitiveadvantage.’ Our study results suggest an alternative basis for how innovation strategies can have acompetitive advantage, indicating that in dynamic market condition, a company’s process innovationhad a more significant impact on competitive advantage than product innovation, while in a stablemarket, product innovation more significantly affected competitive advantage than process innovation.Based on these findings, it is inferred that when market dynamics are high, process innovation canbe a source of ‘order winner’ that differentiates from competitions while product innovation plays arole of ‘order qualifier,’ a prerequisite for survival in the industry. Conversely, the results also suggestthat in a stable market condition, product innovation creates a source of ‘order winners,’ but processinnovation serves as ‘order qualifier’ because it is the minimum requirement for survival amongst thecompetition. Figure 5 is a graphical summary of these claims about how competitive advantage can beachieved through innovation activities in line with market dynamics.
Sustainability 2020, 12, 913 15 of 23
Sustainability 2020, 12, 913 15 of 23
according to industrial environmental factors; here, companies can face ‘competitive parity’ rather than ‘competitive advantage.’ Our study results suggest an alternative basis for how innovation strategies can have a competitive advantage, indicating that in dynamic market condition, a company’s process innovation had a more significant impact on competitive advantage than product innovation, while in a stable market, product innovation more significantly affected competitive advantage than process innovation. Based on these findings, it is inferred that when market dynamics are high, process innovation can be a source of ‘order winner’ that differentiates from competitions while product innovation plays a role of ‘order qualifier,’ a prerequisite for survival in the industry. Conversely, the results also suggest that in a stable market condition, product innovation creates a source of ‘order winners,’ but process innovation serves as ‘order qualifier’ because it is the minimum requirement for survival amongst the competition. Figure 5 is a graphical summary of these claims about how competitive advantage can be achieved through innovation activities in line with market dynamics.
Figure 5. Market dynamism and sources of competitive advantage.
Finally, the study also contributes to the research methodology by newly developing scale items for KBR and PBR measurements. Existing studies have used self-selected indicators as proxy to measure KBR and PBR, so they often suffer from non-representative samples, and there is a limit to comprehensively estimating the characteristics of strategic resources of individual companies [59]. In this study, based on extensive literature review, we developed PBR scale items that can be used to measure the extent to which a company relies on property-based resources (e.g., patents, ownership, contracts, copyrights, trademarks, and registered designs) to maintain a competitive advantage [13,19,49,59,60]. KBR scale items were also developed to measure the extent to which a company relies on knowledge-based resources (e.g., a firm’s specialized skills, processes, technical and managerial systems, and know-how) to maintain a competitive advantage in the market [14,42,60,76,77]. These items were validated through various statistical methods, including Cronbach alpha, average variances extracted, and factor analysis, and were posted in the Appendix for future researchers.
5.2. Limitations and Suggestions for Future Research
Although current research has made some meaningful contributions to the literature on product and process innovation, the methodological limitations of this research should be noted. Above all, the relatively small sample size of this study may be a source of concern about the generalizability of our model. In this study, H2 was not particularly supported. The reason why H2 is not supported can be thought of in two ways: (i) the rationale for H2 is wrong, or (ii) the problem of small sample size. We think the latter is more likely because we did a discriminant analysis to verify this problem as the post hoc analysis, and the results showed that there was a significant difference between the four groups even though the functional mean of Group 2 (i.e. high PBR and low KBR) was the lowest. As such, from a loose perspective, even H2 can be seen as being supported. Hence, given the minimal number of participants (n = 15) meeting the preconditions for H2 (i.e., high PBR and low KBR), future
Figure 5. Market dynamism and sources of competitive advantage.
Finally, the study also contributes to the research methodology by newly developing scale itemsfor KBR and PBR measurements. Existing studies have used self-selected indicators as proxy tomeasure KBR and PBR, so they often suffer from non-representative samples, and there is a limit tocomprehensively estimating the characteristics of strategic resources of individual companies [59].In this study, based on extensive literature review, we developed PBR scale items that can beused to measure the extent to which a company relies on property-based resources (e.g., patents,ownership, contracts, copyrights, trademarks, and registered designs) to maintain a competitiveadvantage [13,19,49,59,60]. KBR scale items were also developed to measure the extent to which acompany relies on knowledge-based resources (e.g., a firm’s specialized skills, processes, technical andmanagerial systems, and know-how) to maintain a competitive advantage in the market [14,42,60,76,77].These items were validated through various statistical methods, including Cronbach alpha, averagevariances extracted, and factor analysis, and were posted in the Appendix for future researchers.
5.2. Limitations and Suggestions for Future Research
Although current research has made some meaningful contributions to the literature on productand process innovation, the methodological limitations of this research should be noted. Above all,the relatively small sample size of this study may be a source of concern about the generalizability ofour model. In this study, H2 was not particularly supported. The reason why H2 is not supportedcan be thought of in two ways: (i) the rationale for H2 is wrong, or (ii) the problem of small samplesize. We think the latter is more likely because we did a discriminant analysis to verify this problemas the post hoc analysis, and the results showed that there was a significant difference between thefour groups even though the functional mean of Group 2 (i.e., high PBR and low KBR) was the lowest.As such, from a loose perspective, even H2 can be seen as being supported. Hence, given the minimalnumber of participants (n = 15) meeting the preconditions for H2 (i.e., high PBR and low KBR), futureresearch can verify the claim of H2 with a larger-scale sampling. Another possible reason why H2is not supported is that this study was conducted in the sole context of the US economy. H2 is anassumption for a company that relies heavily on PBR rather than KBR to stay competitive in the market.However, given the knowledge-intensive industrial structure of the United States, it is never easy fora company to gain a competitive advantage by simply focusing on PBR. In short, the sample thatmeets the H2 criteria is expected to be more structurally rare than other sample groups due to USbusiness environmental factors. Besides, H2 was developed based the idea of barriers to imitabilityin the context of RBV. However, given that the ‘technical diffusion processes’ vary from country tocountry, even the basic assumption of RBV may not be applicable in the business environment of othercountries (e.g., different barriers and regulations for patent, copyright, and technology transfer incountries) [114–116]. It is, thus, worthwhile for future studies to explore the insights of resource-based

Sustainability 2020, 12, 913 16 of 23
innovation models in a broader context beyond the U.S. economy by examining samples from variousbackground countries. Further, instead of sticking to one innovation paradigm, future research willneed to develop a multi-dimensional approach model to find the most effective innovation strategy byintegrating resource-based and PLC-based innovation models.
5.3. Conclusions
As discussed earlier, we acknowledge that PLC-based innovation models [6,7,28,31] havecontributed significantly to establishing a general logic that can be applied to a wide range ofindustrial innovation patterns. However, many of the innovation patterns in real industrial sites arenot easily explained by the PLC innovation model and are still unresolved in the literature. Thus,we began this study with the motivation to fill this gap. As such, this study has proposed a newresource-based innovation algorithm that helps us to understand innovation phenomena that aredifficult to explain through the lens of the PLC-based innovation paradigm. In short, by integrating theliterature on product and process innovation with a resource-based perspective, this study provides anew paradigm for understanding the mechanisms by which corporate strategic resources influenceinnovation strategy decisions. Therefore, rather than denying the current PLC paradigm, we hope thatthis study will help broaden the scope of innovation research by presenting new insights to discoverthe logic that complements the limitations of the PLC paradigm.
Author Contributions: All authors contributed significantly to the completion of this manuscript.Conceptualization, Y.S.C.; methodology, Y.S.C., K.L.; formal analysis, Y.S.C., K.L.; writing-original draft preparation,Y.S.C.; writing-review and editing, K.L.; supervision, K.L. All authors have read and agreed to the publishedversion of the manuscript.
Funding: This research received no external funding.
Acknowledgments: We are very grateful to David Peng (University of Houston) and Hale Kaynak (University ofTexas-Rio Grande Valley), and the anonymous Sustainability reviewers for their insightful comments on an earlierdraft of this paper.
Conflicts of Interest: The authors declare no conflict of interest.
Appendix A. Survey Questionnaire (Measure Items)
Appendix A.1. Product Innovation Intensity
Sustainability 2020, 12, 913 16 of 23
research can verify the claim of H2 with a larger-scale sampling. Another possible reason why H2 is not supported is that this study was conducted in the sole context of the US economy. H2 is an assumption for a company that relies heavily on PBR rather than KBR to stay competitive in the market. However, given the knowledge-intensive industrial structure of the United States, it is never easy for a company to gain a competitive advantage by simply focusing on PBR. In short, the sample that meets the H2 criteria is expected to be more structurally rare than other sample groups due to US business environmental factors. Besides, H2 was developed based the idea of barriers to imitability in the context of RBV. However, given that the ‘technical diffusion processes’ vary from country to country, even the basic assumption of RBV may not be applicable in the business environment of other countries (e.g., different barriers and regulations for patent, copyright, and technology transfer in countries) [114–116]. It is, thus, worthwhile for future studies to explore the insights of resource-based innovation models in a broader context beyond the U.S. economy by examining samples from various background countries. Further, instead of sticking to one innovation paradigm, future research will need to develop a multi-dimensional approach model to find the most effective innovation strategy by integrating resource-based and PLC-based innovation models.
5.3. Conclusions
As discussed earlier, we acknowledge that PLC-based innovation models [6,7,28,31] have contributed significantly to establishing a general logic that can be applied to a wide range of industrial innovation patterns. However, many of the innovation patterns in real industrial sites are not easily explained by the PLC innovation model and are still unresolved in the literature. Thus, we began this study with the motivation to fill this gap. As such, this study has proposed a new resource-based innovation algorithm that helps us to understand innovation phenomena that are difficult to explain through the lens of the PLC-based innovation paradigm. In short, by integrating the literature on product and process innovation with a resource-based perspective, this study provides a new paradigm for understanding the mechanisms by which corporate strategic resources influence innovation strategy decisions. Therefore, rather than denying the current PLC paradigm, we hope that this study will help broaden the scope of innovation research by presenting new insights to discover the logic that complements the limitations of the PLC paradigm.
Author Contributions: All authors contributed significantly to the completion of this manuscript. Conceptualization, Y.S.C.; methodology, Y.S.C., K.L.; formal analysis, Y.S.C., K.L.; writing-original draft preparation, Y.S.C.; writing-review and editing, K.L.; supervision, K.L.
Funding: This research received no external funding.
Acknowledgments: We are very grateful to David Peng (University of Houston) and Hale Kaynak (University of Texas-Rio Grande Valley), and the anonymous Sustainability reviewers for their insightful comments on an earlier draft of this paper.
Conflicts of Interest: The authors declare no conflict of interest.
Appendix A
Survey Questionnaire (Measure Items)
A1: Product Innovation Intensity
PRODUCT Innovation is defined as: (i) the changes made to existing products or services for the benefit of customers or clients, or (ii) the creation of entirely new products or services. Please consider your company’s PRODUCT Innovation activities, and then indicate your agreement with each statement on a scale of 1 to 7.
PdI1: PRODUCT innovations introduced by our company during the last three years have been extensive. PdI2: Our company’s PRODUCT improvements during the last three years have been radical. PdI3: In dealing with our competitors, our company tends to sustain competitive advantages through more intensive PRODUCT innovations than our competitors. PdI4: In general, our company tends to be ahead of our competitors in introducing new or improved products or services. PdI5: Our company is well known by our customers for outstanding PRODUCT innovations.
PdI1: PRODUCT innovations introduced by our company during the last three years havebeen extensive.
PdI2: Our company’s PRODUCT improvements during the last three years have been radical.PdI3: In dealing with our competitors, our company tends to sustain competitive advantages
through more intensive PRODUCT innovations than our competitors.PdI4: In general, our company tends to be ahead of our competitors in introducing new or improved
products or services.PdI5: Our company is well known by our customers for outstanding PRODUCT innovations.
Appendix A.2. Process Innovation Intensity
Sustainability 2020, 12, 913 17 of 23
A2: Process Innovation Intensity
PROCESS Innovation is defined as the changes in the way that a firm produces products or services. Please consider your company’s PROCESS Innovation activities, and then indicate your agreement with each statement on a scale of 1 to 7.
PcI1: Our company’s PROCESS improvements during the last three years have been radical. PcI2: In dealing with our competitors, our company tends to sustain competitive advantages through more intensive PROCESS
innovations than our competitors. PcI3: In general, our company tends to be ahead of our competitors in introducing new or significantly improved PROCESSES
(e.g., information technology, productive process, and machinery and equipment) for producing products or services. PcI4: Our company has a superior capability to develop a new product or service in a shorter time compared to our competitors.
A3: Reliance on Property-based Resources
Property-based Resources are defined as resources that can be protected by property rights such as patent, ownership, contracts, copyrights, trademarks, and registered designs. Please consider your company’s Property-based Resources, and then indicate your agreement with each statement on a scale of 1 to 7.
Pr1: The reliance of our business on ‘Property-Based Resources’ (e.g., patent, ownership, contracts, copyrights, trademarks, and registered designs) has been significant.
Pr2: In dealing with our competitors, our company tends to sustain our competitive edge by strengthening “Property-Based Resources.”
Pr3: Our company tends to introduce new products or services into the market more frequently than our competitors. Pr4: Our company is superior to our competitors in terms of product variety. Pr5: Our product brands are typically considered more prestigious than those of our competitors. Pr6: Our company is well known by our customers for dominant legal properties such as registered designs, technical patents,
and copyrights.
A4: Reliance on Knowledge-based Resources
Knowledge-based Resources are defined as resources that can be protected by knowledge barriers such as a firm’s specialized skills, processes, technical and managerial systems, and know-hows that cannot easily be identified or imitated by market competitors. Please consider your company’s Knowledge-based Resources, and then indicate your agreement with each statement on a scale of 1 to 7.
Kr1: The reliance of our business on ‘Knowledge-Based Resources’ (e.g., a firm’s specialized skills, processes, technical and managerial systems, and know-hows) has been significant.
Kr2: In dealing with our competitors, our company tends to sustain our competitive edge by strengthening ‘Knowledge-Based Resources.’
Kr3: Our company has a strong position regarding technical expertise compared to our competitors. Kr4: Our company has a strong position regarding expertise in marketing compared to our competitors. Kr5: Our company has a strong position regarding expertise in customer service compared to our competitors. Kr6: Our company has a strong position regarding highly productive staffs compared to our competitors.
A5: Sustainable Competitive Advantage
Please consider your firm’s performance over the last three years, and then indicate your opinion about how your firm’s performance compares with its competition in your industry on a scale of 1 to 7 (e.g., 1 = low end of the industry, 2 = much worse than average, 3 = worse than average, 4 = average, 5 = better than average, 6 = much better than average, 7 = superior).
Sca1: Sales growth Sca2: Market share growth Sca3: Net profit margin Sca4: Return on assets Sca5: Customer satisfaction Sca6: Customer retention
A6: Market Dynamism
Please consider your company’s Business Environment, and then indicate your agreement with each statement on a scale of 1 to 7.
PcI1: Our company’s PROCESS improvements during the last three years have been radical.
Sustainability 2020, 12, 913 17 of 23
PcI2: In dealing with our competitors, our company tends to sustain competitive advantagesthrough more intensive PROCESS innovations than our competitors.
PcI3: In general, our company tends to be ahead of our competitors in introducing new orsignificantly improved PROCESSES (e.g., information technology, productive process, andmachinery and equipment) for producing products or services.
PcI4: Our company has a superior capability to develop a new product or service in a shorter timecompared to our competitors.
Appendix A.3. Reliance on Property-based Resources
Sustainability 2020, 12, 913 17 of 23
A2: Process Innovation Intensity
PROCESS Innovation is defined as the changes in the way that a firm produces products or services. Please consider your company’s PROCESS Innovation activities, and then indicate your agreement with each statement on a scale of 1 to 7.
PcI1: Our company’s PROCESS improvements during the last three years have been radical. PcI2: In dealing with our competitors, our company tends to sustain competitive advantages through more intensive PROCESS
innovations than our competitors. PcI3: In general, our company tends to be ahead of our competitors in introducing new or significantly improved PROCESSES
(e.g., information technology, productive process, and machinery and equipment) for producing products or services. PcI4: Our company has a superior capability to develop a new product or service in a shorter time compared to our competitors.
A3: Reliance on Property-based Resources
Property-based Resources are defined as resources that can be protected by property rights such as patent, ownership, contracts, copyrights, trademarks, and registered designs. Please consider your company’s Property-based Resources, and then indicate your agreement with each statement on a scale of 1 to 7.
Pr1: The reliance of our business on ‘Property-Based Resources’ (e.g., patent, ownership, contracts, copyrights, trademarks, and registered designs) has been significant.
Pr2: In dealing with our competitors, our company tends to sustain our competitive edge by strengthening “Property-Based Resources.”
Pr3: Our company tends to introduce new products or services into the market more frequently than our competitors. Pr4: Our company is superior to our competitors in terms of product variety. Pr5: Our product brands are typically considered more prestigious than those of our competitors. Pr6: Our company is well known by our customers for dominant legal properties such as registered designs, technical patents,
and copyrights.
A4: Reliance on Knowledge-based Resources
Knowledge-based Resources are defined as resources that can be protected by knowledge barriers such as a firm’s specialized skills, processes, technical and managerial systems, and know-hows that cannot easily be identified or imitated by market competitors. Please consider your company’s Knowledge-based Resources, and then indicate your agreement with each statement on a scale of 1 to 7.
Kr1: The reliance of our business on ‘Knowledge-Based Resources’ (e.g., a firm’s specialized skills, processes, technical and managerial systems, and know-hows) has been significant.
Kr2: In dealing with our competitors, our company tends to sustain our competitive edge by strengthening ‘Knowledge-Based Resources.’
Kr3: Our company has a strong position regarding technical expertise compared to our competitors. Kr4: Our company has a strong position regarding expertise in marketing compared to our competitors. Kr5: Our company has a strong position regarding expertise in customer service compared to our competitors. Kr6: Our company has a strong position regarding highly productive staffs compared to our competitors.
A5: Sustainable Competitive Advantage
Please consider your firm’s performance over the last three years, and then indicate your opinion about how your firm’s performance compares with its competition in your industry on a scale of 1 to 7 (e.g., 1 = low end of the industry, 2 = much worse than average, 3 = worse than average, 4 = average, 5 = better than average, 6 = much better than average, 7 = superior).
Sca1: Sales growth Sca2: Market share growth Sca3: Net profit margin Sca4: Return on assets Sca5: Customer satisfaction Sca6: Customer retention
A6: Market Dynamism
Please consider your company’s Business Environment, and then indicate your agreement with each statement on a scale of 1 to 7.
Pr1: The reliance of our business on ‘Property-Based Resources’ (e.g., patent, ownership, contracts,copyrights, trademarks, and registered designs) has been significant.
Pr2: In dealing with our competitors, our company tends to sustain our competitive edge bystrengthening “Property-Based Resources.”
Pr3: Our company tends to introduce new products or services into the market more frequentlythan our competitors.
Pr4: Our company is superior to our competitors in terms of product variety.Pr5: Our product brands are typically considered more prestigious than those of our competitors.Pr6: Our company is well known by our customers for dominant legal properties such as registered
designs, technical patents, and copyrights.
Appendix A.4. Reliance on Knowledge-based Resources
Sustainability 2020, 12, 913 17 of 23
A2: Process Innovation Intensity
PROCESS Innovation is defined as the changes in the way that a firm produces products or services. Please consider your company’s PROCESS Innovation activities, and then indicate your agreement with each statement on a scale of 1 to 7.
PcI1: Our company’s PROCESS improvements during the last three years have been radical. PcI2: In dealing with our competitors, our company tends to sustain competitive advantages through more intensive PROCESS
innovations than our competitors. PcI3: In general, our company tends to be ahead of our competitors in introducing new or significantly improved PROCESSES
(e.g., information technology, productive process, and machinery and equipment) for producing products or services. PcI4: Our company has a superior capability to develop a new product or service in a shorter time compared to our competitors.
A3: Reliance on Property-based Resources
Property-based Resources are defined as resources that can be protected by property rights such as patent, ownership, contracts, copyrights, trademarks, and registered designs. Please consider your company’s Property-based Resources, and then indicate your agreement with each statement on a scale of 1 to 7.
Pr1: The reliance of our business on ‘Property-Based Resources’ (e.g., patent, ownership, contracts, copyrights, trademarks, and registered designs) has been significant.
Pr2: In dealing with our competitors, our company tends to sustain our competitive edge by strengthening “Property-Based Resources.”
Pr3: Our company tends to introduce new products or services into the market more frequently than our competitors. Pr4: Our company is superior to our competitors in terms of product variety. Pr5: Our product brands are typically considered more prestigious than those of our competitors. Pr6: Our company is well known by our customers for dominant legal properties such as registered designs, technical patents,
and copyrights.
A4: Reliance on Knowledge-based Resources
Knowledge-based Resources are defined as resources that can be protected by knowledge barriers such as a firm’s specialized skills, processes, technical and managerial systems, and know-hows that cannot easily be identified or imitated by market competitors. Please consider your company’s Knowledge-based Resources, and then indicate your agreement with each statement on a scale of 1 to 7.
Kr1: The reliance of our business on ‘Knowledge-Based Resources’ (e.g., a firm’s specialized skills, processes, technical and managerial systems, and know-hows) has been significant.
Kr2: In dealing with our competitors, our company tends to sustain our competitive edge by strengthening ‘Knowledge-Based Resources.’
Kr3: Our company has a strong position regarding technical expertise compared to our competitors. Kr4: Our company has a strong position regarding expertise in marketing compared to our competitors. Kr5: Our company has a strong position regarding expertise in customer service compared to our competitors. Kr6: Our company has a strong position regarding highly productive staffs compared to our competitors.
A5: Sustainable Competitive Advantage
Please consider your firm’s performance over the last three years, and then indicate your opinion about how your firm’s performance compares with its competition in your industry on a scale of 1 to 7 (e.g., 1 = low end of the industry, 2 = much worse than average, 3 = worse than average, 4 = average, 5 = better than average, 6 = much better than average, 7 = superior).
Sca1: Sales growth Sca2: Market share growth Sca3: Net profit margin Sca4: Return on assets Sca5: Customer satisfaction Sca6: Customer retention
A6: Market Dynamism
Please consider your company’s Business Environment, and then indicate your agreement with each statement on a scale of 1 to 7.
Kr1: The reliance of our business on ‘Knowledge-Based Resources’ (e.g., a firm’s specialized skills,processes, technical and managerial systems, and know-hows) has been significant.
Kr2: In dealing with our competitors, our company tends to sustain our competitive edge bystrengthening ‘Knowledge-Based Resources.’
Kr3: Our company has a strong position regarding technical expertise compared to our competitors.Kr4: Our company has a strong position regarding expertise in marketing compared to
our competitors.Kr5: Our company has a strong position regarding expertise in customer service compared to
our competitors.Kr6: Our company has a strong position regarding highly productive staffs compared to
our competitors.
Appendix A.5. Sustainable Competitive Advantage
Sustainability 2020, 12, 913 17 of 23
A2: Process Innovation Intensity
PROCESS Innovation is defined as the changes in the way that a firm produces products or services. Please consider your company’s PROCESS Innovation activities, and then indicate your agreement with each statement on a scale of 1 to 7.
PcI1: Our company’s PROCESS improvements during the last three years have been radical. PcI2: In dealing with our competitors, our company tends to sustain competitive advantages through more intensive PROCESS
innovations than our competitors. PcI3: In general, our company tends to be ahead of our competitors in introducing new or significantly improved PROCESSES
(e.g., information technology, productive process, and machinery and equipment) for producing products or services. PcI4: Our company has a superior capability to develop a new product or service in a shorter time compared to our competitors.
A3: Reliance on Property-based Resources
Property-based Resources are defined as resources that can be protected by property rights such as patent, ownership, contracts, copyrights, trademarks, and registered designs. Please consider your company’s Property-based Resources, and then indicate your agreement with each statement on a scale of 1 to 7.
Pr1: The reliance of our business on ‘Property-Based Resources’ (e.g., patent, ownership, contracts, copyrights, trademarks, and registered designs) has been significant.
Pr2: In dealing with our competitors, our company tends to sustain our competitive edge by strengthening “Property-Based Resources.”
Pr3: Our company tends to introduce new products or services into the market more frequently than our competitors. Pr4: Our company is superior to our competitors in terms of product variety. Pr5: Our product brands are typically considered more prestigious than those of our competitors. Pr6: Our company is well known by our customers for dominant legal properties such as registered designs, technical patents,
and copyrights.
A4: Reliance on Knowledge-based Resources
Knowledge-based Resources are defined as resources that can be protected by knowledge barriers such as a firm’s specialized skills, processes, technical and managerial systems, and know-hows that cannot easily be identified or imitated by market competitors. Please consider your company’s Knowledge-based Resources, and then indicate your agreement with each statement on a scale of 1 to 7.
Kr1: The reliance of our business on ‘Knowledge-Based Resources’ (e.g., a firm’s specialized skills, processes, technical and managerial systems, and know-hows) has been significant.
Kr2: In dealing with our competitors, our company tends to sustain our competitive edge by strengthening ‘Knowledge-Based Resources.’
Kr3: Our company has a strong position regarding technical expertise compared to our competitors. Kr4: Our company has a strong position regarding expertise in marketing compared to our competitors. Kr5: Our company has a strong position regarding expertise in customer service compared to our competitors. Kr6: Our company has a strong position regarding highly productive staffs compared to our competitors.
A5: Sustainable Competitive Advantage
Please consider your firm’s performance over the last three years, and then indicate your opinion about how your firm’s performance compares with its competition in your industry on a scale of 1 to 7 (e.g., 1 = low end of the industry, 2 = much worse than average, 3 = worse than average, 4 = average, 5 = better than average, 6 = much better than average, 7 = superior).
Sca1: Sales growth Sca2: Market share growth Sca3: Net profit margin Sca4: Return on assets Sca5: Customer satisfaction Sca6: Customer retention
A6: Market Dynamism
Please consider your company’s Business Environment, and then indicate your agreement with each statement on a scale of 1 to 7.
Sca1: Sales growthSca2: Market share growth
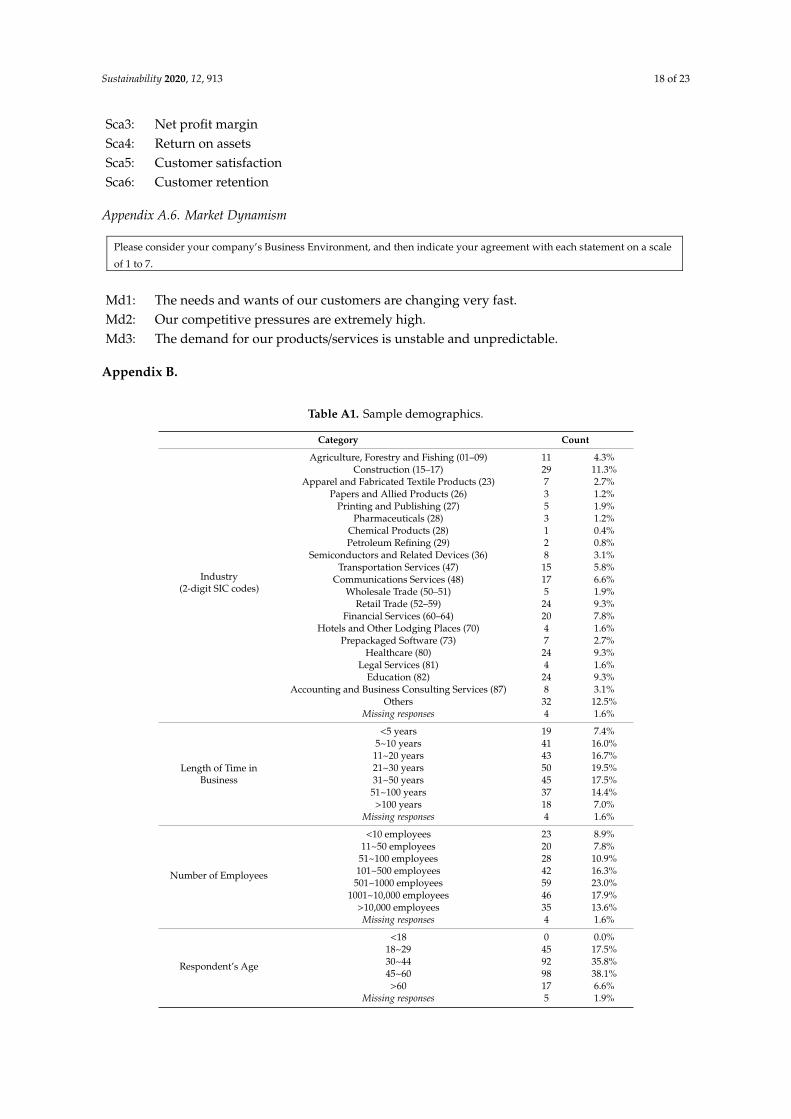
Sustainability 2020, 12, 913 18 of 23
Sca3: Net profit marginSca4: Return on assetsSca5: Customer satisfactionSca6: Customer retention
Appendix A.6. Market Dynamism
Sustainability 2020, 12, 913 17 of 23
A2: Process Innovation Intensity
PROCESS Innovation is defined as the changes in the way that a firm produces products or services. Please consider your company’s PROCESS Innovation activities, and then indicate your agreement with each statement on a scale of 1 to 7.
PcI1: Our company’s PROCESS improvements during the last three years have been radical. PcI2: In dealing with our competitors, our company tends to sustain competitive advantages through more intensive PROCESS
innovations than our competitors. PcI3: In general, our company tends to be ahead of our competitors in introducing new or significantly improved PROCESSES
(e.g., information technology, productive process, and machinery and equipment) for producing products or services. PcI4: Our company has a superior capability to develop a new product or service in a shorter time compared to our competitors.
A3: Reliance on Property-based Resources
Property-based Resources are defined as resources that can be protected by property rights such as patent, ownership, contracts, copyrights, trademarks, and registered designs. Please consider your company’s Property-based Resources, and then indicate your agreement with each statement on a scale of 1 to 7.
Pr1: The reliance of our business on ‘Property-Based Resources’ (e.g., patent, ownership, contracts, copyrights, trademarks, and registered designs) has been significant.
Pr2: In dealing with our competitors, our company tends to sustain our competitive edge by strengthening “Property-Based Resources.”
Pr3: Our company tends to introduce new products or services into the market more frequently than our competitors. Pr4: Our company is superior to our competitors in terms of product variety. Pr5: Our product brands are typically considered more prestigious than those of our competitors. Pr6: Our company is well known by our customers for dominant legal properties such as registered designs, technical patents,
and copyrights.
A4: Reliance on Knowledge-based Resources
Knowledge-based Resources are defined as resources that can be protected by knowledge barriers such as a firm’s specialized skills, processes, technical and managerial systems, and know-hows that cannot easily be identified or imitated by market competitors. Please consider your company’s Knowledge-based Resources, and then indicate your agreement with each statement on a scale of 1 to 7.
Kr1: The reliance of our business on ‘Knowledge-Based Resources’ (e.g., a firm’s specialized skills, processes, technical and managerial systems, and know-hows) has been significant.
Kr2: In dealing with our competitors, our company tends to sustain our competitive edge by strengthening ‘Knowledge-Based Resources.’
Kr3: Our company has a strong position regarding technical expertise compared to our competitors. Kr4: Our company has a strong position regarding expertise in marketing compared to our competitors. Kr5: Our company has a strong position regarding expertise in customer service compared to our competitors. Kr6: Our company has a strong position regarding highly productive staffs compared to our competitors.
A5: Sustainable Competitive Advantage
Please consider your firm’s performance over the last three years, and then indicate your opinion about how your firm’s performance compares with its competition in your industry on a scale of 1 to 7 (e.g., 1 = low end of the industry, 2 = much worse than average, 3 = worse than average, 4 = average, 5 = better than average, 6 = much better than average, 7 = superior).
Sca1: Sales growth Sca2: Market share growth Sca3: Net profit margin Sca4: Return on assets Sca5: Customer satisfaction Sca6: Customer retention
A6: Market Dynamism
Please consider your company’s Business Environment, and then indicate your agreement with each statement on a scale of 1 to 7.
Md1: The needs and wants of our customers are changing very fast.Md2: Our competitive pressures are extremely high.Md3: The demand for our products/services is unstable and unpredictable.
Appendix B.
Table A1. Sample demographics.
Category Count
Industry(2-digit SIC codes)
Agriculture, Forestry and Fishing (01–09) 11 4.3%Construction (15–17) 29 11.3%
Apparel and Fabricated Textile Products (23) 7 2.7%Papers and Allied Products (26) 3 1.2%
Printing and Publishing (27) 5 1.9%Pharmaceuticals (28) 3 1.2%
Chemical Products (28) 1 0.4%Petroleum Refining (29) 2 0.8%
Semiconductors and Related Devices (36) 8 3.1%Transportation Services (47) 15 5.8%
Communications Services (48) 17 6.6%Wholesale Trade (50–51) 5 1.9%
Retail Trade (52–59) 24 9.3%Financial Services (60–64) 20 7.8%
Hotels and Other Lodging Places (70) 4 1.6%Prepackaged Software (73) 7 2.7%
Healthcare (80) 24 9.3%Legal Services (81) 4 1.6%
Education (82) 24 9.3%Accounting and Business Consulting Services (87) 8 3.1%
Others 32 12.5%Missing responses 4 1.6%
Length of Time inBusiness
<5 years 19 7.4%5~10 years 41 16.0%
11~20 years 43 16.7%21~30 years 50 19.5%31~50 years 45 17.5%
51~100 years 37 14.4%>100 years 18 7.0%
Missing responses 4 1.6%
Number of Employees
<10 employees 23 8.9%11~50 employees 20 7.8%51~100 employees 28 10.9%
101~500 employees 42 16.3%501~1000 employees 59 23.0%
1001~10,000 employees 46 17.9%>10,000 employees 35 13.6%
Missing responses 4 1.6%
Respondent’s Age
<18 0 0.0%18~29 45 17.5%30~44 92 35.8%45~60 98 38.1%>60 17 6.6%
Missing responses 5 1.9%

Sustainability 2020, 12, 913 19 of 23
References
1. Cardozo, R.; McLaughlin, K.; Harmon, B.; Reynolds, P.; Miller, B. Product-market choices and growth of newbusinesses. J. Prod. Innov. Manag. 1993, 10, 331–340. [CrossRef]
2. Frambach, R.T.; Schillewaert, N. Organizational innovation adoption: A multi-level framework ofdeterminants and opportunities for future research. J. Bus. Res. 2002, 55, 163–176. [CrossRef]
3. Hall, J.; Vredenburg, H. The challenges of innovating for sustainable development. MIT Sloan Manag. Rev.2003, 45, 61–68.
4. Cho, H.J.; Pucik, V. Relationship between innovativeness, quality, growth, profitability, and market value.Strateg. Manag. J. 2005, 26, 555–575. [CrossRef]
5. Gunday, G.; Ulusoy, G.; Kilic, K.; Alpkan, L. Effects of innovation types on firm performance. Int. J. Prod. Econ.2011, 133, 662–676. [CrossRef]
6. Utterback, J.M.; Abernathy, W.J. A dynamic model of process and product innovation. Omega 1975, 3,639–656. [CrossRef]
7. Barras, R. Towards a theory of innovation in services. Res. Policy 1986, 15, 161–173. [CrossRef]8. Lawrence, P.R.; Lorsch, J.W. Differentiation and integration in complex organizations. Adm. Sci. Q. 1967, 12,
1–47. [CrossRef]9. Child, J. Organizational structure, environment and performance: The role of strategic choice. Sociology 1972,
6, 1–22. [CrossRef]10. Donaldson, L. Strategy and structural adjustment to regain fit and performance: In defense of contingency
theory. J. Manag. Stud. 1987, 24, 1–24. [CrossRef]11. Chandler, A.D. Strategy and structure. In The History of the Industrial Enterprise; MIT Press: Cambridge, MA,
USA, 1990; Volume 120.12. Porter, M.E. What is strategy? Harvard Business Review, November–December. 1996; 61–78.13. Hayes, R.; Pisano, G.; Upton, D.; Wheelwright, S. Operation, Strategy, and Technology: Pursuing the Competitive
Edge; John Wiley & Sons: Indianapolis, IN, USA, 2004.14. Gagnon, S. Resource-based competition and the new operations strategy. Int. J. Oper. Prod. Manag. 1999, 19,
125–138. [CrossRef]15. Barney, J.; Arikan, A. The resource-based view: Origins and implications. In The Blackwell Handbook of
Strategic Management; John Wiley & Sons: Hoboken, NJ, USA, 2005; pp. 124–188.16. Meredith, J.R.; Pilkington, A. Assessing the exchange of knowledge between operations management and
other fields: Some challenges and opportunities. J. Oper. Manag. 2018, 60, 47–53. [CrossRef]17. Gopalakrishnan, S.; Damanpour, F. A review of innovation research in economics, sociology and technology
management. Omega 1997, 25, 15–28. [CrossRef]18. Schroeder, R.G.; Scudder, G.D.; Elm, D.R. Innovation in manufacturing. J. Oper. Manag. 1989, 8, 1–15.
[CrossRef]19. Kim, D.Y.; Kumar, V.; Kumar, U. Relationship between quality management practices and innovation. J. Oper.
Manag. 2012, 30, 295–315. [CrossRef]20. Hsu, C.C.; Tan, K.C.; Jayaram, J.; Laosirihongthong, T. Corporate entrepreneurship, operations core
competency and innovation in emerging economies. Int. J. Prod. Res. 2014, 52, 5467–5483. [CrossRef]21. Capon, N.; Farley, J.U.; Lehmann, D.R.; Hulbert, J.M. Profiles of product innovators among large U.S.
manufacturers. Manag. Sci. 1992, 38, 157–169. [CrossRef]22. Jayaram, J.; Oke, A.; Prajogo, D. The antecedents and consequences of product and process innovation
strategy implementation in Australian manufacturing firms. Int. J. Prod. Res. 2014, 52, 4424–4439. [CrossRef]23. Knight, K.E. A descriptive model of the intra-firm innovation process. J. Bus. 1967, 40, 478–496. [CrossRef]24. Kaynak, H. Total Quality Management and Just-in-Time Purchasing: Their Effects on Performance of Firms Operating
in the U.S.; Garland Publishing: New York, NY, USA, 1997.25. Jajja, M.S.S.; Kannan, V.R.; Brah, S.A.; Hassan, S.Z. Linkages between firm innovation strategy, suppliers,
product innovation, and business performance: Insights from resource dependence theory. Int. J. Oper.Prod. Manag. 2017, 37, 1054–1075. [CrossRef]
26. Zhang, M.; Qi, Y.; Guo, H. Impacts of intellectual capital on process innovation and mass customisationcapability: Direct and mediating effects. Int. J. Prod. Res. 2017, 55, 6971–6983. [CrossRef]
27. De Propris, L. Types of innovation and inter-firm co-operation. Entrep. Reg. Dev. 2002, 14, 337–353. [CrossRef]

Sustainability 2020, 12, 913 20 of 23
28. Utterback, J.M. Mastering the Dynamics of Innovation; Harvard Business School Press: Boston, MA, USA, 1994.29. Koberg, C.S.; Detienne, D.R.; Heppard, K.A. An empirical test of environmental, organizational, and process
factors affecting incremental and radical innovation. J. High Technol. Manag. Res. 2003, 14, 21–45. [CrossRef]30. Kach, A.; Busse, C.; Azadegan, A.; Wagner, S.M. Maneuvering through hostile environments: How firms
leverage product and process innovativeness. Decis. Sci. 2016, 47, 907–956. [CrossRef]31. Abernathy, W.J.; Utterback, J.M. Patterns of industrial innovation. Technol. Rev. 1978, 80, 40–47.32. Bayus, B.L. Optimal dynamic policies for product and process innovation. J. Oper. Manag. 1995, 12, 173–185.
[CrossRef]33. Rothaermel, F.T. Strategic Management: Concepts and Cases; McGraw-Hill Irwin: New York, NY, USA, 2013.34. Damanpour, F.; Gopalakrishnan, S. The dynamics of the adoption of product and process innovations in
organizations. J. Manag. Stud. 2001, 38, 45–65. [CrossRef]35. Barras, R. Interactive innovation in financial and business services: The vanguard of the service revolution.
Res. Policy 1990, 19, 215–237. [CrossRef]36. Porter, M.E. Competitive Strategy: Techniques for Analyzing Industries and Competitors, 1st ed.; Free Press:
New York, NY, USA, 1980.37. Porter, M.E. Competitive Advantage; Free Press: New York, NY, USA, 1985.38. Donaldson, L. The Contingency Theory of Organizations; Sage Publications: Southend Oaks, CA, USA, 2001.39. Hayes, R.; Wheelwright, S.C. The dynamics of process-product life cycles. Harvard Business Review, March
1979; 127–136.40. Anderson, J.C.; Cleveland, G.; Schroeder, R.G. Operations strategy: A literature review. J. Oper. Manag. 1989,
8, 133–158. [CrossRef]41. Porter, M.E. Competition in Global Industries; Harvard Business School Press: Boston, MA, USA, 1986.42. Barney, J. Firm resources and sustained competitive advantage. J. Manag. 1991, 17, 99–120. [CrossRef]43. Barney, J. Gaining and Sustaining Competitive Advantage; Prentice Hall: Upper Saddle River, NJ, USA, 2002.44. Reed, R.; DeFillippi, R.J. Causal Ambiguity, Barriers to Imitation, and Sustainable Competitive Advantage.
Acad. Manag. Rev. 1990, 15, 88–102. [CrossRef]45. Peteraf, M.A. The cornerstone of competitive advantage: A resource-based view. Strateg. Manag. J. 1993, 14,
179–191. [CrossRef]46. Powell, T.C. Firm-specific competitive advantage in high technology firms. J. High Technol. Manag. Res. 1993,
4, 197–209. [CrossRef]47. Barney, J.B.; Hesterly, W.S. Strategic Management and Competitive Advantage: Concepts and Cases; Pearson:
Upper Saddle River, NJ, USA, 2006.48. Hitt, M.A.; Ireland, R.D.; Hoskisson, R.E. Strategic Management: Competitiveness & Globalization: Concepts, 9th
ed.; Cengage Learning: Mason, OH, USA, 2011.49. Wernerfelt, B. A resource-based view of the firm. Strateg. Manag. J. 1984, 5, 171–180. [CrossRef]50. Gouda, S.K.; Saranga, H. Sustainable supply chains for supply chain sustainability: Impact of sustainability
efforts on supply chain risk. Int. J. Prod. Res. 2018, 56, 5820–5835. [CrossRef]51. Conner, K. A historical comparison of resource-based theory and five schools of thought within industrial
organization economics: Do we have a new theory of the firm? J. Manag. 1991, 17, 121–154. [CrossRef]52. McEvily, S.K.; Chakravarthy, B. The persistence of knowledge-based advantage: An empirical test for product
performance and technological knowledge. Strateg. Manag. J. 2002, 23, 285–305. [CrossRef]53. Wiggins, R.R.; Ruefli, T.W. Sustained competitive advantage: Temporal dynamics and the incidence and
persistence of superior economic performance. Organ. Sci. 2002, 13, 82–105. [CrossRef]54. Grant, R.M. The resource-based theory of competitive advantage: Implications for strategy formulation.
Calif. Manag. Rev. 1991, 33, 114–135. [CrossRef]55. Das, T.K.; Teng, B. Resources and risk management in the strategic alliance making process. J. Manag. 1998,
24, 21–42. [CrossRef]56. Castanias, R.P.; Helfat, C.E. Managerial resources and rents. J. Manag. 1991, 17, 155–171. [CrossRef]57. Fiol, C.M. Managing culture as a competitive resource: An identity-based view of sustainable competitive
advantage. J. Manag. 1991, 17, 191–211. [CrossRef]58. Lado, A.A.; Boyd, N.G.; Wright, P. A Competency-based model of sustainable competitive advantage:
Toward a conceptual integration. J. Manag. 1992, 18, 77–91. [CrossRef]
Sustainability 2020, 12, 913 21 of 23
59. Miller, D.; Shamsie, J. The resource-based view of the firm in two environments: The Hollywood film studiosfrom 1936 to 1965. Acad. Manag. J. 1996, 39, 519–543.
60. Das, T.K.; Teng, B. A resource-based theory of strategic alliance. J. Manag. 2000, 26, 31–61. [CrossRef]61. Palmeri, C. Trader Joe’s Recipe for Success. Bloomberg Businessweek. 20 February 2008. Available online: https://
www.bloomberg.com/news/articles/2008-02-20/trader-joes-recipe-for-success (accessed on 15 January 2020).62. Llopis, G. Why Trader Joe’s Stands Out from All the Rest in the Grocery Business. Forbes. 5 September 2011.
Available online: https://www.forbes.com/sites/glennllopis/2011/09/05/why-trader-joes-stands-out-from-all-the-rest-in-the-grocery-business/#45d5286a4dec (accessed on 15 January 2020).
63. Krajewski, L.J.; Ritzman, L.P.; Malhotra, M.K. Operations Management: Processes and Supply Chains, 10th ed.;Pearson/Prentice Hall: Upper Saddle River, NJ, USA, 2013.
64. P&G 2012 Annual Report. Available online: http://annualreport.pg.com/annualreport2012 (accessed on15 January 2020).
65. P&G Company Website. Available online: http://www.pg.com/enUS/company/corestrengths.shtml (accessedon 30 April 2013).
66. Kang, J. A Study of the DRAM Industry. Master’s Thesis, Massachusetts Institute of Technology, Cambridge,MA, USA, 2010.
67. Bozarth, C.; Handfield, R.B. Introduction to Operations and Supply Chain Management, 4th ed.; Pearson:Upper Saddle River, NJ, USA, 2015.
68. Weerawardena, J. The role of marketing capability in innovation-based competitive strategy. J. Strateg. Mark.2003, 11, 15–35. [CrossRef]
69. Prajogo, D.I.; Sohal, A.S. The relationship between organization strategy, total quality management (TQM),and organization performance—The mediating role of TQM. Eur. J. Oper. Res. 2006, 168, 35–50. [CrossRef]
70. Gopalakrishnan, S.; Bierly, P.; Kessler, E.H. A reexamination of product and process innovations using aknowledge-based view. J. High Technol. Manag. Res. 1999, 10, 147–166. [CrossRef]
71. Atuahene-Gima, K.; Ko, A. An empirical investigation of the effect of market orientation and entrepreneurshiporientation alignment on product innovation. Organ. Sci. 2001, 12, 54–74. [CrossRef]
72. Real, K.; Poole, M.S. Innovation implementation: Conceptualization and measurement in organizationalresearch. Res. Organ. Chang. Dev. 2005, 15, 63–134.
73. Valle, S.; Vázquez-Bustelo, D. Concurrent engineering performance: Incremental versus radical innovation.Int. J. Prod. Econ. 2009, 119, 136–148. [CrossRef]
74. Ettlie, J.E.; Reza, E.M. Organizational integration and process innovation. Acad. Manag. J. 1992, 35, 795–827.75. Armstrong, C.E.; Shimizu, K. A review of approaches to empirical research on the resource-based view of
the firm. J. Manag. 2007, 33, 959–986. [CrossRef]76. Shepherd, D.A.; Wiklund, J. Entrepreneurial Small Businesses: A Resource-Based Perspective; Edward Elgar
Publishing: Northampton, MA, USA, 2005.77. Wernerfelt, B. The resource-based view of the firm: Ten years after. Strateg. Manag. J. 1995, 16, 171–174.
[CrossRef]78. Cho, Y.S.; Linderman, K. Metacognition-Based Process Improvement Practices. Int. J. Prod. Econ. 2019, 211,
132–444. [CrossRef]79. Guo, L.; Tobias, J.; Bendoly, E.; Hu, Y. Different departments, different drivers: Asymmetry in antecedents
and outcomes of voluntary knowledge exchange between sales and production functions. Int. J. Oper.Prod. Manag. 2017, 37, 1031–1053. [CrossRef]
80. Damanpour, F. Organizational size and innovation. Organ. Stud. 1992, 13, 375–402. [CrossRef]81. Martinez-Ros, E. Explaining the decisions to carry out product and process innovations: The Spanish case.
J. High Technol. Manag. Res. 1999, 10, 223–242. [CrossRef]82. Camisón-Zornoza, C.; Lapiedra-Alcamí, R.; Segarra-Ciprés, M.; Boronat-Navarro, M. A meta-analysis of
innovation and organizational size. Organ. Stud. 2004, 25, 331–361. [CrossRef]83. Kach, A.; Azadegan, A.; Wagner, S.M. The influence of different knowledge workers on innovation strategy
and product development performance in small and medium-sized enterprises. Int. J. Prod. Res. 2015, 53,2489–2505. [CrossRef]
84. Calantone, R.J.; Cavusgil, S.T.; Zhao, Y. Learning orientation, firm innovation capability, and firm performance.Ind. Mark. Manag. 2002, 31, 515–524. [CrossRef]

Sustainability 2020, 12, 913 22 of 23
85. Pagell, M.; Krause, D.R. A multiple-method study of environmental uncertainty and manufacturing flexibility.J. Oper. Manag. 1999, 17, 307–325. [CrossRef]
86. Zhang, D.; Linderman, K.; Schroeder, R.G. The moderating role of contextual factors on quality managementpractices. J. Oper. Manag. 2012, 30, 12–23. [CrossRef]
87. Dillman, D.A.; Smyth, J.D.; Christian, L.M. Internet, Phone, Mail and Mixed-Mode Surveys: The Tailored DesignMethod, 4th ed.; Wiley: New York, NY, USA, 2014.
88. Miller, D.; Toulouse, J.M. Chief executive personality and corporate strategy and structure in small firms.Manag. Sci. 1986, 32, 1389–1409. [CrossRef]
89. Zahra, S.A.; Covin, J.G. Business strategy, technology policy and firm performance. Strateg. Manag. J. 1993,14, 451–478. [CrossRef]
90. Craighead, C.W.; Ketchen, D.J.; Dunn, K.S.; Hult, G.T.M. Addressing common method variance: Guidelinesfor survey research on information technology, operations, and supply chain management. IEEE Trans.Eng. Manag. 2011, 58, 578–588. [CrossRef]
91. Wagner, S.M.; Bode, C. Supplier relationship-specific investments and the role of safeguards for supplierinnovation sharing. J. Oper. Manag. 2014, 32, 65–78. [CrossRef]
92. Escrig-Tena, A.B.; Segarra-Ciprés, M.; García-Juan, B.; Beltrán-Martín, I. The impact of hard and soft qualitymanagement and proactive behaviour in determining innovation performance. Int. J. Prod. Econ. 2018, 200,1–14. [CrossRef]
93. Miller, J.G.; Roth, A.V. A taxonomy of manufacturing strategies. Manag. Sci. 1994, 40, 285–304. [CrossRef]94. Cho, Y.S.; Jung, J.Y.; Linderman, K. The QM Evolution: Behavioral Quality Management as a Firm’s Strategic
Resource. Int. J. Prod. Econ. 2017, 191, 233–249. [CrossRef]95. Podsakoff, P.M.; MacKenzie, S.B.; Lee, J.Y.; Podsakoff, N.P. Common method biases in behavioral research: A
critical review of the literature and recommended remedies. J. Appl. Psychol. 2003, 88, 879–903. [CrossRef][PubMed]
96. Armstrong, J.S.; Overton, T.S. Estimating nonresponse bias in mail surveys. J. Mark. Res. 1977, 14, 396–402.[CrossRef]
97. Akgün, A.E.; Ince, H.; Imamoglu, S.Z.; Keskin, H.; Kocoglu, I. The mediator role of learning capability andbusiness innovativeness between total quality management and financial performance. Int. J. Prod. Res.2014, 52, 888–901. [CrossRef]
98. Prajogo, D.; Mena, C.; Nair, A. The fit between supply chain strategies and practices: A contingency approachand comparative analysis. IEEE Trans. Eng. Manag. 2018, 65, 168–180. [CrossRef]
99. Segars, A.H.; Grover, V. Strategic information systems planning success: An investigation of the constructand its measurement. MIS Q. 1998, 22, 139–163. [CrossRef]
100. Byrne, B.M. Structural Equation Modeling with LISREL, PRELIS, and SIMPLIS: Basis Concepts, Application andProgramming; Lawrence Erlbaum Associates Inc.: Mahwah, NJ, USA, 1998.
101. Mulaik, S.A.; James, L.R.; Van Altine, J.; Bennett, N.; Lind, S.; Stilwell, C.D. Evaluation of goodness-of-fitnessindices for structural equation models. Psychol. Bull. 1989, 105, 430–445. [CrossRef]
102. Bentler, P.M.; Bonett, D.G. Significance tests and goodness of fit in the analysis of covariance structures.Psychol. Bull. 1980, 88, 588–606. [CrossRef]
103. Bollen, K.A.; Long, J.S. Testing Structural Equation Models; Sage Publications: Thousand Oaks, CA, USA, 1993.104. Hair, J.F.; Black, W.C.; Babin, B.J.; Anderson, R.E. Multivariate Data Analysis, 7th ed.; Pearson: Upper Saddle
River, NJ, USA, 2010.105. Cronbach, L.J. Coefficient alpha and the internal structure of tests. Psychometrika 1951, 16, 297–334. [CrossRef]106. Fornell, C.; Larcker, D.F. Evaluating structural equation models with unobservable variables and measurement
error. J. Mark. Res. 1981, 18, 39–50. [CrossRef]107. Dubey, R.; Gunasekaran, A.; Ali, S.S. Exploring the relationship between leadership, operational practices,
institutional pressures and environmental performance: A framework for green supply chain. Int. J.Prod. Econ. 2015, 160, 120–132. [CrossRef]
108. Prajogo, D.I.; Sohal, A.S. The multidimensionality of TQM practices in determining quality and innovationperformance-an empirical examination. Technovation 2004, 24, 443–453. [CrossRef]
109. Hinkle, D.E.; Wiersma, W.; Jurs, S.G. Applied Statistics for the Behavioral Sciences, 5th ed.; Cengage Learning:Belmont, CA, USA, 2003.

Sustainability 2020, 12, 913 23 of 23
110. Scott, W.R.; Davis, G. Organizations and Organizing: Rational, Natural and Open System Perspectives; PearsonPrentice-Hall: Upper Saddle River, NJ, USA, 2007.
111. Baldwin, W.L.; Scott, J.T. Market Structure and Technological Change; Psychology Press: London, UK, 1987.112. Fisher, R.J.; Price, L.L. An investigation into the social context of early adoption behavior. J. Consum. Res.
1992, 19, 477–486. [CrossRef]113. Porter, M.E. The five competitive forces that shape strategy. Harv. Bus. Rev. 2008, 86, 78–93. [PubMed]114. Aldieri, L.; Vinci, C. Green economy and sustainable development: The economic impact of innovation on
employment. Sustainability 2018, 10, 3541. [CrossRef]115. Aldieri, L.; Makkonen, T.; Vinci, C.P. Spoils of innovation? Employment effects of R&D and knowledge
spillovers in Finland. Econ. Innov. New Technol. 2019, 1–15. [CrossRef]116. OECD. Oslo Manual 2018: Guidelines for Collecting, Reporting and Using Data on Innovation, 4th ed.;
OECD Publishing: Paris, France; Eurostat: Luxembourg, 2018.
© 2020 by the authors. Licensee MDPI, Basel, Switzerland. This article is an open accessarticle distributed under the terms and conditions of the Creative Commons Attribution(CC BY) license (http://creativecommons.org/licenses/by/4.0/).