resilience pathways: the ford motor company case - anzam
TRANSCRIPT
Resilience Pathways: The Ford Motor Company Case
Dr Elena Mamouni Limnios
UWA Business School, University of Western Australia, Crawley, Australia
Email: [email protected]
Professor Tim Mazzarol
UWA Business School, University of Western Australia, Crawley, Australia and Burgundy
School of Business, Groupe ESC Dijon Bourgogne, France
Email: [email protected]
Page 1 of 31 ANZAM 2011
Page 1
RESILIENCE PATHWAYS: THE FORD MOTOR CO. CASE
ABSTRACT
This paper offers a historical analysis of organizational resilience within the Resilience Architecture
framework that allows for a dual conceptualization of resilience as either adaptation or resistance to
change. We develop a set of resilience determinants that allow system classification and then apply a
process strategy to construct the Resilience Architecture of Ford Motor Company from 1903 to 1945.
The historical case illustrates a dynamic use of the framework in addition to its static configuration.
We offer suggestions for practitioners for the stimulation of desirable future trajectories and conclude
that further case study analysis at corporate and industry levels would improve our understanding of
system trajectories, building on the potential predictive capacity of this dynamic analysis tool.
Keywords: resilience, Ford Motor Company, strategic decision-making, strategy and structure, organizational change, transformation.
INTRODUCTION
Resilience has been inadequately theorized in the organisational context, generally approached as a
social skill of an individual or a group of people (Horne 1997; Mallak 1998; Coutu 2002; Riolli and
Savicki 2003), or used in corporate strategy as a residual to study phenomena of unexpected
organisational success or failure (Sutcliffe and Vogus 2003). In this article we present a first
application of the Resilience Architecture framework applied to a case study of the early years of the
Ford Motor Company. We aim to ground the theoretical construct empirically, illustrating the
framework’s applicability. We examine the literature of complex socio-ecological systems to develop
a set of resilience determinants that can be used to classify corporate systems within the framework. A
process based methodology is then used to analyse the historical development of Ford Motor
Company from 1903 to 1945. The exploratory case contributes to the advancement of the theoretical
model, introducing a dynamic framework configuration. We conclude with the presentation of
theoretical propositions that have surfaced from this case study, providing stimulation for further
scientific enquiry.
ORGANISATIONAL RESILIENCE IN STRATEGIC MANAGEMENT
Current models of linear corporate assessment have limited predictive capacity, commonly failing to
provide adequate warning signs of forthcoming system collapse. In addition, they encourage
organisational learning through exploitation (improving efficiency of existing skills) in contrast to
Page 2 of 31ANZAM 2011
Page 2
exploration. Although more efficient and successful in the short run, such managerial practice can
lead to the development of rigid monocultures, ultimately triggering corporate failure (March 1991;
Miller 1990; 1993). Such managerial failures also take place at larger scales, with the recent example
of the 2008 global financial crisis, climate change and the pertaining socio-economic challenges
facing the developing world.
The ability of a firm to successfully navigate a path through a complex competitive environment has
been examined with reference to its dynamic capabilities (Teece, Pisano and Shuen 1997). These path
dependencies offer a means of coping with complex contingencies in the firm’s evolutionary cycle
(Eriksson, Majkgard and Sharma 2000). The paths that are followed by the firm in its evolutionary
cycle flow like a river and are best understood via historical case analysis (Lamberg and Parvinen
2003; Mintzberg 1978). However, the ability to plan systematically and strategically in a complex,
uncertain environment has raised serious questions as to whether the strategic management is even
possible (Grant 2003).
Advancements in complex socio-ecological systems research have highlighted the need for alternative
assessment methods and management paradigms, and resilience has surfaced as a promising body of
theory in this direction (Holling 2001). Proponents of this concept highlight the risks of
oversimplification of complex interrelations between system components. Forcing the system towards
the direction of increased potential or system wealth affects the system’s internal structure,
influencing its ability to reorganize and adapt to internal or external change.
<Insert Table 1 about here>
Already well-established within the field of socio-ecological research and ecological economics,
resilience has begun to achieve greater recognition with the organizational management discipline.
Some conceptualizations of organizational resilience have been influenced by the engineering
definition of robustness, recognizing a single stable state where the system can return after
perturbation. Such approaches commonly approach resilience as a psychological or behavioral
attribute that is applied at the individual or collective behavioural level ( Avey et al 2011; Brodsky et
al 2011; Luthans and Youssef 2007; Sutcliffe and Vogus 2003; Riolli and Savicki 2003; Coutu 2002;
Mallak 1998; Horne 1997) rather than examined as an organizational characteristic.
Page 3 of 31 ANZAM 2011
Page 3
More recently resilience has been studied as a means of understanding the longevity of firms (Hamel
and Valikangas 2003). Resilience in that line of work is closely related to complexity logic and the
concept of “adaptive management” with applications in human resources management (Lengnick-Hall
and Beck 2005; Lengnick-Hall et al. 2011), strategic change management (Hamel and Valikangas
2003; Dervitsiotis 2003), as well as disaster management and corporate adaptation to environmental
change (Sullivan-Taylor and Wilson 2009; Korhonen and Seager 2008) . Chakravarthy’s (1982)
conceptualisation of “adaptive fit” in which the firm moves between three states of instability,
stability and neutrality which conform to the defensive (Defender), reactive (Analyser) and proactive
(Prospector) strategic types of Miles and Snow (1978) can be seen as an initial attempt to understand
the firm’s behaviour within its task environment. However, as Lengnick-Hall and Beck (2005)
observe; “Adaptive fit does not adequately accommodate the full range of environmental conditions
that organizations encounter”.
Although definitions of organizational resilience differ, the concept has always been approached as a
positive and desirable characteristic. Although that is also the case in the majority of socio-ecological
systems literature (Folke et al. 2005; Lebel et al. 2006; Liu et al. 2007), some researchers have
highlighted that unlike sustainability, resilience can be desirable or undesirable depending on the
system state (Carpenter et al. 2001; Mamouni Limnios 2008; Derissen et al 2011). An organization
can be resilient due to its adaptive capacity, where the organization effectively reacts to disturbance
by changing its structure, processes and functions in order to increase its ability to persist. However,
an organization may also be very resilient due to its ability to resist change and maintain its current
structure and processes. In this case the system is able to tolerate disturbance and absorb shocks rather
than adapt to change. Differentiating between these two opposing manifestations of resilience as
adaptation or resistance to internal or external disturbance is critical, especially in organizational
systems, where these attributes assume a strategic character and can be influenced and adjusted upon
a better understanding of the system state and condition.
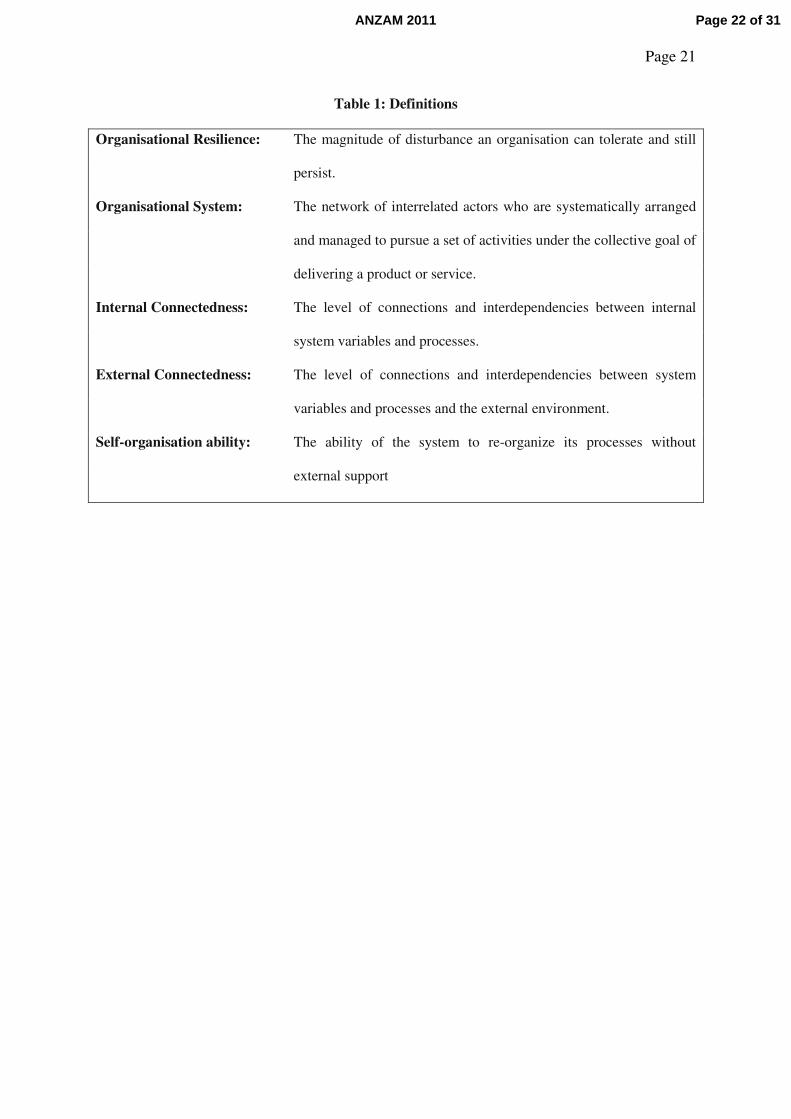
The Resilience Architecture framework (Figure 1) provides a mechanism for understanding and
tracking the behaviour patterns of firms, allowing for a dual conceptualization of resilience that can be
Page 4 of 31ANZAM 2011
Page 4
associated both with adaptability or rigidity and can thus be a more or less desirable characteristic,
depending on the system state.
<Insert Figure 1 about here>
For example, highly polluted ecosystems, political dictatorships (Carpenter et al. 2001), or very large
and bureaucratic companies (Mamouni Limnios 2008) can be very hard to enter a phase of change
and can thus maintain their dysfunctional state for long periods of time. Such systems operate in the
rigidity quadrant, exhibiting high levels of resilience due to an increased ability to resist change and
persist. The other extreme is systems with highly satisfied stakeholders, however very vulnerable to a
number of critical parameters, internal or external system conditions. Such systems operate in the
vulnerability quadrant and while their situational dependence is concealed, they can temporarily
disguise their vulnerability. Systems in the adaptability quadrant are resilient due to a combination of
cognitive, behavioural, and contextual factors that enable organization to mobilize people, resources,
and processes to interpret unfamiliar situations and devise new ways of confronting these events
(Lengnick-Hall and Beck 2005). Finally, systems exhibiting low resilience and low desirability of
system state face an uncertain future. Organizations commonly operate in this quadrant in their early
stages or when undergoing a major restructure.
ASSESSING RESILIENCE
The consistency of classification within the RA framework is dependent upon a consistent approach
for assessing resilience levels. Research in socio-ecological systems indicates that a system’s
resilience is controlled by a few key system variables. In the case of ecological resilience these
variables are slow changing (e.g. soil, sediment concentrations, or long-lived organisms), whereas
social resilience can be controlled by either slow (e.g. culture) or fast-changing variables (e.g.
technology) (Walker et al 2006). When a threshold level of a controlling variable is crossed, the
system shifts to a different structural and functional state, a different system regime. Despite the
importance of these variables and their respective thresholds as drivers of regime shifts, they are
highly system and context specific and thus their applicability is limited for cross-disciplinary work.
Furthermore, resilience as a dynamic property depends on various system characteristics, which can
alter the position of a threshold along a determining variable, as well as change the difficulty by
Page 5 of 31 ANZAM 2011
Page 5
which the system may approach the threshold. The following research questions therefore arise: Is a
threshold an emergent property of some underlying set of attributes of a system? Is there a
relationship, for example, between the network topology of a system and the likelihood of a threshold
(Walker and Meyers 2004)?
Following this line of thinking we shift the focus of enquiry from identifying system-specific
controlling variables and thresholds to examining the underlying system characteristics that impact on
the systems’ resilience. We have conducted a preliminary examination of relevant works in socio-
ecological systems (See Table 2), in order to provide a proposition in this direction that can be used to
evaluate organisational systems’ resilience and facilitate placement within the Resilience Architecture
framework. Six key issues for the study and evaluation of resilience have emerged: (1) connectivity
among strategic actors; (2) power distribution in the strategic network; (3) management structure
including leadership style and capacity for self-organisation; (4) processes of learning and innovation;
(5) capital flows in the network; and (6) levels of trust among stakeholders.
<Insert Table 2 about here>
Resilience determinants
Systems connectivity, centrality and self-organisation are the structural elements of the network. In
the case of the corporate system we define connectivity as the existence of connections between actors
(stakeholders) in the corporate network, centrality as the power distribution within the network and
self-organisation as the ability of the corporate system to self-organize without external influence.
These concepts have appeared in a variety of organisational literature streams, including corporate
performance and strategic decision making.
Centrality at group, intra-organisational and inter-organisational levels affects the evolution of
hierarchy, the power structure that controls strategic interdependencies and valued resources (Boje
and Whetten 1981). It is furthermore associated with influence in decision making (Friedkin 1993),
innovation (Ibarra 1993) and individual and group performance (Sparrowe et al. 2001). Connectivity
within the corporate system can have multiple dimensions, i.e. technical, interpersonal, group,
organisational, network, economic and cultural (Kolb 2008). Organisational relations to task
environment and institutional constituents within the organisational network have been widely
Page 6 of 31ANZAM 2011
Page 6
recognised as determinants of organisational performance and survival (Baum and Oliver 1991;
Oliver 1997). Furthermore, connectivity has also been examined as a public good produced by multi-
firm, alliance-based networks (Monge et al. 1998). It has introduced a new stream of research in the
area of organisational culture, with a special focus in the cultural complexity of merger and
acquisition dynamics (Angwin and Vaara 2005). It has recently been defined as a central concept in
organisational systems thinking; a determinant of analysis, planning and decision making (Mason
2005). Finally, self-organisation has been widely examined in economics and within corporate
systems it is recognized as a key component for understanding transformative change (Lichtenstein
2000). In addition to that, self-organisation is also related to the innovative capacity of an
organisational network (Rycroft and Kash 2004).
The functional determinants of resilience are; capital flow, learning and trust within the network.
Research in the areas of corporate management has widely examined adaptive learning processes in
organisational settings, while trust has been recognized as the core mechanism for lowering
transaction costs, thus making strategic networks economically viable (Jarillo 1993). Furthermore, the
generation of above-normal rates of return from various tangible and intangible forms of capital has
been the focus of analysis and competitive advantage by the resource-based view of the firm. The
parameter of capital flows may include various elements of capital transformations within the
corporate network, such as financial capital flows, information flows, social, cultural and ecological
diversity, pollution generation, rehabilitation or the transformation of economic value.
FORD MOTOR CASE ANALYSIS
We sought a historical application instead of two or three snapshot corporate studies, as it would
allow us to capture the dynamics of change over time. Such an exploratory case study provides insight
in the direction and causality of movement between the quadrants. The subject and period of
application were selected based on three criteria; being a highly publicized company, passing through
highly turbulent periods of time, and influencing a large number of stakeholders.
In order to answer the question of “how” do these resilience determinants influence a firm’s ability to
tolerate disturbance and still persist, we applied a process mode of enquiry. An event-driven approach
was followed, observing and analysing the sequence of events in the organisation’s historical
Page 7 of 31 ANZAM 2011
Page 7
development (Van de Ven and Poole 1995; Van de Ven and Engleman 2004). Quantitative data
analysis is applied for an initial classification and identification of movement within the framework,
followed by a narrative explanation of the transformational dynamics.
Data collection and coding
Nontechnical literature including referenced publications (Nevins 1954; Nevins & Hill 1957, 1963;
Watts 2005), Henry Ford’s writings and other company records and reports were used as primary
data, allowing for triangulation of information in order to construct the history of the firm from
foundation (1903) to 1945. Scoring of the histories of organisations in order to construct a consistent
database for studies spanning long periods of time has been conducted in the past; the work of Miller
and Friesen (1977; 1980; 1983) being a characteristic example of such an approach applied in the
field of corporate management and lifecycle analysis. We conducted open coding (Strauss and Corbin
1998), analysing our sources at various scales in order to identify and compare incidents and event
categories that could be grouped within our predefined categories of resilience and desirability of
system state. Comparative analysis allowed a scoring of twelve variables (system desirability from the
perspectives of 1) customers, 2) shareholders, 3) employees, 4) Ford dealers, 5) the wider community;
6) internal connectivity; 7) power distribution; 8) self-organisation; 9) leadership; 10) capital flows;
11) learning and 12) trust) and therefore an emergence of the phenomena of desirability of system
state (variables 1 to 5) and organisational resilience (variables 6 to 12) from the data. Scoring was
performed on a 10-point scale, and corresponded to each event for the respective point in time that the
event took place.
In order to assess the desirability of the system state, scores were assigned according to whether the
events indicated that variables in this period were much higher (10), much lower (1), or about the
same as in previous periods. When assessing resilience variables, the concept of “higher” or “lower”
is substituted by an assessment of the proximity of the variable to its optimum level that would lead to
long-term survival. So for example, high centrality in the decision making structure leading to
inefficiency in operations was rated as being far from the optimum levels, and thus being indicative of
lower levels of resilience. A list of the constructed historical events is included as an Appendix. Some
of the listed events were only used as historical points, adding to the context of analysis, being neither
Page 8 of 31ANZAM 2011
Page 8
indicators of stakeholder satisfaction, nor resilience. Our analysis is based on a number of works,
which was regarded sufficient for the purpose of investigation, as we in no way seek to present a
definitive historical analysis of the company.
CASE ANALYSIS
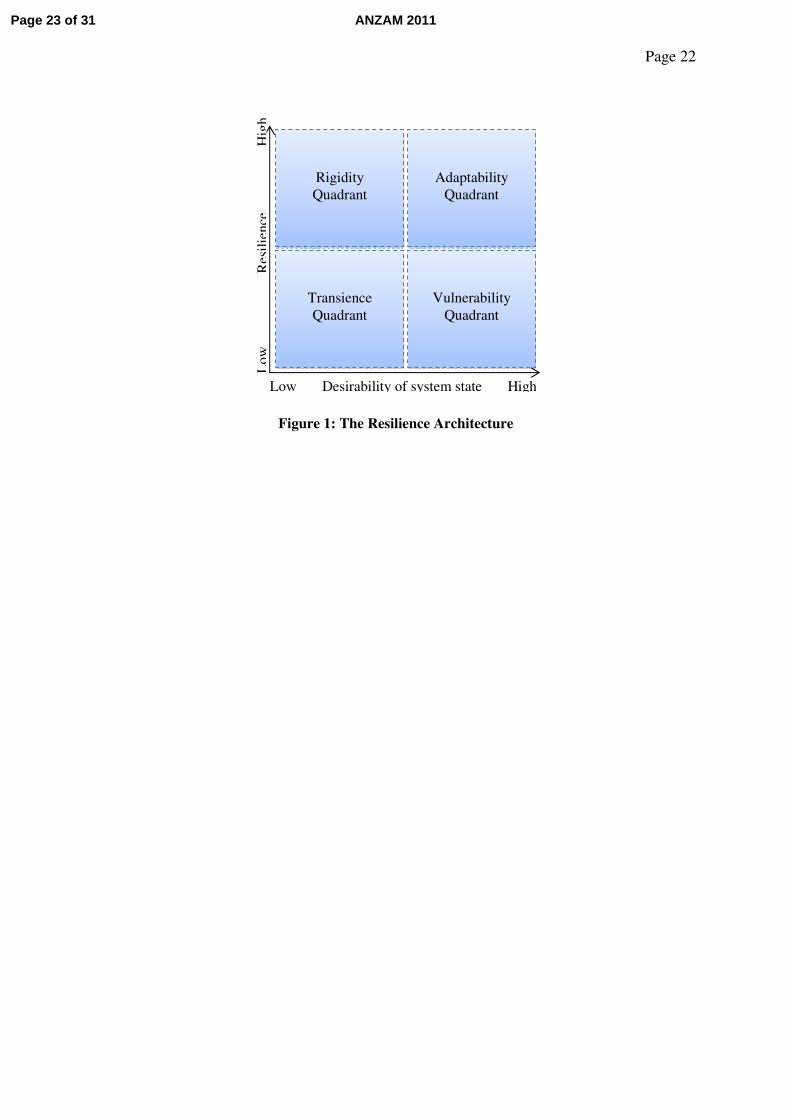
Figure 2 illustrates the Ford Motor Company Timeline of events and the respective levels of
stakeholder satisfaction and resilience in each time period.
<Insert Figure 2 about here>
The identified clusters are used to make an initial categorization of the company in quadrants using
the Resilience Architecture model. The mean and standard deviation of each cluster is presented. It is
identified that from 1903 to 1905 the company operates in the transience quadrant, displaying low
levels of resilience and stakeholder satisfaction. For a short period it passes from the vulnerability
quadrant, as the stakeholder satisfaction increases, however resilience is still low. Upon an internal
restructure at the end of this period Ford Motor Company enters the adaptability quadrant
approximately in 1908 and until 1919, where high levels of resilience and stakeholder satisfaction are
observed. In the 1920s and 1930s, stakeholder satisfaction drops dramatically, as well as some aspects
of resilience. However the company is still resilient enough to maintain large size of operations and
significant amount of market segment and sales. In this period of time the company therefore operates
in rigidity quadrant, experiencing high rigidity, falling in the trap of pseudo-resilience. An effort to
transform in 1927-28 does not succeed, as the company returns in quadrant D. The Ford Motor
Company entered an extensive transformation stage only upon Henry Ford’s succession by Henry II
in 1945.
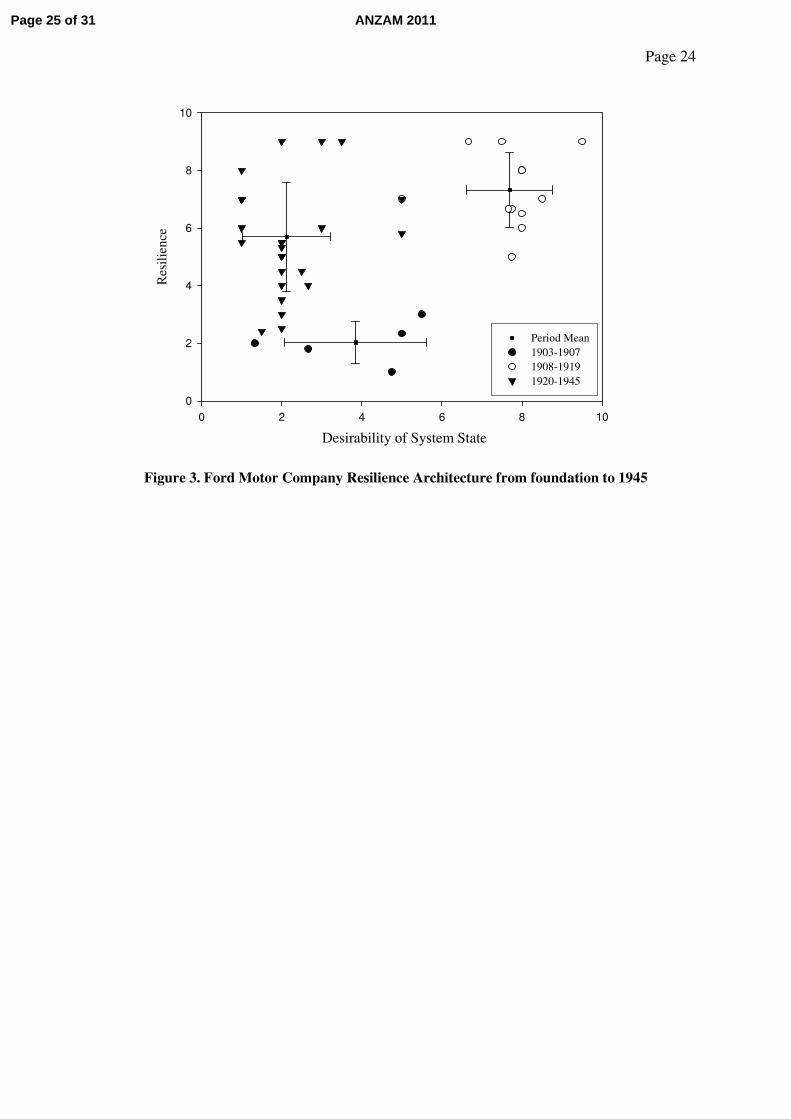
<Insert Figure 3 about here>
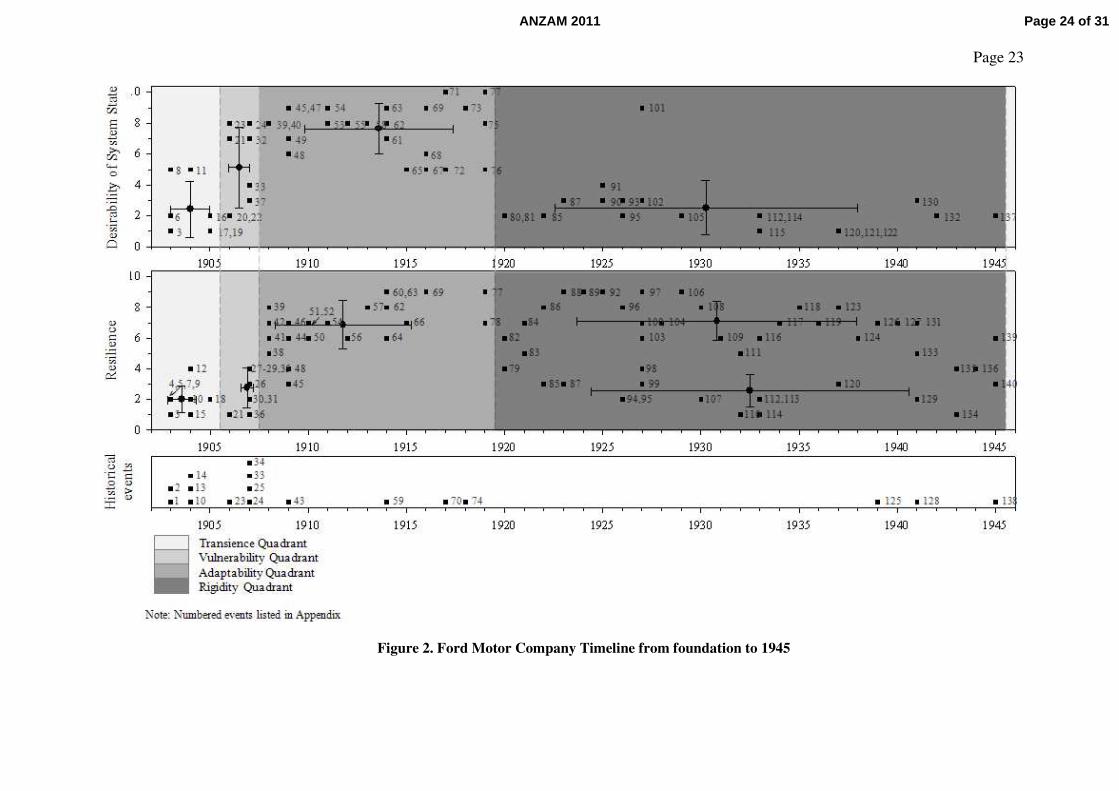
Average yearly estimates of stakeholder satisfaction and resilience are computed in order to construct
the Resilience Architecture are shown in Figure 3. The passage from the vulnerability quadrant in the
period 1906-1907 that was illustrated in Figure 2 is not as evident in Figure 3. This may be due to the
limited data points, as the use of yearly averages results in only two data points for this period, with
an average level of resilience not exceeding level 6. It was therefore decided to group the two first
clusters into one, period 1903-1907. A short qualitative analysis of the results is provided below,
Page 9 of 31 ANZAM 2011
Page 9
aiming to synthesize and interpret the identified events within the particular socio-economic context
of each period.
1903-1907: Challenge
The Ford Motor Company was founded in June 1903 with Ford and Malcomson being the two
principals of 12 partners (Ford Motor Company Archives 1903). These first years stakeholder
satisfaction and the desirability of the system state grew steadily, however the necessary structures
and functions were not yet developed and the company was still at the time vulnerable to
disturbances, facing an uncertain future.
Ford provided the technical expertise and Malcomson the financial backing. The car model was ready
for production prior to the foundation of the company, as Ford’s two previous car manufacturing
companies had failed to bring a product to market, leading to bankruptcy (Nevins 1954). The
company could finance itself from the first year of operation (Nevins 1954) and corporate
management was constantly investing throughout these years in plant expansions, human capital and
product improvements. By 1907 one chassis was used for all car models in order to minimize costs
and vanadium steel was used in construction to reduce the weight, but still produce a strong vehicle
(Ford 1923).
However a lengthy court case (where Ford denied complying with royalty payments against a
registered patent for a motor vehicle) and plans for expansion put the company under severe economic
strain. Furthermore, there were some drawbacks as the vision of manufacturing a light and cheap
vehicle was not consolidated and the company was experimenting with the manufacturing of larger,
luxurious models. The foundation of The Ford Manufacturing Company affected cash flows,
absorbing The Ford Motor Company profits (Nevins 1954). That was an intentional move by Henry
Ford to dilute profit and eventually manage to buy off stockholders that did not share his vision,
which took place in 1906 leaving Henry Ford as the majority stockholder of The Ford Motor
Company (Nevins 1954).
Production costs were outpacing profits in 1906-07 and the company did not manage to fulfil its
promise of bringing a car to the market for only $US 500 (Ford Motor Company Archives 1906).
Paydays were several times postponed in the fall of 1907, the company covered bills with notes
Page 10 of 31ANZAM 2011
Page 10
instead of cash and they were sending cars to dealers demanding payment upon receipt and not upon
sale, shifting the financial burden further down the chain (Ford Motor Company Archives a). Less
efficient car manufacturers and manufacturers of expensive cars suffered an even greater impact,
leading to a number of bankruptcies in 1907 (Nevins 1954). The Ford Motor Company survived the
crisis of 1907, after which the investments in structure and efficiency of operations started to pay
back. After consolidation with The Ford Manufacturing Company, the centrality of The Ford Motor
Company grew and operations connectivity improved as all machinery was moved together and
rearranged to increase operations efficiency (Nevins 1954). The buyout of minority stakeholders in
1906-07 and streamlining of corporate structure and leadership was vital to allow the resilience of the
company to increase in the following period.
1908-1919: Growth
The passage through the transience and vulnerability quadrants was very short, as Ford Motor
Company entered the adaptability quadrant within only five years from its foundation. As Henry Ford
later mentioned the first five years were an “experimenting period” (Ford 1923: 59), after which he
had clarified his vision. His vision “to build a motor car for the great multitude” (Ford 1923: 73), a
cheap and reliable car that the average American family could afford, guided the formulation of his
success strategy. This was supported by the right human, financial and physical capital structure of the
company and a balance of exploration and exploitation in organisational learning. The technological
advancements of the assembly line established The Ford Motor Company as a leader in the industry,
but also as a significant contributor to the manufacturing industry advancements and to the American
victory in the First World War.
The connectivity between the company, its employees and the external stakeholders was maintained
through the issue of The Ford Times, a company magazine first issued in 1908 and distributed at all
Ford dealerships across the country (Nevins 1954). This was complemented and strengthened even
further by independent press coverage of the company’s achievements and Henry Ford’s personal and
political life. The centrality of Ford Motor Company in the American car manufacturing network was
evident by their volume of production and sales that was dominating the market. In 1916 the Model
T’s manufactured accounted for 32 percent of all cars manufactured in the US, rising to 40 percent by
Page 11 of 31 ANZAM 2011
Page 11
1919 (Nevins and Hill 1957). The Ford Motor Company also played a central role for the Americans
during their involvement in the First World War, by employing their factories and their advanced
assembly line process to produce large numbers of military equipment.
Furthermore, the innovative and strongly motivated leadership team promoted excellence and
constant need for efficiency improvements. These efforts lead to the gradual development of the
assembly line from 1912 till 1914. The main concept was the “reduction of the necessity for thought
on the part of the worker and the reduction of his movements to a minimum” (Ford 1923: 80). The
assembly line revolutionized not only the industry, but manufacturing processes internationally.
Learning and innovation, as well as adaptive reorganization were constant targets of the The Ford
Motor Company. Finally, company systems and processes successfully handled increasing capital
flows, while maintaining a level of trust internally and externally within the stakeholder network.
1920-1945: Rigidity
In this period the company operates primarily in the rigidity quadrant. Stakeholder satisfaction falls
dramatically as corporate leadership does not adapt to the external challenges. The Ford Motor
Company insists in producing only one car, the Model T, when the market is shifting from first time
buyers to second time buyers, demanding new and improved models. Furthermore, labour
relationships deteriorate, as the company not only refuses to acknowledge unions, but also develops a
culture of mistrust between its employees. Autocratic leadership by Henry Ford, over-centralized
structure of the decision making process and rigid corporate policies regarding dealers and labour
relations are evidence of deteriorating resilience. However, although the company is losing market
segment and in some years registers losses, it remains viable, and upper management does not realize
the need for change. The company has fallen in a dysfunctional momentum, a rigidity trap, having
developed defence mechanisms that resist change and prolong adaptation in a rigid state.
During the 1920s and 1930s the authoritative management of Henry Ford affected a number of
resilience parameters. Leadership patterns changed as from 1919 until 1921 key executives left the
business. Henry Ford was not only autocratic, but also very rigid in his decision making, refusing to
adapt to the changing environment. Although the reduced appeal of the Model T was obvious since
1923, four years passed before he agreed to introduce a new model. His management team was
Page 12 of 31ANZAM 2011
Page 12
hesitant in even suggesting the need for a new model. The Vice President, Ernest Kanzler finally
presented a memo to Henry Ford in January 1926 (Ford Motor Company Archives 1926), analyzing
the need for a new model. Henry Ford ignored his views, resulting in Kanzler’s resignation after 6
months (Watts 2005). It is characteristic of the rigidity of the corporate processes and the leadership
functions that even after great losses in the mid 1930s the company did not enter a reorganization
phase. Although during that decade Ford developed other interests (e.g., the Ford Museum, the
Greenfield Village, village industries, experimental soybean farms, practical educational projects) that
took a lot of his time and effort, he still controlled all major decision making in The Ford Motor
Company, overruling his son, Edsel, who was the president at the time. Upon Edsel’s death Henry
Ford returned in the company as active president in 1943. His presidency was inefficient due to his
reduced interaction with corporate issues, but also due to increasing mental health issues. Only in
1945, when Ford was unable to recognize many people outside his immediate family, he eventually
resigned, passing the presidency on to Henry II (Watts 2005).
The rigidity of the leadership and their resistance to change directly affected the structure of the
company’s dealership network. Ford factories failed to adapt in the changing environment between
the two World Wars. They applied an unsuccessful strategy of putting a lot of pressure on their
dealers to accept predetermined orders, thus straining them financially, losing their trust and
sometimes losing them to other manufacturers (Bernard 2003; Watts 2005). The centrality and
connectivity of the company in the network were impaired.
Poor trust and flow of human capital were also characteristics of The Ford Motor Company in the
decade of the 1930s. It is uncertain whether Henry Ford was fully aware of the conditions of work and
of the actions of his service department, where some of his management figures were terrorizing their
subordinates and peers, developing intrigues and heavily influencing Henry Ford’s decision making
(Watts 2005). From the great idealist of the 1910s that introduced the 5 dollar minimum wage, Ford’s
public image as a humanitarian collapsed in the 1930s.
Despite underperformance and reduced desirability of system state the company remained viable,
capitalizing on their capital reserves and finally entered an extensive transformation stage only upon
Henry Ford’s succession in 1945.
Page 13 of 31 ANZAM 2011
Page 13
CONCLUDING REMARKS
In conclusion, a first historical case study has illustrated the applicability of the Resilience
Architecture Framework. The RA framework provides a mechanism for understanding and tracking
the behaviour patterns of firms that is free from the constraints imposed by existing linear models of
corporate strategic analysis. It allows for a dual conceptualization of resilience as adaptability or
rigidity and as such can be used to guide the management of systems both close and far from
equilibrium. Managers are urged to identify the quadrant the corporation operates in, consider
possible future trajectories and consciously stimulate the most desirable one. More specifically:
• Classification in the Vulnerability and Rigidity quadrants indicates the need for
transformation to exit those quadrants, avoid possible detrimental effects upon
disturbance for the overall system and thus maintain long-term system performance.
• Classification in the Adaptability quadrant should raise awareness for the challenges
and dangers associated with the implementation of linear performance measures and
continuous incremental improvements through exploitation. Regular reassessments of
the desirability of system state and resilience dimensions can provide early signs of
movement to another quadrant, thus allowing the instigation of timely
transformations at smaller scales, mitigating risks for the overall system.
• Classification in the Transience quadrant identifies the need for traditional strategic
planning, focusing on increased exploitation of core capabilities of the business.
Overall, the framework stimulates an understanding of complex system dynamics, providing the
ability to identify early signs of rigidity or vulnerability and instigate timely transformations at
smaller scales to achieve learning and adaptation at larger system scales. Further case study analysis
at corporate and industry levels can provide useful insights, developing an array of potential system
trajectories, identifying critical elements that trigger transformations and influence their effectiveness
and thus building on the potential predictive capacity of this dynamic analysis tool.
Page 14 of 31ANZAM 2011
Page 14
REFERENCES
Abel, N., Cumming, D. and Anderies, J. (2006), “Collapse and reorganization in social-
ecological systems: questions, some ideas, and policy implications”, Ecology and
Society 11(1): [online] www.ecologyandsociety.org
Adger, W., Brown, K., and Tompkins, E. (2006), “The political economy of cross-scale
networks in resource co-management”, Ecology and Society 10(2): [online]
www.ecologyandsociety.org
Anderies, J, Walker, B. and Kinzig, A. (2006), “Fifteen weddings and a funeral: case studies
and resilience-based management”, Ecology and Society 11(1): [online]
www.ecologyandsociety.org.
Angwin, D. and Vaara, E. (2005), “Introduction to the special issue.’Connectivity' in merging
organizations: Beyond traditional cultural perspectives”, Organization Studies 26(10):
1445-1453.
Avey, J.B., Reichard, R.J., Luthans, F., and Mhatre, K.H. (2011), “Meta-Analysis of the
Impact of Positive Psychological Capital on Employee Attitudes, Behaviors, and
Performance”, Human Resource Development Quarterly 22(2): 127-152.
Baum, J.A.C, and Oliver, C. (1991), “Institutional linkages and organizational mortality”,
Administrative Science Quarterly 36(2): 187-218.
Berkes, F. (2006), “From community-based resource management to complex systems: the
scale issue and marine commons”, Ecology and Society 11(1): [online]
www.ecologyandsociety.org.
Bernard, J. (2003), “Ford’s distribution network in Europe: recent developments in the
context of the history of automobile retailing”, in H. Bonin, Y. Lung, & S. Tolliday
(eds), Ford, The European History, 1903 – 2003, P.l.a.g.e., Paris, pp. 417-442.
Boje, D.M., and Whetten D.A. (1981), “Effects of organizational strategies and contextual
constraints on centrality and attributions of influence in inter-organizational
networks”, Administrative Science Quarterly 26(3): 378-395.
Bradshaw, G., and Borchers, J. (2000), “Uncertainty as information: narrowing the science-
policy gap”, Conservation Ecology 4(1): [online] www.consecol.org.
Brodsky, A.E, Welsh, E., Carrillo, A., Talwar, G., Scheibler, J, and Butler, T. (2011),
“Between Synergy and Conflict: Balancing the Processes of Organizational and
Individual Resilience in an Afghan Women’s Community”, American Journal of
Community Psychology 47: 217–235.
Page 15 of 31 ANZAM 2011
Page 15
Butler, C. and Oluoch-Kosura, W. (2006), “Linking future ecosystem services and future
human wellbeing”, Ecology and Society 11(1): [online] www.ecologyandsociety.org.
Carpenter, S., Bennett, E., and Peterson, G. (2006), “Scenarios for ecosystem services: an
overview”, Ecology and Society, 11(1): [online] www.ecologyandsociety.org.
Carpenter, S., Walker, B., Anderies, J.M., and Abel, N. (2001) “From Metaphor to
Measurement: Resilience of What to What?”, Ecosystems, 4(8): 765-781.
Chakravarthy, B. S. (1982). "Adaptation: A Promising Metaphor for Strategic Management."
Academy of Management Review 7(1): 35-44.
Coutu, D.L. (2002). “How resilience works”, Harvard Business Review, 80(5): 46-55.
Cumming, G., Cumming, D. and Redman, C. (2006), “Scale mismatches in social-ecological
systems: causes, consequences, and solutions”, Ecology and Society 11(1): [online]
www.ecologyandsociety.org.
De Leo, G., and Levin, S. (1997), “The multifaceted aspects of ecosystem integrity”,
Conservation Ecology 1(1): [online] www.consecol.org..
Derissen, S., Quass, M.F., and Baumgartner, S. (2011), “The Relationship between
Resilience and Sustainability of Ecological-Economic Systems”, Ecological
Economics 70(6): 1121-1128.
Dervitsiotis, K.N. (2003), “The pursuit of sustainable business excellence: guiding
transformation for effective organizational change”, Total Quality Management &
Business Excellence 14(3): 251-267.
Deutsch, L., Folke, C, and Skanberg, K. (2003), “The critical natural capital of ecosystem
performance as insurance for human well-being”, Ecological Economics 44(2-3):
205-217.
Elmqvist, T., Colding, J., Barthel, S., Borgstrom, S., Duit, A., Lundberg, J., Andersson, E.,
Ahrne, K., Ernstson, H., Folke, C., and Bengtsson, J. (2004), “The dynamics of
social-ecological systems in urban landscapes - Stockholm and the National Urban
Park”, Sweden, Annals of the New York Academy of Sciences 1023(308-322).
Eriksson, K., Majkgard, A., and Sharma, D. (2000). "Path Dependence and Knowledge
Development in the Internationalization Process." Management International Review
40(4): 307-328.
Folke, C. (2003), “Freshwater for resilience: a shift in thinking”, Philosophical Transactions
of the Royal Society of London Series B-Biological Sciences 358(1440): 2027-2036.
Page 16 of 31ANZAM 2011
Page 16
Folke, C., Hahn, T., Olsson, P., and Norberg, J. (2005), “Adaptive governance of social-
ecological systems”, Annual Review of Environment and Resources 30(November):
441-473.
Ford H (1923). My life and work. William Heinemann Ltd., London.
Ford Motor Company Archives (1903), Minute book. vol 2, entry for June 16 1903.
Ford Motor Company Archives (1906), Minute book, entry for Sept 7 1906.
Ford Motor Company Archives (1926), Kanzler memo, 26 Jan 1926. Account 1. Box 116.
Ford Motor Company Archives a, “Reminiscences, Max F. Wollering, Frank Bennett and
Charles E Sorensen”.
Friedkin, N.E. (1993), “Structural bases of interpersonal influence in groups: A longitudinal
case study”, American Sociological Review 58(6): 861-872.
Grant, R. M. (2003). "Strategic Planning in a Turbulent Environment: Evidence from the Oil
Majors." Strategic Management Journal 24(6): 491-517.
Gunderson, L., Carpenter, S., Folke, C., Olsson, P., and Peterson, G. (2006), “Water RATs
(resilience, adaptability, and transformability) in lake and wetland social-ecological
systems”, Ecology and Society 11(1): [online] www.ecologyandsociety.org.
Gunderson, L.H., and Holling, C.S. (eds). (2001). Panarchy: understanding transformations
in human and natural systems, Island Press, Washington, DC.
Hamel, G., and Valikangas, L. (2003), “The quest for resilience”. Harvard Business Review,
81(9): 52-63.
Holling, C.S. (2001). “Understanding the Complexity of Economic, Ecological, and Social
Systems”. Ecosystems 4(5), 390-405.
Horne, J.F.I. (1997). “The coming age of organizational resilience”, Business Forum,
22(2/3/4): 24-28.
Hotimsky, S., Cobb, R., and Bond, A. (2006), “Contracts or scripts? A critical review of the
application of institutional theories to the study of environmental change”, Ecology
and Society 11(1): [online] www.ecologyandsociety.org.
Hughes, T., Bellwood, D., Folke, C., Steneck, R., and Wilson, J. (2005), “New paradigms for
supporting the resilience of marine ecosystems”, Trends in Ecology & Evolution
20(7): 80-386.
Ibarra, H (1993), “Network centrality, power, and innovation involvement: Determinants of
technical and administrative roles”, Academy of Management Journal 36(3): 471-501.
Janssen, M., Bodin, Ö., Anderies, J., Elmqvist, T., Ernstson, H., McAllister, R., Olsson, P.,
and Ryan, P. (2006), “Toward a network perspective of the study of resilience in
Page 17 of 31 ANZAM 2011
Page 17
social-ecological systems”, Ecology and Society 11(1): [online]
www.ecologyandsociety.org.
Jansson, A., Folke, C., Rockstrom, J., and Gordon, L. (1999), “Linking freshwater flows and
ecosystem services appropriated by people: The case of the Baltic Sea drainage
basin”, Ecosystems 2(4): 351-366.
Jarillo C (1993), Strategic Networks: Creating the Borderless Organization, Butterworth-
Heinemann Ltd, Oxford, UK.
Kolb, D.G. (2008), “Exploring the metaphor of connectivity: Attributes, dimensions and
duality”, Organization Studies 29(1): 127-144.
Korhonen, J., and Seager, T.P. (2008), “Beyond Eco-Efficiency: a Resilience Perspective”,
Business Strategy and the Environment 17: 411–419.
Lamberg, J.-A., and Parvinen, P. (2003). "The River Metaphor for Strategic Management."
European Management Journal 21(5): 549-557.
Lebel, L., Anderies, J. M., Campbell, B., Folke, C., Hatfield-Dodds, S., Hughes, T. P. and
Wilson, J. (2006), “Governance and the capacity to manage resilience in regional
social-ecological systems”, Ecology and Society 11(1).
Lengnick-Hall, C. A., Beck, T. E., Lengnick-Hall, M. L. (2011). "Developing a capacity for
organizational resilience through strategic human resource management”, Human
Resource Management Review 21(3): 243-255.
Lengnick-Hall, C. A., and Beck, T.E. (2005). "Adaptive Fit Versus Robust Transformation:
How Organizations Respond to Environmental Change", Journal of Management
31(5): 738-757.
Liu, J., Dietz, T., Carpenter, S.R., Alberti, M., Folke, C., Moran, E., Pell, A.N., Deadman, P.,
Kratz, T., Lubchenco, J., Ostrom, E., Ouyang, Z., Provencher, W., Redman, C.L.,
Schneider, S.H., and Taylor, W.W. (2007), “Complexity of Coupled Human and
Natural Systems”, Science 317(1513): 1513-1516.
Luthans, F. and Youssef, C.M. (2007). “Emerging Positive Organizational Behavior”,
Journal of Management, 33(3): 321-349.
Mallak, L. (1998). “Putting organizational resilience to work”, Industrial Management,
40(6): 8-13.
Mamouni Limnios, E.A. (2008). Incorporating complex systems dynamics in sustainability
assessment frameworks: enhanced prediction and management of socio-ecological systems
performance, PhD Thesis at The University of Western Australia, Australasian Digital Thesis
Record No: 224235. http://theses.library.uwa.edu.au/adt-WU2009.0012/
Page 18 of 31ANZAM 2011
Page 18
Miles, R. E., and Snow, C.C. (1978). Organizational Strategy, Structure and Process. New York,
McGraw-Hill.
March, J.G. (1991). “Exploration and Exploitation in organizational learning”, Organization
Science, 2(1):71-87.
Mason, G.L. (2005), “Connectivity as a basis for a systems modelling ontology”, Systems
Research and Behavioral Science 22(1): 69-80.
Miller, D. (1990). The Icarus paradox: how exceptional companies bring about their own
downfall: new lessons in the dynamics of corporate success, decline, and renewal,
HarperBusiness, New York.
Miller, D. (1993). “The Architecture of Simplicity”, Academy of Management Review, 18(1):
116-138.
Miller, D., and Friesen, P. (1977), “Strategy-making in context: ten empirical archetypes”,
Journal of Management Studies 14(3), 253-280.
Miller, D., and Friesen P. (1980), Momentum and revolution in organizational adaptation,
Academy of Management Journal 23(4): 591-614.
Miller, D., and Friesen, P. (1983) “Successful and unsuccessful phases of the corporate life-
cycle”, Organization Studies 4(4): 339-356.
Mintzberg , H. (1978). "Patterns in Strategy Formation." Management Science 24(9): 934-
948.
Monge, P.R., Fulk, J., Kalman, M.E., Flanagin, A.J., Parnassa, C. and Rumsey, S. (1998),
“Production of collective action in alliance-based interorganizational communication
and information systems”, Organization Science 9(3): 411-433.
Nevins A (1954), Ford: The Times, the Man, the Company, Charles Scribner's Sons, New
York.
Nevins A, and Hill F E (1957), Ford: Expansion and Challenge 1915-1933, Charles
Scribner's Sons, New York.
Nevins A, and Hill F E (1963), Ford: Decline & Rebirth 1933-1962, Charles Scribner's Son,
New York.
Oliver, C. (1997), “The influence of institutional and task environment relationships on
organizational performance: The Canadian construction industry”, Journal of
Management Studies 34(1): 99-124.
Olsson, P., and Folke, C. (2001), “Local ecological knowledge and institutional dynamics for
ecosystem management: A study of Lake Racken Watershed, Sweden”, Ecosystems
4(2): 85-104.
Page 19 of 31 ANZAM 2011
Page 19
Olsson, P., Folke, C., and Berkes, F. (2004a), “Adaptive co-management for building
resilience in social-ecological systems”, Environmental Management 34(1): 75-90.
Olsson P, Folke C, and Hahn T (2004b), Social-ecological transformation for ecosystem
management: the development of adaptive co-management of a wetland landscape in
southern Sweden, Ecology and Society 9(4): [online] www.ecologyandsociety.org.
Olsson P, Gunderson L H, Carpenter S R, Ryan P, Lebel L, Folke C, and Holling C S (2006),
Shooting the rapids: navigating transitions to adaptive governance of social-ecological
systems, Ecology and Society 11(1): [online] www.ecologyandsociety.org.
Pahl-Wostl, C. (2006), “The importance of social learning in restoring the multifunctionality
of rivers and floodplains”, Ecology and Society 11(1): [online]
www.ecologyandsociety.org.
Riolli, L., and Savicki, V. (2003). “Information system organizational resilience”, Omega-
International Journal of Management Science, 31(3): 227-233.
Roux, D., Rogers, K., Biggs, H., Ashton, P., and Sergeant, A. (2006), “Bridging the science-
management divide: moving from unidirectional knowledge transfer to knowledge
interfacing and sharing”, Ecology and Society 11(1): [online]
www.ecologyandsociety.org.
Rycroft, R.W., and Kash, D.E. (2004), “Self-organizing innovation networks: implications
for globalization”, Technovation 24(3): 187-197.
Sparrowe, R.T., Liden, R.C., Wayne, S.J, and Kraimer, M.L. (2001), “Social networks and
the performance of individuals and groups”, Academy of Management Journal 44(2):
316-325.
Strauss A, and Corbin J (1998), Basics of qualitative research: techniques and procedures for
developing grounded theory, second ed. Thousand Oaks, CA, Sage Publications.
Sullivan-Taylor, B., and Wilson, D.C. (2009), “Managing the Threat of Terrorism in British
Travel and Leisure Organizations”, Organization Studies, 30(2-3): 251-276.
Sutcliffe, K.M., and Vogus, T.J. (2003). “Organizing for Resilience”. in K.S. Cameron, J.E.
Dutton, & R.E. Quinn (eds), Positive organizational scholarship: Foundations of a
new discipline, Berrett-Koehler Publishers, San Francisco, CA, pp.94-110.
Teece, D. J., Pisano, G. and Shuen, A. (1997). “Dynamic Capabilities and Strategic
Management”, Strategic Management Journal, 18(7): 509-533.
Van de Ven, A.H., and Engleman, R. (2004), “Event and outcome-driven explanations of
entrepreneurship”, Journal of Business Venturing 19(3): 343-358.
Page 20 of 31ANZAM 2011
Page 20
Van de Ven, A.H., and Poole, M.S. (1995), “Explaining Development and Change in
Organizations”, Academy of Management Review 20(3): 510-540.
Walker, B. and Meyers, J.A. (2004), “Thresholds in ecological and social–ecological
systems: a developing database”, Ecology and Society 9(2): [online]
www.ecologyandsociety.org
Walker B H, Gunderson L H, Kinzig A P, Folke C, Carpenter S R, and Schultz L (2006), “A
handful of heuristics and some propositions for understanding resilience in social-
ecological systems”. Ecology and Society 11 (1): [online]
www.ecologyandsociety.org
Wallace, R. (2003), “Social influences on conservation: Lessons from U.S. recovery
programs for marine mammals”, Conservation Biology 17(1): 104-115.
Watts S (2005), The people's tycoon: Henry Ford and the American century. Alfred A Knopf,
New York.
Young O (2006), “Vertical interplay among scale-dependent environmental and resource
regimes”, Ecology and Society 11(1): [online] www.ecologyandsociety.org
Page 21 of 31 ANZAM 2011
Page 21
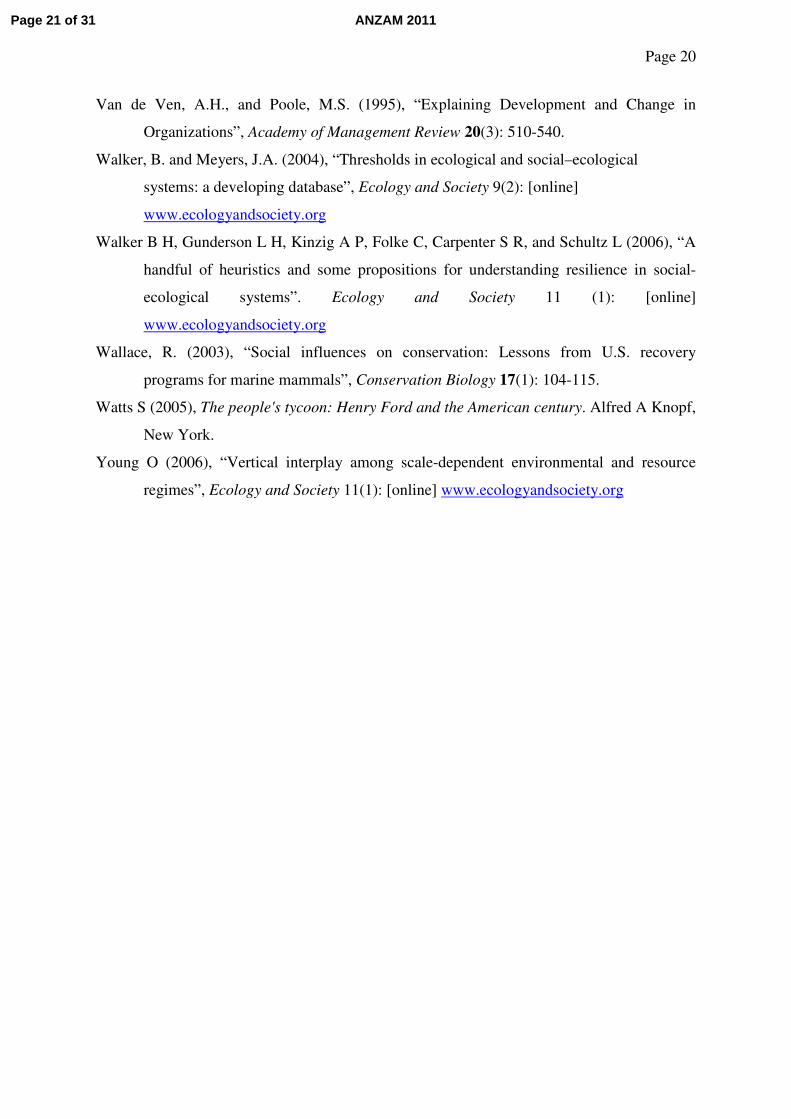
Table 1: Definitions
Organisational Resilience: The magnitude of disturbance an organisation can tolerate and still
persist.
Organisational System: The network of interrelated actors who are systematically arranged
and managed to pursue a set of activities under the collective goal of
delivering a product or service.
Internal Connectedness: The level of connections and interdependencies between internal
system variables and processes.
External Connectedness: The level of connections and interdependencies between system
variables and processes and the external environment.
Self-organisation ability: The ability of the system to re-organize its processes without
external support
Page 22 of 31ANZAM 2011
Page 22
Figure 1: The Resilience Architecture
Rigidity
Quadrant
Adaptability Quadrant
Vulnerability Quadrant
Transience Quadrant
Low
R
esil
ienc
e
H
igh
Low Desirability of system state High
Page 23 of 31 ANZAM 2011
Page 23
Figure 2. Ford Motor Company Timeline from foundation to 1945
Page 24 of 31ANZAM 2011
Page 24
Sustainability
0 2 4 6 8 10
Res
ilie
nce
0
2
4
6
8
10
Period Mean1903-19071908-19191920-1945
Figure 3. Ford Motor Company Resilience Architecture from foundation to 1945
Desirability of System State
Page 25 of 31 ANZAM 2011
Page 25
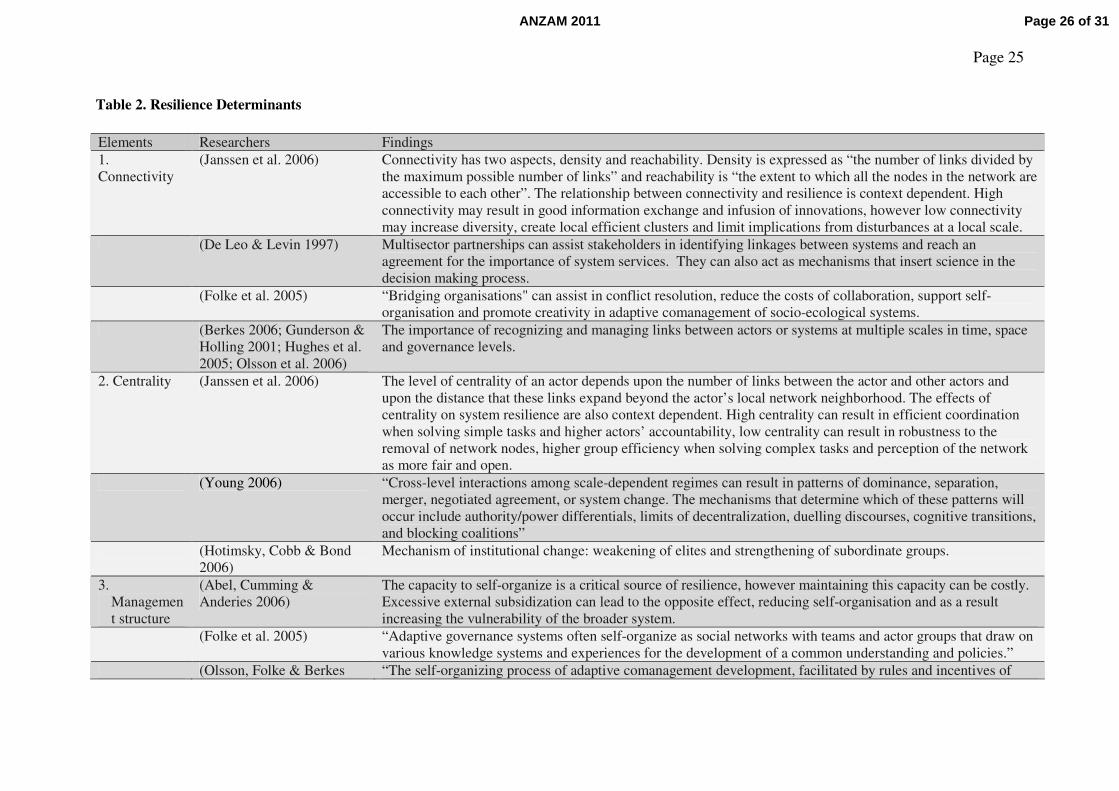
Table 2. Resilience Determinants
Elements Researchers Findings 1. Connectivity
(Janssen et al. 2006) Connectivity has two aspects, density and reachability. Density is expressed as “the number of links divided by the maximum possible number of links” and reachability is “the extent to which all the nodes in the network are accessible to each other”. The relationship between connectivity and resilience is context dependent. High connectivity may result in good information exchange and infusion of innovations, however low connectivity may increase diversity, create local efficient clusters and limit implications from disturbances at a local scale.
(De Leo & Levin 1997) Multisector partnerships can assist stakeholders in identifying linkages between systems and reach an agreement for the importance of system services. They can also act as mechanisms that insert science in the decision making process.
(Folke et al. 2005) “Bridging organisations" can assist in conflict resolution, reduce the costs of collaboration, support self-organisation and promote creativity in adaptive comanagement of socio-ecological systems.
(Berkes 2006; Gunderson & Holling 2001; Hughes et al. 2005; Olsson et al. 2006)
The importance of recognizing and managing links between actors or systems at multiple scales in time, space and governance levels.
2. Centrality (Janssen et al. 2006) The level of centrality of an actor depends upon the number of links between the actor and other actors and upon the distance that these links expand beyond the actor’s local network neighborhood. The effects of centrality on system resilience are also context dependent. High centrality can result in efficient coordination when solving simple tasks and higher actors’ accountability, low centrality can result in robustness to the removal of network nodes, higher group efficiency when solving complex tasks and perception of the network as more fair and open.
(Young 2006) “Cross-level interactions among scale-dependent regimes can result in patterns of dominance, separation, merger, negotiated agreement, or system change. The mechanisms that determine which of these patterns will occur include authority/power differentials, limits of decentralization, duelling discourses, cognitive transitions, and blocking coalitions”
(Hotimsky, Cobb & Bond 2006)
Mechanism of institutional change: weakening of elites and strengthening of subordinate groups.
3. Management structure
(Abel, Cumming & Anderies 2006)
The capacity to self-organize is a critical source of resilience, however maintaining this capacity can be costly. Excessive external subsidization can lead to the opposite effect, reducing self-organisation and as a result increasing the vulnerability of the broader system.
(Folke et al. 2005) “Adaptive governance systems often self-organize as social networks with teams and actor groups that draw on various knowledge systems and experiences for the development of a common understanding and policies.”
(Olsson, Folke & Berkes “The self-organizing process of adaptive comanagement development, facilitated by rules and incentives of
Page 26 of 31ANZAM 2011
Page 26
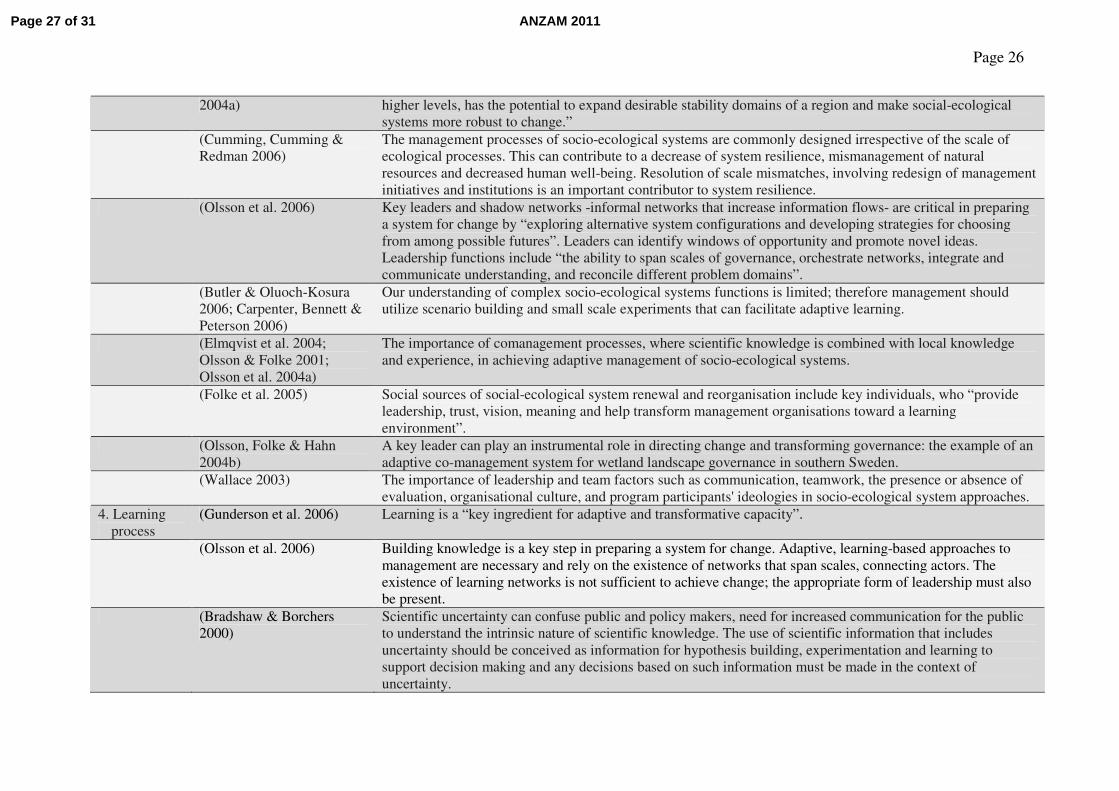
2004a) higher levels, has the potential to expand desirable stability domains of a region and make social-ecological systems more robust to change.”
(Cumming, Cumming & Redman 2006)
The management processes of socio-ecological systems are commonly designed irrespective of the scale of ecological processes. This can contribute to a decrease of system resilience, mismanagement of natural resources and decreased human well-being. Resolution of scale mismatches, involving redesign of management initiatives and institutions is an important contributor to system resilience.
(Olsson et al. 2006) Key leaders and shadow networks -informal networks that increase information flows- are critical in preparing a system for change by “exploring alternative system configurations and developing strategies for choosing from among possible futures”. Leaders can identify windows of opportunity and promote novel ideas. Leadership functions include “the ability to span scales of governance, orchestrate networks, integrate and communicate understanding, and reconcile different problem domains”.
(Butler & Oluoch-Kosura 2006; Carpenter, Bennett & Peterson 2006)
Our understanding of complex socio-ecological systems functions is limited; therefore management should utilize scenario building and small scale experiments that can facilitate adaptive learning.
(Elmqvist et al. 2004; Olsson & Folke 2001; Olsson et al. 2004a)
The importance of comanagement processes, where scientific knowledge is combined with local knowledge and experience, in achieving adaptive management of socio-ecological systems.
(Folke et al. 2005) Social sources of social-ecological system renewal and reorganisation include key individuals, who “provide leadership, trust, vision, meaning and help transform management organisations toward a learning environment”.
(Olsson, Folke & Hahn 2004b)
A key leader can play an instrumental role in directing change and transforming governance: the example of an adaptive co-management system for wetland landscape governance in southern Sweden.
(Wallace 2003) The importance of leadership and team factors such as communication, teamwork, the presence or absence of evaluation, organisational culture, and program participants' ideologies in socio-ecological system approaches.
4. Learning process
(Gunderson et al. 2006) Learning is a “key ingredient for adaptive and transformative capacity”.
(Olsson et al. 2006) Building knowledge is a key step in preparing a system for change. Adaptive, learning-based approaches to management are necessary and rely on the existence of networks that span scales, connecting actors. The existence of learning networks is not sufficient to achieve change; the appropriate form of leadership must also be present.
(Bradshaw & Borchers 2000)
Scientific uncertainty can confuse public and policy makers, need for increased communication for the public to understand the intrinsic nature of scientific knowledge. The use of scientific information that includes uncertainty should be conceived as information for hypothesis building, experimentation and learning to support decision making and any decisions based on such information must be made in the context of uncertainty.
Page 27 of 31 ANZAM 2011
Page 27
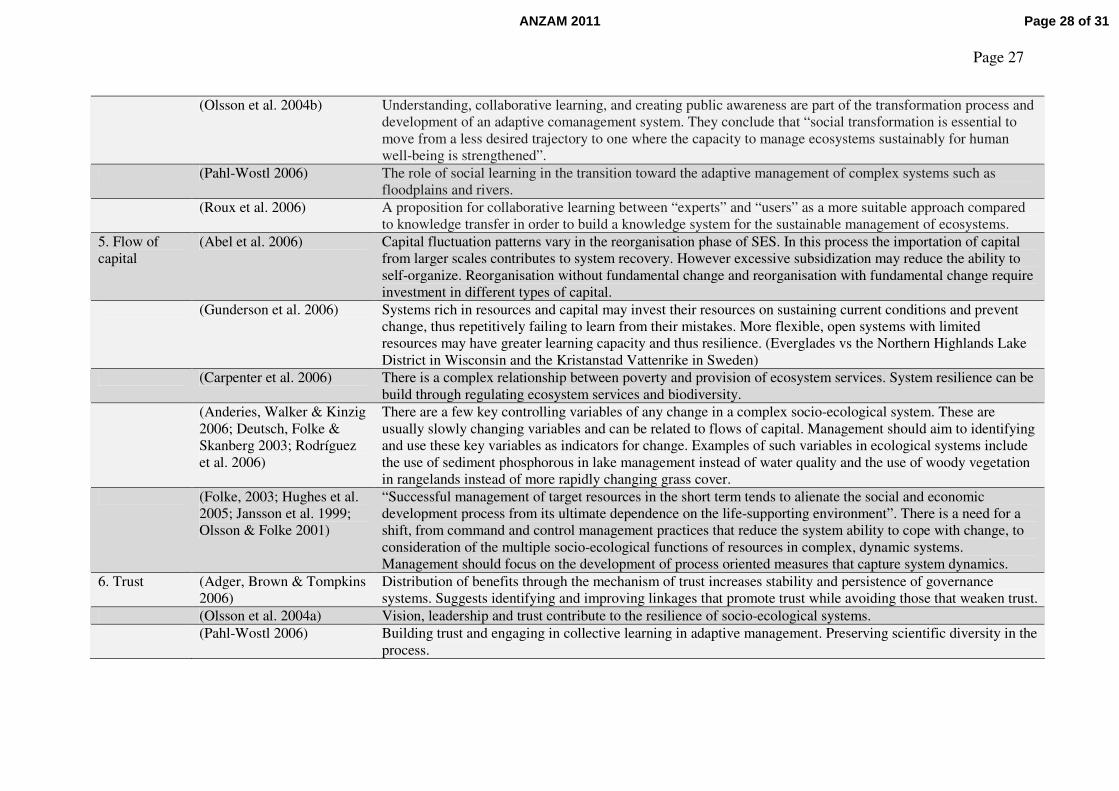
(Olsson et al. 2004b) Understanding, collaborative learning, and creating public awareness are part of the transformation process and development of an adaptive comanagement system. They conclude that “social transformation is essential to move from a less desired trajectory to one where the capacity to manage ecosystems sustainably for human well-being is strengthened”.
(Pahl-Wostl 2006) The role of social learning in the transition toward the adaptive management of complex systems such as floodplains and rivers.
(Roux et al. 2006) A proposition for collaborative learning between “experts” and “users” as a more suitable approach compared to knowledge transfer in order to build a knowledge system for the sustainable management of ecosystems.
5. Flow of capital
(Abel et al. 2006) Capital fluctuation patterns vary in the reorganisation phase of SES. In this process the importation of capital from larger scales contributes to system recovery. However excessive subsidization may reduce the ability to self-organize. Reorganisation without fundamental change and reorganisation with fundamental change require investment in different types of capital.
(Gunderson et al. 2006) Systems rich in resources and capital may invest their resources on sustaining current conditions and prevent change, thus repetitively failing to learn from their mistakes. More flexible, open systems with limited resources may have greater learning capacity and thus resilience. (Everglades vs the Northern Highlands Lake District in Wisconsin and the Kristanstad Vattenrike in Sweden)
(Carpenter et al. 2006) There is a complex relationship between poverty and provision of ecosystem services. System resilience can be build through regulating ecosystem services and biodiversity.
(Anderies, Walker & Kinzig 2006; Deutsch, Folke & Skanberg 2003; Rodríguez et al. 2006)
There are a few key controlling variables of any change in a complex socio-ecological system. These are usually slowly changing variables and can be related to flows of capital. Management should aim to identifying and use these key variables as indicators for change. Examples of such variables in ecological systems include the use of sediment phosphorous in lake management instead of water quality and the use of woody vegetation in rangelands instead of more rapidly changing grass cover.
(Folke, 2003; Hughes et al. 2005; Jansson et al. 1999; Olsson & Folke 2001)
“Successful management of target resources in the short term tends to alienate the social and economic development process from its ultimate dependence on the life-supporting environment”. There is a need for a shift, from command and control management practices that reduce the system ability to cope with change, to consideration of the multiple socio-ecological functions of resources in complex, dynamic systems. Management should focus on the development of process oriented measures that capture system dynamics.
6. Trust (Adger, Brown & Tompkins 2006)
Distribution of benefits through the mechanism of trust increases stability and persistence of governance systems. Suggests identifying and improving linkages that promote trust while avoiding those that weaken trust.
(Olsson et al. 2004a) Vision, leadership and trust contribute to the resilience of socio-ecological systems. (Pahl-Wostl 2006) Building trust and engaging in collective learning in adaptive management. Preserving scientific diversity in the
process.
Page 28 of 31ANZAM 2011
Page 28
APPENDIX
List of Historical Events
1) The Ford Motor Company was founded, Ford and Malcomson were the primary partners, including another 10 private investors (16 June 1903).
2) The car model was ready for production before signing the papers, the target was to produce light, simple and durable cars. (1903)
3) Initially sales failed to materialize, the cash balance fell from $14,500 in June 26 to $223.65 in July 11. (1903)
4) By the end of August the balance rose to $23,000. (1903) 5) The first 3 ½ months operation profit $36,957. (1903) 6) Numerous defects in those early models in the engine, the
radiator, the carburettor, the brakes, oiling system, circulating pump, transmissions, and others. However this was generally the case in the industry. (1903)
7) G.B. Selden and the Electric Vehicle Company filed suit against the Ford Motor Company (October 1903) because they did not agree in paying royalty to the Electric Vehicle Company. Selden had developed a patent for a motor vehicle, and ALAM (Association of Licensed Automobile Manufacturers) was formed recognizing Selden’s patent which was a general patent for a motor vehicle. This vehicle was never constructed, it was only used to get patent fees from other manufacturers. (1903)
8) Ford antirust and anti monopoly arguments were brought in public and were used in the company’s adds where they referred to ALAM as “the Trust", capitalizing on the progressive movement and the public concern about increasing corporate power in early 1900’s.
9) At times the Selden case severely strained corporate resources 10) New Factory Plant need for increased output. (1904) 11) From mid of June 03 to end of March 04 Ford sold 658 cars,
achieving revenue of $354,190 and net profit of $98,851. Combined sales for the three best months of 04 (April, May and June) reached almost $650,000. The total number of cars sold in first 15 months was 1708. In autumn 1904 sales were averaging $60,000 per month. (1904)
12) The company could finance itself. (1904) 13) The Ford Motor Company of Canada was founded, 51% owned
by the mother company, to make and sell in the Dominion and other British colonies and after 1907 would participate with a Michigan company in the British market (1904)
14) Late 04 and early 05 operations moved to new Piquette Avenue plant, 10 times the size of present plant. (1904)
15) In Piquette Avenue plant still no continuity of manufacture, the production rate was 25 cars/day with 300 men. (1904)
16) Malcomson had previously appointed Couzens from his coal business to The Ford Motor Company while he was mainly involved in his coal business. As Ford Motor Company was growing rapidly he wanted to get the role of business manager and send Couzens back in the coal business. Ford and Couzens who were working harmoniously together resisted. (1905)
17) Difference in opinion between Ford and Malcomson in the type of car to be manufactured, Malcomson was supported by the Dodge brothers who knew that the current trend was toward big cars. (1905)
18) The Ford Manufacturing Company was incorporated by the following shareholders: Ford, the two Dodges, Rackham, Anderson, Wills, Couzens and Bennett (22 November 1905). The company would manufacture parts only for the less expensive car. Bennett shortly transferred his stock to Ford, who was controlling the company holding 2900 out of the 5000 shares issued. The company would sell the parts to The Ford Motor Company, achieving a synergy but also diluting some of The Ford Motor Company profit.
19) Malcomson unhappy the management decisions in The Ford Motor Company and being excluded from The Ford Manufacturing Company founded another motor company, in which he was both the officer and director. He was asked
to resign in a Ford Motor Company directors meeting (6 December 05) on the basis of conflict of interests.
20) Sales of expensive models (Model K) were disappointing and the company depended on it and on the last of Models C and F. Total sales from October 1 05 to September 30 06 only 1,599, fewer than the previous year. Profits dropped from $290,194 to $102,397.
21) The cheap car showed a promising future, however the profits were absorbed by The Ford Manufacturing Company. (1906)
22) Malcomson was displeased with the situation and was in negotiations for several months until he sold his shares to Ford on July 12 1906. Three other stockholders (Woodall, Bennett and Fry) sold their shares to Ford and Couzens by September 1907.
23) Ford brought a car to the market at the price of $500. The Cycle and Automobile Trade Journal referred to this as “distinctly the most important mechanical event of 1906”.
24) By September 07 Ford held 585 and Couzens 110 of the 1000 Ford Motor Company shares. Ford became the majority stockholder.
25) Absorption of the Ford Manufacturing Company into the Ford Motor Company, (May 1 1907)
26) After consolidation machinery was moved in the enlarged Piquette plant, rearranging the whole business for more efficient operations. (1907)
27) One chassis was used for all models (Model N and slightly different in appearance models), minimizing costs. (1907)
28) Plans were made for a new plant in Highland Park. (1907) 29) Hawkins, a new marketing expert was employed taking part of
Couzens responsibility, which was never his primary expertise. (1907)
30) Production costs were outpacing profits. (1907) 31) Although the company tried to keep costs down, the mark of
$500 could not be reached and additional costs were charged for the recommended tire size, lamps and horn. (1907)
32) In 1906-07 the cheapest car was selling at $600 and the most expensive at $750. Despite the above model N was a great success. Sold 8,423 cars in 1906-07, over 5 times better than the company’s previous record for a 12-month period.
33) The Panic of 1907 and the diversion to a slightly more expensive model cut down the sales of 1907-1908 to 6,398 cars.
34) Less efficient car manufacturers and the makers of expensive cars suffered the most, leading to a number of bankruptcies in 1907.
35) Vanadium steel was firstly used by The Ford Motor Company, a more resistant and lighter material that would improve car performance. (1907)
36) Financial strain due to the purchase of the Highland Park tract and the absorption of the Ford Manufacturing Company. Paydays were several times postponed in the fall of 1907, to get money.
37) Due to the financial constraint Ford would send cars to the dealers who had to pay for the cars and then try to sell them, leading to dealers dissatisfactions. Furthermore the company covered bills with notes (instead of cash or checks) to manufacturers. (1907)
38) Early in 1908 general upswing in the industry. 39) The Ford Motor Company emerged an industry leader. (1908) 40) Record sales in April $595,594 and in May $868,738. (1908) 41) Model T was announced in the autumn of 1908, selling for
$850. Price increases in 09-10 took place in order to finance the new plant in Highland Park.
42) The UK dealer established back in 1904 was facing financial difficulties. In 1908 the company established a well financed branch in the UK, improving the distribution network.
43) Model T for sale early 1909. 44) Mid 1909 the company employed 22,000 people, 400%
increase from previous year
Page 29 of 31 ANZAM 2011
Page 29
45) May 1909 the company declared that it could not take orders for any type of delivery until after August 1st.
46) Increased efficiency and productivity. (1909) 47) Positive working environment, involved leadership, employees
enjoyed high spirit and work motivation. (1909) 48) Announcement that that Ford was going to build in the future
only one car, Model T, adding the famous quote “any customer can have a car painted any colour that he wants so long as it is black”. (1909)
49) Ruling in the Selden case by the first court against The Ford Motor Company, however the company enjoyed the public’s support. (1909)
50) New factory in Highland Park. (1910) 51) More than 60 sub-dealers in the UK. (1910) 52) Marketing in Europe from offices in Paris, achieving sales in
multiple countries. The Ford Times claiming that “America is educating the World to the Automobile”. (1910)
53) Production of Model T’s: 53,500 in 1911 54) The New York Court of Appeals overturned the lower courts
decision, ruling in Ford’s favour on the Selden case. Ford received great public support and press coverage. (1911)
55) Production of Model T’s: 82,400 in 1912 56) Efficiency improvements that would lead to the assembly line
concept. (1912) 57) The assembly line was initiated in April 1913 and spread in the
whole factory. Work was performed on a moving chassis. 58) Production of Model T’s: 185,000 in 12 months ending
September 1913 59) WWI in Europe (1914) 60) Revolutionary manufacturing methods with three lines
operations. A car was assembled in 1h and 33min compared to the previous rate of 12h and 28 min using the old stationary system. (1914)
61) Work in the assembly line was very repetitive, demanding for workers. (1914)
62) Couzens issued an order forbidding foremen to fire any workers until they have been tried at other jobs in the factory. (1914)
63) In January 1914 announcement of $5 min wage, became known as the 5 dollar day.
64) The Beginning of a social program (1914) to educate workers on housing and lifestyle. The program became controversial due to its invasive character. It was ended in 1921.
65) Couzens quit, upon an argument with Ford who was using The Ford Times to express his personal anti-war views. (1915)
66) Ford gained a reputation as an anti-war activist, escalating with the Peace Ship expedition to Europe, which was a failure as the prestigious guests did not participate. (1915)
67) On 2 November The Ford Motor Company was sued by John and Horace Dodge, demanding a halt of all expansions and distribution of 75% of cash surplus as dividends. (1916)
68) Henry Ford sued the Chicago Tribune for libel. The newspaper had characterized Ford on June 1916 as an “ignorant idealist … an anarchistic enemy of the nation” The trial was held in 1919.
69) Production of Model T's: 523,000. This accounted for 32% of all cars made in US and was four times what their nearest rival manufactured. (1916)
70) The US enters the war. (1917) 71) In the period 1917-1918 The Ford Motor Company worked for
the government. They manufactured thousands of ambulances, cars and trucks for the forces, thousands of Liberty airplane engines, participated in drives for Liberty Loans and the Red Cross and made films for military training and to communicate to the public activities of the military.
72) The Ford Motor Company lost the Dodge court case on October 31 1917 and was ordered to stop expansion and pay dividends of approx 19 million. The company appealed in higher court.
73) Henry Ford run for senator. He did not spend any money on a political campaign and lost with a thin margin. (1918)
74) End of WWI. (1918) 75) Henry Ford won the case against Chicago Tribune for libel,
however was awarded only 6 cents in damages. Despite the exposure of his lack of knowledge of basic history he rose
again as a public hero, receiving hundreds of support letters by plain citizens. (1919)
76) The higher court examined the Dodge case and cancelled the halt of expansion, however ordered dividends to be paid. The Dodge case also contributed to the public perception that Ford management was primarily interested in improving their services (investing in the business) rather than extracting profit. (1919)
77) Manufactured 40% of all cars made in the US. (1919) 78) Henry Ford used a representative to buy out all minority
stakeholders while allowing a rumour that he was leaving the Ford Motor Company to start a new company. (1919)
79) Exit of executives from 1919 to 1921 80) The Independent, a newspaper bought by Ford started a series
“The International Jew”, which supported Fords general views against Jewish people. The series was discontinued in 1922, replaced by other anti-Semitic articles focused upon specific cases and individuals.
81) The economic recession slowed down the automobile industry. The Ford Motor Company applied the previous tactic of lowering supply costs and forcing dealers to accept orders, which caused lasting bitterness amongst them.
82) Ford Motor Company total production (US, Canada and Foreign)= 582,647 cars in 1920
83) In 1921 the social program was ended, as Ford accepted its outdated paternalistic character
84) Ford Motor Company total production (US, Canada and Foreign)= 1,050,741 cars in 1921
85) Ford Motor Company imposing their US distribution system to UK dealers, elimination wholesalers and imposing sales quotas to salespeople. As an outcome of this tactic throughout the 1920's and 1930's they were loosing dealerships to local competitors.
86) Ford Motor Company total production (US, Canada and Foreign)= 1,425,830 cars in 1922
87) Sales of Model T begin to decline after 1923. General Motors poses a competitive threat, producing cars at various price ranges, organizing loans that allowed customers to buy on credit and decentralizing their management structure. Ford Motor Company persists with Model T.
88) Ford Motor Company total production (US, Canada and Foreign)= 2,201,188 cars in 1923
89) Ford Motor Company total production (US, Canada and Foreign)= 2,083,481 cars in 1924
90) Lawsuit for libel by one of the Independent’s Jewish targets. Ford sought out-of-court settlement in 1927. His public apology was accepted by the press, however the honesty of his claim, not being fully aware of the content of the paper articles, was doubted.
91) In 1925 Ford lost market leadership in the UK to Morris 92) Ford Motor Company total production (US, Canada and
Foreign)= 2,103,541 cars in 1925 93) Seeking Ford’s opinions on general issues that do not relate to
his business is being criticized by the press. (1926) 94) Ford is being pressured from his management, including his son
Edsel, to admit the obsolescence of the Model T. The vice president, Ernest C. Kanzler, presents a memo to Ford, arguing for the need to introduce a new model. He resigned after 6 months. (1926)
95) The press analyses the challenges that the company was facing, identifying the diminishing market segment of first-time buyers that Ford was aiming to. They furthermore note the disorganized dealer network and internal management intrigues. (1926)
96) Ford Motor Company total production (US, Canada and Foreign)= 1,752,075 cars in 1926
97) On the 26 May 1927 the company announced an “entirely new car”.
98) The restructuring of the production process and machinery was needed. Management decided that the River Rouge plant would be the primary production factory, which along with 34 US and 12 overseas plants would need retooling. (1927)
Page 30 of 31ANZAM 2011
Page 30
99) Thousands of workers were laid off, the production was terminated in June 1927 and the first model was assembled in October 21.
100) Ford disclosed information about the new car, allowing rumours to circulate in the press, creating a hype in the market from June until December 1927.
101) The launch was a great success. The new car was introduced on the 2nd of December 1927 in showrooms all over the country. 10 million Americans saw the car within 36h, 25 million within a week.
102) Ford was presented as the driver behind the whole process. 103) Ford Motor Company total production (US, Canada and
Foreign)= 555,796 cars in 1927 104) Ford Motor Company total production (US, Canada and
Foreign)= 833,511 cars in 1928 105) Ford market share in the UK had fallen to 5.7%m when Morris
and Austin combined accounted for 75% of the market. (1929)
106) Ford Motor Company total production (US, Canada and Foreign)= 1,967,741 cars in 1929
107) During the n1930’s Henry Ford disengaged from the company, pursuing other interests (Ford Museum, Greenfield Village, village industries, experimental soybean farms, practical educational projects). However, he was still making all major decisions in The Ford Motor Company, regarding new models, labor policy, etc.
108) Ford Motor Company total production (US, Canada and Foreign)= 1,5517,023 cars in 1930
109) Ford Motor Company total production (US, Canada and Foreign)= 771,444 cars in 1931
110) $140 million losses from 1931 to 1933 111) Ford Motor Company total production (US, Canada and
Foreign)= 451,591 cars in 1932 112) In December 1933 the Fortune magazine provided an in depth
analysis of Henry Ford and his company, identifying his authoritative management style and his apparent indifference to declining sales and losses.
113) $20 million losses in 1933 114) Ford Motor Company was losing market segment. In 1933
GM sold 650,000 cars (41%), Chrysler 400,000 cars (25%) and Ford 325,000 cars (21%).
115) Workers and executives were dissatisfied by work conditions as Ford developed an internal spying system, called the service department. Bennett, the department’s chief, had ties with the underworld and was carrying guns in the office. He was subverting his rivals in the company and acting as the company’s spokesman in union matters. (1933-1937)
116) Ford Motor Company total production (US, Canada and Foreign)= 515,488 cars in 1933
117) Ford Motor Company total production (US, Canada and Foreign)= 872,849 cars in 1934
118) Ford Motor Company total production (US, Canada and Foreign)= 1,368,139 cars in 1935
119) Ford Motor Company total production (US, Canada and Foreign)= 1,233,943 cars in 1936
120) Internal spying and harsh treatment of workers. Management was demanding faster pace of work under the threat of lay-
off. There was great fear between workmen, and extreme working conditions developed, such as workers not being allowed to talk, have only 15min lunch break and not being allowed to go to the toilet unless a substitute was available.
121) Ford men attacked union organizers on the 26th of May 1937, an incident that became known as the “battle of the Overpass”.
122) The National Labor Relations Board found Ford guilty of violating the Wagner Act for interfering with unionization and firing workers who tried to organize.
123) Ford Motor Company total production (US, Canada and Foreign)= 1,378,201 cars in 1937
124) Ford Motor Company total production (US, Canada and Foreign)= 797,566 cars in 1938
125) Initiation of WWII. (1939) 126) Ford Motor Company total production (US, Canada and
Foreign)= 1,009,598 cars in 1939 127) Ford Motor Company total production (US, Canada and
Foreign)= 1,099,538 cars in 1940 128) The US enters WWII (1941) 129) After GM and Chrysler agreed to recognize the union bodies.
Henry Ford only under the pressure of his son and some of his other managers agreed to hold a ballot as to whether workers would like union representatives.
130) In the ballot that took place on the 21st of May 1941 only 3% of workers voted for no union representation. Upon these results unions were recognized by The Ford Motor Company.
131) Ford Motor Company total production (US, Canada and Foreign)= 1,157,121 cars in 1941
132) There is controversy about the Ford Motor Company’s role in WWII. There are claims that the company and the Ford family supported both sides. The Ford Motor Company claims that the company had no control over what happened at the subsidiary, Ford-Werke, and that it did not profit from wartime operations at the German plant.
133) Ford Motor Company total production (US, Canada and Foreign)= 416,456 cars in 1942
134) Upon Edsel’s sudden death Henry became president on June 1, 1943. His leadership was ineffective, as his mental health was deteriorating.
135) Ford Motor Company total production (US, Canada and Foreign)= 307455 cars in 1943
136) Ford Motor Company total production (US, Canada and Foreign)= 321,973 cars in 1944
137) Internal corporate politics between Bennett and Henry II climaxed. (1945)
138) Only in 1945 when Henry Ford reached the point of not being able to recognize many others beyond his immediate family, he stepped down. Henry II became president in September 21 1945.
139) The presidency of Henry II initiated a new era of reorganisation of operations and corporate structure. (1945)
140) Ford Motor Company total production (US, Canada and Foreign)= 283,920 cars in 1945
Page 31 of 31 ANZAM 2011