rerep: computational detection of repetitive sequences in genome survey sequences (gss
TRANSCRIPT
BioMed CentralBMC Bioinformatics
ss
Open AcceMethodology articleReRep: Computational detection of repetitive sequences in genome survey sequences (GSS)Thomas D Otto*1,2, Leonardo HF Gomes1,3, Marcelo Alves-Ferreira1, Antonio B de Miranda1 and Wim M Degrave1Address: 1Laboratory for Functional Genomics and Bioinformatics, IOC, Fiocruz, Rio de Janeiro, Brazil, 2Fundação Ataulpho de Paiva, Rio de Janeiro, Brazil and 3Medicine Faculty, UFRJ, Rio de Janeiro, Brazil
Email: Thomas D Otto* - [email protected]; Leonardo HF Gomes - [email protected]; Marcelo Alves-Ferreira - [email protected]; Antonio B de Miranda - [email protected]; Wim M Degrave - [email protected]
* Corresponding author
AbstractBackground: Genome survey sequences (GSS) offer a preliminary global view of a genome since,unlike ESTs, they cover coding as well as non-coding DNA and include repetitive regions of thegenome. A more precise estimation of the nature, quantity and variability of repetitive sequencesvery early in a genome sequencing project is of considerable importance, as such data stronglyinfluence the estimation of genome coverage, library quality and progress in scaffold construction.Also, the elimination of repetitive sequences from the initial assembly process is important to avoiderrors and unnecessary complexity. Repetitive sequences are also of interest in a variety of otherstudies, for instance as molecular markers.
Results: We designed and implemented a straightforward pipeline called ReRep, which combinesbioinformatics tools for identifying repetitive structures in a GSS dataset. In a case study, we firstapplied the pipeline to a set of 970 GSSs, sequenced in our laboratory from the human pathogenLeishmania braziliensis, the causative agent of leishmaniosis, an important public health problem inBrazil. We also verified the applicability of ReRep to new sequencing technologies using a set of454-reads of an Escheria coli. The behaviour of several parameters in the algorithm is evaluated andsuggestions are made for tuning of the analysis.
Conclusion: The ReRep approach for identification of repetitive elements in GSS datasets provedto be straightforward and efficient. Several potential repetitive sequences were found in a L.braziliensis GSS dataset generated in our laboratory, and further validated by the analysis of a morecomplete genomic dataset from the EMBL and Sanger Centre databases. ReRep also identified mostof the E. coli K12 repeats prior to assembly in an example dataset obtained by automatedsequencing using 454 technology. The parameters controlling the algorithm behaved consistentlyand may be tuned to the properties of the dataset, in particular to the length of sequencing readsand the genome coverage. ReRep is freely available for academic use at http://bioinfo.pdtis.fiocruz.br/ReRep/.
Published: 9 September 2008
BMC Bioinformatics 2008, 9:366 doi:10.1186/1471-2105-9-366
Received: 23 May 2008Accepted: 9 September 2008
This article is available from: http://www.biomedcentral.com/1471-2105/9/366
© 2008 Otto et al; licensee BioMed Central Ltd. This is an Open Access article distributed under the terms of the Creative Commons Attribution License (http://creativecommons.org/licenses/by/2.0), which permits unrestricted use, distribution, and reproduction in any medium, provided the original work is properly cited.
Page 1 of 10(page number not for citation purposes)
BMC Bioinformatics 2008, 9:366 http://www.biomedcentral.com/1471-2105/9/366
BackgroundRepetitive sequences make up a significant part of manygenomes [1]. They are dynamic elements that contributeto plasticity, and they generally evolve faster than codingregions; for this reason they can be used in species identi-fication and phylogenetic inference [2]. Current genomesequencing methodologies involve mostly high-through-put shotgun approaches, and Genome Survey Sequencing(GSS) is often an initial but large-scale step. The presenceof a considerable amount of repetitive sequences in thegenome under study can hamper library construction,accurate sequencing and especially assembly of the finalgenome sequence. An early assessment of the nature, fre-quency and variability of the repetitive content of agenome is therefore important. Such data strongly influ-ence the evaluation of sequencing strategies and assemblybecause of the impact of repetitive elements on the esti-mation of genome coverage, library quality and progressin scaffold construction. The elimination of repetitivesequences from the initial assembly process is importantto avoid errors and unnecessary complexity. Identifiedrepeats can also be useful in a variety of other studies, forinstance as molecular markers in mapping and straincharacterization. For example, prior to large-scalesequencing of the Leishmania braziliensis genome, most ofits known repeats were simple microsatellites or species-specific repeats [3-5], while for Leishmania major, a closelyrelated species, several other types of repeats werereported [6]. A global analysis of the types and frequenciesof repeats of L. major could only be done after completionof the sequence [7].
Algorithms for de novo repeat detection [8] are normallybased on suffix trees [9,10], on word count algorithms[11,12] or on similarity searches [13]. Programs likeRepeatmasker (Smit, unpublished) search for repeatsusing a database of known repetitive sequences, such asRepbase [14]. However, the high evolutionary rates makedetection of a particular repeat feasible only in closelyrelated organisms, and many repeats are species-specific[1]. It is important to note that these programs usuallyrequire a complete and accurate genome assembly while,on the other hand, the presence of repeat sequencesgreatly hampers the assembly process in many eukaryotes,such as in Trypanosoma cruzi [15], human [16] or Dro-sophila [17]. One of the difficulties in repeat recognitionin GSS data arises when repeats are longer than the reads.During the assembly process these repeats tend to bejoined into one contig [18], but ideally, reads with repeti-tive sequences should be excluded from the initial assem-bly and mapped manually in the final stages [18].Identifying repetitive units before the assembly thus avoiderrors and speeds up the process, providing more accuratescaffolds. However, it is difficult to detect and estimate thefrequency of repeats when working with a small dataset
(e.g. at low genome coverage), and it is hard to differenti-ate between a truly repetitive sequence and a genomicregion with higher sequencing coverage.
To help identify repetitive units before the assembly phaseof a genome, we designed and evaluated a pipeline(ReRep – Read Repeat Finder) based on similaritysearches [19,20], the interpretation of sequence land-scapes [21], the assembly of clustered sequences [22] andin-house Perl scripts. The main challenge is to determinethe limits of the repetitive sequences found in the GSSdataset and to estimate their abundance in the wholegenome.
As a case study, we used 970 GSS with at least 150 bp ofgood quality (Phred quality Q >= 20 [23]) generated inour laboratory and covering approximately 1.4% of thegenome of L. braziliensis. Several putative repetitive struc-tures could be identified with our approach. Results werethen verified against several datasets representing about16% coverage, such as L. braziliensis GSS obtained fromEMBL (described in [24]), from the Sanger Centre (WholeGenome Shotgun sequences, WGS) and against the com-plete assembled genome. Human leishmaniasis, a tropi-cal disease transmitted by phlebotomine sand flies, iscaused by protozoan parasites of the genus Leishmania. L.braziliensis is the most common etiological agent of cuta-neous leishmaniasis in Brazil and the disease constitutesan important public health problem in Brazil and otherCentral and South American countries [25]. We alsoapplied ReRep to a large set of reads obtained from agenome project of E. coli K12 using 454 technology, toascertain the viability of the methodology with the shorterreads from this approach. We could also determine thenumber of false positives and negatives in this experi-ment, as the genome is completely assembled.
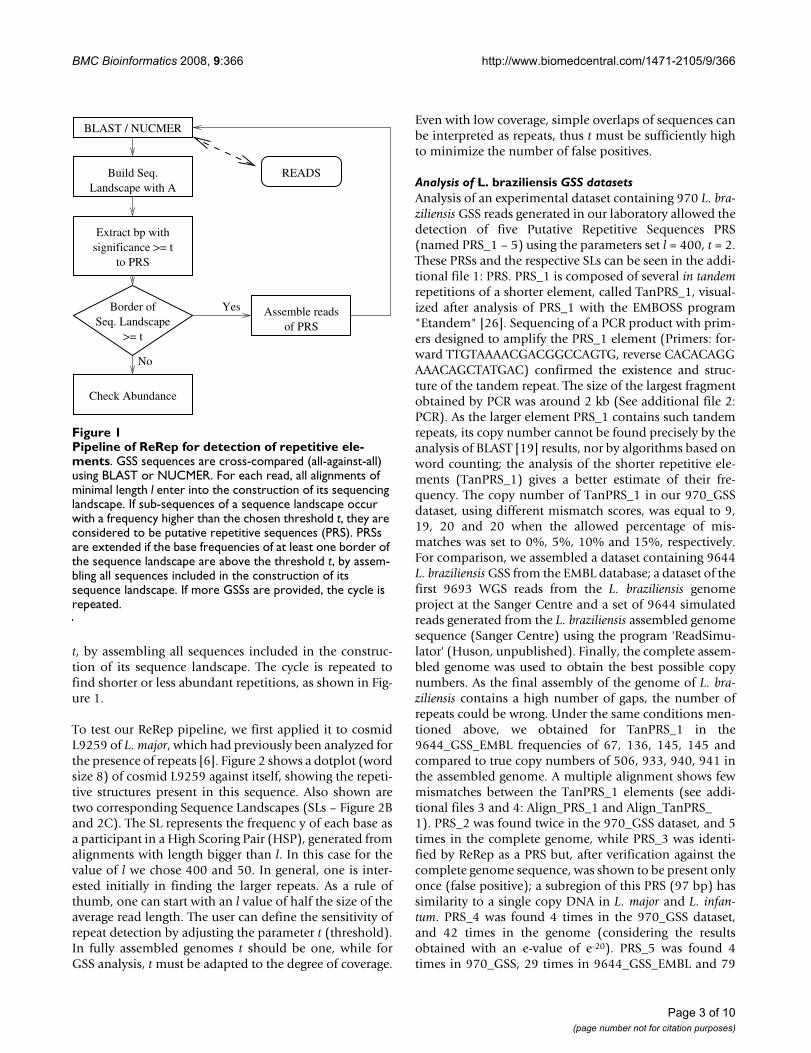
ResultsDesign and testing of ReRepDuring GSS sequencing in a larger project, and usuallybefore assembly, repetitive elements should be identifiedand temporarily removed from the dataset. For this pur-pose, we developed a workflow (Figure 1) where GSSsequences are cross-compared (all-against-all) usingBLAST [19] or NUCMER from the MUMmer package [20].To speed up the algorithm, the first seed (word size withdefault value of 11) can be increased. For each read, allalignments of minimal length l enter into the construc-tion of the sequencing landscape, a graphical representa-tion of the abundance of each base in the sequence(Figure 2B). If sub-sequences of a landscape occur with afrequency higher than the chosen threshold t, they areconsidered to be Putative Repetitive Sequences (PRS).PRSs are extended if the base frequencies of at least oneborder of the sequence landscape are above the threshold
Page 2 of 10(page number not for citation purposes)
BMC Bioinformatics 2008, 9:366 http://www.biomedcentral.com/1471-2105/9/366
t, by assembling all sequences included in the construc-tion of its sequence landscape. The cycle is repeated tofind shorter or less abundant repetitions, as shown in Fig-ure 1.
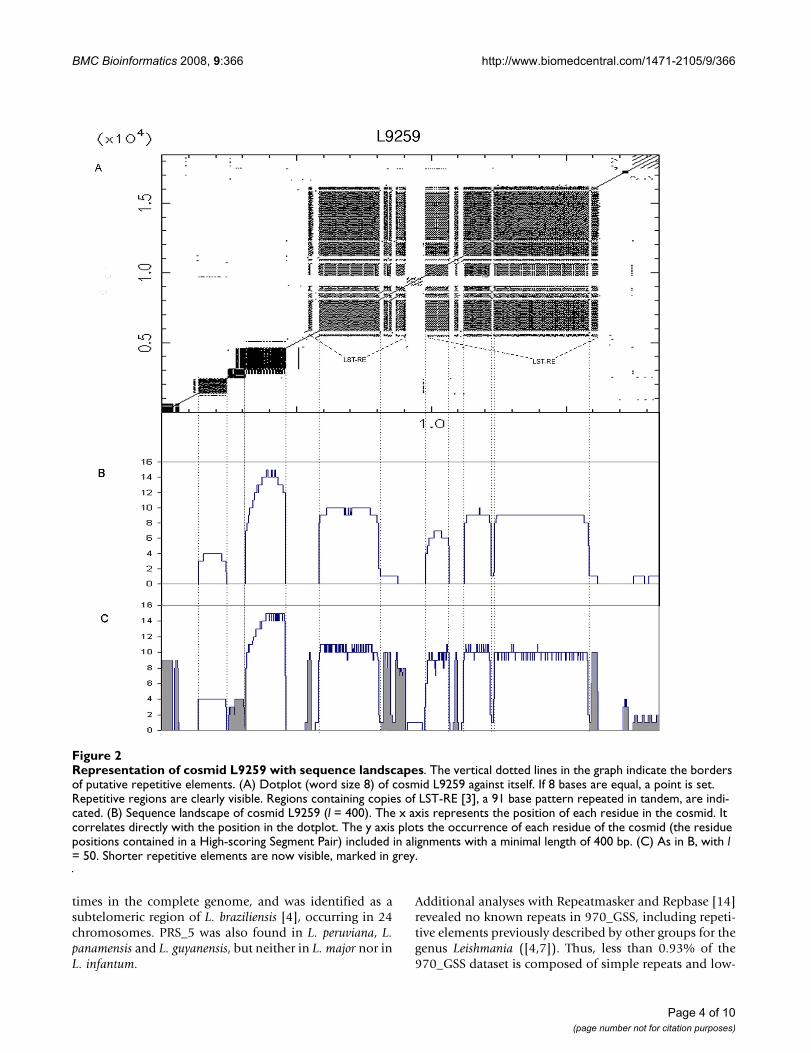
To test our ReRep pipeline, we first applied it to cosmidL9259 of L. major, which had previously been analyzed forthe presence of repeats [6]. Figure 2 shows a dotplot (wordsize 8) of cosmid L9259 against itself, showing the repeti-tive structures present in this sequence. Also shown aretwo corresponding Sequence Landscapes (SLs – Figure 2Band 2C). The SL represents the frequenc y of each base asa participant in a High Scoring Pair (HSP), generated fromalignments with length bigger than l. In this case for thevalue of l we chose 400 and 50. In general, one is inter-ested initially in finding the larger repeats. As a rule ofthumb, one can start with an l value of half the size of theaverage read length. The user can define the sensitivity ofrepeat detection by adjusting the parameter t (threshold).In fully assembled genomes t should be one, while forGSS analysis, t must be adapted to the degree of coverage.
Even with low coverage, simple overlaps of sequences canbe interpreted as repeats, thus t must be sufficiently highto minimize the number of false positives.
Analysis of L. braziliensis GSS datasetsAnalysis of an experimental dataset containing 970 L. bra-ziliensis GSS reads generated in our laboratory allowed thedetection of five Putative Repetitive Sequences PRS(named PRS_1 – 5) using the parameters set l = 400, t = 2.These PRSs and the respective SLs can be seen in the addi-tional file 1: PRS. PRS_1 is composed of several in tandemrepetitions of a shorter element, called TanPRS_1, visual-ized after analysis of PRS_1 with the EMBOSS program"Etandem" [26]. Sequencing of a PCR product with prim-ers designed to amplify the PRS_1 element (Primers: for-ward TTGTAAAACGACGGCCAGTG, reverse CACACAGGAAACAGCTATGAC) confirmed the existence and struc-ture of the tandem repeat. The size of the largest fragmentobtained by PCR was around 2 kb (See additional file 2:PCR). As the larger element PRS_1 contains such tandemrepeats, its copy number cannot be found precisely by theanalysis of BLAST [19] results, nor by algorithms based onword counting; the analysis of the shorter repetitive ele-ments (TanPRS_1) gives a better estimate of their fre-quency. The copy number of TanPRS_1 in our 970_GSSdataset, using different mismatch scores, was equal to 9,19, 20 and 20 when the allowed percentage of mis-matches was set to 0%, 5%, 10% and 15%, respectively.For comparison, we assembled a dataset containing 9644L. braziliensis GSS from the EMBL database; a dataset of thefirst 9693 WGS reads from the L. braziliensis genomeproject at the Sanger Centre and a set of 9644 simulatedreads generated from the L. braziliensis assembled genomesequence (Sanger Centre) using the program 'ReadSimu-lator' (Huson, unpublished). Finally, the complete assem-bled genome was used to obtain the best possible copynumbers. As the final assembly of the genome of L. bra-ziliensis contains a high number of gaps, the number ofrepeats could be wrong. Under the same conditions men-tioned above, we obtained for TanPRS_1 in the9644_GSS_EMBL frequencies of 67, 136, 145, 145 andcompared to true copy numbers of 506, 933, 940, 941 inthe assembled genome. A multiple alignment shows fewmismatches between the TanPRS_1 elements (see addi-tional files 3 and 4: Align_PRS_1 and Align_TanPRS_1). PRS_2 was found twice in the 970_GSS dataset, and 5times in the complete genome, while PRS_3 was identi-fied by ReRep as a PRS but, after verification against thecomplete genome sequence, was shown to be present onlyonce (false positive); a subregion of this PRS (97 bp) hassimilarity to a single copy DNA in L. major and L. infan-tum. PRS_4 was found 4 times in the 970_GSS dataset,and 42 times in the genome (considering the resultsobtained with an e-value of e-20). PRS_5 was found 4times in 970_GSS, 29 times in 9644_GSS_EMBL and 79
Pipeline of ReRep for detection of repetitive elementsFigure 1Pipeline of ReRep for detection of repetitive ele-ments. GSS sequences are cross-compared (all-against-all) using BLAST or NUCMER. For each read, all alignments of minimal length l enter into the construction of its sequencing landscape. If sub-sequences of a sequence landscape occur with a frequency higher than the chosen threshold t, they are considered to be putative repetitive sequences (PRS). PRSs are extended if the base frequencies of at least one border of the sequence landscape are above the threshold t, by assem-bling all sequences included in the construction of its sequence landscape. If more GSSs are provided, the cycle is repeated.
READS
Extract bp with
to PRS
Border of
>= t
Check Abundance
Landscape with ABuild Seq.
significance >= t
Seq. Landscape of PRSAssemble reads
No
Yes
BLAST / NUCMER
Page 3 of 10(page number not for citation purposes)
BMC Bioinformatics 2008, 9:366 http://www.biomedcentral.com/1471-2105/9/366
times in the complete genome, and was identified as asubtelomeric region of L. braziliensis [4], occurring in 24chromosomes. PRS_5 was also found in L. peruviana, L.panamensis and L. guyanensis, but neither in L. major nor inL. infantum.
Additional analyses with Repeatmasker and Repbase [14]revealed no known repeats in 970_GSS, including repeti-tive elements previously described by other groups for thegenus Leishmania ([4,7]). Thus, less than 0.93% of the970_GSS dataset is composed of simple repeats and low-
Representation of cosmid L9259 with sequence landscapesFigure 2Representation of cosmid L9259 with sequence landscapes. The vertical dotted lines in the graph indicate the borders of putative repetitive elements. (A) Dotplot (word size 8) of cosmid L9259 against itself. If 8 bases are equal, a point is set. Repetitive regions are clearly visible. Regions containing copies of LST-RE [3], a 91 base pattern repeated in tandem, are indi-cated. (B) Sequence landscape of cosmid L9259 (l = 400). The x axis represents the position of each residue in the cosmid. It correlates directly with the position in the dotplot. The y axis plots the occurrence of each residue of the cosmid (the residue positions contained in a High-scoring Segment Pair) included in alignments with a minimal length of 400 bp. (C) As in B, with l = 50. Shorter repetitive elements are now visible, marked in grey.
Page 4 of 10(page number not for citation purposes)
BMC Bioinformatics 2008, 9:366 http://www.biomedcentral.com/1471-2105/9/366
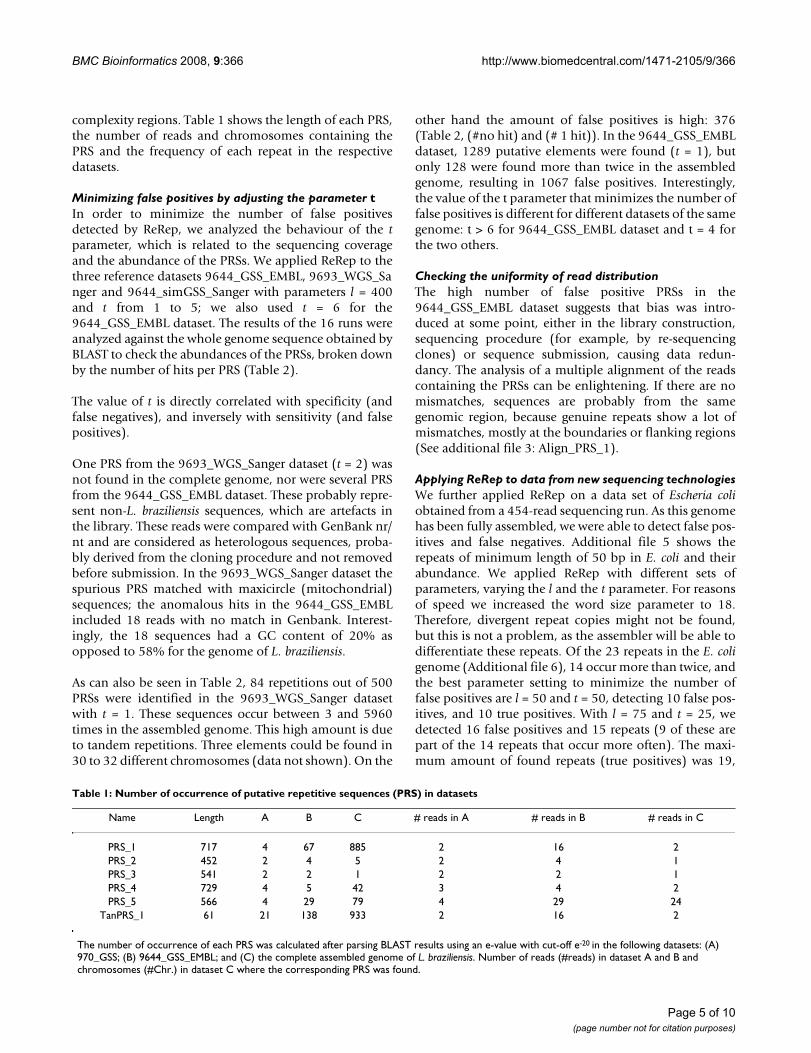
complexity regions. Table 1 shows the length of each PRS,the number of reads and chromosomes containing thePRS and the frequency of each repeat in the respectivedatasets.
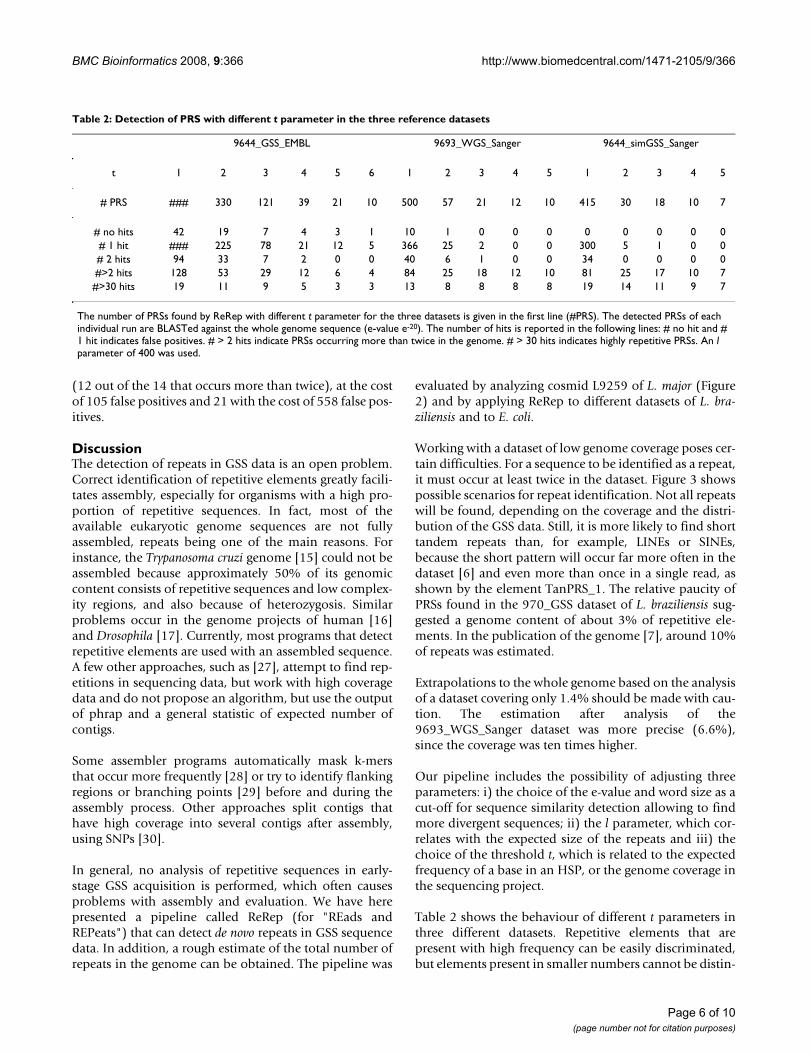
Minimizing false positives by adjusting the parameter tIn order to minimize the number of false positivesdetected by ReRep, we analyzed the behaviour of the tparameter, which is related to the sequencing coverageand the abundance of the PRSs. We applied ReRep to thethree reference datasets 9644_GSS_EMBL, 9693_WGS_Sanger and 9644_simGSS_Sanger with parameters l = 400and t from 1 to 5; we also used t = 6 for the9644_GSS_EMBL dataset. The results of the 16 runs wereanalyzed against the whole genome sequence obtained byBLAST to check the abundances of the PRSs, broken downby the number of hits per PRS (Table 2).
The value of t is directly correlated with specificity (andfalse negatives), and inversely with sensitivity (and falsepositives).
One PRS from the 9693_WGS_Sanger dataset (t = 2) wasnot found in the complete genome, nor were several PRSfrom the 9644_GSS_EMBL dataset. These probably repre-sent non-L. braziliensis sequences, which are artefacts inthe library. These reads were compared with GenBank nr/nt and are considered as heterologous sequences, proba-bly derived from the cloning procedure and not removedbefore submission. In the 9693_WGS_Sanger dataset thespurious PRS matched with maxicircle (mitochondrial)sequences; the anomalous hits in the 9644_GSS_EMBLincluded 18 reads with no match in Genbank. Interest-ingly, the 18 sequences had a GC content of 20% asopposed to 58% for the genome of L. braziliensis.
As can also be seen in Table 2, 84 repetitions out of 500PRSs were identified in the 9693_WGS_Sanger datasetwith t = 1. These sequences occur between 3 and 5960times in the assembled genome. This high amount is dueto tandem repetitions. Three elements could be found in30 to 32 different chromosomes (data not shown). On the
other hand the amount of false positives is high: 376(Table 2, (#no hit) and (# 1 hit)). In the 9644_GSS_EMBLdataset, 1289 putative elements were found (t = 1), butonly 128 were found more than twice in the assembledgenome, resulting in 1067 false positives. Interestingly,the value of the t parameter that minimizes the number offalse positives is different for different datasets of the samegenome: t > 6 for 9644_GSS_EMBL dataset and t = 4 forthe two others.
Checking the uniformity of read distributionThe high number of false positive PRSs in the9644_GSS_EMBL dataset suggests that bias was intro-duced at some point, either in the library construction,sequencing procedure (for example, by re-sequencingclones) or sequence submission, causing data redun-dancy. The analysis of a multiple alignment of the readscontaining the PRSs can be enlightening. If there are nomismatches, sequences are probably from the samegenomic region, because genuine repeats show a lot ofmismatches, mostly at the boundaries or flanking regions(See additional file 3: Align_PRS_1).
Applying ReRep to data from new sequencing technologiesWe further applied ReRep on a data set of Escheria coliobtained from a 454-read sequencing run. As this genomehas been fully assembled, we were able to detect false pos-itives and false negatives. Additional file 5 shows therepeats of minimum length of 50 bp in E. coli and theirabundance. We applied ReRep with different sets ofparameters, varying the l and the t parameter. For reasonsof speed we increased the word size parameter to 18.Therefore, divergent repeat copies might not be found,but this is not a problem, as the assembler will be able todifferentiate these repeats. Of the 23 repeats in the E. coligenome (Additional file 6), 14 occur more than twice, andthe best parameter setting to minimize the number offalse positives are l = 50 and t = 50, detecting 10 false pos-itives, and 10 true positives. With l = 75 and t = 25, wedetected 16 false positives and 15 repeats (9 of these arepart of the 14 repeats that occur more often). The maxi-mum amount of found repeats (true positives) was 19,
Table 1: Number of occurrence of putative repetitive sequences (PRS) in datasets
Name Length A B C # reads in A # reads in B # reads in C
PRS_1 717 4 67 885 2 16 2PRS_2 452 2 4 5 2 4 1PRS_3 541 2 2 1 2 2 1PRS_4 729 4 5 42 3 4 2PRS_5 566 4 29 79 4 29 24
TanPRS_1 61 21 138 933 2 16 2
The number of occurrence of each PRS was calculated after parsing BLAST results using an e-value with cut-off e-20 in the following datasets: (A) 970_GSS; (B) 9644_GSS_EMBL; and (C) the complete assembled genome of L. braziliensis. Number of reads (#reads) in dataset A and B and chromosomes (#Chr.) in dataset C where the corresponding PRS was found.
Page 5 of 10(page number not for citation purposes)
BMC Bioinformatics 2008, 9:366 http://www.biomedcentral.com/1471-2105/9/366
(12 out of the 14 that occurs more than twice), at the costof 105 false positives and 21 with the cost of 558 false pos-itives.
DiscussionThe detection of repeats in GSS data is an open problem.Correct identification of repetitive elements greatly facili-tates assembly, especially for organisms with a high pro-portion of repetitive sequences. In fact, most of theavailable eukaryotic genome sequences are not fullyassembled, repeats being one of the main reasons. Forinstance, the Trypanosoma cruzi genome [15] could not beassembled because approximately 50% of its genomiccontent consists of repetitive sequences and low complex-ity regions, and also because of heterozygosis. Similarproblems occur in the genome projects of human [16]and Drosophila [17]. Currently, most programs that detectrepetitive elements are used with an assembled sequence.A few other approaches, such as [27], attempt to find rep-etitions in sequencing data, but work with high coveragedata and do not propose an algorithm, but use the outputof phrap and a general statistic of expected number ofcontigs.
Some assembler programs automatically mask k-mersthat occur more frequently [28] or try to identify flankingregions or branching points [29] before and during theassembly process. Other approaches split contigs thathave high coverage into several contigs after assembly,using SNPs [30].
In general, no analysis of repetitive sequences in early-stage GSS acquisition is performed, which often causesproblems with assembly and evaluation. We have herepresented a pipeline called ReRep (for "REads andREPeats") that can detect de novo repeats in GSS sequencedata. In addition, a rough estimate of the total number ofrepeats in the genome can be obtained. The pipeline was
evaluated by analyzing cosmid L9259 of L. major (Figure2) and by applying ReRep to different datasets of L. bra-ziliensis and to E. coli.
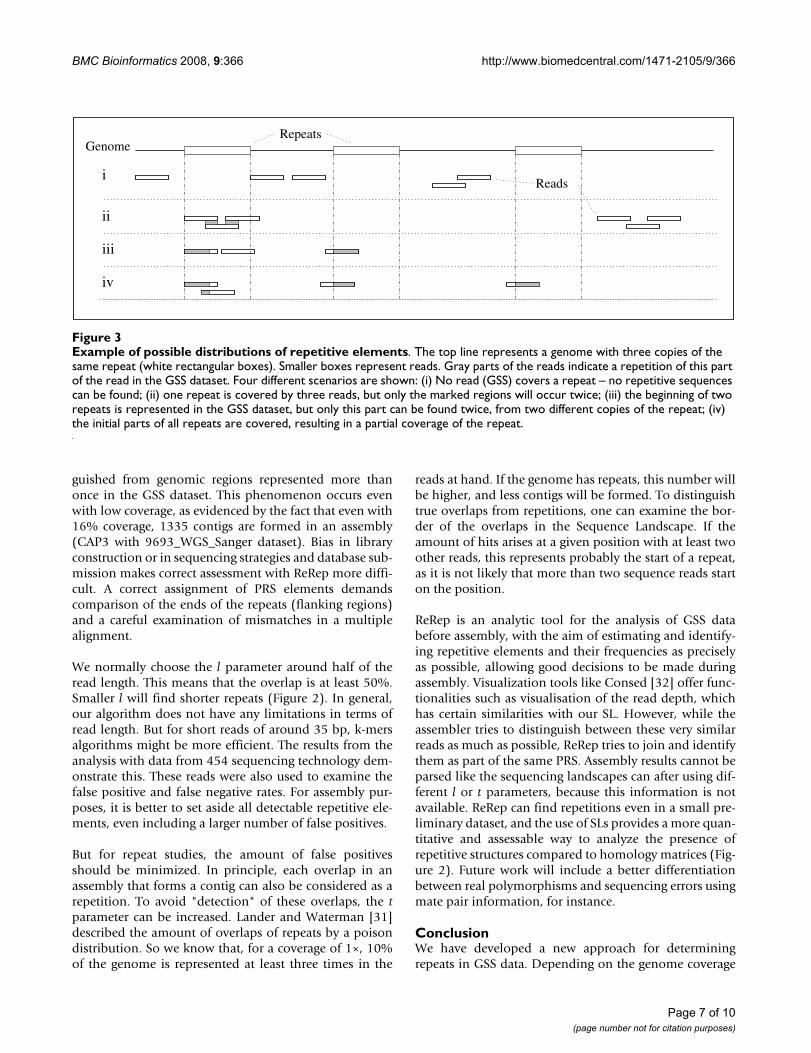
Working with a dataset of low genome coverage poses cer-tain difficulties. For a sequence to be identified as a repeat,it must occur at least twice in the dataset. Figure 3 showspossible scenarios for repeat identification. Not all repeatswill be found, depending on the coverage and the distri-bution of the GSS data. Still, it is more likely to find shorttandem repeats than, for example, LINEs or SINEs,because the short pattern will occur far more often in thedataset [6] and even more than once in a single read, asshown by the element TanPRS_1. The relative paucity ofPRSs found in the 970_GSS dataset of L. braziliensis sug-gested a genome content of about 3% of repetitive ele-ments. In the publication of the genome [7], around 10%of repeats was estimated.
Extrapolations to the whole genome based on the analysisof a dataset covering only 1.4% should be made with cau-tion. The estimation after analysis of the9693_WGS_Sanger dataset was more precise (6.6%),since the coverage was ten times higher.
Our pipeline includes the possibility of adjusting threeparameters: i) the choice of the e-value and word size as acut-off for sequence similarity detection allowing to findmore divergent sequences; ii) the l parameter, which cor-relates with the expected size of the repeats and iii) thechoice of the threshold t, which is related to the expectedfrequency of a base in an HSP, or the genome coverage inthe sequencing project.
Table 2 shows the behaviour of different t parameters inthree different datasets. Repetitive elements that arepresent with high frequency can be easily discriminated,but elements present in smaller numbers cannot be distin-
Table 2: Detection of PRS with different t parameter in the three reference datasets
9644_GSS_EMBL 9693_WGS_Sanger 9644_simGSS_Sanger
t 1 2 3 4 5 6 1 2 3 4 5 1 2 3 4 5
# PRS ### 330 121 39 21 10 500 57 21 12 10 415 30 18 10 7
# no hits 42 19 7 4 3 1 10 1 0 0 0 0 0 0 0 0# 1 hit ### 225 78 21 12 5 366 25 2 0 0 300 5 1 0 0# 2 hits 94 33 7 2 0 0 40 6 1 0 0 34 0 0 0 0#>2 hits 128 53 29 12 6 4 84 25 18 12 10 81 25 17 10 7#>30 hits 19 11 9 5 3 3 13 8 8 8 8 19 14 11 9 7
The number of PRSs found by ReRep with different t parameter for the three datasets is given in the first line (#PRS). The detected PRSs of each individual run are BLASTed against the whole genome sequence (e-value e-20). The number of hits is reported in the following lines: # no hit and # 1 hit indicates false positives. # > 2 hits indicate PRSs occurring more than twice in the genome. # > 30 hits indicates highly repetitive PRSs. An l parameter of 400 was used.
Page 6 of 10(page number not for citation purposes)
BMC Bioinformatics 2008, 9:366 http://www.biomedcentral.com/1471-2105/9/366
guished from genomic regions represented more thanonce in the GSS dataset. This phenomenon occurs evenwith low coverage, as evidenced by the fact that even with16% coverage, 1335 contigs are formed in an assembly(CAP3 with 9693_WGS_Sanger dataset). Bias in libraryconstruction or in sequencing strategies and database sub-mission makes correct assessment with ReRep more diffi-cult. A correct assignment of PRS elements demandscomparison of the ends of the repeats (flanking regions)and a careful examination of mismatches in a multiplealignment.
We normally choose the l parameter around half of theread length. This means that the overlap is at least 50%.Smaller l will find shorter repeats (Figure 2). In general,our algorithm does not have any limitations in terms ofread length. But for short reads of around 35 bp, k-mersalgorithms might be more efficient. The results from theanalysis with data from 454 sequencing technology dem-onstrate this. These reads were also used to examine thefalse positive and false negative rates. For assembly pur-poses, it is better to set aside all detectable repetitive ele-ments, even including a larger number of false positives.
But for repeat studies, the amount of false positivesshould be minimized. In principle, each overlap in anassembly that forms a contig can also be considered as arepetition. To avoid "detection" of these overlaps, the tparameter can be increased. Lander and Waterman [31]described the amount of overlaps of repeats by a poisondistribution. So we know that, for a coverage of 1×, 10%of the genome is represented at least three times in the
reads at hand. If the genome has repeats, this number willbe higher, and less contigs will be formed. To distinguishtrue overlaps from repetitions, one can examine the bor-der of the overlaps in the Sequence Landscape. If theamount of hits arises at a given position with at least twoother reads, this represents probably the start of a repeat,as it is not likely that more than two sequence reads starton the position.
ReRep is an analytic tool for the analysis of GSS databefore assembly, with the aim of estimating and identify-ing repetitive elements and their frequencies as preciselyas possible, allowing good decisions to be made duringassembly. Visualization tools like Consed [32] offer func-tionalities such as visualisation of the read depth, whichhas certain similarities with our SL. However, while theassembler tries to distinguish between these very similarreads as much as possible, ReRep tries to join and identifythem as part of the same PRS. Assembly results cannot beparsed like the sequencing landscapes can after using dif-ferent l or t parameters, because this information is notavailable. ReRep can find repetitions even in a small pre-liminary dataset, and the use of SLs provides a more quan-titative and assessable way to analyze the presence ofrepetitive structures compared to homology matrices (Fig-ure 2). Future work will include a better differentiationbetween real polymorphisms and sequencing errors usingmate pair information, for instance.
ConclusionWe have developed a new approach for determiningrepeats in GSS data. Depending on the genome coverage
Example of possible distributions of repetitive elementsFigure 3Example of possible distributions of repetitive elements. The top line represents a genome with three copies of the same repeat (white rectangular boxes). Smaller boxes represent reads. Gray parts of the reads indicate a repetition of this part of the read in the GSS dataset. Four different scenarios are shown: (i) No read (GSS) covers a repeat – no repetitive sequences can be found; (ii) one repeat is covered by three reads, but only the marked regions will occur twice; (iii) the beginning of two repeats is represented in the GSS dataset, but only this part can be found twice, from two different copies of the repeat; (iv) the initial parts of all repeats are covered, resulting in a partial coverage of the repeat.
i
ii
iii
iv
Reads
RepeatsGenome
Page 7 of 10(page number not for citation purposes)
BMC Bioinformatics 2008, 9:366 http://www.biomedcentral.com/1471-2105/9/366
of the GSS dataset, it may not be possible to detect allrepeats. But depending on the copy number of the repeti-tive elements identified, it is possible to obtain a roughestimate of their total frequency in the genome. In addi-tion, the results can be used to optimize the sequenceassembly process. After application of our pipeline to a L.braziliensis GSS dataset, four repeats were identified, ofwhich three had not been documented so far.
MethodsParasite strain and cultureLeishmania braziliensis (MHOM/BR/1968/M2904) cellmass was kindly provided by the Leishmania ReferenceCenter at IOC, Fiocruz (Dr. E. Cupolillo). Promastigoteswere cultured at 26°C in M199 medium (HyClone) sup-plemented with 10% (v/v) heat-inactivated fetal bovineserum (Gibco), 100 μM adenine, 10 μg/mL haemin, 40μmM HEPES (N-2-hydroxyethylpiperazine-N-ethanesul-fonic acid pH 7.4), penicillin 50 U/mL, streptomycin 50μm/L and 2% human urine.
Library construction and DNA sequencingL. braziliensis high-molecular-weight genomic DNA wasextracted by alkaline lysis, sheared and sized to around 2–3 kb to construct a genomic library in pUC18. Plasmidtemplates from the 2–3 kb insert semi-random librarywere prepared with a Wizard-SV 96 plasmid purificationsystem (Promega). Double-stranded plasmid DNA tem-plates were sequenced using Big Dye terminator chemistrywith M13 forward and reverse primers and run on an ABI3730 sequencer (Applied Biosystems).
DatasetsWe first constructed a dataset ('970_GSS') by sequencing970 GSS with an average length of 550 bp and at least 150bp of Phred quality equal to or higher than 20 [23]. Allsequences were submitted to GenBank (Genbank:EI184570 – Genbank: EI185539). Assuming a 32 Mb hap-loid genome size for L. braziliensis [7], this represents agenome coverage of approximately 1.4%. A second data-set was constructed that included all available GSS for L.braziliensis data from EMBL ('9644_GSS_EMBL' EMBL:BX53013 – EMBL: BX53013; EMBL: BX897701 –EMBL:BX908718), comprising 9644 sequences (includ-ing the first dataset) with a average length of 544 bp. Athird dataset consisted of the first 9693 reads (averagelength 539 bp) from the WGS dataset from the SangerInstitute ('9693_WGS_Sanger' [33]). We also used the 35available chromosomes of L. braziliensis (EMBL:AM494938 to EMBL: AM494972) to better estimate theobserved frequencies of the repetitive structures identifiedin this work. Due to gaps in the assembly, the exactnumber cannot be determined. A fourth dataset was con-structed by simulating GSS data from the 35 chromo-somes using a ReadSimulator (Huson, unpublished). This
dataset ('9644_simGSS_Sanger') has approximately thesame coverage (~16%), the same mean read length as thefirst dataset and approximately the same amount of basepairs as the other datasets. Pyrosequencing [34] (454)reads of Escheria coli K12 were obtained from [35]. Weused around 400,000 reads (mean length of 109 bp),which cover the genome (4.6 MB) around 8 times.
Known repeats and sequence featuresA search for sequences similar to known repeats (Repbasevolume 11 issue 12) was performed using the programRepeatmasker. In addition, we used Repeatmasker to findmicrosatellites, tandem repeats and low-complexityregions.
De novo repeat identificationWe implemented a pipeline (ReRep) that is based on sim-ilarity searches, the interpretation of sequence landscapes(SL), the assembly of clustered sequences and in-housePerl scripts. First, all reads are compared to each otherwith BLAST [19], with a word size of 8 and an e-value cut-off of 10-20, or NUCMER [20], with a word size of 11. Eachresult is pre-processed by joining overlapping hits and bydeleting self-hits. For each read, an SL is constructed bycounting how often each base of the read is part of a hitwith another read. To generate the graph, we used the GDlibrary [36]. The minimal length that an alignment musthave to enter into the analysis was defined as l. Runs withdifferent values for l can be performed.
Sequence landscapes and repeat extensionThe SL of each particular sequence represents how oftenits sub-sequences (with minimum length l) are repre-sented in the dataset. All sub-sequences that occur moreoften than t times are retrieved from the SL as PutativeRepetitive Sequences (PRS). The parameter t is deter-mined according to the coverage.
To extend repeats that are longer than a GSS, the borders(the first or the last base) of the SL are analysed: If one orboth borders score above or equal to the threshold t, therepeat is extended over the read. In this case, all reads thatare part of the SL are assembled with CAP3 [21]. From theconsensus of the assembly an SL is again constructed byrepeating the comparison step. These steps are reiteratedas long as the borders in the SL satisfy the threshold t ornew GSS enter into the assembly. The identified repetitivestructures, referred to in this work as Putative RepetitiveSequences (PRS), are obtained by retrieving each base pairwith a frequency equal to or above the threshold t fromthe SL. Note that more than one PRS can be obtained froma single SL if two different regions of the SL score signifi-cantly. The consensus can be obtained by i) assembling allthe reads forming the SL with CAP3 or ii) if parts of somereads are unique, a multiple alignment can be constructed
Page 8 of 10(page number not for citation purposes)
BMC Bioinformatics 2008, 9:366 http://www.biomedcentral.com/1471-2105/9/366
using ClustalW [37]. To avoid reprocessing the SLs withknown PRS, all sequences in the GSS data containing thisPRS are masked by Cross_match (Green, unpublished).Besides masking known PRS, SLs containing this PRSsequence will be analyzed with a new value for l in thenext iteration. Each PRS is then examined for tandemstructures, repetitive substructures or fusion of more thanone repeat.
Repeat frequency determinationTo count the frequency of each PRS we used the program'Fuzznuc' of the EMBOSS package [25], allowing 0%, 5%,10% and 15% of possible mismatches for shortsequences. To compare this result with a similarity searchresult and to count the number of reads in which each PRSoccurs, two BLAST comparisons (e-value 10-20 and 10-60)were performed. A rough estimate of the abundance of therepetitive elements in the whole genome may be obtainedby multiplying the frequency of each PRS in the GSS data-set by the reciprocal of its coverage.
Availability and requirementsProject name: ReRep - Detecting repeats in sequencingreads
Project home page: http://bioinfo.pdtis.fiocruz.br/ReRep/
Operating systems: Linux
Programming language: Perl
Other requirements: Perl GD, BLAST, Nucmer (MUMmer)and CAP3
License: ReRep is distributed under a GPL license
Authors' contributionsTO, AB and WD designed the algorithm and wrote themanuscript. TO implemented and applied the algorithm.LG and MF obtained the 970 GSS sequences. All authorsread and approved the final manuscript.
Additional material
AcknowledgementsWe thank the platform PDTIS/Genomic-DNA Sequencing (Fiocruz), the platform PDTIS/bioinformatics (Fiocruz) [38], the Leishmania Reference Centre (Dr. E. Cupolillo), and CAPES and FAPERJ for financial support. We thank Knut Reinert for valuable discussions about the differentiation of repetitive sequences and Martin Böhme for proofreading.
References1. Wickstead B, Ersfeld K, Gull K: Repetitive Elements in Genomes
of Parasitic Protozoa. Microbiol Mol Biol Rev 2003, 67(3):360-375.2. Fu G, Perona-Wright G, Barker DC: Leishmania braziliensis: char-
acterisation of a complex specific subtelomeric repeatsequence and its use in the detection of parasites. Exp Parasitol1998, 90(3):236-243.
3. Fu G, Barker DC: Characterisation of Leishmania telomeresreveals unusual telomeric repeats and conserved telomere-associated sequence. Nucleic Acids Res 1998, 26(9):2161-2167.
4. Pedrosa AL, Silva AM, Ruiz JC, Cruz AK: Characterization of LST-R533: uncovering a novel repetitive element in Leishmania.Int J Parasitol 2006, 36(2):211-217.
5. Rodriguez N, Lima HD, Rodriguez A, Brewster S, Barker DC:Genomic DNA repeat from Leishmania (Viannia) braziliensis
Additional file 1Sequences and Sequence Landscapes of the PRS. The DNA sequence and SL of PRS_1 – PRS_5 is given, using l = 400.Click here for file[http://www.biomedcentral.com/content/supplementary/1471-2105-9-366-S1.pdf]
Additional file 2PCR reaction for the elements PRS_1. Column MW: 1 kb marker plus DNA Ladder. Size of the bands is indicated on the left. Column 1: ampli-fication with primers: TTGTAAAACGACGGCCAGTG and CACACAG-GAAACAGCTATGAC.Click here for file[http://www.biomedcentral.com/content/supplementary/1471-2105-9-366-S2.pdf]
Additional file 3Multiple alignment for PRS_1. Multiple alignment of read GenBank: EI185111 and read GenBank: EI185194, representing PRS_1.Click here for file[http://www.biomedcentral.com/content/supplementary/1471-2105-9-366-S3.pdf]
Additional file 4Multiple alignment of the Tan-PRS_1 elements. The tandem elements of PRS_1 were extracted from the original GSS. Elements A1-A11 were obtained from GenBank: EI185111; elements B1-B10 from GenBank: EI185194.Click here for file[http://www.biomedcentral.com/content/supplementary/1471-2105-9-366-S4.pdf]
Additional file 5Table of repeats of E. coli K12. The name, the number of copies and the size of the repeats that are present in the E. coli K12 genome are listed, with indication, which of those are detected by ReRep analysis, with the corresponding parameter values of l and t.Click here for file[http://www.biomedcentral.com/content/supplementary/1471-2105-9-366-S5.pdf]
Additional file 6FASTA file of repeats of E. coli K12.Click here for file[http://www.biomedcentral.com/content/supplementary/1471-2105-9-366-S6.pdf]
Page 9 of 10(page number not for citation purposes)
BMC Bioinformatics 2008, 9:366 http://www.biomedcentral.com/1471-2105/9/366
(Venezuelan strain) containing simple repeats and microsat-ellites. Parasitology 1997, 115:349-358.
6. Sunkin SM, Kiser P, Myler PJ, Stuart K: The size differencebetween Leishmania major friedlin chromosome one homo-logues is localized to sub-telomeric repeats at one chromo-somal end. Mol Biochem Parasitol 2000, 109:1-15.
7. Peacock CS, Seeger K, Harris D, Murphy L, Ruiz JC, Quail MA, PetersN, Adlem E, Tivey1 A, Aslett M, Kerhornou A, Ivens A, Fraser A,Rajandream MA, Carver T, Norbertczak H, Chillingworth T, HanceZ, Jagels K, Moule S, Ormond D, Rutter S, Squares R, Whitehead S,Rabbinowitsch E, Arrowsmith C, White B, Thurston S, Bringaud F,Baldauf SL, Faulconbridge A, Jeffares D, Depledge DP, Oyola SO,Hilley JD, Brito LO, Tosi LRO, Barrell B, Angela K, Cruz JCM, SmithDF, Berriman M: Comparative genomic analysis of three Leish-mania species that cause diverse human disease. Nat Genet2007, 39(7):839-847.
8. Bao Z, Eddy SR: Automated De Novo Identification of RepeatSequence Families in Sequenced Genomes. Genome Res 2002,12:1269-1276.
9. Volfovsky N, Haas BJ, Salzberg SL: A clustering method forrepeat analysis in DNA sequences. Genome Biol 2001, 2(8):27.
10. Kurtz S, Choudhuri JV, Ohlebusch E, Schleiermacher C, Stoye J, Gieg-erich R: REPuter: The Manifold Applications of Repeat Anal-ysis on a Genomic Scale. Nucleic Acids Res 2001,29(22):4633-4642.
11. Healy J, Thomas EE, Schwartz JT, Wiegler M: Annotating largeGenomes with Exact Word Matches. Genome Res 2003,13(10):2306-2315.
12. Pevzner PA, Tang H, Tesler G: De novo repeat classification andfragment assembly. In RECOMB '04: Proceedings of the eighth annualinternational conference on Computational molecular biology New York,NY, USA: ACM Press; 2004:213-222.
13. Szklarczyk R, Heringa J: Tracking repeats using significance andtransitivity. Bioinformatics 2004, 20(Suppl 1):i311-i317.
14. Jurka J: Repbase update: a database and an electronic journalof repetitive elements. Trends Genet 2000, 16(9):418-420.
15. El-Sayed NM, Myler PJ, Bartholomeu DC, Nilsson D, Aggarwal G,Tran AN, Ghedin E, Worthey EA, Delcher AL, Blandin G, Westen-berger SJ, Caler E, Cerqueira GC, Branche C, Haas B, Anupama A,Arner E, Aslund L, Attipoe P, Bontempi E, Bringaud F, Burton P,Cadag E, Campbell DA, Carrington M, Crabtree J, Darban H, da Sil-veira JF, de Jong P, Edwards K, Englund PT, Fazelina G, Feldblyum T,Ferella M, Frasch AC, Gull K, Horn D, Hou L, Huang Y, Kindlund E,Klingbeil M, Kluge S, Koo H, Lacerda D, Levin MJ, Lorenzi H, Louie T,Machado CR, McCulloch R, McKenna A, Mizuno Y, Mottram JC, Nel-son S, Ochaya S, Osoegawa K, Pai G, Parsons M, Pentony M, Petters-son U, Pop M, Ramirez JL, Rinta J, Robertson L, Salzberg SL, SanchezDO, Seyler A, Sharma R, Shetty J, Simpson AJ, Sisk E, Tammi MT, Tar-leton R, Teixeira S, Aken SV, Vogt C, Ward PN, Wickstead B, Wort-man J, White O, Fraser CM, Stuart KD, Andersson B: The GenomeSequence of Trypanosoma cruzi and Etiologic Agent of Cha-gas Disease. Science 2005, 309(5733):409-415.
16. Consortium IHGS: Initial sequencing and analysis of the humangenome. Nature 2001, 409:860-921.
17. Hoskins RA, Smith CD, Carlson JW, Carvalho B, Halpern A,Kaminker JS, Kennedy C, Mungall CJ, Sullivan BA, Sutton GG, Yasu-hara JC, Wakimoto BT, Myers EW, Celniker SE, Rubin GM, KarpenGH: Heterochromatic sequences in a Drosophila whole-genome shotgun assembly. Genome Biol 2002,3(12):RESEARCH0085.
18. Myers EW, Sutton GG, Delcher AL, Dew IM, Fasulo DP, Flanigan MJ,Kravitz SA, Mobarry CM, Reinert KHJ, Remington KA, Anson EL,Bolanos RA, Chou HH, Jordan CM, Halpern AL, Lonardi S, BeasleyEM, Brandon RC, Chen L, Dunn PJ, Lai Z, Liang Y, Nusskern DR, ZhanM, Zhang Q, Zheng X, Rubin GM, Adams MD, Venter JC: A whole-Genome Assembly of Drosophila. Science 2000,287(5461):2196-2204.
19. Altschul SF, Madden TL, Schaffer AA, Zhang J, Zhang Z, Miller W, Lip-man DJ: Gapped BLAST and PSI-BLAST: a new generation ofprotein database search programs. Nucleic Acids Res 1997,25:3389-3402.
20. Kurtz S, Phillippy A, Delcher AL, Smoot M, Shumway M, AntonescuC, Salzberg SL: Versatile and open software for comparinglarge genomes. Genome Biol 2004, 5(2):R12.
21. Clift B, Haussler D, McConnell R, Schneider TD, Stormo GD:Sequence landscapes. Nucleic Acids Res 1986, 14:141-158.
22. Huang X, Madan A: CAP3: A DNA sequence assembly pro-gram. Genome Res 1999, 9(9):868-877.
23. Ewing B, Hillier L, Wendl M, Green P: Basecalling of automatedsequencer traces using phred. I. Accuracy assessment.Genome Res 1998, 8:175-185.
24. Laurentino EC, Ruiz JC, Fazelinia G, Myler PJ, Degrave W, Alves-Fer-reira M, Ribeiro JC, Cruz AK: A survey of Leishmania braziliensisgenome by shotgun sequencing. Mol Biochem Parasitol 2004,137:81-86.
25. WHO, Information about leishmaniasis [http://www.who.int/leishmaniasis/en/]
26. Rice P, Longden I, Bleasby A: EMBOSS: the European MolecularBiology Open Software Suite. Trends Genet 2000,16(6):276-277.
27. Swaminathan K, Varala K, Hudson ME: Global repeat discoveryand estimation of genomic copy number in a large, complexgenome using a high-throughput 454 sequence survey. BMCGenomics 2007, 8:132.
28. Wang J, Wong GKS, Ni P, Han Y, Huang X, Zhang J, Ye C, Zhang Y,Hu J, Zhang K, Xu X, Cong L, Lu H, Ren X, Ren X, He J, Tao L, PasseyDA, Wang J, Yang H, Yu J, Songgang Li: RePS: A Sequence Assem-bler That Masks Exact Repeats Identified from the ShotgunData. Genome Res 2002, 12(5):824-831.
29. Reinert K, Huson D: Bioinformatics Support for Genome-Sequencing Projects. In Bioinformatics – From Genomes to Therapies:Volume 1: The uilding Blocks: Molecular Sequences and Structures; Volume2: Getting at the Inner Workings: Molecular Interactions; Volume 3: TheHoly Grail: Molecular Function, 3-Volume Set first edition. Edited by: Len-gauer T. Wiley Press; 2007:25-53.
30. Arner E, Tammi MT, Tran AN, Kindlund E, Andersson B: DNPTrap-per: an assembly editing tool for finishing and analysis ofcomplex repeat regions. BMC Bioinformatics 2006, 7(155):1-11.
31. Lander ES, Waterman MS: Genomic mapping by fingerprintingrandom clones: a mathematical analysis. Genomics 1988,2:231-239.
32. Gordon D, Abajian C, Green P: Consed: A graphical tool forsequence finishing. Genome Res 1998, 8(3):195-202.
33. Sanger Centre ftp site for L. braziliensis genome data [ftp://ftp.sanger.ac.uk/pub/pathogens/L_braziliensis/]
34. Margulies M, Egholm M, Altman WE, Attiya S, Bader JS, Bemben LA,Berka J, Braverman MS, Chen YJ, Chen Z, Dewell SB, de Winter A,Drake J, Du L, Fierro JM, Forte R, Gomes XV, Godwin BC, He W,Helgesen S, Ho CH, Hutchison SK, Irzyk GP, Jando SC, Alenquer MLI,Jarvie TP, Jirage KB, Kim JB, Knight JR, Lanza JR, Leamon JH, Lee WL,Lefkowitz SM, Lei M, Li J, Lohman KL, Lu H, Makhijani VB, McDadeKE, McKenna MP, Myers EW, Nickerson E, Nobile JR, Plant R, Puc BP,Reifler M, Ronan MT, Roth GT, Sarkis GJ, Simons JF, Simpson JW,Srinivasan M, Tartaro KR, Tomasz A, Vogt KA, Volkmer GA, WangSH, Wang Y, Weiner MP, Willoughby DA, Yu P, Begley RF, RothbergJM: Genome sequencing in open microfabricated high den-sity picoliter reactors. Nature 2005, 437(7057):376-380.
35. NCBI Trace Archive, ftp site for E. coli K12 454 reads [ftp://ftp.ncbi.nih.gov/pub/TraceDB/escherichia_coli_k12/]
36. GD – open source code library for the dynamic creation ofimages by Programmers [http://www.libgd.org]
37. Thompson JD, Higgins DG, Gibson TJ: CLUSTAL W: improvingthe sensitivity of progressive multiple sequence alignmentthrough sequence weighting, position-specific gap penaltiesand weight matrix choice. Nucleic Acids Res 1994,22(22):4673-4680.
38. Otto TD, Catanho M, Degrave W, de Miranda AB: The PDTIS bio-informatics platform: from sequence to function. RECIIs 2007,1(2):286-294.
Page 10 of 10(page number not for citation purposes)