renewable energy technologies wind, mini-hydro
TRANSCRIPT
Renewable Energy Technologies: wind, mini-hydro, thermal, photovoltaic biomass and waste.
Survey of Appropriate Technologies and Perspectives for Latin America and the Caribbean
INTERNATIONAL CENTRE
FOR SCIENCE AND HIGH TECHNOLOGY

ii
The opinions in this report do not necessarily reflect the views of the United Nations Industrial Development Organization (UNIDO) or the International Centre for Science and High Technology (ICS). Mention of the names of firms or commercial products does not imply endorsement by UNIDO or ICS.
No use of this publication may be made for resale or for any other commercial purpose whatsoever without prior permission in writing from ICS.
Cover page insets include pictures of: Photo 1: Photo-voltaic Photo 2: Wind Energy Turbine Photo 3: Transmission Towers ICS-UNIDO is supported by the Italian Ministry of Foreign Affairs
© 2008 United Nations Industrial Development Organization and the International Centre for Science and High Technology,
High Technology and New Materials International Centre for Science and High Technology ICS-UNIDO, AREA Science Park Padriciano 99, 34012 Trieste, Italy Tel.: +39-040-9228126 Fax: +39-040-9228122 E-mail: [email protected]
iii
Renewable Energy Technologies: wind, mini-hydro, thermal, photovoltaic biomass and waste.
Survey of Appropriate Technologies and Perspectives
for Latin America and the Caribbean
Prepared by: Graziano Bertogli
Alfonso Avila-Merino Enrico Bocci
Vincenzo Naso Rossella Rotella
INTERNATIONAL CENTRE FOR SCIENCE AND HIGH TECHNOLOGY Trieste, 2008
iv
Table of Contents
LIST OF FIGURES VII LIST OF TABLES VIX ACRONYMS X
1 INTRODUCTION 1 1.1 ICS-UNIDO PROGRAMME AND ACTIVITIES IN THE FIELD OF RENEWABLE ENERGY 3 1.2 THE AREA OF HIGH TECHNOLOGY AND NEW MATERIALS 3 1.3 THE REASONS WHY LATIN AMERICA HAS BEEN CHOSEN AS TARGET 5 2 RENEWABLE ENERGY CURRENT OUTLOOK 7 2.1 THE ENERGY QUESTION 8 2.2 THE DIVERSIFICATION OF ENERGY SOURCES AND VECTORS 7 2.3 INCREASE OF ENERGY DEMAND 8 2.4 SECURITY OF ENERGY SUPPLY 9 2.5 RENEWABLE ENERGY: OPPORTUNITIES AND BARRIERS 10 2.6 ENERGY PRICES 11 2.7 ENVIRONMENTAL ASPECTS 13 2.8 CURRENT RENEWABLE ENERGY SHARE 13 2.9 RENEWABLE ENERGY POTENTIAL 18 2.10 CURRENT AND POTENTIAL RENEWABLES USE 19 2.11 REFERENCES 21 3 STATUS OF ART OF RENEWABLES IN LATIN AMERICA 22 3.1 RENEWABLES AND THE POWER SECTOR 22 3.2 ENERGY RESOURCES IN LATIN AMERICA 22 3.3 HYDRO 25
3.3.1 Argentina 25 3.3.2 Bolivia 26 3.3.3 Brazil 26 3.3.4 Chile 26 3.3.5 Colombia 26 3.3.6 Costa Rica 27 3.3.7 Cuba 27 3.3.8 Ecuador 27 3.3.9 Mexico 27 3.3.10 Paraguay 27 3.3.11 Peru 28 3.3.12 Uruguay 28 3.3.13 Venezuela 28 3.3.14 Republica Dominicana 28
3.4 WIND 29 3.4.1 Argentina 29 3.4.2 Brazil 29 3.4.3 Chile 30 3.4.4 Costa Rica 30 3.4.5 Cuba 30 3.4.6 Ecuador 30 3.4.7 Mexico 30 3.4.8 Peru 31 3.4.9 Republica Dominicana 31 3.4.10 Uruguay 31
3.5 SOLAR ENERGY 31 3.5.1 Argentina 31 3.5.2 Bolivia 31 3.5.3 Brazil 31 3.5.4 Cuba 31 3.5.5 Peru 32
v
3.5.6 Dominican Republic 32 3.6 GEOTHERMAL ENERGY 33 3.7 REFERENCES 33 4 WIND ENERGY 34 4.1 WIND RESOURCES 34 4.2 THE WIND TECHNOLOGIES 35 4.3 MATURITY 38 4.4 RELIABILITY AND COST 42 5 MINI-HYDRO TECHNOLOGIES 44 5.1 THE HYDRO RESOURCE 44 5.2 THE HYDRO TECHNOLOGIES 44 5.3 MATURITY 48 5.4 RELIABILITY AND COST 49 6 SOLAR ENERGY 51 6.1 SOLAR RESOURCE 51 6.2 SOLAR TECHNOLOGIES 52
6.2.1 PV Systems 52 6.2.2 Solar Thermal Heat 56 6.2.3 Solar Thermal: Low Temperature Systems 56 6.2.4 Solar Thermal: High Temperature Systems 56 6.2.5 Passive Solar Heating And Daylighting 67 6.2.6 Solar Process Space Heating And Cooling 58 6.2.7 Artificial Photosynthesis 58
6.3 MATURITY 58 6.3.1 The Potential And Market Developments for PV Solar Energy 59 6.3.2 Low-Temperature Solar Energy Potential And Market Developments 62 6.3.3 High-Temperature Solar Energy Potential And Market Developments 62 6.4 RELIABILITY AND COST 64 6.4.1 Implementation Issues Of PV Systems 64 6.4.2 Implementation Issues Of Low Temperature Solar Systems 66 6.4.3 Implementation Issues Of Low Temperature Solar Systems 66 6.4.4 PV Systems Costs 66 6.4.5 Low Temperature Solar Thermal Costs 67 6.4.6 High Temperature Solar Thermal Costs 68
7 GEOTHERMAL ENERGY 69 7.1 GEOTHERMAL RESOURCE 69 7.2 GEOTHERMAL TECHNOLOGIES 70 7.3 MATURITY 72 7.4 RELIABILITY AND COSTS 72 8 BIOMASS AND WASTE 75 8.1 OVERVIEW 75 8.2 RENEWABLE FUELS 75 8.3 CONVERSION TECHNOLOGIES 76 8.4 THERMO-CHEMICAL PROCESSES: GENERALITIES 77 8.5 MICROBIAL PROCESSES: GENERALITIES 78 8.6 COMBUSTION TECHNOLOGY 78
8.6.1 Combustion Process 78 8.6.2 The Combustion Reactors 79
8.6.2.1 The Pile Burning Furnace 79 8.6.2.2 The Stoker Fired Furnace 79 8.6.2.3 The Fluidized Bed Furnace 81
8.7 ELECTRICITY AND HEAT GENERATION 83 9 INNOVATIVE TECHNOLOGIES 87 9.1 THE PYROLYSIS TECHNOLOGY 87
9.1.1 The Pyrolysis Process 87

vi
9.1.1.1 The Slow Pyrolysis 87 9.1.1.2 The Fast Pyrolysis 88
9.2 THE PYROLYSIS REACTOR 88 9.3 ELECTRICITY AND HEAT GENERATION 88 9.4 GASIFICATION TECHNOLOGY 90
9.4.1 The Gasification Process 90 9.4.2 The Gasification Reactors 92
9.4.2.1 Fixed Bed Gasifiers 92 9.4.2.2 The Updraft Gasifier 92 9.4.2.3 The Downdraft Gasifier 93 9.4.2.4 Fluidized Bed Gasifiers 94 9.4.2.5 BFB Gasifier 95 9.4.2.6 CFB Gasifier 96
9.5 ELECTRICITY AND HEAT GENERATION 97 10 THE ANAEROBIC DIGESTION 101 APPENDIX 1 103 APPENDIX 2 104 APPENDIX 3 105 REFERENCES 106
vii
List of Figures
Figure 2-1 World energy consumption per sources (1860-2060) Figure 2-2 Global energy systems transition, 1850–2150 Figure 2-3 Per capita energy consumption, 10.000 BC – 1990 AC Figure 2-4 Energy consumption per capita and total Figure 2-5. Energy Price in $ of 2005 per MBTU 1970-2030 Figure 2-6. Electricity Costs versus technology and fuel type November of 2006 Figure 2-7. Average heating, transport and electricity costs (€/MWh) Figure 2-8 Fuels share of world primary energy supply Figure 2-9 Annual Growth of Renewables Supply from 1971 to 2003 Figure 2-10 Renewables data 2004-2005 Figure 2-11 Regional Shares of Renewables Supply Figura 2-12 Top five countries in 2005 Figure 2-13 Renewables electricity capacity Figure 2-14 Global Sectorial Consumption of Renewables (IEA, 2006) Figure 2-15. Forms of potential for renewables and fossil resources Figure 3-1 Wind potential for Latin America Figure 3-2 Global radiation in Latin America Figure 3-3 Fuelwood production in Latin America Figure 3-4 Productive forest area in relation to the total area of the country Figure 3-5 Theoretical hydraulic potential Figure 3-6 Volcanoes in Latin America Figure 4-1. Anemometers Figure 4-2 Analysis of wind flow Figure 4-3 U.S. Annual wind power resource and wind power classes Figure 4-4. Power and moment versus λ in different turbines Figure 4-5 Stall and Pitch control Figure 4-6 Total installed wind capacity (1997-2010) Figure 4-7 Manufacturer world market shares 2005 and 2006 Figure 5-1 The water (hydrologic) cycle Figure 5-2 World hydrological cycle observing system Figure 5-3 Impoundment facilities Figure 5-4 Run-of-river facilities Figure 5-5 Impulse turbines Figure 5-6 Reaction turbines Figure 5-7 Water turbine chart (Net Head versus flow) Figure 6-1 Solar – Earth balance Figure 6-2 Solar Geographical Information System Figure 6-3 Grid connected (left) and stand alone (right) PV plant Figure 6-4 Variation of the PV cell Characteristic with the intensity of solar radiation Figure 6-5 Variation of the PV cell Characteristic with the temperature Figure 6-6 Parabolic trough solar system Figure 6-7 Power tower solar system Figure 6-8 Installed PV power in the IEA reference States, 2005 Figure 6.9 2006 PV installations by market Figure 6 10 World map of potential sites for concentrating solar power Figure 6 11 Energy payback for rooftop PV systems Figure 6 12 Overall clean energy payoff Figure 7-1 Earth layers and relative temperatures Figure 7-2 Plate boundaries and geothermal power plants Figura 7-3 Geothermal phenomenon Figure 7-4 Geothermal power plants Figure 8-1 Schematic presentation of thermo-chemical processes Figure 8-2 Scheme of a stoker fired furnace with travelling grate (1) Figure 8-3 Scheme of a stoker fired furnace with travelling grate (2)

viii
Figure 8-4 Scheme of a stoker fired furnace with vibrating grate Figure 8-5 Scheme of CHP plant based on biomass combustion Figure 8-6 Scheme of CHP plant based on waste combustion Figure 9-1 Scheme of a rotary kiln for pyrolysis process Figure 9-2 Scheme of an IPCC plant Figure 9-3 Scheme of an updraft gasifier Figure 9-4 Scheme of a downdraft gasifier Figure 9-5 Scheme of a BFB gasifier Figure 9-6 Scheme of a CFB gasifier Figure 9-7 Scheme of a IGCC power plant Figure 9-8 Scheme of a IGGE power plant Figure 10-1 Schematic presentation of the anaerobic digestion process Figure 10-2 Scheme of a power plant based on anaerobic digestion and a gas engine

ix
List of Tables
Table 2 1 Synthesis of World Energy Assessment data 2001 Table 2 2 The contribution of renewables in global primary energy supply in 2004 Table 2 3 Renewables installed capacity 2004-2005 Table 2 4 Summary of the RES potential in EJ/y Table 2 5 2001 World RES capacity and energy produced and mean data Table 3 1 Installed capacity for Wind energy in Brazil Table 3 2 Geothermal capacity and potential 1995 Table 4 1 Type of windmills Table 4-2 Installed wind capacity 2005-2006 Table 5 1 Small hydroelectric Centrals: economic and financial analysis Table 6 1 PV solar cell technologies and efficiencies of the various module technologies Table 6-2 Potential contribution of solar energy technologies to world energy consumption (EJ of
electricity) Table 7 1 Geothermal Power Direct Capital Costs (US$1999 /KW installed capacity) Table 7 2 Conventional Baseload Power Direct Capital Costs Table 7 3 Geothermal O&M Costs by Plants Size (U.S. cents/kWh) Table 7 4 O&M Cost Comparison by Baseload Power Source (US $) Table 7 5 Employment Rates by Energy Technology Table 8 1 Composition and chemical-physical characteristics of biomass, MSW, RDF and animal
manures Table 8-2 Synthetic evaluation of the different combustion reactor technologies Table 9-1 Fuel requirements and operating conditions vs. gasifier design
x
Acronyms
AC Alternating Current CC Combined Cycle CdS Carbon sulphur CFB Circulating Fluidised Bed CHP Combined Heat and Power DC Direct Current DCs Developed Countries DOE Department of Energy EGS Enhanced Geothermal Systems EJ Exa Joule EPA US Environmental Protection Agency ESTIA European Solar Thermal Power Industry Association FAO Food and Agriculture Organization of the United Nations GaAs Gallium Arsenic GEF Global Environmental Facility GHG Greenhouse Gas Gj Giga joule GMOs Genetically Modified Organisms Gtoe Giga tons of energy GW Giga Watt GWe Giga Watt electric GWth Giga Watt hour HAWT Horizontal-Axis Wind Turbine HTNM High Technology and New Materials Hz Hertz ICS International Centre for Science and High Technology ICT Information and Communication Technologies IEA International Energy Agency IGA International Geothermal Association IGGE Integrated gasification gas engine IPCC Integrated Pyrolysis Combined Cycle ISCC Integrated solar combined-cycle K degrees Kelvin km2 square kilometres kw kilo watt kWe kilo watt electric LPG Liquid Petroleum Gas MBTU Million British Thermal Units MEM Ministerio de Energía y Minas MDG Millennium Development Goals MSW Municipal Solid Waste MW Mega Watt MWe Mega Watt electric MWh Mega Watt hour HEP Hydro Electric Power RE Renewable Energy OECD Organization for Economic Cooperation and Development OLADE Latin American Energy Organization O&M Operating and maintenance costs ppbv parts per billion by volume PROINFA Alternative Sources for Energy Incentive Programme PV Photovoltaic RDF Refuse Derived Fuel REN21 Renewable Energies Policy Network for the 21 Century – RES Renewable Energy Sources RET Renewable Energy Technologies R&D Research and Development SEGS Sovereign Enterprises Grading Service

xi
SDHW Solar Domestic Hot Water SME Small and Sized Medium Enterprise S&T Science and Technology TCs Technology Centres TWh Tera Watt hour UN United Nations UNDP United Nations Development Programme UNIDO United Nations Industrial Development Organization USA United States of America VAWT Vertical Axis Wind Turbine WEA World Energy Agency WEC World Energy Council WETO World Energy Technology Outlook Wp Watts peak WSSD World Summit on Sustainable Development WWEA World Wind Energy Association WWF World Wide Found
1
11 .. II NN TT RR OO DD UU CC TT II OO NN
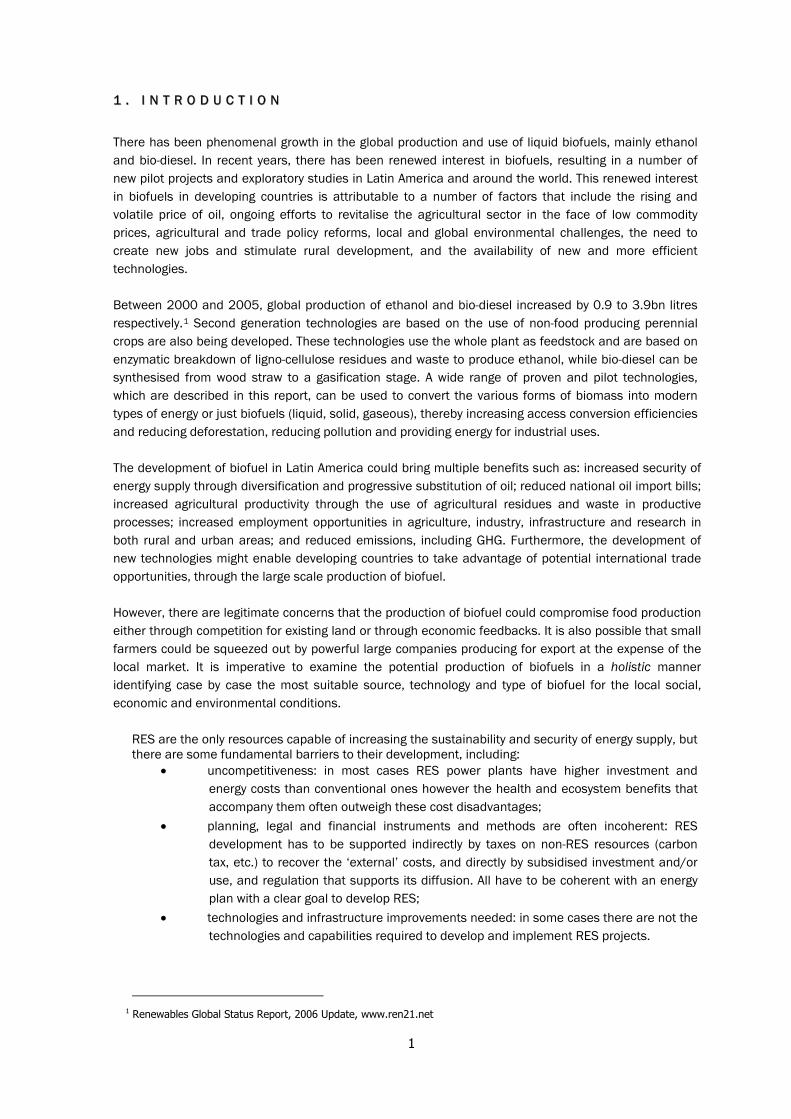
There has been phenomenal growth in the global production and use of liquid biofuels, mainly ethanol and bio-diesel. In recent years, there has been renewed interest in biofuels, resulting in a number of new pilot projects and exploratory studies in Latin America and around the world. This renewed interest in biofuels in developing countries is attributable to a number of factors that include the rising and volatile price of oil, ongoing efforts to revitalise the agricultural sector in the face of low commodity prices, agricultural and trade policy reforms, local and global environmental challenges, the need to create new jobs and stimulate rural development, and the availability of new and more efficient technologies. Between 2000 and 2005, global production of ethanol and bio-diesel increased by 0.9 to 3.9bn litres respectively.1 Second generation technologies are based on the use of non-food producing perennial crops are also being developed. These technologies use the whole plant as feedstock and are based on enzymatic breakdown of ligno-cellulose residues and waste to produce ethanol, while bio-diesel can be synthesised from wood straw to a gasification stage. A wide range of proven and pilot technologies, which are described in this report, can be used to convert the various forms of biomass into modern types of energy or just biofuels (liquid, solid, gaseous), thereby increasing access conversion efficiencies and reducing deforestation, reducing pollution and providing energy for industrial uses. The development of biofuel in Latin America could bring multiple benefits such as: increased security of energy supply through diversification and progressive substitution of oil; reduced national oil import bills; increased agricultural productivity through the use of agricultural residues and waste in productive processes; increased employment opportunities in agriculture, industry, infrastructure and research in both rural and urban areas; and reduced emissions, including GHG. Furthermore, the development of new technologies might enable developing countries to take advantage of potential international trade opportunities, through the large scale production of biofuel. However, there are legitimate concerns that the production of biofuel could compromise food production either through competition for existing land or through economic feedbacks. It is also possible that small farmers could be squeezed out by powerful large companies producing for export at the expense of the local market. It is imperative to examine the potential production of biofuels in a holistic manner identifying case by case the most suitable source, technology and type of biofuel for the local social, economic and environmental conditions.
RES are the only resources capable of increasing the sustainability and security of energy supply, but there are some fundamental barriers to their development, including:
• uncompetitiveness: in most cases RES power plants have higher investment and energy costs than conventional ones however the health and ecosystem benefits that accompany them often outweigh these cost disadvantages;
• planning, legal and financial instruments and methods are often incoherent: RES development has to be supported indirectly by taxes on non-RES resources (carbon tax, etc.) to recover the ‘external’ costs, and directly by subsidised investment and/or use, and regulation that supports its diffusion. All have to be coherent with an energy plan with a clear goal to develop RES;
• technologies and infrastructure improvements needed: in some cases there are not the technologies and capabilities required to develop and implement RES projects.
1 Renewables Global Status Report, 2006 Update, www.ren21.net
2
This report aims to be a comprehensive source of information and reference on the topic of renewable energy for the use of decision-makers in developing countries, particularly in Latin America. It highlights the following aspects in relation to renewable energy:
1. the current outlook for the Latin American countries 2. the state-of-the-art of the different generation of technologies for sustainable energy
production 3. mapping of RET in Latin America 4. specific analysis of biofuels in Africa, perspectives, scenarios and shortcomings 5. the policy and regulatory frameworks affecting the promotion of RES, financing
mechanisms and TT processes 6. advantage and risks
This report represents the efforts of scientists, technologists, policy-makers, and specialists in different international organisations, including UNIDO, ICS, UNDP, FAO and IEA. The document is organised as follows. Section 1 describes the current work of ICS/UNIDO in relation to the promotion and development of projects related to RES and Renewable Energy Technologies (RET) in developing countries; Section 2 examines the current energy outlook of RES for the sustainable production of energy focusing on the technologies for bio resources and biomass. Section 3 presents the state-of-the-art of renewables in Latin America including solar, wind, hydro, geothermal and biomass to provide a picture of what these countries may able to exploit in terms of renewable resources. Section 4 analyses the technological issues related to the exploitation of RES, specifically wind energy and also examines its advantages and disadvantages. Section 5 presents the mini-hydro technologies in terms of their resources, technologies, maturity of those technologies and finally its reliability and cost. Likewise, Section 6 focuses on solar energy. Section 7 focuses on the examination of geothermal energy in terms of its resources, related technologies, maturity of the technology as well as their current reliability and costs. Section 8 examines biomass and waste technologies and processes available to exploit this source of energy. Section 9 analyses the innovative technologies that developing countries might use or start to develop in the near future. Lastly, Section 10 presents the process of anaerobic digestion, which is related to the use and exploitation of renewable energy technologies.
3
1.1 ICS-UNIDO Programme and Activities in the Field of Renewable Energy The International Centre for Science and High Technology (ICS) of the United Nations Industrial Development Organization (UNIDO) has the mandate of strengthening the scientific and technological (S&T) capacity and competence of developing countries in order to support their effort toward social and economic development with special emphasis on transfer of appropriate, sustainable and environmental friendly technology. UNIDO is contributing to achievement of the Millennium Development Goals (MDGs) through a number of programmes and projects aimed at providing an effective response to the growing industrial divide, by addressing the three thematic priorities: • Poverty reduction through productive activities • Trade capacity building • Energy and environment. ICS activities, as detailed in the Institutional Agreement signed in 1993 between the Italian Government and UNIDO, are in three scientific areas (International Institutes): 1) Pure and Applied Chemistry; 2) Earth Environment and Marine Science and Technologies; and 3) High Technology and New Materials, to improve technical and scientific knowledge and participation in the development and utilisation of new and advanced technologies in developing countries, which are required for the accumulation of industrial and technological capability and competitiveness. To alleviate the challenges faced by developing countries in achieving social and economic growth, ICS has developed a strategic work plan based on a practical step-by-step approach to awareness building, training-of-trainers, advisory services and assistance, designed to build, develop and strengthen national capacity in TT and partnership development. 1.2 High Technology and New Materials (HTNM) In the past, HTNM area programmes and activities have been dedicated to supporting and cooperating with developing countries within four scientific/technical fields: Laser application, Building materials, Information and Communication Technologies (ICT) and Renewable Energy (RE). The medium/long-term objective of the RE sub-programme aims at providing assistance to all developing countries in acquiring technologies and knowledge related to energy production based on local resources, for cooking, food conservation, lighting and communication, for rural communities and micro, small and medium enterprises, as users and producers of both energy, and equipment for energy production. At the same time, there is a demand for promotion and diffusion of the technologies and knowledge that these countries are able to produce, mainly within the UNIDO network of technology centres (TCs), a number of which are specialised in technologies related to energy production. Within this framework, ICS aims to be a hub of the network of TCs supporting and promoting activities and results worldwide. It is hoped that this network will be able to provide technology support to developing countries with ICS providing ad hoc support activities, such as capacity building (training courses, fellowship programmes), development of decision-support tools, establishment of innovation TCs, etc. It is hoped that, in cooperation with UNIDO HQs, a continuous project can be implemented that focuses on the production of small quantities of energy, (less than 50-100 kw), using local renewable resources for the benefit of needy communities.

4
The development and diffusion of low-cost and low maintenance technologies for small local production of energy is ideal for community use in schools, small hospitals, for telecommunications (including business centres), in small craft factories and industries, food conservation, call centres, etc. The UNIDO HQs and the TC network have a better picture of local requirements in the respective S&T fields. However, in certain cases they have limited resources to respond to these needs. Closer cooperation with ICS could enable access to the S&T environment, regular upgrading of in house expertise and promotion of local programmes and projects. At the same time, ICS, through the TCs, can target local industrial sectors that are the end users of the activities. ICS is actively cooperating with the local institutions and supporting the effort of their countries towards economic and social development by offering targeted fellowship programmes and training for technicians and scientists who return to their home countries to train others. Another activity within this multiyear project is the collection and evaluation of national policies, incentives, support programmes in developed and developing countries, with the scope of promoting the use of renewable resources and supporting the local production of energy from renewable resources, etc. for communities and to support the local production/assembly of equipment and plant producing energy from renewable resources. Energy saving also needs to be considered. Finally, the possibility to study, to provide ad hoc funding for pilot plants, equipment and spin offs, should be included in ICS activities. The expected impacts in socio-economic terms are:
• assist developing countries in the assessment of small local energy resources: solar, hydro, geo, biomass, etc. for productive uses, and energy savings and process improvements opportunities in selected sectors
• increase human resource capacities and capabilities • strengthen the decision-making process at policy and regulatory levels for sustainable industrial
development • promote local production of parts and components for equipment/plant for renewable
resources utilisation, such as solar driers, solar ovens, photovoltaic (PV) panels for tele-centres, etc.
This project is currently being implemented in cooperation with relevant UNIDO field offices.
5
1.3 The Reasons why Latin America has been Chosen as Target
The major share of today’s human “appropriation” of biomass is dedicated to the provision of food, feed, and bio-materials mainly fibre, and timber for construction. Currently, only about 10 percent of the biomass is used as biofuels, but residues find their way into cooking stoves, furnaces, and power plants. All forms of biofuels supply about 10 percent of the world primary energy demand, representing 90 percent of the global contribution of all renewable energies (Global Status Report 2006 Renewable Energies Policy Network for the 21 Century – REN21). While biofuels shares in OECD energy supply decreased over the last decades, they remain an important source of energy in developing countries where on average a third of all primary energy comes from biomass; in many developing some African countries, even up to 90%. The energy supply of approximately 2 billion people depends nearly exclusively on traditional bio-energy such as firewood or dung, mainly used for cooking (Karekezi 2004). Future Prospects Forecasts show that in the most optimistic scenarios, bio-energy could provide for more than twice the current global energy demand, without competing with food production, forest protection efforts, and biodiversity. In the least favorable scenarios however, bio-energy could supply only a fraction of current energy use, perhaps even less than it provides today. This significant range of uncertainty of the sustainable global biofuel potential is a consequence of the uncertain developments in future agricultural and land-use policies, especially in developing countries. Facto rs such as increases in productivity could “free” the land for biofuel crops, and conversion of marginal and degraded land into biofuels production areas could expand the resource base as well. On the other hand, impacts from climate change such as heat waves and droughts, as well as competing uses of land (food, nature conservation) could severely restrict the future biofuel potential. Feed vs. Food A key concern in the global biofuel discussion is the competition between land-use for biofuels production and food and feed production. If there is no direct competition it could show indirectly through economic (price) feedbacks as can be seen in recent sugar and corn price fluctuations. This competition has a special significance insofar as food security is concerned, and the MDGs clearly require policies to reduce hunger, and increase food security. In this respect, a switch to large-scale bio-energy production might have adverse indirect impacts on food security, which need further attention. As long as biofuels mainly come from plants which can be also used for food/feed production, the economic effects of coupling the energy (i.e. biofuel) market with food/feed markets could increase food/feed prices, and – hence – worsens the access to affordable food/feed for many. The indirect effect of increased prices for traditional agro-products, however, could increase farmer (and country) income, and thus help increasing food security, depending on the distribution of the increased income. As the overall outcome of such developments is still being debated, the FAO announced recently to research the food-versus-fuel issue in more detail (FAO, 2006). The outcome of this research should be considered key in safeguarding future biofuel development against food/feed competition. Economic Competitiveness Concerning economic competitiveness of biofuels, already today, heating applications based on modern biofuels can compete with oil and gas, and electricity generation with biogas from residues, landfills, or waste-water treatment undercuts costs of oil- and gas-fired power plants. Ethanol from sugarcane in Brazil is competitive without subsidies at 35-50 US$/bbl oil (WB 2005), while most other liquid biofuels for transport need further development before becoming economically attractive at oil prices in the 50 US$/bbl range. Yet, volatility in oil prices could also endanger investments in market introduction of biofuels.
6
Trade Implications International biofuel trade is an issue for global players, with SMEs having a minor role so far. As a consequence of the energy price and supply security developments, however, interest in global trade of biofuels is spreading. Since the mid-1990s, biomass trade flows increased rapidly, partly as a result of reduced marine bulk transport cost. Many trade flows are between neighbouring countries, but long-distance trade also occurs, for example, with export of ethanol from Brazil to Japan and the EU, palm kernel shells from Malaysia to the Netherlands, wood pellets from Canada to Sweden. Nearly all of that trade is across waterways, or uses large maritime cargo vessels. The IEA Bio-energy Task 40 projects a significant increase in global shipping of biofuels in the next years. In addition, the failure of the WTO Doha Round in opening agricultural markets of OECD countries (and to restrict subsidized agricultural exports) shifts the focus of traditional farming from cash crops to dedicated bio-energy crops, which have the prospect of higher revenues on international markets if converted into biofuels. Sustainability Issues With the 2002 World Summit on Sustainable Development (WSSD) in Johannesburg and the formulation of the Millennium Development Goals (MDGs) , sustainable development in general, and its link to energy became prominent issues in global fora. In this context, there are currently many national and international initiatives underway to safeguard against negative social and environmental impacts of future bio-energy developments. Concerns over land use (as referred to in the food vs. feed discussion), land ownership, loss of biodiversity and genetically modified organisms (GMOs), greenhouse gas emissions, soil erosion and other soil degradation, water use and water contamination, human health impacts, labour conditions and rights of children are all part of the sustainability discussion and international efforts to formulate standards. Climate Change Bio-energy could in comparison to fossil fuels drastically reduce greenhouse-gas and air emissions if managed adequately. However, there are many factors to be taken into account when quantifying Greenhouse Gas (GHG) emissions. Current knowledge of GHG balances of biofuels indicates a rather large range (Larson 2006). For specified regions like the EU, quantification is possible with regard to the different bio-energy crops, conversion routes, and by-product utilization rates (OEKO 2006). For other regions like the USA, and a few developing countries (Brazil, China, India), some data on the life-cycle GHG balances exist, while other countries like Thailand have ongoing research programme in that area.
Technology Transfer
Realization of the potential of biofuels depends to a great extent on the availability of competitive
conversion technologies. Yet, these technologies are not readily available in developing countries. To
this end, there is need for support mechanisms that would encourage the transfer of relevant
technologies and associated capacities from technology producers to technology markets. Since
UNIDO’s focus will centre on providing such support mechanisms the following sections will describe the
current situation with regard to existing and future conversion technologies.
7
22 .. RR EE NN EE WW AA BB LL EE EE NN EE RR GG YY CC UU RR RR EE NN TT OO UU TT LL OO OO KK
2.1 The Energy Question
Energy is crucial for three dimensions of human life: 1. Economic: Many countries’ energy imports represent up to 50% of their trade. The price of
energy defines development. 2. Social: about 2bn people, mainly in sub-Saharan Africa and South East Asia do not have
energy (for cooking, heating, water, lighting, cooling, transport, communication, etc.): energy consumption is linked to quality of life. Energy consumption per capita in the developed countries (DCs) is less than 15% of consumption in Europe, and 10% of per capita consumption in the US.
3. Environmental: Much of the noxious emissions come from energy systems. The rate of energy consumptions is a billion times that of energy production.
Energy poverty, defined as lack of access to modern sources of energy, is one of the barriers to human development and there is a strict correlation between the Human Development Index and per capita energy consumption. In the words of former UN Secretary General, Kofi Annan:
In the developing countries, some 1.6 billion people still lack access to electricity and about 2.4 billion continue to rely on traditional biomass for cooking and heating, mainly in the rural areas. Achievement of the Millennium Development Goal of halving, by 2015, the proportion of the world’s population whose income is less than $1 per day will depend on providing these people with access to modern energy services for their basic needs and for income generation. Decentralized renewable energy systems can contribute to poverty eradication efforts, in particular in areas with widely dispersed rural populations. (UN News Service, 19.08.2005)
We currently need a new energy framework. The problem of energy is increasingly widespread involving not only scientific institutions, energy companies and politicians, but also industry, citizens, etc., which requires some tangible solutions:
1. International, national and local planning; 2. Legal and financial instruments; 3. Action (implementation of sustainable methods, technologies and processes).
The choice of instruments to solve this problem around the world represents the greatest opportunity for mankind, and a challenge that we cannot pass up. To achieve a sustainable energy system requires changes to the whole of the energy chain: from the supply sector to energy end use technologies. There are many possible solutions; but the problem is complex and available time is short. Thus, energy research must be aimed at the promotion and implementation of methods, technologies and processes for sustainable economic, social and environmental development. Operative and competitive sustainable energy systems must be implemented. In the very near future, all energy systems will have to be sustainable, efficient and cost-effective, and convenient and safe; energy must be available, clean, sustainable, non-polluting, and appropriate to different local conditions. These attributes can be summarised as clean energy.
What is required is efficiency, and especially sustainable efficiency, through the development and implementation of closed cycle systems for generating energy from renewable resources (CCER).
2.2 Diversification of Energy Sources and Vectors
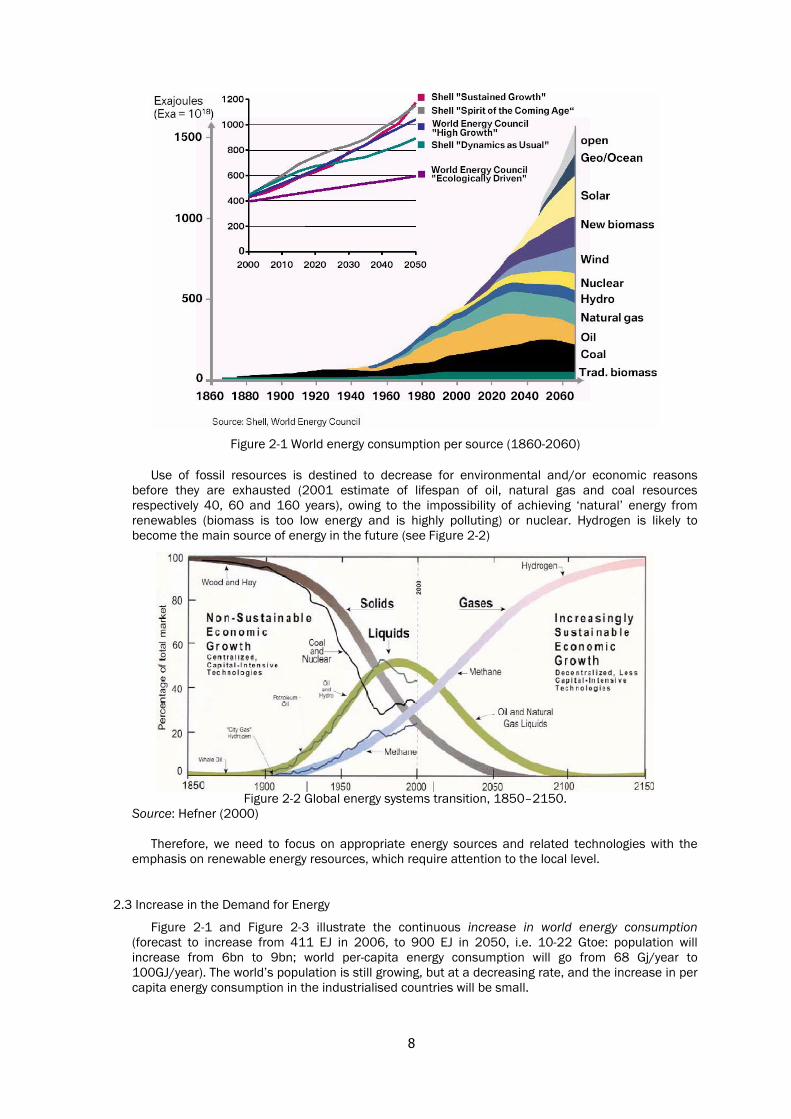
From the beginning of human history to the 1850s man’s main source of energy was biomass (human, animal and vegetable); from 1850 to 1950 it was coal; since 1950 the main source of energy has been petroleum. Since the 1950s, several sources of energy have coexisted: petroleum, coal, natural gas, biomass, hydroelectric power, nuclear, wind, solar, geothermal, and wave power) as can be seen in Figure 2-1. We are living in an era of a variety of energy sources.
8
Figure 2-1 World energy consumption per source (1860-2060)
Use of fossil resources is destined to decrease for environmental and/or economic reasons before they are exhausted (2001 estimate of lifespan of oil, natural gas and coal resources respectively 40, 60 and 160 years), owing to the impossibility of achieving ‘natural’ energy from renewables (biomass is too low energy and is highly polluting) or nuclear. Hydrogen is likely to become the main source of energy in the future (see Figure 2-2)
Figure 2-2 Global energy systems transition, 1850–2150.
Source: Hefner (2000)
Therefore, we need to focus on appropriate energy sources and related technologies with the emphasis on renewable energy resources, which require attention to the local level.
2.3 Increase in the Demand for Energy
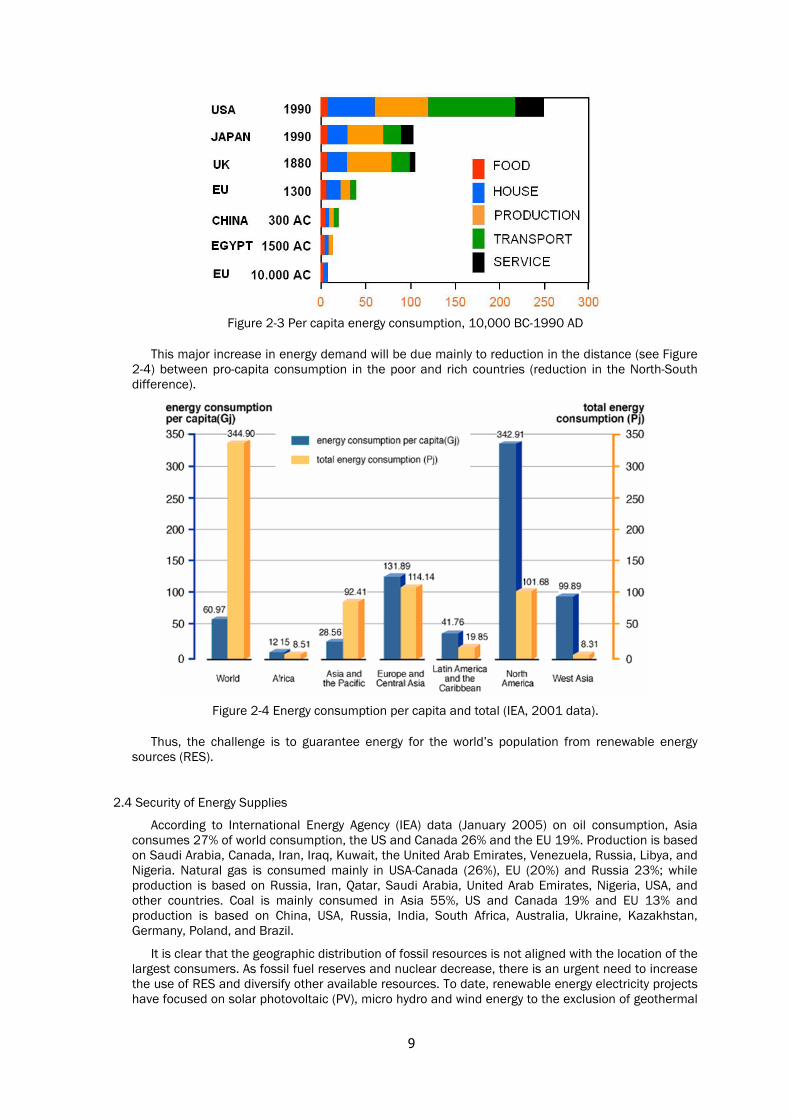
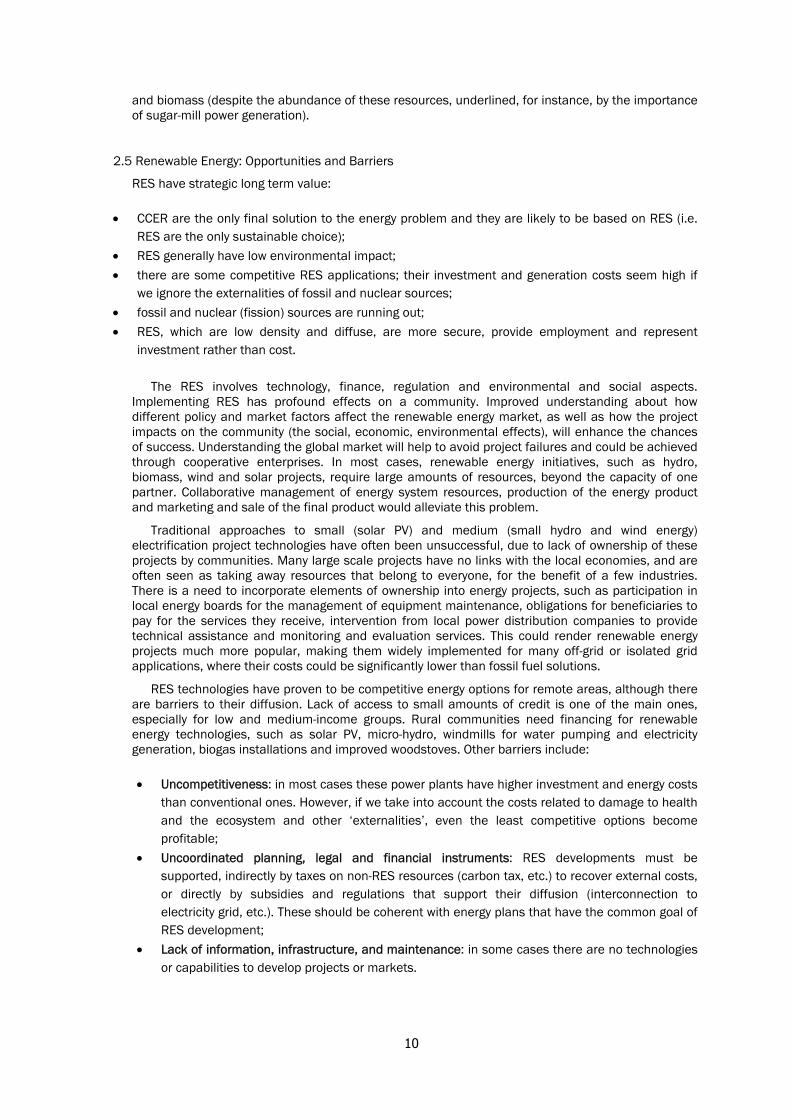
Figure 2-1 and Figure 2-3 illustrate the continuous increase in world energy consumption (forecast to increase from 411 EJ in 2006, to 900 EJ in 2050, i.e. 10-22 Gtoe: population will increase from 6bn to 9bn; world per-capita energy consumption will go from 68 Gj/year to 100GJ/year). The world’s population is still growing, but at a decreasing rate, and the increase in per capita energy consumption in the industrialised countries will be small.
9
Figure 2-3 Per capita energy consumption, 10,000 BC-1990 AD
This major increase in energy demand will be due mainly to reduction in the distance (see Figure 2-4) between pro-capita consumption in the poor and rich countries (reduction in the North-South difference).
Figure 2-4 Energy consumption per capita and total (IEA, 2001 data).
Thus, the challenge is to guarantee energy for the world’s population from renewable energy sources (RES).
2.4 Security of Energy Supplies
According to International Energy Agency (IEA) data (January 2005) on oil consumption, Asia consumes 27% of world consumption, the US and Canada 26% and the EU 19%. Production is based on Saudi Arabia, Canada, Iran, Iraq, Kuwait, the United Arab Emirates, Venezuela, Russia, Libya, and Nigeria. Natural gas is consumed mainly in USA-Canada (26%), EU (20%) and Russia 23%; while production is based on Russia, Iran, Qatar, Saudi Arabia, United Arab Emirates, Nigeria, USA, and other countries. Coal is mainly consumed in Asia 55%, US and Canada 19% and EU 13% and production is based on China, USA, Russia, India, South Africa, Australia, Ukraine, Kazakhstan, Germany, Poland, and Brazil.
It is clear that the geographic distribution of fossil resources is not aligned with the location of the largest consumers. As fossil fuel reserves and nuclear decrease, there is an urgent need to increase the use of RES and diversify other available resources. To date, renewable energy electricity projects have focused on solar photovoltaic (PV), micro hydro and wind energy to the exclusion of geothermal
10
and biomass (despite the abundance of these resources, underlined, for instance, by the importance of sugar-mill power generation).
2.5 Renewable Energy: Opportunities and Barriers
RES have strategic long term value:
• CCER are the only final solution to the energy problem and they are likely to be based on RES (i.e. RES are the only sustainable choice);
• RES generally have low environmental impact; • there are some competitive RES applications; their investment and generation costs seem high if
we ignore the externalities of fossil and nuclear sources; • fossil and nuclear (fission) sources are running out; • RES, which are low density and diffuse, are more secure, provide employment and represent
investment rather than cost.
The RES involves technology, finance, regulation and environmental and social aspects. Implementing RES has profound effects on a community. Improved understanding about how different policy and market factors affect the renewable energy market, as well as how the project impacts on the community (the social, economic, environmental effects), will enhance the chances of success. Understanding the global market will help to avoid project failures and could be achieved through cooperative enterprises. In most cases, renewable energy initiatives, such as hydro, biomass, wind and solar projects, require large amounts of resources, beyond the capacity of one partner. Collaborative management of energy system resources, production of the energy product and marketing and sale of the final product would alleviate this problem.
Traditional approaches to small (solar PV) and medium (small hydro and wind energy) electrification project technologies have often been unsuccessful, due to lack of ownership of these projects by communities. Many large scale projects have no links with the local economies, and are often seen as taking away resources that belong to everyone, for the benefit of a few industries. There is a need to incorporate elements of ownership into energy projects, such as participation in local energy boards for the management of equipment maintenance, obligations for beneficiaries to pay for the services they receive, intervention from local power distribution companies to provide technical assistance and monitoring and evaluation services. This could render renewable energy projects much more popular, making them widely implemented for many off-grid or isolated grid applications, where their costs could be significantly lower than fossil fuel solutions.
RES technologies have proven to be competitive energy options for remote areas, although there are barriers to their diffusion. Lack of access to small amounts of credit is one of the main ones, especially for low and medium-income groups. Rural communities need financing for renewable energy technologies, such as solar PV, micro-hydro, windmills for water pumping and electricity generation, biogas installations and improved woodstoves. Other barriers include:
• Uncompetitiveness: in most cases these power plants have higher investment and energy costs than conventional ones. However, if we take into account the costs related to damage to health and the ecosystem and other ‘externalities’, even the least competitive options become profitable;
• Uncoordinated planning, legal and financial instruments: RES developments must be supported, indirectly by taxes on non-RES resources (carbon tax, etc.) to recover external costs, or directly by subsidies and regulations that support their diffusion (interconnection to electricity grid, etc.). These should be coherent with energy plans that have the common goal of RES development;
• Lack of information, infrastructure, and maintenance: in some cases there are no technologies or capabilities to develop projects or markets.

11
In Latin America, with the exception of traditional biomass and large hydro, sources of renewable energy have been underexploited, with applications limited to pilot projects developed by NGOs, governments and international cooperation. One of the reasons for this is the lack of information on the potentials of RES, such as solar and wind maps, etc. In rural residential areas, wood continues to be an important energy source because other energy sources, such as liquid petroleum gas (LPG), are not available and/or are too expensive. Renewable energy, mainly hydro, has been exploited but only to a small percentage of its potential. Good information on the potential of and technology involved in alternative energy sources could extend RES coverage to isolated regions.
The distribution systems for commercial energy, such as electricity and LPG, are limited by geography, scarce demand in isolated areas and high market prices. The electricity grid is being extended only slowly, from the big power generation stations to consumption points, involving high costs in energy losses during transmission and low use of the electricity grid (in some rural sectors about 40%).
A solar PV home system of 50 Wp, based on energy storage systems, may be enough to satisfy domestic lighting, communication and entertainment needs, but requires local participation and technical assistance. Likewise, the installation of wood stoves can have direct health benefits, as gas is directed outside the house. They produce significant savings in terms of amounts of fuel, money and time spent gathering wood. It is important to have good maintenance programmes in place to avoid fumes leaking from stoves.
2.6 Energy Prices
Energy prices are increasing as much as they did in the 1970s. The USA-DOE Annual Energy Outlook, forecasts an increase in long term energy prices depicted in Figure 2-5.
Figure 2-5 Energy Price in US$ of 2005 per MBTU 1970-2030 (AEO 2007)
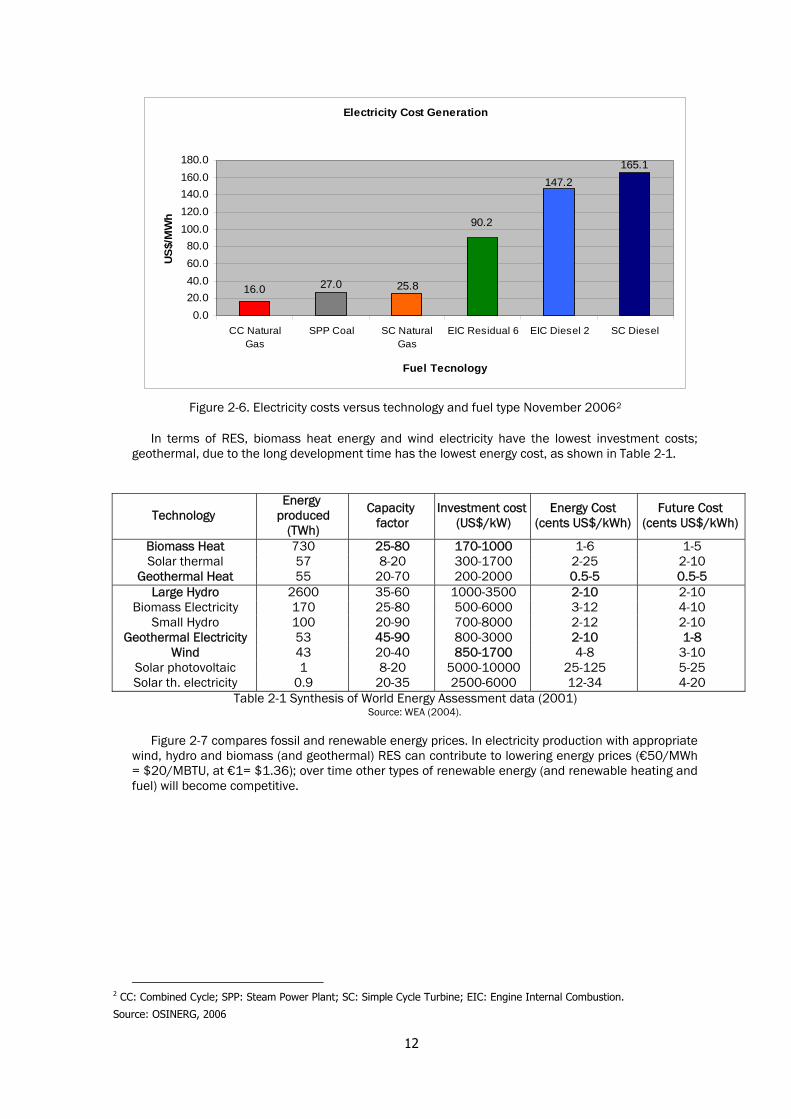
Figure 2-6 shows comparative generation costs for power stations in Latin America ($20/MBTU = $68/MWh): the range is for a gas turbine working with diesel (SC diesel) at very low efficiency, and thus very high operating costs, up to combined cycle (CC) natural gas at costs that are ten times lower.
12
Electricity Cost Generation
16.0 27.0 25.8
90.2
147.2165.1
0.020.040.060.080.0
100.0120.0140.0160.0180.0
CC NaturalGas
SPP Coal SC NaturalGas
EIC Residual 6 EIC Diesel 2 SC Diesel
Fuel Tecnology
US$/
MW
h
Figure 2-6. Electricity costs versus technology and fuel type November 20062
In terms of RES, biomass heat energy and wind electricity have the lowest investment costs; geothermal, due to the long development time has the lowest energy cost, as shown in Table 2-1.
Technology Energy
produced (TWh)
Capacity factor
Investment cost (US$/kW)
Energy Cost (cents US$/kWh)
Future Cost (cents US$/kWh)
Biomass Heat 730 25-80 170-1000 1-6 1-5 Solar thermal 57 8-20 300-1700 2-25 2-10
Geothermal Heat 55 20-70 200-2000 0.5-5 0.5-5 Large Hydro 2600 35-60 1000-3500 2-10 2-10
Biomass Electricity 170 25-80 500-6000 3-12 4-10 Small Hydro 100 20-90 700-8000 2-12 2-10
Geothermal Electricity 53 45-90 800-3000 2-10 1-8 Wind 43 20-40 850-1700 4-8 3-10
Solar photovoltaic 1 8-20 5000-10000 25-125 5-25 Solar th. electricity 0.9 20-35 2500-6000 12-34 4-20
Table 2-1 Synthesis of World Energy Assessment data (2001) Source: WEA (2004).
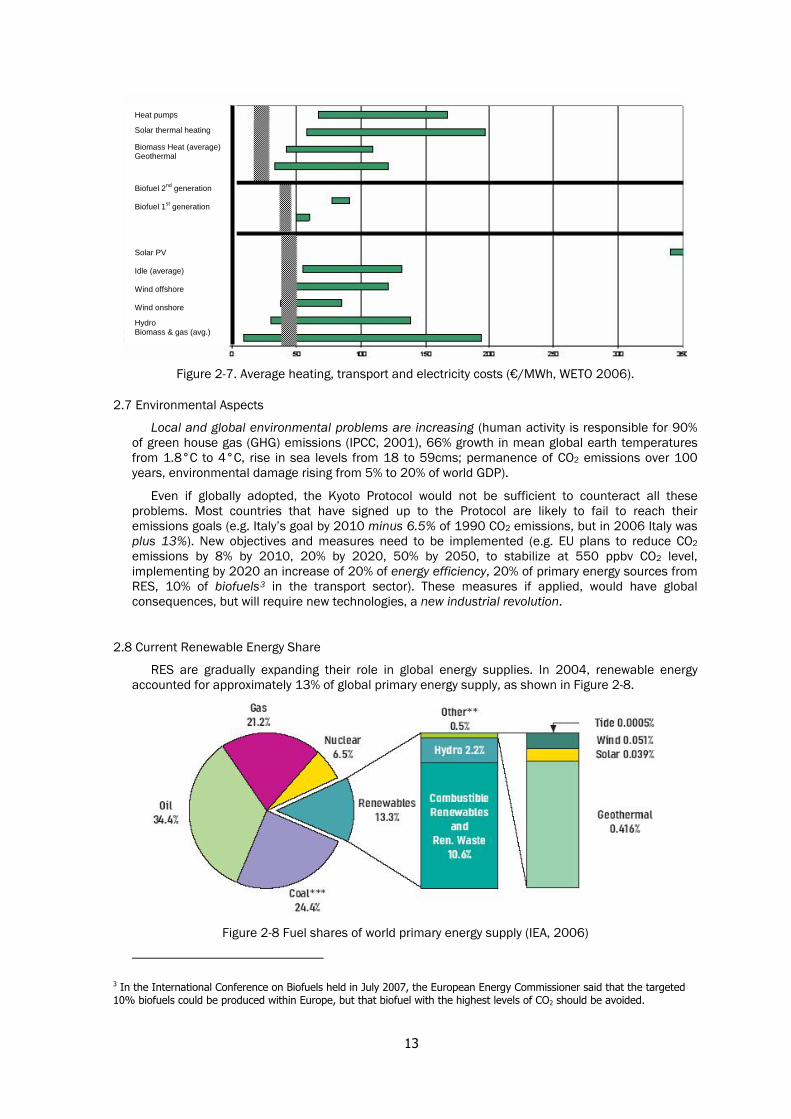
Figure 2-7 compares fossil and renewable energy prices. In electricity production with appropriate
wind, hydro and biomass (and geothermal) RES can contribute to lowering energy prices (€50/MWh = $20/MBTU, at €1= $1.36); over time other types of renewable energy (and renewable heating and fuel) will become competitive.
2 CC: Combined Cycle; SPP: Steam Power Plant; SC: Simple Cycle Turbine; EIC: Engine Internal Combustion.
Source: OSINERG, 2006
13
Figure 2-7. Average heating, transport and electricity costs (€/MWh, WETO 2006).
2.7 Environmental Aspects
Local and global environmental problems are increasing (human activity is responsible for 90% of green house gas (GHG) emissions (IPCC, 2001), 66% growth in mean global earth temperatures from 1.8°C to 4°C, rise in sea levels from 18 to 59cms; permanence of CO2 emissions over 100 years, environmental damage rising from 5% to 20% of world GDP).
Even if globally adopted, the Kyoto Protocol would not be sufficient to counteract all these problems. Most countries that have signed up to the Protocol are likely to fail to reach their emissions goals (e.g. Italy’s goal by 2010 minus 6.5% of 1990 CO2 emissions, but in 2006 Italy was plus 13%). New objectives and measures need to be implemented (e.g. EU plans to reduce CO2 emissions by 8% by 2010, 20% by 2020, 50% by 2050, to stabilize at 550 ppbv CO2 level, implementing by 2020 an increase of 20% of energy efficiency, 20% of primary energy sources from RES, 10% of biofuels3 in the transport sector). These measures if applied, would have global consequences, but will require new technologies, a new industrial revolution.
2.8 Current Renewable Energy Share
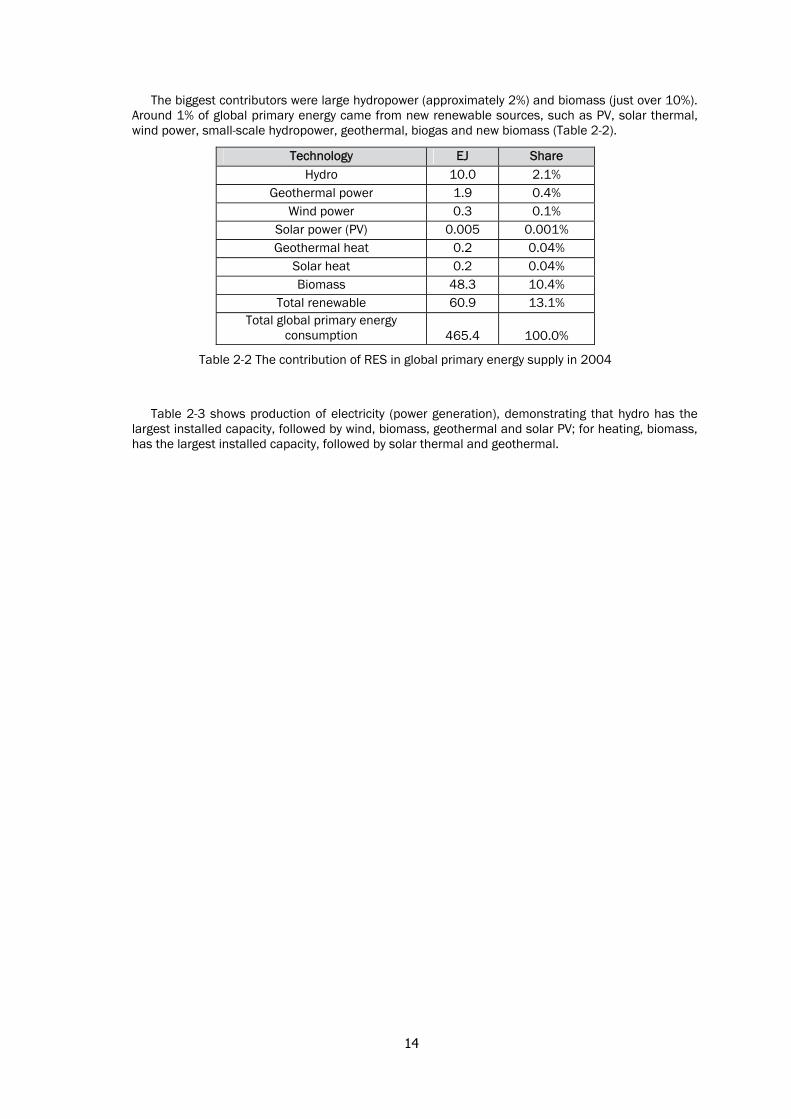
RES are gradually expanding their role in global energy supplies. In 2004, renewable energy accounted for approximately 13% of global primary energy supply, as shown in Figure 2-8.
Figure 2-8 Fuel shares of world primary energy supply (IEA, 2006)
3 In the International Conference on Biofuels held in July 2007, the European Energy Commissioner said that the targeted 10% biofuels could be produced within Europe, but that biofuel with the highest levels of CO2 should be avoided.
Heat pumps Solar thermal heating Biomass Heat (average) Geothermal Biofuel 2nd generation Biofuel 1st generation Solar PV Idle (average) Wind offshore Wind onshore Hydro Biomass & gas (avg.)
14
The biggest contributors were large hydropower (approximately 2%) and biomass (just over 10%). Around 1% of global primary energy came from new renewable sources, such as PV, solar thermal, wind power, small-scale hydropower, geothermal, biogas and new biomass (Table 2-2).
Technology EJ Share Hydro 10.0 2.1%
Geothermal power 1.9 0.4% Wind power 0.3 0.1%
Solar power (PV) 0.005 0.001% Geothermal heat 0.2 0.04%
Solar heat 0.2 0.04% Biomass 48.3 10.4%
Total renewable 60.9 13.1% Total global primary energy
consumption 465.4 100.0%
Table 2-2 The contribution of RES in global primary energy supply in 2004
Table 2-3 shows production of electricity (power generation), demonstrating that hydro has the largest installed capacity, followed by wind, biomass, geothermal and solar PV; for heating, biomass, has the largest installed capacity, followed by solar thermal and geothermal.

15
Table 2-3 Renewables installed capacity 2004-2005
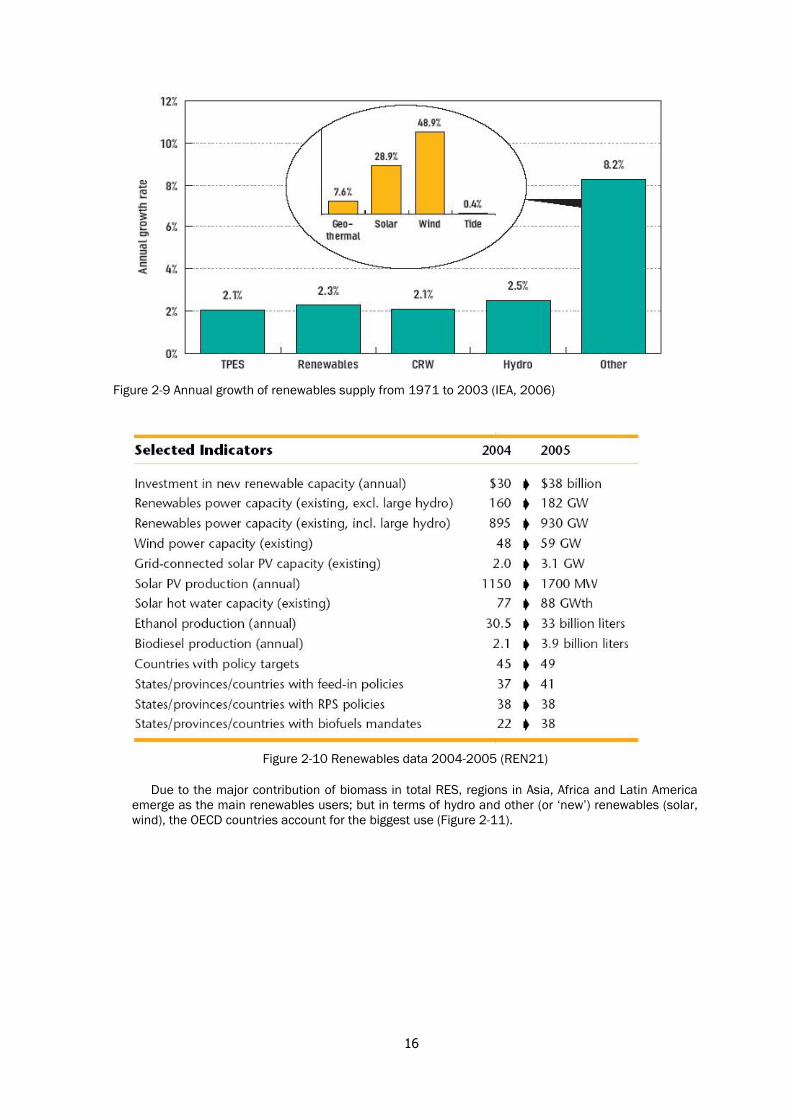
As can be seen from Figure 2-9, the fastest-growing energy technologies are wind and solar, and over recent years they have increased by some 30-50% annually, albeit starting from very low levels (especially PV). Biodiesel is increasing, over the last five years by 25%, calculated as the average annual growth rate.
16
Figure 2-9 Annual growth of renewables supply from 1971 to 2003 (IEA, 2006)
Figure 2-10 Renewables data 2004-2005 (REN21)
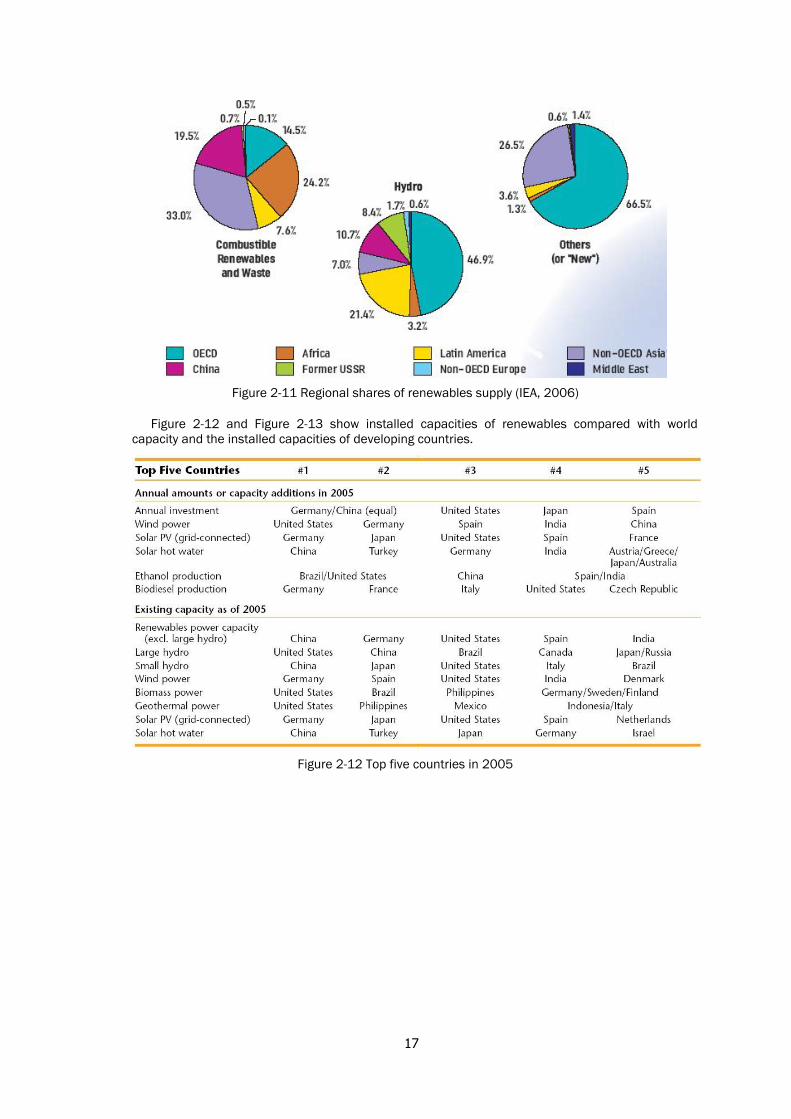
Due to the major contribution of biomass in total RES, regions in Asia, Africa and Latin America emerge as the main renewables users; but in terms of hydro and other (or ‘new’) renewables (solar, wind), the OECD countries account for the biggest use (Figure 2-11).
17
Figure 2-11 Regional shares of renewables supply (IEA, 2006)
Figure 2-12 and Figure 2-13 show installed capacities of renewables compared with world capacity and the installed capacities of developing countries.
Figure 2-12 Top five countries in 2005
18
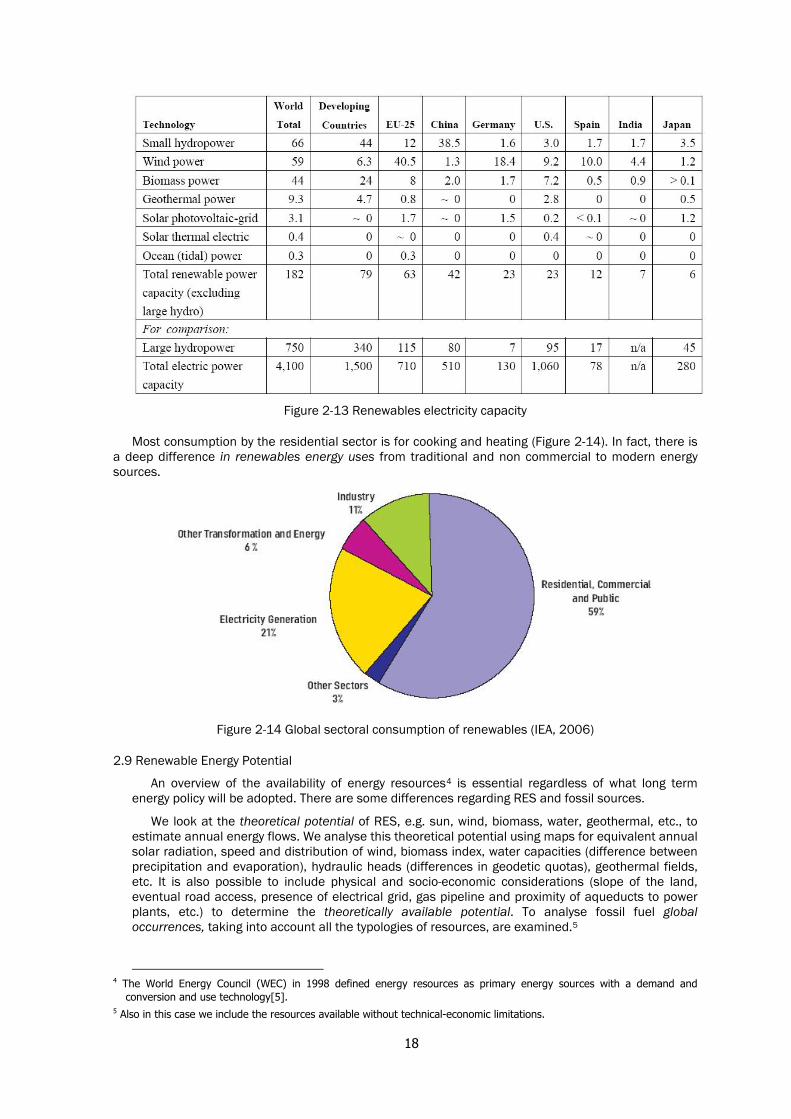
Figure 2-13 Renewables electricity capacity
Most consumption by the residential sector is for cooking and heating (Figure 2-14). In fact, there is a deep difference in renewables energy uses from traditional and non commercial to modern energy sources.
Figure 2-14 Global sectoral consumption of renewables (IEA, 2006)
2.9 Renewable Energy Potential
An overview of the availability of energy resources4 is essential regardless of what long term energy policy will be adopted. There are some differences regarding RES and fossil sources.
We look at the theoretical potential of RES, e.g. sun, wind, biomass, water, geothermal, etc., to estimate annual energy flows. We analyse this theoretical potential using maps for equivalent annual solar radiation, speed and distribution of wind, biomass index, water capacities (difference between precipitation and evaporation), hydraulic heads (differences in geodetic quotas), geothermal fields, etc. It is also possible to include physical and socio-economic considerations (slope of the land, eventual road access, presence of electrical grid, gas pipeline and proximity of aqueducts to power plants, etc.) to determine the theoretically available potential. To analyse fossil fuel global occurrences, taking into account all the typologies of resources, are examined.5
4 The World Energy Council (WEC) in 1998 defined energy resources as primary energy sources with a demand and
conversion and use technology[5]. 5 Also in this case we include the resources available without technical-economic limitations.
19
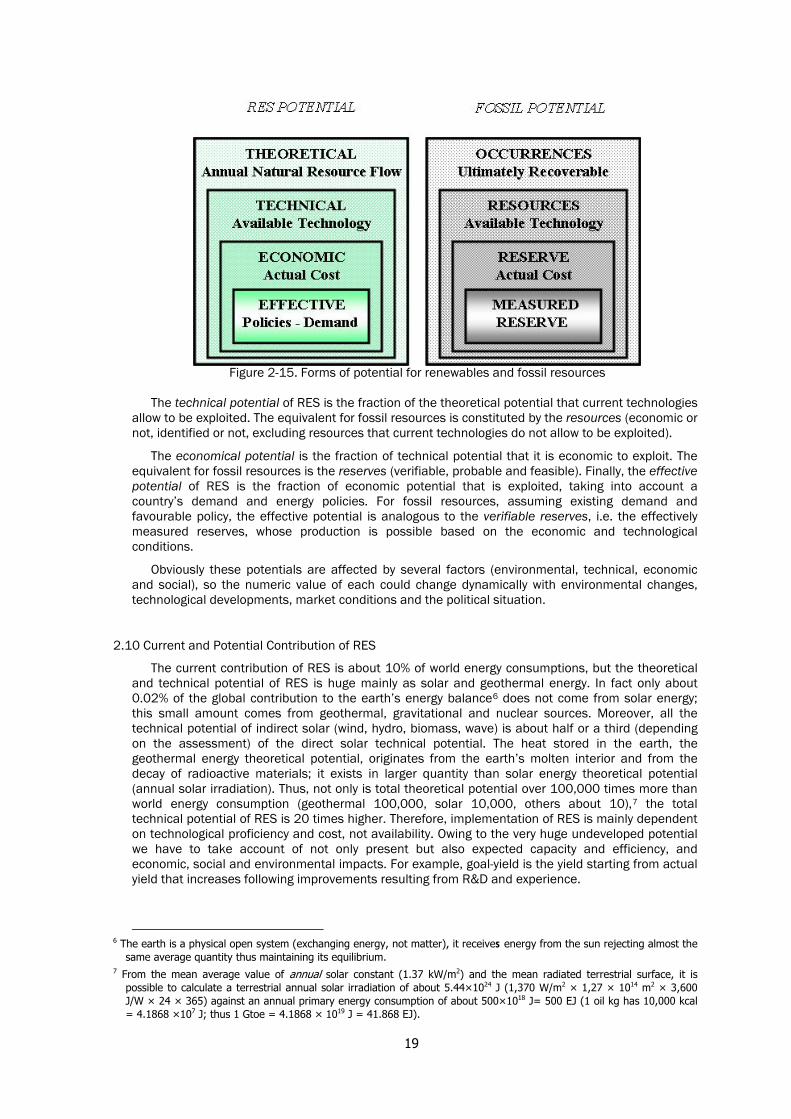
Figure 2-15. Forms of potential for renewables and fossil resources
The technical potential of RES is the fraction of the theoretical potential that current technologies
allow to be exploited. The equivalent for fossil resources is constituted by the resources (economic or not, identified or not, excluding resources that current technologies do not allow to be exploited).
The economical potential is the fraction of technical potential that it is economic to exploit. The equivalent for fossil resources is the reserves (verifiable, probable and feasible). Finally, the effective potential of RES is the fraction of economic potential that is exploited, taking into account a country’s demand and energy policies. For fossil resources, assuming existing demand and favourable policy, the effective potential is analogous to the verifiable reserves, i.e. the effectively measured reserves, whose production is possible based on the economic and technological conditions.
Obviously these potentials are affected by several factors (environmental, technical, economic and social), so the numeric value of each could change dynamically with environmental changes, technological developments, market conditions and the political situation.
2.10 Current and Potential Contribution of RES
The current contribution of RES is about 10% of world energy consumptions, but the theoretical and technical potential of RES is huge mainly as solar and geothermal energy. In fact only about 0.02% of the global contribution to the earth’s energy balance6 does not come from solar energy; this small amount comes from geothermal, gravitational and nuclear sources. Moreover, all the technical potential of indirect solar (wind, hydro, biomass, wave) is about half or a third (depending on the assessment) of the direct solar technical potential. The heat stored in the earth, the geothermal energy theoretical potential, originates from the earth’s molten interior and from the decay of radioactive materials; it exists in larger quantity than solar energy theoretical potential (annual solar irradiation). Thus, not only is total theoretical potential over 100,000 times more than world energy consumption (geothermal 100,000, solar 10,000, others about 10),7 the total technical potential of RES is 20 times higher. Therefore, implementation of RES is mainly dependent on technological proficiency and cost, not availability. Owing to the very huge undeveloped potential we have to take account of not only present but also expected capacity and efficiency, and economic, social and environmental impacts. For example, goal-yield is the yield starting from actual yield that increases following improvements resulting from R&D and experience.
6 The earth is a physical open system (exchanging energy, not matter), it receives energy from the sun rejecting almost the
same average quantity thus maintaining its equilibrium. 7 From the mean average value of annual solar constant (1.37 kW/m2) and the mean radiated terrestrial surface, it is
possible to calculate a terrestrial annual solar irradiation of about 5.44×1024 J (1,370 W/m2 × 1,27 × 1014 m2 × 3,600 J/W × 24 × 365) against an annual primary energy consumption of about 500×1018 J= 500 EJ (1 oil kg has 10,000 kcal = 4.1868 ×10⁷ J; thus 1 Gtoe = 4.1868 × 10¹⁹ J = 41.868 EJ).
20
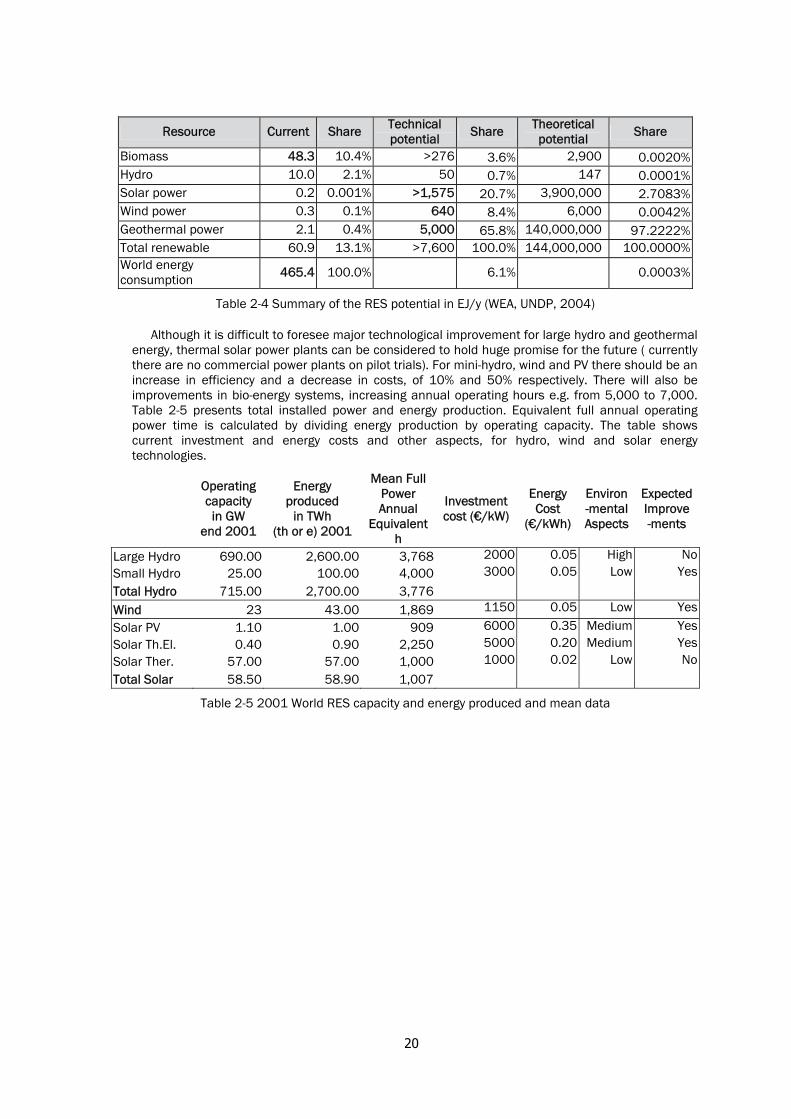
Resource Current Share Technical potential Share Theoretical
potential Share
Biomass 48.3 10.4% >276 3.6% 2,900 0.0020% Hydro 10.0 2.1% 50 0.7% 147 0.0001% Solar power 0.2 0.001% >1,575 20.7% 3,900,000 2.7083% Wind power 0.3 0.1% 640 8.4% 6,000 0.0042% Geothermal power 2.1 0.4% 5,000 65.8% 140,000,000 97.2222% Total renewable 60.9 13.1% >7,600 100.0% 144,000,000 100.0000% World energy consumption 465.4 100.0% 6.1% 0.0003%
Table 2-4 Summary of the RES potential in EJ/y (WEA, UNDP, 2004)
Although it is difficult to foresee major technological improvement for large hydro and geothermal energy, thermal solar power plants can be considered to hold huge promise for the future ( currently there are no commercial power plants on pilot trials). For mini-hydro, wind and PV there should be an increase in efficiency and a decrease in costs, of 10% and 50% respectively. There will also be improvements in bio-energy systems, increasing annual operating hours e.g. from 5,000 to 7,000. Table 2-5 presents total installed power and energy production. Equivalent full annual operating power time is calculated by dividing energy production by operating capacity. The table shows current investment and energy costs and other aspects, for hydro, wind and solar energy technologies.
Operating capacity in GW
end 2001
Energy produced
in TWh (th or e) 2001
Mean Full Power Annual
Equivalent h
Investment cost (€/kW)
Energy Cost
(€/kWh)
Environ -mental Aspects
Expected Improve -ments
Large Hydro 690.00 2,600.00 3,768 2000 0.05 High No Small Hydro 25.00 100.00 4,000 3000 0.05 Low Yes
Total Hydro 715.00 2,700.00 3,776
Wind 23 43.00 1,869 1150 0.05 Low Yes
Solar PV 1.10 1.00 909 6000 0.35 Medium Yes Solar Th.El. 0.40 0.90 2,250 5000 0.20 Medium Yes Solar Ther. 57.00 57.00 1,000 1000 0.02 Low No
Total Solar 58.50 58.90 1,007
Table 2-5 2001 World RES capacity and energy produced and mean data
21
2.11 References
1. International Energy Agency (IEA) statistics, web site: www.iea.org/statist/keyword/keystats.htm, 2007.
2. IEA, World Energy Outlook 2006, www.iea.org, WEO, 2006. 3. IEA, Potential for Building Integrated Photovoltaics, 2003. 4. United Nation Organisation statistics, web site: www.undp.org, 2007. 5. United Nations Development Program (UNDP-UNDESA-WEC), World Energy Assessment, WEA,
2000 and update 2004. 6. IEA - United Nations Industrial Development Organization (UNIDO), Hydropower and the World’s
Energy Future, 2000. 7. National Renewable Energy Laboratory (NREL) and Department of Energy (DOE) statistics, web
site: www.nrel.gov and www.eren.doe.gov. 8. Energy Information Administration (EIA), Department Of Energy (DOE), International and Annual
energy Outlook 2007, www.eia.doe.gov, IEO and AEO, 2007. 9. European Commission, World Energy Technology Outlook 2006 (DGRTD),
http://ec.europa.eu/research/energy/pdf/weto-h2_en.pdf, WETO, 2006. 10. European Commission, Energy Policy for Europe, http://Eur-
lex.europa.eu/LexUriServ/site/it/com/2007/com2007_0001it01.pdf, 2007. 11. Intergovernmental Panel on Climate Change (IPCC), Climate Change 2007, www.ipccc.ch, 2007. 12. Stern, Stern Review on the Economics of Climate Change, www.hm-
tresaury.gv.uk/indipendent_reviews/stern_report.cfm, 2007. 13. World Wide Found (WWF), The living planet report 2006, 2006. 14. Energy and Environment Italian Agency (ENEA), 2006 Energy and Environment Report (Rapporto
Energia e Ambiente), 2007, (in Italian). 15. ENEA, Solar thermal energy production: guidelines and future programmes of ENEA, 2001. 16. International Solar Energy Society (ISES), Renewable Energy state of art (Stato dell’arte delle fonti
energetiche nuove e rinnovabili), 1996, (in Italian).
22
33 .. CC UU RR RR EE NN TT SS TT AA TT EE -- OO FF -- AA RR TT OO FF RR EE NN EE WW AA BB LL EE SS II NN LL AA TT II NN AA MM EE RR II CC AA
3.1 Renewables and the Power Sector
Since the mid 1990s most Latin America countries have adopted similar energy policies that include monopolisation, unbundling, regulatory bodies, privatisation and subsidy removal. In many countries of Latin America:
1. the State has a majority role; 2. RES are not central in energy policies; 3. there is a limit on small scale connection of RES to the grid.
The power sector is in crisis, particularly in terms of financing and ability to meet demand at
least-cost, and on an environmentally sustainable basis. Most Latin American countries need a restructuring of their energy sectors and a focus on the development of renewable energies. Some regions are starting to make progress in the area of RES through the provision of funding, subsidies and rural developments; however, much remains to be done. There is a strong polarisation in the region between north and south, and between the coastal region and the mountains, this last area being particularly challenging in terms of electrification.
In general, significantly expanded access to energy will be required to improve security of energy supply and social equity, create jobs, and protect the global and local environment.
3.2 Energy Resources in Latin America
Energy supply in the Latin America region is based mainly on oil. Only some countries, Mexico, Venezuela, Colombia and Brazil, in the area have sufficient oil resources to be self sufficient; the rest of the region depends on imports.
Hydro resources are available in most countries. Brazil and most of Central America depend on hydro electricity generating. Natural gas is plentiful in Argentina, Bolivia and Peru, but its exploitation needs to be developed in some countries. Several countries in the region have no commercial fossil fuel supplies.
All the countries in the region are endowed with abundant RES. Solar, wind, biomass, small hydro and energy resources derived from the ocean are available in region in larger or smaller quantities, depending on their geographical location and morphology.
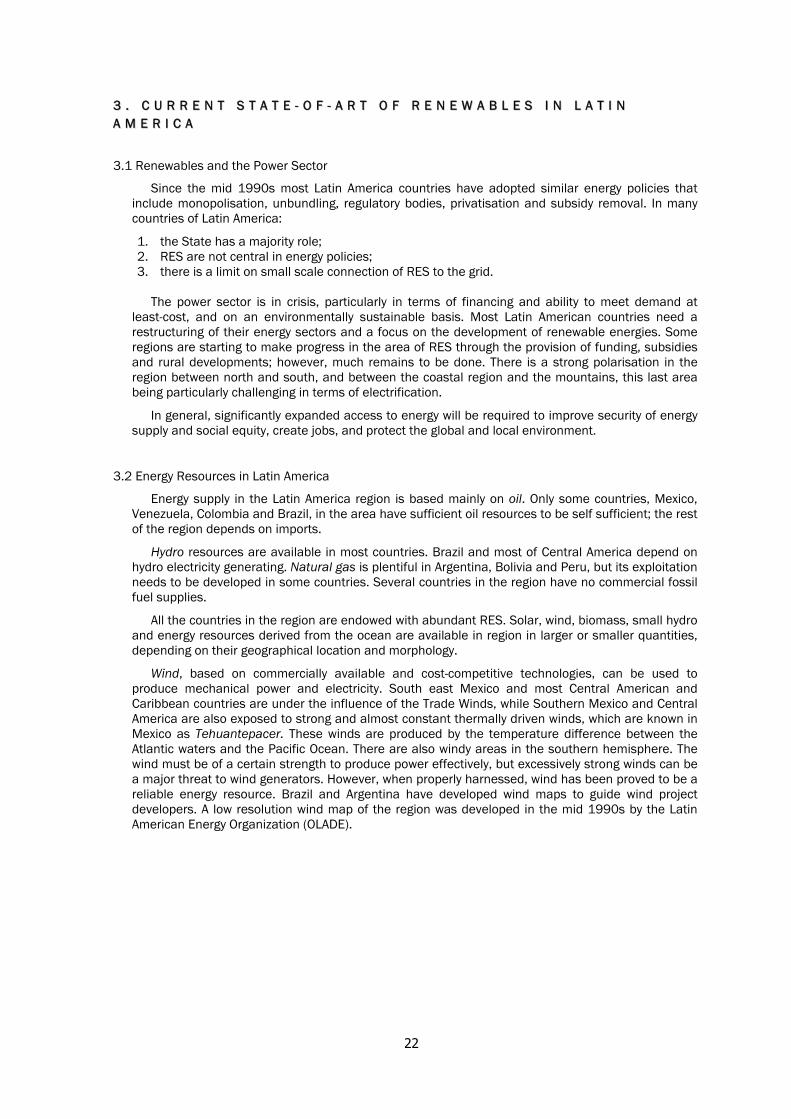
Wind, based on commercially available and cost-competitive technologies, can be used to produce mechanical power and electricity. South east Mexico and most Central American and Caribbean countries are under the influence of the Trade Winds, while Southern Mexico and Central America are also exposed to strong and almost constant thermally driven winds, which are known in Mexico as Tehuantepacer. These winds are produced by the temperature difference between the Atlantic waters and the Pacific Ocean. There are also windy areas in the southern hemisphere. The wind must be of a certain strength to produce power effectively, but excessively strong winds can be a major threat to wind generators. However, when properly harnessed, wind has been proved to be a reliable energy resource. Brazil and Argentina have developed wind maps to guide wind project developers. A low resolution wind map of the region was developed in the mid 1990s by the Latin American Energy Organization (OLADE).
23
Figure 3-1 Wind potential for Latin America
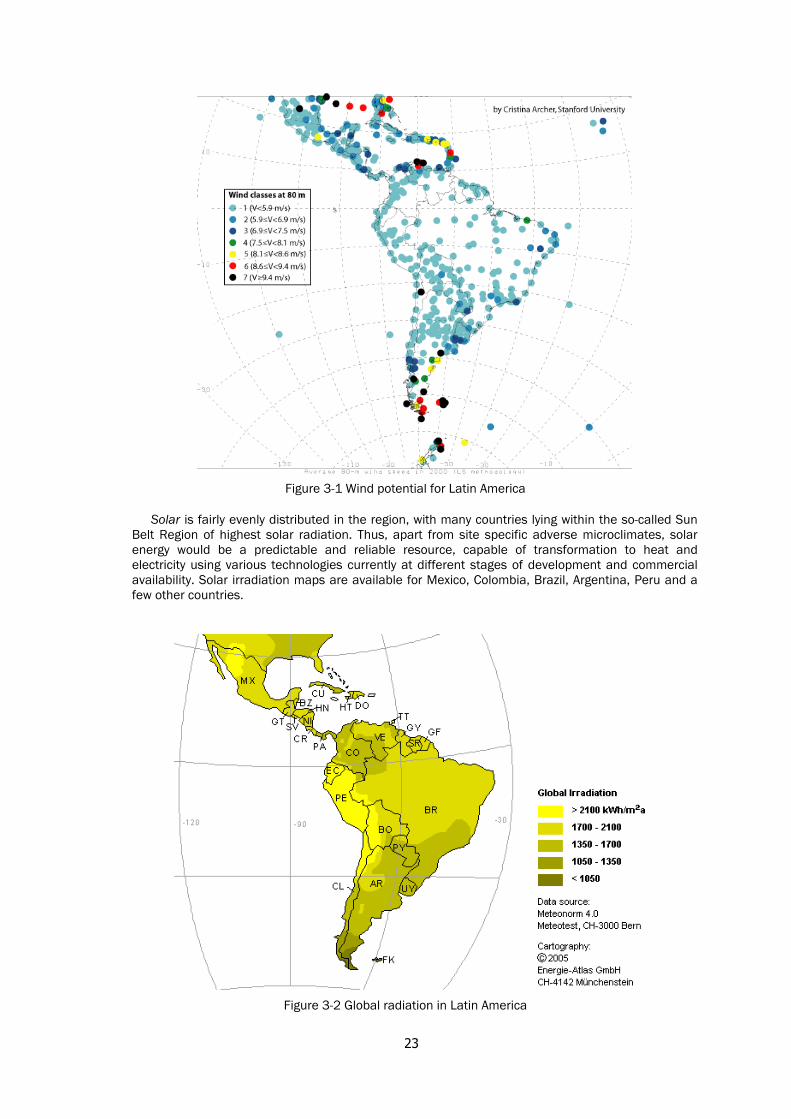
Solar is fairly evenly distributed in the region, with many countries lying within the so-called Sun Belt Region of highest solar radiation. Thus, apart from site specific adverse microclimates, solar energy would be a predictable and reliable resource, capable of transformation to heat and electricity using various technologies currently at different stages of development and commercial availability. Solar irradiation maps are available for Mexico, Colombia, Brazil, Argentina, Peru and a few other countries.
Figure 3-2 Global radiation in Latin America
24
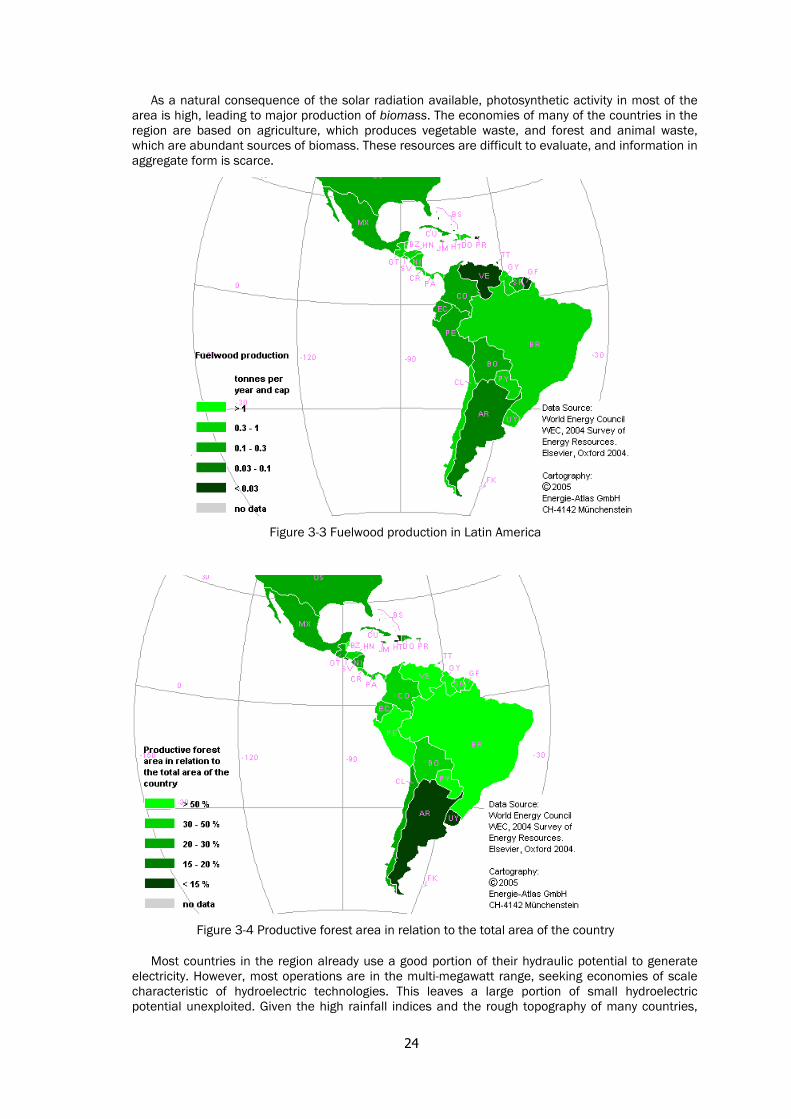
As a natural consequence of the solar radiation available, photosynthetic activity in most of the area is high, leading to major production of biomass. The economies of many of the countries in the region are based on agriculture, which produces vegetable waste, and forest and animal waste, which are abundant sources of biomass. These resources are difficult to evaluate, and information in aggregate form is scarce.
Figure 3-3 Fuelwood production in Latin America
Figure 3-4 Productive forest area in relation to the total area of the country
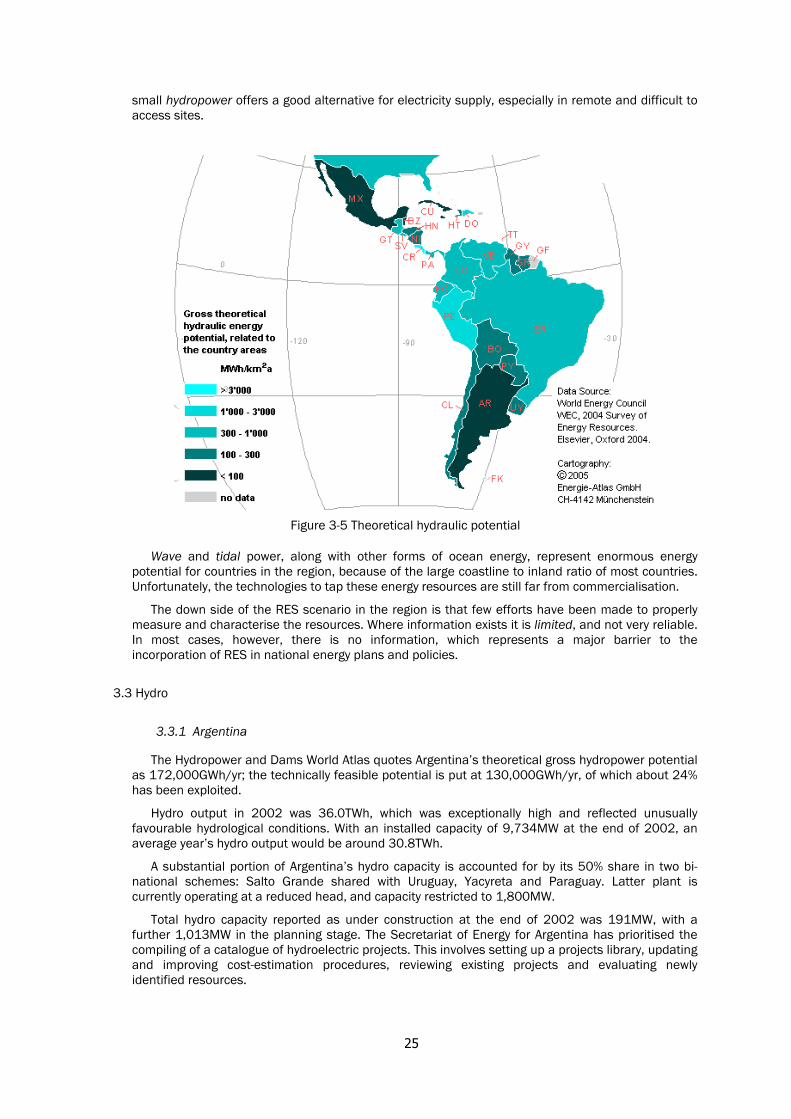
Most countries in the region already use a good portion of their hydraulic potential to generate electricity. However, most operations are in the multi-megawatt range, seeking economies of scale characteristic of hydroelectric technologies. This leaves a large portion of small hydroelectric potential unexploited. Given the high rainfall indices and the rough topography of many countries,
25
small hydropower offers a good alternative for electricity supply, especially in remote and difficult to access sites.
Figure 3-5 Theoretical hydraulic potential
Wave and tidal power, along with other forms of ocean energy, represent enormous energy potential for countries in the region, because of the large coastline to inland ratio of most countries. Unfortunately, the technologies to tap these energy resources are still far from commercialisation.
The down side of the RES scenario in the region is that few efforts have been made to properly measure and characterise the resources. Where information exists it is limited, and not very reliable. In most cases, however, there is no information, which represents a major barrier to the incorporation of RES in national energy plans and policies.
3.3 Hydro
3.3.1 Argentina
The Hydropower and Dams World Atlas quotes Argentina’s theoretical gross hydropower potential as 172,000GWh/yr; the technically feasible potential is put at 130,000GWh/yr, of which about 24% has been exploited.
Hydro output in 2002 was 36.0TWh, which was exceptionally high and reflected unusually favourable hydrological conditions. With an installed capacity of 9,734MW at the end of 2002, an average year’s hydro output would be around 30.8TWh.
A substantial portion of Argentina’s hydro capacity is accounted for by its 50% share in two bi-national schemes: Salto Grande shared with Uruguay, Yacyreta and Paraguay. Latter plant is currently operating at a reduced head, and capacity restricted to 1,800MW.
Total hydro capacity reported as under construction at the end of 2002 was 191MW, with a further 1,013MW in the planning stage. The Secretariat of Energy for Argentina has prioritised the compiling of a catalogue of hydroelectric projects. This involves setting up a projects library, updating and improving cost-estimation procedures, reviewing existing projects and evaluating newly identified resources.
26
3.3.2 Bolivia
For Cochabamba’s conditions, a mini-hydroelectric 100kW plant costs around US$300,000 and is capable of providing domestic and production-oriented energy to 400 households; a 200W unit costs US$600 for electromechanical equipment, and another similar amount for civil works. As costs are lower than for solar systems, the cost of the energy produced is about 15 times lower than that derived from solar energy.
A project inventory carried out by the national energy ministry, in the early 2000s, revealed the feasibility of installing 7MW micro-plants, distributed across more than 100 projects, to supply almost 20,000 families.
3.3.3 Brazil
Hydroelectric power is one of Brazil’s principal energy assets: the republic has the largest hydropower resources on the continent. The Brazilian World Engineer Convention (WEC) Member Committee reports that gross theoretical capability exceeds 3,000TWh/yr, with an economically exploitable capability of over 800TWh/yr, of which nearly 40% has so far been harnessed. Hydro output in 2002 was 285TWh, which accounted for 89% of Brazil’s electricity generation.
Hydroelectric plants (above 30MW capacity) represent 78% of Brazilian installed capacity. Thus, Brazil’s electricity generation is strongly influenced by the natural flows of rivers and other watercourses. In 2001, due to unexpectedly low water flows, a power outage occurred in Brazil. However, in 2002 reservoir levels rose, new power plants came into operation and consumers were making more efficient use of energy, all of which has considerably reduced the risks of future power outages in the short term.
Hydro generating capacity in Brazil more than doubled between 1980 and 1999, partly through the commissioning of the huge Itaipu scheme (total capacity 12,600MW), which came on line between 1984 and 1991. Brazil shares Itaipu’s output with its neighbour Paraguay, which sells back to Brazil the surplus remaining after its own electricity needs have been satisfied. At the end of 2002, Brazil had over 7GW of hydro capacity under construction, including a major (4,125MW) extension of capacity at Tucuruı and two additional 700MW units at Itaipu. Nearly 7GW of hydro capacity is planned for future development.
In the above context, small-scale hydro (defined by Brazil in 1998 as 1–30MW capacity plants) has an economically exploitable capability of about 17TWh/yr, some 27% of which had been exploited by capacity installed at the end of 2002.
The 975MW of small-scale hydro currently in place will be augmented by the 2,280MW additional capacity that is under construction or planned. Under current legislation, owners/developers of small scale hydro schemes receive incentives, which are designed to increase competition in the electricity market.
3.3.4 Chile
Chile has substantial hydropower potential, with technically exploitable capability estimated at about 162TWh/yr, of which some 15% has so far been exploited. Hydro output in 2002 was 22.6TWh, equivalent to about 53% of Chile’s total electricity generation. The largest hydro scheme currently under development is the 570MW Ralco project, which is expected to become operational in 2004. A number of projects, including some long-term schemes, are planned: La Higuera/Tinguririca (260MW), Baker (1,000MW), Pascua (1,200MW), Neltume (400MW), Choshuenco (150MW) and Punilla (100MW).
3.3.5 Colombia
The theoretical potential for hydropower in Colombia is large - estimated at 1,000TWh/yr, of which 20% is classified as technically feasible. The economically exploitable capability has been evaluated at 140TWh/yr: hydro output in 2002 represented about a quarter of this potential, and accounted for around two-thirds of Colombia’s electricity generation. Two large hydro schemes have recently come on stream - Porce II (392MW) and La Miel I (400MW). Around 10,000MW of new capacity is at the planning stage for medium- to long-term implementation, including Sogamoso (1,035MW), Nechı (750MW), Porce III (660MW), La Miel II (411MW) and Quimbo (400MW).
27
3.3.6 Costa Rica
For a country with a surface area of only 51 100 km2, Costa Rica has surprisingly large hydroelectric potential. Its gross theoretical potential is estimated at 223TWh/yr, of which 43TWh/yr has been assessed as technically feasible. Aggregate hydro capacity was 1,263MW at end-2002, equivalent to about 77% of Costa Rica’s generating capacity. Several new hydro plants are under construction or planned: the largest being Cariblanco (70MW), due to be commissioned in 2006, and Pirris (128MW), scheduled to come on line in 2007.
3.3.7 Cuba
Cuba has 175 hydroelectric power plants with a total capacity of 54.7MW, which generate 90GWh.
3.3.8 Ecuador
Ecuador has a portfolio of small hydro projects including some 3,220MW plants. These should receive funding within the framework of support mechanisms, such as the FERUM (Fund for Electrification of Marginal Rural and Urban Areas). In discussions about the prospects for renewable energy, the importance of including hydro energy as a sustainable source was underlined, e.g. one project (Proyecto de Propósito Múltiple Quevedo Vinces) involves integration of the Baba dam project with the Río Guayas basin. This project is expected to generate more than 50MW, reduce flooding downriver, regularise flows (80% between January and May) and enable irrigation.
3.3.9 Mexico
With a gross theoretical hydro capability of 135TWh/yr and a technically exploitable capability of 49TWh/yr (Hydropower & Dams World Atlas, 2003), Mexico possesses considerable hydroelectric potential. Its economically exploitable capability quoted by the same source is 32.2TWh/yr.
The Mexican WEC Member Committee reports that actual hydro generation in 2002 was 24.9TWh, equivalent to 11.6% of total net generation. Nearly 1,700MW of additional hydro capacity was reported to be under construction at the end of 2002, with approximately the same amount of capacity planned for future development. The principal plants are
1. El Cajon (680MW), scheduled for completion in 2007; 2. La Parota (765MW), due on stream in 2008; 3. Copainala´ (210MW), due on stream in 2008.
A major extension of the Manuel Moreno Torres (Chicoasen) hydro plant is planned for completion in 2003; this will add three units, with a total additional capacity of 900MW. At end 2002, installed capacity of small scale hydropower as reported by the Mexican Member Committee, was 385MW, with an annual output of 1,488GWh.
3.3.10 Paraguay
Paraguay’s outstanding natural energy asset is its hydroelectric potential, which is mainly derived from the river Parana and its tributaries. The country’s gross theoretical capability for hydroelectricity is about 111TWh/yr, of which 68TWh is estimated to be economically exploitable. Two huge hydroelectric schemes currently exploit the flow of the Parana: Itaipu, which Paraguay shares with Brazil, and Yacyreta, which it shares with Argentina.
Itaipu is the world’s largest hydroelectric plant, with total generating capacity of 12,600MW, half of which goes to Paraguay. This share is far in excess of Paraguay’s current or forecast needs and most of this output is sold back to Brazil. Two more 700MW units are being installed at Itaipu, with completion expected in 2004.
The bi-national plant at Yacyreta, downstream from Itaipu, has an installed capacity of 3,100MW. There are 20 generating units, each of 155MW capacity, all of which are operating at only 90MW per unit, owing to the reservoir level being held below what was originally planned. The planned addition of 255MW of hydro capacity on the Añacuá, a tributary of the Parana´, would raise the level of the water in the Yacyreta reservoir, leading to improved utilisation of the bi-national scheme’s turbines.
28
Paraguay has a wholly owned 256MW hydro plant (Acaray), which will probably be upgraded during the next few years. The state electricity utility, ANDE, also plans to install two 100MW units at Yguazu. An environmental impact study has been conducted for the projected bi-national Corpus Christi dam (2,880MW, to be shared with Argentina), to be sited on the Parana´, downstream of Itaipú and upstream of Yacyreta.
3.3.11 Peru
Peru’s topography, with the Andes running the length of the country and many fast-flowing rivers, endows the republic with enormous hydroelectric potential. Its hydro capability is assessed as among the largest in South America: its economically exploitable capability is some 260TWh/yr. Current utilisation of this capability is very low, at around 6%. Hydro provides about 75% of Peru’s electricity.
Plants under construction at the end of 2002 were Chimay (142MW), Ocona (150MW) and Yu´ncan (134MW). About 1,500MW of hydro capacity is planned for development over the short/medium term, including Olmos (624MW), Cheves (525MW) and El Platanal (two plants totalling 270MW).
3.3.12 Uruguay
Hydropower is Uruguay’s only indigenous source of commercial primary energy, and is limited. According to Hydropower & Dams World Atlas 2003, the technically exploitable potential is 10TWh/yr, from a gross theoretical potential of 32TWh. The Uruguayan WEC Member Committee estimates the gross theoretical capability at only 16TWh and reports 2002 output to be 9,535 GWh, thus leaving only small incremental capacity available for exploitation in the future.
During the 1980s almost all of Uruguay’s incremental generating capacity was in the form of hydropower, based on the commissioning of the bi-national Salto Grande (1,890MW) plant on the river Uruguay, whose output is shared with Argentina. No new hydro plants are under construction or planned: future increases in generating capacity are likely to be fuelled by natural gas.
3.3.13 Venezuela
The Venezuelan WEC Member Committee reports a gross theoretical capability of 320TWh/yr, of which 130TWh/yr is considered to be economically exploitable. Hydroelectric output in 2002 was 54.8TWh, a relatively low level due to low water availability. Hydro output in an average year should reach 65TWh, representing half the realistic potential.
About 70% of the republic’s electricity requirements are met from hydropower. A large increase in hydroelectric capacity occurred during the 1980s as a result of the new Guri plant (Raúl Leoni), on the river Caronı in eastern Venezuela, whose 10,300MW capacity makes it (at the time of writing) the world’s second largest hydro station, after Itaipu. Its capacity is currently being expanded to 10,700MW.
At end 2002, total hydroelectric generating capacity is reported to be 13.76GW, 4.5GW under construction and a further 7.4GW planned for future development.
The 2,160 MW Caruachi project, sited 59km downstream from Guri, is scheduled for phased entry into operation between 2003 and 2006. There are two other major projects planned for the river Caronı: Tocoma (2,160MW) and Tayucay (2,450MW).
3.3.14 Dominican Republic
Although the Dominican Republic claims to have made substantial progress in exploiting its large-scale hydroelectric potential, mini-hydro potential has neither been properly identified nor exploited. According to the available information, the most significant contribution from RES comes from conventional hydro sources, with installed generating capacity standing at 452MW, with mini plants representing aggregate capacity of 0.93MW.
29
3.4 Wind
Wind represents one of fastest growing energy technologies, increasing over the last 5 years by more than 30% per annum on average. Europe accounts for most wind power, with 75% of global installed capacity. A major development is offshore installations, which, if successful, will provide a huge new wind energy resource. This should spur technological development of even bigger wind turbines, up to 5MW.
The increase in wind turbines is providing challenges for electricity systems. In Western Denmark more than 20% of annual electricity consumption is now delivered by wind turbines. New grid developments are needed to cope with this new source of electricity.
The increased numbers of wind turbines has produced a downward trend in the price of turbines and generating costs. This is in line with conventional industrial theory. These reduced costs will be an important factor in promoting the diffusion of wind power. Other important factors are the reduced dependence on fossil energy resources and emission free wind turbine operations. Wind resources can be exploited in most parts of the world. For wind power to be feasible, modern technology is required accompanied by annual average wind speeds over 5m/s (metres per second).
3.4.1 Argentina
Although the whole country experiences windy conditions, the greatest concentration of wind farms is in Patagonia, whose potential for wind energy is considered to be one of the largest in the world. Potential output, according to some studies, is estimated at 300,000MW based on mean wind speeds of over 8m/s.
Wind resource applications are being utilised to generate electricity for mechanical pumping for water troughs for cattle, sheep, pigs, etc. and for irrigation. Electricity generation is based on cooperative ventures that supply electricity to the public.
There are three sizes of water pumping mills on the domestic market, rated according to the diameter of the rotor. The calculations of power and energy output are based on an average mill. According to the manufacturers’ data, mean power is 1hp, equivalent to 0.75kW, and average use is 8 hours/day, 330 days/yr.
The PERMER Project in Argentina was set up to promote the development of renewable energies in rural markets.
3.4.2 Brazil
According to the Brazilian Wind Atlas, the gross wind resource potential is estimated at approximately 140GW. However, only a portion (30GW) of that potential could be effectively harnessed for wind power projects.
The Brazilian Government launched the PROINFA—Alternative Sources for Energy Incentive Programme, a national programme designed to promote the use of wind, biomass and micro-hydro. The first and second phases of the programme aim at a total of 4.15GW of wind energy by the end of 2014.
The main application of wind energy in Brazil is for installed capacity to be grid connected. At the time of writing there were nine projects, representing 22,075MW installed, generating some 54GWh/yr:
City State Capacity (kW) Fernando de Noronha Pernambuco 75 Aquiraz Ceara´ 10,000 Sa˜o Gonc¸alo do Amarante Ceara´ 5,000 Gouveia Minas Gerais 1,000 Palmas Parana´ 2,500 Fernando de Noronha Pernambuco 275 Fortaleza Ceara´ 2,400 Bom Jardim da Serra Santa Catarina 600 Olinda Pernambuco 225
Table 3-1 Installed capacity for Wind energy in Brazil
30
3.4.3 Chile
In 1992, the available information on wind power was used to evaluate wind resources in the country (Evaluación del potencial de energía eólica en Chile, CORFO). At the same time, the National Energy Commission produced a preliminary mapping of wind power potential for the Chiloé Archipelago, in order to evaluate this resource for rural areas not connected to the grid. This map enabled the development of hybrid wind-diesel projects forecast to supply more than 3,100 families on 32 islands in the archipelago.
At the time of writing only one of these projects, Alto Baguales, was up and running Alto Baguales is an area with three wind generators (660kWc/u) with a nominal combined capacity of 2MW. In November 2001, it was connected to the Aysén electricity system, which serves 19,000 families in Chile’s XI Region. The project is owned by the Aysén electricity company (Empresa Eléctrica de Aysén). The area’s high potential for wind power made this wind farm possible
3.4.4 Costa Rica
Costa Rica is reputed to have some of the highest average wind speeds in the world. In addition to using geothermal and biomass resources, the Costa Rican government is demonstrating commitment to the utilisation of wind in an effort to increase sustainability and reduce GHG emissions.
In 1993 the government issued a tender for a 20MW grid-connected wind plant near the town of La Tejona. The project involved the installation of 40-100 turbines on two parallel ridges to the northwest of Lake Arenal. However, many problems were encountered, which delayed the project until the late 1990s. It was not until September 2001 that the turbines were shipped and installation began.
Another project, also near Lake Arenal, financed by private and public loans, various banks and the Danish International Development Agency, has been developed. The 24MW Tierras Morenas wind farm sells approximately 70,000MWh/yr of electricity to the Instituto Costarricense de Electricidad, the state-owned national electric utility, under a 15-year power purchase agreement. At the present time Costa Rica is the only country on the Central American isthmus that has wind parks connected to the grid.
At the end of 2002, installed wind energy capacity was 62MW, which increased to 69MW by the end of 2003.
3.4.5 Cuba
Cuba has 6,767 windmills to pump water, which increased to almost 10,000toe in 2002. There are three facilities for the production of electricity using wind, with a total capacity of 0.46MW.
3.4.6 Ecuador
There is an interesting wind power initiative in the Loja region in the south of Ecuador. This is a high potential site that has stable, almost unidirectional winds with average speeds of 10m/s, enabling the installation of a 110MW plant. The first phase will involve development of a 15MW project, with funding from the Andean Development Corporation (as the guarantor) and the Government of Denmark (to finance the wind generators). The project design is based on strong leadership from the local community in coordination with MEM.
3.4.7 Mexico
Mexico’s estimated wind potential is about 5,000MW, mostly located in the south of the country. The Comisión Federal de Electricidad operates 2MW of the total installed capacity, 1MW is operated by self-producers and 3MW are from small wind power generators and wind water pumps. Currently, the cost of investment in wind power installations is around US$1,000 per kW installed, and electricity generation costs are between US$5 and 11cents/kWh.
31
3.4.8 Peru
To evaluate the country’s wind power, 31 metering stations have been set up across most of Peru’s districts (departamentos). Results indicate that the best conditions are on the coast and border regions between Bolivia and Chile. The Peruvian coast has significant wind power potential with average wind speeds of 8m/s in Malabrigo, San Juan de Marcona and Paracas. Along most of the rest of the coast, annual average wind speeds reach 6m/s, which indicate the value of conducting an analysis of their potential for generating electricity.
3.4.9 Dominican Republic
The potential for wind power in the Dominican Republic is estimated at over 10,000MW, mostly on the northern (towards the north-east) and the south-eastern coasts. There are already 30 small facilities that use wind power.
The Dominican Republic has several RES projects, including eight wind power projects, involving capacities ranging from 2-100MW, and a total of more than 300MW. Concessions are in place for half of this capacity.
3.4.10 Uruguay
At the present time wind energy is utilised for water pumping in remote rural areas not connected to the electricity grid. A pilot plant to study the feasibility of grid-connected wind generated electricity was installed in March 2000.
3.5 Solar Energy
3.5.1 Argentina
Total installed power in the form of PV solar power energy, as part of the public utility services, was estimated at 5MW in 2002. Estimated energy produced by this installed capacity was some 7MWh/year.
3.5.2 Bolivia
The rural electrification plan being implemented at the time of writing proposes the combined implementation of distribution lines, local systems and decentralized power plants, mainly based on solar energy, with the target being 45% coverage, adding to 60MW of demand by 2007.
3.5.3 Brazil
On average, Brazil receives 230Wh/m2 of solar radiation per year, giving the country considerable theoretical potential for solar energy. However, the problems and uncertainties are equally large. In common with the rest of the world, the future role of solar energy in Brazil is hard to predict. Many technological advances would be required to make solar energy economically viable. Currently, there are approximately 6,000 small projects with peak installed capacity of 3,000kW in a variety of applications, primarily water pumping and lighting..
3.5.4 Cuba
Cuba has 7,000 PV systems with a capacity of 1.5MW, including 350 medical centres, 5 rural hospitals, 2,364 primary schools, 1,864 rural television rooms and 150 social centres. There are more than 1,800 facilities for heating water based on solar energy.
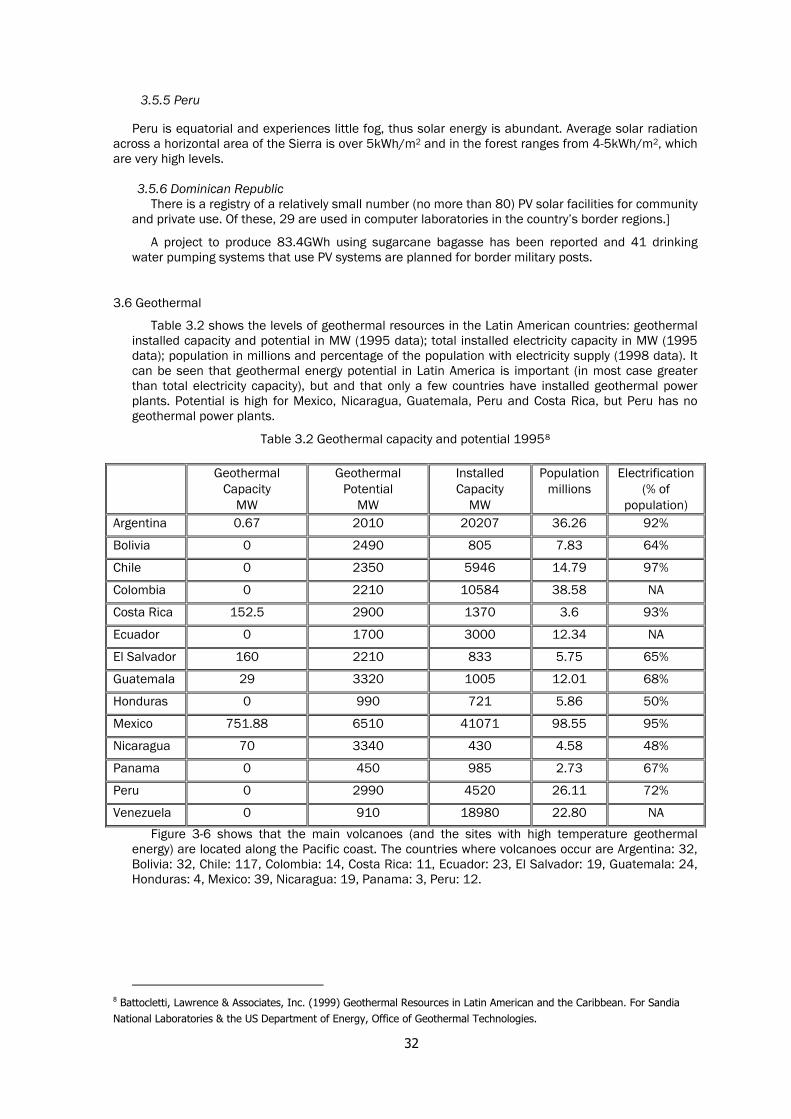
32
3.5.5 Peru
Peru is equatorial and experiences little fog, thus solar energy is abundant. Average solar radiation across a horizontal area of the Sierra is over 5kWh/m2 and in the forest ranges from 4-5kWh/m2, which are very high levels.
3.5.6 Dominican Republic
There is a registry of a relatively small number (no more than 80) PV solar facilities for community and private use. Of these, 29 are used in computer laboratories in the country’s border regions.]
A project to produce 83.4GWh using sugarcane bagasse has been reported and 41 drinking water pumping systems that use PV systems are planned for border military posts.
3.6 Geothermal
Table 3.2 shows the levels of geothermal resources in the Latin American countries: geothermal installed capacity and potential in MW (1995 data); total installed electricity capacity in MW (1995 data); population in millions and percentage of the population with electricity supply (1998 data). It can be seen that geothermal energy potential in Latin America is important (in most case greater than total electricity capacity), but and that only a few countries have installed geothermal power plants. Potential is high for Mexico, Nicaragua, Guatemala, Peru and Costa Rica, but Peru has no geothermal power plants.
Table 3.2 Geothermal capacity and potential 19958
Geothermal Capacity
MW
Geothermal Potential
MW
Installed Capacity
MW
Population millions
Electrification (% of
population) Argentina 0.67 2010 20207 36.26 92%
Bolivia 0 2490 805 7.83 64%
Chile 0 2350 5946 14.79 97%
Colombia 0 2210 10584 38.58 NA
Costa Rica 152.5 2900 1370 3.6 93%
Ecuador 0 1700 3000 12.34 NA
El Salvador 160 2210 833 5.75 65%
Guatemala 29 3320 1005 12.01 68%
Honduras 0 990 721 5.86 50%
Mexico 751.88 6510 41071 98.55 95%
Nicaragua 70 3340 430 4.58 48%
Panama 0 450 985 2.73 67%
Peru 0 2990 4520 26.11 72%
Venezuela 0 910 18980 22.80 NA
Figure 3-6 shows that the main volcanoes (and the sites with high temperature geothermal energy) are located along the Pacific coast. The countries where volcanoes occur are Argentina: 32, Bolivia: 32, Chile: 117, Colombia: 14, Costa Rica: 11, Ecuador: 23, El Salvador: 19, Guatemala: 24, Honduras: 4, Mexico: 39, Nicaragua: 19, Panama: 3, Peru: 12.
8 Battocletti, Lawrence & Associates, Inc. (1999) Geothermal Resources in Latin American and the Caribbean. For Sandia National Laboratories & the US Department of Energy, Office of Geothermal Technologies.

33
Figure 3-6 Volcanoes in Latin America9
References
1. Jorge M Huacuz, Overview of Renewable Energy Sources in Latin America, Non-Conventional Energy Unit, Alternative Energy Division, Electrical Research Institute (IIE)
2. World Energy Council. 2004 Survey of Energy resources 3. Renewable Energy Resource Maps. http://www.geni.org/globalenergy/library/renewable-
energy-resources/index.shtml
9 Source: Smithsonian National Museum of Natural History, http://www.volcano.si.edu/world/
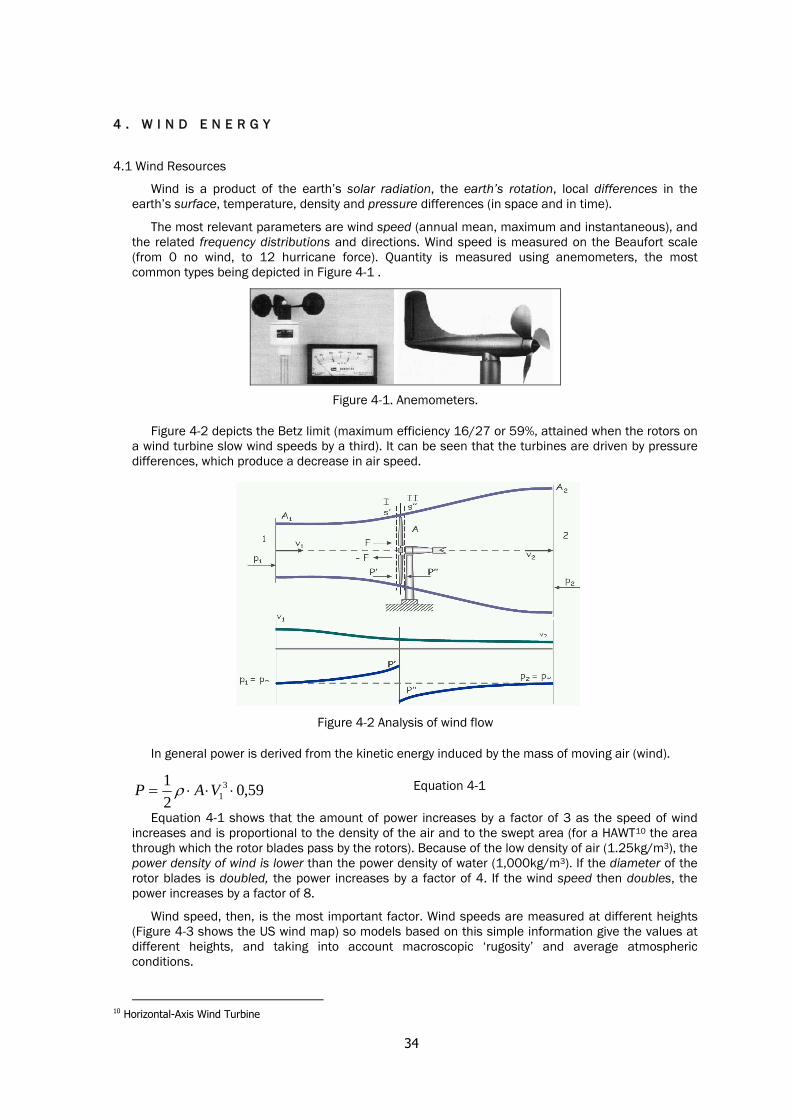
34
44 .. WW II NN DD EE NN EE RR GG YY
4.1 Wind Resources
Wind is a product of the earth’s solar radiation, the earth’s rotation, local differences in the earth’s surface, temperature, density and pressure differences (in space and in time).
The most relevant parameters are wind speed (annual mean, maximum and instantaneous), and the related frequency distributions and directions. Wind speed is measured on the Beaufort scale (from 0 no wind, to 12 hurricane force). Quantity is measured using anemometers, the most common types being depicted in Figure 4-1 .
Figure 4-1. Anemometers.
Figure 4-2 depicts the Betz limit (maximum efficiency 16/27 or 59%, attained when the rotors on a wind turbine slow wind speeds by a third). It can be seen that the turbines are driven by pressure differences, which produce a decrease in air speed.
Figure 4-2 Analysis of wind flow
In general power is derived from the kinetic energy induced by the mass of moving air (wind).
59,021 3
1 ⋅⋅⋅= VAP ρ Equation 4-1
Equation 4-1 shows that the amount of power increases by a factor of 3 as the speed of wind increases and is proportional to the density of the air and to the swept area (for a HAWT10 the area through which the rotor blades pass by the rotors). Because of the low density of air (1.25kg/m3), the power density of wind is lower than the power density of water (1,000kg/m3). If the diameter of the rotor blades is doubled, the power increases by a factor of 4. If the wind speed then doubles, the power increases by a factor of 8.
Wind speed, then, is the most important factor. Wind speeds are measured at different heights (Figure 4-3 shows the US wind map) so models based on this simple information give the values at different heights, and taking into account macroscopic ‘rugosity’ and average atmospheric conditions.
10 Horizontal-Axis Wind Turbine
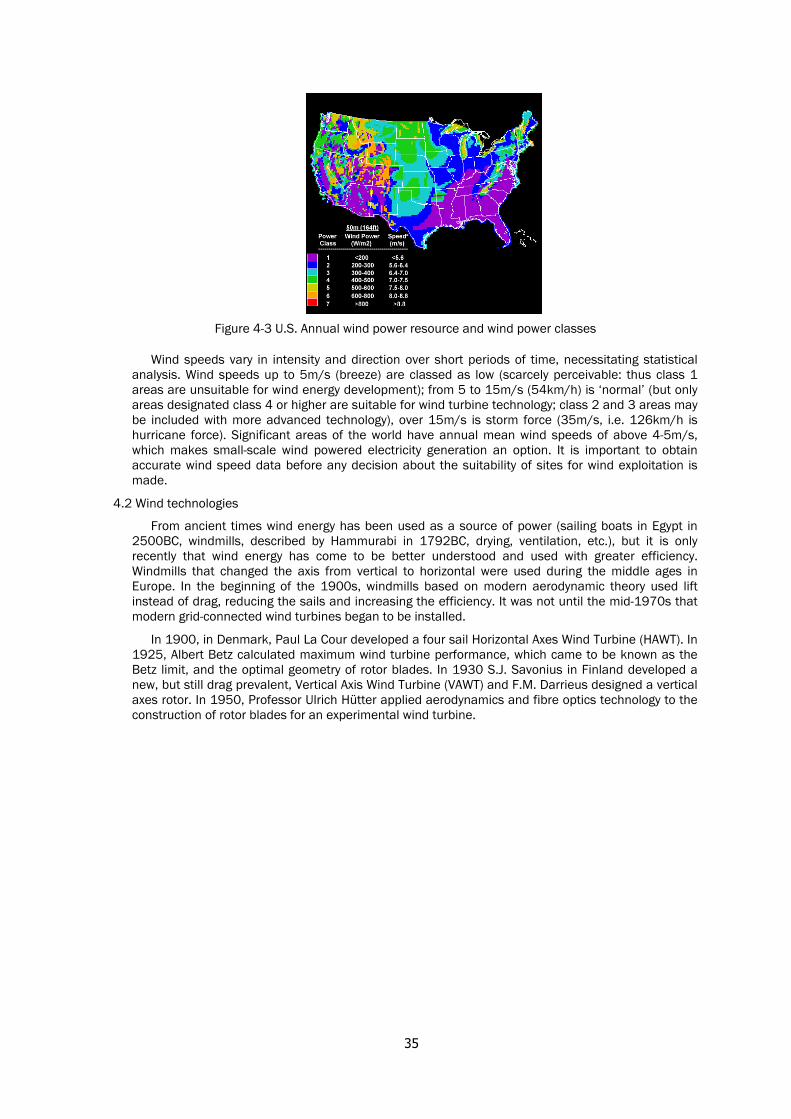
35
Figure 4-3 U.S. Annual wind power resource and wind power classes
Wind speeds vary in intensity and direction over short periods of time, necessitating statistical analysis. Wind speeds up to 5m/s (breeze) are classed as low (scarcely perceivable: thus class 1 areas are unsuitable for wind energy development); from 5 to 15m/s (54km/h) is ‘normal’ (but only areas designated class 4 or higher are suitable for wind turbine technology; class 2 and 3 areas may be included with more advanced technology), over 15m/s is storm force (35m/s, i.e. 126km/h is hurricane force). Significant areas of the world have annual mean wind speeds of above 4-5m/s, which makes small-scale wind powered electricity generation an option. It is important to obtain accurate wind speed data before any decision about the suitability of sites for wind exploitation is made.
4.2 Wind technologies
From ancient times wind energy has been used as a source of power (sailing boats in Egypt in 2500BC, windmills, described by Hammurabi in 1792BC, drying, ventilation, etc.), but it is only recently that wind energy has come to be better understood and used with greater efficiency. Windmills that changed the axis from vertical to horizontal were used during the middle ages in Europe. In the beginning of the 1900s, windmills based on modern aerodynamic theory used lift instead of drag, reducing the sails and increasing the efficiency. It was not until the mid-1970s that modern grid-connected wind turbines began to be installed.
In 1900, in Denmark, Paul La Cour developed a four sail Horizontal Axes Wind Turbine (HAWT). In 1925, Albert Betz calculated maximum wind turbine performance, which came to be known as the Betz limit, and the optimal geometry of rotor blades. In 1930 S.J. Savonius in Finland developed a new, but still drag prevalent, Vertical Axis Wind Turbine (VAWT) and F.M. Darrieus designed a vertical axes rotor. In 1950, Professor Ulrich Hütter applied aerodynamics and fibre optics technology to the construction of rotor blades for an experimental wind turbine.
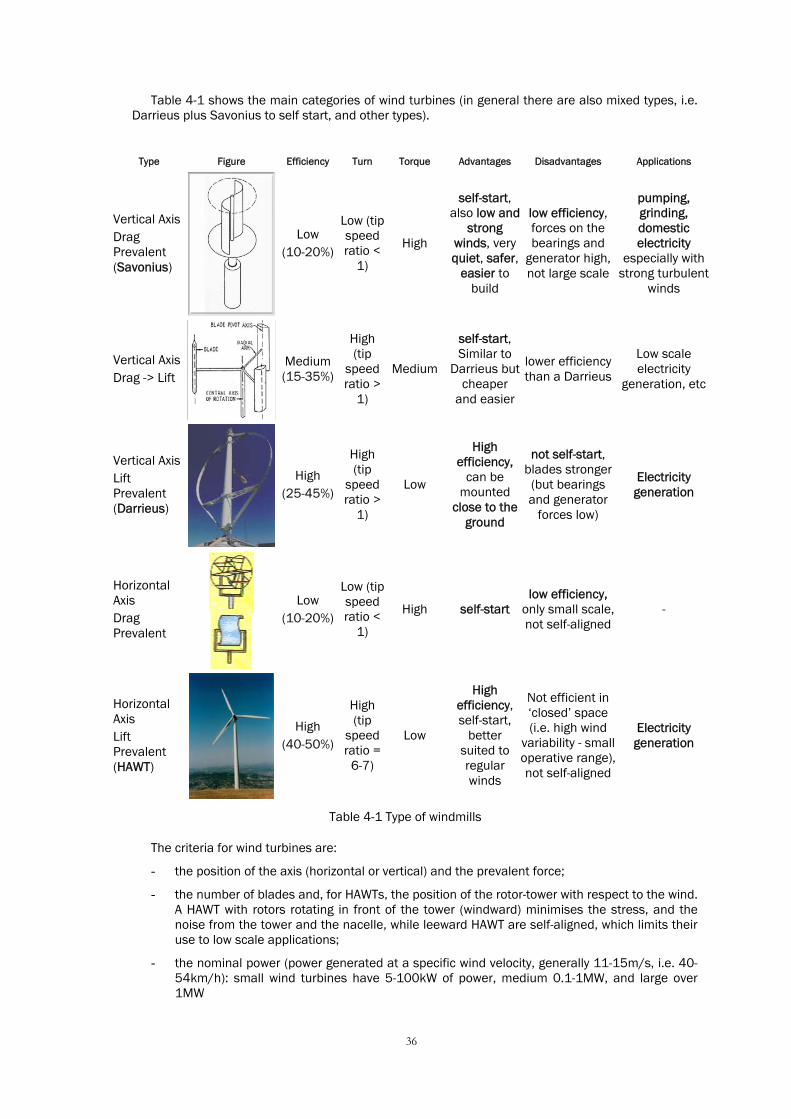
36
Table 4-1 shows the main categories of wind turbines (in general there are also mixed types, i.e. Darrieus plus Savonius to self start, and other types).
Type Figure Efficiency Turn Torque Advantages Disadvantages Applications
Vertical Axis Drag Prevalent (Savonius)
Low (10-20%)
Low (tip speed ratio <
1)
High
self-start, also low and
strong winds, very quiet, safer,
easier to build
low efficiency, forces on the bearings and
generator high, not large scale
pumping, grinding, domestic electricity
especially with strong turbulent
winds
Vertical Axis Drag -> Lift
Medium (15-35%)
High (tip
speed ratio >
1)
Medium
self-start, Similar to
Darrieus but cheaper
and easier
lower efficiency than a Darrieus
Low scale electricity
generation, etc
Vertical Axis Lift Prevalent (Darrieus)
High (25-45%)
High (tip
speed ratio >
1)
Low
High efficiency,
can be mounted
close to the ground
not self-start, blades stronger
(but bearings and generator
forces low)
Electricity generation
Horizontal Axis Drag Prevalent
Low (10-20%)
Low (tip speed ratio <
1)
High self-start low efficiency,
only small scale, not self-aligned
-
Horizontal Axis Lift Prevalent (HAWT)
High (40-50%)
High (tip
speed ratio =
6-7)
Low
High efficiency, self-start,
better suited to regular winds
Not efficient in ‘closed’ space (i.e. high wind
variability - small operative range), not self-aligned
Electricity generation
Table 4-1 Type of windmills
The criteria for wind turbines are:
- the position of the axis (horizontal or vertical) and the prevalent force;
- the number of blades and, for HAWTs, the position of the rotor-tower with respect to the wind. A HAWT with rotors rotating in front of the tower (windward) minimises the stress, and the noise from the tower and the nacelle, while leeward HAWT are self-aligned, which limits their use to low scale applications;
- the nominal power (power generated at a specific wind velocity, generally 11-15m/s, i.e. 40-54km/h): small wind turbines have 5-100kW of power, medium 0.1-1MW, and large over 1MW
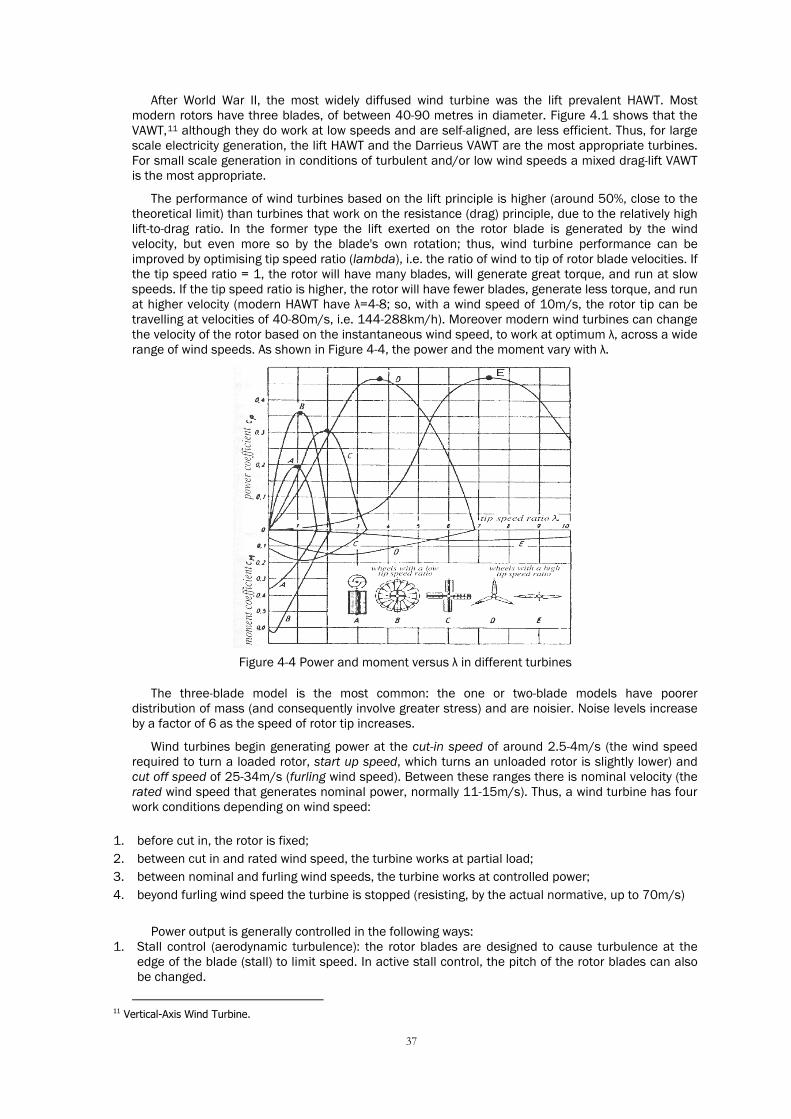
37
After World War II, the most widely diffused wind turbine was the lift prevalent HAWT. Most modern rotors have three blades, of between 40-90 metres in diameter. Figure 4.1 shows that the VAWT,11 although they do work at low speeds and are self-aligned, are less efficient. Thus, for large scale electricity generation, the lift HAWT and the Darrieus VAWT are the most appropriate turbines. For small scale generation in conditions of turbulent and/or low wind speeds a mixed drag-lift VAWT is the most appropriate.
The performance of wind turbines based on the lift principle is higher (around 50%, close to the theoretical limit) than turbines that work on the resistance (drag) principle, due to the relatively high lift-to-drag ratio. In the former type the lift exerted on the rotor blade is generated by the wind velocity, but even more so by the blade's own rotation; thus, wind turbine performance can be improved by optimising tip speed ratio (lambda), i.e. the ratio of wind to tip of rotor blade velocities. If the tip speed ratio = 1, the rotor will have many blades, will generate great torque, and run at slow speeds. If the tip speed ratio is higher, the rotor will have fewer blades, generate less torque, and run at higher velocity (modern HAWT have λ=4-8; so, with a wind speed of 10m/s, the rotor tip can be travelling at velocities of 40-80m/s, i.e. 144-288km/h). Moreover modern wind turbines can change the velocity of the rotor based on the instantaneous wind speed, to work at optimum λ, across a wide range of wind speeds. As shown in Figure 4-4, the power and the moment vary with λ.
Figure 4-4 Power and moment versus λ in different turbines
The three-blade model is the most common: the one or two-blade models have poorer distribution of mass (and consequently involve greater stress) and are noisier. Noise levels increase by a factor of 6 as the speed of rotor tip increases.
Wind turbines begin generating power at the cut-in speed of around 2.5-4m/s (the wind speed required to turn a loaded rotor, start up speed, which turns an unloaded rotor is slightly lower) and cut off speed of 25-34m/s (furling wind speed). Between these ranges there is nominal velocity (the rated wind speed that generates nominal power, normally 11-15m/s). Thus, a wind turbine has four work conditions depending on wind speed:
1. before cut in, the rotor is fixed; 2. between cut in and rated wind speed, the turbine works at partial load; 3. between nominal and furling wind speeds, the turbine works at controlled power; 4. beyond furling wind speed the turbine is stopped (resisting, by the actual normative, up to 70m/s)
Power output is generally controlled in the following ways: 1. Stall control (aerodynamic turbulence): the rotor blades are designed to cause turbulence at the
edge of the blade (stall) to limit speed. In active stall control, the pitch of the rotor blades can also be changed.
11 Vertical-Axis Wind Turbine.
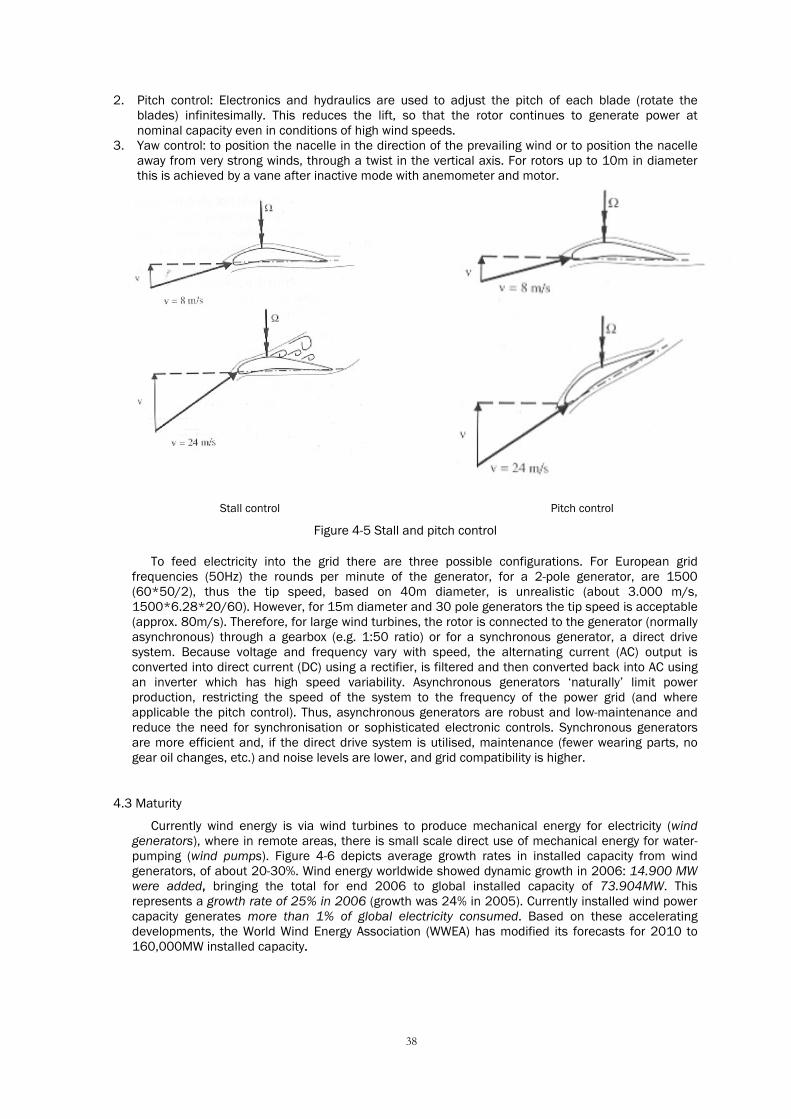
38
2. Pitch control: Electronics and hydraulics are used to adjust the pitch of each blade (rotate the blades) infinitesimally. This reduces the lift, so that the rotor continues to generate power at nominal capacity even in conditions of high wind speeds.
3. Yaw control: to position the nacelle in the direction of the prevailing wind or to position the nacelle away from very strong winds, through a twist in the vertical axis. For rotors up to 10m in diameter this is achieved by a vane after inactive mode with anemometer and motor.
Stall control Pitch control
Figure 4-5 Stall and pitch control
To feed electricity into the grid there are three possible configurations. For European grid frequencies (50Hz) the rounds per minute of the generator, for a 2-pole generator, are 1500 (60*50/2), thus the tip speed, based on 40m diameter, is unrealistic (about 3.000 m/s, 1500*6.28*20/60). However, for 15m diameter and 30 pole generators the tip speed is acceptable (approx. 80m/s). Therefore, for large wind turbines, the rotor is connected to the generator (normally asynchronous) through a gearbox (e.g. 1:50 ratio) or for a synchronous generator, a direct drive system. Because voltage and frequency vary with speed, the alternating current (AC) output is converted into direct current (DC) using a rectifier, is filtered and then converted back into AC using an inverter which has high speed variability. Asynchronous generators ‘naturally’ limit power production, restricting the speed of the system to the frequency of the power grid (and where applicable the pitch control). Thus, asynchronous generators are robust and low-maintenance and reduce the need for synchronisation or sophisticated electronic controls. Synchronous generators are more efficient and, if the direct drive system is utilised, maintenance (fewer wearing parts, no gear oil changes, etc.) and noise levels are lower, and grid compatibility is higher.
4.3 Maturity
Currently wind energy is via wind turbines to produce mechanical energy for electricity (wind generators), where in remote areas, there is small scale direct use of mechanical energy for water-pumping (wind pumps). Figure 4-6 depicts average growth rates in installed capacity from wind generators, of about 20-30%. Wind energy worldwide showed dynamic growth in 2006: 14.900 MW were added, bringing the total for end 2006 to global installed capacity of 73.904MW. This represents a growth rate of 25% in 2006 (growth was 24% in 2005). Currently installed wind power capacity generates more than 1% of global electricity consumed. Based on these accelerating developments, the World Wind Energy Association (WWEA) has modified its forecasts for 2010 to 160,000MW installed capacity.
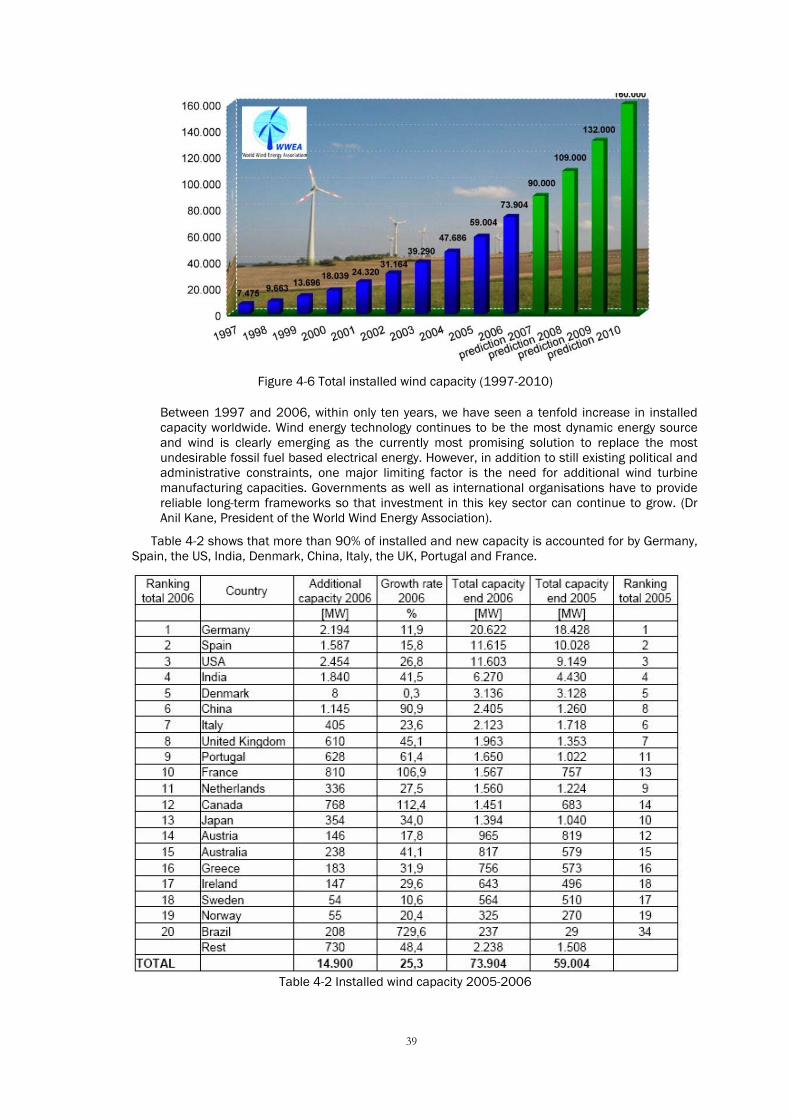
39
Figure 4-6 Total installed wind capacity (1997-2010)
Between 1997 and 2006, within only ten years, we have seen a tenfold increase in installed capacity worldwide. Wind energy technology continues to be the most dynamic energy source and wind is clearly emerging as the currently most promising solution to replace the most undesirable fossil fuel based electrical energy. However, in addition to still existing political and administrative constraints, one major limiting factor is the need for additional wind turbine manufacturing capacities. Governments as well as international organisations have to provide reliable long-term frameworks so that investment in this key sector can continue to grow. (Dr Anil Kane, President of the World Wind Energy Association).
Table 4-2 shows that more than 90% of installed and new capacity is accounted for by Germany, Spain, the US, India, Denmark, China, Italy, the UK, Portugal and France.
Table 4-2 Installed wind capacity 2005-2006
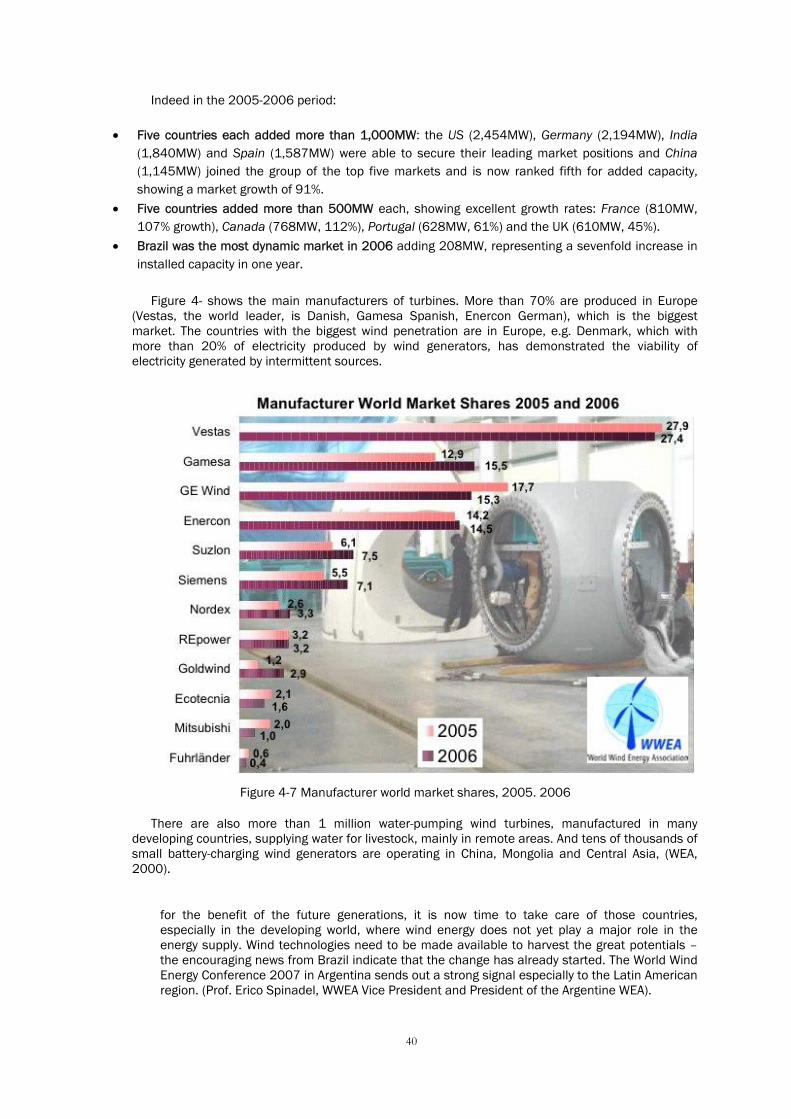
40
Indeed in the 2005-2006 period:
• Five countries each added more than 1,000MW: the US (2,454MW), Germany (2,194MW), India (1,840MW) and Spain (1,587MW) were able to secure their leading market positions and China (1,145MW) joined the group of the top five markets and is now ranked fifth for added capacity, showing a market growth of 91%.
• Five countries added more than 500MW each, showing excellent growth rates: France (810MW, 107% growth), Canada (768MW, 112%), Portugal (628MW, 61%) and the UK (610MW, 45%).
• Brazil was the most dynamic market in 2006 adding 208MW, representing a sevenfold increase in installed capacity in one year.
Figure 4- shows the main manufacturers of turbines. More than 70% are produced in Europe (Vestas, the world leader, is Danish, Gamesa Spanish, Enercon German), which is the biggest market. The countries with the biggest wind penetration are in Europe, e.g. Denmark, which with more than 20% of electricity produced by wind generators, has demonstrated the viability of electricity generated by intermittent sources.
Figure 4-7 Manufacturer world market shares, 2005. 2006
There are also more than 1 million water-pumping wind turbines, manufactured in many developing countries, supplying water for livestock, mainly in remote areas. And tens of thousands of small battery-charging wind generators are operating in China, Mongolia and Central Asia, (WEA, 2000).
for the benefit of the future generations, it is now time to take care of those countries, especially in the developing world, where wind energy does not yet play a major role in the energy supply. Wind technologies need to be made available to harvest the great potentials – the encouraging news from Brazil indicate that the change has already started. The World Wind Energy Conference 2007 in Argentina sends out a strong signal especially to the Latin American region. (Prof. Erico Spinadel, WWEA Vice President and President of the Argentine WEA).
41
Actual use of wind energy (2006 installed capacity of 74GW produced some 150TWh, i.e. 0.5EJ) is very far from technical potential, and the theoretical potential is many times higher than the technical potential.12 In addition, the investment and energy costs are competitive for many applications. In recent decades huge progress has been made in the development of wind turbines for electricity production.
Wind turbines became powerful. Based on economies of scale, average power size has increased by 60 times in the last 30 years (from 30kW, 10m diameter unit, to 2MW, 70m diameter units). In some cases 5MW turbines (116m diameter) are already being installed.
Wind turbines became light. The weight of aero generators halved in the space of five years as a result of new materials and the removal of some components. This has resulted in lower costs, increased reliability and easier maintenance. For example carbon fibre, directly driven, slow-running generators, with yaw and pitch control are being installed world wide.
Wind turbines became more controllable and grid-compatible. Blade pitch control systems combined with variable speed electricity conversion systems are replacing simple stall control combined with easy asynchronous generators, increasing efficiency and producing excellent power quality.
Wind turbines went offshore. The sea depths possible have doubled for offshore applications and specific offshore design features enable greater reliability, larger wind turbines, novel installation concepts, electricity conversion and transport systems, corrosion protection, and integration with external conditions (both wind and wave loading).
Wind power became more predictable. Meteorological research on predicting the output of wind farms has become more precise. Average wind speeds, statistical wind speed distribution, turbulence intensities, and roughness of the surrounding terrain can be more accurately calculated. Moreover, the ability to predict output a few hours in advance has resulted in computer programs that optimise the operational and fuel costs of regional electricity production parks (Denmark, Germany). This will increase the capacity value of wind power and the value of the electricity produced.
Further improvements expected: Improvements in low speed wind technologies are expected in a number of areas:
• Power: Increases in single unit power sizes and possibility to exploit class 2 and 3 areas (larger rotors to harvest the lower-energy winds without increasing cost, taller towers to take advantage of the higher wind speeds at higher altitudes, etc.);
• Rotors: Blade development (lighter and quieter rotors using new materials), aerodynamic code development and validation, aero-acoustics research and testing;
• Control: More efficient generating equipment and power electronics to accommodate sustained light wind operation at lower power levels without increasing electrical system costs; advanced drive trains with novel configurations; advanced power electronics to improve overall efficiency and provide higher-quality power; advanced controls to monitor overall system health and reduce maintenance costs;
• Offshore: Better foundation and control, addition of wave/tidal/stream technologies, increased depths, etc;
• Site specific design: Greater understanding of the nature of the atmospheric loading at increasing heights; integration into standard design practices of methods of estimating and designing for site-specific environments with uncertainty-based design margins, etc.
12 Studies on Europe indicate that the offshore wind resources available are bigger than total electricity demand in Europe;
in general, assuming that 25% of the earth’s land surface is exposed to an annual mean wind speed higher than 5m/s at 10m above ground (class 3 and above), and that 4% of this entire area could be used for wind farms, the potential is about 70EJ, more than total worldwide electricity production.
42
4.4 Reliability and Cost
Modern wind turbines are complex technical systems that combine the theory from several fields.
1. Aerodynamics, lightweight construction: rotor blades, dynamics, overall system. 2. Mechanical and plant engineering: shafts, gearboxes, bearings, brakes, and tower. 3. Electrical engineering: generator, converter, mains connection, electrical lines. 4. Electronics, instrumentation and controls: system controls, remote monitoring. 5. Construction engineering: foundations, access roads. 6. Meteorology: design, yield.
Wind and other RES are widely available, but fossil fuel sources are cheaper and currently more reliable. Because of their reliance on wind speed, determining the potential of wind energy at a specific site is not straightforward. More accurate meteorological measurements and wind energy maps and handbooks are being produced and published, which should enable wind project developers to better assess the long-term economic performance of their proposed projects. But there are serious barriers to efficient implementation of wind turbine projects. Complicated, time-consuming and expensive institutional procedures are necessary due to the lack of public acceptance, which varies considerably from country to country. Project preparation time is often longer than the ‘time to market’ of new wind turbine types and there are no internationally accepted certification procedures or standards.
Because wind energy is intermittent, wind turbines have a low capacity factor (annual yield divided by the product of the wind turbine's nominal output and the 8,760 hours in a year), often only 20%. (The capacity factor can range from 30% in coastal areas with strong winds, to around 18% in inland locations; the equivalent full power annual operative time is about 2,000h.) However, the wind energy fed to the power grid does constitute part of the baseload. In large land areas (e.g. Germany), some 10% of the nominal power of all wind turbines can be expected to be fed to the grid as constant output.
Investment costs are about €850 divided by 2,500/kW, depending on the site (accessibility, grid proximity) and the size (higher for smaller sizes). Project preparation and infrastructure costs depend heavily on local circumstances, such as availability of accurate wind speed data, soil conditions, road conditions and availability of electricity substations. Wind turbines larger than 2MW can incur installation costs of less than €1,000/kW, while domestic 1kW (2m diameter) Windsave 1,000 wind turbines cost around €2,200, including planning permission, home survey and installation.
Despite a small increase (contrasting with normal trends) in investment costs, the downward trend in wind electricity costs in 2006 is expected to continue. Design and prediction tools have improved such that designing on the basis of fatigue lifetime has become possible and energy output can be estimated near the theoretical maximum (E= 3.15 x v^3, where v is the average wind speed at hub height). In practice, for economic calculations for large turbines, turnkey costs are €500/m2 (swept rotor area), interest is at 5%, the economic lifetime is 15 years, technical availability is 95%, and operating and maintenance is €0.005/kWh. Thus, if average wind speeds at the hub height range from 5.6-7.5m/s, corresponding electricity production cost is €0.11-0.04/kWh. So cost per unit of energy produced is comparable to the cost of new generating capacity for fossil fuels and if local average wind speeds exceed 5m/s, economic exploitation of grid-connected wind turbines is possible.
Interest in small turbines for standalone and autonomous systems for rural areas, is being revived.
The negative environmental impacts of wind turbines are limited: acoustic noise emissions, visual impact on the landscape, impact on bird life, moving shadows caused by the rotor, and electromagnetic interference with radio, television and radar signals. In practice, the noise and visual impact cause the most problems, increasing public resistance against the installation of new turbines in densely populated countries. Aero-acoustic research has provided design tools and blade configurations to make blades considerably quieter, reducing the distance required between wind turbines and housing. The impact on bird life appears to be minor if turbines are properly located. A research project in the Netherlands showed that bird casualties from collisions with rotating rotor blades on a wind farm of 1,000MWs was a very small fraction of casualties from hunting, high voltage lines and road traffic (Winkelman, 1992).
The positive environmental impacts of wind turbines are large: no exotic materials or manufacturing processes are required to produce wind turbines or build the civil works. Because all

43
components are conventional, the recycling methods for decommissioning wind turbine are conventional. Blades are generally constructed of glass or carbon fibre reinforced plastics, and are processed by incineration. To replace glass and carbon and close the material use cycle, wood composites are being applied and biofibres developed. The energy payback time of a large wind turbine, under typical Danish conditions, is 3-4 months (Dannemand Andersen, 1998). A study by BTM Consult (1999) indicates that in 2025 wind energy could reduce CO2 emissions by 1.4-2.5gigatonnes per year.
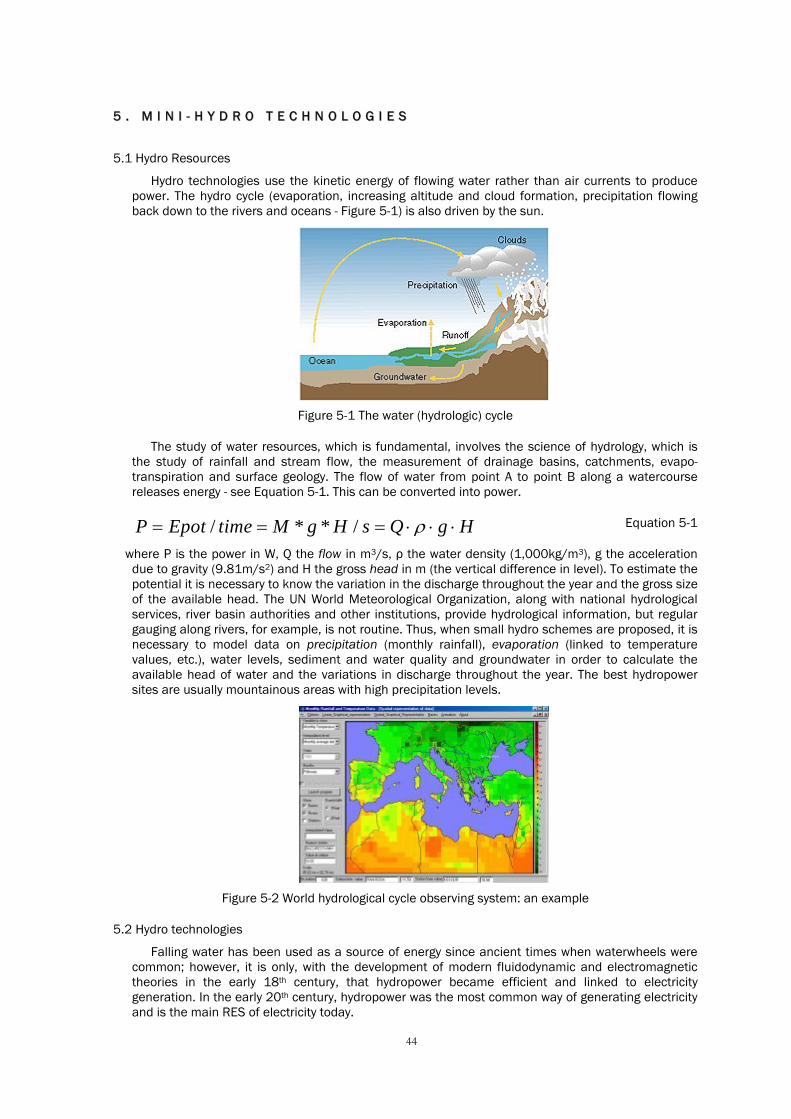
44
55 .. MM II NN II -- HH YY DD RR OO TT EE CC HH NN OO LL OO GG II EE SS
5.1 Hydro Resources
Hydro technologies use the kinetic energy of flowing water rather than air currents to produce power. The hydro cycle (evaporation, increasing altitude and cloud formation, precipitation flowing back down to the rivers and oceans - Figure 5-1) is also driven by the sun.
Figure 5-1 The water (hydrologic) cycle
The study of water resources, which is fundamental, involves the science of hydrology, which is the study of rainfall and stream flow, the measurement of drainage basins, catchments, evapo-transpiration and surface geology. The flow of water from point A to point B along a watercourse releases energy - see Equation 5-1. This can be converted into power.
/ * * /P Epot time M g H s Q g Hρ= = = ⋅ ⋅ ⋅ Equation 5-1
where P is the power in W, Q the flow in m3/s, ρ the water density (1,000kg/m3), g the acceleration due to gravity (9.81m/s2) and H the gross head in m (the vertical difference in level). To estimate the potential it is necessary to know the variation in the discharge throughout the year and the gross size of the available head. The UN World Meteorological Organization, along with national hydrological services, river basin authorities and other institutions, provide hydrological information, but regular gauging along rivers, for example, is not routine. Thus, when small hydro schemes are proposed, it is necessary to model data on precipitation (monthly rainfall), evaporation (linked to temperature values, etc.), water levels, sediment and water quality and groundwater in order to calculate the available head of water and the variations in discharge throughout the year. The best hydropower sites are usually mountainous areas with high precipitation levels.
Figure 5-2 World hydrological cycle observing system: an example
5.2 Hydro technologies
Falling water has been used as a source of energy since ancient times when waterwheels were common; however, it is only, with the development of modern fluidodynamic and electromagnetic theories in the early 18th century, that hydropower became efficient and linked to electricity generation. In the early 20th century, hydropower was the most common way of generating electricity and is the main RES of electricity today.
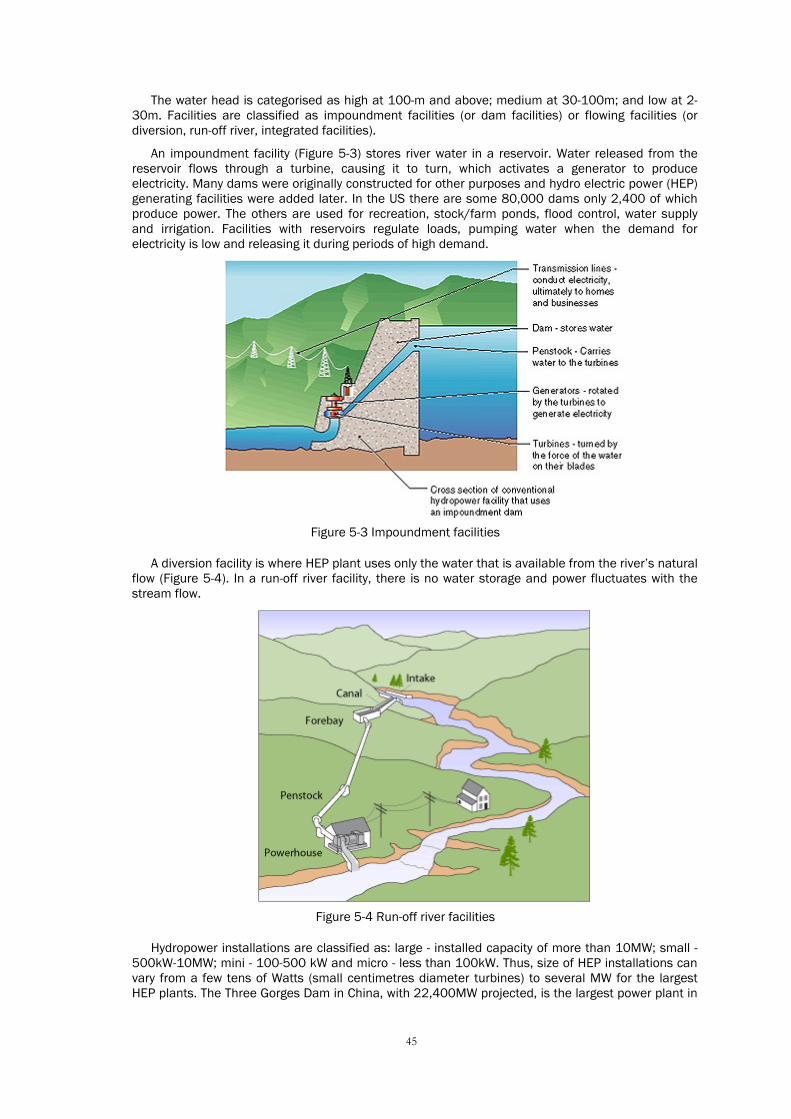
45
The water head is categorised as high at 100-m and above; medium at 30-100m; and low at 2-30m. Facilities are classified as impoundment facilities (or dam facilities) or flowing facilities (or diversion, run-off river, integrated facilities).
An impoundment facility (Figure 5-3) stores river water in a reservoir. Water released from the reservoir flows through a turbine, causing it to turn, which activates a generator to produce electricity. Many dams were originally constructed for other purposes and hydro electric power (HEP) generating facilities were added later. In the US there are some 80,000 dams only 2,400 of which produce power. The others are used for recreation, stock/farm ponds, flood control, water supply and irrigation. Facilities with reservoirs regulate loads, pumping water when the demand for electricity is low and releasing it during periods of high demand.
Figure 5-3 Impoundment facilities
A diversion facility is where HEP plant uses only the water that is available from the river’s natural flow (Figure 5-4). In a run-off river facility, there is no water storage and power fluctuates with the stream flow.
Figure 5-4 Run-off river facilities
Hydropower installations are classified as: large - installed capacity of more than 10MW; small - 500kW-10MW; mini - 100-500 kW and micro - less than 100kW. Thus, size of HEP installations can vary from a few tens of Watts (small centimetres diameter turbines) to several MW for the largest HEP plants. The Three Gorges Dam in China, with 22,400MW projected, is the largest power plant in
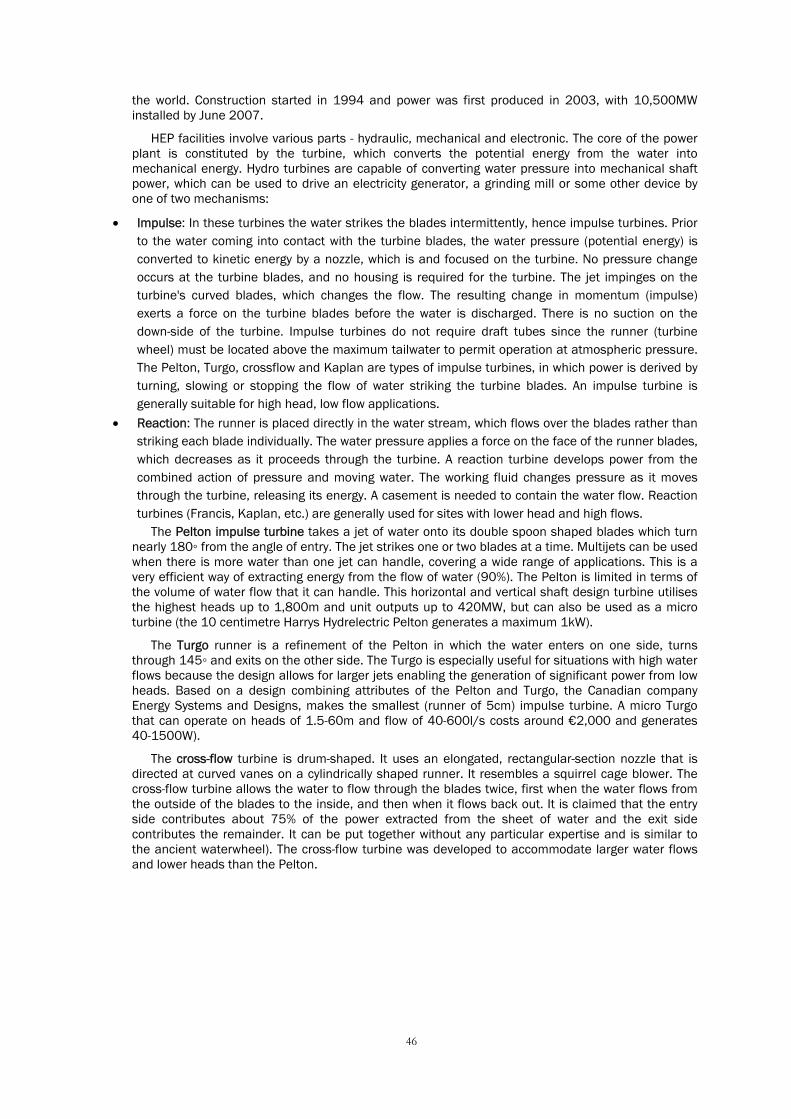
46
the world. Construction started in 1994 and power was first produced in 2003, with 10,500MW installed by June 2007.
HEP facilities involve various parts - hydraulic, mechanical and electronic. The core of the power plant is constituted by the turbine, which converts the potential energy from the water into mechanical energy. Hydro turbines are capable of converting water pressure into mechanical shaft power, which can be used to drive an electricity generator, a grinding mill or some other device by one of two mechanisms:
• Impulse: In these turbines the water strikes the blades intermittently, hence impulse turbines. Prior to the water coming into contact with the turbine blades, the water pressure (potential energy) is converted to kinetic energy by a nozzle, which is and focused on the turbine. No pressure change occurs at the turbine blades, and no housing is required for the turbine. The jet impinges on the turbine's curved blades, which changes the flow. The resulting change in momentum (impulse) exerts a force on the turbine blades before the water is discharged. There is no suction on the down-side of the turbine. Impulse turbines do not require draft tubes since the runner (turbine wheel) must be located above the maximum tailwater to permit operation at atmospheric pressure. The Pelton, Turgo, crossflow and Kaplan are types of impulse turbines, in which power is derived by turning, slowing or stopping the flow of water striking the turbine blades. An impulse turbine is generally suitable for high head, low flow applications.
• Reaction: The runner is placed directly in the water stream, which flows over the blades rather than striking each blade individually. The water pressure applies a force on the face of the runner blades, which decreases as it proceeds through the turbine. A reaction turbine develops power from the combined action of pressure and moving water. The working fluid changes pressure as it moves through the turbine, releasing its energy. A casement is needed to contain the water flow. Reaction turbines (Francis, Kaplan, etc.) are generally used for sites with lower head and high flows.
The Pelton impulse turbine takes a jet of water onto its double spoon shaped blades which turn nearly 180◦ from the angle of entry. The jet strikes one or two blades at a time. Multijets can be used when there is more water than one jet can handle, covering a wide range of applications. This is a very efficient way of extracting energy from the flow of water (90%). The Pelton is limited in terms of the volume of water flow that it can handle. This horizontal and vertical shaft design turbine utilises the highest heads up to 1,800m and unit outputs up to 420MW, but can also be used as a micro turbine (the 10 centimetre Harrys Hydrelectric Pelton generates a maximum 1kW).
The Turgo runner is a refinement of the Pelton in which the water enters on one side, turns through 145◦ and exits on the other side. The Turgo is especially useful for situations with high water flows because the design allows for larger jets enabling the generation of significant power from low heads. Based on a design combining attributes of the Pelton and Turgo, the Canadian company Energy Systems and Designs, makes the smallest (runner of 5cm) impulse turbine. A micro Turgo that can operate on heads of 1.5-60m and flow of 40-600l/s costs around €2,000 and generates 40-1500W).
The cross-flow turbine is drum-shaped. It uses an elongated, rectangular-section nozzle that is directed at curved vanes on a cylindrically shaped runner. It resembles a squirrel cage blower. The cross-flow turbine allows the water to flow through the blades twice, first when the water flows from the outside of the blades to the inside, and then when it flows back out. It is claimed that the entry side contributes about 75% of the power extracted from the sheet of water and the exit side contributes the remainder. It can be put together without any particular expertise and is similar to the ancient waterwheel). The cross-flow turbine was developed to accommodate larger water flows and lower heads than the Pelton.
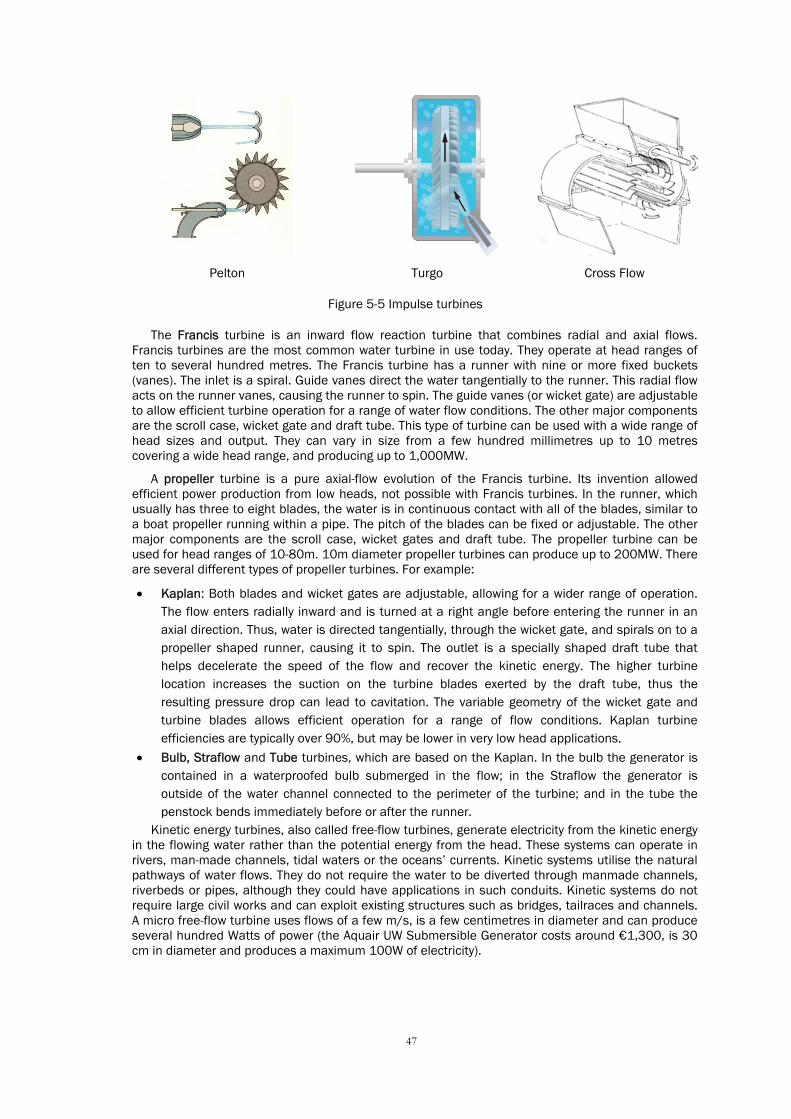
47
Pelton Turgo Cross Flow
Figure 5-5 Impulse turbines
The Francis turbine is an inward flow reaction turbine that combines radial and axial flows. Francis turbines are the most common water turbine in use today. They operate at head ranges of ten to several hundred metres. The Francis turbine has a runner with nine or more fixed buckets (vanes). The inlet is a spiral. Guide vanes direct the water tangentially to the runner. This radial flow acts on the runner vanes, causing the runner to spin. The guide vanes (or wicket gate) are adjustable to allow efficient turbine operation for a range of water flow conditions. The other major components are the scroll case, wicket gate and draft tube. This type of turbine can be used with a wide range of head sizes and output. They can vary in size from a few hundred millimetres up to 10 metres covering a wide head range, and producing up to 1,000MW.
A propeller turbine is a pure axial-flow evolution of the Francis turbine. Its invention allowed efficient power production from low heads, not possible with Francis turbines. In the runner, which usually has three to eight blades, the water is in continuous contact with all of the blades, similar to a boat propeller running within a pipe. The pitch of the blades can be fixed or adjustable. The other major components are the scroll case, wicket gates and draft tube. The propeller turbine can be used for head ranges of 10-80m. 10m diameter propeller turbines can produce up to 200MW. There are several different types of propeller turbines. For example:
• Kaplan: Both blades and wicket gates are adjustable, allowing for a wider range of operation. The flow enters radially inward and is turned at a right angle before entering the runner in an axial direction. Thus, water is directed tangentially, through the wicket gate, and spirals on to a propeller shaped runner, causing it to spin. The outlet is a specially shaped draft tube that helps decelerate the speed of the flow and recover the kinetic energy. The higher turbine location increases the suction on the turbine blades exerted by the draft tube, thus the resulting pressure drop can lead to cavitation. The variable geometry of the wicket gate and turbine blades allows efficient operation for a range of flow conditions. Kaplan turbine efficiencies are typically over 90%, but may be lower in very low head applications.
• Bulb, Straflow and Tube turbines, which are based on the Kaplan. In the bulb the generator is contained in a waterproofed bulb submerged in the flow; in the Straflow the generator is outside of the water channel connected to the perimeter of the turbine; and in the tube the penstock bends immediately before or after the runner.
Kinetic energy turbines, also called free-flow turbines, generate electricity from the kinetic energy in the flowing water rather than the potential energy from the head. These systems can operate in rivers, man-made channels, tidal waters or the oceans’ currents. Kinetic systems utilise the natural pathways of water flows. They do not require the water to be diverted through manmade channels, riverbeds or pipes, although they could have applications in such conduits. Kinetic systems do not require large civil works and can exploit existing structures such as bridges, tailraces and channels. A micro free-flow turbine uses flows of a few m/s, is a few centimetres in diameter and can produce several hundred Watts of power (the Aquair UW Submersible Generator costs around €1,300, is 30 cm in diameter and produces a maximum 100W of electricity).
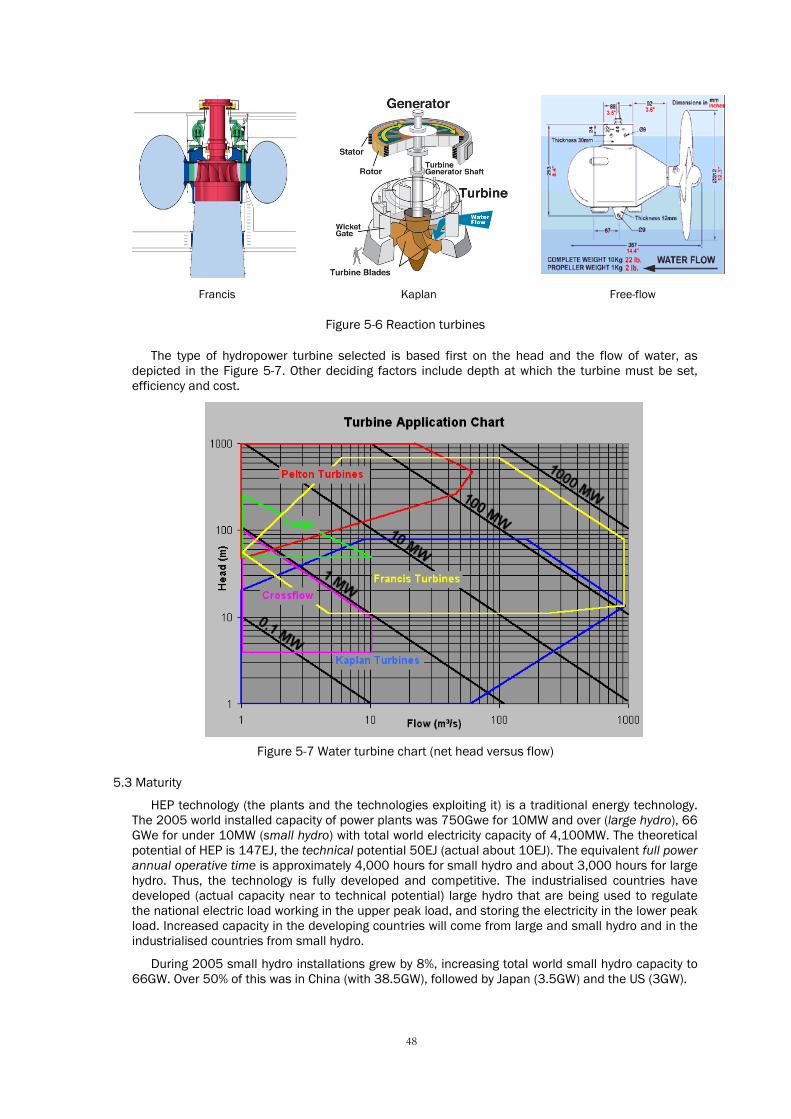
48
Francis Kaplan Free-flow
Figure 5-6 Reaction turbines
The type of hydropower turbine selected is based first on the head and the flow of water, as depicted in the Figure 5-7. Other deciding factors include depth at which the turbine must be set, efficiency and cost.
Figure 5-7 Water turbine chart (net head versus flow)
5.3 Maturity
HEP technology (the plants and the technologies exploiting it) is a traditional energy technology. The 2005 world installed capacity of power plants was 750Gwe for 10MW and over (large hydro), 66 GWe for under 10MW (small hydro) with total world electricity capacity of 4,100MW. The theoretical potential of HEP is 147EJ, the technical potential 50EJ (actual about 10EJ). The equivalent full power annual operative time is approximately 4,000 hours for small hydro and about 3,000 hours for large hydro. Thus, the technology is fully developed and competitive. The industrialised countries have developed (actual capacity near to technical potential) large hydro that are being used to regulate the national electric load working in the upper peak load, and storing the electricity in the lower peak load. Increased capacity in the developing countries will come from large and small hydro and in the industrialised countries from small hydro.
During 2005 small hydro installations grew by 8%, increasing total world small hydro capacity to 66GW. Over 50% of this was in China (with 38.5GW), followed by Japan (3.5GW) and the US (3GW).

49
Many companies offer standardised turbine generator packages in size ranges from of few hundred watts to 10MW. These ‘water to wire’ packages simplify the planning and development of sites since one vendor is responsible for most of the equipment supply. Non-recurring engineering costs are minimised and the development cost is spread over multiple units, making these systems very cost efficient. While synchronous generators capable of isolated plant operation are often used, small hydro plants connected to a distribution system can use economical induction generators, which further reduce installation costs and simplify control and operation. Micro-hydro plants can exploit industrial centrifuge pumps, connected in reverse to act as turbines. While these machines rarely have optimum hydraulic characteristics when operating as turbines, their low purchase cost makes them attractive for micro-hydro installations. Other small hydro schemes can use tidal energy or propeller-type turbines immersed in flowing water to extract energy.
5.4 Reliability and Cost
Small scale hydro or micro-hydro power is being used increasingly as an alternative energy source, especially in remote areas where other sources of power are not viable. Small scale hydropower systems can be installed in small rivers or streams (potable aqueducts, irrigation channels, etc.) with little or no discernible environmental effect. Most small scale hydropower systems do not require dams or major water diversion and thus are very simple facilities although they are dependent on the supply of water as they cannot store it. One of the advantages of hydropower over other renewable energy technologies is that energy pumping water can be stored and then released to generate the electricity when it is required. Therefore, for small scale systems it is important to understand the amount of water flow available. Water rights and easements can raise legal and regulatory issues.
Since small hydro projects usually involve minimal environmental and licensing procedures, and since the equipment is usually in serial production, is standardised and simple, and since the civil works involved is very small, they can be developed very rapidly. The physically small size of the equipment makes it easy to transport to remote areas that do not have good road and rail access. In remote communities, micro hydropower, with a capacity of 100kW or less, allows communities to generate their own electricity. This form of power is supported by various organizations such as the UK's Practical Action.
Allowable flows are dictated by multivariate optimisation based on:
• fish, wildlife, and other related environmental needs • irrigation • navigation • flood control • recreation • energy/power demands.
There are technical, institutional, economic and political factors that need to be considered. Engineering considerations include integrated controllability and generator response times, the transmission systems linking the physical locations of the hydropower and wind power facilities, and the characteristics of the utility electrical load. Capacity of reservoirs, seasonal and yearly inflow variability (for normal, wet and dry years) are also important.
Institutional factors are related to type of control and responsibility of the utility or operating agency. For example, a hydropower system can be integrated, such that a central utility has the responsibility for electric load demand growth. It could also be operated with little seasonal or annual storage capability, governed by capacity, rather than energy (more water available than generators to run it through). Another possibility is that the utility can purchase additional power for wholesale customers on request, passing all additional costs directly on to customers. Finally, where there is the capability for storing water for long periods, and output is energy rather than capacity limited (water supply limited, but no limit in terms of number/size of generators), then power can be allocated on a project-by-project rather than a system basis.
Individual institutional situations are important in assessing wind/hydropower integration opportunities. For example, in some cases an individual hydropower resource will be developed to benefit specific customers; in others, a complete drainage system may be operated in an integrated fashion.
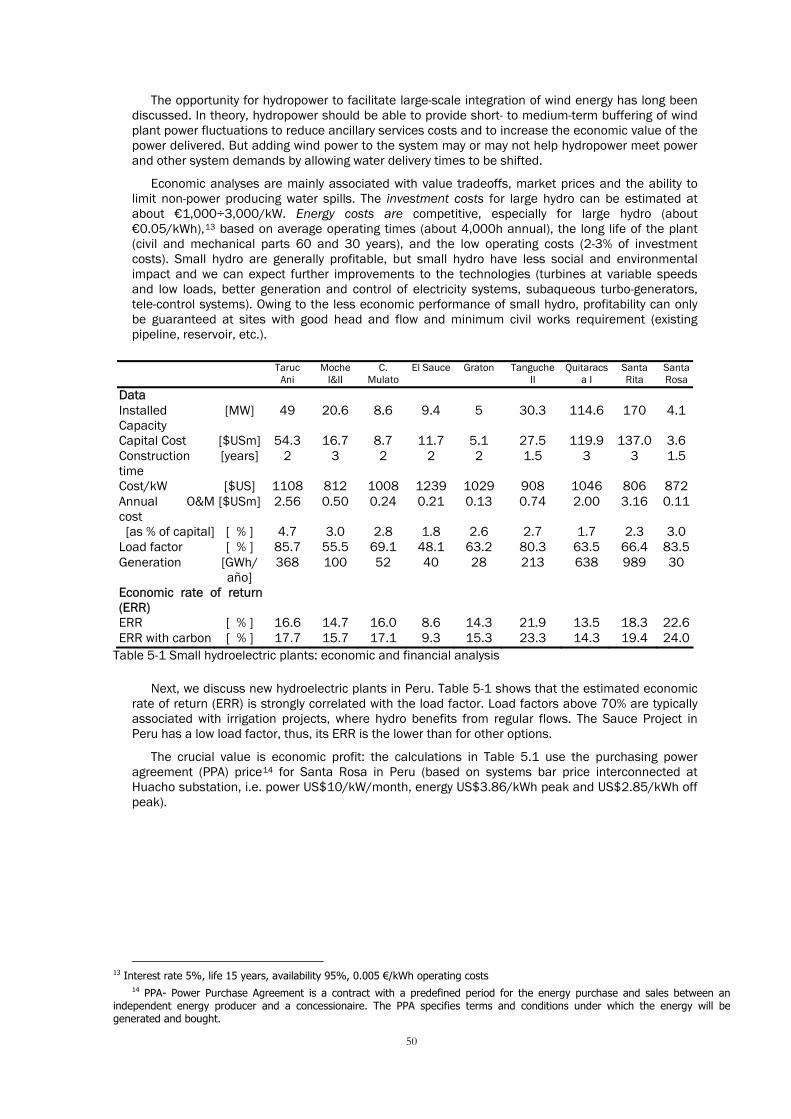
50
The opportunity for hydropower to facilitate large-scale integration of wind energy has long been discussed. In theory, hydropower should be able to provide short- to medium-term buffering of wind plant power fluctuations to reduce ancillary services costs and to increase the economic value of the power delivered. But adding wind power to the system may or may not help hydropower meet power and other system demands by allowing water delivery times to be shifted.
Economic analyses are mainly associated with value tradeoffs, market prices and the ability to limit non-power producing water spills. The investment costs for large hydro can be estimated at about €1,000÷3,000/kW. Energy costs are competitive, especially for large hydro (about €0.05/kWh),13 based on average operating times (about 4,000h annual), the long life of the plant (civil and mechanical parts 60 and 30 years), and the low operating costs (2-3% of investment costs). Small hydro are generally profitable, but small hydro have less social and environmental impact and we can expect further improvements to the technologies (turbines at variable speeds and low loads, better generation and control of electricity systems, subaqueous turbo-generators, tele-control systems). Owing to the less economic performance of small hydro, profitability can only be guaranteed at sites with good head and flow and minimum civil works requirement (existing pipeline, reservoir, etc.).
Taruc Ani
Moche I&II
C. Mulato
El Sauce Graton Tanguche II
Quitaracsa I
Santa Rita
Santa Rosa
Data Installed Capacity
[MW] 49 20.6 8.6 9.4 5 30.3 114.6 170 4.1
Capital Cost [$USm] 54.3 16.7 8.7 11.7 5.1 27.5 119.9 137.0 3.6 Construction time
[years] 2 3 2 2 2 1.5 3 3 1.5
Cost/kW [$US] 1108 812 1008 1239 1029 908 1046 806 872 Annual O&M cost
[$USm] 2.56 0.50 0.24 0.21 0.13 0.74 2.00 3.16 0.11
[as % of capital] [ % ] 4.7 3.0 2.8 1.8 2.6 2.7 1.7 2.3 3.0 Load factor [ % ] 85.7 55.5 69.1 48.1 63.2 80.3 63.5 66.4 83.5 Generation [GWh/
año] 368 100 52 40 28 213 638 989 30
Economic rate of return(ERR)
ERR [ % ] 16.6 14.7 16.0 8.6 14.3 21.9 13.5 18.3 22.6 ERR with carbon [ % ] 17.7 15.7 17.1 9.3 15.3 23.3 14.3 19.4 24.0
Table 5-1 Small hydroelectric plants: economic and financial analysis
Next, we discuss new hydroelectric plants in Peru. Table 5-1 shows that the estimated economic rate of return (ERR) is strongly correlated with the load factor. Load factors above 70% are typically associated with irrigation projects, where hydro benefits from regular flows. The Sauce Project in Peru has a low load factor, thus, its ERR is the lower than for other options.
The crucial value is economic profit: the calculations in Table 5.1 use the purchasing power agreement (PPA) price14 for Santa Rosa in Peru (based on systems bar price interconnected at Huacho substation, i.e. power US$10/kW/month, energy US$3.86/kWh peak and US$2.85/kWh off peak).
13 Interest rate 5%, life 15 years, availability 95%, 0.005 €/kWh operating costs
14 PPA- Power Purchase Agreement is a contract with a predefined period for the energy purchase and sales between an independent energy producer and a concessionaire. The PPA specifies terms and conditions under which the energy will be generated and bought.

51
66 .. SS OO LL AA RR EE NN EE RR GG YY
6.1 Solar Resource
Solar radiation is radiant energy emitted by the sun resulting from a nuclear fusion reaction that creates electromagnetic energy. The spectrum of solar radiation is close to that of a black body with a temperature of about 5,800K. About half of the radiation is in the visible short-wave part of the electromagnetic spectrum. The remainder is mostly in the near-infrared part, with some in the ultraviolet part of the spectrum. Sunlight and heat are transformed and absorbed by the environment in many different ways. Some of these transformations result in renewable energy flows, such as biomass, wind and waves. Effects such as the jet stream, the Gulf Stream and the water cycle are also the result of the absorption of solar energy in the environment.
Figure 6-1 Solar–earth balance
The earth receives 174PW (Peta Watts) of solar radiation in the upper atmosphere. On its journey through the atmosphere, 6% of the incoming solar radiation (insolation) is reflected and 16% is absorbed. Average atmospheric conditions (clouds, dust, pollutants) reduce insolation by a further 20% through reflection, and a further 3% through absorption. The absorption of solar energy by atmospheric convection (sensible heat transport) and by evaporation and condensation of water vapour (latent heat transport) drives the wind and water cycles. The total solar energy available to the earth is approximately 3,850ZJ (zettajoules) per year. Oceans absorb approximately 285ZJ of solar energy per year. Winds can theoretically supply 6ZJ of energy per year. Biomass captures approximately 1.8ZJ of solar energy per year. Worldwide energy consumption was 0.471ZJ in 2004.
Solar radiation varies with latitude. The map in Figure 6-3 shows annual average ground level insolation. In North America, for instance, average insolation at ground level over a year (including night time and cloudy periods) is 125-375W/m² (3-9kWh/m²/day).
The interaction of solar radiation with the earth’s atmosphere and surface is determined by three factors:
1. the earth’s geometry, revolution and rotation (declination, latitude, solar hour angle); 2. terrain (elevation, surface inclination and orientation, shadows);
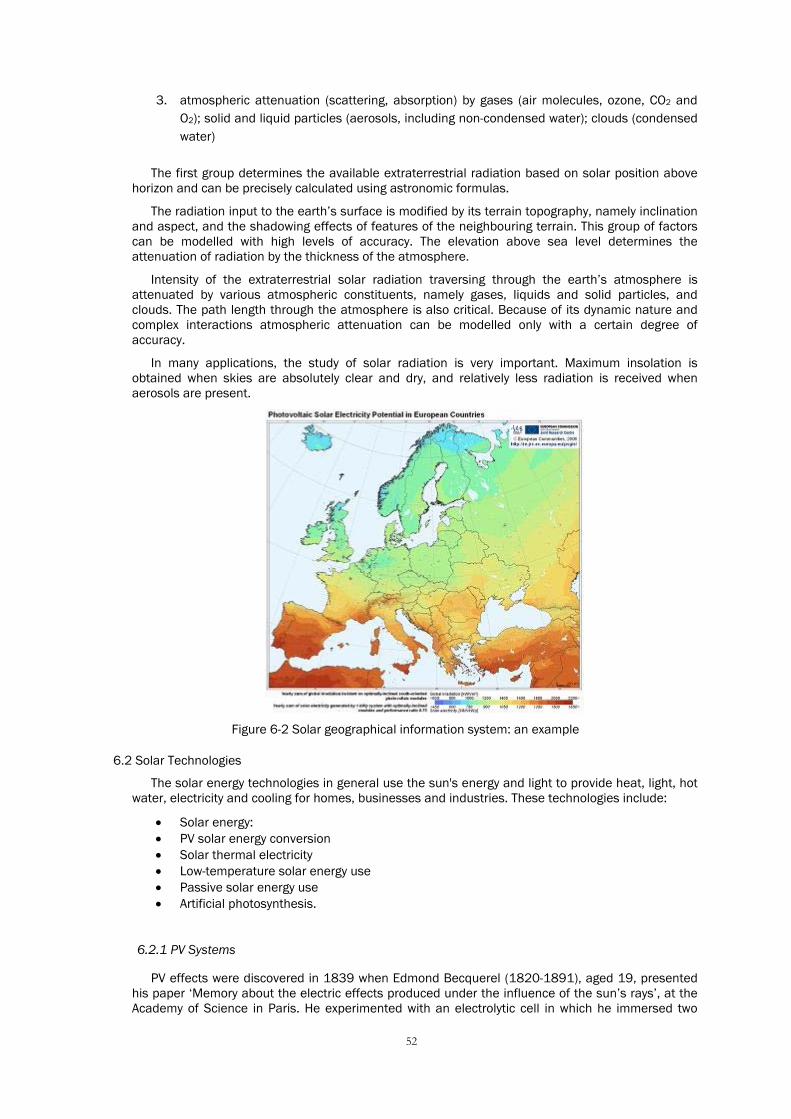
52
3. atmospheric attenuation (scattering, absorption) by gases (air molecules, ozone, CO2 and O2); solid and liquid particles (aerosols, including non-condensed water); clouds (condensed water)
The first group determines the available extraterrestrial radiation based on solar position above horizon and can be precisely calculated using astronomic formulas.
The radiation input to the earth’s surface is modified by its terrain topography, namely inclination and aspect, and the shadowing effects of features of the neighbouring terrain. This group of factors can be modelled with high levels of accuracy. The elevation above sea level determines the attenuation of radiation by the thickness of the atmosphere.
Intensity of the extraterrestrial solar radiation traversing through the earth’s atmosphere is attenuated by various atmospheric constituents, namely gases, liquids and solid particles, and clouds. The path length through the atmosphere is also critical. Because of its dynamic nature and complex interactions atmospheric attenuation can be modelled only with a certain degree of accuracy.
In many applications, the study of solar radiation is very important. Maximum insolation is obtained when skies are absolutely clear and dry, and relatively less radiation is received when aerosols are present.
Figure 6-2 Solar geographical information system: an example
6.2 Solar Technologies
The solar energy technologies in general use the sun's energy and light to provide heat, light, hot water, electricity and cooling for homes, businesses and industries. These technologies include:
• Solar energy: • PV solar energy conversion • Solar thermal electricity • Low-temperature solar energy use • Passive solar energy use • Artificial photosynthesis.
6.2.1 PV Systems
PV effects were discovered in 1839 when Edmond Becquerel (1820-1891), aged 19, presented his paper ‘Memory about the electric effects produced under the influence of the sun’s rays’, at the Academy of Science in Paris. He experimented with an electrolytic cell in which he immersed two
53
electrodes, and found that the intensity of the current increased when the cell was exposed to sunlight. He was realised that this effect was a function of the spectrum colour of the incident radiation.
In 1876, Smith, Adams and Day experimented with junctions of selenium with metal oxides. However, the idea of exploiting the PV effect did not take off until new, more efficient materials were developed. The first solar cell application was produced by the Bell Laboratory in 1954, by Person, Fuller and Chapin. They carried out a planar junction on a silicon monocrystal, manufacturing the parent of modern PV cells. These three scientists realised the energy potentials of the new device. Initially, the high cost limited its application to special cases, such as supplying electricity to satellites. This early period of development was devoted to increasing the cells’ resistance to small space environmental conditions. Since the mid 1970s, research has focused on terrestrial applications. The initial target of this work was cost reduction, particularly by reducing the amount of construction material, which led to the study of new materials. The most promising of these are gallium (GaAs), carbon sulphur (CdS) and amorphous silicon. If they prove to be durable to the sun’s radiation over time, then they could become a viable solution for large scale power generation.
A PV cell converts sunlight directly into electricity and its function is to trap as much of the sunlight falling on it as possible. It achieves this by provoking voltage at cell terminals whenever it is exposed to light of sufficient intensity.
The cells are made of semiconducting materials similar to those used in computer chips. When sunlight is absorbed by these materials, the solar energy knocks electrons lost from their atoms, allowing the electrons to flow through the material to produce electricity. This process of converting light (photons) into electricity (voltage) is known as the PV effect.
Various types of PV cell have been developed using various semi-conducting materials. Most commercial cells are made of silicon: either single crystal, polycrystalline or amorphous. Thin layers or slices of the material a few thousandths of a millimetre in thickness, are processed, placed behind glass, sealed with a flexible polymer material and assembled into frames to form solar panels.
Solar cells and their corresponding modules can be divided into two main categories: wafer-type and thin-film. Wafer-type cells are made from silicon wafers or silicon ribbons. Thin-film cells are deposited directly onto a substrate (glass, stainless steel, plastic). For flat-plate applications, the individual cells are connected in series to form a module; a number of these modules can be mounted in PV arrays that can measure up to several metres. Solar cells for concentrator systems are mounted in a one-dimensional or two-dimensional optical concentrator.
These flat-plate PV arrays can be mounted at a fixed angle facing south, or on a tracking device that follows the sun, allowing them to capture the maximum sunlight over the course of a day. Several connected PV arrays can provide enough power for a household; for large electric utility or industrial applications, hundreds of arrays can be interconnected to form a single large PV system.
Thin film solar cells use layers of semiconductor materials of a few micrometres in thickness. Thin film technology has enabled the application of solar cells as roof shingles, roof tiles, building facades or glazing for skylights or atria. The solar cell version of these items, e.g. shingles, offers the same protection and durability as ordinary asphalt shingles.
A PV cell consists of a very thin wafer of semi-conductor material, such as silicon, which has been ‘doped’ with other elements, such as phosphorus or boron, on either surface. These doping elements form impurities within the silicon chemical structure, in essence, providing two thin layers of dissimilar semi-conducting materials. These consist of:
• an n-type semi-conductor with a trace presence of phosphorus atoms to give an excess of free electrons with negative electrical charges;
• a p-type semi-conductor with a trace presence of boron atoms to give a deficit of electrons, i.e. ‘holes’ in the silicon structure where electrons are missing. This absence of negatively charged electrons is equivalent to having a positively charged layer. Because the carriers are created close to a p-n junction, they are separated and swept away to opposite ends of the wafer and appear on its surface.
There they can be collected at the external terminals of the cell. This produces an electrical voltage and a direct electric current (DC) which can be carried outside the cell into the external circuitry. The DC produced can be stored in batteries and used to run DC appliances, or can be converted into alternating current (AC) by an inverter to run standard AC appliances.
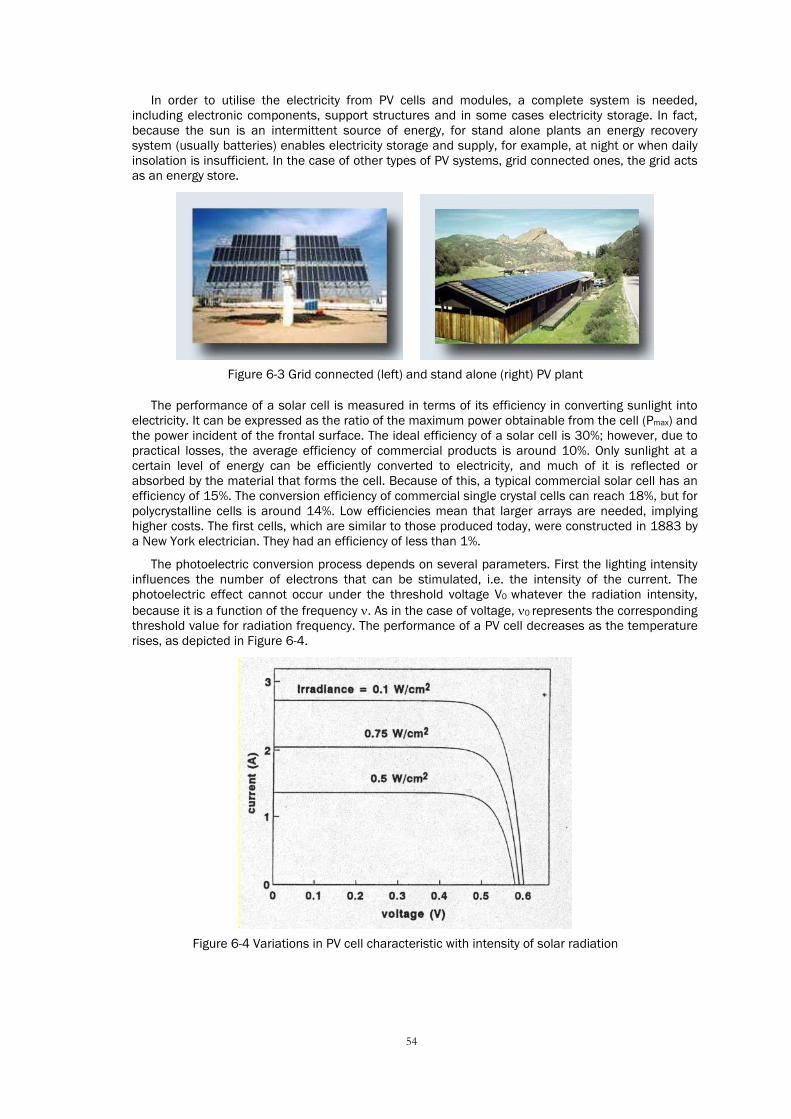
54
In order to utilise the electricity from PV cells and modules, a complete system is needed, including electronic components, support structures and in some cases electricity storage. In fact, because the sun is an intermittent source of energy, for stand alone plants an energy recovery system (usually batteries) enables electricity storage and supply, for example, at night or when daily insolation is insufficient. In the case of other types of PV systems, grid connected ones, the grid acts as an energy store.
Figure 6-3 Grid connected (left) and stand alone (right) PV plant
The performance of a solar cell is measured in terms of its efficiency in converting sunlight into electricity. It can be expressed as the ratio of the maximum power obtainable from the cell (Pmax) and the power incident of the frontal surface. The ideal efficiency of a solar cell is 30%; however, due to practical losses, the average efficiency of commercial products is around 10%. Only sunlight at a certain level of energy can be efficiently converted to electricity, and much of it is reflected or absorbed by the material that forms the cell. Because of this, a typical commercial solar cell has an efficiency of 15%. The conversion efficiency of commercial single crystal cells can reach 18%, but for polycrystalline cells is around 14%. Low efficiencies mean that larger arrays are needed, implying higher costs. The first cells, which are similar to those produced today, were constructed in 1883 by a New York electrician. They had an efficiency of less than 1%.
The photoelectric conversion process depends on several parameters. First the lighting intensity influences the number of electrons that can be stimulated, i.e. the intensity of the current. The photoelectric effect cannot occur under the threshold voltage V0 whatever the radiation intensity, because it is a function of the frequency ν. As in the case of voltage, ν0 represents the corresponding threshold value for radiation frequency. The performance of a PV cell decreases as the temperature rises, as depicted in Figure 6-4.
Figure 6-4 Variations in PV cell characteristic with intensity of solar radiation

55
Figure 6-5 Variations in PV cell characteristics with temperature
Being linked to the variable sun radiation, In order to quantify the performance of a PV cell, which is linked to the sun’s radiation we need to take account of the following standards:
• intensity of the radiation: 1,000W/m2;
• temperature of the cell: 25°C;
• solar spectrum: AM1,5
The nominal power produced by a cell is expressed in peak Watts (Wp). Peak power is generated by the abovementioned standard conditions.
A special application of PV solar cells is designed to operate with concentrated sunlight. These cells are built into concentrating collectors that utilise a lens that focuses the sunlight onto the surface. This approach has disadvantages and advantages compared to flat-plate PV arrays. The aim is to reduce the use of expensive semiconductor PV material while collecting as much sunlight as possible. But as the lenses must be oriented to the sun, the use of concentrating collectors is limited to the sunniest parts of countries. Some concentrating collectors are designed to be mounted on simple tracking devices, but most require sophisticated systems, which further limits their adoption by electric utilities, industry and large buildings. Table 6-1 presents a comparison among efficiencies of the main PV technologies.
Technology Symbol Characteristics
Record efficiency laboratory cells
Typical efficiency commercial flat-plate
(percentage) modules (percentage)
Single crystal silicon sc-Si Wafer-type 24 13–15 Multi-crystalline silicon mc-Si Wafer-type 19 12–14 Crystalline silicon films on ceramics f-Si Wafer type 17 (8–11)
Crystalline silicon films on glass Thin film 9
Amorphous silicon (including silicon-germanium tandems) a-Si Thin film 13 6– 9
Copper-indium/gallium-diselenide CIGS Thin film 18 (8–11)
Cadmium telluride CdTe Thin film 16 (7–10)
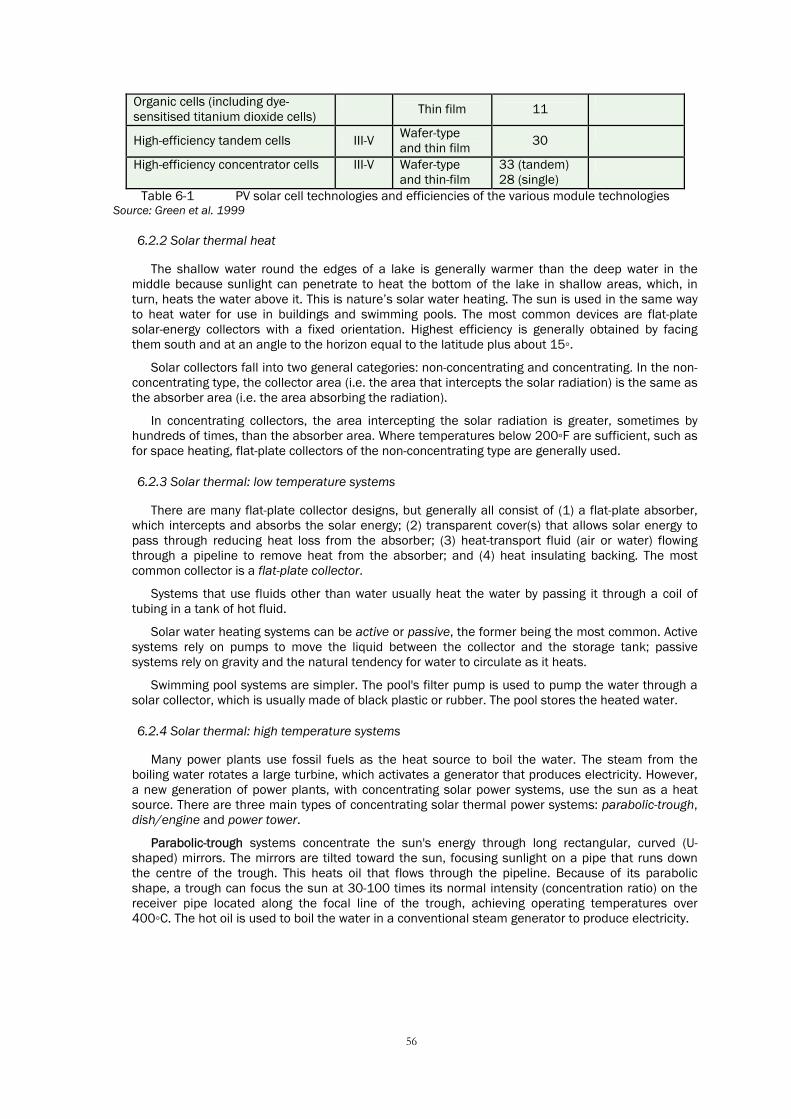
56
Organic cells (including dye-sensitised titanium dioxide cells)
Thin film 11
High-efficiency tandem cells III-V Wafer-type and thin film 30
High-efficiency concentrator cells III-V Wafer-type and thin-film
33 (tandem) 28 (single)
Table 6-1 PV solar cell technologies and efficiencies of the various module technologies Source: Green et al. 1999
6.2.2 Solar thermal heat
The shallow water round the edges of a lake is generally warmer than the deep water in the middle because sunlight can penetrate to heat the bottom of the lake in shallow areas, which, in turn, heats the water above it. This is nature’s solar water heating. The sun is used in the same way to heat water for use in buildings and swimming pools. The most common devices are flat-plate solar-energy collectors with a fixed orientation. Highest efficiency is generally obtained by facing them south and at an angle to the horizon equal to the latitude plus about 15◦.
Solar collectors fall into two general categories: non-concentrating and concentrating. In the non-concentrating type, the collector area (i.e. the area that intercepts the solar radiation) is the same as the absorber area (i.e. the area absorbing the radiation).
In concentrating collectors, the area intercepting the solar radiation is greater, sometimes by hundreds of times, than the absorber area. Where temperatures below 200◦F are sufficient, such as for space heating, flat-plate collectors of the non-concentrating type are generally used.
6.2.3 Solar thermal: low temperature systems
There are many flat-plate collector designs, but generally all consist of (1) a flat-plate absorber, which intercepts and absorbs the solar energy; (2) transparent cover(s) that allows solar energy to pass through reducing heat loss from the absorber; (3) heat-transport fluid (air or water) flowing through a pipeline to remove heat from the absorber; and (4) heat insulating backing. The most common collector is a flat-plate collector.
Systems that use fluids other than water usually heat the water by passing it through a coil of tubing in a tank of hot fluid.
Solar water heating systems can be active or passive, the former being the most common. Active systems rely on pumps to move the liquid between the collector and the storage tank; passive systems rely on gravity and the natural tendency for water to circulate as it heats.
Swimming pool systems are simpler. The pool's filter pump is used to pump the water through a solar collector, which is usually made of black plastic or rubber. The pool stores the heated water.
6.2.4 Solar thermal: high temperature systems
Many power plants use fossil fuels as the heat source to boil the water. The steam from the boiling water rotates a large turbine, which activates a generator that produces electricity. However, a new generation of power plants, with concentrating solar power systems, use the sun as a heat source. There are three main types of concentrating solar thermal power systems: parabolic-trough, dish/engine and power tower.
Parabolic-trough systems concentrate the sun's energy through long rectangular, curved (U-shaped) mirrors. The mirrors are tilted toward the sun, focusing sunlight on a pipe that runs down the centre of the trough. This heats oil that flows through the pipeline. Because of its parabolic shape, a trough can focus the sun at 30-100 times its normal intensity (concentration ratio) on the receiver pipe located along the focal line of the trough, achieving operating temperatures over 400◦C. The hot oil is used to boil the water in a conventional steam generator to produce electricity.
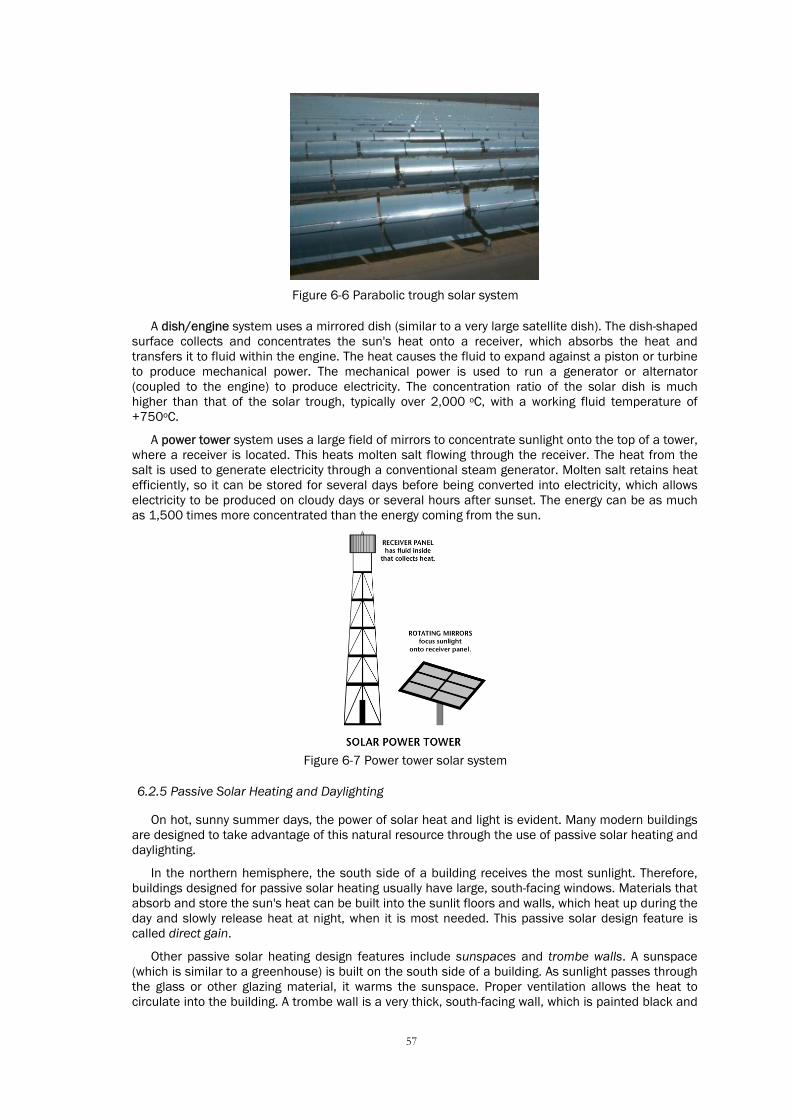
57
Figure 6-6 Parabolic trough solar system
A dish/engine system uses a mirrored dish (similar to a very large satellite dish). The dish-shaped surface collects and concentrates the sun's heat onto a receiver, which absorbs the heat and transfers it to fluid within the engine. The heat causes the fluid to expand against a piston or turbine to produce mechanical power. The mechanical power is used to run a generator or alternator (coupled to the engine) to produce electricity. The concentration ratio of the solar dish is much higher than that of the solar trough, typically over 2,000 oC, with a working fluid temperature of +750oC.
A power tower system uses a large field of mirrors to concentrate sunlight onto the top of a tower, where a receiver is located. This heats molten salt flowing through the receiver. The heat from the salt is used to generate electricity through a conventional steam generator. Molten salt retains heat efficiently, so it can be stored for several days before being converted into electricity, which allows electricity to be produced on cloudy days or several hours after sunset. The energy can be as much as 1,500 times more concentrated than the energy coming from the sun.
Figure 6-7 Power tower solar system
6.2.5 Passive Solar Heating and Daylighting
On hot, sunny summer days, the power of solar heat and light is evident. Many modern buildings are designed to take advantage of this natural resource through the use of passive solar heating and daylighting.
In the northern hemisphere, the south side of a building receives the most sunlight. Therefore, buildings designed for passive solar heating usually have large, south-facing windows. Materials that absorb and store the sun's heat can be built into the sunlit floors and walls, which heat up during the day and slowly release heat at night, when it is most needed. This passive solar design feature is called direct gain.
Other passive solar heating design features include sunspaces and trombe walls. A sunspace (which is similar to a greenhouse) is built on the south side of a building. As sunlight passes through the glass or other glazing material, it warms the sunspace. Proper ventilation allows the heat to circulate into the building. A trombe wall is a very thick, south-facing wall, which is painted black and

58
made of material that absorbs heat. A pane of glass or plastic glazing, installed a few inches in front of the wall, helps with heat retention. The wall heats up slowly during the day. Then as it cools during the night, it releases heat into the building.
Many passive solar heating design features also provide daylighting. Daylighting is simply the use of natural sunlight to brighten the interior of a building. To lighten north-facing rooms and upper levels, a clerestory - a row of windows near the peak of the roof - is often used in combination with open plan interior that allows the light to bounce throughout the building.
Of course, too much solar heating and daylighting can be a problem during the hot months of the year and many design features have been developed to keep passive solar buildings cool in the summer, e.g. overhangs that shade windows in the summer, sunspaces that can be closed off from the rest of the building, and fresh-air ventilation.
6.2.6 Solar Energy Space Heating and Cooling
Commercial, industrial and residential buildings can use the same solar technologies - PV, passive heating, daylighting, water heating. Non-residential buildings can also exploit other solar energy technologies that would be impractical for domestic buildings. These include ventilation air preheating, solar process heating and solar cooling.
Many large buildings need air from ventilation to maintain inside air quality. In cold climates the air needs to be heated prior to circulation around the building, which consumes large amounts of energy. Solar ventilation systems preheat the air, saving both energy and money. Such systems typically use transpired collectors, which consist of thin, black, perforated metal panels mounted on south-facing walls, which absorb the sun's heat. Air passes through the small perforations in the panels, and the space behind the panel allows the streams of air from these holes to mix. The heated air is sucked out from the top of the space into the ventilation system.
Solar process heating systems are designed to provide large quantities of hot water or space heating for non-residential buildings. A typical system includes solar collectors that work in combination with a pump, a heat exchanger, and/or one or more large storage tanks. The two main types of solar collectors - evacuated-tube collectors and parabolic-trough collectors - can operate at high temperatures with high efficiency. The former type consists of a shallow box containing double-walled glass tubes and reflectors that heat the fluid in the tubes. The vacuum between the two walls of the tubes acts as insulation, holding in the heat. In parabolic troughs, which are rectangular, there are curved (U-shaped) mirrors tilted to focus the sunlight on a tube running down the centre of the trough to heat the fluid within the tube.
The heat from solar collectors can also be used to cool buildings, based on solar heat being the energy source. Domestic air conditioners use electricity as the energy source. Solar absorption coolers work on a similar principle. Solar energy can also be used with evaporative or ‘swamp’ coolers in humid climates, exploiting a process called desiccant cooling.
6.2.7 Artificial photosynthesis
Artificial photosynthesis replicates the natural process of photosynthesis, converting sunlight, water and carbon dioxide into carbohydrates and oxygen. Artificial photosynthesis also describes the splitting of water into hydrogen and oxygen using sunlight.
6.3 Maturity
As above described, solar technologies using direct solar radiation are low and high temperature thermal and PV technologies. Low temperature thermal utilisation of solar energy is a traditional technology involving very large equipment. In 2005, total installed capacity of solar hot water systems was 88GWth; growth is forecast at 14% per year. PV technology is a relatively recent technology (5.4GWe installed worldwide), and high temperature thermal technology (0.4GWe installed) is currently in the demonstration phase.
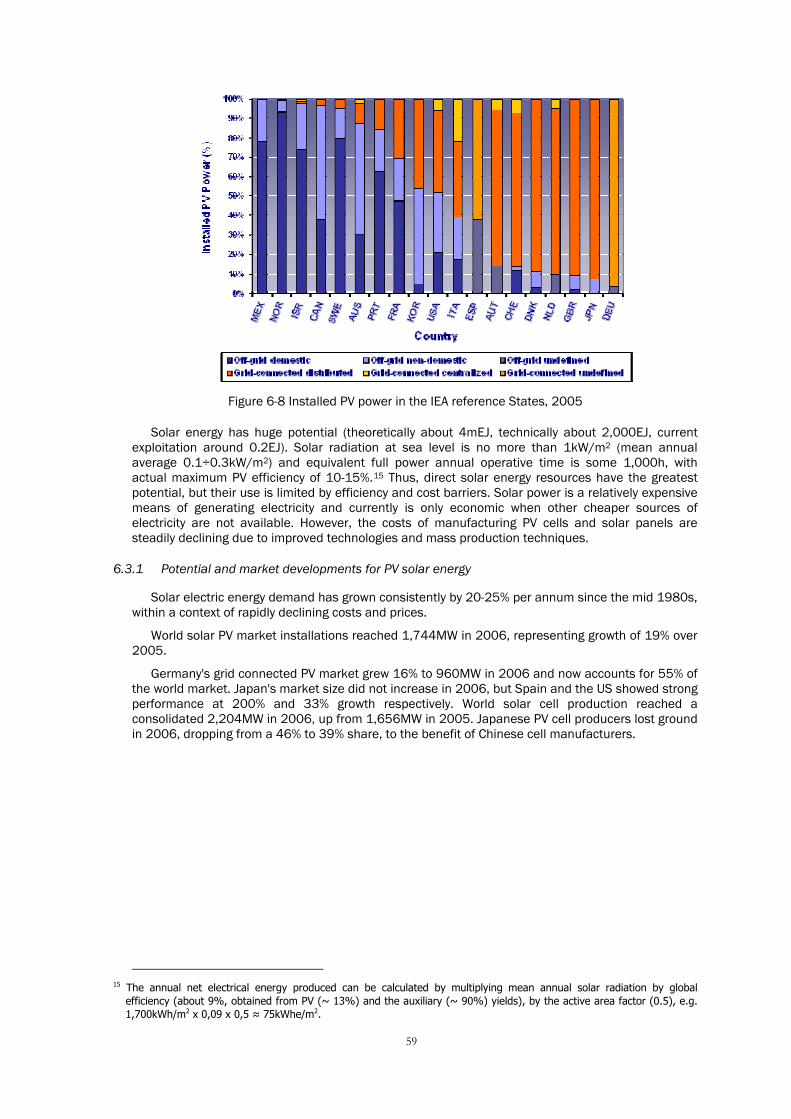
59
Figure 6-8 Installed PV power in the IEA reference States, 2005
Solar energy has huge potential (theoretically about 4mEJ, technically about 2,000EJ, current exploitation around 0.2EJ). Solar radiation at sea level is no more than 1kW/m2 (mean annual average 0.1÷0.3kW/m2) and equivalent full power annual operative time is some 1,000h, with actual maximum PV efficiency of 10-15%.15 Thus, direct solar energy resources have the greatest potential, but their use is limited by efficiency and cost barriers. Solar power is a relatively expensive means of generating electricity and currently is only economic when other cheaper sources of electricity are not available. However, the costs of manufacturing PV cells and solar panels are steadily declining due to improved technologies and mass production techniques.
6.3.1 Potential and market developments for PV solar energy
Solar electric energy demand has grown consistently by 20-25% per annum since the mid 1980s, within a context of rapidly declining costs and prices.
World solar PV market installations reached 1,744MW in 2006, representing growth of 19% over 2005.
Germany's grid connected PV market grew 16% to 960MW in 2006 and now accounts for 55% of the world market. Japan's market size did not increase in 2006, but Spain and the US showed strong performance at 200% and 33% growth respectively. World solar cell production reached a consolidated 2,204MW in 2006, up from 1,656MW in 2005. Japanese PV cell producers lost ground in 2006, dropping from a 46% to 39% share, to the benefit of Chinese cell manufacturers.
15 The annual net electrical energy produced can be calculated by multiplying mean annual solar radiation by global
efficiency (about 9%, obtained from PV (~ 13%) and the auxiliary (~ 90%) yields), by the active area factor (0.5), e.g. 1,700kWh/m2 x 0,09 x 0,5 ≈ 75kWhe/m2.
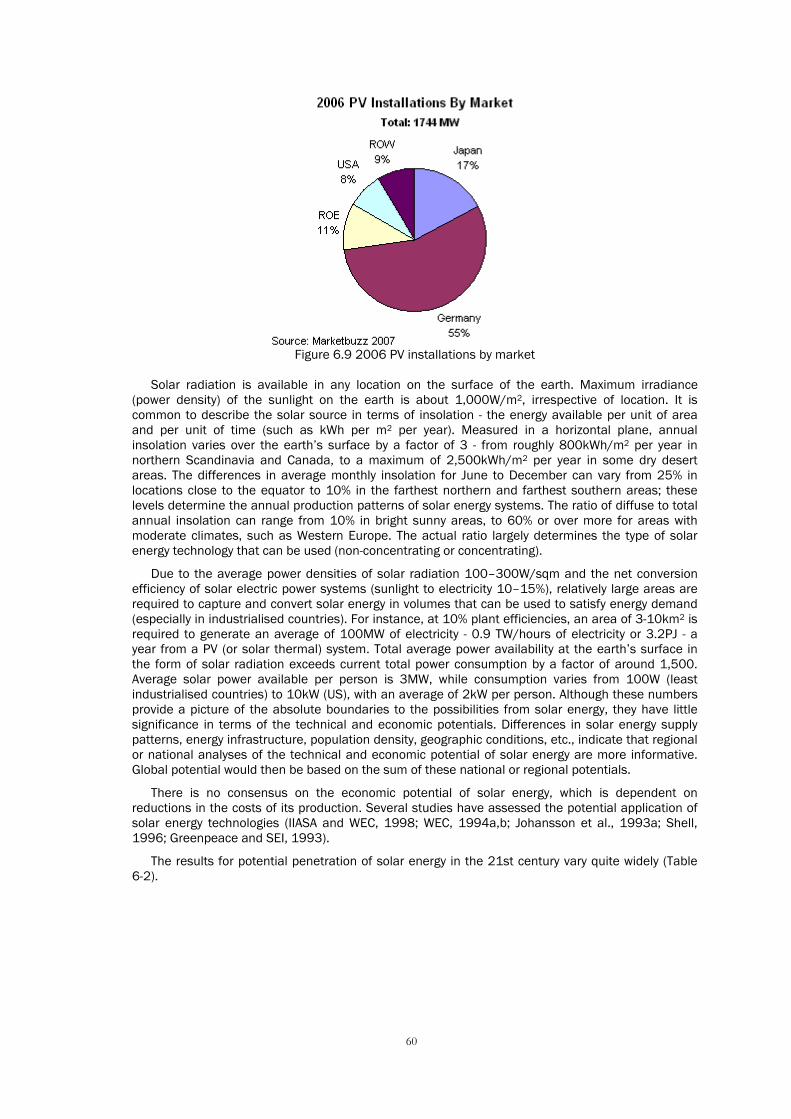
60
Figure 6.9 2006 PV installations by market
Solar radiation is available in any location on the surface of the earth. Maximum irradiance
(power density) of the sunlight on the earth is about 1,000W/m2, irrespective of location. It is common to describe the solar source in terms of insolation - the energy available per unit of area and per unit of time (such as kWh per m2 per year). Measured in a horizontal plane, annual insolation varies over the earth’s surface by a factor of 3 - from roughly 800kWh/m2 per year in northern Scandinavia and Canada, to a maximum of 2,500kWh/m2 per year in some dry desert areas. The differences in average monthly insolation for June to December can vary from 25% in locations close to the equator to 10% in the farthest northern and farthest southern areas; these levels determine the annual production patterns of solar energy systems. The ratio of diffuse to total annual insolation can range from 10% in bright sunny areas, to 60% or over more for areas with moderate climates, such as Western Europe. The actual ratio largely determines the type of solar energy technology that can be used (non-concentrating or concentrating).
Due to the average power densities of solar radiation 100–300W/sqm and the net conversion efficiency of solar electric power systems (sunlight to electricity 10–15%), relatively large areas are required to capture and convert solar energy in volumes that can be used to satisfy energy demand (especially in industrialised countries). For instance, at 10% plant efficiencies, an area of 3-10km2 is required to generate an average of 100MW of electricity - 0.9 TW/hours of electricity or 3.2PJ - a year from a PV (or solar thermal) system. Total average power availability at the earth’s surface in the form of solar radiation exceeds current total power consumption by a factor of around 1,500. Average solar power available per person is 3MW, while consumption varies from 100W (least industrialised countries) to 10kW (US), with an average of 2kW per person. Although these numbers provide a picture of the absolute boundaries to the possibilities from solar energy, they have little significance in terms of the technical and economic potentials. Differences in solar energy supply patterns, energy infrastructure, population density, geographic conditions, etc., indicate that regional or national analyses of the technical and economic potential of solar energy are more informative. Global potential would then be based on the sum of these national or regional potentials.
There is no consensus on the economic potential of solar energy, which is dependent on reductions in the costs of its production. Several studies have assessed the potential application of solar energy technologies (IIASA and WEC, 1998; WEC, 1994a,b; Johansson et al., 1993a; Shell, 1996; Greenpeace and SEI, 1993).
The results for potential penetration of solar energy in the 21st century vary quite widely (Table 6-2).
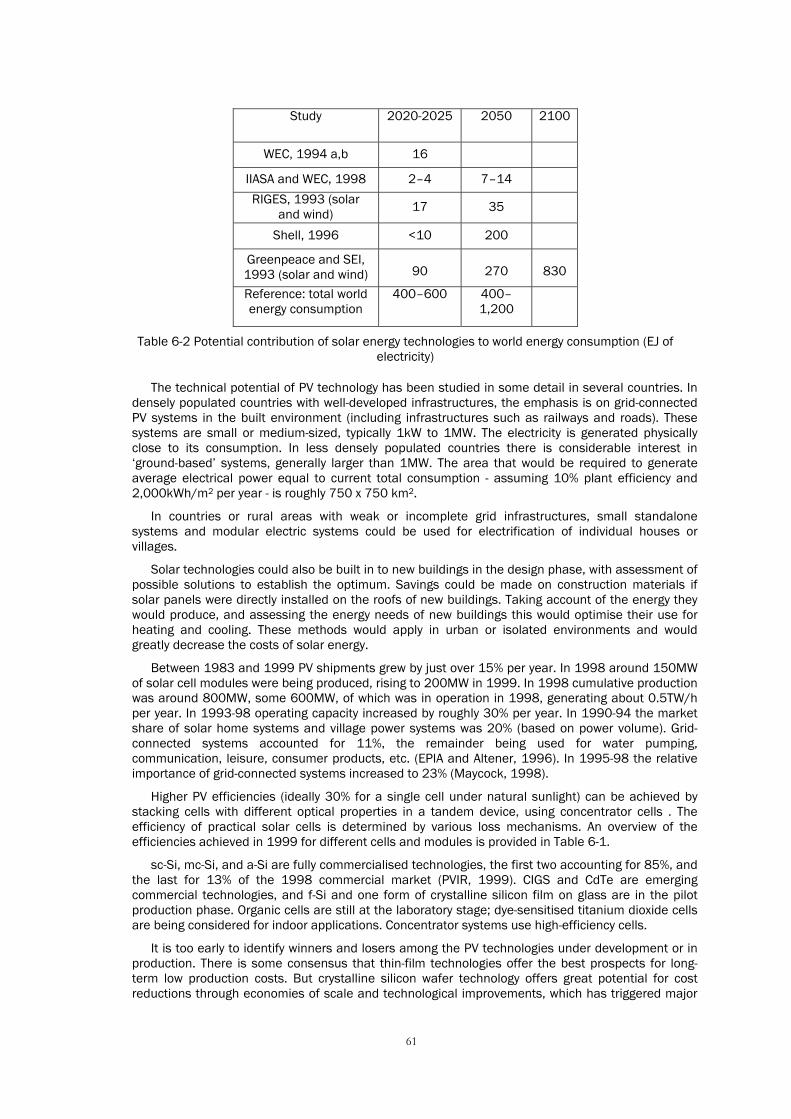
61
Study 2020-2025 2050 2100
WEC, 1994 a,b 16
IIASA and WEC, 1998 2–4 7–14
RIGES, 1993 (solar and wind) 17 35
Shell, 1996 <10 200
Greenpeace and SEI, 1993 (solar and wind)
90
270
830
Reference: total world energy consumption
400–600 400–1,200
Table 6-2 Potential contribution of solar energy technologies to world energy consumption (EJ of electricity)
The technical potential of PV technology has been studied in some detail in several countries. In densely populated countries with well-developed infrastructures, the emphasis is on grid-connected PV systems in the built environment (including infrastructures such as railways and roads). These systems are small or medium-sized, typically 1kW to 1MW. The electricity is generated physically close to its consumption. In less densely populated countries there is considerable interest in ‘ground-based’ systems, generally larger than 1MW. The area that would be required to generate average electrical power equal to current total consumption - assuming 10% plant efficiency and 2,000kWh/m2 per year - is roughly 750 x 750 km2.
In countries or rural areas with weak or incomplete grid infrastructures, small standalone systems and modular electric systems could be used for electrification of individual houses or villages.
Solar technologies could also be built in to new buildings in the design phase, with assessment of possible solutions to establish the optimum. Savings could be made on construction materials if solar panels were directly installed on the roofs of new buildings. Taking account of the energy they would produce, and assessing the energy needs of new buildings this would optimise their use for heating and cooling. These methods would apply in urban or isolated environments and would greatly decrease the costs of solar energy.
Between 1983 and 1999 PV shipments grew by just over 15% per year. In 1998 around 150MW of solar cell modules were being produced, rising to 200MW in 1999. In 1998 cumulative production was around 800MW, some 600MW, of which was in operation in 1998, generating about 0.5TW/h per year. In 1993-98 operating capacity increased by roughly 30% per year. In 1990-94 the market share of solar home systems and village power systems was 20% (based on power volume). Grid-connected systems accounted for 11%, the remainder being used for water pumping, communication, leisure, consumer products, etc. (EPIA and Altener, 1996). In 1995-98 the relative importance of grid-connected systems increased to 23% (Maycock, 1998).
Higher PV efficiencies (ideally 30% for a single cell under natural sunlight) can be achieved by stacking cells with different optical properties in a tandem device, using concentrator cells . The efficiency of practical solar cells is determined by various loss mechanisms. An overview of the efficiencies achieved in 1999 for different cells and modules is provided in Table 6-1.
sc-Si, mc-Si, and a-Si are fully commercialised technologies, the first two accounting for 85%, and the last for 13% of the 1998 commercial market (PVIR, 1999). CIGS and CdTe are emerging commercial technologies, and f-Si and one form of crystalline silicon film on glass are in the pilot production phase. Organic cells are still at the laboratory stage; dye-sensitised titanium dioxide cells are being considered for indoor applications. Concentrator systems use high-efficiency cells.
It is too early to identify winners and losers among the PV technologies under development or in production. There is some consensus that thin-film technologies offer the best prospects for long-term low production costs. But crystalline silicon wafer technology offers great potential for cost reductions through economies of scale and technological improvements, which has triggered major
62
investments in new production capacity. It is not clear when thin films will become dominant in the PV market.
The conversion efficiency of commercial modules should increase steadily in the next decades (irrespective of the technology). For the medium term (2010) efficiency is forecast to be 12-20% (Maycock, 1998), and for the longer term (beyond 2020) possibly 30% or even somewhat more (EUREC Agency, 1996). However, this is based on an evaluation of what is physically possible, not what is technologically at low cost. Moreover, it is not expected that such high efficiencies would be obtainable from simple extrapolation of the currently commercialised technologies. It is unlikely that modules with the lowest manufacturing cost per Watt would be the most efficient.
6.3.2 Low-temperature solar energy potential and market developments
About 140 million m2 of solar thermal collector area are currently in operation around the world and the annual newly installed area is more than 10 million m2. The total installed capacity is thus approaching 100GWth – more than the global wind power electric capacity. China is the world lead market, with an installed capacity one-third of the world total, almost exclusively evacuated tubular collectors. Their total surface now exceeds 22millions m2. In the US, Canada and Australia swimming pool heating is dominant with an installed capacity of 18GWth of unglazed plastic collectors. Europe and Japan provide about 10GWth and 9GWth respectively with flat-plate and evacuated tube collectors. Almost all use water as the heat transfer fluid – air collectors represent only 1% of the global market. In Europe, lead markets are Germany, Greece and Austria. The highest collector surface area per inhabitant is Cyprus with 582m2, far above Austria 297m2 and the EU average of 33.7m2 (EurObservER, 2005)16.
World commercial low-temperature heat consumption can be estimated at 50EJ/yr for space heating and at about 10EJ/yr for hot water production. Low and medium temperature heat (up to 200◦C) can be used as process heat, in total about 40EJ/yr. Almost any low and medium temperature heat demand can be met at least partially with solar energy. One of the drawbacks to this application is the mismatch between availability of sunlight and demand for heating, which requires solar heating systems to include storage.
Solar domestic hot water (SDHW) systems are currently the most important application for low-temperature solar heat. In 1994 some 7m SDHW systems were installed worldwide. In 1994 the total installed collector area of SDHW and other solar energy systems was about 22m2 (Morrison, 1999) and in 1998 about 30m2. This can be expressed as installed capacity of around 18,000MW. The total heat generated by these solar energy systems can be estimated at 50PJ/yr, which is only 0.5% of the potential of 10EJ/yr. In Europe the market expanded after 1994. In 1996 about 700,000m2 were produced, mainly in Germany (330,000m2) and Austria (230,000m2). The European Solar Industry Federation forecasts annual growth of around 20% (ESIF, 1996). In 1998 sales in Europe were probably of the order of 1,000,000m2. In the US the market has declined - the amount of collector area sold for SDHW systems decreased from 1.1m in 1984 to around 80,000m2 in 1998 (Morrison, 1999). The US market collapsed in 1986 due to the withdrawal of federal R&D funding and tax credits. In China production is increasing rapidly. In Japan the market is increasing after a collapse in 1987 (ESIF, 1996). Growth of 10-25% per year is forecast for the world; the installed collector area is forecast to be 150,000,000m2 in 2010.
Electric heat pumps are another important technology. These pumps can withdraw heat from a heat source, raise the temperature and deliver the resultant heat to an application (e.g. space heating). Tens of millions of appliances that can be operated as heat pumps have been installed, most of which can also operate as cooling devices (air conditioners). Whether their application results in net fuel savings depends on the local situation, and aspects such as pump performance, and the characteristics of the electricity source. We do not have data on which to determine the net contribution of heat pumps to energy supplies.
6.3.3 High-temperature solar energy potential and market developments
Concentrating solar systems are 27% more efficient than flat plate collectors, due to their increased captive surface per square metre. This is based on efficiency of the thermodynamic cycle
16 EuroObserver (2005), ‘The present and future use of solar thermal energy as a primary source of energy’ Cédric Philibert,
IEA, Paris, France
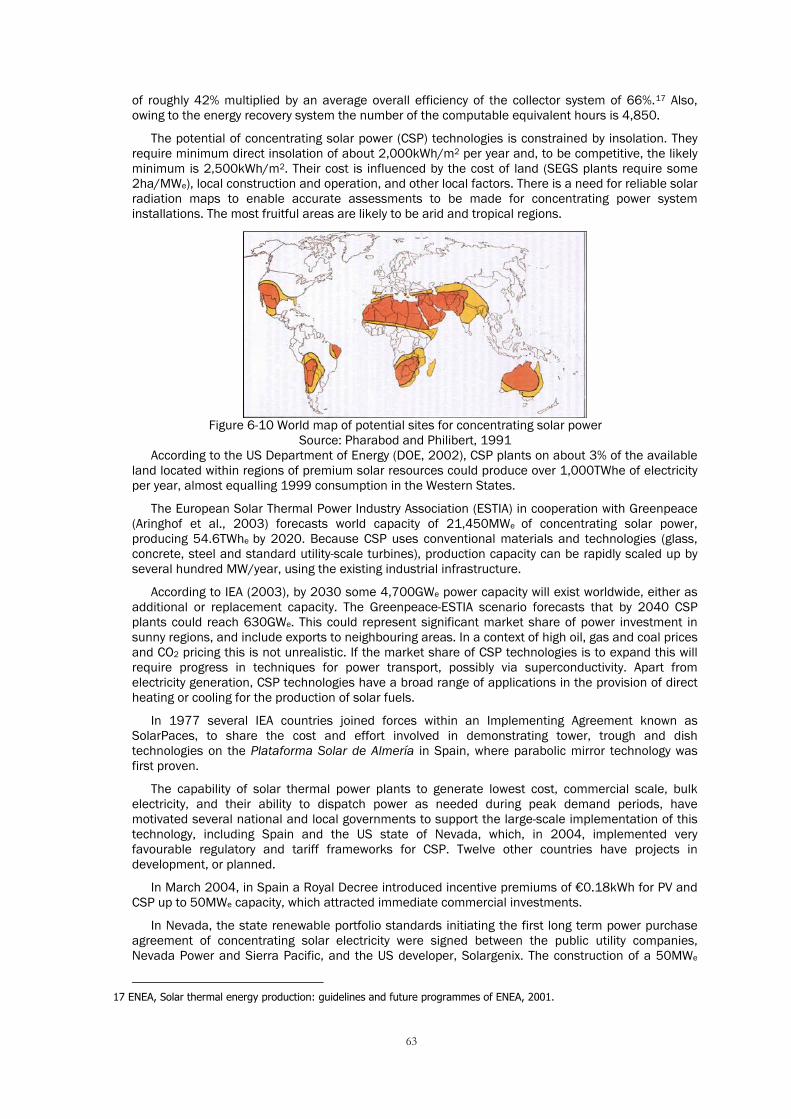
63
of roughly 42% multiplied by an average overall efficiency of the collector system of 66%.17 Also, owing to the energy recovery system the number of the computable equivalent hours is 4,850.
The potential of concentrating solar power (CSP) technologies is constrained by insolation. They require minimum direct insolation of about 2,000kWh/m2 per year and, to be competitive, the likely minimum is 2,500kWh/m2. Their cost is influenced by the cost of land (SEGS plants require some 2ha/MWe), local construction and operation, and other local factors. There is a need for reliable solar radiation maps to enable accurate assessments to be made for concentrating power system installations. The most fruitful areas are likely to be arid and tropical regions.
Figure 6-10 World map of potential sites for concentrating solar power
Source: Pharabod and Philibert, 1991 According to the US Department of Energy (DOE, 2002), CSP plants on about 3% of the available
land located within regions of premium solar resources could produce over 1,000TWhe of electricity per year, almost equalling 1999 consumption in the Western States.
The European Solar Thermal Power Industry Association (ESTIA) in cooperation with Greenpeace (Aringhof et al., 2003) forecasts world capacity of 21,450MWe of concentrating solar power, producing 54.6TWhe by 2020. Because CSP uses conventional materials and technologies (glass, concrete, steel and standard utility-scale turbines), production capacity can be rapidly scaled up by several hundred MW/year, using the existing industrial infrastructure.
According to IEA (2003), by 2030 some 4,700GWe power capacity will exist worldwide, either as additional or replacement capacity. The Greenpeace-ESTIA scenario forecasts that by 2040 CSP plants could reach 630GWe. This could represent significant market share of power investment in sunny regions, and include exports to neighbouring areas. In a context of high oil, gas and coal prices and CO2 pricing this is not unrealistic. If the market share of CSP technologies is to expand this will require progress in techniques for power transport, possibly via superconductivity. Apart from electricity generation, CSP technologies have a broad range of applications in the provision of direct heating or cooling for the production of solar fuels.
In 1977 several IEA countries joined forces within an Implementing Agreement known as SolarPaces, to share the cost and effort involved in demonstrating tower, trough and dish technologies on the Plataforma Solar de Almería in Spain, where parabolic mirror technology was first proven.
The capability of solar thermal power plants to generate lowest cost, commercial scale, bulk electricity, and their ability to dispatch power as needed during peak demand periods, have motivated several national and local governments to support the large-scale implementation of this technology, including Spain and the US state of Nevada, which, in 2004, implemented very favourable regulatory and tariff frameworks for CSP. Twelve other countries have projects in development, or planned.
In March 2004, in Spain a Royal Decree introduced incentive premiums of €0.18kWh for PV and CSP up to 50MWe capacity, which attracted immediate commercial investments.
In Nevada, the state renewable portfolio standards initiating the first long term power purchase agreement of concentrating solar electricity were signed between the public utility companies, Nevada Power and Sierra Pacific, and the US developer, Solargenix. The construction of a 50MWe
17 ENEA, Solar thermal energy production: guidelines and future programmes of ENEA, 2001.
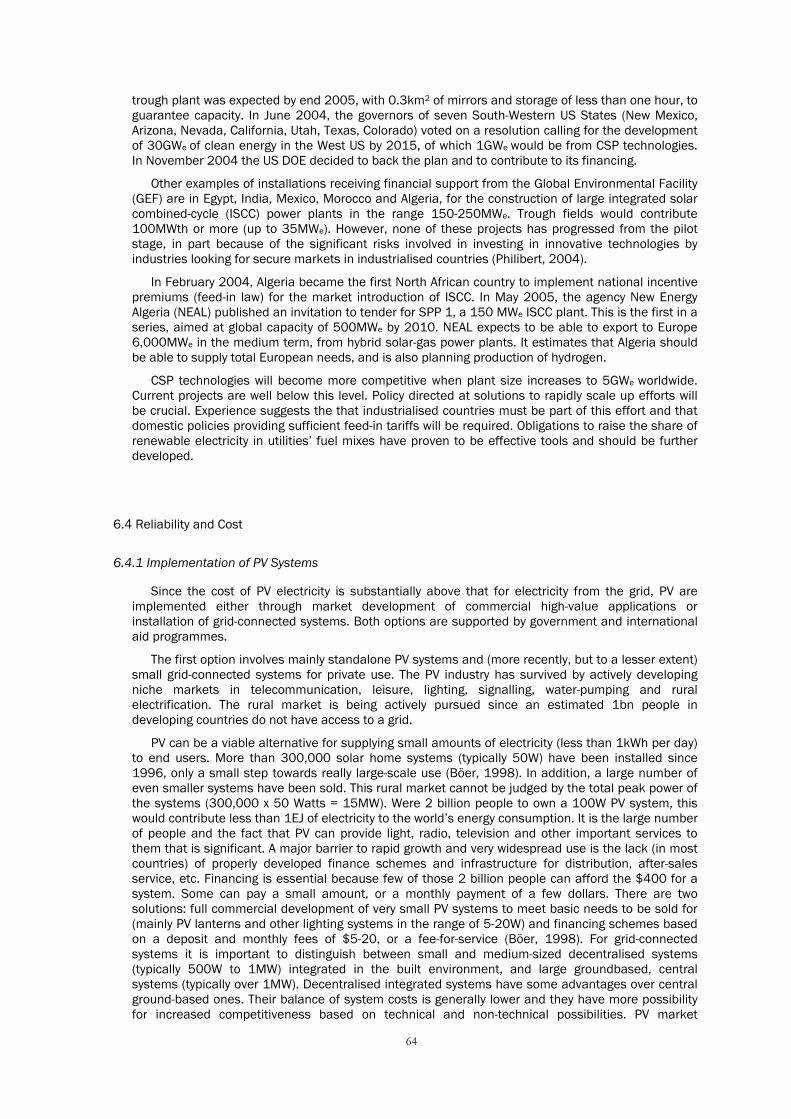
64
trough plant was expected by end 2005, with 0.3km2 of mirrors and storage of less than one hour, to guarantee capacity. In June 2004, the governors of seven South-Western US States (New Mexico, Arizona, Nevada, California, Utah, Texas, Colorado) voted on a resolution calling for the development of 30GWe of clean energy in the West US by 2015, of which 1GWe would be from CSP technologies. In November 2004 the US DOE decided to back the plan and to contribute to its financing.
Other examples of installations receiving financial support from the Global Environmental Facility (GEF) are in Egypt, India, Mexico, Morocco and Algeria, for the construction of large integrated solar combined-cycle (ISCC) power plants in the range 150-250MWe. Trough fields would contribute 100MWth or more (up to 35MWe). However, none of these projects has progressed from the pilot stage, in part because of the significant risks involved in investing in innovative technologies by industries looking for secure markets in industrialised countries (Philibert, 2004).
In February 2004, Algeria became the first North African country to implement national incentive premiums (feed-in law) for the market introduction of ISCC. In May 2005, the agency New Energy Algeria (NEAL) published an invitation to tender for SPP 1, a 150 MWe ISCC plant. This is the first in a series, aimed at global capacity of 500MWe by 2010. NEAL expects to be able to export to Europe 6,000MWe in the medium term, from hybrid solar-gas power plants. It estimates that Algeria should be able to supply total European needs, and is also planning production of hydrogen.
CSP technologies will become more competitive when plant size increases to 5GWe worldwide. Current projects are well below this level. Policy directed at solutions to rapidly scale up efforts will be crucial. Experience suggests the that industrialised countries must be part of this effort and that domestic policies providing sufficient feed-in tariffs will be required. Obligations to raise the share of renewable electricity in utilities’ fuel mixes have proven to be effective tools and should be further developed.
6.4 Reliability and Cost
6.4.1 Implementation of PV Systems
Since the cost of PV electricity is substantially above that for electricity from the grid, PV are implemented either through market development of commercial high-value applications or installation of grid-connected systems. Both options are supported by government and international aid programmes.
The first option involves mainly standalone PV systems and (more recently, but to a lesser extent) small grid-connected systems for private use. The PV industry has survived by actively developing niche markets in telecommunication, leisure, lighting, signalling, water-pumping and rural electrification. The rural market is being actively pursued since an estimated 1bn people in developing countries do not have access to a grid.
PV can be a viable alternative for supplying small amounts of electricity (less than 1kWh per day) to end users. More than 300,000 solar home systems (typically 50W) have been installed since 1996, only a small step towards really large-scale use (Böer, 1998). In addition, a large number of even smaller systems have been sold. This rural market cannot be judged by the total peak power of the systems (300,000 x 50 Watts = 15MW). Were 2 billion people to own a 100W PV system, this would contribute less than 1EJ of electricity to the world’s energy consumption. It is the large number of people and the fact that PV can provide light, radio, television and other important services to them that is significant. A major barrier to rapid growth and very widespread use is the lack (in most countries) of properly developed finance schemes and infrastructure for distribution, after-sales service, etc. Financing is essential because few of those 2 billion people can afford the $400 for a system. Some can pay a small amount, or a monthly payment of a few dollars. There are two solutions: full commercial development of very small PV systems to meet basic needs to be sold for (mainly PV lanterns and other lighting systems in the range of 5-20W) and financing schemes based on a deposit and monthly fees of $5-20, or a fee-for-service (Böer, 1998). For grid-connected systems it is important to distinguish between small and medium-sized decentralised systems (typically 500W to 1MW) integrated in the built environment, and large groundbased, central systems (typically over 1MW). Decentralised integrated systems have some advantages over central ground-based ones. Their balance of system costs is generally lower and they have more possibility for increased competitiveness based on technical and non-technical possibilities. PV market
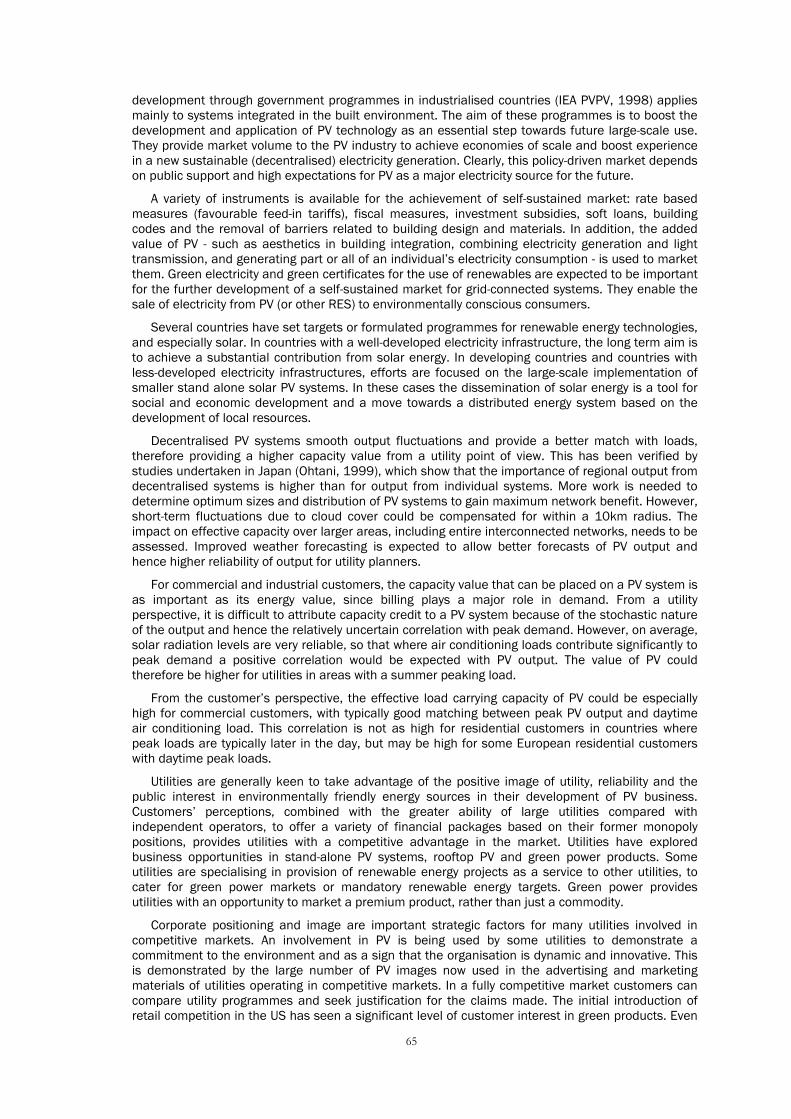
65
development through government programmes in industrialised countries (IEA PVPV, 1998) applies mainly to systems integrated in the built environment. The aim of these programmes is to boost the development and application of PV technology as an essential step towards future large-scale use. They provide market volume to the PV industry to achieve economies of scale and boost experience in a new sustainable (decentralised) electricity generation. Clearly, this policy-driven market depends on public support and high expectations for PV as a major electricity source for the future.
A variety of instruments is available for the achievement of self-sustained market: rate based measures (favourable feed-in tariffs), fiscal measures, investment subsidies, soft loans, building codes and the removal of barriers related to building design and materials. In addition, the added value of PV - such as aesthetics in building integration, combining electricity generation and light transmission, and generating part or all of an individual’s electricity consumption - is used to market them. Green electricity and green certificates for the use of renewables are expected to be important for the further development of a self-sustained market for grid-connected systems. They enable the sale of electricity from PV (or other RES) to environmentally conscious consumers.
Several countries have set targets or formulated programmes for renewable energy technologies, and especially solar. In countries with a well-developed electricity infrastructure, the long term aim is to achieve a substantial contribution from solar energy. In developing countries and countries with less-developed electricity infrastructures, efforts are focused on the large-scale implementation of smaller stand alone solar PV systems. In these cases the dissemination of solar energy is a tool for social and economic development and a move towards a distributed energy system based on the development of local resources.
Decentralised PV systems smooth output fluctuations and provide a better match with loads, therefore providing a higher capacity value from a utility point of view. This has been verified by studies undertaken in Japan (Ohtani, 1999), which show that the importance of regional output from decentralised systems is higher than for output from individual systems. More work is needed to determine optimum sizes and distribution of PV systems to gain maximum network benefit. However, short-term fluctuations due to cloud cover could be compensated for within a 10km radius. The impact on effective capacity over larger areas, including entire interconnected networks, needs to be assessed. Improved weather forecasting is expected to allow better forecasts of PV output and hence higher reliability of output for utility planners.
For commercial and industrial customers, the capacity value that can be placed on a PV system is as important as its energy value, since billing plays a major role in demand. From a utility perspective, it is difficult to attribute capacity credit to a PV system because of the stochastic nature of the output and hence the relatively uncertain correlation with peak demand. However, on average, solar radiation levels are very reliable, so that where air conditioning loads contribute significantly to peak demand a positive correlation would be expected with PV output. The value of PV could therefore be higher for utilities in areas with a summer peaking load.
From the customer’s perspective, the effective load carrying capacity of PV could be especially high for commercial customers, with typically good matching between peak PV output and daytime air conditioning load. This correlation is not as high for residential customers in countries where peak loads are typically later in the day, but may be high for some European residential customers with daytime peak loads.
Utilities are generally keen to take advantage of the positive image of utility, reliability and the public interest in environmentally friendly energy sources in their development of PV business. Customers’ perceptions, combined with the greater ability of large utilities compared with independent operators, to offer a variety of financial packages based on their former monopoly positions, provides utilities with a competitive advantage in the market. Utilities have explored business opportunities in stand-alone PV systems, rooftop PV and green power products. Some utilities are specialising in provision of renewable energy projects as a service to other utilities, to cater for green power markets or mandatory renewable energy targets. Green power provides utilities with an opportunity to market a premium product, rather than just a commodity.
Corporate positioning and image are important strategic factors for many utilities involved in competitive markets. An involvement in PV is being used by some utilities to demonstrate a commitment to the environment and as a sign that the organisation is dynamic and innovative. This is demonstrated by the large number of PV images now used in the advertising and marketing materials of utilities operating in competitive markets. In a fully competitive market customers can compare utility programmes and seek justification for the claims made. The initial introduction of retail competition in the US has seen a significant level of customer interest in green products. Even

66
in countries such as Australia, where full retail competition has yet to be introduced, almost all electricity retailers now offer green products. Although PV is not the cheapest technology for utilities, most still include PV in their portfolios because even systems as small as 1kWp can be installed in high visibility locations, close to customers, and provide a high technology, green image.
6.4.2 Implementation issues for low temperature solar systems
In many countries incentive programmes help to stimulate the further development and application of low-temperature solar energy systems, improving their performance and reducing economic and other barriers. In countries where government stimulation is lacking, it is often the economic attractiveness of the system or environmental conscience that motivates people to install these systems. In many cases energy companies, especially utilities, have stimulated the use of solar thermal energy. Motivated by environmental action programmes, demand-side management programmes, or a desire to diversify and serve new markets, these companies have taken over a significant part of the effort to get solar water systems to the market. They support these projects by active marketing, by financial contributions, or by offering the possibility to rent or lease a system (IEA Caddet, 1998).
Low-temperature solar thermal technologies can contribute many EJ to annual demand for heat. Current levels are about 50PJ per year (excluding heat pumps and passive solar energy use).
World-wide, about 7m solar hot water mainly SDHW systems, have been installed. In many regions their dissemination strongly depends on government policy, mainly because of the relatively high heat-production costs ($0.03–0.20/kWh). However, they can compete with electric hot water systems. The costs of installed solar hot water systems in moderate climate zones may be reduced 25%-50% by further technology developments and/or mass production and installation.
Active solar systems for space heating with seasonal storage are mainly in the demonstration phase. Passive solar energy use has become an attractive option for heating and cooling buildings, following the development of new materials and powerful simulation tools. Electric heat pumps for space heating are especially attractive in countries where electricity is produced by hydropower or wind energy. In other countries net contribution to the energy supply is achieved only from pumps with high performance factors.
Solar drying of agricultural crops could be a viable technological and economic option that needs to be marketed. Solar cooking has a significant beneficial impact. Many hundreds of thousands of solar cooking devices have been sold, but they have limitations and can only supplement conventional fuel consumption.
6.4.3 Implementation issues for high temperature solar systems
High temperature thermal technologies, due to thermal energy storage, could reach 5,000 equivalent full power annual operative time (currently 2,000) and efficiencies equal to those of thermoelectric power plants. Development to increase reliability and reduce costs is required.
6.4.4 PV Systems Costs
The investment costs for PV installations range from €4,000-20,000/kW (up to six times higher than conventional thermoelectric power plants), with energy costs of €0.25-0.65/kWh. For low and high temperature thermal technologies the investment costs are lower (but always higher than for conventional thermal power plants). Increased yields and reduced costs are expected for PV technologies. PV systems have very low social and environmental impact and PV technologies are already competitive for ‘poor’ thermal uses and in low scale off grid applications. The US DOE (2004) recently calculated investment payback for PV systems to be four years, based on 12% conversion efficiency (standard conditions) and 1,700kWh/m2 per year of available sunlight energy (Figure 6-11). In a 10 year development projection based on 14% efficiency, payback would be only 2 years.
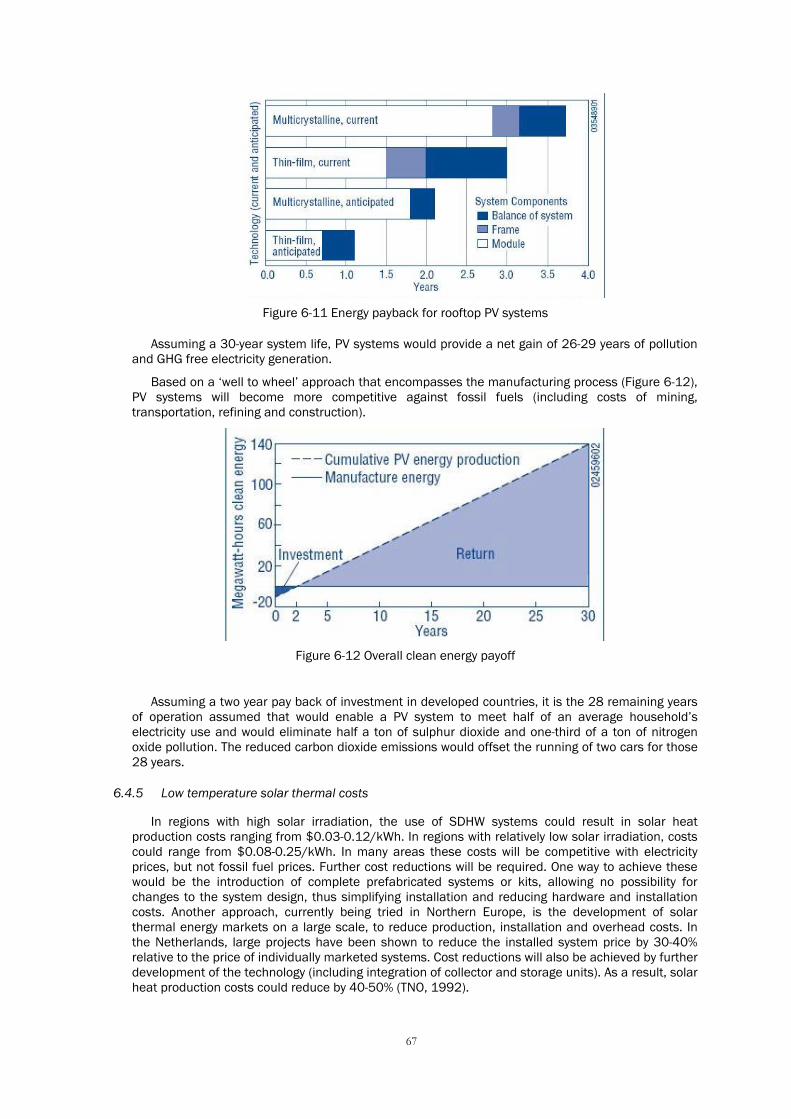
67
Figure 6-11 Energy payback for rooftop PV systems
Assuming a 30-year system life, PV systems would provide a net gain of 26-29 years of pollution and GHG free electricity generation.
Based on a ‘well to wheel’ approach that encompasses the manufacturing process (Figure 6-12), PV systems will become more competitive against fossil fuels (including costs of mining, transportation, refining and construction).
Figure 6-12 Overall clean energy payoff
Assuming a two year pay back of investment in developed countries, it is the 28 remaining years
of operation assumed that would enable a PV system to meet half of an average household’s electricity use and would eliminate half a ton of sulphur dioxide and one-third of a ton of nitrogen oxide pollution. The reduced carbon dioxide emissions would offset the running of two cars for those 28 years.
6.4.5 Low temperature solar thermal costs
In regions with high solar irradiation, the use of SDHW systems could result in solar heat production costs ranging from $0.03-0.12/kWh. In regions with relatively low solar irradiation, costs could range from $0.08-0.25/kWh. In many areas these costs will be competitive with electricity prices, but not fossil fuel prices. Further cost reductions will be required. One way to achieve these would be the introduction of complete prefabricated systems or kits, allowing no possibility for changes to the system design, thus simplifying installation and reducing hardware and installation costs. Another approach, currently being tried in Northern Europe, is the development of solar thermal energy markets on a large scale, to reduce production, installation and overhead costs. In the Netherlands, large projects have been shown to reduce the installed system price by 30-40% relative to the price of individually marketed systems. Cost reductions will also be achieved by further development of the technology (including integration of collector and storage units). As a result, solar heat production costs could reduce by 40-50% (TNO, 1992).

68
SDHW systems are commonly produced from metals (aluminium, copper, steel), glass and insulation materials. In most designs the systems can be separated into the constituent materials; all metals and glass can be recycled. The energy payback time for a SDHW system is now generally less than one year (van der Leun, 1994).
6.4.6 High temperature solar thermal costs
Trough plants. For most 30 MWe plants, investment costs are about $3.9/W, while subsidised electricity cost have gone from $0.24/kWh for SEGS-1 to $0.12/kWh for SEGS-VIII and IX (80MWe). However, the solar only power cost of these plants would be higher, close to $0.16/kWh.
Dishes and towers. Capital costs are currently estimated at over $10/W, but might fall drastically with mass production.
In general terms parabolic trough technology has demonstrated a reduction in the cost of electricity of 15% with every doubling of total installed capacity. A similar cost reductions trend has been demonstrated for other power technologies (DOE, 2002).

69
77 .. GG EE OO TT HH EE RR MM AA LL EE NN EE RR GG YY
7.1 The Geothermal Resource
The word geothermal is derived from the Greek geo (earth) and therme (heat), thus, geothermal energy is generally defined as heat stored within the earth. Heat originates from the earth’s molten interior and from the decay of radioactive materials. It exists in larger quantities than theoretical solar energy (annual solar irradiation). In fact total geothermal theoretical potential is more than 100,000 times higher than the world energy consumption and its total technical potential (about 5,000EJ) is higher than world energy consumption (about 45EJ); actual use is about 2EJ. Similar to other renewable resources (solar energy, wind energy), geothermal energy is widely dispersed. Thus, it is the technological ability to use geothermal energy, not its availability that will determine its role.
The earth has four main layers, each of different composition, function and temperature (Figure 7-1).
Figure 7-1 Earth’s layers and relative temperatures
The crust is the outermost layer of the earth, and is the land that forms the continents and ocean floors. It can be 3-8km thick under the oceans and 25-55km thick on the continents.
The heat of the earth dissipates towards the earth’s surface by about 3◦C for every 100m of depth, a temperature difference too small to generate huge local power. The earth's crust is broken into pieces called plates. Magma, which is molten rock at high temperature, comes to the earth's surface at the edges of these plates with the result that geothermal energy is generally greater in areas where tectonic plates collide and generate volcanic activity. Figure 7-2 depicts where plate boundaries and geothermal power plants are located. The Pacific Ring (the ‘Ring of Fire’) is a prime location for harnessing geothermal activity because it is an area where tectonic processes are occurring continuously.
Figure 7-2 Plate boundaries and geothermal power plants
Although most reservoirs of geothermal are deep underground with no signs of their existence above ground, geothermal energy sometimes finds its way to the surface in the form of volcanoes and fumaroles (holes allowing the release of volcanic gases), hot springs and geysers (see Figure 7-3).
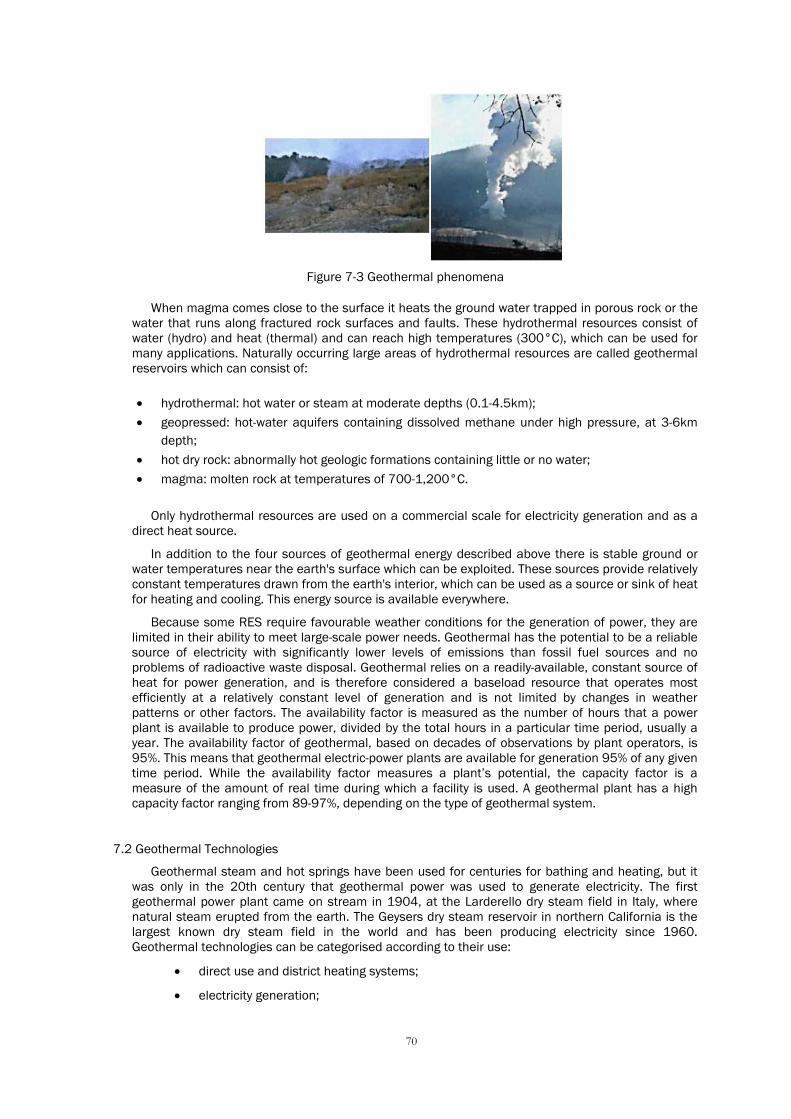
70
Figure 7-3 Geothermal phenomena
When magma comes close to the surface it heats the ground water trapped in porous rock or the water that runs along fractured rock surfaces and faults. These hydrothermal resources consist of water (hydro) and heat (thermal) and can reach high temperatures (300°C), which can be used for many applications. Naturally occurring large areas of hydrothermal resources are called geothermal reservoirs which can consist of:
• hydrothermal: hot water or steam at moderate depths (0.1-4.5km); • geopressed: hot-water aquifers containing dissolved methane under high pressure, at 3-6km
depth; • hot dry rock: abnormally hot geologic formations containing little or no water; • magma: molten rock at temperatures of 700-1,200°C.
Only hydrothermal resources are used on a commercial scale for electricity generation and as a direct heat source.
In addition to the four sources of geothermal energy described above there is stable ground or water temperatures near the earth's surface which can be exploited. These sources provide relatively constant temperatures drawn from the earth's interior, which can be used as a source or sink of heat for heating and cooling. This energy source is available everywhere.
Because some RES require favourable weather conditions for the generation of power, they are limited in their ability to meet large-scale power needs. Geothermal has the potential to be a reliable source of electricity with significantly lower levels of emissions than fossil fuel sources and no problems of radioactive waste disposal. Geothermal relies on a readily-available, constant source of heat for power generation, and is therefore considered a baseload resource that operates most efficiently at a relatively constant level of generation and is not limited by changes in weather patterns or other factors. The availability factor is measured as the number of hours that a power plant is available to produce power, divided by the total hours in a particular time period, usually a year. The availability factor of geothermal, based on decades of observations by plant operators, is 95%. This means that geothermal electric-power plants are available for generation 95% of any given time period. While the availability factor measures a plant’s potential, the capacity factor is a measure of the amount of real time during which a facility is used. A geothermal plant has a high capacity factor ranging from 89-97%, depending on the type of geothermal system.
7.2 Geothermal Technologies
Geothermal steam and hot springs have been used for centuries for bathing and heating, but it was only in the 20th century that geothermal power was used to generate electricity. The first geothermal power plant came on stream in 1904, at the Larderello dry steam field in Italy, where natural steam erupted from the earth. The Geysers dry steam reservoir in northern California is the largest known dry steam field in the world and has been producing electricity since 1960. Geothermal technologies can be categorised according to their use:
• direct use and district heating systems;
• electricity generation;
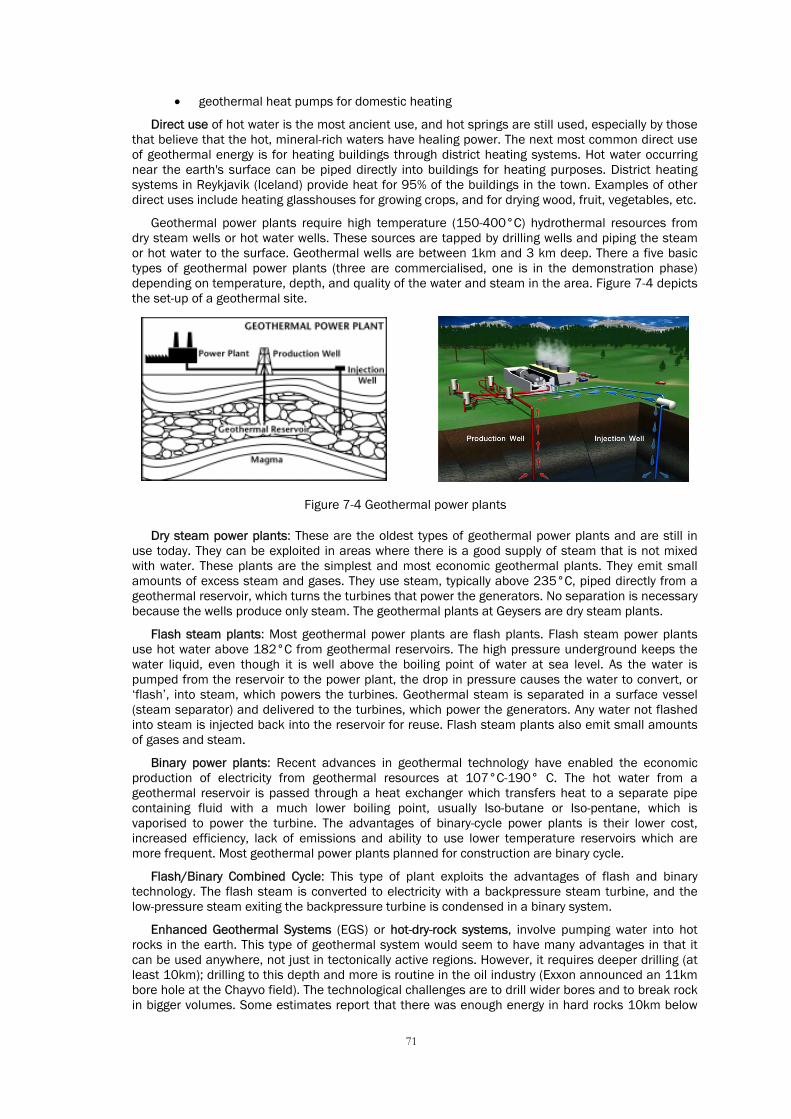
71
• geothermal heat pumps for domestic heating
Direct use of hot water is the most ancient use, and hot springs are still used, especially by those that believe that the hot, mineral-rich waters have healing power. The next most common direct use of geothermal energy is for heating buildings through district heating systems. Hot water occurring near the earth's surface can be piped directly into buildings for heating purposes. District heating systems in Reykjavik (Iceland) provide heat for 95% of the buildings in the town. Examples of other direct uses include heating glasshouses for growing crops, and for drying wood, fruit, vegetables, etc.
Geothermal power plants require high temperature (150-400°C) hydrothermal resources from dry steam wells or hot water wells. These sources are tapped by drilling wells and piping the steam or hot water to the surface. Geothermal wells are between 1km and 3 km deep. There a five basic types of geothermal power plants (three are commercialised, one is in the demonstration phase) depending on temperature, depth, and quality of the water and steam in the area. Figure 7-4 depicts the set-up of a geothermal site.
Figure 7-4 Geothermal power plants
Dry steam power plants: These are the oldest types of geothermal power plants and are still in use today. They can be exploited in areas where there is a good supply of steam that is not mixed with water. These plants are the simplest and most economic geothermal plants. They emit small amounts of excess steam and gases. They use steam, typically above 235°C, piped directly from a geothermal reservoir, which turns the turbines that power the generators. No separation is necessary because the wells produce only steam. The geothermal plants at Geysers are dry steam plants.
Flash steam plants: Most geothermal power plants are flash plants. Flash steam power plants use hot water above 182°C from geothermal reservoirs. The high pressure underground keeps the water liquid, even though it is well above the boiling point of water at sea level. As the water is pumped from the reservoir to the power plant, the drop in pressure causes the water to convert, or ‘flash’, into steam, which powers the turbines. Geothermal steam is separated in a surface vessel (steam separator) and delivered to the turbines, which power the generators. Any water not flashed into steam is injected back into the reservoir for reuse. Flash steam plants also emit small amounts of gases and steam.
Binary power plants: Recent advances in geothermal technology have enabled the economic production of electricity from geothermal resources at 107°C-190° C. The hot water from a geothermal reservoir is passed through a heat exchanger which transfers heat to a separate pipe containing fluid with a much lower boiling point, usually Iso-butane or Iso-pentane, which is vaporised to power the turbine. The advantages of binary-cycle power plants is their lower cost, increased efficiency, lack of emissions and ability to use lower temperature reservoirs which are more frequent. Most geothermal power plants planned for construction are binary cycle.
Flash/Binary Combined Cycle: This type of plant exploits the advantages of flash and binary technology. The flash steam is converted to electricity with a backpressure steam turbine, and the low-pressure steam exiting the backpressure turbine is condensed in a binary system.
Enhanced Geothermal Systems (EGS) or hot-dry-rock systems, involve pumping water into hot rocks in the earth. This type of geothermal system would seem to have many advantages in that it can be used anywhere, not just in tectonically active regions. However, it requires deeper drilling (at least 10km); drilling to this depth and more is routine in the oil industry (Exxon announced an 11km bore hole at the Chayvo field). The technological challenges are to drill wider bores and to break rock in bigger volumes. Some estimates report that there was enough energy in hard rocks 10km below
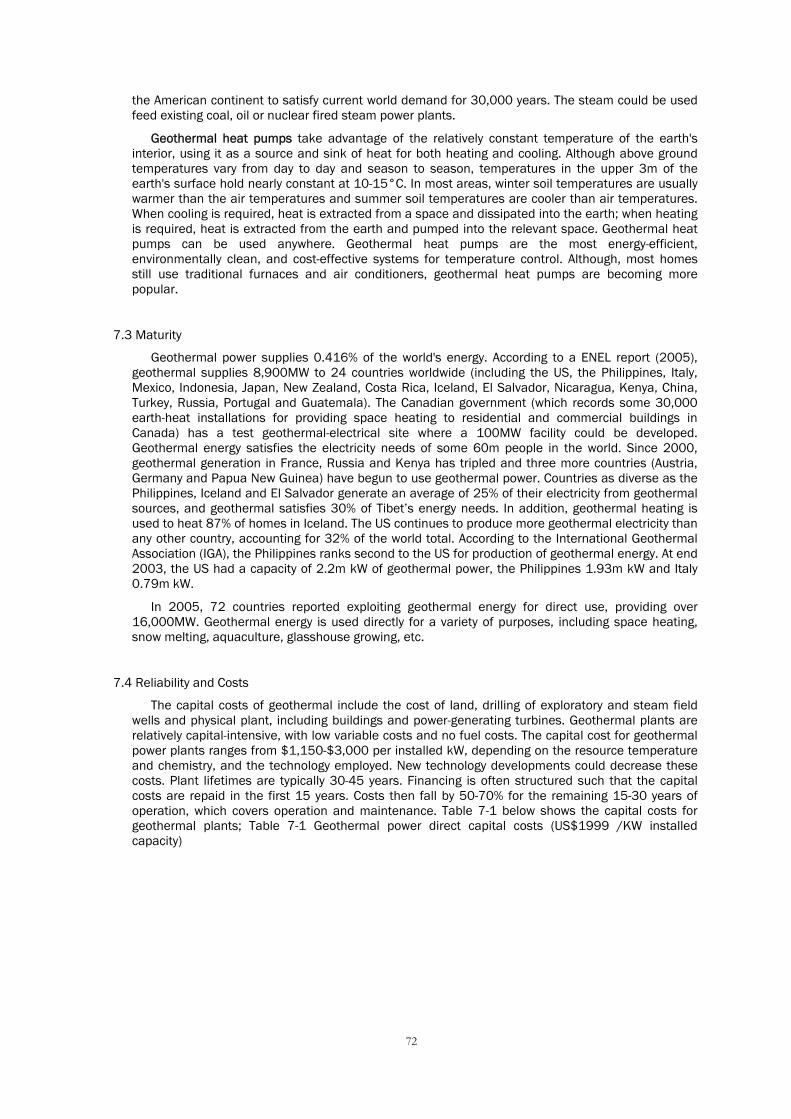
72
the American continent to satisfy current world demand for 30,000 years. The steam could be used feed existing coal, oil or nuclear fired steam power plants.
Geothermal heat pumps take advantage of the relatively constant temperature of the earth's interior, using it as a source and sink of heat for both heating and cooling. Although above ground temperatures vary from day to day and season to season, temperatures in the upper 3m of the earth's surface hold nearly constant at 10-15°C. In most areas, winter soil temperatures are usually warmer than the air temperatures and summer soil temperatures are cooler than air temperatures. When cooling is required, heat is extracted from a space and dissipated into the earth; when heating is required, heat is extracted from the earth and pumped into the relevant space. Geothermal heat pumps can be used anywhere. Geothermal heat pumps are the most energy-efficient, environmentally clean, and cost-effective systems for temperature control. Although, most homes still use traditional furnaces and air conditioners, geothermal heat pumps are becoming more popular.
7.3 Maturity
Geothermal power supplies 0.416% of the world's energy. According to a ENEL report (2005), geothermal supplies 8,900MW to 24 countries worldwide (including the US, the Philippines, Italy, Mexico, Indonesia, Japan, New Zealand, Costa Rica, Iceland, El Salvador, Nicaragua, Kenya, China, Turkey, Russia, Portugal and Guatemala). The Canadian government (which records some 30,000 earth-heat installations for providing space heating to residential and commercial buildings in Canada) has a test geothermal-electrical site where a 100MW facility could be developed. Geothermal energy satisfies the electricity needs of some 60m people in the world. Since 2000, geothermal generation in France, Russia and Kenya has tripled and three more countries (Austria, Germany and Papua New Guinea) have begun to use geothermal power. Countries as diverse as the Philippines, Iceland and El Salvador generate an average of 25% of their electricity from geothermal sources, and geothermal satisfies 30% of Tibet’s energy needs. In addition, geothermal heating is used to heat 87% of homes in Iceland. The US continues to produce more geothermal electricity than any other country, accounting for 32% of the world total. According to the International Geothermal Association (IGA), the Philippines ranks second to the US for production of geothermal energy. At end 2003, the US had a capacity of 2.2m kW of geothermal power, the Philippines 1.93m kW and Italy 0.79m kW.
In 2005, 72 countries reported exploiting geothermal energy for direct use, providing over 16,000MW. Geothermal energy is used directly for a variety of purposes, including space heating, snow melting, aquaculture, glasshouse growing, etc.
7.4 Reliability and Costs
The capital costs of geothermal include the cost of land, drilling of exploratory and steam field wells and physical plant, including buildings and power-generating turbines. Geothermal plants are relatively capital-intensive, with low variable costs and no fuel costs. The capital cost for geothermal power plants ranges from $1,150-$3,000 per installed kW, depending on the resource temperature and chemistry, and the technology employed. New technology developments could decrease these costs. Plant lifetimes are typically 30-45 years. Financing is often structured such that the capital costs are repaid in the first 15 years. Costs then fall by 50-70% for the remaining 15-30 years of operation, which covers operation and maintenance. Table 7-1 below shows the capital costs for geothermal plants; Table 7-1 Geothermal power direct capital costs (US$1999 /KW installed capacity)
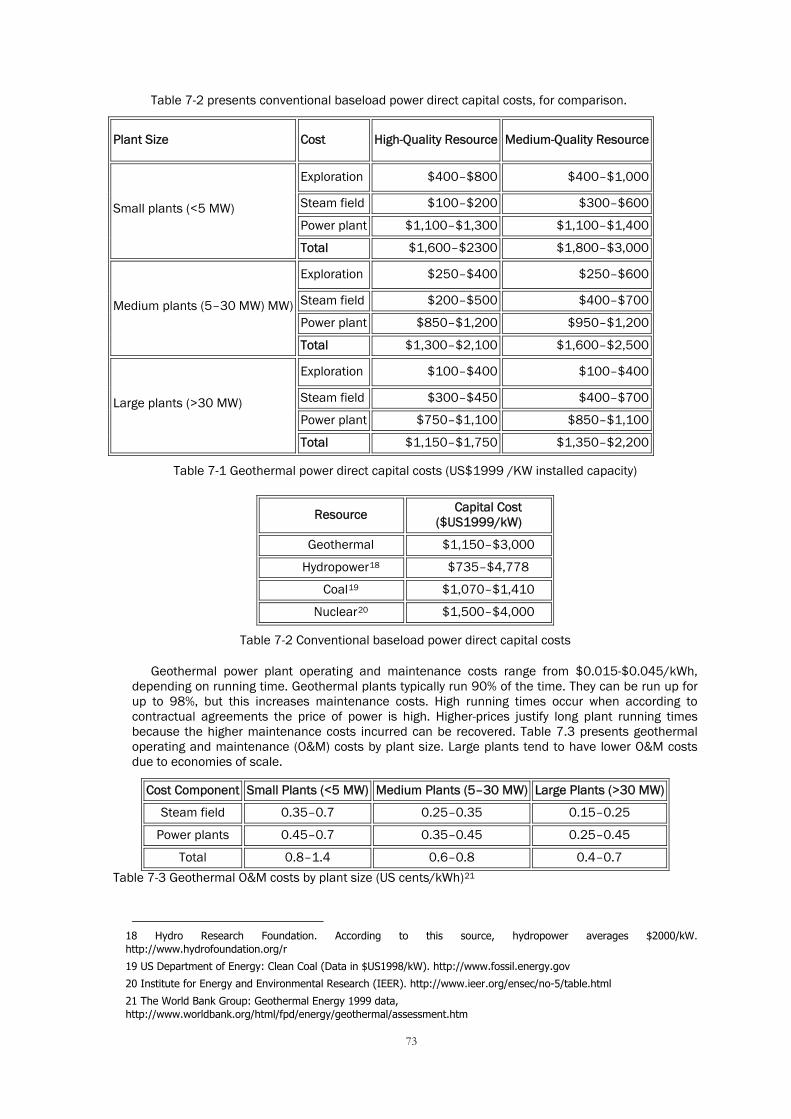
73
Table 7-2 presents conventional baseload power direct capital costs, for comparison.
Plant Size Cost High-Quality Resource Medium-Quality Resource
Exploration $400–$800 $400–$1,000
Steam field $100–$200 $300–$600
Power plant $1,100–$1,300 $1,100–$1,400 Small plants (<5 MW)
Total $1,600–$2300 $1,800–$3,000
Exploration $250–$400 $250–$600
Steam field $200–$500 $400–$700
Power plant $850–$1,200 $950–$1,200 Medium plants (5–30 MW) MW)
Total $1,300–$2,100 $1,600–$2,500
Exploration $100–$400 $100–$400
Steam field $300–$450 $400–$700
Power plant $750–$1,100 $850–$1,100 Large plants (>30 MW)
Total $1,150–$1,750 $1,350–$2,200
Table 7-1 Geothermal power direct capital costs (US$1999 /KW installed capacity)
Resource Capital Cost ($US1999/kW)
Geothermal $1,150–$3,000
Hydropower18 $735–$4,778
Coal19 $1,070–$1,410
Nuclear20 $1,500–$4,000
Table 7-2 Conventional baseload power direct capital costs
Geothermal power plant operating and maintenance costs range from $0.015-$0.045/kWh, depending on running time. Geothermal plants typically run 90% of the time. They can be run up for up to 98%, but this increases maintenance costs. High running times occur when according to contractual agreements the price of power is high. Higher-prices justify long plant running times because the higher maintenance costs incurred can be recovered. Table 7.3 presents geothermal operating and maintenance (O&M) costs by plant size. Large plants tend to have lower O&M costs due to economies of scale.
Cost Component Small Plants (<5 MW) Medium Plants (5–30 MW) Large Plants (>30 MW)
Steam field 0.35–0.7 0.25–0.35 0.15–0.25
Power plants 0.45–0.7 0.35–0.45 0.25–0.45
Total 0.8–1.4 0.6–0.8 0.4–0.7
Table 7-3 Geothermal O&M costs by plant size (US cents/kWh)21
18 Hydro Research Foundation. According to this source, hydropower averages $2000/kW. http://www.hydrofoundation.org/r
19 US Department of Energy: Clean Coal (Data in $US1998/kW). http://www.fossil.energy.gov
20 Institute for Energy and Environmental Research (IEER). http://www.ieer.org/ensec/no-5/table.html
21 The World Bank Group: Geothermal Energy 1999 data, http://www.worldbank.org/html/fpd/energy/geothermal/assessment.htm
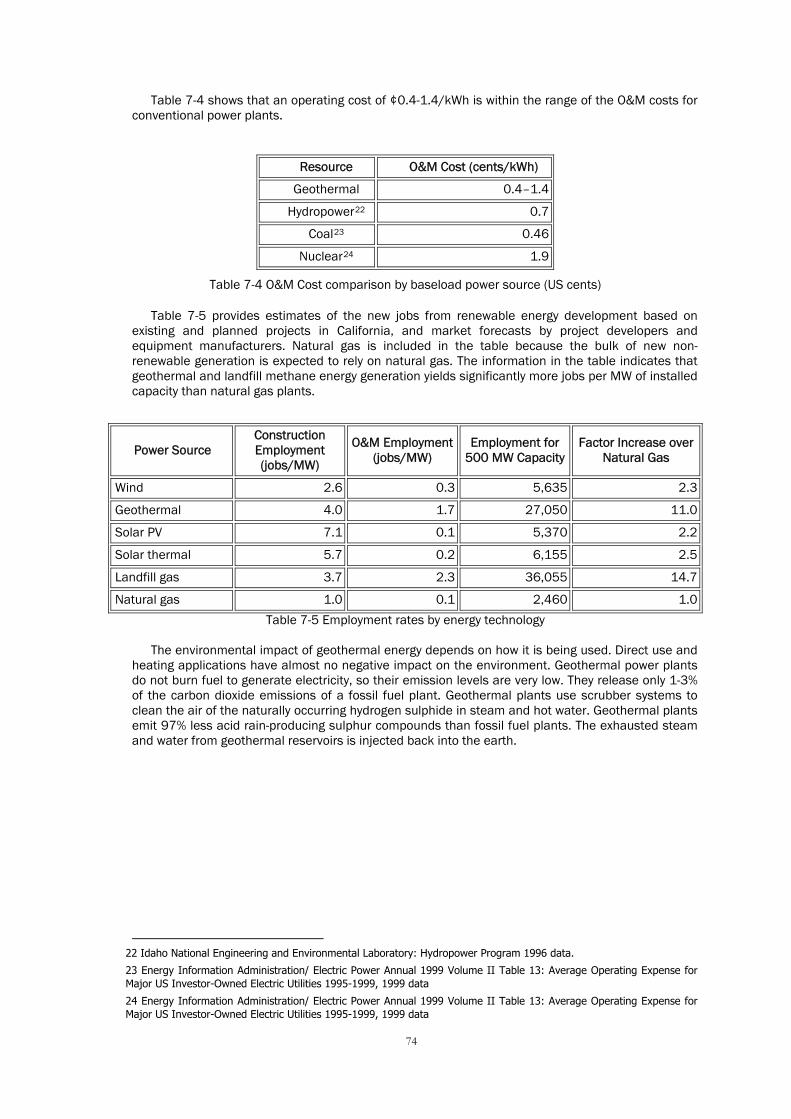
74
Table 7-4 shows that an operating cost of ¢0.4-1.4/kWh is within the range of the O&M costs for conventional power plants.
Resource O&M Cost (cents/kWh)
Geothermal 0.4–1.4
Hydropower22 0.7
Coal23 0.46
Nuclear24 1.9
Table 7-4 O&M Cost comparison by baseload power source (US cents)
Table 7-5 provides estimates of the new jobs from renewable energy development based on existing and planned projects in California, and market forecasts by project developers and equipment manufacturers. Natural gas is included in the table because the bulk of new non-renewable generation is expected to rely on natural gas. The information in the table indicates that geothermal and landfill methane energy generation yields significantly more jobs per MW of installed capacity than natural gas plants.
Power Source Construction Employment (jobs/MW)
O&M Employment (jobs/MW)
Employment for 500 MW Capacity
Factor Increase over Natural Gas
Wind 2.6 0.3 5,635 2.3
Geothermal 4.0 1.7 27,050 11.0
Solar PV 7.1 0.1 5,370 2.2
Solar thermal 5.7 0.2 6,155 2.5
Landfill gas 3.7 2.3 36,055 14.7
Natural gas 1.0 0.1 2,460 1.0
Table 7-5 Employment rates by energy technology
The environmental impact of geothermal energy depends on how it is being used. Direct use and heating applications have almost no negative impact on the environment. Geothermal power plants do not burn fuel to generate electricity, so their emission levels are very low. They release only 1-3% of the carbon dioxide emissions of a fossil fuel plant. Geothermal plants use scrubber systems to clean the air of the naturally occurring hydrogen sulphide in steam and hot water. Geothermal plants emit 97% less acid rain-producing sulphur compounds than fossil fuel plants. The exhausted steam and water from geothermal reservoirs is injected back into the earth.
22 Idaho National Engineering and Environmental Laboratory: Hydropower Program 1996 data.
23 Energy Information Administration/ Electric Power Annual 1999 Volume II Table 13: Average Operating Expense for Major US Investor-Owned Electric Utilities 1995-1999, 1999 data
24 Energy Information Administration/ Electric Power Annual 1999 Volume II Table 13: Average Operating Expense for Major US Investor-Owned Electric Utilities 1995-1999, 1999 data
75
88 .. BB II OO MM AA SS SS AA NN DD WW AA SS TT EE
8.1 Overview
Electricity and heat generation from biomass and waste is seen as having potential in the near and medium terms, to mitigate GHG emissions by substituting for fossil fuels.
In Europe there are several activities and programmes aimed at biomass-to-energy and waste-to-energy technologies development at both European and national levels. Every country in Europe has bio-energy in its energy and climate and agricultural policies, since the production of biomass crops and the use of RES is linked to agricultural activities. Bio-energy provides multiple benefits since it is closely linked to forestry, food processing, paper and pulp production, building materials, and the energy sector generally. However, the realisation of bio-energy projects is difficult due to long term fuel availability, fuel price variations and reliability of the technology.
Below we provide a description of renewable fuels and an analysis of the conversion technologies and industrial processes involved in electricity and heat generation.
8.2 Renewable Fuels
Renewable fuels include:
• BIOMASS, which is a source of solar energy stored by plants resulting from the process of photosynthesis, in which carbon dioxide is captured and converted into cellulose, hemi-cellulose and lignin; biomass is an organic-non-fossil material of biological origin, which can be used as fuel for electricity and heat generation;
• MUNICIPAL WASTE, i.e. waste produced by the domestic, commercial and public services sectors, which is incinerated in special installations for electricity and/or heat generation, or landfilled. It includes Municipal Solid Waste (MSW), which is the residual waste from domestic and commercial activities, and ), which is fuel produced by shredding and selecting MSW. RDF consists largely of the organic components of MSW, such as plastics, paper and other bio-degradable material.
Waste is a major problem in every developed country; its growth is a sign of inefficiencies and the depletion of the earth’s resources. While waste cannot be eliminated, its environmental impact can be reduced by reducing its growth where possible, and by exploiting it for the production of energy.
• ANIMAL MANURE, i.e. poultry litter and pig and cattle faeces, which can be incinerated to produce heat and electricity.
The term biomass covers materials of biological origin and municipal waste and animal excrement as in the following definition:
‘Biomass’ means non-fossilised and biodegradable organic material originating from plants, animals and micro-organisms. This shall also include products, by-products, residues and waste from agriculture, forestry and related industries as well as non fossilised and biodegradable organic fractions of industrial and municipal wastes. Biomass also includes
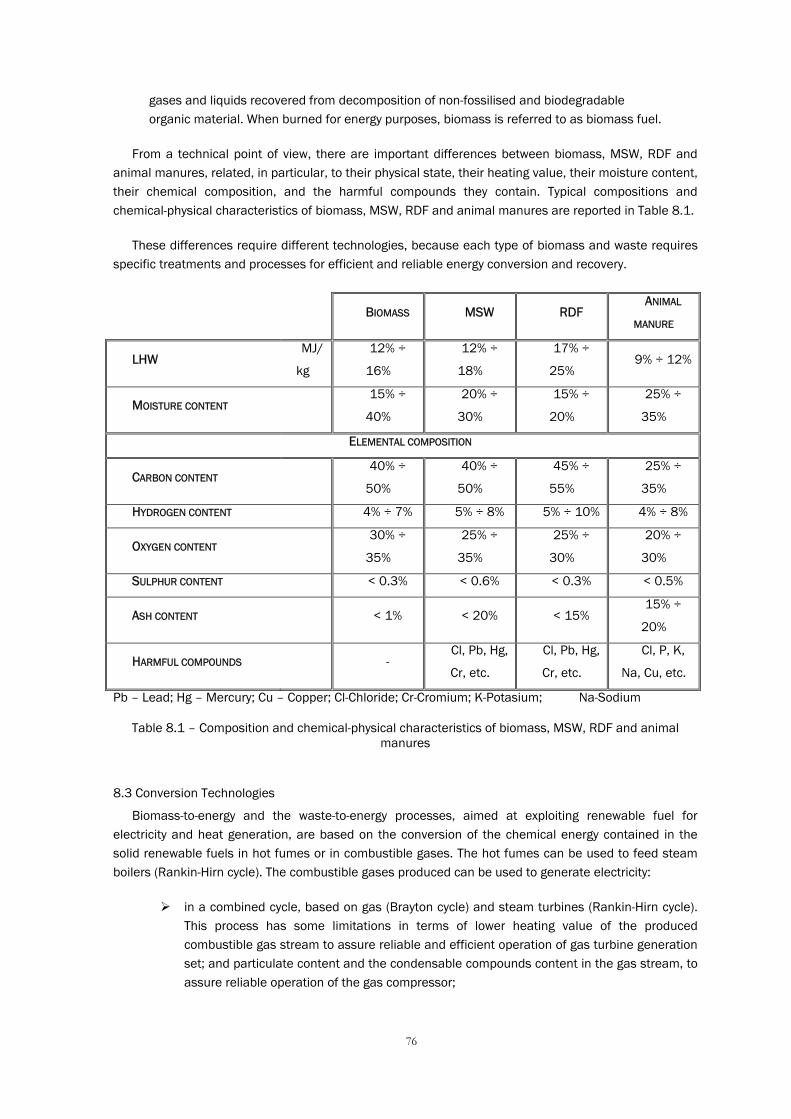
76
gases and liquids recovered from decomposition of non-fossilised and biodegradable organic material. When burned for energy purposes, biomass is referred to as biomass fuel.
From a technical point of view, there are important differences between biomass, MSW, RDF and animal manures, related, in particular, to their physical state, their heating value, their moisture content, their chemical composition, and the harmful compounds they contain. Typical compositions and chemical-physical characteristics of biomass, MSW, RDF and animal manures are reported in Table 8.1.
These differences require different technologies, because each type of biomass and waste requires specific treatments and processes for efficient and reliable energy conversion and recovery.
BIOMASS MSW RDF ANIMAL
MANURE
LHW MJ/
kg
12% ÷
16%
12% ÷
18%
17% ÷
25% 9% ÷ 12%
MOISTURE CONTENT 15% ÷
40%
20% ÷
30%
15% ÷
20%
25% ÷
35%
ELEMENTAL COMPOSITION
CARBON CONTENT 40% ÷
50%
40% ÷
50%
45% ÷
55%
25% ÷
35%
HYDROGEN CONTENT 4% ÷ 7% 5% ÷ 8% 5% ÷ 10% 4% ÷ 8%
OXYGEN CONTENT 30% ÷
35%
25% ÷
35%
25% ÷
30%
20% ÷
30%
SULPHUR CONTENT < 0.3% < 0.6% < 0.3% < 0.5%
ASH CONTENT
< 1% < 20% < 15% 15% ÷
20%
HARMFUL COMPOUNDS
- Cl, Pb, Hg,
Cr, etc.
Cl, Pb, Hg,
Cr, etc.
Cl, P, K,
Na, Cu, etc.
Pb – Lead; Hg – Mercury; Cu – Copper; Cl-Chloride; Cr-Cromium; K-Potasium; Na-Sodium
Table 8.1 – Composition and chemical-physical characteristics of biomass, MSW, RDF and animal manures
8.3 Conversion Technologies
Biomass-to-energy and the waste-to-energy processes, aimed at exploiting renewable fuel for electricity and heat generation, are based on the conversion of the chemical energy contained in the solid renewable fuels in hot fumes or in combustible gases. The hot fumes can be used to feed steam boilers (Rankin-Hirn cycle). The combustible gases produced can be used to generate electricity:
in a combined cycle, based on gas (Brayton cycle) and steam turbines (Rankin-Hirn cycle). This process has some limitations in terms of lower heating value of the produced combustible gas stream to assure reliable and efficient operation of gas turbine generation set; and particulate content and the condensable compounds content in the gas stream, to assure reliable operation of the gas compressor;

77
in a gas engine, where again it is necessary to control the heating value and particulate and condensable compounds contents in the gas stream; however, the exploitation of combustible gas in a gas engine is less critical with respect to use in a gas turbine generating set;
in a combustion chamber, for the production of hot fumes to be used for steam generation (Rankin-Hirn cycle); this process has some limitations in terms of fume temperatures – the combined effects of high temperature and aggressive compounds can cause damage to the equipment.
The technologies for conversion of solid renewable fuels into gaseous fuels or into flue gas at high temperature, are based on a large variety of thermo-chemical and microbial processes.
8.4 Thermo-chemical Processes: Generalities
Thermo-chemical processes for renewable fuels conversion include traditional processes such as combustion, and innovative processes such as gasification and pyrolysis. In general, the thermo-chemical conversion of a solid renewable fuel in a combustible gas stream involves a number of steps:
1. thermal decomposition of solid fuel particles into gas, tar and char; the tar (condensable vapours) is a mixture of water and heavy hydrocarbons, which condense at atmospheric temperature; the char is the solid residue from the process consisting of fixed carbon and heavy ash, originally contained in the solid renewable fuel;
2. thermal cracking of tar to gas;
3. gasification, oxidation or partial oxidation of combustible gas, vapours and char depending on the quantity and nature of the gasification/oxidation agent used.
A schematic presentation of the thermo-chemical processes described above is shown in Figure -1.
Figure 8-1 Schematic presentation of thermo-chemical processes

78
The product composition for a thermo-chemical conversion process depends on:
• the gasification/oxidation agent:
if an inert gas is used, pyrolysis occurs and thermal decomposition and thermal cracking take place; in this case, the process products are a combustible gas stream, tar and char;
if steam, oxygen or air with sub-stoichiometric amounts are used, gasification occurs; the process products are a combustible gas stream and inert ashes;
if oxygen or air with over-stoichiometric amounts are used, combustion occurs; the process products are hot fumes and inert ashes;
• the maximum temperature process;
• the heating rate of solid fuel particles;
• the time residence in the reactor;
• the reactor design.
8.5 Microbial Processes: Generalities
The most important microbial process in applied to renewable fuel exploitation is anaerobic digestion (AD), which leads to the conversion of bio-fuel in a relatively high-methane-content bio-gas of medium energy value.
8.6 Combustion Technology
8.6.1 Combustion Process
Combustion is an exothermic process in which the renewable fuel is oxidised through the combined effects of high temperature and an oxidant, typically air, with over-stoichiometric amounts. The combustion process includes several complex reactions, most of which occur simultaneously, and is usually considered to consist of four stages. For combustion of a single particle of wood, subjected to a specific heating rate (related to the power released from the combustion of other wood particles), the four stages are:
1. when the temperature of the particle increases to 200°C, condensable vapours and gases, some of which are combustible, are released from the particle’s surface; this phase is endothermic;
2. when the temperature rises to the range 200°C-350°C, volatilisation occurs and the majority of condensable vapours and gases are released from the particle’s surface; the rate of volatilisation is directly related to the surface area and hence to the fuel particle size; this phase is endothermic;
79
3. when the temperature of the particle increases to the range 350-500°C, the vapours and the gases released are subject to heterogeneous secondary reactions, cracking and combustion; the cracking reactions are endothermic and the combustion reactions are exothermic;
4. when the temperature rises above 500°C, only fixed carbon and ash remain in the particle and the carbon reacts with oxygen
The products of the combustion process are inert ash and hot fumes, containing principally CO2, H2O and N2 (carbon dioxide, water and nitrogen), which are typically used to generate steam (electricity generation based on the Rankin-Hirn cycle). The temperature of the fumes, usually 850-1,000°C, has to be strictly controlled and limited to a maximum value, which depends on the type of renewable fuel being burned, If this is biomass, the fume temperature can be up to 1,000°C, if it is MSW, RDF or animal manure, the fume temperature is usually limited to 850°C because the combined effects of high temperature and chlorine could damage the boiler’s heat exchange surfaces.
8.6.2 Combustion Reactors
Many combustion reactor configurations have been developed and deployed over time in a bid to achieve high conversion efficiency; high fuel flexibility; low environmental emissions; and high resistance to the aggressive compounds contained in renewable fuel, such as chloride and alkaline metals. Basic combustion reactors include a pile burning furnace, a stoker fired furnace or a fluidised bed furnace.
A description of these reactors can be found in Sections 8.6.2.1, 8.6.2.2 and 8.6.2.3.
In addition, Table 8-2 presents a comparison of combustion reactor technologies.
8.6.2.1 Pile burning furnace
In a pile burning reactor, the biomass is loaded to form piles, and burned, with air fed beneath and above the piles. The advantages of the pile burning furnace are fuel flexibility, since pile reactors can cope with a large variety of fuel, and simple reactor design. The disadvantages are their low conversion efficiency of fuel chemical energy in hot fumes and low efficiency of the steam cycle due to low fume temperature and relatively poor combustion control. The pile furnace concept has not been widely adopted for electricity and heat generation for industrial use.
8.6.2.2 Stoker fired furnace
The principal components of the stoker fired furnace are the feed system and the grate. The biomass feed system puts a layer of fuel on the grate. This fuel layer is relatively thin and more evenly distributed than in a pile burner. There are three types of stoker fired furnaces. The first is the stoker fired furnace with a stationary grate in which the fuel is combusted as it slides down to the grate. This type is not widely used by industry, owing to the difficulty of controlling the combustion process and the risk of fuel avalanching The second type is the stoker fired furnace with a travelling grate, in which the fuel is fed into one side of the grate and burns as the grate transports it to the ash removal system. This type of furnace is largely deployed for renewable fuel treatment because of its better combustion

80
control, high conversion efficiency and low maintenance requirements. Two schemes of stoker fired furnaces with travelling grates are shown in Figure 8-2 and Figure 8-3;
Figure 8-2 Scheme of a stoker fired furnace with travelling grate (1)
Figure 8-3 Scheme of a stoker fired furnace with travelling grate (2)
Third, there is the stoker fired furnace with a vibrating grate, in which the fuel is fed across the whole grate, which vibrates to spread the fuel evenly. This type is depicted in Figure 8-4.

81
Figure 8-4 Scheme of a stoker fired furnace with vibrating grate
8.6.2.3 Fluidised bed furnace
In a fluidised bed furnace, small particles of fuel are fed in and the speed of the combustion air flow is so high that the fuel becomes a boiling mass. Fluidised bed reactors usually have relatively high conversion efficiency and are relatively flexible in terms of fuel quality. There are two main types of fluidised bed furnaces. The bubbling fluidised bed (BFB) furnace in which small particles of biomass remain in suspension in the reactor in the flow of air and gas, and the circulating fluidised bed (CFB) furnace, in which small particles of biomass are carried away from the reactor by the gas stream and re-circulated from the bottom of the reactor after separation in a cyclone.
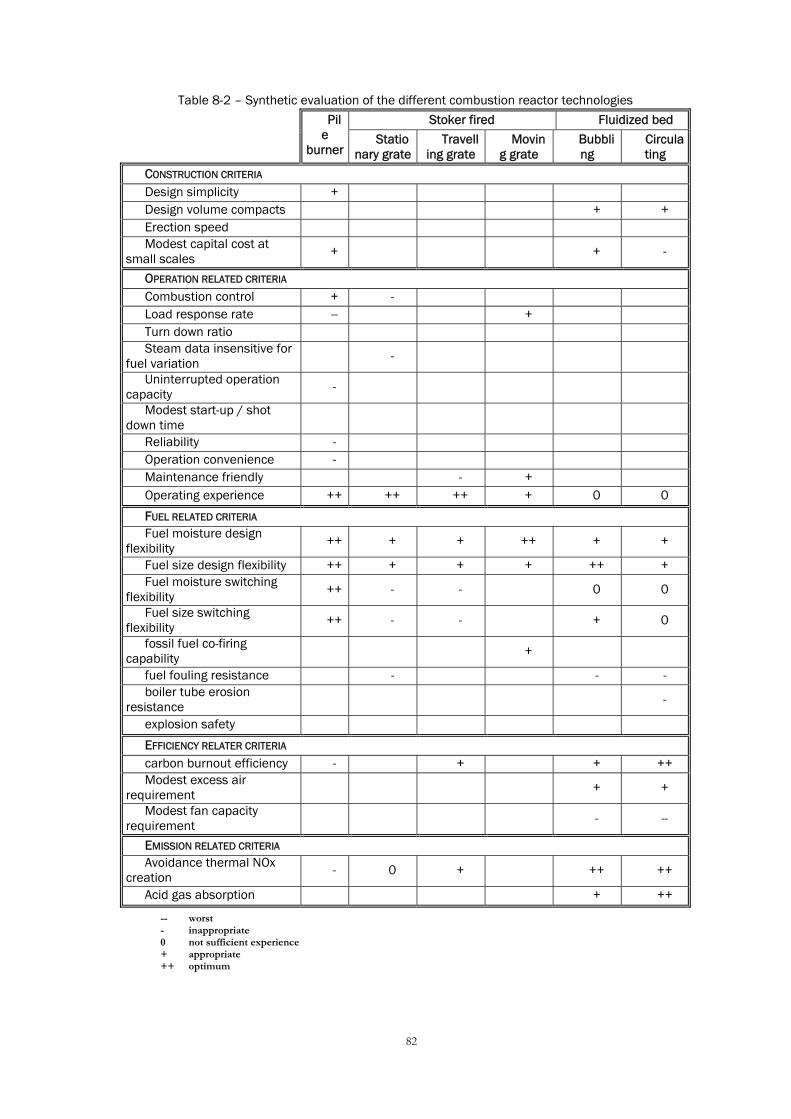
82
Table 8-2 – Synthetic evaluation of the different combustion reactor technologies
Stoker fired Fluidized bed
Pile
burner Statio
nary grate Travell
ing grate Movin
g grate Bubbling
Circulating
CONSTRUCTION CRITERIA Design simplicity + Design volume compacts + + Erection speed Modest capital cost at
small scales + + -
OPERATION RELATED CRITERIA Combustion control + - Load response rate -- + Turn down ratio Steam data insensitive for
fuel variation -
Uninterrupted operation capacity -
Modest start-up / shot down time
Reliability - Operation convenience - Maintenance friendly - + Operating experience ++ ++ ++ + 0 0
FUEL RELATED CRITERIA Fuel moisture design
flexibility ++ + + ++ + +
Fuel size design flexibility ++ + + + ++ + Fuel moisture switching
flexibility ++ - - 0 0
Fuel size switching flexibility ++ - - + 0
fossil fuel co-firing capability +
fuel fouling resistance - - - boiler tube erosion
resistance -
explosion safety
EFFICIENCY RELATER CRITERIA carbon burnout efficiency - + + ++ Modest excess air
requirement + +
Modest fan capacity requirement - --
EMISSION RELATED CRITERIA Avoidance thermal NOx
creation - 0 + ++ ++
Acid gas absorption + ++
-- worst - inappropriate 0 not sufficient experience + appropriate ++ optimum
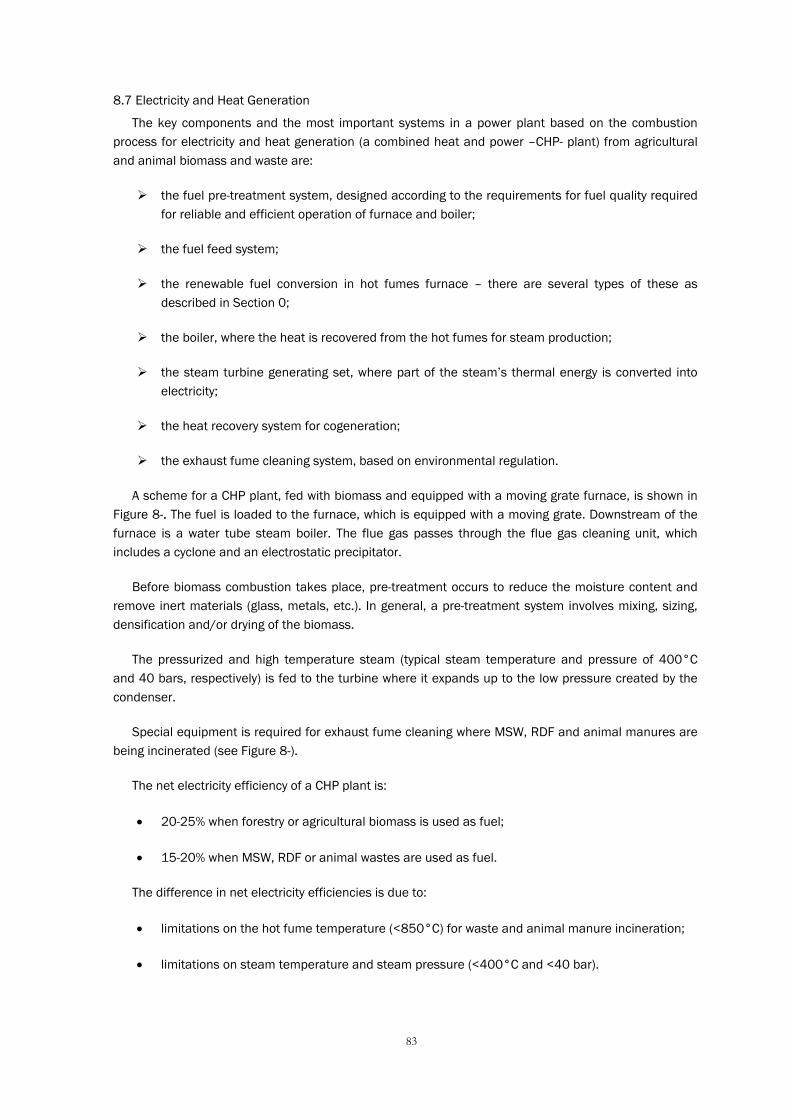
83
8.7 Electricity and Heat Generation
The key components and the most important systems in a power plant based on the combustion process for electricity and heat generation (a combined heat and power –CHP- plant) from agricultural and animal biomass and waste are:
the fuel pre-treatment system, designed according to the requirements for fuel quality required for reliable and efficient operation of furnace and boiler;
the fuel feed system;
the renewable fuel conversion in hot fumes furnace – there are several types of these as described in Section 0;
the boiler, where the heat is recovered from the hot fumes for steam production;
the steam turbine generating set, where part of the steam’s thermal energy is converted into electricity;
the heat recovery system for cogeneration;
the exhaust fume cleaning system, based on environmental regulation.
A scheme for a CHP plant, fed with biomass and equipped with a moving grate furnace, is shown in Figure 8-. The fuel is loaded to the furnace, which is equipped with a moving grate. Downstream of the furnace is a water tube steam boiler. The flue gas passes through the flue gas cleaning unit, which includes a cyclone and an electrostatic precipitator.
Before biomass combustion takes place, pre-treatment occurs to reduce the moisture content and remove inert materials (glass, metals, etc.). In general, a pre-treatment system involves mixing, sizing, densification and/or drying of the biomass.
The pressurized and high temperature steam (typical steam temperature and pressure of 400°C and 40 bars, respectively) is fed to the turbine where it expands up to the low pressure created by the condenser.
Special equipment is required for exhaust fume cleaning where MSW, RDF and animal manures are being incinerated (see Figure 8-).
The net electricity efficiency of a CHP plant is:
• 20-25% when forestry or agricultural biomass is used as fuel;
• 15-20% when MSW, RDF or animal wastes are used as fuel.
The difference in net electricity efficiencies is due to:
• limitations on the hot fume temperature (<850°C) for waste and animal manure incineration;
• limitations on steam temperature and steam pressure (<400°C and <40 bar).

84
These limitations are necessary to prevent furnace and boiler damage from chlorine and alkaline metals.
An important aspect of the Rankine-Hirn steam cycle is related to steam enthalpy (pressure and temperature). High pressure and high temperature values, which imply high cycle efficiency, require the adoption of specific and expensive materials to avoid damage to the heat exchange surfaces. Steam systems, therefore, are affected by considerable economies of scale, which limit the efficiency of biomass-to-energy and waste-to-energy plants.
Installation costs for a CHP plant based on combustion technologies depend on the fuel burned:
• for forestry biomass, installation costs are €1,000-€2,000/kWe;
• for MSW, RDF or animal manures, installation costs are €1,500-€3,000/kWe;.
which is due to the lower electricity efficiency of the power plant treating the waste; the expensive materials needed for furnace and boiler construction; and the requirement for exhaust fume cleaning system equipment.
The costs of electricity produced in a CHP plant based on combustion conversion varies between €cents2.8-10/kWhe.
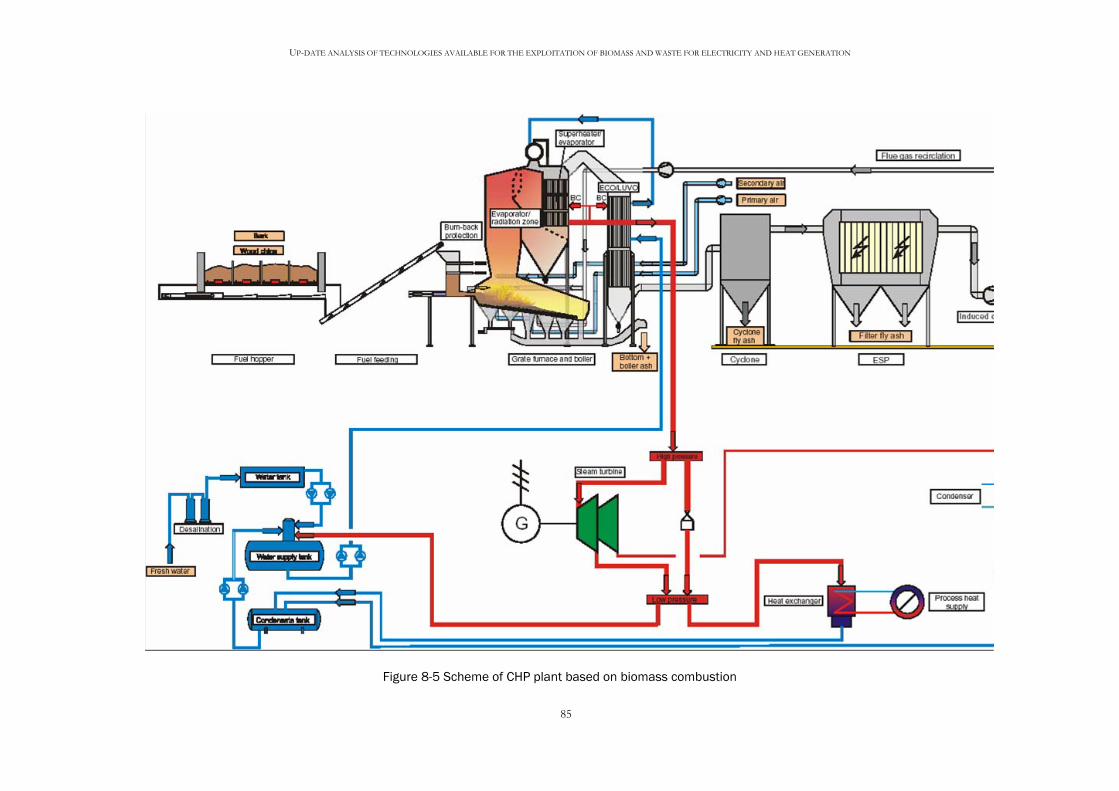
UP-DATE ANALYSIS OF TECHNOLOGIES AVAILABLE FOR THE EXPLOITATION OF BIOMASS AND WASTE FOR ELECTRICITY AND HEAT GENERATION
85
Figure 8-5 Scheme of CHP plant based on biomass combustion
UP-DATE ANALYSIS OF TECHNOLOGIES AVAILABLE FOR THE EXPLOITATION OF BIOMASS AND WASTE FOR ELECTRICITY AND HEAT GENERATION
86
Figure 8-6 Scheme of CHP plant based on waste combustion
UP-DATE ANALYSIS OF TECHNOLOGIES AVAILABLE FOR THE EXPLOITATION OF BIOMASS AND WASTE FOR ELECTRICITY AND HEAT
87
99 II NN NN OO VV AA TT II VV EE TT EE CC HH NN OO LL OO GG II EE SS
Innovative technologies, such as pyrolysis and gasification, are widely used for biomass-to-energy and waste-to-energy industrial processes because of their advantages over the combustion process. These advantages include:
• higher electrical efficiency: the application of gasification and pyrolysis processes enables the conversion of solid fuel into a combustible gas, which can be used in a combined cycle, with the obvious advantage of increased cycle efficiency;
• lower installation costs: the installation costs of power plants, based on gasification and pyrolysis processes, are lower than those of a combustion power plant because the gas cleaning systems are smaller and there is no need for expensive materials to reduce the risks of boiler damage.
9.1 Pyrolysis Technology
9.1.1 Pyrolysis Process
Pyrolysis is an endothermic process that occurs in an inert environment (in the absence of oxygen) and consists of thermal degradation of solid fuel for the production of:
• PYROGAS, which is a combustible gas principally consisting of hydrogen, carbon monoxide, carbon dioxide, methane, ethane, ethylene and unsaturated hydrocarbons;
• CHAR, which is a combustible powder that is nearly pure carbon with some inert material in the feedstock;
• TAR, which is a mixture of liquid hydrocarbons composed of complex organic substances such as ketones and saturated hydrocarbons.
For a specific renewable solid fuel, pyrogas yield and the pyrogas heating value (depending on pyrogas chemical composition), tar yield and tar heating value, char yield and char heating value depend on the temperature of the pyrolysis process and the length of time the fuel is in the pyrolyser. Pyrolysis can be a slow or fast process.
9.1.1.1 Slow Pyrolysis
Slow pyrolysis takes place at temperatures of 450-600°C and requires a residence time in the pyrolysis reactor of about 1 hour. Slow pyrolysis is used for the production of pyrogas that can be used in a combined power plant (gas turbine + steam turbine). The pyrogas has to be treated before electricity generation to prevent compressor damage. This treatment consists of pyrogas cooling and tar separation.
Many recent industrial applications, for electric energy production from forestry biomass and waste, use slow pyrolysis as the conversion process.
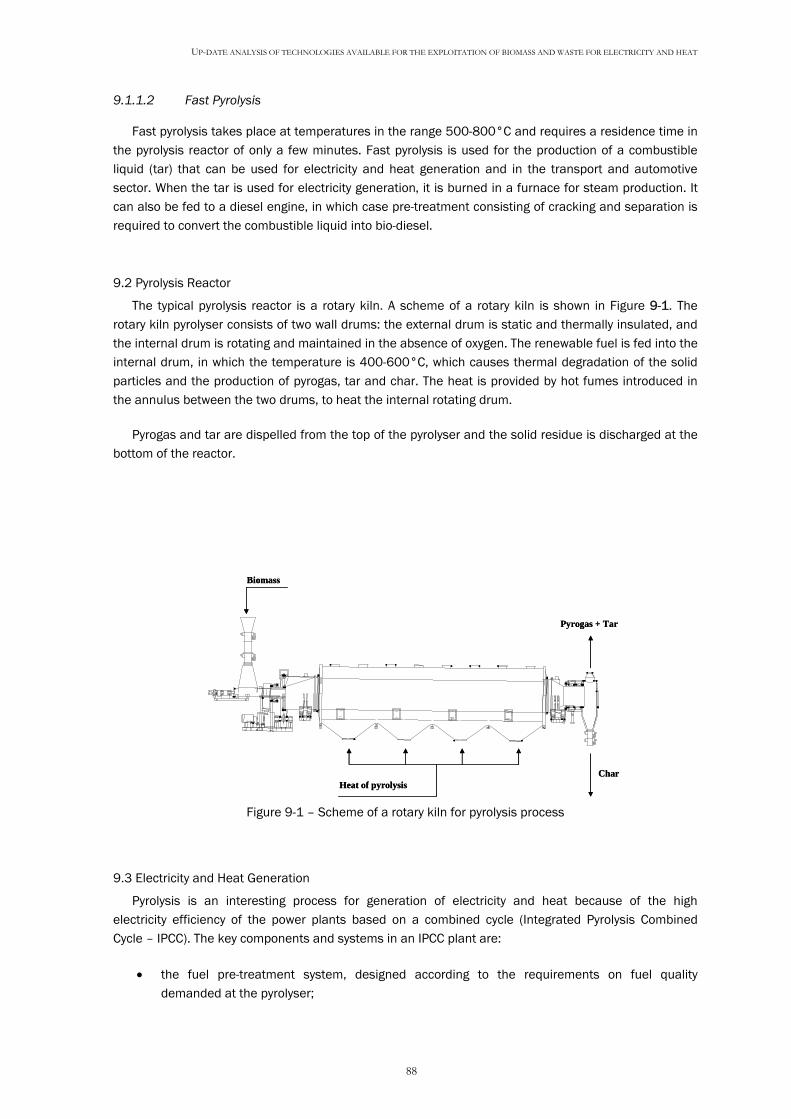
UP-DATE ANALYSIS OF TECHNOLOGIES AVAILABLE FOR THE EXPLOITATION OF BIOMASS AND WASTE FOR ELECTRICITY AND HEAT
88
9.1.1.2 Fast Pyrolysis
Fast pyrolysis takes place at temperatures in the range 500-800°C and requires a residence time in the pyrolysis reactor of only a few minutes. Fast pyrolysis is used for the production of a combustible liquid (tar) that can be used for electricity and heat generation and in the transport and automotive sector. When the tar is used for electricity generation, it is burned in a furnace for steam production. It can also be fed to a diesel engine, in which case pre-treatment consisting of cracking and separation is required to convert the combustible liquid into bio-diesel.
9.2 Pyrolysis Reactor
The typical pyrolysis reactor is a rotary kiln. A scheme of a rotary kiln is shown in Figure 9-1. The rotary kiln pyrolyser consists of two wall drums: the external drum is static and thermally insulated, and the internal drum is rotating and maintained in the absence of oxygen. The renewable fuel is fed into the internal drum, in which the temperature is 400-600°C, which causes thermal degradation of the solid particles and the production of pyrogas, tar and char. The heat is provided by hot fumes introduced in the annulus between the two drums, to heat the internal rotating drum.
Pyrogas and tar are dispelled from the top of the pyrolyser and the solid residue is discharged at the bottom of the reactor.
Biomass
Heat of pyrolysis
Pyrogas + Tar
Char
Biomass
Heat of pyrolysis
Pyrogas + Tar
Char
Figure 9-1 – Scheme of a rotary kiln for pyrolysis process
9.3 Electricity and Heat Generation
Pyrolysis is an interesting process for generation of electricity and heat because of the high electricity efficiency of the power plants based on a combined cycle (Integrated Pyrolysis Combined Cycle – IPCC). The key components and systems in an IPCC plant are:
• the fuel pre-treatment system, designed according to the requirements on fuel quality demanded at the pyrolyser;
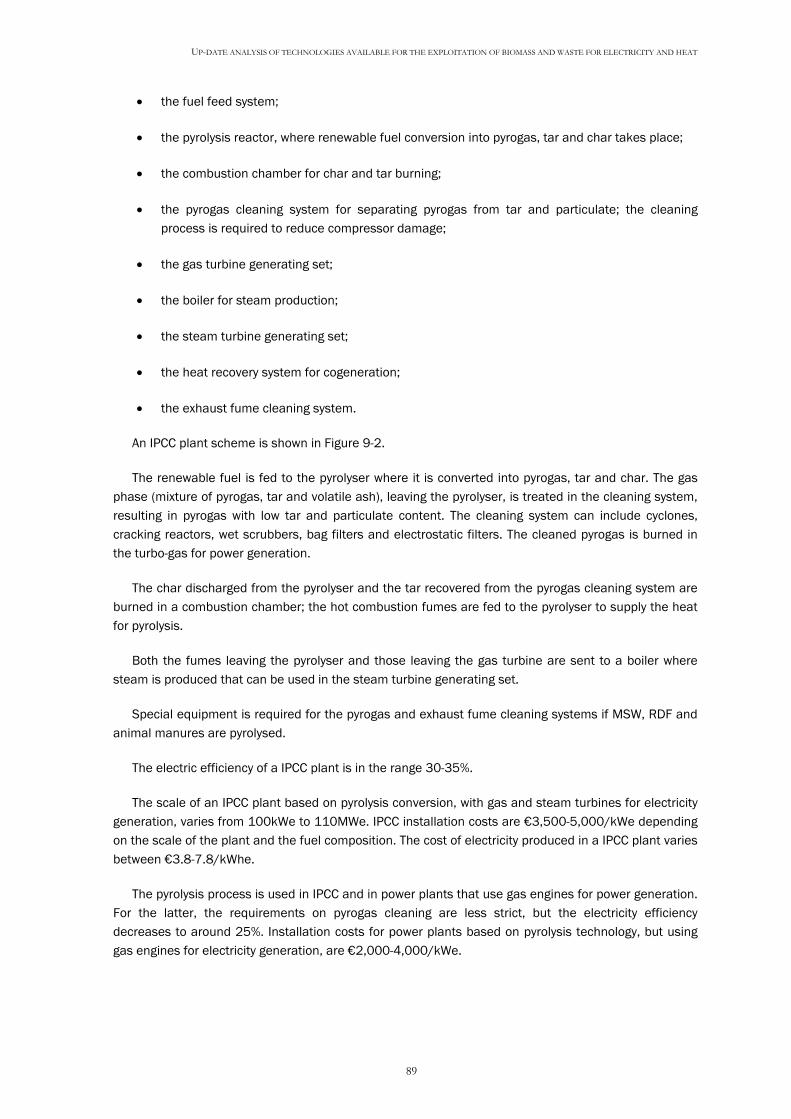
UP-DATE ANALYSIS OF TECHNOLOGIES AVAILABLE FOR THE EXPLOITATION OF BIOMASS AND WASTE FOR ELECTRICITY AND HEAT
89
• the fuel feed system;
• the pyrolysis reactor, where renewable fuel conversion into pyrogas, tar and char takes place;
• the combustion chamber for char and tar burning;
• the pyrogas cleaning system for separating pyrogas from tar and particulate; the cleaning process is required to reduce compressor damage;
• the gas turbine generating set;
• the boiler for steam production;
• the steam turbine generating set;
• the heat recovery system for cogeneration;
• the exhaust fume cleaning system.
An IPCC plant scheme is shown in Figure 9-2.
The renewable fuel is fed to the pyrolyser where it is converted into pyrogas, tar and char. The gas phase (mixture of pyrogas, tar and volatile ash), leaving the pyrolyser, is treated in the cleaning system, resulting in pyrogas with low tar and particulate content. The cleaning system can include cyclones, cracking reactors, wet scrubbers, bag filters and electrostatic filters. The cleaned pyrogas is burned in the turbo-gas for power generation.
The char discharged from the pyrolyser and the tar recovered from the pyrogas cleaning system are burned in a combustion chamber; the hot combustion fumes are fed to the pyrolyser to supply the heat for pyrolysis.
Both the fumes leaving the pyrolyser and those leaving the gas turbine are sent to a boiler where steam is produced that can be used in the steam turbine generating set.
Special equipment is required for the pyrogas and exhaust fume cleaning systems if MSW, RDF and animal manures are pyrolysed.
The electric efficiency of a IPCC plant is in the range 30-35%.
The scale of an IPCC plant based on pyrolysis conversion, with gas and steam turbines for electricity generation, varies from 100kWe to 110MWe. IPCC installation costs are €3,500-5,000/kWe depending on the scale of the plant and the fuel composition. The cost of electricity produced in a IPCC plant varies between €3.8-7.8/kWhe.
The pyrolysis process is used in IPCC and in power plants that use gas engines for power generation. For the latter, the requirements on pyrogas cleaning are less strict, but the electricity efficiency decreases to around 25%. Installation costs for power plants based on pyrolysis technology, but using gas engines for electricity generation, are €2,000-4,000/kWe.
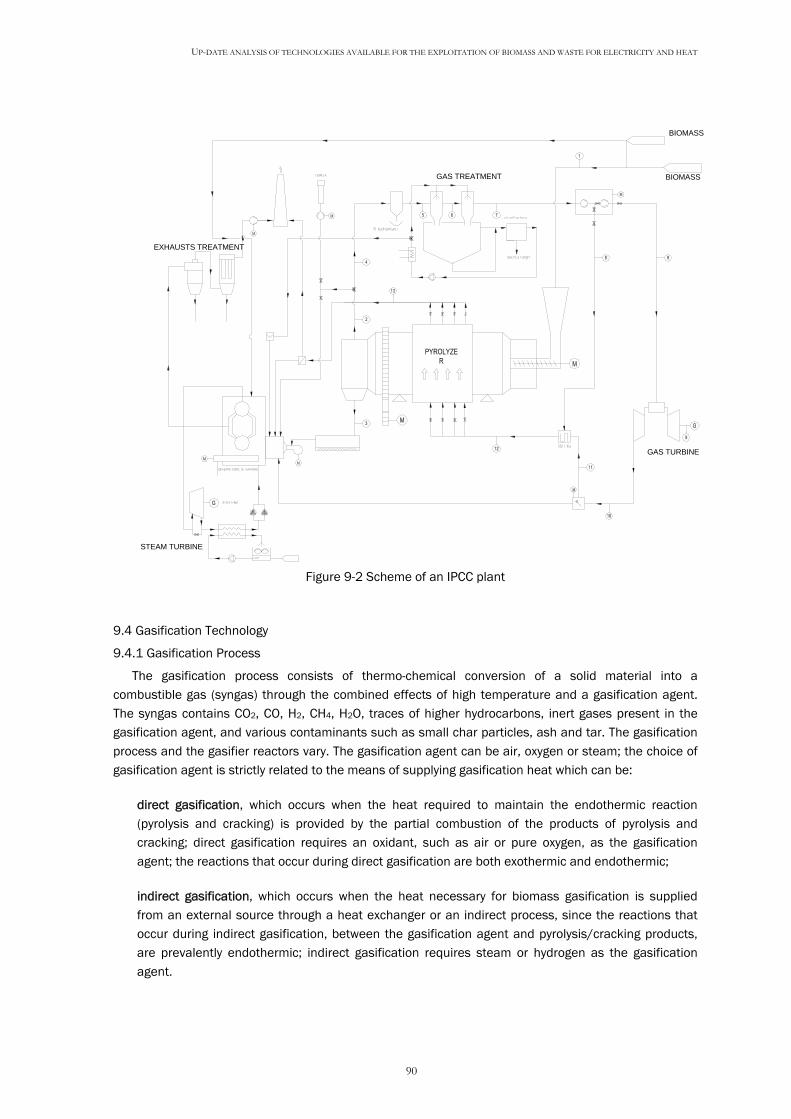
UP-DATE ANALYSIS OF TECHNOLOGIES AVAILABLE FOR THE EXPLOITATION OF BIOMASS AND WASTE FOR ELECTRICITY AND HEAT
90
GAS TREATMENT
BIOMASS
GAS TURBINE
STEAM TURBINE
EXHAUSTS TREATMENT
BIOMASS
Figure 9-2 Scheme of an IPCC plant
9.4 Gasification Technology
9.4.1 Gasification Process
The gasification process consists of thermo-chemical conversion of a solid material into a combustible gas (syngas) through the combined effects of high temperature and a gasification agent. The syngas contains CO2, CO, H2, CH4, H2O, traces of higher hydrocarbons, inert gases present in the gasification agent, and various contaminants such as small char particles, ash and tar. The gasification process and the gasifier reactors vary. The gasification agent can be air, oxygen or steam; the choice of gasification agent is strictly related to the means of supplying gasification heat which can be:
direct gasification, which occurs when the heat required to maintain the endothermic reaction (pyrolysis and cracking) is provided by the partial combustion of the products of pyrolysis and cracking; direct gasification requires an oxidant, such as air or pure oxygen, as the gasification agent; the reactions that occur during direct gasification are both exothermic and endothermic;
indirect gasification, which occurs when the heat necessary for biomass gasification is supplied from an external source through a heat exchanger or an indirect process, since the reactions that occur during indirect gasification, between the gasification agent and pyrolysis/cracking products, are prevalently endothermic; indirect gasification requires steam or hydrogen as the gasification agent.
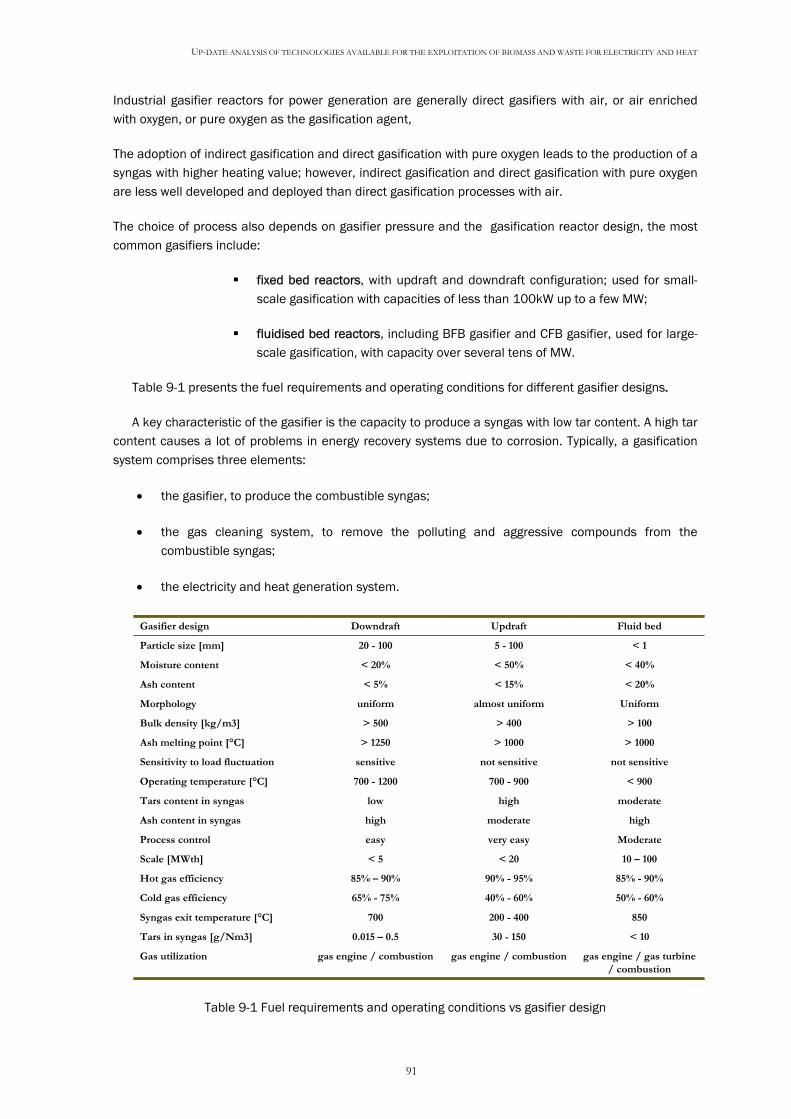
UP-DATE ANALYSIS OF TECHNOLOGIES AVAILABLE FOR THE EXPLOITATION OF BIOMASS AND WASTE FOR ELECTRICITY AND HEAT
91
Industrial gasifier reactors for power generation are generally direct gasifiers with air, or air enriched with oxygen, or pure oxygen as the gasification agent,
The adoption of indirect gasification and direct gasification with pure oxygen leads to the production of a syngas with higher heating value; however, indirect gasification and direct gasification with pure oxygen are less well developed and deployed than direct gasification processes with air.
The choice of process also depends on gasifier pressure and the gasification reactor design, the most common gasifiers include:
fixed bed reactors, with updraft and downdraft configuration; used for small-scale gasification with capacities of less than 100kW up to a few MW;
fluidised bed reactors, including BFB gasifier and CFB gasifier, used for large-scale gasification, with capacity over several tens of MW.
Table 9-1 presents the fuel requirements and operating conditions for different gasifier designs.
A key characteristic of the gasifier is the capacity to produce a syngas with low tar content. A high tar content causes a lot of problems in energy recovery systems due to corrosion. Typically, a gasification system comprises three elements:
• the gasifier, to produce the combustible syngas;
• the gas cleaning system, to remove the polluting and aggressive compounds from the combustible syngas;
• the electricity and heat generation system.
Gasifier design Downdraft Updraft Fluid bed
Particle size [mm] 20 - 100 5 - 100 < 1
Moisture content < 20% < 50% < 40%
Ash content < 5% < 15% < 20%
Morphology uniform almost uniform Uniform
Bulk density [kg/m3] > 500 > 400 > 100
Ash melting point [°C] > 1250 > 1000 > 1000
Sensitivity to load fluctuation sensitive not sensitive not sensitive
Operating temperature [°C] 700 - 1200 700 - 900 < 900
Tars content in syngas low high moderate
Ash content in syngas high moderate high
Process control easy very easy Moderate
Scale [MWth] < 5 < 20 10 – 100
Hot gas efficiency 85% – 90% 90% - 95% 85% - 90%
Cold gas efficiency 65% - 75% 40% - 60% 50% - 60%
Syngas exit temperature [°C] 700 200 - 400 850
Tars in syngas [g/Nm3] 0.015 – 0.5 30 - 150 < 10
Gas utilization gas engine / combustion gas engine / combustion gas engine / gas turbine / combustion
Table 9-1 Fuel requirements and operating conditions vs gasifier design
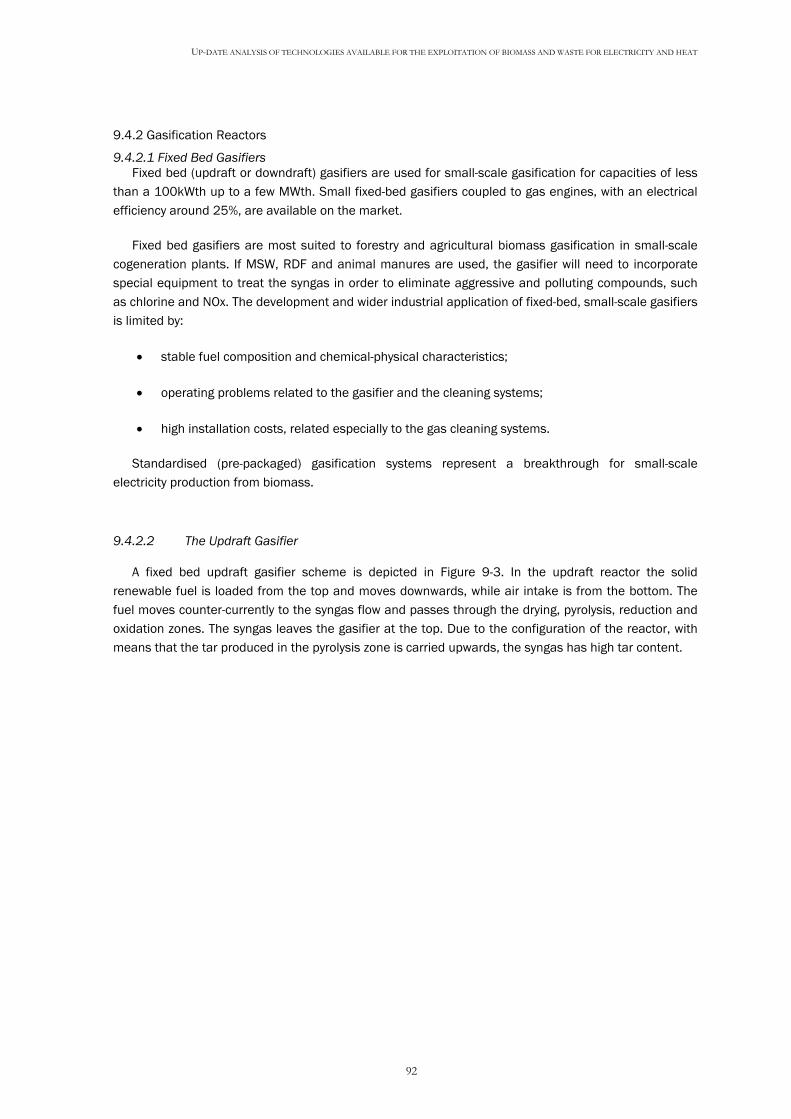
UP-DATE ANALYSIS OF TECHNOLOGIES AVAILABLE FOR THE EXPLOITATION OF BIOMASS AND WASTE FOR ELECTRICITY AND HEAT
92
9.4.2 Gasification Reactors
9.4.2.1 Fixed Bed Gasifiers Fixed bed (updraft or downdraft) gasifiers are used for small-scale gasification for capacities of less
than a 100kWth up to a few MWth. Small fixed-bed gasifiers coupled to gas engines, with an electrical efficiency around 25%, are available on the market.
Fixed bed gasifiers are most suited to forestry and agricultural biomass gasification in small-scale cogeneration plants. If MSW, RDF and animal manures are used, the gasifier will need to incorporate special equipment to treat the syngas in order to eliminate aggressive and polluting compounds, such as chlorine and NOx. The development and wider industrial application of fixed-bed, small-scale gasifiers is limited by:
• stable fuel composition and chemical-physical characteristics;
• operating problems related to the gasifier and the cleaning systems;
• high installation costs, related especially to the gas cleaning systems.
Standardised (pre-packaged) gasification systems represent a breakthrough for small-scale electricity production from biomass.
9.4.2.2 The Updraft Gasifier
A fixed bed updraft gasifier scheme is depicted in Figure 9-3. In the updraft reactor the solid renewable fuel is loaded from the top and moves downwards, while air intake is from the bottom. The fuel moves counter-currently to the syngas flow and passes through the drying, pyrolysis, reduction and oxidation zones. The syngas leaves the gasifier at the top. Due to the configuration of the reactor, with means that the tar produced in the pyrolysis zone is carried upwards, the syngas has high tar content.
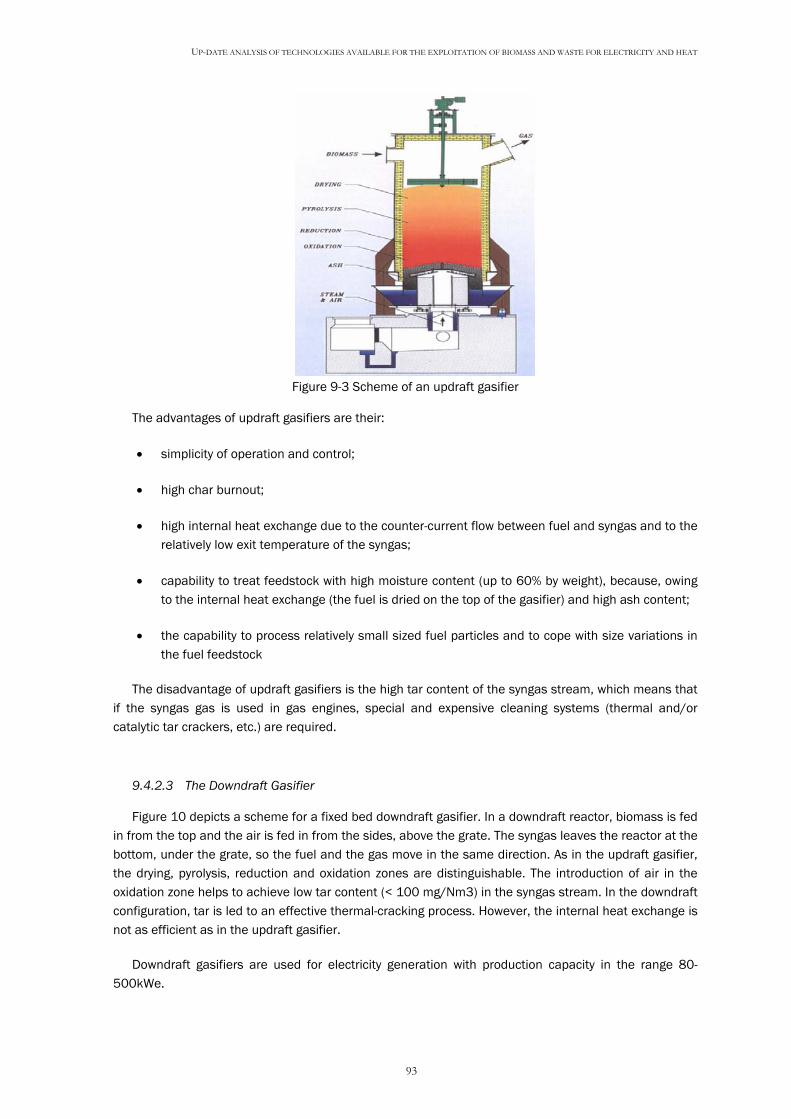
UP-DATE ANALYSIS OF TECHNOLOGIES AVAILABLE FOR THE EXPLOITATION OF BIOMASS AND WASTE FOR ELECTRICITY AND HEAT
93
Figure 9-3 Scheme of an updraft gasifier
The advantages of updraft gasifiers are their:
• simplicity of operation and control;
• high char burnout;
• high internal heat exchange due to the counter-current flow between fuel and syngas and to the relatively low exit temperature of the syngas;
• capability to treat feedstock with high moisture content (up to 60% by weight), because, owing to the internal heat exchange (the fuel is dried on the top of the gasifier) and high ash content;
• the capability to process relatively small sized fuel particles and to cope with size variations in the fuel feedstock
The disadvantage of updraft gasifiers is the high tar content of the syngas stream, which means that if the syngas gas is used in gas engines, special and expensive cleaning systems (thermal and/or catalytic tar crackers, etc.) are required.
9.4.2.3 The Downdraft Gasifier
Figure 10 depicts a scheme for a fixed bed downdraft gasifier. In a downdraft reactor, biomass is fed in from the top and the air is fed in from the sides, above the grate. The syngas leaves the reactor at the bottom, under the grate, so the fuel and the gas move in the same direction. As in the updraft gasifier, the drying, pyrolysis, reduction and oxidation zones are distinguishable. The introduction of air in the oxidation zone helps to achieve low tar content (< 100 mg/Nm3) in the syngas stream. In the downdraft configuration, tar is led to an effective thermal-cracking process. However, the internal heat exchange is not as efficient as in the updraft gasifier.
Downdraft gasifiers are used for electricity generation with production capacity in the range 80-500kWe.
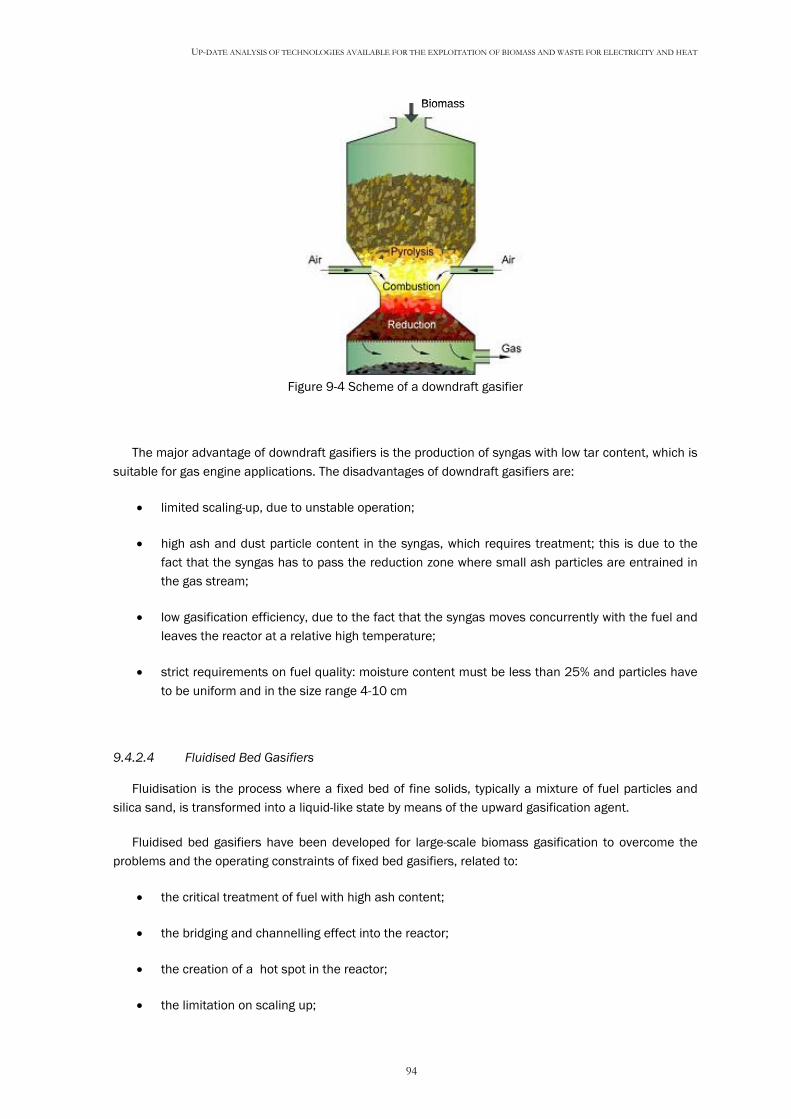
UP-DATE ANALYSIS OF TECHNOLOGIES AVAILABLE FOR THE EXPLOITATION OF BIOMASS AND WASTE FOR ELECTRICITY AND HEAT
94
Figure 9-4 Scheme of a downdraft gasifier
The major advantage of downdraft gasifiers is the production of syngas with low tar content, which is suitable for gas engine applications. The disadvantages of downdraft gasifiers are:
• limited scaling-up, due to unstable operation;
• high ash and dust particle content in the syngas, which requires treatment; this is due to the fact that the syngas has to pass the reduction zone where small ash particles are entrained in the gas stream;
• low gasification efficiency, due to the fact that the syngas moves concurrently with the fuel and leaves the reactor at a relative high temperature;
• strict requirements on fuel quality: moisture content must be less than 25% and particles have to be uniform and in the size range 4-10 cm
9.4.2.4 Fluidised Bed Gasifiers
Fluidisation is the process where a fixed bed of fine solids, typically a mixture of fuel particles and silica sand, is transformed into a liquid-like state by means of the upward gasification agent.
Fluidised bed gasifiers have been developed for large-scale biomass gasification to overcome the problems and the operating constraints of fixed bed gasifiers, related to:
• the critical treatment of fuel with high ash content;
• the bridging and channelling effect into the reactor;
• the creation of a hot spot in the reactor;
• the limitation on scaling up;
BiomassBiomass

UP-DATE ANALYSIS OF TECHNOLOGIES AVAILABLE FOR THE EXPLOITATION OF BIOMASS AND WASTE FOR ELECTRICITY AND HEAT
95
• the plugging problem associated with small particles treatment.
Due to the high level of mixing in the fluid bed, the different zones - drying, pyrolysis, oxidation, reduction – cannot be clearly distinguished.
The major advantages of fluidised bed gasifiers with respect to fixed bed gasifiers are:
• compact design, related to high heat exchange and reaction rates, due to intensive mixing in the bed;
• uniform bed temperature with no hot spots;
• fuel quality flexibility (moisture and ash content);
• ability to deal with fluff and fine grain fuel;
• low ash melting due to the low reaction temperature.
The major disadvantages of fluidised bed gasifiers with respect to fixed bed gasifiers are:
• high tar and dust content in the syngas;
• high content of alkaline metals in the vapour state in syngas;
• incomplete carbon burnout;
• complex operation
Fluidised bed gasifiers can be used for forestry and agricultural biomass, and for RDF. These types of gasifiers are typically for large scale use (over several tens of MWth capacity), combined with gas turbine and steam turbine generating sets. If the gasifier is loaded with RDF, special equipment is needed to treat the syngas in order to eliminate aggressive and polluting compounds, such as chlorine and NOx. They can be BFB or CFB.
9.4.2.5 BFB Gasifiers
Figure 11 shows a typical BFB gasifier. In a BFB reactor, expansion of the fluidised bed, maintained in suspension under the effect of the upward flowing gasification, occurs in the lower part of the gasifier; sand and fuel particles are not released from the reactor.
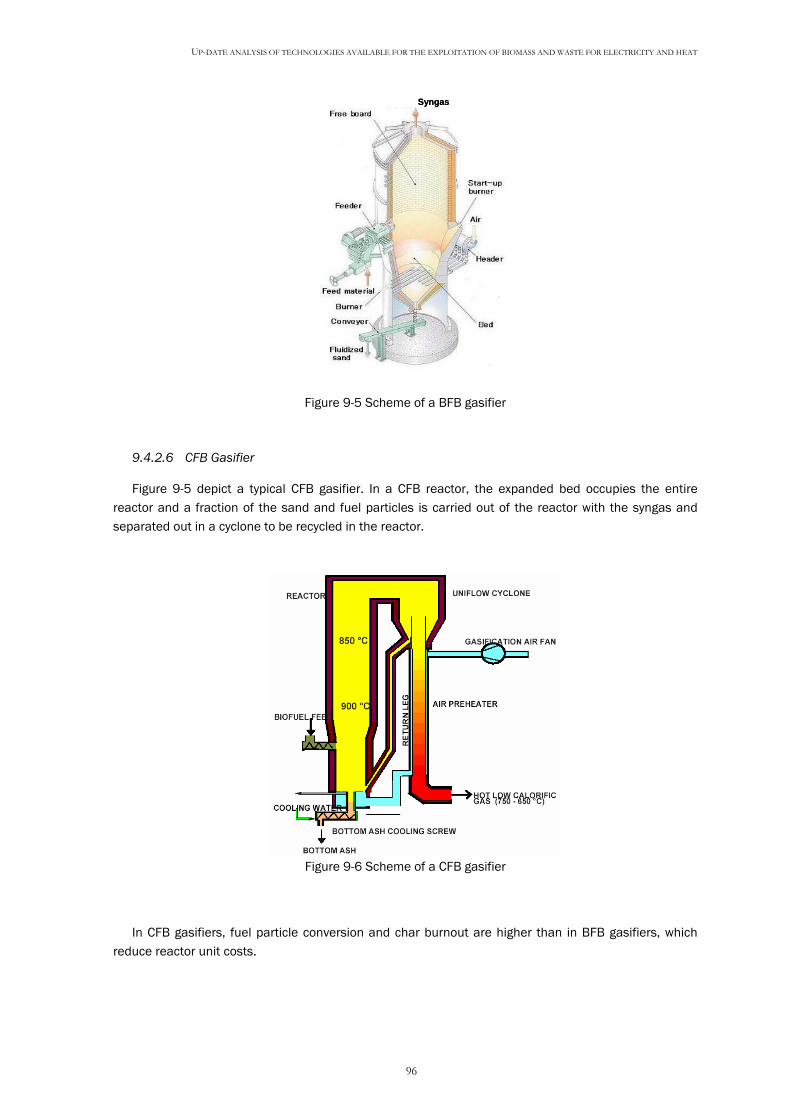
UP-DATE ANALYSIS OF TECHNOLOGIES AVAILABLE FOR THE EXPLOITATION OF BIOMASS AND WASTE FOR ELECTRICITY AND HEAT
96
SyngasSyngas
Figure 9-5 Scheme of a BFB gasifier
9.4.2.6 CFB Gasifier
Figure 9-5 depict a typical CFB gasifier. In a CFB reactor, the expanded bed occupies the entire reactor and a fraction of the sand and fuel particles is carried out of the reactor with the syngas and separated out in a cyclone to be recycled in the reactor.
Figure 9-6 Scheme of a CFB gasifier
In CFB gasifiers, fuel particle conversion and char burnout are higher than in BFB gasifiers, which reduce reactor unit costs.
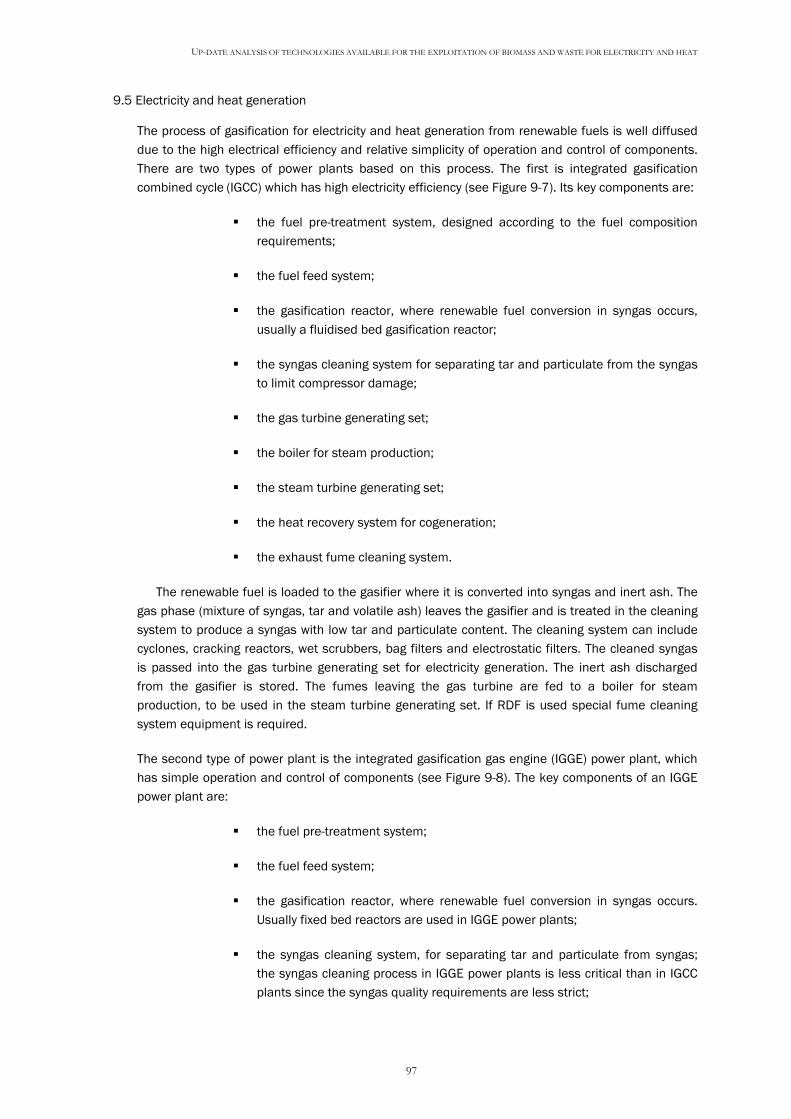
UP-DATE ANALYSIS OF TECHNOLOGIES AVAILABLE FOR THE EXPLOITATION OF BIOMASS AND WASTE FOR ELECTRICITY AND HEAT
97
9.5 Electricity and heat generation
The process of gasification for electricity and heat generation from renewable fuels is well diffused due to the high electrical efficiency and relative simplicity of operation and control of components. There are two types of power plants based on this process. The first is integrated gasification combined cycle (IGCC) which has high electricity efficiency (see Figure 9-7). Its key components are:
the fuel pre-treatment system, designed according to the fuel composition requirements;
the fuel feed system;
the gasification reactor, where renewable fuel conversion in syngas occurs, usually a fluidised bed gasification reactor;
the syngas cleaning system for separating tar and particulate from the syngas to limit compressor damage;
the gas turbine generating set;
the boiler for steam production;
the steam turbine generating set;
the heat recovery system for cogeneration;
the exhaust fume cleaning system.
The renewable fuel is loaded to the gasifier where it is converted into syngas and inert ash. The gas phase (mixture of syngas, tar and volatile ash) leaves the gasifier and is treated in the cleaning system to produce a syngas with low tar and particulate content. The cleaning system can include cyclones, cracking reactors, wet scrubbers, bag filters and electrostatic filters. The cleaned syngas is passed into the gas turbine generating set for electricity generation. The inert ash discharged from the gasifier is stored. The fumes leaving the gas turbine are fed to a boiler for steam production, to be used in the steam turbine generating set. If RDF is used special fume cleaning system equipment is required.
The second type of power plant is the integrated gasification gas engine (IGGE) power plant, which has simple operation and control of components (see Figure 9-8). The key components of an IGGE power plant are:
the fuel pre-treatment system;
the fuel feed system;
the gasification reactor, where renewable fuel conversion in syngas occurs. Usually fixed bed reactors are used in IGGE power plants;
the syngas cleaning system, for separating tar and particulate from syngas; the syngas cleaning process in IGGE power plants is less critical than in IGCC plants since the syngas quality requirements are less strict;
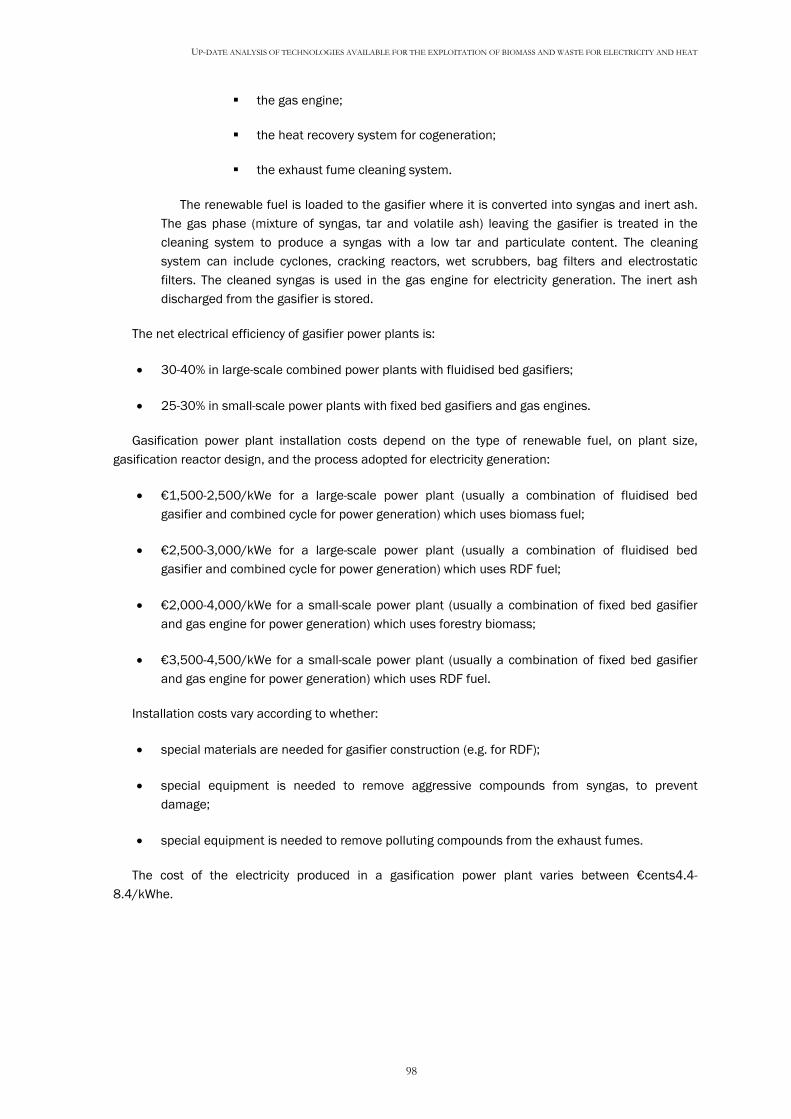
UP-DATE ANALYSIS OF TECHNOLOGIES AVAILABLE FOR THE EXPLOITATION OF BIOMASS AND WASTE FOR ELECTRICITY AND HEAT
98
the gas engine;
the heat recovery system for cogeneration;
the exhaust fume cleaning system.
The renewable fuel is loaded to the gasifier where it is converted into syngas and inert ash. The gas phase (mixture of syngas, tar and volatile ash) leaving the gasifier is treated in the cleaning system to produce a syngas with a low tar and particulate content. The cleaning system can include cyclones, cracking reactors, wet scrubbers, bag filters and electrostatic filters. The cleaned syngas is used in the gas engine for electricity generation. The inert ash discharged from the gasifier is stored.
The net electrical efficiency of gasifier power plants is:
• 30-40% in large-scale combined power plants with fluidised bed gasifiers;
• 25-30% in small-scale power plants with fixed bed gasifiers and gas engines.
Gasification power plant installation costs depend on the type of renewable fuel, on plant size, gasification reactor design, and the process adopted for electricity generation:
• €1,500-2,500/kWe for a large-scale power plant (usually a combination of fluidised bed gasifier and combined cycle for power generation) which uses biomass fuel;
• €2,500-3,000/kWe for a large-scale power plant (usually a combination of fluidised bed gasifier and combined cycle for power generation) which uses RDF fuel;
• €2,000-4,000/kWe for a small-scale power plant (usually a combination of fixed bed gasifier and gas engine for power generation) which uses forestry biomass;
• €3,500-4,500/kWe for a small-scale power plant (usually a combination of fixed bed gasifier and gas engine for power generation) which uses RDF fuel.
Installation costs vary according to whether:
• special materials are needed for gasifier construction (e.g. for RDF);
• special equipment is needed to remove aggressive compounds from syngas, to prevent damage;
• special equipment is needed to remove polluting compounds from the exhaust fumes.
The cost of the electricity produced in a gasification power plant varies between €cents4.4-8.4/kWhe.
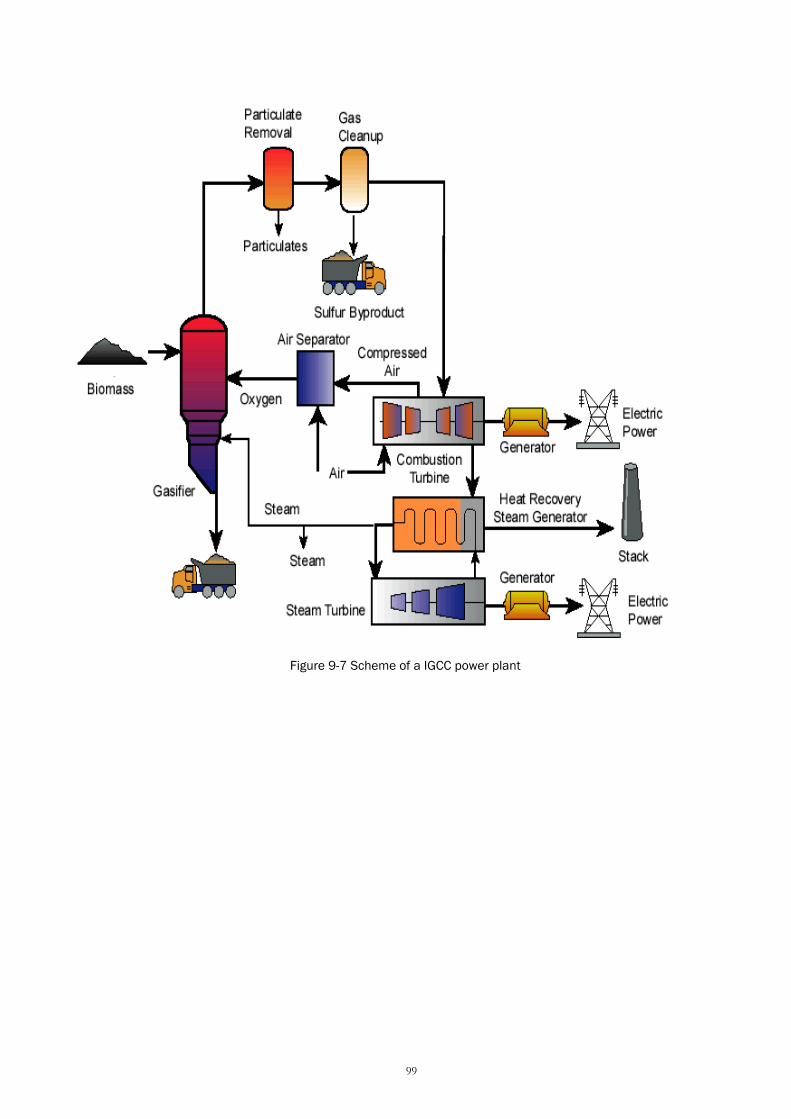
99
Figure 9-7 Scheme of a IGCC power plant
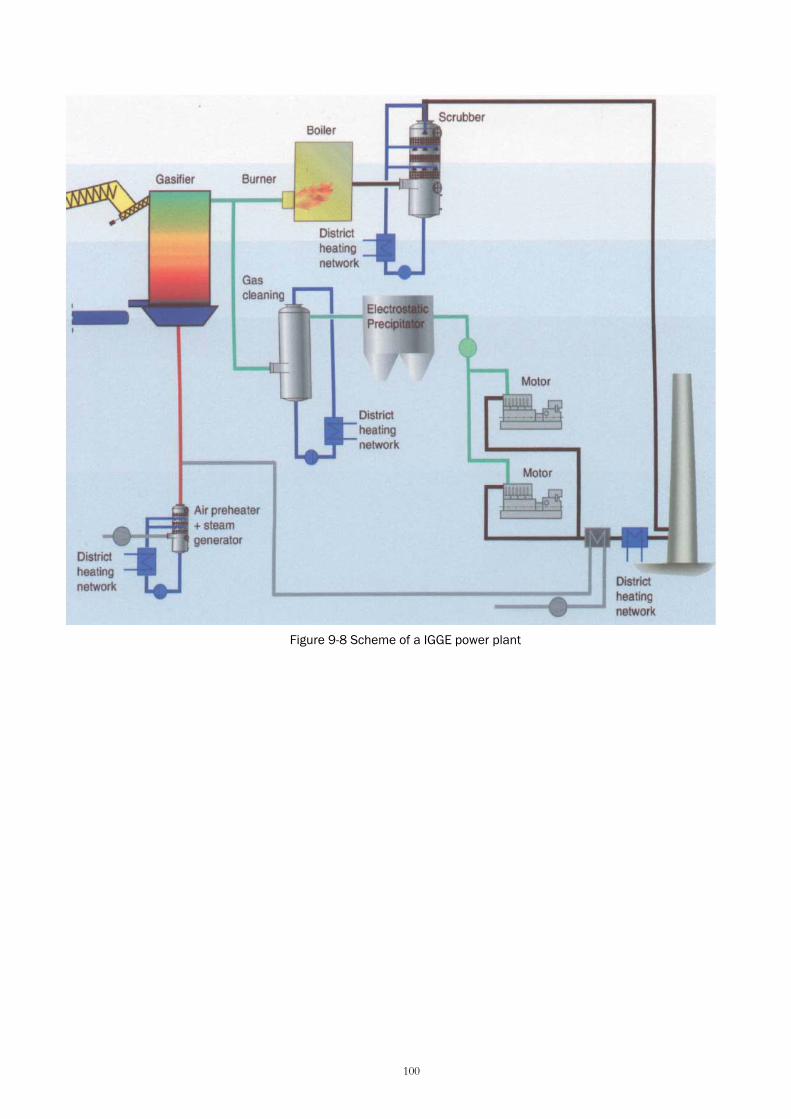
100
Figure 9-8 Scheme of a IGGE power plant
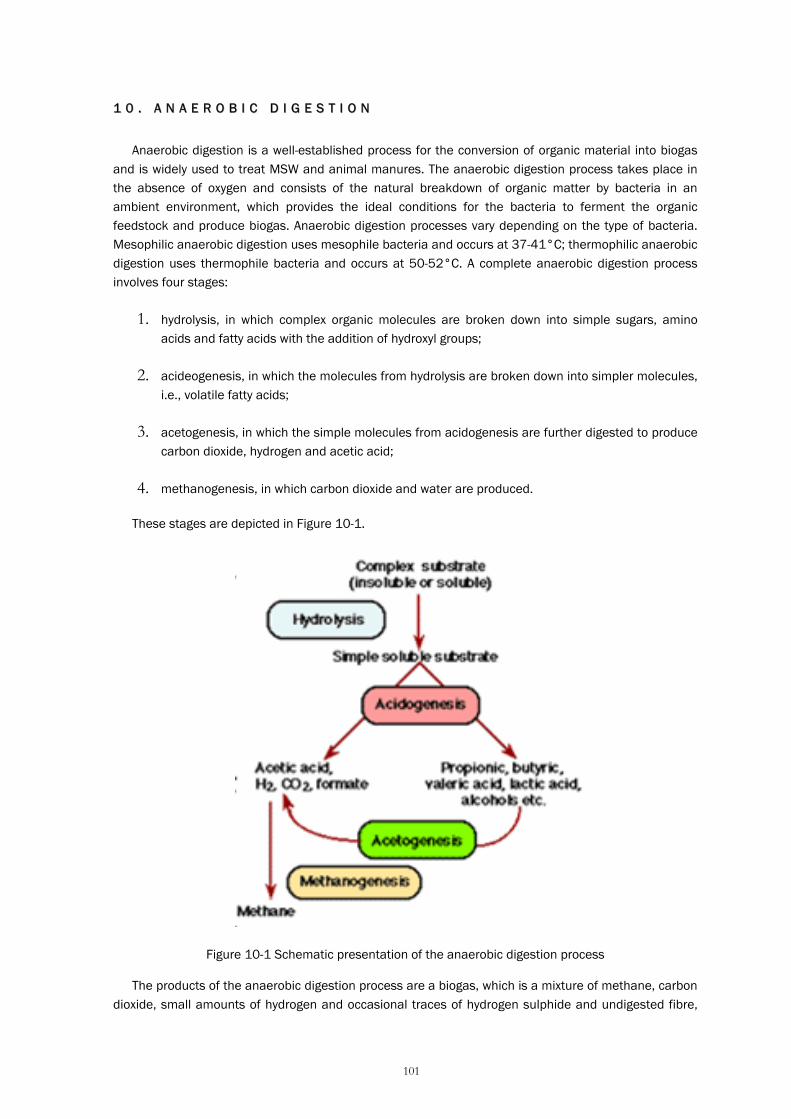
101
11 00 .. AA NN AA EE RR OO BB II CC DD II GG EE SS TT II OO NN
Anaerobic digestion is a well-established process for the conversion of organic material into biogas and is widely used to treat MSW and animal manures. The anaerobic digestion process takes place in the absence of oxygen and consists of the natural breakdown of organic matter by bacteria in an ambient environment, which provides the ideal conditions for the bacteria to ferment the organic feedstock and produce biogas. Anaerobic digestion processes vary depending on the type of bacteria. Mesophilic anaerobic digestion uses mesophile bacteria and occurs at 37-41°C; thermophilic anaerobic digestion uses thermophile bacteria and occurs at 50-52°C. A complete anaerobic digestion process involves four stages:
1. hydrolysis, in which complex organic molecules are broken down into simple sugars, amino acids and fatty acids with the addition of hydroxyl groups;
2. acideogenesis, in which the molecules from hydrolysis are broken down into simpler molecules, i.e., volatile fatty acids;
3. acetogenesis, in which the simple molecules from acidogenesis are further digested to produce carbon dioxide, hydrogen and acetic acid;
4. methanogenesis, in which carbon dioxide and water are produced.
These stages are depicted in Figure 10-1.
Figure 10-1 Schematic presentation of the anaerobic digestion process
The products of the anaerobic digestion process are a biogas, which is a mixture of methane, carbon dioxide, small amounts of hydrogen and occasional traces of hydrogen sulphide and undigested fibre,
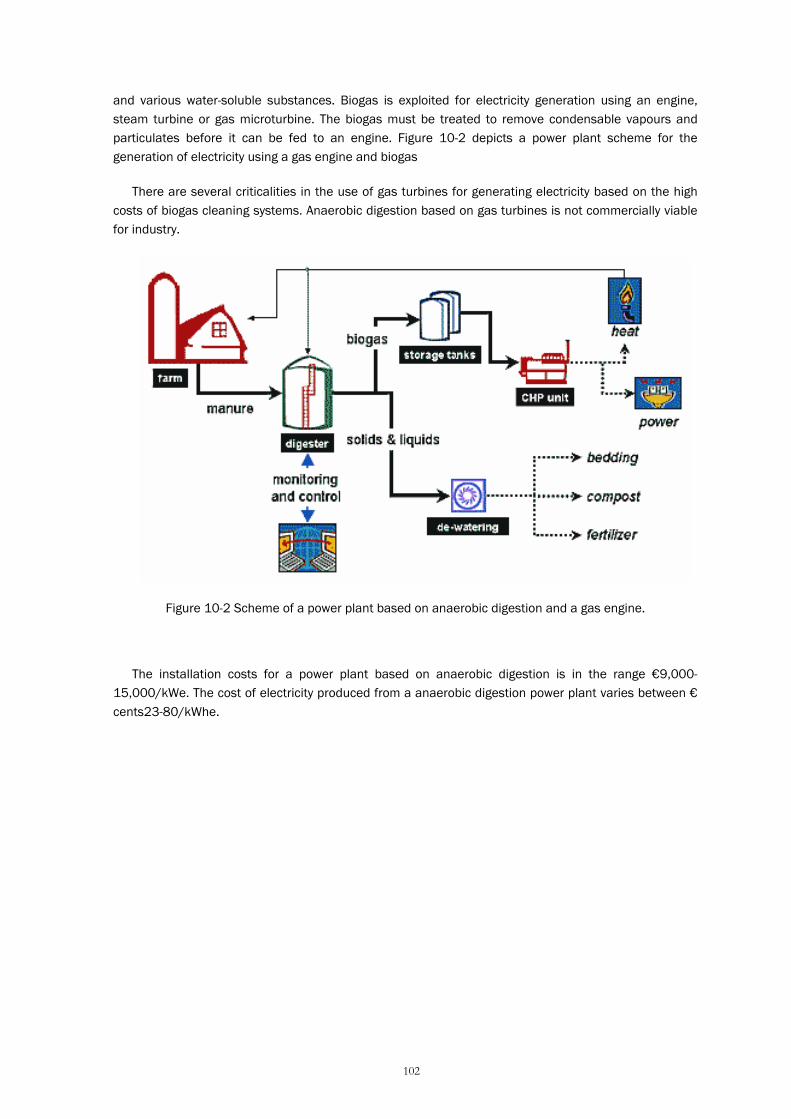
102
and various water-soluble substances. Biogas is exploited for electricity generation using an engine, steam turbine or gas microturbine. The biogas must be treated to remove condensable vapours and particulates before it can be fed to an engine. Figure 10-2 depicts a power plant scheme for the generation of electricity using a gas engine and biogas
There are several criticalities in the use of gas turbines for generating electricity based on the high costs of biogas cleaning systems. Anaerobic digestion based on gas turbines is not commercially viable for industry.
Figure 10-2 Scheme of a power plant based on anaerobic digestion and a gas engine.
The installation costs for a power plant based on anaerobic digestion is in the range €9,000-15,000/kWe. The cost of electricity produced from a anaerobic digestion power plant varies between € cents23-80/kWhe.
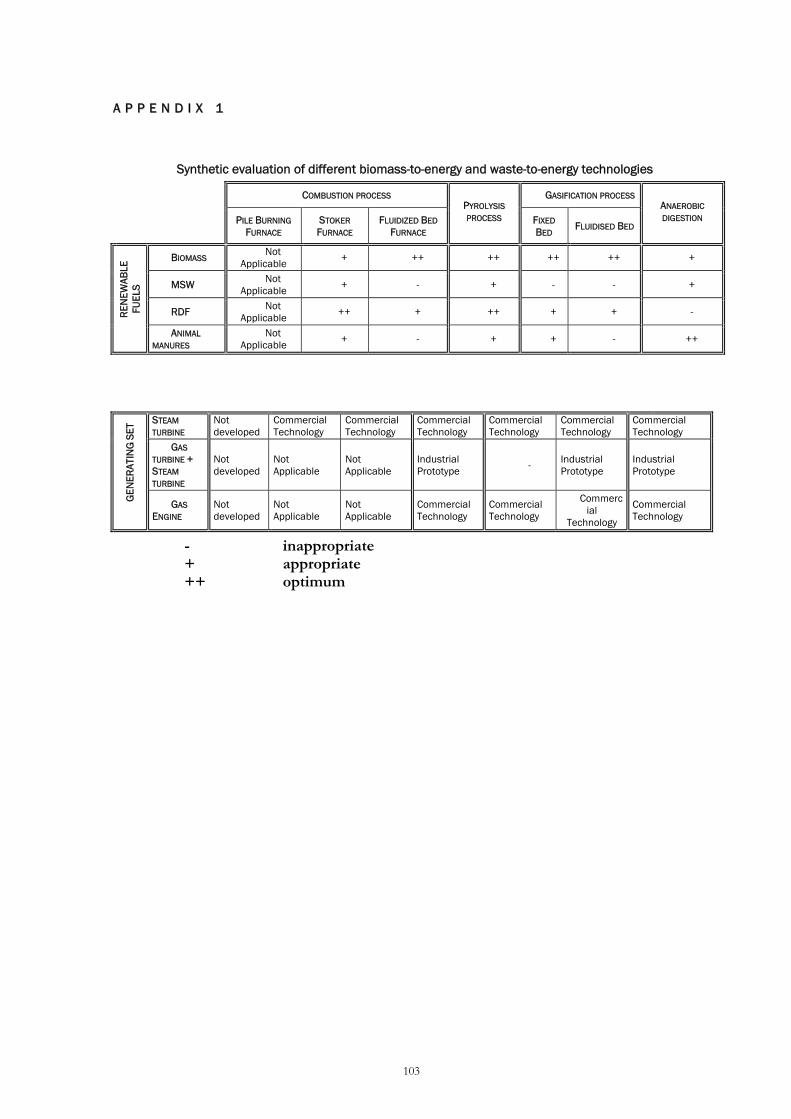
103
AA PP PP EE NN DD II XX 11
Synthetic evaluation of different biomass-to-energy and waste-to-energy technologies
COMBUSTION PROCESS GASIFICATION PROCESS
PILE BURNING FURNACE
STOKER FURNACE
FLUIDIZED BED FURNACE
PYROLYSIS PROCESS FIXED
BED FLUIDISED BED
ANAEROBIC DIGESTION
BIOMASS Not Applicable + ++ ++ ++ ++ +
MSW Not Applicable + - + - - +
RDF Not Applicable ++ + ++ + + - R
ENEW
ABLE
FU
ELS
ANIMAL MANURES
Not Applicable + - + + - ++
STEAM TURBINE
Not developed
Commercial Technology
Commercial Technology
Commercial Technology
Commercial Technology
Commercial Technology
Commercial Technology
GAS TURBINE + STEAM TURBINE
Not developed
Not Applicable
Not Applicable
Industrial Prototype - Industrial
Prototype Industrial Prototype
GEN
ERAT
ING
SET
GAS ENGINE
Not developed
Not Applicable
Not Applicable
Commercial Technology
Commercial Technology
Commercial
Technology
Commercial Technology
- inappropriate + appropriate ++ optimum

104
AA PP PP EE NN DD II XX 22
Synthetic evaluation of conversion processes availability for renewable fuels conversion
COMBUSTION PROCESS GASIFICATION PROCESS
STOKER FURNACE
FLUIDISED BED FURNACE
PYROLYSIS PROCESS STOKER
FURNACE
FLUIDISED BED FURNACE
ANAEROBIC DIGESTION PROCESS
STEAM TURBINE
Biomass MWS RDF Animal
Manures
Biomass RDF
Biomass MSW RDF
Biomass Biomass RDF
MSW Animal
Manures
GAS TURBINE + STEAM TURBINE - -
Biomass MSW RDF
- Biomass RDF
MSW Animal
Manures
GAS ENGINE - - Biomass MSW RDF
Biomass Biomass RDF
MSW Animal
Manures
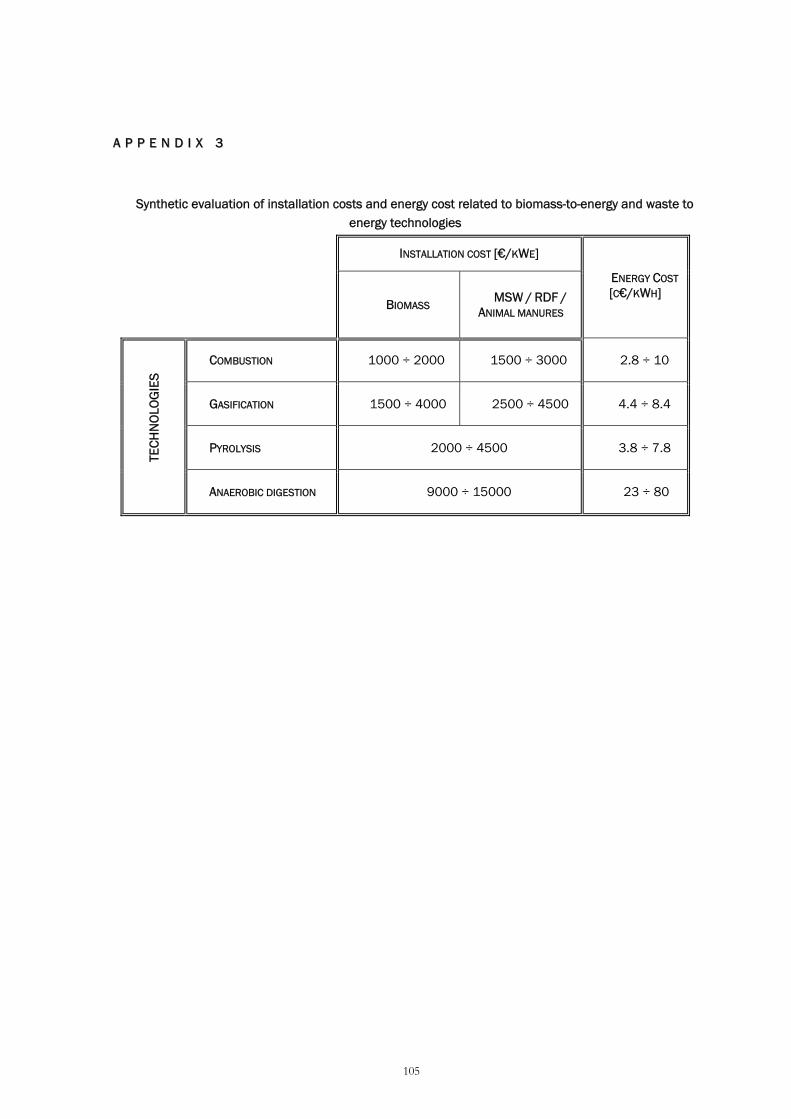
105
AA PP PP EE NN DD II XX 33
Synthetic evaluation of installation costs and energy cost related to biomass-to-energy and waste to
energy technologies
INSTALLATION COST [€/KWE]
BIOMASS MSW / RDF / ANIMAL MANURES
ENERGY COST [C€/KWH]
COMBUSTION 1000 ÷ 2000 1500 ÷ 3000 2.8 ÷ 10
GASIFICATION 1500 ÷ 4000 2500 ÷ 4500 4.4 ÷ 8.4
PYROLYSIS 2000 ÷ 4500 3.8 ÷ 7.8
TECH
NO
LOG
IES
ANAEROBIC DIGESTION 9000 ÷ 15000 23 ÷ 80
106
RR EE FF EE RR EE NN CC EE SS
Bamford, C. H. et al. (1946), THE COMBUSTION OF WOOD, Proc. Cam. Phil. Soc. 42.
Belgiorno, V. et al. (2003), ENERGY FROM GASIFICATION OF SOLID WASTES. Waste Management 23, 1–15.
Bridgwater, A. V. (2002), THE FUTURE FOR BIOMASS PYROLYSIS AND GASIFICATION: STATUS, OPPORTUNITIES AND
POLICIES FOR EUROPE. Aston University. November.
Burke, D. A. (2001), DAIRY WASTE ANAEROBIC DIGESTION HANDBOOK, Environmental Energy Company, June.
Cluster Bioenergie Osterreich Stenum GMBH (2004), SOLID BIOMASS: A TECHNOLOGY PORTRAIT, The internet-platform for innovative technologies in the area of renewable energy sources and energy efficiency.
Demirbas, A. (2005), POTENTIAL APPLICATIONS OF RENEWABLE ENERGY SOURCES, BIOMASS COMBUSTION
PROBLEMS IN BOILER POWER SYSTEMS AND COMBUSTION RELATED ENVIRONMENTAL ISSUES. Progress in Energy and Combustion Science 31.
ENEL (2005), Energy Report
European Commission (2002), EUROPEAN BIO-ENERGY PROJECTS 1999-2002,
Faaij, A. P.C. (2006), BIO-ENERGY IN EUROPE: CHANGING TECHNOLOGY CHOICES. ELSEVIER Energy Policy 34, 322–342
Frandsen, F. J. (2005), UTILIZING BIOMASS AND WASTE FOR POWER PRODUCTION—A DECADE OF CONTRIBUTING TO
THE UNDERSTANDING, INTERPRETATION AND ANALYSIS OF DEPOSITS AND CORROSION PRODUCTS. ELSEVIER Fuel 84.
International Energy Agency Report (2007), RENEWABLES IN GLOBAL ENERGY SUPPLY, January.
International Energy Agency (2005), BIOENERGY PROJECT DEVELOPMENT & BIOMASS SUPPLY,
Jorgensen, K. and A. Van Djik (2004), OVERVIEW OF BIOMASS FOR POWER GENERATION IN EUROPE.
Klass, D. L. (2004), BIOMASS FOR RENEWABLE ENERGY AND FUELS, Encyclopedia of Energy 1.
Koufopanos, C. A. et al. (1991), MODELING OF THE PYROLYSIS OF BIOMASS PARTICLE. STUDY ON KINETICS, THERMAL AND HEAT TRANSFER EFFECTS, The Canadian Journal of Chemical Engineering 69.
Knoef, H.A.M. (2005), HANDBOOK BIOMASS GASIFICATION.
Matsumoto, T. et al. (1969), 12TH SYMPOSIUM OF COMBUSTION, 1969
Moriconi, A. (2005), ENERGIA ELETTRICA PRODOTTA DA BIOMASSA, Associazione Termotecnica Italiana, 60° Congresso Nazionale.
Morris, M. and L. Waldheim (1998), ENERGY RECOVERY FROM SOLID WASTE FUELS USING ADVANCED
GASIFICATION TECHNOLOGY. Waste Management 18.

107
Oudhuis, A.B.J. et al. (2004), HIGH EFFICIENCY ELECTRICITY AND PRODUCTS FROM BIOMASS AND WASTE; EXPERIMENTAL RESULTS OF PROOF OF PRINCIPLE OF STAGED GASIFICATION AND FUEL CELLS. ECN Energy Innovation, ECN-RX--04-045, Maggio
Overend, R. P. (2005), BIOMASS CONVERSION TECHNOLOGIES National Renewable Energy Laboratory, Golden, Colorado 80401, USA

INTERNATIONAL CENTRE FOR SCIENCE AND HIGH TECHNOLOGY