renewable energy technologies for the production of bio-fuels: perspectives and appropriate...
TRANSCRIPT
i
Renewable Energy Technologies for the Production of Bio-Fuels: Perspectives and Appropriate Technologies for African Countries
INTERNATIONAL CENTRE FOR SCIENCE AND HIGH TECHNOLOGY
ii
The opinions in this report do not necessarily reflect the views of the United Nations Industrial Development Organization (UNIDO) or the International Centre for Science and High Technology (ICS). Mention of the names of firms or commercial products does not imply endorsement by UNIDO or ICS.
No use of this publication may be made for resale or for any other commercial purpose whatsoever without prior permission in writing from ICS.
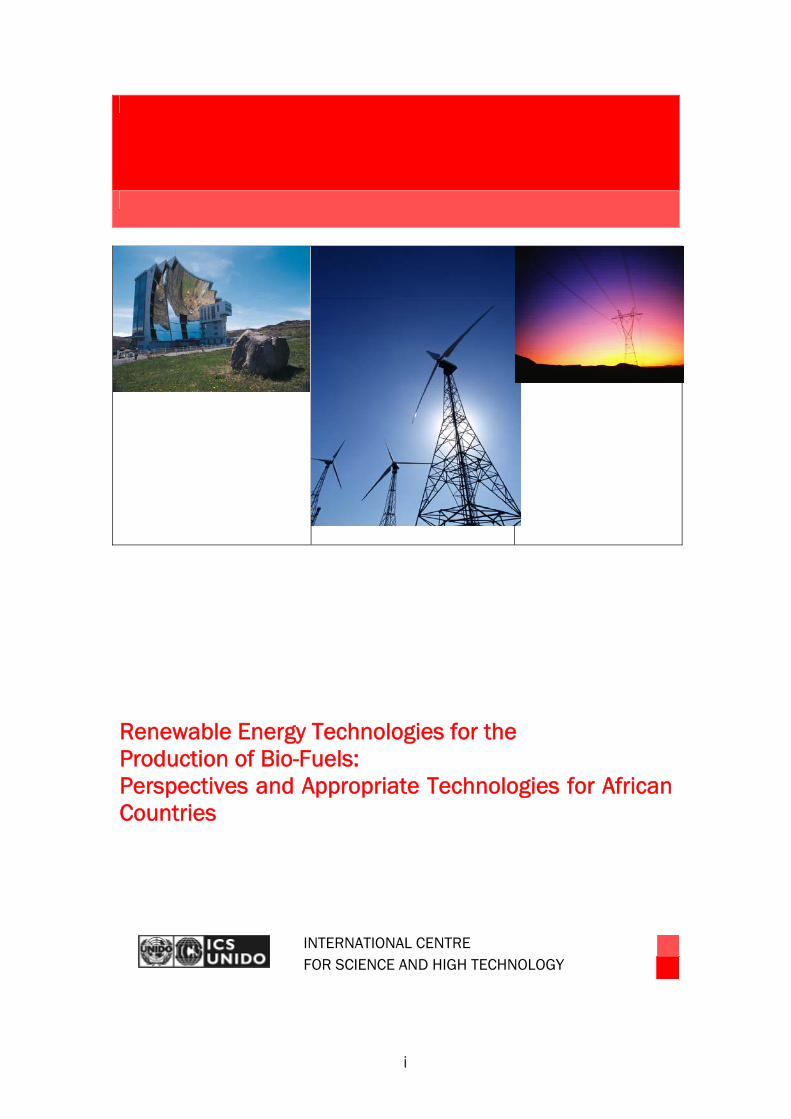
Cover page insets include pictures of: Photo 1: Photo-voltaic Photo 2: Wind Energy Turbine Photo 3: Transmission Towers ICS-UNIDO is supported by the Italian Ministry of Foreign Affairs
© 2008 United Nations Industrial Development Organization and the International Centre for Science and High Technology,
High Technology and New Materials International Centre for Science and High Technology ICS-UNIDO, AREA Science Park Padriciano 99, 34012 Trieste, Italy Tel.: +39-040-9228126 Fax: +39-040-9228122 E-mail: [email protected]
iii
Renewable Energy Technologies for the Production of Bio-Fuels:
Perspectives and Appropriate Technologies for African Countries
Prepared by: Graziano Bertogli
Alfonso Avila-Merino Emanuela Corazzi
Enrico Bocci Vincenzo Naso
INTERNATIONAL CENTRE FOR SCIENCE AND HIGH TECHNOLOGY Trieste, 2008
iv
Table of contents
List of figures vii List of tables viii Acronyms ix Executive Summary x 1. Introduction 1 1.1 ICS-UNIDO Programme and Activities in the field of Renewable Energy 3 1.2 The Area of High Technology and New Materials 3 1.3 Africa’s Situation in Renewables 5 1.3.1 Future Prospects 5 1.3.1.1 Feed vs. Food 5 1.3.2 Economic Competitiveness 6 1.3.2.1 Trade Implications 6 1.3.3 Sustainability Issues 6 1.3.4 Climate Change 6 1.3.5 Technology Transfer 6 1.4 Existing Conversion Technologies 7 1.4.1 Solid Biofuels 7 1.4.2 Liquid Biofuels 8
1.4.3 Gaseous Biofuels 8 1.5 Future Conversion Technologies 9 1.5.1 Liquid Biofuels 9 1.5.2 Gaseous Biofuels 9 1.5.3 Biorefineries 9 1.6 Potential of Biofuels for Developing Countries: Current and Future Situation 10
1.6.1 Africa 10 2 Renewable Energy Current Outlook 12 2.1 Energy and Sustainability 12 2.2 Renewable Energy Definition 14 2.3 Current and Future Capacity, Yields and Costs 16 2.4 Hydro 17 2.5 Wind 18 2.6 Solar 18 2.7 Biomass 19 2.8 Current Renewable Energy Share 20 2.9 Summary 23 3 Renewables in Africa – Status-of-the-Art 24 3.1 The Energy Supply by Sectors 24 3.2 Renewable Energies in Africa 26 3.3 Bio-energy 26
3.3.1 Small-scale biomass energy 28 3.3.2 Large-scale biomass energy 29
3.4 Biofuels 31 3.4.1 Food vs. fuel in Africa 32
3.5 Hydropower 33 3.5.1 Congo River to Power Africa out of Poverty 35
3.6 Solar 37 3.7 Geothermal 39
v
3.8 Wind 43 4 Biomass as Energy Resource 46 4.1 Definiton, Consumption and Availability 46 4.2 Energy Chain 46 4.3 Typologies 47 4.4 Properties-characteristics 47 4.5 Conversion-Transformation Technologies 49
4.5.1 Thermal 50 4.5.2 Biological 51 4.5.3 Mechanical 51
4.6 Traditional Versus Modern Biomass Uses 52 5 Introduction to Bio-fuels 53 6 Solid biofuels 57 6.1 Woody Biomass 57 6.2 Charcoal, Firewood- log Wood 60 6.3 Wood Powder, Chips and Pellets 61 6.4 Solid Biofuels from Agricultural Crops and Residues 62 6.5 Solid Biofuels from Waste 63 7 Biofuels’ First Generation Technologies 64 7.1 Introduction 64 7.2 Extraction and trans-esterification 65
7.2.1 Raw Material (oleaginous plant) 65 7.2.2 Products (Oil-Biodiesel-Animal feed-Glycerine) 66 7.2.3 Production Process 67 7.2.4 Material, Energy and Cost Data 68 7.2.5 Economics 69
7.3 Fermentation and Distillation 70 7.3.1 Raw Material (sucrose and starch plants) 70 7.3.2 Products (Bioethanol - ETBE) 73 7.3.3 Process 74 7.3.4 Material, Energy and Cost Data 75
7.4 Anaerobic Digestion 78 7.5 Gasification 79
7.5.1 Gas cleaning 80 8 Biofuels’ Second Generation Technologies 83 8.1 Pyrolysis and hydro-treatments 83 8.2 Advanced fermentation and hydrolysis 84 8.3 Advanced gasification 86 8.4 Pyrolysis plus gasification plus synthesis 87 8.5 Bio-Hydrogen technologies 87 8.6 Bio-refinery and energy farm 89 9 Biomass energy sustainability 92 9.1 Assessment of Biomass Use 92 9.2 Environmental and Socio-economic Implications 93 10 Sustainable Bio-energy: Potential Benefits and Risks 94 10.1 Introduction 94 10.2 Economic Aspect 95 10.3 Social Aspects 96
vi
10.4 Environmental aspects 98 10.5 Summary 99 11 Agro-fuels: Mono-cropping no man’s land 101 11.1 Indigenous People and Agro-fuels 101 11.2 The Inconvenient Impacts of Agro-fuels 102 11.3 Impacts on Food Security and Food Sovereignty 103 11.4 Sustainable Agro-fuels 105 11.5 Summary 106 12 Policy and Regulatory Frameworks Supporting the Development of Renewable
Energy Sources in Africa 107 12.1 Current Energy Related Problems facing African Countries 107 12.2 Technology Appropriation/Transference and Building Local Capacity 109 12.3 Alternative energy scenarios 109 Conclusions 112 References 114
vii
List of Figures Figure 2.1 World Energy Consumption per Sources (1860-2060) Figure 2.2 Forms of Potential for Renewables and Fossil Resources Source Figure 2.3 Energy Price 1970-2030 (2005 $ per MBTU) Figure 2.4 Average heating, transport and electricity costs (€/MWh) Figure 2.5 Fuels Share of World Primary Energy supply Figure 2.6 Annual Growth of Renewables Supply from 1971 to 2003 Figure 2 7 Regional Shares of Renewables Supply Figure 2.8 Global Sectorial Consumption of Renewables Figure 3.1 Biomass energy as a Percentage of Total Energy for selected Eastern and
Southern African Countries Figure 3.2 Electricity Consumption per Capita (kWh/capita) by Regions of the World in 2000 Figure 3.3 Population and Household Fuel Use by Region, 1995 Figure 3.4 % of Population Living Below $2 day (1990-2001) Figure 3.5 Maximum Potential Biomass Density Figure 3.6 Electricity Production by Source in Africa Figure 3.7 Mapping of hydro sources Figure 3.8 Mapping of solar radiation Figure 3.9 Olkaria Geothermal Plant, Kenya Figure 3.10 African countries using or having carried out research on geothermal resources Figure 3.11 Wind production farm Figure 4.1 Total World Primary Energy Supply Figure 4.2 Biomass Typologies Figure 4.3 Biomass Conversion Processes Figure 6.1 Classification of Woody Biomass Figure 6.2 Solid Biofuels Market Analysis Figure 6.3 Example of wood Cycle Figure 6.4 World Crops Production Figure 6.5 Pathways of MSW Figure 7.1 Bio-diesel and bio-ethanol production processes Figure 7.2 Soy, Palm, Rape, Sunflower Figure 7.3 Trans-esterification Figure 7.4 World Sugarcane and sugar Beet Places Figure 7.5 Sugarcane and sugar Beet Figure 7.6 Corn and Wheat Figure 8.1 Cellulose Chain Figure 8.1 Bio-refinery Scheme
viii
List of tables
Table 2 1 Summary of the RES Potential in EJ/y Table 2.2. Land use requirements for different energy technologies Table 2.3 Cost for producing Energy from Different Sources Table 2.4 The Contribution of Renewables in global Primary Energy Supply in 2004 Table 3.1 Cogeneration potential From Bagasse for eastern And Southern Africa Table 3.2 Ethanol Production in Southern Africa Table 3.3 Share of Arable, Permanent and pasture Areas to Agricultural Areas Table 3.4 Geothermal Potential for Some African Countries Table 3.5 Estimated Average Wind Speeds in Selected African Countries Table 4.1 Biomass Properties Table 5.1 First Generation of Biofuels Table 5.2 Second Generation Biofuels Table 5.3 Infrastructural Costs for Producing Ethanol Table 5.4 Costs of Producing Ethanol in Selected Countries Table 5.5 Cellulosic Ethanol Plant Cost Estimates Table 5.6 Amount of irrigation needed for the grow of biofuels Table 5.7 Cost for Producing Electricity from Biofulels and other Renewable Energy Sources (2005) Table 5.8 Estimated Plant Costs to produce Cellulose Ethanol (per litre) Table 5.9 Amount of irrigation Needed for the Grow of Biofuels Table 6.1 Classification of Origin and Sources of Woody Biomass Table 7.1 World Production of Soy, Rape and Sunflower (1995-1999) Table 7.2 Main Material, Energy and Economic Data of Main Oleaginous Plants Table 7.3 Main Global Material and Energy Data of a ‘Good’ Rape Bio-diesel Plant Table 7.4 Sugarcane Land and Yield Table 7.5 Average Sugar Content in Different Crops Table 7.6 Average Sugar Content in Different Roots Table 7.7 Average Indicators for Corn from Central and South America Table 7.8 Average Indicators for Wheat from South West Asia Table 7.9 Yield and Cost of Main product of the Main Ethanol-crops Table 7.10 Economic and Energy Related Data for Some Materials Table 7.11 Sugarcane to Ethanol Table 7.12 General Energy Data About Corn-ethanol Process Table 7.13 Anaerobic Digester Costs (€) Table 8.1 Different types of pyrolysis process Table 8.2 Pre-treatment costs per litre of ethanol Table 8.3 Indicative Costs for Hydrogen Production Table 8.4 Balance between different power group configurations Table 10.1 Sustainability Challenging Table 12.1 Summary of factors Related to RES in Selected African Countries
ix
Acronyms bbl Barrel CC Combined Cycles CCER Closed Cycles of Energy Resources CE Combustion Engines EJ Exa Joule EU European Union FAO Food and Agriculture Organization of the United Nations FC Fuel Cells GT Gas Turbines Gtoe Giga tonne of oil equivalent Gwe Giga Watt electric HQ Head Quarters ICS International Centre for Science and High Technology IEA International Energy Agency Kcal Kilo calorie KW Kilo Watt KWh Kilo Watt-hour MDG Millennium Development Goals MPOB Malaysian Palm Oil Board MSW Municipal Solid Waste Mtoe Million tonne of oil equivalent MW Mega Watt MSW Municipal Solid Waste NIC Newly Industrialised Country OCDE Organization for Economic Co-operation and Development PV Photo-Voltaic R&D Research and Development RET Renewable Energy Technologies RES Renewable Energy Sources SME Small to Medium Enterprise TC Technology Centre TW Tera-Watt TWh Tera-Watt-hour UNDP United Nations Development Programme UNIDO United Nations Industrial Development Organization UNITAR United Nations Institute for Training and Research USD United States Dollar WEA World Energy Agency WSSD World Summit on Sustainable Development
x
Executive Summary
Introduction
Energy is an important factor in the three areas relating to sustainability:
1. Economic: many countries import energy representing up to 50% of their trade balance. The price of energy defines an important part of a country’s economic development. 2. Social: approximately 2bn people, mainly from sub-Saharan Africa and Southern Asia, do not have access to modern energy sources for cooking, heating, lighting, cooling, transport, communication, etc. Energy consumption per capita in developing countries is about 15% of the level in Europe and 20% of the US level. 3. Environmental: A large proportion of toxic emissions are related to energy systems. The rate of energy consumption is higher than the rate of energy production. The problems related to energy use and production are becoming increasingly widespread, involving not only scientific institutions, energy companies and governments, but also industries and consumers. Therefore, institutions, governments, companies and citizens must collaborate to find solutions through:
• International, national and local planning, • Legal and financial instruments , • Actions, i.e. sustainable methods of production, new technologies, uses and
processes.
Resolving the world’s energy problem is a challenge that involves the sustainable development of renewable energy and a revised model of industrial and social development, i.e. a sustainable energy system requires change and adaptation to the entire energy chain, from energy supply to technologies to end users. There are several possible solutions but the issues related to sustainability of renewable energy are complex and the problem is urgent. The promotion and implementation of methods, technologies and processes for sustainable economic, social and environmental development of energy production and use is crucial.
The world’s energy consumption is constantly increasing and is forecast to increase from 411EJ in 2006 to 900EJ by 2050; i.e. from 10-22Gtoe. The world’s population is forecast to increase from 6bn to 9bn in the same period, with per-capita energy consumption going from 68Gj/y to 100GJ/y, with security of energy supply and the North-South energy balance becoming more unequal due to geopolitical distribution, exhausted reserves, and increases in oil prices. Local and global environmental problems will increase - humans are responsible for 90% of greenhouse gas (GHG) emissions (IPCC 2001) – and there will be an increase in mean global earth temperatures of 1.8°-4°C, accompanied by increased sea levels of 18-59cm. Carbon dioxide (CO2) emissions in the next 100 years will be responsible for environmental damage representing 5-20% of world GDP.
Even were the Kyoto Protocol to be adopted by everyone this would not be sufficient to resolve this situation. Italy’s goal for 2010 was a 6.5% decrease over 1990 CO2 emission
xi
levels, but in 2006 levels were more than 13% higher. New objectives and measures need to be implemented at EU level to reduce CO2 emissions by 8% by 2010, 20% by 2020 and 50% by 2050 just to stabilise CO2 levels at 550ppbv.1 If implemented by 2020, such measures could result in an increase of 20% in energy efficiency meaning that 20% of primary energy sources will come from RES and 10% biofuels2 will be being used in the transport sector. These measures would have global consequences and produce important change in energy sources and vectors.
From prehistoric times to 1850 the main energy source was biomass from animal and vegetable sources. From 1850 to 1900 coal and gas dominated, and from 1900 to 2000 petroleum and natural gas have taken over as the key fuels.
Up to 2050, solid fuel (from biomass, coal and nuclear); liquid fuel (e.g. petroleum, bioethanol, vegetable oil, biodiesel, synthetic liquid biofuels), and gaseous fuel (e.g. natural gas, biogas, synthetic gaseous biofuels and hydrogen) will coexist. We need to examine the resources available, the related technologies and the scales of application, all of which should be related to local conditions.
A general assessment of the availability of energy resources3 is essential for the creation of any long term energy policy. RES provide an energy flow that is renewed regularly; fossil fuels on the other hand are ‘fixed’ resources. The actual use of RES is about 10% of the world’s energy consumption, but the theoretical and technical potential4 of renewable energy is huge especially if we take into account solar and geothermal sources. Only some 0.02% of the global contribution to the earth’s energy balance5 comes from geothermal, gravitational and nuclear energy.
The heat stored in the earth (geothermal energy), originates from the earth’s molten interior and from the decay of radioactive materials, and its potential is larger than the solar energy theoretical potential (annual solar irradiation). The theoretical potential of geothermal is more than 100,000 times higher than world energy consumption, solar 10,000 times and other sources around 10 times;6 the total technical potential of RES is 20 times higher than the world’s energy consumption. Due to the huge capabilities so far underdeveloped, it is important to stress the potentials for exploitation, the current and
1 Ppbv stands for Part Per Billion by Volume. 2 The European Energy Commissioner at the International Conference on Biofuels (5-6/7/2007) said that the targeted 10% of biofuels could be produced within Europe, but the biofuel with the lowest amount of CO2, should be selected regardless of where it is produced.
3 World Energy Council (1998) defined energy resource as primary energy the one using basic or none conversion technology.
4 Within this proposed framework, theoretical potential of a RES -sun, wind, biomass, water, geothermal- the annual flow of energy without technical-economic references,4 IS estimated through direct analyses. The technical potential of RES is the fraction of theoretical potential that current technologies could exploit. The economic potential is the fraction of technical potential to be exploited. Finally, the effective potential of RES is the fraction of economic potential that is exploited taking into account a country’s demand and energy policies. The potentials are affected by several factors including: environmental, technical, economic and social; thus, the numerical value of each aspect changes dynamically according to environmental changes, technological developments, market conditions and the political situation.
5 The earth is a physical open system (exchanging energy not matter), it receives energy from the sun and reflects the same quantity of energy to maintain its temperature.
6 From the mean average value of solar constant (1.37kW/m2) and the mean radiate terrestrial surface, it is possible to calculate a terrestrial annual solar irradiation of about 5.44×1024J (1,370W/m2 × 1,27 × 1014 m2 × 3,600J/W × 24 × 365) against an annual primary energy consumption of about 4,2×10²⁰J (i.e. 420EJ = 10,000Mtoe; 1kg of oil has 10,000kcal = 4.1868 ×10⁷J; thus 1Gtoe = 4.1868 × 10¹⁹J = 41.868EJ).
xii
future capacities, outputs, as well as socio-economic and environmental impacts. Outputs would be increased with developments based on research and development (R&D) related to technological and cost aspects.
In the case of the large hydro and geothermal sources it is difficult to forecast technology improvements. Thermal-solar power plants can be considered only in the mid-term (although there are some pilot projects underway); currently there are no commercial power plants. In the case of wind and photovoltaic (PV), we can forecast increased yields and decreased costs of 10% and 50%, respectively. The situation is similar for bio-energy, but here improvements could increase annual hours of operation e.g. from 5,000 to 7,000.
Renewable resources are gradually expanding their role in global energy supplies. In 2004, renewable energy accounted for approximately 13% of global primary energy supply. Large hydro in developing countries are near to their technical potential; small hydro could double their production capability in the near future; wind energy, ground and offshore, could achieve similar performance to hydro technologies in the short term, while geothermal technology could allow a doubling of current levels from this source. The contribution of solar energy will depend on investments and improvements. Increasing sustainable biomass energy will be challenging. Nevertheless, the prospects for the contribution from RES increasing are good
RES are the only resources capable of increasing the sustainability and security of energy supplies. There are fundamental barriers to their development, the main ones being:
• uncompetitiveness: in most cases, power plants for RES have higher investment and energy costs than conventional ones. However, if the ‘external’ costs (related to health and ecosystem damage and other ‘externalities’) are taken into account even the least competitive cases become profitable; • planning, legal and financial instruments and methods are often ineffective and incoherent: the development of RES has to be supported indirectly by tax on non-RES (carbon tax, etc.) to recover the ‘external’ costs, by subsidised investments and/or regulation that really supports its diffusion. All these aspects must be coherent within an energy plan with a clear, shared goal of RES development; • technologies and infrastructure improvements: in some cases there are no technologies or capabilities to develop and implement RES projects.
xiii
Africa’s energy supplies North Africa depends on oil and gas, South Africa depends primarily on coal and Sub-Saharan Africa is largely dependent on biomass. Compared to other sub-regions, on a per capita basis, sub-Saharan Africa is one of the lowest consumers of modern forms of energy in the world. Africa’s per capita consumption of electricity ranges from 431kWh to 112kWh (World Bank, 2003). The total energy demand for sub-Saharan Africa is approximately 267Mtoe,7 comprising 80% traditional energy.8 South Africa accounts for 45% of the total electricity generated in Africa, North Africa for 30%. This leaves sub-Saharan Africa, where 80% of continent’s population resides, with only 24% of total electricity generated. In terms of fossil fuels, total oil consumption in 1997 was 2m barrels per day, which is expected to double by 2010. North Africa accounts for 50% of Africa’s gas reserves and Nigeria a further 30%. The energy sector is characterised by large and increasing imports of petroleum products, which account for significant proportions of export earnings, an average of 20-40% for the non-oil exporting sub-Saharan African countries. The transport sector is the major consumer of oil, accounting for 60% of the total. The high oil import bill exposes sub-Saharan Africa’s energy sector to external energy price shocks. Thus, renewables, such as ethanol, would assist in mitigating the negative impact of high fossil fuel imports.
Renewable energies in Africa
Africa has 1.1GW (Gigawatts) of hydropower capacity, 9GW of geothermal potential and abundant biomass, solar and wind potential. It is important to underline that the RES potential in Africa has not been fully exploited, mainly due to limited policy interest and investment levels.
• Biomass Estimates based on available data show that biomass constituted 58% of total final energy consumption in Africa in 2002 (IEA, 2004). According to the same source, in 2002, biomass accounted for 49% of total primary energy supply. Although there was a decrease from the share of biomass in total primary energy supply in a 30-year period (from 62% to 49%), biomass still plays a dominant role in Africa’s energy sector. The heavy reliance on biomass is prominent for sub-Saharan Africa, where biomass accounts for 70-90% of the primary energy supply in some countries, and an estimated 86% of energy consumption. The bulk of biomass energy used in sub-Saharan Africa is traditional biomass.
7 Toe = ton oil equivalent 8 If South Africa is included in the region, the percentages are 54% traditional energy, 27% oil, 14% solid fuel, 3%
hydropower and 2% gas.
xiv
Biofuels The importance of biofuels has grown due to their potential for providing a reliable and sustainable source of energy in most parts of the world. They have political appeal as they reduce dependence on imported fossil fuels and they attract grant finance and credits based on programmes for reduction in GHG. Africa is one of the lowest emitters of GHG, which increases the relevance of promoting renewables in the continent. There is a growing consciousness within the African region, that dependence on imported fuel is having a negative impact on regional economic development. The recent high oil prices have adversely affected the African economies. Of 47 of the world’s poorest countries, 38 are net oil importers, the majority in Africa. It is estimated that the negative impact of the most recent increase in oil prices on the oil importing economies of sub-Saharan Africa will far outstrip the benefits of the debt relief extended to the region. The high prices of fossil fuels enhance the attractiveness of biofuels as alternative sources of fuels for transportation and other applications.
Two major biofuels have been developed in Africa.
Bio-diesel: The production of bio-diesel is not well developed in Africa. Currently the most attractive and common option for the region is Jatropha curcas seeds, which are favoured because of their ability to grow in infertile soils and drought prone areas, and because they are not attractive to animals. They have high potential for adoption in most sub-Saharan African countries which have degraded lands that are not suitable for food production. The cost of producing bio-diesel from Jatropha curcas is reasonably low (IFPRI, 2006), which makes it an attractive feedstock for becoming a viable source of biodiesel. The production of biodiesel occurs mostly in rural areas, and enables the poor to access this fuel. Currently, the estimated production costs are US$0.70-1.2 per litre of diesel equivalent (IEA, 2006). Although these prices are above those for petroleum and diesel, there is high potential for growth through R&D and tax concessions. Countries that have made progress in biodiesel development include Mali, Kenya, Malawi, Zambia and South Africa. Mali has an estimated potential output of 1.7m litres of oil per year. Also, based on locally available resources, with appropriate processing the lubricating characteristics of biodiesel are 50% superior to that of conventional fossil diesel (The Natal Witness 2003). The cost of biodiesel production however, continues to be the main hurdle to its commercialisation (Fangrui and Milford, 1999).
Ethanol is produced in several countries, including Zimbabwe, South Africa, Mauritius, Malawi, Zambia and Swaziland. South Africa accounts for about 70% of Africa’s ethanol production; however, the bulk of it is high-purity ethanol which goes to industrial and pharmaceutical markets (IEA, 2004). Ethanol can enhance the security of liquid fuel supplies compared to imported liquid fossil fuels, as it is sourced from locally available feedstock. Ethanol programmes in Malawi, Zimbabwe and Kenya have produced a blend of ethanol and gasoline (gasohol) for use in existing motor vehicles.
xv
• Hydropower resources Africa has vast large-scale hydropower resource potential. However, less than 10% of the technically feasible potential has been developed (Burtle, 2002). Consequently, the share of hydropower in total electricity production is quite small. If small hydropower is included, the proportion of unexploited hydropower potential increases significantly.
Total installed hydro capacity in Africa was estimated in 2001 to be about 20.3GW with potential hydro-electricity generation of about 76,000GWh/year (Hydropower and Dams 2001). In 2001, hydro contributed more than 50% of the electricity used in 25 African countries and more than 80% in Angola, Burundi, Benin, Cameroon, CAR, DRC, Ethiopia, Guinea, Lesotho, Congo Brazzaville, Malawi, Mozambique, Namibia, Rwanda, Tanzania, Uganda and Zambia.
• Solar
Solar energy is the best-known RES in Africa. It has been used traditionally for drying animal skins, for preserving meat, for drying crops and for evaporating seawater to extract salt (Karekezi and Ranja, 1997). Solar energy is utilised on a small-scale for domestic lighting, cooking, water heaters and solar architecture houses; on a medium-scale for various appliances including water heating in hotels, and for irrigation; at community level, it is used for vaccine refrigeration, water pumping and purification and rural electrification; and on a larger scale, for pre-heating boiler water for industrial use, and for telecommunications. • Geothermal Geothermal power has numerous advantages over other energy sources (Bronicki, 2001) including near-zero emissions (in modern closed cycle systems that inject water back to the earth’s crust), and has very small space requirement per unit of power generated. Using current technology, Africa has the potential to generate 9,000MW of power (excluding the potential from ground heat source pumps) from geothermal (BCSE, 2003). Of this potential, only 127MW has been tapped in Kenya, and less than 2MW in Ethiopia. These estimates of existing geothermal power generating capacity do not include direct use of geothermal energy, which is widely practised in Africa. To put this in an international perspective approximately 8,100MW of geothermal power is generated worldwide. Indonesia produces 589MW, Japan 546MW and the Philippines over 1,900MW of electrical power from geothermal energy. Varying levels of geothermal exploration and research have been undertaken in Djibouti, Eritrea, Uganda, Tanzania, Zambia, Malawi and Madagascar, but the potential for grid connected geothermal exploitation is highest in Ethiopia, Kenya, Uganda and Tanzania, which are all on the Great Rift Valley. Government representatives from Ethiopia, Uganda, Tanzania and Eritrea are considering the use of small-scale geothermal plants for rural electrification via mini-grid systems.
xvi
• Wind Africa is not on the world wind map, even though a wind park with one of the highest wind regimes in the world has been in operation (Koudia Al Baida, Morocco, with more than 11m/s annual average wind speed at 10m above sea level). Much of Africa straddles the tropical equatorial zones of the globe and only the southern and northern regions overlap the temperate westerly wind areas, which mean that many sub-Saharan countries have low wind speeds, particularly the land locked countries. South Africa, North Africa and the Red Sea coast (and surprisingly parts of Chad and Northern Kenya) have some of the highest wind potentials in the region. Average wind speeds of 7.2-9.7m/s have been recorded around Cape Point and Cape Alguhas in South Africa (Afriwea, 2005). The North African coast is another attractive region for wind projects, and large-scale wind power generation projects to exploit this abundant energy source are under way in Morocco (as already mentioned) and Egypt.
Energy chain
Biomass use like other energy sources depends on the global production system. Unlike other RES, biomass (as a fuel) is subject to the traditional energy chains and relative impacts of a natural resource on daily life. Current energy chains are depleting non-renewable resources and releasing harmful pollutants, producing waste and both local and global pollution. A more evenly shared and longer lasting development will be realised only from energy cycles that use RES. Thus, the energy sector needs to focus on the so called closed-cycles characterised by no non-renewable resources consumption, and no impact on the environment.
In the case of biomass, extraction and treatment, is substituted by growing, harvesting and treatment, resulting in an energy chain comprised of:
1. Production, i.e. growing, harvesting and treatment 2. Transport 3. Conversion 4. Distribution 5. End use.
Unlike other RES, biomass exhibits extremely large variety (owing to the large variety of the renewable multi-carbon compounds) and is suitable for number of processes, which produce a variety of products and by-products. The biomass chain can be divided into:
1. Energy culture: biomass especially planted for energy purpose in marginal or productive land or water; 2. Residues: from woodlands, public parks and gardens, from human or animal
cultivation, from food, zoo-technical, wood, textile industries or retailing and end use chains (Municipal Solid Waste - MSW).
xvii
Biomass Typologies
As can be seen from the above, biomass is a complex resource that can be processed in many ways leading to a variety of products and by-products. Biomass energy conversion, which involves the transformation9 processes, can be divided into three main categories according to the main energy/substance used in the process:
1. Thermal: Conversion using thermal energy e.g. combustion, pyrolysis and gasification; 2. Biological: Conversion using microbial or enzymatic activity e.g. aerobic and anaerobic
digestion and fermentation; 3. Mechanical: Conversion using mechanical energy e.g. oil extraction.
Traditional versus modern biomass uses
Generally speaking, the biological processes are similar to the traditional processes that organisms use to produce energy and nutrients, but the renewable processes used by organisms have only recently been used to produce food, fuel and chemicals. Fermentation was traditionally used to produce alcoholic beverages. The processes involved in producing coal, oil and natural gas from biomass can be seen as very particular ‘pyrolysis/gasification’ processes but they are not renewable, and took millions of years to be completed.
Thus, the most traditional biomass energy used - and also the first energy form consciously exploited by humans – was the simple combustion of small amounts of mainly solid biomass to produce heat or light in the forms of fires and torches. Due to the toxic emissions from its combustion and the impossibility to burn (with significant yield) all types of biomass, other processes were developed (see above). Therefore, if we excluded direct combustion, biomass energy is usually in the form of biofuels (in the general definition), in solid, gaseous and liquid forms.
The process and related technology are determined by the properties and quantities of the biomass; the final product required (final type of energy), economic conditions, environmental regulations and other project specific factors. Biofuels are liquid10 fuels made from organic material. The most common biofuels are biodiesel made from vegetable oils, and bioethanol made from sugar and starch crops. Research is under way to commercialise ‘second-generation’ production techniques that will enable production of biofuels from woody material, grasses and some types of waste. Biofuels are unique in being the only direct substitute for oil for use in transport that is available on a significant scale. Other technologies, such as hydrogen, have enormous
9 In the energy sector, conversion means the a passage from one form of energy to another; transformation is only change in characteristics. Thus, only combustion and aerobic digestion are conversion (in these processes the chemical energy of the biomass is converted into thermal energy in the form of combustion gases and sewage respectively); the other processes are transformations (the chemical energy in the biomass is transferred to chemical energy in the fuel, i.e. the same energy form but with different characteristics). However, owing to the other energy involved e.g. in gasification thermal energy is converted to upgrade the fuel, etc., other processes can be considered to be conversion. 10 The EC (2004) report considers only liquid biofuels, here the definition includes solid and gaseous biofuels.
xviii
potential but are a long way from large-scale viability and will require major changes to vehicles and fuel distribution systems. Currently produced biofuels can be used in existing vehicle engines, unmodified for low blends or with cheap modifications to accept high blends. Changing the fuel mix in transport is important because the current transport system is almost entirely dependent on oil most of which is produced in politically unstable parts of the world. Its import involves cost and more GHG emissions. Thus, biofuel offers benefits in terms of security of supply and climate change. However, the way that biofuel is produced must be carefully considered in order to avoid environmental damage, e.g. land converted from high-diversity natural environments to be used to grow biomass.11
Biofuels
The most traditional biofuels are solid fuels. Solid bio-fuels are simple or treated ligno-cellulosic biomass from wood, i.e. firewood, charcoal, woodchips, pellets, briquettes, powder; agricultural crops and residues such as husks, stalks/straws, sugarcane bagasse, grass, etc,. herbaceous and fruit biomass, and waste, which is the mainly solid recovered fuel from the organic fraction of MSW. Biofuels are normally used for combustion, but can also be used in other thermal processes or biological processes (although this last use has some problems). The traditional use involves open-air or in-house burning of simple biomass, this is largely applied today, especially in developing countries, even if it is decentralised and uses renewable resources, has low yield, high pollution and can contribute to GHG12 emissions when the biomass used is more than the biomass growing.
Liquid and gaseous biofuels have been around for a long time. The diesel engine and the model T Ford were originally designed to run on biodiesel and bioethanol, respectively. The liquid and gaseous biofuels obtained by processes commercially available and widely applied in the world are called first generation biofuels and include bioethanol, vegetable oil, biodiesel, biogas and fuel gas, and are easy to transport. Generally, first generation biofuels are understood as bioethanol and biodiesel.
Second generation biofuels are the same as first generation fuels, but from improved or different production processes that enable more biomass feedstock to be usable and produce higher yields, They also include other fuels such as synthetic liquid and gaseous fuels and hydrogen.
Bio-hydrogen technologies
Environmental concerns and security of energy supply issues are driving the transition from a fossil fuel to a hydrogen based society. In order to meet our ever-increasing energy needs in a sustainable manner, leading to the establishment of an energy ‘democracy’ around the globe, the combination of hydrogen produced from renewables, and fuel cells
11 Report on the progress made in the use of biofuels and other renewable fuels in the Member States of the European Union, EU COM(2006) 845 final, 10.1.2007, Brussels. 12 GHGs include water vapour, carbon dioxide, methane, chlorofluorocarbons (CFCs) and hydro chlorofluorocarbons (HCFCs); they absorb and re-emit infrared radiation, warming the earth's surface and contributing to climate change (UNEP, 1998).
xix
which hold the promise of a sustainable future, is one of the few serious alternatives to fossil energy sources in terms of resource availability (i.e. only hydrogen from all renewables can replace conventional fuel consumption) and provide environmental protection for the world.
For example, in terms of electricity produced from renewables, instant consumption of the electricity produced, which should be sufficient to satisfy demand, would be the most efficient. If there is excess production, this could be used to produce hydrogen, would become the means of storing energy from renewables. The niche markets that would allow an increase of the penetration of renewables to produce hydrogen could be seen as the sharp end of the ‘hydrogen economy’. Driven by recent technical advances in hydrogen and fuel cell technologies and by the need for diversified and sustainable technologies, the OECD country governments are intensifying their R&D efforts (almost €1bn per year is being invested globally for hydrogen and fuel cells research) and
investment from the private sector is increasing (approx. €3-4bn per year), including the
major oil and gas companies, car manufacturers, electric utilities, power plant component developers and a number of smaller players in the hydrogen and fuel cell market.
Hydrogen can be produced from RES:
• through electrolysis from electricity (wind, solar, geothermal, hydro, wave, biomass); • through reforming of biomass-derived fuels; • biological and bio-mimetic production (bio-photolysis and fermentation); • high temperature solar thermochemical production – thermolysis; • photo-electrochemical production – photo-electrolysis. Energy farms Existing energy farms are based on the last three parts in the biomass chain (pre-treatment, conversion, end use), which makes their energy, environmental and economic balance more favourable. Accurate analysis and design of the conversion processes is required to avoid negative impacts on these aspects such as low energy efficiency, pollution, high cost. In practice, global economic pressures have pushed the agricultural sector (i.e. sugar, paper, livestock) to search for uses for the waste from their industries in order to lower food production costs and to diversify and integrate raw materials sources. Most farms are potentially energy farms although some will not be able to produce surplus energy. Biorefinery In the short term, biorefinery products will not be able to compete on cost with products made from fossil fuels. For biorefineries to succeed, different sectors of the economy – agriculture, forestry, agro- and wood-based industries, chemical, food, transport and energy industries – will need to cooperate to develop processes for the production of new biomass-based products, and bringing them to the market. Research institutes and
xx
universities are therefore important stakeholders. Policymakers, regulators and law-makers will play important enabling roles in establishing the biorefinery concept. Assessment of biomass uses The first element to consider in assessing viable biomass uses is the energy and economic feedstock production costs (GJ/GJ and €/GJ), constituted by the first three parts in the biomass chain. Fixing a value of 100GJ/ha (e.g. yield of 10t/ha and a conversion value (CV) of 10GJ/t, thus taking account of all the biomass produced by an energy crop), for a value of 10GJ/ha for cultivation and harvesting, the energy production cost is €0.1,13 while the mean economic cost is about €4/GJ. These average ‘good’ values include, among other items, transport energy and economic costs of 0.5MJ/km and €0.02/km per ton. Lower yield and lower CV biomass do not have proportionally lower costs; thus the energy and economic returns could become negative. Production costs are affected by yield, land rent and labour costs. The second main element that should be considered is the conversion process which is mainly dependent on the quality of the biomass and final product (heat, electricity, fuel, food, chemicals). The above mentioned values have a very large range and also the energy and economy returns can easily become negative. Many processes have high energy requirements and, in the case of the most advanced technologies, high investment costs. In terms of cost, biofuels are the highest among other renewables and fossil fuels. Environmental and socio-economic implications
The use of biomass, especially on a large-scale, has a wide range of environmental implications: soil fertility; leaching of nutrients and biodiversity; deforestation and erosion; landscape, water use; fire and disease; air, water and ground pollution, etc. Even where ideal biomass energy use produces just the CO2 that the biomass has fixed, pollution can occur from use and production of fertilisers and pesticides, poor cultivation and harvesting practices, etc.
On the other hand, good biomass can prevent soil erosion, remove soil contaminants, increase biodiversity, etc. In terms of the social implications, bio-energy systems require complex organisations, multiple actors and substantial areas of land, but have employment benefits and have application in most countries.
Bioenergy production can be an opportunity for developing countries (especially in Africa) in providing large employment generation linked to ecosystem conservation, and even rehabilitation. Furthermore, investments in biomass energy can be an effective way of combating desertification and can have significant impacts on global climate change and can be a valuable tool for promoting gender equity within associated natural resources management activities. Developing countries are mostly agriculture based economies,
13 Energy Return On Energy Investment (EROEI) equal to 10.
xxi
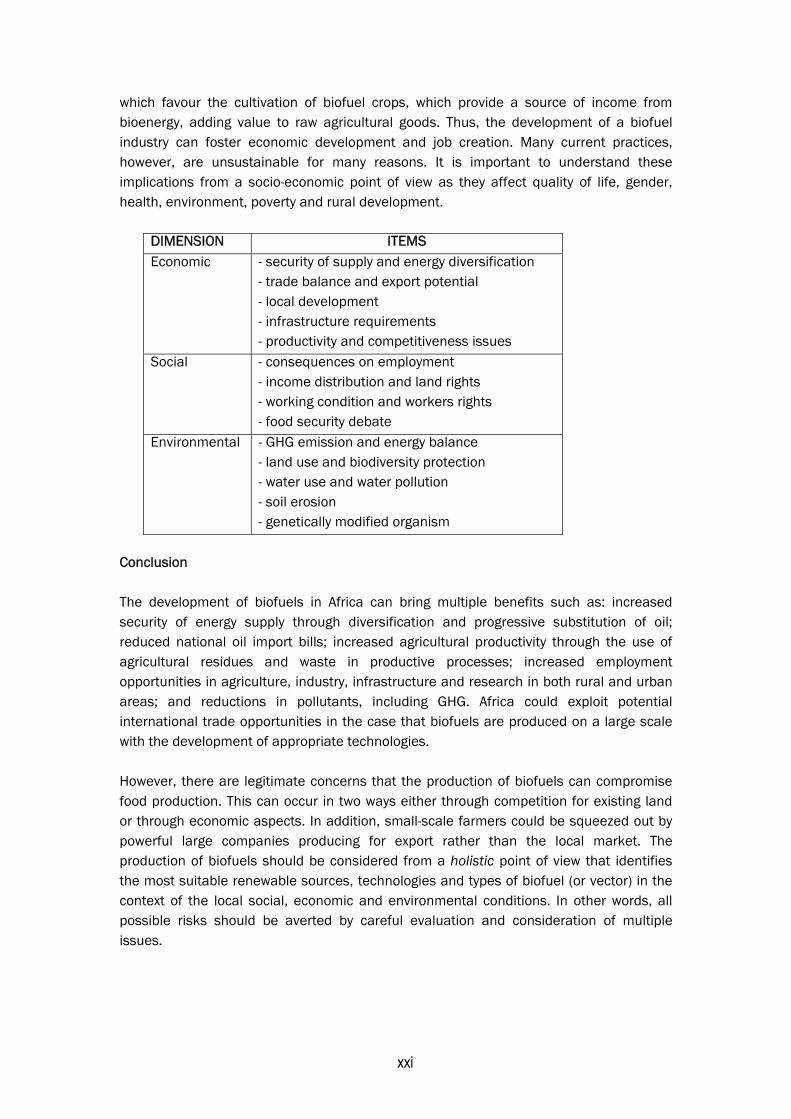
which favour the cultivation of biofuel crops, which provide a source of income from bioenergy, adding value to raw agricultural goods. Thus, the development of a biofuel industry can foster economic development and job creation. Many current practices, however, are unsustainable for many reasons. It is important to understand these implications from a socio-economic point of view as they affect quality of life, gender, health, environment, poverty and rural development.
DIMENSION ITEMS Economic - security of supply and energy diversification
- trade balance and export potential - local development - infrastructure requirements - productivity and competitiveness issues
Social - consequences on employment - income distribution and land rights - working condition and workers rights - food security debate
Environmental - GHG emission and energy balance - land use and biodiversity protection - water use and water pollution - soil erosion - genetically modified organism
Conclusion The development of biofuels in Africa can bring multiple benefits such as: increased security of energy supply through diversification and progressive substitution of oil; reduced national oil import bills; increased agricultural productivity through the use of agricultural residues and waste in productive processes; increased employment opportunities in agriculture, industry, infrastructure and research in both rural and urban areas; and reductions in pollutants, including GHG. Africa could exploit potential international trade opportunities in the case that biofuels are produced on a large scale with the development of appropriate technologies. However, there are legitimate concerns that the production of biofuels can compromise food production. This can occur in two ways either through competition for existing land or through economic aspects. In addition, small-scale farmers could be squeezed out by powerful large companies producing for export rather than the local market. The production of biofuels should be considered from a holistic point of view that identifies the most suitable renewable sources, technologies and types of biofuel (or vector) in the context of the local social, economic and environmental conditions. In other words, all possible risks should be averted by careful evaluation and consideration of multiple issues.
xxii
The main issues at local level to ensure sustainability of bioenergy production in developing countries in general and in Africa in particular are:
• provide policy support for small producers and cooperatives in the form of financial incentives such as access to credit, tax benefits, and greater use of Clean Development Mechanisms (CDM). Create policy support to facilitate sustainable international biofuel trade and guarantee access to it;
• develop economies of scale to control future production costs. The need to match social and environmental benefits to the achievement of these economies of scale means that action needs to be taken to organise small producers into cooperatives;
• provide access to technology and improve investment in R&D in countries that have just started to produce bioenergy. Enable technology transfer (TT) from countries already exporting bioenergy, e.g., technologies for sugarcane based on bioethanol and oil seed based biodiesel are already well developed. Technologies for other types of feedstock, such as jatropha, require further development. Policies are needed to expedite transition to second generation feedstocks and technologies that will enable dramatically increased production at lower cost, and reduce negative environmental impacts. Bioenergy related TT would be an interesting test for more ambitious South-South cooperation;
• corporate social responsibility (CSR) goals: Fostering a clear and universal certification scheme including a criteria and indicators system for the sustainability of bio energy production and trade. This should include all levels of sustainable development (environmental, social, economic) through an integrated analysis of a broad spectrum of sectors (agriculture, forestry, energy, trade) in production and trade chains in order to improve societal well being in terms of better environmental performance, higher social standards (e.g. standard minimum requirements for working conditions, human rights, gender equity) and ethical and sustainable economic development (e.g. creating opportunities for economically disadvantaged producers, improving transparency and accountability, creating trade relationships). The agricultural sector has several certification systems referring to different types of farming, i.e. organic, integrated or good practice agricultural production (Lewandowski 2004);
• promote participatory decision making: involve all rural populations and stakeholders in planning and decision-making in order to achieve sustainable energy development. Special attention should be devoted to involving women, who bear the burden of traditional energy systems and are likely to be the greatest beneficiaries of improved systems. More active involvement of rural people and their institutions in identifying rural energy problems and in formulating and implementing plans to overcome them, would result in more efficient, rational use of resources and more equitable sharing of the benefits of development;
• implementation of land-use policies to prevent negative impacts from land-use changes (e.g. by controlling access to and use of high-natural-value areas and habitats, cultural sites, etc.). Bioenergy production should be concentrated on available arable land. Bioenergy crop development must be restricted to areas where other crops are not competing.
xxiii
It should be remembered that biofuels are not the only solution to guaranteeing energy security in Africa. It is important to assess the available solution taking account of local economic, social, environmental and technical conditions. Without a detailed examination of the technologies available to exploit RES, short term solutions might be favoured, whereas the efficient use of RES are associated with medium and long term sustainable solutions. It is hoped that this report will provide African decision-makers and other stakeholders with basis for the preparation of an integrated programme for African countries with the following objectives:
• increasing security of energy supply through diversification and progressive substitution of oil
• increasing agricultural productivity through the use of agricultural residues and waste in productive processes
• increasing employment opportunities in agriculture, industry, infrastructure and research
• reducing polluting emissions, including GHG • identifying the most viable technology for RES.
As far as the ICS contribution in the possible programme is concerned, the support of the High Technology and New Material Area could focus on the
• design, development and implementation of pilot projects for identification and selection of suitable technologies for solid, liquid and gaseous biofuels production utilising integrated conversion platforms;
• economic and environmental evaluation of each proposed technology; • TT with special attention to the involvement of local industry the
production of parts and components for processing plants; • cooperation with local institutions for creating national policies
1
1. Introduction
There has been phenomenal growth in the global production and use of liquid biofuels, mainly ethanol and bio-diesel. In Africa, the longest continuously operating biofuels programme is in Malawi, where ethanol from sugar cane has been blended with gasoline since 1982. Other efforts in biofuel production are much smaller and or have not operated continuously. In recent years, there has been renewed interest in biofuels, resulting in a number of new pilot projects and exploratory studies in Africa and around the world. This renewed interest in biofuels in Africa is attributable to a number of factors that include the rising and volatile price of oil, ongoing efforts to revitalise the agricultural sector in the face of low commodity prices, agricultural and trade policy reforms, local and global environmental challenges, the need to create new jobs and stimulate rural development, and the availability of new and more efficient technologies. Between 2000 and 2005, global production of ethanol and bio-diesel increased by 0.9 to 3.9bn litres respectively.14 Second generation technologies based on the use of non-food producing perennial crops are also being developed. These technologies use the whole plant as feedstock and are based on enzymatic breakdown of ligno-cellulose residues and waste to produce ethanol, while bio-diesel can be synthesised from wood straw to a gasification stage. A wide range of proven and pilot technologies, which are described in this report, can be used to convert the various forms of biomass into modern types of energy or just biofuels (liquid, solid, gaseous), thereby increasing access conversion efficiencies and reducing deforestation, reducing pollution and providing energy for industrial uses. The development of biofuel in Africa could bring multiple benefits such as: increased security of energy supply through diversification and progressive substitution of oil; reduced national oil import bills; increased agricultural productivity through the use of agricultural residues and waste in productive processes; increased employment opportunities in agriculture, industry, infrastructure and research in both rural and urban areas; and reduced emissions, including GHG. Furthermore, the development of new technologies might enable Africa to take advantage of potential international trade opportunities, through the large scale production of biofuel. However, there are legitimate concerns that the production of biofuel could compromise food production either through competition for existing land or through economic feedbacks. It is also possible that small farmers could be squeezed out by powerful large companies producing for export at the expense of the local market. It is imperative to examine the potential production of biofuels in a holistic manner identifying case by case the most suitable source, technology and type of biofuel for the local social, economic and environmental conditions. RES are the only resources capable of increasing the sustainability and security of energy supply, but there are some fundamental barriers to their development, including:
14 Renewables Global Status Report, 2006 Update, www.ren21.net

2
• uncompetitiveness: in most cases RES power plants have higher investment and energy costs than conventional ones however the health and ecosystem benefits that accompany them often outweigh these cost disadvantages;
• planning, legal and financial instruments and methods are often incoherent: RES development has to be supported indirectly by taxes on non-RES resources (carbon tax, etc.) to recover the ‘external’ costs, and directly by subsidised investment and/or use, and regulation that supports its diffusion. All have to be coherent with an energy plan with a clear goal to develop RES;
• technologies and infrastructure improvements needed: in some cases there are not the technologies and capabilities required to develop and implement RES projects
This report aims to be a comprehensive source of information and reference on the topic of renewable energy for the use of decision-makers in developing countries, particularly in Africa. It highlights the following aspects in relation to renewable energy:
1. the current outlook for the African continent 2. the state-of-the-art of the different generation of technologies for sustainable
energy production 3. mapping of RET in Africa 4. specific analysis of biofuels in Africa, perspectives, scenarios and
shortcomings 5. the policy and regulatory frameworks affecting the promotion of RES,
financing mechanisms and TT processes 6. advantage and risks.
This report represents the efforts of scientists, technologists, policy-makers, and specialists in different international organisations, including UNIDO, ICS, UNDP, FAO and IEA. The document is organised as follows. Chapter 1 describes the current work of ICS/UNIDO in relation to the promotion and development of projects related to RES and Renewable Energy Technologies (RET) in developing countries; Chapter 2 examines the state-of-the-art of RES for the sustainable production of energy focusing on the technologies for bio resources and biomass. Chapter 3 discusses the mapping of RET, including solar, wind, hydro, geothermal and biomass, in the African countries to provide a picture of what African countries may able to exploit in terms of renewable resources. Chapter 4 analyses the technological issues related to the exploitation of RES based on biomass, and examines the advantages and disadvantages vs fossil based energy sources. Chapter 5 describes the introduction of biofuels in various countries and examines the impacts of RES in these countries and Chapter 6 focuses on the different products obtained from biomass utilising first generation technology to produce liquid fuel such as bio-ethanol, biodiesel, bio-methane and bio-methanol. Chapter 7 focuses on the production of solid fuels from biomass resources. Chapter 8 examines the second generation technologies related to the production of biofuels from biomass, including
3
ligno-cellulose ethanol, syngas or gas fuel and pyrolisis-oil based fuel. Chapter 9 examines the sustainability of biomass as a RES, the energy balance and productivity of this type of energy and the environmental and socio-economic implications for its use. Chapter 10 provides some guidelines for developing countries, especially in Africa, in terms of formulating policies, strategies and instruments (financial and technological) related to the effective use and exploitation of RES and related technologies. 1.1 ICS-UNIDO Programme and Activities in the Field of Renewable Energy The International Centre for Science and High Technology (ICS) of the United Nations Industrial Development Organization (UNIDO) has the mandate of strengthening the scientific and technological (S&T) capacity and competence of developing countries in order to support their effort toward social and economic development with special emphasis on transfer of appropriate, sustainable and environmental friendly technology. UNIDO is contributing to achievement of the Millennium Development Goals (MDGs) through a number of programmes and projects aimed at providing an effective response to the growing industrial divide, by addressing the three thematic priorities: • Poverty reduction through productive activities • Trade capacity building • Energy and environment. ICS activities, as detailed in the Institutional Agreement signed in 1993 between the Italian Government and UNIDO, are in three scientific areas (International Institutes): 1) Pure and Applied Chemistry; 2) Earth Environment and Marine Science and Technologies; and 3) High Technology and New Materials, to improve technical and scientific knowledge and participation in the development and utilisation of new and advanced technologies in developing countries, which are required for the accumulation of industrial and technological capability and competitiveness. To alleviate the challenges faced by developing countries in achieving social and economic growth, ICS has developed a strategic work plan based on a practical step-by-step approach to awareness building, training-of-trainers, advisory services and assistance, designed to build, develop and strengthen national capacity in TT and partnership development. 1.2 High Technology and New Materials (HTNM) In the past, HTNM area programmes and activities have been dedicated to supporting and cooperating with developing countries within four scientific/technical fields: Laser application, Building materials, Information and Communication Technologies (ICT) and Renewable Energy (RE). The medium/long-term objective of the RE sub-programme aims at providing assistance to all developing countries in acquiring technologies and knowledge related to energy
4
production based on local resources, for cooking, food conservation, lighting and communication, for rural communities and micro, small and medium enterprises, as users and producers of both energy, and equipment for energy production. At the same time, there is a demand for promotion and diffusion of the technologies and knowledge that these countries are able to produce, mainly within the UNIDO network of technology centres (TCs), a number of which are specialised in technologies related to energy production. Within this framework, ICS aims to be a hub of the network of TCs supporting and promoting activities and results worldwide. It is hoped that this network will be able to provide technology support to developing countries with ICS providing ad hoc support activities, such as capacity building (training courses, fellowship programmes), development of decision-support tools, establishment of innovation TCs, etc. It is hoped that, in cooperation with UNIDO HQs, a continuous project can be implemented that focuses on the production of small quantities of energy, (less than 50-100kw), using local renewable resources for the benefit of needy communities. The development and diffusion of low-cost and low maintenance technologies for small local production of energy is ideal for community use in schools, small hospitals, for telecommunications (including business centres), in small craft factories and industries, food conservation, call centres, etc. The UNIDO HQs and the TC network have a better picture of local requirements in the respective S&T fields. However, in certain cases they have limited resources to respond to these needs. Closer cooperation with ICS could enable access to the S&T environment, regular upgrading of in house expertise and promotion of local programmes and projects. At the same time, ICS, through the TCs, can target local industrial sectors that are the end users of the activities. ICS is actively cooperating with the local institutions and supporting the effort of their countries towards economic and social development by offering targeted fellowship programmes and training for technicians and scientists who return to their home countries to train others. Another activity within this multiyear project is the collection and evaluation of national policies, incentives, support programmes in developed and developing countries, with the scope of promoting the use of renewable resources and supporting the local production of energy from renewable resources, etc. for communities and to support the local production/assembly of equipment and plant producing energy from renewable resources. Energy saving also needs to be considered. Finally, the possibility to study, to provide ad hoc funding for pilot plants, equipment and spin offs, should be included in ICS activities. The expected impacts in socio-economic terms are:
• assist developing countries in the assessment of small local energy resources: solar, hydro, geo, biomass, etc. for productive uses, and energy savings and process improvements opportunities in selected sectors
• increase human resource capacities and capabilities
5
• strengthen the decision-making process at policy and regulatory levels for sustainable industrial development
• promote local production of parts and components for equipment/plant for renewable resources utilisation, such as solar driers, solar ovens, photovoltaic (PV) panels for tele-centres, etc.
This project is currently being implemented in cooperation with relevant UNIDO field offices. 1.3 Africa’s Renewables Situation15 The major share of human ’appropriation’ of biomass is for food, animal feed, and bio-materials mainly fibre, and timber for construction. Currently, only about 10% of the biomass produced is used as biofuels, although residues are used to fuel cooking stoves, furnaces and power plants. Forms of biofuels supply about 10% of the world primary energy demand, representing 90% of the global contribution of all renewable energies (Global Status Report, 2006). While biofuel share in the energy supply of the OECD countries has decreased,16 it remains an important source of energy in developing countries where on average a third of all primary energy comes from biomass; in some African countries, this can be up to 90%. Approximately 2bn people depend nearly exclusively on traditional bio-energy such as firewood or dung, mainly used for cooking (Karekezi 2004). 1.3.1 Future Prospects Optimistic forecasts show that bio-energy could provide more than twice current global energy demand, without competing with food production, forest protection efforts, or biodiversity. In the least favourable scenarios, however, bio-energy would supply only a fraction of current energy use, perhaps even less than it provides today. This significant uncertainty in the potential of sustainable global biofuel is a consequence of the uncertain future agricultural and land-use policies, especially in developing countries. Factors such as increases in productivity could free up land for biofuel crops, and conversion of marginal and degraded land into biomass production areas could further expand the resource base. On the other hand, the impacts of climate change, such as heat waves and droughts, and competing land uses (food, nature conservation) could severely restrict the biofuel potential. 1.3.1.1 Feed vs Food A key concern in the global biofuel discussion is the competition over land-use for biofuels production and production of food and feed. In addition, there are economic (price) feedbacks, exemplified recently in the fluctuations in the prices of sugar and corn. This competition has a special significance insofar as food security is concerned, and the
15 Extract from UNIDO Biofuel Strategy – Draft 6 March 2006. 16 There are some exceptions to this trend, e.g., Austria, Denmark, Finland, and Sweden. Also in Germany, drastically higher shares of bio-energy are expected in the future (Fritsche et al. 2004).
6
MDGs clearly require policies to reduce hunger, and increase food security. In this respect, a switch to large-scale bio-energy production might have adverse indirect impacts on food security. As long as biofuels mainly come from plants that can also be used for food/feed production, the economic effects of coupling the energy (i.e. biofuel) market with the food/feed markets could increase food/feed prices, and reduce access for many to affordable food/feed. The indirect effect of increased prices for traditional agro-products, however, could increase incomes for farmers (and countries), and thus help to increase food security, depending on how the increased income was distributed. The outcome of such developments is still being debated, and the FAO has announced a programme of detailed research into the food-versus-fuel issue (FAO, 2006). The outcome of this research should provide safeguards for future biofuel development against food/feed competition.
1.3.2 Economic Competitiveness Concerning the economic competitiveness of biofuels, heating applications based on modern biofuels are already competing with oil and gas, and electricity generation using biogas from residues, landfills, or waste-water treatment undercuts the costs of oil- and gas-fired power plants. Ethanol produced from sugarcane in Brazil is competitive without subsidies at US$35-50/bbl oil (WB 2005), although most other liquid biofuels for transport use need further development before becoming economically attractive against oil prices in the US$50/bbl range. Volatility in oil prices could endanger investments in the market introduction of biofuels.
1.3.2.1 Trade Implications International trade in biofuels involves global players, with small and medium sized enterprises (SMEs) playing only minor roles. As a consequence of the energy price and supply security developments, however, interest in global trade in biofuels is increasing. Since the mid-1990s, biomass trade flows have expanded rapidly, partly as a result of reduced marine bulk transport costs. Many trade flows are between neighbouring countries, but long-distance trade also occurs, for example, with exports of ethanol from Brazil to Japan and the EU, palm kernel shells from Malaysia to the Netherlands, wood pellets from Canada to Sweden. Nearly all of that trade is across waterways, or uses large maritime cargo vessels. The IEA Bio-energy Task 40 projects a significant increase in global shipping of biofuels in coming years. In addition, the failure of the WTO Doha Round to open the agricultural markets of the OECD countries (and to restrict subsidised agricultural exports) has shifted the focus of traditional farming from cash crops to dedicated bio-energy crops, which have the potential for higher revenues on international markets if converted into biofuels.17 1.3.3 Sustainability Issues With the 2002 World Summit on Sustainable Development (WSSD) in Johannesburg and the formulation of the MDGs,18 sustainable development in general, and its link to energy
17 Market access and differences in tariff structure are another cause. Also, bio-diesel is regarded as an industrial product, whereas bio-ethanol is treated as an agricultural product and, therefore, attracts higher import duties. 18 Although there is no specific MDG relating to energy, the MDGs cannot be met without affordable, accessible and reliable energy services (UN Energy 2005).
7
have become prominent issues in global fora. There are currently many national and international initiatives underway to safeguard against the negative social and environmental impacts of future bio-energy developments. Concerns over land use (as referred to in the food vs feed discussion), land ownership, loss of biodiversity and genetically modified organisms (GMOs), GHG emissions, soil erosion and other soil degradation, water use and water contamination, human health impacts, labour conditions and children’s rights are all part of the sustainability discussion and international efforts to formulate standards. 1.3.4 Climate Change Bio-energy compared to fossil fuels could drastically reduce GHG and other emissions if managed properly. However, there are many factors to be taken into account when quantifying GHG emissions. Current knowledge of GHG balances in biofuels indicates a rather large range (Larson 2006). For specific regions, such as the EU, quantification is possible with regard to the different bio-energy crops, conversion routes, and by-product utilisation rates (OEKO 2006). For other regions such as the USA, and a few developing countries (Brazil, China, India), some data on the life-cycle GHG balances exist, while in other countries, for example Thailand, there is ongoing research in this area. 1.3.5 Technology Transfer Realisation of the potential of biofuels depends to a great extent on the availability of competitive conversion technologies which are not readily available in developing countries. Thus, it will be necessary to provide support mechanisms to encourage the transfer of relevant technologies and associated capacities from technology producers to technology markets. UNIDO’s focus will be on providing such support mechanisms and the following sections describe the current situation with regard to existing and future conversion technologies.
1.4 Existing Conversion Technologies 1.4.1 Solid Biofuels The conversion of solid biofuels to energy is a traditional human activity – from the fire used in pre-historic times to modern cooking stoves,19 and electricity generation from biogenic residues burnt to generate steam for high-pressure-turbine power plants. Biomass gasification technology based on solid biofuels has become commercially viable for both power generation and process heat applications in industry, realising the potential of the technology to achieve distributed power energy for industrial applications for SMEs. The market introduction of such technologies is far more rapid in developing countries, such as India, than in industrialised areas. Medium-to-large cogeneration technologies using biofuels are already in the market, and could benefit from gasification developments, especially for industrial process heat and
19 It should be noted that modern biomass use for cooking is also an issue at household level (e.g., through efficient stoves, biogas, ethanol-based gelfuel). As this report is mainly concerned with biofuel conversion in the industrial sector, these technologies are not discussed further.
8
on-site cogeneration. With ‘hybrid’ schemes and ‘bio-refineries’ for multiple outputs becoming more and more available, power and fuel markets might overlap or even merge, allowing the bio-energy industry to optimise its outputs according to market developments and revenue opportunities. The emerging bio and thermo-chemical conversion systems for bio-energy will be closely related to the transport sector. Indirectly, this will also couple the commodity prices for traditional agricultural and forestry products with those in the energy sector. This development could mean that the agro- and forestry product industries will have to pay closer attention to biofuel market developments in order to decide whether to become active in these markets. Hence, there is a need for support for decision-making processes especially in SMEs. 1.4.2 Liquid Biofuels Bio-ethanol and bio-diesel have emerged as the dominant global liquid biofuels for replacing fossil fuels (i.e. gasoline and diesel) not only in the transport sector, but also for heat and electricity generation.
Bio-ethanol from biomass as a substitute for gasoline is currently the main biofuel used globally as it has proven efficiencies, and established economics. Suitable biogenic feedstocks contain high shares of sugar, or starch. Sugar cane in particular stands out as the feedstock that is providing large quantities of ethanol in Brazil. Other crops that can be converted into ethanol are cassava,20 maize, potatoes, sorghum, sugar beet and wheat. The conversion of their starch content into sugar has high process energy demands, making the cost of the final product rather high. Bio-diesel is an important liquid biofuel: oilseed-yielding plants such as castor, cotton, jatropha, palm, rape, soy, etc. offer a feedstock from which straight vegetable oils (SVO) can be derived by physical and chemical treatment (milling/refining). For developing countries it is potentially valuable that bio-diesel can be derived from plants such as jatropha, which have comparatively low yields, but need only minor inputs so that their overall costs should be moderate where land and labour costs are low. Jatropha can also be grown on marginal and even degraded land, and needs very little irrigation during the first few years.
1.4.3 Gaseous Biofuels Biogas – at least in Europe - has developed beyond the mere fermentation of biomass residues, such as dung, liquid manure, or organic household waste, to be available from industrial wastes and ‘modern’ bio-energy crops such as maize (corn), wheat, as well as mixed or double cropping farming systems, which can integrate various ‘old’ plant varieties into their rotation, to give net energy yields comparable to the best palm oil, or sugarcane plantations.
20 Research in Thailand indicates moderate prospects for future cassava-based ethanol (JGSEE 2006).
9
1.5 Future conversion technologies 1.5.1 Liquid biofuels Since the mid 1990s, other options for liquid biofuels have been researched and two ‘new’ conversion routes are currently in the pilot stage. These next or 2nd generation biofuels differ in terms of technology and benefit from a larger biomass feedstock supply. To extend the biofuels yield, the whole plant material is to be used as a feedstock. In addition, the feedstock can come from ‘non-food’ perennial crops (woody biomass and tall grasses) and ligno-cellulose residues and wastes (e.g. woodchips from forest and harvest residues as well as surplus straw from agriculture). Ligno-cellulose biomass from fast-growing perennial crops such as short-rotation wood and tall grass crops requires less agrochemical inputs. Furthermore, the root systems of perennials remain in place after harvest which enables these crops to reduce soil erosion, and increase carbon storage in soil. However, high biomass yields will typically be achieved only on good soils with sufficient water supply. 1.5.2 Gaseous Biofuels Biogas can be upgraded to ‘substitute natural gas’ (SNG) which can be fed into existing natural gas pipeline systems (both locally, nationally, or even for cross-border trade). Alternatively, it can be compressed into ‘green’ compressed natural gas (CNG) to be used in gas-engine vehicles (buses, cars, trains, trucks, etc.). Biogas-derived SNG can be blended with natural gas in any mix. Biogas can be processed into a green GtL (gas-to-liquid), thus becoming directly available as a powerful and very clean-burning liquid fuel, although this route is rather costly. Nevertheless, with the notable exception of Argentina, current markets for CNG vehicles are rather small, and gas transmission and distribution infrastructures are often lacking in developing countries.
1.5.3 Bio-refineries Biomass can be converted not only into biofuels, but also into bulk and fine chemicals (or biomaterials), which are nearly equivalent to those derived from fossil hydrocarbons, and might offer more interesting revenues than bio-energy or biofuels alone. The concept of a ‘bio-refinery’ aims to optimise the conversion of biomass feedstocks so that its output mix reflects the highest revenues and covers the most attractive markets. As with the 2nd generation biofuel technologies to which bio-refineries are closely related, it is currently not possible to know with certainty how the bio-refinery concept might perform, what its costs would be, and which products could be delivered to the market. The overall bio-refinery technology paradigm is important, however, as it indicates a willingness to consider biomass in all potential areas of application. If process control evolves, the bio-refinery paradigm might foster spin-offs suitable for smaller-scale application, i.e., benefiting not only hi-tech businesses, but also SMEs in developing countries. It should be understood that this is a possibility, not a certainty.
10
1.6 Potential of Bio-fuels for Developing Countries: Current and Future Situation Biofuels are relevant RES especially in developing countries, and have the potential to provide up to 30% of global energy consumption in the near future (based on the vast potential of energy efficiency in the transport sector). The realisation of this potential depends on technological improvements, innovations, and market conditions in both developing and developed countries. It is anticipated that increased flows of biofuels could come from agriculture and forestry when, as in some countries, pre-processing and conversion of dedicated bio-energy crops and residues or by-products into marketable biofuels e.g., pellets, ethanol, bio-diesel, etc. become parts of agro and forestry businesses. Future liquid (and gaseous) 2nd generation biofuels for transportation could come from non-food crops, cellulose biomass, and wood. Brazil is the most active player in liquid biofuels, but China, India, several Latin American countries, Malaysia, South Africa and Thailand also have national liquid biofuels programmes. Most developing countries have started to consider liquid biofuels as a domestic energy option, or as an export commodity. Several developing and industrialised countries’ governments have implemented legal requirements to introduce liquid biofuels through quota schemes for blending biofuels with petroleum-based gasoline and diesel, or through preferential tax treatments (WWI/gtz 2006).
1.6.1 Africa The renewed interest of African countries in biofuels is attributable to a number of factors including:
• ongoing efforts to revitalise the agricultural sector in the face of low commodity prices • agricultural and trade policy reforms • local and global environmental challenges • need to create new jobs • stimulate rural development • availability at international level of new and more efficient technologies.
Furthermore, the recent high and volatile prices of oil have forced the majority of African countries, which are net oil importers, to develop innovative policies to mitigate the impact of these high prices on their economies. The most effective policy in this respect is the diversification of energy supply sources; in the transport sector, liquid biofuels appear to offer the best opportunities In fact, a wide range of proven technologies can be used to convert the various forms of biomass into modern energy carriers or just biofuels (liquid, solid, gaseous), thereby increasing access conversion efficiencies and reducing deforestation and pollution and providing energy for industrial uses.
The development of biofuels in Africa, however, is bound to create a number of challenges including:
11
• Which conversion technologies are appropriate for which regions and using which feed? • What policies need to be in place to support the development of biofuels and minimise
the potential challenges that include environment, food and feed competition, competition for land, etc?
• Who are the stakeholders and what are their roles? • How can funding for biofuels projects be accessed? • What biofuels conversion platforms could be developed and in which regions? • With the potential for increased international trade in biofuels, how can countries in
Africa position themselves to maximise the potential benefits? Therefore, it seems necessary to undertake the production of biofuels, mainly in Africa, following a holistic approach to identify the most suitable sources, technologies and types of biofuel for the local social, economic and environmental situation. The possible risks of each technological and resource option need to be evaluated. This report focuses mainly on second and third generation technologies applied in the production of bio-fuels (solid, liquid and gaseous) from biomass and constitutes a first analysis of renewable energy in Africa, based on the technologies applied in the production of energy from non-biological systems (geothermal, hydropower, solar, wind).
This overview is important to focus attention on the risks associated with processing biomass produced in areas where other kinds of RET could be more easily applied. It is expected that both institutions and decision-makers will find this report informative for supporting and assisting their decisions in relation to policy and incentives, and that local entrepreneurs could use it as source of potential investment project ideas. This policy proposal could be made more robust and more sustainable by the development of some of the ideas it promotes. Finally, it is important to stress the benefits and risks related to the use of biofuels in Africa.
Biomass use – Benefits The development of biofuels in Africa could bring multiple benefits such as increased energy supply security through diversification and progressive substitution of oil; reduced national oil importation bills; increased agricultural productivities through the use of agricultural residues and waste in productive processes; increased employment opportunities in agriculture, industry, infrastructure and research in both rural and urban areas; and reduced emission of pollutants, including GHG. Africa could take advantage of potential international trade opportunities if biofuel were to be produced on a large scale using appropriate technologies.
Biomass use – Risks There are legitimate concerns that the production of biofuels can compromise food production either through competition for existing land or through economic feedbacks. In addition, there are significant chances that small farmers could be squeezed out by powerful large companies interested in producing for export rather than the local market.
12
2. Renewable energy - current outlook 2.1 Energy and sustainability Energy is crucial for the three dimensions related to sustainability:
1. Economic: many countries import up to 50% of their trade balance in energy. The energy price defines an important part of economic development. 2. Social: about 2bn people, mainly in sub-Saharan Africa and Southern Asia, do not have access to modern energy sources for cooking, heating, lighting, cooling, transport, communication, etc.. Energy consumption per capita in developing countries represents one sixth of European and one tenth of US per capita energy consumption. 3. Environmental: a large proportion of toxic emissions is related to energy systems; the rate of energy consumption is much faster than energy production.
The problems related to energy use and production have become increasingly widespread involving not only scientific institutions, energy companies and governments, but also industries and consumers. Therefore, institutions, governments, companies and citizens must work together to find a solution based on:
1. international, national and local planning 2. legal and financial instruments 3. actions, i.e. implementing sustainable methods, technologies, uses
and processes Resolutions to the world’s energy problem present a huge challenge that involves sustainable development of renewable energy and changes to the current model of industrial and social development. A sustainable energy system must involve the whole energy chain, from the energy supply sectors to the end users, the technologies must change and adapt to the new era. There are several possible solutions, but the issues surrounding the sustainability of renewable energy are complex and the time availability is short. Hence, the promotion and implementation of methods, technologies and processes for a sustainable economic, social and environmental development of energy production and use are crucial. Furthermore, operative and competitive sustainable energy systems have been implemented with different levels of success. In the near future, energy systems must become sustainable, efficient, cost-effective, and safe so the energy must be abundant, clean and appropriate to different local conditions. Within this scenario the key issues are efficiency and sustainable efficacy, which means the implementation of closed cycles for energy resources (CCER).21
21 It is feasible to use biomass to produce at the same time three products: electricity, heat, and depot fertiliser. All that remains when production is completed is pure water. Corn silage mixed with manure is especially suited for producing biogas. In the next step, the biogas from fermentation is combusted to produce electricity and heat through the cogeneration process. The byproducts of biogas generation are recycled, all material cycles are closed – the byproducts that remain after fermentation are used to produce fertiliser and thus return to the biosphere.
13
World energy consumption is constantly increasing and will pass from 411EJ in 2006 to 900EJ in 2050;22 that is, from 10 to 22Gtoe. Also, the world’s population is forecast to increase from 6bn to 9bn in the same period, and per-capita energy consumption to increase from 68Gj/y to 100GJ/y. rendering security of energy supply and the North-South energy balance unequal due geopolitical distribution, exhausted reserves, increased oil prices, etc. Moreover, local and global environmental problems will increase, human activity is responsible for 90% of GHG emissions (IPCC 2001), there will be an increase in the mean earth temperature of between 1.8°C and 4°C, and an increase in sea levels of between 18cm and 59cm; CO2 emissions in the next 100 years will continue and environmental damage will represent 5-20% of world GDP.
The Kyoto Protocol, even if totally adopted, would not be sufficient to solve these problems. Italy’s goal for 2010 was to reduce by 6.5% its 1990 CO2 emissions; in 2006 emissions were 13% higher. New objectives and measures need to be implemented at EU level to reduce CO2 emissions by 8% by 2010, 20% by 2020 and 50% by 2050 to stabilise at 550 ppbv.23 If implemented by 2020, there will be an increase of 20% of energy efficiency meaning that 20% of primary energy sources will come from RES and 10% of biofuels24 will be used in the transport sector. This would have global consequences and constitute important changes in both energy sources and vectors.
From the beginning of human history to 1850 the main source of energy was biomass - animal and vegetable; from 1850 to 1900 coal and gas were the predominant energy components and from 1900 to 2000 petroleum and natural gas have been the key fuels. Up to 2050 there will be coexistence of solid fuel (from biomass), coal and nuclear; liquid fuel (such as petroleum, bio-ethanol, vegetable oil, bio-diesel, synthetic liquid biofuels), and gaseous fuel (such as natural gas, biogas, synthetic gaseous biofuels and hydrogen), as indicated in Figure 2.1
The focus in energy systems should be on the appropriate resources and technologies and the scale of application, which should be tuned to local conditions.
22 Consumption forecast. 23 Ppbv stands for Part Per Billion by Volume. 24 Energy European Commissioner in the International Conference on Biofuels of 5-6/7/2007 said that the targeted 10% biofuels could be produced within Europe, but the biofuel with the lowest amount of CO2 should be selected, regardless of the place of production.
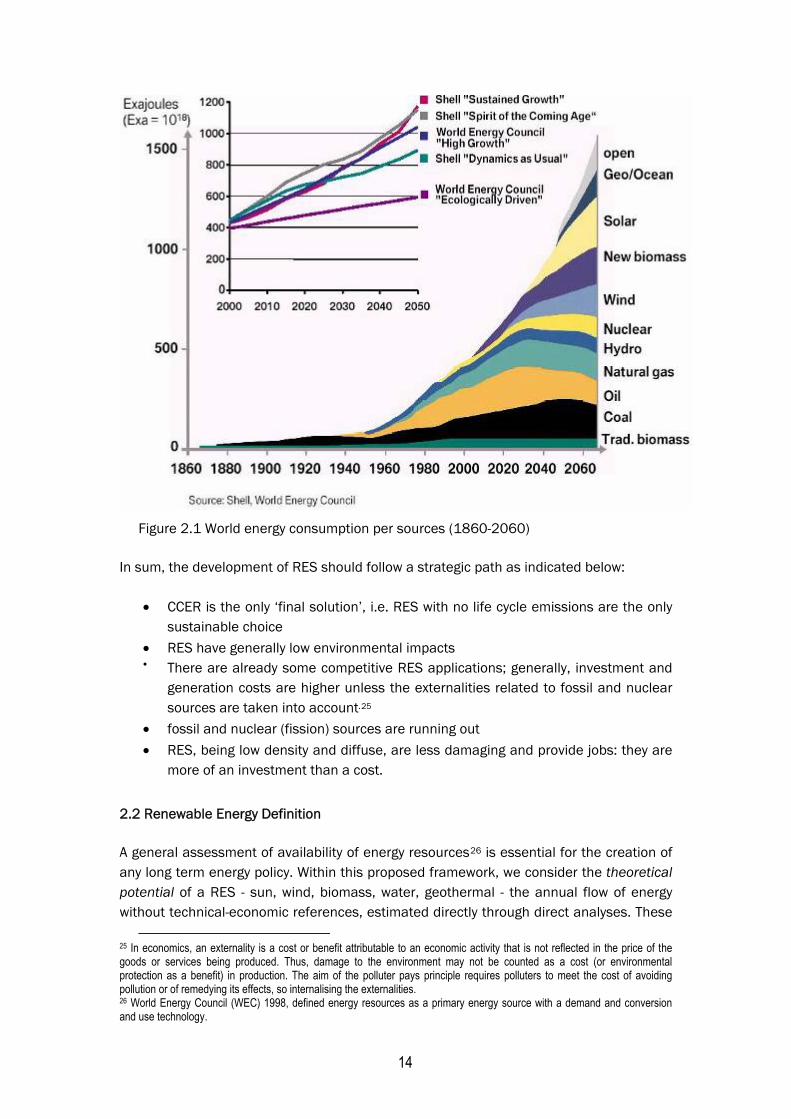
14
Figure 2.1 World energy consumption per sources (1860-2060)
In sum, the development of RES should follow a strategic path as indicated below:
• CCER is the only ‘final solution’, i.e. RES with no life cycle emissions are the only sustainable choice
• RES have generally low environmental impacts • There are already some competitive RES applications; generally, investment and
generation costs are higher unless the externalities related to fossil and nuclear sources are taken into account.25
• fossil and nuclear (fission) sources are running out • RES, being low density and diffuse, are less damaging and provide jobs: they are
more of an investment than a cost.
2.2 Renewable Energy Definition
A general assessment of availability of energy resources26 is essential for the creation of any long term energy policy. Within this proposed framework, we consider the theoretical potential of a RES - sun, wind, biomass, water, geothermal - the annual flow of energy without technical-economic references, estimated directly through direct analyses. These
25 In economics, an externality is a cost or benefit attributable to an economic activity that is not reflected in the price of the goods or services being produced. Thus, damage to the environment may not be counted as a cost (or environmental protection as a benefit) in production. The aim of the polluter pays principle requires polluters to meet the cost of avoiding pollution or of remedying its effects, so internalising the externalities. 26 World Energy Council (WEC) 1998, defined energy resources as a primary energy source with a demand and conversion and use technology.
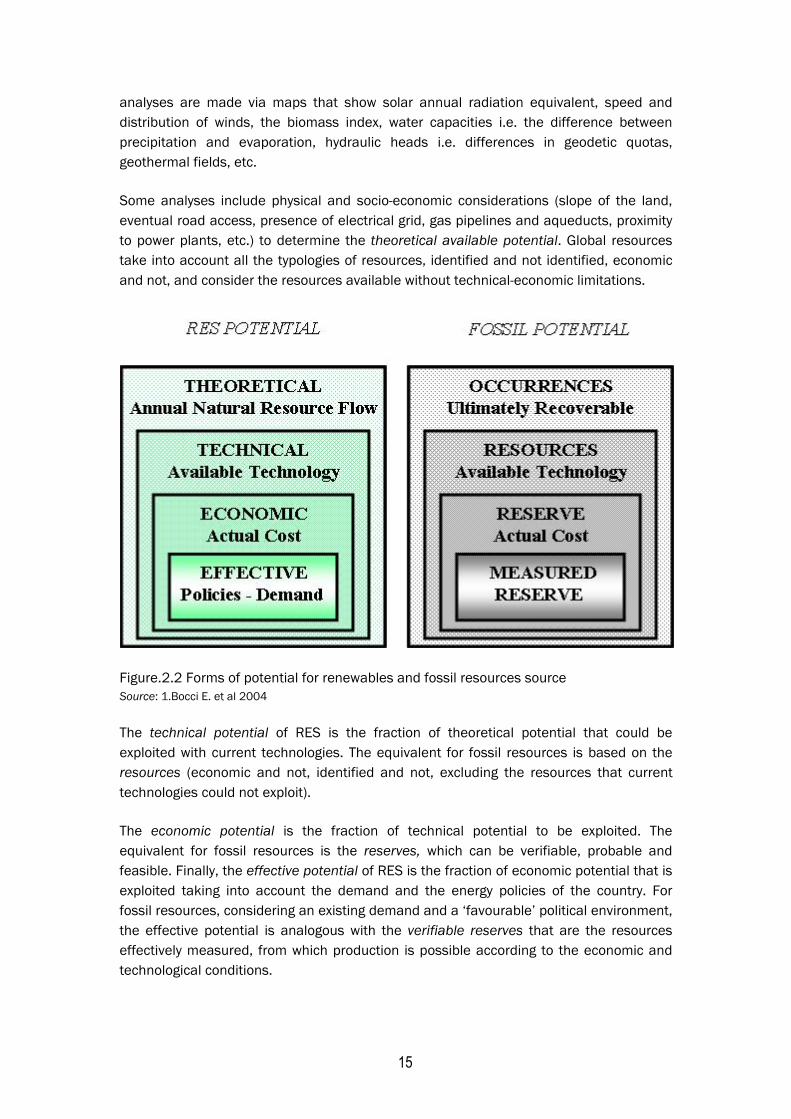
15
analyses are made via maps that show solar annual radiation equivalent, speed and distribution of winds, the biomass index, water capacities i.e. the difference between precipitation and evaporation, hydraulic heads i.e. differences in geodetic quotas, geothermal fields, etc.
Some analyses include physical and socio-economic considerations (slope of the land, eventual road access, presence of electrical grid, gas pipelines and aqueducts, proximity to power plants, etc.) to determine the theoretical available potential. Global resources take into account all the typologies of resources, identified and not identified, economic and not, and consider the resources available without technical-economic limitations.
Figure.2.2 Forms of potential for renewables and fossil resources source Source: 1.Bocci E. et al 2004
The technical potential of RES is the fraction of theoretical potential that could be exploited with current technologies. The equivalent for fossil resources is based on the resources (economic and not, identified and not, excluding the resources that current technologies could not exploit).
The economic potential is the fraction of technical potential to be exploited. The equivalent for fossil resources is the reserves, which can be verifiable, probable and feasible. Finally, the effective potential of RES is the fraction of economic potential that is exploited taking into account the demand and the energy policies of the country. For fossil resources, considering an existing demand and a ‘favourable’ political environment, the effective potential is analogous with the verifiable reserves that are the resources effectively measured, from which production is possible according to the economic and technological conditions.
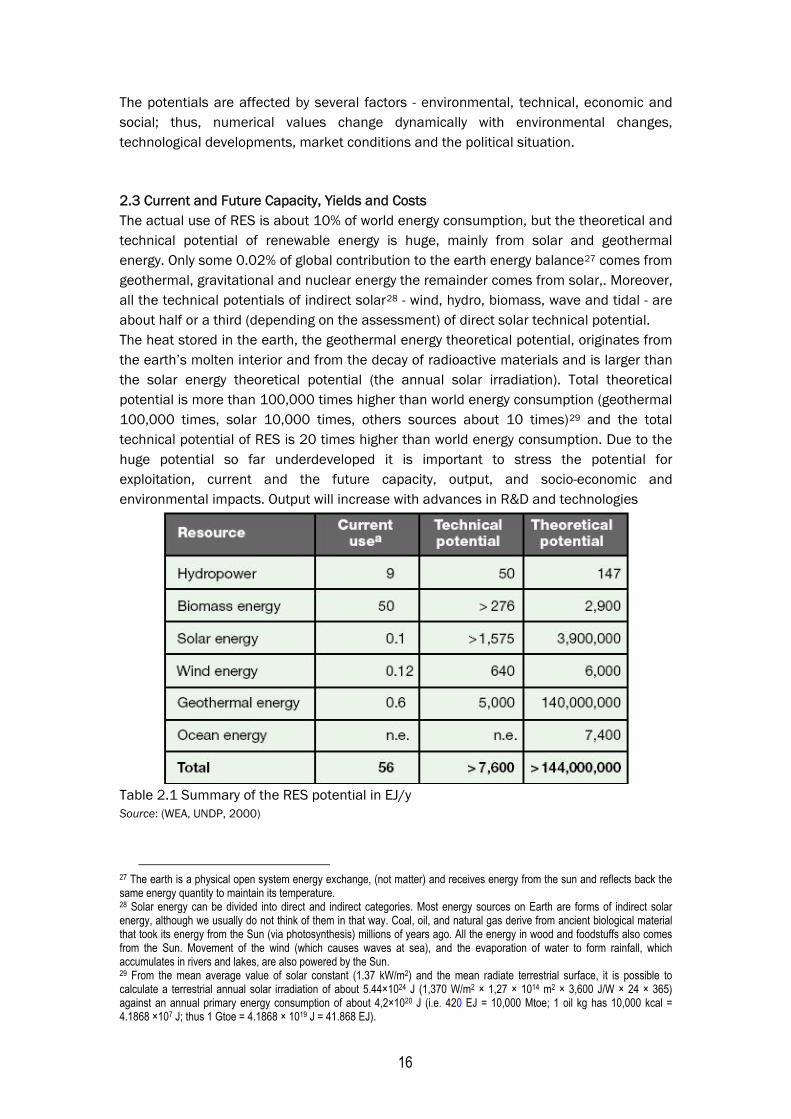
16
The potentials are affected by several factors - environmental, technical, economic and social; thus, numerical values change dynamically with environmental changes, technological developments, market conditions and the political situation.
2.3 Current and Future Capacity, Yields and Costs The actual use of RES is about 10% of world energy consumption, but the theoretical and technical potential of renewable energy is huge, mainly from solar and geothermal energy. Only some 0.02% of global contribution to the earth energy balance27 comes from geothermal, gravitational and nuclear energy the remainder comes from solar,. Moreover, all the technical potentials of indirect solar28 - wind, hydro, biomass, wave and tidal - are about half or a third (depending on the assessment) of direct solar technical potential. The heat stored in the earth, the geothermal energy theoretical potential, originates from the earth’s molten interior and from the decay of radioactive materials and is larger than the solar energy theoretical potential (the annual solar irradiation). Total theoretical potential is more than 100,000 times higher than world energy consumption (geothermal 100,000 times, solar 10,000 times, others sources about 10 times)29 and the total technical potential of RES is 20 times higher than world energy consumption. Due to the huge potential so far underdeveloped it is important to stress the potential for exploitation, current and the future capacity, output, and socio-economic and environmental impacts. Output will increase with advances in R&D and technologies
Table 2.1 Summary of the RES potential in EJ/y Source: (WEA, UNDP, 2000)
27 The earth is a physical open system energy exchange, (not matter) and receives energy from the sun and reflects back the same energy quantity to maintain its temperature. 28 Solar energy can be divided into direct and indirect categories. Most energy sources on Earth are forms of indirect solar energy, although we usually do not think of them in that way. Coal, oil, and natural gas derive from ancient biological material that took its energy from the Sun (via photosynthesis) millions of years ago. All the energy in wood and foodstuffs also comes from the Sun. Movement of the wind (which causes waves at sea), and the evaporation of water to form rainfall, which accumulates in rivers and lakes, are also powered by the Sun. 29 From the mean average value of solar constant (1.37 kW/m2) and the mean radiate terrestrial surface, it is possible to calculate a terrestrial annual solar irradiation of about 5.44×1024 J (1,370 W/m2 × 1,27 × 1014 m2 × 3,600 J/W × 24 × 365) against an annual primary energy consumption of about 4,2×10²⁰ J (i.e. 420 EJ = 10,000 Mtoe; 1 oil kg has 10,000 kcal = 4.1868 ×10⁷ J; thus 1 Gtoe = 4.1868 × 10¹⁹ J = 41.868 EJ).
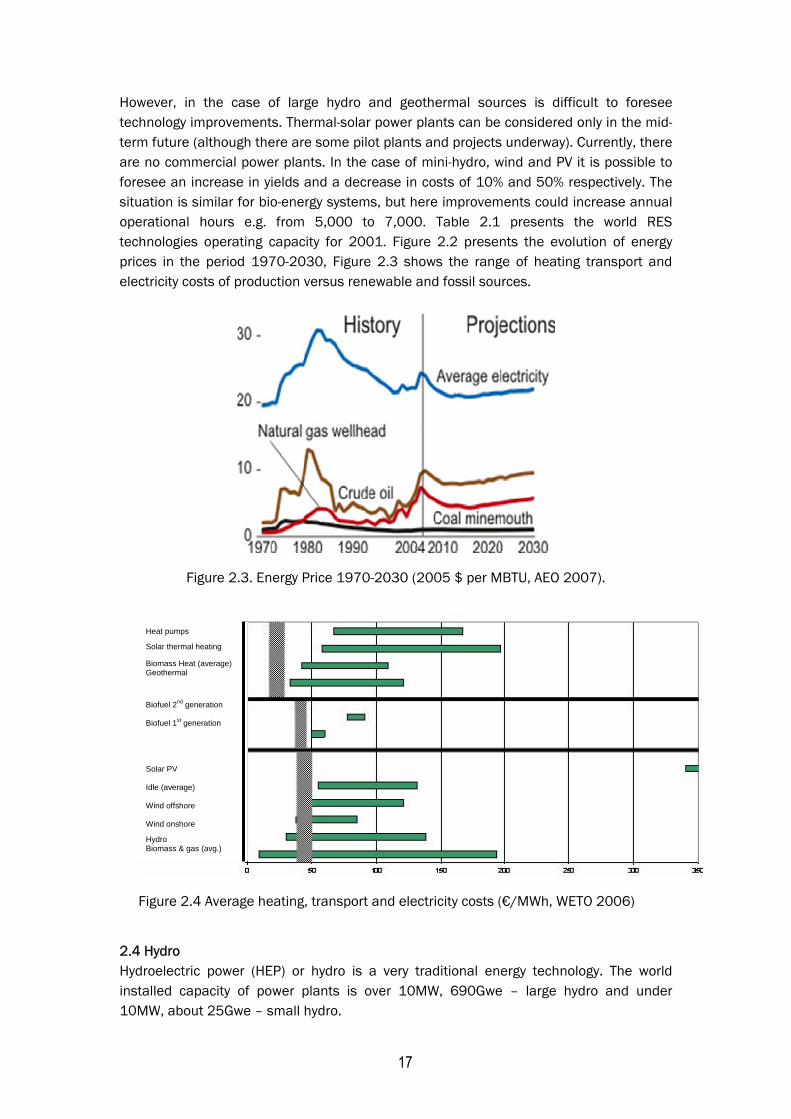
17
However, in the case of large hydro and geothermal sources is difficult to foresee technology improvements. Thermal-solar power plants can be considered only in the mid-term future (although there are some pilot plants and projects underway). Currently, there are no commercial power plants. In the case of mini-hydro, wind and PV it is possible to foresee an increase in yields and a decrease in costs of 10% and 50% respectively. The situation is similar for bio-energy systems, but here improvements could increase annual operational hours e.g. from 5,000 to 7,000. Table 2.1 presents the world RES technologies operating capacity for 2001. Figure 2.2 presents the evolution of energy prices in the period 1970-2030, Figure 2.3 shows the range of heating transport and electricity costs of production versus renewable and fossil sources.
Figure 2.3. Energy Price 1970-2030 (2005 $ per MBTU, AEO 2007).
Figure 2.4 Average heating, transport and electricity costs (€/MWh, WETO 2006)
2.4 Hydro Hydroelectric power (HEP) or hydro is a very traditional energy technology. The world installed capacity of power plants is over 10MW, 690Gwe – large hydro and under 10MW, about 25Gwe – small hydro.
Heat pumps Solar thermal heating Biomass Heat (average) Geothermal Biofuel 2nd generation Biofuel 1st generation Solar PV Idle (average) Wind offshore Wind onshore Hydro Biomass & gas (avg.)
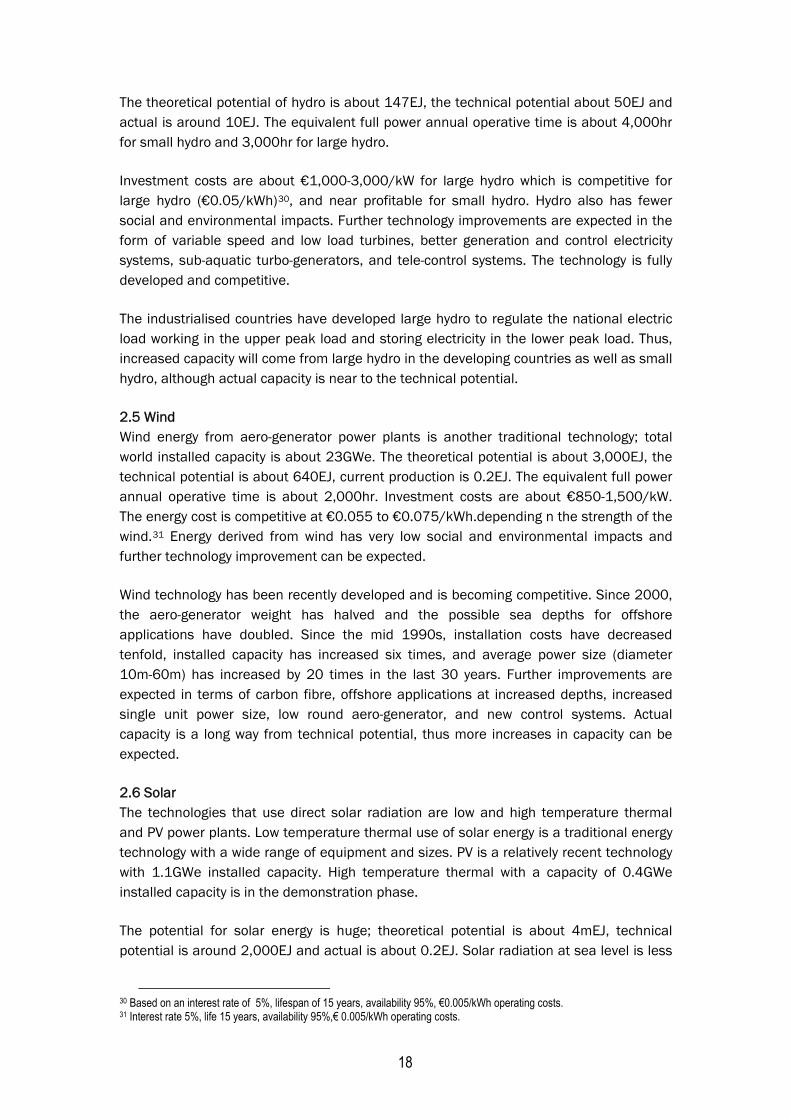
18
The theoretical potential of hydro is about 147EJ, the technical potential about 50EJ and actual is around 10EJ. The equivalent full power annual operative time is about 4,000hr for small hydro and 3,000hr for large hydro.
Investment costs are about €1,000-3,000/kW for large hydro which is competitive for large hydro (€0.05/kWh)30, and near profitable for small hydro. Hydro also has fewer social and environmental impacts. Further technology improvements are expected in the form of variable speed and low load turbines, better generation and control electricity systems, sub-aquatic turbo-generators, and tele-control systems. The technology is fully developed and competitive.
The industrialised countries have developed large hydro to regulate the national electric load working in the upper peak load and storing electricity in the lower peak load. Thus, increased capacity will come from large hydro in the developing countries as well as small hydro, although actual capacity is near to the technical potential.
2.5 Wind Wind energy from aero-generator power plants is another traditional technology; total world installed capacity is about 23GWe. The theoretical potential is about 3,000EJ, the technical potential is about 640EJ, current production is 0.2EJ. The equivalent full power annual operative time is about 2,000hr. Investment costs are about €850-1,500/kW. The energy cost is competitive at €0.055 to €0.075/kWh.depending n the strength of the wind.31 Energy derived from wind has very low social and environmental impacts and further technology improvement can be expected.
Wind technology has been recently developed and is becoming competitive. Since 2000, the aero-generator weight has halved and the possible sea depths for offshore applications have doubled. Since the mid 1990s, installation costs have decreased tenfold, installed capacity has increased six times, and average power size (diameter 10m-60m) has increased by 20 times in the last 30 years. Further improvements are expected in terms of carbon fibre, offshore applications at increased depths, increased single unit power size, low round aero-generator, and new control systems. Actual capacity is a long way from technical potential, thus more increases in capacity can be expected.
2.6 Solar The technologies that use direct solar radiation are low and high temperature thermal and PV power plants. Low temperature thermal use of solar energy is a traditional energy technology with a wide range of equipment and sizes. PV is a relatively recent technology with 1.1GWe installed capacity. High temperature thermal with a capacity of 0.4GWe installed capacity is in the demonstration phase.
The potential for solar energy is huge; theoretical potential is about 4mEJ, technical potential is around 2,000EJ and actual is about 0.2EJ. Solar radiation at sea level is less
30 Based on an interest rate of 5%, lifespan of 15 years, availability 95%, €0.005/kWh operating costs. 31 Interest rate 5%, life 15 years, availability 95%,€ 0.005/kWh operating costs.
19
than 1kW/m2 with a mean annual average of 0.1-0.3kW/m2. Equivalent full power annual operative time is about 1,000hr and actual maximum PV yield is 10-15%.32 Hence, direct solar energy resources have the greatest potential but their use is limited in terms of output and cost.
Investment costs for PV installations range from €4,000-20,000/kW, up to six times higher than conventional thermoelectric power plants. The energy cost is not competitive at €0.25-0.65/kWh. The situation is similar for low and high temperature thermal technologies. Increased output and reduced costs are expected mainly for high temperature and PV technologies. For low temperature technologies, economic competitiveness will be achieved because of the higher oil prices. Due to the very low social and environmental impacts of PV systems, many applications are already or could become competitive.
All these technologies use a resource with huge potential, but are limited in terms of their output and costs. Further improvements are expected in the PV, mainly thin films able to transform a greater part of the solar radiation spectrum and low cost materials replacing silicon. In high temperature thermal technologies, due to thermal energy storage, it is envisaged that 5,000hr equivalent full power annual operative time (currently 2,000hr) will be achieved, thereby increasing yields, but increased reliability and reduced costs will be necessary.
2.7 Biomass The technologies used for energy from biomass are thermal energy, electricity and fuels. Thermal biomass power plants use traditional energy technology, exploiting a large variety of equipment of different sizes; installed capacity is more than 210GWt. The power plants generating electricity or fuel i.e. gasifiers, biogas producers, etc. from biomass can also be considered a traditional technology although there are innovations that have increased the range of production. The theoretical potential of biomass is about 6,000EJ, the technical potential is about 500EJ; current production is 50EJ; equivalent full power annual operative time is about 4,000hr.
Installation costs are less than €1,000/kW for thermal energy production, and from €500-10,000/kW for electricity or biofuels production. The cost of the energy produced is competitive for thermal and electricity production, provided that the cost of the biomass (input) is low. Biofuel costs are higher - more than double conventional fuel costs. As already mentioned, biomass energy must be seen in the context of food, biomass and renewable materials such as clothing, furniture, building, chemicals, etc., which could make its social and environmental impacts negative.
To summarise, biomass energy technologies produce heat, electricity and fuel. Biomass is exploited even where the economic returns and social and environmental impacts make its use socially and economically unacceptable. It will be crucial to identify appropriate energy sources and technologies for local conditions. Combustion and
32 The annual net electric energy produced can be calculated by multiplying mean annual solar radiation by global yield (about 9%, obtained from the PV (~ 13%) and the remainder (~ 90%) yields by the active area factor (0.5), for example: 1.700 kWh/m2 x 0,09 x 0,5 ≈ 75 kWhe/m2.
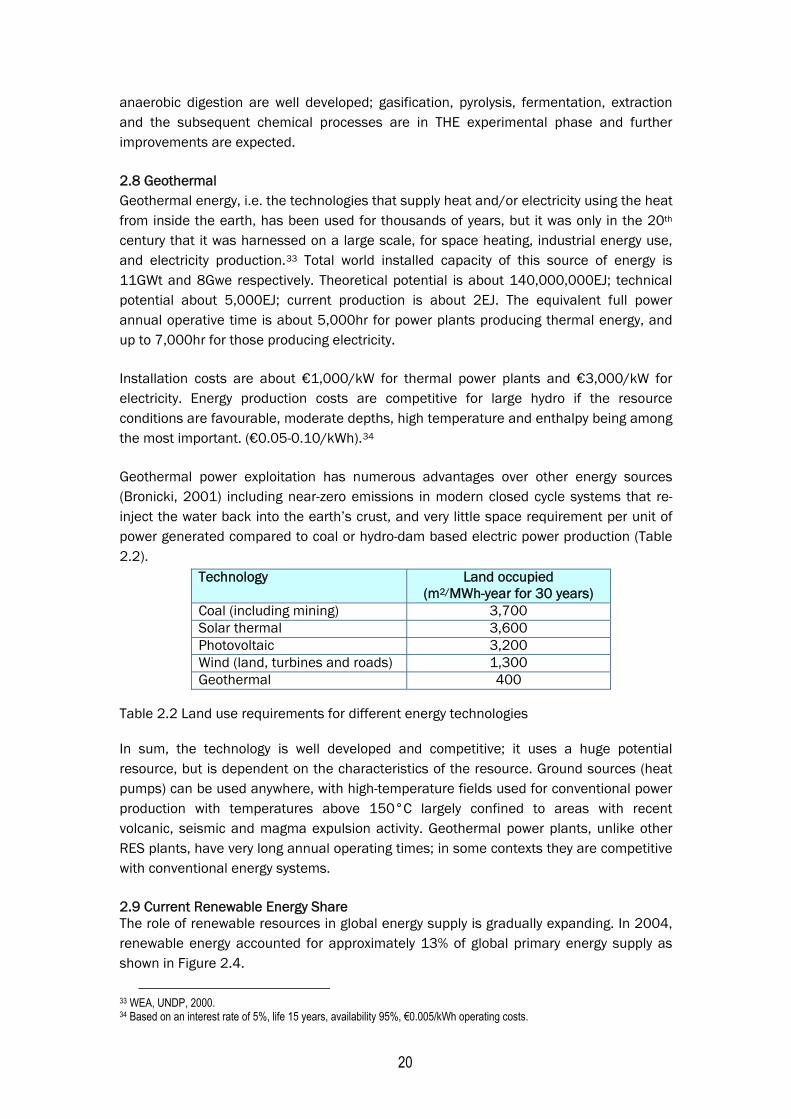
20
anaerobic digestion are well developed; gasification, pyrolysis, fermentation, extraction and the subsequent chemical processes are in THE experimental phase and further improvements are expected.
2.8 Geothermal Geothermal energy, i.e. the technologies that supply heat and/or electricity using the heat from inside the earth, has been used for thousands of years, but it was only in the 20th century that it was harnessed on a large scale, for space heating, industrial energy use, and electricity production.33 Total world installed capacity of this source of energy is 11GWt and 8Gwe respectively. Theoretical potential is about 140,000,000EJ; technical potential about 5,000EJ; current production is about 2EJ. The equivalent full power annual operative time is about 5,000hr for power plants producing thermal energy, and up to 7,000hr for those producing electricity.
Installation costs are about €1,000/kW for thermal power plants and €3,000/kW for electricity. Energy production costs are competitive for large hydro if the resource conditions are favourable, moderate depths, high temperature and enthalpy being among the most important. (€0.05-0.10/kWh).34
Geothermal power exploitation has numerous advantages over other energy sources (Bronicki, 2001) including near-zero emissions in modern closed cycle systems that re-inject the water back into the earth’s crust, and very little space requirement per unit of power generated compared to coal or hydro-dam based electric power production (Table 2.2).
Technology Land occupied (m2/MWh-year for 30 years)
Coal (including mining) 3,700 Solar thermal 3,600 Photovoltaic 3,200 Wind (land, turbines and roads) 1,300 Geothermal 400
Table 2.2 Land use requirements for different energy technologies
In sum, the technology is well developed and competitive; it uses a huge potential resource, but is dependent on the characteristics of the resource. Ground sources (heat pumps) can be used anywhere, with high-temperature fields used for conventional power production with temperatures above 150°C largely confined to areas with recent volcanic, seismic and magma expulsion activity. Geothermal power plants, unlike other RES plants, have very long annual operating times; in some contexts they are competitive with conventional energy systems.
2.9 Current Renewable Energy Share The role of renewable resources in global energy supply is gradually expanding. In 2004, renewable energy accounted for approximately 13% of global primary energy supply as shown in Figure 2.4.
33 WEA, UNDP, 2000. 34 Based on an interest rate of 5%, life 15 years, availability 95%, €0.005/kWh operating costs.
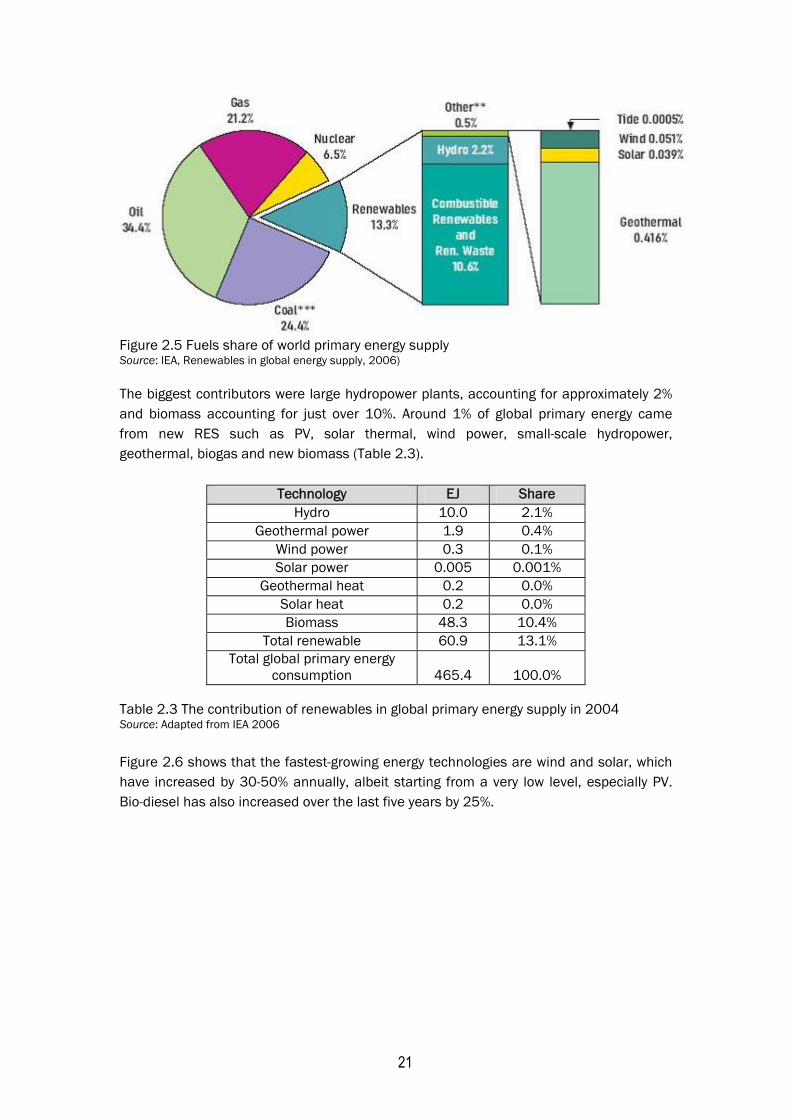
21
Figure 2.5 Fuels share of world primary energy supply Source: IEA, Renewables in global energy supply, 2006)
The biggest contributors were large hydropower plants, accounting for approximately 2% and biomass accounting for just over 10%. Around 1% of global primary energy came from new RES such as PV, solar thermal, wind power, small-scale hydropower, geothermal, biogas and new biomass (Table 2.3).
Technology EJ Share Hydro 10.0 2.1%
Geothermal power 1.9 0.4% Wind power 0.3 0.1% Solar power 0.005 0.001%
Geothermal heat 0.2 0.0% Solar heat 0.2 0.0% Biomass 48.3 10.4%
Total renewable 60.9 13.1% Total global primary energy
consumption 465.4 100.0% Table 2.3 The contribution of renewables in global primary energy supply in 2004 Source: Adapted from IEA 2006
Figure 2.6 shows that the fastest-growing energy technologies are wind and solar, which have increased by 30-50% annually, albeit starting from a very low level, especially PV. Bio-diesel has also increased over the last five years by 25%.
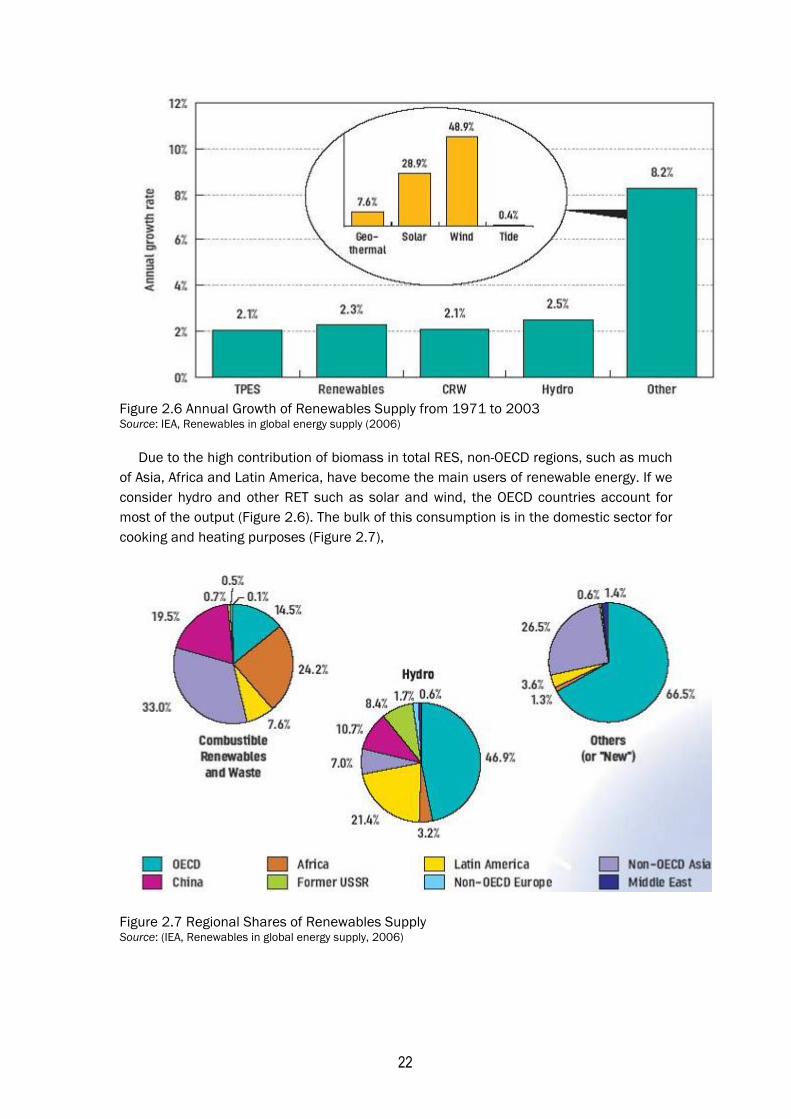
22
Figure 2.6 Annual Growth of Renewables Supply from 1971 to 2003 Source: IEA, Renewables in global energy supply (2006)
Due to the high contribution of biomass in total RES, non-OECD regions, such as much of Asia, Africa and Latin America, have become the main users of renewable energy. If we consider hydro and other RET such as solar and wind, the OECD countries account for most of the output (Figure 2.6). The bulk of this consumption is in the domestic sector for cooking and heating purposes (Figure 2.7),
Figure 2.7 Regional Shares of Renewables Supply Source: (IEA, Renewables in global energy supply, 2006)
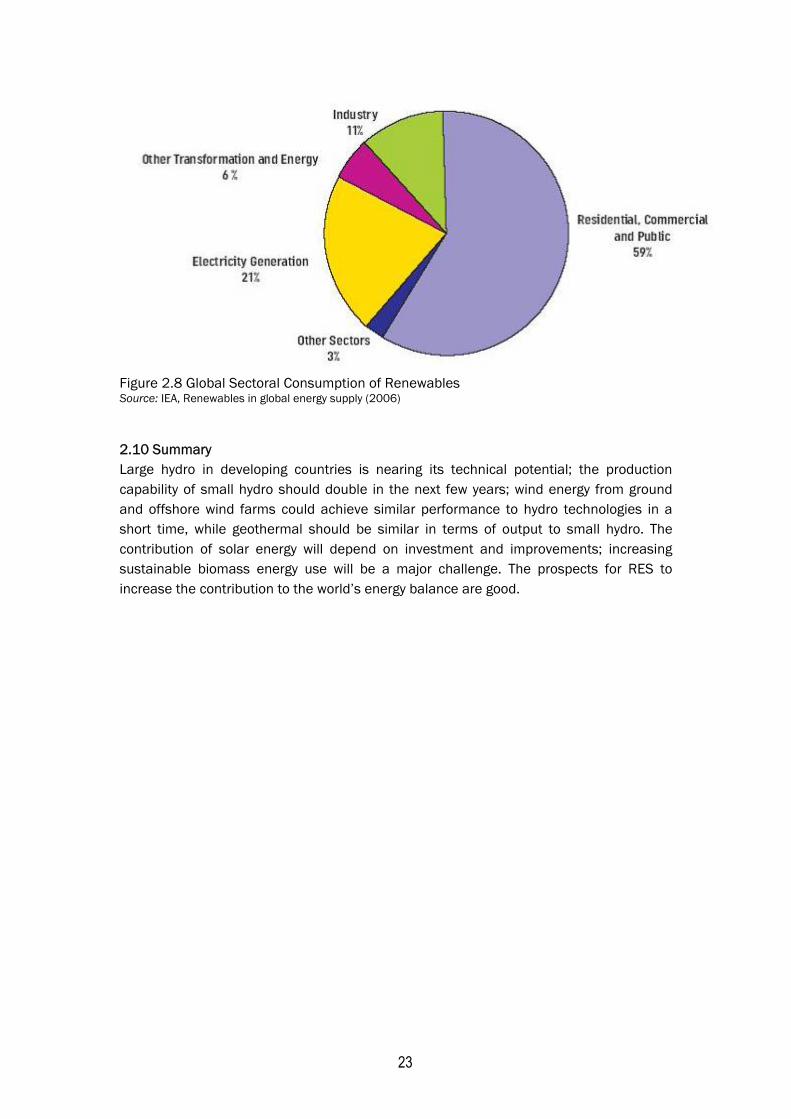
23
Figure 2.8 Global Sectoral Consumption of Renewables Source: IEA, Renewables in global energy supply (2006)
2.10 Summary Large hydro in developing countries is nearing its technical potential; the production capability of small hydro should double in the next few years; wind energy from ground and offshore wind farms could achieve similar performance to hydro technologies in a short time, while geothermal should be similar in terms of output to small hydro. The contribution of solar energy will depend on investment and improvements; increasing sustainable biomass energy use will be a major challenge. The prospects for RES to increase the contribution to the world’s energy balance are good.
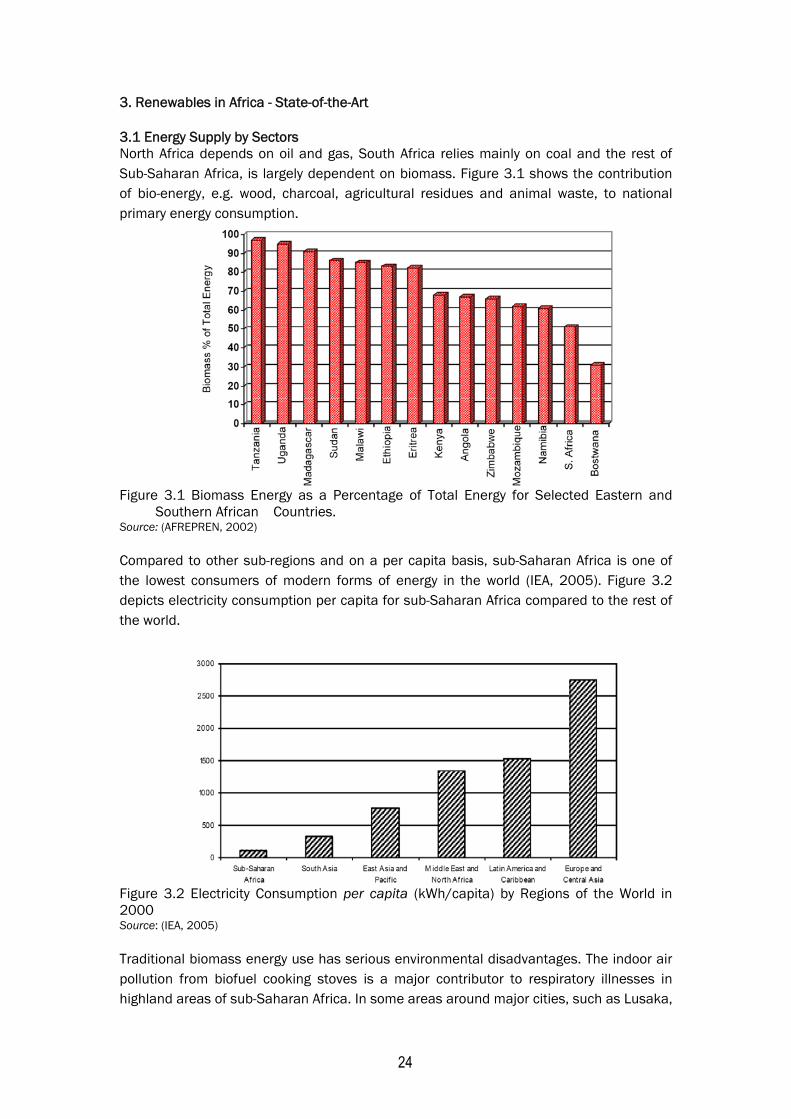
24
3. Renewables in Africa - State-of-the-Art
3.1 Energy Supply by Sectors North Africa depends on oil and gas, South Africa relies mainly on coal and the rest of Sub-Saharan Africa, is largely dependent on biomass. Figure 3.1 shows the contribution of bio-energy, e.g. wood, charcoal, agricultural residues and animal waste, to national primary energy consumption.
Figure 3.1 Biomass Energy as a Percentage of Total Energy for Selected Eastern and
Southern African Countries. Source: (AFREPREN, 2002)
Compared to other sub-regions and on a per capita basis, sub-Saharan Africa is one of the lowest consumers of modern forms of energy in the world (IEA, 2005). Figure 3.2 depicts electricity consumption per capita for sub-Saharan Africa compared to the rest of the world.
Figure 3.2 Electricity Consumption per capita (kWh/capita) by Regions of the World in 2000 Source: (IEA, 2005)
Traditional biomass energy use has serious environmental disadvantages. The indoor air pollution from biofuel cooking stoves is a major contributor to respiratory illnesses in highland areas of sub-Saharan Africa. In some areas around major cities, such as Lusaka,
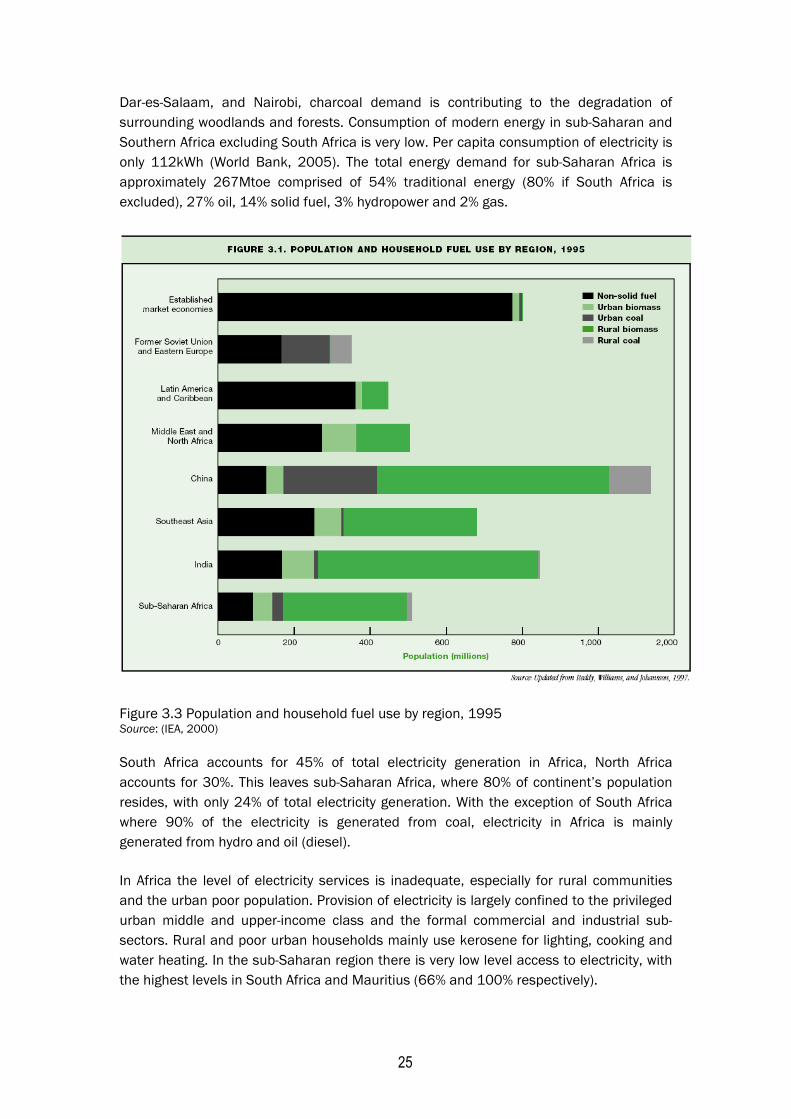
25
Dar-es-Salaam, and Nairobi, charcoal demand is contributing to the degradation of surrounding woodlands and forests. Consumption of modern energy in sub-Saharan and Southern Africa excluding South Africa is very low. Per capita consumption of electricity is only 112kWh (World Bank, 2005). The total energy demand for sub-Saharan Africa is approximately 267Mtoe comprised of 54% traditional energy (80% if South Africa is excluded), 27% oil, 14% solid fuel, 3% hydropower and 2% gas.
Figure 3.3 Population and household fuel use by region, 1995 Source: (IEA, 2000)
South Africa accounts for 45% of total electricity generation in Africa, North Africa accounts for 30%. This leaves sub-Saharan Africa, where 80% of continent’s population resides, with only 24% of total electricity generation. With the exception of South Africa where 90% of the electricity is generated from coal, electricity in Africa is mainly generated from hydro and oil (diesel).
In Africa the level of electricity services is inadequate, especially for rural communities and the urban poor population. Provision of electricity is largely confined to the privileged urban middle and upper-income class and the formal commercial and industrial sub-sectors. Rural and poor urban households mainly use kerosene for lighting, cooking and water heating. In the sub-Saharan region there is very low level access to electricity, with the highest levels in South Africa and Mauritius (66% and 100% respectively).
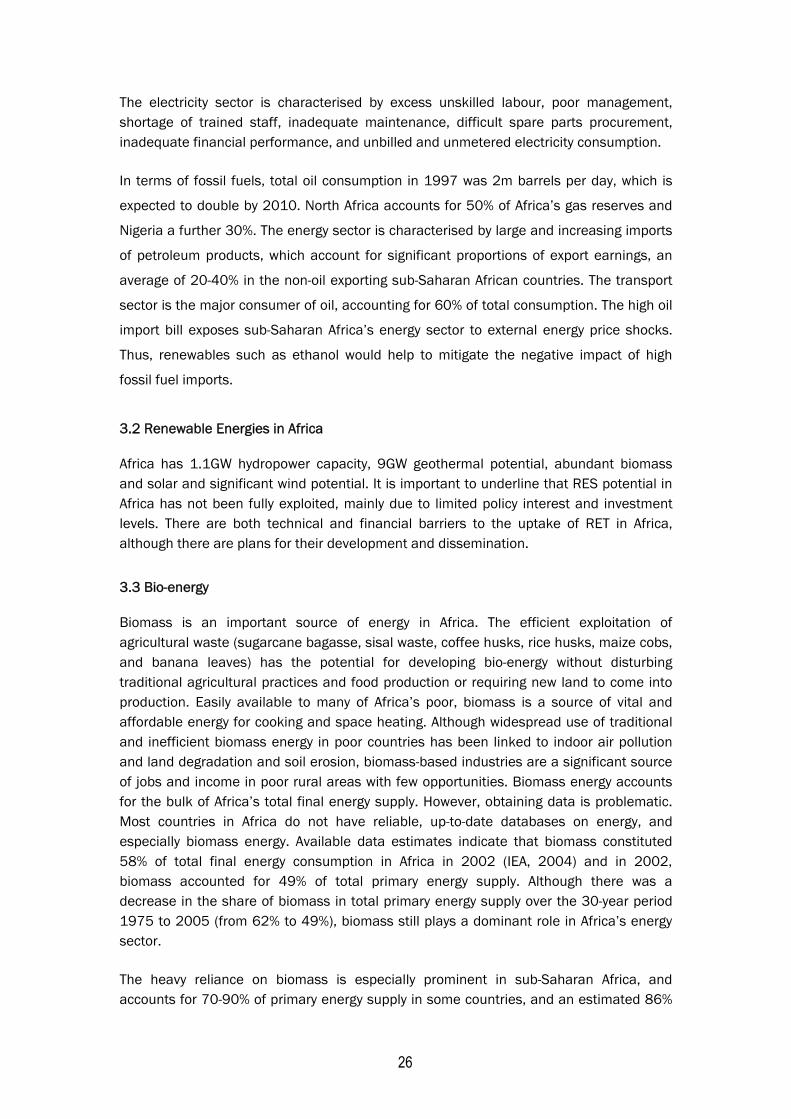
26
The electricity sector is characterised by excess unskilled labour, poor management, shortage of trained staff, inadequate maintenance, difficult spare parts procurement, inadequate financial performance, and unbilled and unmetered electricity consumption.
In terms of fossil fuels, total oil consumption in 1997 was 2m barrels per day, which is
expected to double by 2010. North Africa accounts for 50% of Africa’s gas reserves and
Nigeria a further 30%. The energy sector is characterised by large and increasing imports
of petroleum products, which account for significant proportions of export earnings, an
average of 20-40% in the non-oil exporting sub-Saharan African countries. The transport
sector is the major consumer of oil, accounting for 60% of total consumption. The high oil
import bill exposes sub-Saharan Africa’s energy sector to external energy price shocks.
Thus, renewables such as ethanol would help to mitigate the negative impact of high
fossil fuel imports.
3.2 Renewable Energies in Africa
Africa has 1.1GW hydropower capacity, 9GW geothermal potential, abundant biomass and solar and significant wind potential. It is important to underline that RES potential in Africa has not been fully exploited, mainly due to limited policy interest and investment levels. There are both technical and financial barriers to the uptake of RET in Africa, although there are plans for their development and dissemination.
3.3 Bio-energy
Biomass is an important source of energy in Africa. The efficient exploitation of agricultural waste (sugarcane bagasse, sisal waste, coffee husks, rice husks, maize cobs, and banana leaves) has the potential for developing bio-energy without disturbing traditional agricultural practices and food production or requiring new land to come into production. Easily available to many of Africa’s poor, biomass is a source of vital and affordable energy for cooking and space heating. Although widespread use of traditional and inefficient biomass energy in poor countries has been linked to indoor air pollution and land degradation and soil erosion, biomass-based industries are a significant source of jobs and income in poor rural areas with few opportunities. Biomass energy accounts for the bulk of Africa’s total final energy supply. However, obtaining data is problematic. Most countries in Africa do not have reliable, up-to-date databases on energy, and especially biomass energy. Available data estimates indicate that biomass constituted 58% of total final energy consumption in Africa in 2002 (IEA, 2004) and in 2002, biomass accounted for 49% of total primary energy supply. Although there was a decrease in the share of biomass in total primary energy supply over the 30-year period 1975 to 2005 (from 62% to 49%), biomass still plays a dominant role in Africa’s energy sector.
The heavy reliance on biomass is especially prominent in sub-Saharan Africa, and accounts for 70-90% of primary energy supply in some countries, and an estimated 86%
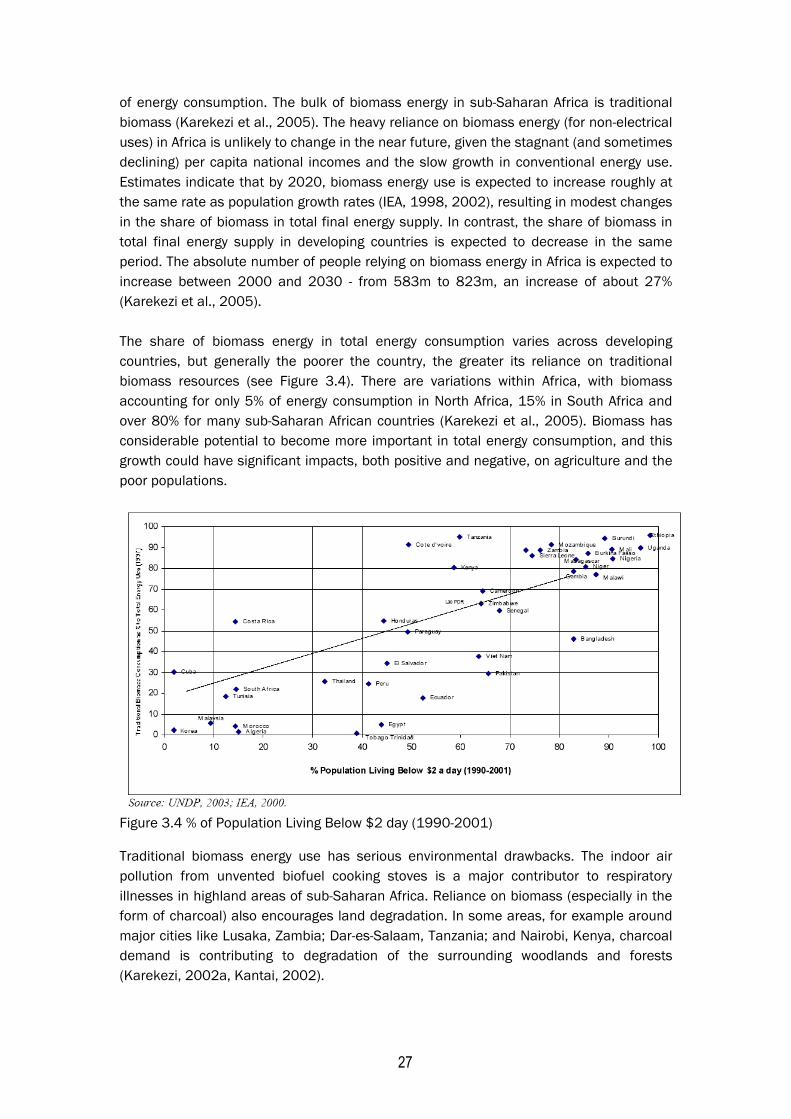
27
of energy consumption. The bulk of biomass energy in sub-Saharan Africa is traditional biomass (Karekezi et al., 2005). The heavy reliance on biomass energy (for non-electrical uses) in Africa is unlikely to change in the near future, given the stagnant (and sometimes declining) per capita national incomes and the slow growth in conventional energy use. Estimates indicate that by 2020, biomass energy use is expected to increase roughly at the same rate as population growth rates (IEA, 1998, 2002), resulting in modest changes in the share of biomass in total final energy supply. In contrast, the share of biomass in total final energy supply in developing countries is expected to decrease in the same period. The absolute number of people relying on biomass energy in Africa is expected to increase between 2000 and 2030 - from 583m to 823m, an increase of about 27% (Karekezi et al., 2005). The share of biomass energy in total energy consumption varies across developing countries, but generally the poorer the country, the greater its reliance on traditional biomass resources (see Figure 3.4). There are variations within Africa, with biomass accounting for only 5% of energy consumption in North Africa, 15% in South Africa and over 80% for many sub-Saharan African countries (Karekezi et al., 2005). Biomass has considerable potential to become more important in total energy consumption, and this growth could have significant impacts, both positive and negative, on agriculture and the poor populations.
Figure 3.4 % of Population Living Below $2 day (1990-2001) Traditional biomass energy use has serious environmental drawbacks. The indoor air pollution from unvented biofuel cooking stoves is a major contributor to respiratory illnesses in highland areas of sub-Saharan Africa. Reliance on biomass (especially in the form of charcoal) also encourages land degradation. In some areas, for example around major cities like Lusaka, Zambia; Dar-es-Salaam, Tanzania; and Nairobi, Kenya, charcoal demand is contributing to degradation of the surrounding woodlands and forests (Karekezi, 2002a, Kantai, 2002).
28
3.3.1 Small-scale biomass energy Since the mid 1980s, substantial efforts have been made towards modernising small-scale biomass energy systems. Two of the most sustained efforts have been the development of an energy efficient charcoal kiln and an environmentally-sound and improved cooking stove for rural and urban households in sub-Saharan Africa. Both of these initiatives have delivered significant benefits to the urban and rural poor. The informal sector, which provides employment for the urban poor, is the principal source of improved stoves (Karekezi, 2002). In terms of energy used per system, small-scale traditional bio-energy systems appear marginal. However, the very large number of users of these systems means that they are very important—bio-fuelled cooking stoves meet the bulk of cooking, heating and lighting needs of most rural households in Africa (Karekezi, 2002; Karekezi and Kithyoma, 2002). Charcoal is an important household and, to a lesser extent, industrial fuel. It is mainly used in urban areas where its ease of storage, high-energy content and low levels of smoke emissions, make it more attractive than wood fuel. It is the primary fuel for the urban poor in Africa (Kalumiana, 2002). Traditional charcoal production, a major source of employment for the rural poor, relies on the rudimentary earth kiln, which is responsible for much of the land degradation in many peri-urban regions of sub Saharan Africa. Efforts to improve and modernise small-scale biomass energy constitute an important component of the national energy strategies of many sub-Saharan African countries and could potentially have major benefits for both urban and rural poor populations (Karekezi, 2002). Biogas is another small-scale biomass energy technology that has become more popular since the mid 1970s. Conceptually, biogas technology appears simple and straightforward. The raw material is animal dung, plentiful in many rural areas of sub Saharan Africa; the technology appears not overly complicated; and relatively limited levels of investment are required. The technical viability of biogas technology has been well proven in field tests and pilot projects. However, numerous problems arise when mass dissemination is attempted (Karekezi, 2002). First, dung collection proved more problematic than anticipated, particularly for farmers who do not keep their livestock penned. Second, small herds do not produce sufficient dung to provide enough feedstock for a bio-digester unit to ensure steady gas generation for lighting and cooking. Third, the investment cost of even the smallest biogas unit is prohibitive for most poor rural African households (Karekezi and Ranja, 1997; Karekezi, 2002). Consequently, biogas dissemination levels are still relatively low. Though the evidence from many African countries is still limited, the general consensus is that the larger combined septic tank/biogas units operated by institutions, such as schools and hospitals, are more viable than small-scale biogas digesters (Karekezi, 2002).
29
3.3.2 Large-scale biomass energy (cogeneration) Large-scale biomass utilisation encompasses direct combustion for process heat; ethanol production; gasification; heat cogeneration; biogas production; briquetting and electricity generation. Bioenergy is an important source of energy in the region. Efficient exploitation of existing agricultural wastes presents significant potential for developing bioenergy without disruption to existing agricultural practices and food production or the requisitioning of additional land. Some of the most common crop wastes suitable for bioenergy development include sugarcane bagasse, sisal waste, coffee husks, rice husks, maize cobs and banana leaves. Unlike many other crop wastes, these are rarely returned to the fields. Consequently, using them for energy generation is unlikely to have a detrimental impact on soil management and food production and could potentially be an additional source of revenue for the poor. The best-known large-scale biomass energy systems with sound economic track records are cogeneration systems, which use biomass as the fuel stock to produce ethanol which substitutes for petroleum fuel (Karekezi and Ranja, 1997). Cogeneration is the simultaneous production of electricity and process heat from a single dynamic plant. A cogeneration plant heats water to produce steam, which drives a turbine to produce electricity. Various forms of biomass can be used to fuel the plant including bagasse from the sugar industry and paper and pulp waste, and palm wood and rice wastes. In cane milling, the cane stalks are shredded and crushed to extract cane juice while the by-product, bagasse, is sent to a boiler to produce steam to provide electricity for the factory (Deepchand, 2001). Cogeneration offers substantial opportunities for generating electricity and/ or heat energy, with limited capital investment, and none of the negative environmental effects that increased fossil fuel combustion produces. Industries can be located in remote areas not linked to the electricity grid. Surplus electricity can be made available to other users through mini-grids. For industries close to the grid, sale of surplus power to the national utility would increase their incomes (Deepchand, 2001). Sugar is produced in a number of eastern and southern African countries. It is a major agricultural export for Ethiopia, Madagascar, Malawi, Mozambique, Swaziland, Zambia and Zimbabwe. The potential for electricity generation from bagasse is high, since cogeneration equipment is almost always an integral part of sugar factory design. Estimates show that several eastern and southern African countries could meet a significant proportion of their current electricity consumption from bagasse-based cogeneration in the sugar industry (see Table 14). Mauritius, for example, meets close to 40% of its electricity demand from cogeneration (about half of cogeneration electricity is from bagasse). The sugar industry is a major user of cogeneration technology. At the beginning of 2000, worldwide sugar mill cogeneration was almost 1,100MW installed and operating, with
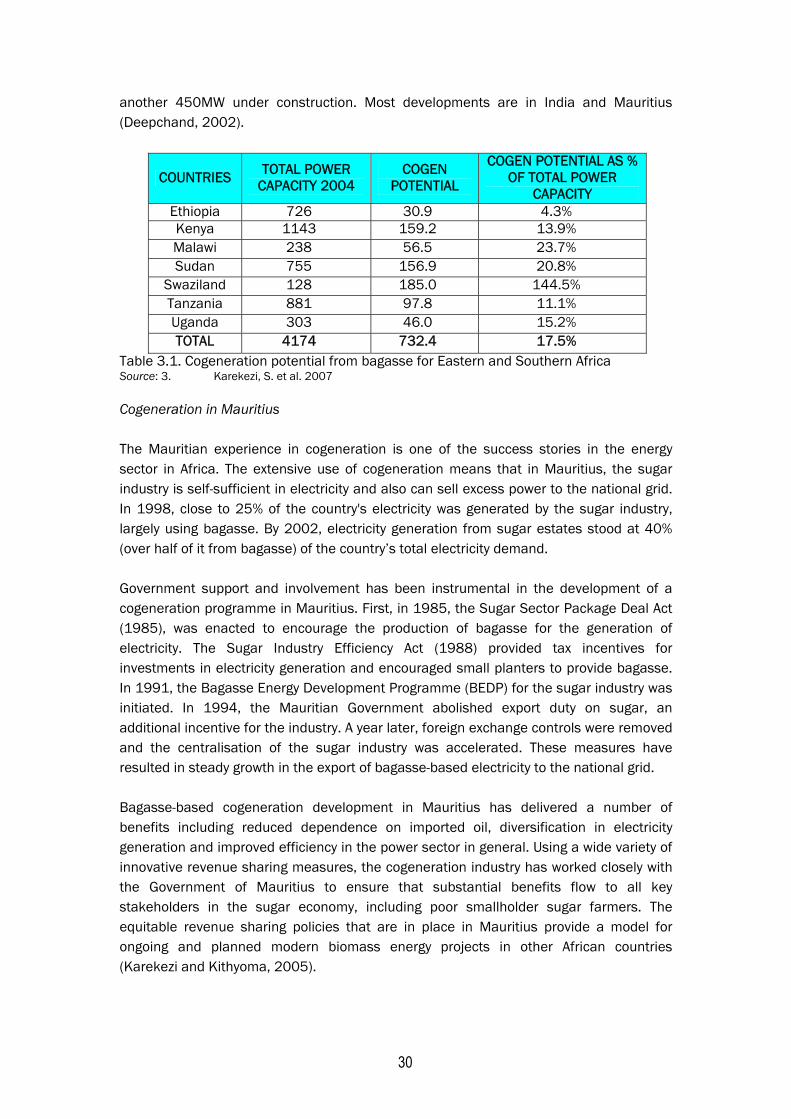
30
another 450MW under construction. Most developments are in India and Mauritius (Deepchand, 2002).
COUNTRIES TOTAL POWER CAPACITY 2004
COGEN POTENTIAL
COGEN POTENTIAL AS % OF TOTAL POWER
CAPACITY Ethiopia 726 30.9 4.3% Kenya 1143 159.2 13.9% Malawi 238 56.5 23.7% Sudan 755 156.9 20.8%
Swaziland 128 185.0 144.5% Tanzania 881 97.8 11.1% Uganda 303 46.0 15.2% TOTAL 4174 732.4 17.5%
Table 3.1. Cogeneration potential from bagasse for Eastern and Southern Africa Source: 3. Karekezi, S. et al. 2007
Cogeneration in Mauritius The Mauritian experience in cogeneration is one of the success stories in the energy sector in Africa. The extensive use of cogeneration means that in Mauritius, the sugar industry is self-sufficient in electricity and also can sell excess power to the national grid. In 1998, close to 25% of the country's electricity was generated by the sugar industry, largely using bagasse. By 2002, electricity generation from sugar estates stood at 40% (over half of it from bagasse) of the country’s total electricity demand. Government support and involvement has been instrumental in the development of a cogeneration programme in Mauritius. First, in 1985, the Sugar Sector Package Deal Act (1985), was enacted to encourage the production of bagasse for the generation of electricity. The Sugar Industry Efficiency Act (1988) provided tax incentives for investments in electricity generation and encouraged small planters to provide bagasse. In 1991, the Bagasse Energy Development Programme (BEDP) for the sugar industry was initiated. In 1994, the Mauritian Government abolished export duty on sugar, an additional incentive for the industry. A year later, foreign exchange controls were removed and the centralisation of the sugar industry was accelerated. These measures have resulted in steady growth in the export of bagasse-based electricity to the national grid. Bagasse-based cogeneration development in Mauritius has delivered a number of benefits including reduced dependence on imported oil, diversification in electricity generation and improved efficiency in the power sector in general. Using a wide variety of innovative revenue sharing measures, the cogeneration industry has worked closely with the Government of Mauritius to ensure that substantial benefits flow to all key stakeholders in the sugar economy, including poor smallholder sugar farmers. The equitable revenue sharing policies that are in place in Mauritius provide a model for ongoing and planned modern biomass energy projects in other African countries (Karekezi and Kithyoma, 2005).
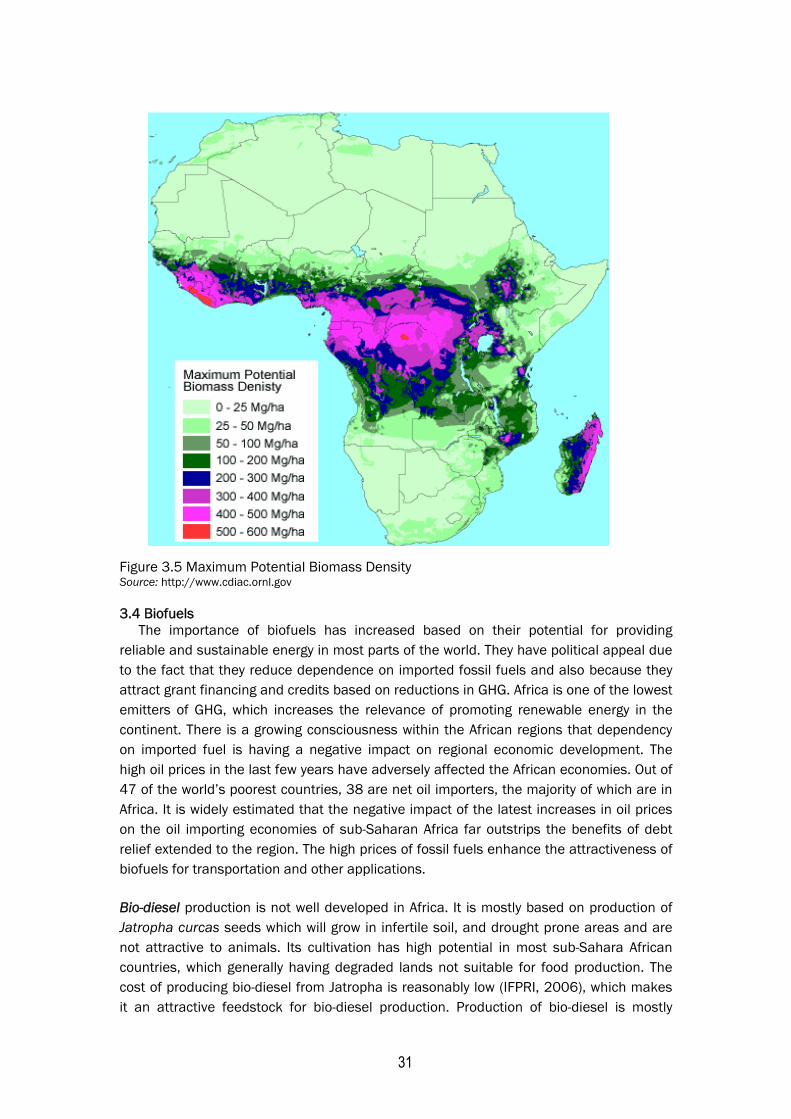
31
Figure 3.5 Maximum Potential Biomass Density Source: http://www.cdiac.ornl.gov 3.4 Biofuels
The importance of biofuels has increased based on their potential for providing reliable and sustainable energy in most parts of the world. They have political appeal due to the fact that they reduce dependence on imported fossil fuels and also because they attract grant financing and credits based on reductions in GHG. Africa is one of the lowest emitters of GHG, which increases the relevance of promoting renewable energy in the continent. There is a growing consciousness within the African regions that dependency on imported fuel is having a negative impact on regional economic development. The high oil prices in the last few years have adversely affected the African economies. Out of 47 of the world’s poorest countries, 38 are net oil importers, the majority of which are in Africa. It is widely estimated that the negative impact of the latest increases in oil prices on the oil importing economies of sub-Saharan Africa far outstrips the benefits of debt relief extended to the region. The high prices of fossil fuels enhance the attractiveness of biofuels for transportation and other applications.
Bio-diesel production is not well developed in Africa. It is mostly based on production of Jatropha curcas seeds which will grow in infertile soil, and drought prone areas and are not attractive to animals. Its cultivation has high potential in most sub-Sahara African countries, which generally having degraded lands not suitable for food production. The cost of producing bio-diesel from Jatropha is reasonably low (IFPRI, 2006), which makes it an attractive feedstock for bio-diesel production. Production of bio-diesel is mostly
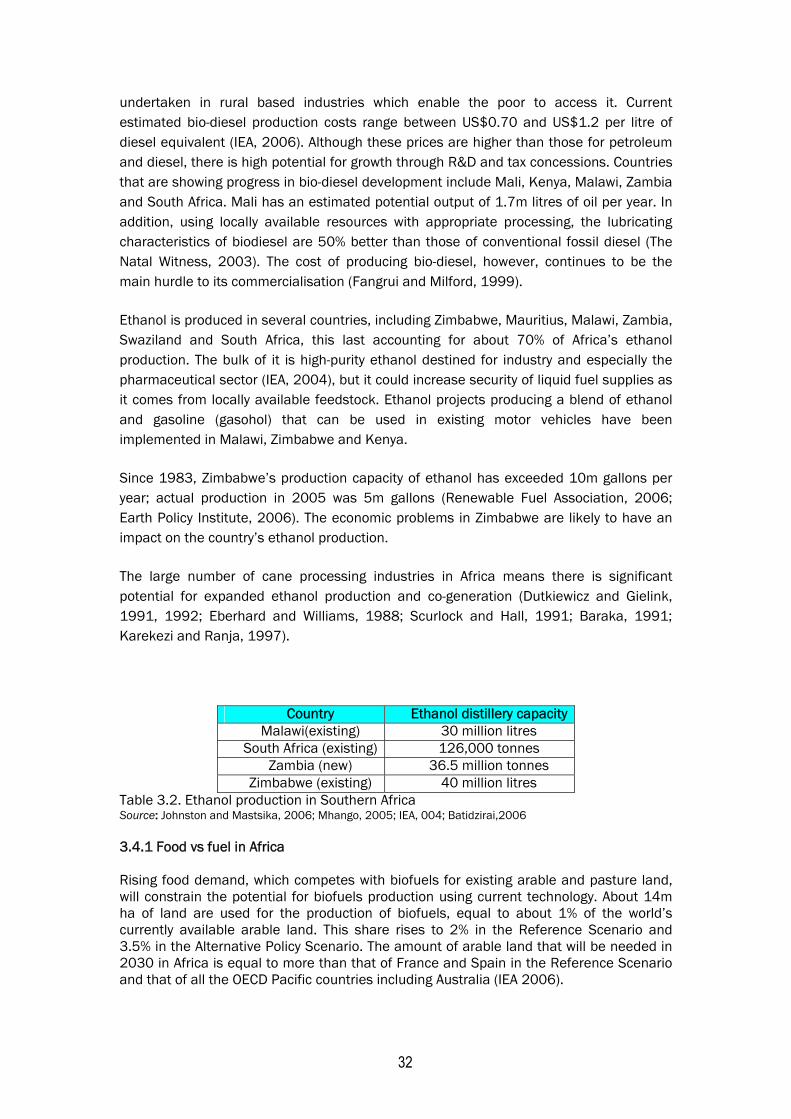
32
undertaken in rural based industries which enable the poor to access it. Current estimated bio-diesel production costs range between US$0.70 and US$1.2 per litre of diesel equivalent (IEA, 2006). Although these prices are higher than those for petroleum and diesel, there is high potential for growth through R&D and tax concessions. Countries that are showing progress in bio-diesel development include Mali, Kenya, Malawi, Zambia and South Africa. Mali has an estimated potential output of 1.7m litres of oil per year. In addition, using locally available resources with appropriate processing, the lubricating characteristics of biodiesel are 50% better than those of conventional fossil diesel (The Natal Witness, 2003). The cost of producing bio-diesel, however, continues to be the main hurdle to its commercialisation (Fangrui and Milford, 1999).
Ethanol is produced in several countries, including Zimbabwe, Mauritius, Malawi, Zambia, Swaziland and South Africa, this last accounting for about 70% of Africa’s ethanol production. The bulk of it is high-purity ethanol destined for industry and especially the pharmaceutical sector (IEA, 2004), but it could increase security of liquid fuel supplies as it comes from locally available feedstock. Ethanol projects producing a blend of ethanol and gasoline (gasohol) that can be used in existing motor vehicles have been implemented in Malawi, Zimbabwe and Kenya.
Since 1983, Zimbabwe’s production capacity of ethanol has exceeded 10m gallons per year; actual production in 2005 was 5m gallons (Renewable Fuel Association, 2006; Earth Policy Institute, 2006). The economic problems in Zimbabwe are likely to have an impact on the country’s ethanol production.
The large number of cane processing industries in Africa means there is significant potential for expanded ethanol production and co-generation (Dutkiewicz and Gielink, 1991, 1992; Eberhard and Williams, 1988; Scurlock and Hall, 1991; Baraka, 1991; Karekezi and Ranja, 1997).
Country Ethanol distillery capacity Malawi(existing) 30 million litres
South Africa (existing) 126,000 tonnes Zambia (new) 36.5 million tonnes
Zimbabwe (existing) 40 million litres Table 3.2. Ethanol production in Southern Africa Source: Johnston and Mastsika, 2006; Mhango, 2005; IEA, 004; Batidzirai,2006
3.4.1 Food vs fuel in Africa Rising food demand, which competes with biofuels for existing arable and pasture land, will constrain the potential for biofuels production using current technology. About 14m ha of land are used for the production of biofuels, equal to about 1% of the world’s currently available arable land. This share rises to 2% in the Reference Scenario and 3.5% in the Alternative Policy Scenario. The amount of arable land that will be needed in 2030 in Africa is equal to more than that of France and Spain in the Reference Scenario and that of all the OECD Pacific countries including Australia (IEA 2006).
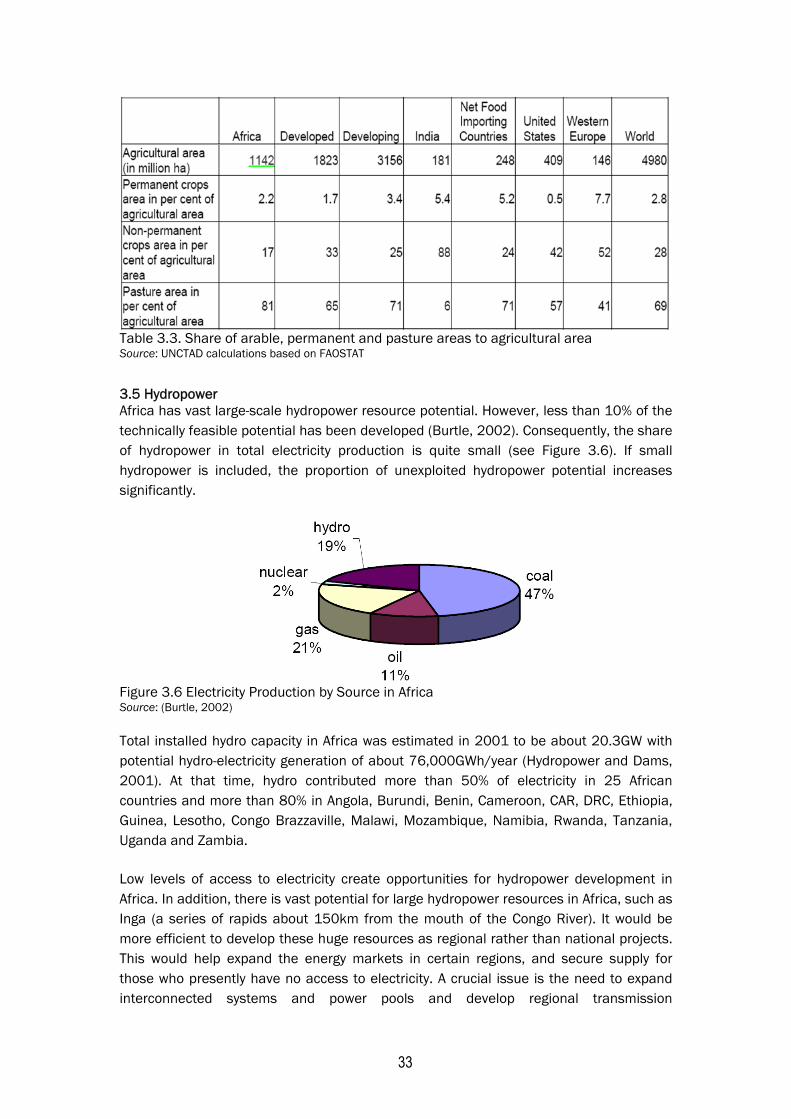
33
Table 3.3. Share of arable, permanent and pasture areas to agricultural area Source: UNCTAD calculations based on FAOSTAT
3.5 Hydropower Africa has vast large-scale hydropower resource potential. However, less than 10% of the technically feasible potential has been developed (Burtle, 2002). Consequently, the share of hydropower in total electricity production is quite small (see Figure 3.6). If small hydropower is included, the proportion of unexploited hydropower potential increases significantly.
Figure 3.6 Electricity Production by Source in Africa Source: (Burtle, 2002)
Total installed hydro capacity in Africa was estimated in 2001 to be about 20.3GW with potential hydro-electricity generation of about 76,000GWh/year (Hydropower and Dams, 2001). At that time, hydro contributed more than 50% of electricity in 25 African countries and more than 80% in Angola, Burundi, Benin, Cameroon, CAR, DRC, Ethiopia, Guinea, Lesotho, Congo Brazzaville, Malawi, Mozambique, Namibia, Rwanda, Tanzania, Uganda and Zambia.
Low levels of access to electricity create opportunities for hydropower development in Africa. In addition, there is vast potential for large hydropower resources in Africa, such as Inga (a series of rapids about 150km from the mouth of the Congo River). It would be more efficient to develop these huge resources as regional rather than national projects. This would help expand the energy markets in certain regions, and secure supply for those who presently have no access to electricity. A crucial issue is the need to expand interconnected systems and power pools and develop regional transmission
34
infrastructures for power transmission and market expansion. Proposed regional hydro projects include Inga in the Democratic Republic of Congo (DRC), Kafue Gorge Lower in Zambia, Cabora Bassa in Mozambique, Maguga in Swaziland, Bui in Ghana, and Bujagali in Uganda. Apart from DRC, four countries sharing the Nile basin: Uganda, Tanzania, Sudan and Ethiopia, have considerable indigenous hydropower resources, which could produce well above the demand from these countries according to present long-term sub-sector planning. Proposed regional transmission projects include upgrading of the Zambia-DR Congo-South Africa Interconnection, Zambia-Tanzania Interconnection, Namibia-Botswana Interconnection, and West Africa Grid Network and Power Pool. Hydropower developments in Africa face high up-front investments and high risks (political, technical, economic, commercial, environmental and social). Africa’s huge hydropower potential could be developed for the benefit of the vast majority of Africa’s population, in particular as regional integration projects. The Inga Falls hydroelectric power plant consists of two hydroelectric stations. The 1,725-km high-voltage power line extends across almost the entire width of the DR Congo, from the Inga Falls in the west of the country to Kolwezi in the heart of Shaba's mining region and the Inga Falls-South Africa interconnection and the construction of a second power line could supply power to Kinshasa. While some African countries and/or regions have excess generating capacity, others are experiencing shortages, with serious consequences for their economic and social development. Although it is technically feasible for each country to develop sufficient energy resources to meet its needs in the medium to longer-term, it would be more sensible to reap the economic and environmental efficiencies that regional co-operation would bring. Cooperation would allow under-supplied regions or countries over-dependent on hydroelectricity where supplies may not be reliable during dry seasons, to have immediate access to a pool of electricity, and to contribute to this pool when water levels are high. This would facilitate uninterrupted power supply throughout Africa. The DRC's rivers, with an estimated hydroelectric power potential of 150,000MW, could provide the energy needed to develop Africa. The hydroelectric power potential of the Inga Falls could be developed in phases beginning with a project for 3,000-5,000MW, or 10% of Inga’s total potential, with later phases raising production to 39,000 MW, which would satisfy Africa’s demand for electricity. One of the long-term objectives of development of DR Congo's hydro resources is to expand the electrification of Africa through interconnections between the various countries, through one interconnected transmission grid. In line with large-scale development of the hydro resources of central and southern Africa, the transmission line from Inga Falls to Zambia could be upgraded and the western transmission corridor from Inga Falls through Angola, Namibia and Botswana to South Africa could be developed. A pan-African grid could be created between the Southern African Power Pool (SAPP) and the West Africa Power Pool (WAPP). This would require development of a DR-Congo
35
Brazzaville-Gabon-Equatorial Guinea-Cameroon-Nigeria high voltage (HV) transmission line. Another direct connection to the Eastern Africa market could be achieved through the proposed development of a HV transmission line from Inga Falls to Uganda. In the medium to long-term, the linking of the Inga Falls to Cairo by an HV transmission line from Nigeria, or Cameroon via Chad, Libya and Egypt is planned. The attempt to tap Inga's energy potential for the overall benefit of Africa fits within the thinking that energy access must be a universal priority of the New Partnership for Africa's Development (NEPAD). NEPAD specifically states that energy plays a critical role in the development process, first as a domestic necessity, but also as a factor of production whose cost directly affects the prices of other goods and services and the competitiveness of enterprises. According to NEPAD, viable regional projects are proposed in the context of developing a pan-African transmission grid and the hydro resources of the Inga Falls via development of the eastern transmission corridor through the completion of the SAPP interconnection network to Tanzania and Malawi, and further extension of the SAPP grid to Eastern Africa through an HV transmission line from Arusha, Tanzania to Nairobi, Kenya. The transmission lines, in the short-term, will enable the transmission of power from existing excess capacity markets (South Africa, Zambia, Mozambique and the DRC), to existing areas of shortage (Tanzania, Malawi and Kenya). In the medium to long-term, these lines will enable the delivery of power from future refurbished and newly developed hydro resources in the DR Congo, Zambia and Mozambique to Eastern Africa including Kenya, Sudan, Ethiopia and Eritrea. A second development phase is proposed to further develop the enormous and stable hydropower resources of central Africa through the refurbishment of existing plants such as Inga 1 and 2, which would add about 1,000MW, and the development of new plants such as Inga 3 (1,500-3,500MW). In the medium to long-term, a further 40,000-50,000MW could be added to the Inga Falls’ potential. 3.5.1 Congo River to Power Africa out of Poverty
Nairobi, 24 February 2005 - Plans to harness the power of the mighty Congo River to generate electricity are being drawn up by one of Africa’s biggest energy companies. The scheme, which will initially focus on the Inga Rapids, aims to eventually generate more than enough electricity to power Africa’s industrialization. Mr Khoza, chairman of the South African-based power company, Eskom Holdings said: ‘Africa urgently needs energy to lift its people out of poverty and deliver sustainable development. The Congo River offers enormous opportunities for doing this. We calculate that hydro electricity from the Congo could generate more than 40,000 megawatts, enough to power Africa’s industrialization with the possibility of selling the surplus to southern Europe’.
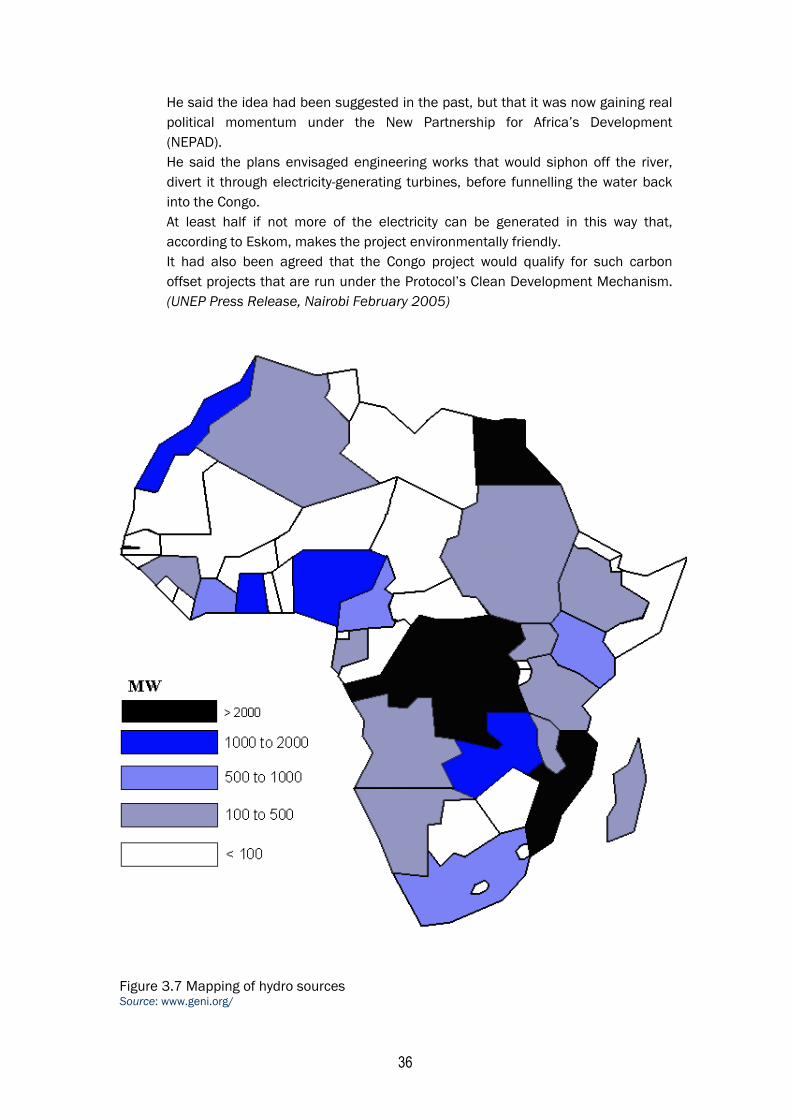
36
He said the idea had been suggested in the past, but that it was now gaining real political momentum under the New Partnership for Africa’s Development (NEPAD). He said the plans envisaged engineering works that would siphon off the river, divert it through electricity-generating turbines, before funnelling the water back into the Congo. At least half if not more of the electricity can be generated in this way that, according to Eskom, makes the project environmentally friendly. It had also been agreed that the Congo project would qualify for such carbon offset projects that are run under the Protocol’s Clean Development Mechanism. (UNEP Press Release, Nairobi February 2005)
Figure 3.7 Mapping of hydro sources Source: www.geni.org/
37
The major hydropower stations are situated on great African rivers:
• the Congo • the Nile • the Zambesi • the Niger.
3.6 Solar Solar energy is the best-known RET in Africa. It has been used for drying animal skins and clothes, preserving meat, drying crops and evaporating seawater to extract salt (Karekezi and Ranja, 1997). Solar energy is utilised at various levels. On a small-scale, it is used for domestic lighting, cooking, water heating and solar architecture houses. Medium-scale appliances include water heating in hotels, and irrigation. At community level, it is used for vaccine refrigeration, water pumping and purification and rural electrification; on a large scale, it is used to pre-heat boiler water for industrial use, and for telecommunications (Karekezi and Ranja, 1997; Ecosystems, 2002).
Community applications of PV have proven successful with encouraging results from the use of PV in rural dispensaries and missionary establishments (AFREPREN, 2003, 2004; Mapako and Mbewe, 2004; MPWE, 1994; Kgathi et al., 1997; Karekezi and Ranja, 1997; Karekezi et al., 2004). About 15,000 domestic solar water heaters have been installed in Botswana (Fagbenle, 2001) and about 4,000 solar water heaters are in use in Zimbabwe (AFREPREN, 2001).
Solar water pumping One of the most immediate problems facing many third world countries is the availability of drinking water. Solar powered technologies can help, at minimal cost, by providing solar powered pumping for wells, water towers or other holding tanks, and solar powered water purifiers. These technologies require minimal maintenance, have low operational costs, and once set up, can provide water for irrigation and drinking water. With large reservoirs for the water that has been pumped and purified using solar powered technology, communities will be better able to withstand periods of drought and famine. The stored water can be consumed by humans and livestock, and used to irrigate community gardens and fields, thus improving community health and crop yields. Solar powered water purification systems are capable of removing many pathogens and bacteria from ground and runoff water. A cluster of these devices would improve sanitation and control the spread of waterborne disease. Kenya would provide a good testing ground for such systems because of its progressive and relatively well-funded Department of Agriculture, which overseas the Kenya Agricultural Research Institute (KARI), which provides funding for and oversight of many projects using experimental methods and technologies.
38
Although this solar technology may have higher initial costs than conventional fossil fuels, the low maintenance and operating costs and the ability to operate without stored fuel makes solar powered systems cheaper to run. A solar powered system could serve a small rural community indefinitely, and would provide clean drinking water at a negligible cost after the initial equipment purchase and setup. In larger communities, it would contribute to the water supply and reduce the pressures related to day to day survival. This technology is capable of pumping hundreds of gallons of water per day, and is limited only by the amount of water available. Solar powered water pumping and purification systems have the potential to help rural Africans fulfil one of their most basic needs for survival and involve minimum of training in operation and maintenance. Further field test are being conducted by KARI and the many companies that manufacture the equipment; these small-scale applications of solar technology are proving successful. Combined with sustainable agricultural practices and conservation of natural resources, solar power could bring the benefits of technology to the parched lands of Africa. To supplement well water, runoff rainwater could be collected during the rainy season for use in periods of drought. Southern Africa has an information sharing network – SEARNET - which provides information to farmers about techniques for catching and storing rainwater. Some farmers have already seen increased yields. This network enabling farmers to share their ideas, has spread both new and old ideas, and has led to greater sustainability of water resources in Botswana, Ethiopia, Kenya, Malawi, Rwanda, Tanzania, Uganda, Zambia and Zimbabwe. Real examples A solar powered water pump and holding system was installed in Kayrati, Chad, in 2004, as compensation for land lost to oil development. This system utilises a standard well pump powered by a PV panel array. The pumped water is stored in a water tower, which provides the pressure needed to deliver water to homes in the area. This use of oil revenues to build infrastructure is an example of using profits to improve living standards in rural areas. Hundreds of solar water pumping stations in Sudan fulfil a similar role, involving various applications of different systems for pumping and storage. Over the past 10 years, approximately 250 PV water pumps have been installed in Sudan. Considerable progress has been made and the present generation of systems appears reliable and cost-effective under certain conditions. A PV pumping system to pump 25m3 per day requires a solar array of approximately 800Wp. The pump would cost US$6,000, since the total system comprises the cost of modules, pump, motor, pipework, wiring, control system and array support structure. PV water pumping has been promoted successfully in the state of Kordofan in Sudan. Its economics are favourable compared to diesel pumps, it is maintenance free and benefits from a regular supply of fuel. The only maintenance required for PV pumps is if the pump breaks down not failure of the PV devices.
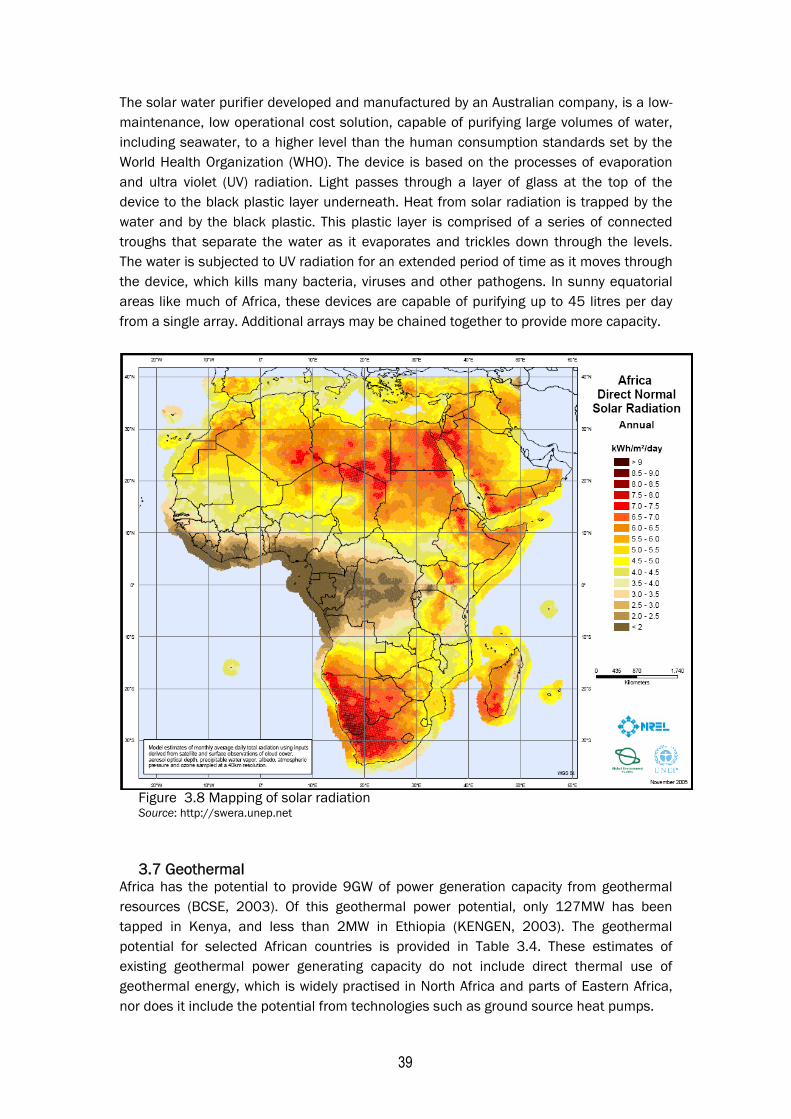
39
The solar water purifier developed and manufactured by an Australian company, is a low-maintenance, low operational cost solution, capable of purifying large volumes of water, including seawater, to a higher level than the human consumption standards set by the World Health Organization (WHO). The device is based on the processes of evaporation and ultra violet (UV) radiation. Light passes through a layer of glass at the top of the device to the black plastic layer underneath. Heat from solar radiation is trapped by the water and by the black plastic. This plastic layer is comprised of a series of connected troughs that separate the water as it evaporates and trickles down through the levels. The water is subjected to UV radiation for an extended period of time as it moves through the device, which kills many bacteria, viruses and other pathogens. In sunny equatorial areas like much of Africa, these devices are capable of purifying up to 45 litres per day from a single array. Additional arrays may be chained together to provide more capacity.
Figure 3.8 Mapping of solar radiation Source: http://swera.unep.net 3.7 Geothermal
Africa has the potential to provide 9GW of power generation capacity from geothermal resources (BCSE, 2003). Of this geothermal power potential, only 127MW has been tapped in Kenya, and less than 2MW in Ethiopia (KENGEN, 2003). The geothermal potential for selected African countries is provided in Table 3.4. These estimates of existing geothermal power generating capacity do not include direct thermal use of geothermal energy, which is widely practised in North Africa and parts of Eastern Africa, nor does it include the potential from technologies such as ground source heat pumps.
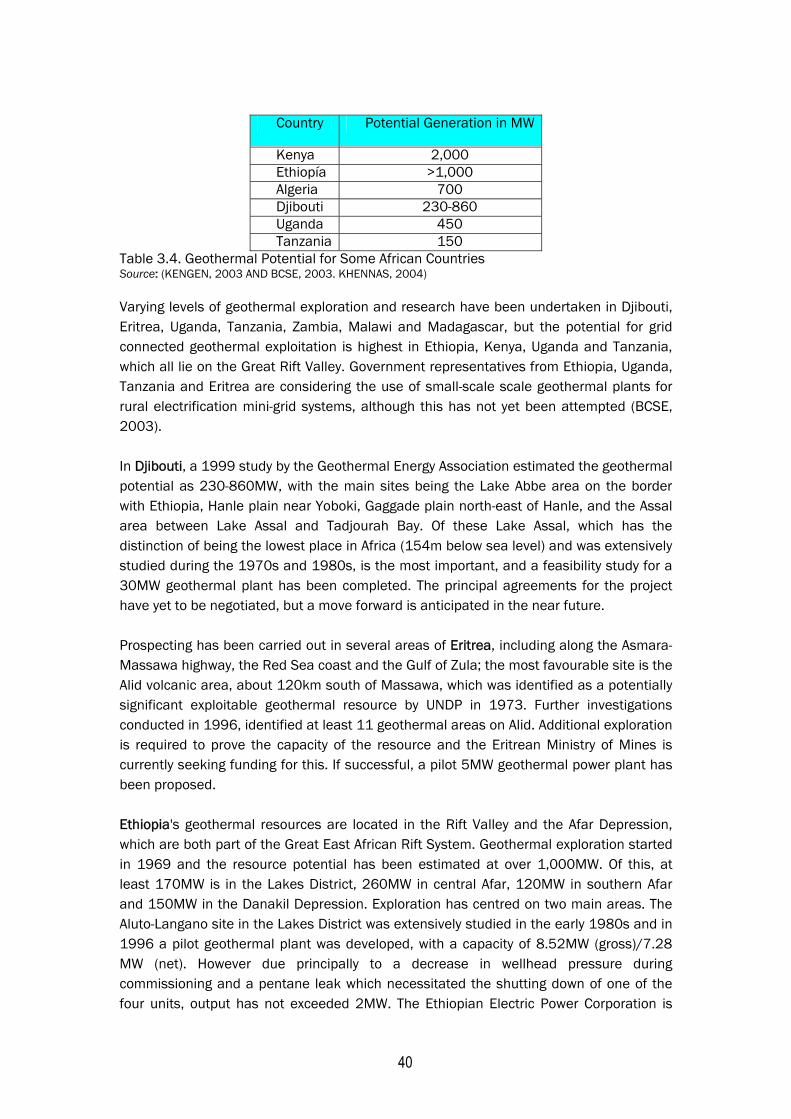
40
Country Potential Generation in MW
Kenya 2,000 Ethiopía >1,000 Algeria 700 Djibouti 230-860 Uganda 450 Tanzania 150
Table 3.4. Geothermal Potential for Some African Countries Source: (KENGEN, 2003 AND BCSE, 2003. KHENNAS, 2004) Varying levels of geothermal exploration and research have been undertaken in Djibouti, Eritrea, Uganda, Tanzania, Zambia, Malawi and Madagascar, but the potential for grid connected geothermal exploitation is highest in Ethiopia, Kenya, Uganda and Tanzania, which all lie on the Great Rift Valley. Government representatives from Ethiopia, Uganda, Tanzania and Eritrea are considering the use of small-scale scale geothermal plants for rural electrification mini-grid systems, although this has not yet been attempted (BCSE, 2003). In Djibouti, a 1999 study by the Geothermal Energy Association estimated the geothermal potential as 230-860MW, with the main sites being the Lake Abbe area on the border with Ethiopia, Hanle plain near Yoboki, Gaggade plain north-east of Hanle, and the Assal area between Lake Assal and Tadjourah Bay. Of these Lake Assal, which has the distinction of being the lowest place in Africa (154m below sea level) and was extensively studied during the 1970s and 1980s, is the most important, and a feasibility study for a 30MW geothermal plant has been completed. The principal agreements for the project have yet to be negotiated, but a move forward is anticipated in the near future. Prospecting has been carried out in several areas of Eritrea, including along the Asmara-Massawa highway, the Red Sea coast and the Gulf of Zula; the most favourable site is the Alid volcanic area, about 120km south of Massawa, which was identified as a potentially significant exploitable geothermal resource by UNDP in 1973. Further investigations conducted in 1996, identified at least 11 geothermal areas on Alid. Additional exploration is required to prove the capacity of the resource and the Eritrean Ministry of Mines is currently seeking funding for this. If successful, a pilot 5MW geothermal power plant has been proposed. Ethiopia's geothermal resources are located in the Rift Valley and the Afar Depression, which are both part of the Great East African Rift System. Geothermal exploration started in 1969 and the resource potential has been estimated at over 1,000MW. Of this, at least 170MW is in the Lakes District, 260MW in central Afar, 120MW in southern Afar and 150MW in the Danakil Depression. Exploration has centred on two main areas. The Aluto-Langano site in the Lakes District was extensively studied in the early 1980s and in 1996 a pilot geothermal plant was developed, with a capacity of 8.52MW (gross)/7.28 MW (net). However due principally to a decrease in wellhead pressure during commissioning and a pentane leak which necessitated the shutting down of one of the four units, output has not exceeded 2MW. The Ethiopian Electric Power Corporation is
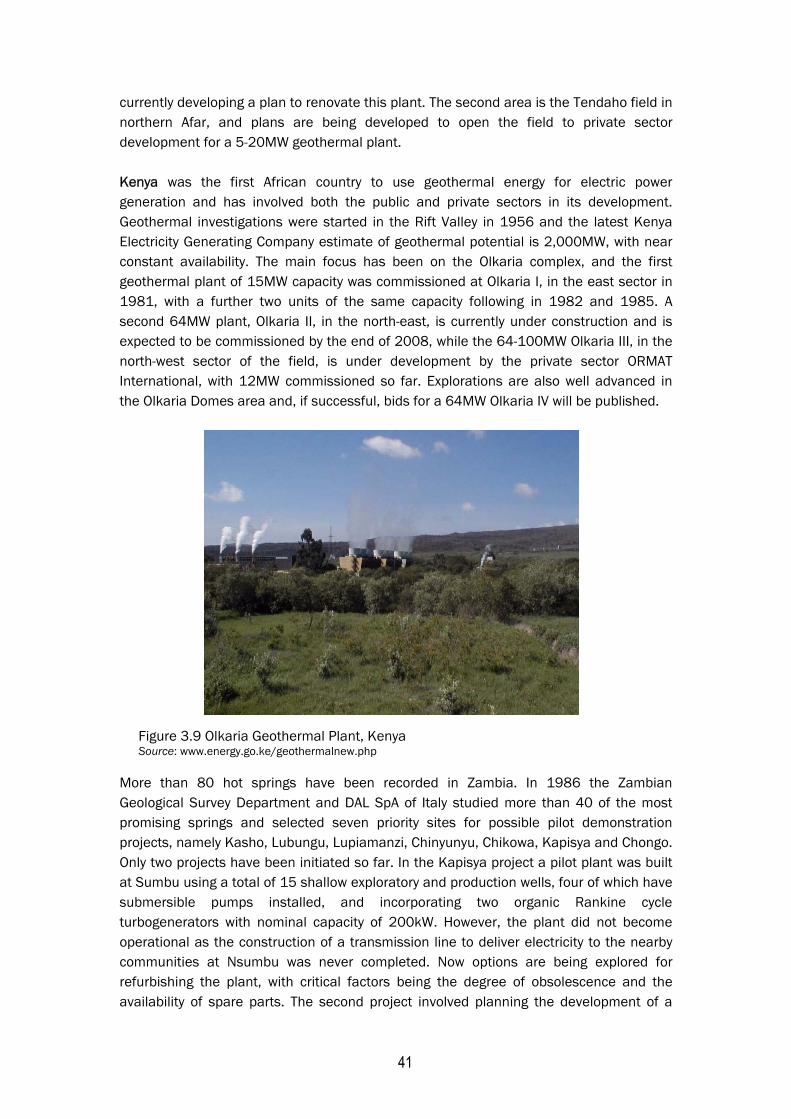
41
currently developing a plan to renovate this plant. The second area is the Tendaho field in northern Afar, and plans are being developed to open the field to private sector development for a 5-20MW geothermal plant. Kenya was the first African country to use geothermal energy for electric power generation and has involved both the public and private sectors in its development. Geothermal investigations were started in the Rift Valley in 1956 and the latest Kenya Electricity Generating Company estimate of geothermal potential is 2,000MW, with near constant availability. The main focus has been on the Olkaria complex, and the first geothermal plant of 15MW capacity was commissioned at Olkaria I, in the east sector in 1981, with a further two units of the same capacity following in 1982 and 1985. A second 64MW plant, Olkaria II, in the north-east, is currently under construction and is expected to be commissioned by the end of 2008, while the 64-100MW Olkaria III, in the north-west sector of the field, is under development by the private sector ORMAT International, with 12MW commissioned so far. Explorations are also well advanced in the Olkaria Domes area and, if successful, bids for a 64MW Olkaria IV will be published.
Figure 3.9 Olkaria Geothermal Plant, Kenya Source: www.energy.go.ke/geothermalnew.php
More than 80 hot springs have been recorded in Zambia. In 1986 the Zambian Geological Survey Department and DAL SpA of Italy studied more than 40 of the most promising springs and selected seven priority sites for possible pilot demonstration projects, namely Kasho, Lubungu, Lupiamanzi, Chinyunyu, Chikowa, Kapisya and Chongo. Only two projects have been initiated so far. In the Kapisya project a pilot plant was built at Sumbu using a total of 15 shallow exploratory and production wells, four of which have submersible pumps installed, and incorporating two organic Rankine cycle turbogenerators with nominal capacity of 200kW. However, the plant did not become operational as the construction of a transmission line to deliver electricity to the nearby communities at Nsumbu was never completed. Now options are being explored for refurbishing the plant, with critical factors being the degree of obsolescence and the availability of spare parts. The second project involved planning the development of a
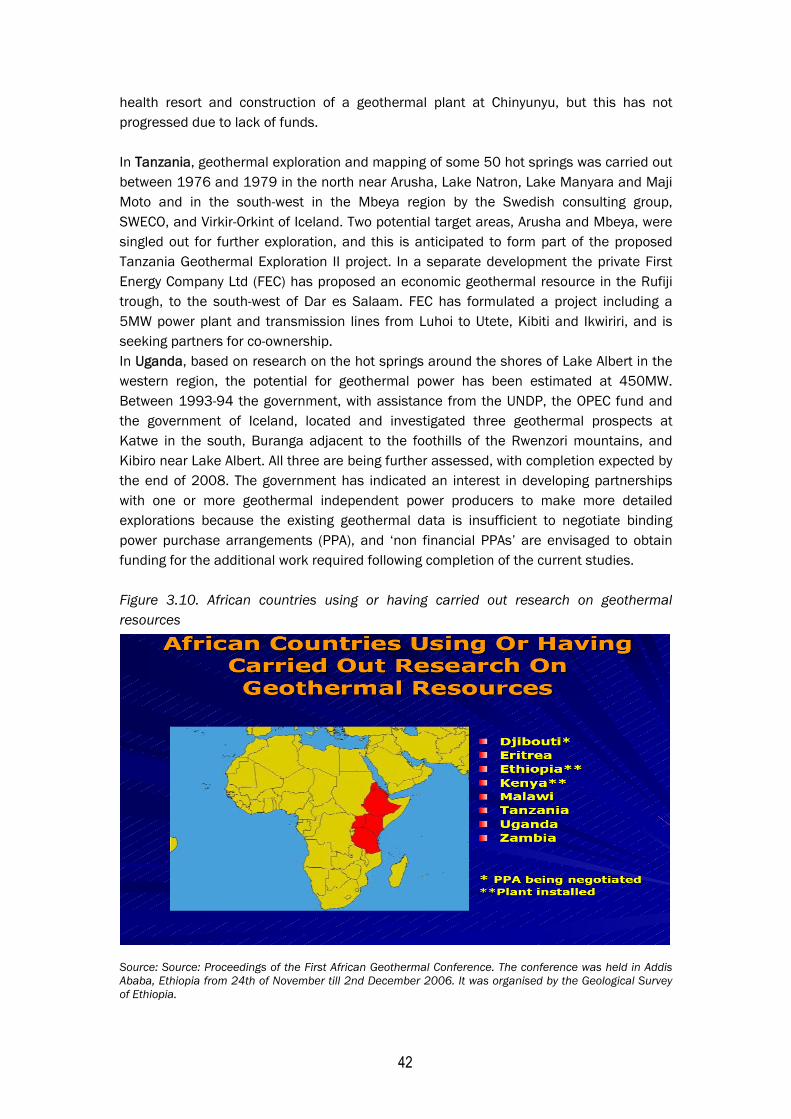
42
health resort and construction of a geothermal plant at Chinyunyu, but this has not progressed due to lack of funds. In Tanzania, geothermal exploration and mapping of some 50 hot springs was carried out between 1976 and 1979 in the north near Arusha, Lake Natron, Lake Manyara and Maji Moto and in the south-west in the Mbeya region by the Swedish consulting group, SWECO, and Virkir-Orkint of Iceland. Two potential target areas, Arusha and Mbeya, were singled out for further exploration, and this is anticipated to form part of the proposed Tanzania Geothermal Exploration II project. In a separate development the private First Energy Company Ltd (FEC) has proposed an economic geothermal resource in the Rufiji trough, to the south-west of Dar es Salaam. FEC has formulated a project including a 5MW power plant and transmission lines from Luhoi to Utete, Kibiti and Ikwiriri, and is seeking partners for co-ownership. In Uganda, based on research on the hot springs around the shores of Lake Albert in the western region, the potential for geothermal power has been estimated at 450MW. Between 1993-94 the government, with assistance from the UNDP, the OPEC fund and the government of Iceland, located and investigated three geothermal prospects at Katwe in the south, Buranga adjacent to the foothills of the Rwenzori mountains, and Kibiro near Lake Albert. All three are being further assessed, with completion expected by the end of 2008. The government has indicated an interest in developing partnerships with one or more geothermal independent power producers to make more detailed explorations because the existing geothermal data is insufficient to negotiate binding power purchase arrangements (PPA), and ‘non financial PPAs’ are envisaged to obtain funding for the additional work required following completion of the current studies. Figure 3.10. African countries using or having carried out research on geothermal resources
Source: Source: Proceedings of the First African Geothermal Conference. The conference was held in Addis Ababa, Ethiopia from 24th of November till 2nd December 2006. It was organised by the Geological Survey of Ethiopia.
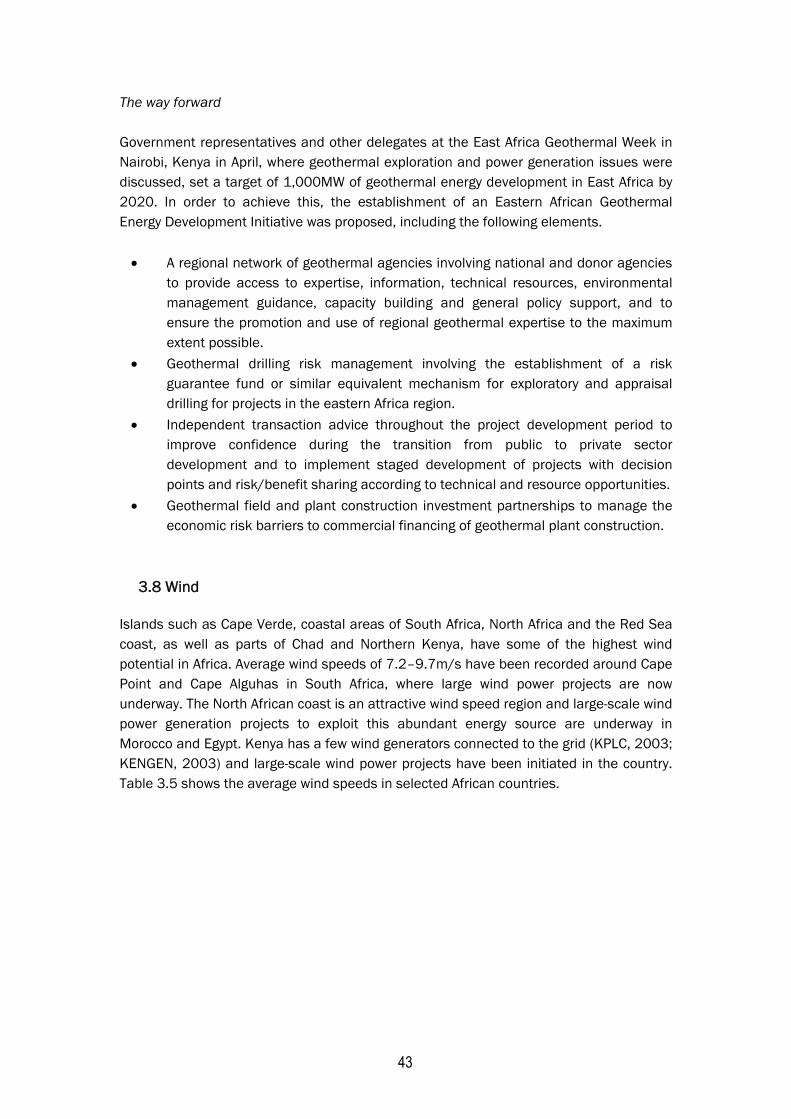
43
The way forward Government representatives and other delegates at the East Africa Geothermal Week in Nairobi, Kenya in April, where geothermal exploration and power generation issues were discussed, set a target of 1,000MW of geothermal energy development in East Africa by 2020. In order to achieve this, the establishment of an Eastern African Geothermal Energy Development Initiative was proposed, including the following elements. • A regional network of geothermal agencies involving national and donor agencies
to provide access to expertise, information, technical resources, environmental management guidance, capacity building and general policy support, and to ensure the promotion and use of regional geothermal expertise to the maximum extent possible.
• Geothermal drilling risk management involving the establishment of a risk guarantee fund or similar equivalent mechanism for exploratory and appraisal drilling for projects in the eastern Africa region.
• Independent transaction advice throughout the project development period to improve confidence during the transition from public to private sector development and to implement staged development of projects with decision points and risk/benefit sharing according to technical and resource opportunities.
• Geothermal field and plant construction investment partnerships to manage the economic risk barriers to commercial financing of geothermal plant construction.
3.8 Wind Islands such as Cape Verde, coastal areas of South Africa, North Africa and the Red Sea coast, as well as parts of Chad and Northern Kenya, have some of the highest wind potential in Africa. Average wind speeds of 7.2–9.7m/s have been recorded around Cape Point and Cape Alguhas in South Africa, where large wind power projects are now underway. The North African coast is an attractive wind speed region and large-scale wind power generation projects to exploit this abundant energy source are underway in Morocco and Egypt. Kenya has a few wind generators connected to the grid (KPLC, 2003; KENGEN, 2003) and large-scale wind power projects have been initiated in the country. Table 3.5 shows the average wind speeds in selected African countries.
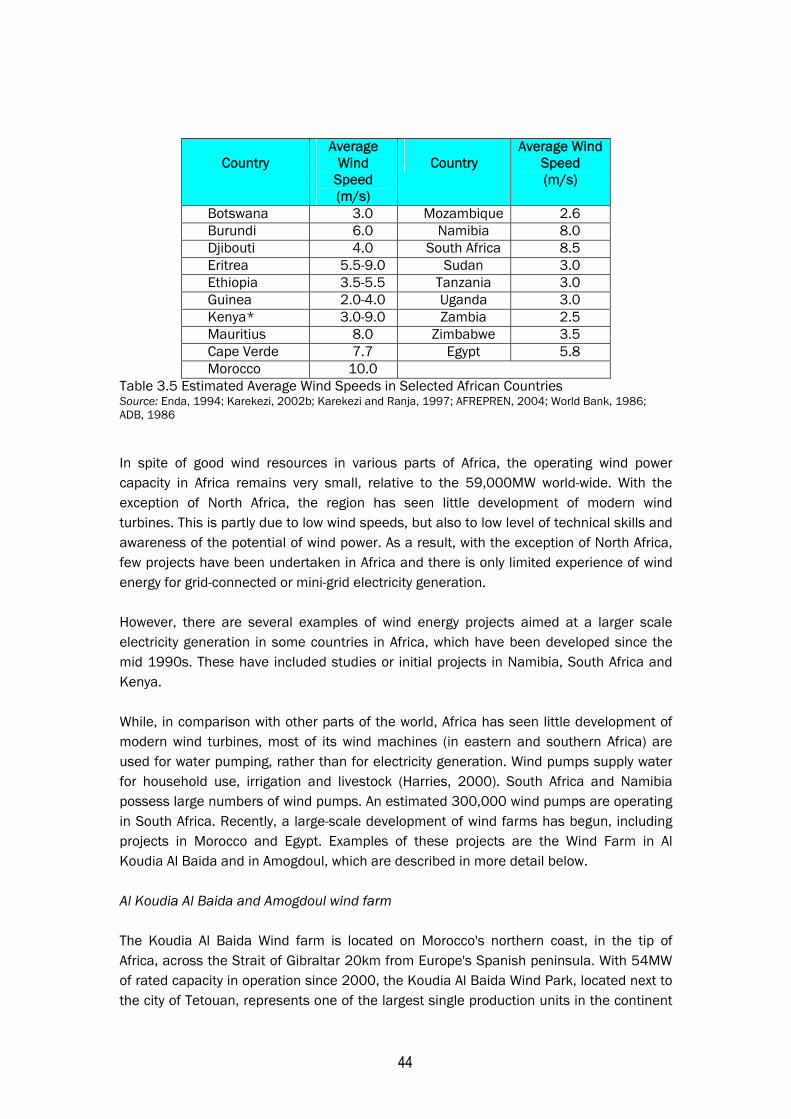
44
Country
Average Wind
Speed (m/s)
Country
Average Wind Speed (m/s)
Botswana 3.0 Mozambique 2.6 Burundi 6.0 Namibia 8.0 Djibouti 4.0 South Africa 8.5 Eritrea 5.5-9.0 Sudan 3.0 Ethiopia 3.5-5.5 Tanzania 3.0 Guinea 2.0-4.0 Uganda 3.0 Kenya* 3.0-9.0 Zambia 2.5 Mauritius 8.0 Zimbabwe 3.5 Cape Verde 7.7 Egypt 5.8 Morocco 10.0
Table 3.5 Estimated Average Wind Speeds in Selected African Countries Source: Enda, 1994; Karekezi, 2002b; Karekezi and Ranja, 1997; AFREPREN, 2004; World Bank, 1986; ADB, 1986
In spite of good wind resources in various parts of Africa, the operating wind power capacity in Africa remains very small, relative to the 59,000MW world-wide. With the exception of North Africa, the region has seen little development of modern wind turbines. This is partly due to low wind speeds, but also to low level of technical skills and awareness of the potential of wind power. As a result, with the exception of North Africa, few projects have been undertaken in Africa and there is only limited experience of wind energy for grid-connected or mini-grid electricity generation. However, there are several examples of wind energy projects aimed at a larger scale electricity generation in some countries in Africa, which have been developed since the mid 1990s. These have included studies or initial projects in Namibia, South Africa and Kenya. While, in comparison with other parts of the world, Africa has seen little development of modern wind turbines, most of its wind machines (in eastern and southern Africa) are used for water pumping, rather than for electricity generation. Wind pumps supply water for household use, irrigation and livestock (Harries, 2000). South Africa and Namibia possess large numbers of wind pumps. An estimated 300,000 wind pumps are operating in South Africa. Recently, a large-scale development of wind farms has begun, including projects in Morocco and Egypt. Examples of these projects are the Wind Farm in Al Koudia Al Baida and in Amogdoul, which are described in more detail below. Al Koudia Al Baida and Amogdoul wind farm The Koudia Al Baida Wind farm is located on Morocco's northern coast, in the tip of Africa, across the Strait of Gibraltar 20km from Europe's Spanish peninsula. With 54MW of rated capacity in operation since 2000, the Koudia Al Baida Wind Park, located next to the city of Tetouan, represents one of the largest single production units in the continent
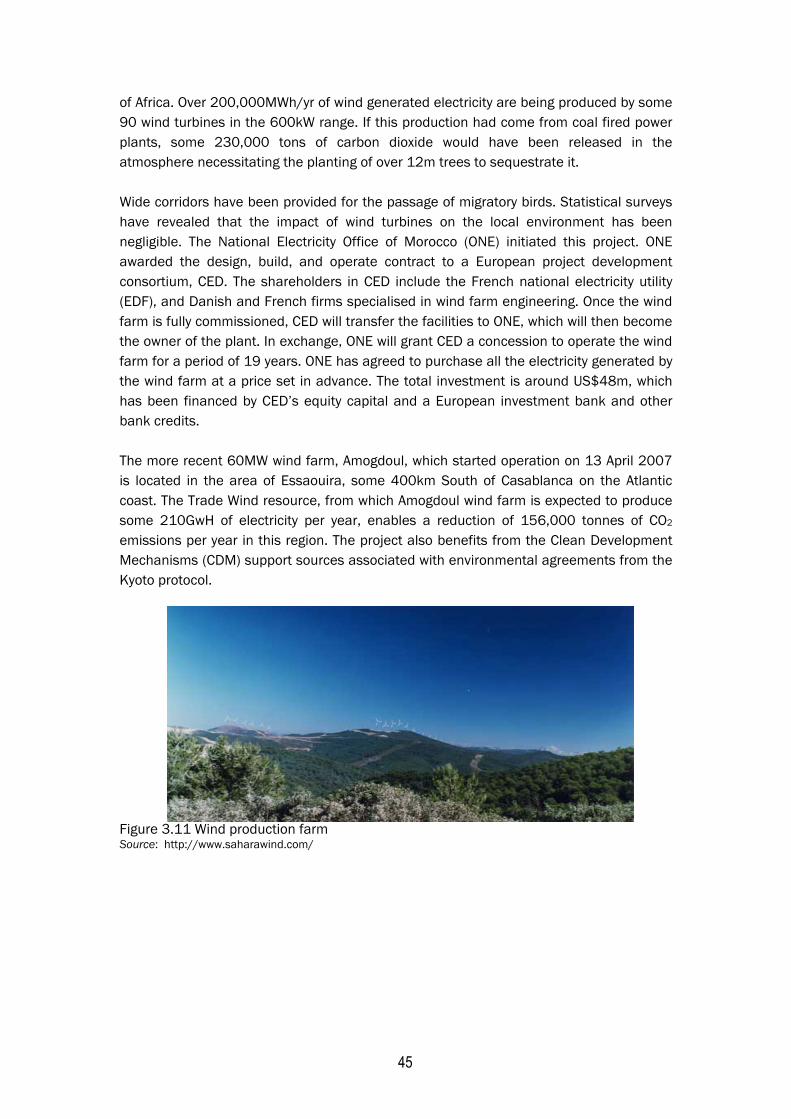
45
of Africa. Over 200,000MWh/yr of wind generated electricity are being produced by some 90 wind turbines in the 600kW range. If this production had come from coal fired power plants, some 230,000 tons of carbon dioxide would have been released in the atmosphere necessitating the planting of over 12m trees to sequestrate it. Wide corridors have been provided for the passage of migratory birds. Statistical surveys have revealed that the impact of wind turbines on the local environment has been negligible. The National Electricity Office of Morocco (ONE) initiated this project. ONE awarded the design, build, and operate contract to a European project development consortium, CED. The shareholders in CED include the French national electricity utility (EDF), and Danish and French firms specialised in wind farm engineering. Once the wind farm is fully commissioned, CED will transfer the facilities to ONE, which will then become the owner of the plant. In exchange, ONE will grant CED a concession to operate the wind farm for a period of 19 years. ONE has agreed to purchase all the electricity generated by the wind farm at a price set in advance. The total investment is around US$48m, which has been financed by CED’s equity capital and a European investment bank and other bank credits. The more recent 60MW wind farm, Amogdoul, which started operation on 13 April 2007 is located in the area of Essaouira, some 400km South of Casablanca on the Atlantic coast. The Trade Wind resource, from which Amogdoul wind farm is expected to produce some 210GwH of electricity per year, enables a reduction of 156,000 tonnes of CO2 emissions per year in this region. The project also benefits from the Clean Development Mechanisms (CDM) support sources associated with environmental agreements from the Kyoto protocol.
Figure 3.11 Wind production farm Source: http://www.saharawind.com/
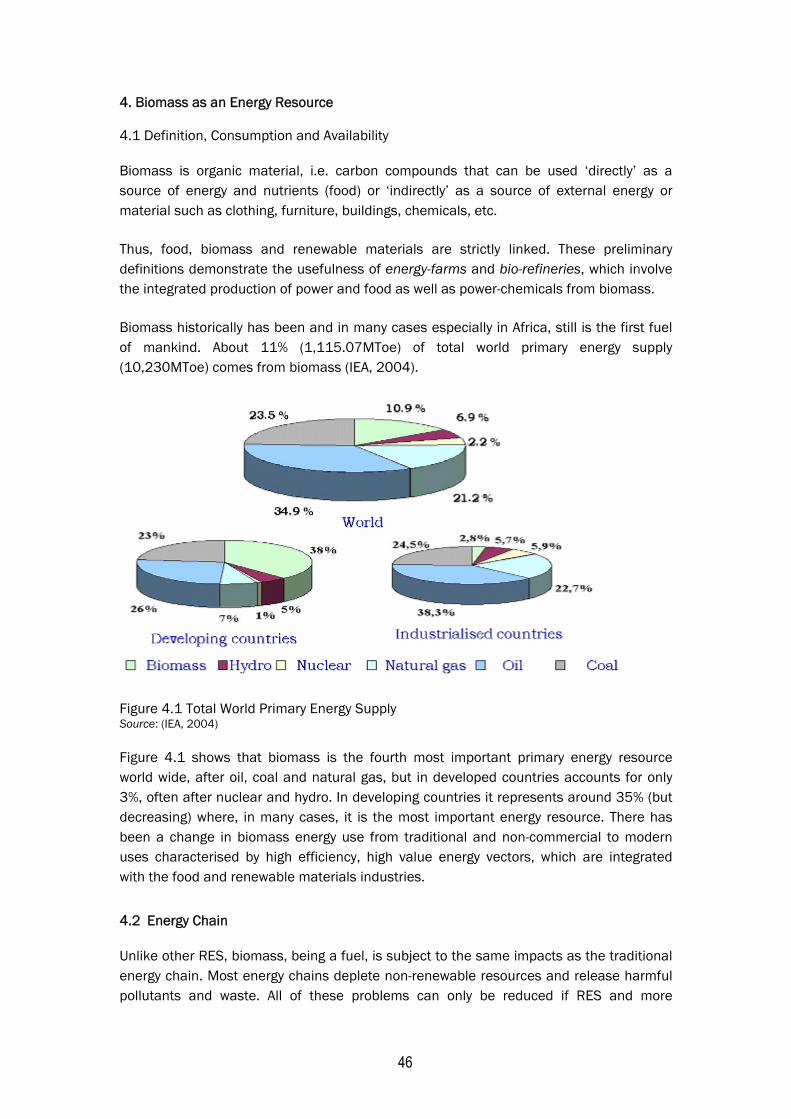
46
4. Biomass as an Energy Resource 4.1 Definition, Consumption and Availability
Biomass is organic material, i.e. carbon compounds that can be used ‘directly’ as a source of energy and nutrients (food) or ‘indirectly’ as a source of external energy or material such as clothing, furniture, buildings, chemicals, etc.
Thus, food, biomass and renewable materials are strictly linked. These preliminary definitions demonstrate the usefulness of energy-farms and bio-refineries, which involve the integrated production of power and food as well as power-chemicals from biomass.
Biomass historically has been and in many cases especially in Africa, still is the first fuel of mankind. About 11% (1,115.07MToe) of total world primary energy supply (10,230MToe) comes from biomass (IEA, 2004).
Figure 4.1 Total World Primary Energy Supply Source: (IEA, 2004)
Figure 4.1 shows that biomass is the fourth most important primary energy resource world wide, after oil, coal and natural gas, but in developed countries accounts for only 3%, often after nuclear and hydro. In developing countries it represents around 35% (but decreasing) where, in many cases, it is the most important energy resource. There has been a change in biomass energy use from traditional and non-commercial to modern uses characterised by high efficiency, high value energy vectors, which are integrated with the food and renewable materials industries.
4.2 Energy Chain
Unlike other RES, biomass, being a fuel, is subject to the same impacts as the traditional energy chain. Most energy chains deplete non-renewable resources and release harmful pollutants and waste. All of these problems can only be reduced if RES and more
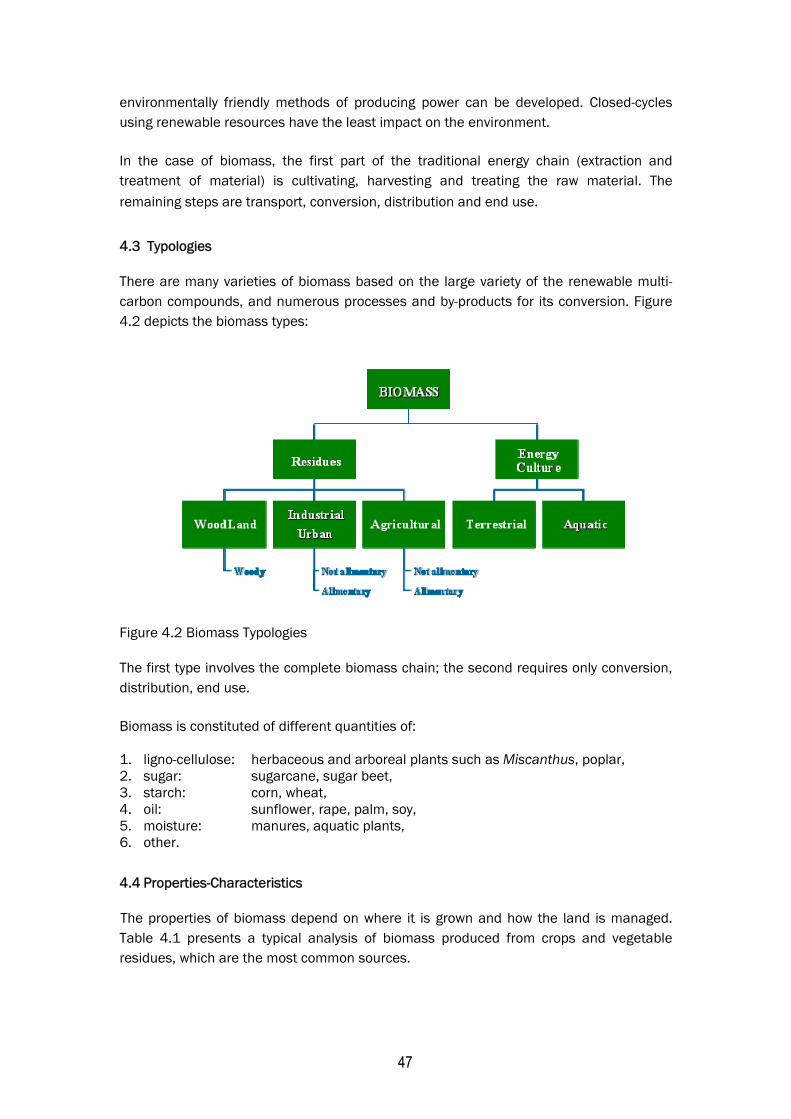
47
environmentally friendly methods of producing power can be developed. Closed-cycles using renewable resources have the least impact on the environment.
In the case of biomass, the first part of the traditional energy chain (extraction and treatment of material) is cultivating, harvesting and treating the raw material. The remaining steps are transport, conversion, distribution and end use.
4.3 Typologies
There are many varieties of biomass based on the large variety of the renewable multi-carbon compounds, and numerous processes and by-products for its conversion. Figure 4.2 depicts the biomass types:
Figure 4.2 Biomass Typologies
The first type involves the complete biomass chain; the second requires only conversion, distribution, end use.
Biomass is constituted of different quantities of: 1. ligno-cellulose: herbaceous and arboreal plants such as Miscanthus, poplar, 2. sugar: sugarcane, sugar beet, 3. starch: corn, wheat, 4. oil: sunflower, rape, palm, soy, 5. moisture: manures, aquatic plants, 6. other.
4.4 Properties-Characteristics
The properties of biomass depend on where it is grown and how the land is managed. Table 4.1 presents a typical analysis of biomass produced from crops and vegetable residues, which are the most common sources.
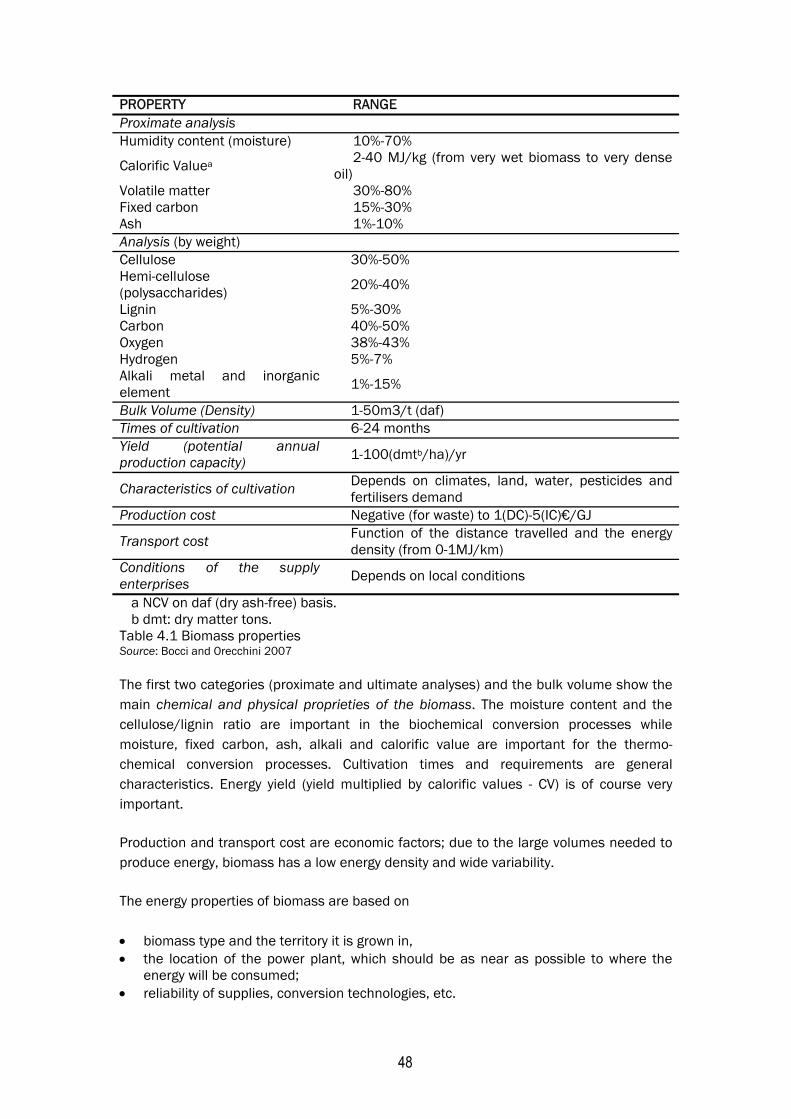
48
PROPERTY RANGE Proximate analysis Humidity content (moisture) 10%-70%
Calorific Valuea 2-40 MJ/kg (from very wet biomass to very dense oil)
Volatile matter 30%-80% Fixed carbon 15%-30% Ash 1%-10% Analysis (by weight) Cellulose 30%-50% Hemi-cellulose (polysaccharides) 20%-40%
Lignin 5%-30% Carbon 40%-50% Oxygen 38%-43% Hydrogen 5%-7% Alkali metal and inorganic element 1%-15%
Bulk Volume (Density) 1-50m3/t (daf) Times of cultivation 6-24 months Yield (potential annual production capacity) 1-100(dmtb/ha)/yr
Characteristics of cultivation Depends on climates, land, water, pesticides and fertilisers demand
Production cost Negative (for waste) to 1(DC)-5(IC)€/GJ
Transport cost Function of the distance travelled and the energy density (from 0-1MJ/km)
Conditions of the supply enterprises Depends on local conditions
a NCV on daf (dry ash-free) basis. b dmt: dry matter tons.
Table 4.1 Biomass properties Source: Bocci and Orecchini 2007
The first two categories (proximate and ultimate analyses) and the bulk volume show the main chemical and physical proprieties of the biomass. The moisture content and the cellulose/lignin ratio are important in the biochemical conversion processes while moisture, fixed carbon, ash, alkali and calorific value are important for the thermo-chemical conversion processes. Cultivation times and requirements are general characteristics. Energy yield (yield multiplied by calorific values - CV) is of course very important.
Production and transport cost are economic factors; due to the large volumes needed to produce energy, biomass has a low energy density and wide variability.
The energy properties of biomass are based on
• biomass type and the territory it is grown in, • the location of the power plant, which should be as near as possible to where the
energy will be consumed; • reliability of supplies, conversion technologies, etc.
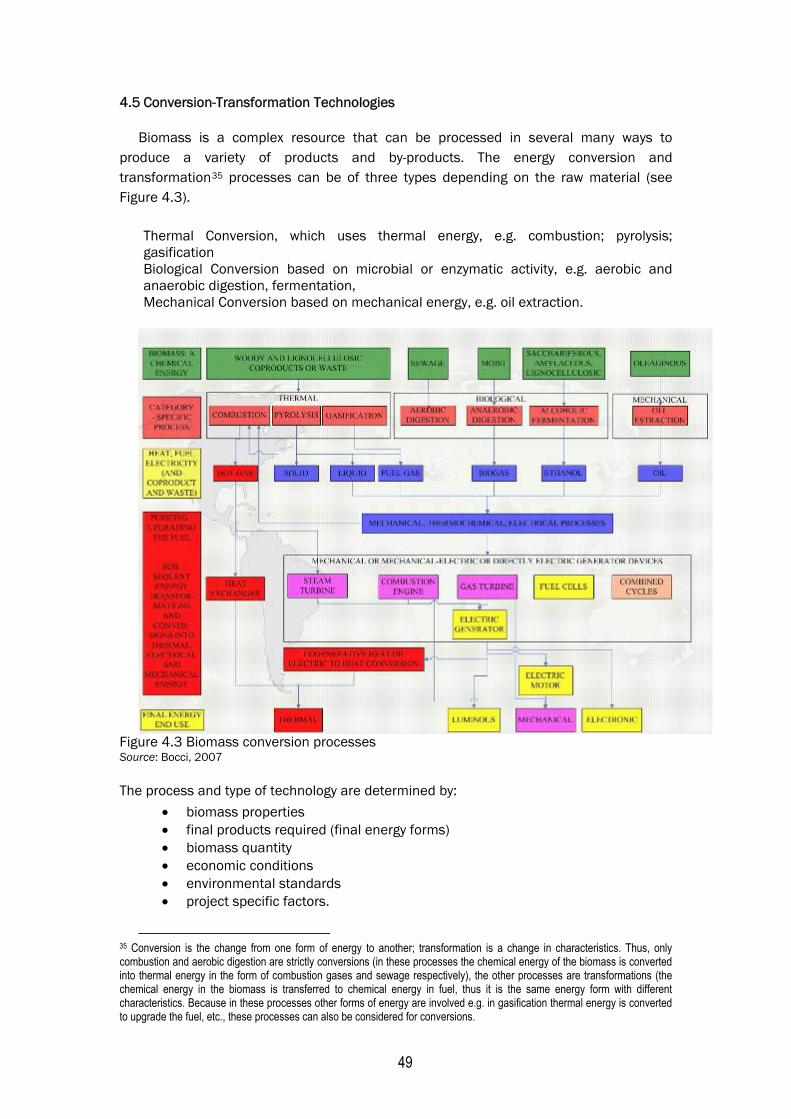
49
4.5 Conversion-Transformation Technologies
Biomass is a complex resource that can be processed in several many ways to produce a variety of products and by-products. The energy conversion and transformation35 processes can be of three types depending on the raw material (see Figure 4.3).
Thermal Conversion, which uses thermal energy, e.g. combustion; pyrolysis; gasification Biological Conversion based on microbial or enzymatic activity, e.g. aerobic and anaerobic digestion, fermentation, Mechanical Conversion based on mechanical energy, e.g. oil extraction.
Figure 4.3 Biomass conversion processes Source: Bocci, 2007
The process and type of technology are determined by:
• biomass properties • final products required (final energy forms) • biomass quantity • economic conditions • environmental standards • project specific factors.
35 Conversion is the change from one form of energy to another; transformation is a change in characteristics. Thus, only combustion and aerobic digestion are strictly conversions (in these processes the chemical energy of the biomass is converted into thermal energy in the form of combustion gases and sewage respectively), the other processes are transformations (the chemical energy in the biomass is transferred to chemical energy in fuel, thus it is the same energy form with different characteristics. Because in these processes other forms of energy are involved e.g. in gasification thermal energy is converted to upgrade the fuel, etc., these processes can also be considered for conversions.
50
Humidity, cellulose/lignin ratio and oil content all have an influence on the choice of process. For example, biochemical processes are more suitable for biomass with a high moisture content and high cellulose/lignin ratio. Other properties of the biomass are taken into account in choosing the process technologies and have an effect on the yield and reliability of the production chain.
The final energy forms required and, in some cases, the economic conditions and environmental standards of a country influence the choice of process. All possible processes use all the available chemical energy, but the energy is delivered in different ways with different levels of efficiency. Aerobic digestion produces heat only at low temperatures and is thus most suited to treating sewage than producing energy. The direct combustion of solid biomass supplies only heat, which can be converted into electricity, but with low efficiency, i.e. only large scale combustion of solid fuel would produce sufficient steam to power a turbine. Also, combustion of solid biomass releases a lot of contaminants. The process known as old pyrolysis transforms the chemical energy of biomass into chemical energy in a solid or a liquid, i.e. modern pyrolysis, fermentation, oil extraction and gaseous fuel, namely, gasification, anaerobic digestion.
The fuel obtained from any of these processes needs to be purified and/or upgraded through subsequent mechanical and/or thermo-chemical treatment, i.e. cracking, reforming, synthesis, esterification, etc. and/or electrical treatment, i.e. electrostatic precipitation, etc. Obviously a high CV fuel will be more efficient. High CV fuel and/or electricity is also more easy to transport and has many different uses. With liquid or gas fuels the electricity is obtained via Combustion Engines (CE), Gas Turbines (GT), Fuel Cells (FC) or Combined Cycles (CC), which are more efficient than steam turbines.
Final end uses of the energy can be for heat, light or mechanical or electronic power: • heat is produced via combustion, • mechanical energy is produced via CE or GT (which are used for land, sea or
air transport) • electricity is produced directly using FC or indirectly via mechanical energy
(CE, ST, GT, CC) and can be used for lighting, etc.
Each process results in different energy products (heat-fuel-electricity), by-products and waste, which require different treatments. Thus, the energy/materials balance and the economic, social and environmental analysis cannot be restricted only to the type of biomass and energy outcome, e.g. in biological processes about half of the mass and energy content of the primary material goes to by-products.
A sustainable biomass power plant needs to produce, heat/electricity/fuel and food or chemicals.
4.5.1 Thermal There are three main process options for thermo-chemical conversion combustion, pyrolysis or gasification.
Combustion of biomass produces gases at temperatures of 800–1,000°C. In theory any type of biomass can be burned, but in practice combustion is only feasible for biomass
51
with a moisture content of less than 50C. Combustion is the final process that occurs in the combustion chamber before the biomass has been dried, pyrolysed or gasified.
Pyrolysis is a thermal process of degradation that takes place at intermediate temperatures in the absence of air or in the presence of a limited amount of oxidating agents. The pyrolysis process produces:
a gaseous fraction with a low-medium CV composed of CO, CO2, CxHy, H2O, H2, etc; a liquid fraction composed of water and low molecular weight organic compounds; a solid fraction composed of residues with higher molecular weights.
The oldest pyrolysis technology is carbonisation, which produces coal. Conventional pyrolysis produces almost the same percentages of the three fractions listed above. Fast or flash pyrolysis maximises the liquid fraction. Recent research indicates that this liquid fraction can be used to produce biofuels.
Gasification converts the solid fuel into gas through an endothermic process. IHG (Indirectly Heated Gasification) or OG (Oxygen Gasification) is the only form of gasification that produces a high CV and nitrogen free gas.
4.5.2 Biological Biological processes convert biomass into energy through a chemical reaction based on the action of enzymes, funghi and micro-organisms, which form in the biomass under certain conditions. These processes, which convert only the carbohydrate portion, are applied to biomass with a carbon-to-nitrogen (C:N) ratio between 16 and 30 (a low lignin content), and a moisture content above 30%.
There are three types of biological processes: aerobic digestion; anaerobic digestion (to produce a biogas mixture composed mainly of methane and carbon dioxide); alcoholic fermentation (to produce ethanol).
Aerobic digestion uses aerobic micro-organisms, which cause the organic matter to decompose and produce heat, carbon dioxide and water. It is used to purify sewage and is not suited to energy production as the heat produced is at low temperatures, which would allow the aerobic micro-organisms to survive.
In anaerobic digestion, the biomass is converted by bacteria in an anaerobic environment, producing a gas composed 65-70% of CH4 and 30-35% of CO2. This biogas can be sold and burned to produce heat for use in CE/GT/FC to produce electricity (and heat in cogeneration).
In alcoholic fermentation starch is converted by enzymes to sugars, and sugars with yeast are converted to ethanol. The ethanol can be sold and burned to produce heat, which can be used in CE/GT/FC to generate electricity and heat.
4.5.3 Mechanical Oil extraction is a mechanical transformation process used to extract oil from seeds. The biomass is dried, husked, crushed and pressed to extract the oil. The residues can be treated with solvents to extract more oil. The final oil is processed by reacting it with
52
alcohol, which is known as esterification, to produce bio-diesel. The bio-diesel can be sold and burned to obtain heat, used in CE/GT/FC to generate electricity and heat.
4.6 Traditional vs Modern Biomass Uses
Biological processes are similar to the traditional processes for obtaining energy and nutrients. Renewable processes for the production of food, fuel and chemicals are recent. Fermentation was traditionally used only to produce alcoholic beverages. The processes that produced coal, oil and natural gas from biomass can be seen as types of ‘pyrolysis/gasification’ processes; however, they are not renewable and took millions of years to be completed.
The most traditional biomass energy use and also the first form of energy to be consciously used by humans is the simple combustion of solid biomass to produce heat or light.
Due to the toxic emissions of the combustion and the impossibility to burn, with significant yield, all types of biomass, other processes were developed to produce fuel. Thus, excluding direct combustion, biomass energy generally leads to biofuels i.e. including solid and gaseous as well as liquid forms.
53
5. Introduction to Biofuels
Biofuels are liquid36 fuels produced from organic material. The most common biofuels are bio-diesel, which is made from vegetable oils, and bio-ethanol, which is made from sugar and starch crops. Research is underway to commercialise ‘second-generation’ production techniques to produce biofuels from woody material, grasses and some types of waste. Biofuels are unique in being the only direct substitute for oil in transport that is available on a significant scale. Other technologies, such as hydrogen, have potential but they are far from large-scale viability and will require major changes to vehicle engines and fuel distribution systems. Biofuels can be used in standard engines, unmodified for low blends or with cheap modification to accept high blends. Changing the fuel mix in transport is important because the transport system is almost entirely dependent on oil, most of which comes from politically unstable parts of the world. Its import by non-oil producing countries increases GHG emissions. Thus, promotion of biofuels would increase security of supply and support climate change policy. The production of biofuels, however, does produce GHG and can cause significant environmental damage by using land converted from high-diversity natural environments,37 effects that need to be reduced as much as possible
The most traditional biofuels are solid biofuels which are simple or treated ligno-cellulose biomass from wood, i.e. firewood, charcoal, chips, pellets, briquettes and powder; agricultural crops and residues, such as husks, straws, sugarcane bagasse, grass, etc.; herbaceous and fruit biomass, and waste, which is mainly solid recovered from the organic fraction of MSW. Biofuels are normally used in combustion processes can be used in other thermal processes and some biological processes. Traditional use involves simple open-air or in-house burning. More recent uses in developing countries have lower production volumes and are highly polluting and contribute to GHG38 emissions if the proportion of biomass used is more than the biomass that is being grown. Solid biofuels include wood, straws, energy crops and organic wastes.
Types of liquid and gaseous biofuels are old; the diesel engine and the model T Ford were originally designed to run on bio-diesel and bio-ethanol, respectively. The liquid and gaseous bio-fuels obtained by processes commercially available and widely applied in the world can be described as first generation biofuels and include bio-ethanol, vegetable oil, bio-diesel, biogas, and fuel gas, although today the term is usually understood to include only bio-ethanol and bio-diesel, which are more common due to their larger market share based on ease of transport. Table 5-1 summarises the first generation biofuels.
36 The EC (2004) report considers only liquid biofuels, here the definition comprises also solid and gaseous. 37 Report on the progress made in the use of biofuels and other renewable fuels in the Member States of the European Union, EU COM(2006) 845 final, 10.1.2007, Brussels. 38 GHGs include water vapour, carbon dioxide, methane, chlorofluorocarbons (CFCs) and hydrochlorofluorocarbons (HCFCs), which absorb and re-emit infrared radiation, warming the earth's surface and contributing to climate change (UNEP, 1998).
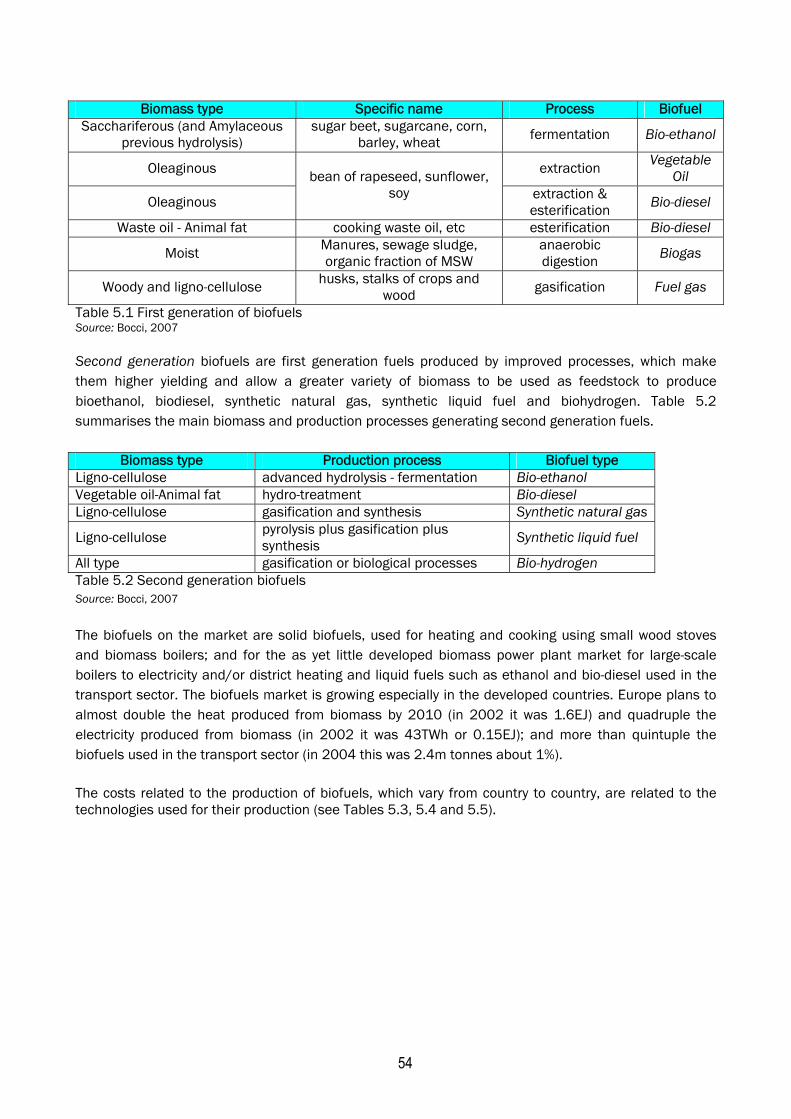
54
Biomass type Specific name Process Biofuel Sacchariferous (and Amylaceous
previous hydrolysis) sugar beet, sugarcane, corn,
barley, wheat fermentation Bio-ethanol
Oleaginous extraction Vegetable Oil
Oleaginous
bean of rapeseed, sunflower, soy extraction &
esterification Bio-diesel
Waste oil - Animal fat cooking waste oil, etc esterification Bio-diesel
Moist Manures, sewage sludge, organic fraction of MSW
anaerobic digestion Biogas
Woody and ligno-cellulose husks, stalks of crops and wood gasification Fuel gas
Table 5.1 First generation of biofuels Source: Bocci, 2007
Second generation biofuels are first generation fuels produced by improved processes, which make them higher yielding and allow a greater variety of biomass to be used as feedstock to produce bioethanol, biodiesel, synthetic natural gas, synthetic liquid fuel and biohydrogen. Table 5.2 summarises the main biomass and production processes generating second generation fuels.
Biomass type Production process Biofuel type Ligno-cellulose advanced hydrolysis - fermentation Bio-ethanol Vegetable oil-Animal fat hydro-treatment Bio-diesel Ligno-cellulose gasification and synthesis Synthetic natural gas
Ligno-cellulose pyrolysis plus gasification plus synthesis Synthetic liquid fuel
All type gasification or biological processes Bio-hydrogen Table 5.2 Second generation biofuels Source: Bocci, 2007
The biofuels on the market are solid biofuels, used for heating and cooking using small wood stoves and biomass boilers; and for the as yet little developed biomass power plant market for large-scale boilers to electricity and/or district heating and liquid fuels such as ethanol and bio-diesel used in the transport sector. The biofuels market is growing especially in the developed countries. Europe plans to almost double the heat produced from biomass by 2010 (in 2002 it was 1.6EJ) and quadruple the electricity produced from biomass (in 2002 it was 43TWh or 0.15EJ); and more than quintuple the biofuels used in the transport sector (in 2004 this was 2.4m tonnes about 1%).
The costs related to the production of biofuels, which vary from country to country, are related to the technologies used for their production (see Tables 5.3, 5.4 and 5.5).
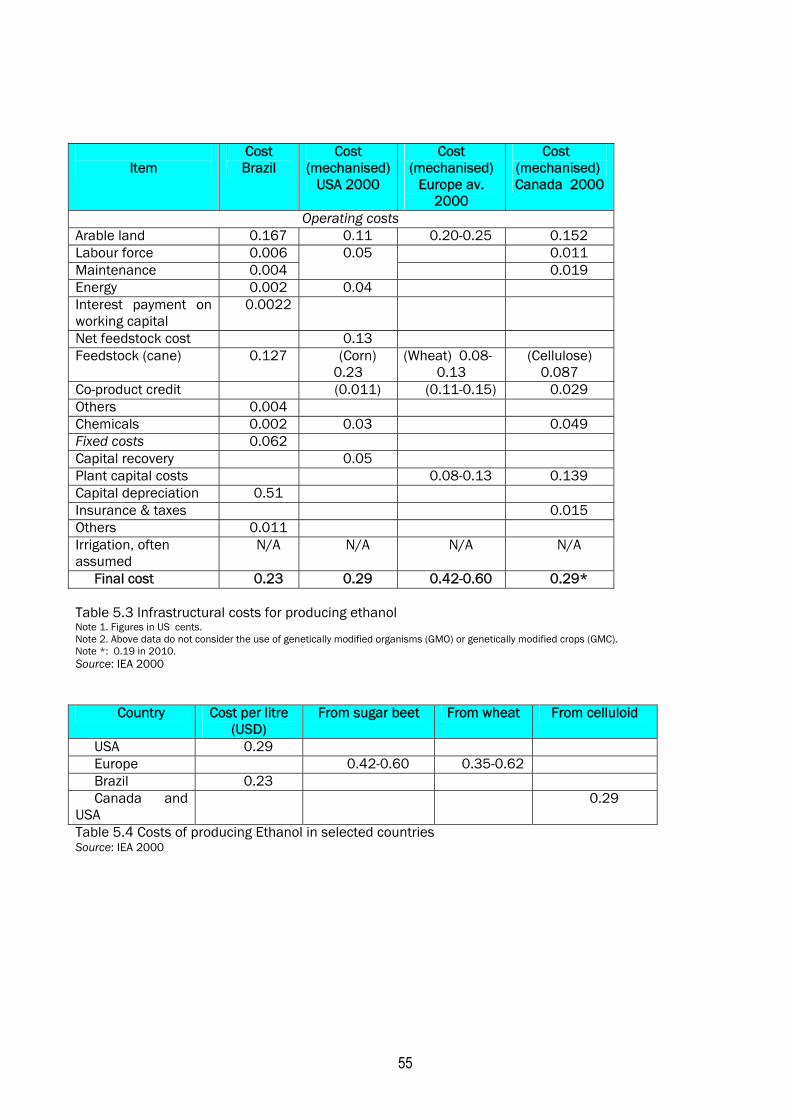
55
Item
Cost Brazil
Cost (mechanised)
USA 2000
Cost (mechanised)
Europe av. 2000
Cost (mechanised) Canada 2000
Operating costs Arable land 0.167 0.11 0.20-0.25 0.152 Labour force 0.006 0.011 Maintenance 0.004
0.05 0.019
Energy 0.002 0.04 Interest payment on working capital
0.0022
Net feedstock cost 0.13 Feedstock (cane) 0.127 (Corn)
0.23 (Wheat) 0.08-
0.13 (Cellulose)
0.087 Co-product credit (0.011) (0.11-0.15) 0.029 Others 0.004 Chemicals 0.002 0.03 0.049 Fixed costs 0.062 Capital recovery 0.05 Plant capital costs 0.08-0.13 0.139 Capital depreciation 0.51 Insurance & taxes 0.015 Others 0.011 Irrigation, often assumed
N/A N/A N/A N/A
Final cost 0.23 0.29 0.42-0.60 0.29* Table 5.3 Infrastructural costs for producing ethanol Note 1. Figures in US cents. Note 2. Above data do not consider the use of genetically modified organisms (GMO) or genetically modified crops (GMC). Note *: 0.19 in 2010. Source: IEA 2000
Country Cost per litre (USD)
From sugar beet From wheat From celluloid
USA 0.29 Europe 0.42-0.60 0.35-0.62 Brazil 0.23 Canada and
USA 0.29
Table 5.4 Costs of producing Ethanol in selected countries Source: IEA 2000
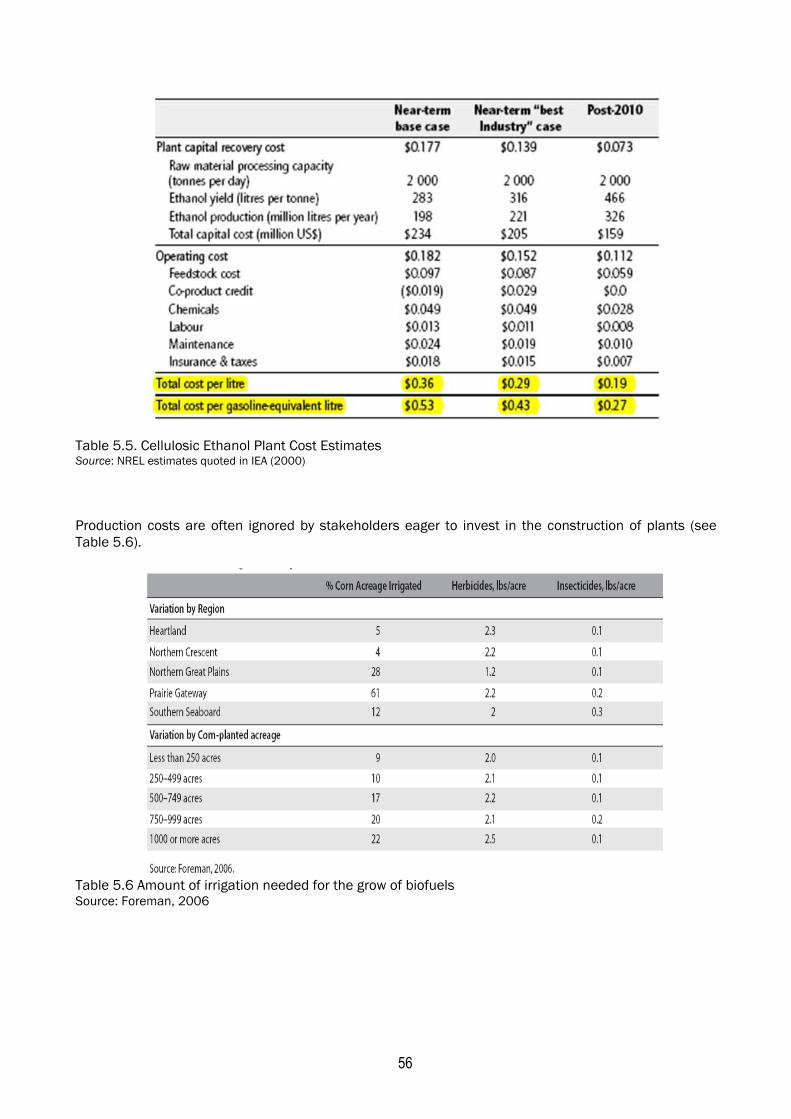
56
Table 5.5. Cellulosic Ethanol Plant Cost Estimates Source: NREL estimates quoted in IEA (2000) Production costs are often ignored by stakeholders eager to invest in the construction of plants (see Table 5.6).
Table 5.6 Amount of irrigation needed for the grow of biofuels Source: Foreman, 2006
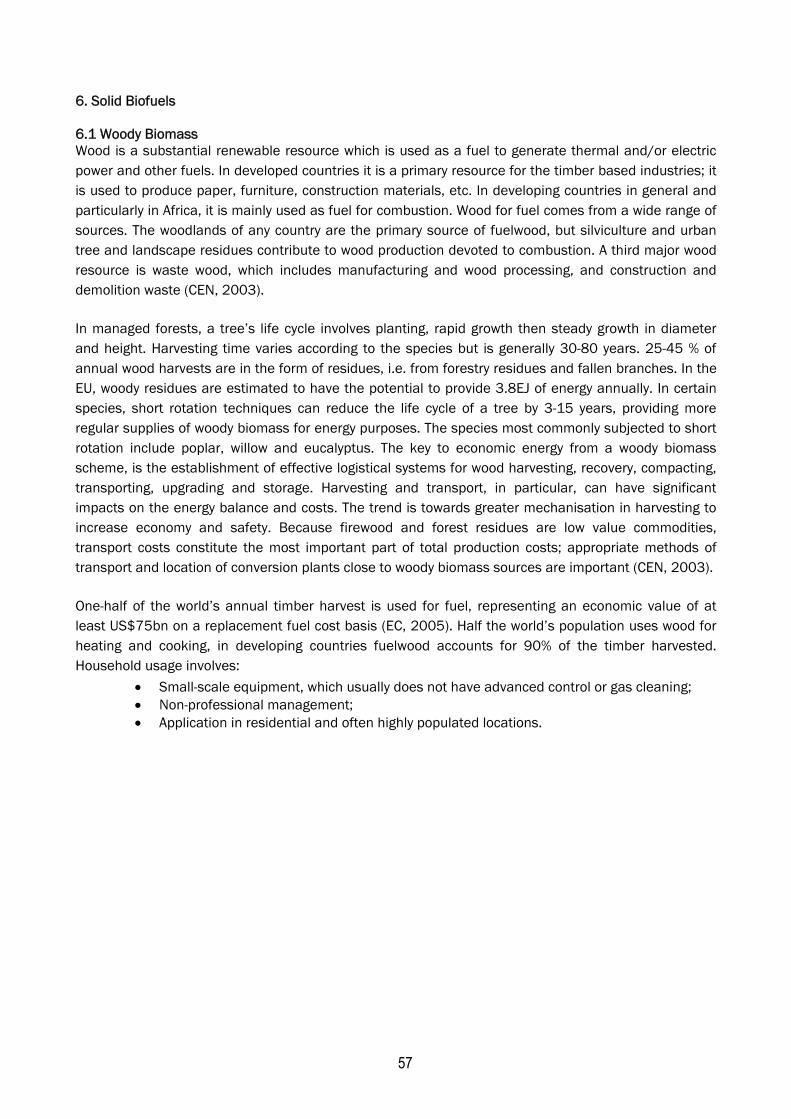
57
6. Solid Biofuels 6.1 Woody Biomass Wood is a substantial renewable resource which is used as a fuel to generate thermal and/or electric power and other fuels. In developed countries it is a primary resource for the timber based industries; it is used to produce paper, furniture, construction materials, etc. In developing countries in general and particularly in Africa, it is mainly used as fuel for combustion. Wood for fuel comes from a wide range of sources. The woodlands of any country are the primary source of fuelwood, but silviculture and urban tree and landscape residues contribute to wood production devoted to combustion. A third major wood resource is waste wood, which includes manufacturing and wood processing, and construction and demolition waste (CEN, 2003).
In managed forests, a tree’s life cycle involves planting, rapid growth then steady growth in diameter and height. Harvesting time varies according to the species but is generally 30-80 years. 25-45 % of annual wood harvests are in the form of residues, i.e. from forestry residues and fallen branches. In the EU, woody residues are estimated to have the potential to provide 3.8EJ of energy annually. In certain species, short rotation techniques can reduce the life cycle of a tree by 3-15 years, providing more regular supplies of woody biomass for energy purposes. The species most commonly subjected to short rotation include poplar, willow and eucalyptus. The key to economic energy from a woody biomass scheme, is the establishment of effective logistical systems for wood harvesting, recovery, compacting, transporting, upgrading and storage. Harvesting and transport, in particular, can have significant impacts on the energy balance and costs. The trend is towards greater mechanisation in harvesting to increase economy and safety. Because firewood and forest residues are low value commodities, transport costs constitute the most important part of total production costs; appropriate methods of transport and location of conversion plants close to woody biomass sources are important (CEN, 2003).
One-half of the world’s annual timber harvest is used for fuel, representing an economic value of at least US$75bn on a replacement fuel cost basis (EC, 2005). Half the world’s population uses wood for heating and cooking, in developing countries fuelwood accounts for 90% of the timber harvested. Household usage involves:
• Small-scale equipment, which usually does not have advanced control or gas cleaning; • Non-professional management; • Application in residential and often highly populated locations.
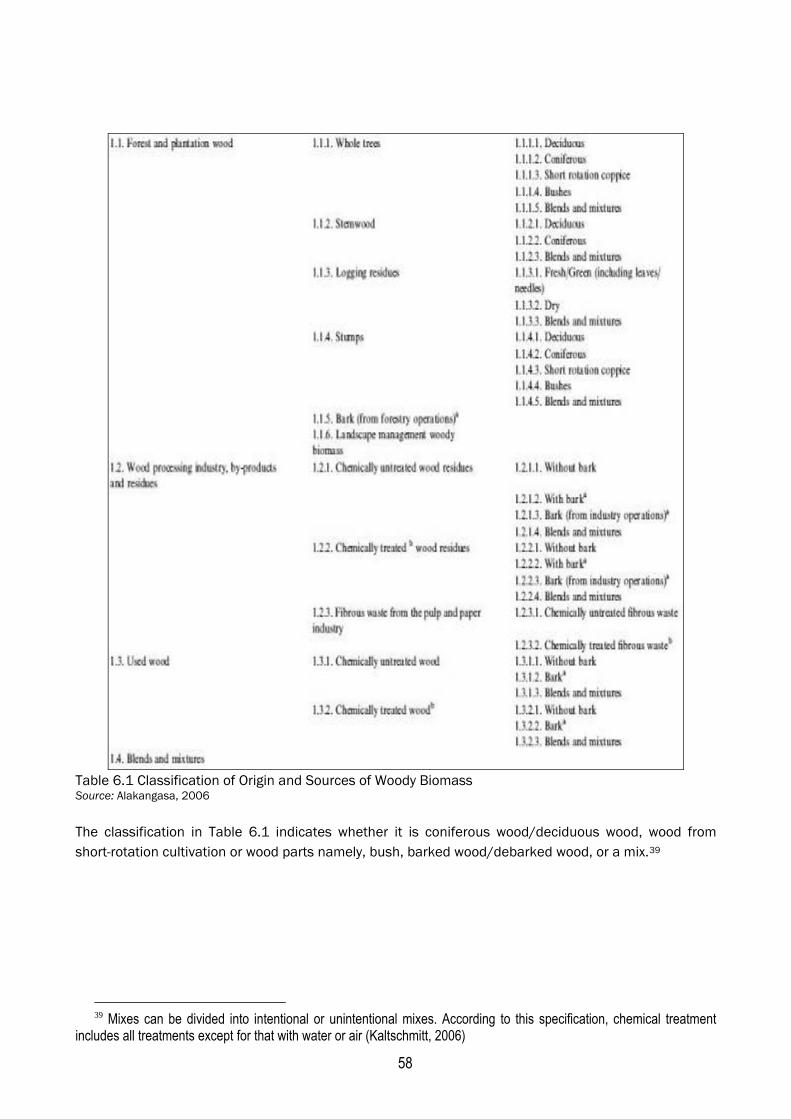
58
Table 6.1 Classification of Origin and Sources of Woody Biomass Source: Alakangasa, 2006
The classification in Table 6.1 indicates whether it is coniferous wood/deciduous wood, wood from short-rotation cultivation or wood parts namely, bush, barked wood/debarked wood, or a mix.39
39 Mixes can be divided into intentional or unintentional mixes. According to this specification, chemical treatment
includes all treatments except for that with water or air (Kaltschmitt, 2006)
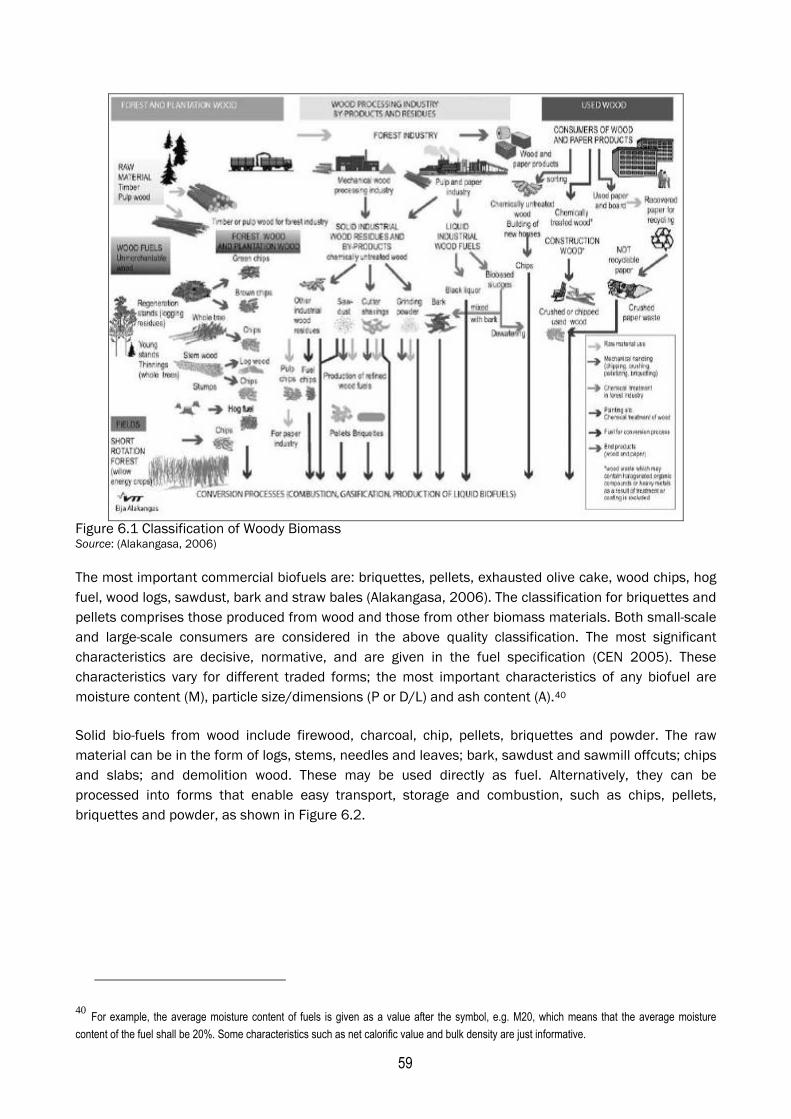
59
Figure 6.1 Classification of Woody Biomass Source: (Alakangasa, 2006)
The most important commercial biofuels are: briquettes, pellets, exhausted olive cake, wood chips, hog fuel, wood logs, sawdust, bark and straw bales (Alakangasa, 2006). The classification for briquettes and pellets comprises those produced from wood and those from other biomass materials. Both small-scale and large-scale consumers are considered in the above quality classification. The most significant characteristics are decisive, normative, and are given in the fuel specification (CEN 2005). These characteristics vary for different traded forms; the most important characteristics of any biofuel are moisture content (M), particle size/dimensions (P or D/L) and ash content (A).40
Solid bio-fuels from wood include firewood, charcoal, chip, pellets, briquettes and powder. The raw material can be in the form of logs, stems, needles and leaves; bark, sawdust and sawmill offcuts; chips and slabs; and demolition wood. These may be used directly as fuel. Alternatively, they can be processed into forms that enable easy transport, storage and combustion, such as chips, pellets, briquettes and powder, as shown in Figure 6.2.
40 For example, the average moisture content of fuels is given as a value after the symbol, e.g. M20, which means that the average moisture content of the fuel shall be 20%. Some characteristics such as net calorific value and bulk density are just informative.
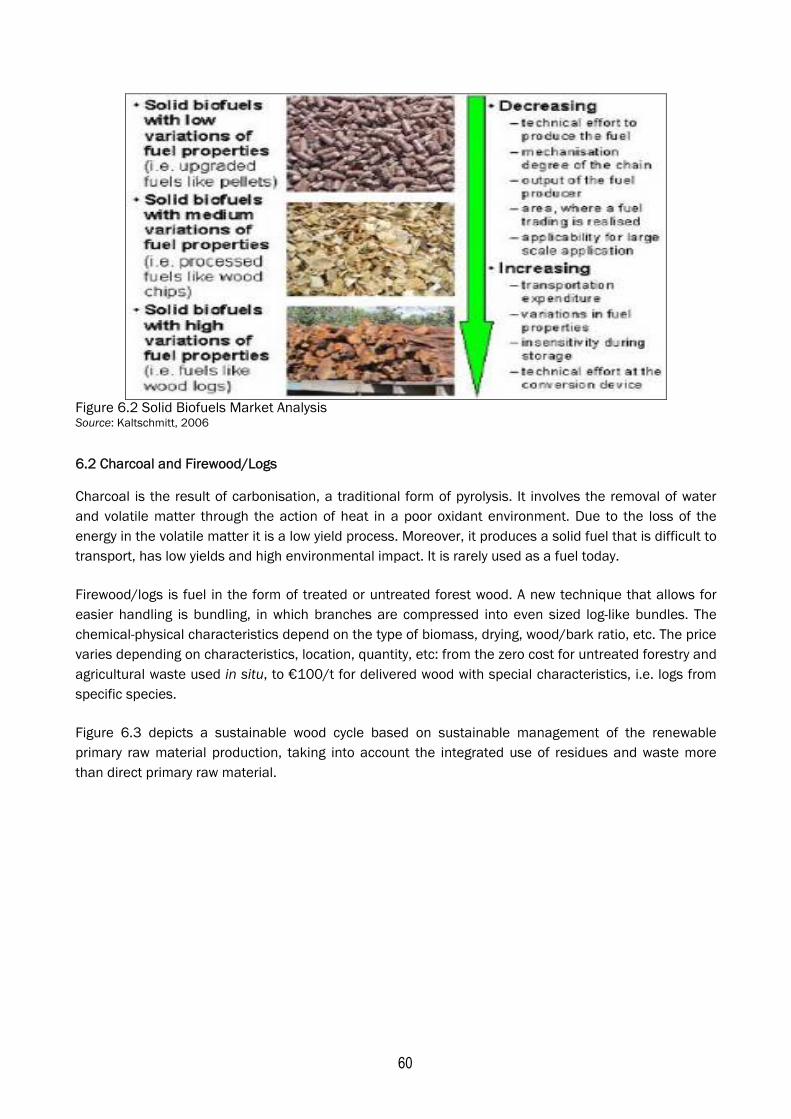
60
Figure 6.2 Solid Biofuels Market Analysis Source: Kaltschmitt, 2006
6.2 Charcoal and Firewood/Logs
Charcoal is the result of carbonisation, a traditional form of pyrolysis. It involves the removal of water and volatile matter through the action of heat in a poor oxidant environment. Due to the loss of the energy in the volatile matter it is a low yield process. Moreover, it produces a solid fuel that is difficult to transport, has low yields and high environmental impact. It is rarely used as a fuel today.
Firewood/logs is fuel in the form of treated or untreated forest wood. A new technique that allows for easier handling is bundling, in which branches are compressed into even sized log-like bundles. The chemical-physical characteristics depend on the type of biomass, drying, wood/bark ratio, etc. The price varies depending on characteristics, location, quantity, etc: from the zero cost for untreated forestry and agricultural waste used in situ, to €100/t for delivered wood with special characteristics, i.e. logs from specific species.
Figure 6.3 depicts a sustainable wood cycle based on sustainable management of the renewable primary raw material production, taking into account the integrated use of residues and waste more than direct primary raw material.
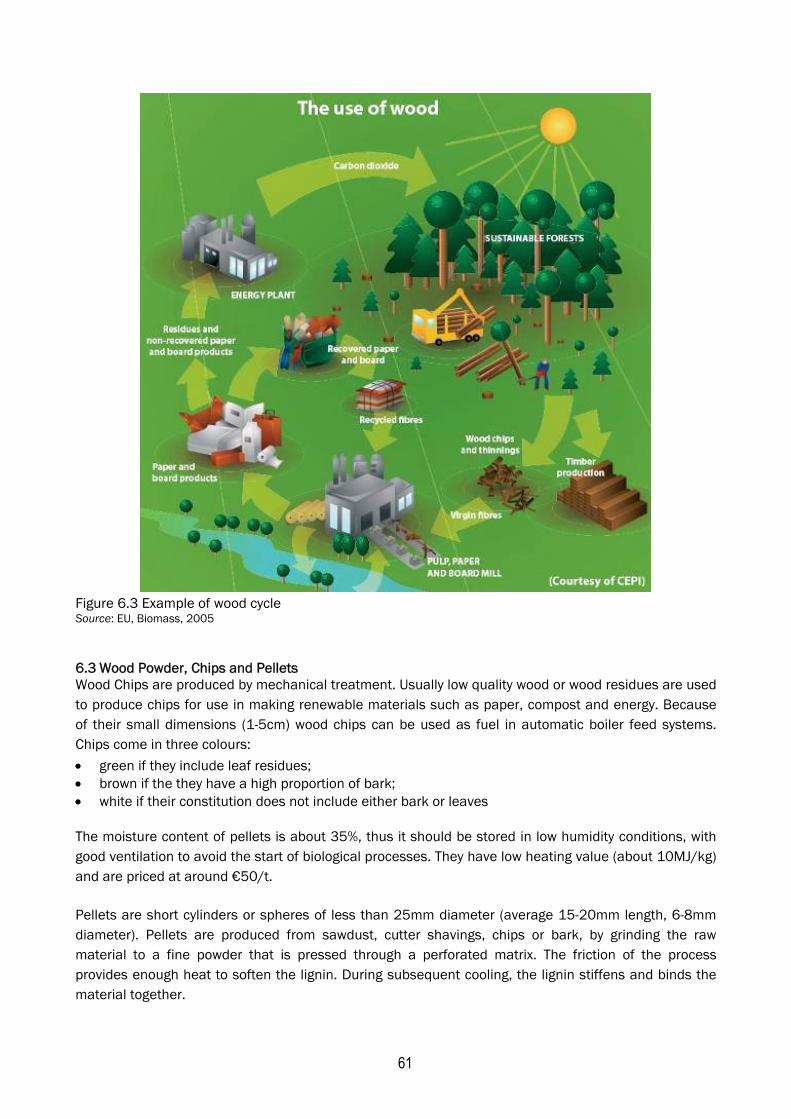
61
Figure 6.3 Example of wood cycle Source: EU, Biomass, 2005
6.3 Wood Powder, Chips and Pellets Wood Chips are produced by mechanical treatment. Usually low quality wood or wood residues are used to produce chips for use in making renewable materials such as paper, compost and energy. Because of their small dimensions (1-5cm) wood chips can be used as fuel in automatic boiler feed systems. Chips come in three colours:
• green if they include leaf residues; • brown if the they have a high proportion of bark; • white if their constitution does not include either bark or leaves
The moisture content of pellets is about 35%, thus it should be stored in low humidity conditions, with good ventilation to avoid the start of biological processes. They have low heating value (about 10MJ/kg) and are priced at around €50/t.
Pellets are short cylinders or spheres of less than 25mm diameter (average 15-20mm length, 6-8mm diameter). Pellets are produced from sawdust, cutter shavings, chips or bark, by grinding the raw material to a fine powder that is pressed through a perforated matrix. The friction of the process provides enough heat to soften the lignin. During subsequent cooling, the lignin stiffens and binds the material together.
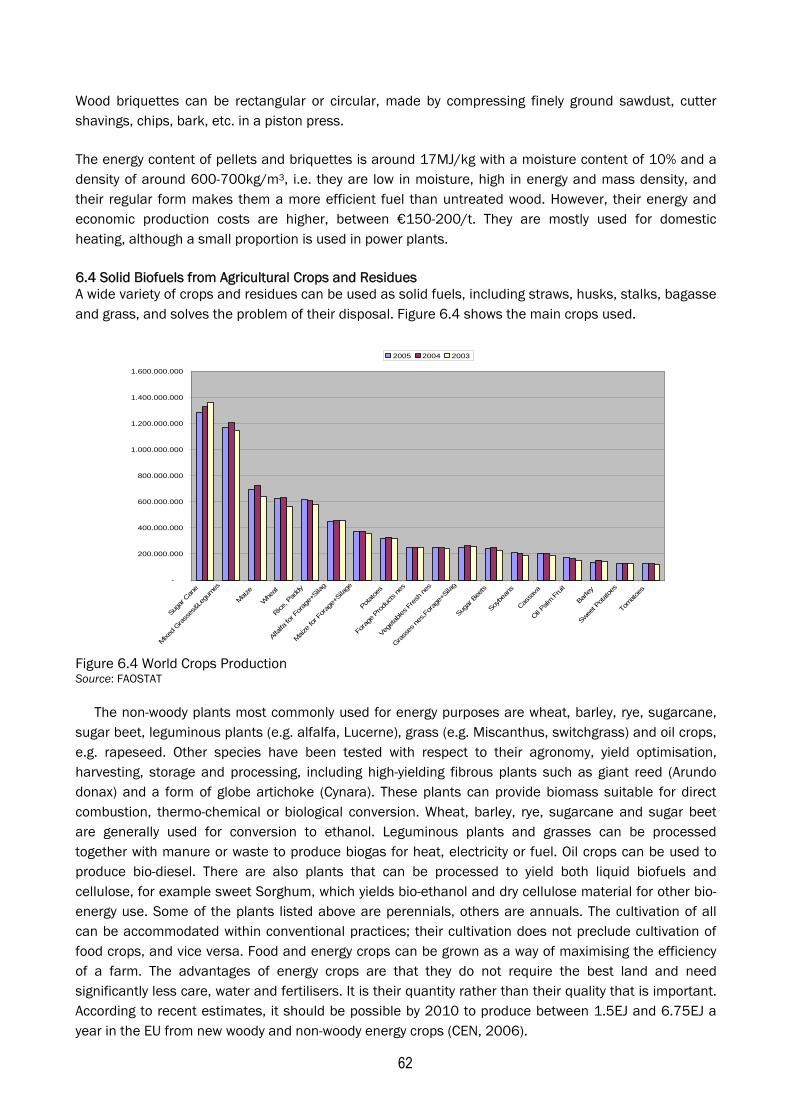
62
Wood briquettes can be rectangular or circular, made by compressing finely ground sawdust, cutter shavings, chips, bark, etc. in a piston press.
The energy content of pellets and briquettes is around 17MJ/kg with a moisture content of 10% and a density of around 600-700kg/m3, i.e. they are low in moisture, high in energy and mass density, and their regular form makes them a more efficient fuel than untreated wood. However, their energy and economic production costs are higher, between €150-200/t. They are mostly used for domestic heating, although a small proportion is used in power plants.
6.4 Solid Biofuels from Agricultural Crops and Residues A wide variety of crops and residues can be used as solid fuels, including straws, husks, stalks, bagasse and grass, and solves the problem of their disposal. Figure 6.4 shows the main crops used.
-
200.000.000
400.000.000
600.000.000
800.000.000
1.000.000.000
1.200.000.000
1.400.000.000
1.600.000.000
Suga
r Can
e
Mixed G
rass
es&Le
gumes
Maize
Whe
at
Rice, P
addy
Alfal
fa for
For
age+
Silag
Maize f
or F
orag
e+Sila
ge
Potat
oes
Fora
ge P
rodu
cts ne
s
Vegeta
bles F
resh
nes
Grass
es ne
s,For
age+
Silag
Sugar
Bee
ts
Soybe
ans
Cassa
va
Oil Palm
Fru
it
Barley
Sweet P
otatoe
s
Tomato
es
2005 2004 2003
Figure 6.4 World Crops Production Source: FAOSTAT
The non-woody plants most commonly used for energy purposes are wheat, barley, rye, sugarcane, sugar beet, leguminous plants (e.g. alfalfa, Lucerne), grass (e.g. Miscanthus, switchgrass) and oil crops, e.g. rapeseed. Other species have been tested with respect to their agronomy, yield optimisation, harvesting, storage and processing, including high-yielding fibrous plants such as giant reed (Arundo donax) and a form of globe artichoke (Cynara). These plants can provide biomass suitable for direct combustion, thermo-chemical or biological conversion. Wheat, barley, rye, sugarcane and sugar beet are generally used for conversion to ethanol. Leguminous plants and grasses can be processed together with manure or waste to produce biogas for heat, electricity or fuel. Oil crops can be used to produce bio-diesel. There are also plants that can be processed to yield both liquid biofuels and cellulose, for example sweet Sorghum, which yields bio-ethanol and dry cellulose material for other bio-energy use. Some of the plants listed above are perennials, others are annuals. The cultivation of all can be accommodated within conventional practices; their cultivation does not preclude cultivation of food crops, and vice versa. Food and energy crops can be grown as a way of maximising the efficiency of a farm. The advantages of energy crops are that they do not require the best land and need significantly less care, water and fertilisers. It is their quantity rather than their quality that is important. According to recent estimates, it should be possible by 2010 to produce between 1.5EJ and 6.75EJ a year in the EU from new woody and non-woody energy crops (CEN, 2006).
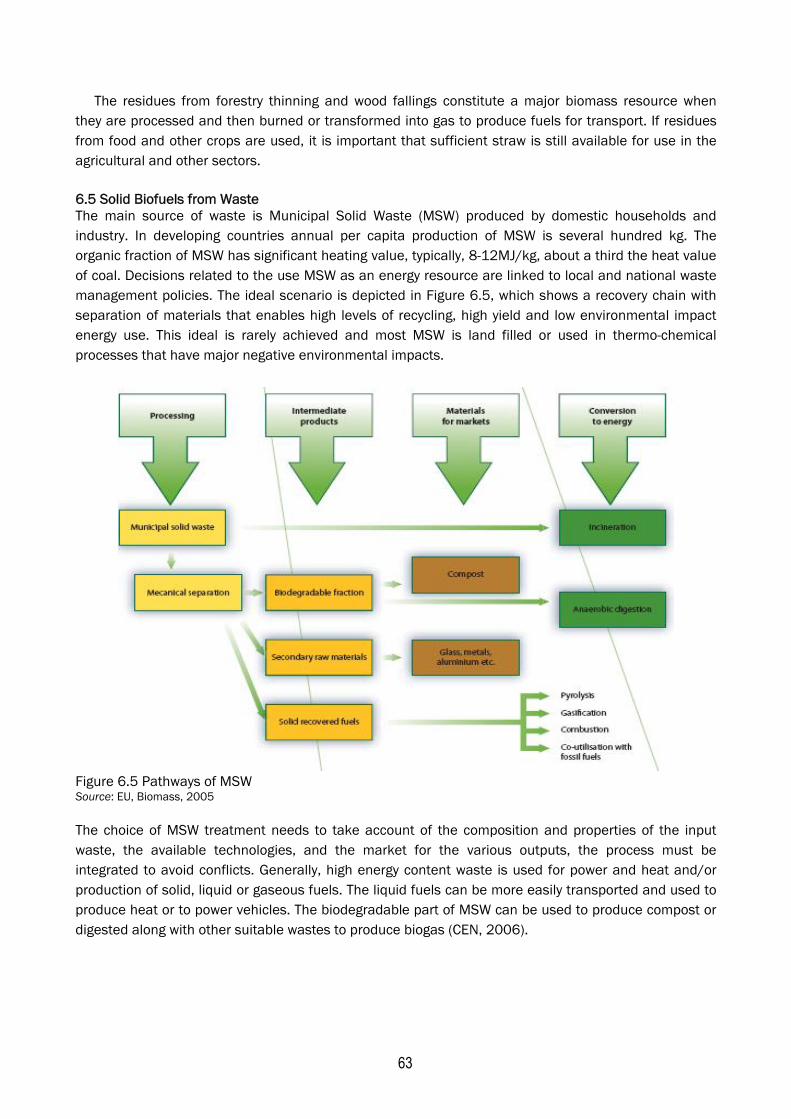
63
The residues from forestry thinning and wood fallings constitute a major biomass resource when they are processed and then burned or transformed into gas to produce fuels for transport. If residues from food and other crops are used, it is important that sufficient straw is still available for use in the agricultural and other sectors.
6.5 Solid Biofuels from Waste The main source of waste is Municipal Solid Waste (MSW) produced by domestic households and industry. In developing countries annual per capita production of MSW is several hundred kg. The organic fraction of MSW has significant heating value, typically, 8-12MJ/kg, about a third the heat value of coal. Decisions related to the use MSW as an energy resource are linked to local and national waste management policies. The ideal scenario is depicted in Figure 6.5, which shows a recovery chain with separation of materials that enables high levels of recycling, high yield and low environmental impact energy use. This ideal is rarely achieved and most MSW is land filled or used in thermo-chemical processes that have major negative environmental impacts.
Figure 6.5 Pathways of MSW Source: EU, Biomass, 2005
The choice of MSW treatment needs to take account of the composition and properties of the input waste, the available technologies, and the market for the various outputs, the process must be integrated to avoid conflicts. Generally, high energy content waste is used for power and heat and/or production of solid, liquid or gaseous fuels. The liquid fuels can be more easily transported and used to produce heat or to power vehicles. The biodegradable part of MSW can be used to produce compost or digested along with other suitable wastes to produce biogas (CEN, 2006).
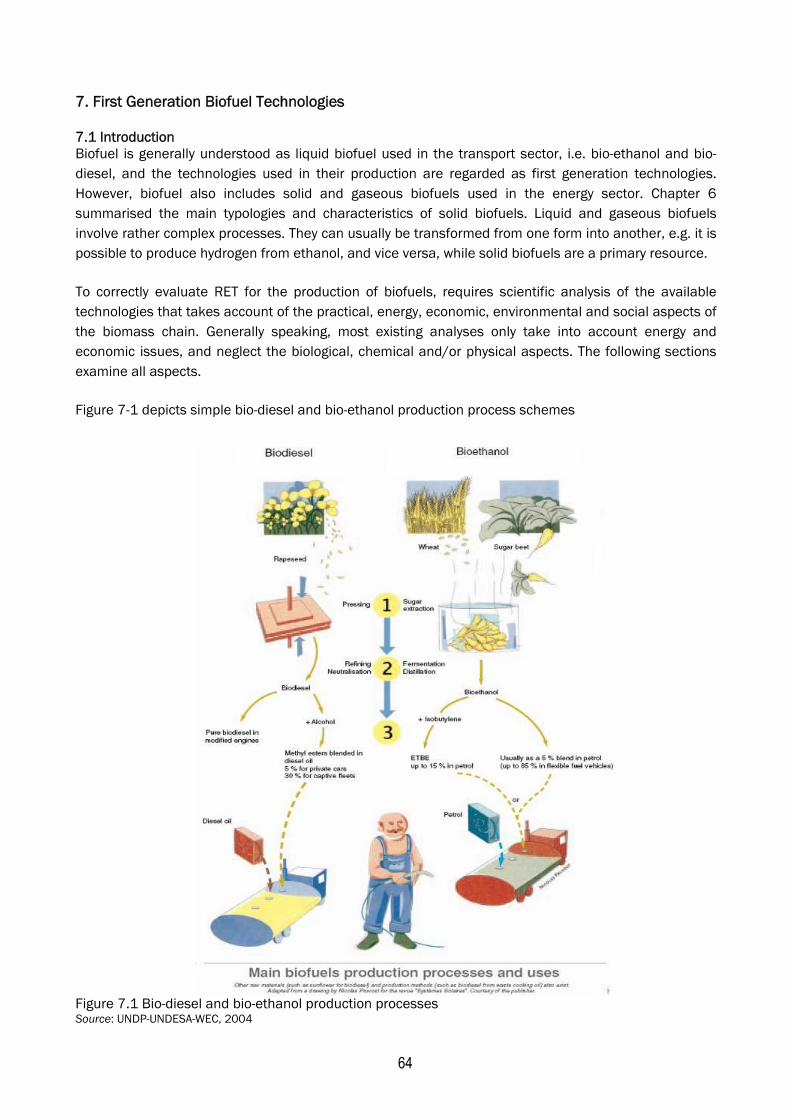
64
7. First Generation Biofuel Technologies 7.1 Introduction Biofuel is generally understood as liquid biofuel used in the transport sector, i.e. bio-ethanol and bio-diesel, and the technologies used in their production are regarded as first generation technologies. However, biofuel also includes solid and gaseous biofuels used in the energy sector. Chapter 6 summarised the main typologies and characteristics of solid biofuels. Liquid and gaseous biofuels involve rather complex processes. They can usually be transformed from one form into another, e.g. it is possible to produce hydrogen from ethanol, and vice versa, while solid biofuels are a primary resource.
To correctly evaluate RET for the production of biofuels, requires scientific analysis of the available technologies that takes account of the practical, energy, economic, environmental and social aspects of the biomass chain. Generally speaking, most existing analyses only take into account energy and economic issues, and neglect the biological, chemical and/or physical aspects. The following sections examine all aspects.
Figure 7-1 depicts simple bio-diesel and bio-ethanol production process schemes
Figure 7.1 Bio-diesel and bio-ethanol production processes Source: UNDP-UNDESA-WEC, 2004
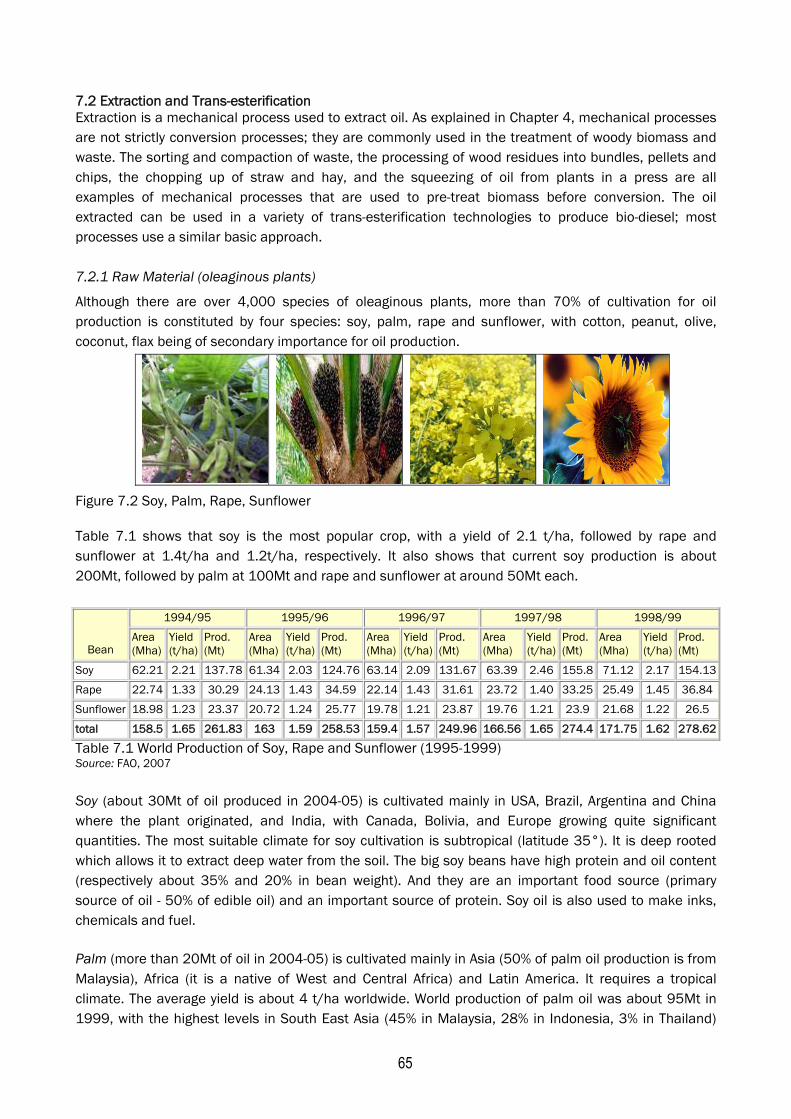
65
7.2 Extraction and Trans-esterification Extraction is a mechanical process used to extract oil. As explained in Chapter 4, mechanical processes are not strictly conversion processes; they are commonly used in the treatment of woody biomass and waste. The sorting and compaction of waste, the processing of wood residues into bundles, pellets and chips, the chopping up of straw and hay, and the squeezing of oil from plants in a press are all examples of mechanical processes that are used to pre-treat biomass before conversion. The oil extracted can be used in a variety of trans-esterification technologies to produce bio-diesel; most processes use a similar basic approach. 7.2.1 Raw Material (oleaginous plants)
Although there are over 4,000 species of oleaginous plants, more than 70% of cultivation for oil production is constituted by four species: soy, palm, rape and sunflower, with cotton, peanut, olive, coconut, flax being of secondary importance for oil production.
Figure 7.2 Soy, Palm, Rape, Sunflower
Table 7.1 shows that soy is the most popular crop, with a yield of 2.1 t/ha, followed by rape and sunflower at 1.4t/ha and 1.2t/ha, respectively. It also shows that current soy production is about 200Mt, followed by palm at 100Mt and rape and sunflower at around 50Mt each.
1994/95 1995/96 1996/97 1997/98 1998/99
Bean Area (Mha)
Yield (t/ha)
Prod. (Mt)
Area (Mha)
Yield (t/ha)
Prod. (Mt)
Area (Mha)
Yield (t/ha)
Prod. (Mt)
Area (Mha)
Yield (t/ha)
Prod. (Mt)
Area (Mha)
Yield (t/ha)
Prod. (Mt)
Soy 62.21 2.21 137.78 61.34 2.03 124.76 63.14 2.09 131.67 63.39 2.46 155.8 71.12 2.17 154.13
Rape 22.74 1.33 30.29 24.13 1.43 34.59 22.14 1.43 31.61 23.72 1.40 33.25 25.49 1.45 36.84
Sunflower 18.98 1.23 23.37 20.72 1.24 25.77 19.78 1.21 23.87 19.76 1.21 23.9 21.68 1.22 26.5
total 158.5 1.65 261.83 163 1.59 258.53 159.4 1.57 249.96 166.56 1.65 274.4 171.75 1.62 278.62
Table 7.1 World Production of Soy, Rape and Sunflower (1995-1999) Source: FAO, 2007
Soy (about 30Mt of oil produced in 2004-05) is cultivated mainly in USA, Brazil, Argentina and China where the plant originated, and India, with Canada, Bolivia, and Europe growing quite significant quantities. The most suitable climate for soy cultivation is subtropical (latitude 35°). It is deep rooted which allows it to extract deep water from the soil. The big soy beans have high protein and oil content (respectively about 35% and 20% in bean weight). And they are an important food source (primary source of oil - 50% of edible oil) and an important source of protein. Soy oil is also used to make inks, chemicals and fuel.
Palm (more than 20Mt of oil in 2004-05) is cultivated mainly in Asia (50% of palm oil production is from Malaysia), Africa (it is a native of West and Central Africa) and Latin America. It requires a tropical climate. The average yield is about 4 t/ha worldwide. World production of palm oil was about 95Mt in 1999, with the highest levels in South East Asia (45% in Malaysia, 28% in Indonesia, 3% in Thailand)
66
and Africa (8% in Nigeria, 1% in both Cameroon and Côte d'Ivoire). This plant is a very high oil producer, one tree can yield up to 20 tons of fruit per year (average 4t/ha of fruit) with 20% oil content. The fruits consist of a hard kernel (seed) inside a shell (endocarp), which is surrounded by a fleshy Mesocarp. The Mesocarp contains about 49% palm oil and the kernel about 50% palm kernel oil.
Rape is cultivated mainly in China, Canada, India (where it likely originated), and the EU. Humid and slightly overcast conditions are needed for its cultivation i.e. moderate climates. The oil and protein contents per bean weight are about 45% and 22% respectively.
Sunflower is cultivated mainly in Russia, Ukraine, Argentina, China, India, USA (where it originated) and the EU. It requires a temperate climate. Oil and protein content are, respectively, 40% and 25% of bean weight.
7.2.2 Products (pil-bio-diesel-animal feed-glycerine)
These oils have very different characteristics (compositions in triacylglycerol species41 varies) which results in different uses in terms of food, chemicals and fuel, and different food and chemical products. The oils have high viscosity, which makes them problematic for using in injectors in diesel engines. They result in ‘dirty’ combustion due to the increased ignition pressure, which produces reduced spraying and ignition delays (lower cetane number),42 and lower performance. The crude types of oil have lower heat value than diesel (LHV15% in weight and 10% in volume).
Diesel engines operating with oils have high particulate emissions, reduced efficiency and higher maintenance requirements. Thus, these oils are unsuitable for modern diesel engines (diesel increases performance with CN from 40 to a maximum of 55; e.g. Europe, set at a minimum of 49 in 1994 and 51 in 2000), but can be used in lower technology diesel engines.
Bio-diesel consists of methyl (or ethyl) esters of fatty acids (FAME or FAEE), with a density of 0.874kg/l. Its LHV is around 9,600kcal/kg, lower than oil (10,300kcal/kg), but due to its higher cetane number (55) this difference is not important. Bio-diesel has several advantages over diesel: it has a higher cetane number, is biodegradable (up to 98%), has a higher flash point (150°C rather than 64°C) and higher lubricant power. Its disadvantages are its lower LHV, lower freezing point and higher solvent power. The higher cetane number compensates for the lower LHV; tank heating will avert the risk of freezing; and new types of rubber do not dissolve.
Bio-diesel releases fewer solid particles; it contains no sulphur, so does not produce sulphur dioxide, which contributes to acid rain. NOx emissions, however are higher than from diesel due to the presence of nitrogen in the biomass raw material. The EU has the most developed market for bio-diesel based on the number of diesel engines in this area. Growth rates in the EU have been 34% a year since the mid 1990s. Bio-diesel has the largest share in the EU’s liquid biofuels market, accounting for 79.5% of EU total liquid biofuels production in 2004. Eight EU member states have bio-diesel production facilities, which, like bio-ethanol facilities, are large. Practically all diesel engines are able to run on bio-diesel or
41 Soy oil: LLL (19%), OLL (15%), LLLn (10%), LOP (9%), OLO (6%), and OLLn (6%); palm oil: LOP (24%), OOP (17%), LLP (8%), OLO (5%), and OOO (4%); rape oil: OLO (23%), OOO (17%), OLnO (11%), OLL (8%), OLLn (6%), OLnLn (4%) and LLLn (3%); sunflower oil: LLL (33%), OLL (25%), LOP (11%), and OLO (6%); Holcapek M et al., J Chromatogr, 2003. 42 The cetane (C16H34) has a value of 100, and the isocetane 0. Thus a cetane number of 40 will result in the same ignition delay as a 40% cetane and 60% isocetane mixture
67
blends of bio-diesel and normal diesel oil. Using recently-developed additives it is also possible to blend diesel with ethanol for use in trucks.
The process also yields crushed bean ‘cake’ for animal feed, and glycerine. Glycerine is a chemical that is used in the manufacture of cosmetics, medicines and foods; its co-production can improve the economics of bio-diesel production. However, its market is limited and in high-volume production scenarios, it could end up being used as an additional process fuel in bio-diesel, a relatively low-value application. Compared to some of the technologies under development to produce ethanol and other biofuels, the bio-diesel production process involves well-established technologies.
7.2.3 Production Process
The bio-diesel production process involves the following steps. First the oil is extracted from the harvested plants (by squeezing, heat treating or solvent treatment); then it is filtered and pre-processed to remove water and contaminants. The pre-treated oils and fats are mixed with an alcohol (usually methanol) and a catalyst (usually sodium or potassium hydroxide). The oil molecules (triglycerides) are broken apart and reformed into esters and glycerol, which are then separated and purified. The resulting esters are bio-diesel.
Growing, Harvesting and Extraction: the mass yield can vary from 1 to 4mt/ha and about half that level for sucrose and starch plants, and the oil content can vary from 20% to 50%. Thus, even if nitrogen fertiliser inputs for crop production are in the region of 200kg(N)/ha, comparable with those for cereal farming, nitrogen inputs per unit mass and per unit of energy are higher than grain inputs. In animal or vegetal cells the fat substances are in a protein matrix, thus extraction is aimed at separating the substances with the maximum yield and purity at the lowest energy and economic cost. The main extraction processes are mechanical (mainly pressing) and chemical (solvent, mainly hexane, maximum value 1/18 of bean weight).
Mechanical systems (less energy required, but lower yield) produce oil and protein cake; chemical systems yield oil and flour. Generally, a combination of these systems is used in order to achieve the highest oil yields with the best economic use of energy, e.g., mechanical systems are used for material with an oil content over 20%; this process results in material with 10% oil content to which the chemical process is applied.. The total extraction process takes 30 minutes to produce 2% of residue, or 1-2 hours for below 1% residue. Heating (up to 50°C) increases the speed of oil extraction. The coarser impurities are eliminated with a decanter/pulse-screen/revolving perforated drum and the finer particles by pressurised filter. Finally, phospholipids and other lipids are removed.
Refinement: involves: • removal of excess fatty acids • removal of free fatty acids (mainly in food production processes) • whitening (treatment with 0.5-4% of metal and other substances) • deodorising (steam at 200°C, in a vacuum) • wintering (removal of excess triglyceride, mainly for viscous oils)
Trans-esterification: Trans-esterification, (see Figure 7.3, is the process of exchanging the alkoxy group of an ester compound (in this case oil or fat) with another alcohol (usually methanol or ethanol). Normally, this reaction occurs very slowly or not at all; the addition of heat and an acid or base speeds
68
up the reaction. Neither the acid nor the base is consumed by the trans-esterification reaction. That is, they are not reactants but catalysts. Almost all bio-diesel is produced using the base-catalysed technique as it is the most economic process requiring only low temperatures and pressures and producing over 98% conversion yield (provided the starting oil is moisture and fatty acid free).
Figure 7.3 Trans-esterification
The trans-esterification processes can be a batch or an in-line process. An in-line processes guarantees better use of the thermal energy, control, higher product purity and better by-products recovery. It is lower cost, but can only be done on a large scale. As in other processes, water processing can add to the cost, so the ideal technologies are in-line with and no excess water processing. Trans-esterification plants comprise five stages: trans-esterification reactor, bio-diesel separator, bio-diesel washing, recovery of methanol and water, methanol distillation.
7.2.4 Material, Energy and Cost Data
It is necessary to consider the production, energy and economic balance of the growing, harvesting and extraction phases. Table 7.2 shows the world average values of bean/fruit, oil and by-products production yield, their energy content, and costs.43
Plant Product Production yield [t/Ha]
Energy content [GJ/t]
Energy yield [GJ/Ha]
Cost [$/GJ]
Soy Crop (bean) 2.20 10 22 8 Soy Oil 0.44 16.66 10 15 Soy Animal feed 0.77 Soy Exc. residues 0.05 15 0.75 15
Palm Crop (fruit) 4.00 10 40 N/A Palm Oil 0.80 N/A N/A N/A Palm Animal feed N/A Palm Exc. residues 0.08 N/A N/A N/A
Rape Crop (bean) 1.40 15 21 6 Rape Oil 0.63 28.43 15 9 Rape Animal feed 0.31 Rape Exc. residues 0.06 25 1.5 9 43 Obviously by-products energy data are not considered for no energy use
69
Sunflower Crop (bean) 1.20 12 14.4 7 Sunflower Oil 0.48 23.32 10 10 Sunflower Animal feed 0.30 Sunflower Exc. residues 0.05 20 1 10
Table 7.2 Main material, energy and economic data of main oleaginous plants Source: FAO database, 2007. Here, we are taking account of only the bean or fruit whereas any crop produces much larger amounts of other materials such as leaves, branches, roots, etc. (see Chapter 6). This material remains on the plant, in the ground or is used for other purposes. This must be taken into consideration when evaluating the global energy and material balance and the economic, social and environmental impacts. Comparing the material and energy values of the bean/fruit with the oil values will give an unbalanced picture
Table 7.3 presents a simplified materials and energy balance for a ‘good performance’ bio-diesel plant based on rapeseed.
Material Energy
(t/ha) (MJ/t) (MJ/ha)
Input Growing and harvesting
Oil extraction Oil refinement
Trans-esterification Methanol
Total
3.00 3.00 1.20 1.08 0.13
7,615 1,245 1,660
388 20,000
22,844
3,735 1,992
419 2,662
31,612
Output Bio-diesel
Protein cake Other process by-products
Crops residues Glycerine
Total
1.04 1.60 0.06 4.80 0.09
36,500 15,000 38,181 12,500 17,500
37,930 24,000
2,291 60,000
1,540 125,761
Table 7.3 Main global material and energy data of a ‘good’ rape bio-diesel plant Source: Spazzafumo., 2004
The table shows that the main material inputs occur in the growing-harvesting and oil extraction
steps, and the main outputs are the crop residues. The main energy input is in the growing-harvesting step; the main outputs are crop residues, bio-diesel and a sort of protein cake. If the crop residues and the protein cake are excluded, the energy balance becomes negative.
7.2.5 Economics
Bio-diesel requires substantial subsidies to compete with diesel. The energy balances for bio-diesel systems are less favourable than for perennial crops (Ishitani and Johansson, 1996). The balance improves if by-products, such as straw, are used as an energy source.
70
The installation of a bio-diesel production plant is feasible only if the infrastructure, i.e. motorways, trains, waterways, is in place in the plant location. Without these conditions, a bio-diesel production plant of non-used vegetable oil and pure methane can be costly. A ready to operate plant costing €10M will have a productive capacity of 100,000 t/a.
The economic balance is not influenced by the cost of the plant, but rather by the cost of the raw materials and the selling prices of glycerine and biodiesel, which cannot be precisely forecasted (Matthys 2003).
• the cost of the vegetable oil is very variable and depends on the working cost and treatment of the land – possibly €250-490/t;
• the cost of methane is €115-230/t • the selling price of bio-diesel will depend on the selling price of diesel and the producing
country’s national geo-political factors – probably €90-180/t; • world glycerine consumption is stable, its selling price is in the region of €245/t.
7.3 Fermentation and Distillation Fermentation is one of the oldest biological processes used by man. It normally uses yeast (an organism that secretes catalytic enzymes) to initiate chemical reactions that produce the desired outputs – ethanol and carbon dioxide. Ethanol is used in alcoholic drinks, as a solvent, an additive and a fuel. The main bio-ethanol producers are Brazil (using sugarcane as feedstock) and the US (using corn feedstock). Some fuel alcohol is produced in Europe using wheat, molasses and petrochemical feedstocks. 7.3.1 Raw Material (sucrose and starch plants) Sucrose: the main sucrose crops are sugarcane and sugar beet. Sugarcane grows in tropical climates, sugar beet in temperate climates (see Figure 7.4). Other sucrose material comes from food industry by-products and surpluses (wine and molasses). Agricultural production of feedstock for ethanol production is usually seasonal. While grain can be stored, tubers and beet crops rot rapidly after harvesting and must be converted to a stable form, such as syrup, or used in a plant capable of taking a range of feedstocks depending on what is in season.
Figure 7.4 World sugarcane and sugar beet locations Source: Sugar Knowledge International Limited (SKIL), 2007
Sugarcane is a native of China. It has the highest yield and total production in the world (see Figure 6.4 for main producers) about double of the three main grains: corn, wheat and rice.
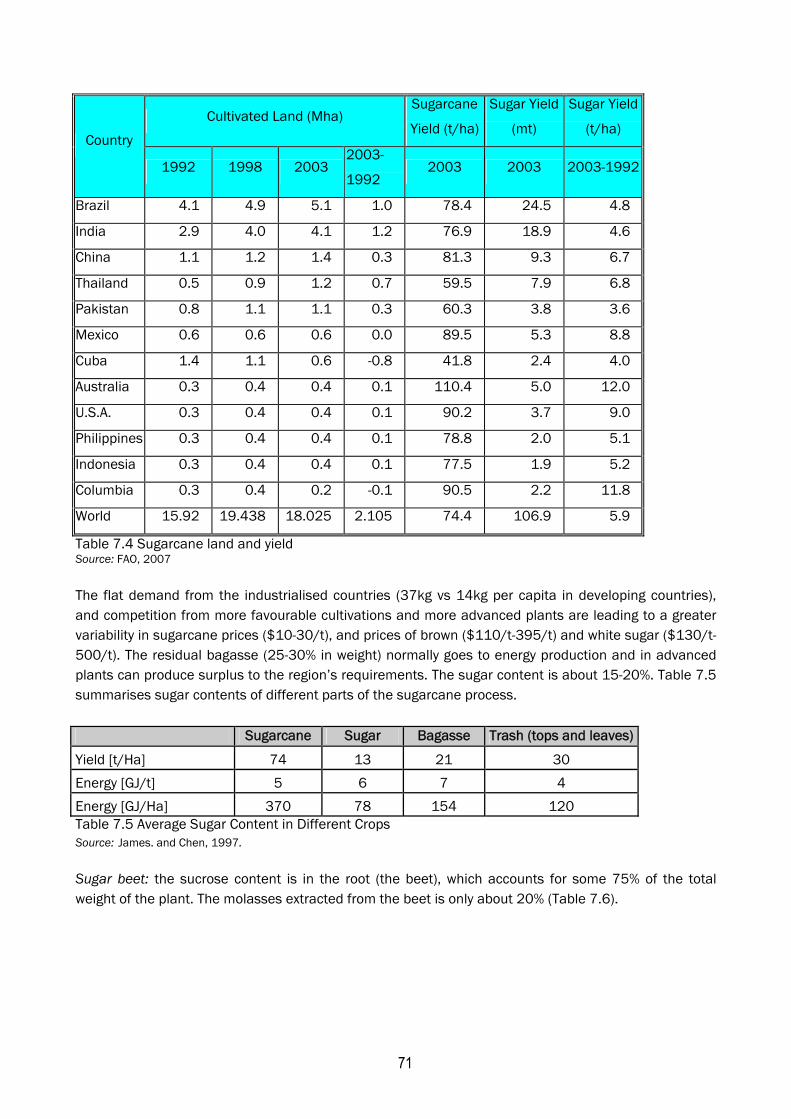
71
Cultivated Land (Mha) Sugarcane
Yield (t/ha)
Sugar Yield
(mt)
Sugar Yield
(t/ha) Country
1992 1998 2003 2003-
1992 2003 2003 2003-1992
Brazil 4.1 4.9 5.1 1.0 78.4 24.5 4.8
India 2.9 4.0 4.1 1.2 76.9 18.9 4.6
China 1.1 1.2 1.4 0.3 81.3 9.3 6.7
Thailand 0.5 0.9 1.2 0.7 59.5 7.9 6.8
Pakistan 0.8 1.1 1.1 0.3 60.3 3.8 3.6
Mexico 0.6 0.6 0.6 0.0 89.5 5.3 8.8
Cuba 1.4 1.1 0.6 -0.8 41.8 2.4 4.0
Australia 0.3 0.4 0.4 0.1 110.4 5.0 12.0
U.S.A. 0.3 0.4 0.4 0.1 90.2 3.7 9.0
Philippines 0.3 0.4 0.4 0.1 78.8 2.0 5.1
Indonesia 0.3 0.4 0.4 0.1 77.5 1.9 5.2
Columbia 0.3 0.4 0.2 -0.1 90.5 2.2 11.8
World 15.92 19.438 18.025 2.105 74.4 106.9 5.9
Table 7.4 Sugarcane land and yield Source: FAO, 2007
The flat demand from the industrialised countries (37kg vs 14kg per capita in developing countries), and competition from more favourable cultivations and more advanced plants are leading to a greater variability in sugarcane prices ($10-30/t), and prices of brown ($110/t-395/t) and white sugar ($130/t-500/t). The residual bagasse (25-30% in weight) normally goes to energy production and in advanced plants can produce surplus to the region’s requirements. The sugar content is about 15-20%. Table 7.5 summarises sugar contents of different parts of the sugarcane process.
Sugarcane Sugar Bagasse Trash (tops and leaves)
Yield [t/Ha] 74 13 21 30
Energy [GJ/t] 5 6 7 4
Energy [GJ/Ha] 370 78 154 120 Table 7.5 Average Sugar Content in Different Crops Source: James. and Chen, 1997.
Sugar beet: the sucrose content is in the root (the beet), which accounts for some 75% of the total weight of the plant. The molasses extracted from the beet is only about 20% (Table 7.6).
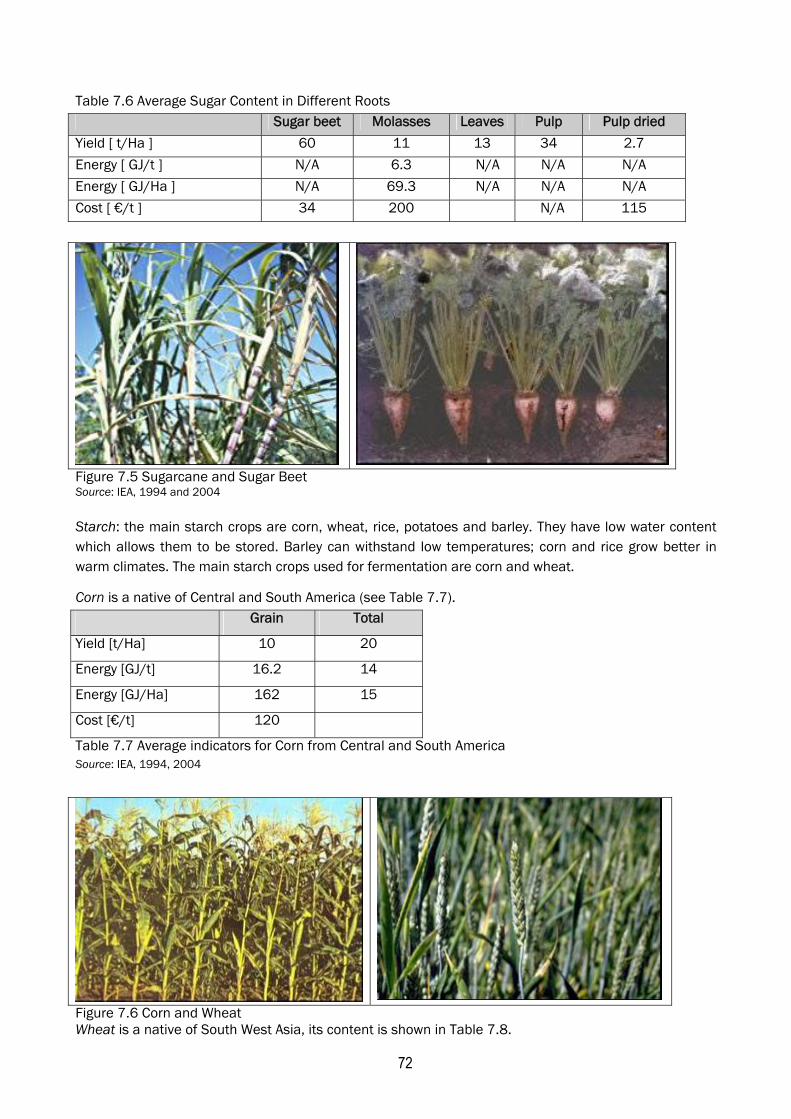
72
Table 7.6 Average Sugar Content in Different Roots Sugar beet Molasses Leaves Pulp Pulp dried
Yield [ t/Ha ] 60 11 13 34 2.7
Energy [ GJ/t ] N/A 6.3 N/A N/A N/A
Energy [ GJ/Ha ] N/A 69.3 N/A N/A N/A
Cost [ €/t ] 34 200 N/A 115
Figure 7.5 Sugarcane and Sugar Beet Source: IEA, 1994 and 2004 Starch: the main starch crops are corn, wheat, rice, potatoes and barley. They have low water content which allows them to be stored. Barley can withstand low temperatures; corn and rice grow better in warm climates. The main starch crops used for fermentation are corn and wheat.
Corn is a native of Central and South America (see Table 7.7). Grain Total
Yield [t/Ha] 10 20
Energy [GJ/t] 16.2 14
Energy [GJ/Ha] 162 15
Cost [€/t] 120
Table 7.7 Average indicators for Corn from Central and South America Source: IEA, 1994, 2004
Figure 7.6 Corn and Wheat Wheat is a native of South West Asia, its content is shown in Table 7.8.
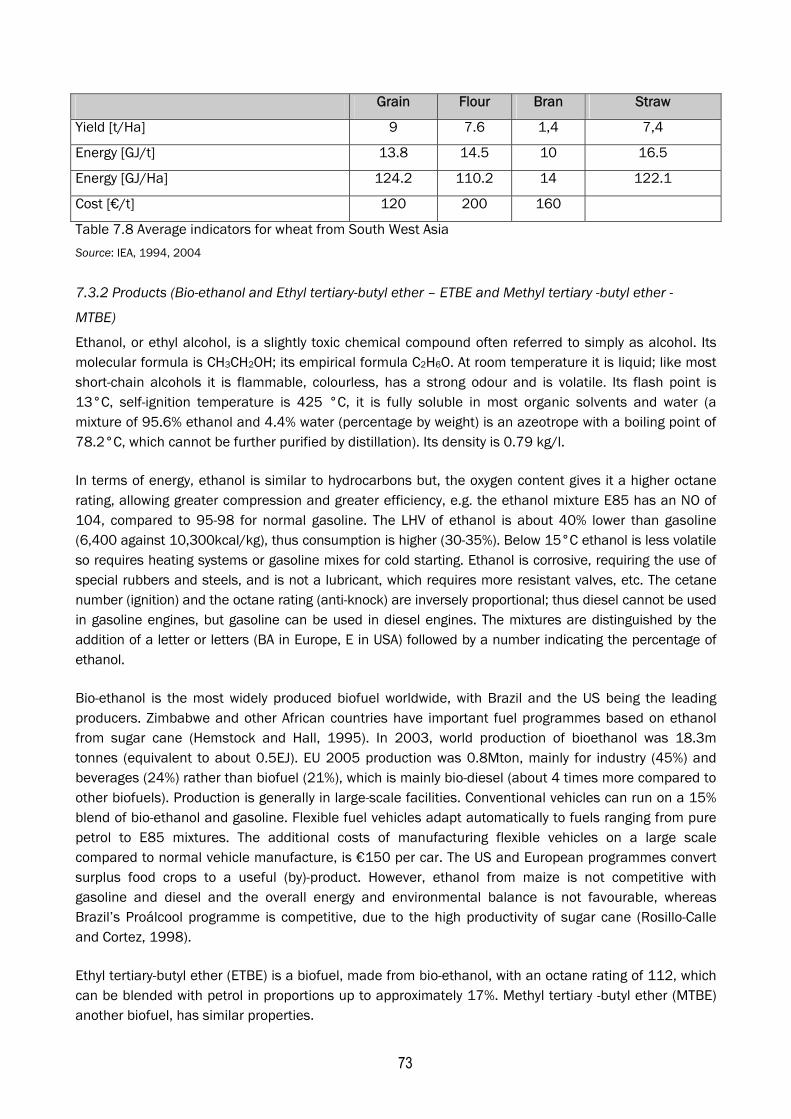
73
Table 7.8 Average indicators for wheat from South West Asia
Source: IEA, 1994, 2004
7.3.2 Products (Bio-ethanol and Ethyl tertiary-butyl ether – ETBE and Methyl tertiary -butyl ether -
MTBE)
Ethanol, or ethyl alcohol, is a slightly toxic chemical compound often referred to simply as alcohol. Its molecular formula is CH3CH2OH; its empirical formula C2H6O. At room temperature it is liquid; like most short-chain alcohols it is flammable, colourless, has a strong odour and is volatile. Its flash point is 13°C, self-ignition temperature is 425 °C, it is fully soluble in most organic solvents and water (a mixture of 95.6% ethanol and 4.4% water (percentage by weight) is an azeotrope with a boiling point of 78.2°C, which cannot be further purified by distillation). Its density is 0.79 kg/l.
In terms of energy, ethanol is similar to hydrocarbons but, the oxygen content gives it a higher octane rating, allowing greater compression and greater efficiency, e.g. the ethanol mixture E85 has an NO of 104, compared to 95-98 for normal gasoline. The LHV of ethanol is about 40% lower than gasoline (6,400 against 10,300kcal/kg), thus consumption is higher (30-35%). Below 15°C ethanol is less volatile so requires heating systems or gasoline mixes for cold starting. Ethanol is corrosive, requiring the use of special rubbers and steels, and is not a lubricant, which requires more resistant valves, etc. The cetane number (ignition) and the octane rating (anti-knock) are inversely proportional; thus diesel cannot be used in gasoline engines, but gasoline can be used in diesel engines. The mixtures are distinguished by the addition of a letter or letters (BA in Europe, E in USA) followed by a number indicating the percentage of ethanol.
Bio-ethanol is the most widely produced biofuel worldwide, with Brazil and the US being the leading producers. Zimbabwe and other African countries have important fuel programmes based on ethanol from sugar cane (Hemstock and Hall, 1995). In 2003, world production of bioethanol was 18.3m tonnes (equivalent to about 0.5EJ). EU 2005 production was 0.8Mton, mainly for industry (45%) and beverages (24%) rather than biofuel (21%), which is mainly bio-diesel (about 4 times more compared to other biofuels). Production is generally in large-scale facilities. Conventional vehicles can run on a 15% blend of bio-ethanol and gasoline. Flexible fuel vehicles adapt automatically to fuels ranging from pure petrol to E85 mixtures. The additional costs of manufacturing flexible vehicles on a large scale compared to normal vehicle manufacture, is €150 per car. The US and European programmes convert surplus food crops to a useful (by)-product. However, ethanol from maize is not competitive with gasoline and diesel and the overall energy and environmental balance is not favourable, whereas Brazil’s Proálcool programme is competitive, due to the high productivity of sugar cane (Rosillo-Calle and Cortez, 1998).
Ethyl tertiary-butyl ether (ETBE) is a biofuel, made from bio-ethanol, with an octane rating of 112, which can be blended with petrol in proportions up to approximately 17%. Methyl tertiary -butyl ether (MTBE) another biofuel, has similar properties.
Grain Flour Bran Straw
Yield [t/Ha] 9 7.6 1,4 7,4
Energy [GJ/t] 13.8 14.5 10 16.5
Energy [GJ/Ha] 124.2 110.2 14 122.1
Cost [€/t] 120 200 160
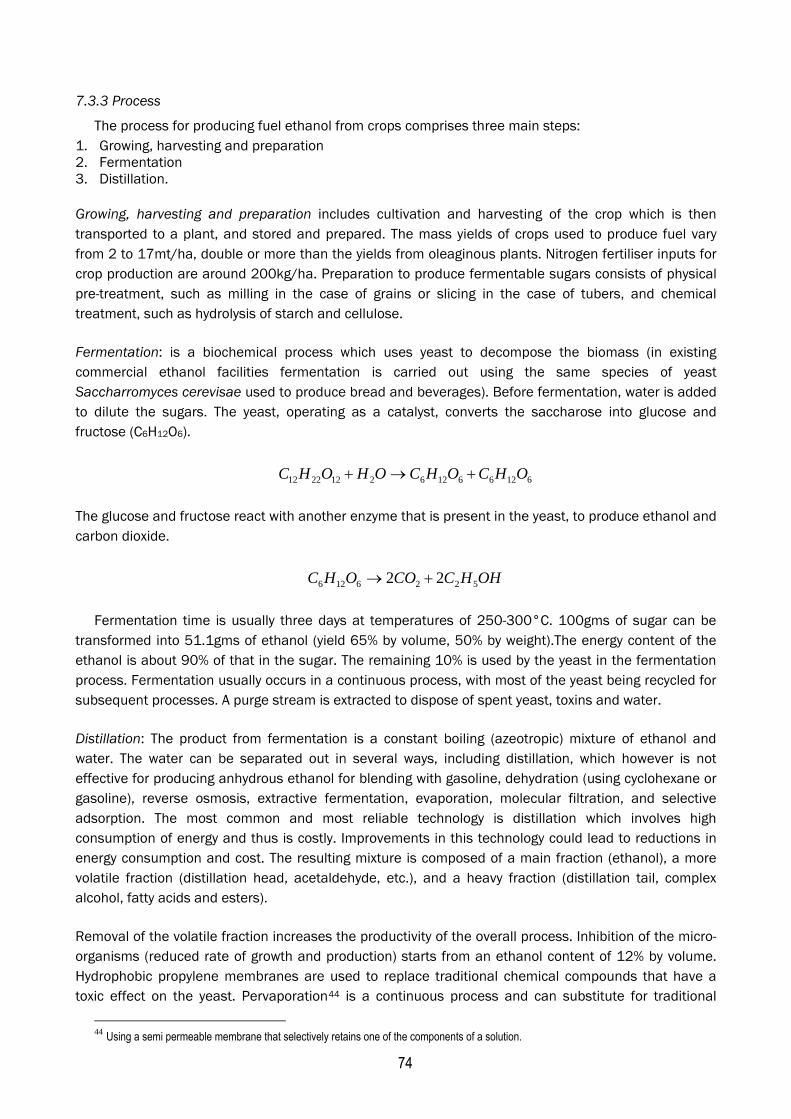
74
7.3.3 Process
The process for producing fuel ethanol from crops comprises three main steps: 1. Growing, harvesting and preparation 2. Fermentation 3. Distillation.
Growing, harvesting and preparation includes cultivation and harvesting of the crop which is then transported to a plant, and stored and prepared. The mass yields of crops used to produce fuel vary from 2 to 17mt/ha, double or more than the yields from oleaginous plants. Nitrogen fertiliser inputs for crop production are around 200kg/ha. Preparation to produce fermentable sugars consists of physical pre-treatment, such as milling in the case of grains or slicing in the case of tubers, and chemical treatment, such as hydrolysis of starch and cellulose.
Fermentation: is a biochemical process which uses yeast to decompose the biomass (in existing commercial ethanol facilities fermentation is carried out using the same species of yeast Saccharromyces cerevisae used to produce bread and beverages). Before fermentation, water is added to dilute the sugars. The yeast, operating as a catalyst, converts the saccharose into glucose and fructose (C6H12O6).
612661262122212 OHCOHCOHOHC +→+
The glucose and fructose react with another enzyme that is present in the yeast, to produce ethanol and carbon dioxide.
OHHCCOOHC 5226126 22 +→
Fermentation time is usually three days at temperatures of 250-300°C. 100gms of sugar can be transformed into 51.1gms of ethanol (yield 65% by volume, 50% by weight).The energy content of the ethanol is about 90% of that in the sugar. The remaining 10% is used by the yeast in the fermentation process. Fermentation usually occurs in a continuous process, with most of the yeast being recycled for subsequent processes. A purge stream is extracted to dispose of spent yeast, toxins and water.
Distillation: The product from fermentation is a constant boiling (azeotropic) mixture of ethanol and water. The water can be separated out in several ways, including distillation, which however is not effective for producing anhydrous ethanol for blending with gasoline, dehydration (using cyclohexane or gasoline), reverse osmosis, extractive fermentation, evaporation, molecular filtration, and selective adsorption. The most common and most reliable technology is distillation which involves high consumption of energy and thus is costly. Improvements in this technology could lead to reductions in energy consumption and cost. The resulting mixture is composed of a main fraction (ethanol), a more volatile fraction (distillation head, acetaldehyde, etc.), and a heavy fraction (distillation tail, complex alcohol, fatty acids and esters).
Removal of the volatile fraction increases the productivity of the overall process. Inhibition of the micro-organisms (reduced rate of growth and production) starts from an ethanol content of 12% by volume. Hydrophobic propylene membranes are used to replace traditional chemical compounds that have a toxic effect on the yeast. Pervaporation44 is a continuous process and can substitute for traditional
44 Using a semi permeable membrane that selectively retains one of the components of a solution.
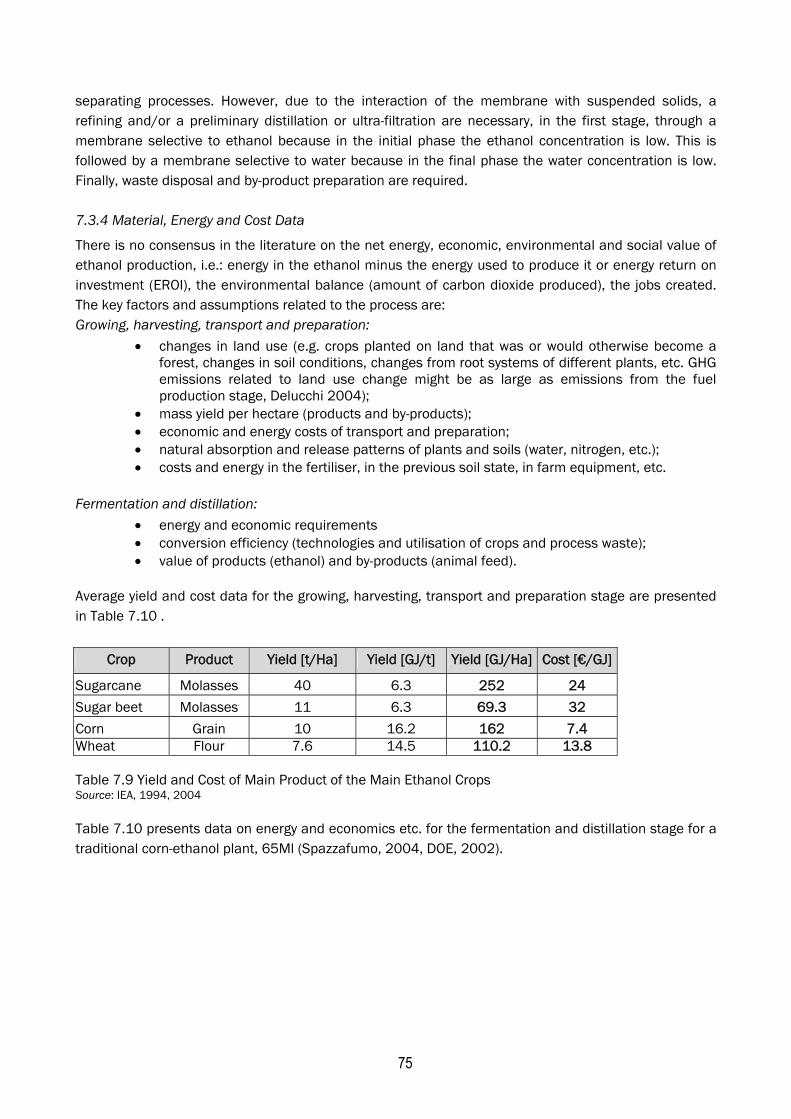
75
separating processes. However, due to the interaction of the membrane with suspended solids, a refining and/or a preliminary distillation or ultra-filtration are necessary, in the first stage, through a membrane selective to ethanol because in the initial phase the ethanol concentration is low. This is followed by a membrane selective to water because in the final phase the water concentration is low. Finally, waste disposal and by-product preparation are required. 7.3.4 Material, Energy and Cost Data
There is no consensus in the literature on the net energy, economic, environmental and social value of ethanol production, i.e.: energy in the ethanol minus the energy used to produce it or energy return on investment (EROI), the environmental balance (amount of carbon dioxide produced), the jobs created. The key factors and assumptions related to the process are: Growing, harvesting, transport and preparation:
• changes in land use (e.g. crops planted on land that was or would otherwise become a forest, changes in soil conditions, changes from root systems of different plants, etc. GHG emissions related to land use change might be as large as emissions from the fuel production stage, Delucchi 2004);
• mass yield per hectare (products and by-products); • economic and energy costs of transport and preparation; • natural absorption and release patterns of plants and soils (water, nitrogen, etc.); • costs and energy in the fertiliser, in the previous soil state, in farm equipment, etc.
Fermentation and distillation:
• energy and economic requirements • conversion efficiency (technologies and utilisation of crops and process waste); • value of products (ethanol) and by-products (animal feed).
Average yield and cost data for the growing, harvesting, transport and preparation stage are presented in Table 7.10 .
Crop Product Yield [t/Ha] Yield [GJ/t] Yield [GJ/Ha] Cost [€/GJ]
Sugarcane Molasses 40 6.3 252 24
Sugar beet Molasses 11 6.3 69.3 32
Corn Grain 10 16.2 162 7.4 Wheat Flour 7.6 14.5 110.2 13.8 Table 7.9 Yield and Cost of Main Product of the Main Ethanol Crops Source: IEA, 1994, 2004
Table 7.10 presents data on energy and economics etc. for the fermentation and distillation stage for a traditional corn-ethanol plant, 65Ml (Spazzafumo, 2004, DOE, 2002).
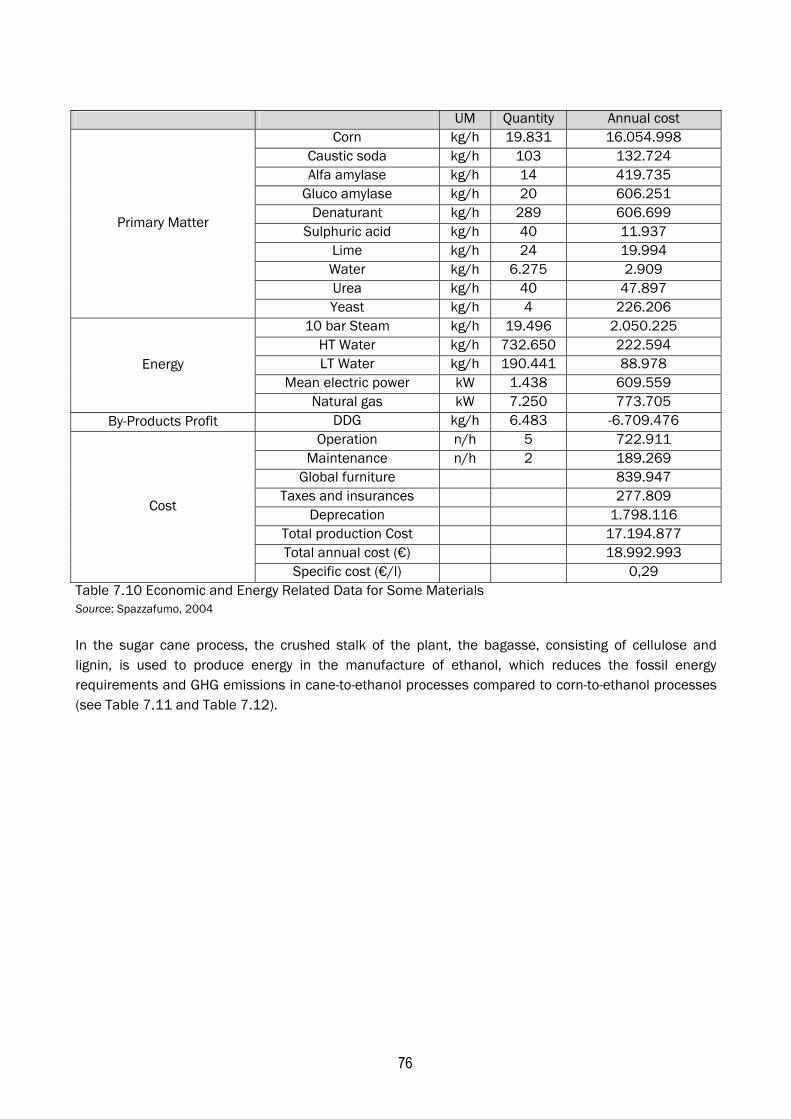
76
UM Quantity Annual cost
Corn kg/h 19.831 16.054.998 Caustic soda kg/h 103 132.724 Alfa amylase kg/h 14 419.735
Gluco amylase kg/h 20 606.251 Denaturant kg/h 289 606.699
Sulphuric acid kg/h 40 11.937 Lime kg/h 24 19.994 Water kg/h 6.275 2.909 Urea kg/h 40 47.897
Primary Matter
Yeast kg/h 4 226.206 10 bar Steam kg/h 19.496 2.050.225
HT Water kg/h 732.650 222.594 LT Water kg/h 190.441 88.978
Mean electric power kW 1.438 609.559 Energy
Natural gas kW 7.250 773.705 By-Products Profit DDG kg/h 6.483 -6.709.476
Operation n/h 5 722.911 Maintenance n/h 2 189.269
Global furniture 839.947 Taxes and insurances 277.809
Deprecation 1.798.116 Total production Cost 17.194.877 Total annual cost (€) 18.992.993
Cost
Specific cost (€/l) 0,29 Table 7.10 Economic and Energy Related Data for Some Materials Source: Spazzafumo, 2004
In the sugar cane process, the crushed stalk of the plant, the bagasse, consisting of cellulose and lignin, is used to produce energy in the manufacture of ethanol, which reduces the fossil energy requirements and GHG emissions in cane-to-ethanol processes compared to corn-to-ethanol processes (see Table 7.11 and Table 7.12).
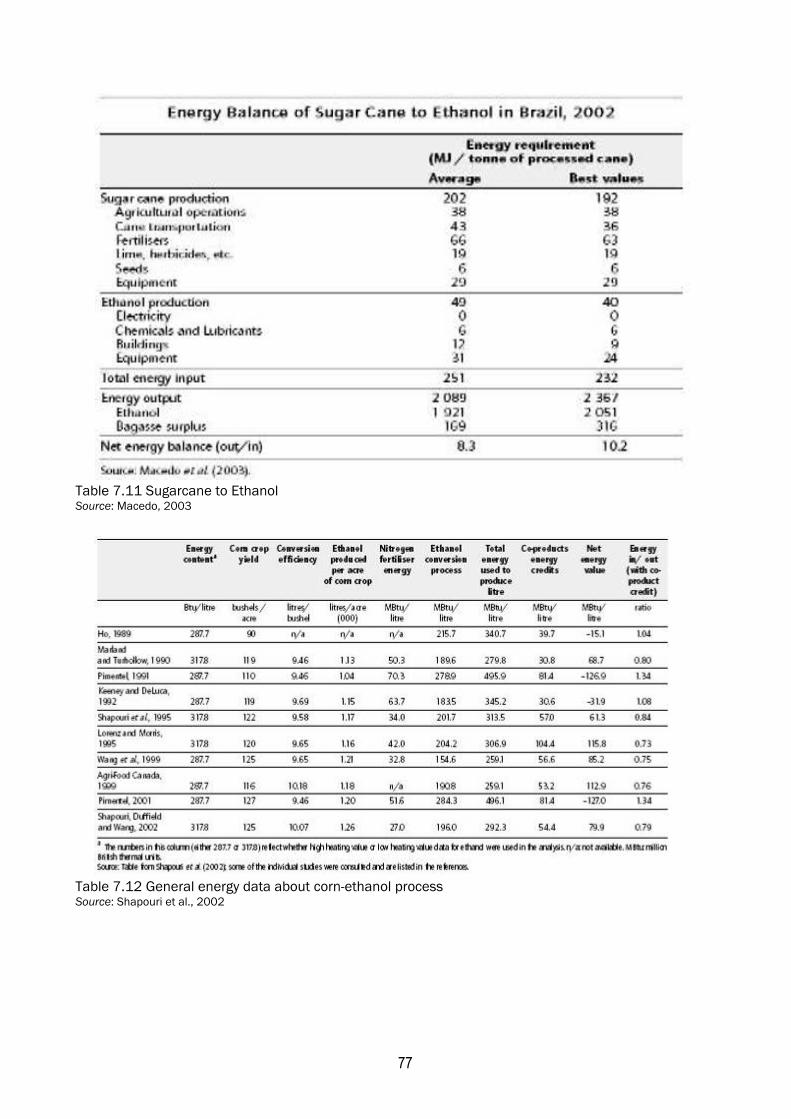
77
Table 7.11 Sugarcane to Ethanol Source: Macedo, 2003
Table 7.12 General energy data about corn-ethanol process Source: Shapouri et al., 2002
78
In sum, in a worst case scenario, ethanol production has a slightly negative total (well-to-wheel) impact. This negative effect may be larger in the case of bio-diesel, because more land is required to generate a unit of diesel than a unit of ethanol. 7.4 Anaerobic digestion In anaerobic digestion, which takes place in the absence of oxygen, a mixed population of bacteria catalyses the breakdown of the polymers in the biomass to produce biogas (5300-5800kcal/Nm3, 23MJ/Nm3, mean density 1kg/Nm3). This primarily consists of methane (50-80%) and carbon dioxide (20-40%), but may also contain ammonia, hydrogen sulphide and mercaptans, which are corrosive, poisonous and odorous.
The process takes place in several stages. First, polymers, such as cellulose, starch, proteins and lipids, are hydrolysed into sugars, amino acids, fatty acids, etc. These are converted into a mixture of hydrogen gas, low molecular weight acids (primarily acetic acid) and carbon dioxide, in a process known as acetogenesis. These products react together to generate methane and carbon dioxide, in a process known as methanogenesis. The methane, which is less soluble in water, occurs only in the gaseous phase, while carbon dioxide occurs in the gaseous and liquid phases. The final products are biogas, and liquid and solid residues.
The methanogenic digestate is an excellent liquid fertiliser, but if the digested materials include even low levels of toxic heavy metals or synthetic organic materials, then the risks to the environment from this waste are high.
The acidogenic digestate is a stable solid organic material comprised largely of lignin and chitin, and a variety of mineral components. It can be used as compost or to make low grade building materials such as fibreboard. There are millions of small anaerobic digesters in rural areas and a lot of large digesters that cope with landfill and other waste. The two main types of digesters are the Chinese ‘fixed dome’ digester and the Indian ‘floating cover’ digester, which differ primarily in the way the gas is collected and routed out of the digester (ITDG, 2000). Anaerobic digestion is the best-known and best-developed technology for biochemical conversion of biomass into biogas.
The feedstock can be sewage sludge, grass and other ley crops, manure and agricultural and food waste (including waste from slaughterhouses, restaurants, grocery stores), and pharmaceuticals waste. It can also be extracted from landfills, where methane is produced spontaneously and can cause environmental problems as it is a powerful GHG (see Chapter 6).
Biogas is often consumed close to place where it is produced. Its main applications are for heat, electricity and combined heat and power. Its main advantage over other biomass-derived fuels is that it can be burned directly in any gas-fired plant. It can also be injected into the natural gas network. In addition, biogas can be used as a transport fuel for vehicles adapted to run on gas. The environmental benefits of replacing petrol or diesel with biogas are considerable. However, although the cost of biogas is significantly lower than the cost of petrol per unit of energy, vehicles need to be equipped with gas tanks.
Biogas yields depend on the biodegradability of the feedstock. For swine and bovine manures the yield is 0.2-0.5m3/kgVM (Volatile Matter), i.e. on average, an 85kg pig would yield 0.12m3 of biogas per day and a 500kg cow would yield 0.75m3/ of biogas per day. For milk serum and slaughterhouse wastes the yield is higher (0.3-0.7m3/kgVM). The yield from food and household waste is 0.5-0.6m3/kgVM.
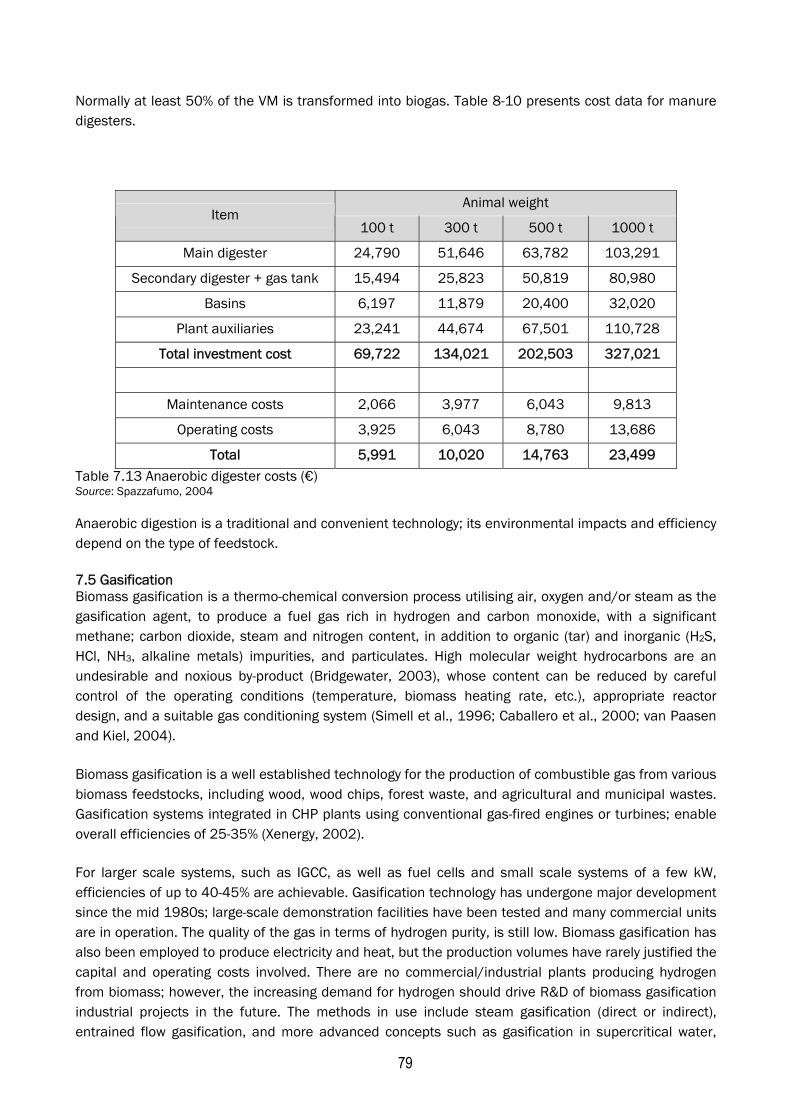
79
Normally at least 50% of the VM is transformed into biogas. Table 8-10 presents cost data for manure digesters.
Animal weight Item
100 t 300 t 500 t 1000 t
Main digester 24,790 51,646 63,782 103,291
Secondary digester + gas tank 15,494 25,823 50,819 80,980
Basins 6,197 11,879 20,400 32,020
Plant auxiliaries 23,241 44,674 67,501 110,728
Total investment cost 69,722 134,021 202,503 327,021
Maintenance costs 2,066 3,977 6,043 9,813
Operating costs 3,925 6,043 8,780 13,686
Total 5,991 10,020 14,763 23,499
Table 7.13 Anaerobic digester costs (€) Source: Spazzafumo, 2004
Anaerobic digestion is a traditional and convenient technology; its environmental impacts and efficiency depend on the type of feedstock. 7.5 Gasification Biomass gasification is a thermo-chemical conversion process utilising air, oxygen and/or steam as the gasification agent, to produce a fuel gas rich in hydrogen and carbon monoxide, with a significant methane; carbon dioxide, steam and nitrogen content, in addition to organic (tar) and inorganic (H2S, HCl, NH3, alkaline metals) impurities, and particulates. High molecular weight hydrocarbons are an undesirable and noxious by-product (Bridgewater, 2003), whose content can be reduced by careful control of the operating conditions (temperature, biomass heating rate, etc.), appropriate reactor design, and a suitable gas conditioning system (Simell et al., 1996; Caballero et al., 2000; van Paasen and Kiel, 2004).
Biomass gasification is a well established technology for the production of combustible gas from various biomass feedstocks, including wood, wood chips, forest waste, and agricultural and municipal wastes. Gasification systems integrated in CHP plants using conventional gas-fired engines or turbines; enable overall efficiencies of 25-35% (Xenergy, 2002).
For larger scale systems, such as IGCC, as well as fuel cells and small scale systems of a few kW, efficiencies of up to 40-45% are achievable. Gasification technology has undergone major development since the mid 1980s; large-scale demonstration facilities have been tested and many commercial units are in operation. The quality of the gas in terms of hydrogen purity, is still low. Biomass gasification has also been employed to produce electricity and heat, but the production volumes have rarely justified the capital and operating costs involved. There are no commercial/industrial plants producing hydrogen from biomass; however, the increasing demand for hydrogen should drive R&D of biomass gasification industrial projects in the future. The methods in use include steam gasification (direct or indirect), entrained flow gasification, and more advanced concepts such as gasification in supercritical water,
80
application of thermo-chemical cycles, and conversion of intermediates, e.g. ethanol, bio-oil or piled wood.
Biomass gasification plants are operating in several countries, demonstrating the increased integration of gasification, gas cleaning, heat and power generation, biofuel production from syngas and the potential of these technologies to contribute significantly to sustainable energy production in developed and developing countries.
Indirect heat gasification produces a largely nitrogen-free gas. The system works by physically separating the gasification and the combustion reactions (i.e. two separate gas output streams). The endothermic gasification of the fuel takes place in one reactor that is connected via a chute to the combustion chamber. Here, any non-gasified fuel particles are burnt with additional properly injected fuel, to provide the heat required by the gasification reaction. The CV of the producer gas is 12-14MJ/Nm3; it can be used in a gas engine or upgraded to synthesis gas. This gasification method combines the advantages of steam as the gasification agent (lower tar) and a nitrogen-free gas (higher calorific value). Example of this gasification system in Europe are the Güssing plant, Austria, (utilisation index has increased steadily to over 7,000 in 2005) and the Herten plant, Germany; but there are also plants in the USA (Battelle plant in Vermont) and other industrialised countries.
It is accepted that to increase the efficiency of the utilisation of the thermal and chemical energy in the producer gas, new gas cleaning and conditioning systems (abatement of particulate content and tar conversion or removal) will need to be developed and implemented. This is particularly important in the case of coupling with a high temperature fuel cell, to avoid loss by condensation of the significant amount of water vapour contained in the gas stream, useful to reform CH4, shift CO towards H2 and prevent carbon deposition on the catalytic anode surface. Hot gas cleaning and hydrogen production are the focus of applied research in gasification, as shown by the large number of papers in the literature and the number of projects funded in the ECs Framework Programmes (FP4,45 FP546 and FP647) related to this area.
7.5.1 Gas Cleaning
The composition of the producer gas depends on the original composition of the feedstock and the process parameters. Usually, the composition of the gas for indirect steam gasification is H2 (30-40%), CO (20-30%), CH4 (10-15%), water (6%), N (1%). However, the fuel gas contains many contaminants that have to be removed. Gas clean-up allows for the removal of contaminants and improvement of the fuel generally. In fuel cells applications, the harmful substances are:
• Tar • Particulates • Hydrogen sulphide • Ammonia
45 73 Joule and Thermie projects on biomass and bioenergy, among the others: Production of Hydrogen rich gas by biomass gasification, JOR3-CT95- 0037, Solid biomass gasification for fuel cells JOR3-CT96-0105, Improved technologies for the gasification of energy crops JOR3-CT97-0125, Hydrogen rich gas from biomass steam gasification JOR3-CT97- 0196 46 Some 100 projects on biomass conversion system and related area on Key action 5, among the others: Biomass gasification for CHP ERK5-1999-00003, Pure and Energetic syngas elaboration ERK5-1999-00156, Bio-H2 ERK6-CT-1999-00012, Effective ERK5-CT-1999-00007, Fuero ERK6-CT-1999-00024, Clean energy from biomass ENK5-CT-2000-00314, Biohpr ENK5-CT-2000-00311, Super-hydrogen ENK6-CT-2001-00555, Absorption Enhanced Reform of gas aer-gas ENK5-CT2001-00545, Biocogen Network ENK5-CT2001-80525, Bio-electricity ENK5-CT2002-00634, Renewable-H2 ENK5-CT-2002-80633 47 Sustainable Energy Systems thematic sub-priority, among others: Clean Hydrogen-rich Synthesis Gas (chrisgas) FP6-502587, Advanced Biomass Gasification for High-Efficiency Power Bigpower FP6-19761, Biomass Fluidised Bed Gasification with in situ Hot Gas Cleaning aer-gas II FP6-518309, Green fuel cell FP6-503122 2004
81
• Halogenated hydrocarbons • Siloxanes
The methods prescribed for their removal are described in detail in Schmack (2004) and Trogisch (2004). The purification process varies according to the gasification technology and how the gas is to be used. Diluents and contaminants, such as tar, particulates, sulphur and alkaline metals need to be removed. The most common methods are:
• Leaching: removal of soluble organics and alkali compounds by washing biomass prior to gasification
• Activated carbon: adsorption of contaminants following gasification • Cold sulphur removal in a fluidised-bed tar cracker followed by scrubbing • Hot gas clean-up in a cracking process to convert tars and unreacted char to H2, CO and
light hydrocarbons.
The above methods are well established; however, their small scale practical and economic application has yet to be proven.
Gas cleaning is normally done by filtration and scrubbing of the producer gas to reduce particulate and tar contents, to make clean gas available at close to environmental temperatures for application in gas engines. This process configuration does not allow high electric conversion efficiencies: reported values are close to 25%. This penalises the overall economic balance of the plant, which would benefit from a higher share of electricity or clean fuel to heat production. In addition, tar separation is sometimes not as effective as expected, which reduces gas yield, and produces waste streams that are difficult to dispose of or recycle. The complexity of the plant scheme to obtain a tar-free product, contributes significantly to the overall initial investment and operating costs, which is a major disadvantage since small-medium scale gasification plants would optimally fit with the economic contexts of most regions for a number of reasons, from biomass transportation costs (biomass is a dilute energy source in comparison with fossil sources), to the need to establish a distributed power generation system, and poor social acceptability of large thermal conversion plants. Thus intensification and simplification of this process could result in a major increase in the utilisation of biomass and the application of gasification plants.
Among the alternative hot gas conditioning methods, catalytic cracking and steam reforming of high molecular weight hydrocarbons offer several advantages, such as thermal integration with gasification reactors and high tar conversion. The two main advantages of catalytic gas cleaning is that it destroys the tar rather than transforming it into an equally difficult to dispose of product, and transfers the energy content of the tar to the gas phase, mainly as H2 and CO. To avoid deactivation by coking of the catalysts located downstream from the gasifier, the upstream gasifier needs to generate a fairly clean gas. Corella et al. suggest a limit of 2g/Nm3. There have been many studies on biomass gasification in fluidised bed reactors utilising dolomite ((Ca, Mg) CO3) or olivine ((Mg, Fe)2SiO4). Calcined dolomite, limestone or magnesite is able to increase the gas hydrogen content (Delgado et al., 1997). Olivine is slightly less efficient in biomass gasification and tar reform, but has higher friction resistance than dolomite (Rapagnà et al., 2000). Rauch et al. (2006) demonstrate that olivine activity or more specifically olivine activation depends on the iron oxide content. Depending on the olivine temperature treatment, iron can be present in the olivine phase, or as iron oxide. Ni-based reforming catalysts show high activity and selectivity for tar conversion, but suffer from mechanical fragility, rapid deactivation (mostly due to sulphur, chlorine, alkali metals, coke) and metal sintering, which together reduces their
82
lifetime (Bain et al., 2005). A Ni/olivine catalyst reduces the tar content in the gas product by one order of magnitude (Pfeifer et al., 2004).
In summary, gasification is a traditional technology involving a directly heated gasifier followed by cold gas cleanup systems (and gas engines); it has lower environmental impacts, higher yield and high CV fuel can be obtained through oxygen or indirectly heated steam gasifiers (and other advanced technologies) followed by hot clean up systems. However, these technologies are in the demonstration phase are probably high cost. These technology improvements (linked to fluidised beds, ceramic candles, membranes, etc.) would enable the production of a very large range of fuels however the costs are only justified for large scale or demonstration plants. The price of a simple air fixed bed followed by a water scrubber and a bag house, e.g. the Indian Ankur gasifier, is about €200/kW (on biomass input thermal power) and is commercialised with capacity of 10kW-2MW. The price per kW of an indirectly heated fluidised bed steam gasifier followed by a tar cracker and a ceramic filter can be ten times higher and especially for small sizes. Commercial equipment is competitive within the 2-10MW capacity.
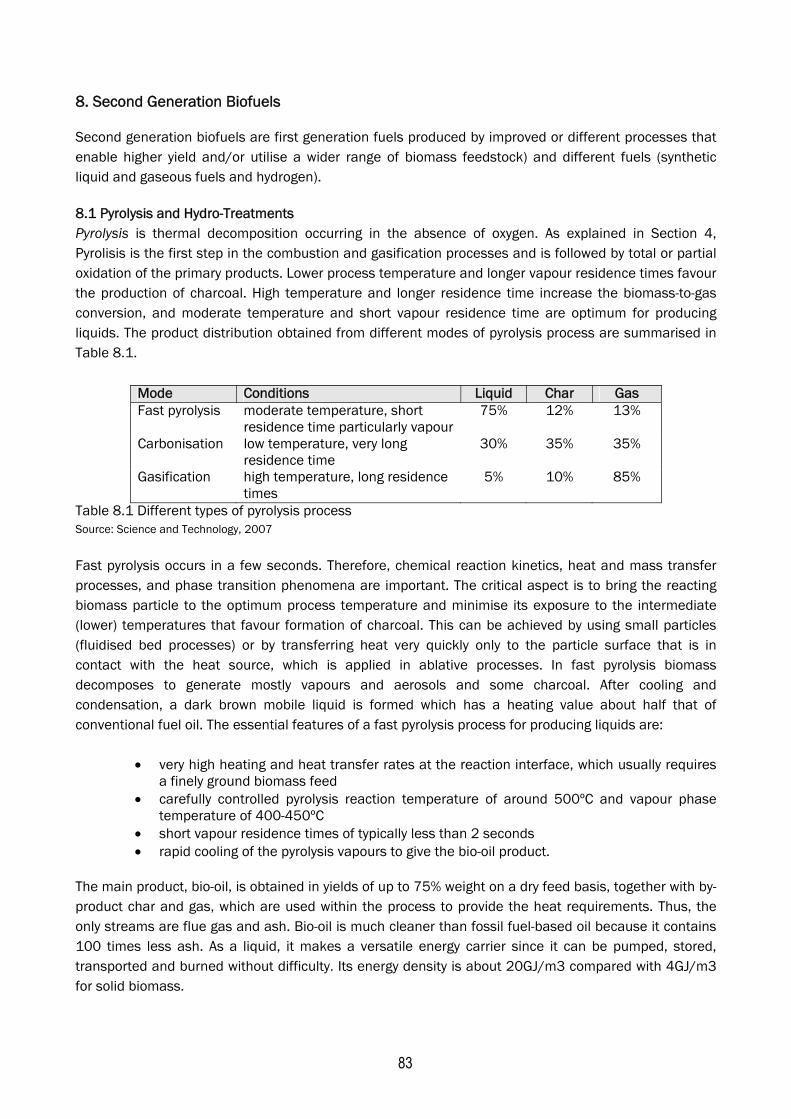
83
8. Second Generation Biofuels
Second generation biofuels are first generation fuels produced by improved or different processes that enable higher yield and/or utilise a wider range of biomass feedstock) and different fuels (synthetic liquid and gaseous fuels and hydrogen).
8.1 Pyrolysis and Hydro-Treatments Pyrolysis is thermal decomposition occurring in the absence of oxygen. As explained in Section 4, Pyrolisis is the first step in the combustion and gasification processes and is followed by total or partial oxidation of the primary products. Lower process temperature and longer vapour residence times favour the production of charcoal. High temperature and longer residence time increase the biomass-to-gas conversion, and moderate temperature and short vapour residence time are optimum for producing liquids. The product distribution obtained from different modes of pyrolysis process are summarised in Table 8.1.
Mode Conditions Liquid Char Gas Fast pyrolysis moderate temperature, short
residence time particularly vapour 75% 12% 13%
Carbonisation low temperature, very long residence time
30% 35% 35%
Gasification high temperature, long residence times
5% 10% 85%
Table 8.1 Different types of pyrolysis process Source: Science and Technology, 2007
Fast pyrolysis occurs in a few seconds. Therefore, chemical reaction kinetics, heat and mass transfer processes, and phase transition phenomena are important. The critical aspect is to bring the reacting biomass particle to the optimum process temperature and minimise its exposure to the intermediate (lower) temperatures that favour formation of charcoal. This can be achieved by using small particles (fluidised bed processes) or by transferring heat very quickly only to the particle surface that is in contact with the heat source, which is applied in ablative processes. In fast pyrolysis biomass decomposes to generate mostly vapours and aerosols and some charcoal. After cooling and condensation, a dark brown mobile liquid is formed which has a heating value about half that of conventional fuel oil. The essential features of a fast pyrolysis process for producing liquids are:
• very high heating and heat transfer rates at the reaction interface, which usually requires a finely ground biomass feed
• carefully controlled pyrolysis reaction temperature of around 500ºC and vapour phase temperature of 400-450ºC
• short vapour residence times of typically less than 2 seconds • rapid cooling of the pyrolysis vapours to give the bio-oil product.
The main product, bio-oil, is obtained in yields of up to 75% weight on a dry feed basis, together with by-product char and gas, which are used within the process to provide the heat requirements. Thus, the only streams are flue gas and ash. Bio-oil is much cleaner than fossil fuel-based oil because it contains 100 times less ash. As a liquid, it makes a versatile energy carrier since it can be pumped, stored, transported and burned without difficulty. Its energy density is about 20GJ/m3 compared with 4GJ/m3 for solid biomass.
84
A fast pyrolysis process includes drying the feed to typically less than 10% water in order to minimise water in the liquid oil (although up to 15% is acceptable), grinding the feed (to around 2mm in the case of fluid bed reactors) to sufficiently small particles to ensure rapid reaction, pyrolysis reaction, separation of solids (char), quenching and collection of the liquid product (bio-oil).
As in the case of gasification, virtually any form of biomass can be considered for fast pyrolysis. While most testing has been applied to wood due to its consistency and comparability between tests, nearly 100 different biomass types have been tested in the laboratory, including agricultural waste, such as straw, olive pits and nut shells, energy crops, such as Miscanthus and sorghum, forestry waste, such as bark, and solid waste, such as sewage sludge and leather waste.
Bio-oil can replace oil or diesel oil in many stand alone applications, including boilers, furnaces, engines and turbines for electricity generation. There is also a range of chemicals that can be extracted or derived from bio-oil, including food flavourings, spices, resins, agri-chemicals, fertilisers, and emissions control agents. Upgrading bio-oil (it contains about 40% by weight of oxygen and is corrosive and acid) to transportation fuel is feasible, but currently has high economic and energy costs.
Although biomass fast pyrolysis techniques for liquid fuel production have been successfully applied on a small-scale, and several large pilot plants and demonstration projects are in operation or at an advanced stage of construction, they are still relatively expensive compared to fossil based energy and thus face economic and other non-technical barriers to competition in the energy market (Bridgwater et al. 2001). There is no obvious ‘best’ technology. Bubbling fluid beds offer robust and scaleable reactors, but the problem of heat transfer has still to be proven. Circulating fluid beds and transported beds may overcome the heat transfer problem, but scaling is not yet proven and there is an added problem of char attrition. Intensive mechanical devices, such as ablative and rotating cone reactors, offer the advantages of compactness and absence of fluidising gas, but may suffer from scaling problems and the problems associated with moving parts at high temperature.
Finally there are specific challenges facing fast pyrolysis related to technology, product and applications including (PyNe):
• cost of bio-oil, which can be 10%-100% higher than fossil fuel • limited developed applications (scaling–up) • lack of standards for use and distribution of bio-oil • non-compatibility with conventional fuels
Hydrothermal upgrading (HTU), originally developed by Shell, converts biomass at high pressure and at moderate temperatures in water to biocrude. Biocrude contains far less oxygen than bio-oil produced through pyrolysis, but the process is still in a pre-pilot phase (Naber et al. 1997, Schindler and Weindorf, 2000).
8.2 Advanced Fermentation and Hydrolysis Most current bio-ethanol production is based on feedstocks from food crops. In the future, ligno-
cellulose biomass is expected to be an important feedstock and its use would reduce competition for raw materials between the food and energy industries. It potentially would be a low-cost (owing to lower biomass cost) and efficient option. Ligno-cellulose biomass requires separation into its components lignin, cellulose and hemi-cellulose of which only the last two can be fermented to produce ethanol, with alternative organisms required to ferment hemi-cellulose. Hydrolysis techniques are attracting attention,
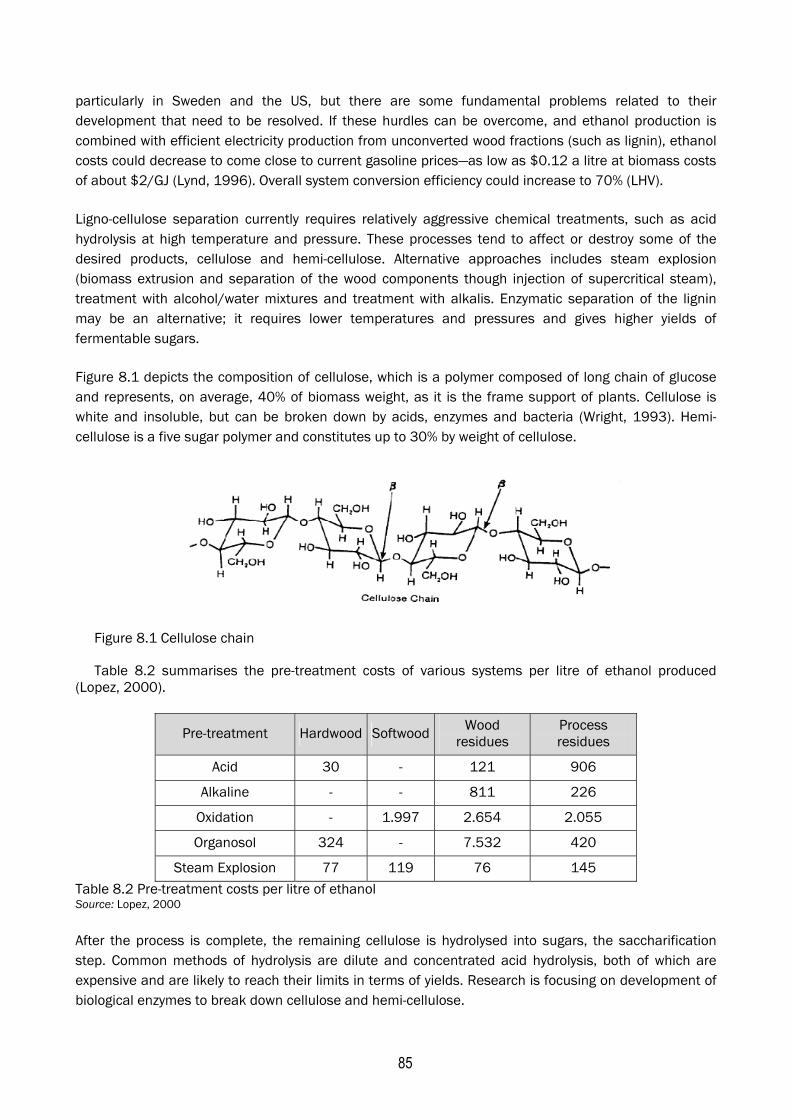
85
particularly in Sweden and the US, but there are some fundamental problems related to their development that need to be resolved. If these hurdles can be overcome, and ethanol production is combined with efficient electricity production from unconverted wood fractions (such as lignin), ethanol costs could decrease to come close to current gasoline prices—as low as $0.12 a litre at biomass costs of about $2/GJ (Lynd, 1996). Overall system conversion efficiency could increase to 70% (LHV).
Ligno-cellulose separation currently requires relatively aggressive chemical treatments, such as acid hydrolysis at high temperature and pressure. These processes tend to affect or destroy some of the desired products, cellulose and hemi-cellulose. Alternative approaches includes steam explosion (biomass extrusion and separation of the wood components though injection of supercritical steam), treatment with alcohol/water mixtures and treatment with alkalis. Enzymatic separation of the lignin may be an alternative; it requires lower temperatures and pressures and gives higher yields of fermentable sugars.
Figure 8.1 depicts the composition of cellulose, which is a polymer composed of long chain of glucose and represents, on average, 40% of biomass weight, as it is the frame support of plants. Cellulose is white and insoluble, but can be broken down by acids, enzymes and bacteria (Wright, 1993). Hemi-cellulose is a five sugar polymer and constitutes up to 30% by weight of cellulose.
Figure 8.1 Cellulose chain
Table 8.2 summarises the pre-treatment costs of various systems per litre of ethanol produced (Lopez, 2000).
Pre-treatment Hardwood Softwood Wood residues
Process residues
Acid 30 - 121 906
Alkaline - - 811 226
Oxidation - 1.997 2.654 2.055
Organosol 324 - 7.532 420
Steam Explosion 77 119 76 145
Table 8.2 Pre-treatment costs per litre of ethanol Source: Lopez, 2000
After the process is complete, the remaining cellulose is hydrolysed into sugars, the saccharification step. Common methods of hydrolysis are dilute and concentrated acid hydrolysis, both of which are expensive and are likely to reach their limits in terms of yields. Research is focusing on development of biological enzymes to break down cellulose and hemi-cellulose.
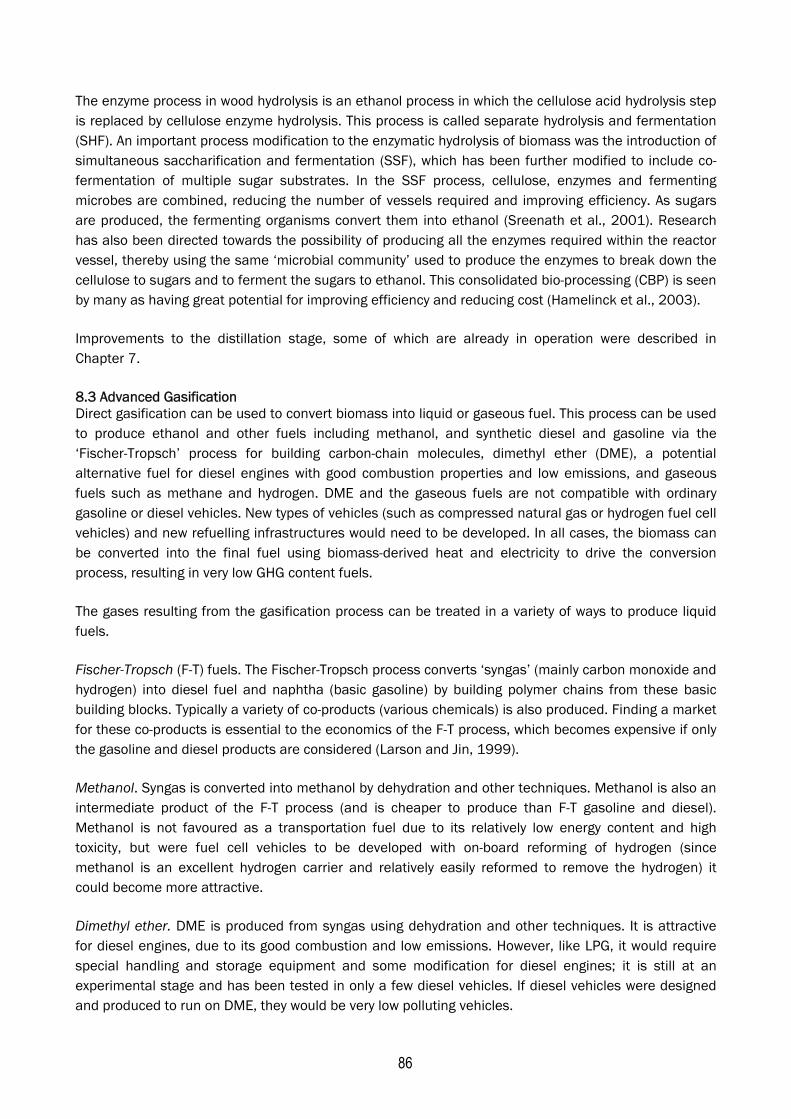
86
The enzyme process in wood hydrolysis is an ethanol process in which the cellulose acid hydrolysis step is replaced by cellulose enzyme hydrolysis. This process is called separate hydrolysis and fermentation (SHF). An important process modification to the enzymatic hydrolysis of biomass was the introduction of simultaneous saccharification and fermentation (SSF), which has been further modified to include co-fermentation of multiple sugar substrates. In the SSF process, cellulose, enzymes and fermenting microbes are combined, reducing the number of vessels required and improving efficiency. As sugars are produced, the fermenting organisms convert them into ethanol (Sreenath et al., 2001). Research has also been directed towards the possibility of producing all the enzymes required within the reactor vessel, thereby using the same ‘microbial community’ used to produce the enzymes to break down the cellulose to sugars and to ferment the sugars to ethanol. This consolidated bio-processing (CBP) is seen by many as having great potential for improving efficiency and reducing cost (Hamelinck et al., 2003).
Improvements to the distillation stage, some of which are already in operation were described in Chapter 7.
8.3 Advanced Gasification Direct gasification can be used to convert biomass into liquid or gaseous fuel. This process can be used to produce ethanol and other fuels including methanol, and synthetic diesel and gasoline via the ‘Fischer-Tropsch’ process for building carbon-chain molecules, dimethyl ether (DME), a potential alternative fuel for diesel engines with good combustion properties and low emissions, and gaseous fuels such as methane and hydrogen. DME and the gaseous fuels are not compatible with ordinary gasoline or diesel vehicles. New types of vehicles (such as compressed natural gas or hydrogen fuel cell vehicles) and new refuelling infrastructures would need to be developed. In all cases, the biomass can be converted into the final fuel using biomass-derived heat and electricity to drive the conversion process, resulting in very low GHG content fuels.
The gases resulting from the gasification process can be treated in a variety of ways to produce liquid fuels.
Fischer-Tropsch (F-T) fuels. The Fischer-Tropsch process converts ‘syngas’ (mainly carbon monoxide and hydrogen) into diesel fuel and naphtha (basic gasoline) by building polymer chains from these basic building blocks. Typically a variety of co-products (various chemicals) is also produced. Finding a market for these co-products is essential to the economics of the F-T process, which becomes expensive if only the gasoline and diesel products are considered (Larson and Jin, 1999).
Methanol. Syngas is converted into methanol by dehydration and other techniques. Methanol is also an intermediate product of the F-T process (and is cheaper to produce than F-T gasoline and diesel). Methanol is not favoured as a transportation fuel due to its relatively low energy content and high toxicity, but were fuel cell vehicles to be developed with on-board reforming of hydrogen (since methanol is an excellent hydrogen carrier and relatively easily reformed to remove the hydrogen) it could become more attractive.
Dimethyl ether. DME is produced from syngas using dehydration and other techniques. It is attractive for diesel engines, due to its good combustion and low emissions. However, like LPG, it would require special handling and storage equipment and some modification for diesel engines; it is still at an experimental stage and has been tested in only a few diesel vehicles. If diesel vehicles were designed and produced to run on DME, they would be very low polluting vehicles.
87
In order for any of these fuels to compete with petroleum fuels at current world oil prices, the costs would need to reduce dramatically. New technologies, such as liquid phase methanol production (combined with electricity generation) and new gas separation, allow lower production costs and higher overall conversion efficiencies. With large-scale conversion and production of both fuel and electricity, these processes might compete with gasoline and diesel (Spath et al., 2000; Faaij et al., 1999).
8.4 Pyrolysis plus Gasification plus Synthesis In this process Biomass To Liquids (BTL) biomass feedstock is converted to bio-oil by pyrolysis, the bio-oil is gasified at high pressure (30 bar) and temperature (1,200-1,500°C) to a high quality clean synthesis gas (a mixture of carbon monoxide and hydrogen); finally synthesis gas is converted into liquid fuel in the F-T catalytic process originally developed to produce liquid fuels from synthesis gas derived from coal. The first commercial BTL diesel-producing plant is due to be commissioned in 2009 in Freiburg, Germany. Capacity will be 13,000t/yr. 8.5 Bio-hydrogen Technologies Environmental and security of energy supply considerations are driving the transition from fossil fuel to hydrogen. In order to meet ever-increasing energy demand and the aim of an energy ‘democracy’ around the globe, the combination of hydrogen produced from renewables and fuel cells seem to be one of the few potential sources of energy that is practicable in terms of resource availability, i.e. the hydrogen from renewables could replace conventional fuel consumption and reduce environmental damage dramatically.
In terms of electricity produced by renewables, it is most efficient to consume all the electricity produced ‘instantly’; any excess production could be used to produce hydrogen, which would become the means of storing energy from renewables. The niche markets that would allow an increase in the penetration of renewables to produce hydrogen could be seen as the highway to the hydrogen economy, driven by technical advances in hydrogen and fuel cell technologies and the need for diversified and sustainable technologies. OECD country governments are intensifying their R&D efforts (almost €1bn/year invested globally in hydrogen and fuel cells research) with private sector investment (including major oil and gas companies, car manufacturers, electrical utilities, power plant component developers and a number of ‘small’ players (SMEs) in the current hydrogen and fuel cell market) reaching €3-4bn/year.
The potential methods of producing hydrogen from RES are: • by electrolysis from electricity (wind, solar, geothermal, hydro, wave, biomass); • hydrogen by reforming of biomass-derived fuels; • biological and bio-mimetic production (bio-photolysis and fermentation); • high temperature solar thermo-chemical production – thermolysis; • photo-electrochemical production – photo-electrolysis
Electrolysis, biogas and gasification and reforming (particularly large scale reforming of fossil fuels) are well established technologies; the other methods are in the early development phase, and are characterised by low efficiency. However, there is potential for major improvements.
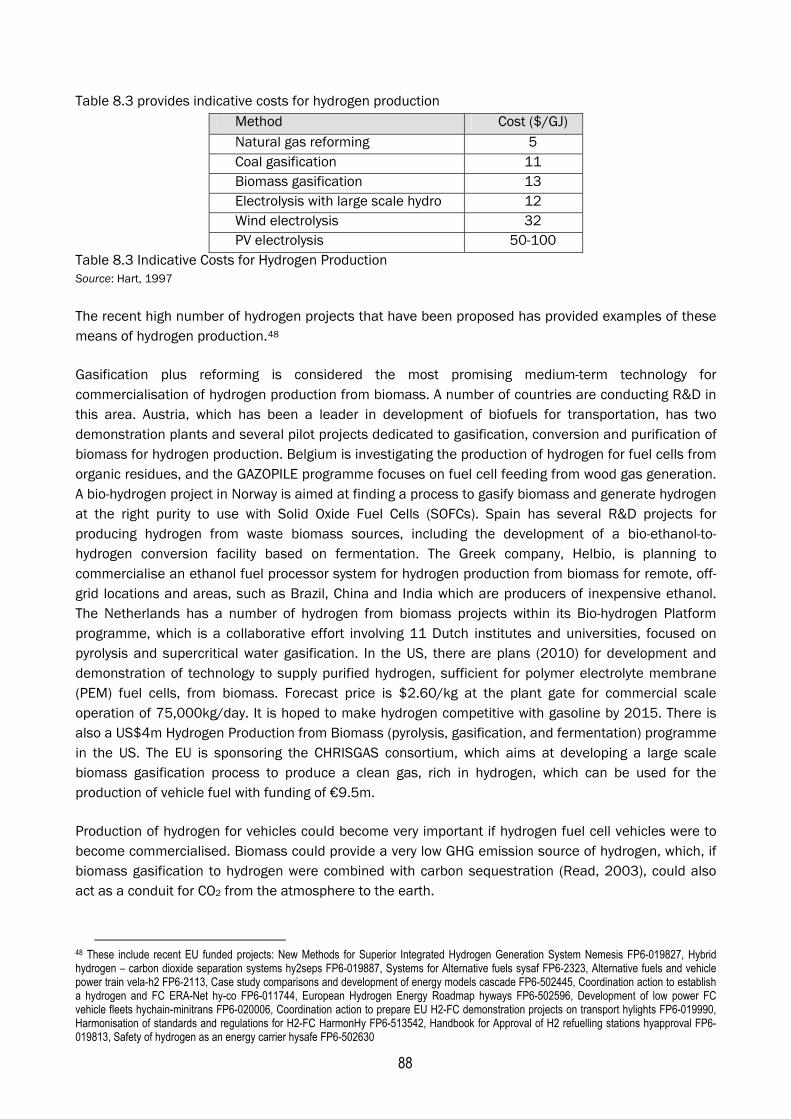
88
Table 8.3 provides indicative costs for hydrogen production Method Cost ($/GJ) Natural gas reforming 5 Coal gasification 11 Biomass gasification 13 Electrolysis with large scale hydro 12 Wind electrolysis 32 PV electrolysis 50-100
Table 8.3 Indicative Costs for Hydrogen Production Source: Hart, 1997
The recent high number of hydrogen projects that have been proposed has provided examples of these means of hydrogen production.48
Gasification plus reforming is considered the most promising medium-term technology for commercialisation of hydrogen production from biomass. A number of countries are conducting R&D in this area. Austria, which has been a leader in development of biofuels for transportation, has two demonstration plants and several pilot projects dedicated to gasification, conversion and purification of biomass for hydrogen production. Belgium is investigating the production of hydrogen for fuel cells from organic residues, and the GAZOPILE programme focuses on fuel cell feeding from wood gas generation. A bio-hydrogen project in Norway is aimed at finding a process to gasify biomass and generate hydrogen at the right purity to use with Solid Oxide Fuel Cells (SOFCs). Spain has several R&D projects for producing hydrogen from waste biomass sources, including the development of a bio-ethanol-to-hydrogen conversion facility based on fermentation. The Greek company, Helbio, is planning to commercialise an ethanol fuel processor system for hydrogen production from biomass for remote, off-grid locations and areas, such as Brazil, China and India which are producers of inexpensive ethanol. The Netherlands has a number of hydrogen from biomass projects within its Bio-hydrogen Platform programme, which is a collaborative effort involving 11 Dutch institutes and universities, focused on pyrolysis and supercritical water gasification. In the US, there are plans (2010) for development and demonstration of technology to supply purified hydrogen, sufficient for polymer electrolyte membrane (PEM) fuel cells, from biomass. Forecast price is $2.60/kg at the plant gate for commercial scale operation of 75,000kg/day. It is hoped to make hydrogen competitive with gasoline by 2015. There is also a US$4m Hydrogen Production from Biomass (pyrolysis, gasification, and fermentation) programme in the US. The EU is sponsoring the CHRISGAS consortium, which aims at developing a large scale biomass gasification process to produce a clean gas, rich in hydrogen, which can be used for the production of vehicle fuel with funding of €9.5m.
Production of hydrogen for vehicles could become very important if hydrogen fuel cell vehicles were to become commercialised. Biomass could provide a very low GHG emission source of hydrogen, which, if biomass gasification to hydrogen were combined with carbon sequestration (Read, 2003), could also act as a conduit for CO2 from the atmosphere to the earth.
48 These include recent EU funded projects: New Methods for Superior Integrated Hydrogen Generation System Nemesis FP6-019827, Hybrid hydrogen – carbon dioxide separation systems hy2seps FP6-019887, Systems for Alternative fuels sysaf FP6-2323, Alternative fuels and vehicle power train vela-h2 FP6-2113, Case study comparisons and development of energy models cascade FP6-502445, Coordination action to establish a hydrogen and FC ERA-Net hy-co FP6-011744, European Hydrogen Energy Roadmap hyways FP6-502596, Development of low power FC vehicle fleets hychain-minitrans FP6-020006, Coordination action to prepare EU H2-FC demonstration projects on transport hylights FP6-019990, Harmonisation of standards and regulations for H2-FC HarmonHy FP6-513542, Handbook for Approval of H2 refuelling stations hyapproval FP6-019813, Safety of hydrogen as an energy carrier hysafe FP6-502630
89
In traditional biochemical conversion (digestion) processes, wet feedstock, such as manure, is digested for 2-4 weeks to produce primarily CH4 and CO2. Methane is converted into hydrogen in a thermo-chemical process, such as steam-reforming. By manipulating the process conditions, methane formation can be suppressed enabling direct production of hydrogen and organic acids. The organic acids can be converted into methane and post-processed to yield additional hydrogen, increasing the overall efficiency of the process. Although this method is well developed, innovations to increase efficiency and lower costs are required to bring the cost of hydrogen produced in this way closer to that of hydrogen produced using methods such as direct reforming of natural gas. Gasification typically involves use of heat to break down the biomass and produce a ‘synthesis gas’, often composed of several compounds from which the hydrogen is afterwards extracted.
Hydrogen is a clean fuel whose combustion emits only pure water and no GHG. Hydrogen can be burned directly to produce heat and electricity; it can be used as a transport fuel; and it can be used as an input for fuel cells where it is efficiently converted directly to heat and power.
Hydrogen can also be produced from a broad range of carbohydrate, cellulose or protein biomass sources using biological processes. Under anaerobic conditions, bacteria convert the biomass to hydrogen, biogas and ethanol. Typical yields are in the range 0.6-3.3 molecules hydrogen per molecule of glucose, depending on the bacteria. Thermophylic bacteria that operate at temperatures up to 70°C give higher yields than bacteria that operate at ambient temperatures. A typical chemical reaction is:
C6H12O6 + 2H2O = 2CO2 + 2CH3COOH + 4H2
The yields can be increased by using phototropic bacteria that convert acetic acid to hydrogen, as follows:
CH3COOH + 4H2O = 2CO2 + 4H2
Biological processes generally require modest investment and are effective even on a small scale; they are still at the development stage.
8.6 Bio-refineries and energy-farms As already explained, to be efficient biomass use requires the integration of biochemical and thermal processes in order to decrease the external energy for the biochemical processes involved in energy production, for example by locating energy plants near to biorefineries or by constructing a combined bio-refinery-farm.
Due to the increase in energy prices and environmental awareness, modern and connected energy farms are increasing the use own energy sources. The implementation of biomass power plants provides competition, and improves the efficiency of renewable energy use (mainly heat and electricity), and reduces CO2 emissions, thereby increasing the economic and social benefits. Existing energy farms mainly use residues from the final stages of the biomass chain (pre-treatment, conversion, end use), which improves the energy, environmental and economic balance. The conversion process must be accurate to avoid negative impacts (low efficiency, pollution, high cost). Global economic pressures have pushed the agroindustries (sugar, paper, animal processing) to search for better use of waste, both to reduce food and feed production costs, and to diversify and integrate raw materials sources. Potentially, most farms can produce energy although perhaps not sufficient for their total energy requirements.
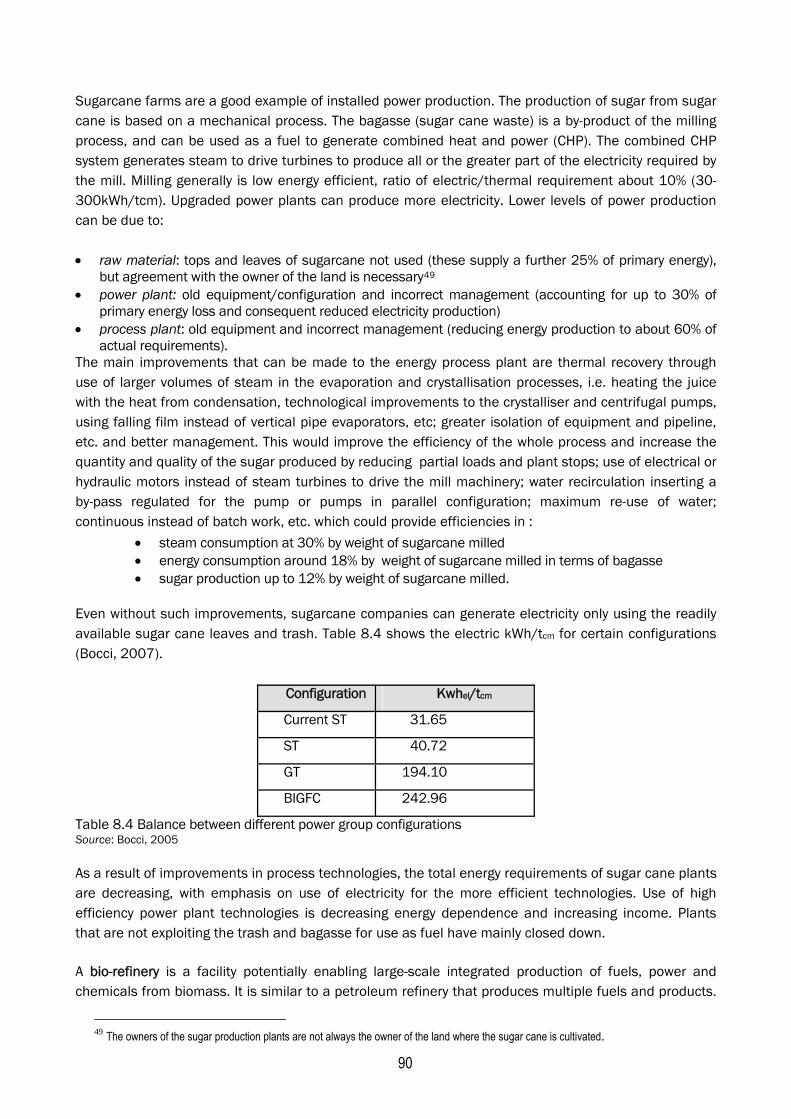
90
Sugarcane farms are a good example of installed power production. The production of sugar from sugar cane is based on a mechanical process. The bagasse (sugar cane waste) is a by-product of the milling process, and can be used as a fuel to generate combined heat and power (CHP). The combined CHP system generates steam to drive turbines to produce all or the greater part of the electricity required by the mill. Milling generally is low energy efficient, ratio of electric/thermal requirement about 10% (30-300kWh/tcm). Upgraded power plants can produce more electricity. Lower levels of power production can be due to:
• raw material: tops and leaves of sugarcane not used (these supply a further 25% of primary energy), but agreement with the owner of the land is necessary49
• power plant: old equipment/configuration and incorrect management (accounting for up to 30% of primary energy loss and consequent reduced electricity production)
• process plant: old equipment and incorrect management (reducing energy production to about 60% of actual requirements).
The main improvements that can be made to the energy process plant are thermal recovery through use of larger volumes of steam in the evaporation and crystallisation processes, i.e. heating the juice with the heat from condensation, technological improvements to the crystalliser and centrifugal pumps, using falling film instead of vertical pipe evaporators, etc; greater isolation of equipment and pipeline, etc. and better management. This would improve the efficiency of the whole process and increase the quantity and quality of the sugar produced by reducing partial loads and plant stops; use of electrical or hydraulic motors instead of steam turbines to drive the mill machinery; water recirculation inserting a by-pass regulated for the pump or pumps in parallel configuration; maximum re-use of water; continuous instead of batch work, etc. which could provide efficiencies in :
• steam consumption at 30% by weight of sugarcane milled • energy consumption around 18% by weight of sugarcane milled in terms of bagasse • sugar production up to 12% by weight of sugarcane milled.
Even without such improvements, sugarcane companies can generate electricity only using the readily available sugar cane leaves and trash. Table 8.4 shows the electric kWh/tcm for certain configurations (Bocci, 2007).
Configuration Kwhel/tcm
Current ST 31.65
ST 40.72
GT 194.10
BIGFC 242.96
Table 8.4 Balance between different power group configurations Source: Bocci, 2005
As a result of improvements in process technologies, the total energy requirements of sugar cane plants are decreasing, with emphasis on use of electricity for the more efficient technologies. Use of high efficiency power plant technologies is decreasing energy dependence and increasing income. Plants that are not exploiting the trash and bagasse for use as fuel have mainly closed down.
A bio-refinery is a facility potentially enabling large-scale integrated production of fuels, power and chemicals from biomass. It is similar to a petroleum refinery that produces multiple fuels and products.
49 The owners of the sugar production plants are not always the owner of the land where the sugar cane is cultivated.
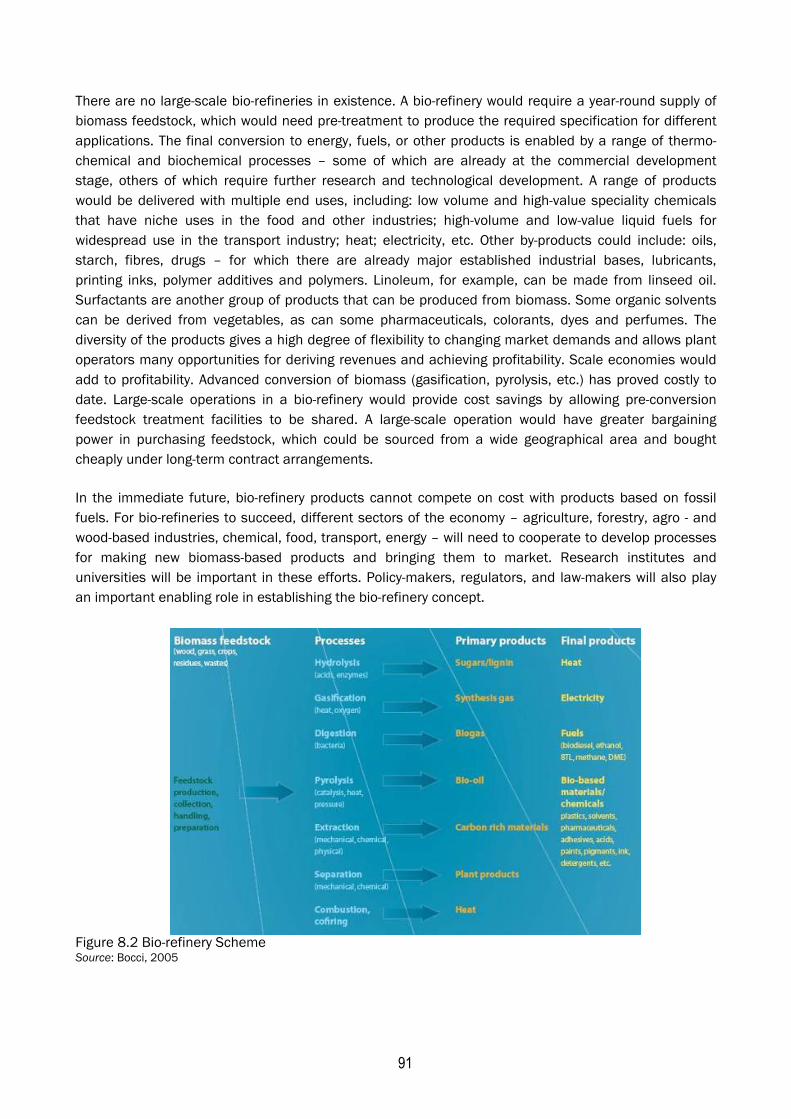
91
There are no large-scale bio-refineries in existence. A bio-refinery would require a year-round supply of biomass feedstock, which would need pre-treatment to produce the required specification for different applications. The final conversion to energy, fuels, or other products is enabled by a range of thermo-chemical and biochemical processes – some of which are already at the commercial development stage, others of which require further research and technological development. A range of products would be delivered with multiple end uses, including: low volume and high-value speciality chemicals that have niche uses in the food and other industries; high-volume and low-value liquid fuels for widespread use in the transport industry; heat; electricity, etc. Other by-products could include: oils, starch, fibres, drugs – for which there are already major established industrial bases, lubricants, printing inks, polymer additives and polymers. Linoleum, for example, can be made from linseed oil. Surfactants are another group of products that can be produced from biomass. Some organic solvents can be derived from vegetables, as can some pharmaceuticals, colorants, dyes and perfumes. The diversity of the products gives a high degree of flexibility to changing market demands and allows plant operators many opportunities for deriving revenues and achieving profitability. Scale economies would add to profitability. Advanced conversion of biomass (gasification, pyrolysis, etc.) has proved costly to date. Large-scale operations in a bio-refinery would provide cost savings by allowing pre-conversion feedstock treatment facilities to be shared. A large-scale operation would have greater bargaining power in purchasing feedstock, which could be sourced from a wide geographical area and bought cheaply under long-term contract arrangements.
In the immediate future, bio-refinery products cannot compete on cost with products based on fossil fuels. For bio-refineries to succeed, different sectors of the economy – agriculture, forestry, agro - and wood-based industries, chemical, food, transport, energy – will need to cooperate to develop processes for making new biomass-based products and bringing them to market. Research institutes and universities will be important in these efforts. Policy-makers, regulators, and law-makers will also play an important enabling role in establishing the bio-refinery concept.
Figure 8.2 Bio-refinery Scheme Source: Bocci, 2005
92
9. Biomass Energy Sustainability
9.1 Assessment of Biomass Use
As explained in Section 4, the first element in viable biomass uses is the energy and economic production costs (GJ/GJ and €/GJ), involved in the first three parts of the biomass chain (see Section 4.2).
Price of feedstock is the largest component of the operating costs of a biomass plant and varies depending on whether it is biomass based on waste or specially cultivated biomass. Some industrial producers of waste biomass (such as the sugar industry) have access to feedstock at minimal cost. In Denmark and Sweden, where carbon and energy taxes have been introduced, more expensive wood fuels and straw are now used on a large scale. Below we provide a simple calculation of these costs based on average values.
Fixing a value of 100GJ/ha (e.g. yield 10t/ha and CV 10GJ/t, which represents all the biomass produced by an energy crop), a value of 10GJ/ha for cultivation and harvesting, the energy production cost is €0.1/GJ50 and the mean economic cost is about €4/GJ. These average ‘good’ values are based on transport and energy costs of €0.5MJ/km and €0.02/km/ton.
Biomass with lower yields and low CV is not proportionally lower in cost; thus the energy and economic returns can become negative. Production costs can be reduced by focusing on yield, land rent, and labour cost. Yields are influenced by biomass species, cultivation and harvesting, e.g. green harvesting of sugar cane provides bagasse and also leaves and plant tops. Land rents will be lower for biomass cultivation on marginal land or for using biomass based on residues. Labour costs can be reduced through mechanisation. Transport costs will be minimised by the power plant being located near to where the biomass is grown, thereby making the transport chain more efficient. A compromise between energy and economic costs will produce the ideal scenario. For example, if a biochemical process is integrated with a thermal process or production of food or chemicals is integrated, the value of the biomass increases, reducing the other costs.
The second main element to consider is the conversion process, which mainly depends on the biomass quality and the end product (heat, electricity, fuel, food, chemicals). The chapter on technologies included data that can be used to calculate the energy and economic production costs. The values have a wide range and the energy and economic returns can easily become negative. Many processes have high energy requirements and, especially for the most advanced technologies, high investment costs. Availability and full-scale application of advanced conversion technology, combining high energy conversion efficiency and environmentally sound performance with low investment costs, is the ideal.
To summarise: solar energy conversion efficiency of biomass is low (world average about 0.1%, crops about 1%);, biomass has a low energy density (transportation distances should not be more than 100-200 km). The energy required for production and conversion of the feedstock can soon outweigh the energy produced if the most appropriate process is not implemented. Last but not least, the social and environmental impacts of the complete biomass chain need to be analysed.
It cannot be assumed that the liquid biofuels that can be produced from biomass will be a complete replacement for petroleum based fuels. In many countries there is not sufficient available land, e.g. if
50 Energy Return On Energy Investment (EROEI) equal to 10
93
we consider only the transport sector in Italy and a bio-diesel yield of 1,000kg/ha or an ethanol yield of 2,000 kg/ha, this would account for all the available land51 and would make the energy, economic, social and environmental impacts negative (see the mono-cropping no man’s land charter). Rather, biofuels should be considered as part of a long term strategy for achieving a sustainable energy system including all possible energy sources, e.g. biogas, fuel gas, hydrogen and sustainable renewable sources, e.g. crops, residues, etc. In this perspective, the total amount of energy sources growth if calculated in terms of substitution of fossil fuels, result in a technical potential more than 20 times higher than world energy consumption.
9.2 Environmental and Socio-Economic Implications Large scale biomass use has a wide range of environmental implications: soil fertility, leaching of nutrients, biodiversity; deforestation and erosion, landscape, water use, increased risk of fire and disease, air, water and ground pollution, etc. Even if the energy produced from biomass produces the same volume of CO2 that the biomass has fixed, there can be polluting emissions due to inappropriate use, fertilisers and pesticides production, cultivation, harvesting, etc.
On the other hand, with appropriate management, biomass use can prevent erosion, remove soil contaminants, increase biodiversity, etc. Soil erosion can be minimised by leaving the plant roots in the soil allowing formation of an extensive root system, which also will add to the organic matter content of the soil. Increased water consumption as a result of the increased vegetation may be a concern, but could perhaps be balanced by the effect of greater land cover which generally is good for water retention and microclimatic conditions. Use of agrochemicals can be avoided. Plantation biomass will result in the removal of nutrients from the soil, which will need to be replenished. Recycling of ash would provide crucial trace elements and phosphates, and is common practice in Austria and Sweden. In Brazil, stillage, which is a rich nutrient remainder from sugar cane fermentation is returned to the sugar cane plantations. Landscaping and management of biomass production systems can considerably reduce the risks of fire and disease. Conversion of biomass to desired intermediate energy carriers and their use for energy services should meet strict environmental standards. Good plantation design, including areas set aside for native plants and animals and sympathetic with the natural landscape would avoid the problems often associated with monocultures. For example, using 60% of the sugar cane leaves and tops for energy production reduces the pollution caused by burning this trash in the fields; returning the remaining 40% to the land and increasing land fertility. The social implications also need to be considered. Bio-energy systems require complex organisations, involving multiple actors and substantial land areas; their benefits in terms of employment are substantial for most countries.
Using bio-energy enables companies in the agricultural sector to become producers of both food and energy and allows them to diversify and integrate their sources and yields. This can be seen in modern power generation in the sugar, paper and pulp industries, and (organic) waste treatment. Carbon taxes, price supports, and long-running R&D programmes are central to these activities.
51 In Italy there are about 35 million vehicles that consume about 35 Gt of fuels and only 13 Mha of available (good) land, thus 13-23 Gt of
biofuels (moreover the biofuels have less energy content).
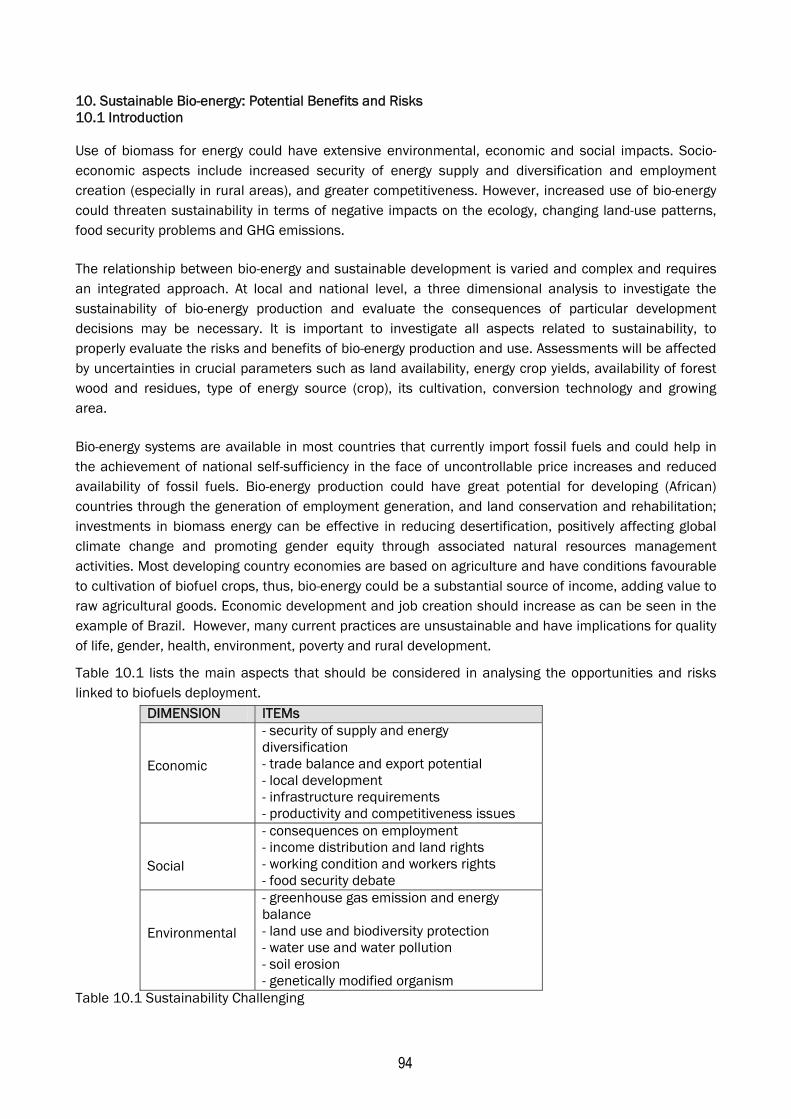
94
10. Sustainable Bio-energy: Potential Benefits and Risks 10.1 Introduction Use of biomass for energy could have extensive environmental, economic and social impacts. Socio-economic aspects include increased security of energy supply and diversification and employment creation (especially in rural areas), and greater competitiveness. However, increased use of bio-energy could threaten sustainability in terms of negative impacts on the ecology, changing land-use patterns, food security problems and GHG emissions.
The relationship between bio-energy and sustainable development is varied and complex and requires an integrated approach. At local and national level, a three dimensional analysis to investigate the sustainability of bio-energy production and evaluate the consequences of particular development decisions may be necessary. It is important to investigate all aspects related to sustainability, to properly evaluate the risks and benefits of bio-energy production and use. Assessments will be affected by uncertainties in crucial parameters such as land availability, energy crop yields, availability of forest wood and residues, type of energy source (crop), its cultivation, conversion technology and growing area.
Bio-energy systems are available in most countries that currently import fossil fuels and could help in the achievement of national self-sufficiency in the face of uncontrollable price increases and reduced availability of fossil fuels. Bio-energy production could have great potential for developing (African) countries through the generation of employment generation, and land conservation and rehabilitation; investments in biomass energy can be effective in reducing desertification, positively affecting global climate change and promoting gender equity through associated natural resources management activities. Most developing country economies are based on agriculture and have conditions favourable to cultivation of biofuel crops, thus, bio-energy could be a substantial source of income, adding value to raw agricultural goods. Economic development and job creation should increase as can be seen in the example of Brazil. However, many current practices are unsustainable and have implications for quality of life, gender, health, environment, poverty and rural development.
Table 10.1 lists the main aspects that should be considered in analysing the opportunities and risks linked to biofuels deployment.
DIMENSION ITEMs
Economic
- security of supply and energy diversification - trade balance and export potential - local development - infrastructure requirements - productivity and competitiveness issues
Social
- consequences on employment - income distribution and land rights - working condition and workers rights - food security debate
Environmental
- greenhouse gas emission and energy balance - land use and biodiversity protection - water use and water pollution - soil erosion - genetically modified organism
Table 10.1 Sustainability Challenging
95
10.2 Economic Aspects Security of supply and energy diversification: The volatility of world oil prices and heavy dependence on imported fuels leave many countries vulnerable to disruptions in supply. In 2000, the OECD countries’ oil imports represented 52% of their energy requirements, and this is expected to rise to 76% by 2020. Many developed countries are oil importers. Crude oil imports to African, Caribbean and Pacific (ACP) countries were forecast to increase to 72% of their requirements by 2005.52 Non-OECD countries share 41% of the world’s oil consumption. Oil supplies, on the other hand, are very unevenly distributed and concentrated in a few countries (75% in the Middle East) and are governed by uncompetitive structures (Dufey, 2006). In 2001 traditional biomass usage (e.g., woody fuel and manure for cooking and heating), or (traditional) woody fuels, accounted for 39EJy-1 or 9.3% of the global primary energy consumption, while modern biomass usage (e.g., for electricity or fuel generation), made up 6EJy-1 or 1.4% of the global primary energy consumption (Turkenburg, 2000; IEA, 2003).
Increased use of bio energy, which is based on a variety of feedstock, could secure long term energy supply. The best way to promote long-term security of supply is to diversify energy sources and raw materials.
Trade balance and export potential: Local economies and national trade balances benefit from the replacement of imported fuels with local fuels. The foreign currency saved by developing countries from reducing oil imports, will increase the resources available for development needs.
The growing import dependence ratio (in EU estimated at 70% by 2030, 90% for oil), has been the motivation for legislation intended to facilitate development of the biofuels market in Europe.53 A target of 20% of the EU's overall energy consumption from renewables by 2020 was agreed by European leaders in March 2007.54 This involves a minimum target for each Member State of at least 10% of their transport fuel consumption from biofuels. In order to achieve the 5.75% indicated in the EC’s biofuel directive (2003/30/EC, May 8, 2003) bio-diesel imports from non-EU countries are expected to increase fourfold from 104,000mt in 2006, to 430,000mt in 2007 while bio-ethanol imports are expected to increase from 459,000mt in 2006, to 660,000mt in 2007 and 920,000mt in 2008 (GAIN, 2007). European demand for bio-energy imports could provide new trade opportunities for developing countries, which have the potential to produce and export bio-energy at competitive prices.
International trade in biofuels and related feedstocks will benefit many countries. For importing countries it will enable their self imposed targets for biofuels use. For exporting countries, especially small and medium sized developing countries, the existence of export markets is needed to initiate their biofuels industries. The benefits for the bio-energy exporting countries are that the production and export of bio-energy brings the benefits described above – especially for rural communities (Lewandowski, 2004). Security of energy supply and improved import/export balance are important macroeconomic and strategic issues for any country.
Local development and infrastructure requirements: The creation of a biofuel industry in developing countries should improve rural diversification and economic development bringing benefits to the local community. Including local farmers and community members in ownership and participation in biofuel production plants will be important to effectively promote rural development. Local ownership should
52 IEA, 2002 quoted in Coelho (2005). 53 EC Green Paper: ‘Towards a European strategy for the security of energy supply’ emphasises the importance of energy independence and the possible role of bioenergy and other renewable energy sources in overcoming increasing external dependence. 54 Renewable Energy Road Map. Renewable energies in the 21st century: building a more sustainable future, COM(2006) 848 final.
96
ensure that local needs are satisfied by local resources and that the profits benefit the local economy. Governments’ and policymakers’ actions will be crucial to support the creation of a national biofuel industry that promotes rural community development.
Productivity and competitiveness issues: The use of biomass energy could reduce agricultural productivity as a result of residues and dung, which otherwise would be used to enrich the land, being burned in stoves. However, demand for bio-energy will generate demand for different crops with potential benefits due to commodity prices, reduced surpluses and new opportunities for agricultural value added (Dufey, 2006), all of which will support poverty reduction in developing countries. Lack of local technological skills and investment could encourage developing countries to export the raw materials needed for biofuels, and leave conversion of unprocessed fuel to the importing country. The next generation technology, which will be required to ensure profitable switching from crops for food and feed to crops for biofuel production, is complex and expensive.
Costs: According to IEA (2007) the average costs of renewable energy, with the exception of combustible biomass (for heat) are generally not competitive with wholesale electricity and fossil fuels. Costs will be minimised if biomass can be converted near to a plentiful source, such as a saw mill or sugar mill (IEA, 2005). The extra cost of using biofuels will depend on the cost of oil, the share of imports and the competitiveness of agricultural markets (COM, 2006 845 final).
According to the EU Strategy for Biofuel (COM, 2006) with current technologies, EU-produced bio-diesel breaks even with oil at around €60 per barrel, and bio-ethanol is competitive with oil at about €90 per barrel. One of the biggest challenges for bio-energy diffusion will be to refine the production process to reduce costs to make the product competitive in the market. Guidelines for GHG emissions demonstrate that with the right technologies bio-energy can help to reduce emissions thereby contributing to fulfilment of the Kyoto targets.
10.3 Social Aspects Consequences for employment: Biomass should have an impact on national and local employment because it is less capital intensive than the alternatives. Bio-energy production has a positive impact on employment and livelihoods when cultivation involves small-scale farmers and conversion takes place near to biomass sources, in rural areas.
Direct employment will come from the operation and construction of biomass plants and production and transport of raw materials, and transport of final product. Indirect employment is job generated within the economy as a result of expenditures related to fuel cycles. Indirect employment is all activities connected, but not directly related, such as supporting industries, services and similar (Domac et al.2005). For example, in Brazil, most bio-ethanol-related jobs went to low skilled and poor workers in rural areas: during the first five years of operation of Proálcool in Brazil, about 376,000ha or some 25% of the total sugar cane area in the state of São Paulo was from land formerly devoted to crops (36%) and pasture (64%). Because management of sugar cane is approximately seven times more labour-intensive than pasture, this resulted in a net gain of some 25,500 worker-years of employment (40,500 worker-years generated minus 15,000 worker-years lost) (Smeets et al., 2006). Total direct employment (including power generation) required for bio-energy is three to four times greater than for fossil fuel system (FAO, 1999).
Income distribution and land rights: The distribution of income is connected to the land owning and use rights, which are fundamental to bio-energy crop cultivation. It is likely that the land will be controlled
97
mainly by large land owners or (trans) national companies. This could conflict with democratic rights over land access and cultivation of food crops. The social situation and historical development of a country will have an effect on the conflict between the requirements of industrial scale cultivation of bio-energy crops and the requirements of diversified agriculture driven by family businesses, cooperatives and rural communities aimed at supplying food and incomes for local populations. Similar disputes could arise between small and large land owners. The threat of disruption to traditional land use must be tackled, in order to prevent expropriation of land; where this is unavoidable, specific policies must be designed to compensate small farmers and reduce the pressure for migration to urban areas. Land ownership should be equitable, and land-tenure conflicts should be minimised through clearly defined, documented and legally based tenure use rights. Poor people should not be excluded from the land and traditional land-use rights should be identified (Fritsche, 2006).
Working conditions, workers rights and social responsibility: Labour conditions comprise aspects such as wages, illegal overtime, child labour and slavery. The number of workers in biocrop plantations has increased with regard to total number of permanent workers, who are exposed to greater risks.
In developing countries women often help out without entering into contracts with the landowner and without any remuneration. The working day can be 12-14 hours, and workers can be put under great pressure by production quotas. Certification and standard minimum requirements for working conditions will be needed to ensure sustainable bio-energy production.
Workers must be protected against forced labour, unequal pay and illegal overtime. In sugarcane cultivation, poor working conditions are mainly related to manual harvesting. Cane cutting carries high risks of wounds to the legs and hands. Such accidents are rarely reported and workers receive no compensation. Sick or badly injured and disabled workers unable to work, do not qualify as disabled and do not receive compensation. Pesticides constitute a major health risk for agricultural workers along with pollution caused by field burnings of sugar cane and palm oil wastes. In addition, many workers will not be aware of the risks of using pesticides.
There are international standards and guidelines related to minimum wages, the rights of pregnant women and child labour. According to the Work International Organization, child labour concerns workers aged under 16 years. The hidden and informal nature of child labour makes children especially vulnerable to workplace accidents. Child labour can be minimised by parents receiving compensation for the costs of education, to ensure that children continue to go to school and are not sent out to work (Smeets et al., 2006). Where children under 16 have been working, families should be compensated for the loss of this income.
Food security: Competition between use of land for food crops and for bio-energy crops is fundamental. In developing countries large-scale bio-energy production can lead to food security problems when demand causes land to be taken away from food and other production. Food shortages and higher food prices can ensue. This conflict is closely linked to land use. There are those that argue that large-scale production of biofuels does not imply food security trade-offs. An analysis by the FAO (2006) suggests that, in general, bio-energy cropping is not a cause of hunger, nor a direct driver of food insecurity.55
55 Food security is indicated by factors, such as the percentage of people who are chronically undernourished, adult literacy (particularly female), the proportion of household income spent on food, population growth, per capita GDP growth, agriculture‘s contribution to GDP, health expenditure as a percentage of GDP, the proportion of adults infected with HIV, the number of food emergencies, the UNDP Human Development Index, the degree of export dependence, domestic food production (food availability), purchasing power (food access), access to water and sanitation facilities (food utilisation), etc. See FAO (2006).
98
Bio-energy crops can be a means of alleviating poverty and improving food security through income generation. There is theoretically enough land available to accommodate bio-energy production without endangering future food supplies or causing further deforestation. There are synergies between fuel and food production. Cultivation of certain perennial energy crops, such as trees and grasses, requires fewer inputs, they can be grown on degraded land unfit for food crops and can promote restoration of the land to enable it to be used for food crops. In the case of sugar cane, the sugar is extracted for human consumption, molasses is used to produce biofuels, and the residues (bagasse) are burnt to produce electricity. Modern biotechnology can increase crop yields and modify plant characteristics to enhance their conversion to fuels. All these developments should reduce the competition between crops for food and crops for energy, (UNCTAD 2006).
10.4 Environmental Aspects GHG emissions and the energy balance: The energy balance is the point at which the energy required to produce 1 unit of biofuel is the same as the energy that is produced. There is debate about whether biofuels have a better energy balance than conventional fuels. This debate began in the early 1970s, based mostly on experience with corn-based ethanol. Biofuels generally have a better energy balance compared to fossil fuels, but there are important differences depending on the types of biofuel (feedstock used, method of cultivation, conversion technology) and evaluation along the entire fuel cycle is very complex.56 The energy balance for palm oil (5.63 units) is better than for soy oil (1.43 units) (Macedo, 2004). Jatropha, is considered to have the highest energy balance of any biofuel.57 Evaluations indicate that crops such as sugarcane, sweet sorghum, palm oil and Jatropha have greater potential to become efficient energy sources. It is important to develop production of crops that require fewer inputs, lower yields and less irrigation, in order to achieve economic and environmental sustainability. One of the most significant benefits of bio-energy is its low impact on GHG levels, and hence its potential to minimise climate change. Bio-energy is carbon-neutral because growing the feedstocks absorbs CO2, which means that the CO2 emitted during biofuel combustion does not contribute to new carbon emissions since they are part of the fixed carbon cycle. The overall balance of GHG emissions from bio-energy supply depends on the effective use of by-products from bio-energy conversion, (e.g. oil cake, glycerine, bagasse) and processing, which could offset at least some of the GHG emissions from bio-energy production. By-product utilisation will vary significantly, since the markets for by-products depend on quantity, and develop over time. The variation in levels of GHG emissions for different types and sources of biofuels make it difficult to predict their contribution to the achievement of GHG reduction targets for policy makers in countries that rely on various sources of biofuels. This highlights the need to identify biofuels with lower GHG emissions and create incentives for their production. Second generation biofuel production processes should be more efficient in terms of GHG emissions reductions.
Land use and biodiversity protection: Land use is critical to bio-energy production. Changes to land use can have an impact on biodiversity (loss of habitats, endangering or extinction of rare species), GHG emissions and soil degradation. If bio-energy production replaces intensive agriculture, the effects can range from neutral to positive; if it replaces natural ecosystems (forests, wetlands, pasture, etc.) the effects are mostly negative. In general, an increase in agricultural land use is to be expected in the
56 Brazilian sugarcane-based bio-ethanol is one of the most energy efficient forms of bio-ethanol, with energy balance estimates varying between 3.7 and 10.2 units, with an average of 8.3 units. Brazil’s natural conditions mean that soil productivity is very high, requiring almost no additional inputs, and sugarcane crops are rain fed. Energy is based on bagasse (the crushed cane waste after the sugar has been extracted), and fossil fuel energy needs are zero. 57 Jatropha is a perennial plant that yields oil seeds for decades after planting. It fixes nitrogen in the soil, grows without irrigation in arid conditions where corn and sugarcane cannot thrive.
99
developing world due to population growth, changes in diet and increasing opportunities to export food and fodder. Reductions to the availability of land can be due to degradation, salination of previously cultivable land, dependence on irrigation, and ongoing desertification (FAO, 2003). Economic developments could put additional pressure on land from settlements and transport infrastructure. The potential increase in bio-energy crop production is one of several pressures on land use, but the competition from bio-energy cropping is only over fertile land. In order to minimise land-use conflicts, marginal land unsuitable for most food crops should be utilised.58
Water use and water pollution: Irrigation water use is a serious concern, especially in arid and semi-arid regions where its supply is scarce and highly variable over the year. Bio-energy production can consume large quantities of water, exacerbating these problems. In general, competition for water from agriculture, urban land use and nature has been increasing in the more arid parts of the world (EEA, 2006). In addition, water pollution from the use of agrochemicals (fertilisers, pesticides) is a problem. The application of best practice techniques would reduce pollution and limit demand for water. Optimised farming systems involve low water input in agro-forestry systems in dry regions. Critical irrigation needs in semi-dry and dry regions can be reduced by water management plans (long-term strategies and implementation programmes), which provide for sustainable and efficient water for irrigation. The quality and availability of surface and ground water should be maintained, and agrochemical use minimised. Re-use of treated waste-water should become part of the agricultural management system. International Certification Systems should focus on optimising water resources and on recycling technologies in agriculture to optimise water use. Irrigation should be controlled.
Soil erosion: The abundant application of irrigation, agrochemicals and heavy harvesting equipment can degrade soils leading to soil erosion, which occurs especially in steeply sloping areas with poor soil cover that experience long, dry periods followed by heavy rainfall. Cultivation of perennial bio-energy crops could improve soils and help reduce erosion on arable land by creating good year-round soil coverage once they have become established (1-2 years) (EEA, 2006, Fritsche, 2006).
Genetically modified organisms (GMO): Genetic modification of fuel-dedicated crops – aimed at increasing yields and at developing favourable characteristics – can lead to fears about plant life and health, conservation of biodiversity and risks to the environment generally. People's resistance to GM crops, grown for whatever purpose, needs to be addressed. The environmental, sustainability and public resistance to GM energy crops should be evaluated before widespread cultivation.
10.5 Summary Policy will play an important role in the development of sustainable bio-energy whose demand is growing rapidly due to the search in many countries for cost effective strategies to reduce GHG. In several countries (especially in the EU and the USA) the use of biomass is being promoted by national policies and incentives. The most urgent issues at the local level to ensure sustainability of bio-energy production in developing countries are:
• policy support for small producers and cooperatives in the form of financial incentives such as access to credit, tax benefits, and greater use of the CDM. Policy support for a sustainable international biofuel trade and guaranteed access to it;
• developing economies of scale to control future production costs. Matching social and environmental benefits to the achievement of these economies of scale will require the motivation of small producers and cooperatives;
58 Biofuels from Jatropha.
100
• support access to technology and improve investment in R&D in countries that have started to produce bio-energy. Technology transfer from countries exporting bio-energy; technologies for sugarcane based bio-ethanol and oilseed-based bio-diesel are well developed; technologies for other types of feedstocks, such as Jatropha, require further development. Policies to expedite transit to second generation feedstocks and technologies that will enable dramatically increased production at lower costs, while reducing the negative environmental impacts. Bio-energy-related technology transfer will be an interesting test of South-South cooperation;
• corporate social responsibility including clear, universal certification schemes for criteria and indicators to test the sustainability of bio energy production and trade.59 This should include all levels of sustainable development (environmental, social and economic) through integrated analysis of a broad spectrum of sectors (agriculture, forestry, energy and trade) in the production and trade chains in order to improve societal well being in terms of better environmental performance, higher social standards (e.g. working conditions, human rights, gender equity) and economic development in an ethical and sustainable way (e.g. creating opportunities for economically disadvantaged producers, improving transparency and accountability, creating trade relationship). There are several existing agriculture certification systems that refer to different types of farming, i.e. organic, integrated or good practice agricultural production (Lewandowski, 2004);
• participatory decision making involving rural people and all stakeholders in planning and decisions is important to achieve sustainable energy development. Special attention should be given to involving women, who bear the burden of traditional energy systems and are likely to be the greatest beneficiaries of improved systems. More active involvement of rural people and their institutions in identifying rural energy problems and in formulating and implementing plans to overcome them, would result in more efficient, rational use of resources and more equitable sharing of the benefits of development;
• implementation of land-use policies to prevent negative impacts from land-use changes (e.g. controlling access to and use of high-natural-value areas and habitats, cultural sites, etc.). Bio-energy production must be concentrated on available arable land. Bio-energy crop development must be restricted to areas unsuitable for production of food, fodder and other crops.
59 Preventing environmental degradation and socioeconomic disruption from activities associated with bioenergy supply is seen as a basic principle of sustainability. In the longer term, a process-oriented development of more refined criteria and indicators involving relevant stakeholders will be needed. Existing certification schemes include: American Tree Farm System; European Green Electricity Network (EUGENE); EUREPGAP Protocol for Fresh Fruit and Vegetables; Fairtrade Labeling Organizations International (FLO); Flower Label Program (FLP); Forest Stewardship Council (FSC); Green Gold Label Program; Impact Basel Criteria for Responsible Soy Production; RSPO Principles and Criteria for Sustainable Palm Oil Production; Sustainable Agricultural Standards; Sustainable Forestry Initiative Standard (SFIS); Utz Kapeh - Codes of Conduct.
101
11. Agrofuels: Mono-cropping ‘No Man’s Land’60
Bio-energy is a growing booming market with good potential since it brings together energy, staple foods, animal feed and the water infrastructure. Via Campesina61 describes biofuels derived from agriculture as agro-fuels. Use of the term bio, which life, is considered to be misleading by a number of environmental professionals and scholars. A number of governments, entrepreneurs, civil society and peasant organisations are collaborating worldwide to oppose substitution biofuels targets, the main example being the European moratorium on these types of biofuels which has signatories from a number of European organisations and individuals. 11.1 Indigenous People and Agro-fuels World populations have co-evolved, sometimes in harmony, sometimes not. When co-evolution has been in harmony, human systems have been productive and not eroded the foundations of life. Most ecosystems inhabited by humans have been modelled on interaction; for example, it has been estimated that 10% of the biodiversity rich Amazon forest has co-evolved with its indigenous communities.62
Latin America, Africa and Asia have large indigenous populations, keen to uphold their cultural heritage and to continue to inhabit forests and wild ecosystems. Practically all of these areas have established policies and laws to protect and empower indigenous peoples and cultures, which have received recognition in national legislations in recent years. Nevertheless, the indigenous peoples in agro-fuel producing countries continuously lose land and more and more are being forced to migrate to urban areas where they live slums.63 ‘Cultural murder’ is frequently accompanied by deforestation and increased cultivation of previously natural land both of which activities add to the world’s GHG emissions.64
Chake Ñuhá (2007) states that:
In order to serve the soybean [agro-fuels] business, the governments of the Southern countries are building dams, waterways, bridges and highways with the consequent negative impacts on the environment. At the same time, the expansion of soybean crops is affecting the health of surrounding populations, where the levels of cancer and other diseases associated with agro toxic chemicals used on these monoculture plantations are increasing day by day.65
Such pleas are being ignored by policy makers in developed countries, which generally are setting high targets for the substitution of fossil fuels with no consideration for the feasibility and impacts of such policies.
60 No man’s land is a book by George Monbiot that examines the food vs fuel biofuels debate taking as a case study Kenya and Tanzania. It basically maintains that if the governments promote biofuels without reversing their policies, the humanitarian impact will be greater than that of a war. Millions will be displaced, hundreds of millions more could go hungry. 61 Call for an immediate moratorium on EU incentives for agrofuels, EU imports of agrofuels and EU agroenergy monocultures. http://www.econexus.info/biofuels.html 62 Boff L., 2004, Ecologia: grito da Terra, grito dos pobres, ed. Sextante. 63 Tauli-Corpuz V., Tamang P., Oil Palm and Other Commercial Tree Plantations, Monocropping: Impacts on Indigenous Peoples’ Land Tenure and Resource Management Systems and Livelihoods, , report to the United Nations Permanent Forum on Indigenous Issues, May 2007, http://www.un.org/esa/socdev/unpfii/documents/6session_crp6.doc. 64Respectively 14% and 18%. Stern Review Report on the Economics of Climate Change, 2006, http://www.hmtreasury.gov.uk/independent_reviews/stern_review_economics_climate_change/stern_review_report.cfm. 65Chake Ñuhá Official Declaration on the Agro-fuels and Environmental Services Traps; We want Food Sovereignty Not Biofuels, 2007, www.wrm.org.uy/subjects/biofuels/EU_declaration.html.
102
11.2 The Inconvenient Impacts of Agro-fuels GE (genetically engineered) crops, both old and newly developed, have brought profits for seed-chemical corporations and businessmen from technology and capital intensive mono-cropping over huge portions of land, and have excluded and dis-empowered most of the peasant populations. After the Second World War, the mechanical and chemical industries needed to find new markets. This was the origin of the Green Revolution, legitimated by the aim of ending world hunger and rural poverty. The war industry converted its production to agricultural machinery, nitrous compounds formerly used for explosives became fertilisers, and toxic substances were modified into pesticides, such as DDT. The previous war on humans turned to fighting the environment, pests, weeds, peasant economies and food sovereignty.66 Rural job losses, abandonment of the land and migration to the cities were seen as successful modernisation of the economy. The First Green Revolution fundamentally failed to address the problem of hunger, which has continued to grow. Loss of traditional knowledge systems has further reduced the hopes for survival of the landless and starving, and the new poor.
Before fully acknowledging the damage wrought by the First Green Revolution,67 we have embarked on a second one involving the conversion of agriculture to agribusiness promoted by the interest in agro-fuels. It is legitimated by concerns over climate change and increasing world hunger. Despite major scientific advancement in GM crops and mechanisation techniques (such as direct seeding), 4m more people per year are recognised by the World Food Programme as being malnourished.68 The industrial capacity of GM crops is leading to higher control and concentration of bio reproductive processes. The second green revolution has had some regrettable impacts; each 100ha cultivated brings only one extra job in eucalyptus plantations, two in soy, and ten (under conditions of slavery) in sugar cane. Various sources forecast between two and eight new fulltime jobs for every thousand tonnes of agro-fuels produced.69 The industry does not need workers, but it does require huge areas of land in impoverished countries, which are being obtained through illegal deforestation and land expropriation. Land tenure is often not supported by legal titles, peasants who may be illiterate, do not have any official documentation. Though most countries recognise the right to land through peaceful possession for a certain length of time, local institutions are prey to rich investors, and will sell these peasant landholdings. Entire families who have lived for many generations on the same piece of land are being forced to migrate. These peasant populations have no legal redress. Often private militias are employed to destroy evidence of human settlements and bulldoze and eliminate cultivations and natural vegetation.70
This land is quickly planted, with no weeds to interrupt the linear perfection of the crop, and noone working the land. Multi seasonal plantings of GM crops are leading to silent seasons, the only flying things being the crop spraying airplanes, dispensing often lethal pesticides and herbicides. Diverse landscapes are becoming green deserts, with people and most forms of life eradicated. Soil, air and water become polluted with toxic, persistent chemicals, such as glyphosate and N,N'-Dimethyl-4,4'-bipyridinium dichloride or Paraqat. Nearby human settlements and ecosystems are affected by harmful windborne and waterborne chemicals and non-GM crops are genetically contaminated by airborne pollen.
66 Food Sovereignty is the ability of countries and communities to control their own food supplies: to have a say in what is produced and under what conditions, and to have a say in what is imported and exported. At the local level, food sovereignty entails the rights of rural communities to remain on the land and to continue producing food for themselves and for domestic markets if they so desire. 67 Food and Agriculture Organization, 2003, Agricultura orgánica y seguridad alimentaria. http://www.fao.org and: Pavan M., 1987, Dissesto ecologico, fame e insicurezza nel mondo, ed. Meroni. 68 http://www.wfp.org/english/?ModuleID=137&Key=2433. 69Coalition Campaigning to Stop Biofuel Targets, Agrofuels: Towards a reality check in nine key areas, 2 July 2007, www.biofuelwatch.org.uk/docs/agrofuels_reality_check.pdf. 70 Murano A., Cosecha roja, el costado criminal del boom sojero, veintitrés, 23-11-2006, pp. 20-26.
103
Agriculture is by far the largest consumer and polluter of fresh water. Agriculture used to account for up to 70% of world water consumption, with the remaining 20% and 10% respectively going to industry and domestic use. These proportions have changed in favour of agriculture based on the most commonly grown agro-fuels crops being among the most water demanding ones. Rivers are being diverted and poisoned; reservoir water is being over-pumped in times of drought. Agro-fuels are reducing many of the world’s most important water reservoirs i.e. the Ongalla aquifer in North America, the Guaranì aquifer in South America have been polluted by fertilisers and agrochemicals applied to soy and cane cultivations.71 In an increasingly water scarce world, agro-fuels seem to be exceeding their share of this resource.
Nitrous oxide (N2O) is the third most important human produced GHG. Its global warming potential is 296 times that of CO2 and it persists for up to 120 years.72 Agriculture contributes to huge releases of this gas; the fertiliser industry has doubled the amounts of biologically available nitrogen which is highly unstable and is oxidized, especially in tropical climates where most agro-fuel crops are grown. Nitrogen compounds, used in explosives, were widely available after the Second World War; peacetime seems to have produced dangerous environmental time bombs.
11.3 Impacts on Food Security73 and Food Sovereignty There is an inescapable contradiction between agro-fuels and food security: in livestock production up to 80% of costs are represented by feedstuffs, with soy and corn being the main crops used for feed and fuel. 1kg of beef requires 10kg of feedstuff (2-3 kg for 1 kg of chicken meat). The corn required to fill the tank of a sports utility vehicle (SUV) with agro-ethanol would feed one person for a year.74
The UN FAO, the World Food Programme, a number of international research centres, governments and NGOs have repeatedly warned against environmental destruction and food insecurity caused by the expansion of the agro-fuels market. The FAO recently stated that the growing agro-fuel demand is the reason for higher agriculture commodity prices.75 In 2006, the price of grains (staples and feedstuff) rose in the proportion of about 1:1 with the oil price.76 Some crops (rice, wheat, corn, soybean) with low or negative energy returns and CO2 saving are used to produce agro-fuels. Sugar cane is probably the best energy crop in terms of efficiency, followed by sugar beet.77 When GHG emissions due to deforestation, agriculture, refinery and transport activities are taken into consideration, the GHG balance for agrofuels is generally negative.
The Chinese government after considering investment in agro-fuels production, has rejected any agro-fuel targets. China is well placed to assess the direct link between ‘green’ energy speculation and rising prices for staple foods. The price of pork has risen by 30% to become unaffordable in China.78 With its 1.3bn population, China cannot afford food insecurity. China will probably put pressure on other powerful consumer nations to give up their mandatory agro-fuel targets (i.e.: 10% EU, 20% USA).
71Altieri M., Bravo E., 2007, La tragedia social y ecológica de la producción de biocombustibles agrícolas en América. 72Coalition Campaigning to Stop Biofuel Targets, Agrofuels Towards a reality check in nine key areas, 2 July 2007, www.biofuelwatch.org.uk/docs/agrofuels_reality_check.pdf. 73 Food security exists when all people, at all times, have access to sufficient, safe and nutritious food to meet their dietary needs and food preferences for an active and healthy life. It includes food aid and fundamentally relies on access to markets. 74 Brown, 2007. 75 Food and Agriculture Organization, www.fao.org/newsroom/en/news/2007/1000620/index.html. 76 Brown L.R., Massive diversion of U.S. grain to fuel cars is raising world food prices, April 2007. http://www.earth-policy.org/Updates/2007/Update65.htm. 77 The eradication of the latter being subsidized in the EU. 78http://www.biodieselspain.com/2007/06/05/china-congela-proyectos-de-biocarburantes-por-las-subidas-de-los-precios-de-alimentos/.
104
Mono-cropping for export is probably one of the least sustainable activities - ecologically, economically and socially - since diversification of risk is one of the oldest principles in economics. Non-linear climate change is creating tensions across the globe; it severely affected soy yields in Argentina in 2007. The threats from climate change should make investments for agrofuels less appealing. In Latin America where agriculture has been extended to most of the useful land, invading non-productive areas and leading to higher water and fertiliser requirements, there has been severe unrest because of rising food prices. Countries such as Argentina, Paraguay, Brazil and Mexico, unable to properly feed their populations, are world leaders in agro-fuel exportation.
The present severe food crisis in agro-energy producing Southern Africa was forecast and could have been avoided by prudent agricultural policy.79 The main customer for African agro-fuel crops is the EU. Africa, more than any other area, has become a quasi no man’s land for countries such as Brazil, holding the know-how, and the EU and the USA as principal investors. This is exacerbating poverty and food insecurity in Africa. Armed conflicts over land tenure in Uganda erupted in early 2007. The indigenous people confronted the police to try to protect one of the last forests in the country, but were unsuccessful.80
It has been calculated that in order to reach the target of substituting 5.75% of fossil fuels, Italy would have to devote 30% of its agricultural land and 20% of its water resources to this use.81 It is very evident that the EU states must continue to depend on imports and the threat of higher prices for grain as a consequence of extended areas being used for agrofuel crops. Even in rich and food secure Europe there is concern over the percentage of available income that goes to buying food.
Agro-fuel markets hold the potential to reverse the trend for using fossil fuels. The increase in feed prices has caused increasing insolvency among livestock producers, whose frequent bankruptcy is resulting in loss of food sovereignty in developed and non-developed countries. Vertical integration is the only adequate strategy82 facing the present global agriculture commodity market, and it is feasible only with cheap feedstuff best provided by the large amounts of industrial residues of agro-fuel production, which will desperately need new markets. In tropical countries, the residues from agrofuel plants will not store, which calls for concentration of livestock farming nearby. Land competition from animal production into agro-fuel producing countries is commonly observed. Livestock production has very negative impacts on the land and GHG emissions.83 Small producers in both developed and non-developed countries are disappearing; big food corporations are displacing their productions to poorer countries with lower environmental and human rights standards, further concentrating power and affluence. Consumers worldwide are paying more for food whose quality and safety is falling along with security of supplies.
In Spain, there is a growing portion of the livestock sector that is completely dependent on soy and corn imports, which is being threatened by the agro-fuel boom. Small and medium sized businesses are closing almost daily. Dairy producers, chicken farmers, pig and stockbreeders are joining the campaign against European biofuel targets. Agro-fuels pose such a severe threat to human wellbeing that this is uniting the most unexpected actors - both corporations and civil society organisations. Traditionally
79 Sugrue A., Douthwaite R., Biofuel production and the threat to South Africa's food security, Wahenga.brief num. 11, 2007. http//www.wahenga.net 80 Food and Agriculture Organization, Swaziland's worst harvest ever http://www.fao.org/newsroom/en/news/2007/1000563/index.html. 81 Russi D., 2007, Social Multi-Criteria Evaluation and Renewable Energy Policy. Two case-studies. Phd Thesis. Programa de doctorado en Ciencias Ambientales, Universidad Autónoma de Barcelona. 82 http://www.biodieselspain.com. 83 Food and Agriculture Organization, Livestock’s long shadow, http://www.fao.org/ag/magazine/0612sp1.htm.
105
opposed to one another over most issues, they are united against Communitarian policies that are threatening business and food sovereignty.
In the US, the Grocery Manufacturers Association has voiced its concern over rising food prices due to agro-fuels production and asked Congress for a prudent approach to the subject.84 Nevertheless, in the recently approved Farm Bill, US$4.2bn was devoted to bio-energy R&D,85 which will not benefit the 35m North American citizens who do not have enough to eat.86
The world’s population is growing at a high rate, and is more concentrated in towns than ever in the past. By 2008, for the first time, more than half of the world’s population will be living in a city.87 Fifty per cent of this urban population will be living in slums with no sanitation or services,88 a trend that is expected to continue to 2030 when an additional 1.1bn will be added to the population. These new poor are populations that have been expelled from their traditional lands and have migrated to cities for survival, and are the most vulnerable to food price rises.89 They survive on irregular, underpaid work, charity, garbage foraging and crime, and pose a security threat to the rest of population. The expansion in the agricultural frontier is the first cause of land abandonment that is forcing people into unsustainable crowded cities. Agrarian reform seems to be at the bottom of the agendas of governments, which are focused more on reproduction education. The current urbanisation is being caused by the transformation of wild ecosystems and agricultural land into green deserts of commercialised crops.
11.4 Sustainable Agro-fuels Soil and water are becoming increasingly scarce and expensive resources. The use of marginal (non-agricultural) land is adding to this problem because it requires higher water and fertiliser inputs and was previously used for cattle grazing which is being displaced to other areas, further encroaching on the remaining forests.90 The already long shadow of disastrous GHG emitting livestock production is getting longer.91 There is no regulation of land and water use in place.92 Agro-fuel producing countries, many of which have poor human and environmental rights, are trying to battle against restrictive regulations, and fight for voluntary certification. For example, Brazil, the leader in agro-fuel production has signed important agreements with the seed and chemicals corporation, Monsanto.
Second generation biofuels would use cellulose rich vegetal waste or specifically grown crops such as GM trees. This technology will take 5-8 years to become available; it requires bacteria that do not exist in nature, to break down the cellulose in the plant material. It is only GM corporations that are able to create these organisms, which constitute an unprecedented bio hazard. There will be no environmental benefit from investing in this kind of research. We need to tackle global warming without delay. The land
84 http://www.checkbiotech.org/green_News_Biofuels.aspx?Name=biofuels&infoId=14695. 85 http://www.usda.gov/documents/FBP_Release_MASTHEAD_Spa.DOC. 86 http://www.ecoliteracy.org/publications/rsl/dan_imhoff_farm_bill.html. 87 United Nations Population Fund, State of World Population 2007. 88 FORD Foundation – Worldwatch Institute, State of the world 2007: Our urban future. 89Coalition Campaigning to Stop Biofuel Targets, Agrofuels Towards a reality check in nine key areas, 2 July 2007, www.biofuelwatch.org.uk/docs/agrofuels_reality_check.pdf. 90 United Nations, UN-Energy, Sustainable Bioenergy: a framework for decision makers. 91 Food and Agriculture Organization, Livestock’s long shadow, http://www.fao.org/ag/magazine/0612sp1.htm. 92Coalition Campaigning to Stop Biofuel Targets, Agrofuels Towards a reality check in nine key areas, 2 July 2007, www.biofuelwatch.org.uk/docs/agrofuels_reality_check.pdf.
106
requires the input of organic matter and the removal of straws and other waste will result in accelerated reduction in fertility.93
Recycling of cooking oils and fats would provide an opportunity for converting polluting waste into a less GHG polluting fuel. Biofuels produced in this way are being used for public transport in some cities, but this kind of recycling is still very marginal despite being cheaper, easier and safer than reshaping global agriculture, developing new more powerful herbicides, buying bigger agricultural machinery, genetically engineering crops or synthetically creating bacteria to break down cellulose.
Sustainable agro-fuels need to be produced and used locally. Energy sovereignty would ensure partial independence from fuel markets and empower rural communities. Small scale organic production for local consumption would eliminate transport related emissions and balance higher agro-fuel N2O emissions by reducing the demand for nitrogen fertilisers. It would not compete with food production because rural communities would regulate production on the basis of their actual needs, with efficiency being the goal.
11.5 Summary There is a deep contradiction between agro-fuels and biodiversity, the main climate regulator and the basis of ecological resilience. The quality of human life is being destroyed by the loss in biodiversity94. For example, there is a correlation between soy prices and the rate of deforestation in the Amazon,95 where the soil is known to be inadequate for agriculture.96 Nevertheless, there is a project to claim at least 80m ha of forest (an area equivalent to the size of Spain and Italy together) to produce agro-fuels,97 to add to the 200m ha that Brazil currently devotes to energy crops.
The US is the main agro-fuels investor and consumer, and still refuses to sign the Kyoto Protocol. These types of inconsistencies do not offer much hope for climate change mitigation. Soil loss and desertification are advancing at a great rate. Climate change, over-exploitation of aquifers, melting icecaps, irregular precipitation and temperatures, edaphic, climatic and hydro stresses are all adding to erosion of agricultural land.
Agro-fuels are an example of a short-sighted investment. There is no insurance against the consequences of climate change and the exhaustion of resources, such as violent crime, revolts, wars, famine, epidemics, water shortages, climate disasters,98 which will reduce the opportunities for investors to enjoy their revenues.99 We should be directing research to replenishing soils and ecosystems and to redefining our mobility and energy needs. As an evolving civilisation we should be aiming higher than substituting fossil fuels.
93 Carpintero O., Biocombustibles y uso energético de la biomasa, un estudio crítico, El ecologista n. 49, otoño 2006 and Friedman A., Peak Soil: Why Cellulose ethanol and other Biofuels are not Sustainable and a Threat to America's National. Security, Energy Pulse, July 2007, 94 UN, Millennium Ecosystem Assessment, 2005 and IUCN, 2004. www.iucn.org/themes/ssc/red_list_2004/Extinction_media_brief_2004.pdf. 95 Coalition Campaigning to Stop Biofuel Targets, quoted paper. 96 Brazilian President Lula, L.I., Our Biofuels Partnership, The Washington Post, Friday, March 30, 2007. http://www.washingtonpost.com/wp-dyn/content/article/2007/03/29/AR2007032902019.html. 97 http://www.biodieselspain.com/2007/02/19/selva-amazonica-sera-la-arabia-saudita-del-biodiesel/. 98 United Nations, Millennium Ecosystem Assessment, 2005. 99 CIS Cooperative Insurance, Sustainability of biofuels – Risks and Opportunities – Responsible Shareholding, www.cis.co.uk.
107
12. Policy and regulatory framework promoting RES This chapter examines the necessity for African countries to create a policy and regulatory framework that enhances the possibilities of access to and efficient use of RET and exploiting RES in order to improve the standards of living of their citizens. We outline the current problems related to RES in many African countries and propose reasons for the development of RES and renewable technologies for socio-economic development. We suggest a methodology for increasing the success of technology transfer (TT) related to RET and present a future scenario related to RES, which includes a series of guidelines for policy-makers in African countries to help with the creation of national policies in the area of RES and technologies. 12.1 Current energy related problems facing African countries Most of the policies related to the support, use and exploitation of renewal energy sources in Africa are rooted in the energy crisis in the 1970s, after which time, efforts to develop RET were greatly reduced. With the exception of South Africa, none of the African countries have sound renewable energy policies. Most do not have policies related to RET and those that do exist are inadequate and outdated. There are very small budgets to develop or to acquire these technologies or to exploit the resources related to renewable energy. There is still a very established way to invest in mature technologies related to oil production and electricity generation, but few investors are willing to invest in RET. African energy and renewal energy sources problems seem to be mainly explained by the following factors: Poor institutional framework Most African countries have no institutional framework or set of institutions that allows them to exploit and use RES and technologies to overcome their problems. Inadequate planning There is a lack of planning related to RES and technologies with the very short-term dominating any decisions in the renewables area. There is a lack of coordination with other institutions within and outside the country in order to work on plans that benefit populations. Lack of co-ordination among stakeholders There is a lack of co-ordination among the stakeholders involved in promoting the development, exploitation and use of RES and technologies. The private sector generally invests in infrastructure to provide energy (electricity) based on grids (serving large, populated areas), and ignores the need to exploit other sources of energy and invest in the technologies that would allow it to exploit these sources of energy, initially in less populated areas. Governments have been unable to establish standards, strategies and policies to guide the private sector. The NGOs dedicated to the promotion of alternative sources of energy are not following any local or national strategy to make this effort effective. Lack of linkage to renewable energy programmes Most African countries have enormous problems to relate different programmes, policies, institutions (locally and internationally) to deal with the use of RES and technologies.
108
Price distortions The use and exploitation of some products derived from RES do not have fixed international prices. Calculations are generally based on comparison with the price of oil (IEA, 2007). The Brazilians and Americans have established prices; there can be no competition until there are more producers. Weak technology diffusion strategies Most African countries (with the exception of South Africa and Kenya) have no science and technology policy to guide their efforts in various sectors, including renewable technologies. Without this it will be difficult for these countries to plan how to exploit resources. They will be dependent on the experience of the developed countries. Lack of human capital African countries are characterised by a lack of human resources to manage, develop and upgrade technologies acquired from abroad or developed nationally. There are some examples of TT projects in Africa that have not been carried out for the foreign company, government or NGO due to the lack of human capital that sets the technology, Renewable energy projects are not the exception. The African countries lose their qualified human capital to overseas countries where there are better work opportunities and greater socio-economic stability. High initial investments and sunk costs that reduce capacity to change technology New technologies have high investment costs, which are paid for by the country purchasing the technology, which is generally a deterrent to the purchase of these technologies by countries in Africa, although in the long term these costs will diminish. Generally, though, African countries do not have sunk costs, as most have no previous RET. Solar technology has undergone changes since the mid 1990s; the developed countries have paid the costs of several technology generations. Poor RES and technologies information base The availability of reliable and up to date information on the use and development of technology is important for decision making. In sub-Saharan countries in particular, there is an absence of data banks on RES and technology application in different areas, policy frameworks, best technologies (benchmarked), providers of technologies, costs, methods of payments and schemes for technology acquisition. This means that less than efficient decisions are taken, e.g. investment in an obsolete technology. Low maintenance capacity The development of a technology or set of technologies involves maintenance in order for it to work efficiently and remain up to date. However, this can only be achieved if there is a certain starting level of the technology. The foreign provider of the technology must provide clear instructions about how technicians can repair, maintain and upgrade any technology purchased. Failed TT is a common problem in developing countries. African countries need a policy or a set of guidelines to guide the efforts of various stakeholders related to the exploitation of RES and development of future technologies. According to the World Energy Outlook (2006), the threat to the world’s energy security is real and growing and rising oil and gas demand, if unchecked, will accentuate the consuming countries’ vulnerability to a severe supply disruption and resulting price shocks.
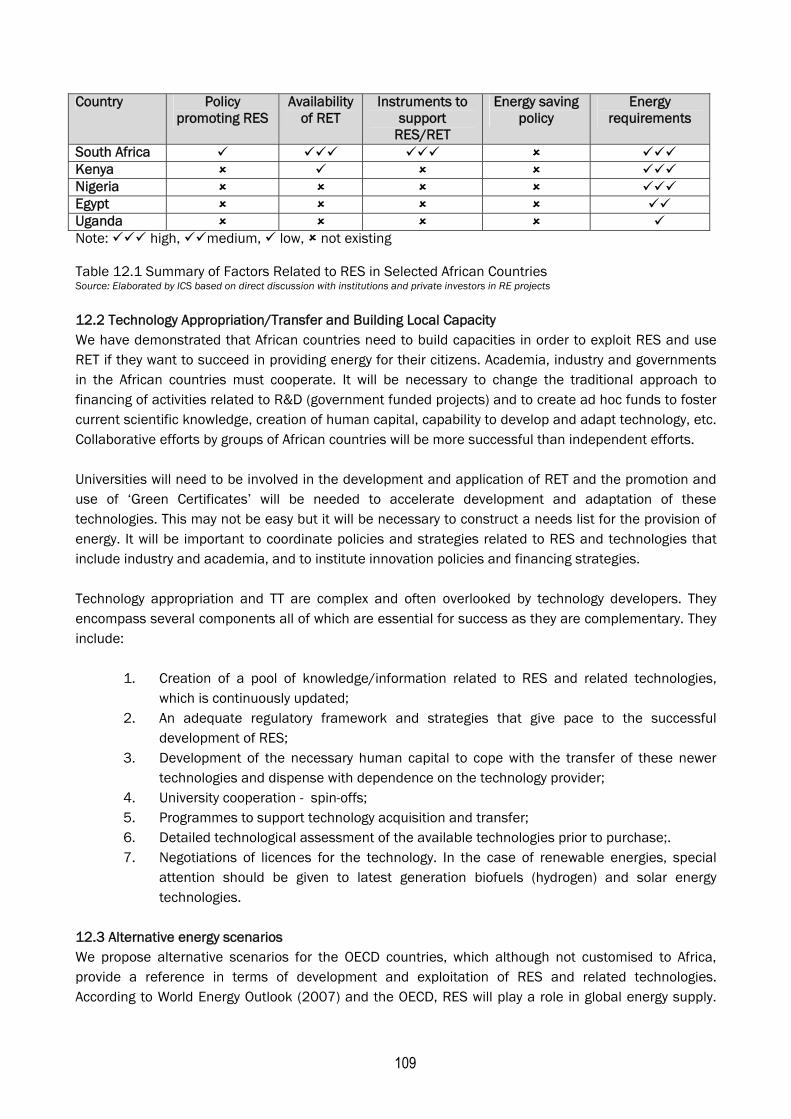
109
Country Policy promoting RES
Availability of RET
Instruments to support
RES/RET
Energy saving policy
Energy requirements
South Africa Kenya Nigeria Egypt Uganda Note: high, medium, low, not existing Table 12.1 Summary of Factors Related to RES in Selected African Countries Source: Elaborated by ICS based on direct discussion with institutions and private investors in RE projects 12.2 Technology Appropriation/Transfer and Building Local Capacity We have demonstrated that African countries need to build capacities in order to exploit RES and use RET if they want to succeed in providing energy for their citizens. Academia, industry and governments in the African countries must cooperate. It will be necessary to change the traditional approach to financing of activities related to R&D (government funded projects) and to create ad hoc funds to foster current scientific knowledge, creation of human capital, capability to develop and adapt technology, etc. Collaborative efforts by groups of African countries will be more successful than independent efforts. Universities will need to be involved in the development and application of RET and the promotion and use of ‘Green Certificates’ will be needed to accelerate development and adaptation of these technologies. This may not be easy but it will be necessary to construct a needs list for the provision of energy. It will be important to coordinate policies and strategies related to RES and technologies that include industry and academia, and to institute innovation policies and financing strategies. Technology appropriation and TT are complex and often overlooked by technology developers. They encompass several components all of which are essential for success as they are complementary. They include:
1. Creation of a pool of knowledge/information related to RES and related technologies, which is continuously updated;
2. An adequate regulatory framework and strategies that give pace to the successful development of RES;
3. Development of the necessary human capital to cope with the transfer of these newer technologies and dispense with dependence on the technology provider;
4. University cooperation - spin-offs; 5. Programmes to support technology acquisition and transfer; 6. Detailed technological assessment of the available technologies prior to purchase;. 7. Negotiations of licences for the technology. In the case of renewable energies, special
attention should be given to latest generation biofuels (hydrogen) and solar energy technologies.
12.3 Alternative energy scenarios We propose alternative scenarios for the OECD countries, which although not customised to Africa, provide a reference in terms of development and exploitation of RES and related technologies. According to World Energy Outlook (2007) and the OECD, RES will play a role in global energy supply.
110
The following scenarios show how the global energy market could evolve if countries around the world were to adopt and implement a certain set of policies and measures. 1. Short term scenario (five years) This scenario is based on Karekezi et al. (2007) and the OECD. Specific recommendations for the African countries with relation to the use of RES and technologies are noted; Scenarios 2 to 4 focus on the OECD countries.
• The large scale energy sector (above 100MW) requires RES that are full cost-competitive options, such as geothermal power, co-generation, medium scale hydro and, in a few countries, particularly Northern and Southern coastal Africa, large scale wind power.
• For medium scale energy applications (under 50MW) promote RES aimed at income generating
activities in the agro/forest industrial sector such co-generation and small hydro.
• For small-scale applications (below 5MW capacity) focus on solar water heaters, wind pumps and solar PVs for remote and rural institutions such as dispensaries, mission hospitals and schools, and commercial wildlife and coastal tourism enterprises.
• At household level (below 1KW equivalent capacity) focus on non-electricity RES such as
improved biofuels for cooking stoves that deliver major cost savings and reduce indoor air pollution.
Simple and low-cost regulatory measures100 could provide an important policy/regulatory platform for promoting RES.101 Africa has a large number of poor people reliant on agriculture;102 the priority must therefore be on the use of existing agricultural wastes for energy generation, which could have a positive impact and provide additional revenues for rural communities. It will require effective revenue-sharing mechanisms that ensure that the higher revenues obtained from this exploitation of agricultural wastes is shared in an equitable fashion among stakeholders, including low-income farmers, and populations. It will require the creation of a legal and regulatory framework that allows the development of modern agro-waste based bio-energy processes. The pattern of investment in energy supply, currently focuses on the major providers of electricity in Africa, which are investing in large grid developments but doing little to invest in technologies that would help small rural communities. 2. Middle-term scenario (up to 10 years)
• A continuous pattern of increased investment can be observed in several developed countries that have invested moderately in renewable technologies.
• There will be an increase in the number of suppliers providing energy based on RES, especially SMEs.
100 Refer to the German feed-in Law at http://www.solarbuzz.com/FastFactsGermany.htm. 101 Refer to the ICS publication: Support Systems in favour of Renewable Energy: overview of EU models and experience’ 2007. 102 Currently 2.5bn people use fuel-wood, charcoal, agricultural waste and animal dung to meet most of their daily energy needs for cooking and heating. In many countries, these resources account for over 90% of total household energy consumption.
111
• Several clear strategies for energy efficiency at all levels in the economy will be established in many countries.
• Most of the regulatory and legal frameworks related to the use of RES and technologies will be created in this period.
• Several countries will have made an assessment of which technologies produce better outcomes with respect to different geographical areas and resources. For instance, in the case of Mexico, it has been identified that solar and wind energy will be a better option in the Northern part of the country, and hydro and thermal electricity plants in the Southern States.
• The number of people using biomass103 will increases to 2.6bn by 2015 and to 2.7bn by 2030 as population increases. That is, one-third of the world’s population will be relying on this type of fuel, a share roughly the same as currently. There are still 1.6bn people in the world living without electricity. To achieve the MDG, this number needs to fall to less than 1bn by 2015.
3. Long-term scenario (10 to 25 years) Renewable energy will contribute significantly towards achieving:
• reductions in CO2 emissions and improved security of energy supply; • share of RES use in global energy consumption unchanged at 14%. Traditional biomass
currently accounts for 7% of world energy demand, but its share will fall as developing countries shift to modern forms of energy. World hydropower production will grow by 1.8% per year and its share will remain stable at around 2%.
• increased shares of other RES (including geothermal, solar and wind) at the rate of 6.2% per year; due to the very low starting base (0.5% share in 2003) they will still be the smallest component of renewable energy in 2030 with a share of only 1.7% of global energy demand.
4. Extra long-term scenario (35-40 years) Based on the IEA104 Accelerated Technology (ACT) (2007) this scenario105 focuses on currently existing technologies or technologies likely to become commercially available in future decades. The results of the ACT scenarios illustrate the impact of a wide range of policies and measures that would overcome barriers to the adoption of these technologies. In addition to the ACT scenarios, an optimistic assumption about the rate at which certain technological barriers will be overcome is part of this scenario. The scenarios presented assume the same set of core efforts and policies, varying only in that they assume different rates of progress in overcoming technological barriers, achieving cost reductions and winning public acceptance for the technology.
These scenarios for the OECD countries provide some perspective of how other countries are expected or not to develop with regard to the use of RES and technologies. Even for the OECD countries these scenarios are not favourable to RES substituting for fossil based fuels. It seems likely that in Africa the trend will continue towards biomass based fuels. However, breakthrough technologies could change these scenarios.
103 The inefficient and unsustainable use of biomass has severe consequences for health, the environment and economic development. About 1.3m people – mostly women and children – die prematurely each year because of exposure to indoor air pollution from biomass. There is evidence that, in countries where local prices have adjusted to recent high international energy prices, the shift to cleaner, more efficient ways of cooking has actually slowed and even reversed this trend 104 The ACT scenarios, assume policies and measures that would lead to the adoption of low-carbon technologies at a cost of up to US$25/t of CO2. The ACT scenarios are based on incentives being in place from 2030 in all countries, including developing countries. These incentives could take many forms − i.e. regulation, pricing, tax breaks, voluntary programmes, subsidies, trading schemes. 105 Scenarios investigate the potential of energy technologies and best practices aimed at reducing energy demand and emissions, and diversifying energy sources.
112
Conclusions The development of biofuels in Africa could bring multiple benefits such as: increased energy supply security through diversification and progressive substitution of oil; reduced national oil importation bills; increased agricultural productivity through the use of agricultural residues and waste in productive processes; increased employment opportunities in agriculture, industry, infrastructure and research in both rural and urban areas; and reduced polluting emissions, including GHG. Furthermore, Africa could take advantage of potential international trade opportunities in the case that biofuels are produced on a large scale using appropriate technologies. However, there are legitimate concerns that the production of biofuels could compromise food production either as a result of competition for existing land or because of economic feedbacks. There are also significant chances that small-scale farmers could be squeezed out of their land by powerful large companies and production for export rather than the local market. It will be necessary to consider production of biofuels in a holistic manner identifying the most suitable renewable source, technology and type of biofuel for local conditions and social, economic and environmental situations.
The most urgent issues at the local level to ensure sustainability of bioenergy production in developing countries in general and in Africa in specific are: • Create policy support for small producers and cooperatives in terms of financial incentives such
as access to credit, tax benefits, and greater use of the CDM. Create policy support to facilitate sustainable international biofuel trade and guarantee access to it.
• Develop economies of scale in order to control the production costs of the industry in the future. The need to match social and environmental benefits with the achievement of these economies of scale means that action needs to be taken to organise small producers into cooperatives.
• Support access to technology and improve investment in R&D in countries that have just started to produce bioenergy. Transfer technology from countries already exporting bioenergy. Technologies for sugarcane based on bioethanol and oil seed-based biodiesel are already well developed. Technologies for other types of feedstocks, such as Jatropha, require further development. Policies are needed to expedite transit to the second generation of feedstock and technologies that will enable dramatically increased production at lower cost, while reducing negative environmental impact. Bioenergy related TT will be an interesting trial for more ambitious South-South cooperation.
• Corporate social responsibility goals: Fostering a clear and commonly valued certification scheme including a criteria and indicators system for the sustainability of bio energy production and trade. This scheme should include all levels of sustainable development (environmental, social and economic) through an integrated analysis of a broad spectrum of sectors (agriculture, forestry, energy and trade) in all production and trade chains in order to improve societal well being in terms of better environmental performance, higher social standards (e.g. standard minimum working conditions, human rights, gender equity) and economic development in an ethical and sustainable way (e.g. creating opportunities for economically disadvantaged producers, improving transparency and accountability, creating trade relationships). There are several existing certification systems referring to different forms of farming, i.e. organic, integrated or good practice production (Lewandowski, 2004).
• Promote participatory decision making. Involve all rural people and stakeholders in planning and decision-making to achieve sustainable energy development. Special attention should be devoted to involving women who bear the burden of traditional energy systems and are likely to be the
113
greatest beneficiaries of improved systems. More active involvement of rural people and their institutions in identifying rural energy problems, and in formulating and implementing plans to overcome them, would result in more efficient, rational use of resources and more equitable sharing of the benefits of development.
• Implementation of land-use policies to prevent negative impacts from land-use change (e.g. by controlling access to and use of high-nature-value areas and habitats, cultural sites, etc.). Bioenergy production should be concentrated on available arable land. Land use policy should restrict bioenergy crop development to areas that are not being competed over for other uses.
Biofuels are not the only solution to energy security in Africa. All solutions should be evaluated bearing in mind the local economic, social, environmental and technical conditions. It is also important to note that without a detailed examination of the technologies available to exploit RES, solutions may be very short term whereas the efficient use of RES is associated with the provision of sustainable solutions for the middle to long-term.
114
References Alakangasa, E. et al. (2006), CEN technical specification for solid biofuels—Fuel specification and classes, Biomass and Bio-energy, Vol. 30, pp. 908–914. Albertazzi S. et al. (2005), The technical feasibility of biomass gasification for hydrogen production, Catalysis Today, 106 (2005) 297-300. Bain R.L. et al (2005), Evaluation of catalyst deactivation during catalytic steam reforming of biomass-derived syngas, Industrial and Engineering Chemistry Research, 44 (2005) 7945-7956. Biofuelwatch, (2007), Report by, Biofuels Threaten to Accelerate Global Warming, http://www.biofuelwatch.org.uk/docs/biofuels-accelerate-climate-change.pdf , April Boff L., (2004), Ecologia: Grito da Terra, grito dos pobres, ed. Sextante Bocci, E, Marcelo D., Di Carlo A., (2007) Power plant perspectives for sugarcane mills, proceedings of International 4th Dubrovnik conference on sustainable development of energy water and environment systems,. ------------, Zuccari F., Electricity from renewables energy sources: The potentiality of Italy (Elettricità da fonti energetiche rinnovabili: Le potenzialità dell’Italia), La Termotecnica, Vol. 1, pp. 81-87, 2004, (in Italian). ------------, F. Orecchini (2007), ‘Biomass to Hydrogen for the realization of closed cycles of energy resources’, Energy, pp. 1006–1011, Volume 32, Number 6, June, ISSN 0360-5442 ------------, (2003), Biomass Integrated Gasification and Fuel Cells power plant, (Impianti di potenza a gassificazione da biomassa e celle a combustibile a carbonati fusi), PhD Thesis, Mechanical Department, University of Rome La Sapienza, 2005, (in Italian). Bridgwater A.V., (2003), Renewable fuels and chemicals by thermal processing of biomass, Chemical Engineering Journal 91 87-102. Brown L.R., (2007) Massive diversion of U.S. grain to fuel cars is raising world food prices, April http://www.earth-policy.org/Updates/2007/Update65.htm Caballero M.A., J. Corella, M.P. Aznar, J. Gil J, (2000), Biomass gasification with air in fluidized bed. Hot gas clean-up with selected commercial and full-size nickel-based catalysts, Industrial and Engineering Chemistry Research, 39 1143-1154. Carella, A. (2001), The future of European geothermal energy, Renewable Energy, Vol. 24,. Carpintero O. (2006), Biocombustibles y uso energético de la biomasa, un estudio crítico, El ecologista n. 49, otoño. CEN/TS 14588 (2003), E, Solid biofuels—Terminology, definitions and descriptions, European Standardisation Committee (CEN), 2003. ---------- 14961: (2005), E, Solid biofuels—Fuel Specification and Classes, CEN, 2005. ---------- 15234: (2006), Solid biofuels— February Fuel Quality Assurance, CEN, 2006. Coalition Campaigning to Stop Biofuel Targets, (2007), Agrofuels Towards a reality check in nine key areas, 2 July , www.biofuelwatch.org.uk/docs/agrofuels_reality_check.pdf
115
COM (2006), An EU Strategy for Biofuels http://ec.europa.eu/agriculture/biomass/biofuel/com2006_34_en.pdf ------ (2006) Biofuels Progress Report Report on the progress made in the use of biofuels and other renewable fuels in the Member States of the European Union, 845, ------ (2006), Renewable Energy Road Map final Renewable energies in the 21st century: building a more sustainable future, http://ec.europa.eu/energy/energy_policy/doc/03_renewable_energy_roadmap_en.pdf, 848 Courson C., C. Petit, A. Kiennemann, P.U. Foscolo, S. Rapagnà, D. Matera, (2001), ‘Catalyseur pour la gazéification de la biomasse en lit fluidisé, procédé d'obtention et utilisations d'un tel catalyseur’, European Patent No. PCT/FR01/01547, May 18. Department Of Energy of USA, (2000), Determining the cost of producing ethanol from corn starch and lignocellu-losic feedstocks, NREL/TP-580-28893,. Department of Minerals and Energy of South Africa (2004), White Paper on the Renewable Energy Policy of the Republic of South Africa, November. De Diego L.F., A. Abad, F. Garzia-Labiano, J. Adanez, P. Gayan, (2004), Simultaneous calcination and sulphidation of Calcium-based sorbents, Industrial and Engineering and Chemistry Research, 42, 3261–3269. Domac J. and Segon V. (2005), Task29: Socio-economic drivers in implementing bio-energy projects, Technology Report ‘Bio-energy and Job Generation’ http://www.valbiom.be/uploadPDF/SOCIOECONOMIC_DRIVERS_IN_IMPLEMENTING_BIO-ENERGY_PROJECTS.pdf ------------, K. Richards and S. Risovic (2005), Socio-economic drivers in implementing bio-energy projects, Biomass and Bio-energy, Volume 28, Issue 2, February 2005, Pages 97- 106 Dornburg V. (2007), Sustainable International Bio-energy Markets, Copernicus Institute, Utrecht University, The Netherlands presentation to COMPETE meeting, Mauritius. http://www.compete-bioafrica.net/events/events2/presentations_mauritius/first_workshop/S3-3-Dornburg-Compete-overviewT40.pdf Dufey A., (2006), Biofuels production, trade and sustainable development: emerging issues, International Institute for Environment and Development, London. http://www.iied.org/pubs/pdf/full/15504IIED.pdf ECLAC (2004), Renewable Energy Sources in Latin America and the Caribbean. Situation and Policy Proposals, Chile. --------- (2003), Renewable Energy and Energy Efficiency in Latin America and the Caribbean: constraints and prospects, Chile ENEA (2001), Solar thermal energy production: guidelines and future programmes of ENEA. Euromot (2006), Biomass, Renewable Fuel, Peak Oil and the End of Cheap Energy?, Germany. European Commission (2006) World Energy Technology Outlook 2006 (DGRTD), http://ec.europa.eu/research/energy/pdf/weto-h2_en.pdf, WETO. ------------------------------------ (2004), Promoting biofuels in Europe.
116
------------------------------------ (2007), Energy Policy For Europe, http://Eur-lex.europa.eu/LexUriServ/site/it/com/2007/com2007_0001it01.pdf ------------------------------------ (2005), Directorate-General for Research, Biomass ‘Green energy for Europe’. ------------------------------------ (EC), (2004), Promoting Biofuels in Europe. EC, Directorate-General for Research, (2005), Biomass ‘Green energy for Europe’, EEA (European Environment Agency) (2006), How much bio-energy can Europe produce without harming the environment? Copenhagen – http://reports. eea.europa.eu/eea_report_2006_7/en/eea_report_7_2006.pdf Faaij, A.P.C. and J. Domac, (2006), Emerging international bio-energy markets and opportunities for socio-economic development, Energy for Sustainable Development, 2006, Vol. X(1), pp. 7-19. (NWS-E-2006-33) Food and Agriculture Organisation, (2007), ‘Food Outlook (Global Market Analysis)’ No. 1, June, http://www.fao.org/docrep/010/ah864e/ah864e00.htm ------ (2006a), Introducing the International Bio-energy Platform (IBEP); Rome – www.fao.org/docrep/fao/009/A0469E/A0469E00.pdf ------ (2006b), The State of Food Insecurity in the World; Rome ------ (2003), World agriculture: towards 2015/2030. An FAO perspective; Rome – www. fao.org/docrep/005/y4252e/y4252e00.htm ------ (1999), Background Paper 2: Bio-energy, Netherlands Conference on the Multifunctional Character of Agriculture and Land http://www.fao.org/mfcal/pdf/bp_2_bio.pdf Federal Ministry of Food, Agriculture and Consumer Protection-Germany (2006), Zusammenfassung der internationalen Konferenz: Kraftstoffe aus nachwachsenden Rohstoffen – Globale Potenziale und Implikationen für eine nachhaltige Landwirtschaft und Energieversorgung im 21. Jahrhundert 16-17 May 2006, Berlin. Foscolo P.U., A. Germanà, N. Jand, S. Rapagnà, Design and cold model testing of a biomass gasifier consisting of two interconnected fluidized beds, Powder Technology, (2007a) in press. Hofbauer H., H. Knoef, Success stories in biomass gasification, in ‘Handbook biomass gasification’, BTG (2005) 115-161. Friedman, A. (2007), Peak Soil: Why Cellulose ethanol and other Biofuels are not Sustainable and a Threat to America's National. Security, Energy Pulse, July, http://www.energypulse.net/centers/topics/article_list_topic.cfm?wt_id=46 Fritsche and K. Hunecke (2006), Sustainability standards for bio-energy. Darmstadt, Oko institut, commissioned by WWF Germany. Global Subsidies (2006), Biofuels – At What Cost? Government support for ethanol and bio-diesel in the United States, October, available at http://www.globalsubsidies.org GAIN (2007), EU-27 Bio-Fuels Annual 2007 http://www.fas.usda.gov/gainfiles/200706/146291509.pdf
117
HRVE, CBC, (2006), El fujo del aceite de Palma Colombia-Belgica/Europa acercamiento desde una perspectiva de derechos humanos, http://www.hrev.org/hrev/media/archivos/flujoPalma/informe_es.pdf, November Hunt, S. (2006), Potential challenges and risks of bio-energy production for developing countries, http://www.rural-development.de/fileadmin/rural-development/volltexte/2006/06/ELR_dt_12-15.pdf IEA (2007), Biofuels for Transport. An International Perspective, OECD:France. ---- (2007), Renewables in Global Energy Supply. An IEA Fact Sheet, OECD, France. ---- (2007), IEA Bio-energy. Annual Report, France. ---- (2006), World Energy Outlook 2006. France. ---- (2005), World Energy Outlook 2005. Middle East and North Africa Insights. France. ---- (2005), Renewables Information Service, Edition 2005: France. ---- (2005), Renewable Energy: Rd&D Priorities1, Renewable Energy Unit, Energy Technology Collaboration Division, Energy Prices and Taxes ---- (2005), Benefits of Bio-energy, Bio-energy Position Paper http://www.ieabio-energy.com/library/179_BenefitsofBio-energy.pdf ---- (2003), Potential for Building Integrated Photo-voltaics. ----- (2003), Key world energy statistics 2003, International Energy Agency, Energy Statistics Division, Paris, France, p.78. ---- (2000), Hydropower and the World’s Energy Future, United Nations Industrial Development Organization (UNIDO) Intergovernmental Panel on Climate Change (IPCC), (2007), Climate Change 2007, www.ipccc.ch. International Solar Energy Society (ISES), (1996), Renewable Energy state of art (Stato dell’arte delle fonti energetiche nuove e rinnovabili), in Italian. International Water Management Institute (2007), Water for Food, Water for Life: A Comprehensive Assessment of Water Management, http://www.iwmi.cgiar.org/Press/coverage/pdf/Biofuel%20crops%20could%20drain%20developing%20world%20dry%20-%20SciDevNet.pdf IISD (2006), Sixth Meeting Of The Global Forum On Sustainable Energy: ‘Africa is Energizing Itself. Global Forum on Sustainable Energy Bulletin Italian Energy and Environment Agency (ENEA), 2006 Energy and Environment Report (Rapporto Energia e Ambiente), 2007, in Italian. James C. P. Chen, (2007), Cane sugar handbook, A manual for cane sugar manufactures and their chemists, 11th edition, 1997.Karekezi, S., Renewables in Africa, Paper prepared for the Institut de l’energie et de l’environment de la Francophonie (IEPF). ---------------- and Withyoma, W. (2003), Renewable Energy in Africa: Prospects and Limits. The Workshop for African Energy Experts on Operationalizing the NEPAD Energy Initiative, Senegal.
118
Kramer J. M., (2002), Agricultural Biogas Casebook, Resources strategies,. Lewandowski and Faaij (2005). ‘Steps towards the development of a certification system for sustainable bio-energy trade.’ Biomass & Bio-energy 30: 83-106. Lula L.I., (2007), Our Biofuels Partnership, The Washington Post, Friday, March 30,. http://www.washingtonpost.com/wp-dyn/content/article/2007/03/29/ AR2007032902019.html Lymberopoulos, N. (2005), Fuel cells and their application in bio-energy, Project Technical Assistant Framework Contract (EESD Contract No: NNE5-PTA-2002-003/1) February. Lymberopoulos N., (2005), Hydrogen production from renewables, Project Technical Assistant Framework Contract (EESD Contract No: NNE5-PTA-2002-003/1), September Lymberopoulos, N. (2004), Microturbines and their application in bio-energy, , Project Technical Assistant Framework Contract (EESD Contract No: NNE5-PTA-2002-003/1), January Macedo I, Lima Verde M and Azevedo J. (2004) Assessment of greenhouse gas emissions in the production and use of fuel ethanol in Brazil Government of the State of Sao Paulo and Secretariat of the Environment. http://www.unica.com.br/i_pages/files/pdf_ingles.pdf McKendry P. Energy production from biomass (part 2): conversion technologies. Bioresource Technology 2002;83(1): 47–54. Madlener, R., Myles, H. (2000). Modelling Socio-Economic Aspects of Bio-energy Systems: A survey prepared for IEA Bio-energy Task 29, September (available at: www.iea-bio-energy-task29.hr/Task29/ pdf/models.pdf). Martin Kaltschmitt, Michael Weber, (2006), Markets for solid biofuels within the EU-15, Biomass and Bio-energy, vol. 30, pp. 897–907. Monbiot G. (2007), If we want to save the planet, we need a five-year freeze on biofuels, Oil produced from plants sets up competition for food between cars and people. People - and the environment - will lose, Tuesday March 27, The Guardian http://www.guardian.co.uk/commentisfree/story/0,,2043724,00.html?-session=pp_sc:BE011B8009cab238EBxqV39778B4 Murano A., (2006), Cosecha roja, el costado criminal del boom sojero, veintitres, 23-11-2006, pp. 20-26 United Nations, Millennium Ecosystem Assessment, 2005. Official Declaration of Chake Ñuhá on the Agro-fuels and Environmental Services Traps (2007), Asunción, Paraguay, 24 April 2007; We want Food Sovereignty Not Biofuels, signed by Alert Against the Green Desert Network, Latin American Network against Monoculture Tree Plantations, Network for a GM free Latin America, Oil Watch South America and World Rainforest Movement, January. www.wrm.org.uy/subjects/biofuels/EU_declaration.html Orecchini F., Bocci E., Di Carlo A. (2007), Process simulation of a neutral emission plant using chestnut’s coppice gasification and molten carbonated fuel cell, Journal of Fuel Cell Science and Technology, 2007. ---------------- (2004), Hydrogen from renewables energy sources: The potentiality of Italy (Idrogeno da fonti energetiche rinnovabili: Le potenzialità dell’Italia), La Termotecnica, Vol. 4, pp. 47-51, in Italian.
119
Project Group ‘Sustainable Production of Biomass’, (2007), Final Report, Testing Framework for Sustainable Biomass, http://www.lowcvp.org.uk/assets/reports/070427-Cramer-FinalReport_EN.pdf Runge F., Senauer B. (2004), How biofuels could starve the poor, Foreign Affairs, May/June 2007,http://www.foreignaffairs.org/20070501faessay86305-p20/c-ford-runge-benjamin-senauer/how-biofuels-could-starve-the-poor.htmlSpazzafumo G., Production and use of biofuels: state of art, (stato dell’arte sulla produzione ed utilizzo di biocombustibili), APAT, in italian. Smeets, E. and A. Faaij (2007). Bio-energy potentials from forestry in 2050. An assessment of the drivers that determine the potential. Climatic Change -------------- (2006), Sustainability of Brazilian bio-ethanol, Report NWS-E-2006-110, ISBN 90-8672-012-9, Utrecht University www.bio-energytrade.org/downloads/sustainabilityofbrazilianbio-ethanol.pdf -------------- and A.P.C. Faaij (2006), Bio-energy potentials from forestry to 2050, Climatic Change, Vol. 38 pp. (NWS-E-2006-282) Spazzafumo G., (2004), Production and use of biofuels: state of art, (stato dell’arte sulla produzione ed utilizzo di biocombustibili), APAT, (in Italian). Stern (2007), Stern Review on the Economics of Climate Change, www.hm-tresaury.gv.uk/indipendent_reviews/stern_report.cfm. Sugrue A., Douthwaite R. (2007), Biofuel production and the threat to South Africa's food security, Wahenga.brief num. 11, http//www.wahenga.net Tauli-Corpuz V., Tamang P., (2007), Oil Palm and Other Commercial Tree Plantations, Monocropping: Impacts on Indigenous Peoples’ Land Tenure and Resource Management Systems and Livelihoods, , report to the United Nations Permanent Forum on Indigenous Issues, May, http://www.un.org/esa/socdev/unpfii/documents/6session_crp6.doc The Economist (2007), Cleaning up. A special report on business and climate change, June. Turkenburg, W. C.: (2000), Renewable energy technologies. World Energy Assessment. J. Goldemberg, UNPD, Washington, D.C., U.S.A., 220-72. UN-Energy FAO (2007), Sustainable Bio-energy. A Framework for Decision Makers. UNCTAD (2006). The emerging biofuels market: regulatory, trade and development implications. Geneva, United Nations Conference on Trade and Development http://r0.unctad.org/ghg/download/publications/UNCTAD_DITC_TED_2006_4.pdf ------------ (2006), Challenges And Opportunities For Developing Countries In Producing Biofuels, Geneva. UNDP (2007), A Review of Energy in National MDG Reports, NYC. -------- UNDESA-WEC (2004), World Energy Assessment, 2000 and update. -------- (2002), Human Development Report 2002, New York, United Nations Development Programme and Oxford University Press http://ec.europa.eu/agriculture/biomass/biofuel/com2006_34_en.pdf -------- (2007), Mainstreaming Access to Energy Services: Experiences from Three African Regional Economic Communities, NYC. -------- (2007), Energy Costing Tool for Use in Costing MDG-based National Energy Needs. User Guide, Version 1.0. NYC. (includes software) -------- (2005), Energy for Sustainable Development. A Policy Agenda, NYC.
120
-------- (2005), Energy Services for the Millennium Development Goals, NYC. -------- (2005), Scaling up Modern Energy Services in East Africa. To alleviate poverty and Meet the Millennium Development Goals, NYC. -------- (2005), Energizing the Millennium Development Goals. A Guide to Energy’s Role in Reducing Poverty, NYC. -------- (2005), Poverty and Climate Change. Reducing the Vulnerability of the Poor through Adaptation -------- (2004), Gender and Energy for Sustainable Development: A Toolkit and Resource Guide, NYC. US Department of Energy (2006), Biomass Entry Data Book, Edition 1, Energy Efficiency and Renewable Energy. ---------------------------------- (2005), Multi-year Program Plan 2007-2012, Office of the Biomass Program, Energy Efficiency and Renewable Energy, August. World Bank, (2005), World Bank Group Progress on Renewable Energy and Energy Efficiency: 1990–2004 World Energy Council (2007), 2007 Global Energy Survey, ---------------------------- (2006), Energy Efficiencies, Pipe Dream or reality? World Wide Found (WWF) (2006), The Living Planet Report.

INTERNATIONAL CENTRE FOR SCIENCE AND HIGH TECHNOLOGY