remote islands are vulnerable to non-indigenous species
TRANSCRIPT

Remote islands are vulnerable to non-indigenous
species: utilization of data analytics to investigate
potential modes of introduction and pest
interceptions
Barbara Kachigunda
This thesis is presented for the degree of
Doctor of Philosophy
College of Science, Health, Engineering and Education and Harry Butler Institute, Murdoch University
Perth, Western Australia Australia

i
DECLARATION
I declare that this thesis is my own account of my research and contains as its main
content work which has not been previously submitted for a degree at any tertiary
educational institution.
Barbara Kachigunda 10 August 2020
A note on formatting and style.
This thesis comprises submitted manuscripts, each of which represents a chapter.
This thesis has continuous pagination.
Barbara Kachigunda
ii
STATEMENT OF CONTRIBUTIONS
The ideas, development and writing up of all the chapters in the thesis were the principal
responsibility of myself, working within the Harry Butler Institute and the College of Science,
Health, Engineering and Education under the supervision of Professor Simon McKirdy (Murdoch
University), Dr. Grey Coupland (Murdoch University), Professor Kerrie Mengersen (University
of Queensland), Dr. Devindri Perera (Murdoch University) and Mr. Johann van der Merwe
(Chevron, Australia Pvt Ltd).
The inclusion of co-authors acknowledges active collaboration in the final outcomes.
Privacy and confidentiality clause
Data is part of Chevron's on-going project. Chevron has the right on how the data and output should
be used subsequently.

iii
ACKNOWLEDGEMENTS
I am sincerely grateful to my principal supervisor Professor Simon McKirdy for accepting to
mentor me and put together a team of expert supervisors who provided me with individual specific
expert advice to make my research complete. Professor Kerrie Mengersen (Queensland University
of Technology) and Dr. Devindri Perera (Murdoch University) for their statistical and
programming expertise and Mr Johann van der Merwe (Chevron, Australia, Pty Ltd) for providing
the opportunity to work with a real-life data set and contextualizing the data into scientific
hypotheses content. Dr Grey Coupland walked with me both academically and as a mentor, more
than her call of duty to ensure my success. She provided me with encouragement, inspiration,
feedback and sometimes stretched me beyond what I thought I was capable of, all for my
betterment. She always reminded me to live and enjoy the moment. Professor McKirdy and Dr.
Coupland opened opportunities for me, quietly gave me wings to fly and for that I am grateful,
you made me a better person.
I will forever be indebted to my family and friends who have supported me through this journey
culminating in this PhD thesis. They inspired me and stood by me when times were tough, and
always spurred me to do my best. Thank you.
Special mention and acknowledgement of Professor Shashi Sharma for opening the opportunity to
do this programme and Mrs. Wynette Francis for being a good friend and colleague. You built me
from a self-doubting person to a courageous and determined scholar/ researcher. I wish to
acknowledge Cameron McCain for her programming expertise and Dr. Justin McDonald for sound
scientific advice. I also wish to acknowledge Professor Yonglin Ren as my supervisory chair
throughout my study period. I wish to acknowledge Mr. Johann van der Merwe and Ms. Jenna van
Niekerk for contextualizing the data into scientific hypotheses.

iv
I am thankful to Chevron Australia Pty Ltd for allowing me access to this invaluable data for my
thesis. I wish to thank Murdoch University and specifically the Harry Butler Institute for the
support throughout my research period. I am grateful to the Australian Government for the
financial support through the Australian Postgraduate Award and the Murdoch Conference Travel
Award which enabled me to travel both locally and abroad for research conferences.
v
ABSTRACT
Biosecurity in Australia and globally is based on understanding and protection of our national
health, economy, industries, and environment from the negative effects associated with invasive
pests and pathogens. The biosecurity continuum includes pre-border preparedness, border
protection and post-border management, eradication, and control. The biosecurity system in
Australia aims to manage risks and reduce the likelihood and adverse consequences of pest and
disease incursions on human, animal and plant health, the environment, and the economy.
To identify biosecurity risks and solve pertinent issues in biosecurity, analysts must gather and
collate information for multiple factors and from a variety of sources in areas including agriculture,
the environment and public health. The amount and complexity of biosecurity data have exposed
the limitations in traditional statistical methodologies in addressing issues in biosecurity
management. Biosecurity surveillance data is challenging in terms of non-normality, over-
dispersion and typically zero-inflated. This type of data follows a natural process rather than a pre-
specified process or distribution models, and often contains a large proportion of zeros.
Application of appropriate statistical models to analyse these unique data sets is essential to
effective biosecurity decision-making. The data used throughout this thesis were typically
characteristic of biosecurity data, containing a large proportion of zeros, non-normality, and over-
dispersion. Data used were collected as part of a biosecurity program implemented on Barrow
Island, a remote island off the western Australian coastline, prior to and during the development
of an industrial project on the island.
In the following research, the first step encompassed evaluation of a range of candidate statistical
models for describing biosecurity border and post-border detection of terrestrial non-indigenous
species.
vi
The dataset was fitted with a variety of models including lognormal linear model, Poisson and
negative binomial generalized linear models, zero-inflated model, a three-component mixture
mode and a clustering analysis approach. A clustering analysis approach was adopted using a
generalization of the popular k-means algorithm appropriate for mixed-type data. The analysis
approach involved determination of the most appropriate number of clusters using just the
numerical data, then subsequently including covariates to the clustering. Based on the counts
alone, three clusters gave an acceptable fit and provided information about the underlying data
characteristics. Incorporation of covariates into the model suggested four distinct clusters
dominated by physical location and type of detection. Though the three-component log-normal
mixture model provided detailed insight into the distribution of the data by dividing the data
according to their distinct characteristic of numerical ordering, the clustering model was the
preferred approach for this study. Availability of more relevant data would greatly improve the
model. Broader use of cluster models in biosecurity data is recommended, with testing of these
models on more datasets to validate the model choice and identify important explanatory variables.
Investigation of the diverse routes by which non-indigenous species can be introduced is also of
key importance to biosecurity. A gap in many introductory pathway studies is the limited
consideration given to multiple introduction pathways occurring simultaneously. Multiple
pathways of non-indigenous species introduction to Barrow Island were investigated and fifteen
potential modes of introduction were identified in association with importing location and
personnel required for the project. Three-way management prioritisation using boosted regression
modelling to determine the most important factors influencing the detection of non-indigenous
species at the biosecurity border was assessed. Factors considered in detecting non-indigenous
species included potential modes of introduction, detection type, border inspection point (physical
location on Barrow Island), phase of industrial development, year, and month of detection, of
vii
which detection type, border inspection point and potential modes of introductions were key
factors.
Cargo vessel and inward bound passenger numbers peaked during the construction period and
were associated with an increase in the number of live non-indigenous species detections. Exposed
potential modes of introductions (e.g. flat racks and vessel topsides) contained a more diverse
species assemblage, while potential modes of introductions associated with human habitation and
activity had the highest likelihood of introducing live non-indigenous species. The nature of these
potential modes of introductions potentially allowed non-indigenous species habitation of niche
areas and/or provided a suitable food supply. Invertebrates comprised 73% of the detections, with
43% live non-indigenous species. Structures such as landings and jetties were recorded as invasion
hotspots, consistent with being the first point of entry for arriving vessels. Human-inhabited
environments reported abundant commensal non-indigenous species.
Our study indicates that biosecurity surveillance programs need to prioritise management of
specific species, potential modes of introductions, and sensitive and susceptible sites to target
potential invasions. Biosecurity managers should prioritise potential modes of introductions with
the highest likelihood of live non-indigenous species detection based on specific potential modes
of introductions characteristics, including niche availability and habitat suitability.
The study provided insight into how biosecurity surveillance programs need to assess current data
and adapt management strategies appropriately. Evaluation of the predictive performance of
models used in biosecurity surveillance is integral to subsequent management decision-making.
This includes assessing the suitability of the model for specific applications, i.e. identifying
important potential predictors, undertaking a comparative assessment of competing models and
modelling techniques, and identifying aspects of the model that might need improvement.
viii
Opportunities to use statistical science for biosurveillance are vast, as are the challenges associated
with available data related to biosecurity. This thesis explored a variety of analytical statistical
methods to enhance interpretation and decision making in biosecurity, while also acknowledging
the challenges associated with this type of data. There is a growing need to leverage scientific
models and predictive analytics to improve decision making in the context of biosecurity
management.
ix
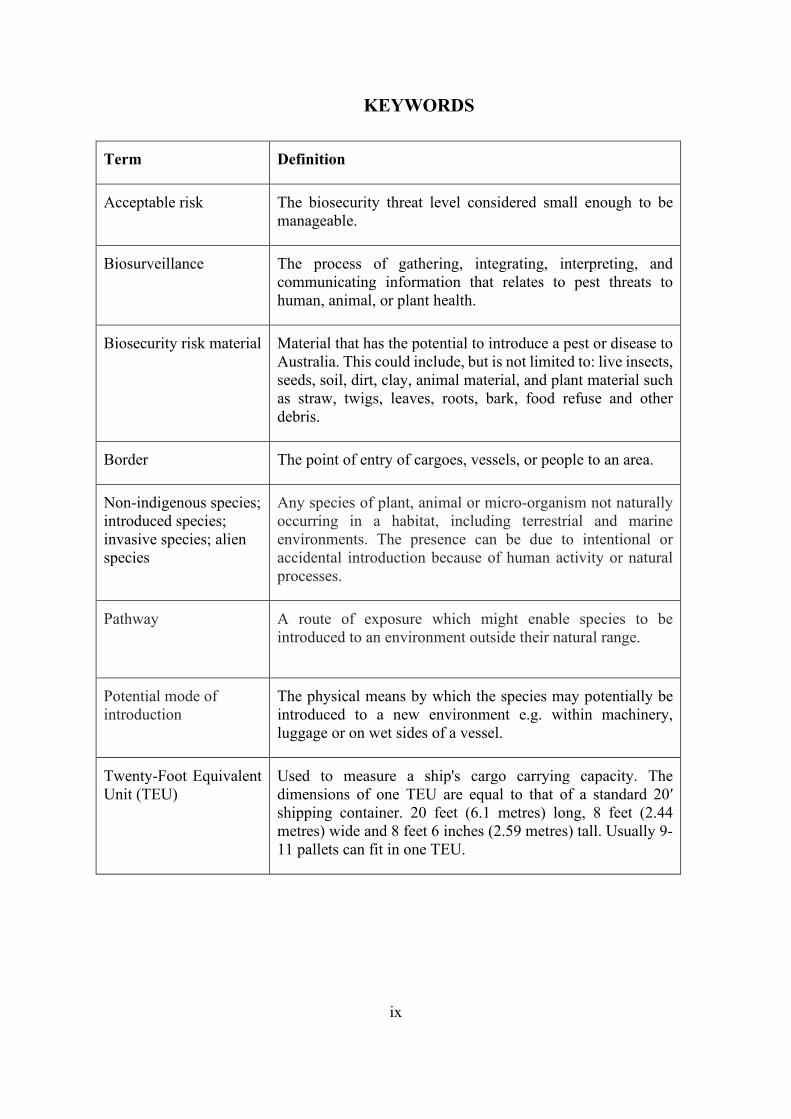
KEYWORDS
Term Definition
Acceptable risk The biosecurity threat level considered small enough to be manageable.
Biosurveillance The process of gathering, integrating, interpreting, and communicating information that relates to pest threats to human, animal, or plant health.
Biosecurity risk material Material that has the potential to introduce a pest or disease to Australia. This could include, but is not limited to: live insects, seeds, soil, dirt, clay, animal material, and plant material such as straw, twigs, leaves, roots, bark, food refuse and other debris.
Border The point of entry of cargoes, vessels, or people to an area.
Non-indigenous species; introduced species; invasive species; alien species
Any species of plant, animal or micro-organism not naturally occurring in a habitat, including terrestrial and marine environments. The presence can be due to intentional or accidental introduction because of human activity or natural processes.
Pathway
A route of exposure which might enable species to be introduced to an environment outside their natural range.
Potential mode of introduction
The physical means by which the species may potentially be introduced to a new environment e.g. within machinery, luggage or on wet sides of a vessel.
Twenty-Foot Equivalent Unit (TEU)
Used to measure a ship's cargo carrying capacity. The dimensions of one TEU are equal to that of a standard 20′ shipping container. 20 feet (6.1 metres) long, 8 feet (2.44 metres) wide and 8 feet 6 inches (2.59 metres) tall. Usually 9-11 pallets can fit in one TEU.
x
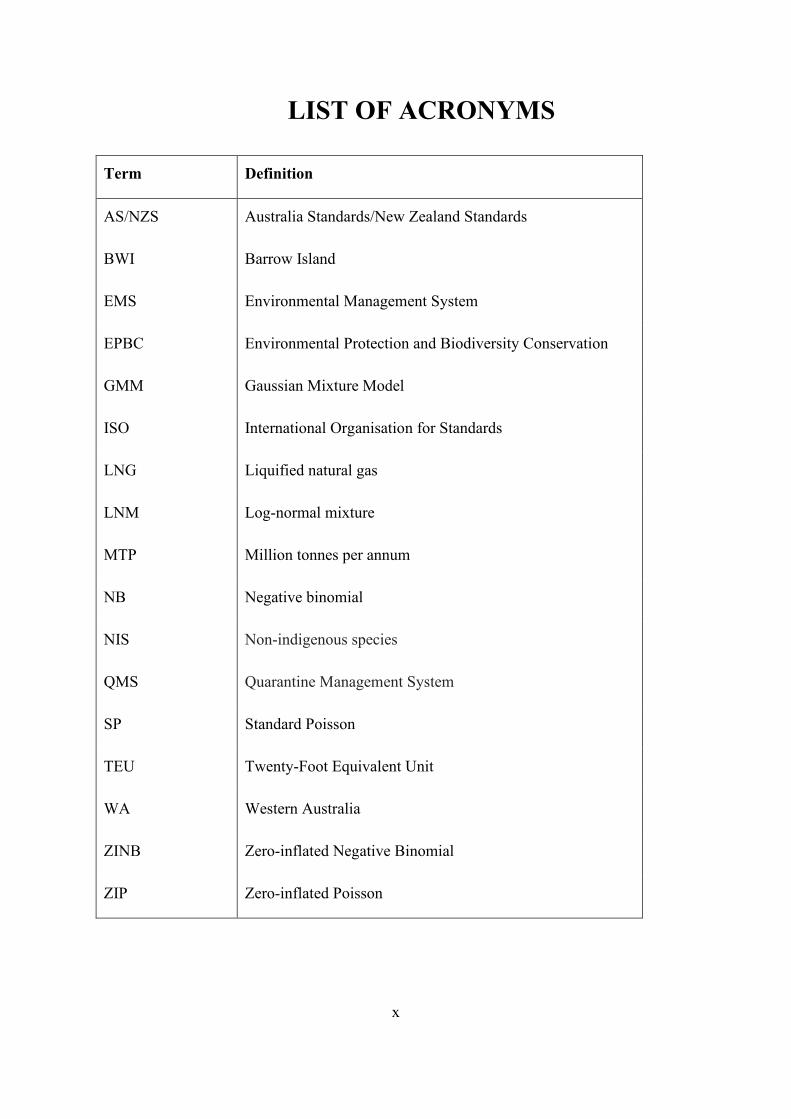
LIST OF ACRONYMS
Term Definition
AS/NZS Australia Standards/New Zealand Standards
BWI Barrow Island
EMS Environmental Management System
EPBC Environmental Protection and Biodiversity Conservation
GMM Gaussian Mixture Model
ISO International Organisation for Standards
LNG Liquified natural gas
LNM Log-normal mixture
MTP Million tonnes per annum
NB Negative binomial
NIS Non-indigenous species
QMS Quarantine Management System
SP Standard Poisson
TEU Twenty-Foot Equivalent Unit
WA Western Australia
ZINB Zero-inflated Negative Binomial
ZIP Zero-inflated Poisson
xi
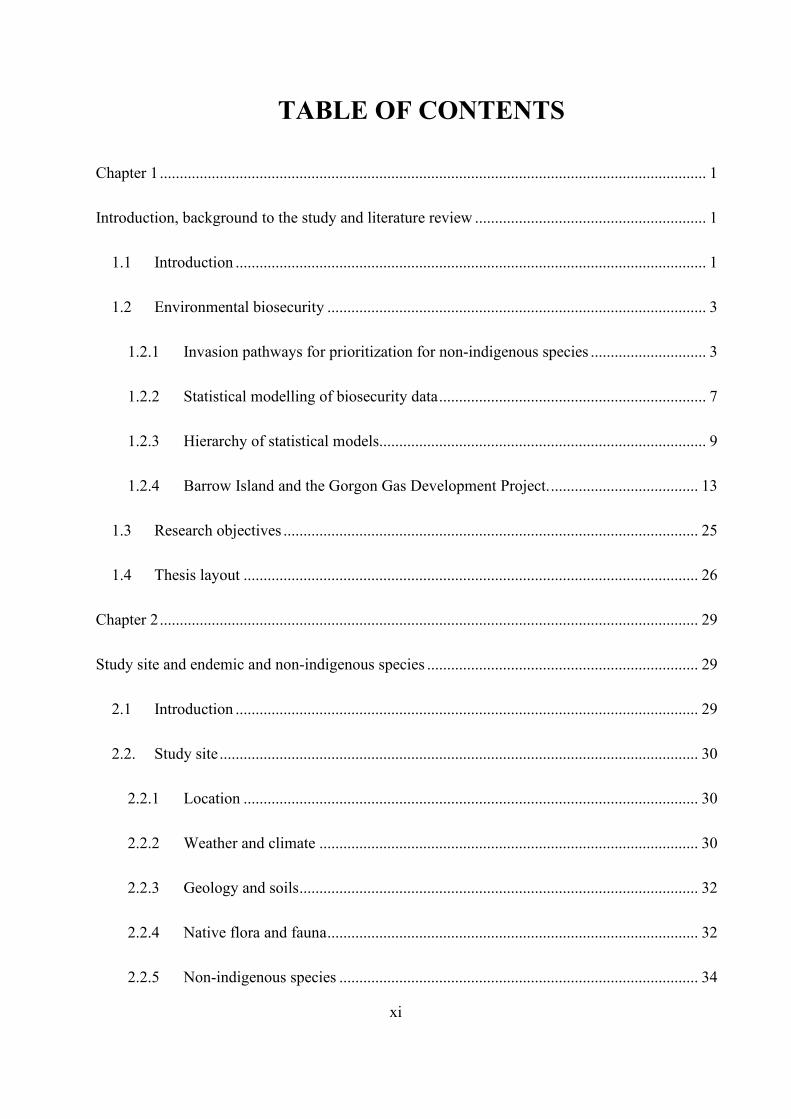
TABLE OF CONTENTS
Chapter 1 ......................................................................................................................................... 1
Introduction, background to the study and literature review .......................................................... 1
1.1 Introduction ...................................................................................................................... 1
1.2 Environmental biosecurity ............................................................................................... 3
1.2.1 Invasion pathways for prioritization for non-indigenous species ............................. 3
1.2.2 Statistical modelling of biosecurity data ................................................................... 7
1.2.3 Hierarchy of statistical models.................................................................................. 9
1.2.4 Barrow Island and the Gorgon Gas Development Project. ..................................... 13
1.3 Research objectives ........................................................................................................ 25
1.4 Thesis layout .................................................................................................................. 26
Chapter 2 ....................................................................................................................................... 29
Study site and endemic and non-indigenous species .................................................................... 29
2.1 Introduction .................................................................................................................... 29
2.2. Study site ........................................................................................................................ 30
2.2.1 Location .................................................................................................................. 30
2.2.2 Weather and climate ............................................................................................... 30
2.2.3 Geology and soils .................................................................................................... 32
2.2.4 Native flora and fauna ............................................................................................. 32
2.2.5 Non-indigenous species .......................................................................................... 34
xii
2.3 Biosecurity surveillance to detect incursion of high risk non-indigenous ..................... 36
2.3.1 High risk non-indigenous species ........................................................................... 38
2.3.2 High risk non-indigenous vertebrates ..................................................................... 41
2.3.3 High risk non-indigenous plant species .................................................................. 44
2.3.4 High risk non-indigenous marine species ............................................................... 46
2.4 Adaptability and characteristics of live NIS detected at border ..................................... 49
Chapter 3 ....................................................................................................................................... 51
Characterising biosecurity border detections of non-indigenous species using mixed-type data
clustering algorithm ...................................................................................................................... 51
3.1 Introduction .................................................................................................................... 52
3.2 Materials and methods ................................................................................................... 57
3.2.1 Study site ................................................................................................................. 57
3.2.2 Border biosecurity inspection protocols ................................................................. 59
3.3 Statistical methodology .................................................................................................. 60
3.3.1 Data collection ........................................................................................................ 60
3.3.2 Implementation of models ...................................................................................... 61
3.3.3 Clustering of mixed type data ................................................................................. 62
3.3.4 Bayesian model fitting in WINBUGS .................................................................... 64
3.3 Results ............................................................................................................................ 65
3.4.1 Data description ...................................................................................................... 65
xiii
3.4.2 Three-component log-normal mixture model ......................................................... 70
3.4.3 Cluster analysis of detections.................................................................................. 72
3.4.4 Cluster analysis of detections including covariates ................................................ 74
3.4.5 Cluster performance evaluation .............................................................................. 79
3.5 Discussion ...................................................................................................................... 82
3.6 Conclusion ...................................................................................................................... 88
Chapter 4 ....................................................................................................................................... 89
A systems approach to biosecurity pays off: a case study investigating introduction pathways and
interceptions of non-indigenous species at a biosecurity border .................................................. 89
4.1 Introduction .................................................................................................................... 90
4.2 The systems approach .................................................................................................... 93
4.2.1 Biosecurity protocols .............................................................................................. 93
4.2.2 Diagnostics, classifications, and response variables ............................................... 96
4.3 Materials and methods ................................................................................................... 99
4.3.1 Study site ................................................................................................................. 99
4.3.2 Statistical methodology ......................................................................................... 104
4.4 Results .......................................................................................................................... 107
4.4.1 Variation in detections among project phases ...................................................... 107
4.4.2 Summary description of detection events ............................................................. 112
4.4.3 Variation in NIS detections among the Introduction pathways ............................ 117
xiv
4.5 Discussion .................................................................................................................... 122
4.6 Conclusion .................................................................................................................... 129
Chapter 5 ..................................................................................................................................... 131
Three-way management prioritisation is effective for determining key factors in live non-
indigenous species detection during an island development project .......................................... 131
5.1 Introduction .................................................................................................................. 132
5.2 Material as methods ..................................................................................................... 136
5.2.2 Statistical methodology ......................................................................................... 140
5.2.3 Modelling approach using boosted regression ...................................................... 143
5.3 Results .......................................................................................................................... 144
5.3.1 Summary description of the results ....................................................................... 144
5.3.2 Boosted Tree Regression Model ........................................................................... 149
5.4 Discussion .................................................................................................................... 154
5.5 Conclusion .................................................................................................................... 159
Chapter 6 ..................................................................................................................................... 161
General Discussion ..................................................................................................................... 161
Appendices .................................................................................................................................. 172
References ................................................................................................................................... 189
xv
List of figures
Figure 1.1: Classification of non-indigenous/alien species. Adapted from Essl et al. (2018). ....... 4
Figure 1.2: Three-way prioritization of species, pathways, and sites. Adapted from McGeoch et al.
(2016). ............................................................................................................................................. 7
Figure 1.3: The generalised invasion curve detailing stages of pest management. ........................ 9
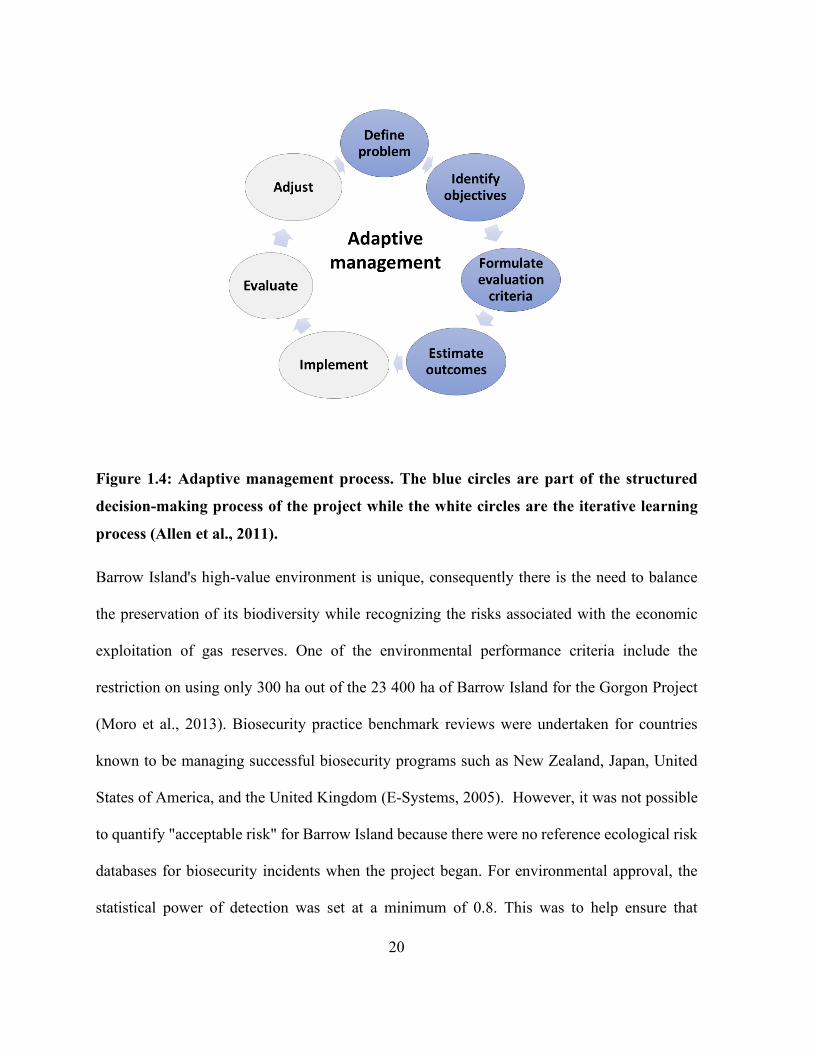
Figure 1.4: Adaptive management process. The blue circles are part of the structured decision-
making process of the project while the white circles are the iterative learning process (Allen et
al., 2011). ...................................................................................................................................... 20
Figure 2.1: Location of Barrow Island in relation to the western Australian landmass and various
ports (inset), and location of industrial project facilities on the land (modified from Chevron
Australia, 2009)............................................................................................................................. 31
Figure 2.2: Monthly rainfall and mean maximum temperature on Barrow Island between 2009 and
2018 (Bureau of Meteorology, 2016). .......................................................................................... 32
Figure 3.1: Physical definitions of biosecurity borders inspection points on Barrow Island,
Australia and location of Barrow Island in relation to the west Australian landmass and various
ports (inset) (modified from Chevron Australia, 2009) ................................................................ 58
Figure 3.2: Comparison of biosecurity border inspection detections by physical border entry
location for Barrow Island from 2009 to 2015. N.B.: Others included Barrow Island shore waters
and pre-commissioning sites. ........................................................................................................ 67
xvi
Figure 3.3: Distribution of detections by type of biosecurity risk material inspected and the number
of units detected per inspection for Barrow Island from 2009 to 2015. ....................................... 68
Figure 3.4: Time series model for total border detection counts for Barrow Island from January
2010 to September 2015. .............................................................................................................. 69
Figure 3.5: Trace plot and histograms of estimated parameters of the three-component lognormal
mixture model using detection data for Barrow Island from 2009 to 2015. ................................. 72
Figure 3.6: Optimal number of clusters using univariate clustering using ckmeans algorithm for
log-transformed data using detection data from Barrow Island 2009 to 2015. ............................ 73
Figure.3.7: Univariate clustering using ckmeans algorithm for log-transformed data using
detection data for Barrow Island from 2009 to 2015. ................................................................... 73
Figure 3.8: Cluster profiles for the four-component model using data from Barrow Island from
2009 to 2015. ................................................................................................................................ 79
Figure 3.9: Time series model for biosecurity border detection counts for Barrow Island between
January 2010 and September 2015 for cluster 2. .......................................................................... 81
Figure 4.1: a) Specific biosecurity borders on Barrow Island (air and seaports) and pre-border
points. b) Preborder biosecurity points in Australia. c) Listing of preborder biosecurity points in
Western Australia, Asia, and Europe. ......................................................................................... 102
Figure 4.2: Distribution of freight (tonnes) to Barrow Island from 2009 to 2015 by project phase
..................................................................................................................................................... 107
Figure 4.3: Distribution of air passengers and inward bound flights to Barrow Island from 2009 to
2015 by project phase. ................................................................................................................ 108
xvii
Figure 4.4: a) Distribution of border detection events for Barrow Island from 2009 to 2015 and b)
the relationship between inspection hours and border detection events by project phase. ......... 109
Figure 4.5: Distribution of detections, species, and total freight (t) to Barrow Island from 2009 to
2015............................................................................................................................................. 111
Figure 4.6: Total freight (t) and inward bound passenger movement to Barrow Island from 2009
to 2015. ....................................................................................................................................... 111
Figure 4.7: Distribution of border detection events for Barrow Island by pathway and detection
type for each of the project phases from 2009 to 2015. .............................................................. 113
Figure 4.8: Classification of detection events for Barrow Island from 2009 to 2015 by type of
detection. ..................................................................................................................................... 114
Figure 4.9: Classification of detection events for Barrow Island from 2009 to 2015 by viability.
..................................................................................................................................................... 115
Figure 4.10: Distribution of 10 most abundant invertebrate intercepts by introduction pathway
(presence/absence) for Barrow Island from 2009 to 2015. ......................................................... 121
Figure 4.11: Temporal variation (years and months) in the total abundance of live non-indigenous
species detections for Barrow Island for each introduction pathway from 2009 to 2015. ......... 122
Figure 5.1: Location of Barrow Island relative to the Western Australian coastline (inset) and
specific location of industrial project facilities on Barrow Island (BWI) (adapted from Chevron
Australia, 2009). N.B. WAPET Landing - Western Australian Petroleum Ltd Landing; LNG -
liquified natural gas..................................................................................................................... 137
xviii
Figure 5.2: Distribution of border detections on Barrow Island from 2009 to 2018 according to
type of detection (N.B. soil/organic matter comprised less than 1% of detections). .................. 145
Figure 5.3: Frequency of live non-indigenous species detections or absence of live detections for
each Potential Mode of Introduction on Barrow Island from 2009 to 2018 (See Table 5.1 for
abbreviations). ............................................................................................................................. 146
Figure 5.4: Distribution of border detections on Barrow Island from 2009 to 2018. ................. 147
Figure 5.5: A classification tree modelling the presence of live non-indigenous by detection type
and border inspection point on Barrow Island during the construction phase of the project. .... 151
Figure 5.6: A classification tree modelling the presence of live non-indigenous by Potential Mode
of Introduction and detection type for Barrow Island during the operational phase of the project.
..................................................................................................................................................... 152
Figure 5.7: A classification tree modelling the presence of live non-indigenous species by detection
type, Potential Mode of Introduction, and border inspection point on Barrow Island from 2009 to
2018............................................................................................................................................. 154
xix
List of tables
Table 1.1: Description of the Potential Modes of Introduction (PMoI) to and from the Barrow
Island (Chevron Australia, 2014a). ............................................................................................... 18
Table 2.1: List of non-indigenous invertebrate species recorded between 2005 and 2012. ......... 35
Table 2.2: Exemplar invertebrate species considered high-risk non-indigenous species to Barrow
Island (Chevron Australia, 2014a). ............................................................................................... 40
Table 2.3: Vertebrate species considered high-risk non-indigenous species to Barrow Island
(Chevron Australia, 2014b). ......................................................................................................... 42
Table 2.4: Plant species considered high-risk non-indigenous species for Barrow Island (Chevron
Australia, 2014b)........................................................................................................................... 45
Table 2.5: Marine species considered high-risk non-indigenous species for Barrow Island
(Chevron Australia, 2014b). ......................................................................................................... 48
Table 3.1: Summary statistics for the Barrow Island biosecurity detection events between 2009 to
2015............................................................................................................................................... 66
Table 3.2: Summary comparisons of models used to assess detection data for Barrow Island from
2009 to 2015 (n=5325). ................................................................................................................ 68
Table 3.3: Parameter estimates for log-normal mixture model using OpenBUGS for border
detection events for Barrow Island from 2009 to 2015. ............................................................... 71
Table 3.4: Summary statistics for univariate clustering using ckmeans algorithm for log-
transformed data using detection data for Barrow Island 2009- 2015. ......................................... 74
xx
Table 3.5: Description of covariates used in the cluster model using detection data for Barrow
Island from 2009 to 2015. ............................................................................................................. 75
Table 3.6: Summary statistics of clustering using the response variable only (counts) using
detection data from Barrow Island from 2009 to 2015. ................................................................ 76
Table 3.7: Clustering using both numeric and categorical variables using data from Barrow Island
between 2009 and 2015. ............................................................................................................... 77
Table 3.8: Summary statistics using numerical variable only for detection data from Barrow Island
between 2009 and 2015. ............................................................................................................... 80
Table 3.9: Summary statistics using categorical variables only for detection data from Barrow
Island between 2009 and 2015. ..................................................................................................... 80
Table 3.10: Summary descriptive statistics for Cluster 2 using detection data from Barrow Island
from 2009 to 2015. ........................................................................................................................ 81
Table 3.11: Clustering using both numeric and categorical variables using detection data from
Barrow Island from 2009 to 2015. ................................................................................................ 82
Table 4.1: Comprehensive description of the introduction pathways to Barrow Island (Chevron
Australia, 2014)........................................................................................................................... 103
Table 4.2: Live insects non-indigenous species classified as Incident Level 1 for Barrow Island
from 2009 to 2015. ...................................................................................................................... 116
Table 4.3: Distribution of invertebrate non-indigenous species detection events for Barrow Island
from 2009 to 2015 by introduction pathway classified using non-metric multidimensional scaling
(nMDS) using presence/absence transformation. ....................................................................... 118
xxi
Table 4.4: Live invertebrate non-indigenous species interceptions by introduction pathway (63
detection events) for Barrow Island from 2009 to 2015. ............................................................ 120
Table 5.1: Description of the Potential Modes of Introduction (PMoI) to Barrow Island during the
construction and operational phases between 2009-2018 (Chevron Australia, 2014). ............... 139
Table 5.2: Description of variables used for Boosted Regression Tree modelling of non-indigenous
species detections on Barrow Island between 2009 to 2018....................................................... 142
Table 5.3: Live non-indigenous species intercepted at the border that are on the biosecurity watch-
list for Barrow Island. ................................................................................................................. 148
Table 5.4: Summary of relative contributions (%) of predictor variables for boosted regression tree
model based on detection data collected on Barrow Island from 2009 to 2018. ........................ 150
xxii
Appendices Appendix A 1 : Supplementary information: Complete data set for mixed-type data analysis . 172
Appendix A 2: Supplementary material: Analysis of cluster 2 with 724 units. ......................... 175
Appendix B 1: Correlation matrix for total freight, species count and detection counts (refer Figure
4.5: Distribution of detections, species and total freight (t) to the island between 2009 and 2015).
..................................................................................................................................................... 180
Appendix B 2: Distribution of detections and abundance of orders in Class Insecta at biosecurity
border inspection for Barrow Island from 2009 to 2015 ranked according to the detection counts.
(he Atlas of Living Australia (ALA: http://www.ala.org.au). .................................................... 181
Appendix B 3: Distribution of seed non-indigenous species detection events for Barrow island
from 2009 to 2015 by introduction pathway classified using non-metric multidimensional scaling
(nMDS) with presence/absence transformation. ......................................................................... 182
Appendix B 4: Distribution of vertebrate non-indigenous species detection events for Barrow
Island for 2009 to 2015 by introduction pathway classified using non-metric multidimensional
scaling (nMDS) with presence/absence transformation. ............................................................ 183
Appendix B 5: Distribution of NIS plant material detection events for Barrow Island from 2009 to
2015 by introduction pathway classified using non-metric multidimensional scaling (nMDS) with
presence/absence transformation. ............................................................................................... 184
Appendix B 6: Univariate diversity indices for all the introductory pathways. ......................... 186

xxiii
Appendix C 1:Detections counts on Barrow Island from 2009 to 2018 defining construction and
transition phases. ......................................................................................................................... 187
Appendix C 2:Watch list of non-indigenous species for Barrow Island (Chevron, 2014a). ...... 188
1
Chapter 1
Introduction, background to the study and
literature review
1.1 Introduction
Environmental biosecurity involves protecting the environment and social amenities from the
negative effects associated with invasive species, including weeds, pests, and diseases. The
biosecurity continuum includes pre-border preparedness, border protection and post-border
management, eradication, and control (Department of Agriculture and Water Resources, 2018;
Department of the Environment and Energy, 2019). The biosecurity system in Australia aims
to reduce the likelihood and adverse consequences of pest and disease incursions on human,
animal and plant health, the environment, and the economy (Council of Australian
Governments, 2012; Craik et al., 2017).
Australia operates one of the most comprehensive biosecurity systems in the world, however,
both global and domestic factors define the success of the biosecurity system (Dodd et al.,
2017). The island geography of Australia has strategically acted as a natural barrier to
movement of pests and diseases. In more recent times, this advantage has unfortunately been
markedly reduced due to global connectivity. International and interstate migration, tourism,
and the increasing volumes and speed of movement of goods all contribute to increased
biosecurity risks faced by Australia (Dodd et al., 2017; Dodd et al., 2015; Hulme, 2009). Total
2
domestic freight volumes are projected to grow by approximately twenty-five percent between
2018 and 2040 (Bureau of Infrastructure, Transport and Regional Economics, 2019). Road
freight volumes contributes an annual growth of 2.0 percent from 218.9 billion tonne km of
freight 2018-2019, rail freight 0.69 percent per annum due to coal and iron ore exports from
413.5 billion tonne kilometres in 2015-2016, and air freight volumes to increase by 17% from
337 million tonne kilometres in 2018 to 393 million tonne kilometres in 2040 (Bureau of
Infrastructure, 2019). In 2018–19, there were 42.1 million passengers on international flights
in Australia and 61.0 million passengers on domestic flights (Bureau of Infrastructure Transport
and Regional Economics, 2019). In 2017–18, 8.1 million twenty-foot equivalent Units (TEUs)
were exchanged at Australia’s five principal container ports (Bureau of Infrastructure Transport
and Regional Economics BITRE, 2019).
Cruise passenger spending in Australia increased by 17.4% in 2018-2019 financial year
equating to $1.4 billion (Port Authority New South Wales, 2019). In 2018, 28.5 million went
on a cruise worldwide representing a 6.7% increase on 2017 records (Australian Cruise
Association, 2019). In 2018, 1.35 million Australians went on a cruise, an increase of 0.9%
over 2017 (Cruise Lines International Association (CLIA) Australasia, 2019).
Campbell et al. (2019) clearly articulate the significant biosecurity risks created by climate
change and the negative consequences of climate change. These climate change induced
biosecurity risks couple with the cascading effects on global distribution of pests and diseases,
which in turn influence the export market access.
3
1.2 Environmental biosecurity
1.2.1 Invasion pathways for prioritization for non-indigenous
species
Non-indigenous species (NIS) are a major threat to global diversity (Moser et al., 2018; Nghiem
et al., 2013; Ojaveer et al., 2015; Schlaepfer, 2018). Preventing introduction of NIS is
increasingly recognised as the most cost-effective means of mitigating their impacts (Pearce et
al., 2012; Pyšek et al., 2010). To tackle the threats caused by NIS there needs to be consistency
regarding the definition of alien species in invasion science, and this has been a matter of on-
going debate and the current definition by Essl et al. (2018). A widely used definition of non-
indigenous/ non- native species are species that have moved from their natural, native habitat
to a new environment, or being found in an ecosystem where they did not evolve. Invasive alien
species are those introduced to a novel environment with negative ecological, economic, or
social impacts (Hanley et al., 2019). Alien species that have established self-sustaining
populations without direct human intervention are said to be naturalized (Essl et al., 2018). Not
all non-native species are invasive (Sladonja et al., 2018). Essl et al. (2018) have proposed
classifying taxa according to the following criteria namely: a) crossing biogeographic barriers
b) direct and indirect human agency c) survival without human assistance and d) date of first
introduction. The taxa are then classified as native, alien, cryptogenic or data deficient. Carlton
(1996) introduced the term “cryptogenic” meaning that a species that is alien in a study region
but there is no definitive evidence that the species are native. Finally, where the lack of data
does not allow for an assessment of the classification criteria at all, then the taxa are classified
as data deficient (Essl et al., 2018; Nori et al., 2020; Scherz et al., 2019). Invasive species are
4
highly adaptable to new habitats, have a high reproductive rate, ecological tolerance, effective
dispersal mechanisms and usually occupy marginal and degraded habitats (Essl et al., 2018).
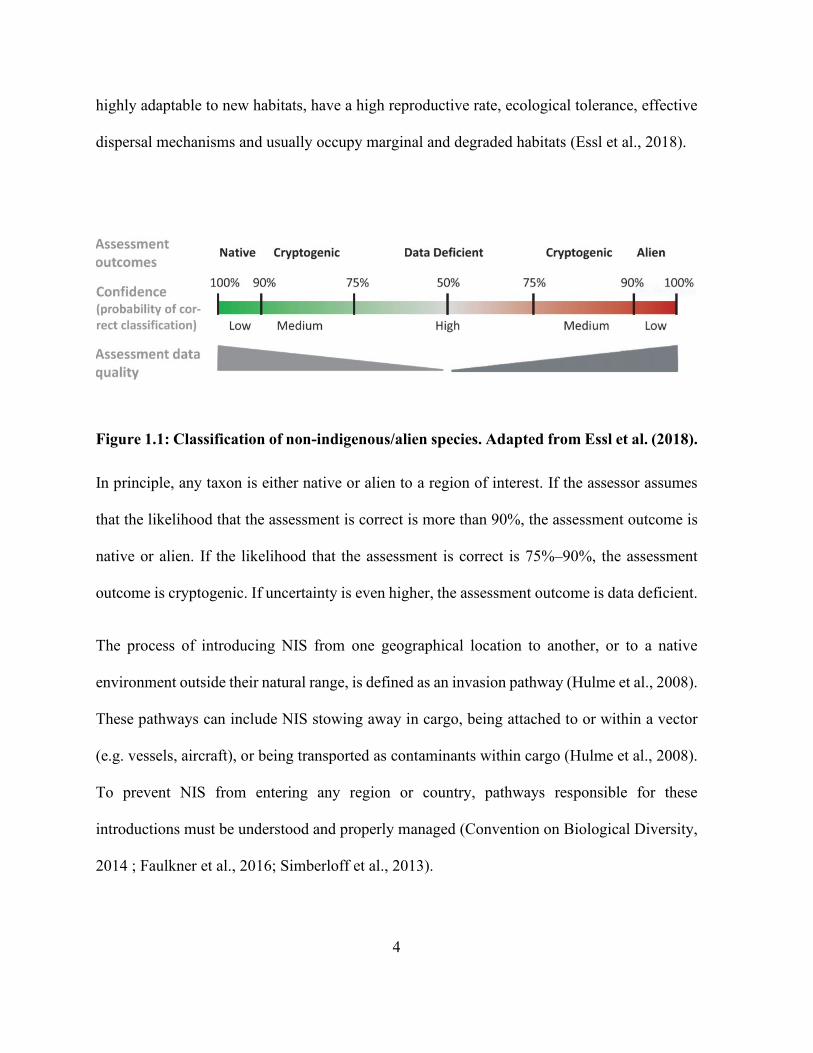
Figure 1.1: Classification of non-indigenous/alien species. Adapted from Essl et al. (2018).
In principle, any taxon is either native or alien to a region of interest. If the assessor assumes
that the likelihood that the assessment is correct is more than 90%, the assessment outcome is
native or alien. If the likelihood that the assessment is correct is 75%–90%, the assessment
outcome is cryptogenic. If uncertainty is even higher, the assessment outcome is data deficient.
The process of introducing NIS from one geographical location to another, or to a native
environment outside their natural range, is defined as an invasion pathway (Hulme et al., 2008).
These pathways can include NIS stowing away in cargo, being attached to or within a vector
(e.g. vessels, aircraft), or being transported as contaminants within cargo (Hulme et al., 2008).
To prevent NIS from entering any region or country, pathways responsible for these
introductions must be understood and properly managed (Convention on Biological Diversity,
2014 ; Faulkner et al., 2016; Simberloff et al., 2013).
5
Invasion pathways can be characterised using information such as the type of imported
commodity, associated alien species, the type and origin of transport used, inspection protocols,
and importation and quarantine regulations for specified products (Pyšek et al., 2011; Saccaggi
et.al., 2016). Key information regarding these factors can assist in developing preventative
biosecurity strategies. Substantial research has been undertaken on introduction pathways
revealing that they vary taxonomically, geographically, and temporally (Lehan et al., 2013;
Pyšek et al., 2011). Identification of pathways with high invasion risk provides information for
post-introduction management and surveillance to target sites that may be susceptible.
Prioritization is the process of ranking species and pathways to determine their potential
environmental impacts, risk to biodiversity and to aid in biosecurity decision making (Garcia,
2017; Hui et al., 2017). It has two distinct functions: firstly, to assess the potential impact of
NIS on the environment and secondly, to decide on the action to contain, control or eradicate
NIS and to prevent or mitigate potential impacts (Blackburn et al., 2014; Kumschick et al.,
2013; McGeoch et al., 2016; Richardson, 2011). Therefore, pathways are ranked according to
the number and diversity of distinct species they introduce, and the severity of their impact
should the species become established (Essl et al., 2015). Invasive species are costly to manage,
and resources are most limiting in prevention, containment, and eradication of invasive species
(Epanchin-Niell et al., 2017; Reaser et al., 2020). Prioritization to support cost-effective
allocation of resources is inherently part of management decision making at every stage of the
invasion process (McGeoch et al., 2016). Current prioritization protocols neglect management
costs. Courtois et al. (2018) proposed a cost-benefit optimization framework that incorporates
species utility, ecological value, distinctiveness, and species interaction. Previously Carrasco
6
et al. (2010) developed a multi-invasive species cost-benefit optimisation approach that focused
only on species invasiveness and did not cover species interdependencies through competition
and predation. It should be acknowledged that funding should be preferentially allocated to
invasive species with Allee effects (i.e. species whose survival probability increases with the
density of the population) and low propagule pressure (Courtois et al., 2018). Part of the
Convention on Biological Diversity (2014), Aichi Target 9, focuses on species and pathway
prioritization. Non-indigenous species must first be identified and matched with the risk they
pose and then prioritized to ensure effective biosecurity responses.
Prioritization can be implemented pre-border by ensuring that goods and commodities comply
with quarantine export requirements before they leave the exporting countries. Some offshore
quarantine inspection and import schemes have been agreed upon by various Australian trading
partners (http://dfat.gov.au/trade/agreements/Pages/trade-agreements.aspx), making the
process of biosecurity surveillance more consistent.
Limited research has been conducted on a three-way quantitative prioritization across multiple
species, pathways, and sites (Brunel et al., 2010; McGeoch et al., 2016; Padayachee et al.,
2019). However, numerous studies have covered species by pathway analyses (see NOBANIS.,
2015; Roy et al., 2014) and pathways by sites (see Chown et al., 2012; Kumschick et al., 2012).
This project has the scope to conduct a quantitative prioritization across multiple species,
pathways, and sites (Figure 1.2). Sites can be classified as susceptible or sensitive, depending
on the vulnerability to the impacts of NIS invasions (McGeoch et al., 2016). Susceptible sites
most likely to be invaded are those associated with high human activity, and related
disturbances and the import of goods and materials (McGeoch et al., 2016).

7
Figure 1.2: Three-way prioritization of species, pathways, and sites. Adapted from
McGeoch et al. (2016).
1.2.2 Statistical modelling of biosecurity data
Biosecurity surveillance is considered to be occurring within a “C-U-E continuum” explained
as data capture (to provide information), understanding (to interpret diverse data) and
exploitation (to use it wisely for the best possible biosecurity outcomes) (Baxter et al., 2016).
To identify biosecurity risks and solve pertinent issues in biosecurity, analysts must gather and
collate information for multiple factors and from a variety of sources in agriculture, the
environment and public health. The amount and complexity of biosecurity data has exposed
the limitations in traditional statistical methodologies in their ability to address issues in
biosecurity management (Craik et al., 2017; Simpson et al., 2014). Biosecurity is complex,
with complicated interactions occurring between stakeholders at different stages of biosecurity
8
risk management. This inevitably produces massive data sets. Heterogeneity of the data itself
adds to the complexity as it is often unstructured, spatio-temporal or having complex design
formats (Chen et al., 2013). Growth of data intensive science, improvements in data processing
and organisation, data warehousing, modelling and visualisation, and analytics can lead to
improved understanding of biosecurity risks across social, economic, and environmental
dimensions (Chen et al., 2013; Productivity Commission, 2017). However, issues such as lack
of funding and poor data integration could limit the potential for technological solutions to
address current and future biosecurity challenges (Simpson et al.,, 2014). Innovative data
mining techniques must be implemented to complement the available methods. Data mining
techniques include machine learning, artificial intelligence, data visualization,
multidimensional databases, and statistical inference (Leventhal, 2010; Nisbet et al., 2009).
The effectiveness of the screening process at border and post-border can be improved by
implementing various statistical techniques. These may include pathway models, network
invasion models and decision trees, which can both characterise and predict which pathways
are most likely bring in non-indigenous species (NIS) (Azmi et al., 2014; Baxter et al., 2016;
Campbell, 2011; Campbell et al., 2018; Colunga-Garcia et al., 2013; Paini et al., 2012)
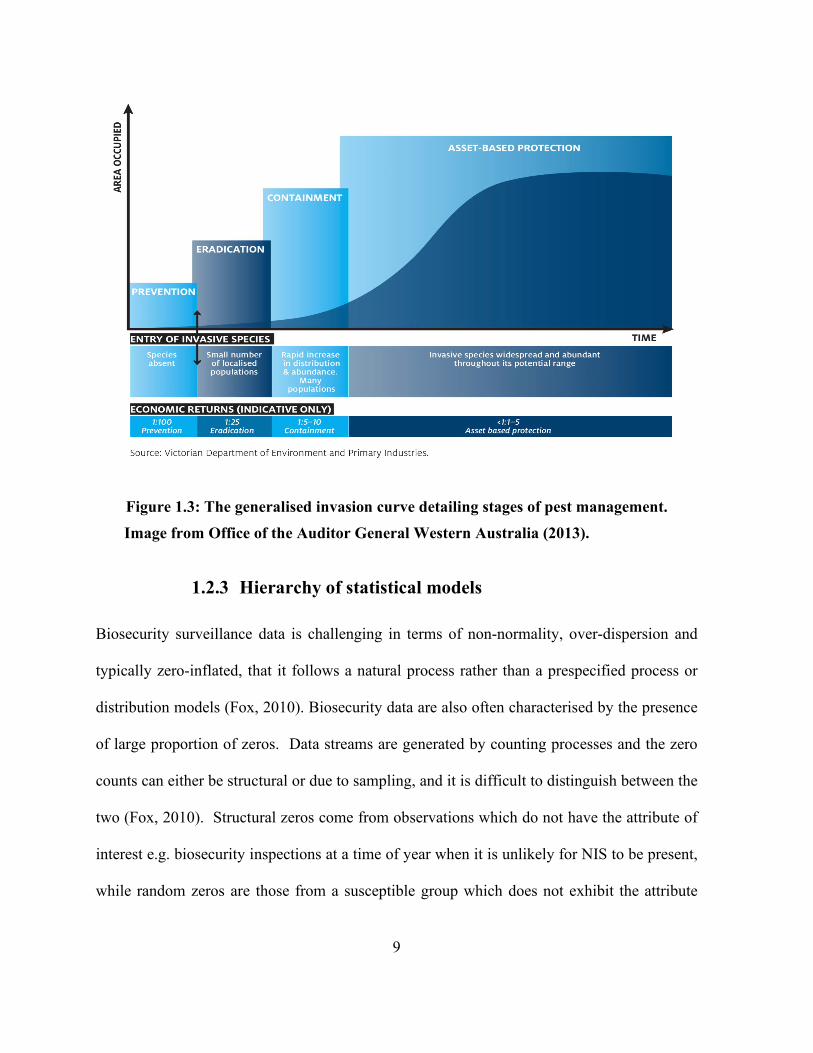
Data capture or collection provides the initial information to achieve biosecurity objectives.
Successful preventative strategies depend on early detection of pests and diseases, and
subsequent tracking of the progress of spread and control of a pest until final eradication or
containment (Figure 1.3) (Auditor General, 2013)
9
Figure 1.3: The generalised invasion curve detailing stages of pest management. Image from Office of the Auditor General Western Australia (2013).
1.2.3 Hierarchy of statistical models
Biosecurity surveillance data is challenging in terms of non-normality, over-dispersion and
typically zero-inflated, that it follows a natural process rather than a prespecified process or
distribution models (Fox, 2010). Biosecurity data are also often characterised by the presence
of large proportion of zeros. Data streams are generated by counting processes and the zero
counts can either be structural or due to sampling, and it is difficult to distinguish between the
two (Fox, 2010). Structural zeros come from observations which do not have the attribute of
interest e.g. biosecurity inspections at a time of year when it is unlikely for NIS to be present,
while random zeros are those from a susceptible group which does not exhibit the attribute
10
e.g. inspection at a time when NIS may be present but is not observed (Yang, 2014).
Biosecurity data comes from multiple, disparate sources with both spatial and temporal aspects.
Quantitative data analysis approaches target not only numerical observation data, but data from
sensors, remote imaging, GIS, and elicitation of expert opinion (Kokla et al., 2020, Whittle et
al., 2013). Further biosecurity data is characterised by high dimensionality, variability,
dependency, and non-linear relationships such that a host of statistical analysis approaches are
available to allow for meaningful interpretation of the data (Nguyen et al., 2019). When
analysing any data set, including those related to biosecurity, a common aim is to choose an
appropriate statistical model from a set of candidates. Choice of fitted distributions is dictated
by either the stochastic process governing the outcome of interest when there is no prior
knowledge regarding the underlying process, or by observation of its empirical distribution
(Delignette-Muller et al., 2015). Generalized linear models and their variants have increasingly
become the statistical approach of choice as they provide a selection of models which closely
mimic the generative processes for a range of data, including count data, thus providing
appropriate descriptive and predictive models (Bolker et al., 2009; McCulloch et al., 2014;
McCullough et al., 2006; Wood, 2017). As biosecurity data are often count based, generalized
linear models are a natural starting point for analysis.
Standard count regression models generally used include Standard Poisson (SP), the Negative
Binomial (NB) and the Log-Normal (LN). There are limitations and assumptions associated
with each distribution. For example, the SP assumes that detection error is constant in space
and time, which is universally incorrect (Joseph et al., 2009). The standard Poisson (SP) model
often underestimates the variance of the data. Over-dispersion caused mainly by mis-
11
specification of the model, omission of important covariates, non-independence of data and a
high proportion of zero events in comparison to the Poisson distribution, can lead to incorrect
inferences, commonly by overstating the significance of the some of the covariates (Hilbe,
2011; Hinde et al., 1998; Lee et al., 2012; Zuur et al., 2009). Alternatively, the negative
binomial (NB) distribution allows for some forms of over-dispersion, notably caused by rare
events (Rodrıguez, 2013), and can be used in place of the SP. Other models including the log-
normal (LN), the zero-inflated models (e.g. the zero-inflated Poisson (ZIP), the zero-inflated
negative binomial (ZINP) and mixture models, including the log-normal mixture (LNM)
model, adjust for both over-dispersion and zero-inflation, characteristic of border and post-
border detection data (Neelon et al., 2019). Where there is a large proportion of zeros and other
specific events, such as single counts, it could be assumed that data are generated from two or
more different sub-populations (Perumean-Chaney et al., 2013). For example, for a zero-
inflation model, one population may always produce zeros, or no event, while the other may
behave like a Poisson distribution. In the case of border surveillance for NIS, it is common to
observe a large proportion of zeros, single units, a smaller number of Poisson distributed counts
and a few extremely large counts.
Mixture modelling is an alternative approach to dealing with over-dispersion and population
heterogeneity where the distribution might be multimodal, skewed, or non-standard (Melnykov
et al., 2010). Mixture models enable generalization of distribution assumptions and provide a
formal framework for clustering and classification where the population consists of several
homogenous subpopulations (Joseph et al., 2009). Mixture models can be used as a convenient
mechanism for empirically describing non-standard data or phenomena, be it biological,
12
chemical, or otherwise. These models account for detection and abundance simultaneously
(Joseph et al., 2009).
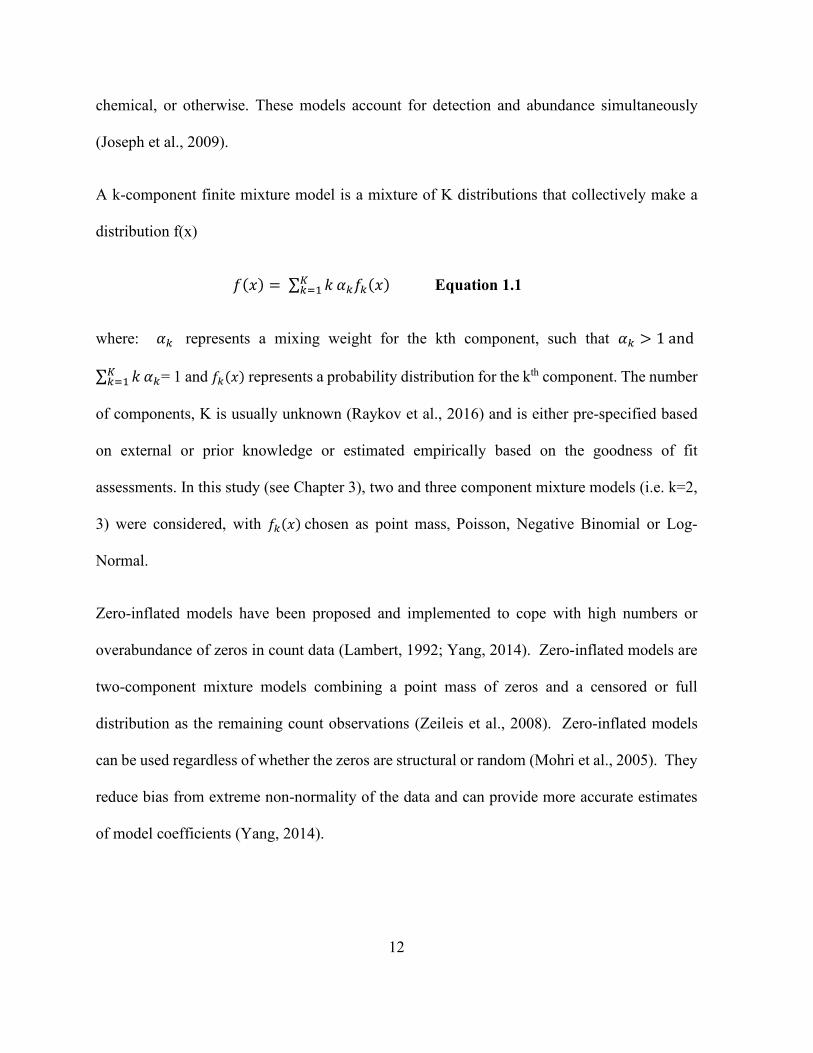
A k-component finite mixture model is a mixture of K distributions that collectively make a
distribution f(x)
𝑓𝑓(𝑥𝑥) = ∑ 𝑘𝑘𝐾𝐾𝑘𝑘=1 𝛼𝛼𝑘𝑘𝑓𝑓𝑘𝑘(𝑥𝑥) Equation 1.1
where: 𝛼𝛼𝑘𝑘 represents a mixing weight for the kth component, such that 𝛼𝛼𝑘𝑘 > 1 and
∑ 𝑘𝑘𝐾𝐾𝑘𝑘=1 𝛼𝛼𝑘𝑘= 1 and 𝑓𝑓𝑘𝑘(𝑥𝑥) represents a probability distribution for the kth component. The number
of components, K is usually unknown (Raykov et al., 2016) and is either pre-specified based
on external or prior knowledge or estimated empirically based on the goodness of fit
assessments. In this study (see Chapter 3), two and three component mixture models (i.e. k=2,
3) were considered, with 𝑓𝑓𝑘𝑘(𝑥𝑥) chosen as point mass, Poisson, Negative Binomial or Log-
Normal.
Zero-inflated models have been proposed and implemented to cope with high numbers or
overabundance of zeros in count data (Lambert, 1992; Yang, 2014). Zero-inflated models are
two-component mixture models combining a point mass of zeros and a censored or full
distribution as the remaining count observations (Zeileis et al., 2008). Zero-inflated models
can be used regardless of whether the zeros are structural or random (Mohri et al., 2005). They
reduce bias from extreme non-normality of the data and can provide more accurate estimates
of model coefficients (Yang, 2014).
13
Boosted regression trees (BRT) are regarded as “one of the best-off-the-shell” prediction
algorithms (Biau et al., 2018). They incorporate techniques from both statistical and machine
learning (ML) paradigms/traditions. Machine learning, however, assumes that the data-
generating process is complex and unknown, then learns the relationship between the response
and its predictor variables to determine dominant patterns and then give a predictive model
(Breiman, 2001). As a consequence, algorithmic modelling has strong predictive performance
and effective (reliable) identification of relevant predictor variables and interactions.
Ecological applications of BRT, though recent, are gaining wide usage in generating
comprehensive analyses avenues of huge complex data sets (De'ath et al., 2000; Elith et al.,
2017; Elith et al., 2008; Froeschke et al., 2016; Ridgeway, 2007, 2017).
A variety of modelling techniques must be developed to analyse biosecurity surveillance data
and address various aspects of these unique data sets. Development of targeted models aids in
biosecurity decision making and ensures that available data is used maximally to improve
biosecurity protocols and methods of data collection (Clarke et al., 2017; Dodd et al., 2017;
Hester et al., 2016; Robinson et al., 2017; Schneider et al., 2018).
1.2.4 Barrow Island and the Gorgon Gas Development Project.
Extensive research has been conducted on NIS on human-inhabited islands (Rojas‐Sandoval et
al., 2017; Russell et al., 2017; Toral-Granda et al., 2017; Turbelin et al., 2017; Wasowicz,
2014). These pathway analysis studies have a wide scope, ranging in focus from the number
and importance of introductions (Pyšek et al., 2011), the invasion success of introduced taxa,
to the change in prominence of pathways over time (Genovesi et al., 2012; McGeoch et al.,
2016; Pyšek et al., 2011). Studies have also focused on the abundance and type of organisms
14
that have been introduced (Levine et al., 2003), whether the introduced species were non-
random with regards to origin, commodity type or taxonomy and how the factors vary for
vertebrates, invertebrates, and plants (Kenis et al., 2007).
On islands, the highest numbers of non-native species introductions have been attributed to
stowaways, contaminants, and intentional release as part of horticulture and agriculture
activities (Hughes et al., 2010; Wasowicz, 2014). The potential for NIS invasion of remote,
sparsely inhabited islands is, however, often limited due to the nature of their seclusion and due
to the restricted points of entry (e.g. by air and/or sea) (Fahrig, 2013; Greve et al., 2018; Martín‐
Queller et al., 2017; Moser et al., 2018; Riera et al., 2018; Weigelt et al., 2013).
Barrow Island (BWI) is a remote island situated off the Western Australia coastline. The island
is recognized as one of the largest land masses in the world without any established non-
indigenous vertebrates (Jarrad et al., 2010) and was listed as a Class A nature reserve in 1910
(Dudley, 2008). In addition to being an A Class Nature Reserve, Barrow Island is also the site
for the Gorgon Gas Development Project, managed by Chevron Australia Pty. Ltd and its’ joint
venture partners. The project is one of the world’s largest natural gas projects and the largest
single natural resource project in Australian history (Lagdon et al., 2013; Moro et al., 2013).
Development of the Gorgon Gas Project on the island commenced in 2009. The project includes
a liquified natural gas (LNG) processing facility, subsea pipelines to BWI, and an LNG
shipping infrastructure for export to both domestic and international markets (Chevron
Australia, 2017).
15
Commencement of the construction of the LNG plant on Barrow Island presented significant
opportunities for the introduction of NIS through importation of diverse types of cargo and
personnel required for construction. During the construction phase of the liquid natural gas
(LNG) project, a diverse set of cargo/personnel Potential Modes of Introduction (PMoI) (e.g.
domestic vessels, personnel and luggage, and food and perishables) was created (Chevron
Australia, 2014c). As such, detecting, intercepting, and identifying potential NIS arriving on
the island became a priority in biosecurity surveillance and management of the island, and was
a requirement under the government legal framework (Government of Western Australia,
2009). As part of the biosecurity management of the island, it was important to identify NIS
already established on the island and those deemed pests due to their potential negative impact
on the island ecosystem.
The goals of national biosecurity programs are primarily to prevent the introduction and spread
of pests and diseases while minimizing adverse effects on trade (Nairn et al., 1996). However,
when Chevron proposed to exploit the natural gas reserves at Barrow Island, the focus of
biosecurity was to protect the conservation value of the island while facilitating ongoing
commercial operations (Chevron Australia, 2005). Barrow Island faces major biodiversity
threats that include land clearing, altered hydrological regimes, contamination, and pollution
due to anthropogenic activities such as infrastructure development and human activity
(Department of Parks and Wildlife, 2015). These activities can exacerbate the biosecurity risks
posed to the island’s biodiversity. It is important that implementation of biosecurity
surveillance and monitoring in a highly protected environmental area should maintain the
conservation value of the environment with minimum disturbance.
16
As a result of the biodiversity threats outlined above, stringent environmental measures were
required to be developed as part of the Gorgon project, agreed upon by expert consultation and
subsequently implemented to ensure security and preservation of Barrow Island’s biodiversity
when development commenced. The biosecurity management system implemented under
Gorgon Project is termed the Quarantine Management System (QMS). The QMS is governed
by the Biosecurity Act of 2015 (Australian Government, 2016) from which the Barrow Island
Act (2003) (Government of Western Australia, 2003a) (Barrow Island Act) emanated. Detailed
specification focussing on Barrow Island is specified in Schedule 1 (Clause 7 (1)(f), The
Gorgon Gas Processing and Infrastructure Project Agreement (Government of Western
Australia, 2009). The Barrow Island Act (2003),Western Australia requires compliance in all
aspects of the Environmental Protection Act 1986 (WA) (Government of Western Australia,
1986). Effective implementation of these government acts is guided by the ABU Barrow Island
Quarantine Policy (Chevron Australia, 2014b). The QMS was developed based on the principle
of AS/NZS ISO 14001: 1996, Environmental Management Systems (International
Organization for Standardization, 1996). The ISO 14001 is an internationally agreed standard
that defines the criteria for an environmental management system. It allows an organization to
quantify, monitor and control the impact of their current and future operations on the
environment and ensures legislative awareness and compliance. Development of the QMS
included 380 supporting documents, 78 specifications and procedures, and 412 activity steps
(Department of Parks and Wildlife, 2015; Scott et al., 2017).
The overall aim of the QMS as specified in Schedule 1 is “not to introduce or proliferate non-
indigenous (NIS) terrestrial species and marine pests to or within Barrow Island or the water
17
surrounding Barrow Island as a consequence of the proposal" (Government of Western
Australia, 2009). The specific objectives included preventing NIS introductions, detecting NIS
sufficiently early to consider eradication, control and eradicate any detected NIS and mitigation
of adverse impacts of any control or eradication actions on indigenous species (Chevron
Australia, 2010). Specifically, the QMS focuses on all potential introduction pathways to
Barrow Island and strategies have been put in place to help exclude all NIS on or in the waters
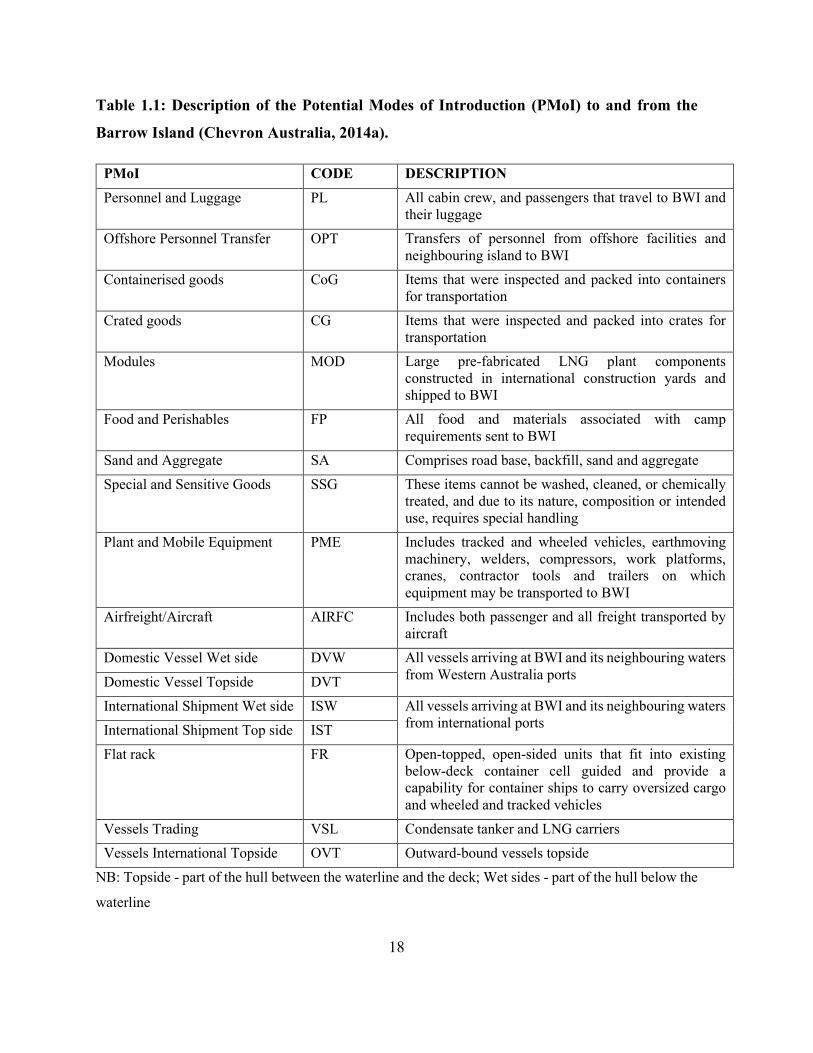
surrounding Barrow Island (Chevron Australia, 2010). The activities encompass pre-border
prevention of NIS using protocols specifically designed for the fifteen potential modes of
introduction (PMoI) as described in Table 1.1.
18
Table 1.1: Description of the Potential Modes of Introduction (PMoI) to and from the
Barrow Island (Chevron Australia, 2014a).
PMoI CODE DESCRIPTION Personnel and Luggage PL All cabin crew, and passengers that travel to BWI and
their luggage Offshore Personnel Transfer OPT Transfers of personnel from offshore facilities and
neighbouring island to BWI Containerised goods CoG Items that were inspected and packed into containers
for transportation Crated goods CG Items that were inspected and packed into crates for
transportation Modules MOD Large pre-fabricated LNG plant components
constructed in international construction yards and shipped to BWI
Food and Perishables FP All food and materials associated with camp requirements sent to BWI
Sand and Aggregate SA Comprises road base, backfill, sand and aggregate Special and Sensitive Goods SSG These items cannot be washed, cleaned, or chemically
treated, and due to its nature, composition or intended use, requires special handling
Plant and Mobile Equipment PME Includes tracked and wheeled vehicles, earthmoving machinery, welders, compressors, work platforms, cranes, contractor tools and trailers on which equipment may be transported to BWI
Airfreight/Aircraft AIRFC Includes both passenger and all freight transported by aircraft
Domestic Vessel Wet side DVW All vessels arriving at BWI and its neighbouring waters from Western Australia ports Domestic Vessel Topside DVT
International Shipment Wet side ISW All vessels arriving at BWI and its neighbouring waters from international ports International Shipment Top side IST
Flat rack FR Open-topped, open-sided units that fit into existing below-deck container cell guided and provide a capability for container ships to carry oversized cargo and wheeled and tracked vehicles
Vessels Trading VSL Condensate tanker and LNG carriers Vessels International Topside OVT Outward-bound vessels topside
NB: Topside - part of the hull between the waterline and the deck; Wet sides - part of the hull below the
waterline
19
These protocols include: screening of all passengers and cargo for compliance using X-rays
and sniffer dogs; shrink-wrapping oversized machinery and equipment; refusal of non-
compliant cargo and fumigation; washing, preparing, packaging, and inspecting fresh food,
prior to shipping to the island (Chevron Australia, 2015). Pre-border activities are followed by
a 100% border inspection protocol. Finally, post-border (outside of the development site)
controls are also in place (Chevron Australia, 2015). Post-border activities include ecological
monitoring of species trends, surveillance, and detection of NIS and eradication programs
where required, which result in the minimum impact on the indigenous species on the island
(Department of Parks and Wildlife, 2015).
The biosecurity management team for the BWI project adopted the adaptive management
framework for decision making, whereby the project was reviewed on a daily basis. Any
important information which became available was used to implement decisions (van der
Merwe personal communication, 2020). Adaptive management is a formal iterative process of
resource management that achieves management objectives by increasing system knowledge
through a structured feedback (Allen et al., 2011; Williams et al., 2016). It involves exploring
alternative ways to meet management objectives using current knowledge and monitoring to
learn continuously. Managers, the government, scientists, and other stakeholders learn together
to update knowledge and adjust management decisions. Structured decision making (blue
circles) lays foundation of any project, while the iterative process (white cycles) involves the
learning and feedback (Figure 1.4). As more information became available as the Gorgon
project progressed, some changes were implemented in the biosecurity protocols and in the
allocation of resources.
20
Figure 1.4: Adaptive management process. The blue circles are part of the structured
decision-making process of the project while the white circles are the iterative learning
process (Allen et al., 2011).
Barrow Island's high-value environment is unique, consequently there is the need to balance
the preservation of its biodiversity while recognizing the risks associated with the economic
exploitation of gas reserves. One of the environmental performance criteria include the
restriction on using only 300 ha out of the 23 400 ha of Barrow Island for the Gorgon Project
(Moro et al., 2013). Biosecurity practice benchmark reviews were undertaken for countries
known to be managing successful biosecurity programs such as New Zealand, Japan, United
States of America, and the United Kingdom (E-Systems, 2005). However, it was not possible
to quantify "acceptable risk" for Barrow Island because there were no reference ecological risk
databases for biosecurity incidents when the project began. For environmental approval, the
statistical power of detection was set at a minimum of 0.8. This was to help ensure that
21
terrestrial non-indigenous species (invertebrates, vertebrates and plants) introduced as a result
of the development activities on Barrow Island were detected sufficiently early to consider
eradication without significant environmental consequences to native flora and fauna (Barrett
et al., 2010; Whittle et al., 2013). The statistical power in this study of at least 0.8 is the
probability of detecting a NIS given it is present at a tolerable population size (K) with the type
II error of at least 0.2 (the probability of falsely declaring the NIS to be absent) (Whittle et al.,
2013). A tolerable population is the number of individuals or independent groups large enough
to be detectable, but not too large to reduce the likelihood of eradication or pose significant
environmental consequences (Barrett et al., 2010). Statistical power was a formal way to assess
the utility of a plan for detecting target species sufficiently early to maximise the opportunity
for eradication. As such, an integrated approach on detections of multi-species using different
survey tools over non-homogenous environment was used (Jarrad et al., 2015; Jarrad et al.,
2011; Whittle et al., 2013; Williams et al., 2014). Power analysis is a recognized tool for study
designs as it results in reduced financial and ecological costs whilst utilizing an optimal
detection system especially for early stages of monitoring and planning (Barata et al., 2017;
Barrett et al., 2010). Statistical power is affected by sample size, statistical significance level,
variability or variance of the response variable, magnitude of the effect of the variable, species-
specific detection, and occupancy probabilities (Steenweg et al., 2019).
Geographic information system (GIS) was used to identify a probability surface for the
occurrence of a species, and the information was then used to map the distribution of the
detections and inform management decisions (Whittle et al., 2013). The Barrow Island
landscape was stratified according to identified potential points of likelihood of entry and
22
establishment of exemplar NIS using a GIS shapefile containing the information of terrain,
vegetation and building locations (Whittle et al., 2013). The vegetation classifications were
based on a survey conducted by Mattiske Consulting Pty Ltd (1997). GIS services were
provided by Chevron Australia. Risk maps were prepared for each exemplar species (Chevron
Australia, 2014a). In the first stage, experts identified potential points of entry and habitat
attributes for successful establishment for each exemplar species. The process of risk mapping
utilised the Analytical Hierarchy Process (AHP: Saaty 1987), which involved combining the
generalised detection model incorporating detectability on arrival, detectability on the island
and risk occupancy with the geographical information system (GIS) for Barrow Island. GIS for
Barrow Island includes extensive data on landforms and vegetation on the island. A panel of
experts compared the relative importance of entry points and establishment attributes using the
Analytic Hierarchy Process (AHP) and assigned relative importance weights (RIWs) (Saaty,
1987).
The biosecurity program implemented under the Gorgon Gas Project is the only biosecurity
surveillance project to have the statistical power of detection reported (Whittle et al., 2013),
though the concept has been acknowledged in other scientific work in medicine, business, and
psychology (McQuitty, 2004; Sedgwick, 2013; Steidl et al., 1997; Turner et al., 2018). The key
operational areas targeted by the QMS to protect Barrow Island’s conservation status include
i) biosecurity measures to ensure that non-indigenous species do not enter the island, ii)
workforce education, iii) progressive rehabilitation of disused production areas and iv) planning
of infrastructure to maintain the island’s ecosystem functions and processes (Moro et al., 2013).
The QMS recognized that biosecurity is managed as a continuum, pre-border, border, and post-
23
border activities (Beale, 2008). Biosecurity continuum focuses on taking direct responsibility
on activities to minimize the risk of entry of disease and NIS. Pre-border and border activities
include quarantine and sanitary measures on goods and commodities, pre-clearance checks,
quality assurance, compliance with conditions of entry, border inspection and managing of
pathways of introductions (Jeggo, 2012; McKirdy et al., 2014). Further, post-border activities
include surveillance, monitoring and emergency preparedness planning (Sharma et al., 2014).
Post-border activities mitigate the likelihood of establishment and spread of the NIS which can
damage the environment and biodiversity of Barrow Island and is the focus of this research.
The QMS focuses primarily on the biosecurity continuum for Barrow Island and quantifies the
effectiveness of the activities in minimizing the entry and establishment of NIS (Chevron
Australia, 2005, 2017).
Barrow Island has strategic advantages in terms of biosecurity due to its geographical isolation,
specific biosecurity regulatory framework (Barrow Island Act of 2003) and lack of internal
political borders (Government of Western Australia, 2003). The island has remained largely
uninhabited by humans and has been generally free of invasive species for almost 8000 years
(Jarrad et al., 2010). Given the high conservation value of Barrow Island, the biosecurity system
put in place should attempt to maintain its relatively pest free status.
The Gorgon Gas Project was forecast to add more than $440 billion to Australia’s gross
domestic product between 2009 and 2041, almost $14 billion per year (ACIL Allen, 2015). The
Project involves the construction and operation of a 15 million tonnes per annum (MTPA) LNG
facility and a 300 terajoules per day (TJ/d) domestic gas plant. At the local level, the supply of
LNG from the Gorgon Gas Project is expected to meet a third of Western Australia’s domestic
24
supply, whilst the rest is to be marketed domestically and regionally, in the Asia-Pacific (ACIL
Allen, 2015; Lagdon & Moro, 2013). In March 2016, the first LNG cargo from the Gorgon Gas
Project was successfully loaded and set sail from Barrow Island for export to Japan (Chevron
Australia, 2016).
Sustainable development and exploitation of minerals and other natural resources has been
acknowledged as a global management and development challenge (Butlin, 1989). Sustainable
development integrates economically viable, socially acceptable, and environmentally sound
practices in the exploitation of natural resources (United Nations, 2006). Reconciling resource
extraction and protecting the environment is an on-going challenge in both the developed and
developing world to make companies account for their environmental impacts (Bell, 2017).
Proof that resource development and biodiversity can coexist is required to demonstrate that
exploitation of natural resources can occur within pristine environments around the world, with
minimal environmental impact and simultaneous socio-economic benefits (Imperatives, 1987;
Martin et al., 2016). The ability to prove this would be of direct benefit to resource development
companies. There is capacity for benefits to be accrued to local and national governments, and
the general population when resources are economically exploited without significantly
damaging the environment (Delgado-Serrano, 2017). However, it should be acknowledged that
even responsible extracting of natural resources imposes significant environmental costs
(Edwards et al., 2014; Lampert, 2019). There is capacity for benefits to be accrued to local and
national governments, and the general population when resources are economically exploited,
such as foreign direct investment, employment, increased government revenue, foreign
exchange earnings and general economic growth in other related sectors (Carvalho, 2017). The
25
concept of "protecting the environment" in poor regions of the world is, however, very
challenging (Scherl et al., 2004). This is because there are fragile regulatory institutions,
experience in compliance and enforcement is weak and environmental issues are not considered
a priority, coupled with rampant corruption (Bell, 2017; Koziell et al., 2003).
1.3 Research objectives
To assess whether the biosecurity surveillance system in place on Barrow Island has reduced
the likelihood of NIS from entering and establishing on the island. The effectiveness of the
biosecurity surveillance system can be demonstrated by 1) quantifying detections of NIS
through modelling the detection patterns at the border and post-border, 2) characterisation of
introduction pathways and 3) the capacity for adaptive surveillance techniques and strategies
on the island.
The specific objectives for the following research are:
i. To test various statistical models and determine which model best describes border
and post-border detections of terrestrial NIS for Barrow Island, Australia. The
outcome is to inform past and future decisions on biosecurity management
protocols and strategies to minimize the introduction of NIS to Barrow Island and
refine inspection and detection programs at border and post-border.
ii. To characterise introduction pathways transporting goods and personnel to the
remote island and determine which PMoI has the highest likelihood of introducing
NIS to the island so as to target biosecurity resources towards these PMoI.
26
iii. To provide a predictive model for future assessments of PMoI to Barrow Island
using a robust and objective statistical methodology that identifies factors
contributing to the likelihood of detecting live NIS on the island.
1.4 Thesis layout
Chapters 1 and 2 provide a background to the study, a literature review, and the objectives of
the study. This research focussed on pre-incursion modelling i.e. pre-border and border NIS
interception biosecurity surveillance data between 2009 and 2018 during the development of
the Gorgon LNG Project on Barrow Island. Biosecurity data comes from multiple, disparate
sources that have both spatial and temporal aspects. Consequently, data are characterised by
high dimensionality, variability, dependency, and non-linear relationships such that a host of
statistical analysis approaches available to allow for meaningful interpretation of the data have
to be tested and compared.
The data chapters, Chapters 3, 4 and 5, address specific topics that highlight the various
statistical methodologies applied to provide comprehensive information about each of the
above objectives.
Chapter 3 acknowledges that biosecurity data are commonly characterized by presence/absence
data (binomial distribution) and clumping and extreme events that can be characterized by a
mixture of distribution models. These include the standard Poisson, negative binomial
distributions, and variants of these such as zero-inflated and hurdle models. Statistical methods
used to analyse biosecurity data will be dictated by these distributions. Further, two approaches
27
are applied: 1) the Bayesian lognormal mixture model and 2) the clustering of mixed-type
(metric–ordinal–nominal) data with covariates, with preference to the mixed-type clustering
approach. Model-based clustering is centred on statistical inference, where data is assumed to
arise from a mixture of distributions with a finite number of populations, with various
proportions. Each population represents a cluster with distributional properties and the clusters
overlap. With mixed-type data clustering, distinct homogeneous subgroups are formed
deterministically based on measures between objects, or between objects and centroids. The
analysis approach involved determination of the most appropriate number of clusters using just
the numerical data, then subsequently including covariates to the clustering.
Chapter 4 highlights how a systems approach to biosecurity assists in strategic management of
introduction pathways and post-border surveillance activities. This was achieved through
investigating border interception patterns of non-indigenous species at the biosecurity border
to Barrow Island. Further, high-risk species and their potential impacts to biodiversity on
Barrow Island, biosecurity protocols implemented pre-border, border and post-border are
explained in-depth to illustrate their contribution biosecurity outcomes between 2009 and 2015.
Chapter 5 assesses three-way management (species, pathway, and sites) prioritisation using
boosted regression modelling to provide a better understanding of how non-indigenous species
are reaching the borders and entry points of Barrow Island. Factors considered in detecting NIS
include Potential Mode of Introduction (PMoI), detection type, border inspection point
(location), phase of industrial development, year, and month of detection, of which detection
type, border inspection point and PMoI were key factors. The program adopted the
precautionary approach from the Convention of Biological Diversity ethos, as stated by
28
Campbell (2011), “that it is preferable to make a mistake of denying entry to a non-pest than to
allow entry of a pest because a decision to admit a species is usually irreversible”, hence the
need to identify how and where the NIS arrived on the island.
Chapter 6 discusses the outcomes of the research, highlighting that opportunities to use
statistical science for biosecurity surveillance are vast as are the challenges with available
biosecurity data. Pre-incursion modelling enables biosecurity preparedness to be adaptive, as it
predicts future outcomes using currently available data. Further outcomes include the
transferability of the Quarantine Management System policies and procedures developed for
the Gorgon LNG Project to similar resource projects in high biodiversity areas around the
world.
Each of chapters commences with a preface outlining the objectives of the chapter, which are
aligned with the overall aims of the thesis and includes an Abstract, Introduction, Materials and
Methods, Results, Discussion and Conclusion.
29
Chapter 2
Study site and endemic and non-indigenous
species
2.1 Introduction
Barrow Island is a Class A Nature Reserve and is recognised as one of the largest landmasses
in the world without any established non-indigenous vertebrate (Jarrad et al., 2011). Class A
Nature Reserve (Reserve 11648) status is the highest conservation classification and is in
recognition of its pristine condition, high biodiversity, and conservation value (Government of
Western Australia, 2003). Barrow Island is managed by the Department of Parks and Wildlife
(Department of Parks and Wildlife, 2015). The island is home to a range of species that are
threatened, priority-listed and endemic, although mining title deeds, production licences and
exploration permits are available over the entire planning area of the island (Department of
Parks and Wildlife, 2015). Major threats to biodiversity, such as land clearing for development,
altered hydrological and fire regimes, introduction of NIS, gravel extraction and contamination
and/or pollution are inevitable due to the mining activities, and a balance has to be achieved
between resource exploitation and conservation of biodiversity (Delgado-Serrano, 2017; Sonter
et al., 2018).
30
2.2. Study site
2.2.1 Location
Barrow Island (BWI) is located 200 45´S, 115025´E, 56 km off the Pilbara region of mainland
of Australia (Figure 2.1). The island is the second-largest continental island in the world 25 km
in length, 10 km in width and approximately 23 400 hectares above the high-tide mark. The
industrial project on the island occupies approximately 332 hectares of the island (1.4 per cent
of the land area) (Chevron Australia, 2005).
2.2.2 Weather and climate
Barrow Island has a semi-arid tropical climate with two main seasons: summer (October –
March) and winter (April –September). Summer temperatures range between 20°C – 34°C with
tropical storms. Winters are cooler with temperatures ranging between 17°C – 26°C with
occasional rainfall (Bureau of Meteorology, 2016) (Figure 2.2)
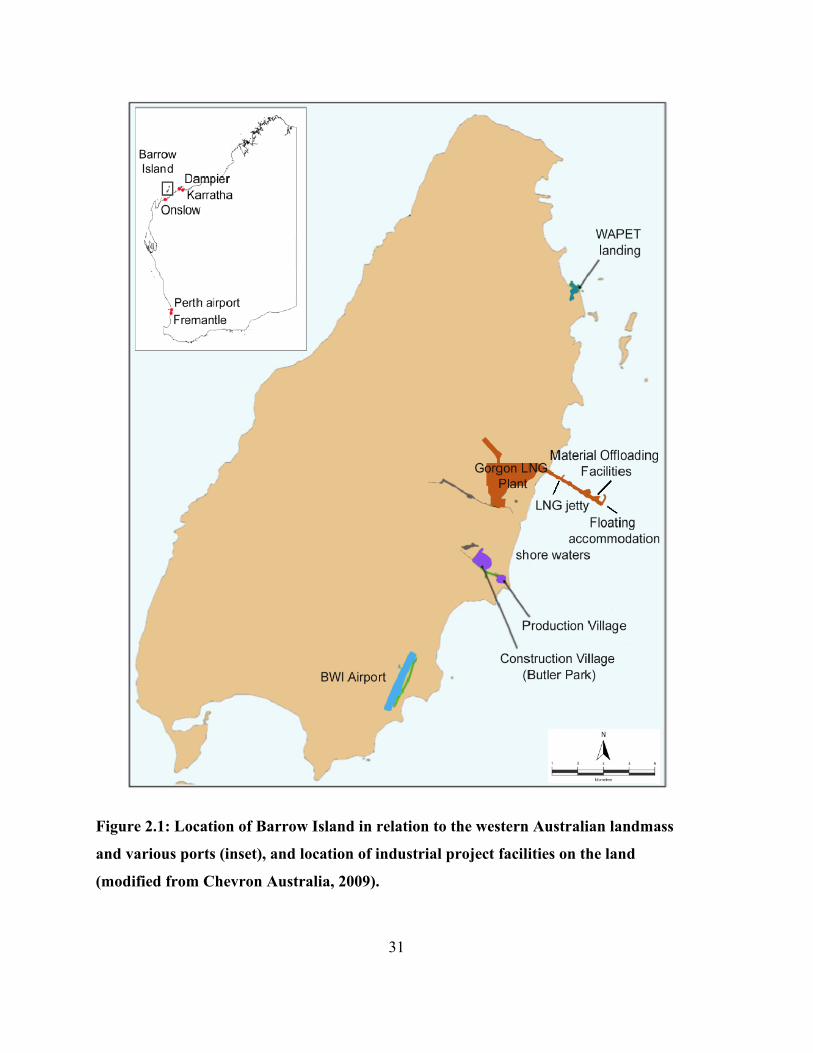
31
Figure 2.1: Location of Barrow Island in relation to the western Australian landmass
and various ports (inset), and location of industrial project facilities on the land
(modified from Chevron Australia, 2009).

32
Figure 2.2: Monthly rainfall and mean maximum temperature on Barrow Island between
2009 and 2018 (Bureau of Meteorology, 2016).
2.2.3 Geology and soils
Barrow Island is characterized by undulating limestone uplands, rocky shores, and coastal
fringes and near coastal lowlands consisting of sandy beaches. There are low cliffs and dunes,
salt flats and reefs (Lagdon & Moro, 2013). There is a network of humid caves extending up
to 100 m underground that support diverse ecological systems (Chevron, 2012). The soils are
alkaline red sands with low nutrient content (Callan et al., 2011). Other parts of the island have
deep alluvial soils that act as seed stores for vegetation regeneration (Chevron, 2012).
2.2.4 Native flora and fauna
The island is home to 378 native plants species, 13 mammal species, over 119 species of
terrestrial and migratory birds. Furthermore, there are 43 species of terrestrial reptiles, three
subterranean vertebrates (an eel, a fish, and a snake), over 2000 species of terrestrial
33
invertebrates, and at least 34 species of subterranean invertebrates on the island (Majer et al.,
2013; Moro & Lagdon, 2013). Flora surveys of the island have recorded more than 50
vegetation complexes consisting of 377 vascular taxa (Chevron Australia, 2014b). The flora is
dominated by families such as Poaceae (grasses), Chenopodiaceae (goosefoots), Fabaceae
(legumes, peas, and wattles), Malvaceae (mallows) and Asteraceae (daisies), the genera Triodia
(hummock-forming grasses) and Acacia (wattles) (Mattiske Consulting, 2005)
Marine species native to Barrow Island include the Natator depressus (flat back turtle) and
Chelonia mydas (the green turtle), which are subject to a major on-going scientific study, the
North West Shelf Flatback Turtle Conservation Program (NWSTCP). The NWSTCP aims to
see if the Gorgon Project is significantly impacting the survival and growth of the flatback on
BWI and across the North West Shelf. The project started in 2011 and is expected to continue
for the next 60 years. The flatback turtles are classified as vulnerable under the Environment
Protection and Biodiversity Conservation (EPBC) Act (1999) and under the Western Australian
Biodiversity Conservation Act 2016 and are listed in Schedule 3 (rare or likely to become
extinct) (Department of Biodiversity, 2017).
An on-going environmental program complemented by the biosecurity surveillance program in
place on Barrow Island aims to provide baseline information on the island's ecosystem over the
expected 40-year lifespan of the Gorgon LNG Project (Moro et al., 2013). A baseline survey
was conducted on the island between 2005 and 2009 as part of the environment impact
assessment on Barrow Island for the Gorgon LNG Project. The objectives of the survey were
to describe the diversity and taxonomy of BWI’s invertebrate fauna, determine if any
invertebrate NIS were already present on the island and to understand the determinants of the
34
composition of invertebrate assemblages (Callan et al., 2011) The determinants included soil,
vegetation and seasonal climatic fluctuations which result in hot, humid summers with sporadic
rainfall and cool, dry winters (Chevron Australia, 2005). A total of 1873 species and
morphospecies from 27 invertebrate orders were collected as part of and representing 321
families of invertebrates (Callan et al., 2011). Summary identification of invertebrate species
surveyed showed 1501 species of Insecta, 287 Arachnida, 41 Collembola, 15 Chilopoda, 14
Malacostraca, 12 Mollusca and three Diplopoda.
2.2.5 Non-indigenous species
On BWI there are 25 confirmed NIS and seven putative species whose status is uncertain. These
NIS were present on BWI prior to the commencement of the Gorgon LNG Project (Majer et
al., 2013). A list of non-indigenous invertebrate species on Barrow Island were identified
between 2005 and 2012 (Table 2.1).
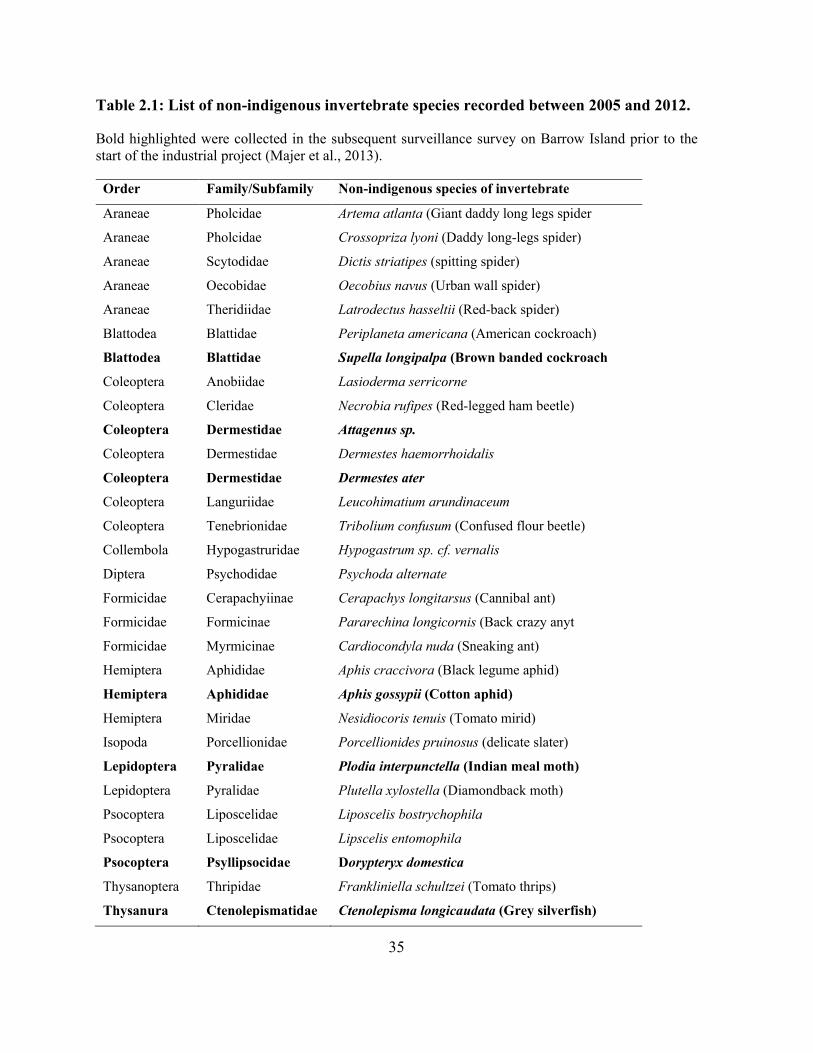
35
Table 2.1: List of non-indigenous invertebrate species recorded between 2005 and 2012.
Bold highlighted were collected in the subsequent surveillance survey on Barrow Island prior to the start of the industrial project (Majer et al., 2013).
Order Family/Subfamily Non-indigenous species of invertebrate
Araneae Pholcidae Artema atlanta (Giant daddy long legs spider
Araneae Pholcidae Crossopriza lyoni (Daddy long-legs spider)
Araneae Scytodidae Dictis striatipes (spitting spider)
Araneae Oecobidae Oecobius navus (Urban wall spider)
Araneae Theridiidae Latrodectus hasseltii (Red-back spider)
Blattodea Blattidae Periplaneta americana (American cockroach)
Blattodea Blattidae Supella longipalpa (Brown banded cockroach
Coleoptera Anobiidae Lasioderma serricorne
Coleoptera Cleridae Necrobia rufipes (Red-legged ham beetle)
Coleoptera Dermestidae Attagenus sp.
Coleoptera Dermestidae Dermestes haemorrhoidalis
Coleoptera Dermestidae Dermestes ater
Coleoptera Languriidae Leucohimatium arundinaceum
Coleoptera Tenebrionidae Tribolium confusum (Confused flour beetle)
Collembola Hypogastruridae Hypogastrum sp. cf. vernalis
Diptera Psychodidae Psychoda alternate
Formicidae Cerapachyiinae Cerapachys longitarsus (Cannibal ant)
Formicidae Formicinae Pararechina longicornis (Back crazy anyt
Formicidae Myrmicinae Cardiocondyla nuda (Sneaking ant)
Hemiptera Aphididae Aphis craccivora (Black legume aphid)
Hemiptera Aphididae Aphis gossypii (Cotton aphid)
Hemiptera Miridae Nesidiocoris tenuis (Tomato mirid)
Isopoda Porcellionidae Porcellionides pruinosus (delicate slater)
Lepidoptera Pyralidae Plodia interpunctella (Indian meal moth)
Lepidoptera Pyralidae Plutella xylostella (Diamondback moth)
Psocoptera Liposcelidae Liposcelis bostrychophila
Psocoptera Liposcelidae Lipscelis entomophila
Psocoptera Psyllipsocidae Dorypteryx domestica
Thysanoptera Thripidae Frankliniella schultzei (Tomato thrips)
Thysanura Ctenolepismatidae Ctenolepisma longicaudata (Grey silverfish)
36
2.3 Biosecurity surveillance to detect incursion of high risk
non-indigenous
The current biosecurity surveillance monitoring programme on Barrow Island incorporates all
NIS, inclusive of invertebrates, vertebrates, plants, and marine species except microorganisms.
The surveillance is aimed at detecting any new NIS arriving on BWI through natural dispersal
or as result of the industrial development of the Gorgon LNG Project (Chevron Australia,
2017). As part of this surveillance program, there are a range of NIS species that have been
classified as high-risk to the island should an establishment occur due to their potential impact
on the natural ecosystem (Chevron Australia, 2005). These include a range of vertebrate,
invertebrate and plant species (see below). The biosecurity surveillance program on the island
ensures that these high-risk species are on priority watch list across to the biosecurity
continuum because of their potential negative effects on the biodiversity and environment on
Barrow Island (Chevron Australia, 2005).
Threats of introducing NIS and marine pests through cargo, vessels and personnel were
identified and analysed using a qualitative risk assessment and prioritisation methodology
(Chevron Australia, 2014b). Species Action Plans (SAPs) were developed where terrestrial NIS
detections of flora and fauna were categorised as follows:
1. exemplar species representing broad taxa were identified by an expert group. An ideal
exemplar species would have been studied and reported extensively with respect to its
ecology and detection,
37
2. NIS present before construction commenced and not covered by exemplar SAPs,
3. established NIS and marine pest species attributable to the Gorgon LNG Development
Project,
4. identified high risk species.
High risk species were identified from a suite of species based on their potential to be
introduced, the difficulty of detecting the species, and the amount of damage they were
perceived to cause should they establish (Chevron Australia, 2017; Stoklosa, 2005). Species
were also identified based on their known invasiveness elsewhere in the world, for example the
highly invasive species Rattus rattus (black rat), Cenchrus ciliaris (buffel grass) and
Hemidactylus frenatus (Asian House Gecko) and Monomorium destructor (Singapore ant).
Between 1999 and 2010 a study on incursions and interceptions of exotic vertebrates in
Australia identified the Asian House gecko as a species with extreme establishment risk, with
a risk score of 0.872 (Henderson et al., 2011). This was based on historical introductions and
climate models using risk assessment models (Bomford, 2008).
Features for identification of high risk species included climate matching with country of
origin, prior invasion success, propagule pressure, physiological tolerance, dispersal mode and
life history (Keller et al., 2007; Mathakutha et al., 2019; Seebens et al., 2017). It should be
highlighted that for Barrow Island, all NIS were unacceptable, and detection was mandatory
(Chevron Australia, 2017; Environmental Protection Authority, 2009).
Invasiveness in plants is generally not a good predictor of impact according to van Klinken et
al. (2013). However, Jelbert et al. (2019) showed that recovery from demographic disturbance
38
and reproductive capacity (fecundity and seedling survival) are useful traits to predict
invasiveness across the plant kingdom.
Exemplar species were identified as being representative of the vertebrate, invertebrate and
plant species likely to be enter and establish on Barrow Island. R. rattus, H. frenatus, C. ciliaris
and Pheidole megacephala (big-headed ant) were identified as exemplar species.
2.3.1 High risk non-indigenous species
Uncertainty resulting from the lack of empirical evidence regarding the threat posed by invasive
species remains high (Duenas et al., 2018). Further, impacts on biodiversity are difficult to
detect, can only be assessed in long term studies and most of the information on invasiveness
has been obtained from historical information around the world (Probert et al., 2020).
The comprehensive listing of species by Callan et al. (2011) provided the basis for the current
on-going monitoring survey on BWI. Introduction of NIS to Barrow Island could potentially
result in decline in biodiversity and extinction of native species through predation, competition
and herbivory, habitat loss/ alteration, disease, interaction among the introduced NIS, and
hybridization (Duenas et al., 2018). Further, native species are highly specialised, referred to
as “ecological naiveté of native biotas” by Moser et al. (2018). This allows ecological niches
to be left under-utilised potentially leaving them open to exploitation by NIS. For example, on
BWI these niches could be occupied by R. rattus whose invasiveness is well documented
(Banks et al., 2012; Bellard et al., 2016; Boey et al., 2019; Harper et al., 2015; Russell et al.,
2017; Witmer et al., 2007). H. frenatus has a high reproductive rate. As such, this species could
proliferate quickly on BWI and displace the native gecko species. It is a potential vector for
39
invasive blood parasites and can cause extensive damage to machinery at the LNG plant,
disrupting power supplies and operations (Barnett et al., 2018; Hoskin, 2011; Vanderduys et
al., 2013; Weterings et al., 2017). However, the Asian House Gecko is a benign threat and
unlikely to become an environmental pest since it mainly inhabits human-altered landscapes
(Vanderduys et al., 2013). Buffel grass (C. ciliaris) is a known aggressive invader and can
cause extensive damage to Barrow Island through ecosystem degradation, habitat loss and
inhibiting plant regeneration and growth through competition (Marshall et al., 2012). Its unique
characteristics, such as a deep root system, extended seed longevity and opportunistic
germination, enable it to survive in the harsh arid condition on Barrow Island while reducing
likelihood of competition, predation, and disease (Godfree et al., 2017; Weterings et.al., 2017).
Buffel grass is highly valued as pasture, and for rehabilitation of mine sites and erosion control,
however, its adverse impacts on biodiversity have been poorly quantified (Marshall et al.,
2012). The big-headed ant (P. megacephala) is a major household pest and has been nominated
as among 100 of the "World's Worst" invaders (Invasive Species Specialist Group, 2020). It is
known to chew on electrical wires, communication cables and any plastic packages. It can
easily be transported in people’s clothing, possessions and footwear, plants, and plant parts, in
soil, sand and gravel (Wetterer, 2012). The big-head ant has the potential to adversely affect
biodiversity on the island as it preys on hatchling birds, baby sea-turtles and nesting sea birds
which are some of the native species on Barrow Island (Wetterer, 2007; Wetterer et al., 2014).
There are a range of invertebrate NIS species that have been classified as high-risk to the island
(Table 2.2), including snail and ant species.
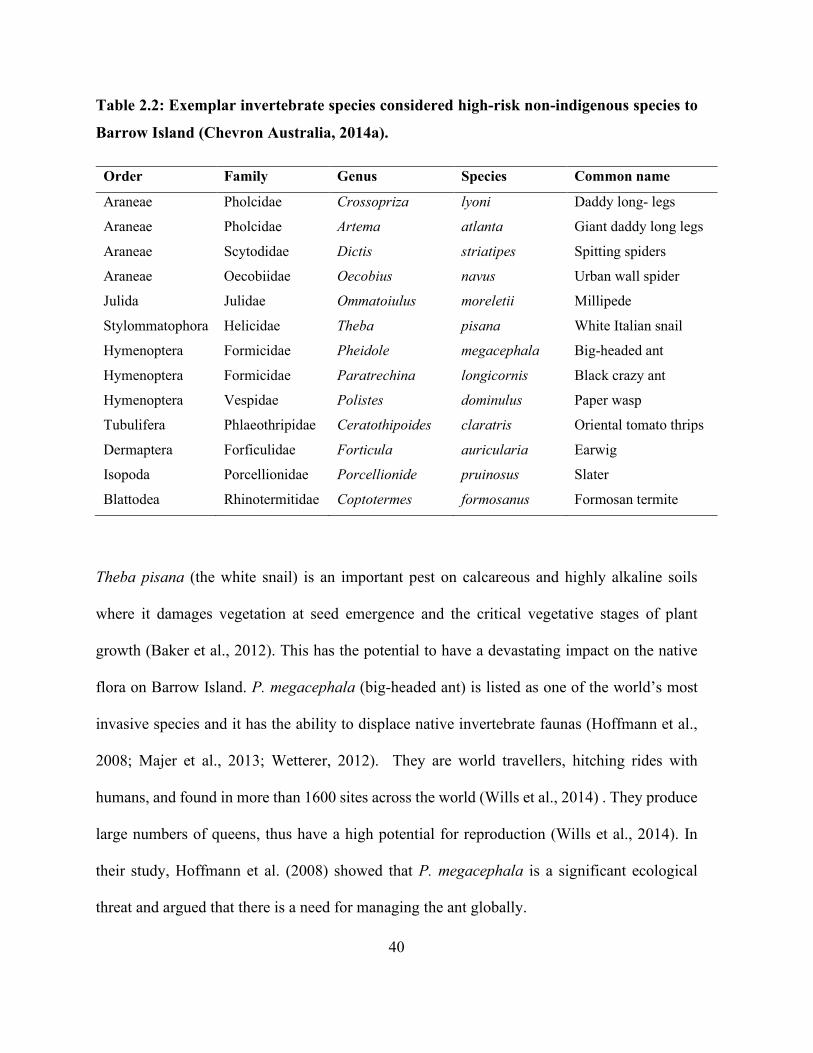
40
Table 2.2: Exemplar invertebrate species considered high-risk non-indigenous species to
Barrow Island (Chevron Australia, 2014a).
Order Family Genus Species Common name
Araneae Pholcidae Crossopriza lyoni Daddy long- legs
Araneae Pholcidae Artema atlanta Giant daddy long legs
Araneae Scytodidae Dictis striatipes Spitting spiders
Araneae Oecobiidae Oecobius navus Urban wall spider
Julida Julidae Ommatoiulus moreletii Millipede
Stylommatophora Helicidae Theba pisana White Italian snail
Hymenoptera Formicidae Pheidole megacephala Big-headed ant
Hymenoptera Formicidae Paratrechina longicornis Black crazy ant
Hymenoptera Vespidae Polistes dominulus Paper wasp
Tubulifera Phlaeothripidae Ceratothipoides claratris Oriental tomato thrips
Dermaptera Forficulidae Forticula auricularia Earwig
Isopoda Porcellionidae Porcellionide pruinosus Slater
Blattodea Rhinotermitidae Coptotermes formosanus Formosan termite
Theba pisana (the white snail) is an important pest on calcareous and highly alkaline soils
where it damages vegetation at seed emergence and the critical vegetative stages of plant
growth (Baker et al., 2012). This has the potential to have a devastating impact on the native
flora on Barrow Island. P. megacephala (big-headed ant) is listed as one of the world’s most
invasive species and it has the ability to displace native invertebrate faunas (Hoffmann et al.,
2008; Majer et al., 2013; Wetterer, 2012). They are world travellers, hitching rides with
humans, and found in more than 1600 sites across the world (Wills et al., 2014) . They produce
large numbers of queens, thus have a high potential for reproduction (Wills et al., 2014). In
their study, Hoffmann et al. (2008) showed that P. megacephala is a significant ecological
threat and argued that there is a need for managing the ant globally.
41
Paratrechina longicornis (black crazy ant) is a pervasive indoor pest and can survive in highly
disturbed and artificial areas such as residences and warehouses (Wetterer, 2008), typical of
some sites on Barrow Island due to the construction of the Gas Project. It can also be found in
plant cavities, rotting wood, debris piles and beaches which are commonplace on Barrow Island
(Nickerson et al., 2019).
2.3.2 High risk non-indigenous vertebrates
Vertebrate species occupy all habitats on Barrow Island. These include the coastal areas,
subterranean caves accessible from the surface, inland scrublands, termite mounds and rocky
outcrops on the west coast (Banks et al., 2012; Moro et al., 2010). Banks et al. (2012) noted
that most successful vertebrate pests exhibit a generalist omnivorous dietary trait which allows
them to access a variety of food sources. Non-indigenous vertebrates have the potential to
destabilize the ecosystem, cause loss of habitat and reduce the local biodiversity (Bomford,
2008). There are a range of NIS vertebrates that are considered high risk species for BWI should
they become established (Table 2.3).
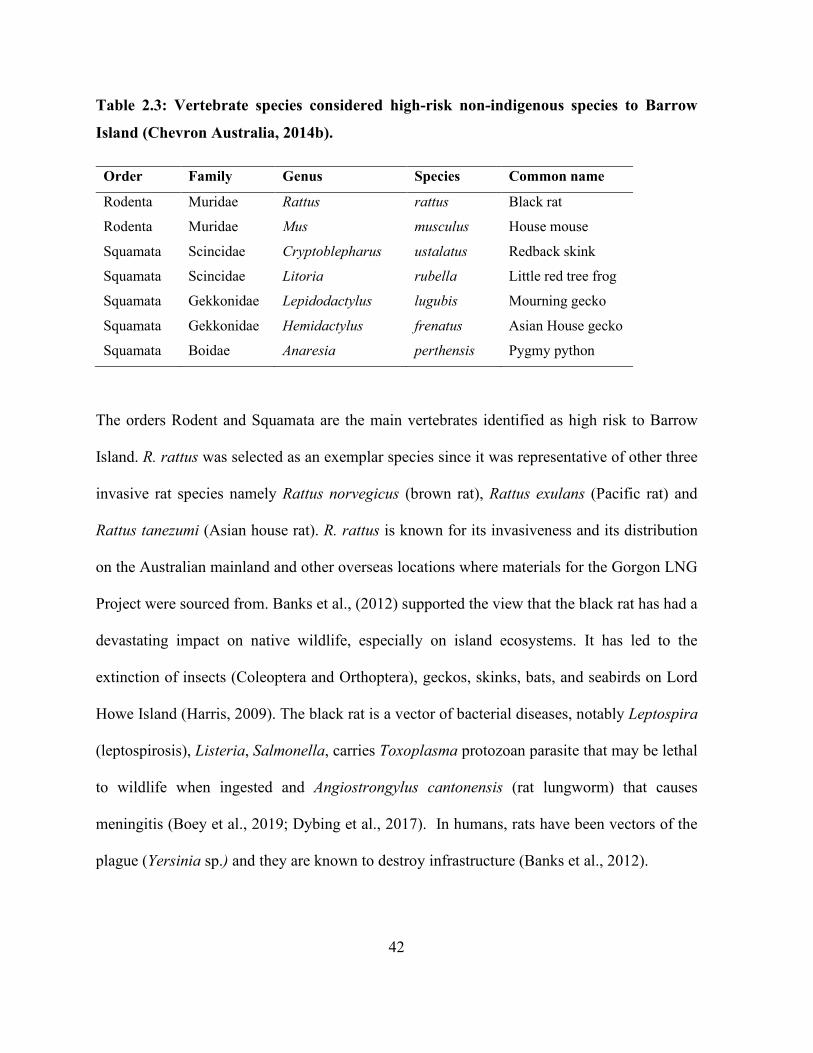
42
Table 2.3: Vertebrate species considered high-risk non-indigenous species to Barrow
Island (Chevron Australia, 2014b).
Order Family Genus Species Common name
Rodenta Muridae Rattus rattus Black rat
Rodenta Muridae Mus musculus House mouse
Squamata Scincidae Cryptoblepharus ustalatus Redback skink
Squamata Scincidae Litoria rubella Little red tree frog
Squamata Gekkonidae Lepidodactylus lugubis Mourning gecko
Squamata Gekkonidae Hemidactylus frenatus Asian House gecko
Squamata Boidae Anaresia perthensis Pygmy python
The orders Rodent and Squamata are the main vertebrates identified as high risk to Barrow
Island. R. rattus was selected as an exemplar species since it was representative of other three
invasive rat species namely Rattus norvegicus (brown rat), Rattus exulans (Pacific rat) and
Rattus tanezumi (Asian house rat). R. rattus is known for its invasiveness and its distribution
on the Australian mainland and other overseas locations where materials for the Gorgon LNG
Project were sourced from. Banks et al., (2012) supported the view that the black rat has had a
devastating impact on native wildlife, especially on island ecosystems. It has led to the
extinction of insects (Coleoptera and Orthoptera), geckos, skinks, bats, and seabirds on Lord
Howe Island (Harris, 2009). The black rat is a vector of bacterial diseases, notably Leptospira
(leptospirosis), Listeria, Salmonella, carries Toxoplasma protozoan parasite that may be lethal
to wildlife when ingested and Angiostrongylus cantonensis (rat lungworm) that causes
meningitis (Boey et al., 2019; Dybing et al., 2017). In humans, rats have been vectors of the
plague (Yersinia sp.) and they are known to destroy infrastructure (Banks et al., 2012).
43
The species were likely introduced in New Zealand around the 1800s by Captain Cooks' vessels
(Atkinson, 1973). R. rattus was first recorded on Barrow Island in 1976 and successfully
eradicated by 1983 (Morris, 2002). Unfortunately, black rats were again detected in 1990 at the
south end of Barrow Island near Middle Island and eradication was successful by 1991 and
none have been detected since (Morris, 2002). St Clair (2011) reviewed 45 publications on the
effects of rodents on island vertebrates of which 31 publications were from New Zealand and
its offshore island. St Clair (2011) concluded that rodents are associated with the decline and
extinction of hundreds of endemic vertebrates on the island ecosystems. Further, large-bodied
invertebrates are most at risk from these rodents (St Clair, 2011).
Lepidodactylus lugubis (the mourning gecko) and H. frenatus (Asian house gecko) are invasive
parthenogenetic (i.e. a single female introduction can establish a population) species that
colonize human habitats and their natural spread is human-mediated as stowaways (Norval et
al., 2014). They are high-risk species because they can invade natural habitats and are
responsible for competitive displacement of similar or smaller sized geckos as it prefers
artificial lit habitats compared to other nocturnal gecko species and have high reproductive rate
(Barnett et al., 2017; Keim, 2002). Barrow Island provides similar environmental conditions
to their native habits, so potentially it would be easy for this species to proliferate and displace
other reptile species. The geckos are nocturnal lizards who prey on insects, spiders, hatchlings,
eggs and juveniles of other species (Hoskin, 2011). Further, H. frenatus carries novel
ectoparasites Geckobia mites (Geckobia bataviensis and Geckobia keegani) that may impact
negatively on the native reptile populations. Hoskin (2011) urged the need to limit the further
44
spread of H. frenatus in natural habitats like Barrow Island and the need for continued vigilance
to prevent further introductions elsewhere in Australia.
Anaresia perthensis (pygmy python) is native to the Pilbara Region, Western Australia (Wilson
et al., 2017). It is usually found on rocky areas and spinifex plains with termite mounds which
are similar to Barrow Island. It also favours large granite outcrops with abundant exfoliation.
However, it can adapt easily to different environments. Its staple diet includes mice and rats,
small birds, and reptiles (geckos). The pygmy python can cause serious predation problems to
the ecosystem.
2.3.3 High risk non-indigenous plant species
Invasive plants can thrive and spread aggressively outside of their native range. They are
associated with a decline in herbaceous species richness or diversity by either altering
communities through competition or displacement of native species (Adair et al., 1997).
Invasive plants irreversibly modify the ecosystem processes, the energy flow, the water and
nutrient cycling and change the micro-climate. Invasive plants can also destroy the wildlife
habitat as well as increase soil erosion (Barney et al., 2013).
Poaceae, Asteraceae, Brassicaceae and Fabaceae (Table 2.4), have been listed as the most
problematic groups of invading plant species and can easily establish monocultures
(Simberloff, 2011). In California, these families make up 75% of the naturalized non-native
species (D’Antonio et al., 2011). They are highly successful in disturbed areas, such as road
and construction sites, and places where the historical type of disturbances have been
suppressed (D’Antonio et al., 2011).
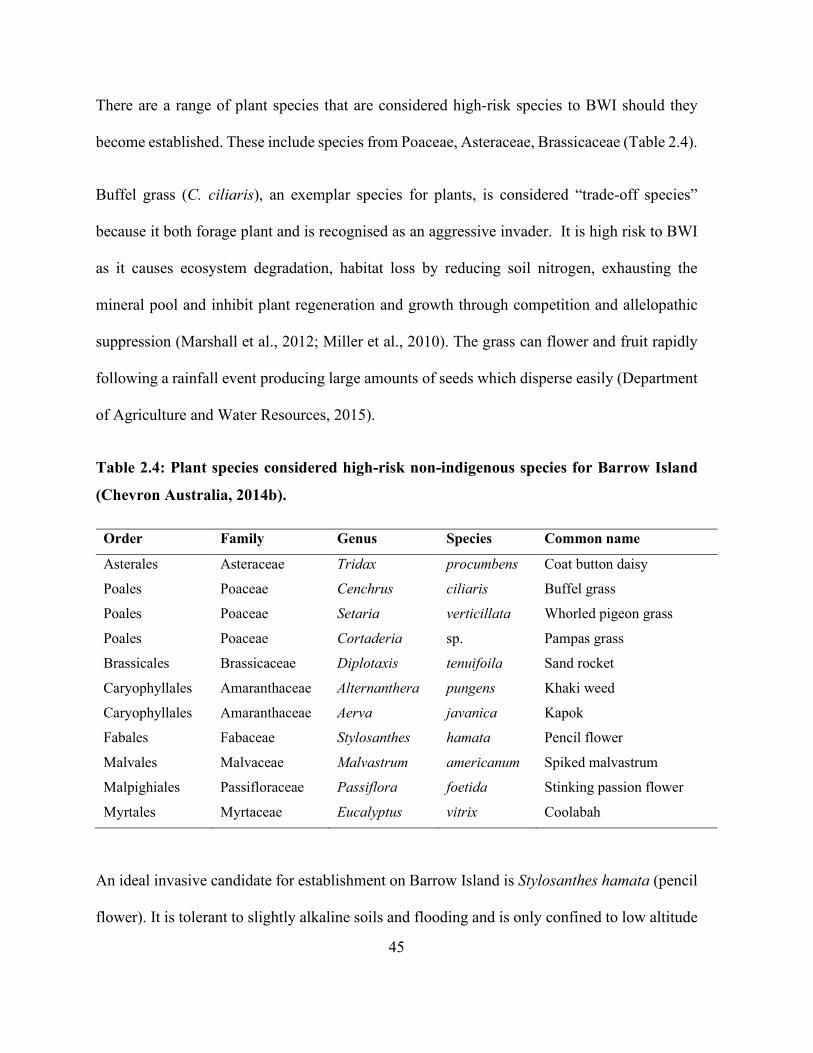
45
There are a range of plant species that are considered high-risk species to BWI should they
become established. These include species from Poaceae, Asteraceae, Brassicaceae (Table 2.4).
Buffel grass (C. ciliaris), an exemplar species for plants, is considered “trade-off species”
because it both forage plant and is recognised as an aggressive invader. It is high risk to BWI
as it causes ecosystem degradation, habitat loss by reducing soil nitrogen, exhausting the
mineral pool and inhibit plant regeneration and growth through competition and allelopathic
suppression (Marshall et al., 2012; Miller et al., 2010). The grass can flower and fruit rapidly
following a rainfall event producing large amounts of seeds which disperse easily (Department
of Agriculture and Water Resources, 2015).
Table 2.4: Plant species considered high-risk non-indigenous species for Barrow Island
(Chevron Australia, 2014b).
Order Family Genus Species Common name
Asterales Asteraceae Tridax procumbens Coat button daisy
Poales Poaceae Cenchrus ciliaris Buffel grass
Poales Poaceae Setaria verticillata Whorled pigeon grass
Poales Poaceae Cortaderia sp. Pampas grass
Brassicales Brassicaceae Diplotaxis tenuifoila Sand rocket
Caryophyllales Amaranthaceae Alternanthera pungens Khaki weed
Caryophyllales Amaranthaceae Aerva javanica Kapok
Fabales Fabaceae Stylosanthes hamata Pencil flower
Malvales Malvaceae Malvastrum americanum Spiked malvastrum
Malpighiales Passifloraceae Passiflora foetida Stinking passion flower
Myrtales Myrtaceae Eucalyptus vitrix Coolabah
An ideal invasive candidate for establishment on Barrow Island is Stylosanthes hamata (pencil
flower). It is tolerant to slightly alkaline soils and flooding and is only confined to low altitude
46
places (Chevron Australia, 2014). It is not suited to cold temperatures experienced at high
altitudes (Stace, 2012) but could cause irreparable damage if it is introduced on Barrow Island.
Passiflora foetida (stinking passionflower) is native to South America and can readily establish
on forest edges, coastal environments, and disturbed areas (Webber et al., 2014; Webber et al.,
2018). The plant is invasive, and it is a biosecurity obligation (everyone is responsible for
managing biosecurity risks that are under their control and that they know about or should
reasonably be expected to know about) to ensure that risk associated with such invasive plants
is minimized (http://www.dpi.qld.gov.au). This comes under the General Biosecurity
Obligation of the Biosecurity Act 2015, Part 3 of the Act (The Biosecurity Act 2015, 2018).
The general biosecurity duty can be found in Part 3 of the Act. Specifically, Section 22 of the
Act provides: “Any person who deals with biosecurity matter or a carrier and who knows, or
ought reasonably to know, the biosecurity risk posed or likely to be posed by the biosecurity
matter, carrier or dealing has a biosecurity duty to ensure that, so far as is reasonably
practicable, the biosecurity risk is prevented, eliminated or minimised.”
(https://www.legislation.gov.au/Series/C2015A00061)
2.3.4 High risk non-indigenous marine species
Many marine NIS remain unrecognised and undetected, while for those confirmed, the
understanding of their impacts is limited (Ojaveer et al., 2015; Chan et al., 2017; Ojaveer et al.,
2018). Further, impacts by marine pests have not been studied sufficiently, both temporally and
spatially to quantify them adequately, and there are a limited number of studies of marine
ecosystems (Hayes et al., 2003; Ruiz et al., 1999). More recent research after the 2000s has
been conducted on marine NIS to aid in improving our current knowledge base, including work
47
by Coutts et al. (2007), Hewitt et al. (2001) and Hewitt et al. (2007). There is no universally
accepted methodology to measure the potential impact of marine NIS, but acceptable
techniques include expert elicitation, stakeholder perceptions and use of empirical studies
(Hayes et al., 2005). Impacts of marine pests include modification of marine ecosystems and
habitats through displacement of native species and/or habitat modification, altered trophic
interactions or food webs, parasitism, herbivory, hybridisation, loss of native genotypes,
bioturbation and change in the community structure (Çinar et al., 2014; Cook et al., 2016; Ruiz
et al., 1999).
Marine pests can be introduced by ballast water discharges, bio-fouling on hulls and inside sea
water pipes on commercial vessels, as well as through marine debris and ocean currents (Hayes
et al., 2019). Worldwide, about three to five billion tonnes of ballast water are transferred
annually across regions (Maritime Llyods Register, 2015). Ballast water improves balance,
stability and structural integrity of ships but has the capacity to transport NIS plants, animals
and microorganisms (Hess-Erga et al., 2018). Effective ballast water treatment and prevention
of biofouling accumulation on submerged structures can effectively reduce the introduction of
marine NIS (Hess-Erga et al., 2018; Ruiz, 2013; Werschkun et al., 2014).
Likelihood of marine NIS establishing on Barrow Island depended on transport pressure (i.e.
opportunity to colonise a vessel for the duration the vessel is in overseas port), transport
survival based on physical and physiological stress during the voyage and inoculation
opportunity once it arrived on Barrow Island (Government of Western Australia, 2016; Hayes
et al., 2005). There are a number of marine species that are considered high-risk species to BWI
should they become established and are on the priority watch list. These were identified as
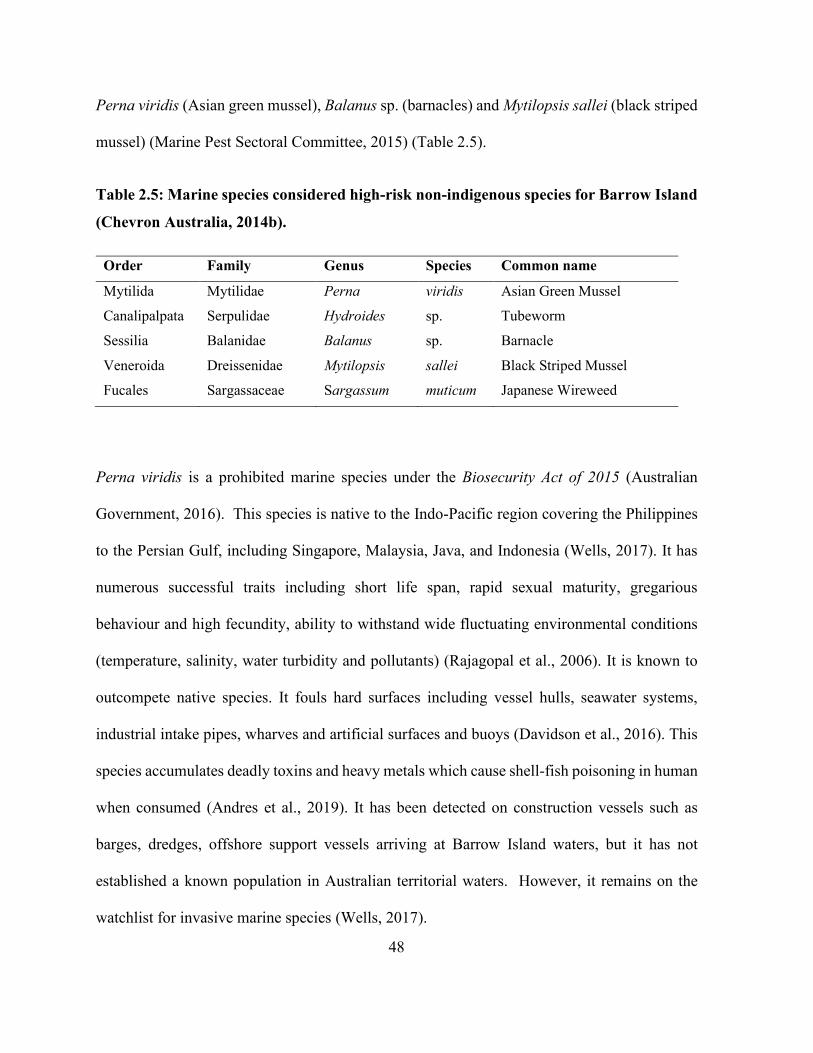
48
Perna viridis (Asian green mussel), Balanus sp. (barnacles) and Mytilopsis sallei (black striped
mussel) (Marine Pest Sectoral Committee, 2015) (Table 2.5).
Table 2.5: Marine species considered high-risk non-indigenous species for Barrow Island
(Chevron Australia, 2014b).
Order Family Genus Species Common name
Mytilida Mytilidae Perna viridis Asian Green Mussel
Canalipalpata Serpulidae Hydroides sp. Tubeworm
Sessilia Balanidae Balanus sp. Barnacle
Veneroida Dreissenidae Mytilopsis sallei Black Striped Mussel
Fucales Sargassaceae Sargassum muticum Japanese Wireweed
Perna viridis is a prohibited marine species under the Biosecurity Act of 2015 (Australian
Government, 2016). This species is native to the Indo-Pacific region covering the Philippines
to the Persian Gulf, including Singapore, Malaysia, Java, and Indonesia (Wells, 2017). It has
numerous successful traits including short life span, rapid sexual maturity, gregarious
behaviour and high fecundity, ability to withstand wide fluctuating environmental conditions
(temperature, salinity, water turbidity and pollutants) (Rajagopal et al., 2006). It is known to
outcompete native species. It fouls hard surfaces including vessel hulls, seawater systems,
industrial intake pipes, wharves and artificial surfaces and buoys (Davidson et al., 2016). This
species accumulates deadly toxins and heavy metals which cause shell-fish poisoning in human
when consumed (Andres et al., 2019). It has been detected on construction vessels such as
barges, dredges, offshore support vessels arriving at Barrow Island waters, but it has not
established a known population in Australian territorial waters. However, it remains on the
watchlist for invasive marine species (Wells, 2017).
49
Sargassum muticum (Japanese Wireweed) is native to Japan but has now spread to China,
Alaska, and California. It is fast growing as it reproduces by self-fertilization. It out-competes
native seaweed and phytoplankton (Salvaterra et al., 2013). This species creates a dense stand
that inhibits penetration of light and increases sedimentation. However, S. muticum also
provides shelter and protection for fish larva or crustaceans as well as laying support for
cuttlefish.
2.4 Adaptability and characteristics of live NIS detected at
border
Duration and conditions during transit affect the survival of species detected at the borders,
which in turn influences the probability of establishment and recruitment in the receiving
environment (Essl et al., 2015; Pyšek et al., 2011). The type and quality of transport mode
contribute to the survival rates of stowaway organisms. For example, flights have the shortest
transit duration, which enhances the chances of survival (Liebert et al., 2006). This is further
compounded by the use of temperature control technologies for specific cargo e.g. food and
perishables that have the potential to harbour invertebrates (Neven et al., 2008). Food items are
a challenging scenario for pest elimination due to pre-sealed packaging or internal
contamination prior to shipment.
Arthropods exhibit characteristics that enhance their survival during transit. Most of them are
prolific breeders and can survive resource shortage (Harrison et al., 2012). For example,
Polistes dominula (paper wasps) has a short development time, breed sacrifice i.e. eggs, larvae
and pupae are fed to offspring when there is a resource shortage, allowing them to maintain
50
production during periods of scarce resources and the capacity to quickly colonise new
environments (Cervo et al., 2000). Ommatoiulus moreletii (Portuguese millipede) can live in
a shipping container for about 3 to 5 days, are resistant to desiccation due to their hard
exoskeleton and exude hydrogen cyanide and quinones that cause stinging, irritation, or
sedation to potential predators (Alagesan, 2016). Seeds are easily dispersed as they can readily
attach to surfaces.
Live NIS are most challenging for biosecurity management because they are a viable incursion
source should they establish in suitable habitats. Determining where live NIS are most likely
to be detected is therefore key to effective biosecurity.
The next chapter will discuss testing of statistical models to show patterns of how NIS were
detected at the biosecurity border of Barrow Island and identify the model best describes the
unique characteristics of biosecurity data.
51
Chapter 3
Characterising biosecurity border detections of
non-indigenous species using mixed-type data
clustering algorithm
Abstract
Appropriate inspection protocols and mitigation strategies are a critical component of effective
biosecurity measures, enabling implementation of sound management decisions. Statistical
models to analyse biosecurity surveillance data are integral to this decision-making process.
This paper focuses on analysing border interception biosecurity data collected from a Class A
Nature Reserve, Barrow Island, in Western Australia. The dataset was fitted with a variety of
models including lognormal linear model, Poisson and negative binomial generalized linear
models, zero-inflated model, a three-component mixture mode and a clustering analysis
approach. A clustering analysis approach was adopted using a generalization of the popular k-
means algorithm appropriate for mixed-type data. The analysis approach involved
determination of the most appropriate number of clusters using just the numerical data, then
subsequently including covariates to the clustering. Based on the counts alone, three clusters
gave an acceptable fit and provided information about the underlying data characteristics.
Incorporation of covariates into the model suggested four distinct clusters dominated by
physical location and type of detection. Availability of more relevant data would greatly
52
improve the model. Broader use of cluster models in biosecurity data is recommended, with
testing of these models on more datasets to validate the model choice and identify important
explanatory variables.
3.1 Introduction
Preventing non-indigenous species (NIS) establishing in new locations is key to effective
biosecurity. Strategies to prevent establishment include prevention of NIS arrival, early
detection, and eradication (Goldson et al., 2016). Preventing NIS arriving, followed by early
detection, are the most effective forms of biosecurity (Hulme, 2006), as once NIS are
established, eradication is problematic (Thresher et al., 2004). Adverse consequences of
invasions vary from the mere presence of NIS in areas where they have not previously been
detected, that are deemed undesirable and detrimental, to the destruction of entire ecosystems
(Mack et al., 2000). As such, it is imperative that NIS are intercepted before they become
established. Stringent border detection contributes significantly to this outcome.
Developing robust inspection protocols and surveillance strategies are critical components of
plant and animal biosecurity measures. Optimizing the use of all available biosecurity detection
data, even when these data are incomplete, coupled with detailed analyses, will enhance the
capacity to make effective biosecurity decisions. If biosecurity measures are sufficiently
competent, there is often a large proportion of zero values for detections, a good indicator that
materials brought in are complying with sanitary and phytosanitary measures (IPPC, 2005).
Generally, biosecurity risk material and pests occur at low densities at biosecurity border
inspections making biosecurity surveillance inevitably imperfect (Hauser et al., 2015). When
53
organisms are detected, values may range from a single organism/unit to extreme values
depending on the type and origin of commodity inspected, pre-border and in-transit quarantine
protocols, and the introductory pathways. The very nature of this data, with large proportions
of zeros, a mixture of distributions and the count nature of data can make statistical analyses of
biosecurity data challenging.
Biosecurity border inspections are important to any biosecurity management programme in
that: 1) interception data provides information about risks associated with individual or groups
of NIS species pests to inform biosecurity actions; 2) provide information about risks
associated with specific commodities and introduction pathways; 3) monitor and evaluate the
effectiveness of phytosanitary treatments and pre-border biosecurity protocols and: 4) in wider
context, border inspections identify risky importing agents for refusal of entry of consignment,
destruction or fines or targeting them with more rigorous inspections (Epanchin-Niell, 2017;
Springborn, 2014). Biosecurity border inspection data are rarely made available other than to
designated organizations and departments (Scott et al., 2017). Data inaccessibility is primarily
due to the complexity of the databases, sensitivity of the information, confidentiality and
privacy concerns, and the potential for misinterpretation and misuse of information, as
evidenced in trade disputes (McCullough et al., 2006).
Probability of border interception changes with inspection effort relative to the volume and
type of cargo, the introductory pathway, and the biological characteristics of the NIS that
influence detection e.g. growth stage (Rebecca Turner et al., 2020). Border interception rate is
a useful proxy for arrival rate for individual species, and was previously thought to be correlated
with establishment probability (Brockerhoff et al., 2006). However, it has since been
54
established that the relationship between interception and establishment is weak, and
interception rates are poor predictors of an incursion (Saccaggi et al., 2016).
A common aim when analysing any data set is to choose an appropriate statistical model from
a set of candidates. Fitting an appropriate statistical model is crucial for correct data
interpretation. The choice of fitted distributions is dictated by either the stochastic process
governing the outcome of interest or by observing its empirical distribution (Delignette-Muller
et al., 2015). Common statistical approaches include normal linear regression with a log-
transformed response and generalized linear models (GLM) with Poisson or negative binomial
distributions for the response (Bolker et al., 2009; McCulloch et al., 2014; Wood, 2017).
With biosecurity data, overdispersion is a problem as data are comprised of counts, and invalid
inferences may occur if overdispersion is not addressed. Overdispersion may result from
population heterogeneity, misspecification of the model, omission of important covariates,
presence of outliers, non-independence of data, and a high proportion of zero events in relation
to the Poisson distribution (Hinde et al., 1998; Lee et al., 2012; Rodrıguez, 2013). The negative
binomial distribution allows for some forms of over-dispersion, notably caused by rare events,
and improves on the use of the standard Poisson (Hilbe, 2011). Using zero-inflated or hurdle
models is a common approach to deal with an excess number of zero counts as well as over-
dispersion. Both models can reduce bias from extreme non-normality of the data and can
provide more accurate estimates of model coefficients than the standard models. As such, these
models are better suited than others to cope with the idiosyncrasies associated with biosecurity
data
55
A more general approach to analysis of biosecurity data is to consider that the data are a mixture
of subgroups. The composition of these clusters can then be examined to provide new insights
into the distribution of the data and the underlying system or process (McLachlan et al., 2019).
Mixture models enable the generalization of distribution assumptions and provide a formal
framework for clustering and classification where the population consists of several
homogenous subpopulations. These types of models can also be used simply as a convenient
mechanism for empirically describing non-standard data or phenomena (Joseph et al., 2009).
For example, in the context of this case study, a mixture model can include components to
describe the large proportions of zero and single counts, as well as relatively large values.
An alternative to mixture modelling is a clustering approach, which can also be used to describe
diverse forms of over-dispersion and population heterogeneity where the distribution might be
multimodal, skewed, or non-standard (Joseph et al., 2009; Melnykov et al., 2010). For example,
in the context of this case study, clusters can be constructed to describe the large proportions
of zero and single counts, as well as relatively large values, and can provide more insight into
characterization of the cluster components with respect to environmental, geographic and other
covariates. Clustering is unsupervised classification where data are classified without the
knowledge of the class labels and provides intuitive interpretation of the relevant aspects of the
data at hand.
Biosecurity data used in this study were collected as part of industrial development on a remote
island (Barrow Island, Australia) and analysed to inform biosecurity management decisions.
The industrial project on the island was permitted with the proviso that no new NIS be
introduced to the island (Environment Protection and Biodiversity Conservation Act, 1999;
56
Government of Western Australia, 2007). To help achieve this, biosecurity surveillance and
management has been conducted on Barrow Island since 2009 and will continue for the life of
the project. Biosecurity surveillance data is used to assess the success of the various aspects of
an on-going environmental program complemented by pre-border inspection protocols, a
border clearance program, and post-border biosecurity surveillance program.
For my study, border inspection data collected on Barrow Island between 2009 and 2015 during
the construction phase of the liquefied natural gas (LNG) plant on the island was used. The data
were used to assess the contribution of type of detection, phase of project, season, and physical
inspection location on the island in characterizing biosecurity border detection events.
The aim of this manuscript is to analyse the border interception biosecurity data collected at
Barrow Island, testing various models to determine which model best describes border
interception data of terrestrial NIS on the island. Various alternative models are tested
sequentially, starting with the standard Poisson and negative binomial models as the
benchmarks, variants of the zero-inflated model, mixture models and finally clustering model.
The clustering approach was explored in detail to assess whether the recorded explanatory
variables can adequately characterize biosecurity border detections of terrestrial NIS coming
through to the island. Two complementary analyses approaches were used, without and with
covariates included in the model. This paper follows preliminary analyses conducted on
invasive terrestrial species on Barrow Island by Scott et al. (2017). The overarching goal of the
research is to improve biosecurity management protocols and strategies to minimize the
introduction of NIS in a global context.
57
3.2 Materials and methods
3.2.1 Study site
Barrow Island (BWI) is located at 200 45´S, 115025´E, and 56 km off the mainland of
Australia. It is 25 km long, 10 km wide, covering an area of approximately 23 400 hectares
above the high-tide mark (Chevron Australia, 2014b) (Figure 3.1) The Gorgon Liquefied
Natural Gas Project (LNG) plant is situated on BWI and was developed to process extensive
gas resources from the Gorgon and Jansz-Io gas fields in the North-West Basin, Australia. The
Gorgon LNG Plant occupies 300 ha, about 1.3% of the Barrow Island land area. The Quarantine
Management System (QMS) was developed by Chevron and implemented to protect the
conservation values of Barrow Island (Chevron Australia, 2014a; Scott et al., 2017). The
overarching aim of the QMS was to prevent the introduction and establishment of vertebrate,
invertebrate, and plant NIS (Majer et al., 2013). The biosecurity protocols implemented were
specific to identified risks and the implementation of safeguards for the diverse types of cargo
and within the logistic chain, e.g. site management, quarantine management plans for
contractors and vendors. Types of biosecurity risk material were categorized into five groups:
vertebrates, invertebrates, seed, soil/organic matter, and other plant material.
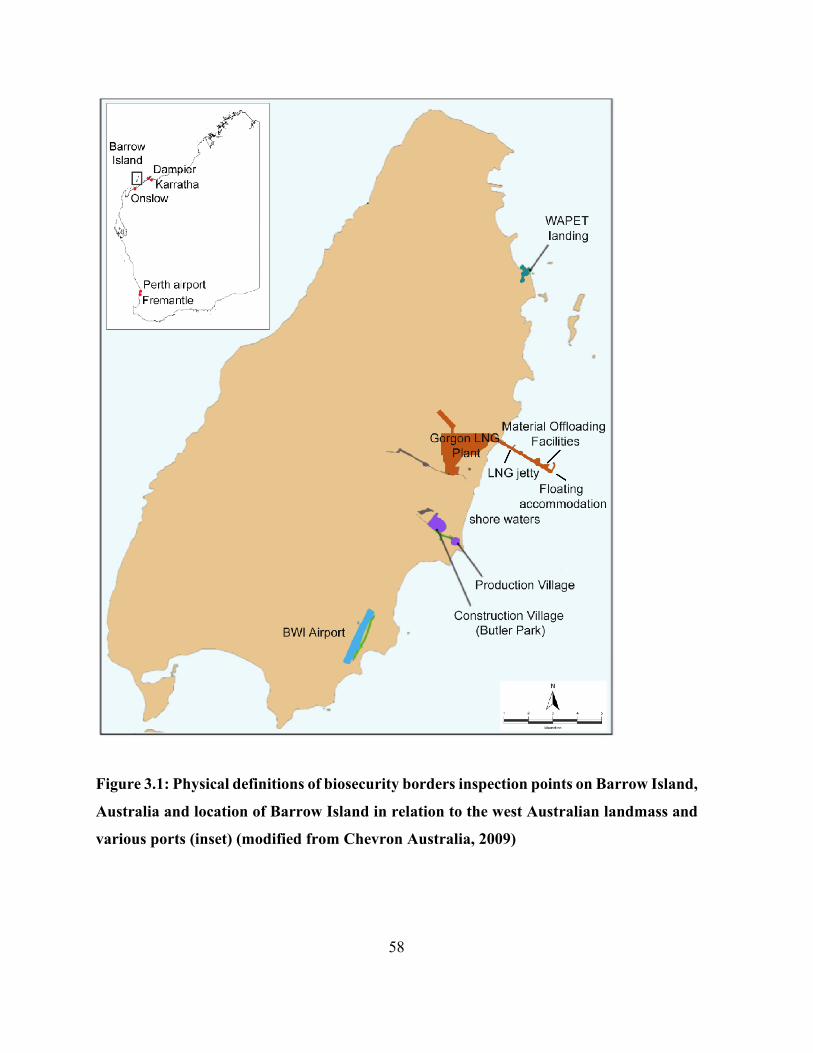
58
Figure 3.1: Physical definitions of biosecurity borders inspection points on Barrow Island,
Australia and location of Barrow Island in relation to the west Australian landmass and
various ports (inset) (modified from Chevron Australia, 2009)
59
3.2.2 Border biosecurity inspection protocols
In biosecurity, a border is the point of entry of goods by land, air, or sea into a designated area
for quarantine purposes. Border inspection points at BWI were identified as Perth Airport, BWI
Material Offloading Facilities (MOF), and Western Australian Petroleum Landing Site Landing
(WAPET Landing) (Figure 3.1). Secondary border inspection was after final cargo clearance
and included points where the consignments were offloaded for use on BWI, such as the
Gorgon LNG Plant, the Construction Village, the Production Village, and Western Australia
(WA) Oil Camp and Others represented the remaining inspection points of Barrow Island (i.e.
Permanent Operating Facility/ Gas Treatment Plant/Quarantine Approved Premises). Border
detection was primarily through biosecurity surveillance and secondly by citizen science since
all personnel coming to work on the island are trained and obligated to report any suspected
NIS plant or animal species.
Border inspection methods included visual, manual, and physical inspection, detector dogs, and
x-ray technology (Wintle et al., 2015). A cabinet x-ray was used for passenger screening at
airports (Chevron Australia, 2005; Stoklosa, 2005). A colour-coded tagging system and
inspection process was implemented to ensure compliance with all biosecurity management
activities. This ensured that one hundred percent of cargo transported to Barrow Island was
inspected (Scott et al., 2017).
60
3.3 Statistical methodology
3.3.1 Data collection
The dataset used for this study was collected during the construction phase on Barrow Island,
between 2009 and 2015. The unit of inspection, termed the Material Management Ticket
(MMT), was used for biosecurity inspection on the island. The MMT is a system used to
track the movement of materials and can include one or several containers, or groupings of
similar materials for biosecurity inspection (Scott et al., 2017). An MMT can also encompass
one or more inspections. When no NIS was found during cargo inspection, results of
inspection were recorded as zero. Otherwise, a detailed set of records was recorded for
positive detections. A detection was either a specimen of an organism or multiple specimens
of an organism (Scott et al., 2017). A unit was an individual count of the type of material
detected.
When an MMT was identified as positive, appropriate remedial treatment action was applied,
e.g. fumigation or the item was refused entry. Cargo were re-inspected at sites where the goods
were to be used and can be considered as a quality assurance measure to ensure that the cargo
reaching the island was free of NIS.
Data were classified into four seasons representing the time periods: January-March (autumn -
1), April-June (winter- 2), July-September (spring - 3) and October-December (summer - 4).
Construction activities were described as phases: early construction (2009-2011), main
construction phase (2012-2014), and transition phase (2015). Early construction phase
consisted mostly of site preparations and earthworks; while main construction phase consisted
61
mainly of major construction activities relating to the building of the three liquefied natural gas
(LNG) processing plants and all the supporting infrastructure such as gas turbine generators,
slug catchers, Boil Off Gas (BOG) flare, MR/PR compressors. Finally, the transitional phase
consisted of preparations for start-up, commissioning tests and eventual start-up and initial
operations. As such, the amount of cargo, type of cargo and personnel reaching biosecurity
borders on the island varied significantly as the project progressed, directly impact the number
of biosecurity detections.
3.3.2 Implementation of models
Preliminary model testing and comparisons of univariate distributions were made using the
MASS and fitdistrplus packages in R (Delignette-Muller et al., 2015; R Team, 2018; Venables
et al., 2013). The libraries in R used for fitting mixture models were mixtools (Benaglia et al.,
2009; Young et al., 2017), gamlss.mx, (Stasinopoulos et al., 2017). The three-component log-
normal mixture model was fitted using R2WinBUGS (Sturtz et al., 2005). The resulting three-
component log-normal mixture model is given as:
𝑦𝑦𝑖𝑖 = 𝑤𝑤1𝐿𝐿𝐿𝐿(𝜇𝜇1,𝜎𝜎12) + 𝑤𝑤2𝐿𝐿𝐿𝐿(𝜇𝜇2,𝜎𝜎22) + 𝑤𝑤3𝐿𝐿𝐿𝐿(𝜇𝜇3,𝜎𝜎32) Equation 3.1
The Akaike Information Criterion (AIC) was used to assess model fit. The best model was
selected by using the difference between model AIC and minimum AIC (Δ𝑖𝑖). Models having
∆𝑖𝑖 ≤ 2 can be considered equally superior (Burnham et al., 2004).
62
3.3.3 Clustering of mixed type data
Distance-based algorithms such as k-means are very popular due to their simplicity,
interpretability, and ease of implementation. Further, statistically desirable characteristics of
the clusters include the stability of identified clusters, independence of variables within a
cluster, and the degree to which a cluster can be well-represented by its centroid in mixed data
type (Foss et al., 2018; Foss et al., 2019). A popular approach that allows for mixed-type data
is Huang's k-prototypes algorithm (Huang, 1998; van de Velden et al., 2019), which calculates
the distances between objects and cluster centroids for categorical and continuous variables,
and combines them in a single objective function. For k-prototypes, cluster centres are
represented by mean values for numeric features and mode values for categorical features.
Two clustering analyses were considered here. The first involved clustering only the response
data and the second included both the response variable and covariates.
For the first cluster analysis, many available software packages analyse univariate continuous
data (Kossmeier et al., 2020; Zhang et al., 2015). Here, the Ckmeans.1d.dp algorithm (Song et
al., 2020) was implemented using Ckmeans.1d.dp in R software, to determine the clusters using
univariate log-transformed detection counts. The algorithm guarantees the optimality of
clustering by ensuring that the total of within-cluster sums of squares is always the minimum
given the number of clusters k.
For the second analysis, several software packages in R are available for clustering mixed-type
data (clustMixType (Szepannek, 2018), clustMD (McParland et al., 2017), Gower's similarity
matrix (Gower, 1971), ClustOfVar (Chavent et al., 2011) and CluMix (Hummel et al., 2017)).
63
Here, the clustMixType package in R (Szepannek, 2018) based on Huang's k-prototype
algorithm (Huang, 1998) was used to assess the role of covariates: seasons, construction phases,
and physical locations/sites where the biosecurity inspection was done. This package allows
using a combination of both numeric and categorical data in model fitting. The k-prototypes
algorithm used belongs to the family of partitional cluster algorithms (Ahmad et al., 2019).
The steps of the algorithm were:
i. Select k initial prototypes for k clusters from the date set X
ii. For each observation:
a. assign observations to its closest prototype according to d ().
b. update cluster prototypes by cluster-specific means/modes for all
variables.
iii. Repeat Step 2 until no data object has changed clusters after a full cycle test of X.
Clusters are assigned using:
d (x, y) = d_{euclid} (x, y) + λ d_ {simple, matching} (x,y) Equation 3.2 (Szepannek, 2018)
For numeric explanatory variables, results are given as summary statistics for each cluster,
while for categorical variables, the results are as a proportion of the contribution of each factor
level across each cluster in a tabular form. Further, summary profile histograms of the
explanatory variables are given as well. The clusters are mutually exclusive.
The covariates represent the temporal aspect of the data since the data was collected over a
period (2009-2015) where seasonality and other construction activities have a direct impact on
the number and type of units detected.
64
3.3.4 Bayesian model fitting in WINBUGS
The Bayesian mixture model was implemented in WinBUGS using Gibbs Sampler, developed
by the MRC, Biostatistics Group, Institute of Public Health (www.mrc-bsu.cam.ac.uk/bugs).
It uses Markov-chain Monte Carlo algorithm to generate random samples from a series of
conditional posterior distributions of all unknown quantities in the model (Spade, 2020). Prior
distributions (or priors) represent the uncertainty of the model parameters being estimated.
Incorporating informed priors into the estimation process can improve convergence and
improve the accuracy of latent class recovery ( (Depaoli et al., 2017). The two main priors that
have the largest impact on final model estimates are (a) the prior for the class proportions, and
(b) the prior for the covariance matrix (Depaoli et al., 2017). The prior distribution used for the
latent class proportions in this mixture model was the Dirichlet distribution. Proportions
(p1…pK) for C latent classes are modelled Dirichlet (D) such that: (𝑝𝑝1 … 𝑝𝑝𝑘𝑘 ) D (𝛿𝛿1 …
𝛿𝛿𝑘𝑘),where all proportions (p) sum to 1.0, and the 𝛿𝛿 elements represent the hyperparameters of
the Dirichlet prior distribution (Nasserinejad et al., 2017). Once the model has been fitted, the
convergence of the Markov-chain Monte Carlo (MCMC) is checked using trace plots. The plot
should show consistent oscillograms around a horizontal line without any trend (Roy, 2020).
Autocorrelation plots check for convergence between samples returned by the MCMC model.
The lag-k autocorrelation is the correlation between every sample and the sample k-steps before
it. Autocorrelation should decrease as the iterations of the MCMC increase. An additional
statistic that can be used to monitor convergence of a chain is Rhat (𝑅𝑅)�, the potential scale
reduction statistic (PSRF) (Gelman et al., 2014). Rhat is a measure of the ratio of the average
variance of draws within each chain to the variance of the pool draws across chains. If the
65
chains are at equilibrium, then (𝑅𝑅)� will be 1 (Gelman et al., 2014). The effective sample size
(n.eff) is number of independent samples equivalent to a set of Markov chain sample with the
same standard error as a correlated sample. The larger (n.eff) the better, n.eff less than 100 are
poor estimators of the parameter, while n.eff greater than 10000 may be a waste of
computational resources (Kass et al., 1998; Ryan Turner et al., 2017).
When using finite mixture models, each cluster is assumed to follow some parametric
distribution and the parameters are typically estimated using the EM (expectation-
maximization) algorithm as shown in a number of publications (Alston et al., 2013; McLachlan
et al., 2019; Mengersen et al., 2011; Scollnik, 2018)
3.3 Results
3.4.1 Data description
In total, over 600,000 inspections were conducted during the period December 2009 to
December 2015, with only 5,380 biosecurity risk material detections, which translates to
approximately 1% of the inspections. For this study, soil/organic matter data were excluded as
it was privy to a different type of biosecurity assessment and analyses, hence the final sample
size used was 5,325 units (Table 3.1).
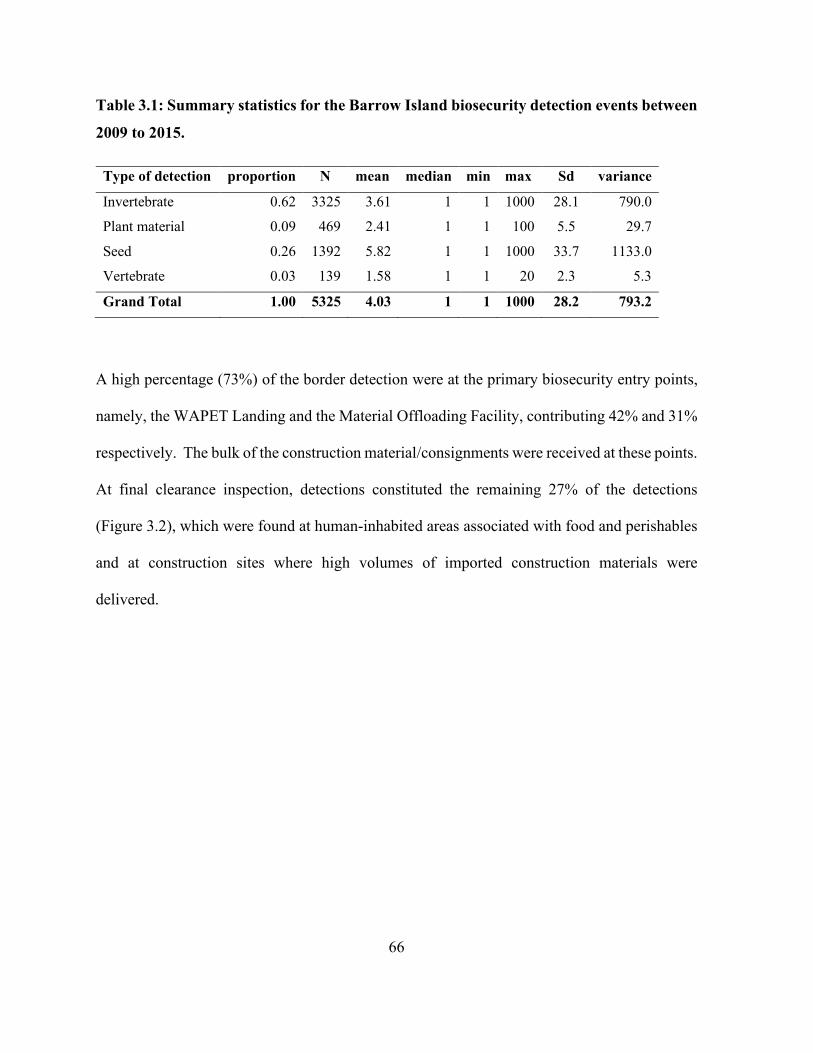
66
Table 3.1: Summary statistics for the Barrow Island biosecurity detection events between
2009 to 2015.
Type of detection proportion N mean median min max Sd variance
Invertebrate 0.62 3325 3.61 1 1 1000 28.1 790.0
Plant material 0.09 469 2.41 1 1 100 5.5 29.7
Seed 0.26 1392 5.82 1 1 1000 33.7 1133.0
Vertebrate 0.03 139 1.58 1 1 20 2.3 5.3
Grand Total 1.00 5325 4.03 1 1 1000 28.2 793.2
A high percentage (73%) of the border detection were at the primary biosecurity entry points,
namely, the WAPET Landing and the Material Offloading Facility, contributing 42% and 31%
respectively. The bulk of the construction material/consignments were received at these points.
At final clearance inspection, detections constituted the remaining 27% of the detections
(Figure 3.2), which were found at human-inhabited areas associated with food and perishables
and at construction sites where high volumes of imported construction materials were
delivered.
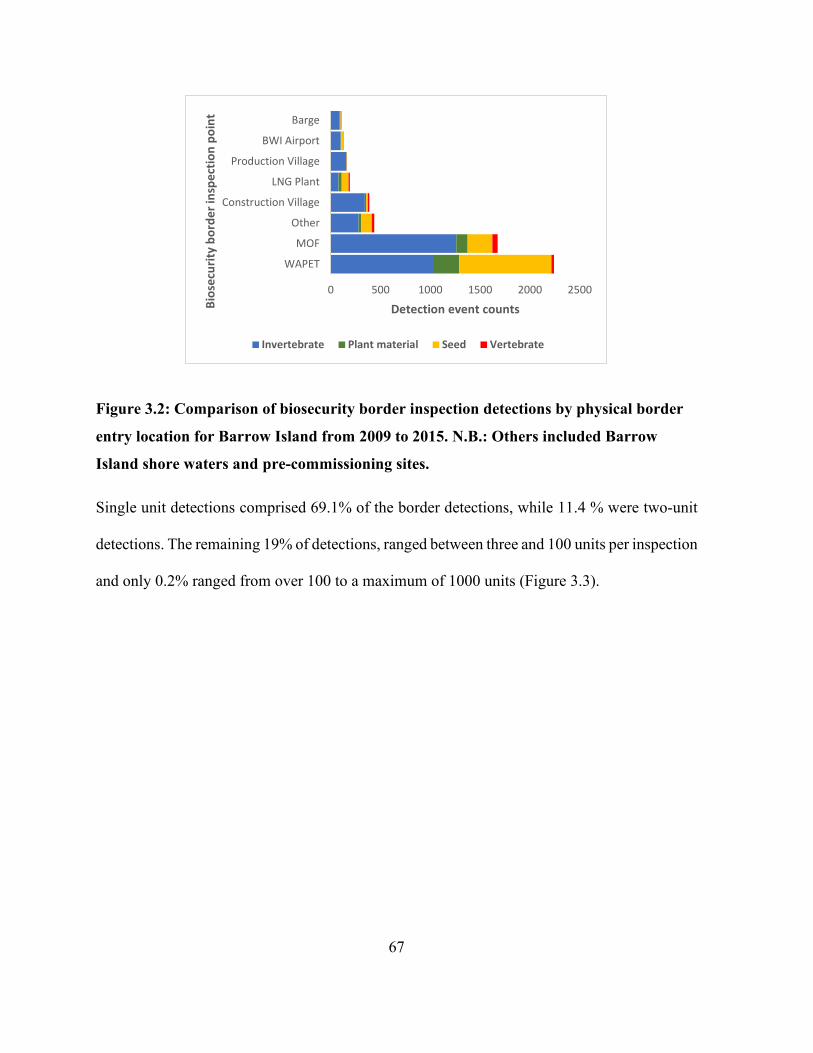
67
Figure 3.2: Comparison of biosecurity border inspection detections by physical border
entry location for Barrow Island from 2009 to 2015. N.B.: Others included Barrow
Island shore waters and pre-commissioning sites.
Single unit detections comprised 69.1% of the border detections, while 11.4 % were two-unit
detections. The remaining 19% of detections, ranged between three and 100 units per inspection
and only 0.2% ranged from over 100 to a maximum of 1000 units (Figure 3.3).
0 500 1000 1500 2000 2500
WAPET
MOF
Other
Construction Village
LNG Plant
Production Village
BWI Airport
Barge
Detection event countsBios
ecur
ity b
orde
r ins
pect
ion
poin
t
Invertebrate Plant material Seed Vertebrate
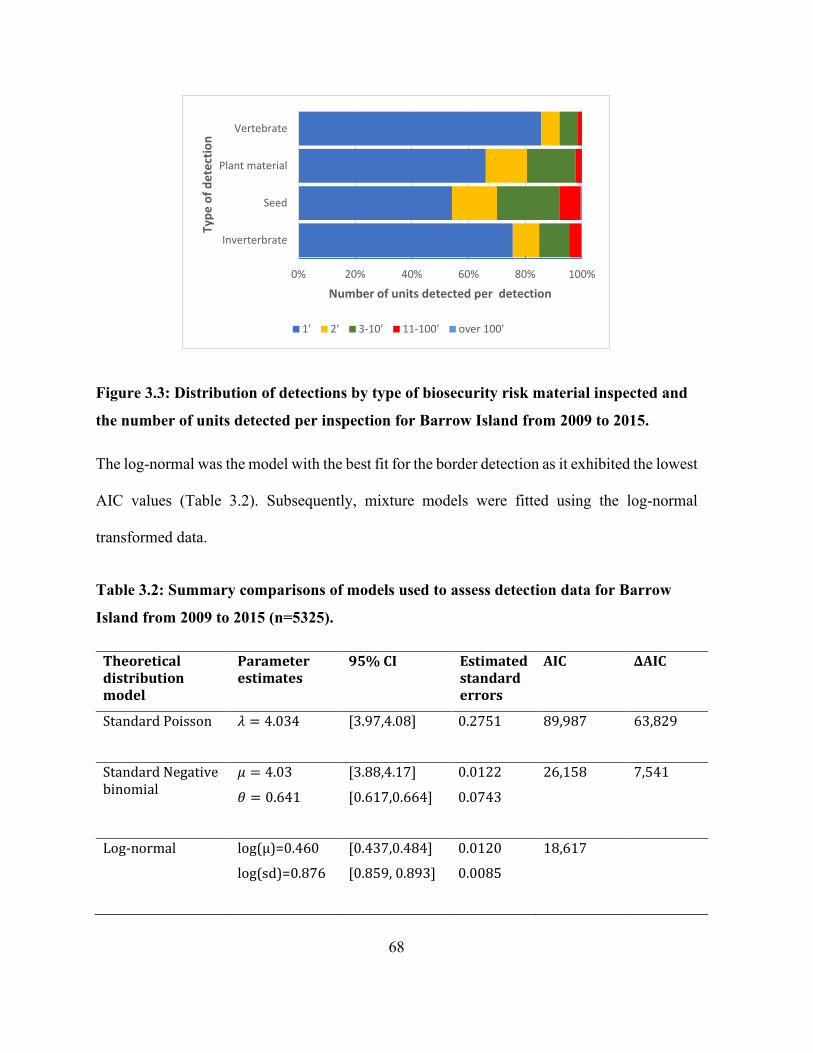
68
Figure 3.3: Distribution of detections by type of biosecurity risk material inspected and
the number of units detected per inspection for Barrow Island from 2009 to 2015.
The log-normal was the model with the best fit for the border detection as it exhibited the lowest
AIC values (Table 3.2). Subsequently, mixture models were fitted using the log-normal
transformed data.
Table 3.2: Summary comparisons of models used to assess detection data for Barrow
Island from 2009 to 2015 (n=5325).
Theoretical distribution model
Parameter estimates
95% CI Estimated standard errors
AIC ∆AIC
Standard Poisson
𝜆𝜆 = 4.034 [3.97,4.08] 0.2751 89,987 63,829
Standard Negative binomial
𝜇𝜇 = 4.03
𝜃𝜃 = 0.641
[3.88,4.17]
[0.617,0.664]
0.0122
0.0743
26,158
7,541
Log-normal log(µ)=0.460
log(sd)=0.876
[0.437,0.484]
[0.859, 0.893]
0.0120
0.0085
18,617
0% 20% 40% 60% 80% 100%
Inverterbrate
Seed
Plant material
Vertebrate
Number of units detected per detection
Type
of d
etec
tion
1' 2' 3-10' 11-100' over 100'
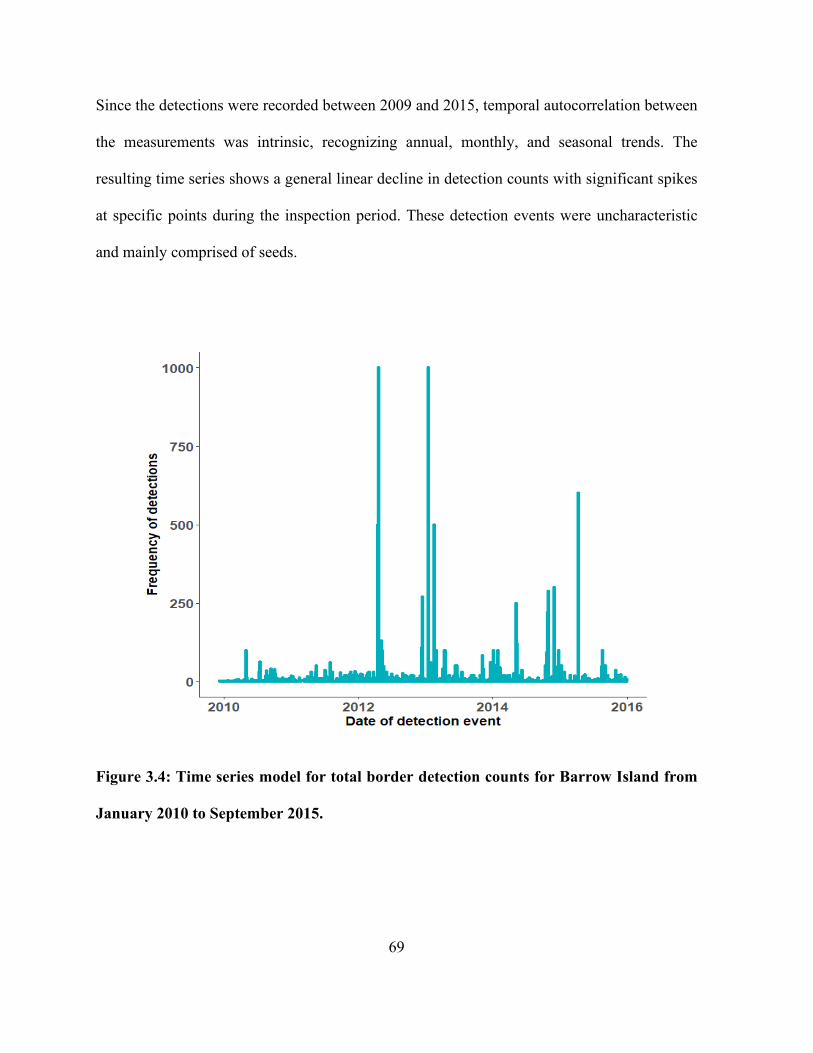
69
Since the detections were recorded between 2009 and 2015, temporal autocorrelation between
the measurements was intrinsic, recognizing annual, monthly, and seasonal trends. The
resulting time series shows a general linear decline in detection counts with significant spikes
at specific points during the inspection period. These detection events were uncharacteristic
and mainly comprised of seeds.
Figure 3.4: Time series model for total border detection counts for Barrow Island from
January 2010 to September 2015.
70
3.4.2 Three-component log-normal mixture model
A point mass was fitted for the single organism counts (𝒘𝒘𝟏𝟏 ), followed by a component for the
moderate organism counts i.e. 2-104 units (𝒘𝒘𝟐𝟐) and finally the third component for the
extremely high values (𝒘𝒘 𝟑𝟑). The marginal posterior distributions for each component and
parameter estimates are provided in (Table 3.3). The single organism detections component
(𝒘𝒘𝟏𝟏 ) contributed 69% of the detections, moderate counts (𝒘𝒘𝟐𝟐 ) contributed 26%, while the
extremely high values 𝑤𝑤3 accounted for the remaining 3%.
Three MCMC chains were used , each with 10 000 iterations, with the first 5000 discarded.
Thinning was kept at 1 so that all the data values would be retained. Rhat for all the parameter
estimates were at 1 indicating that the chains were at equilibrium. Effective sample sizes (n.eff)
are above 100 which reflects good sample sizes (Table 3.3).
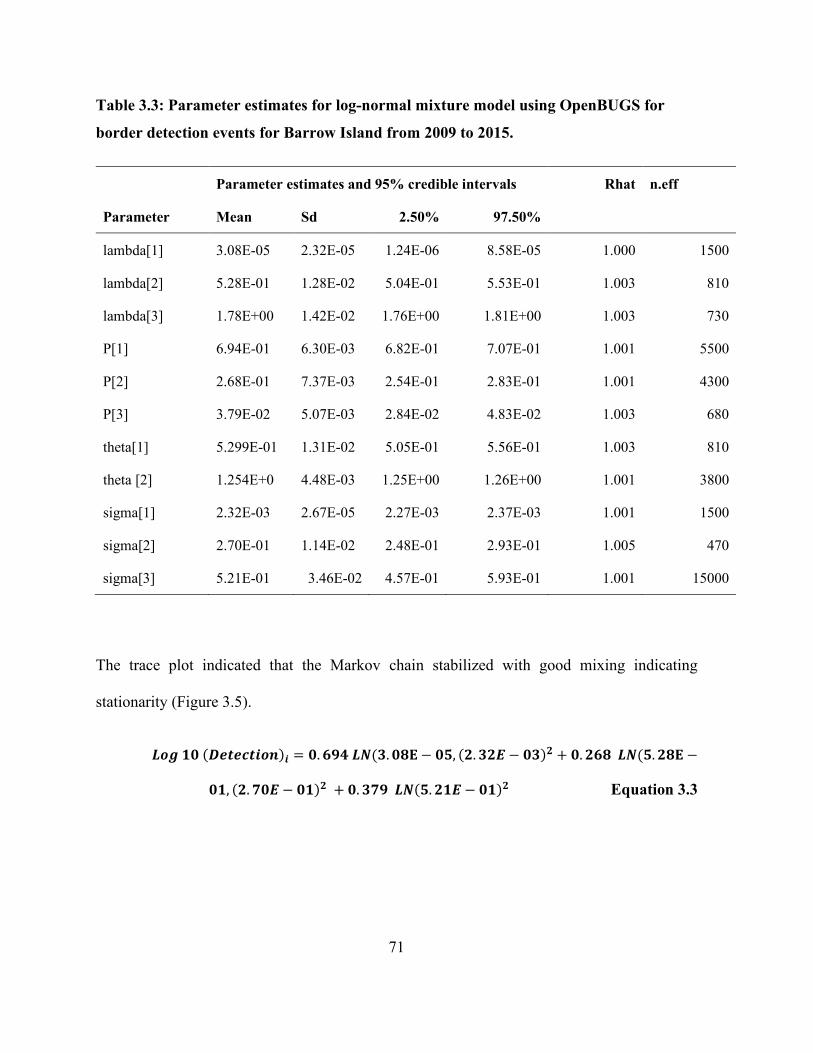
71
Table 3.3: Parameter estimates for log-normal mixture model using OpenBUGS for
border detection events for Barrow Island from 2009 to 2015.
Parameter estimates and 95% credible intervals Rhat n.eff
Parameter Mean Sd 2.50% 97.50%
lambda[1] 3.08E-05 2.32E-05 1.24E-06 8.58E-05 1.000 1500
lambda[2] 5.28E-01 1.28E-02 5.04E-01 5.53E-01 1.003 810
lambda[3] 1.78E+00 1.42E-02 1.76E+00 1.81E+00 1.003 730
P[1] 6.94E-01 6.30E-03 6.82E-01 7.07E-01 1.001 5500
P[2] 2.68E-01 7.37E-03 2.54E-01 2.83E-01 1.001 4300
P[3] 3.79E-02 5.07E-03 2.84E-02 4.83E-02 1.003 680
theta[1] 5.299E-01 1.31E-02 5.05E-01 5.56E-01 1.003 810
theta [2] 1.254E+0 4.48E-03 1.25E+00 1.26E+00 1.001 3800
sigma[1] 2.32E-03 2.67E-05 2.27E-03 2.37E-03 1.001 1500
sigma[2] 2.70E-01 1.14E-02 2.48E-01 2.93E-01 1.005 470
sigma[3] 5.21E-01 3.46E-02 4.57E-01 5.93E-01 1.001 15000
The trace plot indicated that the Markov chain stabilized with good mixing indicating
stationarity (Figure 3.5).
𝑳𝑳𝑳𝑳𝑳𝑳 𝟏𝟏𝟏𝟏 (𝑫𝑫𝑫𝑫𝑫𝑫𝑫𝑫𝑫𝑫𝑫𝑫𝑫𝑫𝑳𝑳𝑫𝑫)𝑫𝑫 = 𝟏𝟏.𝟔𝟔𝟔𝟔𝟔𝟔 𝑳𝑳𝑳𝑳(𝟑𝟑.𝟏𝟏𝟎𝟎𝟎𝟎 − 𝟏𝟏𝟎𝟎, (𝟐𝟐.𝟑𝟑𝟐𝟐𝟑𝟑 − 𝟏𝟏𝟑𝟑)𝟐𝟐 + 𝟏𝟏.𝟐𝟐𝟔𝟔𝟎𝟎 𝑳𝑳𝑳𝑳(𝟎𝟎.𝟐𝟐𝟎𝟎𝟎𝟎 −
𝟏𝟏𝟏𝟏, (𝟐𝟐.𝟕𝟕𝟏𝟏𝟑𝟑 − 𝟏𝟏𝟏𝟏)𝟐𝟐 + 𝟏𝟏.𝟑𝟑𝟕𝟕𝟔𝟔 𝑳𝑳𝑳𝑳(𝟎𝟎.𝟐𝟐𝟏𝟏𝟑𝟑 − 𝟏𝟏𝟏𝟏)𝟐𝟐 Equation 3.3
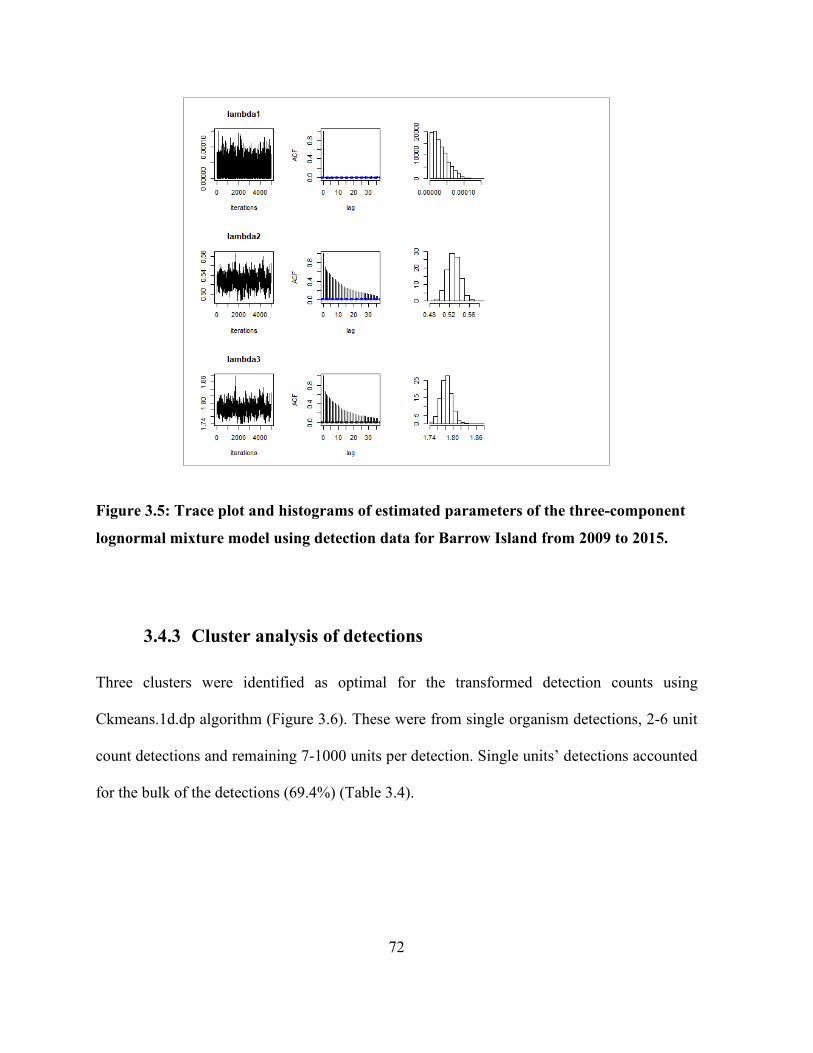
72
Figure 3.5: Trace plot and histograms of estimated parameters of the three-component
lognormal mixture model using detection data for Barrow Island from 2009 to 2015.
3.4.3 Cluster analysis of detections
Three clusters were identified as optimal for the transformed detection counts using
Ckmeans.1d.dp algorithm (Figure 3.6). These were from single organism detections, 2-6 unit
count detections and remaining 7-1000 units per detection. Single units’ detections accounted
for the bulk of the detections (69.4%) (Table 3.4).
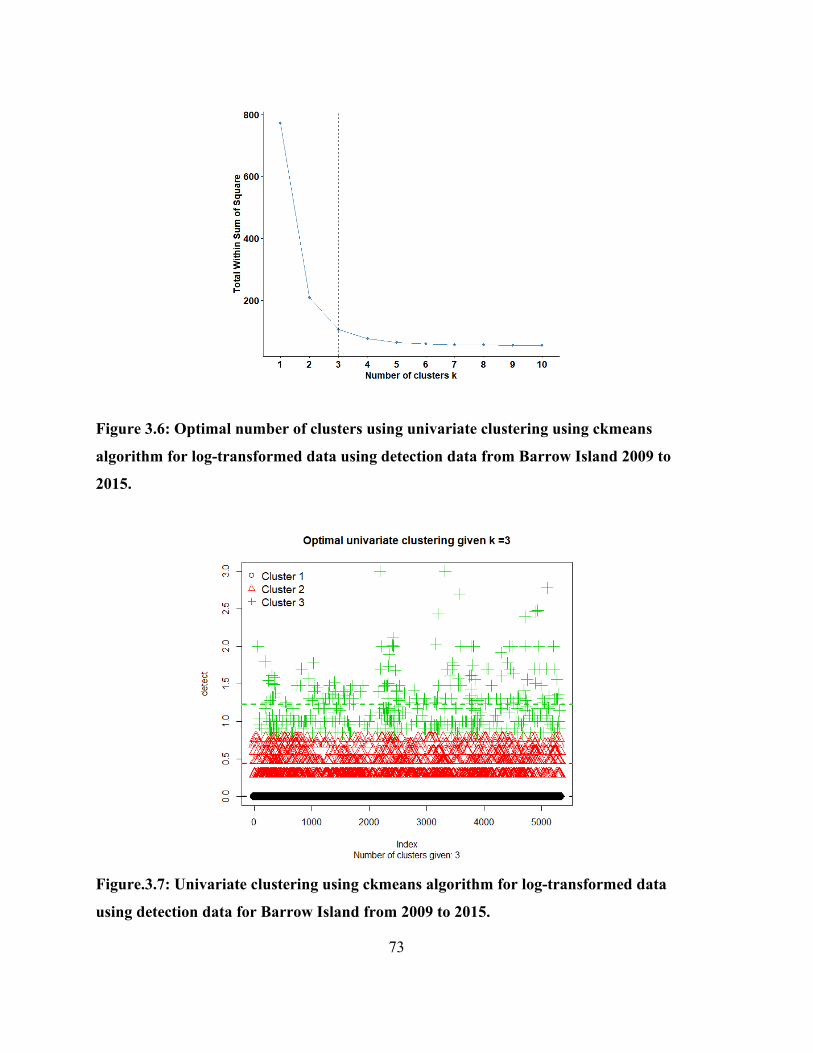
73
Figure 3.6: Optimal number of clusters using univariate clustering using ckmeans
algorithm for log-transformed data using detection data from Barrow Island 2009 to
2015.
Figure.3.7: Univariate clustering using ckmeans algorithm for log-transformed data
using detection data for Barrow Island from 2009 to 2015.
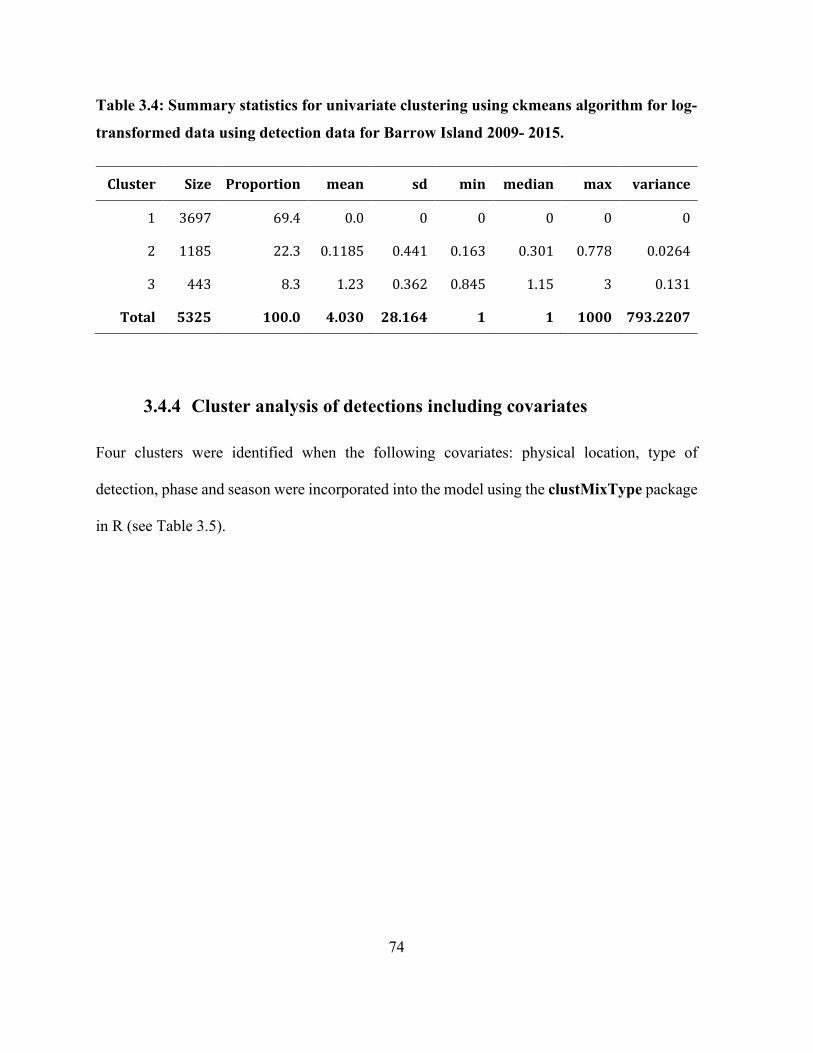
74
Table 3.4: Summary statistics for univariate clustering using ckmeans algorithm for log-
transformed data using detection data for Barrow Island 2009- 2015.
Cluster Size Proportion mean sd min median max variance
1 3697 69.4 0.0 0 0 0 0 0
2 1185 22.3 0.1185 0.441 0.163 0.301 0.778 0.0264
3 443 8.3 1.23 0.362 0.845 1.15 3 0.131
Total 5325 100.0 4.030 28.164 1 1 1000 793.2207
3.4.4 Cluster analysis of detections including covariates
Four clusters were identified when the following covariates: physical location, type of
detection, phase and season were incorporated into the model using the clustMixType package
in R (see Table 3.5).
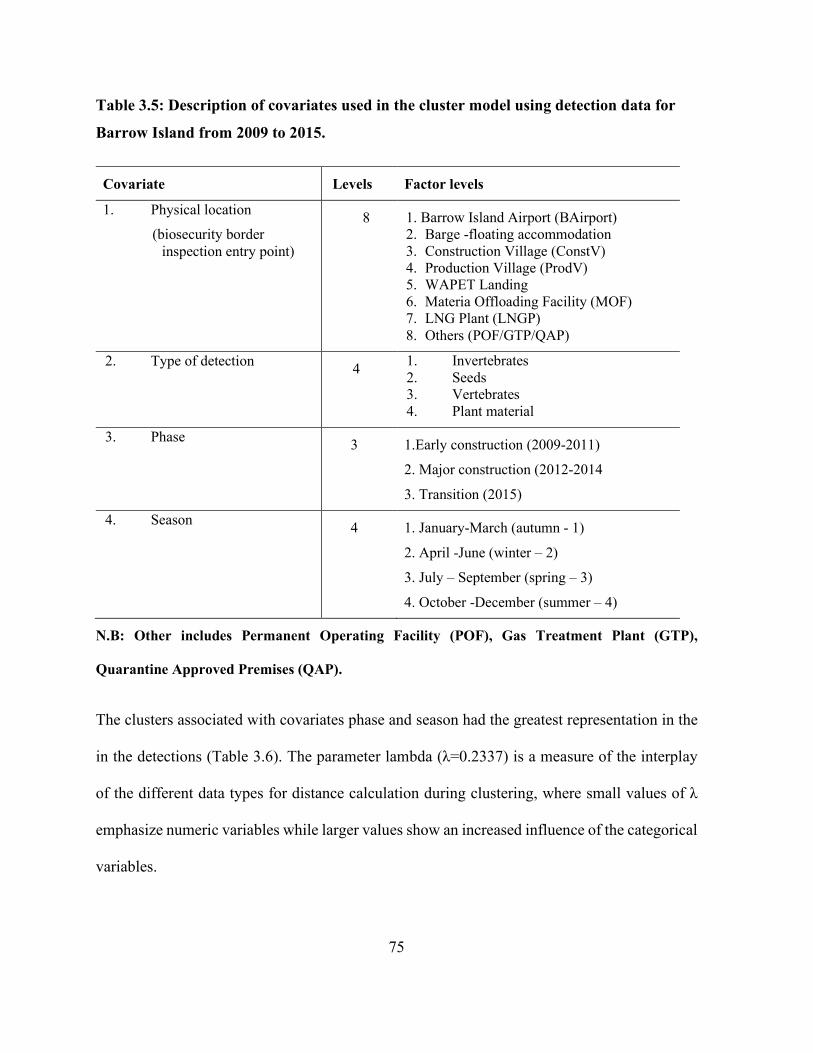
75
Table 3.5: Description of covariates used in the cluster model using detection data for
Barrow Island from 2009 to 2015.
Covariate Levels Factor levels
1. Physical location
(biosecurity border inspection entry point)
8 1. Barrow Island Airport (BAirport) 2. Barge -floating accommodation 3. Construction Village (ConstV) 4. Production Village (ProdV) 5. WAPET Landing 6. Materia Offloading Facility (MOF) 7. LNG Plant (LNGP) 8. Others (POF/GTP/QAP)
2. Type of detection 4 1. Invertebrates 2. Seeds 3. Vertebrates 4. Plant material
3. Phase 3 1.Early construction (2009-2011)
2. Major construction (2012-2014
3. Transition (2015)
4. Season 4 1. January-March (autumn - 1)
2. April -June (winter – 2)
3. July – September (spring – 3)
4. October -December (summer – 4)
N.B: Other includes Permanent Operating Facility (POF), Gas Treatment Plant (GTP),
Quarantine Approved Premises (QAP).
The clusters associated with covariates phase and season had the greatest representation in the
in the detections (Table 3.6). The parameter lambda (λ=0.2337) is a measure of the interplay
of the different data types for distance calculation during clustering, where small values of λ
emphasize numeric variables while larger values show an increased influence of the categorical
variables.
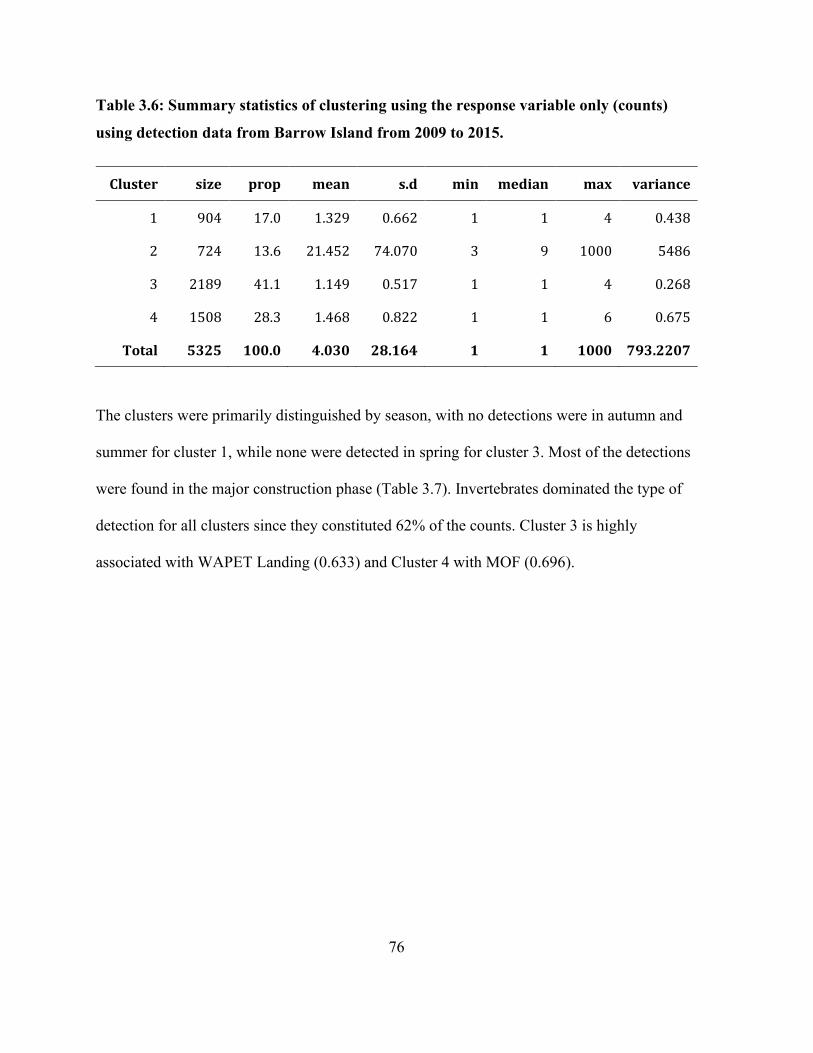
76
Table 3.6: Summary statistics of clustering using the response variable only (counts)
using detection data from Barrow Island from 2009 to 2015.
Cluster size prop mean s.d min median max variance
1 904 17.0 1.329 0.662 1 1 4 0.438
2 724 13.6 21.452 74.070 3 9 1000 5486
3 2189 41.1 1.149 0.517 1 1 4 0.268
4 1508 28.3 1.468 0.822 1 1 6 0.675
Total 5325 100.0 4.030 28.164 1 1 1000 793.2207
The clusters were primarily distinguished by season, with no detections were in autumn and
summer for cluster 1, while none were detected in spring for cluster 3. Most of the detections
were found in the major construction phase (Table 3.7). Invertebrates dominated the type of
detection for all clusters since they constituted 62% of the counts. Cluster 3 is highly
associated with WAPET Landing (0.633) and Cluster 4 with MOF (0.696).
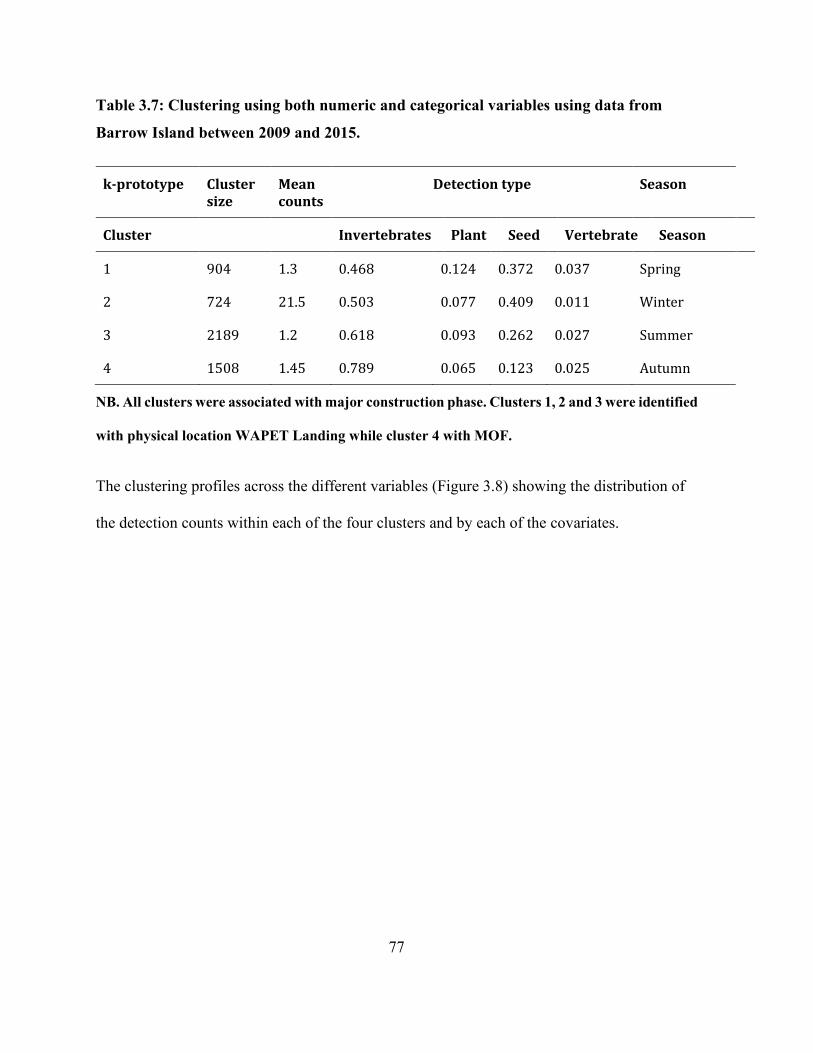
77
Table 3.7: Clustering using both numeric and categorical variables using data from
Barrow Island between 2009 and 2015.
k-prototype Cluster size
Mean counts
Detection type Season
Cluster Invertebrates Plant Seed Vertebrate Season
1 904 1.3 0.468 0.124 0.372 0.037 Spring
2 724 21.5 0.503 0.077 0.409 0.011 Winter
3 2189 1.2 0.618 0.093 0.262 0.027 Summer
4 1508 1.45 0.789 0.065 0.123 0.025 Autumn
NB. All clusters were associated with major construction phase. Clusters 1, 2 and 3 were identified
with physical location WAPET Landing while cluster 4 with MOF.
The clustering profiles across the different variables (Figure 3.8) showing the distribution of
the detection counts within each of the four clusters and by each of the covariates.
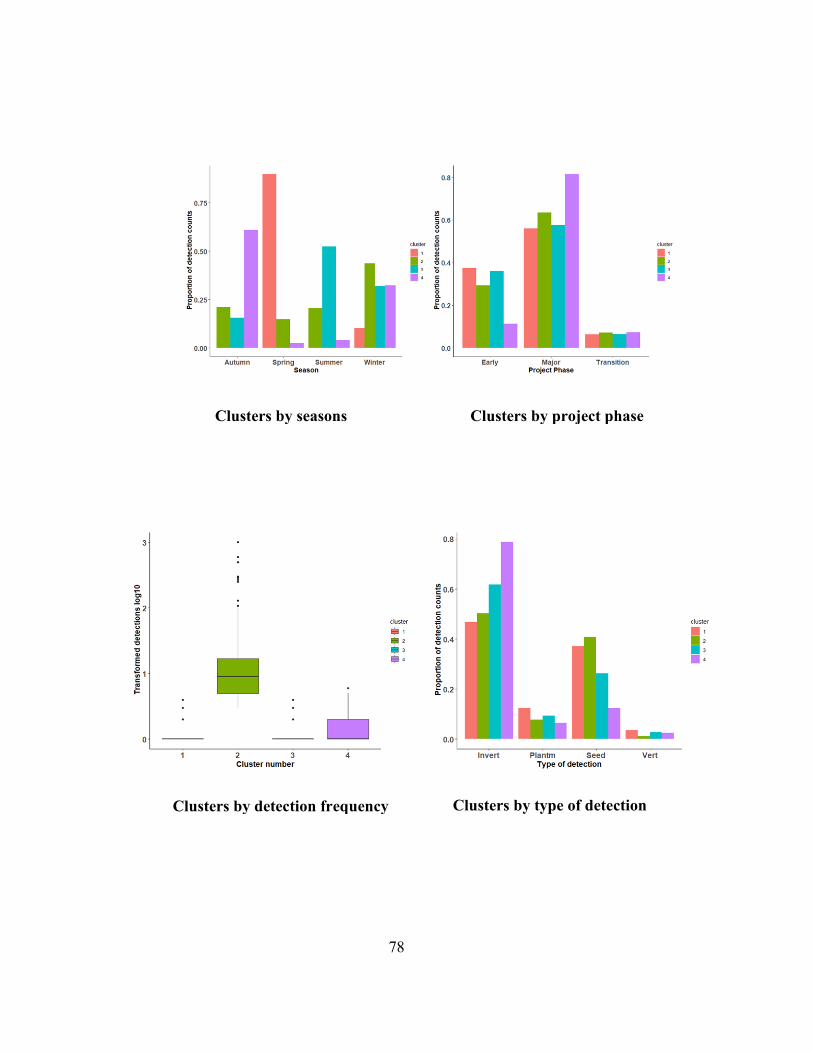
78
Clusters by seasons Clusters by project phase
Clusters by detection frequency
Clusters by type of detection
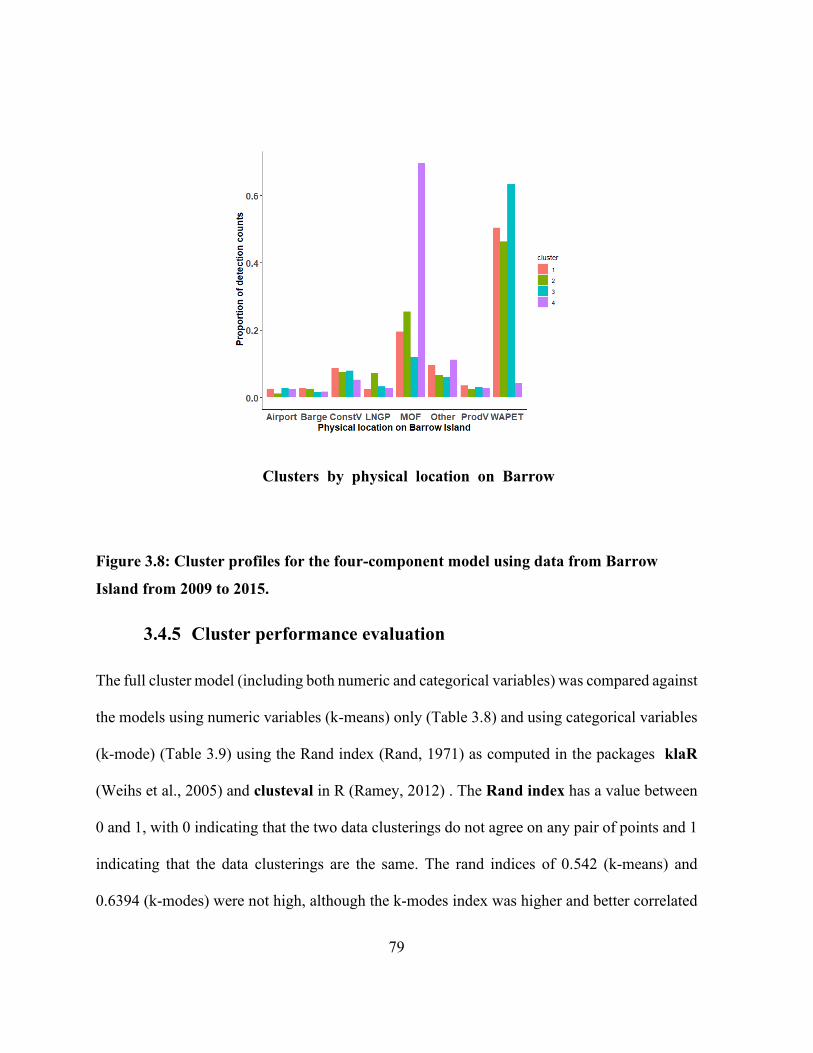
79
Figure 3.8: Cluster profiles for the four-component model using data from Barrow
Island from 2009 to 2015.
3.4.5 Cluster performance evaluation
The full cluster model (including both numeric and categorical variables) was compared against
the models using numeric variables (k-means) only (Table 3.8) and using categorical variables
(k-mode) (Table 3.9) using the Rand index (Rand, 1971) as computed in the packages klaR
(Weihs et al., 2005) and clusteval in R (Ramey, 2012) . The Rand index has a value between
0 and 1, with 0 indicating that the two data clusterings do not agree on any pair of points and 1
indicating that the data clusterings are the same. The rand indices of 0.542 (k-means) and
0.6394 (k-modes) were not high, although the k-modes index was higher and better correlated
Clusters by physical location on Barrow
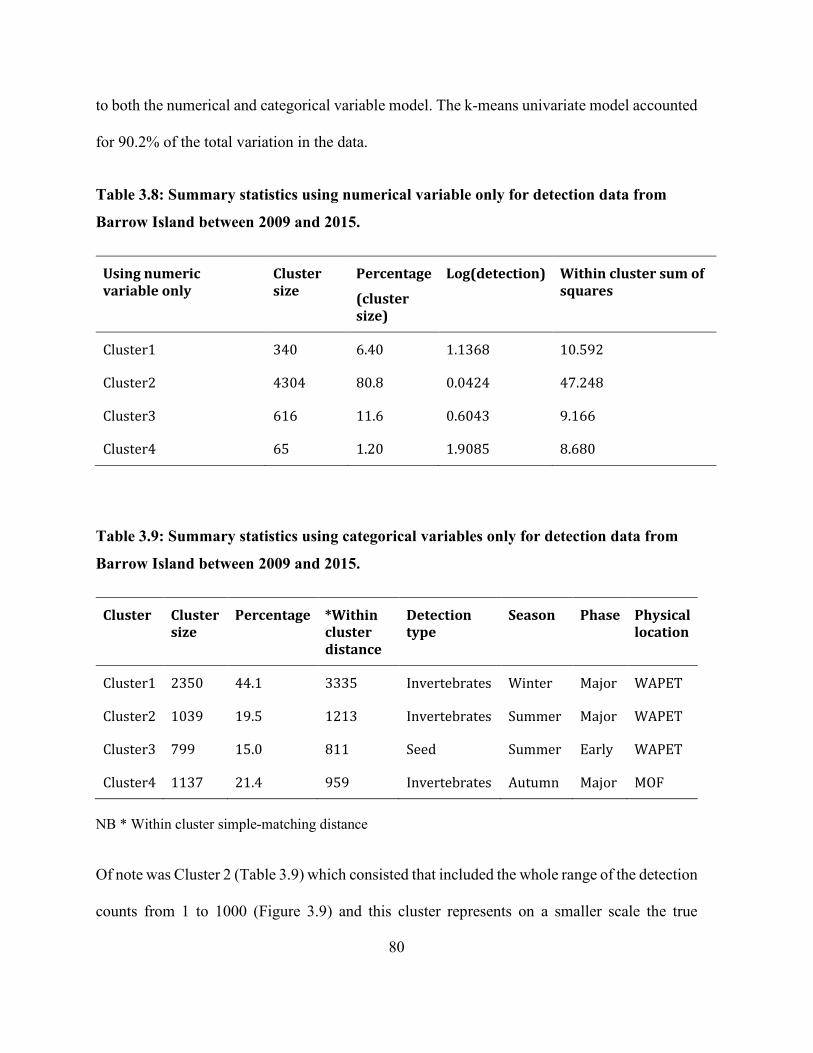
80
to both the numerical and categorical variable model. The k-means univariate model accounted
for 90.2% of the total variation in the data.
Table 3.8: Summary statistics using numerical variable only for detection data from
Barrow Island between 2009 and 2015.
Using numeric variable only
Cluster size
Percentage
(cluster size)
Log(detection) Within cluster sum of squares
Cluster1 340 6.40 1.1368 10.592
Cluster2 4304 80.8 0.0424 47.248
Cluster3 616 11.6 0.6043 9.166
Cluster4 65 1.20 1.9085 8.680
Table 3.9: Summary statistics using categorical variables only for detection data from
Barrow Island between 2009 and 2015.
Cluster Cluster size
Percentage *Within cluster distance
Detection type
Season Phase Physical location
Cluster1 2350 44.1 3335 Invertebrates Winter Major WAPET
Cluster2 1039 19.5 1213 Invertebrates Summer Major WAPET
Cluster3 799 15.0 811 Seed Summer Early WAPET
Cluster4 1137 21.4 959 Invertebrates Autumn Major MOF
NB * Within cluster simple-matching distance
Of note was Cluster 2 (Table 3.9) which consisted that included the whole range of the detection
counts from 1 to 1000 (Figure 3.9) and this cluster represents on a smaller scale the true
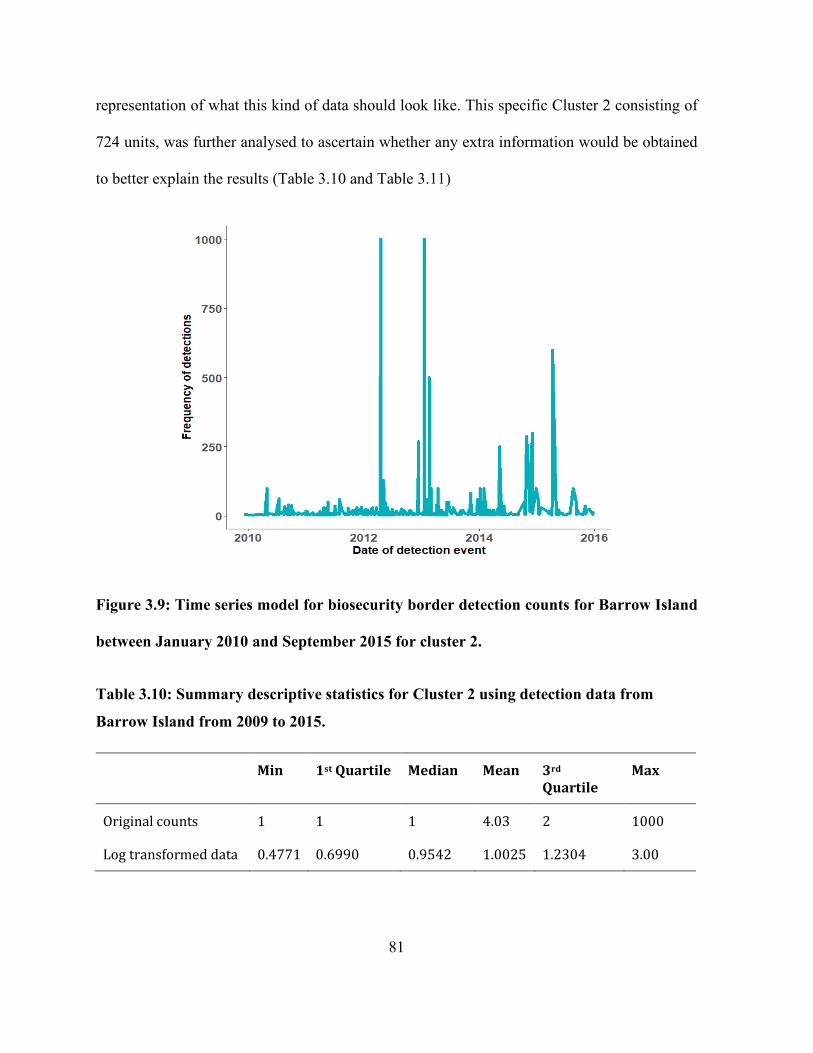
81
representation of what this kind of data should look like. This specific Cluster 2 consisting of
724 units, was further analysed to ascertain whether any extra information would be obtained
to better explain the results (Table 3.10 and Table 3.11)
Figure 3.9: Time series model for biosecurity border detection counts for Barrow Island
between January 2010 and September 2015 for cluster 2.
Table 3.10: Summary descriptive statistics for Cluster 2 using detection data from
Barrow Island from 2009 to 2015.
Min 1st Quartile Median Mean 3rd Quartile
Max
Original counts 1 1 1 4.03 2 1000
Log transformed data 0.4771 0.6990 0.9542 1.0025 1.2304 3.00
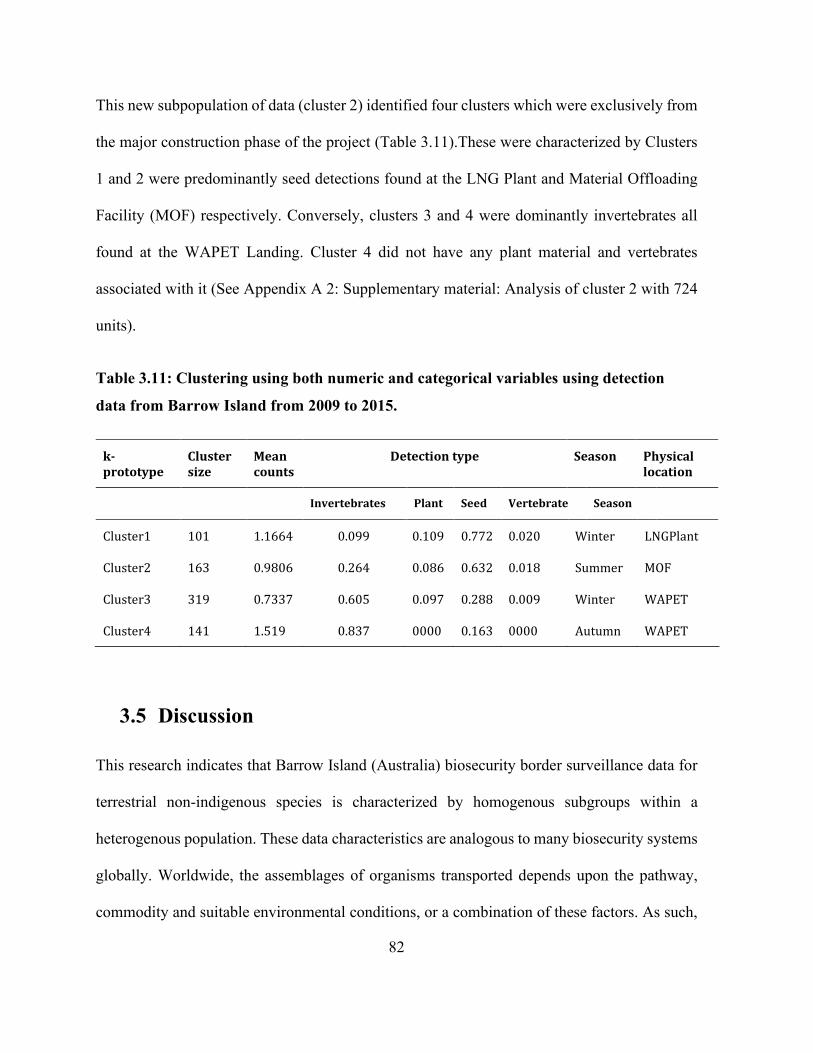
82
This new subpopulation of data (cluster 2) identified four clusters which were exclusively from
the major construction phase of the project (Table 3.11).These were characterized by Clusters
1 and 2 were predominantly seed detections found at the LNG Plant and Material Offloading
Facility (MOF) respectively. Conversely, clusters 3 and 4 were dominantly invertebrates all
found at the WAPET Landing. Cluster 4 did not have any plant material and vertebrates
associated with it (See Appendix A 2: Supplementary material: Analysis of cluster 2 with 724
units).
Table 3.11: Clustering using both numeric and categorical variables using detection
data from Barrow Island from 2009 to 2015.
k-prototype
Cluster size
Mean counts
Detection type Season Physical location
Invertebrates Plant Seed Vertebrate Season
Cluster1 101 1.1664 0.099 0.109 0.772 0.020 Winter LNGPlant
Cluster2 163 0.9806 0.264 0.086 0.632 0.018 Summer MOF
Cluster3 319 0.7337 0.605 0.097 0.288 0.009 Winter WAPET
Cluster4 141 1.519 0.837 0000 0.163 0000 Autumn WAPET
3.5 Discussion
This research indicates that Barrow Island (Australia) biosecurity border surveillance data for
terrestrial non-indigenous species is characterized by homogenous subgroups within a
heterogenous population. These data characteristics are analogous to many biosecurity systems
globally. Worldwide, the assemblages of organisms transported depends upon the pathway,
commodity and suitable environmental conditions, or a combination of these factors. As such,
83
biosecurity data are commonly characterized by presence/absence data (binomial distribution)
and clumping and extreme events which can be characterized a mixture of distribution models
including Poisson, negative binomial distributions, and variants of these such as zero-inflated
and hurdle models. Statistical methods used to analyse biosecurity data will be dictated by these
distributions.
The count component of the data was tested to determine if they followed one of the following
distributions: a standard Poisson, Negative binomial or log-normal distribution and the log-
normal distribution was found to be the best fit. The border detections were highly skewed due
to some values which were deemed “extreme values” which constituted of recordings of
between 104 to 1000 detections per inspection which were mainly seeds. The log-normal
distribution gave the best model fit when comparing AIC statistics against the Standard Poisson
and Negative Binomial distributions.
The three-component log-normal mixture model provided detailed insight into the distribution
of the data by dividing the data according to their distinct characteristic of numerical ordering.
Firstly, there was a point mass detection of single units and the existence of extreme values,
which were identified as the top 2% of detections. These extreme values constituted of
recordings of between 104 to 1000 detections per inspection and were mainly seeds and
invertebrate species. Given that biosecurity data often contains extreme values, the log-normal
mixture model can be a useful tool for biosecurity management as it can encompass all the data
collected.
84
The three-component log-normal mixture model was able to identify the homogenous
subpopulations within the main heterogeneous population. There is the potential for mixtures
of log-normal models to underperform when analysing highly variable count data (Park et al.,
2009). The EM algorithm seems to converge to a solution where one component has variance
zero and thus infinite log-likelihoods are obtained. However, the log-normal model assumes
that the data are continuous, hence the model may not perform optimally. Mixture models can
be useful in describing biosecurity interception data as they identify homogenous sub-
populations within heterogeneous populations which is typical of biosecurity interception data.
A wide range of biosecurity risk material is intercepted during biosecurity inspections.
For this study, a clustering approach to analysis was useful in interpreting complex patterns in
multivariate biosecurity data. The ckmeans algorithm identified a three-cluster model as the
best model fit based on numerical data. The univariate three-cluster log-normal model provided
the best insight into the distribution of the data by dividing data according to their distinct
characteristics. Given that biosecurity data often contain extreme values, the log-normal cluster
model can be a useful tool for biosecurity management as the transformation allows analysis
of all the data collected.
By including categorical covariates in the model, model precision improved by allowing more
information to be available to describe the clusters. This was evident by the increase in the
number of clusters from three to four. Approximately 90% of the variation in the data was
explained by increasing the number of clusters to four using the univariate k-prototype
algorithm, a slight improvement from 88.4% with three clusters. This shows inclusion of
covariates is important for driving cluster generation.
85
The four clusters identified in the analysis were mainly distinguished by one of the four seasons
and by location on the island reflecting seasonal and location variations in the data. For
example, cluster 1 did not record any detections in summer and autumn, whilst cluster 3 had
no detections in spring. In addition, some locations on the island were prominent in the
clustering (WAPET Landing and the Material Offloading Facility) because these had the
highest number of detections as they were the primary inspection points before the cargo was
distributed to various locations on the island. This result supports the experts estimates on the
relative importance of entry points for incursions on Barrow Island (Jarrad et al., 2011; Wintle
& Burgman, 2015). As such, including categorical co-variates in cluster analyses is critical in
defining clusters, with specific categorical factors having more weight than others. It is worthy
to note that the clustering of cluster 2 primarily identified data from the major construction
phase, which was the height of construction activity, characterized by increased levels of
movement of freight and hence more detection events of NIS.
Biosecurity protocols in place at Barrow Island have to date resulted in a substantial proportion
(99%) in which no NIS were detected during the biosecurity border inspections. From over
600,000 border inspections, there were only 5,380 positive detections of NIS i.e. 1% of the total
number of inspections. This reflects stringent preventative biosecurity protocols and the limited
number of entry points to the island i.e. the seaports and airport (García-Díaz et al., 2019).
Using the clustering approach to data analysis, invertebrates and seeds were identified as the
most abundant during inspections (contributing 62% and 26% respectively). Hence these
organisms heavily influenced the formation of clusters and were also the most important in
terms of attaining sufficient number / propagule pressure for potential incursions. Determining
86
the most influential variables for specified outcomes in biosecurity data is critical for managers
for effective biosecurity management.
Extreme counts, as well as high frequency of detection, are important for biosecurity
management strategies, as they increase the likelihood of invasion through sufficient propagule
pressure (Brockerhoff et al., 2014). There is increasing empirical and statistical evidence that
propagule pressure in the form of propagule sizes, propagule numbers, and temporal and spatial
patterns of propagule arrival are important in biological invasions (Simberloff, 2009).
Establishment success has been shown to depend on propagule pressure in the range of 10-100
individuals tested across a broad range of taxa and life histories, including invertebrates,
herbaceous plants and long-lived trees, and terrestrial and aquatic vertebrates (Cassey et al.,
2018). As such, the extreme detection counts (500+) reported in this study for Typha seeds
(bulrush) and a Hymenopteran species theoretically have the potential to start an invasion and
as such provide information critical to biosecurity management. Consequently, our use of
clustering to ascertain detection patterns of NIS at the border is highly relevant. Management
policy aimed at slowing down invasions should target reducing propagule pressure to small
counts or zeros irrespective of any other aspect of an invasion (Cassey et al., 2018). It is still
under debate as to whether and incursion of over 100 individuals may or may not increase the
success of an incursion event. However, extreme counts still need to be taken under careful
biosecurity consideration (Cassey et al., 2018).
Given that the numbers required for sufficient propagule pressure are estimated to be 10-100
individuals (Cassey et al., 2018), the biosecurity protocols in place on Barrow Island limit
propagule pressure as 73% of the detections were either single or two-unit detections. However,
87
the efficacy of border controls cannot be evaluated precisely since the actual propagule pressure
(frequency of introductions) is unknown (Caley et al., 2015; Saccaggi et al., 2016). This is often
the case in many biosecurity situations globally. Biosecurity border surveillance data for
terrestrial non-indigenous species is characterized by homogenous subgroups within a
heterogenous population. These data characteristics are analogous to many biosecurity systems
globally (Sikes et al., 2018). Worldwide, the assemblages of organisms transported depends
upon the pathway, commodity and suitable environmental conditions, or a combination of these
factors (Bellard et al., 2016; Hulme, 2009; Lodge et al., 2016). As such, biosecurity data are
commonly characterized by presence/absence data (binomial distribution) and clumping and
extreme events, which can be characterized a mixture of distribution models including Poisson,
negative binomial distributions, and variants of these such as zero-inflated and hurdle models
(Hauser et al., 2015; Rebecca Turner et al., 2020). Statistical methods used to analyze
biosecurity data will be dictated by these distributions. Clustering approach to analysis is useful
in interpreting complex patterns in multivariate biosecurity data.
My study revealed that clustering approach has the advantage of catering for heterogeneity of
data where subpopulations exist and the data is measured on different scales i.e. numerical or
categorical (Hummel et al., 2017). Border detections at Barrow Island include heterogeneous
subpopulations of distinct types of units (vertebrates, invertebrates, seeds, and plant material)
because of the nature of cargo and movement of personnel to the island. The characteristics and
traits of these types of units vary in their ability to withstand adverse conditions and survive
transit, their associated introductory pathway, and commodity. Visual inspections may not be
reliable in detecting small or cryptic pests, with the species intercepted possibly attributed to
88
the inspection method used rather than to the association of NIS with the commodity
(McCullough et al., 2006; Saccaggi et al., 2016). Thus, even though the clusters may be fit for
purpose, the data itself may have specific limitations since not all the relevant data pertaining
to biosecurity inspections was available. Factors that might influence the number of detections
include the type and quantities of cargo being inspected, the inspection effort, and the method
of inspection. This type of dis-segregation of biosecurity data is a common problem faced by
data analysts (Chen et al., 2013; Simpson et al., 2014). Until various disciplines and
organizations work together, statisticians must manage the available data in the most
parsimonious manner, targeting the most effective models for the data they have available.
3.6 Conclusion
This research demonstrates that biosecurity surveillance data is often comprised of data
measured on different scales (categorical or numerical). This highlights the need to use
appropriate statistical methods to explain complex patterns in data such that that the information
is more readily interpretable for making management decision. Cluster models are increasingly
becoming an integral component of ecological and environmental data analyses due to the
complexity of natural processes. These models can identify where subpopulations are
aggregated, for example, due to the biological circumstances (e.g. diverse types of organisms
transported in the same commodity), but otherwise, they exhibit distinct biological
characteristics and traits. Adequate knowledge of how a biosecurity system works is the first
step in determining how best to improve the system, and cluster models can be an effective tool
in gaining this understanding.
89
Chapter 4
A systems approach to biosecurity pays off: a case
study investigating introduction pathways and
interceptions of non-indigenous species at a
biosecurity border
Abstract
Introduction pathway studies generally describe the diverse routes by which non-indigenous
species (NIS) can be introduced, but rarely consider multiple introduction pathways occurring
simultaneously. In this study, multiple pathways of NIS introduction were investigated during
an industrial development on a remote island off the Australian coast. Fifteen introduction
pathways were categorised in association with importing locality and type of cargo they
transported. The number and types of detection events in each of these introduction pathways
were recorded during biosecurity inspections, cargo clearances and surveillance conducted
between 2009 and 2015. In total, more than 600,000 biosecurity inspections were done, with
5,352 border detection events recorded constituting less than 1% of the biosecurity inspections.
Of these border inspection events, which were classified as animals, plant material, and soil
90
and organic matter, 61% were non-viable and 39% were alive. Non-events constituted 57% of
the detection events, while quarantine intercepts -27%, quarantine incidents -2% and 14% were
indeterminate. Of those detections 2,154 were NIS, with 446 identified NIS species. Of
significance were live NIS detections constituting only 6% of the total detection events and
1.5% were quarantine incidents. Live NIS detections were found only on a subset of the
introduction pathways. Cargo vessel and inward bound passenger numbers peaked during the
major construction period and were associated with an increase in the number of live NIS
detections. The nature of these introduction pathways potentially allowed NIS habitation of
niche areas and/or provided a suitable food supply. My study identified that biosecurity border
inspection is the last port of call to mitigate entry of NIS and minimise the pressure of NIS
entering and establishing on the island thereby protecting the island from an incursion.
4.1 Introduction
Non-indigenous species (NIS) are a major threat to global diversity (Moser et al., 2018; Nghiem
et al., 2013; Ojaveer et al., 2015; Schlaepfer, 2018). Understanding the pathways responsible
for NIS introductions and using this knowledge to inform management decisions will reduce
the likelihood of NIS entering a region or country (Convention on Biological Diversity, 2014 ;
Faulkner et al., 2016; Simberloff et al., 2013). Pathway studies often describe the diverse routes
by which NIS can be introduced to a region but rarely consider multiple introduction pathways
occurring simultaneously (Cope et al., 2017; Essl et al., 2015; Saul et al., 2017). The challenge,
however, is to quantitatively assess the risk of pathways introducing and subsequently
spreading NIS, especially pest species. A pathway-centred biosecurity management approach
targets the “riskiest” pathways, where risk is a combination of probability of an
91
incursion/invasion and impact or consequences. The Australian Government, however, uses a
different philosophy where surveillance and management target the riskiest pathways but also
maintain oversight of pathways that are currently low risk (Reaser et al., 2020). Any pathway
is randomly inspected to provide a degree of deterrence to importers (Reaser et al., 2020).
Information about how and why NIS taxa are coming via specific pathways is analysed, and
targeted preventative strategies, such as early detection, import regulations, and pre-shipment
protocols are implemented and tested over time ( Faulkner et al., 2016; Lott et al., 2016). For
targeted pathways, colonization pressure should decrease over time as management protocols
are adjusted accordingly (Pyšek et al., 2011; Simberloff, 2009).
Historically, human-mediated arrivals of NIS have been very prominent due to trade and
immigration patterns (National Research Council (US), 2002). Accelerating rates of
international trade, volume and diversity of goods and the efficiency of travel, growth of
international airline commerce has led to an increase in unintentional dispersal and an increase
in the likelihood of NIS surviving transit (Hughes et al., 2019). Several studies have
highlighted issues associated with human-mediated pathways and transportation of NIS
(Hughes et al., 2019; Huiskes et al., 2014; Liebhold et al., 2006; McKirdy et al., 2019; Newman
et al., 2018). Consequently, interception of NIS at ports of entry has become an insurmountable
task. Extensive research has been conducted on invasive alien species (IASs) on human-
inhabited islands (Rojas‐Sandoval et al., 2017; Russell et al., 2017; Toral-Granda et al., 2017;
Turbelin et al., 2017; Wasowicz, 2014) where high numbers of NIS introductions have been
attributed to stowaways, contaminants and intentional release as part of horticulture and
agriculture activities (Hughes et al., 2010; Wasowicz, 2014). Further, human associated
92
pathways including cargo, vehicles, fresh food, ships, clothing and personal equipment are
highly effective in translocation of NIS despite implementation of sanitary practices such as
foot-baths, checking of clothes for seeds, use of sniffer dogs and X-raying of baggage at entry
points (Meissner et al., 2009). Statistical profiling for intervention of biosecurity risk material
can be a useful tool for improving the efficiency of detecting personnel at high risk of non-
compliance as well as strong educational awareness (Lane et al., 2017; Meissner et al., 2009).
It should be emphasized that inspection alone is not 100% effective in preventing incursions
and some studies have shown that inspections alone have relatively low interception efficiency
(Caley et al., 2015; Meissner et al., 2009; Suhr et al., 2019).
The three basic components of island biosecurity are quarantine, surveillance and contingency
responses (Russell et al., 2017). While quarantine involves minimising the possibility of NIS
transport and incursions across the biosecurity continuum i.e. pre-border, border and post-
border, biosecurity surveillance focusses on actions taken to determine the presence or absence
of NIS on Barrow Island (BWI) (Anderson et al., 2017). Biosecurity surveillance is always
treated as a continuum, pre-border, border and post-border (Sequeira et al., 2014). A biosecurity
surveillance system is complex, comprising multiple actions undertaken for multiple species
and pathways, by a range of participants at different points along the biosecurity continuum –
off-shore or pre-border, at the border, and on-shore or post-border (Dodd et al., 2017). A
biosecurity surveillance system to monitor and prevent introduction of NIS on BWI was aimed
at mitigating the negative impacts caused by NIS surviving and evading all the biosecurity
barriers in each of the pathways transporting cargo and personnel during the development and
subsequent operation of the LNG project. A competent biosecurity surveillance system ensures

93
detection of incursions of pests (pre-border interception at ports of entry) before they spread
and become widely established whilst assessing the effectiveness of pre-border (quarantine
controlled premises) and border biosecurity protocols in place (Carnegie et al., 2019).
Prevention eliminates impacts of NIS entirely while surveillance facilitates early detection and
eradication, and eradication removes the individuals and reduces future impacts (Rout et al.,
2011).
In biological and ecological invasions, the term ‘pathway’ can refer to the vector (i.e. the way
in which an organism is transported), the route an organism follows, or whether the species is
introduced by natural or anthropogenic means (Carlton, 2001). Introduction pathway for this
study refers to the physical means by which a species may potentially be introduced to a new
environment, such as within machinery, luggage or on wet sides of a vessel.
4.2 The systems approach
The Quarantine Management System in place on BWI is a fully integrated biosecurity system
where quarantine measures were embedded within the procurement, contracting and logistics
processes (Scott et al., 2017). A systems approach was implemented where at least two or more
quarantine measures were implemented to reduce the risk of NIS movement during transit and
to minimise detection at BWI border.
4.2.1 Biosecurity protocols
Trained and company-accredited biosecurity inspectors conducted all pre-border, border, and
post border inspections (Chevron Australia, 2010). Biosecurity training of all personnel going
to Barrow Island was mandatory. There was a purpose-built passenger check-in, inspection,
94
screening, and departure lounge for aircraft from Perth to Barrow Island, and inspection of
personnel at entry points using x-rays and beagles, brushing of shoes and luggage, and checking
pockets was also implemented (Chevron Australia, 2010). The three-colour tagging system of
all cargo going to Barrow Island were part of the strict biosecurity measures implemented. The
full inspection procedure involved up to three (red, blue, and green stages respectively) tiers at
separate handover points, supported by a document and multi-stage tagging system (Material
Management Ticket (MMT) to ensure biosecurity compliance ((Chevron Australia, 2010; Scott
et al., 2017)). The inspected cargo compliant pre-border was tagged red. The red tag was the
contractor’s declaration that the material/equipment was free from discernible evidence of
biosecurity risk material (BRM) and that packaging met the contractual biosecurity
requirements (Chevron Australia, 2010). Prior leaving supply points, the cargo was tagged blue
by inspectors as evidence that it met the biosecurity compliance and was ready to be transported
to the island (Chevron Australia, 2009a). The blue tag meant that the cargo was free from
BRM, that the documentation was correct and that all appropriate biosecurity treatments had
been applied and that the cargo was authorized to proceed in the supply chain ((Chevron
Australia, 2009a). The blue tag was valid for seven days, or the process had to be repeated).
When verification that external surfaces of the consignments had been successfully completed,
confirmation that the integrity of the cargo had been maintained since the blue tag inspection,
then the consignment was tagged green and was ready for transportation to BWI. This green
tagging was valid for only 48 hrs within which the cargo had to be transported to BWI (Chevron
Australia, 2009a, 2010). Upon arrival at Barrow Island, further inspections verified that no
biosecurity risk material was picked up during transit and nothing had been missed during
initial screening. Subsequently the cargo was transported to the various locations on the island
95
for use. Final cargo clearance was conducted where the consignments were offloaded for use
on BWI, such as the Gorgon LNG Plant, the Construction Village, the Production Village and
Western Australia (WA) Oil Camp (Chevron Australia, 2010).
Unique to Barrow Island , pre-border and border inspections were conducted on 100% of the
cargo, all cargo was cleaned, treated and inspected twice prior to shipment (Scott et al., 2017).
Biosecurity designs were implemented prior to the actual procedural inspection wherever
possible, such as inspection of quarantine storage, treatment, and cleaning facilities, shrink-
wrapping of non-containerised/ crated cargo to minimise cross-contamination during transit
and storage (International Petrolueum Industry Environmental Conservation Association,
2012). Further, design solutions were incorporated into modules and pre-assembled units and
pipe racks, for example, accommodation units, office units and pipe racks were pre-assembled
and modularised to minimise the number of items shipped individually. The risks of food and
perishables were minimised by ensuring that food preparation tasks were completed in pre-
border, packaged, and transported to BWI (Chevron Australia, 2014a). For each pathway,
guidelines for inspections are given in Appendix A; Measures to Prevent Introductions of NIS
and Marine Pests (Chevron Australia, 2017).
Pre-border efforts focused on screening all passengers, cargo, and equipment for quarantine
compliance prior to arrival at Barrow Island. Anything noncompliant was remediated by
fumigation with either methyl bromide or ethyl formate or in very exceptional cases, refused
transit to the island. Inspections ensured that cargo, vessels (including aircraft) and people and
their luggage was free from discernible evidence of biosecurity risk material (BRM) upon
leaving the last port for BWI. BRM was defined as plants, plant material, seeds, invertebrates,
96
vertebrates, as well as the agreed marine pests, and soil and organic matter, including scats,
feathers, and fur. Final verification was undertaken prior to release from ports on BWI (Scott
et al., 2017).
4.2.2 Diagnostics, classifications, and response variables
Detected QRM were recorded as events whether dead or alive, viable or non-viable. QRM were
collected for later taxonomic identification or confirmation by trained subject matter experts at
a dedicated taxonomic facility (Callan et al., 2011; Majer et al., 2013). It should be noted that
the terrestrial inspection effort was for any species present on cargo whereas, for the marine
inspection effort was focused only on agreed potential marine pest list for reasons related to the
unique biodiversity realities of marine ecosystems. For the remaining introduction pathways,
all the detection events were recorded and classified according to their impact on biodiversity
on BWI. Interceptions were classified as either indigenous, non-indigenous (NIS), non-
indigenous established or uncertain (awaiting taxonomic classification) (Jarrad et al., 2011;
Majer et al., 2013; Murray et al., 2015). Detection events were classified using the Species
Action Plan List (SAPs) which was compiled by the Chevron Quarantine Expert Panel (QEP).
The panel consisted of experts from government, scientific organisations, and independent
technical consultants tasked to provide technical advice to both Chevron Australia and the
Government concerning quarantine management on the Gorgon LNG Project. The SAPs were
categorised as follows:
• NIS exemplar species representing broad taxa (requiring similar management
responses),
97
• NIS present before construction commenced and that are not covered by the exemplar
SAPs,
• NIS and Marine Pests established attributable to the Gorgon LNG Project and
• NIS considered to be high-risk species, unless covered by an exemplar SAP, located at
mainland and overseas locations where cargo destined for Barrow Island originate from
(Chevron Australia, 2017) (Appendix 1).
Exemplar species representing broad taxa were identified by an expert group and were used
during the surveillance programme. Exemplar species were identified as being representative
of the vertebrate, invertebrate and plant species likely to enter and establish on Barrow Island.
These species have been extensively researched with regards to their ecology and any
detections reported. Rattus rattus (black rat), Hemidactylus frenatus (Asian House Gecko),
Cenchrus ciliaris (buffel grass) and Pheidole megacephala (big-headed ant) were identified as
exemplar species.
During the risk assessment phase, a diverse set of 15 cargo/personnel/vessel introduction
pathways (e.g. domestic vessels, personnel and luggage, and food and perishables) was
identified for the construction phase of a liquified natural gas (LNG) project on the Barrow
island, a remote island off the western coast of Australia (Chevron Australia, 2014).
Construction of the LNG plant presented significant opportunities for the introduction of NIS.
As such, detecting potential quarantine risk material arriving via the various introduction
pathways became a priority in biosecurity management of the island (Chevron Australia,
2014), and was a requirement under the both federal and state government legal framework
(Environment Protection and Biodiversity Conservation Act, 1999; EPBC, 1999; Government
98
of Western Australia, 2009) for the 40 year expected lifespan of the project (ACIL Allen, 2015).
For BWI, the biosecurity system implemented encompassed prevention (at port of entry),
preparedness (early detection, diagnostic and control), response (to contain or eradicate or
manage the pest) and recovery (systems for regulating eradication, management, or
restoration). Rigorous surveillance requires significant upfront investment, but it enhances the
likelihood of detection in the initial stages of an incursion when control and eradication are
feasible and less costly (Christy, 2017; Epanchin‐Niell et al., 2010).
The aim of this study is to characterise introduction pathways transporting goods and personnel
to Barrow Island over a specific time period (i.e. during the construction and operation of an
industrial project) in order to determine which introduction pathways, have the highest
likelihood of introducing terrestrial NIS to the island. Specifically, this research aims to provide
evidence-based insights on how biosecurity efforts are best utilised to maximise the probability
of NIS detection. To achieve this the following hypotheses were investigated:
i. The event frequency of the total number of intercepts and incidents varied with
introduction pathway during the project phases.
ii. The abundance and diversity of overall interceptions and NIS detection events varied
with introduction pathway during different project phases.
iii. The relationship within detection events with regards to live, dead and non-viable
QRM in the various introductory pathways NIS were associated with specific
introduction pathways.
Detection event data were recorded on: i) introduction pathway; ii) physical location where
specimens were collected; iii) date of event; iv) origin of commodity; v) specimen taxa (order
99
or lowest taxonomic resolution); and vi) any additional information specific to each detection
event. Detections were divided into five categories: i) vertebrates; ii) invertebrates; iii) seeds;
iv) undefined plant material; and iv) soil/organic matter.
Results of the study are used to develop recommendations to improve how future biosecurity
efforts for Barrow Island and in a broader context, terrestrial biosecurity surveillance, can be
developed through consideration of problematic introduction pathways.
4.3 Materials and methods
4.3.1 Study site
Barrow Island is the second largest continental island off the Western Australia coastline,
located 60 km off north-western Australia (Department of Environment and Conservation,
2007). The island was declared a “Class A” Nature reserve in 1910 (Moro et al., 2013). The
potential for the introduction of NIS to remote, sparsely inhabited islands is often limited due
to the nature of their seclusion. However, islands are particularly vulnerable to invasion because
the likelihood of high endemism and reduced beta diversity of islands (Suhr et al., 2019) . The
remoteness of the BWI refers to its natural history, its ecological affinities with the mainland
and its resilience to environmental extremes. Currently 2,800 terrestrial and subterranean
species have been documented on the island, some of which are listed as vulnerable or
threatened, and 24 mammal species of which are endemic or endangered (Lagdon et al., 2013;
D Moro et al., 2010). These mammal species have persisted due to their isolation from the
mainland, lack of predation by introduced predators such as cats, foxes and rats, by their
resilience to evolve within an arid and sub-tropical climate that experiences extreme
100
fluctuations in climate and in particular, rainfall ranging between 30 - 300 mm and mean
maximum temperatures ranging between 20 -34oC (Kier et al., 2009; Moro et.al., 2013). It has
been documented that islands most vulnerable to the effects of climate change are at low
altitudes and/or in the Southern Hemisphere including Australia (where BWI is located) and
the Pacific Ocean (Veron et al., 2019). Climate change results in changes in sea level resulting
in coastal erosion, saline water intrusion and impacting terrestrial habitats leading to decrease
in biodiversity (Taylor, 2017).
During the LNG project development (September 2009 to December 2015), there were three
phases with different biosecurity risks:
i. early construction phase - October 2009 to December 2011 which consisted mostly of
site preparations and earth works.
ii. main construction phase - January 2012 to December 2014 which consisted mainly of
major construction activities relating to the building of the three LNG processing plants
and all the supporting infrastructure such as gas turbine generators, slug catchers, Boil
Off Gas (BOG) flare, MR/PR compressors, etc.
iii. transitional phase - January 2015 to December 2015 which mainly consisted of
preparations for start-up, commissioning tests and eventual start-up and initial
operations.
Pre-border inspections were carried out prior to cargo being loaded on vessels for transport to
BWI, border (on arrival) and post-border (outside the development site). Pre-border inspections
were conducted at designated points internationally in Asia (i.e. Indonesia, Malaysia,
Singapore, South Korea, Thailand and China), Europe (England, Italy), USA, as well as locally
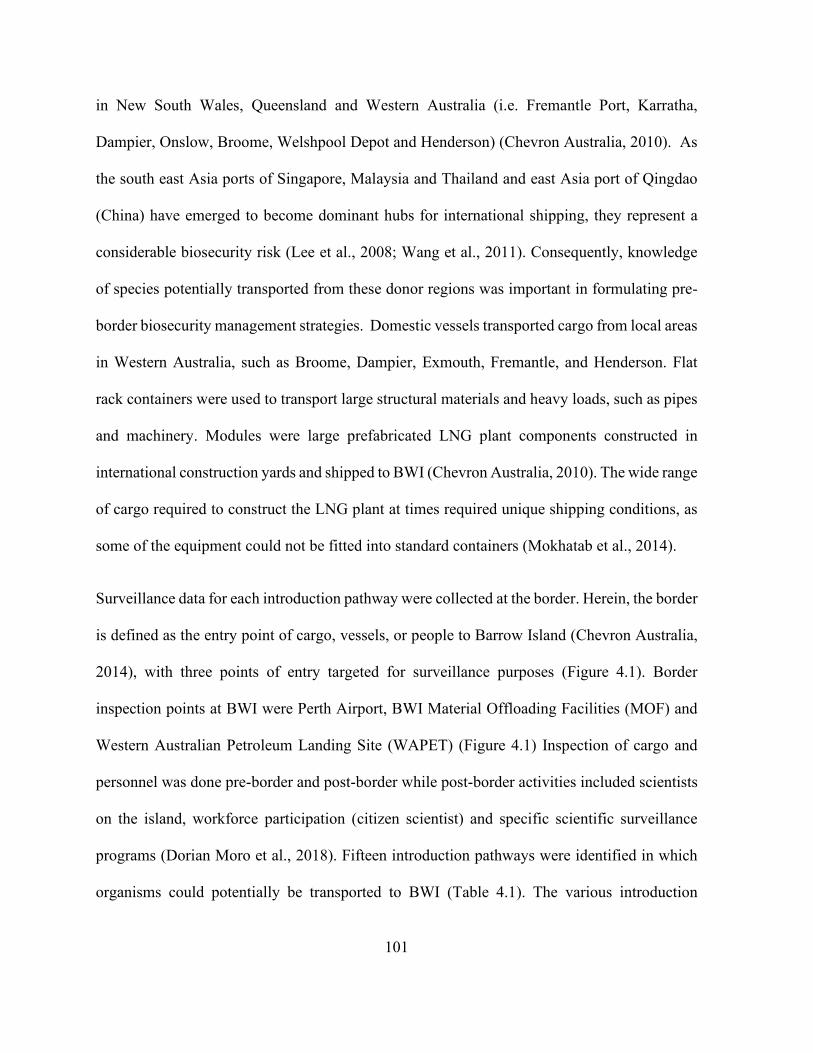
101
in New South Wales, Queensland and Western Australia (i.e. Fremantle Port, Karratha,
Dampier, Onslow, Broome, Welshpool Depot and Henderson) (Chevron Australia, 2010). As
the south east Asia ports of Singapore, Malaysia and Thailand and east Asia port of Qingdao
(China) have emerged to become dominant hubs for international shipping, they represent a
considerable biosecurity risk (Lee et al., 2008; Wang et al., 2011). Consequently, knowledge
of species potentially transported from these donor regions was important in formulating pre-
border biosecurity management strategies. Domestic vessels transported cargo from local areas
in Western Australia, such as Broome, Dampier, Exmouth, Fremantle, and Henderson. Flat
rack containers were used to transport large structural materials and heavy loads, such as pipes
and machinery. Modules were large prefabricated LNG plant components constructed in
international construction yards and shipped to BWI (Chevron Australia, 2010). The wide range
of cargo required to construct the LNG plant at times required unique shipping conditions, as
some of the equipment could not be fitted into standard containers (Mokhatab et al., 2014).
Surveillance data for each introduction pathway were collected at the border. Herein, the border
is defined as the entry point of cargo, vessels, or people to Barrow Island (Chevron Australia,
2014), with three points of entry targeted for surveillance purposes (Figure 4.1). Border
inspection points at BWI were Perth Airport, BWI Material Offloading Facilities (MOF) and
Western Australian Petroleum Landing Site (WAPET) (Figure 4.1) Inspection of cargo and
personnel was done pre-border and post-border while post-border activities included scientists
on the island, workforce participation (citizen scientist) and specific scientific surveillance
programs (Dorian Moro et al., 2018). Fifteen introduction pathways were identified in which
organisms could potentially be transported to BWI (Table 4.1). The various introduction
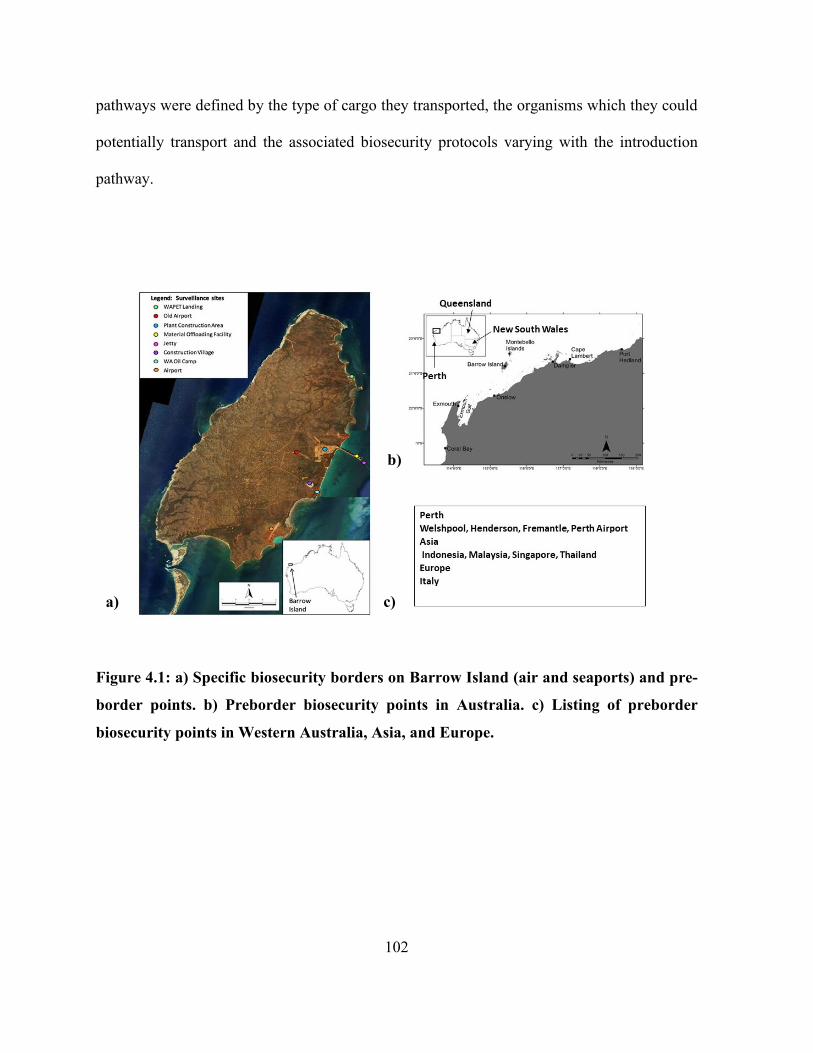
102
pathways were defined by the type of cargo they transported, the organisms which they could
potentially transport and the associated biosecurity protocols varying with the introduction
pathway.
Figure 4.1: a) Specific biosecurity borders on Barrow Island (air and seaports) and pre-
border points. b) Preborder biosecurity points in Australia. c) Listing of preborder
biosecurity points in Western Australia, Asia, and Europe.
b)
a) c)
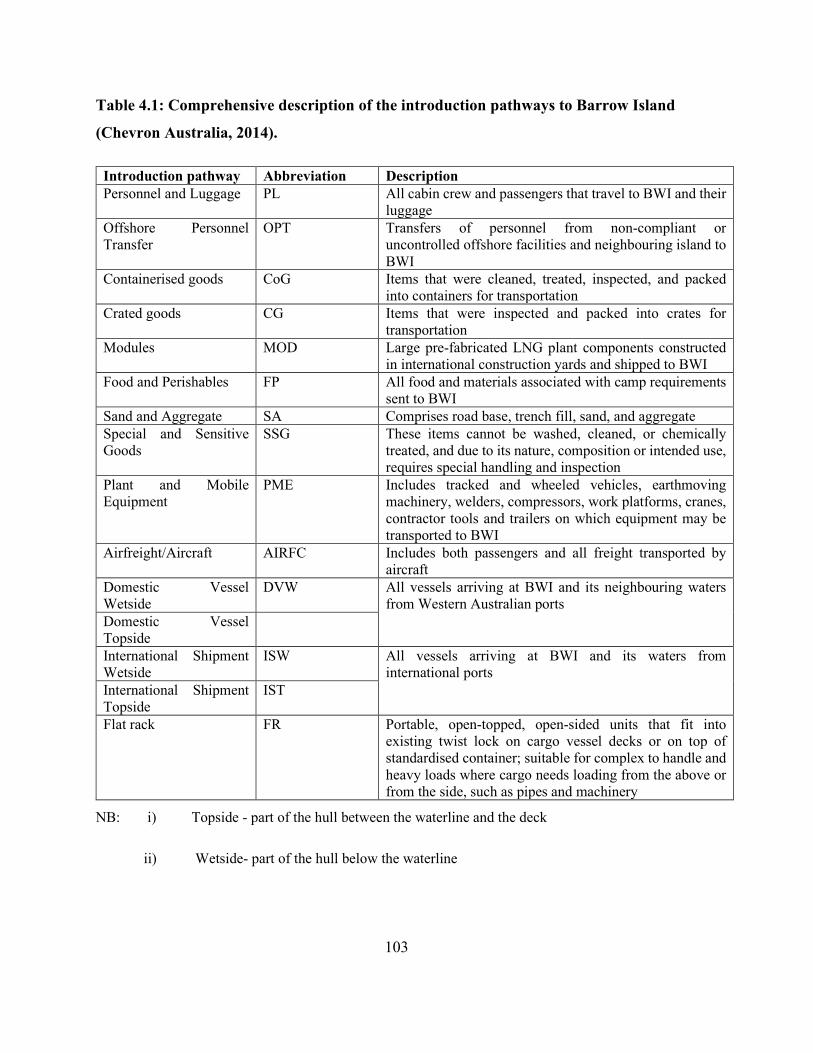
103
Table 4.1: Comprehensive description of the introduction pathways to Barrow Island
(Chevron Australia, 2014).
Introduction pathway Abbreviation Description Personnel and Luggage PL All cabin crew and passengers that travel to BWI and their
luggage Offshore Personnel Transfer
OPT Transfers of personnel from non-compliant or uncontrolled offshore facilities and neighbouring island to BWI
Containerised goods CoG Items that were cleaned, treated, inspected, and packed into containers for transportation
Crated goods CG Items that were inspected and packed into crates for transportation
Modules MOD Large pre-fabricated LNG plant components constructed in international construction yards and shipped to BWI
Food and Perishables FP All food and materials associated with camp requirements sent to BWI
Sand and Aggregate SA Comprises road base, trench fill, sand, and aggregate Special and Sensitive Goods
SSG These items cannot be washed, cleaned, or chemically treated, and due to its nature, composition or intended use, requires special handling and inspection
Plant and Mobile Equipment
PME Includes tracked and wheeled vehicles, earthmoving machinery, welders, compressors, work platforms, cranes, contractor tools and trailers on which equipment may be transported to BWI
Airfreight/Aircraft AIRFC Includes both passengers and all freight transported by aircraft
Domestic Vessel Wetside
DVW All vessels arriving at BWI and its neighbouring waters from Western Australian ports
Domestic Vessel Topside
International Shipment Wetside
ISW All vessels arriving at BWI and its waters from international ports
International Shipment Topside
IST
Flat rack FR Portable, open-topped, open-sided units that fit into existing twist lock on cargo vessel decks or on top of standardised container; suitable for complex to handle and heavy loads where cargo needs loading from the above or from the side, such as pipes and machinery
NB: i) Topside - part of the hull between the waterline and the deck
ii) Wetside- part of the hull below the waterline
104
4.3.2 Statistical methodology
Data were analysed quantitatively as events where biosecurity risk material was detected and
number of units per event detected. A quarantine event was any case where a suspected NIS or
Marine Species is observed and reported, while non-event is a positive identification that a
specimen is not a NIS or marine pest species, which is not viable or dead, hence not posing no
risk to the biodiversity of BWI, or it is deemed to not be related to the project.
Quarantine events were classified as follows:
i. an intercept was the detection, containment, and removal of suspected NIS prior to final
clearance while for marine pests included the westsides while the vessel was within the
limited access zone or controlled access zone.
ii. an incident occurs when there is a detection of NIS or marine pest on BWI after Final
Quarantine Clearance or the proliferation of a NIS population on BWI or marine pests
in the waters surrounding BWI.
Quarantine incidents are classified as a Level 1, 2, or 3 depending on the severity of risk the
detection poses to the biodiversity of BWI. Incident Level 1 is where the risk is low e.g.
prohibited foods, Portuguese millipede, and parachute seeds. Incident Level 2 is either when
uncertainty exists as to the risk posed due to their ability to survive on BWI or suitability of
habitats or the risk is high but the ability to detect and eradicate is readily achievable due to
factors such as visibility, fecundity or slow dispersal e.g. Western Marble Gecko, red fire ant
or whorled pigeon grass. Incident Level 3 is when the risk posed is high and the ability to
detect and eradicate is difficult, while for marine pests are those detected on the wetsides.
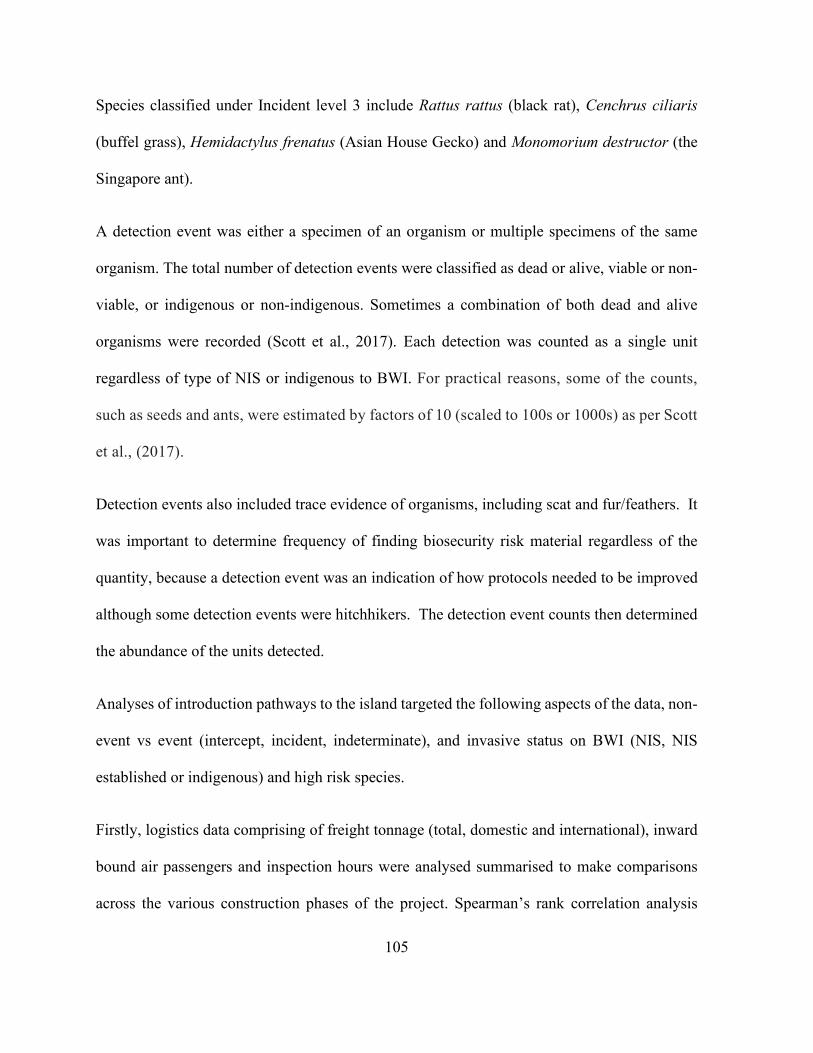
105
Species classified under Incident level 3 include Rattus rattus (black rat), Cenchrus ciliaris
(buffel grass), Hemidactylus frenatus (Asian House Gecko) and Monomorium destructor (the
Singapore ant).
A detection event was either a specimen of an organism or multiple specimens of the same
organism. The total number of detection events were classified as dead or alive, viable or non-
viable, or indigenous or non-indigenous. Sometimes a combination of both dead and alive
organisms were recorded (Scott et al., 2017). Each detection was counted as a single unit
regardless of type of NIS or indigenous to BWI. For practical reasons, some of the counts,
such as seeds and ants, were estimated by factors of 10 (scaled to 100s or 1000s) as per Scott
et al., (2017).
Detection events also included trace evidence of organisms, including scat and fur/feathers. It
was important to determine frequency of finding biosecurity risk material regardless of the
quantity, because a detection event was an indication of how protocols needed to be improved
although some detection events were hitchhikers. The detection event counts then determined
the abundance of the units detected.
Analyses of introduction pathways to the island targeted the following aspects of the data, non-
event vs event (intercept, incident, indeterminate), and invasive status on BWI (NIS, NIS
established or indigenous) and high risk species.
Firstly, logistics data comprising of freight tonnage (total, domestic and international), inward
bound air passengers and inspection hours were analysed summarised to make comparisons
across the various construction phases of the project. Spearman’s rank correlation analysis
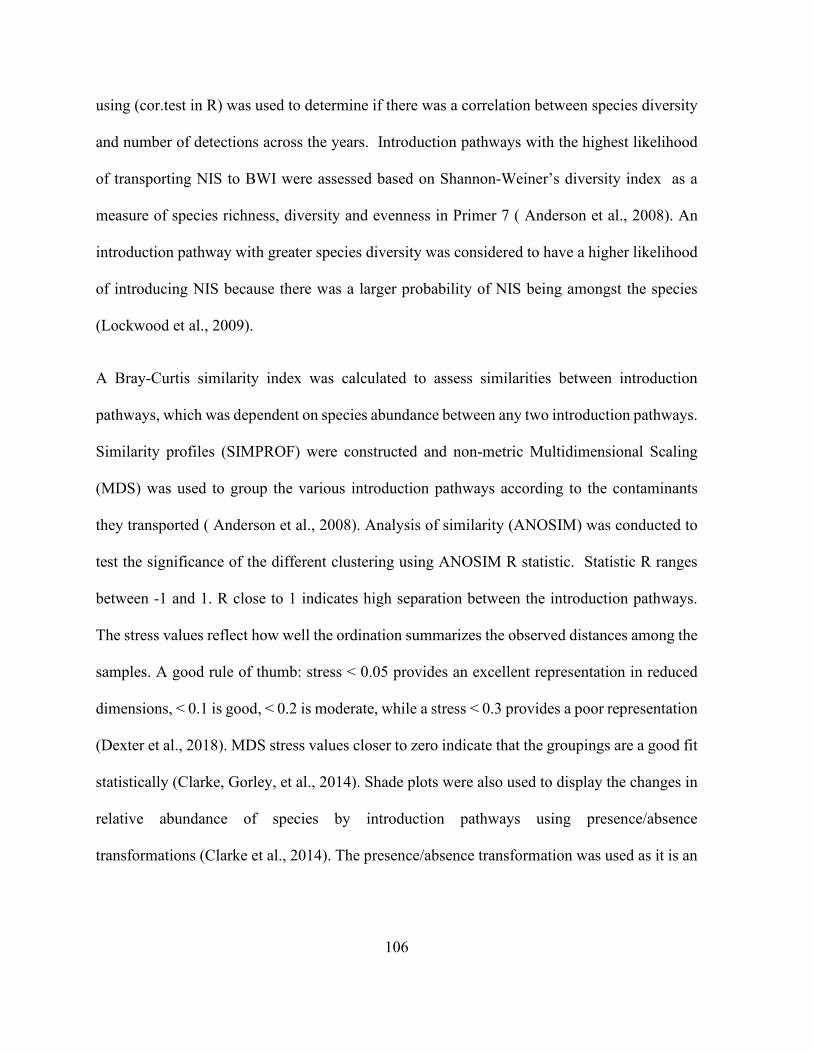
106
using (cor.test in R) was used to determine if there was a correlation between species diversity
and number of detections across the years. Introduction pathways with the highest likelihood
of transporting NIS to BWI were assessed based on Shannon-Weiner’s diversity index as a
measure of species richness, diversity and evenness in Primer 7 ( Anderson et al., 2008). An
introduction pathway with greater species diversity was considered to have a higher likelihood
of introducing NIS because there was a larger probability of NIS being amongst the species
(Lockwood et al., 2009).
A Bray-Curtis similarity index was calculated to assess similarities between introduction
pathways, which was dependent on species abundance between any two introduction pathways.
Similarity profiles (SIMPROF) were constructed and non-metric Multidimensional Scaling
(MDS) was used to group the various introduction pathways according to the contaminants
they transported ( Anderson et al., 2008). Analysis of similarity (ANOSIM) was conducted to
test the significance of the different clustering using ANOSIM R statistic. Statistic R ranges
between -1 and 1. R close to 1 indicates high separation between the introduction pathways.
The stress values reflect how well the ordination summarizes the observed distances among the
samples. A good rule of thumb: stress < 0.05 provides an excellent representation in reduced
dimensions, < 0.1 is good, < 0.2 is moderate, while a stress < 0.3 provides a poor representation
(Dexter et al., 2018). MDS stress values closer to zero indicate that the groupings are a good fit
statistically (Clarke, Gorley, et al., 2014). Shade plots were also used to display the changes in
relative abundance of species by introduction pathways using presence/absence
transformations (Clarke et al., 2014). The presence/absence transformation was used as it is an
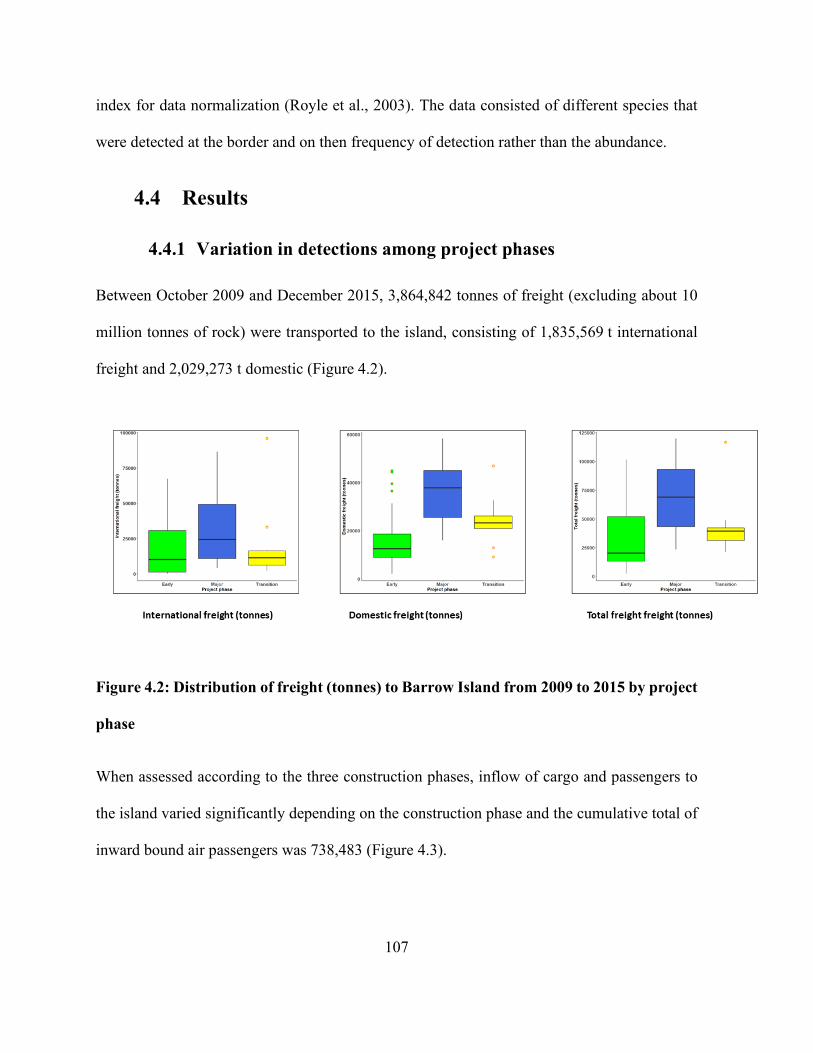
107
index for data normalization (Royle et al., 2003). The data consisted of different species that
were detected at the border and on then frequency of detection rather than the abundance.
4.4 Results
4.4.1 Variation in detections among project phases
Between October 2009 and December 2015, 3,864,842 tonnes of freight (excluding about 10
million tonnes of rock) were transported to the island, consisting of 1,835,569 t international
freight and 2,029,273 t domestic (Figure 4.2).
Figure 4.2: Distribution of freight (tonnes) to Barrow Island from 2009 to 2015 by project
phase
When assessed according to the three construction phases, inflow of cargo and passengers to
the island varied significantly depending on the construction phase and the cumulative total of
inward bound air passengers was 738,483 (Figure 4.3).

108
Figure 4.3: Distribution of air passengers and inward bound flights to Barrow Island
from 2009 to 2015 by project phase.
During this period, almost 6,000 (5,825) detections were made. There were 78 ± 7.6 (min = 0,
observed in November 2009, max = 325 observed in April 2012) mean detections per month
(Figure 4.4a). Inspection hours totalled 1,488,995, with more than 600,000 border inspections
(Figure 4.4b).
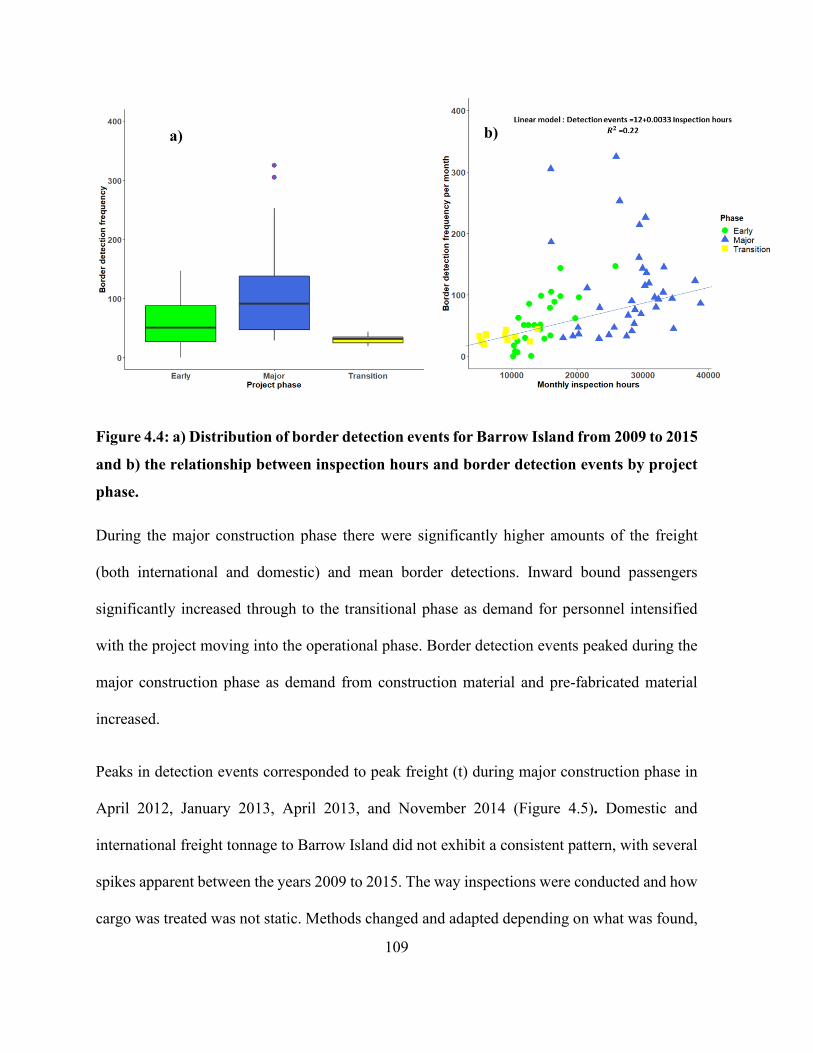
109
Figure 4.4: a) Distribution of border detection events for Barrow Island from 2009 to 2015
and b) the relationship between inspection hours and border detection events by project
phase.
During the major construction phase there were significantly higher amounts of the freight
(both international and domestic) and mean border detections. Inward bound passengers
significantly increased through to the transitional phase as demand for personnel intensified
with the project moving into the operational phase. Border detection events peaked during the
major construction phase as demand from construction material and pre-fabricated material
increased.
Peaks in detection events corresponded to peak freight (t) during major construction phase in
April 2012, January 2013, April 2013, and November 2014 (Figure 4.5). Domestic and
international freight tonnage to Barrow Island did not exhibit a consistent pattern, with several
spikes apparent between the years 2009 to 2015. The way inspections were conducted and how
cargo was treated was not static. Methods changed and adapted depending on what was found,
a) b)
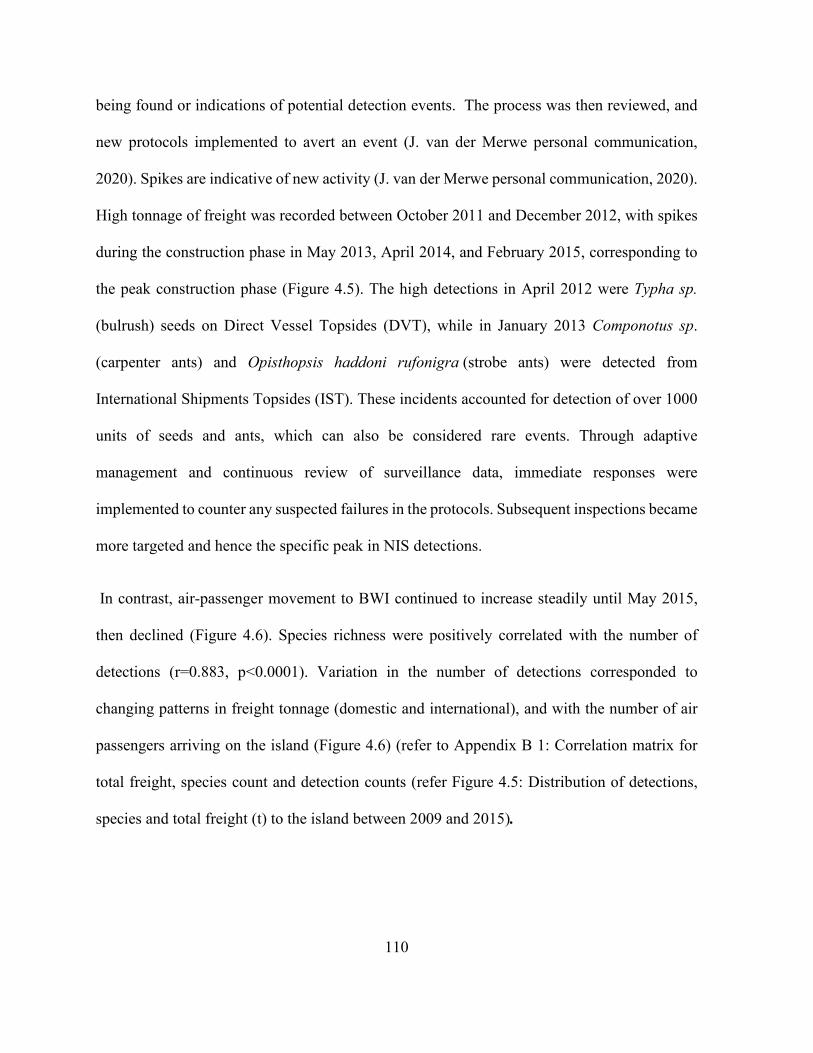
110
being found or indications of potential detection events. The process was then reviewed, and
new protocols implemented to avert an event (J. van der Merwe personal communication,
2020). Spikes are indicative of new activity (J. van der Merwe personal communication, 2020).
High tonnage of freight was recorded between October 2011 and December 2012, with spikes
during the construction phase in May 2013, April 2014, and February 2015, corresponding to
the peak construction phase (Figure 4.5). The high detections in April 2012 were Typha sp.
(bulrush) seeds on Direct Vessel Topsides (DVT), while in January 2013 Componotus sp.
(carpenter ants) and Opisthopsis haddoni rufonigra (strobe ants) were detected from
International Shipments Topsides (IST). These incidents accounted for detection of over 1000
units of seeds and ants, which can also be considered rare events. Through adaptive
management and continuous review of surveillance data, immediate responses were
implemented to counter any suspected failures in the protocols. Subsequent inspections became
more targeted and hence the specific peak in NIS detections.
In contrast, air-passenger movement to BWI continued to increase steadily until May 2015,
then declined (Figure 4.6). Species richness were positively correlated with the number of
detections (r=0.883, p<0.0001). Variation in the number of detections corresponded to
changing patterns in freight tonnage (domestic and international), and with the number of air
passengers arriving on the island (Figure 4.6) (refer to Appendix B 1: Correlation matrix for
total freight, species count and detection counts (refer Figure 4.5: Distribution of detections,
species and total freight (t) to the island between 2009 and 2015).
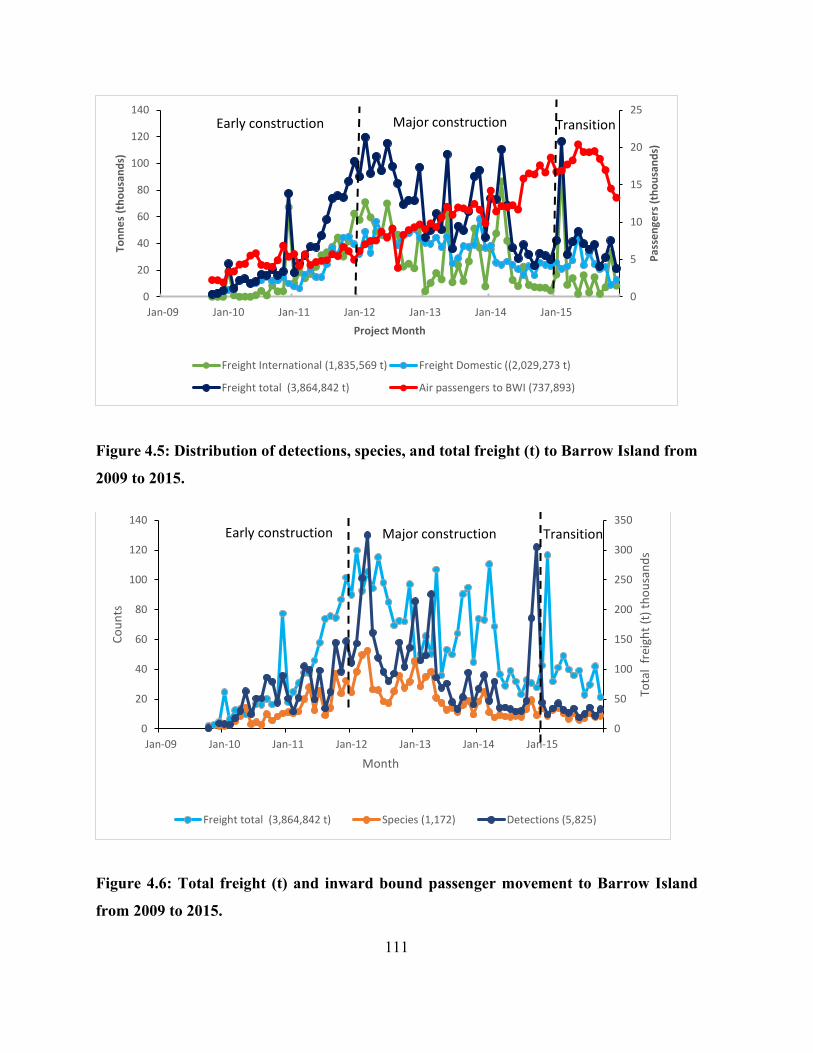
111
Figure 4.5: Distribution of detections, species, and total freight (t) to Barrow Island from
2009 to 2015.
Figure 4.6: Total freight (t) and inward bound passenger movement to Barrow Island
from 2009 to 2015.
0
5
10
15
20
25
0
20
40
60
80
100
120
140
Jan-09 Jan-10 Jan-11 Jan-12 Jan-13 Jan-14 Jan-15
Pass
enge
rs (t
hous
ands
)
Tonn
es (t
hous
ands
)
Project Month
Freight International (1,835,569 t) Freight Domestic ((2,029,273 t)
Freight total (3,864,842 t) Air passengers to BWI (737,893)
Early construction Major construction Transition
0
50
100
150
200
250
300
350
0
20
40
60
80
100
120
140
Jan-09 Jan-10 Jan-11 Jan-12 Jan-13 Jan-14 Jan-15
Tota
l fr
eigh
t (t)
thou
sand
s
Coun
ts
Month
Freight total (3,864,842 t) Species (1,172) Detections (5,825)
Early construction Major construction Transition
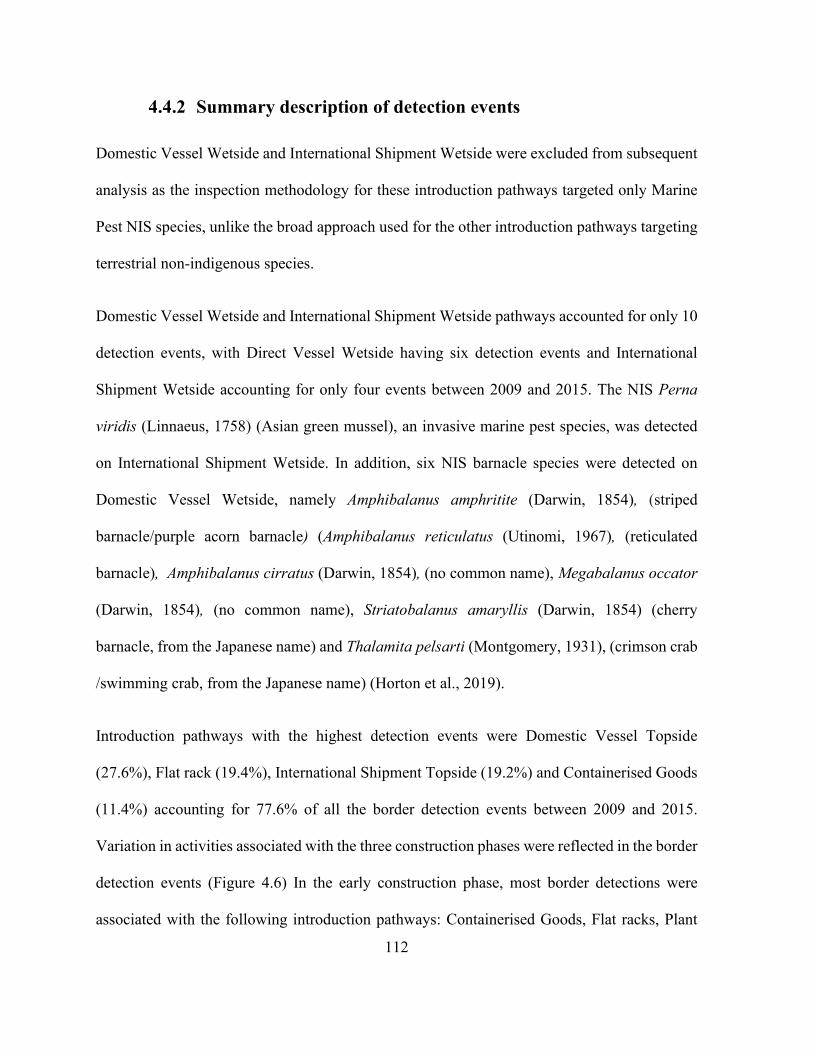
112
4.4.2 Summary description of detection events
Domestic Vessel Wetside and International Shipment Wetside were excluded from subsequent
analysis as the inspection methodology for these introduction pathways targeted only Marine
Pest NIS species, unlike the broad approach used for the other introduction pathways targeting
terrestrial non-indigenous species.
Domestic Vessel Wetside and International Shipment Wetside pathways accounted for only 10
detection events, with Direct Vessel Wetside having six detection events and International
Shipment Wetside accounting for only four events between 2009 and 2015. The NIS Perna
viridis (Linnaeus, 1758) (Asian green mussel), an invasive marine pest species, was detected
on International Shipment Wetside. In addition, six NIS barnacle species were detected on
Domestic Vessel Wetside, namely Amphibalanus amphritite (Darwin, 1854), (striped
barnacle/purple acorn barnacle) (Amphibalanus reticulatus (Utinomi, 1967), (reticulated
barnacle), Amphibalanus cirratus (Darwin, 1854), (no common name), Megabalanus occator
(Darwin, 1854), (no common name), Striatobalanus amaryllis (Darwin, 1854) (cherry
barnacle, from the Japanese name) and Thalamita pelsarti (Montgomery, 1931), (crimson crab
/swimming crab, from the Japanese name) (Horton et al., 2019).
Introduction pathways with the highest detection events were Domestic Vessel Topside
(27.6%), Flat rack (19.4%), International Shipment Topside (19.2%) and Containerised Goods
(11.4%) accounting for 77.6% of all the border detection events between 2009 and 2015.
Variation in activities associated with the three construction phases were reflected in the border
detection events (Figure 4.6) In the early construction phase, most border detections were
associated with the following introduction pathways: Containerised Goods, Flat racks, Plant
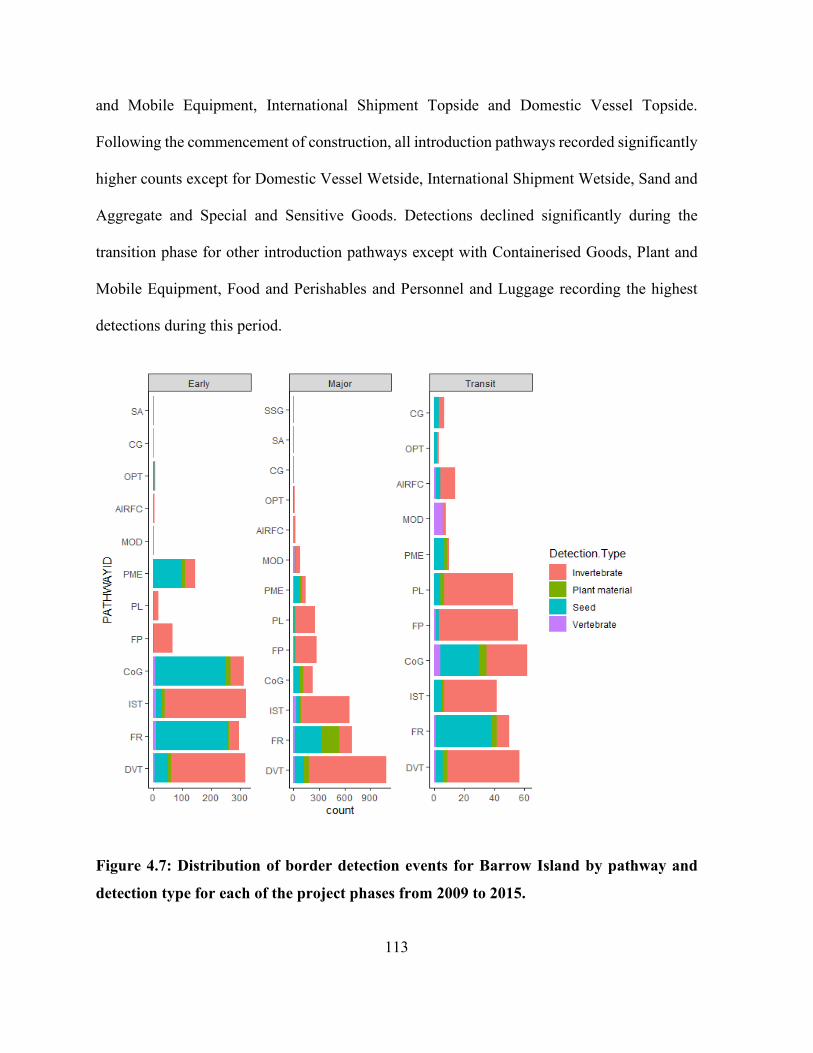
113
and Mobile Equipment, International Shipment Topside and Domestic Vessel Topside.
Following the commencement of construction, all introduction pathways recorded significantly
higher counts except for Domestic Vessel Wetside, International Shipment Wetside, Sand and
Aggregate and Special and Sensitive Goods. Detections declined significantly during the
transition phase for other introduction pathways except with Containerised Goods, Plant and
Mobile Equipment, Food and Perishables and Personnel and Luggage recording the highest
detections during this period.
Figure 4.7: Distribution of border detection events for Barrow Island by pathway and
detection type for each of the project phases from 2009 to 2015.
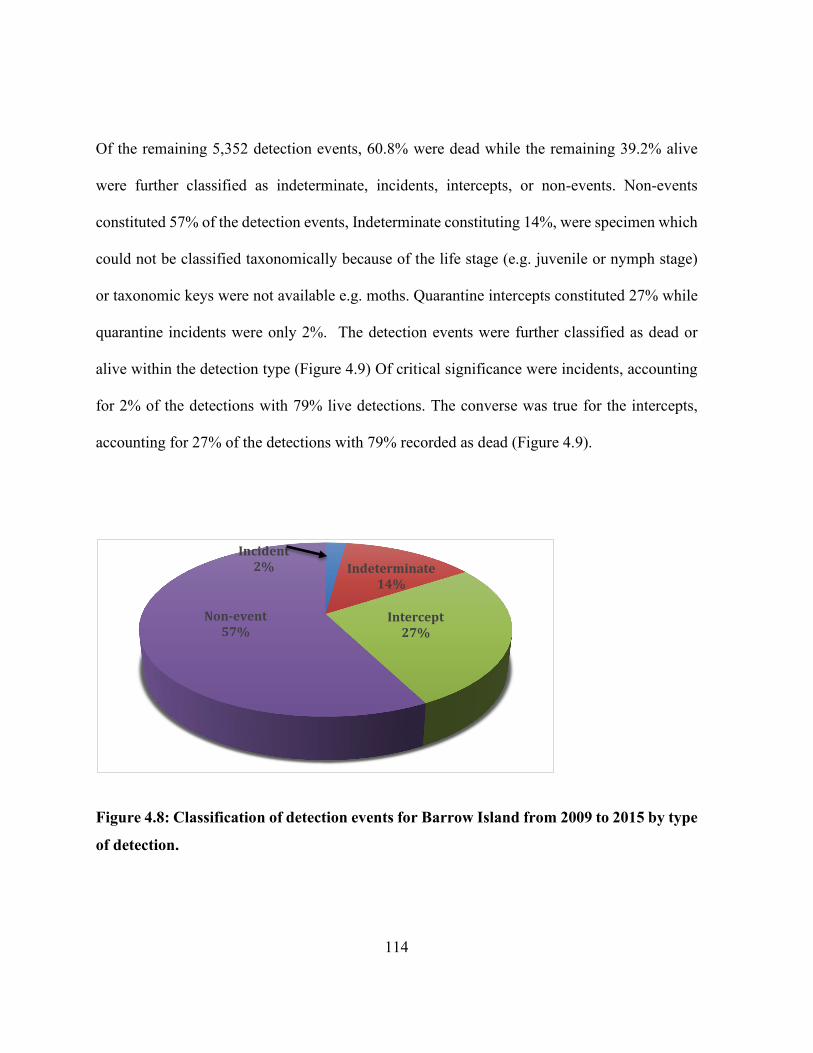
114
Of the remaining 5,352 detection events, 60.8% were dead while the remaining 39.2% alive
were further classified as indeterminate, incidents, intercepts, or non-events. Non-events
constituted 57% of the detection events, Indeterminate constituting 14%, were specimen which
could not be classified taxonomically because of the life stage (e.g. juvenile or nymph stage)
or taxonomic keys were not available e.g. moths. Quarantine intercepts constituted 27% while
quarantine incidents were only 2%. The detection events were further classified as dead or
alive within the detection type (Figure 4.9) Of critical significance were incidents, accounting
for 2% of the detections with 79% live detections. The converse was true for the intercepts,
accounting for 27% of the detections with 79% recorded as dead (Figure 4.9).
Figure 4.8: Classification of detection events for Barrow Island from 2009 to 2015 by type
of detection.
Incident2% Indeterminate
14%
Intercept27%
Non-event57%
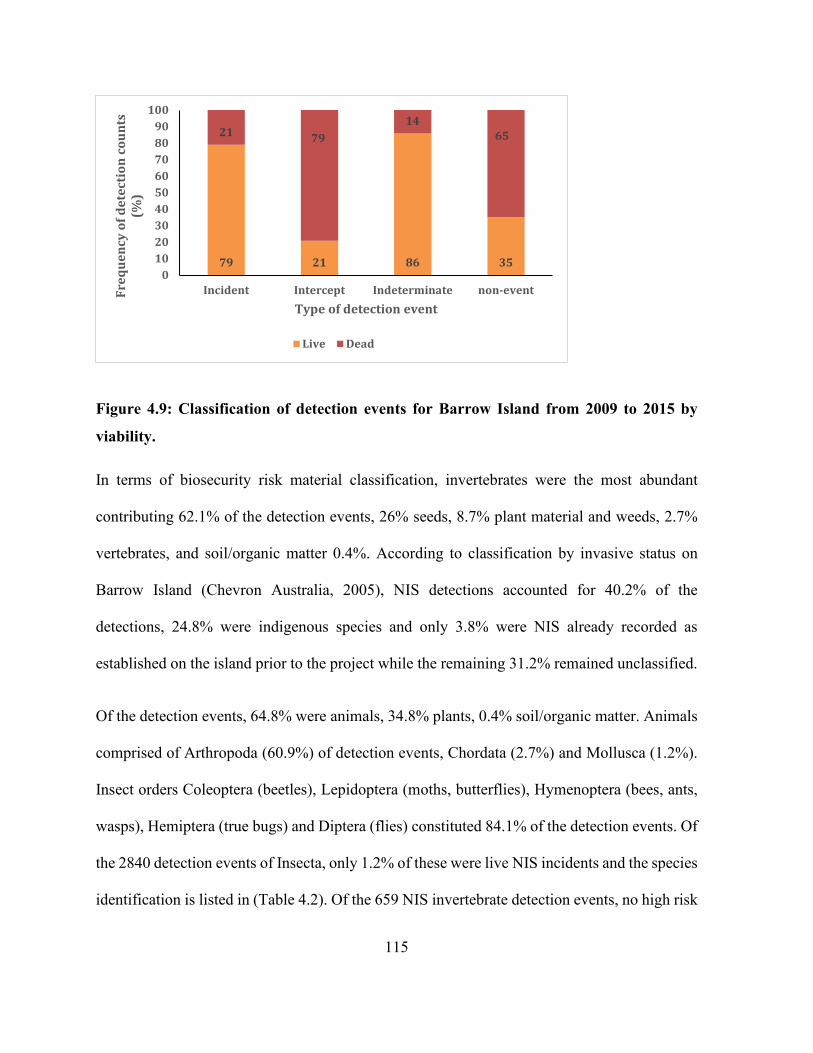
115
Figure 4.9: Classification of detection events for Barrow Island from 2009 to 2015 by
viability.
In terms of biosecurity risk material classification, invertebrates were the most abundant
contributing 62.1% of the detection events, 26% seeds, 8.7% plant material and weeds, 2.7%
vertebrates, and soil/organic matter 0.4%. According to classification by invasive status on
Barrow Island (Chevron Australia, 2005), NIS detections accounted for 40.2% of the
detections, 24.8% were indigenous species and only 3.8% were NIS already recorded as
established on the island prior to the project while the remaining 31.2% remained unclassified.
Of the detection events, 64.8% were animals, 34.8% plants, 0.4% soil/organic matter. Animals
comprised of Arthropoda (60.9%) of detection events, Chordata (2.7%) and Mollusca (1.2%).
Insect orders Coleoptera (beetles), Lepidoptera (moths, butterflies), Hymenoptera (bees, ants,
wasps), Hemiptera (true bugs) and Diptera (flies) constituted 84.1% of the detection events. Of
the 2840 detection events of Insecta, only 1.2% of these were live NIS incidents and the species
identification is listed in (Table 4.2). Of the 659 NIS invertebrate detection events, no high risk
79 21 86 35
21 7914
65
0102030405060708090
100
Incident Intercept Indeterminate non-eventFreq
uenc
y of
det
ecti
on c
ount
s (%
)
Type of detection event
Live Dead
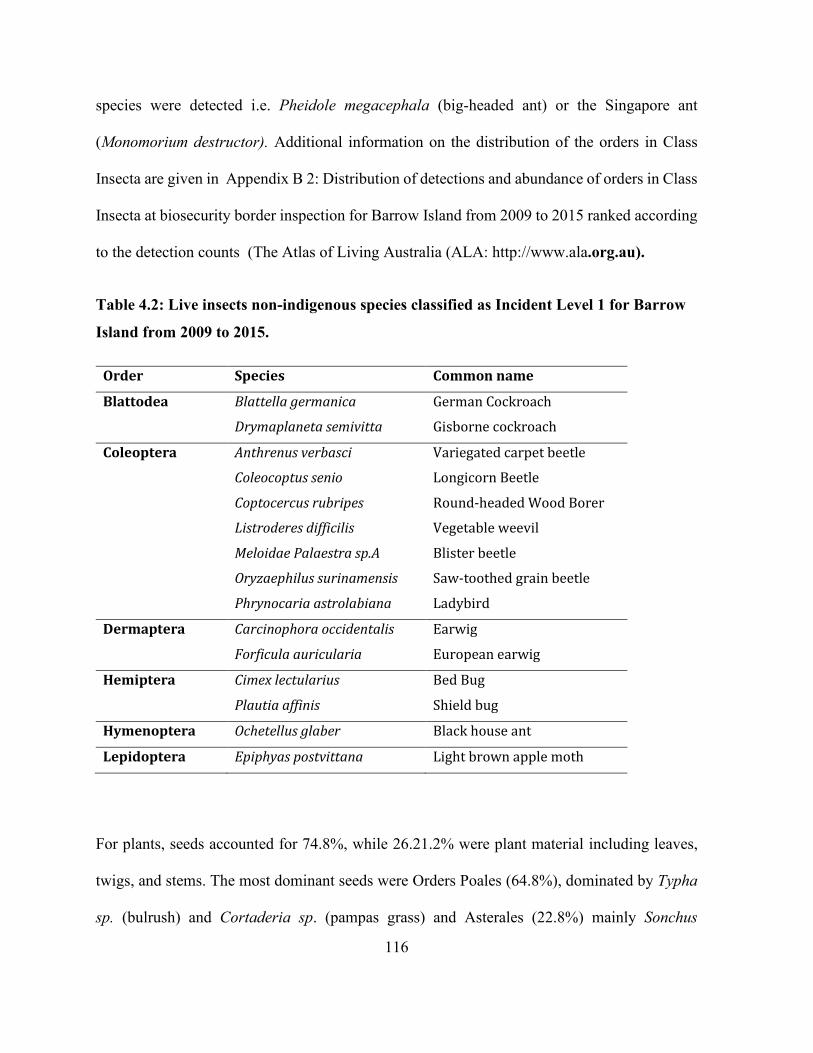
116
species were detected i.e. Pheidole megacephala (big-headed ant) or the Singapore ant
(Monomorium destructor). Additional information on the distribution of the orders in Class
Insecta are given in Appendix B 2: Distribution of detections and abundance of orders in Class
Insecta at biosecurity border inspection for Barrow Island from 2009 to 2015 ranked according
to the detection counts (The Atlas of Living Australia (ALA: http://www.ala.org.au).
Table 4.2: Live insects non-indigenous species classified as Incident Level 1 for Barrow
Island from 2009 to 2015.
Order Species Common name
Blattodea Blattella germanica German Cockroach
Drymaplaneta semivitta Gisborne cockroach
Coleoptera Anthrenus verbasci Variegated carpet beetle
Coleocoptus senio Longicorn Beetle
Coptocercus rubripes Round-headed Wood Borer
Listroderes difficilis Vegetable weevil
Meloidae Palaestra sp.A Blister beetle
Oryzaephilus surinamensis Saw-toothed grain beetle
Phrynocaria astrolabiana Ladybird
Dermaptera Carcinophora occidentalis Earwig
Forficula auricularia European earwig
Hemiptera Cimex lectularius Bed Bug
Plautia affinis Shield bug
Hymenoptera Ochetellus glaber Black house ant
Lepidoptera Epiphyas postvittana Light brown apple moth
For plants, seeds accounted for 74.8%, while 26.21.2% were plant material including leaves,
twigs, and stems. The most dominant seeds were Orders Poales (64.8%), dominated by Typha
sp. (bulrush) and Cortaderia sp. (pampas grass) and Asterales (22.8%) mainly Sonchus
117
oleraceus (sowthistle) that can be classified as benign weeds which are pioneer or specialist
species. Of the 1122 NIS seed detection events, only 0.5 % (6) were buffel grass detections on
Containerised Good (CoG) and Flat racks (FR). Most of the plant seeds where parachute type
seeds that landed in transit on vessels and cargo (J. van der Merwe, personal communication,
2020). Typha sp. is a cosmopolitan iconic wetland plant found worldwide except the Antarctica
(Bansal et al.; Zhou et al., 2018). Typha seed can attach to machinery, humans and their
luggage, and be transported long distance dispersal on cargo, via storms, floods, winds and
birds (The Atlas of Living Australia (ALA: http://www.ala.org.au). Pampas grass and wild oats
are noxious weeds, which thrive in low fertile soils, exhaust surface soil water preventing the
establishment of native, and are pioneer plants on disturbed lands such as road verges.
4.4.3 Variation in NIS detections among the Introduction pathways
There were 2,153 were NIS specimens collected, with 446 NIS species identified in total. Forty
percent of all the detection events were NIS and only 16.6% of NIS detections were live, with
161 species identified. Most of the live detections (76.7%) were from four introduction
pathways, Food and Perishables (22.3%), Personnel and Luggage (22%), International
Shipment Topside (17.6%) and Domestic Vessel Topside (14.8%). Invertebrates (arthropods
and molluscs) accounted for 88.1% of these detections, with insects being the most abundant
of these while plants were (5%) and vertebrates (6.9%). No live vertebrates were detected on
Personnel and Luggage, while no live plant material was detected on International Shipment
Topside. There were 79 NIS vertebrate detections and no live black rats were found, but single
scat samples were found on Containerised Goods, Direct Vessels Topsides, Food and
Perishables and International Shipments Topsides.
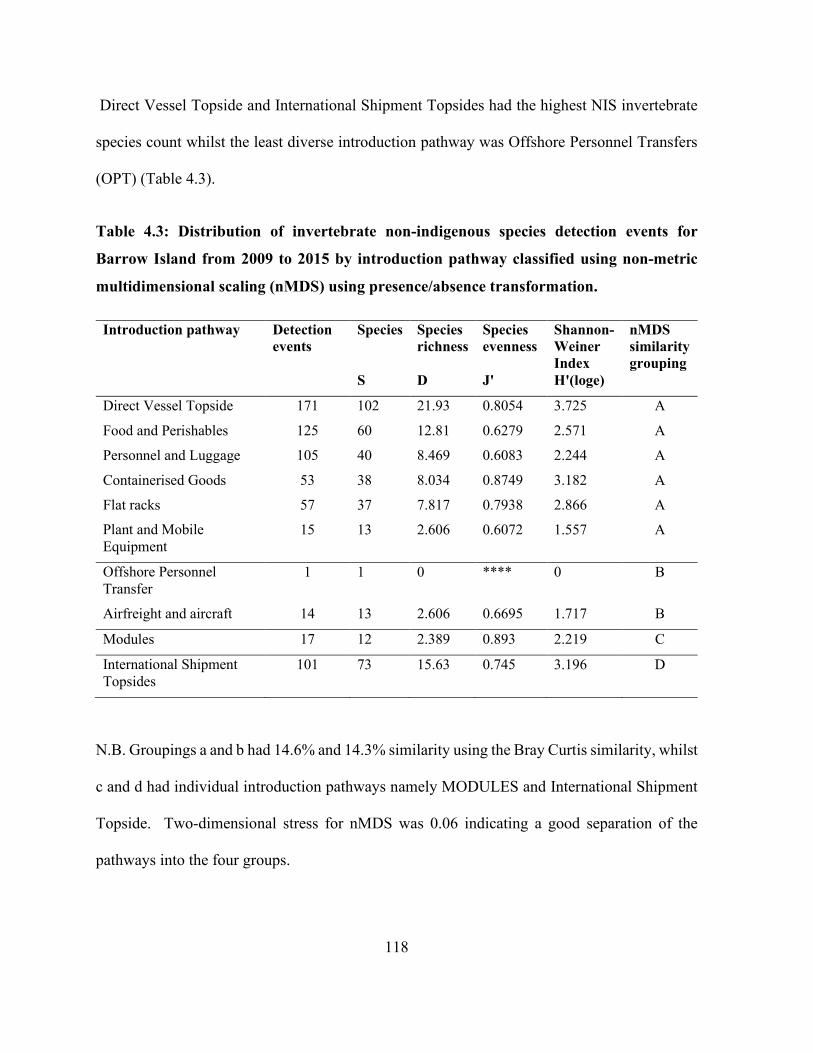
118
Direct Vessel Topside and International Shipment Topsides had the highest NIS invertebrate
species count whilst the least diverse introduction pathway was Offshore Personnel Transfers
(OPT) (Table 4.3).
Table 4.3: Distribution of invertebrate non-indigenous species detection events for
Barrow Island from 2009 to 2015 by introduction pathway classified using non-metric
multidimensional scaling (nMDS) using presence/absence transformation.
Introduction pathway Detection events
Species Species richness
Species evenness
Shannon-Weiner Index
nMDS similarity grouping
S D J' H'(loge)
Direct Vessel Topside 171 102 21.93 0.8054 3.725 A
Food and Perishables 125 60 12.81 0.6279 2.571 A
Personnel and Luggage 105 40 8.469 0.6083 2.244 A
Containerised Goods 53 38 8.034 0.8749 3.182 A
Flat racks 57 37 7.817 0.7938 2.866 A
Plant and Mobile Equipment
15 13 2.606 0.6072 1.557 A
Offshore Personnel Transfer
1 1 0 **** 0 B
Airfreight and aircraft 14 13 2.606 0.6695 1.717 B
Modules 17 12 2.389 0.893 2.219 C
International Shipment Topsides
101 73 15.63 0.745 3.196 D
N.B. Groupings a and b had 14.6% and 14.3% similarity using the Bray Curtis similarity, whilst
c and d had individual introduction pathways namely MODULES and International Shipment
Topside. Two-dimensional stress for nMDS was 0.06 indicating a good separation of the
pathways into the four groups.
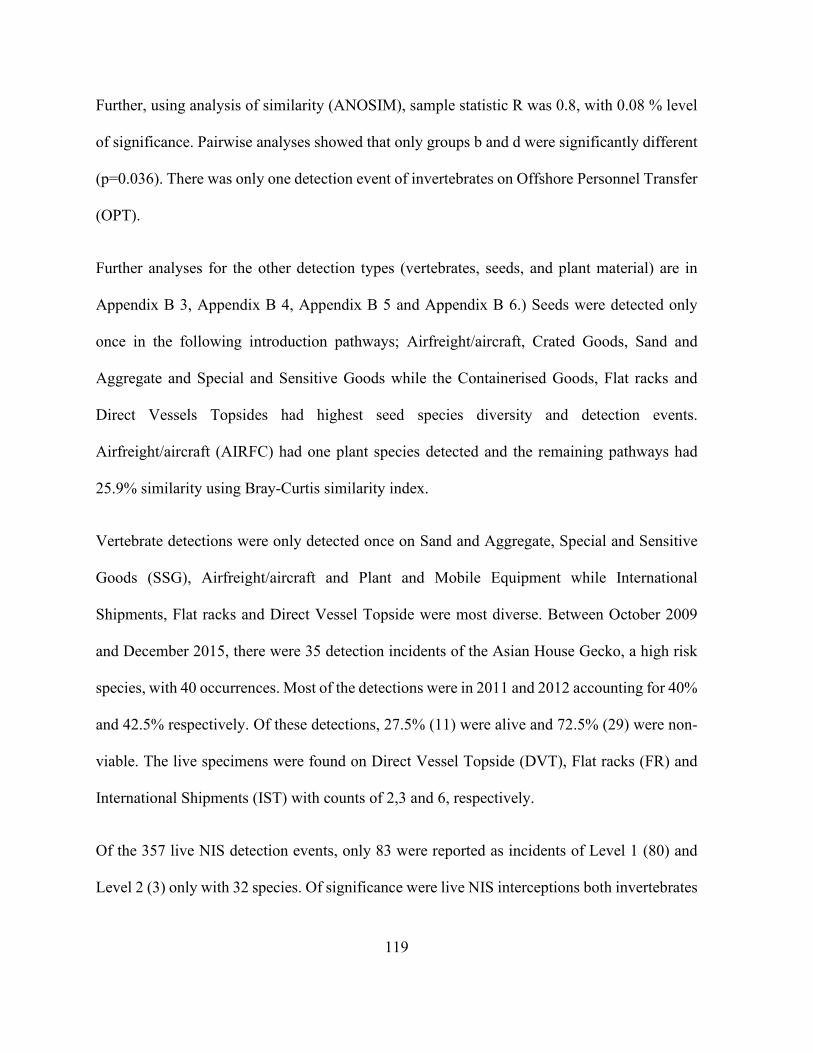
119
Further, using analysis of similarity (ANOSIM), sample statistic R was 0.8, with 0.08 % level
of significance. Pairwise analyses showed that only groups b and d were significantly different
(p=0.036). There was only one detection event of invertebrates on Offshore Personnel Transfer
(OPT).
Further analyses for the other detection types (vertebrates, seeds, and plant material) are in
Appendix B 3, Appendix B 4, Appendix B 5 and Appendix B 6.) Seeds were detected only
once in the following introduction pathways; Airfreight/aircraft, Crated Goods, Sand and
Aggregate and Special and Sensitive Goods while the Containerised Goods, Flat racks and
Direct Vessels Topsides had highest seed species diversity and detection events.
Airfreight/aircraft (AIRFC) had one plant species detected and the remaining pathways had
25.9% similarity using Bray-Curtis similarity index.
Vertebrate detections were only detected once on Sand and Aggregate, Special and Sensitive
Goods (SSG), Airfreight/aircraft and Plant and Mobile Equipment while International
Shipments, Flat racks and Direct Vessel Topside were most diverse. Between October 2009
and December 2015, there were 35 detection incidents of the Asian House Gecko, a high risk
species, with 40 occurrences. Most of the detections were in 2011 and 2012 accounting for 40%
and 42.5% respectively. Of these detections, 27.5% (11) were alive and 72.5% (29) were non-
viable. The live specimens were found on Direct Vessel Topside (DVT), Flat racks (FR) and
International Shipments (IST) with counts of 2,3 and 6, respectively.
Of the 357 live NIS detection events, only 83 were reported as incidents of Level 1 (80) and
Level 2 (3) only with 32 species. Of significance were live NIS interceptions both invertebrates
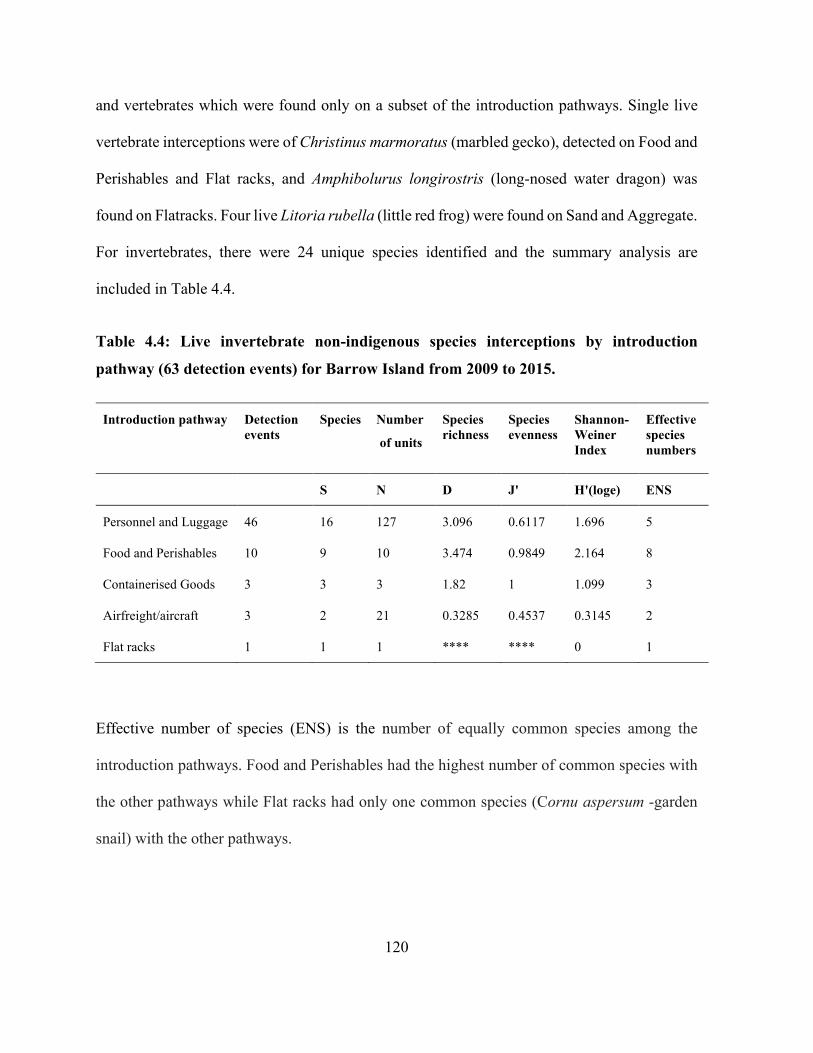
120
and vertebrates which were found only on a subset of the introduction pathways. Single live
vertebrate interceptions were of Christinus marmoratus (marbled gecko), detected on Food and
Perishables and Flat racks, and Amphibolurus longirostris (long-nosed water dragon) was
found on Flatracks. Four live Litoria rubella (little red frog) were found on Sand and Aggregate.
For invertebrates, there were 24 unique species identified and the summary analysis are
included in Table 4.4.
Table 4.4: Live invertebrate non-indigenous species interceptions by introduction
pathway (63 detection events) for Barrow Island from 2009 to 2015.
Introduction pathway Detection events
Species Number
of units
Species richness
Species evenness
Shannon-Weiner Index
Effective species numbers
S N D J' H'(loge) ENS
Personnel and Luggage 46 16 127 3.096 0.6117 1.696 5
Food and Perishables 10 9 10 3.474 0.9849 2.164 8
Containerised Goods 3 3 3 1.82 1 1.099 3
Airfreight/aircraft 3 2 21 0.3285 0.4537 0.3145 2
Flat racks 1 1 1 **** **** 0 1
Effective number of species (ENS) is the number of equally common species among the
introduction pathways. Food and Perishables had the highest number of common species with
the other pathways while Flat racks had only one common species (Cornu aspersum -garden
snail) with the other pathways.
121
Ommatoiulus moreletii (Portuguese millipede) was the most common live invertebrate species
found across all the introduction pathways except the Flat racks (Figure 4.10). Food and
perishables had most of the species except Coleocoptus senio (longicorn beetle) and
Oryzaephilus surinamensis (sawtoothed grain beetle) which were found only on Containerised
Goods and Airfreight/Aircraft pathways, respectively. O. surinamensis is a stored product pest
recorded from products such as e.g. rice, flour, cereals, nuts, and beans, and in this instance, it
was found in oats cereal in Airfreight and Aircraft.
Figure 4.10: Distribution of 10 most abundant invertebrate intercepts by introduction
pathway (presence/absence) for Barrow Island from 2009 to 2015.
It is evident that live NIS were abundant in 2013, for the pathways Direct Vessel Topsides
(DVT) and Personnel and Luggage (PL) while limited live NIS detections were found in 2010
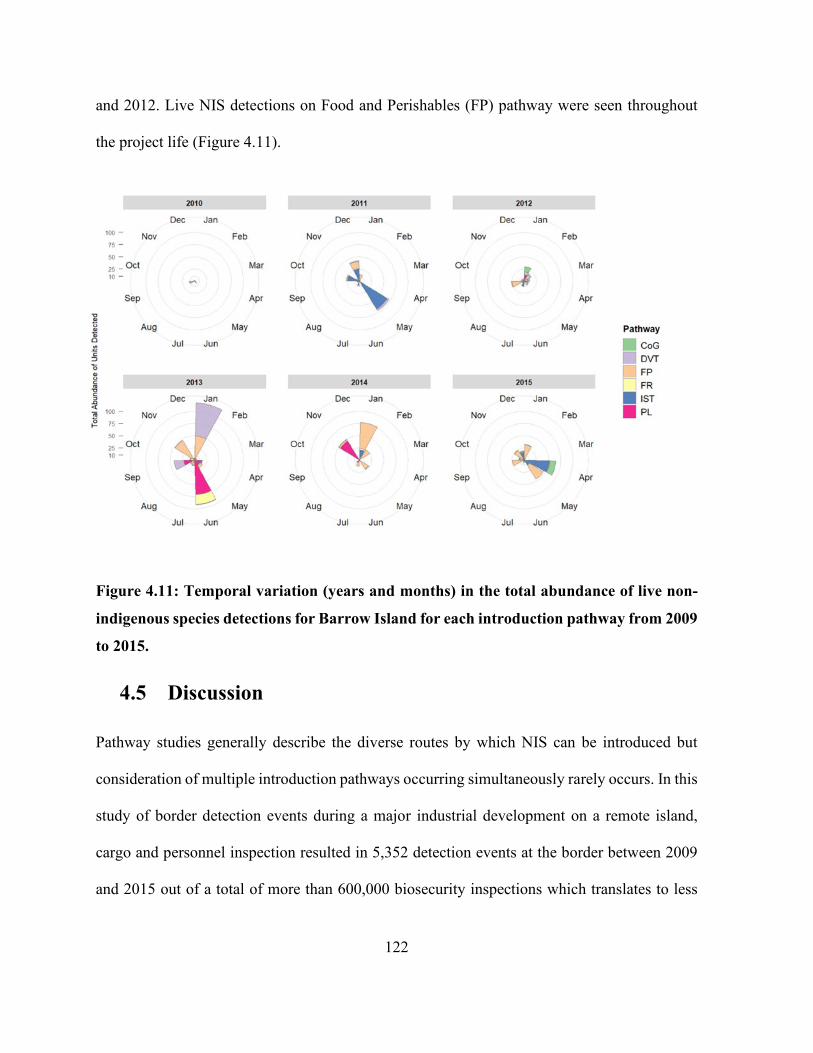
122
and 2012. Live NIS detections on Food and Perishables (FP) pathway were seen throughout
the project life (Figure 4.11).
Figure 4.11: Temporal variation (years and months) in the total abundance of live non-
indigenous species detections for Barrow Island for each introduction pathway from 2009
to 2015.
4.5 Discussion
Pathway studies generally describe the diverse routes by which NIS can be introduced but
consideration of multiple introduction pathways occurring simultaneously rarely occurs. In this
study of border detection events during a major industrial development on a remote island,
cargo and personnel inspection resulted in 5,352 detection events at the border between 2009
and 2015 out of a total of more than 600,000 biosecurity inspections which translates to less
123
than 0.1% of the border inspections. Of 15 introduction pathways reported in this study, four
presented the highest likelihood of transporting NIS to the island. These were Flat racks,
Containerised Goods, Direct Vessel Topside and International Shipment Topside. Pathways
were identified as high risk initially through risk assessments conducted prior to the project
commencement (Hayes et al., 2006; Stoklosa, 2004). Each introduction pathway had a unique
suite of characteristics that enabled an association with specific NIS presenting different
approaches to effective biosecurity management.
Arrival and survival of NIS (i.e. live NIS) at biosecurity borders globally are of great concern
and the subject of extensive biosecurity effort. Given that 40.2% of the detections made at
Barrow Island were non-indigenous species (NIS), with 16.6% of these live NIS, biosecurity
management of these interceptions is critical. Detection of NIS previously established on the
island (3.5%) prior to the Gorgon LNG Project, provides an indicator of the exposure pressure
historically experienced on Barrow Island (M. Thomas, personal communication, 2020). Post
border surveillance shows that no NIS species have been introduced and become establishment
on Barrow island (Scott et al., 2017). All NIS species that have been detected on Barrow Island
have been eradicated, e.g. the Asian House Gecko, or are under a quarantine response like the
buffel grass. On-going NIS species surveillance has not detected the presence of these species
(Scott et al., 2017). This surveillance program is a ministerial requirement and NIS species
must be detected if it is present on Barrow Island with a mandated power of detection of 0.8
(Barrett et al., 2010; Majer et al., 2013; Murray et al., 2015; Whittle et al., 2013). Biosecurity
Inspections continue to be vigilant for NIS species that have high ecological impact and are
124
rapidly invasive such as Cenchrus ciliaris (buffel grass), Aerva javanica (Kapok bush/desert
cotton) and Hemidactylus frenatus (Asian House Gecko).
This research has shown that vessel topsides (Direct Vessel Topsides and Flat racks) and
Containerised Goods have the propensity to transport a diverse assemblage of NIS and had the
highest counts of live NIS at the border and hence presented the greatest challenges to
biosecurity. Many detections were of the Typha sp. (seeds), that are easily dispersed by wind
and consequently can readily contaminate exposed surfaces during transit (Scott et al., 2017).
Topsides of vessels and have a high propensity for becoming infected as they have large
exposed surfaces, allowing organisms to attach/ hide more readily, and as such have an
increased chance of hitchhikers being transported with the vessel. Coleoptera and Lepidoptera
were the most frequently detected insect orders on vessels topsides. In both cases, these are
flying insects that are attracted to the lights on the vessels were mostly from BWI and not NIS.
It should be noted that the vessels were fitted with low sodium vapour lights (to protect turtles
at night) and this attracted even less insects, which means the number of insects would have
been higher than recorded. Further, Lepidoptera species have the propensity to hide in dark
gaps and crevices, are attracted to ship lights and their pupae and eggs affix easily to steel
surfaces, and hence can be transported in containers and machinery undetected (Jenkins et al.,
2014; Meurisse et al., 2018).
The cargo loading process itself can attract pests according to the timing of loading (i.e. night
versus daytime) and the speed/ duration with which loading occurs, however, in this study
night-time loading was prohibited (Caton et al., 2006). Night-time loading was prohibited
because high risk of insects being attracted to the lights, In addition, night light disrupts the
125
search pattern of female sea-turtle seeking appropriate nesting sites, while hatchlings orientate
themselves by the moon light. As such anthropogenic lighting confuses them (Chevron
Australia, 2009; Rich et al., 2013; Salmon, 2006). As such, and special lighting requirements
are in place on Barrow Island for the protection of turtles (Chevron Australia, 2009b). Duration
and conditions during transit affect the survival of species detected at biosecurity borders, e.g.
the effect of residual chemicals reduces the likelihood of survival, which influences the
probability of establishment and recruitment in the receiving environment (Essl et al., 2015;
Pyšek et al., 2011). Vessel speed, journey duration and ports of call, location of cargo loading,
and origin of cargo can all influence the capacity of vessels to transport pest species (Coutts et
al., 2007). These factors are highly variable for the vessels investigated in this study and are
associated with basic differences among introduction pathways and their capacity to transport
NIS invariably influence the species detected (Hewitt et al., 2007; Hewitt et al., 2002;
McDonald et al., 2015) The likelihood of survival of NIS was further reduced by application
of residual insecticide to vessel topsides.
By their very nature, different introduction pathways vary in the availability and accessibility
of suitable niches, availability of food source during transit and suitable environmental
conditions. Consequently, these factors influence the type of organisms that are likely to be
transported. This is further enhanced by the biological and ecological characteristics of the
organism (Sheikh et al., 2017). Cargo containing food items is challenging in terms of pest
elimination due to pre-sealed packaging or internal contamination prior to shipment. As a
consequence, these introduction pathways require more inspection effort and refinement of
126
biosecurity protocols to minimise the likelihood of their transporting unwanted biosecurity risk
material.
Specific pathways related to workers (Offshore Personnel Transfers, Personnel Luggage and
Aircraft/ Airfreight), accounted for 14.4% of all the detection events in this study with high
species diversity and abundance. These pathways present serious challenges in terms of
biosecurity compliance and monitoring. Workers are expected to comply with specific
biosecurity protocols and any oversight is corrected at final inspection after check-in where
footwear, bags, equipment are rejected Enforcing worker compliance is challenging, however
improved biosecurity can rely on appropriate and ongoing education, training and most
importantly, compliance. Unlike other frequently visited islands , like the Galápagos Island,
likely to experience an increase in the introduction of invasive species due to increasing human
activity, BWI is likely to have a reduced workforce as it goes into the operational phase of the
project (Balchin et al., 2019; Toral-Granda et al., 2017). To assist biosecurity managers to
overcome these inherent human related risks, statistical profiling for intervention of biosecurity
risk material can be a useful tool for improving the efficiency of detecting personnel at high
risk of non-compliance and thus focus thorough inspection on the targeted cohort (Lane et al.,
2017). Biosecurity managers need to be mindful of the problems posed by visitor/ worker non-
compliance and associated with future human movement globally.
Not surprisingly, the number of detections and species diversity increased relative to the
movement of freight and personnel to BWI, further, with the peak in construction activity
between 2012 and 2014. My research also revealed that the greater the volume of traffic to the
island, the higher the abundance of organisms detected (Figure 4.3). More importantly, the
127
volume of traffic was positively related to the abundance of different classes of live NIS
detected, with detections of NIS insect and seed increasing with vessel traffic. Strict adherence
to vessel biosecurity measures is therefore necessary (Booth et al., 2012; Clarke et al., 2017;
Hewitt et al., 2007; Zabin et al., 2018).
When biosecurity managers are assessing data it is important to acknowledge propagule
pressure, which incorporates the increased intensity of arrival events (i.e. frequency of
detections) and the propagule size (abundance of organisms detected) (Simberloff, 2009). For
example, for total detections, International Shipment and Sand and Aggregate (SA) had low
numbers of detections events (1,034 and 8 respectively) but in contrast had high numbers of
organisms/units detected (5,333 and 952 respectively). Propagule characterisation is important
for invasive species with Allee effects (i.e. species whose survival probability increases with
the density of the population) and low propagule pressure (Courtois et al., 2018). This is an
important differentiating factor as the higher the frequency of detection, the greater the
likelihood of an incursion event. In terms of biosecurity management, there is need to pay close
attention to introduction pathways that demonstrate the potential for both types of detection
patterns.
Of the 5352 detection events, vertebrates (62.1%) were the most abundant organisms detected
on the various introduction pathways, followed by seeds (26%), with a smaller number of units
of plant material (8.7%), vertebrates (2.7%) and soil/ organic matter (0.4%). A similar pattern
of detections was observed during a study of the Australian Federal Department of Agriculture
and Water Resources (DAWR) vessel inspection data from January 2010 to December 2015
(Clarke et al., 2017). Clarke et al. (2017) reported that invertebrates constituted 87% of total
128
organisms removed from vessels, seeds 8% and plants and animals 2%. Clarke et al. (2017)
further highlighted that the nature of vessel inspection procedures was heavily biased towards
terrestrial and non-aquatic species. Further characterisation of the detection events showed that
60.8% were dead while 39.2% were deemed viable. Detection events were categorised as non-
events constituting 57%, indeterminate constituted 14%, intercepts 27%, incidents 2%. Apart
from visual inspection, a variety of techniques can be implemented to detect insects, and these
include baited traps and lures, acoustic and laser vibrometry (Poland et al, 2019; Suckling et.al
2016). Given that inspection efforts at BWI also often targeted these organisms, it is not
surprising that they were some of the most abundant organisms detected.
Live NIS species presented the greatest biosecurity risk to BWI and were analysed in greater
detail. On BWI, focus was on incidents which were classified levels 1-3, with increasing
severity of risk to biodiversity on BWI. No Incident Level 3 detection event was recorded while
only 3 events were incidents Level 2 were recorded during the period 2009 and 2015. These
were incidents were of Christinus marmoratus (marbled gecko) detected on Food and
Perishables, Containerised Goods and Flat racks. There is uncertainty of the risk posed by the
marbled gecko due to its ability to survive on BWI. The remaining Incident Level 1 detection
events were found on only five introduction pathways, with Personnel and Luggage and Food
and Perishables having the 16 and 9 species detected, respectively. This confirms the initial
risk assessments at the beginning of the project which identified these introduction pathways
as posing high risk.
Some detection events were trace elements (e.g. scats, fur, skin, remains of fish and faeces of
seabirds that rested or ate the meal on deck) indicating presence of an organism. Ramsey et al.
129
(2018) demonstrated the difficulty of collating scat presence to presence of live foxes in
Tasmania, since the scat only demonstrated that a live organism had been present, but its current
location was indeterminate. Trace evidence are, however, useful as indicators of where the
organism is likely to be found to direct future surveillance efforts. It should be noted that when
vessels ports left for BWI, they are free of discernible biosecurity risk material as they
underwent two verification checks immediately prior to leaving. It should be acknowledged
that taxonomic classification to species levels was not done for many of the specimen because
either specimen presented were in poor condition, only parts of the specimen were available or
were unidentifiable life stages (juveniles). However, a para- taxonomic framework exits to
provide continuity in identification between specimen and specimen classification is an on-
going project for Barrow Island.
4.6 Conclusion
The fact that no NIS established on BWI to date is significant and confirms that systems
approach to the biosecurity management system implemented on BWI has effective protocols
in place.
Transportation of live NIS is of greatest concern to biosecurity because they are a viable
incursion source should they establish in suitable habitats. Consequently, determining where
live NIS are most likely to be detected is key to effective biosecurity. Quantitatively evaluating
NIS detections in various introduction pathways is an important process in assisting biosecurity
managers in focusing biosecurity surveillance and reducing the likelihood of incursions. In my
study, each introduction pathway differed in the abundance and frequency of NIS detections.
130
There are multiple reasons for these differences, including the type of commodity being
transported, potential of the commodity to attract organisms, surveillance effort, ease of
treatment introduction pathway type and surveillance success by target species. Greater
biosecurity effort needs to be focused on exposed surfaces and human related pathways, since
these introduction pathways are susceptible to live NIS and thus pose a definable biosecurity
problem. My study emphasised that the introduction pathways with the highest likelihood of
detection varies in relation to the port of origin and the cargo being transported.
The way forward is to ensure that introduction pathways are understood, and modifications to
biosecurity management procedures are sufficient and suitably flexible to adapt to changing
biosecurity factors associated with movement of personnel and cargo. Whenever resource
development occurs or there is an expansion into undisturbed areas, it is imperative that a
comprehensive biosecurity programme is implemented to minimise loss of flora and fauna. In
places of high conservation value, like Barrow Island, the goal should be no new-indigenous
species to be introduced as standard practice.
131
Chapter 5
Three-way management prioritisation is effective
for determining key factors in live non-indigenous
species detection during an island development
project
Abstract
New incursion by invasive species is occurring more frequently due to increased global traffic,
resource development and trade. Biosecurity prioritisation is integral to effective surveillance
and management of these invasions. This research assessed three-way management (species,
pathway, and sites) prioritisation during an industrial development on a high-biodiversity
island. Data was collected between 2009 and 2018. Boosted regression modelling determined
the most important factors influencing the detection of live non-indigenous species (NIS) at the
biosecurity border. Factors considered in detecting NIS included potential mode of introduction
(PMoI), detection type, border inspection point (location), phase of industrial development,
year, and month of detection, of which detection type, border inspection point and PMoI were
key factors. Invertebrates comprised 73% of the detections, with 43% live NIS. PMoI with
large exposed exteriors transported most of the live invertebrates. Structures such as landings
and jetties were recorded as invasion hotspots, consistent with being the first point of entry for
132
arriving vessels. Human-inhabited environments reported abundant commensal NIS.
Commensal NIS complete their life cycles in these habitats or require sheltered areas to avoid
extreme conditions. My study indicates that biosecurity surveillance programs need to prioritise
management of specific species, PMoIs, and sensitive and susceptible sites in order to target
potential invasions.
5.1 Introduction
Evaluating the predictive performance of models used in biosecurity surveillance is essential
to management decision-making. This evaluation includes assessing the suitability of the model
for specific applications, i.e. identifying important potential predictors, undertaking a
comparative assessment of competing models and modelling techniques, and identifying
aspects of the model that may need to be improved (Pearce et al., 2000). Biosecurity programs
for ecological management of invasive species are often focused on species and pathways-
based prioritisation (Essl et al., 2015; Foxcroft et al., 2019; Kumschick et al., 2012; Kumschick
et al., 2013; McGeoch et al., 2016; Saul et al., 2017). However, three-way prioritisation is
thought to be a more effective way of managing biosecurity as it encompasses three foci
simultaneously (site, pathway, and species) (McGeoch et al., 2016; Padayachee et al., 2019).
Techniques that can be used for prioritisation include pathway models, network invasion
models and decision trees, which can characterise and predict pathways that are most likely to
carry non-indigenous species (NIS) (Azmi et al., 2014; Baxter et al., 2016; Campbell, 2011;
Colunga-Garcia et al., 2013; Paini et al., 2012).
133
Boosted regression tree models (BRT), also known as Gradient Boosted Machine (GBM) or
Stochastic Gradient Boosting (SGB), can have ecological applications for studying population
dynamics and habitat suitability (Colin et al., 2017; Debeljak et al., 2007; Debeljak et al., 2011;
Džeroski et al., 2003; Ogris et al., 2010). Advantages of applying BRTs are: 1) predictors can
be of any measurement type (i.e. numeric, binary, categorical), 2) models are unaffected by
transformations and differences in measurement scales among predictors and are insensitive to
outliers, and 3) the importance of predictors can be assessed to determine model of best fit and
the ability to fit interactions between predictors (Elith et al., 2017; Friedman et al., 2003;
Froeschke et al., 2016; Leathwick et al., 2006). BRT modelling can be used to understand
factors involved in determining how NIS reach borders, both spatially and temporally, and to
make adaptive predictions about changes to these factors over time (Moon et al., 2017). BRT
was used in this research to provide a better understanding of how non-indigenous species are
reaching the borders and entry points of a remote offshore island, the site of a major industrial
development occurring off the Western Australian coastline.
McGeoch et al. (2016) described the resource development project on Barrow Island, Australia
- the subject of this research - as an example of site-based prioritization. The island is classified
as susceptible because of the high movement of goods and personnel associated with the
development, and sensitive due to the unique biodiversity of flora and fauna on the island.
(McGeoch et al., 2016; Moro et al., 2018; Moro et al., 2013b; Scott et al., 2017).
To date little attention has been paid to quantitative integration of priorities across multiple
species, pathways and sites (McGeoch et al., 2016). The data collected for the Barrow Island
Quarantine Management System (QMS) provided the opportunity to implement a three-way
134
prioritization. Biosecurity surveillance and a suitable management plan were required to gain
government approval for construction and subsequent operation of a liquid natural gas (LNG)
processing plant at Barrow Island (BWI), Western Australia (Government of Western
Australia, 2009). The island has strategic advantages in biosecurity management due to its
geographical isolation, specific biosecurity regulatory framework (Barrow Island Act of 2003)
and lack of internal political borders (Government of Western Australia, 2003).
The primary aim of the BWI biosecurity program was to prevent the introduction of any new
NIS to the island. The program adopted the precautionary approach from the Convention of
Biological Diversity ethos, as stated by Campbell (2011), “that it is preferable to make a
mistake of denying entry to a non-pest than to allow entry of a pest because a decision to admit
a species is usually irreversible”. Potential adverse impacts of NIS include transmission of
diseases, competition with existing populations, disruptions of ecological interactions, fire
hazards and effects on the nutrient cycle (Carboneras et al., 2018; Jeschke et al., 2014;
Kumschick & Richardson, 2013; McCreless et al., 2016; Nentwig et al., 2018; Pergl et al.,
2017; Ricciardi et al., 2013; Rumlerová et al., 2016). As such, biosecurity protocols were
implemented pre-border, at border and post-border on BWI to reduce the potential of NIS
reaching the island via the various potential modes of introduction (PMoI) associated with the
gas plant development. A biosecurity border is defined is the point of entry of goods by land,
air or sea into a designated area for quarantine purposes. All NIS were a target of the BWI
surveillance program, with a specific focus on live NIS that pose the greatest risk should they
go beyond the border. The program was designed to conserve the island’s high biodiversity
value (Chevron Australia, 2014; Government of Western Australia, 2009; Gunawardene et al.,
135
2013). Effective biosecurity management of BWI is integral to the long-term economic
operations of the industrial project.
Risk assessments were conducted at the commencement of the project on Barrow Island, and a
NIS watch-list was created and updated as more information became available (Stoklosa, 2005;
Whittle et al., 2013). Target or watch-lists for NIS are important and widely used surveillance
tools (Essl et al., 2011; Faulkner et al., 2016; Matthews et al., 2017). These lists assist in
identifying species not yet present but have been recorded as potentially problematic based on
their biosecurity impacts and compatibility with the recipient community and environment
(Verbrugge et al., 2012).
Currently there is limited understanding of pathways associated with the introduction of
multiple highest-priority species at sensitive or susceptible sites, or which sites are most at risk
of invasion by high-priority species (McGeoch et al., 2016). The aim of this study is to address
this research gap using data gathered from border biosecurity detections on a remote island
with heavy personnel and cargo traffic. Specifically, this study focused on identifying pathways
and locations likely to contain live NIS Live NIS have the potential for incursion and
subsequent establishment, and hence are of greatest biosecurity concern The study
implemented a three-way prioritisation (species, potential modes of introduction and sites) as
suggested by McGeoch et al. (2016) in order to provide a better understanding of the potential
for an incursion. Comparing border interception rates of NIS between project phases was used
to identify any patterns in NIS abundance associated with the different project activities. This
comparison allowed for identification of potential risks associated with different activities and
biosecurity planning for future projects. Using this three-way prioritisation approach
136
biosecurity managers will be able to identify combinations of factors that require simultaneous
attention and thus allocate resources and inspection effort appropriately.
5.2 Material as methods
5.2.1 Study site
Barrow Island (BWI) (20°45΄S, 115°25΄E) is the second-largest continental island and situated
off the Western Australian coastline. It is 56 km off the western coast of the Pilbara region, and
25km long, 10 km wide. The industrial project on the island occupies approximately
332 hectares of the island -1.4 percent of the land area (Figure 5.1) ( Moro et al., 2013a). The
island is a Class A Nature Reserve and recognised as one of the largest landmasses in the world
without any established non-indigenous vertebrates (Jarrad et al., 2010). Barrow Island has a
semi-arid tropical climate with two main seasons, summer (October – March) and winter (April
–September). Summer temperatures range between 20°C – 34°C with tropical storms. Winters
are cooler with temperatures ranging between 17°C – 26°C with occasional rainfall (Bureau of
Meterology, 2016).
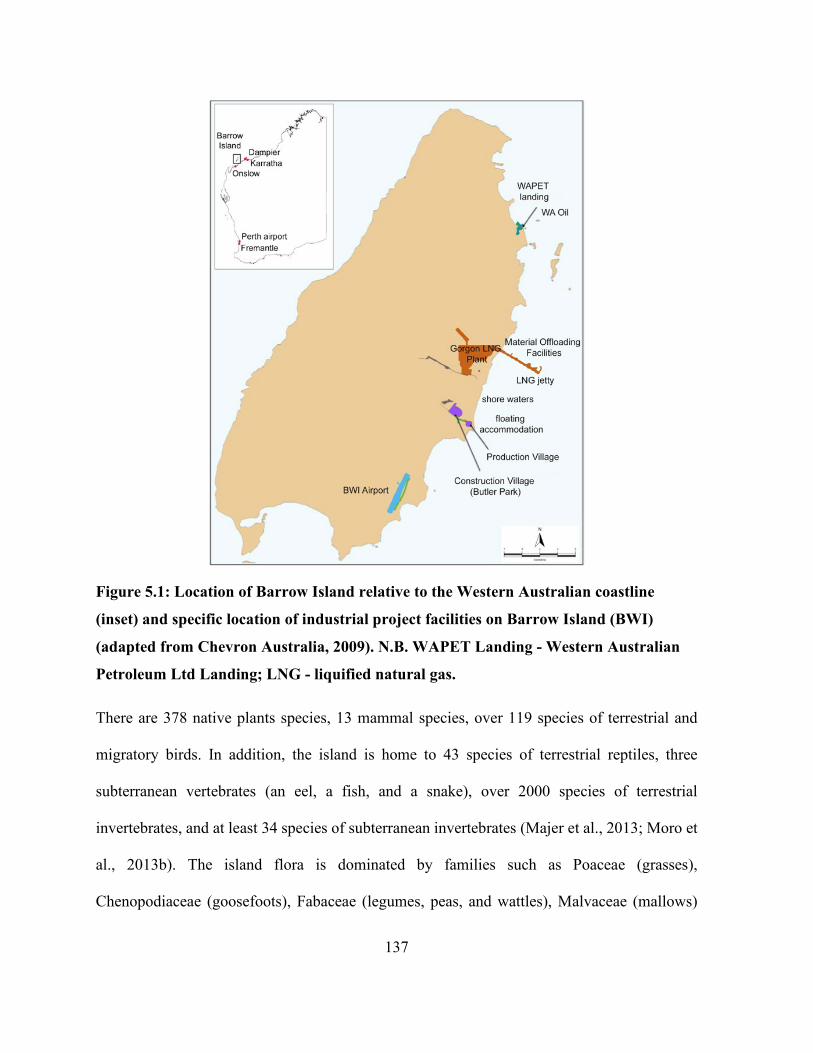
137
Figure 5.1: Location of Barrow Island relative to the Western Australian coastline
(inset) and specific location of industrial project facilities on Barrow Island (BWI)
(adapted from Chevron Australia, 2009). N.B. WAPET Landing - Western Australian
Petroleum Ltd Landing; LNG - liquified natural gas.
There are 378 native plants species, 13 mammal species, over 119 species of terrestrial and
migratory birds. In addition, the island is home to 43 species of terrestrial reptiles, three
subterranean vertebrates (an eel, a fish, and a snake), over 2000 species of terrestrial
invertebrates, and at least 34 species of subterranean invertebrates (Majer et al., 2013; Moro et
al., 2013b). The island flora is dominated by families such as Poaceae (grasses),
Chenopodiaceae (goosefoots), Fabaceae (legumes, peas, and wattles), Malvaceae (mallows)
138
and Asteraceae (daisies), the genera Triodia (hummock-forming grasses) and Acacia (wattles)
(Mattiske Consulting Pty Ltd, 1997).
The industrial project on BWI is projected to continue over 40 years (ACIL Allen, 2015) and
is defined by two project phases, construction and operational, each with a varying suite of
Potential Modes of Introduction (PMoI). PMoI as used in this study, is defined as ‘the physical
means by which a species may potentially be introduced to a new environment, such as within
machinery, luggage or on wet sides of a vessel’. PMoI recorded during the construction phase
(2009-2015) varied to some extent compared to those during the operational phase (2016-
2018). Data from 2009-2018 was used for this study, although the project is ongoing. Between
2009 and 2015 cargo for the project consisted primarily of building material, large construction
machinery, and equipment, as well as personnel involved in the construction work (Chevron
Australia, 2014). In March 2016, the first liquified natural gas (LNG) cargo departed for Japan,
defining the end of the construction phase of the project and the start of the operational phase
(Chevron Australia, 2016). This translated into the addition of new PMoIs to the existing list,
and the redudancy of others (Table 5.1).
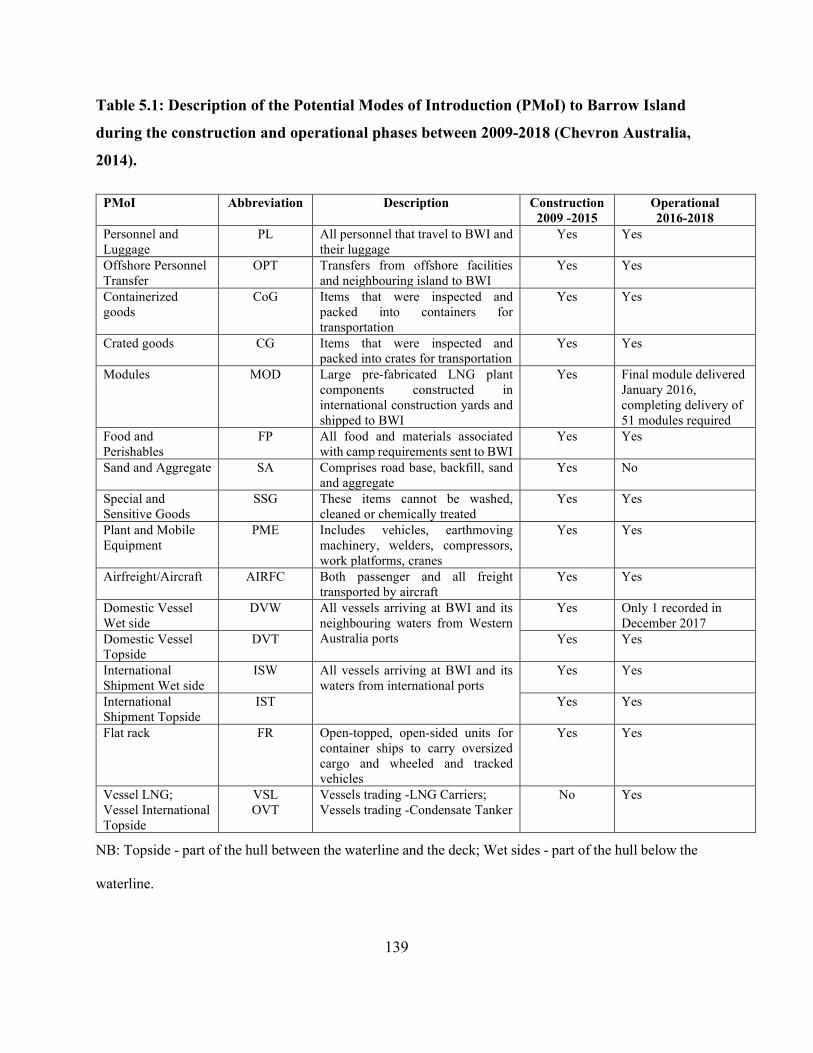
139
Table 5.1: Description of the Potential Modes of Introduction (PMoI) to Barrow Island
during the construction and operational phases between 2009-2018 (Chevron Australia,
2014).
PMoI Abbreviation Description Construction 2009 -2015
Operational 2016-2018
Personnel and Luggage
PL All personnel that travel to BWI and their luggage
Yes Yes
Offshore Personnel Transfer
OPT Transfers from offshore facilities and neighbouring island to BWI
Yes Yes
Containerized goods
CoG Items that were inspected and packed into containers for transportation
Yes Yes
Crated goods CG Items that were inspected and packed into crates for transportation
Yes Yes
Modules MOD Large pre-fabricated LNG plant components constructed in international construction yards and shipped to BWI
Yes Final module delivered January 2016, completing delivery of 51 modules required
Food and Perishables
FP All food and materials associated with camp requirements sent to BWI
Yes Yes
Sand and Aggregate SA Comprises road base, backfill, sand and aggregate
Yes No
Special and Sensitive Goods
SSG These items cannot be washed, cleaned or chemically treated
Yes Yes
Plant and Mobile Equipment
PME Includes vehicles, earthmoving machinery, welders, compressors, work platforms, cranes
Yes Yes
Airfreight/Aircraft AIRFC Both passenger and all freight transported by aircraft
Yes Yes
Domestic Vessel Wet side
DVW
All vessels arriving at BWI and its neighbouring waters from Western Australia ports
Yes Only 1 recorded in December 2017
Domestic Vessel Topside
DVT Yes Yes
International Shipment Wet side
ISW All vessels arriving at BWI and its waters from international ports
Yes Yes
International Shipment Topside
IST
Yes Yes
Flat rack FR Open-topped, open-sided units for container ships to carry oversized cargo and wheeled and tracked vehicles
Yes Yes
Vessel LNG; Vessel International Topside
VSL OVT
Vessels trading -LNG Carriers; Vessels trading -Condensate Tanker
No Yes
NB: Topside - part of the hull between the waterline and the deck; Wet sides - part of the hull below the
waterline.
140
5.2.2 Statistical methodology
The data used in this study were collected between 2009 and 2018, covering two phases of the
project: construction and operational phases. Border inspection points at BWI were identified
as: BWI airport; Production Village (accommodation); Construction Village (accommodation);
LNG jetty; Gorgon LNG Plant; BWI Material Offloading Facilities; Western Australian
Petroleum Landing Site (WAPET); WA Oil (Figure 5.1). Comparing the border interception
rates of NIS between the two project phases aimed to identify any patterns in NIS prevalence
associated with the different project activities.
Thirteen PMoIs were defined during the construction phase, while 15 PMoIs were identified
during the operational phase, 2016 - 2018 (Table 5.1). Vessels trading - LNG Carriers, Vessels
trading-Condensate Tanker and Vessels international topsides were PMoIs introduced during
the operational phase as they are specifically associated with transporting resource products
from BWI. Response variables used in the analyses were the condition of detection (dead or
alive) and status on BWI (NIS or indigenous). Predictor variables included the type of
detection, border inspection point (location), PMoI, project phase, year, and month (Table 5.2).
PMoIs with detection counts less than 20 were excluded from the analysis because these low
detection numbers provided insufficient data for the analyses. PMoIs with these low values
included Sand and Aggregate (SA), Modules (MOD), Special and Sensitive Goods (SSG) and
Crated Goods (CG) (Appendix C 1: Detections counts between 2009 and 2018 defining
construction and transition phases). The wet sides (Domestic Vessels -DVW, International
Shipments - ISW) were excluded because a different biosecurity surveillance methodology was
used for the collection of NIS data.
141
‘Status on BWI’ refers to the classification of detections as NIS or indigenous species, where
NIS included ‘indeterminate’ (where an organism could not be identified), ‘unclassified’
(where the status of the organism was not known, i.e. whether it was indigenous or introduced)
and ‘NIS established’ (NIS established on the island prior to the project commencing). To err
on the side of caution, all detections were assumed live, including seeds, except those explicitly
identified as dead, hence condition was whether the organisms detected was dead or alive.
Detection counts for 2009-2011 were combined to constitute a single period, the preliminary
project phase.
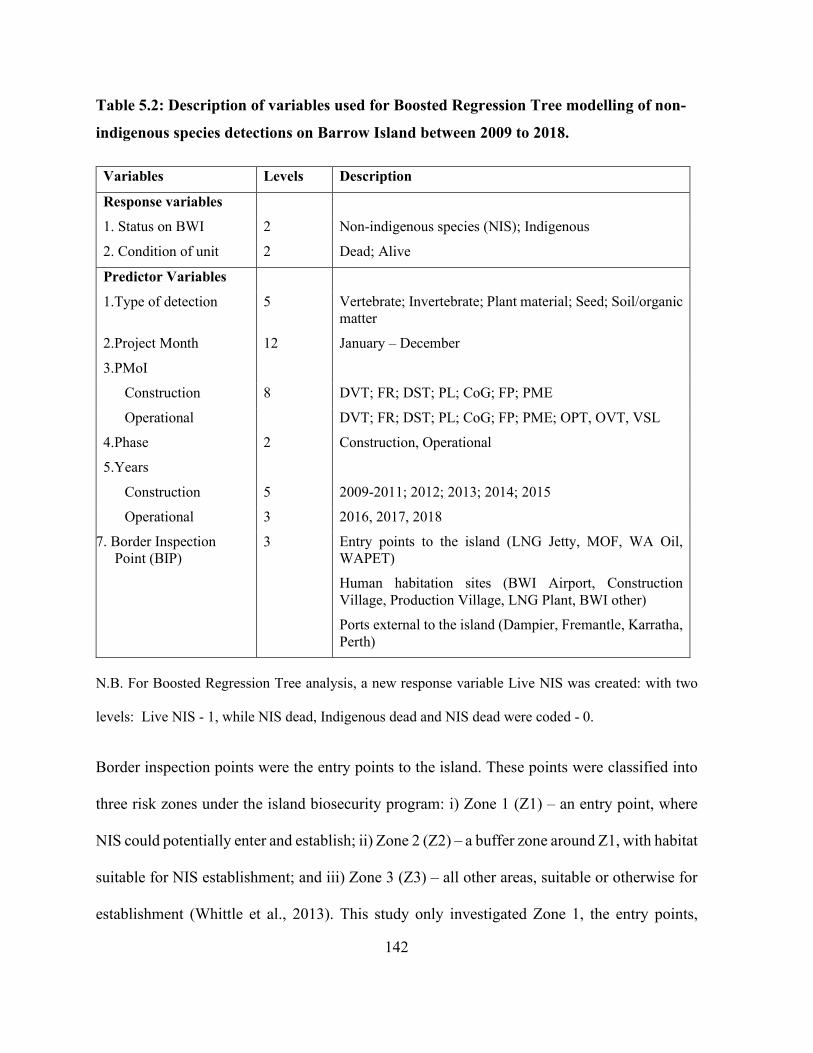
142
Table 5.2: Description of variables used for Boosted Regression Tree modelling of non-
indigenous species detections on Barrow Island between 2009 to 2018.
Variables Levels Description
Response variables
1. Status on BWI 2 Non-indigenous species (NIS); Indigenous
2. Condition of unit 2 Dead; Alive
Predictor Variables
1.Type of detection 5 Vertebrate; Invertebrate; Plant material; Seed; Soil/organic matter
2.Project Month 12 January – December
3.PMoI
Construction 8 DVT; FR; DST; PL; CoG; FP; PME
Operational DVT; FR; DST; PL; CoG; FP; PME; OPT, OVT, VSL
4.Phase 2 Construction, Operational
5.Years
Construction 5 2009-2011; 2012; 2013; 2014; 2015
Operational 3 2016, 2017, 2018
7. Border Inspection Point (BIP)
3 Entry points to the island (LNG Jetty, MOF, WA Oil, WAPET)
Human habitation sites (BWI Airport, Construction Village, Production Village, LNG Plant, BWI other)
Ports external to the island (Dampier, Fremantle, Karratha, Perth)
N.B. For Boosted Regression Tree analysis, a new response variable Live NIS was created: with two
levels: Live NIS - 1, while NIS dead, Indigenous dead and NIS dead were coded - 0.
Border inspection points were the entry points to the island. These points were classified into
three risk zones under the island biosecurity program: i) Zone 1 (Z1) – an entry point, where
NIS could potentially enter and establish; ii) Zone 2 (Z2) – a buffer zone around Z1, with habitat
suitable for NIS establishment; and iii) Zone 3 (Z3) – all other areas, suitable or otherwise for
establishment (Whittle et al., 2013). This study only investigated Zone 1, the entry points,
143
where NIS could potentially enter and establish. Entry points differed in NIS habitat suitability
due to the different types of activities conducted at each site. The LNG Jetty, WAPET landing,
WA Oil, Gorgon LNG Plant and Material Off Loading Facilities were port entry points for
cargo and construction materials, while the Construction Village and Production Village, BWI
airport, Perth airport and BWI other (including floating accommodation, shore waters) were
associated with personnel, luggage, and food items.
5.2.3 Modelling approach using boosted regression
Analyses were conducted using the “gbm”, “rpart”, “dismo” libraries in R package (Elith et al.,
2008; Hijmans et al., 2017; Ridgeway, 2017; Therneau et al., 2018, ). BRT incorporates two
multiple regression tree algorithms, first, by using binary division to identify predictors of
greatest importance to the response, and secondly, using boosting, which merges the fitted trees
for greater accuracy (Shabani et al., 2018). Using the step.gbm function, all the six predictor
variables (type of detection, year, month, border inspection points on BWI, PMoI and project
phase) were included in the BRT model. Simplify.gbm function was then used to identify the
most important predictors, with predictors then used to create the final decision tree. The
relative importance of predictors was estimated, scaled to 100%, and ranked according to their
relative influence on the dependent variable (Froeschke & Froeschke, 2016). One major
advantage of BRT models is that they can select variables of relative importance to determine
their contribution to the model (Gu et al., 2019; Wyse et al., 2018). The “relative influence”
refers to the contribution of each variable to the minimization of the loss function (the
distribution function) (Wyse et.al., 2018). The relative importance is calculated by averaging
the number of times a variable is selected for splitting, weighted by the squared improvement
144
to the BRT model. As a result of each split, it is then scaled so the values sum to 100. Variables
whose relative influence exceeds the median of each model are classified as “highly important”,
and those below the median are classified as having “low importance” (Gu et al., 2019).
To estimate the probability of detecting a live NIS at the inspection border, a BRT was fitted
using a tree complexity of five and a learning rate of 0.001, with a binomial error distribution.
Predictive performance of the model was assessed by cross-validation using five random
samples and comparing their performance using specificity, sensitivity, and accuracy of the
model (Gareth et al., 2017; Kuhn et al., 2013; Shabani et al., 2018).
Three models were tested: the first model for the construction phase, the second model for the
transitional phase and finally, data was combined for the two phases to determine the third
model. In the third model for the combined data, phase became an additional factor, to
determine if the detection patterns changed with phase of the project and the associated
activities.
5.3 Results
5.3.1 Summary description of the results
There were 5,662 and 3,472 border detections for the construction and operational phases
respectively, resulting in 9,134 border detections for the period 2009-2018. Invertebrates
constituted 73.1% of the detections, while the remaining 26.9% consisted of seeds, vertebrates,
plant material and soil/organic matter (Figure 5.2). Of the 9,134 border detections, 53% were
considered live NIS detections. Seeds, plant material and soil/organic matter had 0.99 live
detections and made 17.7% of all detection. These detection types were considered live as the
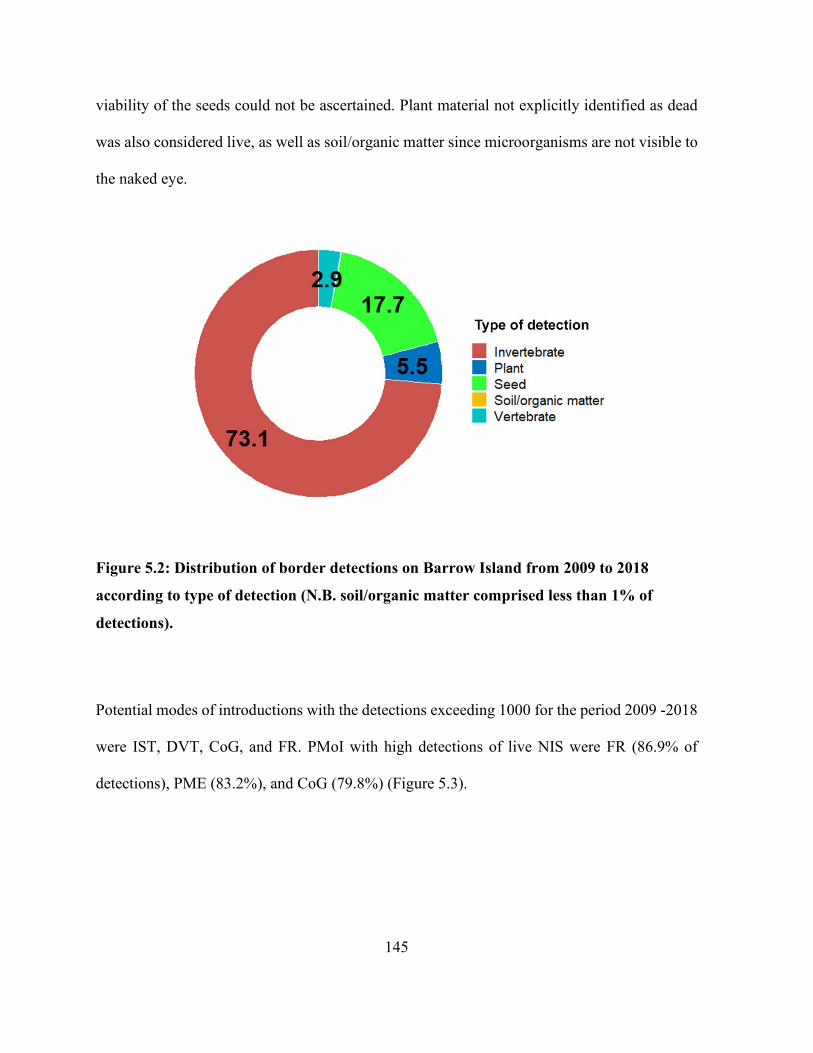
145
viability of the seeds could not be ascertained. Plant material not explicitly identified as dead
was also considered live, as well as soil/organic matter since microorganisms are not visible to
the naked eye.
Figure 5.2: Distribution of border detections on Barrow Island from 2009 to 2018
according to type of detection (N.B. soil/organic matter comprised less than 1% of
detections).
Potential modes of introductions with the detections exceeding 1000 for the period 2009 -2018
were IST, DVT, CoG, and FR. PMoI with high detections of live NIS were FR (86.9% of
detections), PME (83.2%), and CoG (79.8%) (Figure 5.3).
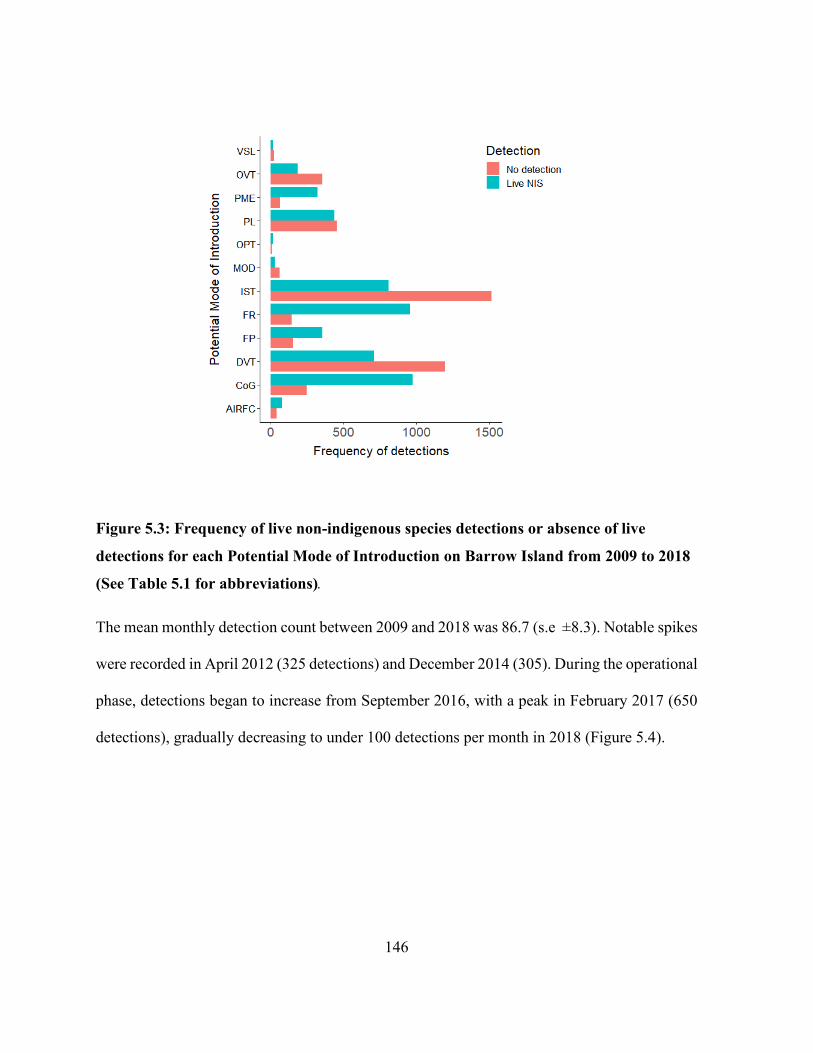
146
Figure 5.3: Frequency of live non-indigenous species detections or absence of live
detections for each Potential Mode of Introduction on Barrow Island from 2009 to 2018
(See Table 5.1 for abbreviations).
The mean monthly detection count between 2009 and 2018 was 86.7 (s.e ±8.3). Notable spikes
were recorded in April 2012 (325 detections) and December 2014 (305). During the operational
phase, detections began to increase from September 2016, with a peak in February 2017 (650
detections), gradually decreasing to under 100 detections per month in 2018 (Figure 5.4).
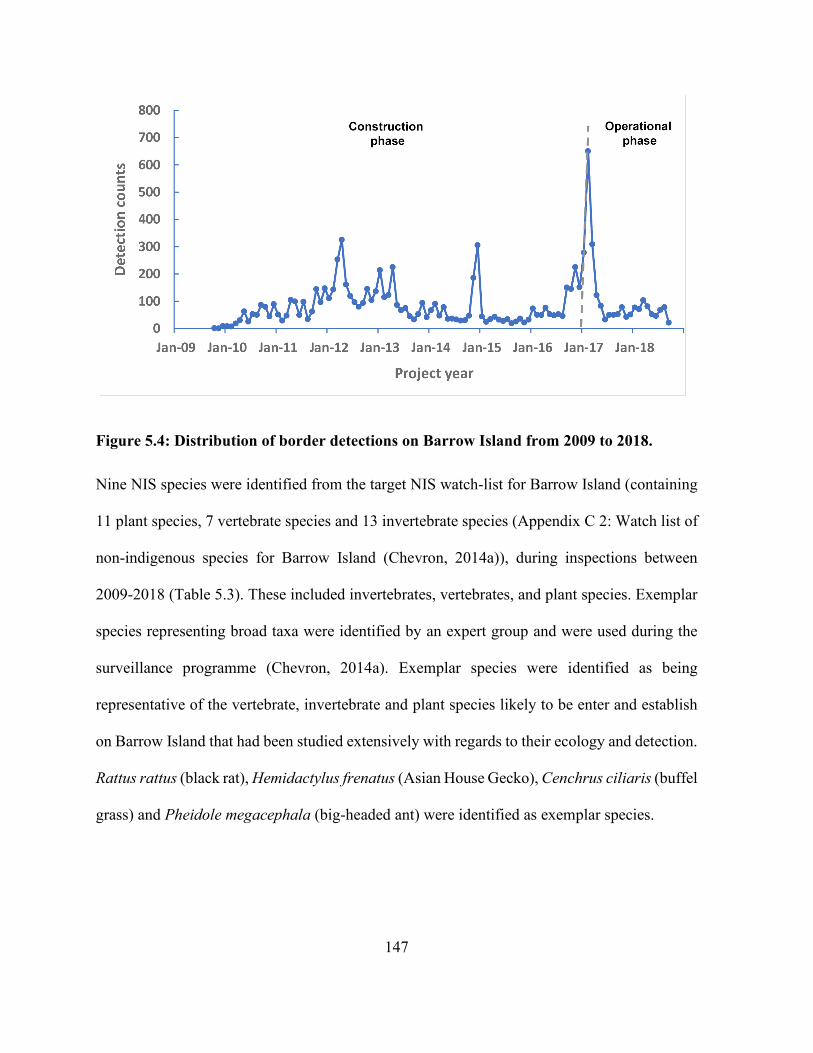
147
Figure 5.4: Distribution of border detections on Barrow Island from 2009 to 2018.
Nine NIS species were identified from the target NIS watch-list for Barrow Island (containing
11 plant species, 7 vertebrate species and 13 invertebrate species (Appendix C 2: Watch list of
non-indigenous species for Barrow Island (Chevron, 2014a)), during inspections between
2009-2018 (Table 5.3). These included invertebrates, vertebrates, and plant species. Exemplar
species representing broad taxa were identified by an expert group and were used during the
surveillance programme (Chevron, 2014a). Exemplar species were identified as being
representative of the vertebrate, invertebrate and plant species likely to be enter and establish
on Barrow Island that had been studied extensively with regards to their ecology and detection.
Rattus rattus (black rat), Hemidactylus frenatus (Asian House Gecko), Cenchrus ciliaris (buffel
grass) and Pheidole megacephala (big-headed ant) were identified as exemplar species.
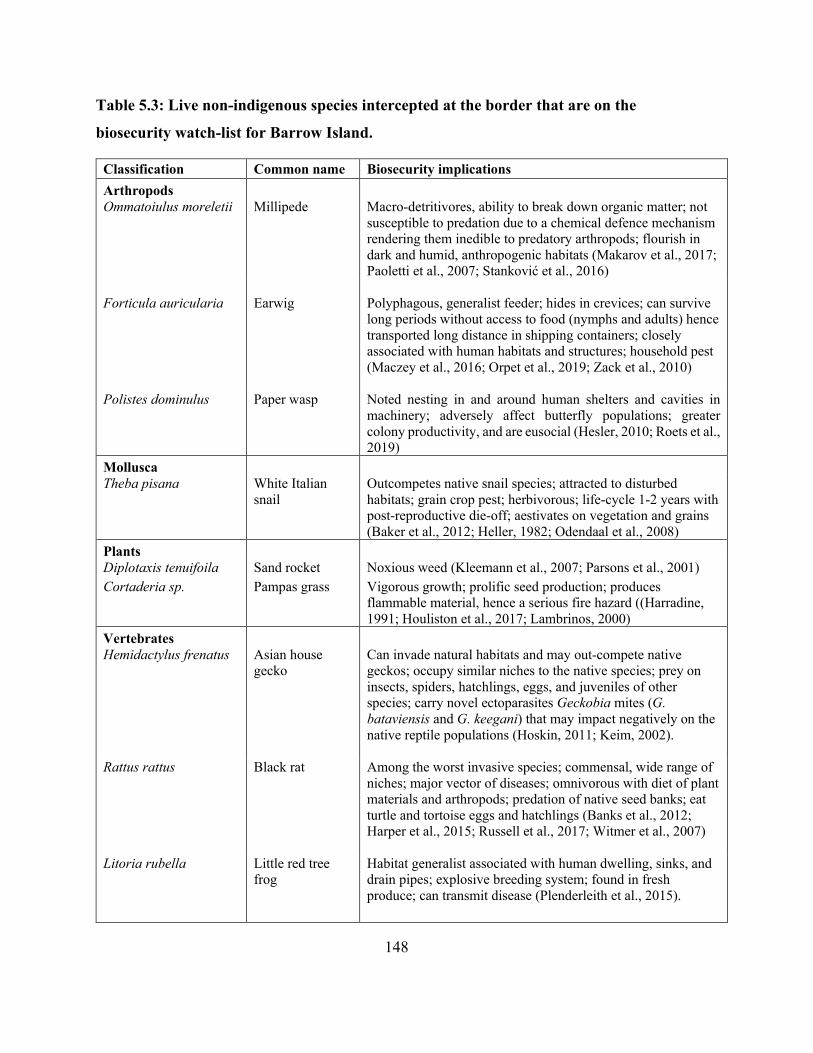
148
Table 5.3: Live non-indigenous species intercepted at the border that are on the
biosecurity watch-list for Barrow Island.
Classification Common name Biosecurity implications Arthropods Ommatoiulus moreletii Millipede Macro-detritivores, ability to break down organic matter; not
susceptible to predation due to a chemical defence mechanism rendering them inedible to predatory arthropods; flourish in dark and humid, anthropogenic habitats (Makarov et al., 2017; Paoletti et al., 2007; Stanković et al., 2016)
Forticula auricularia
Earwig
Polyphagous, generalist feeder; hides in crevices; can survive long periods without access to food (nymphs and adults) hence transported long distance in shipping containers; closely associated with human habitats and structures; household pest (Maczey et al., 2016; Orpet et al., 2019; Zack et al., 2010)
Polistes dominulus Paper wasp Noted nesting in and around human shelters and cavities in machinery; adversely affect butterfly populations; greater colony productivity, and are eusocial (Hesler, 2010; Roets et al., 2019)
Mollusca Theba pisana White Italian
snail Outcompetes native snail species; attracted to disturbed habitats; grain crop pest; herbivorous; life-cycle 1-2 years with post-reproductive die-off; aestivates on vegetation and grains (Baker et al., 2012; Heller, 1982; Odendaal et al., 2008)
Plants Diplotaxis tenuifoila Sand rocket Noxious weed (Kleemann et al., 2007; Parsons et al., 2001) Cortaderia sp. Pampas grass Vigorous growth; prolific seed production; produces
flammable material, hence a serious fire hazard ((Harradine, 1991; Houliston et al., 2017; Lambrinos, 2000)
Vertebrates Hemidactylus frenatus Asian house
gecko Can invade natural habitats and may out-compete native geckos; occupy similar niches to the native species; prey on insects, spiders, hatchlings, eggs, and juveniles of other species; carry novel ectoparasites Geckobia mites (G. bataviensis and G. keegani) that may impact negatively on the native reptile populations (Hoskin, 2011; Keim, 2002).
Rattus rattus Black rat Among the worst invasive species; commensal, wide range of niches; major vector of diseases; omnivorous with diet of plant materials and arthropods; predation of native seed banks; eat turtle and tortoise eggs and hatchlings (Banks et al., 2012; Harper et al., 2015; Russell et al., 2017; Witmer et al., 2007)
Litoria rubella Little red tree frog
Habitat generalist associated with human dwelling, sinks, and drain pipes; explosive breeding system; found in fresh produce; can transmit disease (Plenderleith et al., 2015).
149
5.3.2 Boosted Tree Regression Model
The predictor set (Table 5.4) was simplified and only four predictor variables were identified
as important for the final model for the construction phase: detection type, border inspection
point, month and PMoI. Simplification was done by selecting variables algorithmically that
contributed to the “percentage relative influence”. Relative influence refers to the contribution
of each variable to the minimisation of the loss function (Elith et al., 2008). For the operational
phase, two predictor variables were identified as important: detection type and PMoI. For the
combined model, four predictor variables were identified, consistent with the construction
phase (Table 5.4).
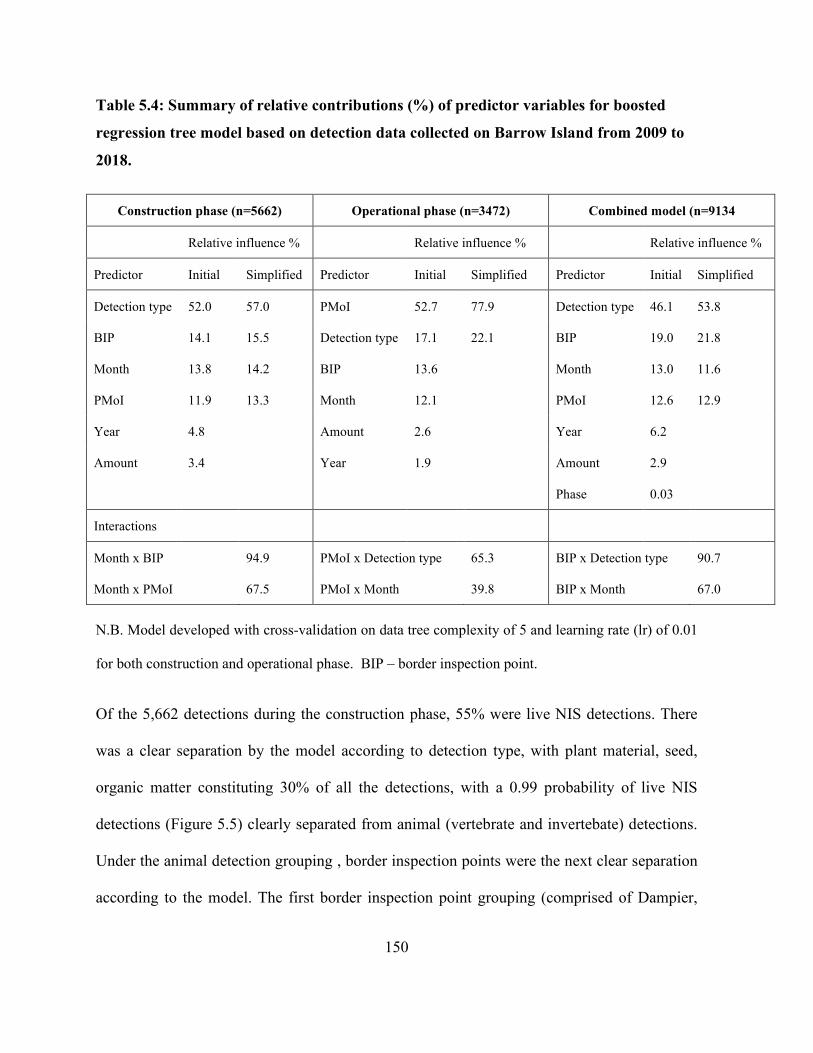
150
Table 5.4: Summary of relative contributions (%) of predictor variables for boosted
regression tree model based on detection data collected on Barrow Island from 2009 to
2018.
Construction phase (n=5662) Operational phase (n=3472) Combined model (n=9134
Relative influence % Relative influence % Relative influence %
Predictor Initial Simplified Predictor Initial Simplified Predictor Initial Simplified
Detection type 52.0 57.0 PMoI 52.7 77.9 Detection type 46.1 53.8
BIP 14.1 15.5 Detection type 17.1 22.1 BIP 19.0 21.8
Month 13.8 14.2 BIP 13.6 Month 13.0 11.6
PMoI 11.9 13.3 Month 12.1 PMoI 12.6 12.9
Year 4.8 Amount 2.6 Year 6.2
Amount 3.4 Year 1.9 Amount 2.9
Phase 0.03
Interactions
Month x BIP 94.9 PMoI x Detection type 65.3 BIP x Detection type 90.7
Month x PMoI 67.5 PMoI x Month 39.8 BIP x Month 67.0
N.B. Model developed with cross-validation on data tree complexity of 5 and learning rate (lr) of 0.01
for both construction and operational phase. BIP – border inspection point.
Of the 5,662 detections during the construction phase, 55% were live NIS detections. There
was a clear separation by the model according to detection type, with plant material, seed,
organic matter constituting 30% of all the detections, with a 0.99 probability of live NIS
detections (Figure 5.5) clearly separated from animal (vertebrate and invertebate) detections.
Under the animal detection grouping , border inspection points were the next clear separation
according to the model. The first border inspection point grouping (comprised of Dampier,
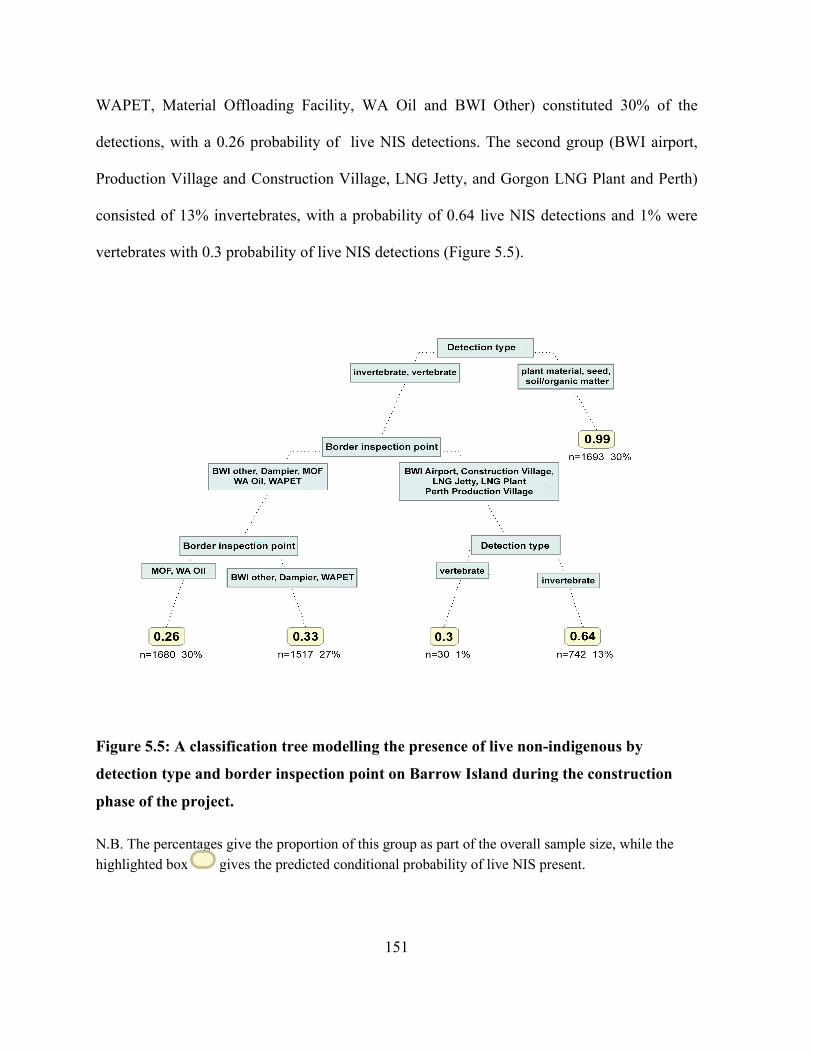
151
WAPET, Material Offloading Facility, WA Oil and BWI Other) constituted 30% of the
detections, with a 0.26 probability of live NIS detections. The second group (BWI airport,
Production Village and Construction Village, LNG Jetty, and Gorgon LNG Plant and Perth)
consisted of 13% invertebrates, with a probability of 0.64 live NIS detections and 1% were
vertebrates with 0.3 probability of live NIS detections (Figure 5.5).
Figure 5.5: A classification tree modelling the presence of live non-indigenous by
detection type and border inspection point on Barrow Island during the construction
phase of the project.
N.B. The percentages give the proportion of this group as part of the overall sample size, while the highlighted box gives the predicted conditional probability of live NIS present.
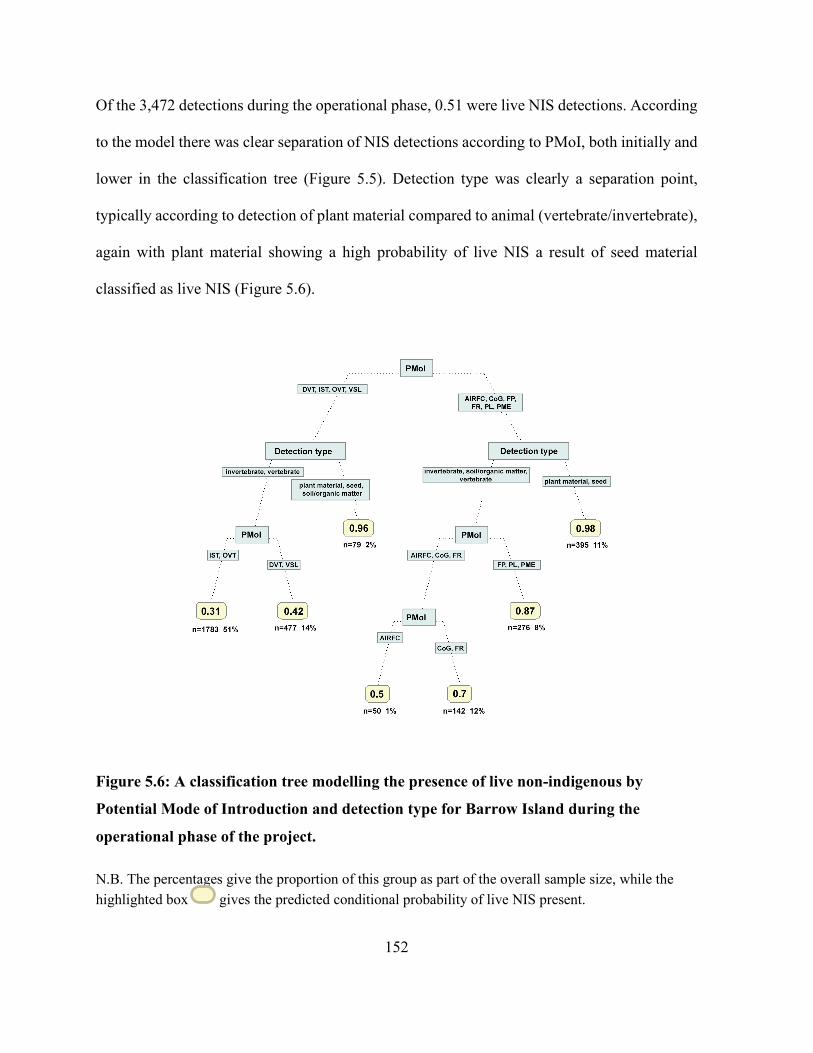
152
Of the 3,472 detections during the operational phase, 0.51 were live NIS detections. According
to the model there was clear separation of NIS detections according to PMoI, both initially and
lower in the classification tree (Figure 5.5). Detection type was clearly a separation point,
typically according to detection of plant material compared to animal (vertebrate/invertebrate),
again with plant material showing a high probability of live NIS a result of seed material
classified as live NIS (Figure 5.6).
Figure 5.6: A classification tree modelling the presence of live non-indigenous by
Potential Mode of Introduction and detection type for Barrow Island during the
operational phase of the project.
N.B. The percentages give the proportion of this group as part of the overall sample size, while the highlighted box gives the predicted conditional probability of live NIS present.
153
Combining data from both the construction and operational phases, there was again a clear
separation by detection type, with plant material, seed, and soil/organic matter 24% of all the
detections with a 0.99 probability of live NIS detections, while vertebrates and invertebrates
constituted the remaining 76% of the detections (Figure 5.7). According to the model, there
was also clear separation of NIS detections according to border inspection points, followed by
PMoI. Groupings of border inspection points were comprised of port entry points and
offloading sites (BWI other, LNG Jetty, MOF, WA Oil, WAPET), as compared to sites of
human habitation and intense activity (BWI Airport, Construction and Production Villages,
LNG Plant) (Figure 5.7).
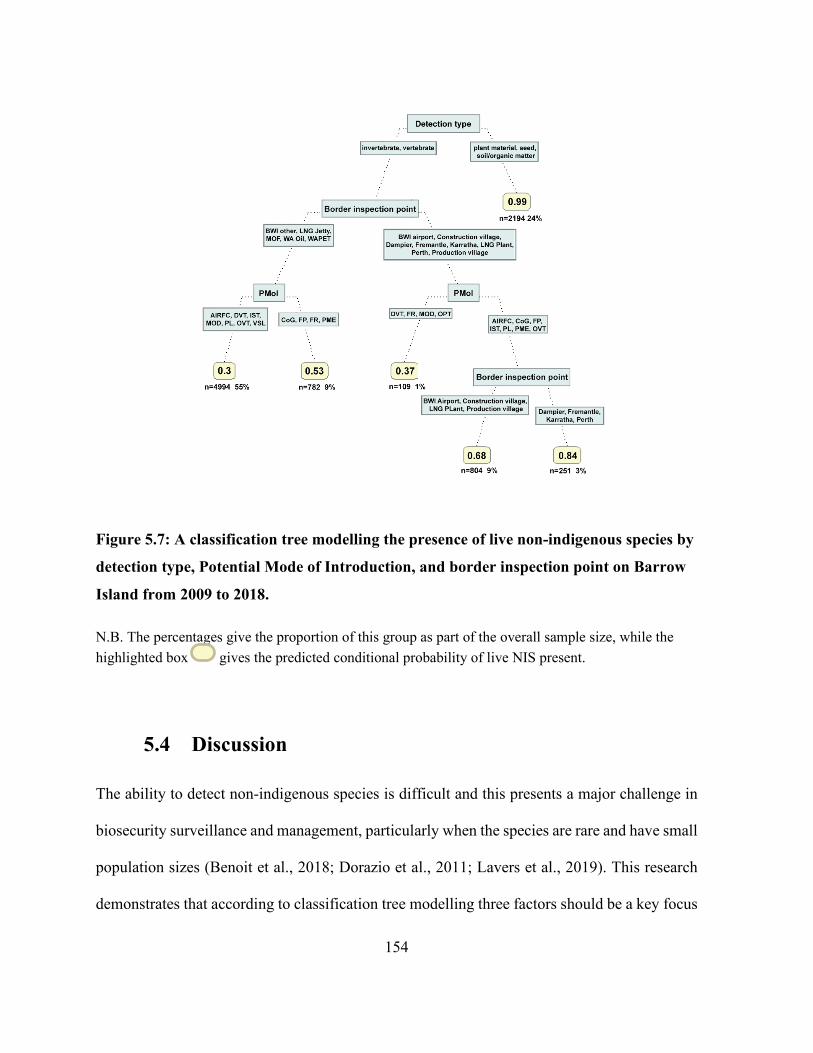
154
Figure 5.7: A classification tree modelling the presence of live non-indigenous species by
detection type, Potential Mode of Introduction, and border inspection point on Barrow
Island from 2009 to 2018.
N.B. The percentages give the proportion of this group as part of the overall sample size, while the highlighted box gives the predicted conditional probability of live NIS present.
5.4 Discussion
The ability to detect non-indigenous species is difficult and this presents a major challenge in
biosecurity surveillance and management, particularly when the species are rare and have small
population sizes (Benoit et al., 2018; Dorazio et al., 2011; Lavers et al., 2019). This research
demonstrates that according to classification tree modelling three factors should be a key focus
155
for biosecurity decision making: type of organism (detection type), PMoI and border inspection
point.
Detection type, with broad taxonomic groupings (i.e. vertebrates, invertebrates, seeds) need to
be represented in operational biosecurity management planning, as some groups of organisms
are more likely to be detected than others. For this research specifically, detections were
dominated by invertebrates, mainly insects (73% of all the detections, with 43% live NIS). The
most common live NIS detected were arthropods, specifically insects, followed by seeds. To
implement biosecurity management of these organisms requires knowledge of the organism’s
dispersal characteristics as this may influence how we search for the organism and manage
invasions to new areas (Lovett et al., 2016). Dispersal characteristics may include attachment
ability (e.g. sticky or barbed appendages), buoyancy and location (e.g. transportation hubs) and
potential vectors, such as wind, water, and humans (Triska et al., 2018).
Border inspection points on BWI were also a critical determinant in the detection of live NIS
Identifying where live detections occur in the landscape is of primary importance for
conservation and management of susceptible and sensitive sites like Barrow Island (McGeoch
et al., 2016). In this study, classification tree modelling separated inspection points into places
of human-habitation (the barge, the construction, and production villages) and locations of
intense construction and productivity, serviced by multiple PMoIs. Inspection points serviced
by multiple PMoI (such as LNG Jetty and MOF) showed cumulative detections for live NIS on
the island, and as such should be areas closely targeted under biosecurity management
protocols. These inspection points included man-made structures, such as ports and jetties,
which are recognised as invasion hotspots as they are the first point of entry for arriving vessels
156
(Bulleri et al., 2010; Simpson et al., 2017). Inspections and surveillance should be concentrated
in areas where initial introductions are most likely to occur, such as seaports and airports, and
other areas where large numbers of shipping containers are received or opened. Surveillance
efforts should be directed at these border inspection points on the island to minimise NIS
incursion and subsequent establishment. In contrast to the BWI, Dampier, Perth, Fremantle,
Karratha, and Perth Airport had the smallest number of detections (4%) but high levels of live
NIS detections (0.83). These sites were external to BWI, and as such not subject to the same
stringent biosecurity controls as present on the island.
The relatively high probability (0.64) of live NIS detections during the construction phase was
associated with places of human habitation (e.g. Construction Village, the Production Village,
Perth Airport and BWI Airport) and service areas (MOF, WAPET, and LNG Plant and LNG
Jetty). The diverse arthropod assemblages found on these sites are comprised of synanthropic
species closely associated with human habitation (e.g. spiders, beetles and stored grain pests)
(Bertone et al., 2016). As such, biosecurity management will need to closely target synanthropic
organisms in these areas.
When interpreting the BRT model, it is important to use prioritisation knowledge rather than
treating all the predictors as equally different from one another. Furthermore, it is important to
consider inter-predictor similarities. Multicollinearity between variables can occur, hence
variables that are correlated must be removed from the model as they do not explain much of
the variation in the model but in fact make the model less parsimonious (Shipley, 2016).
157
The potential for invasion associated with each PMoI depends on the number of NIS species
the PMoI can transport, the number of individuals from each species it can transport, potential
species survival during transit, association between species (e.g. parasites) and the likelihood
that the NIS is released or escapes into a suitable environment for establishment (either initially
or through secondary means (Lodge et al., 2006). The decision tree analysis classified PMoIs
according to their likelihood of bringing in live NIS, with the first group of PMoI characterised
by open surfaces (DVT, IST, OVT and VSL), notorious for harbouring hitch-hikers because of
their exposed nature. The second group consisted primarily of service PMoIs associated with
personnel, freight, transfers, and food (AIRFC, PL, CoC, FP), except for the PMoI that
transported large machinery and equipment on exposed surfaces (PME and FR). While
interception records provide direct evidence of an association between PMoIs and type of
detection, they differed in the levels of quarantine inspection, taxonomic identification, and
recording, which limits the interpretation of the biosecurity surveillance outcomes.
Some PMoI, including Vessel topsides, FR, and PME, harbour live insects due to their exposed
nature, consistent with the understanding that terrestrial NIS often arrive in containers,
packaging material and personal luggage and by wind action (Kiritani et al., 2003; McCullough
et al., 2006; McNeill et al., 2011; Saccaggi et al., 2016). A large proportion of the invertebrates
detected in this study were hitch-hiker pests (‘live insect or animal that has an opportunistic
association with a commodity or item which it has no biological host relationship’ (Toy et al.,
2010)). Key characteristics of these hitch-hikers that make them problematic NIS include their
ability to complete their life cycle in human environments or highly disturbed habitats (e.g. the
Asian house gecko, ants and spiders), life cycles that require sheltered areas to avoid extreme
158
conditions, or have life stages involving dormancy (aestivation) allowing them to survive
extended periods of transit (e.g. the White Italian snail and wasps as hibernating queens)
(Kiritani & Yamamura, 2003; Toy & Newfield, 2010). Hitchhiking insects can be readily
moved on cargo, containers, ships, and passengers, as they can hide in dark gaps and crevices,
and their pupae or eggs can be affixed to steel surfaces. As such, these insects have the capacity
to travel to BWI undetected (Meurisse et al., 2018). In order to improve detection confidence,
visual inspections need to be integrated with other surveillance techniques, including acoustic
detection devices, air sampling of gaseous emissions by pests (Lovett et al., 2016).
Project phases (construction compared to operational) was far less influential (0.03% relative
influence) than detection types and border inspection point (location) (53.8% and 21%
respectively). The difference in model determinants between the construction and operational
phases was due to the construction activity on BWI, the volume of cargo (12.2 million tonnes)
and human movement (0.5 million passengers) (Scott et al., 2017). Passenger movement
reduced considerably post- 2015 (operational phase), after which only approximately 500
workers were required at any given time for maintenance and logistics of the plant (Scott et al.,
2017).
A few NIS on the watch-list are high-risk species were intercepted during the study period,
notably the Asian house gecko (Hemidactylus frenatus). The Asian house gecko is a threat to
the biodiversity on Barrow Island. It can easily displace native species as they have a high
reproductive rate; it can proliferate quickly and displace other reptile species (Somaweera et
al., 2020). The gecko has the potential to cause extensive damage to machinery at the LNG
plant, disrupting power supplies and operations. They also host novel parasites Geckobia
159
bataviensis and Geckobia keegani which are potential vectors for invasive blood parasites
(Hoskin, 2011). There was a reduction in the detections of live Asian house gecko during the
operational phase (1 out of 111) compared to the construction phase (11 out of 151). Increased
vigilance during inspection and improvement in biosecurity protocols e.g. off-shore clearance
from points of cargo origin contributed to the reduction in their detections, particularly from
South East Asia where the Asian house gecko is endemic. Furthermore, a unique acoustic
device, Environmental Acoustic Sensor (EARS), was developed to specifically detect the sound
of a gecko call (Barnard, 2014). The temporal reduction in Asian house gecko detection can in
part be attributed to this device, which was placed on cargo and vessels traveling to BWI, in
marine off-loading facilities (MOF) and at international fabrication yards overseas. Reduced
detections of the gecko can also be attributed to the decline in shipments directly from South
East Asia as construction progressed.
There was no definitive pattern in the total detections and number of live NIS over the ten
project years assessed, except for occasional spikes in detections in 2012 at the peak of
construction and in 2017. Live detections were consistently above 60% between April and
September and relatively low for the remaining months, which may potentially be attributed to
seasonal fluctuations in rainfall and temperature. Seasonality is a factor that needs to be
considered for biosecurity surveillance programs in place globally.
5.5 Conclusion
The decision tree analysis can be used to streamline decision making for biosecurity
management. It can be used to identify factors that are of most importance to NIS detections
160
(Verna et al., 2018). In this study, boosted regression tree model provided an appropriate
statistical tool to select the most meaningful predictors of detecting live NIS at the border. The
model identified that on Barrow Island, type of detection, the border inspection points and
PMoIs were factors that should be allocated the greatest biosecurity effort and resources. The
model provided by this research is exploratory in biosecurity surveillance. The model has the
potential for improvement beyond the scope of this work and can be adapted to incorporate
new information and data as they become available with the continuation of the project. BRT
models are capable of fitting complex functions which mirror the complexity of ecological
processes in shaping species distribution and associations (Cerasoli et al., 2017). Effort should
be targeted to the taxonomic classification of NIS detected and the associated PMoIs to inform
specific biosecurity protocols. By studying species detection/ interception over a period we can
better understanding temporal dynamics and assess the effectiveness biosecurity management
practices. Given that new incursion by invasive species is increasingly frequent due to growth
in resource development and trade, biosecurity prioritisation should be made an integral
component of biosecurity surveillance and management.
161
Chapter 6
General Discussion
Opportunities to use statistical science for biosecurity surveillance are vast as are the challenges
associated with available biosecurity data. Further, scientific literature on mining and
biodiversity is scarce and less than 1% of papers of leading conservation journals refer to
mining-related issues (Sonter et al., 2018). Due in part to the challenges associated with
biosecurity data, decisions related to biosecurity surveillance are often complex with a high
degree of uncertainty. Quantitative models are being developed to deal with uncertainty by
reducing the uncertainty analytically through incorporation of new data or additional variables
as they become available, or framing outcomes of management responses as likelihoods of
meeting management objectives (Baxter et al., 2016).
Multiple factors contribute to uncertainty in biosecurity surveillance and these include the risk
of pest/ disease spread, unknown transmission, Potential Mode of Introduction (PMoI)
connections, pest life-cycle behaviour and imperfect detections (Baxter et al., 2017). The ability
to demonstrate the effectiveness of a biosecurity surveillance program allows decision-makers
to make informed, objective, transparent and defensible decisions about what, when and how
to monitor and allocate resources optimally (Fox, 2010). Quantitative modelling can reduce
this uncertainty by giving a model with, for example, 85% accuracy, given the assumptions to
justify the model (Jakeman et al., 2018; Lee et al., 2019). A less accurate model is preferable
to the absence of a model entirely founded on potential concerns over a model’s shortfalls
(Shmueli et al., 2010).
162
At the start of any modelling process, the model may be rudimentary, but it becomes more
useful and efficient as more information on issues relevant to the research question at hand
becomes available (e.g. pest behaviour, pathway description or efficacy of protocols). Further,
complex models may be considered counterproductive as they often lead to complicated
recommendations, which are potentially unrealistic in terms of practical implementation (Ord,
2012; Zellner, 2001). As such, models should be optimised in order to be useful or beneficial
to the end-users. Consequently, there is need to leverage scientific models and predictive
analytics to improve decision making in the context of biosecurity management.
Use of statistical modelling in biosecurity it imperative in order to effectively manage the
potential of NIS incursions. Non-indigenous species are a major threat to global diversity
(Nghiem et al., 2013; Ojaveer et al., 2015; Moser et al., 2018; Schlaepfer, 2018). Understanding
the pathways responsible for NIS introductions and using this knowledge to inform
management decisions will reduce the likelihood of NIS entering a region or country
(Simberloff et al., 2013; Convention on Biological Diversity, 2014; Faulkner et al., 2016).
Pathway studies often describe the diverse routes by which NIS can be introduced to a region
but rarely consider multiple introduction pathways occurring simultaneously (Essl et al., 2015;
Cope et al., 2017; Saul et al., 2017). The challenge, however, is to quantitatively assess the risk
of pathways introducing and subsequently spreading NIS, especially pest species. In the Barrow
Island context, all NIS were considered unacceptable, and it was imperative to manage specific
and unidentified threats as well.
This research focussed on pre-incursion modelling, i.e. pre-border and border non-indigenous
species interception biosecurity surveillance data between 2009 and 2018 during the
163
development of the Gorgon LNG Project on Barrow Island. Pre-incursion modelling enables
biosecurity preparedness to be adaptive, as it predicts future outcomes using currently available
data (Alizamir et al., 2020; Li et al., 2017). Communication tools, such as risk maps, list of
locations or habitats ranked by surveillance value and dynamic maps can be practical tools for
biosecurity decision-making and can be derived from these models (Baxter et al., 2016).
Statistical models and machine learning techniques were applied to characterise the distribution
of NIS coming through to Barrow Island, the associated PMoIs and the key determinants
associated with detection of live NIS on the island.
To correctly interpret and describe biosecurity data, a range of standard models were compared
in this research project, including standard and zero-inflated, Poisson, negative binomial, and
log-normal alternatives. These models failed to collectively describe key data characteristics,
namely a substantial proportion of zero and single organism detections and a few very high
values. A Bayesian three-component log-normal mixture model and a cluster approach were
tested to determine which approach best fits the data in response to the challenges
aforementioned. Both models have the advantage of catering for heterogeneity of data where
subpopulations exist (Park et al., 2009), as evident in this study.
The three-component log-normal mixture model provided detailed insight into the distribution
of the data by dividing the data according to their numerical ordering, comparable to the
ckmeans algorithm three-cluster model outcome which also used just the numerical data. For
this study, a clustering approach to analysis was useful in interpreting complex patterns in
multivariate biosecurity data by including categorical covariates in the model. Model precision
improved by allowing more information to be available to describe the clusters as covariates
164
are important in cluster generation. The number of clusters increased from three to four,
reflecting seasonal and location variations in the data. It is worthy to note that the clustering of
one particular cluster (cluster 2) primarily identified data from the major construction phase,
which was the height of construction activity, characterized by increased levels of movement
of freight and hence more detection events of NIS. My study revealed that clustering approach
has the advantage of catering for heterogeneity of data where subpopulations exist and the data
is measured on different scales i.e. numerical or categorical (Hummel et al., 2017).
In the Barrow Island context, live invertebrates and vertebrates were more likely to be found in
assemblages rather than as single-unit detections. Detections at Barrow Island included
subpopulations of distinct types of units, namely vertebrates, invertebrates, plant material, and
seeds. The characteristics and traits of these types of units are different with respect to their
ability to withstand adverse conditions and survival during transit, their associated introductory
pathways, and the commodities in which they were transported. Successful establishment of
these NIS depends on the frequency and the number of individuals that are introduced each
time.
Use of clustering model using covariates to ascertain detection patterns of NIS at the Barrow
Island border supports Cassey et al. (2018), who reported that establishment success depended
critically on propagule pressure in the range of 10-100 individuals. Furthermore, Cassey et al.
(2018) recommended that management policy aimed at limiting invasions should target
reducing propagule pressure to "single figures or zero regardless of any other feature of
invasion". This is because extreme detection counts have the potential to provide sufficient
propagule pressure to start an invasion (Brockerhoff et al., 2014). As such, identification of
165
these types of counts provide information critical to biosecurity surveillance (Brockerhoff et
al., 2014).
Appropriate inspection protocols and mitigation strategies are a critical component of effective
biosecurity measures and enable implementation of sound management decisions. Management
decisions should incorporate assessment of introductory pathways. Introduction pathway
studies generally describe the diverse routes by which NIS can be introduced but rarely consider
multiple introduction pathways occurring simultaneously. McGeoch et al. (2016) highlighted
that to date issues around three-way prioritisation “… include pathways … associated with the
introduction of multiple highest-priority species at which sensitive sites or which sites (or
categories of sites) most susceptible to invasion by those same species” had not been addressed.
The Barrow Island project provided an opportunity to investigate this issue i.e. three-way
prioritisation using site, pathways, and species. Through the use of boosted regression
modelling, it was determined that the most important factors influencing live NIS border
detections were PMoI, detection type and border location point. As such, it is recommended
that biosecurity managers should prioritise management of specific species, PMoI, and
sensitive and susceptible sites for successful mitigation of biological invasions.
During investigation of biosecurity surveillance data as part of the three-way prioritisation
assessment it was noted that cargo vessel and inward bound passenger numbers peaked during
the construction period and were associated with an increase in the number of live NIS
detections during that period. Furthermore, that invertebrates comprised the largest number of
detections, with exposed PMoI (e.g. flat racks and vessel topsides) containing a more diverse
species assemblage. In contrast, PMoIs associated with human habitation and activity had the
166
highest likelihood of introducing live NIS. The nature of these PMoI potentially allowed NIS
habitation of niche areas and/or provided a suitable food supply.
At Barrow Island, humans were instrumental in facilitating the movement of live NIS. Artificial
habitats in this study, such as marine landings and jetties were incursion hotspots since they are
the first point of entry for arriving vessels. Live NIS were also abundant in human-inhabited
environments because some NIS are better suited to complete their life cycle in these habitats
or have life cycles that require sheltered areas to avoid extreme conditions (e.g. the Asian house
gecko, ants, and spiders). These findings provide insight into how biosecurity surveillance
programs need to assess current data and adapt strategies appropriately.
When creating biosecurity surveillance programs, managers should recognise that factors
including organism class/species, location of detection and PMoI are likely to be intricately
entwined and as such, should be managed concurrently. Furthermore, biosecurity managers
should prioritise PMoI with the highest likelihood of live NIS detection based on specific PMoI
characteristics, including niche availability and habitat suitability, to improve biosecurity
protocols.
The research presented in this thesis addressed some of the challenges in analysing and
interpreting biosecurity data, using the Gorgon LNG Project as a case study. The findings of
this research demonstrate that the Gorgon LNG Project Quarantine Management System in
place on Barrow Island can be used as a benchmark for similar biosecurity surveillance projects
internationally, particularly where there is the need to balance conservation of natural
environments and economic resource exploitation simultaneously. Preventing the
167
establishment of non-indigenous and invasive species is the most effective way to mitigate and
manage their potential impacts. This can be achieved implementing an effective biosecurity
management plan and continuously improving biosecurity practices as more data becomes
available.
The construction of the Gorgon LNG Project on Barrow Island, a biodiversity “hot spot”,
provided vectors and pathways for opportunities of NIS introduction, spread and establishment
(Bellard et al., 2014; Duenas et al., 2018; Marchese, 2015; Myers et al., 2000). NIS
introductions could potentially result in decline in biodiversity and extinction of native species
through predation, competition and herbivory, habitat loss/ alteration, disease, interaction
among the introduced NIS, and hybridization (Geburzi et al., 2018). Four threatened taxa on
Barrow Island that are likely to be impacted by a Rattus rattus (black rat) invasion: the golden
bandicoot (Isoodon auratus barrowensis), spectacled hare wallaby (Largorchestes c.
conspicullatus), Barrow Island euro (Macropus robustus isabellinus) and Barrow Island black-
and-white fairy wren (Malarus leucopterus edouardi) (Government of Australia, 2009).
However, no rats including Rattus norvegicus (brown rat), Rattus exulans (Pacific rat) and
Rattus tanezumi (Asian house rat) have been detected on Barrow Island, and only scats have
been collected in the cargo coming to the island. Previous eradication programmes of rats might
have contributed to the successful absence of the invertebrate on the island (Harris, 2009; Jarrad
et al., 2011; Morris, 2002; Russell et al., 2008; Russell et al., 2015).
168
Cost of surveillance
Efficient ways to manage the threat of invasive species requires optimisation of resources for
both prevention and surveillance. Prevention, by implementing stringent pre-border and border
biosecurity protocols, eliminates adverse impacts entirely (Rout et al., 2011). On the other hand,
surveillance facilitates early detection and eradication and although it is costly, it reduces future
impacts (Rout et al., 2011). Moore et al. (2010) proposed that it was best to invest in
surveillance over quarantine for Barrow Island as it was more cost-effective, estimating that
investment in quarantine activities to be AU$271 million during the four-year construction
period, while investment in surveillance was estimated at AU$4 million, with approximately
25% of the surveillance budget being targeted to detecting vertebrates. Information on the direct
costs of surveillance has not been made publicly available, however a dedicated surveillance
programme implemented at the beginning of the programme and currently on going has seen
the costs gradually decreasing from approximately $1 million per annum to present day around
$0.5 million per annum for each of the plant, vertebrate and invertebrate species (M. Thomas
personal communication, 2020). For instance, an eradication program of the Asian house
Gecko between November 2015 and March 2017 was estimated to cost over $3 million
including chemicals and human resources. Among the four species, Cenchrus ciliaris (buffel
grass) requires the largest surveillance budget, with 56% of the total spending, followed by
black rats (23%), then Asian house geckos (11%), while Singapore ants consisting of only 9%
of total spending. (Thomas M, Pers. Comm). C. ciliaris is an established NIS on the island and
to proliferate easily, but Chevron is obligated to prevent any new introductions of the grass
169
(Environment Protection and Biodiversity Conservation, 1999). However, the most frequently
intercepted seed was Tyhpa sp. (bulrush).
Detection of NIS previously established on the island (3.5%) prior to the Gorgon LNG Project,
provides an indicator of the exposure pressure historically experienced on Barrow Island (M.
Thomas, personal communication, 2020). Post border surveillance shows that no NIS species
that have been introduced and become establishment on Barrow island (Scott et al., 2017). All
NIS species that have been detected on Barrow Island have been eradicated e.g. the Asian
House Gecko or are under a quarantine response like the buffel grass. On-going NIS species
surveillance has not detected the presence of these species. This surveillance program is a
ministerial requirement and NIS species must be detected if it is present on Barrow Island with
a mandated power of detection of 0.8 (Barrett et al., 2010; Environment Protection and
Biodiversity Conservation, 1999; Majer et al., 2013; Murray et al., 2015; Whittle et al., 2013).
The Quarantine Management System was first implemented in 2009 at the inception of the
Gorgon LNG Project and was continuously revised to included improve risk mitigation
strategies in the light of new information obtained through audits as the project progressed to
the operational phase (Wintle et al., 2015). Notable changes were the exemplar species, where
new ones were added to the list and some of them became redundant. For example,
Trichomyrmex destructor (the Singapore ant) replaced Pheidole megacephala (big-headed ant),
Coptotermes formosanus (Formosan termite ) was replaced by Mastotermes darwiniensis
(giant northern termite), while Polistes humilis (paper wasp) was removed from the
invertebrate list (Wintle et al.,, 2015). C. ciliaris remained top priority for surveillance since it
is already established on the island and Chevron had to ensure that no new introductions
170
occurred as a result of the Gorgon LNG Project. Finally, for the vertebrates, R. rattus and
Hemidactylus frenatus remained top priority for surveillance. Litoria rubella though native to
Australia, is on the priority watch-list. It is a nuisance hitchhiker and stowaway transmits a
disease called chytridiomycosis (a skin infection) to other amphibian species (Rowley et al.,
2020; Van Rooij et al., 2015).
As the Gorgon LNG Project is set to operate for the next 40 years, it is important that the
biosecurity management plan continues to be reviewed and improved upon. The biosecurity
management plan is reflective of scientific approach to environmental management through
targeted multidisciplinary research, implementation of facilities and designs to minimise
environmental risk and development of strict protocols and procedures for the all stakeholders
including contractors, and the entire workforce. There is a structured, systematic framework
for monitoring, auditing, review and improvement of work performance and biosecurity
management (International Petrolueum Industry Environmental Conservation Association,
2012). Barrow Island biosecurity management plan has been highlighted as providing an
example of effective co-management of development and conservation, with mitigation and
prevention of invasion and impacts of non-indigenous species (Lynch et al., 2019). Some of
the biosecurity procedures have been adopted and used by the Department of Primary Industries
and Regional Development (formerly WA Department of Agriculture) and the management of
tramp ant e.g. Solenopsis invicta (red imported fire ant) in Australia. (Department of
Environment and Conservation, 2011; Lach, 2015; Lach et al., 2013). Other resources projects
operating on sensitive islands with high biodiversity e.g. Curtis Island, Queensland which is
171
located in the Great Barrier Reef, a world heritage site, could benefit from the measures adopted
as part of the Quarantine Management System implemented by Chevron (GHD, 2009)
Priority resource exploration projects in North-west Australia, the Deepwater Gulf of Mexico,
Deepwater West Africa, and the Gulf of Thailand can utilise and improve on the biosecurity
management information from the Gorgon LNG Project (Zhang et al., 2019). Future changes
in supply and demand of minerals will likely shift focus towards biodiverse regions,
highlighting the need for implementation of effective biosecurity strategies. As such, it is
essential that these strategies be informed by previously been tested and successful biosecurity
programs. This is essential in order to minimise the potential for spread of invasive species and
to ensure that our natural biodiversity can managed in responsible and accountable manner.
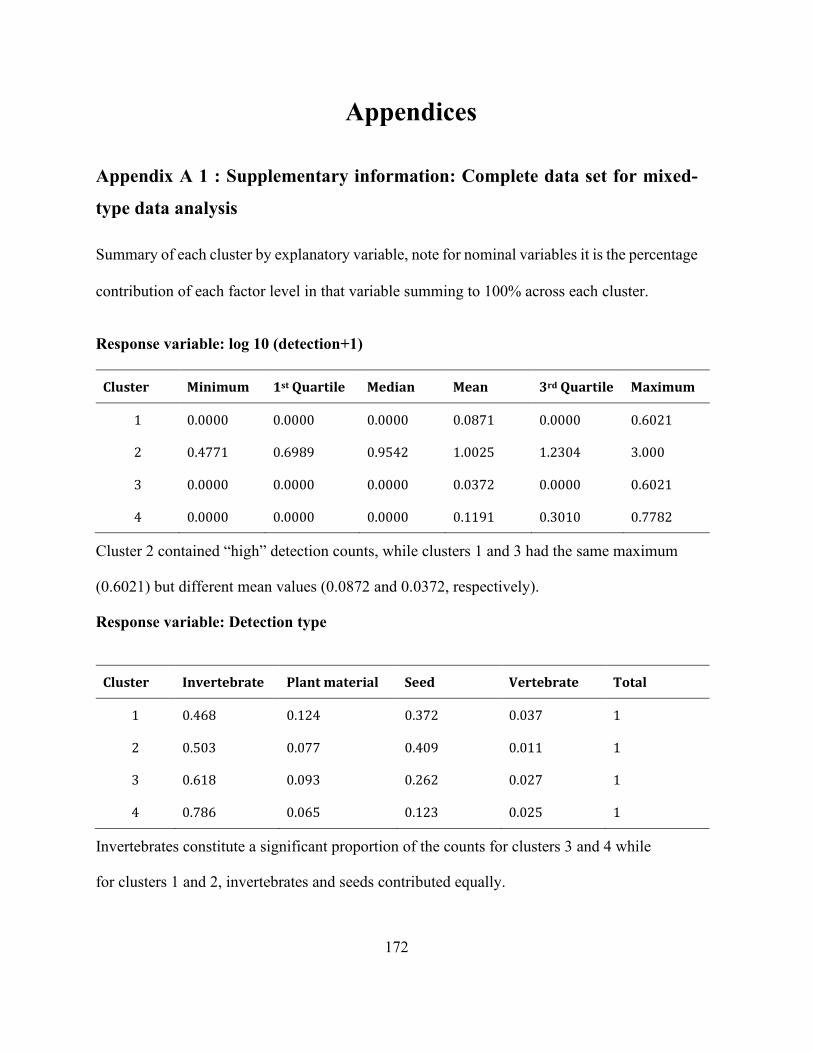
172
Appendices
Appendix A 1 : Supplementary information: Complete data set for mixed-
type data analysis
Summary of each cluster by explanatory variable, note for nominal variables it is the percentage
contribution of each factor level in that variable summing to 100% across each cluster.
Response variable: log 10 (detection+1)
Cluster Minimum 1st Quartile Median Mean 3rd Quartile Maximum
1 0.0000 0.0000 0.0000 0.0871 0.0000 0.6021
2 0.4771 0.6989 0.9542 1.0025 1.2304 3.000
3 0.0000 0.0000 0.0000 0.0372 0.0000 0.6021
4 0.0000 0.0000 0.0000 0.1191 0.3010 0.7782
Cluster 2 contained “high” detection counts, while clusters 1 and 3 had the same maximum
(0.6021) but different mean values (0.0872 and 0.0372, respectively).
Response variable: Detection type
Cluster Invertebrate Plant material Seed Vertebrate Total
1 0.468 0.124 0.372 0.037 1
2 0.503 0.077 0.409 0.011 1
3 0.618 0.093 0.262 0.027 1
4 0.786 0.065 0.123 0.025 1
Invertebrates constitute a significant proportion of the counts for clusters 3 and 4 while
for clusters 1 and 2, invertebrates and seeds contributed equally.
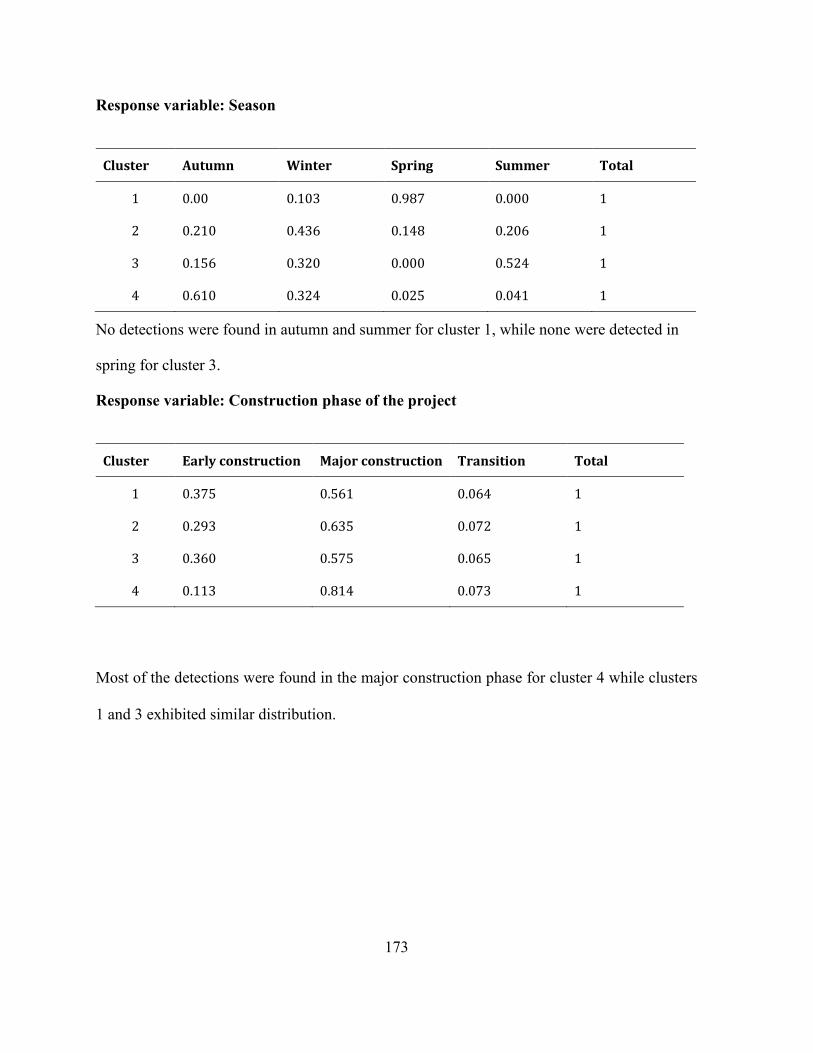
173
Response variable: Season
Cluster Autumn Winter Spring Summer Total
1 0.00 0.103 0.987 0.000 1
2 0.210 0.436 0.148 0.206 1
3 0.156 0.320 0.000 0.524 1
4 0.610 0.324 0.025 0.041 1
No detections were found in autumn and summer for cluster 1, while none were detected in
spring for cluster 3.
Response variable: Construction phase of the project
Cluster Early construction Major construction Transition Total
1 0.375 0.561 0.064 1
2 0.293 0.635 0.072 1
3 0.360 0.575 0.065 1
4 0.113 0.814 0.073 1
Most of the detections were found in the major construction phase for cluster 4 while clusters
1 and 3 exhibited similar distribution.
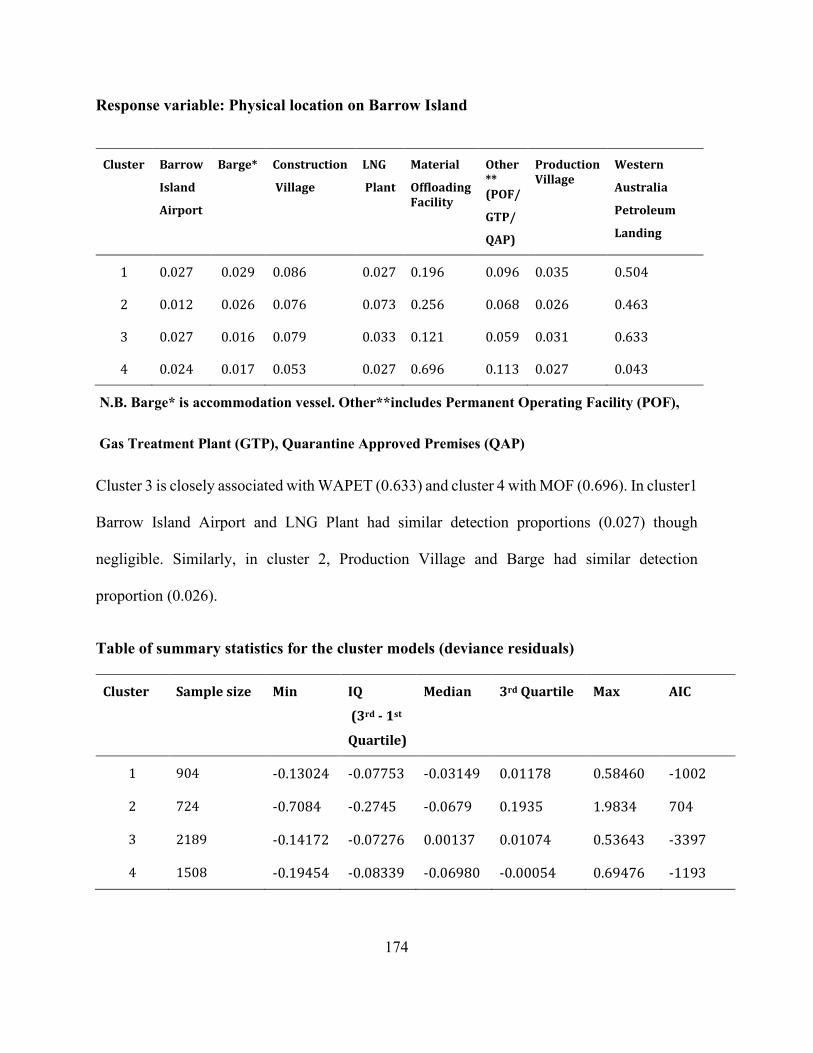
174
Response variable: Physical location on Barrow Island
Cluster Barrow
Island
Airport
Barge*
Construction
Village
LNG
Plant
Material
Offloading Facility
Other ** (POF/
GTP/
QAP)
Production Village
Western
Australia
Petroleum
Landing
1 0.027 0.029 0.086 0.027 0.196 0.096 0.035 0.504
2 0.012 0.026 0.076 0.073 0.256 0.068 0.026 0.463
3 0.027 0.016 0.079 0.033 0.121 0.059 0.031 0.633
4 0.024 0.017 0.053 0.027 0.696 0.113 0.027 0.043
N.B. Barge* is accommodation vessel. Other**includes Permanent Operating Facility (POF),
Gas Treatment Plant (GTP), Quarantine Approved Premises (QAP)
Cluster 3 is closely associated with WAPET (0.633) and cluster 4 with MOF (0.696). In cluster1
Barrow Island Airport and LNG Plant had similar detection proportions (0.027) though
negligible. Similarly, in cluster 2, Production Village and Barge had similar detection
proportion (0.026).
Table of summary statistics for the cluster models (deviance residuals)
Cluster Sample size Min IQ
(3rd - 1st
Quartile)
Median 3rd Quartile Max AIC
1 904 -0.13024 -0.07753 -0.03149 0.01178 0.58460 -1002
2 724 -0.7084 -0.2745 -0.0679 0.1935 1.9834 704
3 2189 -0.14172 -0.07276 0.00137 0.01074 0.53643 -3397
4 1508 -0.19454 -0.08339 -0.06980 -0.00054 0.69476 -1193
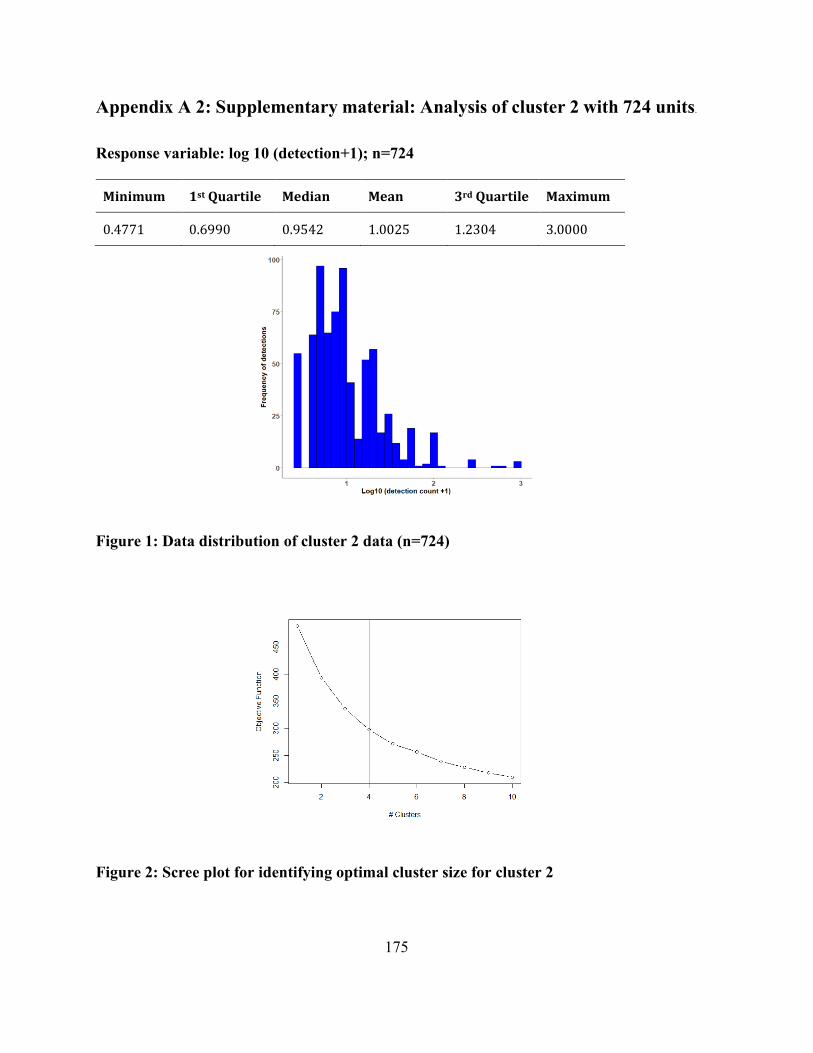
175
Appendix A 2: Supplementary material: Analysis of cluster 2 with 724 units.
Response variable: log 10 (detection+1); n=724
Minimum 1st Quartile Median Mean 3rd Quartile Maximum
0.4771 0.6990 0.9542 1.0025 1.2304 3.0000
Figure 1: Data distribution of cluster 2 data (n=724)
Figure 2: Scree plot for identifying optimal cluster size for cluster 2
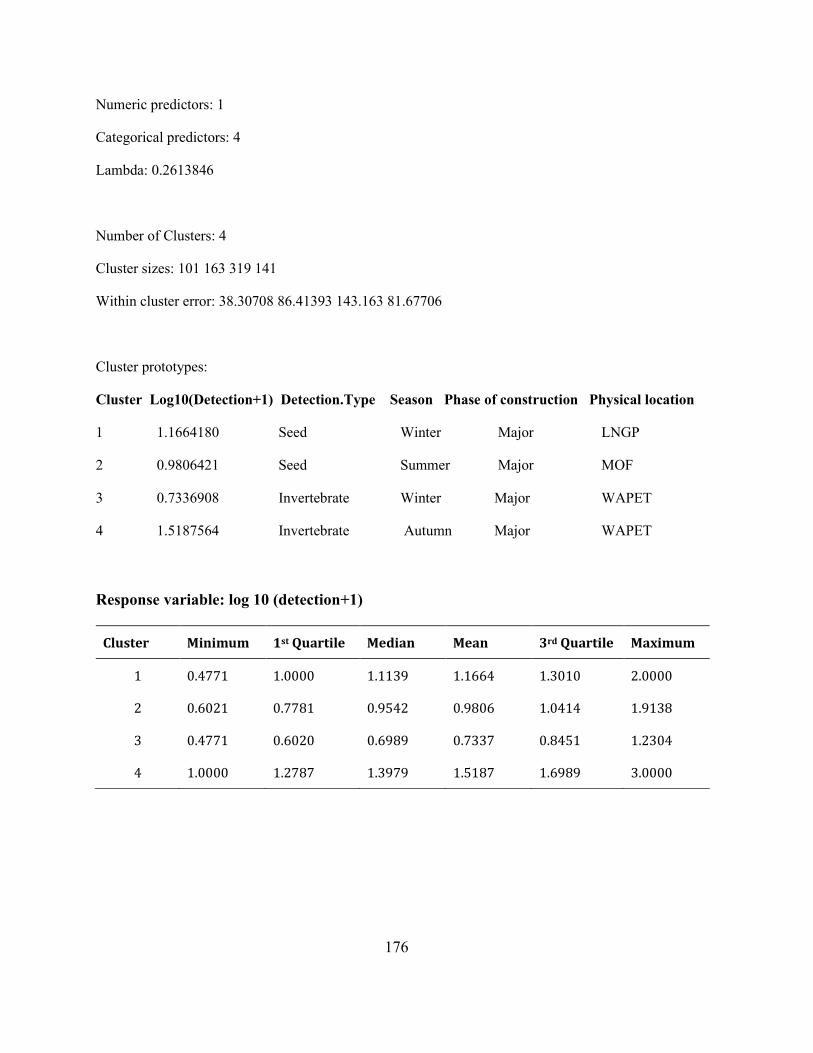
176
Numeric predictors: 1
Categorical predictors: 4
Lambda: 0.2613846
Number of Clusters: 4
Cluster sizes: 101 163 319 141
Within cluster error: 38.30708 86.41393 143.163 81.67706
Cluster prototypes:
Cluster Log10(Detection+1) Detection.Type Season Phase of construction Physical location
1 1.1664180 Seed Winter Major LNGP
2 0.9806421 Seed Summer Major MOF
3 0.7336908 Invertebrate Winter Major WAPET
4 1.5187564 Invertebrate Autumn Major WAPET
Response variable: log 10 (detection+1)
Cluster Minimum 1st Quartile Median Mean 3rd Quartile Maximum
1 0.4771 1.0000 1.1139 1.1664 1.3010 2.0000
2 0.6021 0.7781 0.9542 0.9806 1.0414 1.9138
3 0.4771 0.6020 0.6989 0.7337 0.8451 1.2304
4 1.0000 1.2787 1.3979 1.5187 1.6989 3.0000
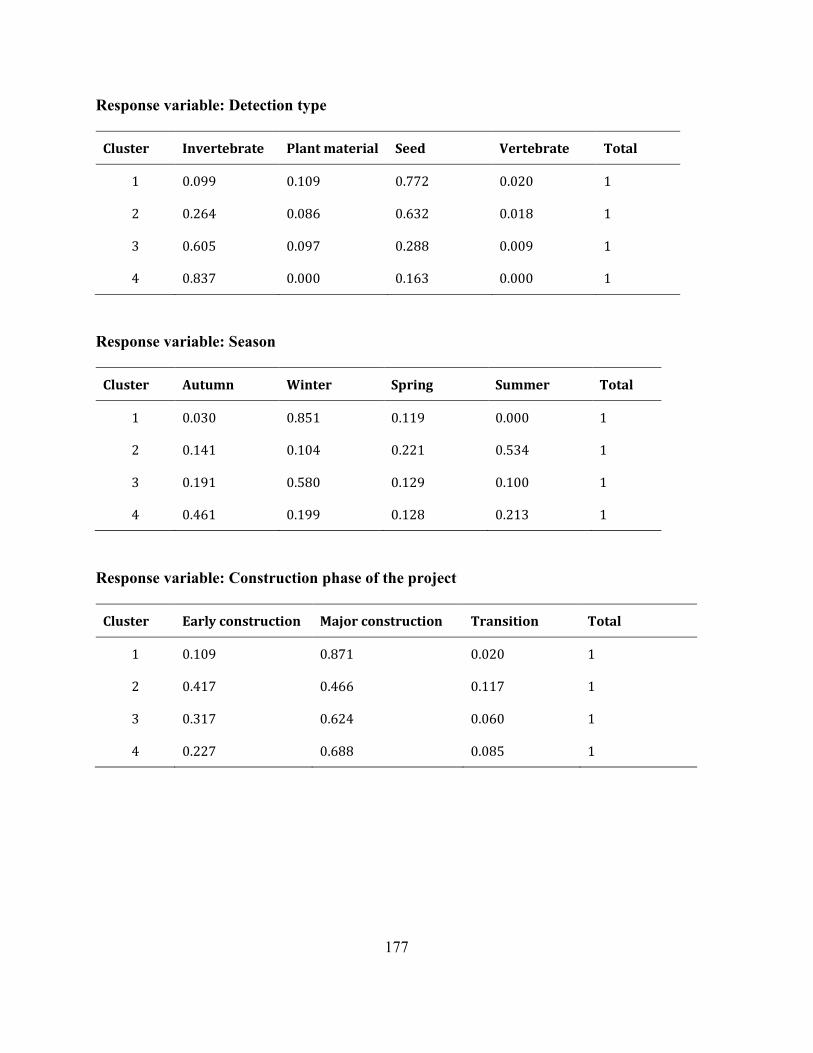
177
Response variable: Detection type
Cluster Invertebrate Plant material Seed Vertebrate Total
1 0.099 0.109 0.772 0.020 1
2 0.264 0.086 0.632 0.018 1
3 0.605 0.097 0.288 0.009 1
4 0.837 0.000 0.163 0.000 1
Response variable: Season
Cluster Autumn Winter Spring Summer Total
1 0.030 0.851 0.119 0.000 1
2 0.141 0.104 0.221 0.534 1
3 0.191 0.580 0.129 0.100 1
4 0.461 0.199 0.128 0.213 1
Response variable: Construction phase of the project
Cluster Early construction Major construction Transition Total
1 0.109 0.871 0.020 1
2 0.417 0.466 0.117 1
3 0.317 0.624 0.060 1
4 0.227 0.688 0.085 1
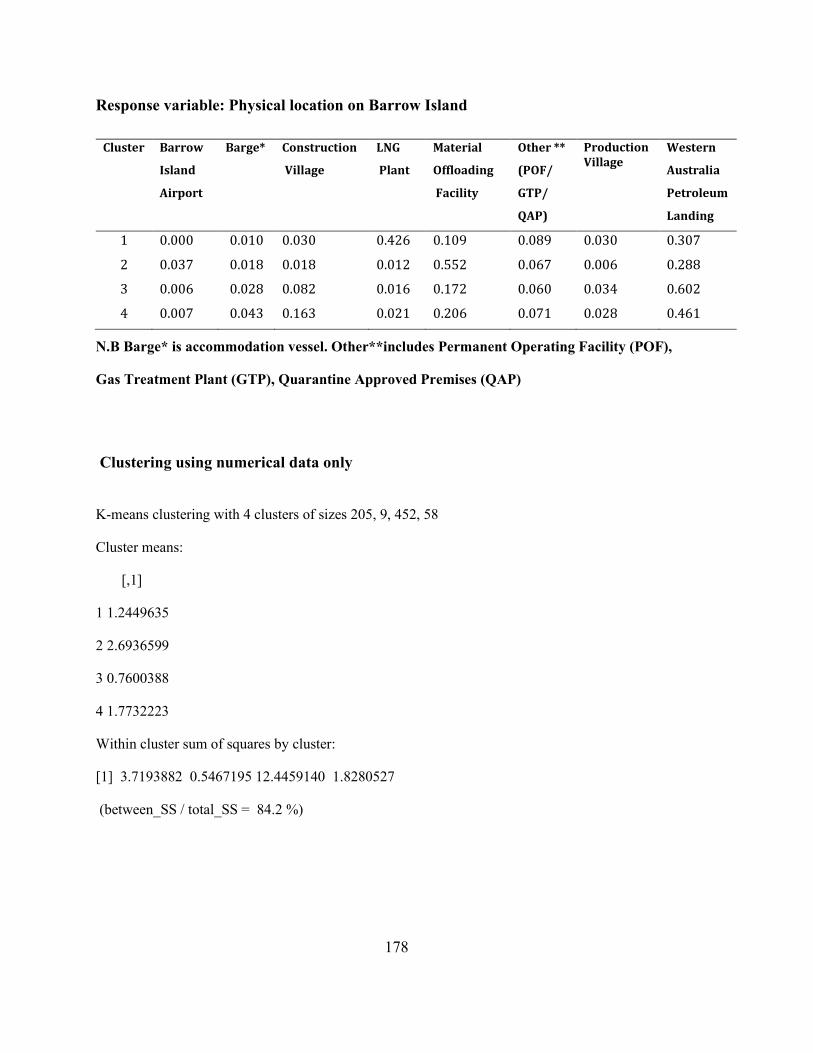
178
Response variable: Physical location on Barrow Island
Cluster Barrow
Island
Airport
Barge*
Construction
Village
LNG
Plant
Material
Offloading
Facility
Other **
(POF/
GTP/
QAP)
Production Village
Western
Australia
Petroleum
Landing
1 0.000 0.010 0.030 0.426 0.109 0.089 0.030 0.307
2 0.037 0.018 0.018 0.012 0.552 0.067 0.006 0.288
3 0.006 0.028 0.082 0.016 0.172 0.060 0.034 0.602
4 0.007 0.043 0.163 0.021 0.206 0.071 0.028 0.461
N.B Barge* is accommodation vessel. Other**includes Permanent Operating Facility (POF),
Gas Treatment Plant (GTP), Quarantine Approved Premises (QAP)
Clustering using numerical data only
K-means clustering with 4 clusters of sizes 205, 9, 452, 58
Cluster means:
[,1]
1 1.2449635
2 2.6936599
3 0.7600388
4 1.7732223
Within cluster sum of squares by cluster:
[1] 3.7193882 0.5467195 12.4459140 1.8280527
(between_SS / total_SS = 84.2 %)
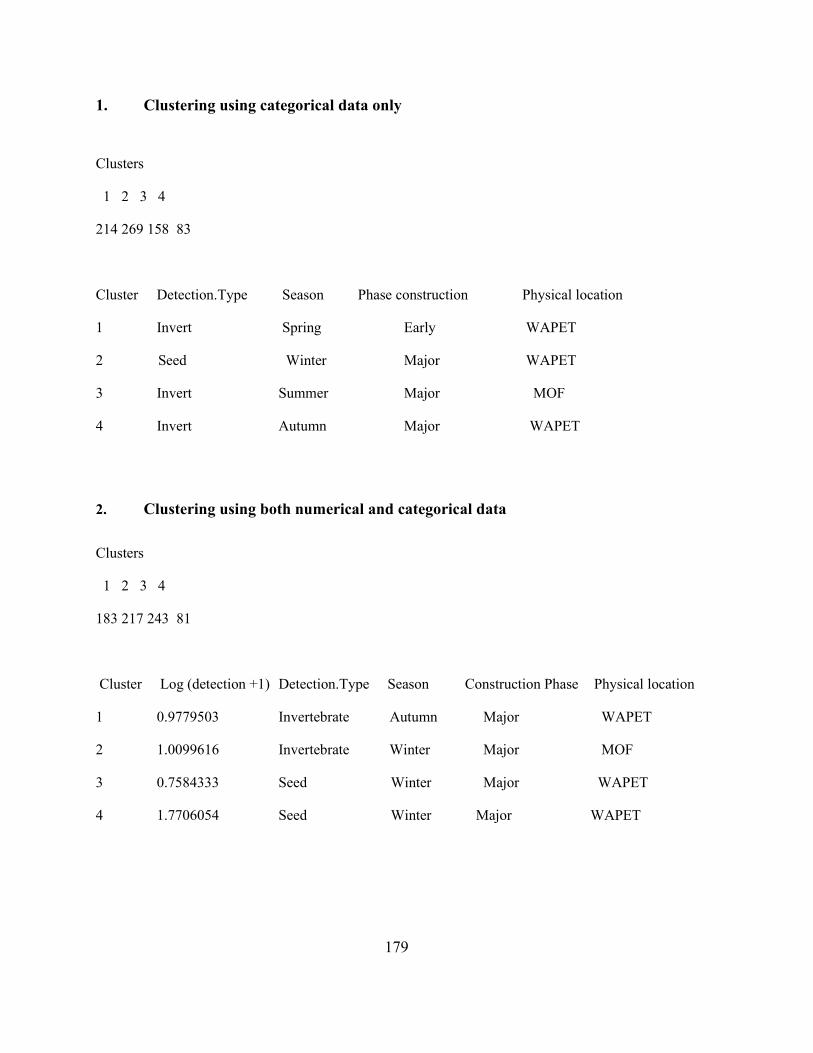
179
1. Clustering using categorical data only
Clusters
1 2 3 4
214 269 158 83
Cluster Detection.Type Season Phase construction Physical location
1 Invert Spring Early WAPET
2 Seed Winter Major WAPET
3 Invert Summer Major MOF
4 Invert Autumn Major WAPET
2. Clustering using both numerical and categorical data
Clusters
1 2 3 4
183 217 243 81
Cluster Log (detection +1) Detection.Type Season Construction Phase Physical location
1 0.9779503 Invertebrate Autumn Major WAPET
2 1.0099616 Invertebrate Winter Major MOF
3 0.7584333 Seed Winter Major WAPET
4 1.7706054 Seed Winter Major WAPET
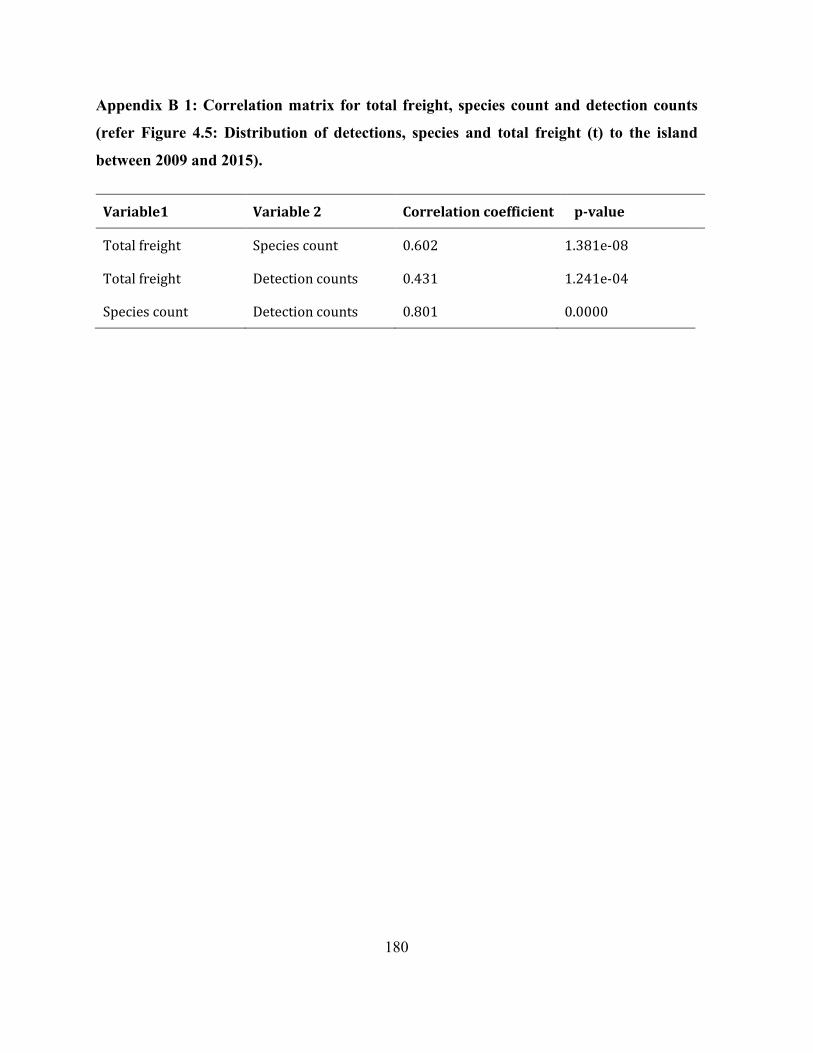
180
Appendix B 1: Correlation matrix for total freight, species count and detection counts
(refer Figure 4.5: Distribution of detections, species and total freight (t) to the island
between 2009 and 2015).
Variable1 Variable 2 Correlation coefficient p-value
Total freight Species count 0.602 1.381e-08
Total freight Detection counts 0.431 1.241e-04
Species count Detection counts 0.801 0.0000
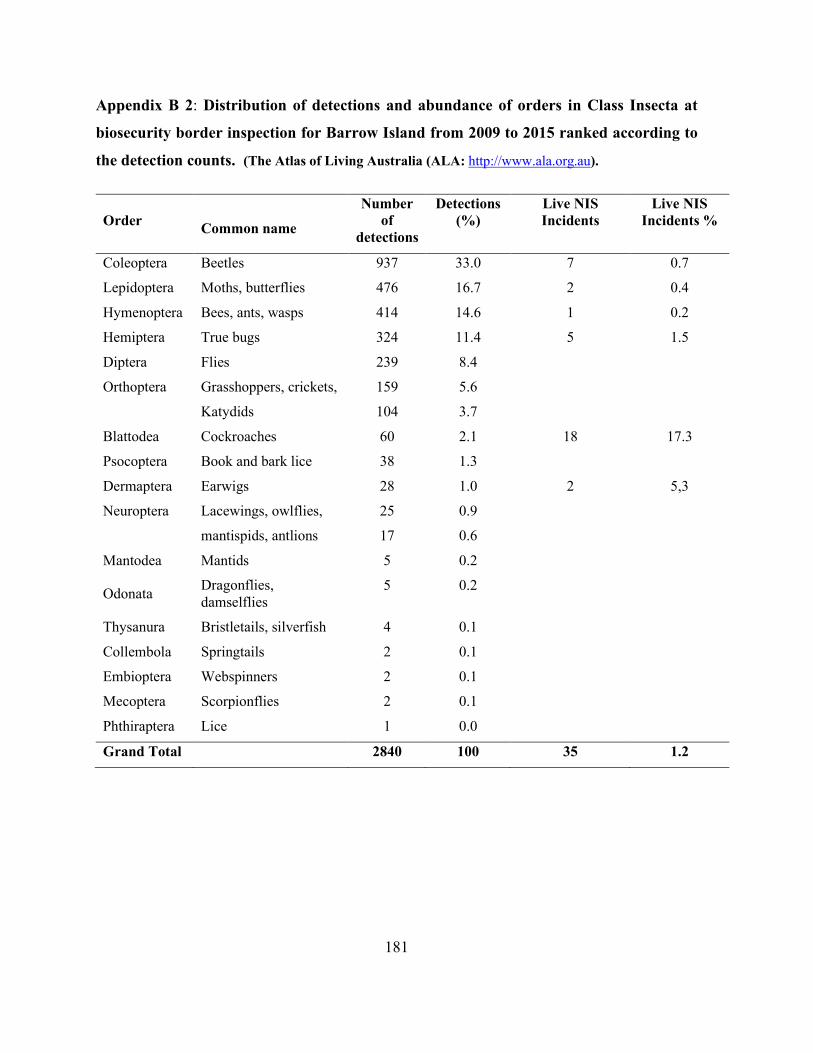
181
Appendix B 2: Distribution of detections and abundance of orders in Class Insecta at
biosecurity border inspection for Barrow Island from 2009 to 2015 ranked according to
the detection counts. (The Atlas of Living Australia (ALA: http://www.ala.org.au).
Order
Common name
Number of
detections
Detections (%)
Live NIS Incidents
Live NIS Incidents %
Coleoptera Beetles 937 33.0 7 0.7
Lepidoptera Moths, butterflies 476 16.7 2 0.4
Hymenoptera Bees, ants, wasps 414 14.6 1 0.2
Hemiptera True bugs 324 11.4 5 1.5
Diptera Flies 239 8.4
Orthoptera Grasshoppers, crickets, 159 5.6
Katydids 104 3.7
Blattodea Cockroaches 60 2.1 18 17.3
Psocoptera Book and bark lice 38 1.3
Dermaptera Earwigs 28 1.0 2 5,3
Neuroptera Lacewings, owlflies, 25 0.9
mantispids, antlions 17 0.6
Mantodea Mantids 5 0.2
Odonata Dragonflies, damselflies
5 0.2
Thysanura Bristletails, silverfish 4 0.1
Collembola Springtails 2 0.1
Embioptera Webspinners 2 0.1
Mecoptera Scorpionflies 2 0.1
Phthiraptera Lice 1 0.0
Grand Total 2840 100 35 1.2
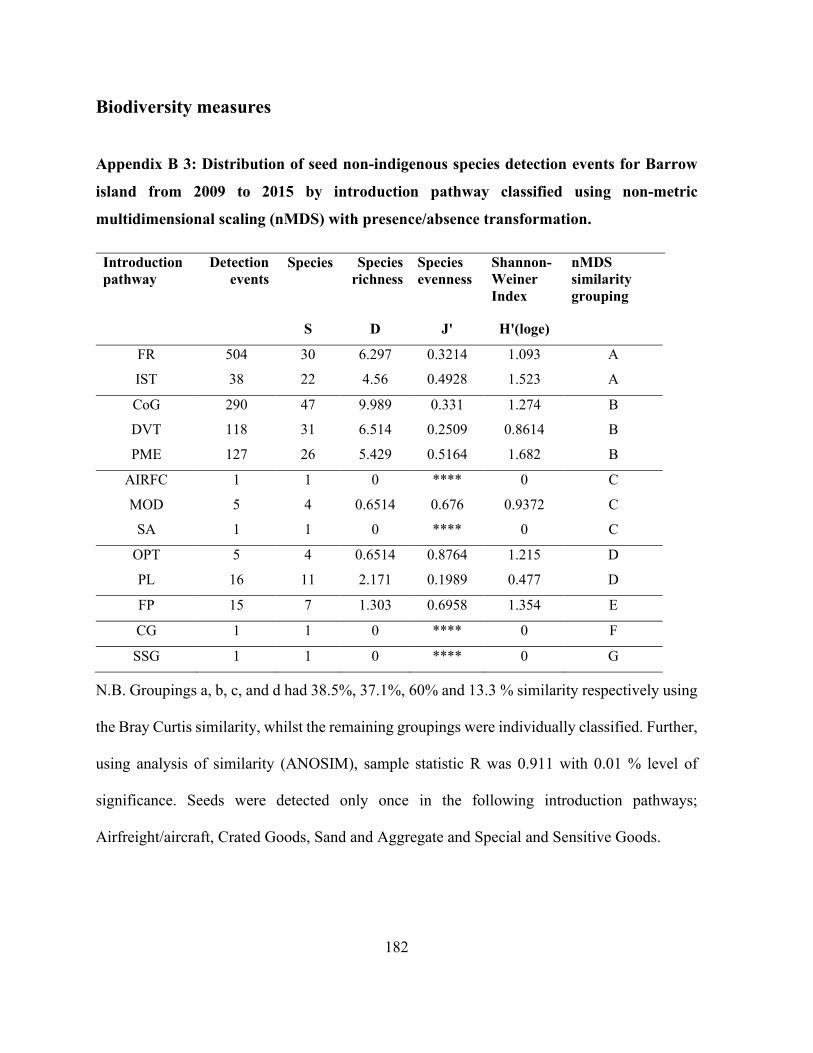
182
Biodiversity measures
Appendix B 3: Distribution of seed non-indigenous species detection events for Barrow
island from 2009 to 2015 by introduction pathway classified using non-metric
multidimensional scaling (nMDS) with presence/absence transformation.
Introduction pathway
Detection events
Species Species richness
Species evenness
Shannon-Weiner Index
nMDS similarity grouping
S D J' H'(loge)
FR 504 30 6.297 0.3214 1.093 A
IST 38 22 4.56 0.4928 1.523 A
CoG 290 47 9.989 0.331 1.274 B
DVT 118 31 6.514 0.2509 0.8614 B
PME 127 26 5.429 0.5164 1.682 B
AIRFC 1 1 0 **** 0 C
MOD 5 4 0.6514 0.676 0.9372 C
SA 1 1 0 **** 0 C
OPT 5 4 0.6514 0.8764 1.215 D
PL 16 11 2.171 0.1989 0.477 D
FP 15 7 1.303 0.6958 1.354 E
CG 1 1 0 **** 0 F
SSG 1 1 0 **** 0 G
N.B. Groupings a, b, c, and d had 38.5%, 37.1%, 60% and 13.3 % similarity respectively using
the Bray Curtis similarity, whilst the remaining groupings were individually classified. Further,
using analysis of similarity (ANOSIM), sample statistic R was 0.911 with 0.01 % level of
significance. Seeds were detected only once in the following introduction pathways;
Airfreight/aircraft, Crated Goods, Sand and Aggregate and Special and Sensitive Goods.
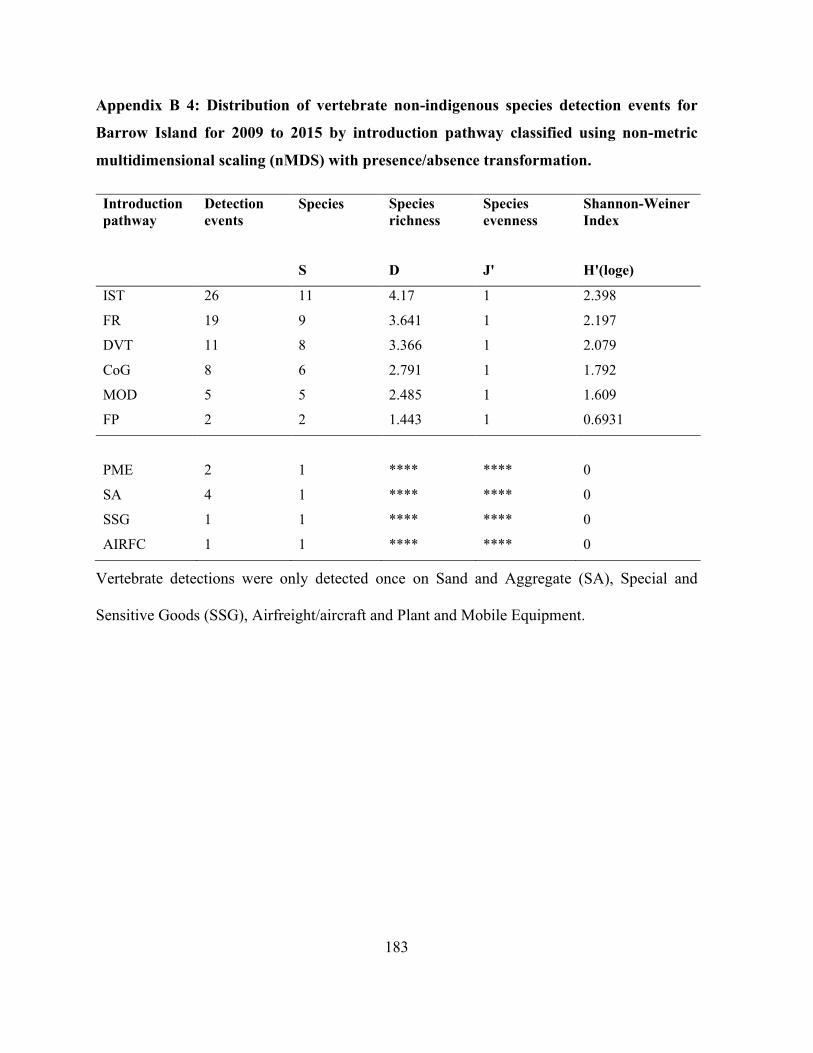
183
Appendix B 4: Distribution of vertebrate non-indigenous species detection events for
Barrow Island for 2009 to 2015 by introduction pathway classified using non-metric
multidimensional scaling (nMDS) with presence/absence transformation.
Introduction pathway
Detection events
Species Species richness
Species evenness
Shannon-Weiner Index
S D J' H'(loge)
IST 26 11 4.17 1 2.398
FR 19 9 3.641 1 2.197
DVT 11 8 3.366 1 2.079
CoG 8 6 2.791 1 1.792
MOD 5 5 2.485 1 1.609
FP 2 2 1.443 1 0.6931
PME 2 1 **** **** 0
SA 4 1 **** **** 0
SSG 1 1 **** **** 0
AIRFC 1 1 **** **** 0
Vertebrate detections were only detected once on Sand and Aggregate (SA), Special and
Sensitive Goods (SSG), Airfreight/aircraft and Plant and Mobile Equipment.
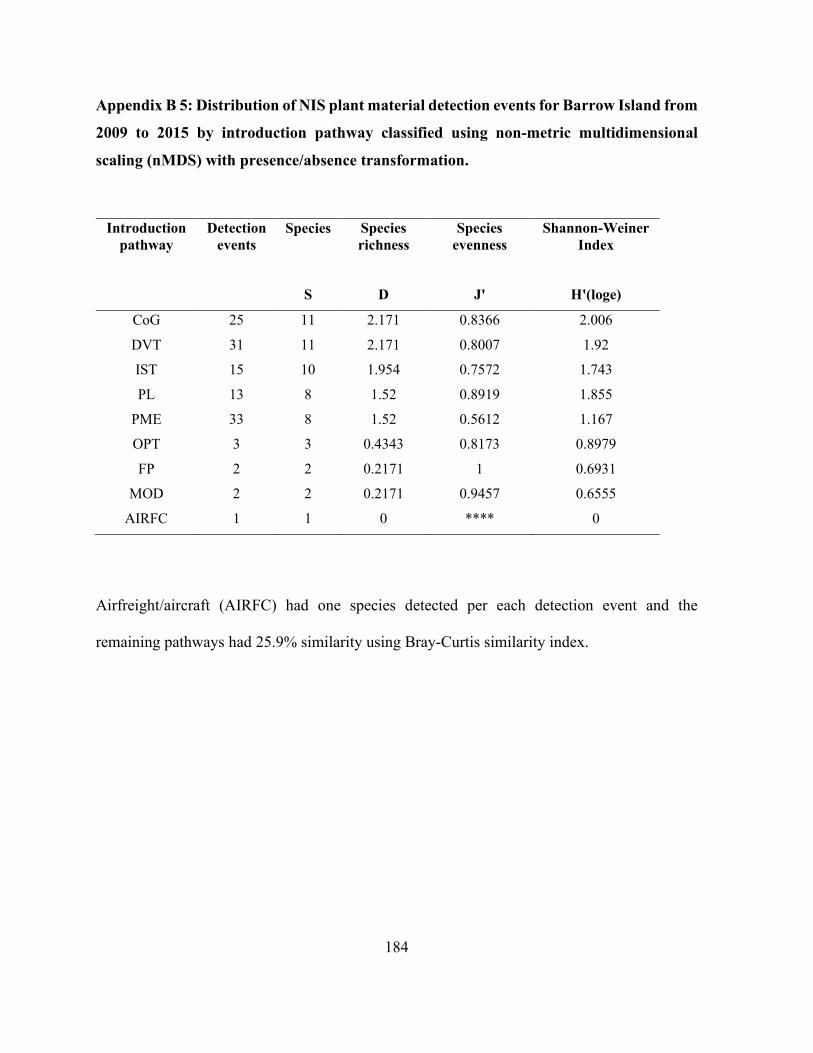
184
Appendix B 5: Distribution of NIS plant material detection events for Barrow Island from
2009 to 2015 by introduction pathway classified using non-metric multidimensional
scaling (nMDS) with presence/absence transformation.
Introduction pathway
Detection events
Species Species richness
Species evenness
Shannon-Weiner Index
S D J' H'(loge)
CoG 25 11 2.171 0.8366 2.006
DVT 31 11 2.171 0.8007 1.92
IST 15 10 1.954 0.7572 1.743
PL 13 8 1.52 0.8919 1.855
PME 33 8 1.52 0.5612 1.167
OPT 3 3 0.4343 0.8173 0.8979
FP 2 2 0.2171 1 0.6931
MOD 2 2 0.2171 0.9457 0.6555
AIRFC 1 1 0 **** 0
Airfreight/aircraft (AIRFC) had one species detected per each detection event and the
remaining pathways had 25.9% similarity using Bray-Curtis similarity index.
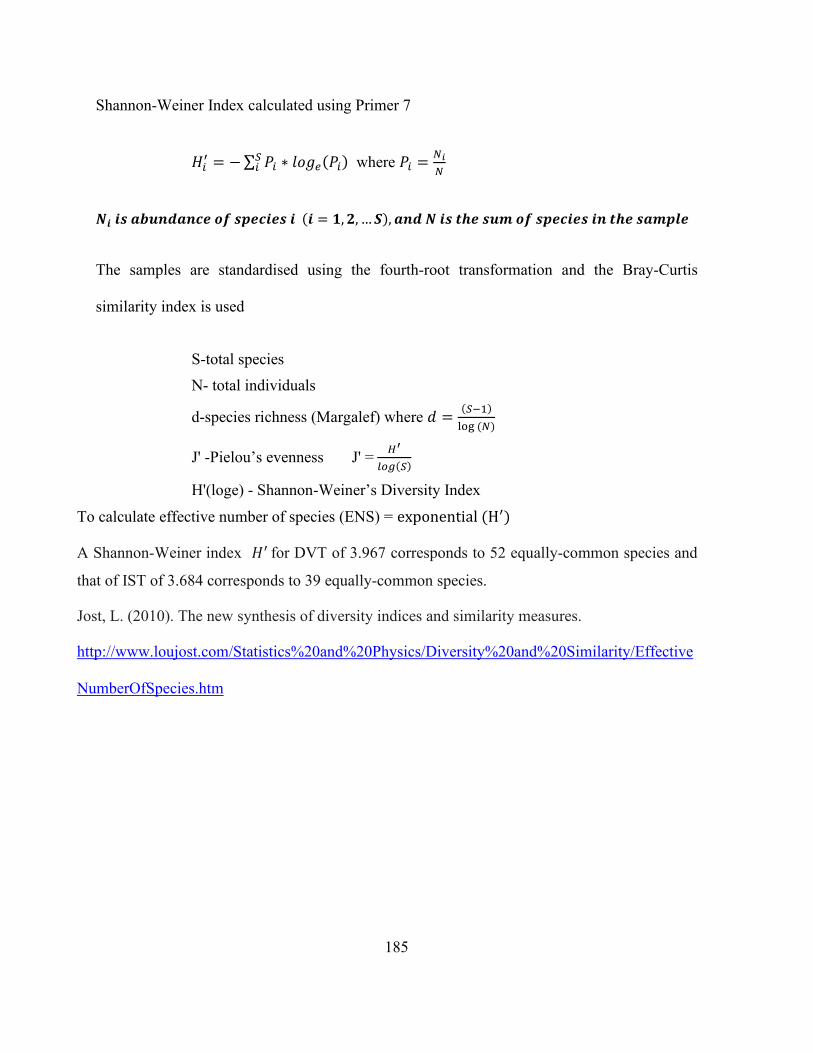
185
Shannon-Weiner Index calculated using Primer 7
𝐻𝐻𝑖𝑖′ = −∑ 𝑃𝑃𝑖𝑖𝑆𝑆𝑖𝑖 ∗ 𝑙𝑙𝑙𝑙𝑙𝑙𝑒𝑒(𝑃𝑃𝑖𝑖) where 𝑃𝑃𝑖𝑖 = 𝑁𝑁𝑖𝑖
𝑁𝑁
𝑳𝑳𝑫𝑫 𝑫𝑫𝒊𝒊 𝒂𝒂𝒂𝒂𝒂𝒂𝑫𝑫𝒂𝒂𝒂𝒂𝑫𝑫𝑫𝑫𝑫𝑫 𝑳𝑳𝒐𝒐 𝒊𝒊𝒔𝒔𝑫𝑫𝑫𝑫𝑫𝑫𝑫𝑫𝒊𝒊 𝑫𝑫 (𝑫𝑫 = 𝟏𝟏,𝟐𝟐, …𝑺𝑺),𝒂𝒂𝑫𝑫𝒂𝒂 𝑳𝑳 𝑫𝑫𝒊𝒊 𝑫𝑫𝒕𝒕𝑫𝑫 𝒊𝒊𝒂𝒂𝒔𝒔 𝑳𝑳𝒐𝒐 𝒊𝒊𝒔𝒔𝑫𝑫𝑫𝑫𝑫𝑫𝑫𝑫𝒊𝒊 𝑫𝑫𝑫𝑫 𝑫𝑫𝒕𝒕𝑫𝑫 𝒊𝒊𝒂𝒂𝒔𝒔𝒔𝒔𝒔𝒔𝑫𝑫
The samples are standardised using the fourth-root transformation and the Bray-Curtis
similarity index is used
S-total species N- total individuals
d-species richness (Margalef) where 𝑑𝑑 = (𝑆𝑆−1)log (𝑁𝑁)
J' -Pielou’s evenness J' = 𝐻𝐻′
𝑙𝑙𝑙𝑙𝑙𝑙(𝑆𝑆)
H'(loge) - Shannon-Weiner’s Diversity Index
To calculate effective number of species (ENS) = exponential (H′)
A Shannon-Weiner index 𝐻𝐻′ for DVT of 3.967 corresponds to 52 equally-common species and
that of IST of 3.684 corresponds to 39 equally-common species.
Jost, L. (2010). The new synthesis of diversity indices and similarity measures.
http://www.loujost.com/Statistics%20and%20Physics/Diversity%20and%20Similarity/Effective
NumberOfSpecies.htm
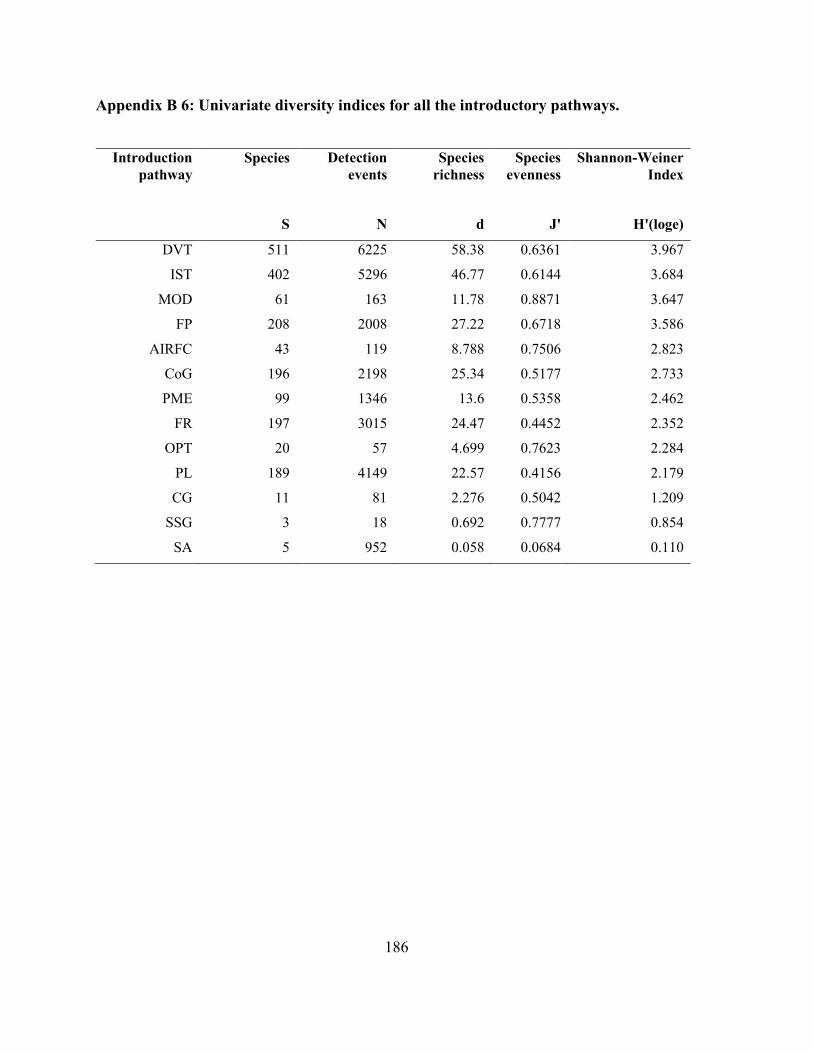
186
Appendix B 6: Univariate diversity indices for all the introductory pathways.
Introduction pathway
Species Detection events
Species richness
Species evenness
Shannon-Weiner Index
S N d J' H'(loge)
DVT 511 6225 58.38 0.6361 3.967
IST 402 5296 46.77 0.6144 3.684
MOD 61 163 11.78 0.8871 3.647
FP 208 2008 27.22 0.6718 3.586
AIRFC 43 119 8.788 0.7506 2.823
CoG 196 2198 25.34 0.5177 2.733
PME 99 1346 13.6 0.5358 2.462
FR 197 3015 24.47 0.4452 2.352
OPT 20 57 4.699 0.7623 2.284
PL 189 4149 22.57 0.4156 2.179
CG 11 81 2.276 0.5042 1.209
SSG 3 18 0.692 0.7777 0.854
SA 5 952 0.058 0.0684 0.110
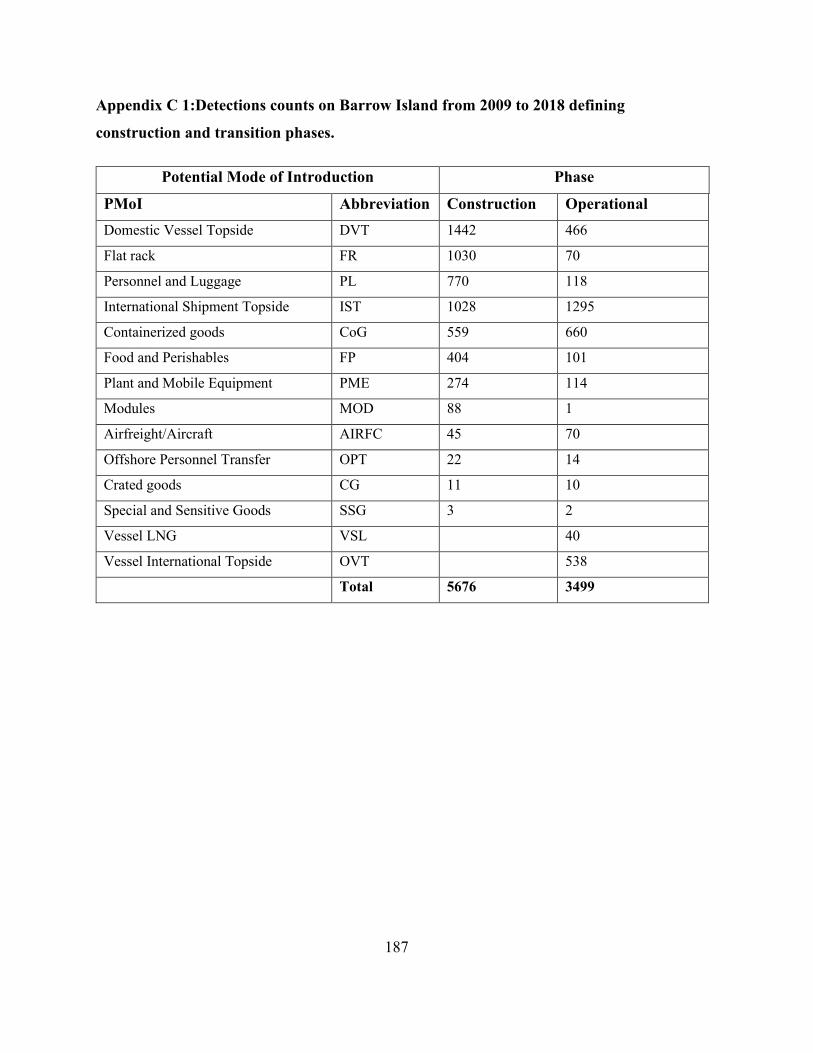
187
Appendix C 1:Detections counts on Barrow Island from 2009 to 2018 defining
construction and transition phases.
Potential Mode of Introduction Phase
PMoI Abbreviation Construction Operational Domestic Vessel Topside DVT 1442 466
Flat rack FR 1030 70
Personnel and Luggage PL 770 118
International Shipment Topside IST 1028 1295
Containerized goods CoG 559 660
Food and Perishables FP 404 101
Plant and Mobile Equipment PME 274 114
Modules MOD 88 1
Airfreight/Aircraft AIRFC 45 70
Offshore Personnel Transfer OPT 22 14
Crated goods CG 11 10
Special and Sensitive Goods SSG 3 2
Vessel LNG VSL 40
Vessel International Topside OVT 538
Total 5676 3499
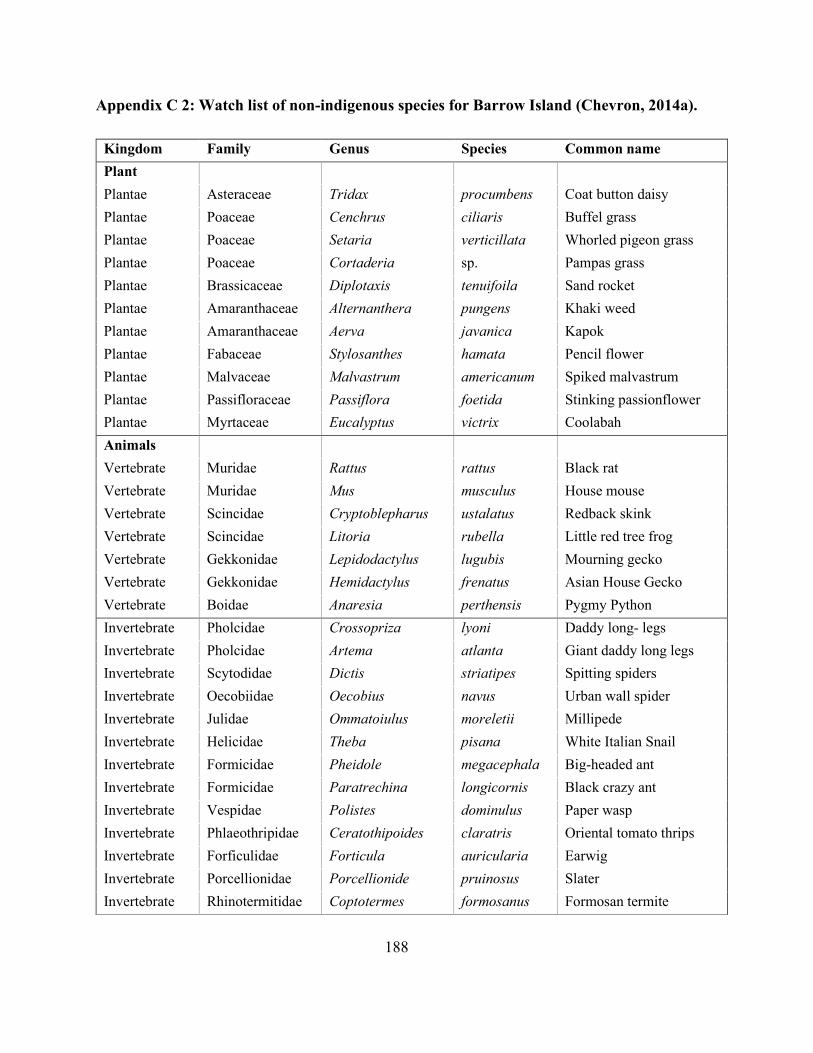
188
Appendix C 2: Watch list of non-indigenous species for Barrow Island (Chevron, 2014a).
Kingdom Family Genus Species Common name Plant Plantae Asteraceae Tridax procumbens Coat button daisy Plantae Poaceae Cenchrus ciliaris Buffel grass Plantae Poaceae Setaria verticillata Whorled pigeon grass Plantae Poaceae Cortaderia sp. Pampas grass Plantae Brassicaceae Diplotaxis tenuifoila Sand rocket Plantae Amaranthaceae Alternanthera pungens Khaki weed Plantae Amaranthaceae Aerva javanica Kapok Plantae Fabaceae Stylosanthes hamata Pencil flower Plantae Malvaceae Malvastrum americanum Spiked malvastrum Plantae Passifloraceae Passiflora foetida Stinking passionflower Plantae Myrtaceae Eucalyptus victrix Coolabah Animals Vertebrate Muridae Rattus rattus Black rat Vertebrate Muridae Mus musculus House mouse Vertebrate Scincidae Cryptoblepharus ustalatus Redback skink Vertebrate Scincidae Litoria rubella Little red tree frog Vertebrate Gekkonidae Lepidodactylus lugubis Mourning gecko Vertebrate Gekkonidae Hemidactylus frenatus Asian House Gecko Vertebrate Boidae Anaresia perthensis Pygmy Python Invertebrate Pholcidae Crossopriza lyoni Daddy long- legs Invertebrate Pholcidae Artema atlanta Giant daddy long legs Invertebrate Scytodidae Dictis striatipes Spitting spiders Invertebrate Oecobiidae Oecobius navus Urban wall spider Invertebrate Julidae Ommatoiulus moreletii Millipede Invertebrate Helicidae Theba pisana White Italian Snail Invertebrate Formicidae Pheidole megacephala Big-headed ant Invertebrate Formicidae Paratrechina longicornis Black crazy ant Invertebrate Vespidae Polistes dominulus Paper wasp Invertebrate Phlaeothripidae Ceratothipoides claratris Oriental tomato thrips Invertebrate Forficulidae Forticula auricularia Earwig Invertebrate Porcellionidae Porcellionide pruinosus Slater Invertebrate Rhinotermitidae Coptotermes formosanus Formosan termite
189
References
ACIL-ALLEN, Chevron. (2015). A snapshot of Chevron's realised and forecast economic benefits in Australia. Perth, Australia. https://www.acilallen.com.au/uploads/ files /projects/163/ACILAllen_Chrevon2015.pdf
Adair, R. J., & Groves, R. H. (1998). Impact of environmental weeds on biodiversity: a review and development of a methodology. Biodiversity Group, Environment Australia Canberra.
Ahmad, A., & Khan, S. S. (2019). Survey of state-of-the-art mixed data clustering algorithms. IEEE Access, 7, 31883-31902. https://doi.org/10.1109/ACCESS.2019.2903568
Alagesan, P. (2016). Millipedes: Diversity, Distribution and Ecology. In A. K. Chakravarthy & S. Sridhara (Eds.), Arthropod Diversity and Conservation in the Tropics and Sub-tropics (pp. 119-137). Springer Singapore.
Alizamir, M., Kisi, O., Ahmed, A.N., Mert, C., Fai, C.M., Kim, S., Kim, N.W. and El-Shafie, A., (2020). Advanced machine learning model for better prediction accuracy of soil temperature at different depths. PLoS One, 15(4). https://doi.org/10.1371/journal.pone.0231055
Alston, C., Mengersen, K. L., Pettitt, A. N., & Wiley, J. (2013). Case studies in Bayesian statistical modelling and analysis: Wiley Online Library. Wiley Series in Probability and Statistics, Hoboken, New Jersey
Anderson, C., Low-Choy, S., Whittle, P., Taylor, S., Gambley, C., Smith, L., Gillespie, P., Löcker, H., Davis, R. and Dominiak, B., (2017). Australian plant biosecurity surveillance systems. Crop Protection, 100, 8-20. https://doi.org/10.1016/j.cropro.2017.05.023
Anderson, M., Gorley, R. N., & Clarke, R. K. (2008). Permanova+ for Primer: Guide to Software and Statistical Methods: Primer-E Limited.
Atkinson, U. A. E. (1973). Spread of the ship rat (Rattus r. rattus L.) III New Zealand. Journal of the Royal Society of New Zealand, 3(3), 457-472., 3(3), 457 -472.
Auditor General, Western Australia (2013). Managing the Impact of Plant and Animal Pests: A State-wide Challenge. Report 18 December 2013. https://audit.wa.gov.au/wp-content/uploads/2013/12/report2013_18-Manage-Impact-Plant-Animal-Pests.pdf
Azmi, F., Primo, C., Hewitt, C. L., & Campbell, M. L. (2014). Assessing marine biosecurity risks when data are limited: bioregion pathway and species-based exposure analyses. ICES Journal of Marine Science, 72(3), 1078-1091. https://doi.org/10.1093/icesjms/fsu236
Baker, G. H., Beckett, S., & Thammavongsa, B. (2012). Are the European snails, Theba pisana (Müller, 1774)(Helicid3ae), Cernuella virgata (da Costa, 1778) and Cochlicella acuta (Müller, 1774)(Hygromiidae) attracted by potential food odours? Crop protection, 42, 88-93. https://doi.org/10.1016/j.cropro.2012.05.021
Balchin, J. R., Duncan, D. G., Key, G. E., & Stevens, N. (2019). Biosecurity on St Helena Island–a socially inclusive model for protecting small island nations from invasive species. Island invasives: scaling up to meet the challenge, (62), 468. https://doi.org/10.2305/IUCN.CH.2019.SSC-OP.62.en
190
Bansal, S., Lishawa, S.C., Newman, S., Tangen, B.A., Wilcox, D., Albert, D., Anteau, M.J., Chimney, M.J., Cressey, R.L., DeKeyser, E. and Elgersma, K.J. (2019). Typha (Cattail) invasion in North American wetlands: Biology, regional problems, impacts, ecosystem services, and management. Wetlands, 39(4), pp.645-684. https://doi.org/10.1007/s13157-019-01174-7
Banks, P. B., & Hughes, N. K. (2012). A review of the evidence for potential impacts of black rats (Rattus rattus) on wildlife and humans in Australia. Wildlife Research, 39(1), 78-88. https://doi.org/10.1071/WR11086
Barnard, D. (2014). Gorgon Project: environmental acoustic recognition sensor (EARS). The Journal of the Australian Petroleum Production & Exploration Association (APPEA), 54(2), 548-548. https://doi.org/10.1071/AJ13121
Barney, J. N., Tekiela, D. R., Dollete, E. S. J., & Tomasek, B. J. (2013). What is the "real" impact of invasive plant species? Frontiers in Ecology and the Environment, 11(6), 322-329. https://doi.org/10.1890/120120
Barrett, S., Whittle, P., Mengersen, K., & Stoklosa, R. (2010). Biosecurity threats: the design of surveillance systems, based on power and risk. Environmental and Ecological Statistics, 17(4), 503-519. https://doi.org/10.1007/s10651-009-0113-4
Barrow Island Act 2003, (WA) (Austl). Retrieved from: https://www.legislation.wa.gov.au/ legislation/statutes.nsf/ law_a6988_currencies.html
Baskin, Y. (2003). A plague of rats and rubbervines: the growing threat of species invasions: Island Press. Washington D.C, United States.
Baxter, P. W., & Hamilton, G. (2016). An analysis of future spatiotemporal surveillance for biosecurity. Plant Biosecurity CRC and Queensland University of Technology, Australia. https://eprints.qut.edu.au/115022/
Baxter, P., Woodley, A., & Hamilton, G. (2017). Modelling the spatial spread risk of plant pests and pathogens for strategic management decisions. Paper presented at the Proceedings of MODSIM2017, 22nd International Congress on Modelling and Simulation.
Beale, R., Fairbrother, J., Inglis, A., & Trebeck, D. (2008). One Biosecurity: A Working Partnership: The Independent Review of Australia's Quarantine and Biosecurity Arrangements Report to the Australian Government.
Bellard, C., Leclerc, C., Leroy, B., Bakkenes, M., Veloz, S., Thuiller, W., & Courchamp, F. (2014). Vulnerability of biodiversity hotspots to global change. Global Ecology and Biogeography, 23(12), 1376-1386. https://doi.org/10.1111/geb.12228
Bellard, C., Leroy, B., Thuiller, W., Rysman, J. F., & Courchamp, F. (2016). Major drivers of invasion risks throughout the world. Ecosphere, 7(3). https://doi.org/10.1002/ecs2.1241.
Benaglia, T., Chauveau, D., Hunter, D. and Young, D. (2009), mixtools: An R package for analyzing finite mixture models. Journal of Statistical Software, 32, 1-29. https://doi.org /10.18637/jss.v032.i06
Benoit, D., Jackson, D. A., & Ridgway, M. S. (2018). Assessing the impacts of imperfect detection on estimates of diversity and community structure through multispecies occupancy modeling. Ecology and Evolution, 8(9), 4676-4684. https://doi.org/10.1002/ece3.4023
191
Bertone, M. A., Leong, M., Bayless, K. M., Malow, T. L., Dunn, R. R., & Trautwein, M. D. (2016). Arthropods of the great indoors: characterizing diversity inside urban and suburban homes. PeerJ, 4. https://doi.org/10.7717/peerj.1582
Bolker, B. M., Brooks, M. E., Clark, C. J., Geange, S. W., Poulsen, J. R., Stevens, M. H. and White, J.-S. S. (2009). Generalized linear mixed models: a practical guide for ecology and evolution. Trends in Ecology and Evolution, 24, 127-135. https://doi.org//10.1016/j.tree.2008.10.008
Biau, G., Cadre, B., & Rouvìère, L. (2018). Accelerated Gradient Boosting. arXiv preprint arXiv:1803.02042.
Biosecurity Act 2015 (2016).(Government of Australia).Retrieved from http://www.agriculture.gov.au/biosecurity/legislation/biosecurity-legislation
Blackburn, T. M., Essl, F., Evans, T., Hulme, P. E., Jeschke, J. M., Kuhn, I., Kumschick, S., Markova, Z., Mrugala, A., Nentwig, W., Pergl, J., Pysek, P., Rabitsch, W., Ricciardi, A., Richardson, D. M., Sendek, A., Vila, M., Wilson, J. R. U., Winter, M., Genovesi, P., & Bacher, S. (2014). A Unified Classification of Alien Species Based on the Magnitude of their Environmental Impacts. PLOS BIOLOGY, 12(5). https://doi.org/: 10.1371/journal.pbio.1001850
Bomford, M. (2008). Risk assessment models for establishment of exotic vertebrates in Australia and New Zealand: Invasive Animals Cooperative Research Centre Canberra.
Booth, G., & Wells, F. (2012). Setting a new benchmark in managing biofouling on vessels operating in a sensitive marine environment. In International Conference on Health, Safety and Environment in Oil and Gas Exploration and Production. Society of Petroleum Engineers.
Breiman, L. (2001). Statistical modeling: The two cultures (with comments and a rejoinder by the author). Statistical science, 16(3), 199-231. https://projecteuclid.org/euclid.ss/1009213726
Brockerhoff, E., Bain, J., Kimberley, M. and Knížek, M. (2006), Interception frequency of exotic bark and ambrosia beetles (Coleoptera: Scolytinae) and relationship with establishment in New Zealand and worldwide. Canadian Journal of Forest Research, 36, 289-298. https://doi.org /10.1139/x05-250
Brockerhoff, E., Kimberley, M., Liebhold, A. M., Haack, R. A. and Cavey, J. F. (2014), Predicting how altering propagule pressure changes establishment rates of biological invaders across species pools. Ecology, 95, 594-601. https://doi.org./10.1890/13-0465.1
Brunel, S., Branquart, E., Fried, G., Van Valkenburg, J., Brundu, G., Starfinger, U., Buholzer, S., Uludag, A., Joseffson, M., & Baker, R. (2010). The EPPO prioritization process for invasive alien plants. EPPO Bulletin, 40(3), 407-422. https://doi.org /10.1111/j.1365-2338.2010.02423.x
Burgman M., Roberts B., Sansford C., Griffin R., Mengersen K. (2014) The Role of Pest Risk Analysis in Plant Biosecurity. In: Gordh G., McKirdy S. (eds) The Handbook of Plant Biosecurity. Springer, Dordrecht. https://doi.org/10.1007/978-94-007-7365-3_9
Bulleri, F., & Chapman, M. G. (2010). The introduction of coastal infrastructure as a driver of change in marine environments. Journal of Applied Ecology, 47(1), 26-35. https://doi.org/10.1111/j.1365-2664.2009.01751.x
192
Bureau of Infrastructure Transport and Regional Economics. (2014). Containerised and non-containerised trade through Australian ports to 2032–33. Retrieved from Canberra: https://bitre.gov.au/publications/2014/files/report_138.pdf
Bureau of Meteorology, A. (2016). Weather and climate data. Retrieved from http://www.bom.gov.au/climate/data/
Butlin, J. (1989). Our common future. By World commission on environment and development. London, Oxford University Press. In: Wiley Online Library.
Burnham, K. P. and Anderson, D. R. (1998), Model selection and inference: a practical information-theoretic approach, Springer-Verlag, New York.
Burnham, K. P., & Anderson, D. R. (2004). Multimodel inference: understanding AIC and BIC in model selection. Sociological methods & research, 33(2), 261-304. https://doi.org/10.1177/0049124104268644
Caley P, Ingram R, De Barro P (2015) Entry of exotic insects into Australia: Does border interception count match incursion risk? Biological Invasions 17(4): 1087–1094. https://doi.org/10.1007/s10530-014-0777-z
Callan, S. K., Majer, J. D., Edwards, K., & Moro, D. (2011). Documenting the terrestrial invertebrate fauna of Barrow Island, Western Australia. Australian Journal of Entomology, 50(4), 323-343.https:// doi.org/10.1111/j.1440-6055.2011.00818.x
Cameron, A. C. and Trivedi, P. K. (2013). Regression analysis of count data, Cambridge University Press.
Campbell, J., Law, C., Durant, S., & Faunce, T. (2019). Biosecurity, Investor-State Dispute Settlement and Corporatogenic Climate Change: A Challenge for Australian Public Health Regulation and Human Rights. Global Biosecurity, 1(1). pp.82–90. https://doi.org/10.31646/gbio.1
Campbell, M. L. (2011). Assessing biosecurity risk associated with the importation of non-indigenous microalgae. Environmental research, 111(7), 989-998. https://doi.org/10.1016/j.envres.2011.02.004
Campbell, M. L., Leonard, K., Primo, C., & Hewitt, C. L. (2018). Marine biosecurity crisis decision-making: two tools to aid “go”/“no go” decision-making. Frontiers in Marine Science, 5, 331. | https://doi.org/10.3389/fmars.2018.00331
Carboneras, C., Genovesi, P., Vilà, M., Blackburn, T.M., Carrete, M., Clavero, M., D'hondt, B., Orueta, J.F., Gallardo, B., Geraldes, P. and González‐Moreno, P.,( 2018). A prioritised list of invasive alien species to assist the effective implementation of EU legislation. Journal of Applied Ecology, 55(2), pp.539-547. https://doi.org/10.1111/1365-2664.12997
Carlton, J. T. (2001). Introduced species in US coastal waters. Pew Oceans Commission, Arlington, Virginia 28pp.
Carnegie, A. J., & Nahrung, H. F. (2019). Post-Border Forest Biosecurity in Australia: Response to Recent Exotic Detections, Current Surveillance and Ongoing Needs. Forests, 10(4), 336. https://doi.org/10.3390/f10040336
Case, T. J., Bolger, D. T., & Petren, K. (1994). Invasions and competitive displacement among house geckos in the tropical Pacific. Ecology, 75(2), 464-477. https://doi.org/10.2307/1939550
193
Cassey, P., Delean, S., Lockwood, J. L., Sadowski, J. and Blackburn, T. M. (2018), “Dissecting the null model for biological invasions: A meta-analysis of the propagule pressure effect,” PLoS Biology, 16. https://doi.org/10.1371/journal.pbio.2005987
Caton B.P., Dobbs T.T., Brodel C.F. (2006) Arrivals of hitchhiking insect pests on international cargo aircraft at Miami International Airport. Biological Invasions 8:765-785. https://doi.org/10.1007/s10530-005-3736-x
Cerasoli, F., Iannella, M., D’Alessandro, P., & Biondi, M. (2017). Comparing pseudo-absences generation techniques in Boosted Regression Trees models for conservation purposes: A case study on amphibians in a protected area. PLoS One, 12(11), e0187589 https://doi.org/10.1371/journal.pone.0187589.
Cervo, R., Zacchi, F., & Turillazzi, S. (2000). Polistes dominulus (Hymenoptera, Vespidae) invading North America: some hypotheses for its rapid spread. Insectes Sociaux, 47(2), 155-157. https://doi.org/10.1007/PL00001694
Chan, F. T., & Briski, E. (2017). An overview of recent research in marine biological invasions. Marine biology, 164(6), 121. https://doi.org/10.1007/s00227-017-3155-4.
Chavent, M., Kuentz, V., Liquet, B. ı., & Saracco, L. (2011). ClustOfVar: an R package for the clustering of variables. arXiv preprint arXiv:1112.0295.
Chen, J., Choudhary, A., Feldman, S., Hendrickson, B., Johnson, C.R., Mount, R., Sarkar, V., White, V. and Williams, D., (2013). Synergistic challenges in data-intensive science and exascale computing: DOE ASCAC data subcommittee report.
Chevron Australia. (2005). Draft Environmental Impact Statement/Environmental Review and Management Programme for the Proposed Gorgon Development: Main Report. Perth, Western Australia.
Chevron Australia (2006). Final environmental impact statement/response to submissions on the environmental review and management programme for the proposed Gorgon development. https://www.epa.wa.gov.au/sites/default/files/ Proponent_response_to_submissions/A1496_R1221_ERMP_RTS_May%202006.pdf
Chevron Australia Pty Ltd. (2014a). Barrow Island Quarantine: Terrestrial and Marine Quarantine Management System. Perth, Australia
Chevron Australia Pty Ltd. (2014b). Gorgon Gas development fourth train expansion proposal public environmental review / draft environmental impact statement. Perth, Western Australia
Chevron Australia Pty Ltd. (2009). Gorgon Gas Development and Jansz Feed Gas Pipeline Long-term Marine Turtle Management Plan. Chevron Australia.
Chevron Australia Pty Ltd. (2010). Barrow Island Quarantine: Terrestrial and Marine Quarantine Management System, Revision 3.
Chevron Australia Pty Ltd. (2015). Barrow Island: Beyond Best Practice. Perth, Western Australia: Retrieved from https://www.chevron.com/-/media/chevron/shared/documents/BarrowIslandQuarantineCaseStudy.pdf
Chevron Australia Pty Ltd. (2016). Gorgon Project Milestones. Retrieved from https://www.chevronaustralia.com/our-businesses/gorgon/project-milestones
Chevron Australia (2017a) Gorgon Gas Development and Jansz Feed Gas Pipeline Environmental Performance Report 2017. Chevron, Perth, Western Australia. https://australia.chevron.com/-/media/australia/our-businesses/documents/gorgon-emp-coastal-and-marine-environmental-report-gps-and-sc.pdf
194
Chevron Australia. (2017b). Gorgon Gas Development and Jansz Feed Gas Pipeline, Terrestrial and Marine Quarantine Management System. Retrieved from Perth, Australia: https://australia.chevron.com/-/media/australia/our-businesses/documents/ terrestrial-and-marine-quarantine-management-system.pdf
Chown, S. L., Ad, H. L. H., Niek, J. M. G., Lee, J. E., Terauds, A., Crosbie, K., Frenot, Y., Hughes, K. A., Imura, S., Kiefer, K., Lebouvier, M., Raymond, B., Tsujimoto, M., Ware, C., Bart Van de, V., & Bergstrom, D. M. (2012). Continent-wide risk assessment for the establishment of nonindigenous species in Antarctica. Proceedings of the National Academy of Sciences of the United States of America, 109(13), 4938-4943. https://doi.org/10.1073/pnas.1119787109
Christy, M. (2017). Consultation Draft. National Incursion Prevention and Response Strategy for Potentially Invasive Animals (2017-2022). PestSmart Toolkit publication, Invasive Animals Cooperative Research Centre, Canberra, Australia.
Clapperton, B. K., Maddigan, F., Chinn, W., & Murphy, E. C. (2019). Diet, population structure and breeding of Rattus rattus L. in South Island beech forest. New Zealand Journal of Ecology, 43(2), 1-8. https://dx.doi.org/10.20417/nzjecol.43.22
Clarke, K. R., Gorley, R., Somerfield, P. J., & Warwick, R. (2014). Change in marine communities: an approach to statistical analysis and interpretation: Primer-E Ltd.
Clarke, K. R., Tweedley, J. R., & Valesini, F. J. (2014). Simple shade plots aid better long-term choices of data pre-treatment in multivariate assemblage studies. Journal of the Marine Biological Association of the United Kingdom, 94(01), 1-16. https://doi.org/10.1017/S0025315413001227
Clarke S, Hollings T, Liu N, Hood G, Robinson A (2017) Biosecurity risk factors presented by international vessels: a statistical analysis. Biological Invasions 19:2837-2850. https://doi.org/10.1007/s10530-017-1486-1
Colin, B., Clifford, S., Wu, P. P., Rathmanner, S., & Mengersen, K. (2017). Using Boosted Regression Trees and Remotely Sensed Data to Drive Decision-Making. Open Journal of Statistics, 7(5), 859-875. https://doi.org/10.4236/ojs.2017.75061
Colunga-Garcia, M., Haack, R. A., Magarey, R. D., & Borchert, D. M. (2013). Understanding trade pathways to target biosecurity surveillance. NeoBiota, 18, 103-118. https://doi.org/10.3897/neobiota.18.4019
Convention on Biological Diversity (2014 ). Global Biodiversity Outlook 4. A mid-term assessment of progress towards the implementation of the Strategic Plan for Biodiversity 2011-2020. Montreal: Secretariat of the Convention on Biological Diversity.
Cook, E. J., Payne, R., MacLeod, A., & Brown, S. (2016). Marine biosecurity: protecting indigenous marine species. Research Reports in Biodiversity Studies, 5, 1-14. https://doi.org/10.2147/RRBS.S63402
Cope, R. C., Ross, J. V., Wittmann, T. A., Watts, M. J., & Cassey, P. (2017). Predicting the risk of biological invasions using environmental similarity and transport network connectedness. Risk Analysis 39 (1) 35-53. https://doi.org/10.1111/risa.12870
Council of Australian Governments. (2012). Intergovernmental Agreement on Biosecurity Canberra. Canberra.
195
Courtois, P., Figuieres, C., Mulier, C., & Weill, J. (2018). A cost–benefit approach for prioritizing invasive species. Ecological Economics, 146; 607-620 . https://doi.org/620. 10.1016/j.ecolecon.2017.11.037
Coutts AD, Taylor MD (2004) A preliminary investigation of biosecurity risks associated with biofouling on merchant vessels in New Zealand. New Zealand Journal of Marine and Freshwater Research 38(2), 215-229. https://doi.org/10.1080/00288330.2004.9517232
Coutts, A. D., Taylor, M. D., & Hewitt, C. L. (2007). Novel method for assessing the en route survivorship of biofouling organisms on various vessel types. Marine Pollution Bulletin, 54(1), 97-100. http://dx.doi.org/10.1016/j.marpolbul.2007.01.015
Craik, W., Palmer, D., & Sheldrake, R. (2017). Priorities for Australia’s Biosecurity System–An Independent Review of the Capacity of the National Biosecurity System and its Underpinning Intergovernmental Agreement.’. Commonwealth of Australia: Canberra, ACT.
D’Antonio, C., Stahlheber, K., & Molinari, N. (2011). Grasses and forbs: Berkeley: University of California Press.
De'Ath, G. (2007). Boosted trees for ecological modeling and prediction. Ecology, 88(1), 243-251. https://doi.org/10.1890/0012-9658(2007)88[243:btfema]2.0.co;2
De'ath, G., & Fabricius, K. E. (2000). Classification and regression trees: a powerful yet simple technique for ecological data analysis. Ecology, 81(11), 3178-3192. https://doi.org/10.1890/0012-9658(2000)081[3178:CARTAP]2.0.CO;2
Debeljak, M., Cortet, J., Demšar, D., Krogh, P. H., & Džeroski, S. (2007). Hierarchical classification of environmental factors and agricultural practices affecting soil fauna under cropping systems using Bt maize. Pedobiologia, 51(3), 229-238. https://doi.org/10.1016/j.pedobi.2007.04.009
Debeljak, M., & Džeroski, S. (2011). Decision trees in ecological modelling. In Modelling complex ecological dynamics (pp. 197-209): Springer. New York, United States.
Delignette-Muller, M. L., & Dutang, C. (2015). fitdistrplus: An R package for fitting distributions. Journal of Statistical Software, 64(4), 1-34. https://doi.org/10.18637/jss.v064.i04
Depaoli, S., Yang, Y., & Felt, J. (2017). Using Bayesian statistics to model uncertainty in mixture models: A sensitivity analysis of priors. Structural Equation Modeling: A Multidisciplinary Journal, 24(2), 198-215. https://doi.org/10.1080/10705511.2016.1250640
Department of Agriculture and Water Resources. (2018). Improving biosecurity surveillance analysis; The Agricultural Competiveness White Paper. Retrieved from http://www.agriculture.gov.au/SiteCollectionDocuments/biosecurity/improving-biosecurity-surveillance-analysis.pdf
Department of Environment and Conservation. (2011). Gorgon Gas Development. Threatened and Priority Species Translocation and Reintroduction Program. Annual Report 2010/2011. Perth, Western Australia.
Department of Environment and Conservation (2007) Management Plan for the Montebello/Barrow Islands Marine Conservation Reserves 2007-2017 Management Plan No 55. Department of Environment and Conservation, Perth, Western Australia
Department of Environment and Energy. (2018). Biodiversity; invasive species. Retrieved from http://www.environment.gov.au/biodiversity/invasive-species
196
Department of Parks and Wildlife. (2015). Barrow group nature reserves management plan 82. Retrieved from Perth, Western Australia: Department of Parks and Wildlife Western Australia. Barrow group nature reserves management plan 82. 57
Dexter, E., Rollwagen‐Bollens, G., & Bollens, S. M. (2018). The trouble with stress: A flexible method for the evaluation of nonmetric multidimensional scaling. Limnology and Oceanography: Methods, 16(7), 434-443. https://doi.org/10.1002/lom3.10257
Dodd, A., Spring, D., Schneider, K., Hafi, A., Fraser, H., & Kompas, T. (2017). Year 1 Report: Valuing Australia’s Biosecurity System. https://cebra.unimelb.edu.au/__data/assets/pdf_file/0006/2791770/CEBRA-Project-1607A-Year-1-FINAL-Report.pdf
Dodd, A. J., Burgman, M. A., McCarthy, M. A., & Ainsworth, N. (2015). The changing patterns of plant naturalization in Australia. Diversity and Distributions, 21(9), 1038-1050. https://doi.org/10.1111/ddi.12351
Dorazio, R. M., Gotelli, N. J., & Ellison, A. M. (2011). Modern methods of estimating biodiversity from presence-absence surveys. Biodiversity loss in a changing planet, 277-302. https://doi.org/10.5772/23881
Dudley, N. (2008). Guidelines for applying protected area management categories: International Union for Conservation of Nature (IUCN). Gland, Switzerland.
Duenas, M.-A., Ruffhead, H. J., Wakefield, N. H., Roberts, P. D., Hemming, D. J., & Diaz-Soltero, H. (2018). The role played by invasive species in interactions with endangered and threatened species in the United States: a systematic review. Biodiversity and Conservation, 27(12), 3171-3183. https://doi.org/10.1007/s10531-018-1595-x
Džeroski, S., & Drumm, D. (2003). Using regression trees to identify the habitat preference of the sea cucumber (Holothuria leucospilota) on Rarotonga, Cook Islands. Ecological Modelling, 170(2-3), 219-226. https://doi.org/ 10.1016/S0304-3800(03)00229-1
Elith, J., & Leathwick, J. (2017). Boosted Regression Trees for ecological modeling. R documentation. Available at https://cran. r-project.org/web/packages/ dismo/ vignettes/brt. pdf.
Elith, J., Leathwick, J. R., & Hastie, T. (2008). A working guide to boosted regression trees. Journal of Animal Ecology, 77(4), 802-813. https://doi.org/10.1111/j.1365-2656.2008.01390.x
Environmental Protection Act 1986 (WA) (Austl) Retrieved from https://www.legislation.wa.gov.au/legislation/statutes.nsf/main_mrtitle_304_homepage.html
Environment Protection and Biodiversity Conservation Act (1999) Environment Protection and Biodiversity Conservation Act. In: Department of Environment and Energy (ed) Commonwealth of Australia. Canberra. https://www.legislation.gov.au/Details/C2016C00777
Environmental Protection Authority. (2009). Gorgon Gas Development: Revised and Expanded Proposal: Barrow Island Reserve, Report 1323. Perth, Western Australia Retrieved from http://epa.wa.gov.au/epadoclib/2937_rep1323gorgonrevper30409.pdf.
Epanchin-Niell, R. S. (2017). Economics of invasive species policy and management. Biological Invasions, 19(11), 3333-3354. https://doi.org/10.1007/s10530-017-1406-4
197
Epanchin‐Niell, R. S., & Hastings, A. (2010). Controlling established invaders: integrating economics and spread dynamics to determine optimal management. Ecology Letters, 13(4), 528-541. https://doi.org/10.1111/j.1461-0248.2010.01440.x
Essl, F., Bacher, S., Blackburn, T. M., Booy, O., Brundu, G., Brunel, S., Cardoso, A.C., Eschen, R., Gallardo, B., & Galil, B. (2015). Crossing frontiers in tackling pathways of biological invasions. BioScience, 65(8), 769-782. https://doi.org/10.1093/biosci/biv082
Essl, F., Bacher, S., Genovesi, P., Hulme, P.E., Jeschke, J.M., Katsanevakis, S., Kowarik, I., Kühn, I., Pyšek, P., Rabitsch, W. and Schindler, S., (2018). Which taxa are alien? Criteria, applications, and uncertainties. BioScience, 68(7), 496-509. https://doi.org/10.1093/biosci/biy057
Essl, F., Nehring, S., Klingenstein, F., Milasowszky, N., Nowack, C., & Rabitsch, W. (2011). Review of risk assessment systems of IAS in Europe and introducing the German–Austrian Black List Information System (GABLIS). Journal for Nature Conservation, 19(6), 339-350. https://doi.org/ 10.1016/j.jnc.2011.08.005
Fahrig, L. (2013). Rethinking patch size and isolation effects: the habitat amount hypothesis. Journal of Biogeography, 40(9), 1649-1663. https://doi.org/10.1111/jbi.12130.
Faulkner, K. T., Robertson, M. P., Rouget, M., & Wilson, J. R. U. (2016). Understanding and managing the introduction pathways of alien taxa: South Africa as a case study. Biological Invasions, 18(1), 73-87. https://doi.org/10.1007/s10530-015-0990-4.
Floerl O., Inglis G., Dey K., Smith A. (2009) The importance of transport hubs in stepping‐stone invasions. Journal of Applied Ecology, 46 (1), 37-45. https://doi.org/10.1111/j.1365-2664.2008.01540.x
Foss, A. H., & Markatou, M. (2018). kamila: clustering mixed-type data in R and Hadoop. Journal of Statistical Software, 83(1), 1-44. https://doi.org/ 10.18637/jss.v083.i13
Foss, A. H., Markatou, M., & Ray, B. (2019). Distance metrics and clustering methods for mixed‐type data. International Statistical Review, 87(1), 80-109. https://doi.org/10.1111/insr.12274
Fox, D. (2010). Statistics and biosecurity: The'risk'and'results' perspectives of biosurveillance rely on maths, probability and statistics. Issues (90), 29. https://environmetrics.net/resources/documents-and-reports/
Foxcroft, L. C., Spear, D., van Wilgen, N. J., & McGeoch, M. A. (2019). Assessing the association between pathways of alien plant invaders and their impacts in protected areas. NeoBiota, 43, 1 - 25. https://doi.org/10.3897/neobiota.43.29644
Friedman, J. H., & Meulman, J. J. (2003). Multiple additive regression trees with application in epidemiology. Statistics in Medicine, 22(9), 1365-1381. https://doi.org/10.1002/sim.1501
Froeschke, J. T., & Froeschke, B. F. (2016). Two-stage boosted regression tree model to characterize Southern Flounder distribution in Texas estuaries at varying population sizes. Marine and Coastal Fisheries, 8(1), 222-231. https://doi.org/10.1080/19425120.2015.1079577
García-Díaz P, Ross JV, Vall-llosera M, Cassey P (2019) Low detectability of alien reptiles can lead to biosecurity management failure: a case study from Christmas Island (Australia). NeoBiota, 45: 75-92. https://doi.org/10.3897/neobiota.45.31009
198
Gareth, J., Daniela, W., Trevor, H., & Robert, T. (2017). An introduction to statistical learning: with applications in R: Springer. Springer-Verlag, New York.
Garson, G. D. (2012), Testing statistical assumptions. Asheboro, NC: Statistical Associates Publishing.
Geburzi J.C., McCarthy M.L. (2018) How Do They Do It? – Understanding the Success of Marine Invasive Species. In: Jungblut S., Liebich V., Bode M. (eds) YOUMARES 8 – Oceans Across Boundaries: Learning from each other. Springer, Springer-Verlag, New York. https://doi.org/10.1007/978-3-319-93284-2_8
Gelman, A., Carlin, J. B., Stern, H. S., Dunson, D. B., Vehtari, A., & Rubin, D. B. (2014). Bayesian data analysis: Chapman and Hall/CRC Press.
Genovesi, P., Carnevali, L., Alonzi, A., & Scalera, R. (2012). Alien mammals in Europe: updated numbers and trends, and assessment of the effects on biodiversity. Integrative zoology, 7(3), 247-253. https://doi.org/10.1111/j.1749-4877.2012.00309.x
Goldson, S. L., Barratt, B. I. P. and Armstrong, K. F. (2016), “Invertebrate Biosecurity Challenges in High-Productivity Grassland: The New Zealand Example,” Frontiers in Plant Science, 7. 1670. https://doi.org/10.3389/fpls.2016.01670
Gorgon Project: Port of Barrow Island - Quarantine information Guide, (2018). https://australia.chevron.com/-/media/australia/our-businesses/documents/barrow-island-port-information-manual.pdf
Government of Western Australia. (2007). Statement that a proposal may be implemented (pursuant to the Environmental Protection Act 1986). Gorgon Gas Development: Barrow Island Nature Reserve. Ministerial Environment Statement No. 748. State of Western Australia.
Government of Australia. (2009). Threat abatement plan to reduce the impacts of exotic rodents on biodiversity on Australian offshore Islands of less than 100 000 hectares (2009). Canberra, Australia.
Government of Western Australia. (2009). Statement that a Proposal may be Implemented- Gorgon gas Development Revised and Expanded Proposal: Barrow Island Nature Reserve (Ministerial Statement No. 800), 10 August 2009. Perth, Western Australia.
Gower, J. C. (1971). A general coefficient of similarity and some of its properties. Biometrics, 857-871.
Gruen, B., Leisch, F., Sarkar, D., Mortier, F., Picard, N. and Gruen, M. B. (2017), Package ‘flexmix’. https://cran.r-project.org/web/packages/flexmix/flexmix.pdf
Greve, M., Mathakutha, R., Steyn, C., & Chown, S. (2018). A review on the status of invasions on sub-Antarctic Marion and Prince Edward Islands. South African Journal of Botany, 115, 287. https://doi.org/ 10.1016/j.sajb.2018.02.044
Gu, H., Wang, J., Ma, L., Shang, Z., & Zhang, Q. (2019). Insights into the BRT (Boosted Regression Trees) method in the study of the climate-growth relationship of Masson pine in subtropical China. Forests, 10(3), 228. https://doi.org/10.3390/f10030228
Gunawardene, N. e., Majer, J. D. e., Harvey, M. S. e., & Western Australian, M. (2013). The terrestrial invertebrate fauna of Barrow Island, Western Australia: supplement (Vol. no. 83.). Perth: Western Australian Museum.
Harper, G. A., & Bunbury, N. (2015). Invasive rats on tropical islands: their population biology and impacts on native species. Global Ecology and Conservation, 3, 607-627. https://doi.org/10.1016/j.gecco.2015.02.010
199
Harradine, A. (1991). The impact of pampas grass as weeds in southern Australia. Plant Protection Quarterly, 6(3), 111-115.
Harris, D. B. (2009). Review of negative effects of introduced rodents on small mammals on islands. Biological Invasions, 11(7), 1611-1630. https://doi.org/10.1007/s10530-008-9393-0
Harris, R. (2005). Invasive ant risk assessment: Monomorium destructor. Series of unpublished Landcare Research contract reports to Biosecurity New Zealand. Landcare Research, Lincoln, New Zealand.
Hauser, C. E., Garrard, G. E., & Moore, J. L. (2015). Estimating detection rates and probabilities. Biosecurity surveillance: quantitative approaches. Queensland Univ. Technology, 151-166. https://www.cabi.org/environmentalimpact/ebook/20153099593
Hayes, K. R., McEnnulty, F., & Babcock, R. C. (2006). Review of Gorgon Gas Development Environmental Impact Statement and Environmental Review and Management Programme: CSIRO Marine and Atmospheric Research.
Hayes, K. R., & Sliwa, C. (2003). Identifying potential marine pests—a deductive approach applied to Australia. Marine Pollution Bulletin, 46(1), 91-98. https://doi.org/ 10.1016/S0025-326X(02)00321-1
Heller, J. (1982). Natural history of Theba pisana in Israel (Pulmonata: helicidae). Journal of Zoology, 196(4), 475-487. https://doi.org/10.1111/j.1469-7998.1982.tb03519.x
Hesler, L. S. (2010). Polistes dominula (Christ, 1791)(Hymenoptera: Vespidae: Polistinae) found in South Dakota, USA. Insecta Mundi, 145, 1-3.
Hess-Erga, O., Moreno-Andrés, J., Enger, Ø., & Vadstein, O. (2018). Microorganisms in ballast water: Disinfection, community dynamics, and implications for management. Science of the Total Environment. https://doi.org/10.1016/j.scitotenv.2018.12.004
Hewitt, C. L., & Campbell, M. L. (2007). Mechanisms for the prevention of marine bioinvasions for better biosecurity. Marine Pollution Bulletin, 55(7-9), 395-401.:https://doi.org/10.1016/j.marpolbul.2007.01.005
Hewitt C.L., Hayes K.R. (2002) Risk Assessment of Marine Biological Invasions. In: Leppäkoski E., Gollasch S., Olenin S. (eds) Invasive Aquatic Species of Europe. Distribution Impacts and Management. Springer, Dordrecht. https://doi.org/10.1007/978-94-015-9956-6_45
Hewitt, C. L., & Martin, R. B. (2001). Revised protocols for baseline port surveys for introduced marine species–design considerations, sampling protocols and taxonomic sufficiency. Centre for Research on Introduced Marine Pests Technical Report, (22).
Hijmans, R. J., Phillips, S., Leathwick, J., Elith, J., & Hijmans, M. R. J. (2017). Package ‘dismo’. Circles, 9(1).
Hilbe, J. M. (2011). Negative binomial regression: Cambridge University Press. United Kingdom.
Hinde, J., & Demétrio, C. G. (1998). Overdispersion: models and estimation. Computational Statistics & Data Analysis, 27(2), 151-170.
Hoekstra, R., Kiers, H. A. L. and Johnson, A. (2012), “Are Assumptions of Well-Known Statistical Techniques Checked, and Why (Not)?,” Frontiers in Psychology, 3, 137. https://doi.org/10.3389/fpsyg.2012.00137
200
Hoffmann, B. D., & Parr, C. L. (2008). An invasion revisited: the African big-headed ant (Pheidole megacephala) in northern Australia. Biological Invasions, 10(7), 1171-1181.https:// doi.org/:10.1007/s10530-007-9194-x
Horton, T., Kroh, A., Ahyong, S., Bailly, N., Boyko, C. B., Brandão, S. N., & Zhao, Z. (2019). World Register of Marine Species (WoRMS). WoRMS Editorial Board. Ostend, Belgium. http://www.marinespecies.org
Hoser, R. (2000). A revision of the Australasian pythons. Ophidia Review, 1(1), 7-27. Hoskin, C. J. (2011). The invasion and potential impact of the Asian House Gecko
(Hemidactylus frenatus) in Australia. Austral Ecology, 36(3), 240-251. https://doi.org/ 10.1111/j.1442-9993.2010.02143.x
Houliston, G. J., & Goeke, D. F. (2017). Cortaderia spp. in New Zealand: patterns of genetic variation in two widespread invasive species. New Zealand Journal of Ecology, 41(1), 107-112. https://doi.org//10.20417/nzjecol.41.13
Huang, Z. (1998). Extensions to the k-means algorithm for clustering large data sets with categorical values. Data mining and knowledge discovery, 2(3), 283-304. https://doi.org/10.1023/A:1009769707641
Hughes, K. A., & Convey, P. (2010). The protection of Antarctic terrestrial ecosystems from inter-and intra-continental transfer of non-indigenous species by human activities: a review of current systems and practices. Global Environmental Change, 20(1), 96-112.: https://doi.org/10.1016/j.gloenvcha.2009.09.005
Hughes, K. A., Convey, P., Pertierra, L. R., Vega, G. C., Aragón, P., & Olalla-Tárraga, M. Á. (2019). Human-mediated dispersal of terrestrial species between Antarctic biogeographic regions: A preliminary risk assessment. Journal of Environmental Management, 232, 73-89. https://doi.org/10.1016/j.jenvman.2018.10.095
Huiskes, A.H., Gremmen, N.J., Bergstrom, D.M., Frenot, Y., Hughes, K.A., Imura, S., Kiefer, K., Lebouvier, M., Lee, J.E., Tsujimoto, M. and Ware, C., (2014). Aliens in Antarctica: assessing transfer of plant propagules by human visitors to reduce invasion risk. Iological Conservation,171,278-284. https://doi.org/10.1016/j.biocon.2014.01.038
Hulme, P. E. (2006). Beyond control: wider implications for the management of biological invasions. Journal of Applied Ecology, 43(5), 835-847.
Hulme, P. E. (2009). Trade, transport, and trouble: managing invasive species pathways in an era of globalization. Journal of Applied Ecology, 46(1), 10-18. https://doi.org/10.1111/j.1365-2664.2008.01600.x
Hulme, P. E., Bacher, S., Kenis, M., Klotz, S., Kühn, I., Minchin, D., Nentwig, W., Olenin, S., Panov, V., & Pergl, J. (2008). Grasping at the routes of biological invasions: a framework for integrating pathways into policy. Journal of Applied Ecology, 45(2), 403-414. https://doi.org/10.1111/j.1365-2664.2007.01442.x
Hummel, M., Edelmann, D., & Kopp-Schneider, A. (2017). Clumix: Clustering and visualization of mixed-type data. URL: https://pdfs. semanticscholar. org/1e65/755051c4b749fac17a23ff93924157acacdd. pdf.
International Petroleum Industry Environmental Conservation Association. (2012). Quarantine management for the Barrow Island gas processing plant and oilfield. Retrieved from http://www.ipieca.org/resources/case-study/quarantine-management-for-the-barrow-island-gas-processing-plant-and-oilfield/
201
International Organization for Standardization. (1996). Environmental Management Systems Specification with Guidance for Use (Vol. 14001): International Organization for Standardization.
International Plant Protection Convention (IPCC) (2005), International Standards for Phytosanitary Measures. ISPM No. 23, Secretariat of the International Plant Protection Convention (IPPC). http://www.fao.org/3/a-j5062e.pdf
Jakeman, Y., El Sawah, S., Cuddy, S., Robson, B., McIntyre, N., & Cook, F. (2018). Queensland Water Modelling Network: Good Modelling Practice Principles. Canberra, Australia: Australian National University Retrieved from http://creativecommons.org/licenses/by/3.0/au/deed.en
Jarrad, F. C., Barrett, S., Murray, J., Parkes, J., Stoklosa, R., Mengersen, K., & Whittle, P. (2011). Improved design method for biosecurity surveillance and early detection of non-indigenous rats. New Zealand Journal of Ecology, 35(2).
Jarrad, F., Barrett, S., Murray, J., Stoklosa, R., Whittle, P., & Mengersen, K. (2011). Ecological aspects of biosecurity surveillance design for the detection of multiple invasive animal species. Biological Invasions, 13(4), 803-818. https://doi.org/10.1007/s10530-010-9870-0
Jarrad, F., Low-Choy, S., & Mengersen, K. (2015). Biosecurity surveillance: quantitative approaches: Centre for Agriculture and Bioscience International (CABI), Wallingford, United Kingdom.
Jarrad, F., Whittle, P., Barrett, S., & Mengersen, K. (2010). Barrow Island's biosecurity: catching the unknown invader. Significance, 7(2), 53-57. https://doi.org/10.1111/j.1740-9713.2010.00418.x
Jeggo, M. (2012). The Australian perspective, the biosecurity continuum from preborder, to border and postborder. Paper presented at the Improving Food Safety Through a One Health Approach: Workshop Summary. https://www.ncbi.nlm.nih.gov/books/NBK114489/
Jenkins DA, Mizell III RF, Van Bloem S, et al. (2014) An analysis of arthropod interceptions by APHIS-PPQ and customs and border protection in Puerto Rico. American Entomologist, 60:44-57.
Jeschke, J.M., Bacher, S., Blackburn, T.M., Dick, J.T., Essl, F., Evans, T., Gaertner, M., Hulme, P.E., Kühn, I., Mrugała, A. and Pergl, J., (2014). Defining the impact of non‐native species. Conservation Biology, 28(5), 1188-1194. https://doi.org/10.1111/cobi.12299
Joseph, L. N., Elkin, C., Martin, T. G., & Possingham, H. P. (2009). Modeling abundance using N‐mixture models: the importance of considering ecological mechanisms. Ecological Applications, 19(3), 631-642. https://doi.org/10.1890/07-2107.1
Kass, R. E., Carlin, B. P., Gelman, A., & Neal, R. M. (1998). Markov chain Monte Carlo in practice: a roundtable discussion. The American Statistician, 52(2), 93-100.
Katsanevakis, S., Wallentinus, I., Zenetos, A., Leppäkoski, E., Çinar, M. E., Oztürk, B., Grabowski, M., Golani, D., & Cardoso, A. C. (2014). Impacts of invasive alien marine species on ecosystem services and biodiversity: a pan-European review. Aquatic Invasions, 9(4), 391-423. https://dx.doi.org/10.3391/ai.2014.9.4.01
Keim, L. (2002). Spatial distribution of the introduced Asian House Gecko across suburban/forest edges. Honours dissertation, University of Queensland., Brisbane.
202
Kenis, M., Rabitsch, W., Auger-Rozenberg, M. A., & Roques, A. (2007). How can alien species inventories and interception data help us prevent insect invasions? Bulletin of Entomological Research, 97(5), 489-502. https://doi.org/10.1017/S0007485307005184.
Kier, G., Kreft, H., Lee, T.M., Jetz, W., Ibisch, P.L., Nowicki, C., Mutke, J. and Barthlott, W., (2009.) A global assessment of endemism and species richness across island and mainland regions. Proceedings of the National Academy of Sciences, 106(23), pp.9322-9327. https://doi.org/10.1073/pnas.0810306106
Kiritani, K., & Yamamura, K. (2003). Exotic insects and their pathways for invasion. Invasive species: vectors and management strategies. Island Press, Washington, 44-67.
Kleemann, S. G., Chauhan, B. S., & Gill, G. S. (2007). Factors affecting seed germination of perennial wall rocket (Diplotaxis tenuifolia) in Southern Australia. Weed Science, 55(5), 481-485. https://doi.org/10.1614/WS-06-197.1
Kokla, M., & Guilbert, E. (2020). A Review of Geospatial Semantic Information Modeling and Elicitation Approaches. ISPRS International Journal of Geo-Information, 9(3), 146.
Kossmeier, M., Tran, U. S., & Voracek, M. (2020). Charting the landscape of graphical displays for meta-analysis and systematic reviews: a comprehensive review, taxonomy, and feature analysis. BMC Medical Research Methodology, 20(1), 26. https://doi.org/10.1186/s12874-020-0911-9
Kuhn, M., & Johnson, K. (2013). Applied predictive modeling (Vol. 26): Springer-Verlag, New York.
Kumschick, S., Bacher, S., Dawson, W., Heikkilä, J., Sendek, A., Pluess, T., Robinson, T., & Kühn, I. (2012). A conceptual framework for prioritization of invasive alien species for management according to their impact. NeoBiota, 15, 69-100. https://doi.org/10.3897/neobiota.15.3323
Kumschick, S., & Richardson, D. M. (2013). Species-based risk assessments for biological invasions: advances and challenges. Diversity and Distributions, 19(9), 1095-1105. https://doi.org/10.1111/ddi.12110
Lach, L., & Barker, G. (2013). Assessing the Effectiveness of Tramp ant Projects to Reduce Impacts on Biodiversity. Australian Government. Department of Sustainability, Environment, Water, Population, and Communities.
Lagdon, R., & Moro, D. (2013). The Gorgon gas development and its environmental commitments. Records of the Western Australian Museum, 9, 011.
Lambert, D. (1992). Zero-Inflated Poisson Regression, with an Application to Defects in Manufacturing. Technometrics, 34(1), 1-14. https://doi.org/10.1080/00401706.1992.10485228.
Lambrinos, J. G. (2000). The impact of the invasive alien grass Cortaderia jubata (Lemoine) Stapf on an endangered mediterranean‐type shrubland in California. Diversity and Distributions, 6(5), 217-231. https://doi.org/10.1046/j.1472-4642.2000.00086.x
Lane S.E., Gao R., Chisholm M., Robinson A.P. (2017) Statistical profiling to predict the biosecurity risk presented by non-compliant international passengers. arXiv preprint arXiv:1702.04044.
203
Lavers, J. L., Hutton, I., & Bond, A. L. (2019). Changes in technology and imperfect detection of nest contents impedes reliable estimates of population trends in burrowing seabirds. Global Ecology and Conservation, 17, https://doi.org/10.1016/j.gecco.2019.e00579
Leathwick, J., Elith, J., Francis, M., Hastie, T., & Taylor, P. (2006). Variation in demersal fish species richness in the oceans surrounding New Zealand: an analysis using boosted regression trees. Marine Ecology Progress Series, 321, 267-281. https://doi.org/10.3354/meps321267
Lee, G., Kim, W., Oh, H., Youn, B. D., & Kim, N. H. (2019). Review of statistical model calibration and validation—from the perspective of uncertainty structures. Structural and Multidisciplinary Optimization, 1-26. https://doi.org/10.1007/s00158-019-02270-2
Lee, J.-H., Han, G., Fulp, W., & Giuliano, A. (2012). Analysis of overdispersed count data: application to the Human Papillomavirus Infection in Men (HIM) Study. Epidemiology and Infection, 140(06), 1087-1094. https://doi.org/10.1017/S095026881100166X
Lee S-W, Song D-W, Ducruet C. (2008) A tale of Asia’s world ports: the spatial evolution in global hub port cities. Geoforum, 39 (1), 372-385. https://doi.org/10.1016/j.geoforum.2007.07.010
Lehan, N. E., Murphy, J. R., Thorburn, L. P., & Bradley, B. A. (2013). Accidental introductions are an important source of invasive plants in the continental United States. American Journal of Botany, 100(7), 1287-1293. http://dx.doi.org/10.3732/ajb.1300061
Leventhal, B. (2010). An introduction to data mining and other techniques for advanced analytics. Journal of Direct Data Digital Marketing Practice ;12, 137–153. https://doi.org/10.1057/dddmp.2010.35
Levine, J. M., & D'antonio, C. M. (2003). Forecasting biological invasions with increasing international trade. Conservation Biology, 17(1), 322-326. https://doi.org/10.1046/j.1523-1739.2003.02038.x
Li, T., Li, Y., & Li, B. (2017). Reinforcement learning based novel adaptive learning framework for smart grid prediction. Mathematical Problems in Engineering, 2017. https://doi.org/10.1155/2017/8192368
Liebert, A. E., Gamboa, G. J., Stamp, N. E., Curtis, T. R., Monnet, K. M., Turillazzi, S., & Starks, P. T. (2006). Genetics, behaviour, and ecology of a paper wasp invasion: Polistes dominulus in North America. Paper presented at the Annales Zoologici Fennici. http://www.sekj.org/anz/anz4356.htm#595
Liebhold A.M., Work T.T., McCullough D.G., Cavey J.F. (2006) Airline baggage as a pathway for alien insect species invading the United States. American Entomologist 52 (1), 48-54. https://doi.org/10.1093/ae/52.1.48
Lockwood J.L., Cassey P., Blackburn T.M. (2009) The more you introduce the more you get: the role of colonization pressure and propagule pressure in invasion ecology. Diversity and Distributions, 15:904-910. https://doi.org/10.1111/j.1472-4642.2009.00594.x
Lodge, D.M., Simonin, P.W., Burgiel, S.W., Keller, R.P., Bossenbroek, J.M., Jerde, C.L., Kramer, A.M., Rutherford, E.S., Barnes, M.A., Wittmann, M.E. and Chadderton, W.L., (2016). Risk analysis and bioeconomics of invasive species to inform policy
204
and management. Annual Review of Environment and Resources, 41. https://doi.org/10.1146/annurev-environ-110615-085532
Lodge, D.M., Williams, S., MacIsaac, H.J., Hayes, K.R., Leung, B., Reichard, S., Mack, R.N., Moyle, P.B., Smith, M., Andow, D.A. and Carlton, J.T.,( 2006). Biological invasions: recommendations for US policy and management. Ecological Applications, 16(6), pp.2035-2054. https://doi.org/10.1890/1051-0761(2006)016[2035:BIRFUP]2.0.CO;2
Lott M., Rose K. (2016) Emerging threats to biosecurity in Australasia: the need for an integrated management strategy. Pacific Conservation Biology 22 (2), 182-188. https://doi.org/10.1071/PC15040
Lovett, G.M., Weiss, M., Liebhold, A.M., Holmes, T.P., Leung, B., Lambert, K.F., Orwig, D.A., Campbell, F.T., Rosenthal, J., McCullough, D.G. and Wildova, R., (2016.) Nonnative forest insects and pathogens in the United States: Impacts and policy options. Ecological Applications, 26(5), pp.1437-1455. https://doi.org/10.1890/15-1176
Lynch, A. J., Beeton, R. J., & Greenslad, P. (2019). The conservation significance of the biota of Barrow Island, Western Australia. Journal of the Royal Society of Western Australia, 102, 98-133.
Mack, R. N., Simberloff, D., Mark Lonsdale, W., Evans, H., Clout, M. and Bazzaz, F. A. (2000), “Biotic invasions: causes, epidemiology, global consequences, and control,” Ecological Applications, 10, 689-710. https://doi.org/10.1890/1051-0761(2000)010[0689:BICEGC]2.0.CO;2
Maczey, N., Edgington, S., Moore, D., & Haye, T. (2016). Biology and host range testing of Triarthria setipennis and Ocytata pallipes (Diptera: Tachinidae) for the control of the European earwig (Forficula auricularia). Biocontrol Science and Technology, 26(4), 447-461. https://doi.org/10.1080/09583157.2015.1123675
Majer, J. D. (1985). Recolonization by ants of rehabilitated mineral sand mines on North Stradbroke Island, Queensland, with particular reference to seed removal. Australian Journal of Ecology, 10(1), 31-48. https://doi.org/10.1111/j.1442-9993.1985.tb00861.x
Majer, J. D., Callan, S. K., Edwards, K., Gunawardene, N. R., & Taylor, C. K. (2013). Baseline survey of the terrestrial invertebrate fauna of Barrow Island. Records of the Western Australian Museum Supplement, 83, 13-112. https://doi.org/10.18195/issn.0313-122x.83.2013.013-112
Majer, J., Gunawardene, N., Taylor, C., & Harvey, M. (2013). The terrestrial invertebrate fauna of Barrow Island, Western Australia: Western Australian Museum. Perth. ISBN: 978-1-920843-05-2
Makarov, S.E., Bodner, M., Reineke, D., Vujisić, L.V., Todosijević, M.M., Antić, D.Ž., Vagalinski, B., Lučić, L.R., Mitić, B.M., Mitov, P. & Anđelković, B.D. (2017). Chemical ecology of cave-dwelling millipedes: defensive secretions of the Typhloiulini (Diplopoda, Julida, Julidae). Journal of Chemical Ecology, 43(4), 317-326. https://doi.org/10.1007/s10886-017-0832-1
Mao, J.-J., & Norval, G. (2014). Hemidactylus frenatus (Asian House Gecko). Herpetological Review, 45(2), 328. Retrieved from http://hdl.handle.net/10500/19135
205
Marchese, C. (2015). Biodiversity hotspots: a shortcut for a more complicated concept. In. Global Ecology and Conservation, 3, 297e309. https://doi.org/10.1016/j.gecco.2014.12.008
Maritime Lloyds Register. (2015). Understanding ballast water management Guidance for shipowners and operators. Retrieved from https://www.lr.org/en-au/ballast-water-management/
Martín‐Queller, E., Albert, C. H., Dumas, P. J., & Saatkamp, A. (2017). Islands, mainland, and terrestrial fragments: How isolation shapes plant diversity. Ecology and Evolution, 7(17), 6904-6917. https://doi.org/10.1002/ece3.3150
Matthews, J., Beringen, R., Creemers, R., Hollander, H.D., Kessel, N.V., Kleef, H.V., Koppel, S., Lemaire, A., Odé, B., Verbrugge, L.N. and Hendriks, A.J., (2017). A (2017). A new approach to horizon-scanning: identifying potentially invasive alien species and their introduction pathways. Management of Biological Invasions (2017) Volume 8, Issue 1: 37–52. https://doi.org/10.3391/mbi.2017.8.1.04.
Mattiske Consulting Pty Ltd. (1997). 1996 Assessment of Revegetation on Seismic Lines, Barrow Island. West Australian Petroleum Pty Ltd., Perth, Western Australia.
McCreless, E.E., Huff, D.D., Croll, D.A., Tershy, B.R., Spatz, D.R., Holmes, N.D., Butchart, S.H. and Wilcox, C., (2016). Past and estimated future impact of invasive alien mammals on insular threatened vertebrate populations. Nature Communications, 7(1), pp.1-11. https://doi.org/10.1038/ncomms12488
McCulloch, C. E., & Neuhaus, J. M. (2014). Generalized linear mixed models: Wiley StatsRef: Statistics Reference Online. https://doi.org/10.1002/9781118445112.stat07540
McCulloch, C. E., & Neuhaus, J. M. (2014). Generalized linear mixed models. Wiley StatsRef: Statistics Reference Online.
McCullough DG, Work TT, Cavey JF, Liebhold AM, Marshall D (2006). Interceptions of nonindigenous plant pests at US ports of entry and border crossings over a 17-year period. Biological Invasions, 8(4), 611-630. https://doi.org/10.1007/s10530-005-1798-4
McDonald, J. I., Bridgwood, S., & Hourston, M. (2015). Likelihood of marine pest introduction to the Indian Ocean territories. Fisheries Report No. 264. (1921845856). Department of Fisheries Retrieved from www.fish.wa.gov.au
McGeoch, M. A., Genovesi, P., Bellingham, P. J., Costello, M. J., McGrannachan, C., & Sheppard, A. (2016). Prioritizing species, pathways, and sites to achieve conservation targets for biological invasion. Biological Invasions, 18(2), 299-314. https://doi.org/10.1007/s10530-015-1013-1
McKirdy, S. J., O’Connor, S., Thomas, M. L., Horton, K. L., Williams, A., Hardie, D., Coupland G.T., van der Merwe, J. (2019). Biosecurity risks posed by a large sea-going passenger vessel: challenges of terrestrial arthropod species detection and eradication. Scientific Reports, 9(1), 1-14. https://doi.org/10.1038/s41598-019-55554-4
McKirdy, S., Sharma, S., & Bayliss, K. (2014). Quarantine and biosecurity. In: Van Alfen, N.K., (ed.) Encyclopedia of Agriculture and Food Systems. Academic Press, London, UK, pp. 11-20. https://researchrepository.murdoch.edu.au/id/eprint/32337
206
McLachlan, G. J., Lee, S. X., & Rathnayake, S. I. (2019). Finite mixture models. Annual review of Statistics and its Application, 6, 355-378. https://doi.org/10.1146/annurev-statistics-031017-100325
McNeill, M., Phillips, C., Young, S., Shah, F., Aalders, L., Bell, N., Gerard, E. and Littlejohn, R., (2011). Transportation of nonindigenous species via soil on international aircraft passengers’ footwear. Biological Invasions, 13(12), 2799-2815. https://doi.org/10.1007/s10530-011-9964-3
McParland, D., & Gormley, I. C. (2017). clustmd: Model based clustering for mixed data. R package version, 1(1), 12.
Meissner, H., Lemay, A., Bertone, C., Schwartzburg, K., Ferguson, L., & Newton, L. (2009). Evaluation of pathways for exotic plant pest movement into and within the greater Caribbean region. USDA, USA.
Melnykov, V., & Maitra, R. (2010). Finite mixture models and model-based clustering. Statistics Surveys, 4, 80-116. https://doi.org/10.1214/09-SS053
Mengersen, K. L., Robert, C., & Titterington, M. (2011). Mixtures: estimation and applications (Vol. 896): John Wiley & Sons.
Meurisse N., Rassati D., Hurley B.P., Brockerhoff E.G., Haack R.A. (2018) Common pathways by which non-native forest insects move internationally and domestically. Journal of Pest Science:1-15. https://doi.org/10.1007/s10340-018-0990-0
Miljkovic, T. and Grün, B. (2016), “Modeling loss data using mixtures of distributions,” Insurance; Mathematics and Economics, 70, 387-396. https://doi.org/10.1016/j.insmatheco.2016.06.019
Mohebbi, M., Wolfe, R. and Forbes, A. (2014), “Disease mapping and regression with count data in the presence of overdispersion and spatial autocorrelation: a Bayesian model averaging approach,” International Journal of Environmental Research and Public Health, 11, 883-902. https://doi.org/10.3390/ijerph110100883
Mohri, M., & Roark, B. (2005). Structural zeros versus sampling zeros. Oregon Health & Science University, Portland, OR, USA.
Mokhatab, S., Mak, J., Valappil, J., & Wood, J. (2014). LNG fundamentals. Handbook of liquefied natural gas, 1, 1-106. https://doi.org/10.1016/B978-0-12-404585-9.00001-5
Moon, M., & Lee, S.-K. (2017). Applying of Decision Tree Analysis to Risk Factors Associated with Pressure Ulcers in Long-Term Care Facilities. Healthcare Informatics Research, 23(1), 43-52. https://doi.org/10.4258/hir.2017.23.1.43
Moore, J. L., Rout, T. M., Hauser, C. E., Moro, D., Jones, M., Wilcox, C., & Possingham, H. P. (2010). Protecting islands from pest invasion: optimal allocation of biosecurity resources between quarantine and surveillance. Biological Conservation, 143(5), 1068-1078 .https://doi.org/10.1016/j.biocon.2010.01.019
Moro, D., Ball, D., & Bryant, S. (2018). Australian island arks: conservation, management, and opportunities: CSIRO PUBLISHING, Canberra, Australia.
Moro, D., & Lagdon, R. (2013). History and Environment of Barrow Island. Supplements of the Western Australia Museum, 83 Part 1, 001 -008.
Moro, D., & MacAulay, I. (2010). A guide to the mammals of Barrow Island. In: Chevron Australia Pty Ltd, Perth, Western Australia. https://australia.chevron.com/-/media/australia/publications/documents/nature-book-mammals.pdf
207
Moro, D., van der Merwe, J., Thomas, M., Smith, A., & Lagdon, R. (2018). Integrating resource development with island conservation: Barrow Island as a model for conservation and development. Australian Island Arks: Conservation, Management and Opportunities, pp 131- 146.
Morris, K. (2002). The eradication of the black rat (Rattus rattus) on Barrow and adjacent islands off the north-west coast of Western Australia. Turning the tide: the eradication of invasive species, 27, 219-225. http://issg.org/database/species/reference_files/ratrat/Morris.pdf
Moser, D., Lenzner, B., Weigelt, P., Dawson, W., Kreft, H., Pergl, J., Pyšek, P., van Kleunen, M., Winter, M., & Capinha, C. (2018). Remoteness promotes biological invasions on islands worldwide. Proceedings of the National Academy of Sciences, 115(37), 9270-9275. https://doi.org/10.1073/pnas.1804179115
Murray J, Whittle P, Jarrad F, Barrett S., Stoklosa R, Mengersen K. (2015) Design of a Surveillance System for Non-indigenous Species on Barrow Island: Plants Case. Biosecurity Surveillance: Quantitative Approaches, (6), 203.
Myers, N., Mittermeier, R. A., Mittermeier, C. G., Da Fonseca, G. A., & Kent, J. (2000). Biodiversity hotspots for conservation priorities. Nature, 403(6772), 853-858. https://doi.org/10.1038/35002501
Nairn, M. E., Allen, P. G., Inglis, A. R., & Tanner, C. (1996). Australian Quarantine: a shared responsibility. Canberra: Department of Primary Industries and Energy.
Nasserinejad, K., van Rosmalen, J., de Kort, W., & Lesaffre, E. (2017). Comparison of criteria for choosing the number of classes in Bayesian finite mixture models. PLoS One, 12(1). https://doi.org/10.1371/journal.pone.0168838
National Invasive Species Council. (2005). Five-Year Review of Executive Order 13112 on Invasive Species. Washington DC: Office of the Secretary (OS/SIO/NISC).
National Research Council (US). (2002). Predicting invasions of nonindigenous plants and plant pests: Immigration: Predicting the Mode and Pathways of Introduction. National Academies Press, Washington D.C.
Nentwig, W., Bacher, S., Kumschick, S., Pyšek, P., & Vilà, M. (2018). More than “100 worst” alien species in Europe. Biological Invasions, 20(6), 1611-1621. https://doi.org/10.1007/s10530-018-1671-x.
Newman, J., Poirot, C., Roper-Gee, R., Leihy, R. I., & Chown, S. L. (2018). A decade of invertebrate colonization pressure on Scott Base in the Ross Sea region. Biological Invasions, 20(9), 2623-2633. https://doi.org/10.1007/s10530-018-1722-3
Nghiem, L. T., Soliman, T., Yeo, D. C., Tan, H. T., Evans, T. A., Mumford, J. D., Keller, R. P., Baker, R. H., Corlett, R. T., & Carrasco, L. R. (2013). Economic and environmental impacts of harmful non-indigenous species in Southeast Asia. PLoS One, 8(8). https://doi.org/10.1371/journal.pone.0071255
Nickerson, J., & Barbara, K. (2009). Crazy ant: scientific name: Paratrechina longicornis (Latreille)(Insecta: Hymenoptera: Formicidae). Featured Creatures: University of Florida Institute of Food and Agricultural Sciences.
Nisbet, R., Elder, J., & Miner, G. (2009). Handbook of statistical analysis and data mining applications. Academic Press. Elder Research, Inc., Charlottesville, VA https://doi.org/10.1016/B978-0-12-374765-5.X0001-0
208
NOBANIS. (2015 ). Invasive Alien Species: pathway analysis and horizon scanning for countries in Northern Europe. Copenhagen: Nordic Council of Ministers.
Odendaal, L. J., Haupt, T. M., & Griffiths, C. L. (2008). The alien invasive land snail Theba pisana in the West Coast National Park: Is there cause for concern? Koedoe, 50(1), 93-98. https://doi.org/10.4102/koedoe.v50i1.153
Ogris, N., & Jurc, M. (2010). Sanitary felling of Norway spruce due to spruce bark beetles in Slovenia: A model and projections for various climate change scenarios. Ecological Modelling, 221(2), 290-302. https://doi.org/10.1016/j.ecolmodel.2009.05.015
Ojaveer, H., Galil, B. S., Campbell, M. L., Carlton, J. T., Canning-Clode, J., Cook, E. J., Davidson, A. D., Hewitt, C. L., Jelmert, A., & Marchini, A. (2015). Classification of non-indigenous species based on their impacts: considerations for application in marine management. PLoS Biology, 13(4). https://doi.org/10.1371/journal.pbio.1002130
Ojaveer, H., Galil, B. S., Carlton, J. T., Alleway, H., Goulletquer, P., Lehtiniemi, M., Marchini, A., Miller, W., Occhipinti-Ambrogi, A., & Peharda, M. (2018). Historical baselines in marine bioinvasions: Implications for policy and management. PLoS One, 13(8). https://doi.org/10.1371/journal.pone.0202383
Ord, K. (2012). The Illusion of predictability: A call to action. International Journal of Forecasting, Forthcoming. 28 (3) https:/doi.org/10.1016/j.ijforecast.2012.02.005
Orpet, R. J., Crowder, D. W., & Jones, V. P. (2019). Biology and Management of European Earwig in Orchards and Vineyards. Journal of Integrated Pest Management, 10(1). https://doi.org/10.1093/jipm/pmz019.
Padayachee, A. L., Procheş, Ş., & Wilson, J. R. (2019). Prioritising potential incursions for contingency planning: pathways, species, and sites in Durban (eThekwini), South Africa as an example. NeoBiota, 47, 1-21. https://doi.org/10.3897/neobiota.47.31959
Paini, D. R., & Yemshanov, D. (2012). Modelling the arrival of invasive organisms via the international marine shipping network: a Khapra beetle study. PLoS One, 7(9). https://doi.org/10.1371/journal.pone.0044589
Park, B.-J. and Lord, D. (2009), “Application of finite mixture models for vehicle crash data analysis,” Accident Analysis and Prevention, 41, 683-691. https://doi.org/10.1016/j.aap.2009.03.007
Paoletti, M.G., Osler, G.H., Kinnear, A., Black, D.G., Thomson, L.J., Tsitsilas, A., Sharley, D., Judd, S., Neville, P. and D’Inca, A. (2007). Detritivores as indicators of landscape stress and soil degradation. Australian Journal of Experimental Agriculture, 47(4), 412-423. https://doi.org/10.1071/EA05297
Parsons, W. T., Parsons, W. T., & Cuthbertson, E. (2001). Noxious weeds of Australia: Commonwealth Scientific Industrial and Scientific Organisation (CSIRO) Publishing, Canberra, Australia.
Pearce, J., & Ferrier, S. (2000). Evaluating the predictive performance of habitat models developed using logistic regression. Ecological Modelling, 133(3), 225-245. http://dx.doi.org/10.1016/S0304-3800(00)00322-7
Pearce, F., Peeler, E. and Stebbing, P. (2012) Modelling the risk of the introduction and spread of non-indigenous species in the UK and Ireland. CEFAS, Report No.E5405W: 70.
209
Pergl, J., Pyšek, P., Bacher, S., Essl, F., Genovesi, P., Harrower, C.A., Hulme, P.E., Jeschke, J.M., Kenis, M., Kühn, I. and Perglová, I. (2017). Troubling travellers: are ecologically harmful alien species associated with particular introduction pathways? NeoBiota, 32, 1-20. https://doi.org/10.3897/neobiota.32.10199
Plenderleith, T. L., Smith, K. L., Donnellan, S. C., Reina, R. D., & Chapple, D. G. (2015). Human-assisted invasions of Pacific Islands by Litoria frogs: a case study of the bleating tree frog on Lord Howe Island. PLoS One, 10(5). https://doi.org/10.1371/journal.pone.0126287.
Poland, T. M., & Rassati, D. (2019). Improved biosecurity surveillance of non-native forest insects: a review of current methods. Journal of Pest Science, 92(1), 37- 49. https://doi.org/10.1007/s10340-018-1004-y
Probert, A. F., Ward, D. F., Beggs, J. R., Lin, S. L., & Stanley, M. C. (2020). Conceptual Risk Framework: Integrating Ecological Risk of Introduced Species with Recipient Ecosystems. BioScience, 70(1), 71-79. https://doi.org/10.1093/biosci/biz131
Pyšek, P., Jarošík, V., & Pergl, J. (2011). Alien plants introduced by different pathways differ in invasion success: unintentional introductions as a threat to natural areas. PLoS One, 6(9). https://doi.org/10.1371/journal.pone.0024890
Pyšek, P., & Richardson, D. M. (2010). Invasive species, environmental change and management, and health. Annual Review of Environment and Resources, 35, 25-55. https://www.annualreviews.org/doi/abs/10.1146/annurev-environ-033009-095548
Quinn, G. P., & Keough, M. J. (2002). Experimental design and data analysis for biologists. New York; Cambridge, U.K; Cambridge University Press.
R Core Team. (2018). “R: A language and environment for statistical computing,” R Foundation for Statistical Computing. Vienna, Austria. Retrieved April 12, 2018 (http://www.R-project.org/)
Rajagopal, S., Venugopalan, V., Van der Velde, G., & Jenner, H. (2006). Greening of the coasts: a review of the Perna viridis success story. Aquatic Ecology, 40(3), 273-297. https://doi.org/10.1007/s10452-006-9032-8
Ramey, J. (2012). clusteval: Evaluation of clustering algorithms. available at https://CRAN. R-project. org/package= clusteval, 666.
Ramsey, D.S., Barclay, C., Campbell, C.D., Dewar, E., MacDonald, A.J., Modave, E., Quasim, S. and Sarre, S.D., (2018). Detecting rare carnivores using scats: Implications for monitoring a fox incursion into Tasmania. Ecology and Evolution, 8(1), pp.732-743. https://doi.org/10.1002/ece3.3694
Rand, W. M. (1971). Objective criteria for the evaluation of clustering methods. Journal of the American Statistical association, 66(336), 846-850. https://doi.org/10.1080/01621459.1971.10482356
Raykov, Y. P., Boukouvalas, A., Baig, F., & Little, M. A. (2016). What to do when K-means clustering fails: a simple yet principled alternative algorithm. PLoS One, 11(9). https://doi.org/10.1371/journal.pone.0162259
Reaser, J. K., Burgiel, S. W., Kirkey, J., Brantley, K. A., Veatch, S. D., & Burgos-Rodríguez, J. (2020). The early detection of and rapid response (EDRR) to invasive species: a conceptual framework and federal capacities assessment. Biological Invasions, 22(1), 1-19. https://doi.org/10.1007/s10530-019-02156-w
210
Ricciardi, A., Hoopes, M. F., Marchetti, M. P., & Lockwood, J. L. (2013). Progress toward understanding the ecological impacts of non-native species. Ecological Monographs, 83(3), 263-282. https://doi.org/10.1890/13-0183.1
Richardson DM (ed). (2011). Fifty years of invasion ecology: the legacy of Charles Elton. Wiley, Chichester.
Ridgeway, G. (2007). Generalized Boosted Models: A guide to the gbm package. Update, 1(1), 2007.
Ridgeway, G. (2017). gbm: Generalized Boosted Regression Models. R package version 2.1. 1. 2015. URL: https://CRAN. R-project. org/package= gbm.
Riera, L., Ramalhosa, P., Canning-Clode, J., & Gestoso, I. (2018). Variability in the settlement of non-indigenous species in benthic communities from an oceanic island. Helgoland Marine Research, 72(1), 15. https://doi.org/10.1186/s10152-018-0517-3
Roets, F., Benadé, P. C., Samways, M. J., & Veldtman, R. (2019). Better colony performance, not natural enemy release, explains numerical dominance of the exotic Polistes dominula wasp over a native congener in South Africa. Biological Invasions, 21(3), 925-933. https://doi.org/10.1007/s10530-018-1870-5
Rodrıguez, G. (2013). Models for count data with overdispersion. Princeton University. Retrieved November 16, 2018 https://data.princeton.edu/wws509/notes/c4a.pdf
Rojas‐Sandoval, J., Tremblay, R. L., Acevedo‐Rodríguez, P., & Díaz‐Soltero, H. (2017). Invasive plant species in the West Indies: geographical, ecological, and floristic insights. Ecology and Evolution, 7(13), 4522-4533. https://doi.org/10.1002/ece3.2984
Rout, T. M., Moore, J. L., Possingham, H. P., & McCarthy, M. A. (2011). Allocating biosecurity resources between preventing, detecting, and eradicating island invasions. Ecological Economics, 71, 54-62. https://doi.org /10.1016/j.ecolecon.2011.09.009
Rowley, J. J., & Callaghan, C. T. (2020). The FrogID dataset: expert-validated occurrence records of Australia’s frogs collected by citizen scientists. ZooKeys, 912, 139. https://doi.org/ 10.3897/zookeys.912.38253
Roy, H. E., Peyton, J., Aldridge, D. C., Bantock, T., Blackburn, T. M., Britton, R., Clark, P., Cook, E., Dehnen-Schmutz, K., Dines, T., Dobson, M., Edwards, F., Harrower, C., Harvey, M. C., Minchin, D., Noble, D. G., Parrott, D., Pocock, M. J. O., Preston, C. D., Roy, S., Salisbury, A., Schönrogge, K., Sewell, J., Shaw, R. H., Stebbing, P., Stewart, A. J. A., & Walker, K. J. (2014). Horizon scanning for invasive alien species with the potential to threaten biodiversity in Great Britain. Global Change Biology, 20(12), 3859-3871. https://doi.org/10.1111/gcb.12603
Royle, J. A., & Nichols, J. D. (2003). Estimating abundance from repeated presence–absence data or point counts. Ecology, 84(3), 777-790. https://doi.org/10.1890/0012-9658(2003)084[0777:EAFRPA]2.0.CO;2
Ruiz, G. (2013). Geographic variation in marine invasions among large estuaries: effects of ships and time. Ecological Applications, 23(2), 311-320. https://doi.org/10.1890/11-1660.1
Ruiz, G. M., Hines, A. H., & Grosholz, E. D. (1999). Non‐indigenous species as stressors in estuarine and marine communities: assessing invasion impacts and interactions. Limnology and oceanography, 44, 950-972. https://doi.org/10.4319/lo.1999.44.3_part_2.0950
211
Rumlerová, Z., Vilà, M., Pergl, J., Nentwig, W., & Pyšek, P. (2016). Scoring environmental and socioeconomic impacts of alien plants invasive in Europe. Biological Invasions, 18(12), 3697-3711. https://doi.org/10.1007/s10530-016-1259-2
Russell, J. C., Beaven, B. M., MacKay, J. W., Towns, D. R., & Clout, M. N. (2008). Testing island biosecurity systems for invasive rats. Wildlife Research, 35(3), 215-221. http://dx.doi.org/10.1071/WR07032
Russell, J. C., & Holmes, N. D. (2015). Tropical island conservation: rat eradication for species recovery. Biological Conservation, 185, 1-7. https://doi.org/10.1016/j.biocon.2015.01.009
Russell, J. C., Meyer, J.-Y., Holmes, N. D., & Pagad, S. (2017). Invasive alien species on islands: impacts, distribution, interactions, and management. Environmental Conservation, 44(4), 359-370. https://doi.org/10.1017/S0376892917000297
Saccaggi, D. L., Karsten, M., Robertson, M. P., Kumschick, S., Somers, M. J., Wilson, J. R., & Terblanche, J. S. (2016). Methods and approaches for the management of arthropod border incursions. Biological Invasions, 18(4), 1057-1075. https://doi.org/10.1007/s10530-016-1085-6
Saul, W.C., Roy, H.E., Booy, O., Carnevali, L., Chen, H.J., Genovesi, P., Harrower, C.A., Hulme, P.E., Pagad, S., Pergl, J. and Jeschke, J.M., (2017). Assessing patterns in introduction pathways of alien species by linking major invasion data bases. Journal of Applied Ecology, 54(2), 657-669. https://doi.org/10.1111/1365-2664.12819
Scherl, L. M. (2004). Can protected areas contribute to poverty reduction?: Opportunities and limitations: International Union of Conservation of Nature. Gland, Switzerland
Schlaepfer, M. A. (2018). Do non-native species contribute to biodiversity? PLoS Biology, 16(4), e2005568. https://doi.org/10.1371/journal.pbio.2005568
Scollnik, D. P. (2018). Bayesian analysis of a quarantine inspection model. Journal of Applied Statistics, 45(8), 1484-1496. https://doi.org/10.1080/02664763.2017.1380785
Scott, J. K., McKirdy, S. J., Merwe, J. V. D., Green, R., Burbidge, A. A., Pickles, G., Hardie, D. C., Morris, K., Kendrick, P. G., Thomas, M. L., Horton, K. L., O'Connor, S. M., Downs, J., Stoklosa, R., Lagdon, R., Marks, B., Nairn, M., & Mengersen, K. (2017). Zero-tolerance biosecurity protects high-conservation-value island nature reserve. Scientific Reports, 7(1), [772].https://doi.org/10.1038/s41598-017-00450-y
Sequeira, R., & Griffin, R. (2014). The biosecurity continuum and trade: pre-border operations. In The handbook of plant biosecurity (pp. 119-148): Springer Publishing, Manhattan, New York City.
Sheikh, A. A., Rehman, N., & Kumar, R. (2017). Diverse adaptations in insects: A Review. Journal of Entomology and Zoology Studies., 5(2), 343-350. Corpus ID: 55130400
Shabani, F., Kumar, L., & Ahmadi, M. (2018). Assessing Accuracy Methods of Species Distribution Models: AUC, Specificity, Sensitivity, and the True Skill Statistic. Global Journal of Human-Social Science Research. Online ISSN: 2249-460x
Sharma, S., McKirdy, S., & Macbeth, F. (2014). The Biosecurity Continuum and Trade: Tools for Post-border Biosecurity. In The Handbook of Plant Biosecurity (pp. 189-206): Springer Publishing, Manhattan, New York City.
Shipley, B. (2016). Cause and correlation in biology: a user's guide to path analysis, structural equations, and causal inference with R: Cambridge University Press.
212
Shmueli, G. and Burkom, H. (2010), “Statistical challenges facing early outbreak detection in biosurveillance,” Technometrics, 52(1), 39-51. https://doi.org/10.1198/TECH.2010.06134
Simberloff, D. (2009). The role of propagule pressure in biological invasions. Annual Review of Ecology, Evolution, and Systematics, 40, 81-102. https://doi.org/10.1146/annurev.ecolsys.110308.120304
Simberloff, D., Martin, J.-L., Genovesi, P., Maris, V., Wardle, D. A., Aronson, J., Courchamp, F., Galil, B., García-Berthou, E., Pascal, M., Pyšek, P., Sousa, R., Tabacchi, E., Vilà, M., & Sveriges, l. (2013). Impacts of biological invasions: What's what and the way forward. Trends in Ecology and Evolution, 28(1), 58-66. https://doi.org/10.1016/j.tree.2012.07.013
Simberloff, D., & Rejmánek, M. (2011). Encyclopedia of biological invasions (Vol. 1). University of California Press, Berkeley.
Simpson, T. J., Smale, D. A., McDonald, J. I., & Wernberg, T. (2017). Large scale variability in the structure of sessile invertebrate assemblages in artificial habitats reveals the importance of local-scale processes. Journal of Experimental Marine Biology and Ecology, 494, 10-19. https://doi.org/10.1016/j.jembe.2017.05.003
Simpson, M., & Srinivasan, V. (2014). Australia’s biosecurity future: preparing for future biological challenges. Canberra: CSIRO, 56.
Somaweera, R., Yeoh, P. B., Jucker, T., Clarke, R. H., & Webber, B. L. (2020). Historical context, current status and management priorities for introduced Asian house geckos at Ashmore Reef, north-western Australia. BioInvasions Records, 9(2), 408-420. https://doi.org/10.3391/bir.2020.9.2.27
Song, J., Wang, H. & Song, M.J., (2020). Package ‘Ckmeans.1d.dp’. Retrieved from https://cran.rproject.org/web/packages/Ckmeans.1d.dp/Ckmeans.1d.dp.pdf
Spade, D. A. (2020). Markov chain Monte Carlo methods: Theory and practice. Handbook of Statistics Volume 43.in Principles and Methods for Data Science Edited by Arni S.R. Srinivasa Rao, C.R. Rao. https://doi.org/10.1016/bs.host.2019.06.001
Springborn, M. R. (2014). Risk aversion and adaptive management: Insights from a multi-armed bandit model of invasive species risk. Journal of Environmental Economics and Management, 68(2), 226-242. https:/doi.org/ 10.1016/j.jeem.2014.05.004
Srisakrapikoop, U. (2016). Foraging behaviour and food preference of Singapore ant Trichomyrmex destructor (Jerdon, 1851). Chulalongkorn University, Thailand.
Stace, H. (Ed.). (2012). The biology and agronomy of Stylosanthes. Elsevier. Stanković, S., Dimkić, I., Vujisić, L., Pavković-Lučić, S., Jovanović, Z., Stević, T., Sofrenić,
I., Mitić, B. and Tomić, V., (2016). Chemical defence in a millipede: evaluation and characterization of antimicrobial activity of the defensive secretion from Pachyiulus hungaricus (Karsch, 1881)(Diplopoda, Julida, Julidae). PLoS One, 11(12), https://doi.org/10.1371/journal.pone.0167249
Stasinopoulos, M. D., Rigby, R. A., Heller, G. Z., Voudouris, V., and De Bastiani, F. (2017). Flexible regression and smoothing: using GAMLSS in R: Chapman and Hall/CRC.
St Clair, J. J. (2011). The impacts of invasive rodents on island invertebrates. Biological Conservation, 144(1), 68-81. https://doi.org/10.1016/j.biocon.2010.10.006
213
Steidl, R. J., Hayes, J. P., & Schauber, E. (1997). Statistical Power Analysis in Wildlife Research. The Journal of Wildlife Management, 61(2), 270-279. https://doi.org/10.2307/3802582
Stoklosa, R. (2005). How-to guide for conducting risk-based assessments of quarantine threats to Barrow Island. Technical Appendix D2. 31. Perth, Western Australia.
Stoklosa, R. T. (2004). Application of engineering risk management to protect the conservation values of Barrow Island from invasion by non-indigenous species. Paper presented at the Engineers Australia 2004 RISK Conference, Melbourne, Victoria, Australia.
Sturtz, S., Ligges, U. and Gelman, A. (2005), “R2WinBUGS: a package for running WinBUGS from R,” Journal of Statistical Software, 12, 1-16. https://doi.org/10.18637/jss.v012.i03
Suhr EL, O'Dowd DJ, Suarez AV, Cassey P, Wittmann TA, Ross JV, Cope RC (2019) Ant interceptions reveal roles of transport and commodity in identifying biosecurity risk pathways into Australia. NeoBiota 53: https://doi.org/10.3897/neobiota.53.39463
Szepannek, G. (2018). clustMixType: User-friendly clustering of mixed-type data in R. The R Journal, 10(2), 200-208.
Taylor, S. (2017). Impacts of climatic and oceanic processes on the threatened terrestrial vertebrates of the Pacific region. GeoResJ, 13, 1-8. https://doi.org/10.1016/j.grj.2016.12.001
Therneau, T., Atkinson, B., Ripley, B., & Ripley, M. B. (2018). Package ‘rpart’. Available online: cran. ma. ic. ac. uk/web/packages/rpart/rpart. pdf (accessed on 20 April 2016).
Thresher, R. E. & Kuris, A. M. (2004), “Options for managing invasive marine species,” Biological Invasions, 6, 295-300. https://doi.org/10.1023/B:BINV.0000034598.28718.2e
Toral-Granda, M. V., Causton, C. E., Jäger, H., Trueman, M., Izurieta, J. C., Araujo, E., Cruz, M., Zander, K. K., Izurieta, A., & Garnett, S. T. (2017). Alien species pathways to the Galapagos Islands, Ecuador. PLoS One, 12(9) https://doi.org/10.1371/journal.pone.0184379
Toy, S., & Newfield, M. (2010). The accidental introduction of invasive animals as hitchhikers through inanimate pathways: a New Zealand perspective. Revue scientifique et technique (International Office of Epizootics), 29(1), 123-133. https://doi.org/ 10.20506/rst.29.1.1970.
Triska, M. D., & Renton, M. (2018). Do an invasive organism's dispersal characteristics affect how we should search for it? Royal Society open science, 5(3), 171784. https://doi.org/10.1098/rsos.171784
Turbelin, A. J., Malamud, B. D., & Francis, R. A. (2017). Mapping the global state of invasive alien species: patterns of invasion and policy responses. Global Ecology and Biogeography, 26(1), 78-92. https://doi.org/10.1111/geb.12517
Turner, R., & Neal, B. (2017). How well does your sampler really work? arXiv preprint arXiv:1712.06006.
Turner, R., Plank, M. J., Brockerhoff, E., Pawson, S., Liebhold, A., & James, A. (2020). Considering unseen arrivals in predictions of establishment risk based on border biosecurity interceptions. Ecological Applications. https:/doi.org/10.1002/eap.2194
214
United Nations. (2006). Plan of Implementation of the World Summit on Sustainable Development. https://www.un.org/esa/sustdev/documents/WSSD_POI_PD/English/ WSSD_PlanImpl.pdf
Van Rooij, P., Martel, A., Haesebrouck, F., & Pasmans, F. (2015). Amphibian chytridiomycosis: a review with focus on fungus-host interactions. Veterinary Research, 46(1), 1-22. https://doi.org/10.1186/s13567-015-0266-0
van de Velden, M., Iodice D'Enza, A., & Markos, A. (2019). Distance‐based clustering of mixed data. Wiley Interdisciplinary Reviews: Computational Statistics, 11(3). https://doi.org/10.1002/wics.1456
Venables, W. N. and Dichmont, C. M. (2004), “GLMs, GAMs and GLMMs: an overview of theory for applications in fisheries research,” Fisheries Research, 70, 319-337. https://doi.org/10.1016/j.fishres.2004.08.011
Venables, W. N. and Ripley, B. D. (2013), Modern applied statistics with S-PLUS. Springer Science and Business Media, New York: Springer-Verlag.
Verbrugge L.N.H,, Van Der Velde G., Hendriks A.J., Verreycken H. & Leuven R.S.E.W. (2012). Risk classification of aquatic non‐native species: application of contemporary European assessment protocols in different biogeographical settings. Aquatic Invasion 7,49–58. https://doi.org/ 10.3391/ai.2012.7.1.006
Verna, D., Rueb, R. R., Gantz, C. A., Gala, J., Green, J., & Zalusky, J. A. (2018). A decision tree analysis of nonindigenous species risk from ballast water to the lower Columbia River and Oregon coast, USA. Management of Biological Sciences, 9(3), 309. https://doi.org/10.3391/mbi.2018.9.3.13
Veron, S., Mouchet, M., Govaerts, R., Haevermans, T., & Pellens, R. (2019). Vulnerability to climate change of islands worldwide and its impact on the tree of life. Scientific Reports, 9(1), 1-14. https://doi.org/10.1038/s41598-019-51107-x
Wang, C., & Wang, J. (2011). Spatial pattern of the global shipping network and its hub-and-spoke system. Research in Transportation Economics, 32(1), 54-63. https://doi.org/10.1016/j.retrec.2011.06.010
Wasowicz, P. (2014). Identifying and ascribing the relative significance of introduction pathways for non-native plants into Iceland. In Environmental & Socio-economic Studies (Vol. 2, pp. 28). https://doi.org/ 10.1515/environ-2015-0047
Warton, D. I. (2005), “Many zeros does not mean zero inflation: comparing the goodness‐of‐fit of parametric models to multivariate abundance data,” Environmetrics, 16, 275-289. https://doi.org/ 10.1002/env.702
Webber, B., Yeoh, P., & Scott, J. (2014). Invasive Passiflora foetida in the Kimberley and Pilbara: understanding the threat and exploring solutions. Phase 1 final report. In: CSIRO Australia). Available at https://library. dbca. wa. gov. au/static.
Webber, B., Yeoh, P., & Somaweera, R. (2018). Climatic limits, spatio-temporal range, and reproductive output of stinking passionflower (Passiflora foetida). Northern Australia Environmental Resources (NAER) Hub website at nespnorthern.edu.au
Weigelt, P., & Kreft, H. (2013). Quantifying island isolation–insights from global patterns of insular plant species richness. Ecography, 36(4), 417-429. https://doi.org/10.1111/j.1600-0587.2012.07669.x
Weihs, C., Ligges, U., Luebke, K., & Raabe, N. (2005). klaR analyzing German business cycles. In Data analysis and decision support (pp. 335-343): Springer, New York.
215
Wells, F. E. (2017). If the Asian green mussel, Perna viridis (Linnaeus, 1758), poses the greatest invasive marine species threat to Australia, why has it not invaded? Molluscan Research, 37(3), 167-174. ttps://doi.org/10.1080/13235818.2017.1322676
Werschkun, B., Banerji, S., Basurko, O. C., David, M., Fuhr, F., Gollasch, S., Grummt, T., Haarich, M., Jha, A. N., Kacan, S., Kehrer, A., Linders, J., Mesbahi, E., Pughiuc, D., Richardson, S. D., Schwarz-Schulz, B., Shah, A., Theobald, N., von Gunten, U., Wieck, S., & Höfer, T. (2014). Emerging risks from ballast water treatment: The run-up to the International Ballast Water Management Convention. Chemosphere, 112, 256-266. https://doi.org/10.1016/j.chemosphere.2014.03.135
Wetterer, J. K. (2007). Biology and impacts of Pacific Island invasive species. 3. The African big-headed ant, Pheidole megacephala (Hymenoptera: Formicidae). Pacific Science, 61(4), 437-456. https://doi.org/10.2984/1534-6188(2007)61[437:BAIOPI]2.0.CO;2
Wetterer, J. K. (2008). Worldwide spread of the longhorn crazy ant, Paratrechina longicornis (Hymenoptera: Formicidae). Myrmecological News, 11, 137-149.
Wetterer, J. K., Wood, L. D., Johnson, C., Krahe, H., & Fitchett, S. (2014). Predaceous ants, beach replenishment, and nest placement by sea turtles. Environmental Entomology, 36(5), 1084-1091. https://doi.org/10.1603/0046-225X(2007)36[1084:PABRAN]2.0.CO;2
Whittle, P., Jarrad, F., & Mengersen, K. (2013). Design of the quarantine surveillance for non-indigenous species of invertebrates on Barrow Island. Records of the Western Australian Museum, Supplement, 83, 113-130. https://doi.org/10.18195/issn.0313-122x.83.2013.113-130
Whittle, P., Stoklosa, R., Barrett, S., Jarrad, F. C., Majer, J. D., Martin, P. A. J., Mengersen, K., & Burgman, M. (2013). A method for designing complex biosecurity surveillance systems: detecting non‐indigenous species of invertebrates on Barrow Island. Diversity and Distributions, 19(5-6), 629-639. https://doi.org/10.1111/ddi.12056
Williams, B. K., & Brown, E. D. (2014). Adaptive management: from more talk to real action. Environmental Management, 53(2), 465-479. https://doi.org/10.1007/s00267-013-0205-7
Wills, B. D., Moreau, C. S., Wray, B. D., Hoffmann, B. D., & Suarez, A. V. (2014). Body size variation and caste ratios in geographically distinct populations of the invasive big-headed ant, Pheidole megacephala (Hymenoptera: Formicidae). Biological Journal of the Linnean Society, 113(2), 423-438. https://doi.org/10.1111/bij.12386
Wintle, B., & Burgman, M. (2015). Expert Elicitation for Barrow Island Surveillance System Revision, Project Report. Melbourne, Victoria
Witmer, G. W., Boyd, F., & Hillis-Starr, Z. (2007). The successful eradication of introduced roof rats (Rattus rattus) from Buck Island using diphacinone, followed by an irruption of house mice (Mus musculus). Wildlife Research, 34(2), 108-115. https://digitalcommons.unl.edu/icwdm_usdanwrc/674
Wood, S. N. (2017). Generalized additive models: an introduction with R: Chapman and Hall/ CRC Press.
Wyse, S. V., & Dickie, J. B. (2018). Taxonomic affinity, habitat and seed mass strongly predict seed desiccation response: a boosted regression trees analysis based on 17 539 species. Annals of Botany, 121(1), 71-83. https://doi.org/10.1093/aob/mcx128.
216
Yang, S. (2014). A comparison of different methods of zero-inflated data analysis and its application in health surveys: Journal of modern applied statistical methods: JMASM 16(1):518-543. https://doi.org/10.22237/jmasm/1493598600
Young, D., Benaglia, T., Chauveau, D., Hunter, D., Elmore, R., Hettmansperger, T., Thomas, H., Xuan, F. and Young, M. D. (2017), “Package ‘mixtools’, for R. Tools for analysing finite mixture models. Lexington, KY, University of Kentucky. R-CRAN. https://cran.r-project.org/web/packages/mixtools/mixtools.pdf.
Zabin, C., Davidson, I., Holzer, K., Smith, G., Ashton, G., Tamburri, M., & Ruiz, G. (2018). How will vessels be inspected to meet emerging biofouling regulations for the prevention of marine invasions? Management of Biological Invasions, 9(3), 195-208. https://doi.org/10.3391/mbi.2018.9.3.03
Zack, R. S., Strenge, D., Landolt, P. J., & Looney, C. (2010). European earwig, Forficula auricularia L.(Dermaptera: Forficulidae), at the Hanford Reach National Monument, Washington State. Western North American Naturalist, 441-445. http://dx.doi.org/10.3398/064.070.0403
Zellner, A., Keuzenkamp, H. A., & McAleer, M. (Eds.). (2001). Simplicity, inference and modelling: keeping it sophisticatedly simple. Cambridge University Press, United Kingdom.
Zeileis, A., Kleiber, C., & Jackman, S. (2008). Regression models for count data in R. Journal of Statistical Software, 27(8), 1-25. http://dx.doi.org/10.18637/jss.v027.i08
Zhang, D. (2008), “Analysis of longitudinal data from epidemiologic studies,” Statistics short-course presented at the University of Michigan, Graduate Summer Session in Epidemiology, Ann Arbor, MI, 136. Retrieved September 27, 2018 https://www4.stat.ncsu.edu/~dzhang2/epid766/syllabus.pdf
Zhang, H., & Huang, Y. (2015). Finite mixture models and their applications: a review. Austin Biometrics and Biostatistics, 2(1), 1-6.
Zhou, B., Tu, T., Kong, F., Wen, J., & Xu, X. (2018). Revised phylogeny and historical biogeography of the cosmopolitan aquatic plant genus Typha (Typhaceae). Scientific Reports, 8(1), 8813. https://doi.org/10.1038/s41598-018-27279-3
Zuur, A. (2009). Ieno E.N., Walker N.J., Saveliev A.A., & Smith G.M. (2009). Mixed effects models and extensions in ecology with R. Springer-Verlag, New York.
Zuur, A., Ieno, E. N., and Smith, G. M. (2007). Analyzing ecological data. Springer Science and Business Media, Springer-Verlag, New York.
Zuur, A., Ieno, E. N., Walker, N. J., Saveliev, A. A., & Smith, G. M. (2009). Zero-truncated and zero-inflated models for count data. In Mixed effects models and extensions in ecology with R (pp. 261-293): Springer-Verlag, New York.