economic impacts of natural hazards on vulnerable
TRANSCRIPT
Economic Impacts of Natural Hazards on Vulnerable
Populations in Fiji, Papua New Guinea, Samoa, Solomon Islands,
Tonga, and Vanuatu

2
Conclusions 4.1. Hazard, Exposure, And Vulnerability 4.2. Coping Mechanisms 4.2.1. Adaptive Social Protection 4.2.2. Financial Inclusion 4.2.3. Insurance 4.2.4 Migration 4.2.5 Remittance 4.2.6 Resttlement 4.2.7 Community Suport Annex : Background and Methodology
References
List of abbreviations
Executive summary
Hazard and exposure 1.1. Overview 1.2. Fiji 1.3. Papua New Guinea 1.4. Samoa 1.5. Solomon Islands 1.6. Tonga 1.7. Vanuatu
Vulnerability And Impacts 2.1. EconomicProfile 2.2. Agriculture and Fisheries 2.3. Commerce and Industry 2.4. Tourism 2.5. Housing and Settlements 2.6. Low-income and Informal Workers 2.7. Gender 2.8. Youth
Coping mechanisms 3.1. Types Of Coping Mechanisms 3.2. Adaptive Social Protection 3.3. Financial Inclusion 3.4. Insurance 3.5. Migration 3.6. Remittance 3.7. Resettlement of Communities at Risk 3.8 Community-based Support
Contents
1
2
3
4
ii
1
779
1418212529
353538465156616682
91919399
106112118124129
135135137138140143145147149152
154
156
i
3
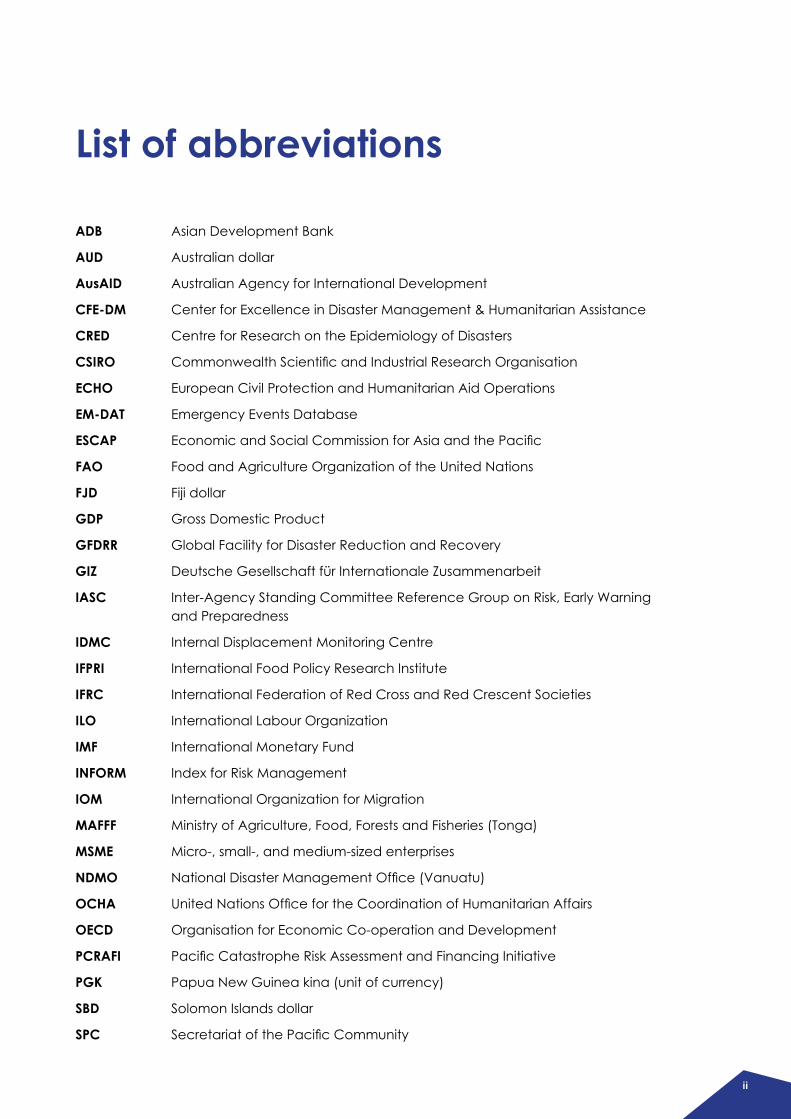
List of abbreviations
ADB Asian Development Bank
AUD Australian dollar
AusAID Australian Agency for International Development
CFE-DM Center for Excellence in Disaster Management & Humanitarian Assistance
CRED Centre for Research on the Epidemiology of Disasters
CSIRO CommonwealthScientificandIndustrialResearchOrganisation
ECHO European Civil Protection and Humanitarian Aid Operations
EM-DAT Emergency Events Database
ESCAP EconomicandSocialCommissionforAsiaandthePacific
FAO Food and Agriculture Organization of the United Nations
FJD Fiji dollar
GDP Gross Domestic Product
GFDRR Global Facility for Disaster Reduction and Recovery
GIZ Deutsche Gesellschaft für Internationale Zusammenarbeit
IASC Inter-Agency Standing Committee Reference Group on Risk, Early Warning and Preparedness
IDMC Internal Displacement Monitoring Centre
IFPRI International Food Policy Research Institute
IFRC International Federation of Red Cross and Red Crescent Societies
ILO International Labour Organization
IMF International Monetary Fund
INFORM Index for Risk Management
IOM International Organization for Migration
MAFFF Ministry of Agriculture, Food, Forests and Fisheries (Tonga)
MSME Micro-, small-, and medium-sized enterprises
NDMO NationalDisasterManagementOffice(Vanuatu)
OCHA UnitedNationsOfficefortheCoordinationofHumanitarianAffairs
OECD Organisation for Economic Co-operation and Development
PCRAFI PacificCatastropheRiskAssessmentandFinancingInitiative
PGK Papua New Guinea kina (unit of currency)
SBD Solomon Islands dollar
SPC SecretariatofthePacificCommunity
ii
4
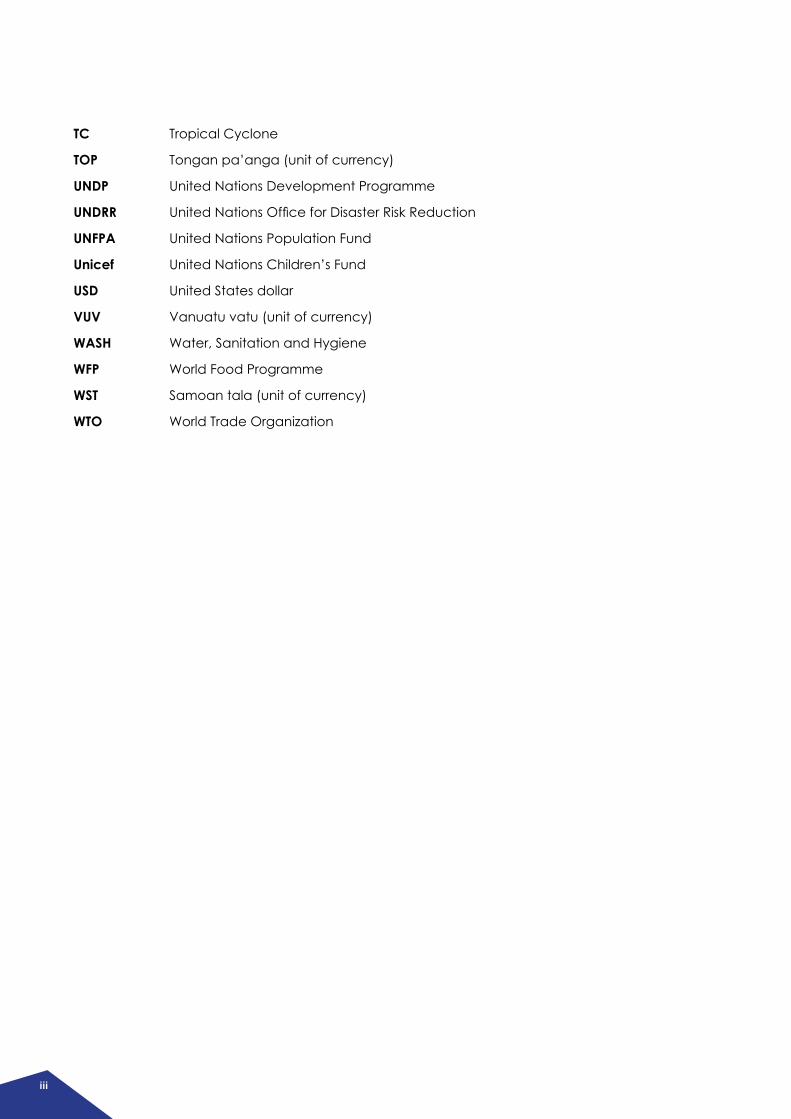
TC Tropical Cyclone
TOP Tongan pa’anga (unit of currency)
UNDP United Nations Development Programme
UNDRR UnitedNationsOfficeforDisasterRiskReduction
UNFPA United Nations Population Fund
Unicef United Nations Children’s Fund
USD United States dollar
VUV Vanuatu vatu (unit of currency)
WASH Water, Sanitation and Hygiene
WFP World Food Programme
WST Samoan tala (unit of currency)
WTO World Trade Organization
iii
1
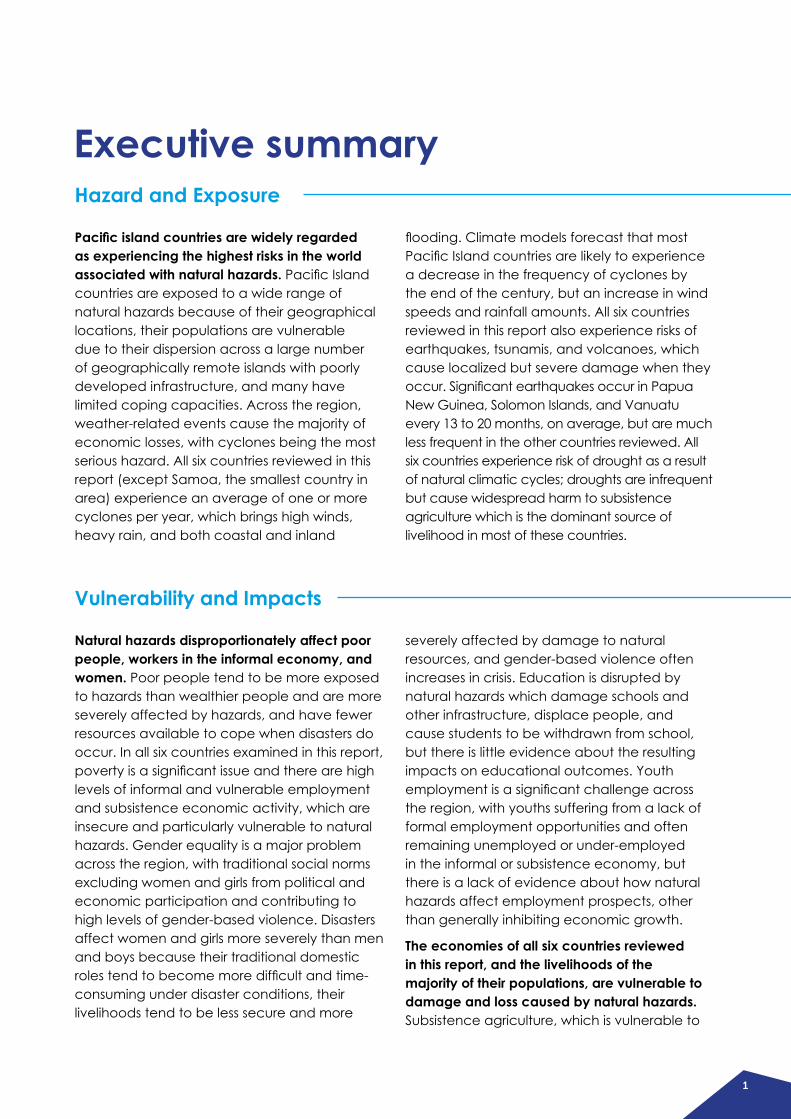
Pacific island countries are widely regarded as experiencing the highest risks in the world associated with natural hazards.PacificIslandcountries are exposed to a wide range of natural hazards because of their geographical locations, their populations are vulnerable due to their dispersion across a large number of geographically remote islands with poorly developed infrastructure, and many have limited coping capacities. Across the region, weather-related events cause the majority of economic losses, with cyclones being the most serious hazard. All six countries reviewed in this report (except Samoa, the smallest country in area) experience an average of one or more cyclones per year, which brings high winds, heavy rain, and both coastal and inland
Natural hazards disproportionately affect poor people, workers in the informal economy, and women. Poor people tend to be more exposed to hazards than wealthier people and are more severely affected by hazards, and have fewer resources available to cope when disasters do occur. In all six countries examined in this report, povertyisasignificantissueandtherearehighlevels of informal and vulnerable employment and subsistence economic activity, which are insecure and particularly vulnerable to natural hazards. Gender equality is a major problem across the region, with traditional social norms excluding women and girls from political and economic participation and contributing to high levels of gender-based violence. Disasters affect women and girls more severely than men and boys because their traditional domestic rolestendtobecomemoredifficultandtime-consuming under disaster conditions, their livelihoods tend to be less secure and more
Executive summary
flooding.ClimatemodelsforecastthatmostPacificIslandcountriesarelikelytoexperiencea decrease in the frequency of cyclones by the end of the century, but an increase in wind speeds and rainfall amounts. All six countries reviewed in this report also experience risks of earthquakes, tsunamis, and volcanoes, which cause localized but severe damage when they occur.SignificantearthquakesoccurinPapuaNew Guinea, Solomon Islands, and Vanuatu every 13 to 20 months, on average, but are much less frequent in the other countries reviewed. All six countries experience risk of drought as a result of natural climatic cycles; droughts are infrequent but cause widespread harm to subsistence agriculture which is the dominant source of livelihood in most of these countries.
severely affected by damage to natural resources, and gender-based violence often increases in crisis. Education is disrupted by natural hazards which damage schools and other infrastructure, displace people, and cause students to be withdrawn from school, but there is little evidence about the resulting impacts on educational outcomes. Youth employmentisasignificantchallengeacrossthe region, with youths suffering from a lack of formal employment opportunities and often remaining unemployed or under-employed in the informal or subsistence economy, but there is a lack of evidence about how natural hazards affect employment prospects, other than generally inhibiting economic growth.
The economies of all six countries reviewed in this report, and the livelihoods of the majority of their populations, are vulnerable to damage and loss caused by natural hazards. Subsistence agriculture, which is vulnerable to
Hazard and Exposure
Vulnerability and Impacts
2
all types of hazards, plays a very important role in people’s livelihoods across all six countries. Fiji is the least dependent on subsistence agriculture, but in the other countries 75% to 97% of the population depends on subsistence agriculture for livelihoods. Most of the countries in the region have very small manufacturing sectors, but many people work in small-scale, informal, and home-based trading activities with limitedresourcestocopewithshocksinflictedbynaturalhazards.Tourism,asignificantindustryin four of the six countries, is largely nature-
based and dependent on coastal and marine ecosystems and coastal infrastructure which are vulnerable to natural hazards and the impacts of climate change. Most of the population in these countries, with the exception of Papua New Guinea, lives in coastal areas where they are more highly exposed to cyclones, tsunamis, andfloodingthaninlandpopulations.Housingin all six countries is often not robust enough to withstand hazards, usually because of poor construction standards especially in informal settlements and rural areas.
Scaling up social protection schemes quickly by providing cash payments or vouchers to people affected by humanitarian crisis is increasingly common worldwide and across the Pacific region. International experience has shown that a cash-basedresponseisefficientandeffective,enablesrecipients to identify and prioritise their own needs, supports the dignity of recipients, can be more timelyandflexiblethanothertypesofassistance,and supports the recovery of local markets. In thePacific,cash-basedprogramminghasnotbeen widely used until quite recently, but it is now becoming more accepted. Cash transfers are more feasible in crisis situations in countries that have prior experience of using them in social protection programs and have well-developed financialservicesandahighdegreeoffinancialinclusion.
Worldwide, financial inclusion is an important contributor to development, poverty reduction, and disaster resilience. Accesstofinancialservices enables and incentivizes people to accumulate savings, smooth consumption over time, obtain loans, start businesses, receive remittances and other payments, obtain insurance, and improve resilience to financialshockswhilereducingrelianceonnegative coping strategies and predatory lending. Evidence from multiple countries shows thatfinancialinclusioncontributestopoverty
Most of the countries reviewed in this report do not have formal social protection schemes that are able to scale up in crisis situations to support disaster relief and recovery. Fiji and Tonga are exceptions: after recent tropical cyclones, they distributed supplementary cash payments through existing social protection systems and distributed electronic vouchers or cash for home repairs. The other countries reviewed in this report have very limited formal social protection systems which are mostly limited to contributory pension schemes for peopleinformalemployment,andnosignificantexperience in providing cash payments for disaster relief and recovery purposes.
reduction, improves food security, and helps preserve capital.
In most of the six countries reviewed in this report, there is little evidence that financial inclusion contributes significantly to disaster resilience. The exception is Fiji, where a relativelyhigh-leveloffinancialinclusionappears to support disaster resilience by facilitating the distribution of relief funds, receipt of remittances, and accumulation of savings. Financial inclusion in all six countries is broadly
Adaptive Social Protection
Financial Inclusion
3
Worldwide, insurance is an important tool for managing risks associated with natural hazards, but the Pacific region is one of the least insured regions in the world. Barriers to uptake of insurance include affordability, inadequate disaster risk mitigation measures, insufficientbaselineinformationfordesigninginsurance products, limited availability of reinsurance, consumer awareness and cultural issues, lack of trust, inadequate building codes andcertificationmechanisms,lackofpublicasset registers, aid dependence, and weak mechanisms for distributing pay-outs. There is limited demand for and limited availability of insurance products in the region, and many communitieshavelimitedaccesstofinancialinstitutions. Micro-, small-, and medium-sized enterprises are often overlooked by insurance companies and regulators, and it is rare for insuranceproductstobetailoredtothespecificneeds of the smallest businesses. Insurance may not be cost-effective for the poorest of the poor, and is not an appropriate approach for frequently recurring events or for slow-onset, highly predictable events. Microinsurance is often considered unsuitable for covering risks associated with natural hazards which affect many people simultaneously, because of the large capital reserves required and the high cost of assessing claims.
In all six countries reviewed in this report, the majority of people and small businesses have no insurance coverage for natural hazards. Property insurance coverage is very limited in
all of the countries, and is essentially absent in rural areas. Crop insurance is not available. Insurance is unaffordable to low-income people across the region, and many people are unfamiliar with insurance. Insurance markets in all six countries are small, have limited capacity, andhavedifficultyobtainingreinsurancecoverage for major hazards. Low standards for building construction across the region limit insurers’ willingness to cover properties without expensivecertification.
Uptake of insurance coverage could potentially be increased by raising awareness and developing products tailored to local circumstances. Demand could potentially be stimulatedbyincreasingfinancial,insuranceand risk management literacy and awareness amongbeneficiaries,insurers,distributionchannels and governments, by supporting the development of a wider range of products, andbyincreasingaccesstofinancialservicesthrough channels such as mobile phones. The insurance industry requires support to develop new products tailored to local market conditions including better local risk data. However, the most vulnerable people cannot afford insurance at market prices and may require some form of support. Parametric or index-based insurance could potentially be simpler, more transparent, and cheaper than indemnity insurance, but requires considerable technical capacity, data, communications capacity, and public awareness and education.
Insurance
comparable to countries at similar income levels elsewhereintheworld,butfinancialinclusionin remote islands and rural areas is much lower than in the main urban areas.
Across the Pacific region, experts recommend that financial inclusion should be increased. Various experts recommend promoting greater accesstoanduseoffinancialservicesincludingdeveloping more access points, agent networks,
digital payment platforms, and mobile money systems. In the long-term, efforts could be madetoincreasefinancialliteracyandawareness, develop regulatory frameworks that accommodate poorer households, improve consumer protection to increase trust in the financialsystem,andincentivizetheprivatesectortodevelopfinancialservicesthatareresilient in crisis.
4
Globally and across the Pacific, migration is recognised as a positive adaptation strategy in response to natural hazards and environmental change. Voluntary, well-managed migration of individuals and communities can enhance the adaptive capacity of the migrant-sending community by generating remittances, reducing population pressure, and transferring knowledge and skills. Some countries have suffered “brain drain” from the loss of skilled workers where migration has been permanent rather than temporary or seasonal.
There are marked differences in migration patterns among the six countries reviewed in this report. Samoa, Tonga, and Fiji have high rates of emigration, ranking among the top 15 migrant-sending countries in the world by proportion of their population, and in all three countries migration is supported by government policies. In Samoa and Tonga, migration is a well-developed strategy for seeking economic opportunities for unskilled workers. In Fiji, better-developed education and training systems have enabled the country to access more opportunities for skilled migrant workers. Papua New Guinea, Solomon Islands, and Vanuatu have been less successful in accessing opportunities for migrant workers.
Remittances are an important source of income for many low-income countries, both in normal times and following disasters. Worldwide, remittances amount to more than three and a halftimesthetotalvalueofofficialdevelopmentassistance, with unrecorded remittances sent through informal channels possibly even greater. Remittances tend to be more stable than other internationalfinancialflows,andoftenincreasefollowing disasters. Households that receive remittances are better able to respond to and recover from disasters than those that do
There is a consensus that migration should be supported, managed, and integrated into environmental, climate change, and urban planning policies. Governments have been urged to prioritise labour mobility schemes, invest in education and training, harmonise standardsforqualifications,investinmarketingstrategies to obtain opportunities for workers, and seek opportunities within and beyond the Pacificregion.Countriesthatreceivemigrantworkers should ensure that migration policies support development in source countries, expand opportunities for low-skilled workers, improve integration for new migrants, and increase opportunities for migrants from countries particularly threatened by sea-level rise. Governments have also been urged to mitigate potential negative social impacts on families and communities, incentivize migrants to return home rather than settle permanently abroad, and work to mitigate potential “brain drain” that could negatively affect countries sending skilled workers overseas. There is a general lack of knowledge about migration andclimatechangeacrossthePacificandthere is a need for better data on migration.
not receive them, including rebuilding more quickly, avoiding negative coping strategies, and maintaining consumption during crisis. There is debate in the literature about whether remittances contribute to reproducing existing inequalities and about how well they support disaster preparedness.
Remittances benefit the countries reviewed in this report that have significant populations of migrant workers and overseas diasporas. In Fiji, Samoa, and Tonga, remittances are
Migration
Remittances
5
Relocation of settlements at extreme risk of natural hazards is generally considered a last resort with potentially severe social and cultural impacts. AcrossthePacific,risksassociatedwith relocation of settlements relate to land, loss of identity, culture, livelihoods, family ties andcommunitycohesion,aswellasconflictand governance issues around customary land rights. Residents typically resist the idea of relocation, and prefer in-place adaptation and sustainable management practices.
Attempts to relocate communities at risk in the countries reviewed for this report have often turned out to be problematic, but each
initiative is unique and depends on specific local circumstances. Recommendations for resettlement initiatives emphasise the importance of community participation and empowerment, providing community services in the new location, and preserving livelihoods and cultures. Access to land and natural resources are major barriers to relocation in most cases, and resettled populations often endupinconflictwiththeirnewneighborsafterrelocation. Vanuatu and Fiji are considered leaders in this area due to their policies on relocation that recognise displaced peoples’ rights and provide guidance for participatory planning processes.
Resettlement of Communities at Risk
importantsourcesofincome,makesignificantcontributions to welfare in normal times, and support recovery from the impacts of natural hazards. Remittances have had limited impacts on disaster resilience in Papua New Guinea and Solomon Islands, but have been increasing in importance in Vanuatu, particularly following tropical cyclone Pam in 2015. There is limited evidence about how remittances contribute to disaster resilience, as most research focuses on their impacts on development generally.
Recommendations for improving the amount and impact of remittances focus on reducing transaction costs and administrative barriers, and incentivizing investment in long-term
development. Many experts have called for the costs of sending remittances to be reduced, particularly during and after crisis. Some experts recommend offering training to migrants and to recipients of remittances (and increasingaccesstofinancialinstitutions)toencourage saving and longer-term investment. Other recommendations include increasing migrants’accesstofinancialservicesinhostcountries, ensuring that systems are in place to enable people to identify themselves (including providingtemporaryidentificationpapersif needed) and supporting the tracing and contacting of family members affected by disasters.
6
Globally and across the Pacific, informal, community-based coping mechanisms are a common way to reduce risk in rural and poor communities. Community-based mechanisms rely on reciprocal exchange and trust in tight-knit social networks, and are well-suited to coping with relatively small-scale natural hazards that affect only a few community membersatatime.AcrossthePacific,therearestrong traditions of informal social protection and sharing of resources within extended families and with the broader community, which play a critical role in coping with disasters. However, community-based mechanisms can be overwhelmed by large-scale, long-term, or frequent events.
All of the countries reviewed in this report have strong cultures of community-based support, traditional knowledge, traditional governance systems, and faith-based organizations that
contribute to disaster resilience. Many examples from all six countries show that traditions of reciprocal support in times of crisis are deeply embedded in local cultures. In some cases, mutual support obligations extend only as far as members of the same cultural or ethnic group, andcanleadtoconflictsarisingwithmembersof other groups. Churches are also extremely important in everyday life and in leading disaster resilience efforts in all of the countries reviewed. Governance institutions based on local traditions (such as tribal, clan, and village chiefs) provide leadership, coordination, and information during crisis, working alongside modern state governance systems but responding more quickly to local needs. Traditional knowledge, such as construction techniques and methods of preserving foods and preparing for hazards, also contribute to disaster resilience.
Community-Based Support
7
Pacific Island countries are widely regarded as experiencing the highest risks in the world associated with natural hazards.PacificIslandcountries are among the countries most severely affected by natural hazards in the world, both in terms of casualties per capita and economic damage (Day, Forster, Himmelsbach, Korte, Mucke, Radtke, Thielbörger, & Weller, 2019; ECHO [European Civil Protection and Humanitarian Aid Operations], 2019, p. 1; Lee, Zhang, & Nguyen, 2018, p. 3). Economic losses on an annualized basis due to natural disastersinthePacific“farexceedthoseinalmost all other countries in the world” (World Bank,2016b,p.15).GeographyexposesPacificIsland countries to a wide variety of natural hazards, their populations are vulnerable due to remoteness and dispersion across a large area,andmanyPacificIslandcountrieshavelimited coping capacities (ADB, 2018a, p. 2; Day et al., 2019; Utz, 2017, p. 81). Across the region, weather-related events cause the majority of economic losses, with cyclones being the most serious hazard, while geological hazards (earthquakes, tsunamis, and volcanoes) are the major cause of human loss (Utz, 2017, p. 81). Different agencies, using different methodologies, provide different assessments of risk.
• WorldRiskReport1 ranks countries on the basis of their exposure to earthquakes, cyclones, floods,droughts,andsea-levelrise,andontheir coping capacities. The ranking process uses 27 indicators and assigns countries scores ranging from 0 (least risk) to 100 (greatest risk) (Day et al., 2019, pp. 43–44, 56).
1. Exposure to natural hazards1.1. Overview
Natural hazards
Natural hazards are naturally occurring physical phenomena that have the potential to cause harm to people, damage to property or to the environment, or economic losses, depending on how they interact with the environmental, social, and economic context in which they occur (Bokwa, 2013, p. 711). Natural hazards cause damage or loss when a population is exposed to a hazard, is vulnerable or susceptible to it or lacks protection from it, and lacks capacity to cope with its effects (Bokwa, 2013, pp. 711–713; Cardona, Aalst, Birkmann, Fordham, McGregor, Perez, Pulwarty, Schipper, & Sinh, 2012, pp. 69–70). High vulnerability and exposure are mainly a result of development processes including environmental mismanagement, demographic change, unplanned urbanization, and inadequate livelihood options for the poor (Cardona et al., 2012, p. 70). Severe damage or loss resulting from the interaction of hazard, vulnerability, and coping capacity may be described as a disaster (Bokwa, 2013, pp. 712–713).
1Developed by Ruhr University Bochum and Bündnis Entwicklung Hilft.
8
• INFORM (Index for Risk Management)2 assesses the relative risk of countries experiencing humanitarian crisis, taking into account exposure to natural hazards (earthquakes, tsunamis,droughts,floods,cyclones,andepidemics),conflicts,vulnerabilityof the population, and coping capacity (IASC [Inter-Agency Standing Committee Reference Group on Risk, Early Warning and Preparedness], 2020).
• ThinkHazard3 provides an overview of natural hazards at national and local levels (GFDRR [Global Facility for Disaster Reduction and Recovery], 2020).
• The Internal Displacement Monitoring Centre (IDMC)4 models the risk of future population displacements (IDMC, 2019).
Agencies that record past disasters diverge on their assessments of the hazards that have caused the greatest damage and economic losses in Pacific Island countries.
• DesInventar5 and the Emergency Events Database, EM-DAT6, are the two main global datasets of disasters related to natural hazards. They use different inclusion criteria, data sources, and reporting practices, so they are not necessarily comparable. In particular, DesInventarincludessignificantlymoreeventsthan EM-DAT, especially high-frequency, low-impact events; EM-DAT tends to show lower estimates of impacts and to lack estimates of damages in smaller countries; data collection practices in both datasets appear to vary from one country to another and may not always be comparable between countries; andbothdatasetsappeartocoverfloodinginadequately (Edmonds & Noy, 2018, pp. 482–484).
Naturalhazardsaretypicallyclassifiedaccording to the way in which they are caused, for example (IFRC, n.d.):
• geophysical (earthquakes, landslides, tsunamis and volcanic activity)
• hydrological(avalanchesandfloods)
• climatological (extreme temperatures, droughtandwildfires)
• meteorological (cyclones, storms, and wave surges)
• biological (disease epidemics and insect or animal plagues)
Thisreportfocusesthefirstfourtypesofhazards, excluding biological hazards. The report focuses on the hazards most significanttoeachofthecountriesreviewed.
• The Pacific Catastrophe Risk Assessment and Financing Initiative (PCRAFI) has also compiled a database cataloguing more than 600 disasters across 15 countries in the region, presenting another perspective on the events that have affected each country; the database includes some events prior to 1900 (documentation does not identify the earliest event included) through approximately 2010 (PCRAFI, 2013a, pp. 53–57).
Climate change is expected to lead to fewer but more powerful cyclones across the Pacific by the end of this century. Cyclones bringdamagingwinds,heavyrain,flooding,andstormsurge,andaresignificantnaturalhazardsforallPacificIslandcountries.Climatemodels produce varying projections of cyclone
2Developed by the Inter-Agency Standing Committee Reference Group on Risk, Early Warning and Preparedness and the European Commission.3Developed by the Global Facility for Disaster Reduction and Recovery (GFDRR) managed by the World Bank.4Part of the Norwegian Refugee Council, a humanitarian non-governmental organization5OperatedbytheUnitedNationsOfficeforDisasterRiskReduction(UNDRR),drawingondatafrompartnersaroundtheworld;dataforthePacificregionareprovidedbytheSecretariatofthePacificCommunity(SPC)6Operated by the Centre for Research on the Epidemiology of Disasters (CRED) at the Catholic University of Louvain
9
7This analysis was based on EM-DAT, which counts disasters involving 10 or more deaths, 100 or more people affected, the declaration of a state of emergency, or a call for international assistance.
formationrates,suggestingthatmostPacificisland countries are likely to experience a decrease in cyclone formation rates by the end of the century. Global projections suggest that maximum wind speeds could increase by 2% to 11%, which would lead to higher damage, and that rainfall within 100 km of cyclone centers could increase by around 20%; there are no projections of changes in cyclone intensity for individual countries (ADB, 2018a, p. 5; Australian Bureau of Meteorology and CSIRO[CommonwealthScientificandIndustrialResearch Organisation], 2014).
Global evidence shows that the economic damage cause by cyclones is long-lasting and
cumulative. A study of the long-term economic impacts of 6,712 tropical cyclones found that the impact on gross domestic product (GDP) caused by a cyclone lasts at least twenty years, and that countries repeatedly exposed to cyclones experience a cumulative and effectively permanent loss to GDP. More powerful storms cause more long-term damage: each additional metre per second (3.6 km/h) increase in average annual wind exposure lowers per capita economic output by 0.37% twenty years later, and an increase in a country’s cyclone exposure by one standard deviation lowers GDP by 3.6 percentage points twenty years later (Hsiang & Jina, 2014).
1.2. Fiji
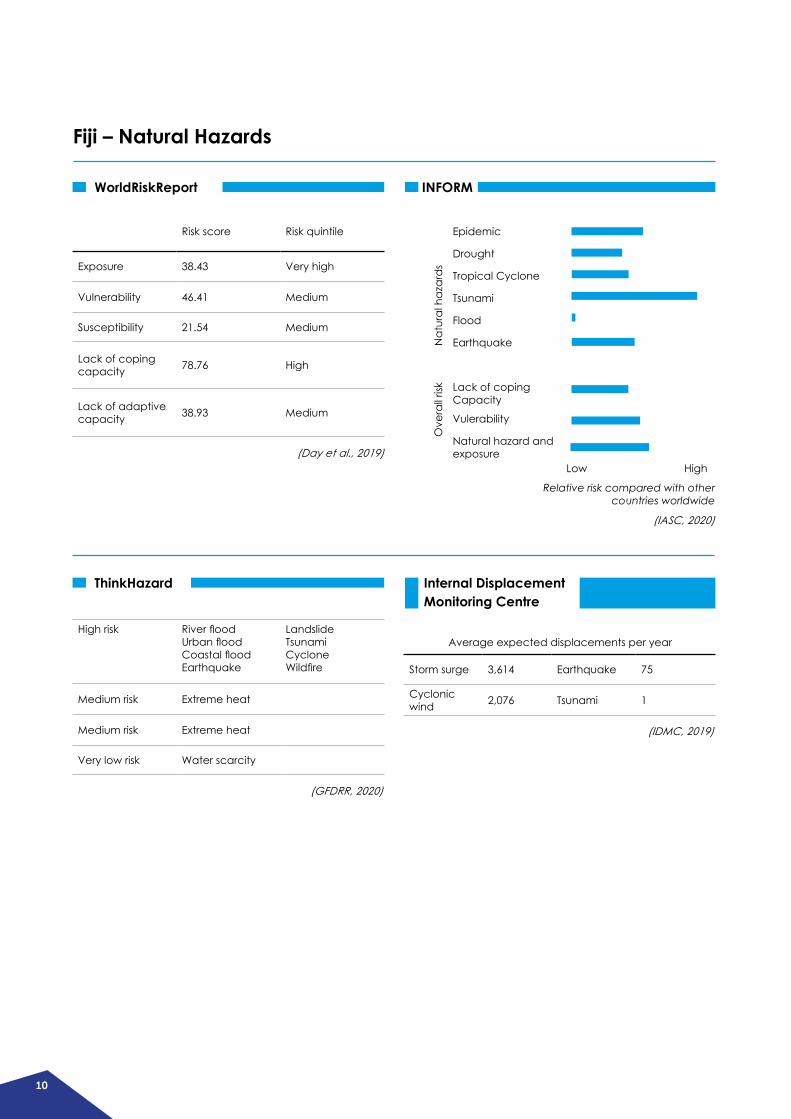
Fiji is ranked as the 12th most hazardous country in the world by WorldRiskIndex on the basis of high exposure to natural hazards and relatively low coping capacity (Day et al., 2019). INFORM ranks Fiji 103rd out of 191 countries on exposure to natural hazards alone, implying a roughly average level of exposure by global standards (IASC, 2020). The hazards that have affected Fiji most severely have been tropical cyclones and floods.AnInternationalMonetaryFund(IMF)study estimates that Fiji has a 70% chance of sufferingasignificant7 disaster related to natural hazards each year (Lee et al., 2018, p. 7), and
the Government of Fiji forecasts that cyclones andfloodsarelikelytocauseaverageannuallosses equal to 5.8% of GDP (Government of Fiji, 2017b, pp. 50–55). PCRAFI estimates that within the next 50 years, Fiji has a 50% chance of experiencing a loss of more than 25% of GDP due to earthquakes or tropical cyclones, and a 10% chance of a loss exceeding 50% of GDP (PCRAFI, 2011a, pp. 1–2). Climate change is likely to exacerbate all weather-related hazards inFiji,andfloodseverityhasalreadyfoundtobeincreasing (UNDRR, 2019, p. 11).
10
Risk score Risk quintile
Exposure 38.43 Very high
Vulnerability 46.41 Medium
Susceptibility 21.54 Medium
Lack of coping capacity 78.76 High
Lack of adaptive capacity 38.93 Medium
High risk RiverfloodUrbanfloodCoastalfloodEarthquake
LandslideTsunamiCycloneWildfire
Medium risk Extreme heat
Medium risk Extreme heat
Very low risk Water scarcity
Storm surge 3,614 Earthquake 75
Cyclonic wind 2,076 Tsunami 1
WorldRiskReport
ThinkHazard
INFORM
Internal Displacement Monitoring Centre
Fiji – Natural Hazards
Epidemic
Drought
Tropical Cyclone
Tsunami
Flood
Earthquake
Lack of coping Capacity
Vulerability
Natural hazard and exposure
Low(Day et al., 2019)
(GFDRR, 2020)
(IDMC, 2019)
Average expected displacements per year
(IASC, 2020)
Nat
ural
haz
ard
sO
vera
ll risk
High
Relative risk compared with other countries worldwide

11
Tropical cyclones 152 1.6%
Fluvialfloods(rivers) 250 2.6%
Pluvialfloods(surfacewater) 154 1.6%
Earthquakes and Tsunamis 5 <0.1%
Tropical cyclone 71
Flood 30
Earthquake 13
Severe local storm 10
Landslide 5
Storm surge 0
Tsunami 0
Government of Fiji
DesInventar: Losses, 1990-2020
EM-DAT: Damage, 1990-2020
PCRAFI: number of recorded disasters
Volcanic Activity
Tsunami
Cyclone
Flood
Earthquake
Drought
Drought
Volcano
Storm (local)
Strom surge
Landslide
Tsunami
Earthquake
Flood
Cyclone
Epidemic
FJD million % GDP
0 250 500 750 1000(Government of Fiji, 2017b, pp. 50–55) Damage in million USD
(CRED, 2020)
(PCRAFI, 2013a, p. 57)
(UNDRR, 2020)
0 250 500 750 1000
Losses in million USD
Average annual asset losses
12
Fiji experiences, on average, one cyclone per year, resulting in FJD 152 million in asset losses annually; losses from 100-year return period cyclones are estimated at around 11% of GDP, and the losses from Tropical Cyclone (TC) Winston are consistent with those from a 200-year event (Government of Fiji, 2017b, p. 50). The country has experienced two record-breaking tropical cyclones this decade: TC Evan, a category 4 storm8 in 2012, and TC Winston, a category 5 storm in 2016 which was the most intense storm ever recorded in the Southern Hemisphere (Schimel, 2020, p. 39). The death toll for both storms was low, with only two deaths recorded for Evan and 44 for Winston (CRED, 2020; Government of Fiji, 2016, p. 10) but the economic losses were heavy, amounting to 2.6% of GDP for Evan and approximately 20% of GDP for Winston (Schimel, 2020, pp. 39–40). The two storms had similar impacts at the sectoral level, with agriculture, forestry, commerce, hotels and restaurants accounting for 87% of total losses (WTO [World Trade Organization], 2019, p. 41). By 2050, extreme weather events may cause up to a 6.5% loss of Fiji’s GDP annually (Schimel, 2020, p. 39).
Fiji is severely and regularly affected by floods that cause loss of life, damage to housing and infrastructure, and economic disruption. Coastalfloodsarearesultofacombinationof mean sea level, astronomical tides, storm surges due to low pressure and wind action, and wind-driven waves (Government of Fiji, 2017b,p.50).Inland,floodingcanoccurasaresultofcyclonesandotherstorms:fluvialfloodsoccurwhenriversbursttheirbanksasaresult of sustained or intense rainfall, and pluvial floodsoccurwhenheavyprecipitationsaturatesdrainagesystems,particularlyinflatandurbanareas (Government of Fiji, 2017b, p. 51). Such floodsarearegularoccurrenceduringthe
monsoon season (November to April), usually alongside cyclones and tropical storms which bring in high intensity rainfall (UNDRR, 2019b, p. 11). Much of the country’s population lives onriverfloodplainssubjecttolong-durationfloodingandinsmallercatchmentspronetoflashflooding(GovernmentofFiji,2017b,p. 51). All major rivers that discharge to the ocean and delta areas can be affected by elevated sea levels during high tides or storm surges (Government of Fiji, 2017b, p. 51). Fiji has experienced,onaverage,morethanonefloodeachyearforthepast40years.Asignificantfractionofthesefloodsarehigh-frequency,low-intensity events that may not be recorded in disaster databases but are frequent enough to generate large cumulative losses (Government ofFiji,2017b,p.51).Averageannualfloodlossesare estimated at more than FJD 400 million, or 4.2% of GDP (Government of Fiji, 2017b, p. 51).
Climate change is expected to increase both the frequency and intensity of extreme rainfall events by the end of the century. Rainfall events that occur once in 20 years may increase in magnitude by 5 to 7mm by 2030 and by 6 to 36mm by 2090, and what is currently a 20-year event may occur every 4 to 9 years by 2090, depending on CO2 emission levels (Government of Fiji, 2017b, p. 51). Without adaptation measures, asset losses would increase correspondingly, reaching 5% of GDP annuallyby2050.Theincreaseinfloodlossesarises more from the increase in the frequency ofsmallereventsthanfromtherarerlargefloods(Government of Fiji, 2017b, p. 54). Climate change models produce varying projections of cyclone formation rates, with a majority suggesting a likely decrease of 20% to 40% in cyclone formation by the end of the century (Australian Bureau of Meteorology and CSIRO, 2014, p. 106).
8Tropicalcyclonesareclassifiedintocategoriesnumbered1through5basedonmaximumsustainedwindspeed,withcategory 5 being the most powerful.

13
Droughts in Fiji are infrequent, and usually short and seasonal, with an average duration of a few months or less (Government of Fiji, 2017b, p. 47,54). Almost all droughts are associated with the El Niño9 phenomenon, which have the potential to reduce annual rainfall by up to 50%, although not all El Niños lead to droughts (Government of Fiji, 2017b, p. 54; UNDRR, 2019b, p. 11). Droughts are infrequent – only six major droughts were recorded between 1970 and 2016 (Government of Fiji, 2017b, p. 47) – but when they occur they affect an average of 20% to 30% of Fiji’s land area (Government of Fiji, 2017b, p. 54). Impacts of droughts include decreased agricultural production, mortality of livestock,shortagesofdrinkingwater,forestfires,and saline water intrusions as a result of reduced flowsinrivers(GovernmentofFiji,2017b,p.54).In 1997-98, for example, one of the strongest El Niños on record led to widespread food and water shortages, school closures, a halving of the sugarcane harvest, and one of the worst recessions in Fiji’s history (OCHA [United Nations OfficefortheCoordinationofHumanitarianAffairs], 2015, p. 3). Another El Niño-induced drought in 2015 similarly led to about 13% of the population receiving emergency water deliveries and reduced harvests (OCHA, 2015). The impact of climate change on the risk of drought is unclear. Different climate models project different changes in precipitation patterns and there does not appear to be a consensus around the implications for drought in Fiji (Government of Fiji, 2017b, p. 54).
Fiji is exposed to earthquakes and tsunamis that affect all countries in the region and has two active volcanoes (PCRAFI, 2011a, p. 3; UNDRR, 2019b, pp. 6, 10). Fiji has experienced sevensignificantearthquakes10 since 1980, or
slightly less than two earthquakes per decade on average (National Geophysical Data Center / World Data Service (NGDC/WDS), 2020), although earthquakes and tsunamis have had limited impacts and the last major earthquake in a built-up area occurred in 1953 (PCRAFI, 2015a, p. 17). Studies have suggested a 20% to40%chanceofexperiencingasignificantearthquakeatleastonceinthenextfiftyyears(Government of Fiji, 2017b, pp. 47, 55; UNDRR, 2019b, p. 10). Overall, Fiji is expected to incur an average of FJD 5 million per year in losses due to earthquakes and tsunamis(Government of Fiji, 2017b, p. 55), making this a relatively small risk compared to other natural hazards. Climate change could potentially lead to increased tsunami risk, primarily through sea-level rise but also through damage to coral reefs; there is evidence that these coastal ecosystems can offer some protection against tsunamis, depending on local conditions (Dilmen, Titov, & Roe, 2015, p. 3570; Shao, Liu, Gao, & Ning, 2019, p. 85).
Steep slopes, unstable volcanic soil, heavy precipitation, and high winds contribute to a significant risk of landslides in Fiji (Drazba, Yan-Richards, & Wilkinson, 2018; UNDRR, 2019b, p. 6). There is a lack of data on landslide occurrences and impacts in Fiji but they are often triggered by rainfall and are believed to pose a substantial threat (Drazba et al., 2018, p. 1337; Government of Fiji, 2017b, p. 47). The frequency of landslides is likely to increase with climate change as a result of increased precipitation and more intense tropical cyclones but land use, deforestation, and slope management are also contributing factors (Government of Fiji, 2017b, p. 54).
9ElNiñoisanaturallyoccurringwarmingoftheeasterntropicalPacificOceanwhichisobservedeverytwotosevenyears,leading to weakening of the prevailing trade winds, reduced ocean upwelling and altered ocean currents, and changes to wind, sea surface temperature and precipitation patterns; La Niña is its counterpart, during which the ocean surface waters cool (Australian Bureau of Meteorology and CSIRO, 2014, pp. 347–349).10Definedasmeetingatleastoneofthefollowingcriteria:causeddeaths,causedmoderatedamage(approximately$1millionormore),magnitude7.5orgreater,ModifiedMercalliIntensityXorgreater,ortheearthquakegeneratedatsunami(National Geophysical Data Center / World Data Service (NGDC/WDS), 2020).
14
1.3. Papua New Guinea
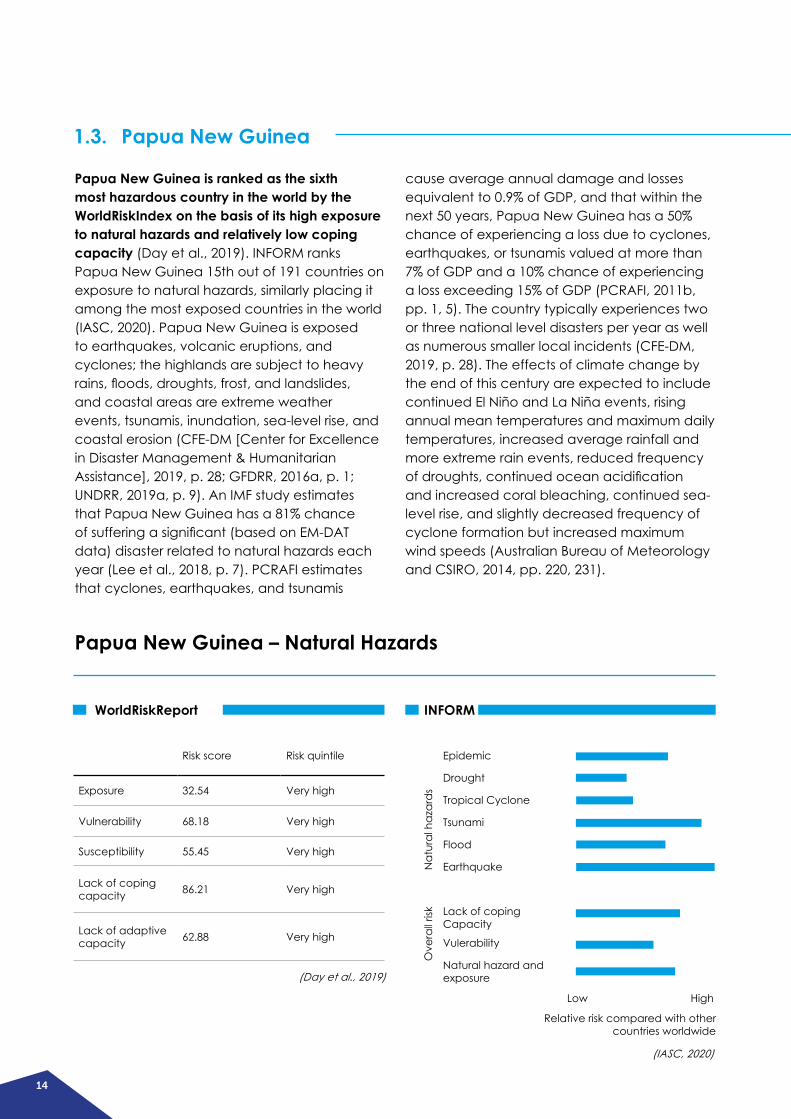
Papua New Guinea is ranked as the sixth most hazardous country in the world by the WorldRiskIndex on the basis of its high exposure to natural hazards and relatively low coping capacity (Day et al., 2019). INFORM ranks Papua New Guinea 15th out of 191 countries on exposure to natural hazards, similarly placing it among the most exposed countries in the world (IASC, 2020). Papua New Guinea is exposed to earthquakes, volcanic eruptions, and cyclones; the highlands are subject to heavy rains,floods,droughts,frost,andlandslides,and coastal areas are extreme weather events, tsunamis, inundation, sea-level rise, and coastal erosion (CFE-DM [Center for Excellence in Disaster Management & Humanitarian Assistance], 2019, p. 28; GFDRR, 2016a, p. 1; UNDRR, 2019a, p. 9). An IMF study estimates that Papua New Guinea has a 81% chance ofsufferingasignificant(basedonEM-DATdata) disaster related to natural hazards each year (Lee et al., 2018, p. 7). PCRAFI estimates that cyclones, earthquakes, and tsunamis
cause average annual damage and losses equivalent to 0.9% of GDP, and that within the next 50 years, Papua New Guinea has a 50% chance of experiencing a loss due to cyclones, earthquakes, or tsunamis valued at more than 7% of GDP and a 10% chance of experiencing a loss exceeding 15% of GDP (PCRAFI, 2011b, pp. 1, 5). The country typically experiences two or three national level disasters per year as well as numerous smaller local incidents (CFE-DM, 2019, p. 28). The effects of climate change by the end of this century are expected to include continued El Niño and La Niña events, rising annual mean temperatures and maximum daily temperatures, increased average rainfall and more extreme rain events, reduced frequency ofdroughts,continuedoceanacidificationand increased coral bleaching, continued sea-level rise, and slightly decreased frequency of cyclone formation but increased maximum wind speeds (Australian Bureau of Meteorology and CSIRO, 2014, pp. 220, 231).
Risk score Risk quintile
Exposure 32.54 Very high
Vulnerability 68.18 Very high
Susceptibility 55.45 Very high
Lack of coping capacity 86.21 Very high
Lack of adaptive capacity 62.88 Very high
Papua New Guinea – Natural Hazards
Epidemic
Drought
Tropical Cyclone
Tsunami
Flood
Earthquake
Lack of coping Capacity
Vulerability
Natural hazard and exposure
Low
(Day et al., 2019)
Relative risk compared with other countries worldwide
Nat
ural
haz
ard
sO
vera
ll risk
High
WorldRiskReport INFORM
(IASC, 2020)
15
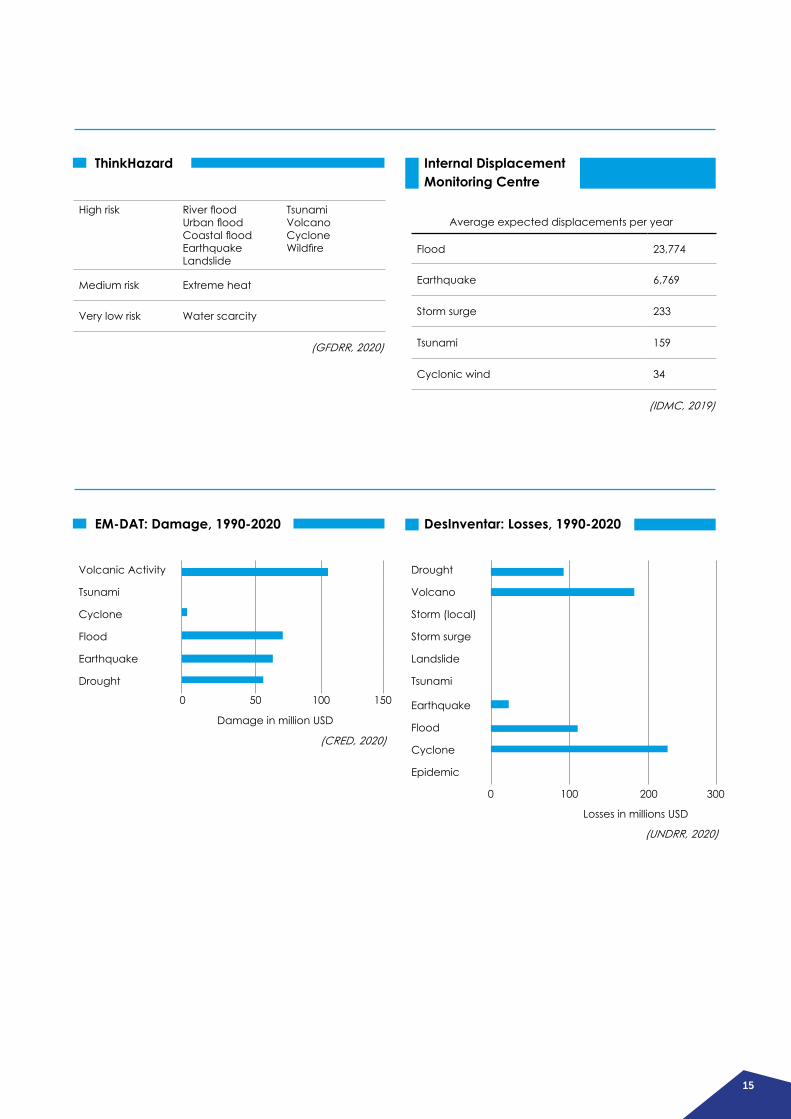
High risk RiverfloodUrbanfloodCoastalfloodEarthquakeLandslide
TsunamiVolcanoCycloneWildfire
Medium risk Extreme heat
Very low risk Water scarcity
Flood 23,774
Earthquake 6,769
Storm surge 233
Tsunami 159
Cyclonic wind 34
(GFDRR, 2020)
(CRED, 2020)
(IDMC, 2019)
(UNDRR, 2020)
Average expected displacements per year
ThinkHazard
EM-DAT: Damage, 1990-2020
Internal Displacement Monitoring Centre
DesInventar: Losses, 1990-2020
Volcanic Activity
Tsunami
Cyclone
Flood
Earthquake
Drought
Drought
Volcano
Storm (local)
Storm surge
Landslide
Tsunami
Earthquake
Flood
Cyclone
Epidemic
0
0
50 100
100 200 300
150
Damage in million USD
Losses in millions USD
16
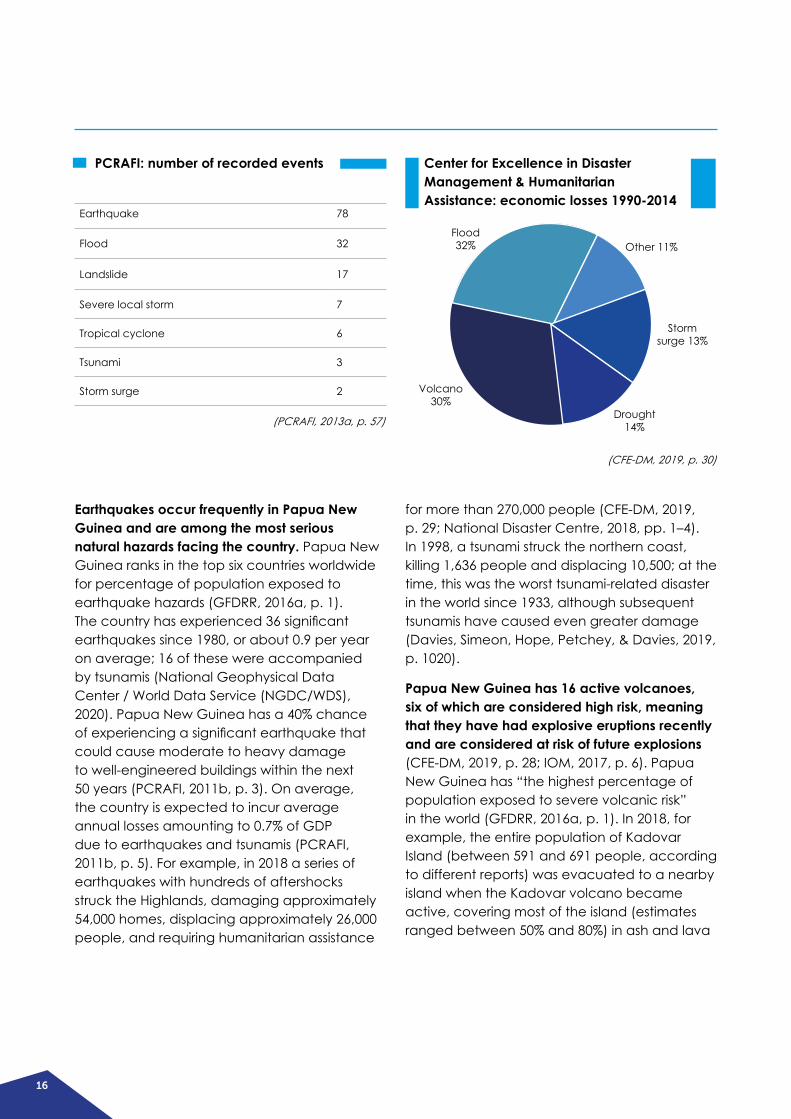
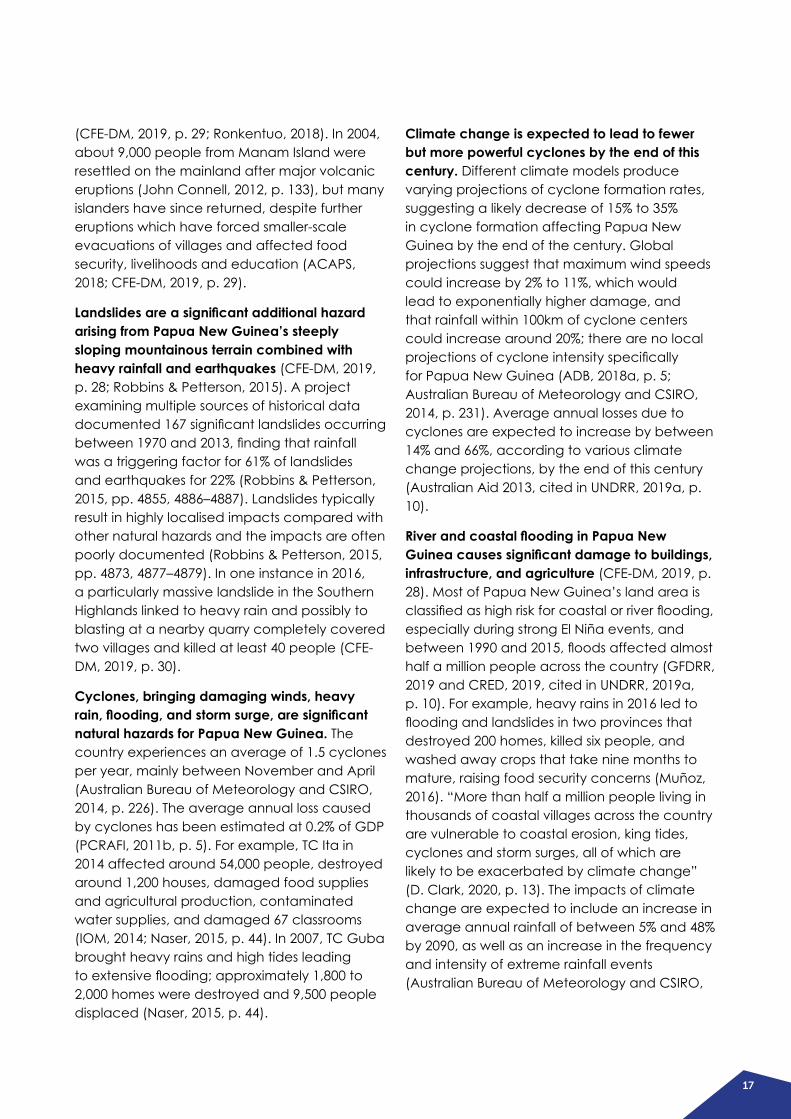
PCRAFI: number of recorded events Center for Excellence in Disaster Management & Humanitarian Assistance: economic losses 1990-2014
Earthquake 78
Flood 32
Landslide 17
Severe local storm 7
Tropical cyclone 6
Tsunami 3
Storm surge 2
(PCRAFI, 2013a, p. 57)
(CFE-DM, 2019, p. 30)
Other 11%
Storm surge 13%
Drought14%
Volcano30%
Flood32%
Earthquakes occur frequently in Papua New Guinea and are among the most serious natural hazards facing the country. Papua New Guinea ranks in the top six countries worldwide for percentage of population exposed to earthquake hazards (GFDRR, 2016a, p. 1). Thecountryhasexperienced36significantearthquakes since 1980, or about 0.9 per year on average; 16 of these were accompanied by tsunamis (National Geophysical Data Center / World Data Service (NGDC/WDS), 2020). Papua New Guinea has a 40% chance ofexperiencingasignificantearthquakethatcould cause moderate to heavy damage to well-engineered buildings within the next 50 years (PCRAFI, 2011b, p. 3). On average, the country is expected to incur average annual losses amounting to 0.7% of GDP due to earthquakes and tsunamis (PCRAFI, 2011b, p. 5). For example, in 2018 a series of earthquakes with hundreds of aftershocks struck the Highlands, damaging approximately 54,000 homes, displacing approximately 26,000 people, and requiring humanitarian assistance
for more than 270,000 people (CFE-DM, 2019, p. 29; National Disaster Centre, 2018, pp. 1–4). In 1998, a tsunami struck the northern coast, killing 1,636 people and displacing 10,500; at the time, this was the worst tsunami-related disaster in the world since 1933, although subsequent tsunamis have caused even greater damage (Davies, Simeon, Hope, Petchey, & Davies, 2019, p. 1020).
Papua New Guinea has 16 active volcanoes, six of which are considered high risk, meaning that they have had explosive eruptions recently and are considered at risk of future explosions (CFE-DM, 2019, p. 28; IOM, 2017, p. 6). Papua New Guinea has “the highest percentage of population exposed to severe volcanic risk” in the world (GFDRR, 2016a, p. 1). In 2018, for example, the entire population of Kadovar Island (between 591 and 691 people, according to different reports) was evacuated to a nearby island when the Kadovar volcano became active, covering most of the island (estimates ranged between 50% and 80%) in ash and lava
17
(CFE-DM, 2019, p. 29; Ronkentuo, 2018). In 2004, about 9,000 people from Manam Island were resettled on the mainland after major volcanic eruptions (John Connell, 2012, p. 133), but many islanders have since returned, despite further eruptions which have forced smaller-scale evacuations of villages and affected food security, livelihoods and education (ACAPS, 2018; CFE-DM, 2019, p. 29).
Landslides are a significant additional hazard arising from Papua New Guinea’s steeply sloping mountainous terrain combined with heavy rainfall and earthquakes (CFE-DM, 2019, p. 28; Robbins & Petterson, 2015). A project examining multiple sources of historical data documented167significantlandslidesoccurringbetween1970and2013,findingthatrainfallwas a triggering factor for 61% of landslides and earthquakes for 22% (Robbins & Petterson, 2015, pp. 4855, 4886–4887). Landslides typically result in highly localised impacts compared with other natural hazards and the impacts are often poorly documented (Robbins & Petterson, 2015, pp. 4873, 4877–4879). In one instance in 2016, a particularly massive landslide in the Southern Highlands linked to heavy rain and possibly to blasting at a nearby quarry completely covered two villages and killed at least 40 people (CFE-DM, 2019, p. 30).
Cyclones, bringing damaging winds, heavy rain, flooding, and storm surge, are significant natural hazards for Papua New Guinea. The country experiences an average of 1.5 cyclones per year, mainly between November and April (Australian Bureau of Meteorology and CSIRO, 2014, p. 226). The average annual loss caused by cyclones has been estimated at 0.2% of GDP (PCRAFI, 2011b, p. 5). For example, TC Ita in 2014 affected around 54,000 people, destroyed around 1,200 houses, damaged food supplies and agricultural production, contaminated water supplies, and damaged 67 classrooms (IOM, 2014; Naser, 2015, p. 44). In 2007, TC Guba brought heavy rains and high tides leading toextensiveflooding;approximately1,800to2,000 homes were destroyed and 9,500 people displaced (Naser, 2015, p. 44).
Climate change is expected to lead to fewer but more powerful cyclones by the end of this century. Different climate models produce varying projections of cyclone formation rates, suggesting a likely decrease of 15% to 35% in cyclone formation affecting Papua New Guinea by the end of the century. Global projections suggest that maximum wind speeds could increase by 2% to 11%, which would lead to exponentially higher damage, and that rainfall within 100km of cyclone centers could increase around 20%; there are no local projectionsofcycloneintensityspecificallyfor Papua New Guinea (ADB, 2018a, p. 5; Australian Bureau of Meteorology and CSIRO, 2014, p. 231). Average annual losses due to cyclones are expected to increase by between 14% and 66%, according to various climate change projections, by the end of this century (Australian Aid 2013, cited in UNDRR, 2019a, p. 10).
River and coastal flooding in Papua New Guinea causes significant damage to buildings, infrastructure, and agriculture (CFE-DM, 2019, p. 28). Most of Papua New Guinea’s land area is classifiedashighriskforcoastalorriverflooding,especially during strong El Niña events, and between1990and2015,floodsaffectedalmosthalf a million people across the country (GFDRR, 2019 and CRED, 2019, cited in UNDRR, 2019a, p. 10). For example, heavy rains in 2016 led to floodingandlandslidesintwoprovincesthatdestroyed 200 homes, killed six people, and washed away crops that take nine months to mature, raising food security concerns (Muñoz, 2016). “More than half a million people living in thousands of coastal villages across the country are vulnerable to coastal erosion, king tides, cyclones and storm surges, all of which are likely to be exacerbated by climate change” (D. Clark, 2020, p. 13). The impacts of climate change are expected to include an increase in average annual rainfall of between 5% and 48% by 2090, as well as an increase in the frequency and intensity of extreme rainfall events (Australian Bureau of Meteorology and CSIRO,
18
2014, pp. 228–230). The main population and commercial centres of Port Moresby and Lae are also vulnerable to rising sea levels (D. Clark, 2020, p. 13), which are expected to increase by 7 to 17 cm by 2030 and 41cm to 87cm by 2090 (Australian Bureau of Meteorology and CSIRO, 2014, p. 234).
Papua New Guinea is vulnerable to drought, and to frost at high elevations, which have serious impacts on subsistence agriculture. Droughts and frost are generally associated with the El Niño phenomenon, which affects precipitationpatternsacrossthePacific.Region-wide, high dependence on subsistence agriculturemakesPacificIslandsvulnerabletothe effects of El Niño, which include drought across the country as well as frost at high elevations (CFE-DM, 2019, p. 29; Thomalla & Boyland, 2017, p. 40). In Papua New Guinea, the
Samoa is ranked as the 94th most hazardous country in the world by WorldRiskIndex, placing it almost exactly on the median of the 180 countries ranked, on the basis of its exposure to natural hazards and coping capacity (Day et al., 2019). INFORM ranks Samoa 128th out of 191 countries on exposure to natural hazards, meaning that two-thirds of the countries in the world have higher exposure (IASC, 2020). Cyclones, bringing damaging winds, rainfall, flooding,swells,stormsurge,andtornadoes,arethemostsignificantnaturalhazardaffectingthe country. An IMF study estimates that Samoa hasa27%chanceofsufferingasignificant(based on EM-DAT data) disaster related to natural hazards each year (Lee et al., 2018, p. 7). PCRAFI estimates that cyclones, earthquakes, and tsunamis cause average annual damage and losses equivalent to 1.7% of GDP, and that within the next 50 years, Samoa has a 50% chance of experiencing a loss due to cyclones, earthquakes, or tsunamis valued at more
2015 El Niño caused drought, water shortages, and frost (at higher elevations), leading to crop failure, food shortages, and increased incidences of waterborne and respiratory diseases affecting about 40% of the population (Annamalai, Keener, Widlansky, & Hafner, 2015, pp. 4–5; CFE-DM, 2019, p. 29; Emilio, Warek, Poienou, Pomoso, Garalom, & Salimbi, 2015, pp. 1–12; Kuleshov et al., 2018, cited in UNDRR, 2019a, p. 9). The Ok Tedi gold and copper mine also closed due to the drying up of the nearby Fly River and lack of hydropower (Annamalai et al., 2015, pp. 4–6). Climate change is likely to lead to increased average rainfall by the end of the century, and the proportion of time spent in drought is expected to decrease in most locations under all scenarios (Australian Bureau of Meteorology and CSIRO, 2014, pp. 228–230).
than 23% of GDP and a 10% chance of a loss exceeding 62% of GDP (PCRAFI, 2011c, pp. 1, 5). The effects of climate change in Samoa by the end of this century are expected to include continued El Niño and La Niña events, rising annual mean temperatures and maximum daily temperatures, little change in mean annual rainfall but more extreme annual rainfall events, a slight decrease or no change in the incidence ofdrought,continuedoceanacidificationandincreased coral bleaching, continued sea-level rise, and slightly decreased frequency of cyclone formation but increased maximum wind speeds (Australian Bureau of Meteorology and CSIRO, 2014, pp. 242, 252). In a survey of Samoans in 2011-2012, respondents cited drought, lack of drinking water, water pollution, hightemperatures,andfloodingbyrainwaterand seawater as being the environmental changes that affected their lives most (Beyerl, Mieg, & Weber, 2018, p. 33).
1.4. Samoa

19
Risk score Risk quintile
Exposure 13.04 Medium
Vulnerability 47.50 Medium
Susceptibility 25.52 Medium
Lack of coping capacity 79.70 High
Lack of adaptive capacity 37.27 Medium
High risk Tsunami Cyclone
Medium risk CoastalfloodEarthquake Extreme heat
Low risk Landslide Volcano
Very low risk Wildfire
No data RiverfloodUrbanflood Water scarcity
Cyclone wind 1,193
Earthquake 17
WorldRiskReport
ThinkHazard
INFORM
Internal Displacement Monitoring Centre
Epidemic
Drought
Tropical Cyclone
Tsunami
Flood
Earthquake
Lack of coping Capacity
Vulerability
Natural hazard and exposure
Low(Day et al., 2019)
(GFDRR, 2020)
(IDMC, 2019)
Average expected displacements per year
(IASC, 2020)
Nat
ural
haz
ard
sO
vera
ll risk
High
Relative risk compared with other countries worldwide
Samoa – Natural Hazards
20
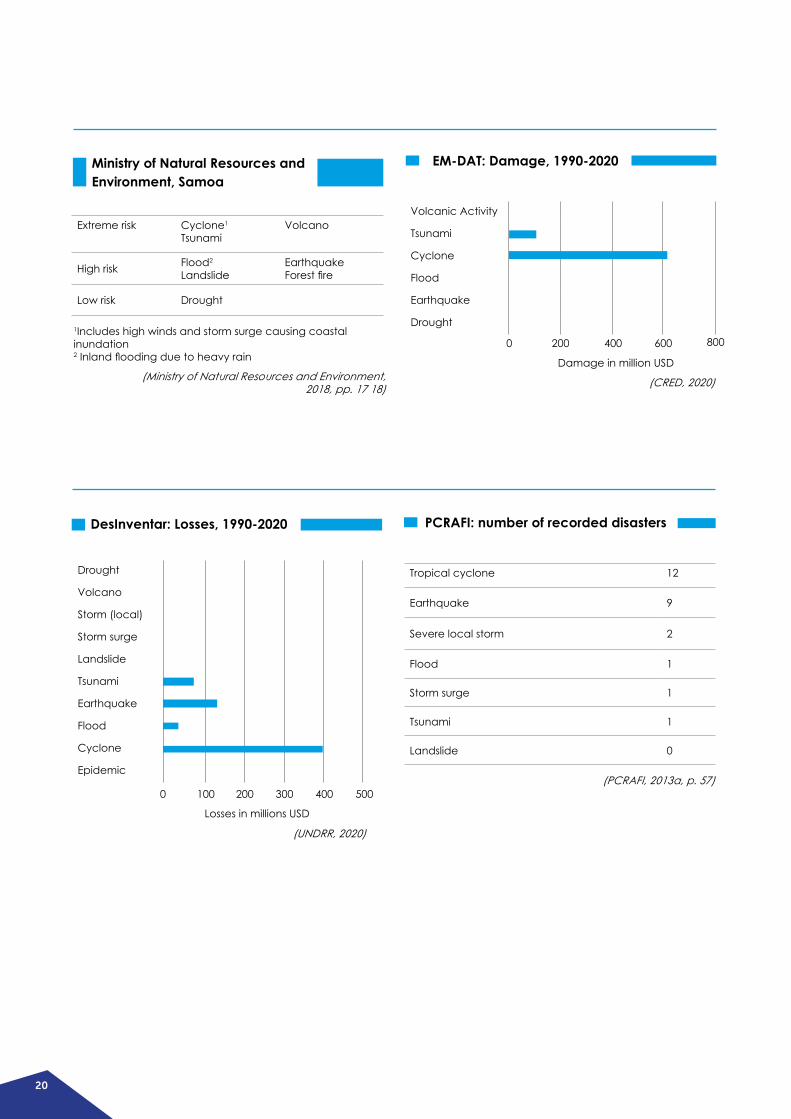
Ministry of Natural Resources and Environment, Samoa
Extreme risk Cyclone1
TsunamiVolcano
High risk Flood2
LandslideEarthquakeForestfire
Low risk Drought
EM-DAT: Damage, 1990-2020
Volcanic Activity
Tsunami
Cyclone
Flood
Earthquake
Drought
0 200 400 600 8001Includes high winds and storm surge causing coastal inundation2Inlandfloodingduetoheavyrain
(CRED, 2020)(Ministry of Natural Resources and Environment, 2018, pp. 17 18)
Damage in million USD
(UNDRR, 2020)
DesInventar: Losses, 1990-2020
Drought
Volcano
Storm (local)
Storm surge
Landslide
Tsunami
Earthquake
Flood
Cyclone
Epidemic
0 100 200 400300 500
Losses in millions USD
PCRAFI: number of recorded disasters
Tropical cyclone 12
Earthquake 9
Severe local storm 2
Flood 1
Storm surge 1
Tsunami 1
Landslide 0
(PCRAFI, 2013a, p. 57)

21
Cyclones, bringing damaging winds, rainfall, flooding, swells, storm surge, and tornadoes, are the most significant natural hazard for Samoa (Government of Samoa, 2009, p. 1, 2013, p. 1). The country experiences an average of 0.6 cyclones per year, mainly between November and April (Australian Bureau of Meteorology and CSIRO, 2014, p. 247). The average annual loss caused by cyclones has been estimated as 1.2% of GDP (PCRAFI, 2011c, p. 5). In 2012, TC Evan brought heavy rainfall and high winds, andcausedflashfloods,inflictingdamageand economic losses valued at approximately 29% of GDP (WST 465 million, USD 204 million) (Government of Samoa, 2013, pp. 5, 13). Atleastfivepeoplewerekilledand4,763displaced (Government of Samoa, 2013, p. 5). Climate models produce varying projections of cyclone formation rates, with half of the projections indicating decreases of 20% to 40% in cyclone formation affecting Samoa by the end of the century (Australian Bureau of Meteorology and CSIRO, 2014, p. 252).
Samoa is also at risk of earthquakes and tsunamis (PCRAFI, 2011c, p. 3), which are rare but can be extremely damaging when they do occur.Samoahasexperiencedfoursignificantearthquakes since 1980, or about one per decade on average (National Geophysical Data Center / World Data Service (NGDC/WDS), 2020). Samoa has a 40% chance of experiencingasignificantearthquakethatcould cause light to moderate damage to well-engineered buildings within the next 50 years (PCRAFI, 2011c, p. 3). On average, the country is expected to incur average annual losses amounting to 0.5% of GDP due to earthquakes and tsunamis (PCRAFI, 2011c, p. 5). In 2009, an undersea earthquake triggered a tsunami that impacted 50 villages, causing damage and loss estimated at WST 310 million (USD 124 million; 22% of GDP), and killed 143 people; it took only 20 minutes for the tsunami wave to arrive following the earthquake, allowing very little time to give warning (Government of Samoa, 2009, pp. 2–3, 38).
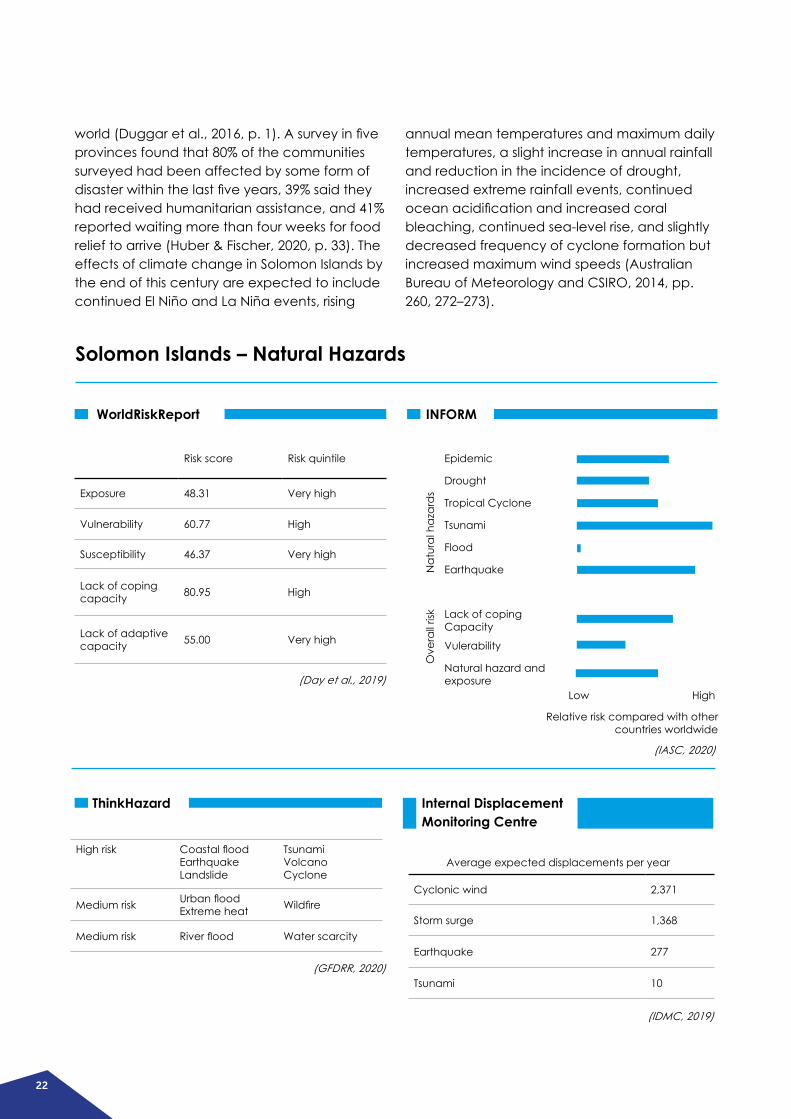
Solomon Islands is ranked as the fourth riskiest country in the world by WorldRiskIndex on the basis of its high exposure to natural hazards and relatively low coping capacity (Day et al., 2019). INFORM ranks Solomon Islands 63rd out of 191 countries on exposure to natural hazards, meaning that two-thirds of the countries in the world have higher exposure (IASC, 2020). Tropical cyclones with accompanying heavyrainandfloods,andearthquakeswithaccompanying tsunamis and landslides, are the principal hazards affecting Solomon Islands. Tropical cyclones with accompanying heavyrainandfloods,andearthquakeswithaccompanying tsunamis and landslides, are the principal hazards affecting Solomon Islands. An
IMF study estimates that Solomon Islands has a 51%chanceofsufferingasignificant(basedonEM-DAT data) disaster related to natural hazards each year (Lee et al., 2018, p. 7). PCRAFI estimates that cyclones, earthquakes, and tsunamis cause average annual damage and losses equivalent to 3.0% of GDP and that within the next 50 years Solomon Islands has a 50% chance of experiencing a loss due to cyclones, earthquakes, or tsunamis valued at more than 35% of GDP and a 10% chance of a loss exceeding 78% of GDP (PCRAFI, 2011d, pp. 1, 5). Another analysis of annual losses due to natural hazards found that from 1980 to 2015, Solomon Islands suffered annual losses valued at 8.0% ofGDP,thefifthhighestestimatedlossesinthe
1.5. Solomon Islands
22
world(Duggaretal.,2016,p.1).Asurveyinfiveprovinces found that 80% of the communities surveyed had been affected by some form of disasterwithinthelastfiveyears,39%saidtheyhad received humanitarian assistance, and 41% reported waiting more than four weeks for food relief to arrive (Huber & Fischer, 2020, p. 33). The effects of climate change in Solomon Islands by the end of this century are expected to include continued El Niño and La Niña events, rising
annual mean temperatures and maximum daily temperatures, a slight increase in annual rainfall and reduction in the incidence of drought, increased extreme rainfall events, continued oceanacidificationandincreasedcoralbleaching, continued sea-level rise, and slightly decreased frequency of cyclone formation but increased maximum wind speeds (Australian Bureau of Meteorology and CSIRO, 2014, pp. 260, 272–273).
Solomon Islands – Natural Hazards
Risk score Risk quintile
Exposure 48.31 Very high
Vulnerability 60.77 High
Susceptibility 46.37 Very high
Lack of coping capacity 80.95 High
Lack of adaptive capacity 55.00 Very high
WorldRiskReport INFORM
Epidemic
Drought
Tropical Cyclone
Tsunami
Flood
Earthquake
Lack of coping Capacity
Vulerability
Natural hazard and exposure
Low(Day et al., 2019)
(IASC, 2020)
Nat
ural
haz
ard
sO
vera
ll risk
High
Relative risk compared with other countries worldwide
High risk CoastalfloodEarthquakeLandslide
TsunamiVolcanoCyclone
Medium risk UrbanfloodExtreme heat Wildfire
Medium risk Riverflood Water scarcity
Cyclonic wind 2,371
Storm surge 1,368
Earthquake 277
Tsunami 10
ThinkHazard Internal Displacement Monitoring Centre
(GFDRR, 2020)
(IDMC, 2019)
Average expected displacements per year

23
(CRED, 2020)
(UNDRR, 2020)
EM-DAT: Damage, 1990-2020 DesInventar: Losses, 1990-2020
Volcanic Activity
Tsunami
Cyclone
Flood
Earthquake
Drought
Drought
Volcano
Storm (local)
Storm surge
Landslide
Tsunami
Earthquake
Flood
Cyclone
Epidemic
0
0
10 20
5 10
30
Damage in million USD
Losses in millions USD
PCRAFI: number of recorded disasters
Earthquake 28
Tropical cyclone 25
Severe local storm 3
Flood 3
Landslide 1
Storm surge 1
Tsunami 0
(PCRAFI, 2013a, p. 57)
24
Solomon Islands experiences an average of 2.9 cyclones per year, mainly between November and April (Australian Bureau of Meteorology and CSIRO, 2014, p. 267). The average annual loss caused by cyclones has been estimated as equivalent to 0.9% of GDP (PCRAFI, 2013b, p. 1). Cyclones that affect the Solomon Islands are usually in the early stages of their life cycle and relatively small, but can still cause serious damage (Meteorological Services Division, n.d.).Majorfloodsassociatedwithcyclonesorheavy rains have occurred about once every four years on average in the capital, Honiara, and the island of Guadalcanal (12 times in 48 years between 1966 and 2014) (Government of Solomon Islands, 2014, p. 2). For example, in 2014, a slow-moving storm that later developed into TC Ita caused at least 732mm of rain over fourdays,resultinginflashfloodinginHoniaraand Guadalcanal that killed 23 people, displaced 10,000 people, destroyed 675 houses and damaged 3,726, damaged or destroyed food gardens and sources of livelihoods, and caused total damage and economic loss estimated at SBD 787 million (USD 109 million, 9.2% of GDP) (Government of Solomon Islands, 2014, pp. 1, 27). In 2015, TC Raquel brought heavy rains across four provinces, with one location reporting as much as 282 millimetres of rainfall in a 24-hour period; one person died, more than 150 buildings were destroyed or damaged, and almost 40,000 food gardens weredamaged(AonBenfield,2015,p.8).Climate change models produce varying projections of cyclone formation rates, with a majority suggesting a likely decrease of 15% to 35% in cyclone formation affecting Tonga by the end of the century (Australian Bureau of Meteorology and CSIRO, 2014, p. 273).
Droughts have serious impacts on subsistence agriculture and on water supplies across Solomon Islands. Droughts are generally associated with the El Niño phenomenon, which affects precipitation patterns across the Pacific,andhighdependenceonsubsistenceagriculturemakesPacificIslandcountriesvulnerable to the effects of El Niño including drought (Thomalla & Boyland, 2017, p. 40). The drought that occurred during the 2015-2016 El Niño, for example, affected water supplies, food security, and livelihoods across the country, and led to schools and health centres closing due to lack of water (OCHA, 2015, pp. 1, 6; Solomon Islands Government, 2015, pp. 10–11). Climate change is likely to lead to the incidence of drought decreasing slightly by the end of the century. Annual average rainfall is projected to increase slightly, although there is a lack of consensus about the exact amount of change and the year-to-year variability is generally greater than the projected changes. The incidence of drought is projected to decrease slightly, although there is some uncertainty about rainfall projections and about potential changes in the El Niño phenomenon (Australian Bureau of Meteorology and CSIRO, 2014, pp. 260, 269–272).
Sea-level rise in Solomon Islands poses threats to low-lying islands and coastal areas. Sea-level rise over the past 20 years has averaged 7-10 mm per year, which is more than three times the global average rate of 2.2mm per year (Nunn, 2013, cited in Filho, Ha’apio, Lutz, & Li, 2020, p. 180). A study in two provinces in 2014, forexample,identifiedfivereefislandsthathad been completely eroded away, six islands that had been reduced in area by more than 20%, and two sites where shoreline recession
25
had destroyed part or all of some villages and led to communities relocating inland (Albert, Leon, Grinham, Church, Gibbes, & Woodroffe, 2016). Rising sea levels also cause salt water to intrude into the water table on low-lying islands, affecting water supplies and agricultural land (Filho et al., 2020, p. 180).
Earthquakes occur frequently in Solomon Islands. The country has experienced 29 significantearthquakessince1980,orabout0.7per year on average (National Geophysical Data Center / World Data Service (NGDC/WDS), 2020). Solomon Islands has a 40% chance ofexperiencingasignificantearthquakethatcould cause moderate to heavy damage to well-engineered buildings within the next 50 years (PCRAFI, 2011d, p. 3). On average,
the country is expected to incur average annual losses amounting to 2.2% of GDP due to earthquakes and tsunamis (PCRAFI, 2011d, p. 5). For example, in the Santa Cruz Islands in 2013, a magnitude 8.0 earthquake caused a tsunami that inundated areas up to 1km inland, killed 10 people and 15 injured, destroyed 588 houses and damaged 478, and damaged infrastructure and crops; aftershocks from the earthquake also caused landslides that buried food gardens (Government of Solomon Islands, 2013, p. 4). In 2016, an undersea earthquake of magnitude 8.0 caused ground shaking and a tsunami affecting three provinces, destroying 485 houses and damaging another 349, and damaging eleven schools and a health clinic (IFRC [International Federation of Red Cross and Red Crescent Societies], 2016a, p. 2, 2016b).
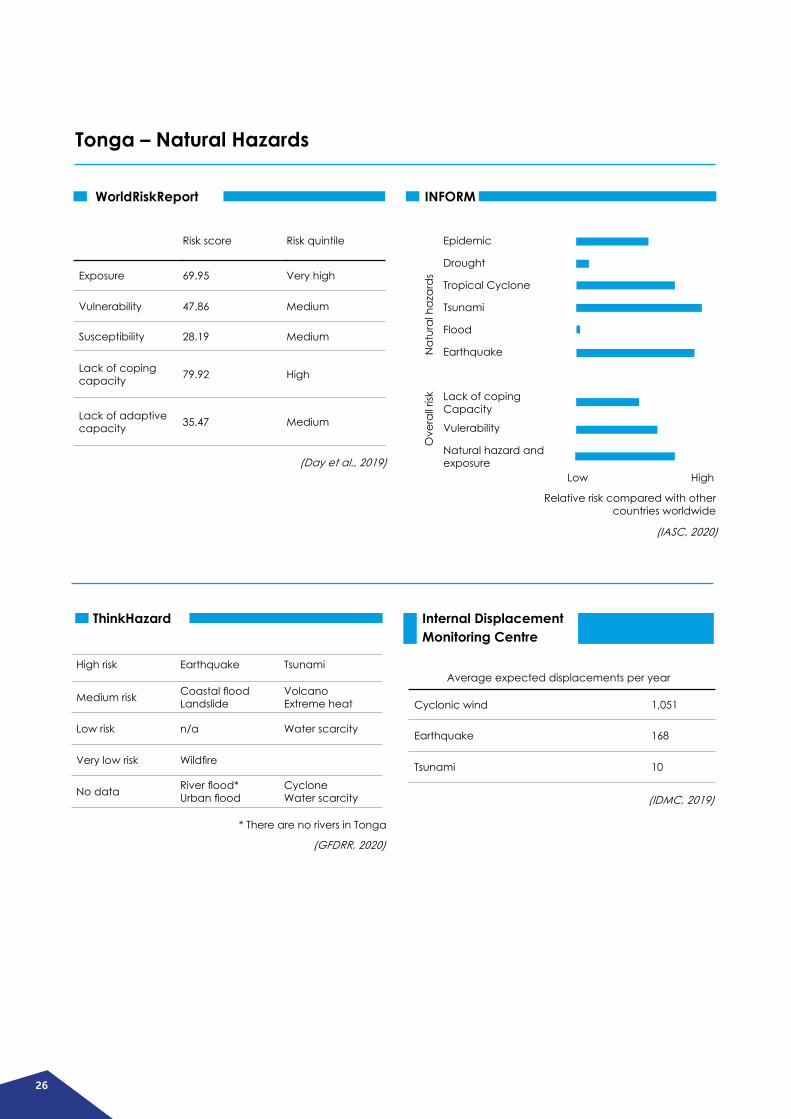
Tonga is ranked as the third most hazardous country in the world by WorldRiskIndex on the basis of its high exposure to natural hazards and relatively low coping capacity (Day et al., 2019). INFORM ranks Tonga joint 50th (tied with Vanuatu) out of 191 countries on exposure to natural hazards, meaning that approximately one quarter of the countries of the world have higher exposure (IASC, 2020). An IMF study estimates that Tonga has a 30% chance of sufferingasignificant(basedonEM-DATdata)disaster related to natural hazards each year (Lee et al., 2018, p. 7). Tropical cyclones are the principal hazard affecting Tonga, although the country is also exposed to earthquakes and tsunamis (PCRAFI, 2015, p. 15; WFP [World Food Programme], 2012, p. 24). PCRAFI estimates that cyclones, earthquakes, and tsunamis cause average annual damage and losses equivalent to 4.3% of GDP, and that within the next 50
years, Tonga has a 50% chance of experiencing a loss due to cyclones, earthquakes, or tsunamis valued at more than 49% of GDP and a 10% chance of a loss exceeding 120% of GDP (PCRAFI, 2011e, pp. 1, 5). The effects of climate change by the end of this century are expected to include fewer but more powerful cyclones, continuing El Niño and La Niña events, more extreme rainfall events, increased oceanacidification,increasedcoralbleaching,continued rising sea levels, and rising daily temperatures with greater extremes (Australian Bureau of Meteorology and CSIRO, 2014, p. 282; Government of Tonga, 2018a, p. 18). A survey of Tongans’ perceptions of weather-related hazards indicated that cyclones, heavy rainfall,floodingwithrainwaterandseawater,soil erosion (particularly in coastal areas), lack of drinking water, and high temperatures were seenassignificantimpactsofclimatechange(Beyerl et al., 2018, p. 33).
1.6. Tonga
26
Tonga – Natural Hazards
Risk score Risk quintile
Exposure 69.95 Very high
Vulnerability 47.86 Medium
Susceptibility 28.19 Medium
Lack of coping capacity 79.92 High
Lack of adaptive capacity 35.47 Medium
WorldRiskReport INFORM
Epidemic
Drought
Tropical Cyclone
Tsunami
Flood
Earthquake
Lack of coping Capacity
Vulerability
Natural hazard and exposure
Low(Day et al., 2019)
(IASC, 2020)
Nat
ural
haz
ard
sO
vera
ll risk
High
Relative risk compared with other countries worldwide
High risk Earthquake Tsunami
Medium risk CoastalfloodLandslide
VolcanoExtreme heat
Low risk n/a Water scarcity
Very low risk Wildfire
No data Riverflood*Urbanflood
CycloneWater scarcity
Cyclonic wind 1,051
Earthquake 168
Tsunami 10
ThinkHazard Internal Displacement Monitoring Centre
(GFDRR, 2020)
*TherearenoriversinTonga
(IDMC, 2019)
Average expected displacements per year
27
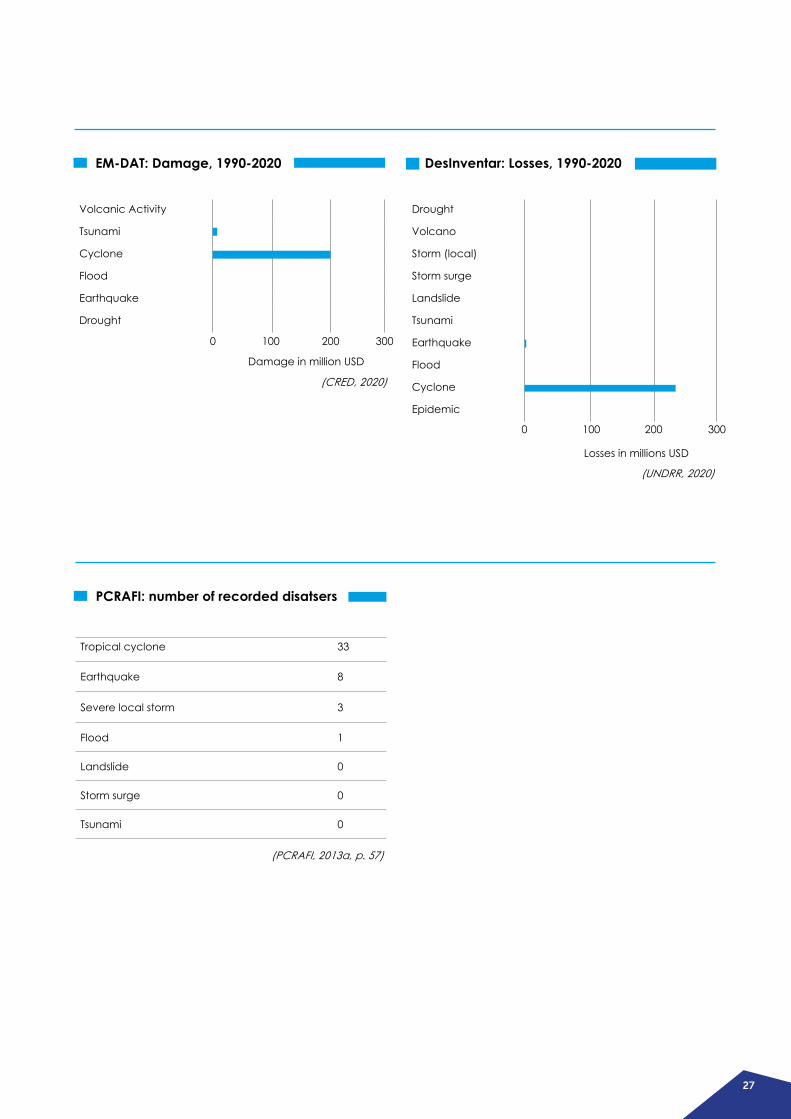
(CRED, 2020)
(UNDRR, 2020)
EM-DAT: Damage, 1990-2020 DesInventar: Losses, 1990-2020
Volcanic Activity
Tsunami
Cyclone
Flood
Earthquake
Drought
Drought
Volcano
Storm (local)
Storm surge
Landslide
Tsunami
Earthquake
Flood
Cyclone
Epidemic
0
0
100 200
100 200 300
300
Damage in million USD
Losses in millions USD
PCRAFI: number of recorded disatsers
Tropical cyclone 33
Earthquake 8
Severe local storm 3
Flood 1
Landslide 0
Storm surge 0
Tsunami 0
(PCRAFI, 2013a, p. 57)
28
Cyclones, bringing damaging winds, heavy rain, and storm surges, are the most significant natural hazard for Tonga. Since 1960, Tonga has been hit by an average of 1.6 tropical cyclones per year (Government of Tonga, 2018a, p. 3; Kingdom of Tonga, 2019, p. 9). The average annual loss caused by cyclones is estimated as 2.7% of GDP (PCRAFI, 2011e, p. 5). Two major cyclones have hit Tonga in the past ten years: in 2014, TC Ian caused damage and loss equivalent to 11% of Tonga’s GDP; and in 2018 TC Gita caused damage and loss worth between 30% and 38% of GDP and reduced GDP growth in 2018 from an anticipated 3.0% to only 0.3% (Ministry of Finance and National Planning, 2018, p. 11; World Bank, 2018c, p. 8, 2020e; WTO, 2019b, p. 1). The death toll for both storms was very low, with only one death attributed to Ian and none to Gita (CRED, 2020; UNDRR, 2020).
Most settlements in Tonga are in low-lying coastal areas vulnerable to flooding when heavy rain, storm surge, tides and sea swell combine (Kingdom of Tonga, 2019, pp. 97–99). Most of the urban area of the capital, Nuku’alofa, is less than two metres above sea levelandissubjecttoperiodicfloodingduringheavy rain (Kingdom of Tonga, 2019, p. 99). The most severe storm surge, caused by TC Isaac in 1982 in combination with a high spring tide, reached 1.6 metres, inundating 30% of the island of Tongatapu (WFP, 2012, p. 10).
Surface flooding can occur as a result of heavy rainfall, but does not usually pose high risks (WFP, 2012, p. 10). Flooding can cause damage to agriculture, buildings, and infrastructure, but Tonga’s islands are small with no rivers, and soils are relatively free-draining, so surface water is not concentrated and dissipates within two or three days (WFP, 2012, p. 10). Most of Nuku‘alofa is less than two metres above
sea-levelandissubjecttofrequentflooding(Kingdom of Tonga, 2019, p. 184). A community survey carried out as part of an ADB project foundthatfloodinginNuku‘alofaoccurseveryyear, with approximately 10% of the properties in the city every time it rains, and about 50% floodedafterheavyrains(Gildea&Carmine,2018, p. 6; Kingdom of Tonga, 2019, p. 184).
Climate change is expected to lead to an increase in the frequency and intensity of extreme rainfall events, and a trend of more rainfall in the rainy season and less in the dry season (Kingdom of Tonga, 2019, p. 85). Rainfall events that currently occur once in 20 years are projected to occur three to four times per 20-year period by 2055 under the lowcarbonemissionsscenario,andfivetimesper 20-year period by 2090 under the high emissions scenario (Kingdom of Tonga, 2019, p. 87). Sea level is also expected to continue to rise by between 3cm and 17cm by 2030, and between 9cm and 31cm by 2055, which will increase the impact of storm surges and coastalflooding(KingdomofTonga,2019,p.87). Climate change models produce varying projections of cyclone formation rates, with a majority suggesting a likely decrease of 10% to 40% in cyclone formation affecting Tonga by the end of the century (Australian Bureau of Meteorology and CSIRO, 2014, p. 294).
Droughts in Tonga are infrequent, but can have serious impacts on agriculture, ecosystems, water resources, emergency management, and disease when they do occur (Kingdom of Tonga, 2019, p. 11; WFP, 2012, p. 18). Four major droughts occurred between 1983 and 2015 (Government of Tonga, 2018a, p. 9; WFP, 2012, p. 18). Droughts are generally associated with the El Niño phenomenon, during which areas of warmer ocean surface temperatures, which support cloud formation, shift eastwards
29
(WFP, 2012, p. 18). Past droughts have affected harvests of coconuts, fruits, and root crops that are traditional staples, adversely affecting food security, customary obligations, and the country’s economy (Government of Tonga, 2018a, p. 9; WFP, 2012, p. 18). Droughts in 1998 and 2014, for example, reduced squash exports by 52% and 69%, respectively (Government of Tonga, 2018a, p. 10). Droughts also affect drinking water supplies, as most Tongans depend on collecting rain water; during the 1997-98 El Niño, for example, the government had to ship water to some islands in the Ha‘apai group (WFP, 2012, p. 18). Climate projections for the end of the century indicate a likely increase in precipitation during the rainy season and a decrease in precipitation during the dry season, but “there is uncertainty around rainfall projections” and “drought projections are inconsistent” (Kingdom of Tonga, 2019, pp. 86–88).
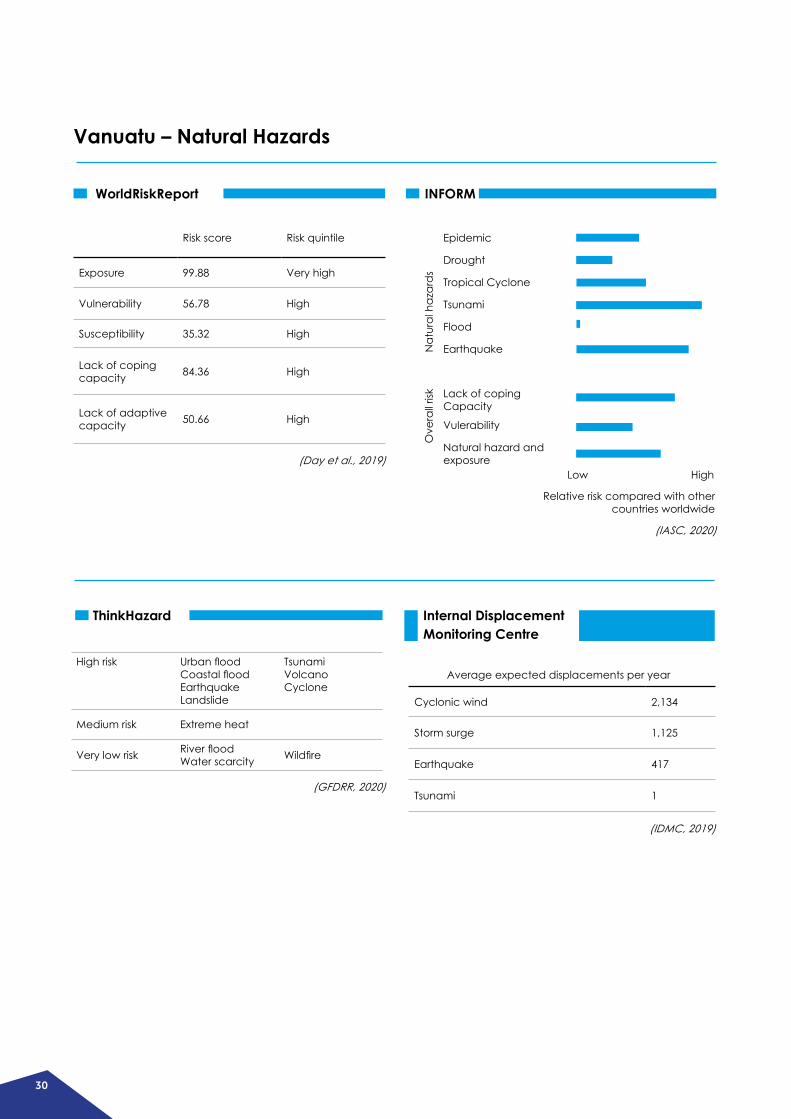
Vanuatu is ranked as the most hazardous country in the world by WorldRiskIndex on the basis of its high exposure to natural hazards and relatively low coping capacity (Day et al., 2019). INFORM ranks Vanuatu joint 50th (tied with Tonga) out of 191 countries on exposure to natural hazards, meaning that approximately one quarter of the countries of the world have higher exposure (IASC, 2020). Tropical cyclones and earthquakes are the principal hazards affecting Vanuatu, although the country is also exposed to volcanoes, tsunamis, and droughts. An IMF study estimates that Vanuatu has a 57%chanceofsufferingasignificant(basedon EM-DAT data) disaster related to natural hazards each year (Lee et al., 2018, p. 7). PCRAFI estimates that cyclones, earthquakes,
Tonga is also at risk of earthquakes and tsunamis (PCRAFI, 2011e, p. 3). Such events are rare, but can be extremely damaging when theydooccur.Tongahasexperiencedfivesignificantearthquakessince1980,oraboutoneper decade on average (National Geophysical Data Center / World Data Service (NGDC/WDS), 2020). A tsunami that struck the island of Niuatoputapu in 2009 killed nine people and destroyed 31% of all houses on the island, the water and sanitation system and most other public utilities, most government buildings including the island’s hospital, and most boats, as well as damaging other houses and buildings (Kingdom of Tonga, 2009, p. 6). Tonga has a40%chanceofexperiencingasignificantearthquake that could cause heavy damage to well-engineered buildings within the next 50 years (PCRAFI, 2011e, p. 3). On average, the country is expected to incur damage amounting to 1.7% of GDP due to earthquakes and tsunamis (PCRAFI, 2011e, p. 5).
and tsunamis cause average annual damage and losses equivalent to 6.6% of GDP, and that within the next 50 years, Vanuatu has a 50% chance of experiencing a loss due to cyclones, earthquakes, or tsunamis valued at more than 45% of GDP and a 10% chance of a loss exceeding 74% of GDP (PCRAFI, 2011f, pp. 1, 5). The effects of climate change in Vanuatu by the end of this century are expected to include continued El Niño and La Niña events, rising annual mean temperatures and maximum daily temperatures,continuedoceanacidificationand increased coral bleaching, continued sea-level rise, and slightly decreased frequency of cyclone formation but increased maximum wind speeds (Australian Bureau of Meteorology and CSIRO, 2014, pp. 320–339).
1.7. Vanuatu
30
Vanuatu – Natural Hazards
Risk score Risk quintile
Exposure 99.88 Very high
Vulnerability 56.78 High
Susceptibility 35.32 High
Lack of coping capacity 84.36 High
Lack of adaptive capacity 50.66 High
WorldRiskReport INFORM
Epidemic
Drought
Tropical Cyclone
Tsunami
Flood
Earthquake
Lack of coping Capacity
Vulerability
Natural hazard and exposure
Low(Day et al., 2019)
(IASC, 2020)
Nat
ural
haz
ard
sO
vera
ll risk
High
Relative risk compared with other countries worldwide
High risk UrbanfloodCoastalfloodEarthquakeLandslide
TsunamiVolcanoCyclone
Medium risk Extreme heat
Very low risk RiverfloodWater scarcity Wildfire
Cyclonic wind 2,134
Storm surge 1,125
Earthquake 417
Tsunami 1
ThinkHazard Internal Displacement Monitoring Centre
(GFDRR, 2020)
(IDMC, 2019)
Average expected displacements per year

31
(CRED, 2020)
(UNDRR, 2020)
EM-DAT: Damage, 1990-2020 DesInventar: Losses, 1990-2020
Volcanic Activity
Tsunami
Cyclone
Flood
Earthquake
Drought
Drought
Volcano
Storm (local)
Storm surge
Landslide
Tsunami
Earthquake
Flood
Cyclone
Epidemic
0
0
250 500
100
Damage in million USD
Losses in millions USD
PCRAFI: number of recorded disasters
Tropical cyclone 50
Earthquake 26
Severe local storm 2
Flood 3
Landslide 1
Storm surge 0
Tsunami 0
(PCRAFI, 2013a, p. 57)
32
Cyclones, bringing damaging winds, heavy rain, flooding, and storm surge, are the most significant natural hazard for Vanuatu. The country experiences an average of 2 to 2.4 cyclones per year, mainly between November and April (Australian Bureau of Meteorology and CSIRO, 2014, p. 320; Handmer & Iveson, 2017, p. 60). Storm surges associated with cyclones,andfloodingduetoheavyrains,arecommon occurrences (Jackson, McNamara, & Witt, 2017, p. 365). Landslides are also occasionally triggered by precipitation from cyclones (Jackson et al., 2017, p. 365). The average annual loss caused by cyclones has been estimated as 5.0% of GDP (PCRAFI, 2011f, p. 5). Climate change models produce varying projections of cyclone formation rates, with a majority suggesting a likely decrease of 15% to 35% in cyclone formation affecting Vanuatu by the end of the century (Australian Bureau of Meteorology and CSIRO, 2014, p. 333).
In 2015, Tropcal cyclone Pam, the most intense cyclone in the country’s history, caused widespread damage and economic loss. The storm caused damage and loss estimated at 64% of GDP, temporarily displaced 65% of householdsinaffectedareas(mostlyfindingshelter with friends, family, or community shelters in their local areas), destroyed crops on a large scale leading to food security issues and reliance on emergency food aid, damaged and contaminated water supplies, damaged 81% of homes in affected areas, and “compromised the livelihoods of at least 80%
of Vanuatu’s rural population” (Government of Vanuatu, 2015b, pp. ix, 3; Handmer & Nalau, 2019, p. 374; SPC [Secretariat of the PacificCommunity],2016,pp.6,11;WFP,2016,pp. 5–6). Heavy rain and storm surge led to coastalandfluvialflooding,anddamagetobuildings and other infrastructure in some areas (Government of Vanuatu, 2015b, pp. 34, 56, 62; Rey, Le Dé, Leone, & Gilbert, 2017, pp. 263–266). Only 11 people were killed as a result of the cyclone, which is low considering the extensive damagetopropertythatitinflicted;thelowdeath toll is attributed both to government preparedness and to the resilience of the Ni-Vanuatu11, who are experienced at dealing with cyclones (Dornan & Newton Cain, 2015, p. 24). A study on Efate island indicated that recovery from TC Pam at the local village level could takeanywherefromfivemonthstothreeyears:some respondents reported that crops and fruit trees could take a year and a half to be re-established, and that rebuilding most houses took two to three years with some houses still not fully repaired up to four years after the cyclone, while other respondents reported that food supplies were fully available within one to two months, that communities had essentially recoveredinfourtofivemonths,andthatmosthouses were rebuilt within one year (Jennings, Manlutac, Gonzales, Kenni, Schweizer, & Giardina, 2020, p. 29). Estimates of the decrease in the country’s GDP growth rate attributable to the cyclone vary from 2.0 to 2.8 percentage points (Lee et al., 2018, p. 22; WTO, 2019b, p. 1).
11The people of Vanuatu.
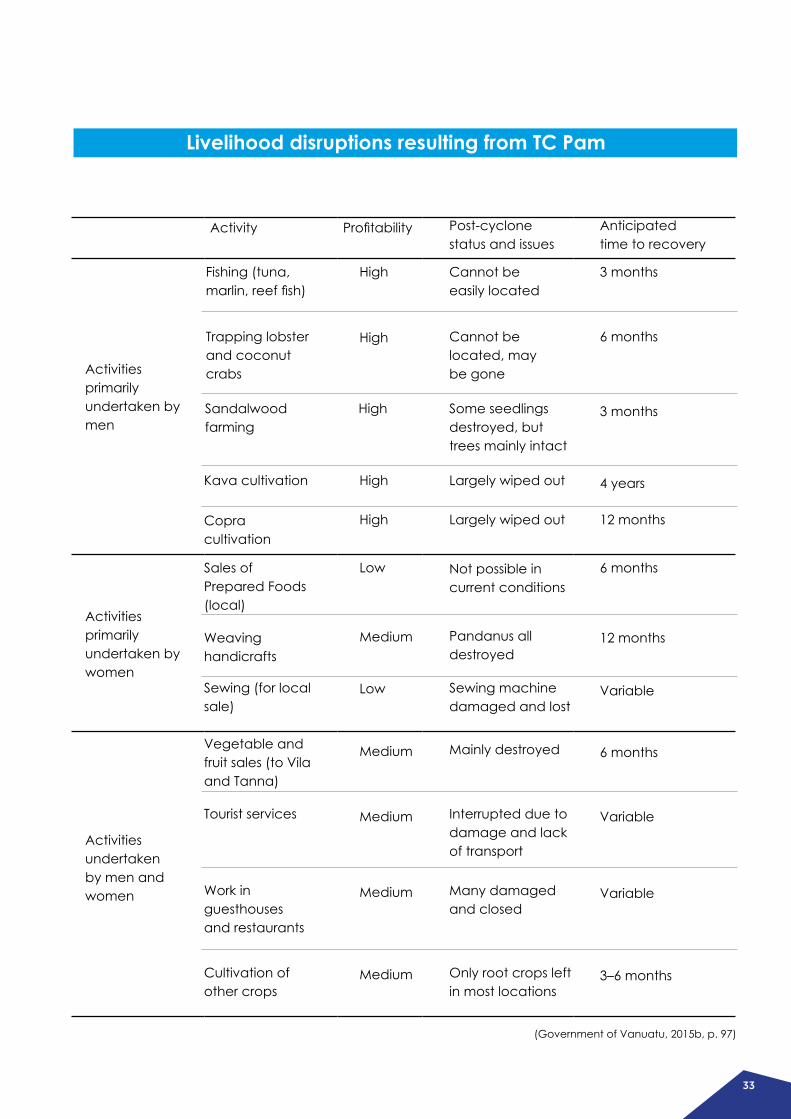
33
Activity Profitability
Fishing (tuna, marlin,reeffish)
Activities primarily undertaken by men
Activities primarily undertaken by women
Activities undertaken by men and women
Trapping lobster and coconut crabs
Sandalwood farming
Kava cultivation
Copra cultivation
Sales of Prepared Foods (local)
Weaving handicrafts
Sewing (for local sale)
Vegetable and fruit sales (to Vila and Tanna)
Tourist services
Work in guesthouses and restaurants
Cultivation of other crops
High
High
High
High
High
Low
Medium
Low
Medium
Medium
Medium
Medium
Cannot be easily located
Post-cyclone status and issues
Cannot be located, may be gone
Some seedlings destroyed, but trees mainly intact
Largely wiped out
Largely wiped out
Not possible in current conditions
Pandanus all destroyed
Sewing machine damaged and lost
Mainly destroyed
Interrupted due to damage and lack of transport
Many damaged and closed
Only root crops left in most locations
3 months
Anticipated time to recovery
6 months
3 months
4 years
12 months
6 months
12 months
Variable
6 months
Variable
Variable
3–6 months
Livelihood disruptions resulting from TC Pam
(Government of Vanuatu, 2015b, p. 97)
34
Droughts have serious impacts on subsistence agriculture and on water supplies, which in Vanuatu are heavily dependent on rainwater harvesting. Droughts are generally associated with the El Niño phenomenon, which affects precipitationpatternsacrossthePacific.Region-wide, high dependence on subsistence agriculturemakesPacificIslandsvulnerableto the effects of El Niño conditions including drought (Thomalla & Boyland, 2017, p. 40). In Vanuatu, the drought that occurred during the 2016 El Niño led to shortages of drinking water, hindered the regrowth of crops damaged by TC Pam the previous year, and required emergency food distribution targeting 90,000 people (Eriksson et al., 2017, p. 52; OCHA [UnitedNationsOfficefortheCoordinationofHumanitarian Affairs], 2015, p. 4). The impact of climate change on the risk of drought is uncertain: the incidence of drought may remain approximately unchanged under most carbon emissions scenarios, and may decrease slightly under conditions of high emissions, but these projectionscarryalowdegreeofconfidencebecause there is a lack of consensus on projections of average rainfall and on potential changes in the El Niño phenomenon, which directlyinfluencesdrought(AustralianBureauofMeteorology and CSIRO, 2014, pp. 331–332).
Vanuatu is also at risk of earthquakes and tsunamis (PCRAFI, 2011f, p. 3). Vanuatu has experienced24significantearthquakessince 1980, or about 0.6 per year (National Geophysical Data Center / World Data Service (NGDC/WDS), 2020). The most recent non-volcanic earthquake, of magnitude 7.0, occurred in Malampa province in April 2016 and led to coastal uplift with associated coral death,lossoffishinggroundsandreducedseaaccessforfishingbutnosignificantdamagetocrops or property (Eriksson et al., 2017, p. 52).
Vanuatu has a 40% chance of experiencing a significantearthquakethatcouldcauseheavydamage to well-engineered buildings within the next 50 years (PCRAFI, 2011f, p. 3). On average, the country is expected to incur damage amounting to 1.5% of GDP due to earthquakes and tsunamis (PCRAFI, 2011f, p. 5).
Most of Vanuatu’s islands are volcanic in origin, and there are six active volcanoes in the country which have triggered humanitarian relief efforts and large-scale evacuations several times in recent years. Mount Yasur on Tanna Island (population approximately 29,000), for example, is an almost continuously active volcano that emits gases, smoke, ash, and frequent bursts of lava (Nimau, Ungaro, Crowley, Korisa, Garaebiti, & Cevuard, 2019, pp. 7, 11–12). Ash, in particular, routinely affects large areas of the island, with larger eruptions sometimespromptingsignificanthumanitarianinterventions. An eruption in 2013 damaged most of the vegetation across the Whitesands district and led to a humanitarian relief effort costing about VUV 47 million (approximately USD 493,000), mostly funded by the Vanuatu government with some assistance from China and New Zealand (Nimau et al., 2019, pp. 12–15), and another ash fall in 2016 affected 20,000 people and led to a humanitarian relief effort costing at least VUV 150 million (approximately USD 1.4 million) (PCRAFI, 2018, p. 1). More recently, eruptions of the volcano Manaro Voui on Ambae Island led to evacuating the entire population, approximately 11,000 people, to other islands in 2017 for a month, and then again in mid-2018 for approximately six months (IDMC, 2018, p. 31; IOM, 2019; PCRAFI, 2018, pp. 2–5; WTO, 2019b, p. 27).
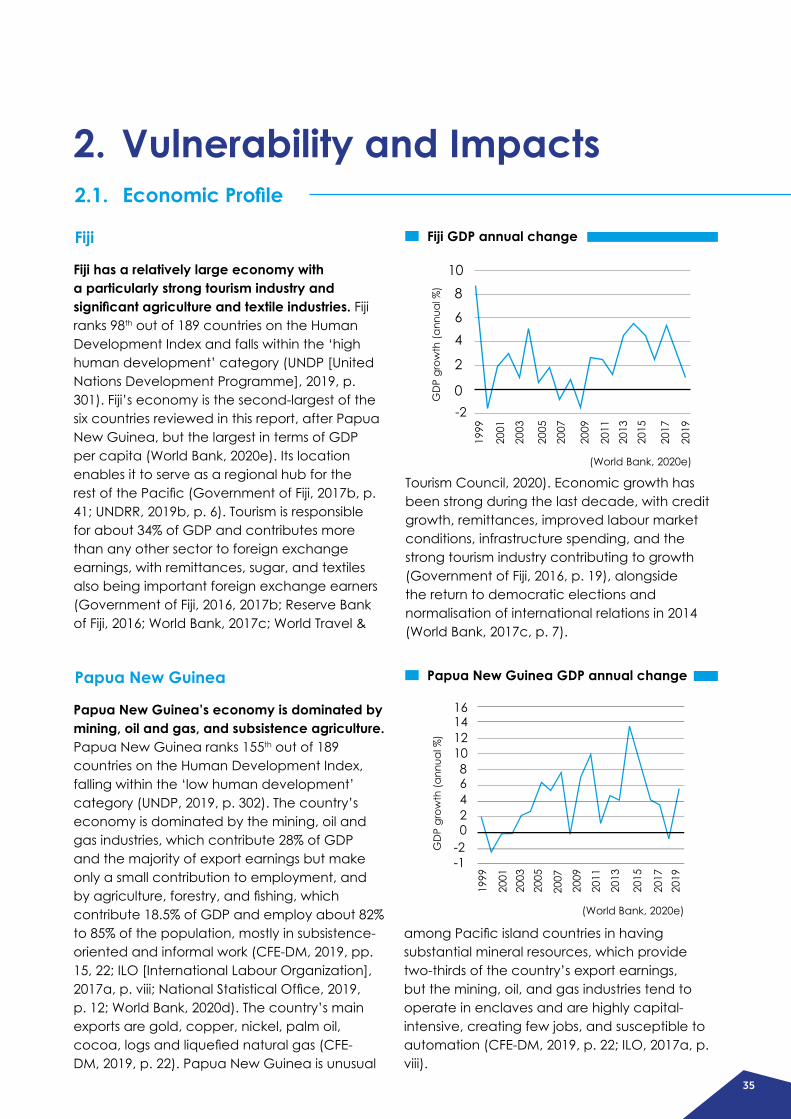
35
108
64
2
0-2
GD
P gr
owth
(ann
ual %
)
Fiji has a relatively large economy with a particularly strong tourism industry and significant agriculture and textile industries. Fiji ranks 98th out of 189 countries on the Human Development Index and falls within the ‘high human development’ category (UNDP [United Nations Development Programme], 2019, p. 301). Fiji’s economy is the second-largest of the six countries reviewed in this report, after Papua New Guinea, but the largest in terms of GDP per capita (World Bank, 2020e). Its location enables it to serve as a regional hub for the restofthePacific(GovernmentofFiji,2017b,p.41; UNDRR, 2019b, p. 6). Tourism is responsible for about 34% of GDP and contributes more than any other sector to foreign exchange earnings, with remittances, sugar, and textiles also being important foreign exchange earners (Government of Fiji, 2016, 2017b; Reserve Bank of Fiji, 2016; World Bank, 2017c; World Travel &
Papua New Guinea’s economy is dominated by mining, oil and gas, and subsistence agriculture. Papua New Guinea ranks 155th out of 189 countries on the Human Development Index, falling within the ‘low human development’ category (UNDP, 2019, p. 302). The country’s economy is dominated by the mining, oil and gas industries, which contribute 28% of GDP and the majority of export earnings but make only a small contribution to employment, and byagriculture,forestry,andfishing,whichcontribute 18.5% of GDP and employ about 82% to 85% of the population, mostly in subsistence-oriented and informal work (CFE-DM, 2019, pp. 15, 22; ILO [International Labour Organization], 2017a,p.viii;NationalStatisticalOffice,2019,p. 12; World Bank, 2020d). The country’s main exports are gold, copper, nickel, palm oil, cocoa,logsandliquefiednaturalgas(CFE-DM, 2019, p. 22). Papua New Guinea is unusual
Tourism Council, 2020). Economic growth has been strong during the last decade, with credit growth, remittances, improved labour market conditions, infrastructure spending, and the strong tourism industry contributing to growth (Government of Fiji, 2016, p. 19), alongside the return to democratic elections and normalisation of international relations in 2014 (World Bank, 2017c, p. 7).
amongPacificislandcountriesinhavingsubstantial mineral resources, which provide two-thirds of the country’s export earnings, but the mining, oil, and gas industries tend to operate in enclaves and are highly capital-intensive, creating few jobs, and susceptible to automation (CFE-DM, 2019, p. 22; ILO, 2017a, p. viii).
2. Vulnerability and Impacts2.1. Economic Profile
Fiji
Papua New Guinea
Fiji GDP annual change
Papua New Guinea GDP annual change
1614121086420
-2-1
(World Bank, 2020e)
(World Bank, 2020e)
GD
P gr
owth
(ann
ual %
)
1999
2001
2003
2005
2007
2009
2011
2013
2015
2017
2019
1999
2001
2003
2005
2007
2009
2011
2013
2015
2017
2019
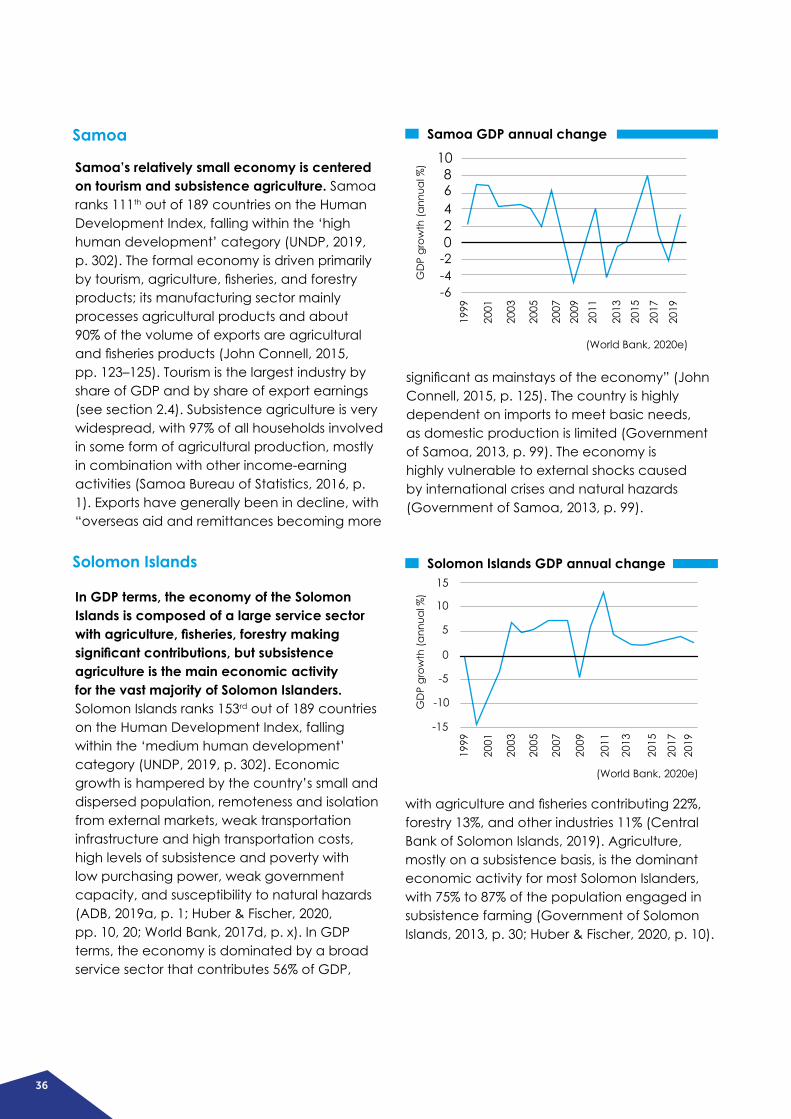
36
Samoa’s relatively small economy is centered on tourism and subsistence agriculture. Samoa ranks 111th out of 189 countries on the Human Development Index, falling within the ‘high human development’ category (UNDP, 2019, p. 302). The formal economy is driven primarily bytourism,agriculture,fisheries,andforestryproducts; its manufacturing sector mainly processes agricultural products and about 90% of the volume of exports are agricultural andfisheriesproducts(JohnConnell,2015,pp. 123–125). Tourism is the largest industry by share of GDP and by share of export earnings (see section 2.4). Subsistence agriculture is very widespread, with 97% of all households involved in some form of agricultural production, mostly in combination with other income-earning activities (Samoa Bureau of Statistics, 2016, p. 1). Exports have generally been in decline, with “overseas aid and remittances becoming more
In GDP terms, the economy of the Solomon Islands is composed of a large service sector with agriculture, fisheries, forestry making significant contributions, but subsistence agriculture is the main economic activity for the vast majority of Solomon Islanders. Solomon Islands ranks 153rd out of 189 countries on the Human Development Index, falling within the ‘medium human development’ category (UNDP, 2019, p. 302). Economic growth is hampered by the country’s small and dispersed population, remoteness and isolation from external markets, weak transportation infrastructure and high transportation costs, high levels of subsistence and poverty with low purchasing power, weak government capacity, and susceptibility to natural hazards (ADB, 2019a, p. 1; Huber & Fischer, 2020, pp. 10, 20; World Bank, 2017d, p. x). In GDP terms, the economy is dominated by a broad service sector that contributes 56% of GDP,
significantasmainstaysoftheeconomy”(JohnConnell, 2015, p. 125). The country is highly dependent on imports to meet basic needs, as domestic production is limited (Government of Samoa, 2013, p. 99). The economy is highly vulnerable to external shocks caused by international crises and natural hazards (Government of Samoa, 2013, p. 99).
withagricultureandfisheriescontributing22%,forestry 13%, and other industries 11% (Central Bank of Solomon Islands, 2019). Agriculture, mostly on a subsistence basis, is the dominant economic activity for most Solomon Islanders, with 75% to 87% of the population engaged in subsistence farming (Government of Solomon Islands, 2013, p. 30; Huber & Fischer, 2020, p. 10).
Samoa
Solomon Islands
Samoa GDP annual change
Solomon Islands GDP annual change
1086420
-2-4-6
(World Bank, 2020e)
(World Bank, 2020e)
15
10
5
0
-5
-10
-15
GD
P gr
owth
(ann
ual %
)G
DP
grow
th (a
nnua
l %)
1999
2001
2003
2005
2007
2009
2011
2013
2015
2017
2019
1999
2001
2003
2005
2007
2009
2011
2013
2015
2017
2019
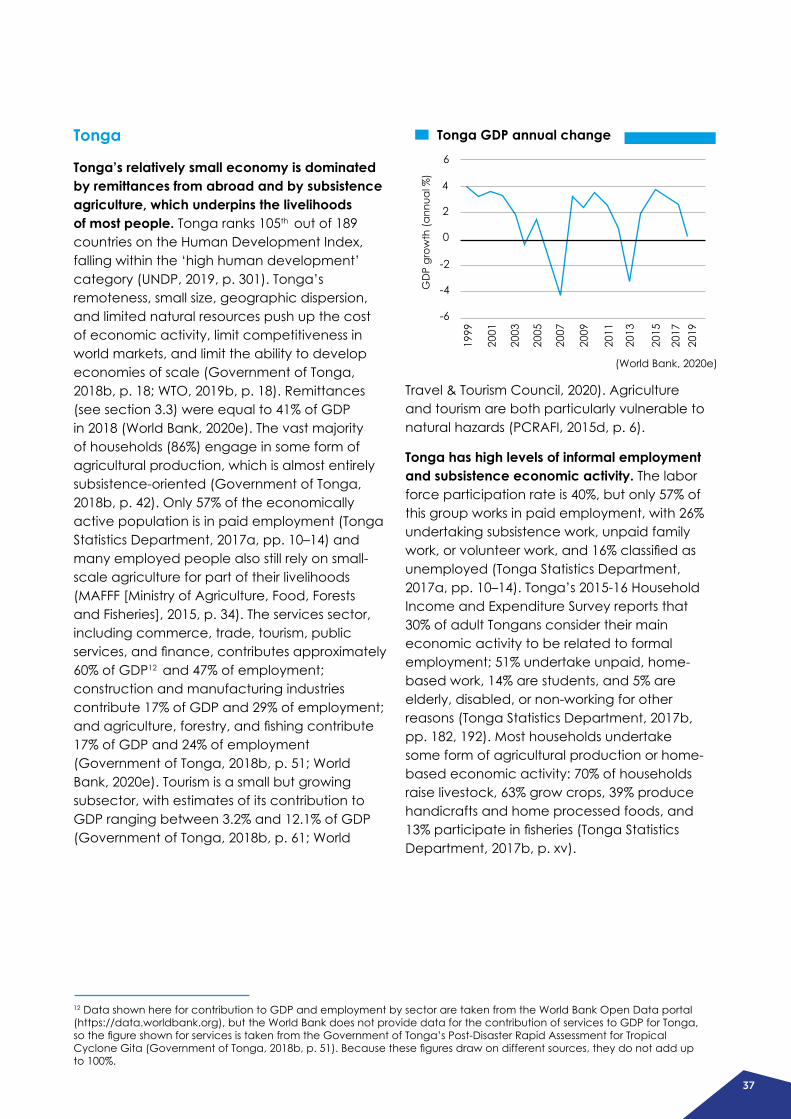
37
Tonga’s relatively small economy is dominated by remittances from abroad and by subsistence agriculture, which underpins the livelihoods of most people. Tonga ranks 105th out of 189 countries on the Human Development Index, falling within the ‘high human development’ category (UNDP, 2019, p. 301). Tonga’s remoteness, small size, geographic dispersion, and limited natural resources push up the cost of economic activity, limit competitiveness in world markets, and limit the ability to develop economies of scale (Government of Tonga, 2018b, p. 18; WTO, 2019b, p. 18). Remittances (see section 3.3) were equal to 41% of GDP in 2018 (World Bank, 2020e). The vast majority of households (86%) engage in some form of agricultural production, which is almost entirely subsistence-oriented (Government of Tonga, 2018b, p. 42). Only 57% of the economically active population is in paid employment (Tonga Statistics Department, 2017a, pp. 10–14) and many employed people also still rely on small-scale agriculture for part of their livelihoods (MAFFF [Ministry of Agriculture, Food, Forests and Fisheries], 2015, p. 34). The services sector, including commerce, trade, tourism, public services,andfinance,contributesapproximately60% of GDP12 and 47% of employment; construction and manufacturing industries contribute 17% of GDP and 29% of employment; andagriculture,forestry,andfishingcontribute17% of GDP and 24% of employment (Government of Tonga, 2018b, p. 51; World Bank, 2020e). Tourism is a small but growing subsector, with estimates of its contribution to GDP ranging between 3.2% and 12.1% of GDP (Government of Tonga, 2018b, p. 61; World
Travel & Tourism Council, 2020). Agriculture and tourism are both particularly vulnerable to natural hazards (PCRAFI, 2015d, p. 6).
Tonga has high levels of informal employment and subsistence economic activity. The labor force participation rate is 40%, but only 57% of this group works in paid employment, with 26% undertaking subsistence work, unpaid family work,orvolunteerwork,and16%classifiedasunemployed (Tonga Statistics Department, 2017a, pp. 10–14). Tonga’s 2015-16 Household Income and Expenditure Survey reports that 30% of adult Tongans consider their main economic activity to be related to formal employment; 51% undertake unpaid, home-based work, 14% are students, and 5% are elderly, disabled, or non-working for other reasons (Tonga Statistics Department, 2017b, pp. 182, 192). Most households undertake some form of agricultural production or home-based economic activity: 70% of households raise livestock, 63% grow crops, 39% produce handicrafts and home processed foods, and 13%participateinfisheries(TongaStatisticsDepartment, 2017b, p. xv).
Tonga Tonga GDP annual change
12 Data shown here for contribution to GDP and employment by sector are taken from the World Bank Open Data portal (https://data.worldbank.org), but the World Bank does not provide data for the contribution of services to GDP for Tonga, sothefigureshownforservicesistakenfromtheGovernmentofTonga’sPost-DisasterRapidAssessmentforTropicalCycloneGita(GovernmentofTonga,2018b,p.51).Becausethesefiguresdrawondifferentsources,theydonotaddupto 100%.
-6
-4
-2
0
2
4
6
(World Bank, 2020e)
1999
2001
2003
2005
2007
2009
2011
2013
2015
2017
2019
GD
P gr
owth
(ann
ual %
)

38
Vanuatu Vanuatu GDP annual change
Vanuatu’s relatively small economy is dominated by a large and growing tourism industry and subsistence agriculture. Vanuatu ranks 141st out of 189 countries on the Human Development Index, falling within the ‘medium human development’ category (UNDP, 2019, p. 302). Economic development is hampered by its geographical remoteness, widely dispersed islands, high costs of public service provision and of transportation and trade, and vulnerability to external economic shocks, notably those resulting from natural hazards (Government of Vanuatu, 2015b, p. 2; WTO, 2019b, p. 25). Its relatively small size means that domestic markets tend to be too small for industries to benefitfromeconomiesofscale(Governmentof Vanuatu, 2015b, p. 2). Economic activity is concentrated in the two most populous urban centres, Port Vila (the capital) and Luganville (Rust, 2019, p. 10). The formal economy is narrowly based, driven primarily by tourism, agriculture, international aid, and construction (Government of Vanuatu, 2015b, p. 2; Handmer
Agriculture and fisheries are extremely important to Fiji, both as commercial and subsistence activities. Agriculture has declined in importance in relation to GDP as tourism and textiles have grown (Wehrhahn, Oza, Savage, Walsh, Veisamasama, & Pascual, 2019, p. 28), but it still provides 36% of all employment (World Bank, 2020e). Women make up about 37% of those employed in agriculture (Government of Fiji, 2016, p. 47). Sugarcane is the dominant cash crop, accounting for 18% of Fiji’s exports and directly or indirectly supporting nearly one-quarter of the population; it is grown by almost 13,700 farmers on small farms averaging 2.8 hectares in size, mostly on western Viti Levu and northern Vanua Levu (Government of Fiji, 2016, p. 48; A. Singh, 2020, p. 66; Wehrhahn et al.,
2019, pp. 28–29). However, the sugar industry has been in decline for the past decade due to low productivity, labour shortages, highproductioncosts,ageingandinefficientsugar mills, and the withdrawal of preferential price arrangements with the European Union (Government of Fiji, 2017b, p. 83; A. Singh, 2020, pp. 67–69). Subsistence livestock production is widespread, constituting a small percentage of total output but generating income for many rural households and contributing to food security and meeting customary obligations (GovernmentofFiji,2016,p.48).Thefisherysectoriscomprisedofoffshoretunafishing,which accounts for around 43% of the value of production,commercialcoastalfisheries(30%),andsubsistencecommercialfisheries(23%)
& Iveson, 2017, p. 61; PCRAFI, 2015e, p. 7; WTO, 2019b, p. 25). Tourism is the largest industry by share of GDP and by share of export earnings (see section 2.4), but agriculture, mostly carried out on a subsistence basis, is the dominant economic activity, with approximately 80% of the population relying to some degree on subsistence farming for livelihood and food security (VNSO [Vanuatu National Statistics Office],2013,citedinGovernmentofVanuatu,2015b, p. 16).
2.2. Agriculture and Fisheries
Fiji
GD
P gr
owth
(ann
ual %
)
10
8
64
2
0
-2-4
-6
(World Bank, 2020e)
1999
2001
2003
2005
2007
2009
2011
2013
2015
2017
2019

39
(Government of Fiji, 2017b, p. 84). Half of all rural households are involved in coastal subsistence fishing(GovernmentofFiji,2016,p.48).
Cyclones and floods regularly cause extensive damage to crops, trees, livestock, equipment, and infrastructure (Government of Fiji, 2017b, p. 84; Wehrhahn et al., 2019, p. 30), and it is essentially infeasible to protect crops against these hazards (Gawith, Daigneault, & Brown, 2016, p. 2115). Flooding “can inundate crops, leading to failed harvests and the death of livestock, and it can also damage or destroy agricultural assets and infrastructure” (Government of Fiji, 2017b, p. 84). Many farms have expanded into areas that are prone to floodingorthathaveahighriskforlandslides(UNDRR, 2019b, p. 14). Sugarcane is grown in coastal areas which are exposed to cyclones and storm surges (PCRAFI, 2015a, p. 8). In the fisheriessector,cyclonesandstormsurgescausedamage to boats, equipment, and aquaculture infrastructure and stock, as well as causing ecosystem damage to coral reefs, mangroves, andotherfishhabitats.Floodingcanalsodamage aquaculture ponds, cause siltation, andharmfishandseafoodstocks(Governmentof Fiji, 2017b, p. 84).
The impact of natural hazards on agriculture is intensified for poor people. Almost half of those living below the national poverty line13 rely on agriculture for at least part of their income (Government of Fiji, 2017b, p. 23). Most farms in Fiji are small – in 2009, 44% of all farms had an area of less than 1 hectare (Department of Agriculture, 2009, p. 33) – and more than 80% of thecountry’sfarmsareclassifiedassubsistencefarms (Ministry of Agriculture, 2018, cited in Wehrhahn et al., 2019, p. 30). Small-scale
farmers (both commercial and subsistence) are vulnerable to natural hazards because they cannot achieve economies of scale or build up financialbufferstoabsorbeconomicshocks,solossesinflictedbynaturalhazardshavegreaterimpact than they would for larger-scale farmers (Wehrhahn et al., 2019, p. 30). In the aftermath ofextensivefloodingin2009,forexample,almost 50% of the affected farming families with livelihoods tied to sugar farming14 were expected to fall below the poverty line and 40% were estimated not to be able to meet basic nutritional needs; these farmers had reduced coping capacities because they were likely to have had pre-existing debts and limited savings, and their incomes were already reduced due to global market conditions for sugar (Lal, 2011, cited in UNDRR, 2019b, p. 10).
Tropical cyclone Winston caused extensive damage, loss of production, and harm to livelihoods in the agriculture sector. Damage was valued at FJD 40.6 million, with additional future production losses estimated at FJD 241.2 million. Sugarcane accounted for 62% of the total damage and loss (Government of Fiji, 2016, p.50).Highwinds,floodingandstormsurgescaused substantial damage to permanent plantations which will need to be replanted, as well as damage to mangrove forests and coral reefs (Government of Fiji, 2016, p. 11). TC Winston also caused extensive damage to food crops, which seriously affected household income, food security and nutrition. Many poor households lost their own food supplies following the cyclone, and market prices for vegetables androotcropsincreasedsignificantly–byas much as double in the case of cassava, a local staple (Government of Fiji, 2016, p. 50).
13 Fiji’s national poverty line, derived from the country’s 2013-14 Household Income and Expenditure Survey, is set at household income of FJD 29.89 per day in 2013-14 (Government of Fiji, 2017b, p. 41), or approximately USD 16.24 per day in2013.FijialsodefinespovertylinesforadultsatFJD7.87perdayforurbanareasandFJD7.07perdayforruralareas(Fiji Bureau of Statistics, 2015, p. 2), or approximately USD 4.28 and USD 3.84 per day respectively. These income levels are higher than the World Bank’s USD 1.90 per day international poverty line, and comparable with the World Bank’s USD 3.20 and 5.50 per day poverty lines for lower- and upper-middle-income countries.14 Most sugarcane farmers are small-scale growers with an average landholding of 2.8 hectares (Insurance Holdings (Pacific)Limited2016,citedinWehrhahnetal.,2019,p.28),whoallocatethemajorityoftheirlandtosugarcaneanduseonly a small proportion of their land to grow other cash and food crops and raise subsistence livestock (A. Singh, 2020).
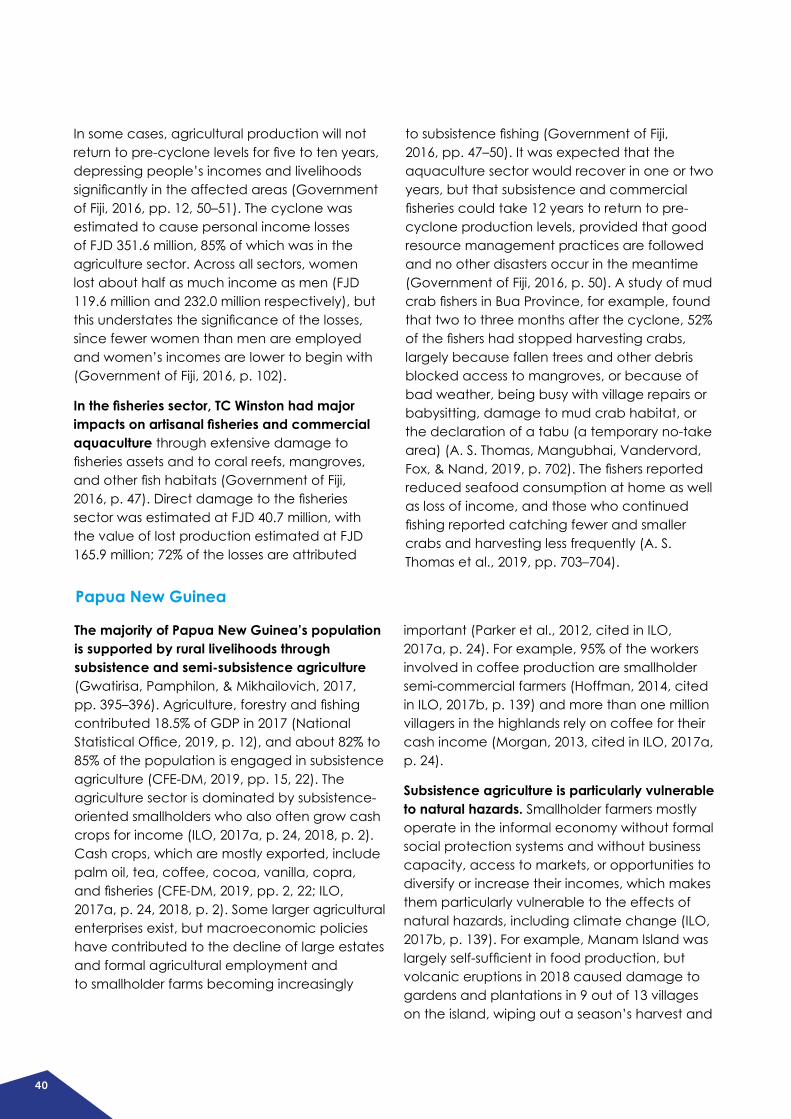
40
In some cases, agricultural production will not returntopre-cyclonelevelsforfivetotenyears,depressing people’s incomes and livelihoods significantlyintheaffectedareas(Governmentof Fiji, 2016, pp. 12, 50–51). The cyclone was estimated to cause personal income losses of FJD 351.6 million, 85% of which was in the agriculture sector. Across all sectors, women lost about half as much income as men (FJD 119.6 million and 232.0 million respectively), but thisunderstatesthesignificanceofthelosses,since fewer women than men are employed and women’s incomes are lower to begin with (Government of Fiji, 2016, p. 102).
In the fisheries sector, TC Winston had major impacts on artisanal fisheries and commercial aquaculture through extensive damage to fisheriesassetsandtocoralreefs,mangroves,andotherfishhabitats(GovernmentofFiji,2016,p.47).Directdamagetothefisheriessector was estimated at FJD 40.7 million, with the value of lost production estimated at FJD 165.9 million; 72% of the losses are attributed
tosubsistencefishing(GovernmentofFiji,2016, pp. 47–50). It was expected that the aquaculture sector would recover in one or two years, but that subsistence and commercial fisheriescouldtake12yearstoreturntopre-cyclone production levels, provided that good resource management practices are followed and no other disasters occur in the meantime (Government of Fiji, 2016, p. 50). A study of mud crabfishersinBuaProvince,forexample,foundthat two to three months after the cyclone, 52% ofthefishershadstoppedharvestingcrabs,largely because fallen trees and other debris blocked access to mangroves, or because of bad weather, being busy with village repairs or babysitting, damage to mud crab habitat, or the declaration of a tabu (a temporary no-take area) (A. S. Thomas, Mangubhai, Vandervord, Fox,&Nand,2019,p.702).Thefishersreportedreduced seafood consumption at home as well as loss of income, and those who continued fishingreportedcatchingfewerandsmallercrabs and harvesting less frequently (A. S. Thomas et al., 2019, pp. 703–704).
The majority of Papua New Guinea’s population is supported by rural livelihoods through subsistence and semi-subsistence agriculture (Gwatirisa, Pamphilon, & Mikhailovich, 2017, pp.395–396).Agriculture,forestryandfishingcontributed 18.5% of GDP in 2017 (National StatisticalOffice,2019,p.12),andabout82%to85% of the population is engaged in subsistence agriculture (CFE-DM, 2019, pp. 15, 22). The agriculture sector is dominated by subsistence-oriented smallholders who also often grow cash crops for income (ILO, 2017a, p. 24, 2018, p. 2). Cash crops, which are mostly exported, include palm oil, tea, coffee, cocoa, vanilla, copra, andfisheries(CFE-DM,2019,pp.2,22;ILO,2017a, p. 24, 2018, p. 2). Some larger agricultural enterprises exist, but macroeconomic policies have contributed to the decline of large estates and formal agricultural employment and to smallholder farms becoming increasingly
important (Parker et al., 2012, cited in ILO, 2017a, p. 24). For example, 95% of the workers involved in coffee production are smallholder semi-commercial farmers (Hoffman, 2014, cited in ILO, 2017b, p. 139) and more than one million villagers in the highlands rely on coffee for their cash income (Morgan, 2013, cited in ILO, 2017a, p. 24).
Subsistence agriculture is particularly vulnerable to natural hazards. Smallholder farmers mostly operate in the informal economy without formal social protection systems and without business capacity, access to markets, or opportunities to diversify or increase their incomes, which makes them particularly vulnerable to the effects of natural hazards, including climate change (ILO, 2017b, p. 139). For example, Manam Island was largelyself-sufficientinfoodproduction,butvolcanic eruptions in 2018 caused damage to gardens and plantations in 9 out of 13 villages on the island, wiping out a season’s harvest and
Papua New Guinea

41
destroyingfishinggear;thereisnomarketonthe island, and income-earning opportunities are limited so few islanders have money to purchase food (ACAPS, 2018, pp. 1–3). In another example, a study of four communities following the 2018 earthquake reported that staple crops such as sago and bananas, lost under landslides caused by the earthquake, may take years to recover to levels necessary to sustain the population (Roche, Diou, Malagian, Mupu’e, & Osake, 2018, pp. 4, 25).
The long-term impacts of climate change on agricultural yields in Papua New Guinea are uncertain and possibly mixed, but food security is likely to be threatened by population growth. Estimating the impacts of climate change on crop yields and food security is complex, andforecastsvarysignificantlyunderdifferentclimate change scenarios, forecasting methods, and assumptions regarding adaptations. For example, studies estimate that yields of sweet potatoes could decrease from 2000 to 2050 by
50% to 59% (Boer and Rakhman, 2011, cited in ADB, 2013, p. 53), 1% to 11% (Rosegrant et al., 2013, cited in ADB, 2013, p. 54), or 11% (Rosegrant, Valmonte-Santos, Thomas, You, & Chiang, 2015, p. xxv). Yields of other crops have been forecast to decrease by 3.2% to 30.8% from 2000 to 2050 under worst-case climate change scenarios, or increase by 3.4% to 17.7% under best-case scenarios (Rosegrant et al., 2013, cited in ADB, 2013, p. 54). Another study suggests that most crops are likely to suffer decreased yields by 2050 except for rice, where yields could see a tiny increase (Rosegrant et al., 2015, p. xxvi). Population growth will mean, however, that food security challenges will increase from 2000 to 2050: the baseline “no climate change” scenario forecasts that 15.4% of the population will be at risk of hunger by 2050, but this is likely to increase to 19.1% due to the effects of climate change, meaning that the number of people at risk of hunger will double from 1.3 million in 2000 to 2.6 million in 2050 (Rosegrant et al., 2015, p. 80).
Almost all households in Samoa engage in agricultural production, mostly for home consumption, and usually in addition to other income-generating economic activities. Agricultureandfisheriescontributeabout10.1%of GDP (about half from crops and livestock, andhalffromfisheries(GovernmentofSamoa,2013, p. 17; Samoa Bureau of Statistics, 2020a, p. 2). Most production is carried out by rural households consisting of extended family units practicing small-scale, labor-intensive mixed farming on customary land (Government of Samoa, 2013, p. 17). In 2015, 97% of all households in the country grew some crops or raised some livestock, 85% of households were considered “major crop households” cultivating more than 523 m2 or 20 trees, and even in the capital city, Apia, more than 90%
of households were engaged in some form of agricultural activity (Samoa Bureau of Statistics, 2016, p. 1). Most major crop households (64%) grow crops primarily for subsistence purposes, with only 4% growing crops mainly for sale, and livestock are mainly kept for home consumption and for customary ceremonies (Samoa Bureau of Statistics, 2016, pp. 2, 22). Agricultural production provides the main source of income for only 22% of households, with most households relying on other paid employment for their main source of income (Samoa Bureau of Statistics, 2016, p. 35). Twenty-one percent of allhouseholdsinthecountryengageinfishing,mostly (70%) for home consumption (Samoa Bureau of Statistics, 2016, pp. 53–54).
Samoa
42
Natural hazards cause extensive damage, loss of production, and harm to livelihoods in the agriculture sector. For example, TC Evan in 2012 caused damage and economic losses in the agricultural sector estimated at WST 75 million (USD 33 million; 4.3% of GDP), or about 30% of agricultural sector GDP (Government of Samoa, 2013, pp. 17, 21). In the worst-affected areas, 80% of the banana crop, 40% of breadfruit trees, and 15% of cocoa trees and fruit trees were destroyed, coconut plantations sustainedsignificantdamage,andtherewasextensive damage to farm buildings, roads, and equipment (Government of Samoa, 2013, pp. 17, 19–20). About 27% of canoes and half ofallotherfishinggearownedbyartisanalfishersweredamaged(GovernmentofSamoa,2013, p. 20). Households involved in processing food crops reported losses due to the damage to crops and to equipment (Government of Samoa, 2013, p. 20). The Government’s post-disaster needs assessment estimated that many households would take a year or more to return to pre-cyclone production levels, particularly in the case of lost tree crops, while livestock production was expected to recover inaboutfivemonthsandfisheriesinabouttwo months (Government of Samoa, 2013, pp.
20–21).Anewsreportfivemonthsafterthecyclone indicated that farmers had “bounced back fast” and that produce was beginning to reappear in markets, although production had not yet returned to pre-cyclone levels (Radio New Zealand International, 2013). The value of economic losses may understate the significanceoftheimpactsonsubsistencefarmers, who were expected to suffer a significantdecreaseinqualityofdietduetothe decreased availability and increased price of fresh fruit and vegetables (Government of Samoa, 2013, p. 21).
Climate change is expected to adversely affect agriculture and fisheries in Samoa through increased frequency of extreme weather and sea-level rise.AcrossthePacificregion,most cash crops are vulnerable to extreme weather, and high winds from more intense tropical cyclones severely threaten crops such as bananas, breadfruit, and coconuts (Bell, M, Amos, & N, 2016, p. 17). Agriculture in Samoa is expected to be affected by more frequent extreme rainfall events, extreme winds, high air and water temperatures, and rising sea levels (Australian Bureau of Meteorology and CSIRO, 2014, pp. 242, 251–252; Government of Samoa, 2013, p. 18).
Subsistence agriculture is the dominant economic activity for most Solomon Islanders. Agricultureandfisheriesaccountedfor22%ofGDP in 2018 (Central Bank of Solomon Islands, 2019), but provides livelihoods for the vast majority of the population: 75% to 87% of the population is engaged in subsistence farming and around 90% of households keep pigs and chickens (Government of Solomon Islands, 2013, p. 30, 2014, p. 20; Huber & Fischer, 2020, p. 10). A significantnumberofruralhouseholdsalsogrowcash crops for export (coconut, oil palm, and cocoa) or for local sale (sweet potato, cassava, banana, taro, yam, beans, and cabbage) (Government of Solomon Islands, 2014, p. 20). About 60% of Solomon Islanders are involved in fishingfortheirownconsumption,andabout
halfofthesealsosellfish(GovernmentofSolomon Islands, 2014, p. 20).
Subsistence agriculture is highly vulnerable to natural hazards. Smallholder farmers mostly operate in the informal economy without formal social protection systems and without business capacity, access to markets, or opportunities to diversify or increase their incomes, which makes them particularly vulnerable to the effects of natural hazards, including climate change (ILO, 2017b, p. 139). Floods in 2014, for example, caused extensive damage to food gardens (affecting mostly kumara, cassava, taro, pana, and vegetables), export crops (cocoa, copra, palm oil), fruit trees (banana), farming equipment, and roads, which was valued at USD 18 million (1.5% of GDP) and which affected
Solomon Islands
43
the availability and price of fresh vegetables in Honiara and other parts of Guadalcanal (Government of Solomon Islands, 2014, pp. 22–24).
The long-term impacts of climate change on agricultural yields in Solomon Islands are uncertain and possibly mixed. Estimating the impacts of climate change on crop yields iscomplex,andforecastsvarysignificantlyunder different climate change scenarios, forecasting methods, and assumptions regarding adaptations. One study forecasts that between 2000 and 2050, yields of sweet potatoes could decrease by 12% to 14% (Boer and Rakhman, 2011, cited in ADB, 2013, p. 53), while another forecasts a range of outcomes
from a worst case of a 15.0% decrease to a best case of a 1.5% increase (Rosegrant et al., 2013, cited in ADB, 2013, p. 53). Yields of other crops are forecast to decrease by 7.6% to 27.8% over the same time period under worst-case scenarios, while best-case scenarios forecast outcomes ranging from decreases of up to 17.9% to increases of up to 10.8% for different crops (Rosegrant et al., 2013, cited in ADB, 2013, p. 53). Climate change and population growth are expected to lead to the proportion of the population at risk of increasing hunger by 2050, from 9.7% under the baseline “no climate change” scenario to 14.0% under the climate change scenario, meaning an increase in 51 million people at risk of hunger due to the effects of climate change (Rosegrant et al., 2015, p. 80).
Agriculture is the dominant economic activity in Tonga, but it is largely subsistence or semi-subsistence15 in nature with limited commercial-scale activity (Government of Tonga, 2018b, p. 42; MAFFF, 2015). Agriculture makes up 17% of GDP, with crops and livestock constituting the majority (Kingdom of Tonga, 2018a, p. 23). Three quarters of Tonga’s domestic exports areagriculturalproducts,withfishandotherseafood making up 42% of total exports, and root crops, kava, and pumpkins making up 34% (Government of Tonga, 2018b, p. 42). Agriculture is responsible for 24% of all employment (World Bank, 2020e). About 86% of households engage in some form of agricultural production (including handicraft production), but only 5% of these do so in a commercial capacity, with 95% being engaged in subsistence and semi-subsistence activities (Government of Tonga, 2018b, p. 42) consisting largely of traditional production of root crops (Kingdom of Tonga, 2018a, p. 23).
Agricultural work is often combined with other income-generating activities: 65% of adults in agriculturally active households work in the labor force in some other capacity (MAFFF, 2015,p.34).Fisheries,mainlyfocusedonreeffinfishandtunaandtoalesserextentonshellfish,lobster, and sea cucumber, contribute 2.9% of GDP (Government of Tonga, 2018b, p. 43). Fishing is mostly done on a subsistence or semi-subsistence basis: about 15% of all households inTongaengageinfishing,with54%ofthesefishingforsubsistence,42%fishingmainlyfor their own consumption and selling some of their harvest, and only 4% of households engagedincommercialfishing(MAFFF,2015,pp. 53–66). Forestry (mostly growing trees for building purposes) contributes just 0.4% of GDP but contributes to the livelihoods of 14% of households (most of which engage in forestry only for their own use; only 2% of all households in the country engage in forestry mainly for commercial purposes) (Government of Tonga, 2018b, p. 43).
Tonga
15Tongadefinessubsistenceasagriculturalactivityinwhichmostoftheproduceisconsumedwithinthefarmer’shousehold, leaving little or nothing to be marketed, or where the area farmed is less than one acre; semi-subsistence is agriculture activity in which some of the produce is consumed by the household and some is sold to the market, or where the area farmed is between 1 and 8 acres (MAFFF, 2015, p. 217).
44
Cyclones cause extensive damage, loss of production, and harm to livelihoods in the agriculture sector. Estimates of damage and economic losses in the agricultural sector caused by TC Gita in 2018 range from TOP 97.5 million to 129.3 million (9.9% to 13.1% of GDP) (Kingdom of Tonga, 2018a, p. 17; WTO, 2019b, p. 14), which accounts for 82% of the total losses caused by the cyclone (Kingdom of Tonga, 2018a, p. 17). Crops were particularly vulnerable, suffering 88% of total agricultural damage and loss, while the forestry sector, livestock,andfisheriessectorssuffered7%,3%,and 2%, respectively, of agricultural sector damage and losses (Kingdom of Tonga, 2018a, p. 23). Approximately 30% to 40% of coconut trees, 70% to 80% of fruit trees, 90% of banana trees, and 40% to 50% of root crops were damaged or destroyed (IFRC [International Federation of Red Cross and Red Crescent Societies], 2018, p. 4). Crop exports, notably root crops, plantain and coconuts, dropped by 37% (WTO, 2019b, p. 14). Similarly, TC Ian in 2014 caused TOP 97.5 million (12.1% of GDP) in damage and production losses in the agricultural sector, severely affecting local food supply and cash crops on Ha’apai island for six to ten months (WTO, 2019b, p. 14). Subsistence andcommercialfisheriesarealsoaffectedbycyclones, primarily through damage to boats and equipment. TC Gita in 2018 damaged fishfences16usedbysubsistencefishersandapproximately40%ofallfishingboatsontheaffected islands of Tongatapu and’Eua (IFRC, 2018b, p. 4). TC Ian was reported to have damagedvirtuallyallfishinggearonHa’apaiisland (WTO, 2019b, p. 14). As three quarters of Tonga’s population live in rural areas where agricultureandfisheriesarethemainsourcesoflivelihoods, cyclones severely affect the poorest and most vulnerable as well as impacting cash crop exports (Government of Tonga, 2018b, pp. 24, 41; WTO, 2019b, p. 14).
Climate change is expected to adversely affect agriculture and fisheries in Tonga through increased frequency of extreme weather events, sea-level rise, and disruption of aquatic ecosystems. Climate change is expected to lead to increased variability of weather, which makes farming less predictable, and to increased frequency and intensity of extreme weatherevents,whichcausesignificantdamage to crops (Government of Tonga, 2018a, p. 8). Soil erosion, associated with the clearing of land for agriculture but exacerbated by extreme weather events such as cyclones, high winds, storm surges, and intense rainfall, is a concern across 21% of Tonga’s agricultural land and runoff can also harm aquatic environments (Government of Tonga, 2018a, pp. 8–11). Sea-level rise is already causing loss of agricultural land in low-lying coastal areas through erosion and inundation, and is increasing the salinity of groundwater and reducing availability of water for irrigation; under current climate change projections, 8% of the agricultural land of the country could be affected (Government of Tonga, 2018a, p. 9; Kingdom of Tonga, 2019, p. 90). Rising sea temperatures cause coral bleaching and increased algae blooms which adverselyaffectcoastalfisheries(Governmentof Tonga, 2018a, p. 10). Damaged coral reefs also offer less protection to coastlines from storm-driven waves (Government of Tonga, 2018a, p. 11). Climate change adversely affectsdeepwaterfisheriesbydisruptingfoodchains fed by cold water plankton upwelling (Government of Tonga, 2018a, p. 11).
16Fences,typicallymadeofnetssupportedonwoodenpolesharvestedfrommangroves,thatcapturefishbyfunnellingthem into a holding area as tides recede.
45
Subsistence agriculture is the principal economic activity and source of livelihoods in Vanuatu. Although agriculture contributes less to GDP than the service sector, agriculture remains the principal economic activity and source of livelihood for the vast majority of ni-Vanuatu (Mackenzie-Reur & Galgal, 2018, p. 9). Agriculture makes up 25% of GDP and mostly consists of crop production (79% of the agriculture sector) with livestock (14%), forestry(5%),andfisheries(3%)makingsmallcontributions (Government of Vanuatu, 2015b, p. 16). Vanuatu’s agriculture sector is dominated by semi-subsistence farmers using mostly household labor; approximately 80% of Vanuatu’s population relies on agriculture (mainlycrops,livestock,andfisheries)forlivelihoods and for food and nutrition security, and at least 71% of the rural population derives some income from agricultural activities (VNSO, 2013, cited in Government of Vanuatu, 2015b, p. 16). In 2016, 42% of all households in Vanuatu grew coconuts as cash crops, 32% grew kava, 16% grew cocoa, and 4% grew coffee (VanuatuNationalStatisticsOffice,2017,p.217). Kava production nationally has increased significantlyinrecentyears–kavawasthecountry’s third largest export commodity in 2014 but made up 53% of all exports by the end of 2019 (Vanuatu Department of Agriculture and Rural Development, 2016, p. 11; Vanuatu NationalStatisticsOffice,2020,p.2)–sokava’scontribution to household incomes is likely to have increased. The extent to which kava may have replaced other crops is uncertain. Nearly all households in coastal villages (32% of all households in Vanuatu) are involved in coastal fishing,mostlyatasubsistencelevel,withabout6%ofallhouseholdsengagedinfishingforsale(Government of Vanuatu, 2015b, p. 17).
Cyclones cause extensive damage, loss of production, and harm to livelihoods in the agriculture sector. The total damage and economic losses in the agricultural sector caused by TC Pam were estimated at VUV 6.1 billion (approximately USD 56 million; 8.0% of GDP) (Government of Vanuatu, 2015b, pp. 16,127),butthefinancialvalueofthecropslost does not fully represent the livelihood and food security impacts on rural households. Crops suffered 69% of the total agricultural damage and loss, followed by forestry (16%), livestock(9%),andfisheries(6%)(Governmentof Vanuatu, 2015b, p. 16). Most of the crop losses (58%) were in kava, a major export crop, which is fragile and vulnerable to strong winds (Government of Vanuatu, 2015b, p. 18). Approximately half of all agricultural households in the affected areas lost all or part of their crops, including crops such as kava, copra, and cocoa that will take up to a year to re-establish (potentially three to four years for kava) (Government of Vanuatu, 2015b, pp. 19, 90, 97). Across the affected areas, 85% of households were engaged in subsistence farming, and slightly more than half of these households had no other sources of income (REACH, 2015, pp. 34–35). Following the cyclone, food security wasasignificantproblem:foodpricesrosedramatically in rural areas, availability of fruit and vegetables was very restricted, people in affected areas were rationing food, and about 200,000 people received emergency food aid from the government, NGOs, and the World Food Programme (Hollema, Miller, & Chong, 2015, pp. 10–16; Wentworth, 2020, pp. 78–81; WFP, 2016, pp. 5–6). Within one month of the cyclone, 85% of households had replanted their subsistence gardens, but even the fastest-growing crops needed at least three months to
Vanuatu
46
reach maturity (REACH, 2015, p. 35). Fishing was badly affected for several weeks following the cyclone, but served as an alternative source of food and livelihood for many households whose crops had been damaged or destroyed, andfishinghadmostlyreturnedtonormalbythe time of an assessment a year and a half later,apartfromthelossofsomefishingareas(Eriksson et al., 2017, pp. 52–53).
Climate change is expected to adversely affect agriculture and fisheries through increased frequency of extreme weather, sea-level rise, and disruption of aquatic ecosystems. AcrossthePacificregion,mostcashcropsarevulnerable to extreme weather, and high winds from more intense tropical cyclones severely
threaten crops such as bananas, breadfruit, and coconuts (Bell et al., 2016, p. 17). In Vanuatu, projected consequences of climate change on agriculture include reduced availability of fresh water, changes in growing seasons, increases in pests and diseases, sea-level rise, saltwater inundation and intrusion into coastal land and groundwater,oceanacidificationandcoralreefdeterioration,reducedfisheriesproductivity,loss of coastal land, damage to infrastructure and equipment, and compromised food security (Government of Vanuatu, 2015a, pp. 6–7). It is possible that cacao production could be enhanced by rising temperatures (Bell et al., 2016, p. 17).
Fiji has a diversified economy with significant commerce and manufacturing sectors. The commerce subsector contributed 9.4% of total GDP in 2014 and includes vehicle trade, supermarkets, textile and clothes traders, hardware traders, book traders, fuel and oil traders, and other wholesale and retail product sales (Government of Fiji, 2016, p. 53). The manufacturing subsector in Fiji contributed 11.0% of total GDP in 2014 and includes food and beverage manufacturing, cigarettes, apparel, footwear, paper products, plastic and rubber products, furniture, basic metals, coachworks, concrete products, and timber and wood products (Government of Fiji, 2016, pp. 53–54). In both commerce and manufacturing, the labour force is two-thirds male and one-third female; in commerce, 55% of the women employed are in the retail sub-sector, and in manufacturing, 56% of the women employed are in the textile, clothing, and footwear industries (Government of Fiji, 2016, pp. 53–54).
The impacts of Tropical cyclone Winston on larger-scale commerce and manufacturing in Fiji have been fairly limited and short-term, although industries that depend on raw materials from agriculture, such as sugar and pearls, experienced larger and longer-term losses as a consequence of lost agricultural production that cannot be quickly recovered. TC Winston caused damage to premises, equipment,rawmaterials,andfinishedproductsin commerce and manufacturing industries, and caused disruption of production and sales as a result of the damage, workers’ absences, interruptions to electricity supplies, and problems with road access (Government of Fiji, 2016, p. 55). Damage has been estimated at a value of FJD 72.9 million, with economic losses estimated at FJD 69.9 million (Government of Fiji, 2016, p. 53). For larger businesses, disruptions were fairly minor: in the wholesale and retail-commerce sector, sales were interrupted for an average of just four days, with some temporary lay-offs, and many larger retail outlets and the
2.3. Commerce and IndustryFiji
47
In monetary terms, Papua New Guinea’s economy is dominated by the mining, oil, and gas industries, which contributed 28% of GDP in 2017 (NationalStatisticalOffice,2019,p.12).Mining has been the leading economic sector in Papua New Guinea since the country’s independence in 1975, and extraction of oil and gas has been important since the 1990s, but the major mines and oil and gas projects operate in enclaves and are highly capital-intensive, offering limited employment but attracting skilled workers away from other industries (ILO, 2017a, p. 27). There are also about 60,000 artisanal miners working informally in the country (ILO, 2017a, p. 27), and although data on artisanal mining are scarce due to the informal nature of the activity, lack of oversight, and unknown levels of illegal gold sales, the amount of gold produced by artisanal miners has been estimated at between 3.7 and 5.4 tonnes per year and “it is clear that artisanal Au [gold] mining is important for local economies and communities, supporting semi and subsistence lifestyles” (Mudd, Roche, Northey, Jowitt, & Gamato, 2020, p. 5). The manufacturing sector is small, consisting of food and food canning,
majority of wholesalers had insurance coverage (Government of Fiji, 2016, pp. 54–56). Job losses in the formal sector were also minimal and recovered quickly: the government’s post-disaster needs assessment reported only 554 job losses, which were reinstated once the electricity supply was fully restored (Government of Fiji, 2016, p. 55).
Micro-, small- and medium-sized enterprises (MSMEs) suffered damage to equipment and supplies as well as production losses as a result of Tropical cyclone Winston, particularly as a result of lost agricultural production (Government of Fiji, 2016, p. 55). Most micro-enterprises in the affected areas rely on agricultural production, and consist of activities such as food processing, handicrafts
soft drinks, beer, tobacco processing, furniture making, small-scale engineering and metal processing, clothing and other light industries (ILO, 2018, p. 2). In some coastal and island communities, artisans work produce ornamental handicrafts from seashells; for example, a survey conducted in the Tigak Islands in New Ireland provinceidentified38artisansinapopulationof3,000 people, 82% of whom were women, and found that sale of these handicrafts accounted for an average of 69% of artisans’ household incomes (Simard, Militz, Kinch, & Southgate, 2019, pp. 374–378). These handicrafts are traded on a very localized basis, within 5 km of where they are produced, and 71% of sales are to locals, rather than tourists (Simard et al., 2019, pp. 377, 381).
Papua New Guinea’s non-agricultural industries are susceptible to external economic shocks and natural hazards. GDP growth has fluctuatedgreatlyduetoshocksincludingdrought, earthquakes, and international commodity price swings (WTO, 2019a, p. 178). During the 2015 drought, for example, the Ok Tedi gold and copper mine closed due
and weaving (Government of Fiji, 2016, p. 102). Many MSMEs are based in people’s homes, which are often poorly constructed and vulnerable to damage (see section 0). Informal sector small and medium-sized manufacturing reported FJD 3.4 million in damage and FJD 11.2 million in losses, which is relatively small compared with other sectors, but 43% of all micro and small enterprises were affected (Government of Fiji, 2016, pp. 55–56) and since MSMEs have few assets and low turnovers, the effects of these losses are likely to be much more impactful than the dollar amounts suggest. Recovery for MSMEs and cooperatives is inhibited by limited access to loans, especially for women, who have greater difficultyaccessingfinancialservicesthanmen(Government of Fiji, 2016, p. 56).
Papua New Guinea
48
to the drying up of the Fly River and lack of hydropower (Annamalai et al., 2015, pp. 4–6). After the 2018 earthquake, ExxonMobil’s PNG LNG17 liquefiednaturalgasplant,whichsuppliesabout 3% of global production, was closed for about two months due to damage to buildings
and an airport runway (A. Clark & Williams, 2018; ExxonMobil, 2019, p. 2). UNDRR warns that the fossil fuel industries bear secondary risks of oilandgasspillsorfiresthatcouldresultfromdamage by natural hazards (UNDRR, 2019a).
Samoa’s economy is service-sector oriented, with very little domestic manufacturing, and mostly consists of very small enterprises and informal work. The service sector (including tourism) makes up 74% of GDP, and includes commerce(30%),financialservices(9%),publicadministration (9%), communications (7%) and other sub-sectors; the construction industry contributes 8% of GDP and manufacturing contributes 6%, the majority of which consists of food and beverage products (Samoa Bureau of Statistics, 2020a, p. 2). Constraints to economic development include a small population that makesitdifficulttoachieveeconomiesofscale, a narrow natural resource base, limited infrastructure in rural areas, geographical remoteness from international markets leading to high transportation costs and high costs of imported goods, and a heavy dependence on fuel imports (ADB, 2018b, p. 170; Amosa & Samson, 2012, p. 7). Firms generally employ only a few people and are often family-owned (ADB, 2018b, p. 170). The informal economy makes up 68% of the total labor force (ILO, 2017a, pp. 4–5; Pita & Schoop, 2015, p. 6) but its production in termsofGDPisdifficulttomeasure;forexample,home-based workers and food vendors, who are mostly women, are two of the largest groups within the informal sector but “much of the income that women earn in this sector remains unaccountedforinofficialstatistics”(Taua’a,2015, pp. 55, 63).
Natural hazards have caused significant damage and economic losses to industry and commerce, but little evidence is available about impacts on the informal economy. TC Evan caused damage and economic losses to commerce and industry estimated at WST 39 million (USD 17 million; 2.3% of GDP), and job losses in the formal sector were expected to be limited (the post-disaster needs assessment forecast the loss of only 31 job losses in manufacturing and 226 in commerce), but impacts on the informal sector were not measured (Government of Samoa, 2013, p. 28). The 2009 tsunami caused damage and economic losses estimated at WST 2.220 million and affected about one-third of the businesses in the affected area, mostly MSMEs operated by an average of two employees or by family workers (Government of Samoa, 2009, pp. 31–32). Some retail stores reopened within three weeks, but the average recovery period was estimated at slightly more than nine weeks (Government of Samoa, 2009, p. 32). No data were available on the proportion of small businesses with insurance coverage, and funds forrefinancingbusinesseswereexpectedtocome from remittances from relatives working overseasandfromrefinancingexistingloans(Government of Samoa, 2009, p. 33).
Samoa
17ThenameoftheprojectalludestoPapuaNewGuineaLiquifiedNaturalGas,butitisofficiallyknownsimplyasPNGLNG.
49
The economy of Solomon Islands is largely based on services, agriculture, and forestry. Estimates for 2018 show the service sector contributing 56% of GDP, agriculture and fisheries22%,forestry13%,andotherindustries11%; within the service sector, the largest contributors to GDP are wholesale and retail trade (8%), real estate and renting (8%), transport and storage (7%), and public administration and defense (7%) (Central Bank of Solomon Islands, 2019). Manufacturing primarily involves processing coconut and other vegetable oils and cocoa, and traditional handicrafts, including woodwork, shell inlay, mats, baskets, and shell jewelry are made for the tourist market and for export (Filho et al., 2020, p. 179). The forestry industry, which consists solely of extracting whole logs as there is no domestic timber processing industry, makes a substantial contribution to GDP but employs only around 5,000 unskilled and low-wage workers and is expected to decline due to unsustainable harvesting practices (ADB, 2019a, p. 1; ILO, 2017a, pp. 25–26). The mining industry is currently small, but is seen as a potential driver of economic growth although unlikely to create many direct jobs (World Bank, 2017d, p. xvii). The national strategy for supporting MSMEs seeks to support growth by improving the legal and institutional framework, promoting a culture of entrepreneurship, enhancing business developmentservicesandaccesstofinance,
facilitating access to markets, promoting innovation and technology capacity; it does not, however, make any direct reference to disaster resilience or natural hazards (Ministry of Commerce Industry Labour and Immigration, 2016, p. 9).
Climate change and natural hazards are barriers to economic development (Filho et al., 2020,p.179).Forexample,in2014floodinginHoniara and Guadalcanal associated with TC Ita was expected to reduce GDP by as much as 5.1%, with the largest impacts (including indirect impacts on businesses supporting mine operations) coming from the closure of theGoldRidgemineduetoflooddamage;themineonlyreopenedfiveyearslater,inOctober 2019 (Government of Solomon Islands, 2014, p. 10; Solomon Times, 2019). A survey of small shops and market vendors across four provinces found that disruptions to supply chains, lack of availability of goods, and lack of purchasing power were the main barriers to quick recovery, and that speed of recovery was linked to distance from the capital city: on the main island of Guadalcanal, 48% of shops and vendors were able to re-open within a week of the last disaster that they had experienced, but re-opening took longer in more remote provinces, with 33% of respondents in Makira and 39% in Western Province saying that it took them four weeks or longer to re-open (Huber & Fischer, 2020, p. 30).
Solomon Islands
Tonga’s commerce and manufacturing sectors are small and often home-based. Tonga is hampered by geographical remoteness, high transportationcosts,lowdiversificationandconnectivity, a narrow production base, and limited economies of scale (WTO, 2019b, p. 7). Manufacturing contributes about 6% of GDP and is declining in importance while imports increase; the main activities are food packing, processing and beverage production (WTO, 2019b, p. 9). Construction and infrastructure
projects, often funded by donor grants and softloans,havealsobeensignificantdriversofeconomic growth in recent years, accounting for 9.5% of GDP in 2016-17 (Ministry of Finance and National Planning, 2018, p. 17; WTO, 2019b, p. 9). Thirty-nine percent of households are involved in producing handicrafts or home-processed foods, mostly for their own consumption, with 31% of these households selling some proportion of their production (Tonga Statistics Department, 2017b, pp. 187–188). Handicraft work relies on local natural
Tonga
50
Vanuatu’s economy, apart from agriculture and tourism, is largely based on trade, with very little domestic manufacturing. As of 2013, commerce and industry contributed 36% of GDP, mostly in the form of retail trade (12% of GDP),financeandinsurance(7%),andrealestate (7%) (Government of Vanuatu, 2015b, p. 23). Manufacturing makes up only 3% of GDP (Government of Vanuatu, 2015b, p. 23). Small-scale production of handicrafts for the tourist market is an important source of livelihoods for independent producers, wholesalers, and market sellers, but the government is making efforts to encourage more local production as it has been estimated that up to 90% of souvenirs sold in Vanuatu are manufactured overseas and imported into the country to be sold to tourists (Vanuatu Department of Industry, 2017, p. 13).
Tropical cyclone Pam caused widespread damage to buildings and inputs to production. Damage and economic losses to commerce and industry were estimated at VUV 3.3 billion (approximately USD 30 million; 4.4% of GDP) (Government of Vanuatu, 2015b, p. 22). Home-based businesses are presumed to have been badly affected, as 81% of households in affected areas reported some level of damage (REACH,2015,p.2),butnospecificdataonhome-based small businesses could be located. However, despite the high frequency of natural hazards affecting Vanuatu, in a survey of MSMEs carried out in November 2016, only 1% of respondentsidentifiednaturalhazardsasbeingamong their most pressing problems; most businessesidentifiedmoreroutineconcernssuch as competition from other businesses (31%)andfindingcustomers(24%)astheirmostpressing problems (Reserve Bank of Vanuatu, 2016b, p. 27). MSMEs in the agriculture sector did, however, identify natural hazards and climate change as creating credit risk which inhibited borrowing (Reserve Bank of Vanuatu, 2016b, p. 46).
Vanuatu
resources such as pandanus tree leaves, and is vulnerable to natural hazards and climate change (Government of Tonga, 2018a, p. 7). Exports of handicrafts in 2014-15 accounted for approximately TOP 4 million (0.5% of GDP) (Government of Tonga, 2018b, p. 42).
Tropical cyclone Gita caused widespread damage and loss to Tongan businesses and demonstrated the vulnerability of MSMEs. Damage and economic losses to commerce and industry are estimated at TOP 55.3 million (5.6% of GDP) (Kingdom of Tonga, 2018a, p. 17). Most businesses (78%) in affected areas reported some extent of damage to their
properties or assets (Government of Tonga, 2018b, p. 51). Businesses reported that it could take between two weeks and six months to recover to pre-cyclone performance levels and overcome challenges including disruption of public utilities, slow consumer demand, and difficultyobtaininggoods,rawmaterials,andother inputs (Government of Tonga, 2018b, p. 51). Most businesses are MSMEs and although approximately 30% of all businesses have some insurance coverage, it is not clear what proportion of the smallest businesses have coverage or whether insurance covers cyclone risk (see section 3.4) (Government of Tonga, 2018b, p. 51).
51
Across all of the countries reviewed in this report, tourism is largely nature-based and dependent on coastal and marine ecosystems and coastal infrastructure, which are vulnerable to natural hazards and the impacts of climate change. Tourism development is expected to be negatively impacted by climate change through increased intensity of storms, increased
temperatures and extreme weather events, damage to infrastructure, beach erosion, damage to marine ecosystems, and policy responses such as carbon taxes which will increase travel costs (Van Der Veeken, Calgaro, Munk Klint, Law, Jiang, de Lacy, Dominey-Howes, & Reis, 2016, p. 53).
2.4. Tourism
Fiji has a large tourism industry that brings in more than 750,000 visitors per year and contributed 34% of the country’s GDP in 2019 (Government of Fiji, 2017b; World Travel & Tourism Council, 2020). Approximately 6% of people in poverty and 12% of people above the poverty line generate some part of their income from tourism (Government of Fiji, 2017b, p. 93). Tourismemploymentisparticularlysignificantfor women, with 12.8% of women working in the sector compared to 7.4% of men, but women are usually employed as housekeepers, receptionists and waitresses, with only one quarter of managerial and professional positions being held by women (Government of Fiji, 2016, p. 60).
The tourism industry is vulnerable to tourists’ perceptions of risk and to degradation of the natural environment. Tourists avoid destinations that they perceive as hazard-prone (ILO, 2019a, p. 23). The tourism industry in Fiji relies heavily on coastal attractions, so is highly vulnerable to cyclones, storm surges, and disruptions to transportation (PCRAFI, 2015a, p. 8), and to other longer-term risks related to climate change, including damage to environmental quality and ecosystems, increasing frequency of extreme temperatures, health risks associated with changes in the natural range
and prevalence of diseases, and increases in travel costs which may occur as part of policy responses to climate change (Government of Fiji, 2017b, pp. 93–94).
Tropical cyclones Evan and Winston caused limited damage to tourist infrastructure, most of which is built to high standards. TC Evan (2012) caused limited structural damage to hotels and resorts, and most of the seriously affected hotels and resorts drew on insurance to repair or rebuild without relying on the Government for financialassistance(WTO,2019b,p.44).Touristarrivals decreased by 2.5% following the storm, but the effect was temporary (Government of Fiji, 2017b, p. 93). TC Winston (2016) similarly had “minimal impact on the tourism sector” (Government of Fiji, 2016, p. 27), which was partly due to good fortune in that the storm did not affect the most popular and productive tourism regions, although it did cause damage to at least 75 of the estimated 400 tourism businesses in the country. Damage to hotels and resorts was minimal due to the generally good standards to which they were built, with a very small proportion of properties reporting the majority of damage (Government of Fiji, 2016, p. 57). Most affected businesses intended to continue operating at reduced capacity or
Fiji
52
to reopen within a few months (Government of Fiji, 2016, p. 60). The tourism industry generally recovered quickly following the cyclone and was successful in minimising negative reporting internationally, promoting a strong “business as usual” message, and reinstating international flightsonlytwodaysafterthecyclone(Government of Fiji, 2016, pp. 57, 59). Businesses are estimated to have lost FJD 44 million through cancellations and lost bookings, but overall visitor numbers were only expected to decline by 0.5% (Government of Fiji, 2016, p. 58).
Micro- and small enterprises supplying the tourism industry were affected in the short term. Tourism provides an important market for micro-, small-, and medium-sized enterprises (MSMEs) making handicrafts and supplying hotelsandspaswithflowers,artisanalproducts,and cosmetics (Government of Fiji, 2016, p. 60). Women’s handicraft groups in Ba Province, for example, reported their daily income declining by FJD 50 to FJD 140 in the aftermath of the cyclone (although it is not clear what proportion of their incomes this represented) (Government of Fiji, 2016, p. 60).
Papua New Guinea’s tourism industry plays only a small part in the country’s economy, and no evidence could be found about the impacts of natural hazards on the industry. Estimates of the economic importance of travel and tourism in Papua New Guinea range from 1% to 2.2% of GDP, and from 0.4% to 2.2% of total employment (ILO, 2017a, p. 30; Perrottet & Garcia, 2016, p. 5; World Travel & Tourism Council, 2020). Most visitors are traveling for business or work; only 26.5% of travelers in 2014 were on holiday (Perrottet & Garcia, 2016, p. 10). Papua New Guinea has diverse tourism opportunities including diving and snorkeling, surfing,cruising,culturalexperiencesandhistoricsites, nature and eco-tourism, trekking, and adventure tourism (Perrottet & Garcia, 2016, pp. 12–13). However, tourism development is hampered by distance, high costs, and security risks (Perrottet & Garcia, 2016, p. 12).
Samoa has a large tourism industry which is extremely important to the country’s economy. Tourism earnings made up 23.7% of GDP in 2019 (Ministry of Finance, 2020, p. 4)18 , generates the majority of export earnings (Perrottet & Garcia, 2016, p. 4), and generates 7% to 18% of formal employment (Samoa Tourism Authority, 2009, cited in Jiang, Calgaro, Klint, Dominey-Howes, DeLacy,&Noakes,2015,p.239;SouthPacificTourism Organization, 2014, and Government of Samoa, 2010, cited in Perrottet & Garcia, 2016, pp. 4–5; Pita & Schoop, 2015, p. 6). Most tourism businesses are small and owned by local people, with the most common type of tourist accommodation being the beach hut (fale) offering a “traditional” Samoan lifestyle experience (Parsons, Brown, Nalau, & Fisher, 2018, p. 647; Perrottet & Garcia, 2016, p. 14; Wong, de Lacy, & Jiang, 2012, p. 137).
Papua New Guinea Samoa
18 Other estimates range from 20% to 25% of GDP (John Connell, 2015, p. 125; Perrottet & Garcia, 2016, p. 3; S. R. Singh, 2019, p. 338).
53
Solomon Islands has a very small tourism industry which is nature-based and highly dependent on coastal and marine ecosystems and infrastructure which are vulnerable to climate change and natural hazards. Estimates of the economic importance of travel and tourism to Solomon Islands range from 3% to 10.5% of GDP and from 3% and 10.8% of total employment (ILO, 2017a, p. 30; Perrottet & Garcia, 2016, p. 5; World Travel & Tourism Council, 2020). As of 2013, 80% of visitors were business travelers (TRIP Consultants, 2015, p. 2); in 2015 there were only 6,100 leisure visitors to Solomon Islands, a number that is “tiny
by regional standards” (World Bank, 2017d, p. 64). The National Tourism Development Strategy describes the tourism industry as small and “still at an embryonic stage” with limited tourism infrastructure, but having potential for growth, particularly in the adventure tourism market (TRIP Consultants, 2015, pp. 2–3); other international observers concur that the potential of the industry is currently largely untapped (ADB, 2019a, p. 1; Perrottet & Garcia, 2016, pp. 11–12; Roubin, Billy, Hilly, Nardi, Nuia, Fernando, Gesiau, Maneka, & Gerea, 2018, p.65).Significantattractionsandactivitiesincludediving,swimming,snorkeling,surfing,
Solomon Islands
Tourism in Samoa is nature-based, highly dependent on coastal ecosystems, and vulnerable to natural hazards and climate change. In Samoa, tourism is centered around beachandmarineactivitiesincludingsurfing,cruising, diving and snorkeling, as well as cultural activities and spa and wellness resorts (Perrottet & Garcia, 2016, pp. 12–13). The tourism industry is “highly dependent on pristine marine resources and coastal infrastructure” (Wong et al., 2012, p. 136) and is vulnerable to natural hazards and climate change (ILO, 2019a, p. 23; Parsons et al., 2018, p. 644).
Natural hazards have caused significant economic harm to the tourism sector in Samoa, mostly through damage to accommodation properties. The 2009 tsunami, for example, damaged or destroyed 20% of accommodation rooms in the affected regions, with the heaviest impact falling on small-scale, typically family-run, beach fale accommodations where 77% of rooms were damaged (Government of Samoa, 2009, p. 34). Total damage across the tourism sector was estimated at WST 24.1 million (USD 9.6 million; 1.5% of GDP) (Government of
Samoa, 2009, p. 34). Projections of economic losses varied from WST 76.8 million (USD 30.7 million) to as high as WST 153.7 million (USD 61.5 million), depending on how quickly tourists were expected to return to Samoa or whether they might choose alternative destinations (Government of Samoa, 2009, p. 35). TC Evan, in 2012, caused damage to accommodation properties and cultural heritage sites valued at WST 30.2 million (USD 13.2 million; 1.7% of GDP), only 8.3% of which was insured (Government of Samoa, 2013, p. 33). It was expected that tourist visits would take three years to return to pre-cyclone levels, leading to estimates of economic losses values at WST 21.7 million (USD 9.5 million; 1.3% of GDP) with additional losses due to lost sales of arts and crafts and other products to tourists and sales of agriculture andfisheryproductstohotels(GovernmentofSamoa, 2013, pp. 33–34). The Government’s post-disaster needs assessment estimated that 974 jobs would be lost in the tourism sector (with a nearly equal distribution among men and women), which is about 54% of the sector’s employment (Government of Samoa, 2013, pp. 31–32, 34).
54
eco-tourism, cultural interest, and historic sites (Perrottet & Garcia, 2016, pp. 11–12). Tourism offers opportunities for inclusive and sustainable economicgrowthandforcreatingsignificantnumber of good quality jobs for both men and women, and for creating opportunities for youths as well; there is particular interest in developing the industry in the Western Province (Roubin et al., 2018, p. 65; World Bank, 2017d, pp. xviii, 64–65). As noted above for the entire
Pacificregion,climatechangeisexpectedto have a range of negative impacts that may adversely affect tourism potential in Solomon Islands. The country’s National Tourism Development Strategy notes the importance of incorporating disaster risk management, climate change adaptation, and public relations management (in relation to natural hazards) in tourism development plans (TRIP Consultants, 2015, pp. 27, 36, 49).
Tonga’s tourism industry contributes a relatively small proportion of domestic economic activity but is the largest single source of export earnings. The Government estimates that the tourism industry contributes 3.2% of GDP but also notes that this may be an underestimate (Government of Tonga, 2018b, p. 61); the value could be as high as 12.1% of GDP (World Travel & Tourism Council, 2020). Estimates of the amount of employment created by the tourism industry range from 12.8% (World Travel & Tourism Council, 2020) to 15% (South PacificTourismOrganization,citedinPerrottet& Garcia, 2016, p. 4). Tourism is the country’s largest single source of export earnings, worth 63% of total exports in 2017 (Perrottet & Garcia, 2016, p. 4; WTO, 2019b, p. 19). The industry hasgrownby17%overthepastfiveyears(Government of Tonga, 2018b, p. 61) and tourist arrivals are expected to increase by 85%, from 47,000 to 87,000 per year, between 2018 and 2028 (World Travel & Tourism Council, cited in WTO, 2019b, p. 19). Tourism in Tonga is nature-based and highly dependent on the health of the coastal environment (Kingdom of Tonga, 2019, p. 99; Van Der Veeken et al., 2016, pp. 55, 59), and tourists are already concerned about natural hazards including tropical cyclones, extreme weather, and tsunamis (Van Der Veeken et al., 2016, p. 59).
Tropical Cyclone Gita caused significant economic harm to the tourism sector, mostly through damage to accommodation properties, but the impacts were expected to last only one season. Damage and economic loss to the tourism sector is estimated at TOP 40.6 million (4.1% of GDP), which was 13% of the total damage caused by the cyclone (Kingdom of Tonga, 2018a, p. 17). Most of the damage (90%) was related to accommodation buildings, furnishings, equipment, and other assets (Kingdom of Tonga, 2018a, p. 31). Almost all (72 out of 76) of the accommodation businesses on Tongatapu and ’Eua sustained damage; resort properties suffered the greatest damage in monetary terms but only 14% of the value was insured (Kingdom of Tonga, 2018a, p. 31). Approximately 44% of accommodation properties (but only 20% of resorts) and 40% of restaurants were insured for cyclone damage (Government of Tonga, 2018b, p. 63). Economic losses due to cancellations, lost bookings, closures, and increased operational costs were expected to be felt more by beach and island resorts, backpacker accommodations, and tourist lodges outside Nuku’alofa, which experienced disproportional declines in business compared to urban hotels (Kingdom of Tonga, 2018a, p. 31). Approximately 29% of damaged accommodation properties completed repairs and reopened within two weeks of the cyclone,
Tonga
55
Vanuatu has a large and growing tourism industry which is extremely important to the country’s economy, but is vulnerable to natural hazards. Estimates of the economic importance of travel and tourism to Vanuatu range between 35% and 45% of GDP, between 14% and 38% of total employment, and up to 67% of total export earnings (Jacqueline Connell, 2019, p. 327; ILO, 2017a, p. 30; World Travel & Tourism Council, 2020; WTO, 2019b, p. 31). The World Travel and Tourism Council predicts industry growth of 4.1% per year over the next decade with tourism’s contribution to Vanuatu’s GDP expected to reach 50% of GDP by 2027 (WTO, 2019b, p. 31). The major attractions for tourists include adventure tourism, volcanoes, beaches, cruising, cultural activities, diving and snorkeling, eco-tourism,andfishing(Perrottet&Garcia,2016, pp. 12–13), which are vulnerable to the impacts of climate change and natural hazards as is the case for all countries in the region.
Tropical Cyclone Pam caused significant economic harm to the tourism sector, mostly through damage to accommodation properties, but the impacts lasted only one season. Damage and economic loss to the tourism sector was estimated at VUV 9.5 billion (approximately USD 87 million; 12.5%
and 58% reopened within one month; other properties estimated that repairs could take up to eight months (Government of Tonga, 2018b, p. 63). Both TC Ian and Gita contributed to business down-turns and short-term reductions in employment opportunities (WTO, 2019b, p. 14) but the impacts of TC Gita on tourism were expected to be short-term, with tourist arrivals and revenues slightly reduced in 2017-18 but expected to return to normal the following year (Ministry of Finance and National Planning, 2018, p. 17).
of GDP) (Government of Vanuatu, 2015b, p. 29). Most of the damage was suffered by accommodation properties (88%), with the greatest damage associated with two major hotels, but widespread lower-value damage was suffered by other accommodation properties and by 88% of all tour operators (Government of Vanuatu, 2015b, p. 31). Women were expected to suffer greater job losses than men, because in post-disaster situations the tourism industry commonly retains managerial and groundskeeping staff, who are mostly male, and lays off housekeeping staff, who are mostly female (Government of Vanuatu, 2015b, p. 34). Tourist arrivals dropped by between 11% and 17% following the cyclone (Perrottet & Garcia, 2016, p. 2; WTO, 2019b, p. 31) but the decline was brief and the tourism sector had recovered to pre-cyclone levels by 2017 (Eriksson et al., 2017, p. 52; WTO, 2019b, p. 31). Some larger properties were slow to reopen (the Holiday Inn took more than 15 months) but smaller owner-operator guesthouses were able to reopen more quickly; however, “many business owners who had not procured cyclone insurance folded in the aftermath of the storm, unable to reinvestsufficientsavingsintheirbusinessesortotap sources of credit” (WTO, 2019b, p. 31).
Tonga’s tourism sector largely consists of MSMEs, and the impact of damage and losses to small businesses with limited cash reserves, especially accommodation properties, was severe (Government of Tonga, 2018b, p. 64). There are no internationally branded hotels in Tonga (Perrottet & Garcia, 2016, p. 14). The scale of the tourism sector is small enough that if several tourist accommodation businesses fail to recover, the country’s destination supply and its brand image could be affected (Government of Tonga, 2018b, p. 64).
Vanuatu
56
2.5. Housing and Settlements
The topography of Fiji leads 90% of the population to live in coastal regions that are exposed to flooding, cyclones and sea-level rise, and there is generally a lack of climate-resilient housing across the country (Government of Fiji, 2018b; UNDRR, 2019b). More than half of the population (54% in 2017) is urban, concentrated in three rapidly growing urban corridors. Urban growth is driven by natural population growth and by migration from rural areas and the outer islands, which is primarily due to urban-rural household income differentials (Government of Fiji, 2017b, p. 41). There is a large backlog in providing low-income housing in Fiji, and urban populations are overcrowding into existing housing stock, building illegally on vacant land, or entering into informal and insecure housing arrangements. About 20% of the urban population (10% of the total population of the country) lives in unplanned and rapidly growing urban and peri-urban informal settlements where land tenure is unregistered and insecure, housing stock is low quality, 13% of households have shared or no access to potable water, 28% had no access to
Most people in Papua New Guinea live in rural areas exposed to a wide range of natural hazards. The majority of the population (87% to 88%) lives in rural areas, highly dispersed geographically with limited access by road or sea, high transportation costs, limited infrastructure, and high levels of poverty (CFE-DM, 2019, p. 25; FAO, 2020; ILO, 2018, p. 2; UNDP, 2019, cited in UNDRR, 2019a, p. 12). More than 80% of the population is susceptible to drought (and frost, in the highlands) caused by El Niño, half a million people live in coastal villages exposed to sea-level rise, coastal degradation and storm surges, the country
electricity, and vulnerability to natural hazards is high (Government of Fiji, 2017b, p. 56).
The two major tropical cyclones that hit Fiji in the past decade caused extensive damage to housing stock across the country. TC Evan destroyed about 1% of the country’s total housing stock and damaged another 4%, for a total value of FJD 50 million (Government of Fiji, 2013). TC Winston destroyed 7.5% of the total housing stock and damaged a further 6.3% of houses, for a total of FJD 751 million (Government of Fiji, 2016, p. 72). Most households had to bear the rebuilding cost themselves, which was a major challenge (WTO, 2019b, p. 45); the government offered assistance through the Help for Homes program (see section 3.2), but the program’s budget was only one-sixth of the estimated amount of damage (Government of Fiji, 2016, p. 72). Households headed by women, the elderly, and peoplewithdisabilitiesmayfinditparticularlychallenging to repair or rebuild their houses independently (Government of Fiji, 2016, p. 76).
is among the top six countries worldwide for the percentage of its population exposed to earthquake hazards, and it has “the highest percentage of population exposed to severe volcanic risk” in the world (GFDRR, 2016a, p. 11; UNDP, 2019, cited in UNDRR, 2019a, p. 12).
Weak construction standards lead to excessive damage to buildings affected by earthquakes. News media reports indicate that building codes in Papua New Guinea are outdated and based on seismic assessments that underestimate the risk posed by earthquakes, and that buildings often fail to conform to
Fiji
Papua New Guinea
57
Most people in Samoa live in rural areas and near coastlines, and housing is often poorly constructed and vulnerable to cyclone and tsunami damage. The majority of the population (81% in 2013-14) lives in rural areas (Samoa Bureau of Statistics, 2020b, p. 30) and 70% of the population lives along the coastline, exposedtocyclones,tsunamisandflooding(IFRC, 2016c, p. 42). Most houses in Samoa (82%) are of “European type” construction, as opposed to houses of traditional Samoan design and construction (Samoa Bureau of Statistics, 2020b). A national building code is used in designing structures but is not legally enforceable, construction often deviates from plans, construction standards are often not followed, and building inspection procedures are lax (Government of Samoa, 2013, p. 61;
the building code due to poor construction standards, lack of inspections and enforcement, and corrupt tendering practices (Allen, 2018, p. 2; Graue, 2018). Details of damage sustained in the 2018 earthquake suggest that sub-standard construction practices were responsible for some buildings failing to withstand the earthquake (Wari, 2018). Traditional homes builtofflexiblenaturalmaterialsperformwellin earthquakes, and are light structures that cause few casualties if they collapse; modern structures with heavier construction (for example, with corrugated iron roofs) require higher standards of construction to be robust under earthquake conditions, and cause more casualties if they do collapse (Graue, 2018). Work on updating the national earthquake hazard map, a prerequisites to updating the building code, was underway as of 2018 (Allen, 2018, p. 2).
PCRAFI, 2015b, p. 35). Damage caused by TC Evan suggested that many European-style houseslackedsufficientreinforcementinroof,walls, and/or foundations, while traditional Samoan houses were less badly affected and were inexpensive and more easily repairable using locally-available building materials (Government of Samoa, 2013, pp. 58, 62). The 2009 tsunami damaged housing of all types roughly equally, and 70% of the houses that were affected were completely destroyed, suggesting that structures of any type were unlikely to be able to resist the force of a tsunami (Government of Samoa, 2009, p. 40).
Rural-urban migration is limited, but contributes to the growth of informal urban settlements that are exposed to risk. In the capital city, Port Moresby, unplanned informal settlements aregrowing,andarevulnerabletoflooding,tsunamis, earthquakes (due to lack of seismic planning),urbanfiresanddiseaseswhichfollow the absence of sanitation (Costella & Ivaschenko, 2015, p. 28; UNDRR, 2019a, p. 14). The urban population in Papua New Guinea is growing slightly more quickly than the total population, at 2.6% and 2.0% per year, respectively (World Bank, 2020e). There is some rural-urban migration, and one small study suggests that 61% of rural-urban migrants are seeking economic opportunities (Steven, 2016). However, the rural-urban population flowisnotlarge,astheurbanpopulationhasremained between 13.0% and 13.3% of the total population for the past twenty years (World Bank, 2020e).
Samoa
58
Tropical cyclone Evan caused extensive damage to housing through a combination of high winds and flooding. In the affected areas, 2,088 houses were damaged, and 29% of these were considered unsafe for occupation (Government of Samoa, 2013, p. 56). The total value of damage and losses including household goods was estimated at WST 43.4 million (USD 19.0 million; 2.5% of GDP) (Government of Samoa, 2013, p. 54). About 7,500 people were temporarily displaced to stay with friends or family or in public emergency shelters, but most returned quickly to their
places of residence where they carried out makeshift repairs or built temporary structures; shelter assistance consisting of tents and tarpaulins, tool kits, hygiene kits, kitchenettes, and household items was distributed to familieswhosehouseswerenolongerfitforoccupation (Government of Samoa, 2013, pp.54,58).Accesstofinancialresourcesforpurchasing building materials including timber wasasignificantconstraintmentionedbyhomeowners (Government of Samoa, 2013, p. 59).
Housing in Solomon Islands is often low-quality and vulnerable to natural hazards, with informal settlements in urban areas being a particular concern. According to the 2009 Population and Housing Census, the majority of houses in Solomon Islands are constructed with walls or roofs (54% and 61%, respectively) of traditional materials, rather than more robust wood, metal, or concrete block construction (SolomonIslandsNationalStatisticalOffice,2012, p. 35). The Government notes that “buildings constructed of traditional materials are not built to any regulated standards and tend to be far less resilient to natural hazards suchasfloodingandcyclones”(Governmentof Solomon Islands, 2014, p. 26), although an academic study considering the effect of cyclones on housing in Vanuatu, Samoa and Solomon Islands concluded that “traditional buildings, if carefully built, are actually designed toletacycloneflowaroundorthroughthem without serious damage” (Yates and Anderson-Berry, 2004, cited in Weir, Dovey, & Orcherton, 2017, p. 1021). The country has a draft building code, developed in 1990, but it is not legally enforceable and is considered out of date (PCRAFI, 2015c, p. 37; Saefoa,
2020). About 75% of the population lives in rural areas, but urbanisation is proceeding rapidly and the urban population is expected to increase to 40% of the total population by 2050, placing strain on urban planning and public services (Fleming, Anthonj, Thakkar, Tikoisuva, Manga, Howard, Shields, Kelly, Overmars, & Bartram, 2019, p. 332). Much of the urban growth consists of inexpensive, temporary, and poorly-constructed structures in informal settlements located in low-lying areas at risk of flooding,tidalsurges,andtsunamis(Costella& Ivaschenko, 2015, p. 28; GFDRR, 2016b, p. 1; Government of Solomon Islands, 2014, p. 27). Flooding in Honiara in 2014, for example, which destroyed 675 houses (about 2.7% of the city’s total housing stock and 2.5% of the total housing stock of Guadalcanal province), was largely attributed to exposure and vulnerability related to unregulated urbanization, and particularly to “highly exposed houses located on dangerously low ground and to the presence of low-resilience (traditional leaf) housing styles, which were disproportionately damaged”, although thefloodsalsodamagedanddestroyedhousesof concrete block construction (Government of Solomon Islands, 2014, pp. 2, 26–27, 37–38).
Solomon Islands
59
Tonga is predominantly rural and most settlements are on low-lying coastal areas which are vulnerable to cyclones and tsunamis. The majority of the population lives on the coasts of the larger islands at or near sea level (Kingdom of Tonga, 2019, pp. 98, 176). Seventy-four percent of the population of the country lives on the largest island, Tongatapu, but only 23% of the population live in the relatively urban area of Nuku’alofa (Tonga Statistics Department, 2017a, p. 10). There is a trend of migration from the outer islands to Tongatapu, where 74% of the population live: net internal migration between 2011 and 2016 amounted to 1.2% of the population of Tongatapu in 2016 (Tonga Statistics Department, 2017a, pp. 13, 64–65). However, the population of Tongatapu decreased by 1.1% and the total population of Tonga decreased by 2.5% over the same period due to emigration (Tonga Statistics Department, 2017a, p. 10; United Nations Population Division, 2019). Some land use and settlement challenges in the more densely populated areas of Tongatapu have been attributed to migration from the outer islands, including increased settlement on marginal, low-lyingandflood-pronelands,reclamationof environmentally sensitive areas, increased fishingpressureadjacenttourbanareas,removal of coastal vegetation and mangroves causing soil loss and coastal erosion, and loss of terrestrial and marine habitats and species (Government of Tonga, 2018a, p. 5; Kingdom of Tonga, 2019, p. 98).
Housing in Tonga is often low-quality and vulnerable to cyclone damage. Houses in Tonga are mostly built with wood (58%) or brick (38%) outer walls, only 4% using other materials (Tonga Statistics Department, 2017a, p. 162). There is limited compliance with the national building code “due to weak regulatory supervision, lack of budget and a shortage of expertise for enforcement, and high construction and maintenance costs”, which contributed to widespread damage to housing as a result of TC Gita (IMF, 2020b, p.
38). Following Cyclone Ian in 2014, it was found that houses constructed to cyclone standards intheearly1980ssufferedsignificantlylessdamage than newer houses that were not built in compliance with the standard (IFRC, 2016d, p. 85). A study of housing quality on Tongatapu found that approximately three-quarters of houses surveyed showed evidence of structural damage or water penetration indicative of past storm damage, which was largely attributed to the use of imported building practices and materials poorly adapted to local conditions (Robinson, Hulme-Moir, Puloka, Smith, Stanley, & Signal, 2017).
Recent cyclones have caused extensive damage to housing, and repair and reconstruction has been slow. TC Gita in 2018 caused widespread damage to housing stock across the affected islands, with 33% of housing in Tongatapu and 57% in ’Eua damaged or destroyed (Kingdom of Tonga, 2018a, p. 35). Damage to housing was estimated at TOP 111.6 million (11.3% of GDP), which was 61% of the total damage caused by the cyclone (Kingdom of Tonga, 2018a, p. 17). Timber and masonry houses experienced similar rates of damage, while 2% of masonry houses and 11% of timber houses were destroyed (Kingdom of Tonga, 2018a, p. 35). The Government of Tonga provided support for housing repair and reconstruction following both TC Ian and TC Gita, but “the lack of an overarching policy and the intensity of relief efforts contributed to long delays in decision-making, exacerbating uncertainties for communities” (IMF, 2020b, p. 38). Immediately following TC Gita, the government was described as “encouraging self-recovery approaches” (CARE, 2018, p. 5) and the transition from immediate response activities to longer-term recovery work was slow and hampered by lack of clarity about roles, responsibilities, and capacity in the relevant government ministries, with options for providing assistance still being discussed at least eight months after the storm (Kingdom of Tonga, 2018a, p. 37, 2018b, p. 2).
Tonga

60
Housing in Vanuatu is often low-quality and vulnerable to cyclone damage.Seventy-fivepercent of the population of Vanuatu lives in rural areas, with 19% living in the capital, Port Vila, and 6% in the country’s second city, Luganville(VanuatuNationalStatisticsOffice,2017, pp. 95–96). Most construction in rural areas is informal, unregulated, and not built according to any standards or codes, which makes communities vulnerable to building damage and injury resulting from natural hazards (Handmer & Iveson, 2017, p. 64). Vanuatu has a large stock (43%) of houses built using traditional locally-available materials and techniques such as thatch, woven palm fronds, and woven cane; 30% of houses are built of locally-available materials supplemented with features such as timber framing and corrugated galvanized iron roofs; and 27% are of more durable timber or concrete block construction (Government of Vanuatu, 2015b, p. 36). Studies looking at housing damage after TC Pam arrived at different conclusions: the Shelter Cluster found that buildings constructed in the traditional style survived better than houses using modern materials or methods, while a report by Save the Children concluded that roofs constructed from traditional materials suffered greater damage than roofs constructed from modern materials (Handmer & Iveson, 2017, p. 64) and the Government’s post-disaster needs assessment concluded that buildings constructed to modern standards survived better and called for more inspections to improve compliance with standards (Government of Vanuatu, 2015b, p. 27). Port Vila also has large informal settlements which house 35% of the city’s population (as of 2013), where housing and infrastructure are not disaster-resilient and access to services is poor (NDMO [National Disaster Management Office],2018,p.11).Theseinformalsettlementsdonothaveofficialsanctionandaregenerallybased on agreements with local land owners (Handmer & Iveson, 2017, p. 61).
Tropical cyclone Pam caused extensive damage to housing stock and temporarily displaced 65% of households in affected areas. In affected areas, 81% of households reported some level of damage, with the most vulnerable houses being those with thatched roofs (55% to 77% of such houses reported total destruction of the roof, depending on thematerialsused)andwallsandfloorsofbamboo (56% of bamboo walls and 63% of bamboofloorswerecompletelydestroyed)(REACH, 2015, pp. 20–21). Damage to homes also results in loss of income from home-based livelihood activities, which particularly affects women (Government of Vanuatu, 2015b, p. 38). Sixty-fivepercentofhouseholdsintheaffectedareas left their houses to stay in safer locations, suggesting widespread fears that houses were notsufficientlyrobusttowithstandthecyclone(REACH, 2015, p. 2). Most stayed with friends or family in their own community (53%) or in a community-managed shelter such as a school orchurch(30%)(REACH,2015,p.12).Byfivetosix months after the cyclone, 86% of displaced households had returned home and half of the remainder expected to return home at some point (Shelter Cluster, 2015, p. 14). Rebuilding after TC Pam often tended to be done quickly and cheaply, and buildings were typically restored to their previous conditions in the same locations and using the same materials rather than raising standards (Handmer & Iveson, 2017, pp. 63–64). Within one to one and a half months after the cyclone, 72% of households had completed enough repairs that they “perceived that their immediate shelter needs had been met”,andbyfivetosixmonthsafterthecyclone, this had risen to 85% (REACH, 2015, p. 24; Shelter Cluster, 2015, p. 20). Five to six months after the cyclone, 68% of households reported that they had received shelter assistance, consisting mostly of tarpaulins (82%), building materials (35%), blankets (27%), and tool kits (26%) (Shelter Cluster, 2015, p. 16). However, most households (81%) reported that they had relied on using recovered materials (sifting through debris) and locally-available natural materials (Shelter Cluster, 2015, pp. 21–22).
Vanuatu
61
Worldwide and across the Pacific, poor and marginalized people are disproportionally exposed to natural hazards. Poor people often live on low-value land in locations where they are more exposed to hazards (including frequent, low-intensity hazards) than wealthier people are. They lack resources to invest in disaster-resilient housing and other infrastructure, their employment and incomes are less secure, they have less access to social protection schemes, they have limited savings, and they have limited access to insurance or affordable credit. When disaster strikes they are often forced to adopt coping strategies that have long-term negative impacts, such as taking children out of school, selling productive assets, or reducing food intake, and they often receive less post-disaster support, and less quickly (Hallegatte et al., 2017, p. 4; ILO, 2019a, p. 4; SPC, 2018, p. 108; Utz, 2017, p. 90; Wehrhahn et al., 2019, p. 60).
The impacts of natural hazards are also disproportionately higher for poorer people (Wehrhahn et al., 2019, p. 60). The same
loss affects poor people more severely than wealthy people because “their livelihoods depend on fewer assets, their consumption is closer to subsistence levels, they cannot rely on savings to smooth the impacts, their health and education are at greater risk, and they may need more time to recover and rebuild” (Hallegatte, Rentschler, & Walsh, 2018, p. 4). The monetary value of damage to assets and losses toeconomicproductiondoesnotfullyreflectthe impacts on people’s well-being (Hallegatte et al., 2018, p. 4). Women, youth, children, the elderly, people living with disabilities, and people belonging to ethnic or religious minorities are also more severely affected by natural hazards than people who have more wealth, power,andinfluence.Vulnerablepeopleinall these groups tend to be overrepresented in the informal economy, more likely to be unemployed or in insecure work, and have less access to resources with which to restore their livelihoods or adapt to climate change (ILO, 2019a, p. 12).
2.6. Low-Income and Informal Workers
More than one-third of Fijians are below the national poverty line, and informal and subsistence livelihoods are common, but extreme poverty is rare. The World Bank reports that 2.3% of the population lives on less than USD 1.40 per day, and 15.1% live on less than USD 3.10 per day (World Bank, 2017c, p. 8). However, 35% of Fijians (26% in urban areas and 44% in rural areas) live below the national basic needs poverty line (Government of Fiji,2016,p.19).ManyFijianslivein“affluentsubsistence”:theyhavesufficientresourcesto meet most basic needs, but have limited economic opportunities to move beyond that level (Wehrhahn et al., 2019, p. 41). About 18% of adults identify their primary economic activity as solely subsistence based (Singh-Peterson & Iranacolaivalu, 2018, p. 12), but 60% of the employed population (78% in rural areas and 37% in urban areas) engage in some form of informal or subsistence activities (ILO, 2017a, pp. 4–5).
Tropical cyclone Winston is expected to have a significant long-term effect on employment and livelihoods for people on lower incomes. The Government’s post-disaster needs assessment noted that “most civil servants and salaried people will not suffer income loss as a result of TC Winston” but that less well-off people may be forced into the informal sector and to increase subsistence activities (Government of Fiji, 2016, p. 34). This will likely depress incomes and livelihoods for a long time: while some sectors of the economy were expected to recover within a few months, agricultural production in some areas may not return to pre-cyclone levels for fivetotenyears,andfisheriesinsomeareasforas long as 12 years (Government of Fiji, 2016, pp. 12, 50).
Fiji
62
Poverty is a major challenge in Papua New Guinea. The most recent available data on extreme poverty is from 2009, when 38% of the population fell below the USD 1.90/day income poverty line (World Bank, 2020e). Papua New Guineaalsohasanationally-definedpovertyline, and in 2017, 37.5% of the population was below that level (ADB, 2020, p. 1). An IFPRI (International Food Policy Research Institute) study carried out in 2018 in three provinces and in the Autonomous Region of Bougainville found that on average, the poorest 40% of households “donotconsumesufficientcaloriestomeettheminimum daily calorie recommendation for a healthy life”, poor and non-poor households in three of the four locations were not meeting their recommended daily protein intake, 29% of children surveyed had stunted growth, and 9% showed wasting19 (Schmidt, Gilbert, Holtemeyer, Rosenbach, & Benson, 2019, p. vi).
Papua New Guinea has high levels of subsistence economic activity and informal and vulnerable employment. The majority of the population (82% to 85%) is engaged in subsistence agriculture (CFE-DM, 2019, pp. 15, 22); the 2011 census provides a breakdown of those engaged in subsistence agriculture, hunting, and forestry as consisting of 71% of males and 81% of females (ILO, 2017a,
p. 6). Unpaid work, unemployment and underemployment are widespread, and formal employment has not kept pace with labor force growth; although extractive industries (mining, oil,andgas)havecontributedsignificantlytothe economy in GDP terms in recent years, this has not created large-scale employment or other economic opportunities (ILO, 2018, p. 3). Estimates of the proportion of the workforce in informal employment range between 84% and 90% (CFE-DM, 2019, p. 22; Jones & McGavin, 2015, cited in ILO, 2017a, p. 4), and the ILO considers 75% of employment in Papua New Guinea to be vulnerable (including people working on their own account and contributing family workers) in the sense of suffering from low job and income security and less protection under employment regulation than work in the formal economy (ILO, 2019a, p. 4). The majority of skilled, formal work is done by foreign workers (CFE-DM, 2019, p. 22). In many countries, the informal economy is seen as negative, and policies aim to formalise economic activity, but in Papua New Guinea, Government policy aims to protect, promote, and grow the informal economy and “to see the informal economy acknowledged as the full and legitimate partner of the formal economy” (Department for Community Development, 2011, p. ix; Kopel, 2017, pp. 3–4).
Papua New Guinea
19Stunting, or low height for age, is the result of chronic or recurrent undernutrition, and impairs the full development of physical and cognitive potential; wasting, or low weight for height, usually indicates recent and severe weight loss becauseofinsufficientfoodoraninfectiousdisease,andisacontributortochildmortality(WorldHealthOrganization,2020).
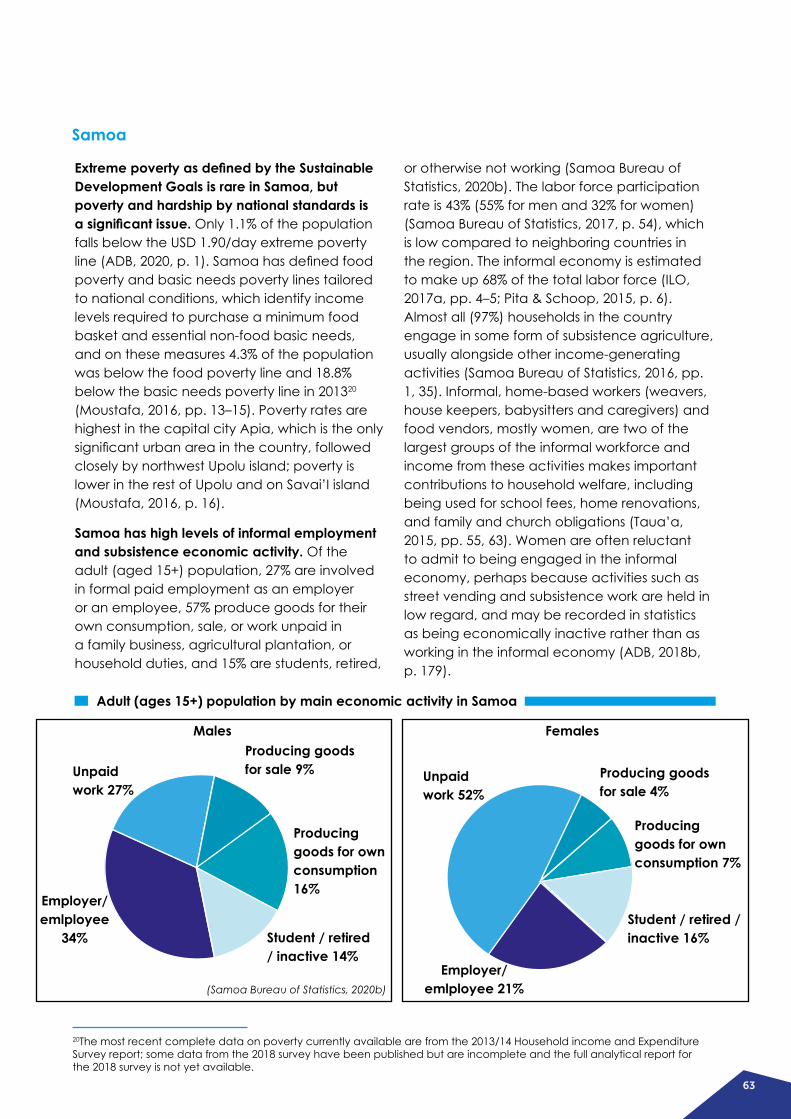
63
Extreme poverty as defined by the Sustainable Development Goals is rare in Samoa, but poverty and hardship by national standards is a significant issue. Only 1.1% of the population falls below the USD 1.90/day extreme poverty line(ADB,2020,p.1).Samoahasdefinedfoodpoverty and basic needs poverty lines tailored to national conditions, which identify income levels required to purchase a minimum food basket and essential non-food basic needs, and on these measures 4.3% of the population was below the food poverty line and 18.8% below the basic needs poverty line in 201320 (Moustafa, 2016, pp. 13–15). Poverty rates are highest in the capital city Apia, which is the only significanturbanareainthecountry,followedclosely by northwest Upolu island; poverty is lower in the rest of Upolu and on Savai’I island (Moustafa, 2016, p. 16).
Samoa has high levels of informal employment and subsistence economic activity. Of the adult (aged 15+) population, 27% are involved in formal paid employment as an employer or an employee, 57% produce goods for their own consumption, sale, or work unpaid in a family business, agricultural plantation, or household duties, and 15% are students, retired,
or otherwise not working (Samoa Bureau of Statistics, 2020b). The labor force participation rate is 43% (55% for men and 32% for women) (Samoa Bureau of Statistics, 2017, p. 54), which is low compared to neighboring countries in the region. The informal economy is estimated to make up 68% of the total labor force (ILO, 2017a, pp. 4–5; Pita & Schoop, 2015, p. 6). Almost all (97%) households in the country engage in some form of subsistence agriculture, usually alongside other income-generating activities (Samoa Bureau of Statistics, 2016, pp. 1, 35). Informal, home-based workers (weavers, house keepers, babysitters and caregivers) and food vendors, mostly women, are two of the largest groups of the informal workforce and income from these activities makes important contributions to household welfare, including being used for school fees, home renovations, and family and church obligations (Taua’a, 2015, pp. 55, 63). Women are often reluctant to admit to being engaged in the informal economy, perhaps because activities such as street vending and subsistence work are held in low regard, and may be recorded in statistics as being economically inactive rather than as working in the informal economy (ADB, 2018b, p. 179).
Samoa
20The most recent complete data on poverty currently available are from the 2013/14 Household income and Expenditure Survey report; some data from the 2018 survey have been published but are incomplete and the full analytical report for the 2018 survey is not yet available.
Adult (ages 15+) population by main economic activity in Samoa
Males Females
Unpaid work 27%
Employer/ emlployee
34%
Producing goods for sale 9% Producing goods
for sale 4%
Producing goods for own consumption 16%
Student / retired / inactive 14%
Producing goods for own consumption 7%
Employer/ emlployee 21%
Unpaid work 52%
Student / retired / inactive 16%
(Samoa Bureau of Statistics, 2020b)
64
People living on low incomes and subsistence agriculture have been severely affected by events such as tsunamis and cyclones. The 2009 tsunami affected a region that was already one of the poorest parts of the country, where reliance on home-produced food was higher than any other part of the country and where many people worked in the tourism sector. The post-disaster needs assessment reported that loss of livelihoods in the affected area was substantial, with damage to subsistence agricultural production putting households at risk of food poverty, and some 500 workers in the tourism industry losing their jobs (Government of Samoa, 2009, pp. 79–80). Similarly, following TC Evan in 2012, subsistence livelihoods and low-income households were heavily impacted and that lost economic opportunities, mostly in agriculture, was likely to push many families temporarily below the poverty line (Government of Samoa, 2013, pp. 105–107). Several weeks
after the cyclone, households reported eating less, eating fewer types of foods, eating less-preferred foods, and slaughtering productive animals to meet food needs, which undermines future productivity (Government of Samoa, 2013, p. 114). Rural families that depended on their plantations for food and income estimated that it would take 6-12 months before production could be harvested again, and a year and a half to two years before returning to pre-cyclone levels of production; however, no rural households sought to change their livelihoods in the meantime, and most sought to re-establish their existing livelihoods (Government of Samoa, 2013, p. 114). It is often the case that people dependent on subsistence farming, especially in remote locations with limited market economies, have limited options available to them and “cannot simply change their livelihoods” (Handmer & Nalau, 2019, p. 371).
Poverty is widespread in Solomon Islands (ADB, 2019a, p. 1). In 2013, 25.1% of the population was below the USD 1.90 per day international poverty line, and 58.8% fell below the USD 3.20 per day poverty line (World Bank, 2020e). Solomon Islands also has a nationally-definedpovertyline,andin2013,12.7%of the population fell below this line (ADB, 2020, p. 1). Electricity, water, transport, and telecommunication services are not available to a large proportion of the population (ADB, 2019a, p. 1).
Solomon Islands has high levels of subsistence economic activity and informal and vulnerable employment. The labor force participation rate is 67% (74% for men and 61% for women), but 85% of those who are employed are considered to be in informal employment (ILO, 2017a, pp. 4–5), and the ILO considers 63% of employment in Solomon Islands to be vulnerable (including people working on their own account and contributing family workers) in the sense of
suffering from low job and income security and less protection under employment regulation than work in the formal economy (ILO, 2019a, p. 4).InformalemploymentissignificantinHoniara,including activities such as: selling betel nut, tobacco, handicrafts, and fruit and vegetables; construction, transport, and repair work for men; house cleaning and child care for women; and also including illicit work (World Bank, 2017d, p. 78). Such work is short-term and sporadic: “the bulk of informal enterprises appear to operate more as survival mechanisms than as means of accumulation. Stalls and canteens, for instance, often operate intermittently to raise income for small household expenses or one-off items. Betel nut, tobacco, and mixed goods sellers tend to remainsmall,unabletoaccumulatesufficientcapitalforexpansion.Instead,profitsareusedfor reinvestments in stock, immediate needs, lending,orkinshipobligationsthatitisdifficultforbusiness owners to resist” (World Bank, 2017d, p. 78).
Solomon Islands
65
Extreme poverty is rare in Tonga, but there are significant levels of deprivation and hardship, especially in rural areas (World Bank, 2017b, p. 2; WTO, 2019b, pp. 9–10). In 2016, 3.1% of the population was living below the World Bank’s USD 1.90 per day international poverty line (up from 1.1% in 2009) (Ministry of Finance, 2019, p. 64) and about 10% of the population was below the USD 3.10 poverty line (World Bank, 2017b, p. 2). The government also uses a national poverty line of TOP 970 per month for adults, equivalent to USD 13.92 per day, against which 27% of the population is considered to be in poverty (Ministry of Finance, 2019, p. 64).
Tonga has high levels of informal and vulnerable employment and subsistence economic activity. Only 57% of the economically active
Poverty is a significant issue in Vanuatu, although there is a lack of recent data to confirm the current situation. The most recent data available come from the 2010 Household income and Expenditure Survey, which showed that 13.2% of the population fell below the USD 1.90 per day international poverty line, and 39.5% fell below the USD 3.20 per day lower middle income poverty line (World Bank, 2018b, p.1).Vanuatualsohasanationally-definedbasic needs poverty line and food poverty line; in 2010, 12.7% of individuals were in basic needs poverty and only 3.2% were in food poverty (Anderson, Barnes, Raoof, & Hamilton, 2017b, p. 108). Poverty rates are higher in urban areas than in rural areas (Anderson et al., 2017b, p. 23).
Vanuatu has high levels of subsistence economic activity, and employment is largely informal and vulnerable. Only 30% of the adult population (excluding full-time students) is in paid employment, with 35% producing goods for their own consumption or for sale, 32% doing unpaid work in a family business or agricultural
population works in paid employment, with 26% undertaking subsistence work, unpaid family work,orvolunteerwork,and16%classifiedasunemployed (Tonga Statistics Department, 2017a, pp. 10–14). The ILO considers 56% of employment in Tonga to be vulnerable, including own-account and contributing family workers who typically experience low job and income security and less protection under employment regulations (ILO, 2019a, p. 4). The government’s post-disaster assessment of TC Gita warns of a risk that formal-sector workers affected by Gita may be forced to transition to informal employment (Government of Tonga, 2018b, p. 28). Tonga’s existing social protection programs are limited by regional standards (see section 3.2 below).
plantation, or undertaking household duties, and 3% considered economically inactive (VanuatuNationalStatisticsOffice,2017,pp.75, 232). The formal economy is relatively small, butthesizeoftheinformaleconomyisdifficultto measure: the Government’s post-disaster needs assessment following TC Pam estimated that 20% of the labor force (26% of working-age males and 14% of working-age females) were in formal employment (Government of Vanuatu, 2015b, pp. 88–89), while the ILO estimates that 40% of total employment is informal (ILO, 2017b, p. 31). The ILO also considers 74% of employment in Vanuatu to be vulnerable in the sense of having low job and income security and less protection under employment regulation than work in the formal economy (ILO, 2019a, p. 4). Approximately 80% of Vanuatu’s population relies on agriculture (mainlycrops,livestock,andfisheries)forlivelihood and for food and nutrition security, and at least 71% of the rural population derives some income from agricultural activities (VNSO 2013, cited in Government of Vanuatu, 2015b, p. 16).
Tonga
Vanuatu

66
Adult population by economic activity
Males
Producing goods 36%
Employes 38%
Unpaid work 23%
Economically inactive 3%
Economically inactive 3%
Females
Producing goods 35%
Employes 38%
(VanuatuNationalStatisticsOffice,2017,pp.75–80)
Unpaid work 40%
Tropical cyclone Pam had severe impacts on people living on low incomes and subsistence livelihoods. In affected areas, half of all agricultural households lost part or all of their crops and required support in the short term to meet minimum needs, and 75% to 95% of income-generating activities were disrupted (Government of Vanuatu, 2015b, pp. xii, 94). On Tanna Island, food crops took at least a year to recover, partly due to the impacts of drought
Worldwide and across the Pacific, women and girls are disproportionately vulnerable to the effects of natural hazards and climate change (Bogdan, McPherlain, & Yoon, 2019; Utz, 2017, p. 90). Women and girls have less ability than mentoinfluence,participatein,andbenefitfrom disaster risk reduction and recovery efforts, and from climate change mitigation and adaptation efforts (Utz, 2017, p. 90). They have less access than men to the resources necessary to cope with and respond to hazardous events, including information, employment opportunities, education, health, land, income, property,otherfinancialandeconomicassets,and basic rights (Morioka, 2016, p. 22; Utz,
conditions caused by El Niño; some remote communities which lacked access to monetary incomeexperiencedsignificantfoodinsecuritywith increased health problems (Handmer & Nalau, 2019, p. 375). People dependent on subsistence farming, especially in remote locations with limited market economies, have limited options available to them; they “cannot simply change their livelihoods” (Handmer & Nalau, 2019, p. 371).
2017, p. 90; Vincent, Tschakert, Barnett, Rivera-Ferre, & Woodward, 2014, p. 105). Women often have less access than men to early warning systems such as weather forecasts andwarningsoffloodsandwaterlevels,andare often less prepared to understand and act on the information, due to gender differences in literacy, mobility, access to public venues, work schedules, and preferences for different communication media (Bogdan et al., 2019, pp. 26–33; IFRC, 2010, p. 32). Women’s livelihoods often depend on natural resources that are affected by natural hazards, and on assets that are vulnerable to disasters or to being sold as a negative coping strategy (Bogdan et
2.7. Gender
67
al., 2019, pp. iv–v; ILO, 2019a, p. 12). Women also usually have more limited opportunities than men to diversify their livelihoods by taking up new occupations because of social norms, home-based responsibilities, or limited education (A. S. Thomas et al., 2019, p. 706). “Socially constructed roles and responsibilities, occupational segregation, and cultural norms” lead to women bearing burdens that include “increased time and labour workloads, health issues like malnutrition, increased rates of sexual and gender-based violence and even early child marriage” (Bogdan et al., 2019, p. 33). Worldwide, even fatality rates in disasters tend to be higher for women than for men, “primarily due to gendered differences in support to cope withsucheventsandinsufficientaccesstoinformation and early warnings” (Bogdan et al., 2019, p. 33; ILO, 2019a, p. 12).
Gender also interacts with other social characteristics to affect how individuals are impacted by natural hazards (Bogdan et al.,2019,p.4).AcrossAsia,thePacificandAfrica, women in rural areas tend to be more vulnerable than those in urban areas; older women and women with disabilities are more severely affected because of a lack
of accessible infrastructure and information; pregnant and lactating women are at higher risk because of inadequate health services following disasters; and widowed and divorced women tend to be more vulnerable (Bogdan et al., 2019, p. 23).
Gendered social norms mean that men suffer different risks compared to women, particularly physical and mental health risks and pressures for migration. Most research on the gendered impacts of climate-related hazards considers effects on women, with “scarce evidence” available about impacts on men (Bogdan et al., 2019, p. iv). Social norms generally call for men to be “brave and heroic, and engage in risky life-saving behaviors that increase their likelihood of mortality” (Bogdan et al., 2019, p. 25; Vincent et al., 2014, p. 106). Under crisis conditions, they also tend to suffer mental health issues from isolation and worry, including depression, and to use alcohol as a coping mechanism (Bogdan et al., 2019, p. 25). Men often migrate (from rural to urban areas, or overseas) in search of new livelihoods, which can strain households and break up families (Bogdan et al., 2019, p. 25).
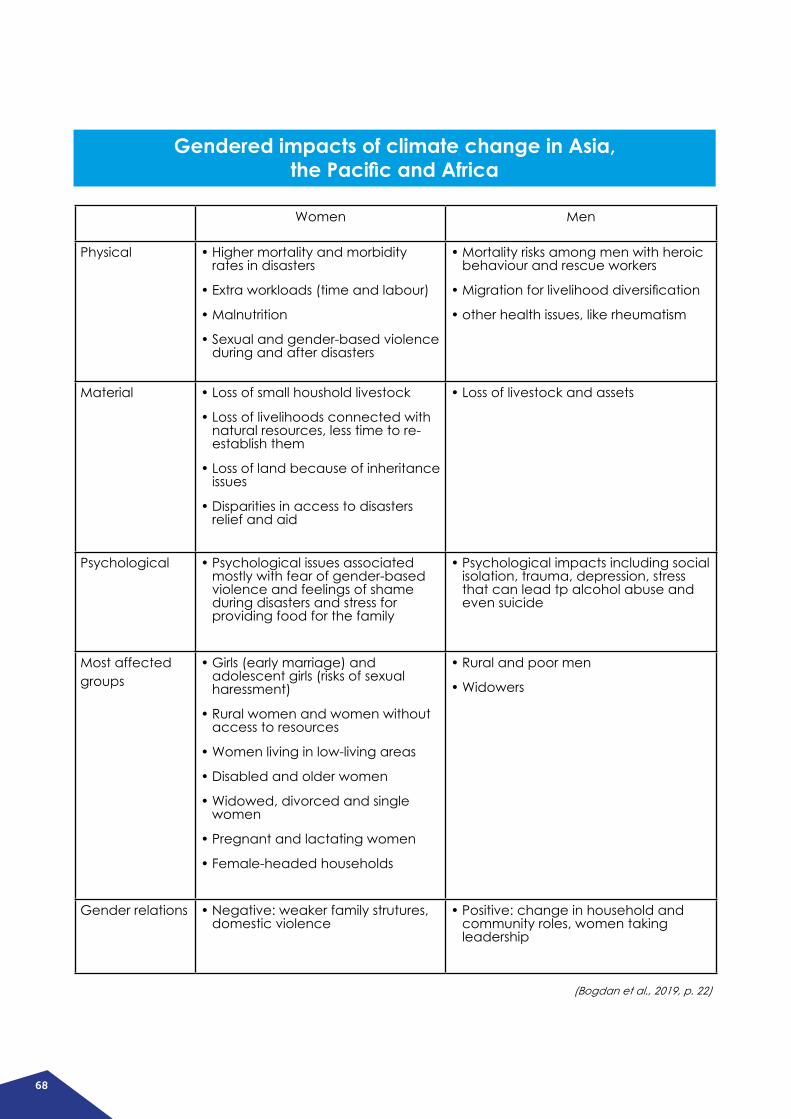
68
Gendered impacts of climate change in Asia, the Pacific and Africa
Women Men
Physical • Higher mortality and morbidity rates in disasters
• Extra workloads (time and labour)
• Malnutrition
• Sexual and gender-based violence during and after disasters
• Mortality risks among men with heroic behaviour and rescue workers
• Migrationforlivelihooddiversification
• other health issues, like rheumatism
Material • Loss of small houshold livestock
• Loss of livelihoods connected with natural resources, less time to re-establish them
• Loss of land because of inheritance issues
• Disparities in access to disasters relief and aid
• Loss of livestock and assets
Psychological • Psychological issues associated mostly with fear of gender-based violence and feelings of shame during disasters and stress for providing food for the family
• Psychological impacts including social isolation, trauma, depression, stress that can lead tp alcohol abuse and even suicide
Most affected groups
• Girls (early marriage) and adolescent girls (risks of sexual haressment)
• Rural women and women without access to resources
• Women living in low-living areas
• Disabled and older women
• Widowed, divorced and single women
• Pregnant and lactating women
• Female-headed households
• Rural and poor men
• Widowers
Gender relations • Negative: weaker family strutures, domestic violence
• Positive: change in household and community roles, women taking leadership
(Bogdan et al., 2019, p. 22)

69
Gender-based violence is widespread across all six countries reviewed in this report, and anecdotal evidence that gender-based violence increases in post-disaster conditions. Data on gender-based violence in the six countries reviewed here tend to be weak, outdated, and often anecdotal even under normal conditions. Worldwide, evidence shows
that gender-based violence often increases following disasters, in all countries at all stages of development (Masson, Lim, Budimir, & Podboj, 2016, p. 11), and although anecdotal evidence suggeststhatthisisthecaseacrossthePacificregion, domestic violence is rarely reported to authoritiesandthereisagenerallackofofficialrecords and robust data.
In Fiji, gender inequality is a significant challenge, with social roles heavily influenced by traditional values (Charan, Kaur, & Singh, 2016, pp. 110–112). Traditional cultural norms among both of the principal ethnic groups in Fiji emphasise male authority and limit women’s participation in decision-making and rights to own property, although education is valued and women are able to participate in many types of employment (Chattier, 2015, pp. 180–181; Schoeffel, 2006, pp. 3–4). Women have limited participation in decision-making at the household, community, and national levels (Charan et al., 2016, p. 112; Taylor & Michael, 2013, p. 11). The labor force participation rate for women is 38.6%, which is half that of men (76.2%) (ILO, 2020). Women and girls are expected to take on heavy domestic responsibilities and are responsible for 74% of household work, compared to 26% for men (Government of Fiji, 2016, p. 51). They are often limited to working in the informal sector and in subsistence agriculture, which offer low income and little security (Government of Fiji, 2016, p. 99). The Government of Fiji has madesignificanteffortstointegrategenderin disaster and climate change policies, including undertaking gender-disaggregated vulnerability and capacity assessments or including gender considerations in post-disaster needs assessments, particularly in the needs assessments that followed TC Evan and TC Winston (Bogdan et al., 2019, p. 13).
Tropical cyclone Winston may result in reduced economic opportunities for women, increasing dependence on subsistence activity, increasing time poverty, deepening poverty and widening gender inequality (Government of Fiji, 2016, p. 99). Immediately after the cyclone, electricity and water supply outages led women and girls to take up increased burdens of household chores such as fetching water and doing laundry, and curtailed their ability to engage in other productive and income-generating activities (Government of Fiji, 2016, p. 103). Women are often home-based workers, and many women engaged in home-based production lost income, materials, and equipment when their homes were damaged or destroyed (Government of Fiji, 2016, p. 76). Women’s livelihoods are also often connected to natural resources which are vulnerable to natural hazards. Many women work at basket and mat weaving, which rely on voivoi (pandanus leaves) which were heavily affected by the cyclone (Bogdan et al., 2019, p. 15), while in coastal areas of Bua province, storm damagepreventedfemalemud-crabfishersfrom accessing mangrove areas or damaged theirfishingequipment,leavingthemwithfewalternative income opportunities (A. S. Thomas et al., 2019). Women’s ability to contribute to household subsistence was also more deeply affected than men’s: 71% of the livestock killed as a result of the storm were small animals like
Fiji

70
poultry, pigs and beehives, which are usually under the control of women (Bogdan et al., 2019, p. 15), and vegetables were the most badly affected type of crop, which again are largely cultivated by women (Government of Fiji, 2016, p. 51). Women “are poorer, earn less income, are more dependent on subsistence economies, and, therefore, have fewer options to cope with the disaster impact than their male counterparts” (Government of Fiji, 2016, p. 102). Conversely, however, disruptions caused by climate change may also force women and men to take on new activities and roles in the family and the community, and may create opportunities for women to take on new leadership roles as they engage in alternative livelihoods and income-generating activities (Bogdan et al., 2019, p. 33).
Gender-based violence rates in Fiji are among the highest in the world, with 72% of women who have ever been in intimate relationships
reporting physical, sexual, or emotional violence from an intimate partner (Fiji Women’s Crisis Centre, 2013, p. 2). During disasters, gender-based violence often increases, particularly when living in short-term emergency or shared accommodation which may have inadequate lighting and mixed sleeping arrangements and WASH facilities (Bogdan et al., 2019, p. 15; Government of Fiji, 2016, p. 76; UNDRR, 2019b, p. 10; Vincent et al., 2014, p. 106). Increased stress, property damage, lack of electricity and lighting, the use of alcohol by men as a coping mechanism, and the breakdown of normal community protection mechanisms are contributing factors (Bogdan et al., 2019, p. 15; Government of Fiji, 2016, p. 103).Followingfloodsin2012andTCWinstonin2016, there were increased reports of domestic violence, and reports of men requesting sexual favors in exchange for food and supplies (Government of Fiji, 2016, pp. 102–103).
Gender equality is a major challenge in Papua New Guinea and women and girls suffer political and economic exclusion, and systemic violations of their rights throughout the country (Gwatirisa et al., 2017, p. 395; V. Thomas, Kauli, & Rawstorne, 2017, p. 3; UNFPA, n.d.). In 2018, Papua New Guinea ranked 161st out of 189 countries on the UN Human Development Report’s Gender Inequality Index (UNDP, 2019, p. 318). Women are under-represented in decision-making at all levels, have limited access to resources, and experience heavy work burdens; “gender inequality in Papua New Guinea is pervasive, persistent and deep-seated” (V. Thomas et al., 2017, p. 3). In both rural and urban areas, traditional cultural norms give men authority over their clan and family members and the right to make most of the decisions and control most of the resources in the family; women are expected to conform to
subservient societal rules and norms, are “often viewed as commodities used in exchange for money, gifts and to resolve tribal disputes” and are vulnerable to sexual and gender-based violence (UNFPA, n.d.). “There is a strong social pressure on men to play a masculine, assertive role in the home which has resulted in toxic exhibitions of masculinity resulting in controlling, dominating, and abusive relationships with domestic partnerships” (CFE-DM, 2019, p.16). Papua New Guinea is one of only three countries in the world that has no women in its national parliament (the other two are the Federated States of Micronesia and Vanuatu) (International Parliamentary Union, 2020). The labor force participation rate is almost identical for women and men (46% and 48%, respectively) (World Bank, 2020e) but women’s participation is mainly limited to informal subsistence agriculture work in rural areas
Papua New Guinea
71
(ILO, 2018, p. 7). Girls lag slightly behind boys in primary school enrolment rates (73% and 77%, respectively) and completion rates (59% and 74%) (ILO, 2018, p. 7), but among adults aged 25 or older, only 9.9% of women and 15.2% of men have attained some secondary education (UNDP, 2019, p. 318). Child marriage is common (21% of girls are married before the age of 18), which puts girls at high risk of abuse (Girls not Brides, 2020), and customs such as forced marriage, bride price, and beliefs in sorcery are found in many communities (Brun, 2018, p. 9).
Natural hazards disproportionately affect women’s activities and livelihoods by damaging the natural resources that women rely on. Most of the discussion in the literature about the gendered impacts of natural hazards in Papua New Guinea (other than gender-based violence, which is discussed below) relates to the roles of men and women in subsistence agriculture, which is the basis of livelihoods for the vast majority of the population. Assessments during the 2015-16 drought and following the 2018 earthquake in the highlands found that lost production due to drought, and destruction of gardens due to the earthquake and associated landslides, not only deprived families of their main food source but also removed the main source of income for women, who customarily worked the gardens and were entitled to sell surpluses (Brun, 2018, pp. 1, 6; CARE, 2015a, p. 9). Studies report that under crisis conditions, women’s workloads tend to increase because oftheincreaseddifficultyofobtainingfood,water, fuel, and other household necessities, and that when food is scarce, men and boys are given priority access to high-quality food over women and girls (Brun, 2018, pp. 1, 5–6; CARE, 2015a, pp. 2–3; Morioka, 2012, cited
in Morioka, 2016, p. 26). During the 2015-16 drought, women spent less time working in food gardens, which were unproductive, while men spent more time searching for bush foods (CARE, 2015a, p. 3). The assessment following the 2018 earthquake highlighted that women would take on additional burdens of caring for children and other family members, and that female-headed households including widows and single mothers, would be particularly disadvantaged as they have fewer resources and are more vulnerable to exploitation (Brun, 2018, pp. 1, 5–6).
Gender-based violence in Papua New Guinea is widespread and is widely accepted based on traditional social norms. There are no recent, comprehensive, national data on the prevalence of gender-based violence in Papua New Guinea (Brun, 2018, p. 8; UNDP, 2016a, p. 32), but “several studies indicate that the rates of family and sexual violence are among the highest in the world” (Brun, 2018, p. 8). The following small-scale studies are illustrative:
• A survey in 2009-10 found that 65% of women in rural and urban areas in coastal, highland and island provinces had suffered gender-based violence (Ganster-Breidler, 2010, cited in UNDP, 2016a, p. 32);
• Human Rights Watch estimated in 2016 that 70% of women in Papua New Guinea experienced rape or assault at some point in their lives (Human Rights Watch, 2016, p. 447);
• A survey of 197 individuals employed in three companies found that 68% of respondents had experienced gender-based violence during the previous year and reported an average of 7.8 incidents (9.4 incidents per
72
year for women and 6.1 for men), including an averageof2.4“severe”incidents,definedasrape by a partner or other, or sexual assault or physical assault by a partner21 (Darko, Smith, & Walker, 2015, pp. i, 13–14); and
• A study of 846 men in Bougainville suggests that 59% have committed rape of an intimate partner, and 41% have raped a non-partner22
(Jewkes, Fulu, Roselli, & Garcia-Moreno, 2013, p. e210).
Domestic violence is illegal, but is rarely prosecuted, women do not report assaults out of fear of retribution and because they do not expect authorities to assist, and there is a shortage of support services such as safe houses, counselling, and legal aid (CFE-DM, 2019, pp. 19–20). A national strategy on gender-based violence has been adopted, aiming to reduce gender-based violence and improve the handling of cases reported to authorities, improve data collection to support evidence-based planning, improve support for survivors of gender-based violence, and undertake preventive measures and messaging (Government of Papua New Guinea, 2017, p. 13).
There is evidence that gender-based violence increased in Papua New Guinea during crisis brought on by natural hazards. An assessment conducted during the 2015 drought found that women and children faced increased safety risks when alone collecting water or when male family members were away gathering food or seeking work (CARE, 2015a, p. 1). Respondents mentioned increases in gender-based violence
and in violence between communities arising from increased tensions caused by shortages of food and water, and there were reports of women engaging in transactional sex and being pressured into becoming a second wife (CARE, 2015a, pp. 6, 10–11). A similar assessment conducted a few weeks after the 2018 earthquake noted that there was at that time “limited information” about how the earthquake had affected gender-based violence, but the report anticipated that violence was likely to increase due to the likelihoodoftribalconflictasdisplacedpeoplemoved; beliefs in sorcery which were strong in theregion;difficultiesaccessingdrinkingwaterand lack of sanitation facilities which exposed women and girls to greater risks; and emotional trauma and stress caused by loss, uncertainty, and food shortages. The report also noted that economic hardship was expected to lead to an increase in transactional sex to obtain necessities,sextrafficking,orarrangedorearlymarriages, with widows and single mothers being most vulnerable due to limited resources and support networks (Brun, 2018, pp. 1, 9). One contrasting report examined four communities following the 2018 earthquake and found that the communities reported that gender and protection issues were no worse three months after the earthquake than they were before it, and that tasks such as water collection and land cultivation were shared equally among men, women, and children, although the authors of the report note that gender-based violence is often under-reported (Roche et al., 2018, p. 26).
21There are some indications in the study that some of the people surveyed, especially males, are likely to have included incidents of non-gender-related violence in their responses, and that males and females may have interpreted questions differently,sothesefiguresmayoverstatethenumberofstrictlygender-relatedincidents.22Ratesofgender-basedviolenceinBougainvillemayhavebeeninfluencedbythe1988-1998civilwar.
73
23Most village churches are Congregational, Catholic, Latter-Day Saints (Mormon) or Methodist (Meleisea et al., 2015, p. 9).24In the 2016 elections, 24 women stood as candidates and four were elected to the 49-seat Legislative Assembly; in accordance with the provisions of the quota system, a new seat was created for the highest-polling unelected female candidate,bringingthetotalnumberofwomenintheLegislativeAssemblytofiveoutof50members(PacificWomeninPolitics, 2020a).
In Samoa, gender inequality is a significant challenge, and women’s political and economic participation is significantly limited by social norms. A national inquiry found that “Samoa is built on patriarchy” with social norms that reinforce men’s dominance in societyandcontroloverwomen(OfficeoftheOmbudsman, 2018, p. 22). Samoa’s traditional villagegovernmentsystempresentssignificantbarriers,sometimesjustifiedintermsoftraditionalcustoms or on religious23 grounds, to women’s participation in decision-making forums in local government councils, church leadership, school management and community-based organisations (Meleisea, Meredith, Mow, Schoeffel, Lauano, Sasa, Boodoosingh, & Sahib, 2015,p.7;OfficeoftheOmbudsman,2018,pp. 23–24, 37). Women are rarely selected toholdthetitleofmatai,atraditionalchieflytitle indicating leadership of an extended family which not only grants a role in village decision-making but is also a prerequisite to being elected to the national parliament (ADB, 2018b, p. 171; Meleisea et al., 2015, pp. 7–8). In employment, large gender disparities are evident: the labor force participation rate is 55% for men and 32% for women; the employed population is 67% male and 33% female; and the unemployment rate is 10.6% for males and 21.3% for females (Samoa Bureau of Statistics, 2017,pp.23,33,54).Womenfinditmoredifficultto start a business than men do, particularly because of cultural attitudes and customs which typically restrict women to low-level and domestic work and limit their familiarity with business processes, because women are often time-poor due to domestic responsibilities, and because women have less access to customary
land (ADB, 2018b, p. 182). Discrimination on the basis of sex is prohibited by the Samoan constitution, and a national policy for gender equality was adopted in 2016 (Meleisea et al., 2015, p. 8; Ministry for Women Community & Social Development, 2016). A constitutional amendment passed in 2013 established a quota of 10% women in the national Legislative Assembly24(PacificWomeninPolitics,2020a).
There is some evidence that natural hazards have affected women’s livelihoods, good quality gender-disaggregated data on the impacts of natural hazards in Samoa appear to be scarce. For example, Samoa’s NationalDisasterManagementOfficehasbeen described as documenting “anecdotal evidence (rather than hard data) on gender impacts of disasters as part of its standard procedure” (Morioka, 2016, p. 81), although recent post-disaster needs assessments do demonstrate efforts to collect sex-disaggregated information (Morioka, 2016, p. 55). Following TC Evan in 2012, the Government’s post-disaster needs assessment estimated that employment and self-employment losses due to the cyclone would affect men more than women “at a nearly 9:1 ratio” (Government of Samoa, 2013, pp. xvi, 104–105; Samoa Bureau of Statistics, 2016, p. 47),althoughthisimpactisinfluencedbythefact that men are more likely than women to be in income-earning roles. Some of the factors that affected women’s livelihoods following the cyclone included: women had to spend more time on domestic chores, particularly fetching water; fragile vegetable crops cultivated by women in household gardens were lost during the cyclone; and closure of schools affected
Samoa

74
women’s incomes more than men’s because most teachers are female (Government of Samoa, 2013, pp. 22, 51, 113). Mat weaving, a significantsourceofincomeforwomen,mayhave been affected, but at the time of the post-disaster needs assessment, the extent of damage to pandanus trees, whose leaves are used in weaving, had not yet been assessed (Government of Samoa, 2013, p. 113). Women involvedinfishingdidnotreportanynegativeimpacts, but there were concerns that the livelihoods of women who sell commercial fishingbycatchesmightsufferifcommercialfishingdidnotresumequickly(GovernmentofSamoa, 2013, p. 113).
Gender-based violence in Samoa is widespread and generally accepted as normal. The most comprehensive and robust data available on the prevalence of gender-based violence in Samoa are from the Samoa Family Health and Safety study published in 2006, which was part of a multi-country study following World Health Organization methodology (IFRC, 2016c, p. 49; SPC, 2006, p. 1). That study found that 46% of Samoan women had experienced physical, emotional, and/or sexual abuse from a partner, with abuse being more prevalent in poorer and rural households than in wealthier and urban ones, and 62% reported being physically abused by someone other than a partner (SPC, 2006, pp. 86–87). Gender-based violence is widely accepted as normal: 73% of women in the study said that abuse in relationships is normal and not serious, and between 20% and 46% of women and men agreed that physical abusewasjustifiedinvariouscircumstances,including disobedience or showing disrespect (SPC, 2006, pp. 43, 86–90). More recent data from a national inquiry published in 2018 suggest that either the problem has not improved since 2006, or that it has become more acceptable to speak openly about domestic violence so thatincidentsaremorefreelyreported(Office
of the Ombudsman, 2018, p. 10). The 2018 inquiry found that 86% of respondents had been subjected to physical violence within the family, and 9.5% reported that they had been raped by a family member at some point in their lives (OfficeoftheOmbudsman,2018,pp.10,15).Child marriage, which puts girls at risk of abuse, occurs in Samoa: 11% of girls are married before the age of 18 (Girls not Brides, 2020).
Legal frameworks for responding to domestic violence exist, but incidents are rarely reported to authorities. The Family Safety Act of 2013 introducedabroaddefinitionofdomesticviolence and provides for courts to issue protection orders, sexual violence within a marriage relationship can be prosecuted, and there is a dedicated Domestic Violence Unit within the national police force and dedicated Family Violence Courts to deal with domestic violence cases (ADB, 2018b, p. 173; IFRC, 2016c, pp. 49–51). However, 54% of women in the Family Health and Safety Study who had been physically abused had never told anyone about it, and it is estimated that only 2% of all familyviolenceisreportedtothepolice(Officeof the Ombudsman, 2018, p. 27; SPC, 2006, pp. 41–42). Domestic violence is considered by the majority of Samoans to be a private matter to be resolved within families and as is the case inmostPacificIslandcountries,Samoahascustomary arbitration/reconciliation practices that are used to settle cases within or between families rather than through external authorities (IFRC, 2016c, p. 52; SPC, 2006, pp. 49–50, 64, 67–68; Taylor & Michael, 2013, p. 20). The collection of statistical data on domestic violence and sexual abuse is “sporadic at best”, error-prone (OfficeoftheOmbudsman,2018,p.26),and“nottakenseriouslybythepolice”(OfficeoftheOmbudsman, 2015, cited in ADB, 2018b, p. 173).
75
Evidence about gender-based violence under emergency conditions in Samoa is limited and largely anecdotal. In studies following the 2009 tsunami and TC Evan in 2012, IFRC noted that the relatively high background level of gender-based violence already present in Samoamadeitdifficulttodeterminewhetherincidences of violence changed following disasters (IFRC, 2016c, p. 42). IFRC also reported that incidents of sexual violence, abuse and intimate partner violence occurred, but werenotofficiallyrecordedbycaseworkersorserviceproviders,andthatitwasdifficultto establish clear causal links to the disaster (IFRC, 2016c, pp. 51, 57). Similarly, the Samoan government’s post-disaster needs assessment following TC Evan in 2013 reported that although communities and service providers
raised concerns about gender-based violence, “nospecificincidentsofsexualandgender-based violence attributable to the disaster were recorded” (Government of Samoa, 2013, p. 117). Unequal distribution of relief supplies wasonefactoridentifiedascontributingtodisillusionment, agitation and tensions that indirectly increased the risk of physical violence amongst intimate partners (IFRC, 2016c, pp. 42–43). Several sources also note that living under temporary emergency shelter conditions isasignificantriskfactor,asemergencysheltersoften entail living in crowded conditions among strangerswithreducedsupervision,insufficientprivacy and security arrangements, and inadequate lighting, shower/bathing and toilet facilities (Government of Samoa, 2013, pp. 52, 109; IFRC, 2016c, pp. 42–43, 55–56).
In Solomon Islands, gender inequality is a significant challenge, with traditional social norms significantly restricting women’s roles. Most cultures in Solomon Islands follow gender norms that “maintain strict social hierarchies dominated by men”, leading to women experiencing “vast and persistent gender inequality” (Homan, Honda, Leung, Fulu, & Fisher, 2019, p. 4). Women suffer from poor access to social services and infrastructure (notably education and health), have limited control over economic resources, and are restricted in participating in public decision-making (ADB, 2019a, p. 1; Roubin et al., 2018, p. 4). Traditional extended family structures and matrilineal land ownership systems have gradually been replaced by nuclear family structures which have promoted men’s control of the family unit, and by patriarchal religious, legal, economic and political systems including control of land (Roubin et al., 2018, p. 4; UNICEF and Government of Solomon Islands, 2002, cited inSPC,2009,p.28;SecretariatofthePacificCommunity, 2012, cited in Taylor & Michael, 2013, p. 11). Traditional restrictive social norms are stronger in rural areas than in urban areas,
which can be slightly more cosmopolitan (Soaki, 2017, p. 100). Most studies indicate that women have “very little say in everyday decisions” and “must ‘stand behind‘ men when it comes to speaking about and dealing with resources in the public arena” (Taylor & Michael, 2013, p. 11). However, some studies suggest that within the household, decision-making can be more of a shared responsibility: a study looking at financialdecision-makingfoundthatwomentend to make decisions about household items, clothing, and savings, men tended to make decisions about shelter, transportation, and non-food items, and men and women made joint decisions about items such as food and education (Huber & Fischer, 2020, p. 35). The National Gender Equality and Women’s Development Policy adopted in 2016 commits the government to ensuring that “policies andservicesbenefitwomenandgirls,aswellas men and boys” (Government of Solomon Islands, 2016, p. 1), and gender considerations are being increasingly acknowledged in government policy, including policies on climate change and disaster risk management (Morioka, 2016, p. 41; Vaike & Salili, 2020, p. 18).
Solomon Islands

76
Women’s participation in political life outside the household is sharply limited. Women’s participation in politics “has only recently been seriously considered”, mainly under pressure from international actors; public decision-making is generally considered “men’s business” and although women vote, most women do not have an understanding of political structures and processes or of government policy (Soaki, 2017, pp. 95–105). As of October 2020, Solomon Islands is ranked 177th out of 188 countries on the basis of the number of women elected to parliament, with 3 women out of 50 members of parliament (International Parliamentary Union, 2020; National Parliament of Solomon Islands, 2019;PacificWomeninPolitics,2020b).
• Women’s economic opportunities are limited by cultural practices that disadvantage women and increase men’s economic power (Roubin et al., 2018, p. 6). Within the family, women are dependent on men to give permission to pursue economic opportunities, to share care and domestic work to free up women’stime,andtoprovidefinancialinputinto business activities (Roubin et al., 2018, p. 6).Inonestudy,womenidentifiedtheburdenof unpaid care work25 as their biggest barrier to economic activity: social norms dictate that women are responsible for care work and should prioritise it over economic activity, while men should not be involved in such work (Roubin et al., 2018, p. 4). Data collected in three provinces indicated that adult women contribute 12.5 hours of unpaid care work per day, young women 23.5 hours per day, and men between 2.5 and 3.5 hours per day (the high totals for women are due to the study counting simultaneous activities separately, for example child care and cooking and
cleaning the house being done at the same time, and noting that young women provide care for infants throughout day and night) (Roubin et al., 2018, pp. 4, 32). Women also feel that they are unable to access business support services such as transportation, markets,financialservices,andtraining,andthat existing support services are oriented towards activities that are seen as male domains, such as palm oil, copra, cacao and tourism, rather than value chains that women have control over, such as vegetable production, weaving, and sewing (Roubin et al., 2018, pp. 4, 6). Another study, by the World Bank, notes that literature on women’s participation in agricultural value chains identifiesfivemainconstraints(WorldBank,2018a, pp. 20–23):
• Access to resources: lacking decision-making power over the use of land, access to technology and means of production, and accesstofinance.
• Decision-making power: exclusion from training and skills development, limited opportunities to develop knowledge through social networks, and low levels of education and literacy.
• Control over income: lack of participation in and control over processing and selling cash crops, suffering harassment and discrimination when selling products in markets, limited access to transportation, lacking access to market information and value-adding opportunities, lack of entrepreneurship and financialskills,limitedcontroloverhouseholdincome, and limited power to control demands for money and goods from male relatives.
• Leadership roles: social constraints on taking
25“Unpaid face to face services provided for family and community members outside of the market that strengthen the wellbeing, health and safety of the recipient, for example child care, meal preparation, laundry, cleaning, etc.” (Roubin et al., 2018, p. 4).

77
leadership and management roles, and on participation in decision-making at every level from the household to the political level, as well as dependence on the support and approval of men for all types of initiatives.
• Time and health burdens: Women are responsible for the bulk of domestic chores, caringwork,andfulfillingculturalobligations,leaving little time or energy for other productive activities; women also suffer disproportionate health burdens related to high fertility, low immunization rates, and heavy household workloads.
The impacts of natural hazards and climate change disproportionately affect women. The majority of economically active women are engaged in agriculture, and although their cash incomes are small, any disruption to agricultural activities is likely to have a disproportionate effect on women’s earning capacities (Government of Solomon Islands, 2014, p. 24). Disasters also often make access tocleanwater,firewood,andothernecessitiesmoredifficultforwomenandgirls,whoaretypically responsible for obtaining these items, require women and girls to spend more time farming to meet household needs (Morioka, 2016, p. 26), and increase domestic burdens such as cleaning, replanting gardens, and caring for children who are not in school (Huber & Fischer, 2020, p. 18). A Red Cross study in 2010-2011 reported, for example, that the drying up of water sources in and around the community of Namokaviri required women and girls to dig more water holes and walk farther to access water (Bill, 2012, p. 14).
Gender-based violence in Solomon Islands is widespread and considered to be within social norms. The best available data on gender-based violence come from the Solomon Islands Family Health and Safety Study, which was
carried out in 2009, but more recent, smaller scale reports indicate that gender-based violence remains widespread (Ming, Stewart, Tiller, Rice, Crowley, & Williams, 2016; Roubin et al., 2018). The Family Health and Safety Study found that 64% of women and girls aged 15 to 49 who had ever been in a relationship had experienced either physical or sexual violence, or both, by an intimate partner, 18% reported physical violence from someone other than a partner, and 18% reported sexual violence from non-partners (SPC, 2009, pp. 3–4). Violence was more common in Honiara than in rural areas, which is unusual compared with other countries (SPC, 2009, pp. 3, 77). Sexual abuse before age 15 was reported by 27% of women (SPC, 2009, p. 4), 21% of girls are married before the age of 18 (Girls not Brides, 2020), and the custom of bride price, which is a risk factor for violence, is practiced in at least two provinces (Roubin et al., 2018, p. 23; SPC, 2009, p. 29). Gender-based violence is widely accepted as normal: the majority of women surveyed (73%) believe thatamanisjustifiedinbeatinghiswifeundersomecircumstances(inparticular,forinfidelityand disobedience) (SPC, 2009, p. 3). Violence is rarely reported: 70% of women who reported physical and/or sexual partner violence in the Family Health and Safety Study had never told anyone else about it (SPC, 2009, p. 8). The Family Protection Act criminalized domestic violence in 2014; previously, there has been nolegislationspecificallyrelatingtodomesticviolence and although a prosecution could be brought under general assault laws, such cases were rare (Homan et al., 2019, p. 10; SPC, 2009, p. 31). However, majority of domestic violence cases, if reported at all, are still resolved using traditional methods and support services for women are rare outside of Honiara (Homan et al., 2019, p. 10).
78
Incidences of gender-based violence in crisis have not been well documented in Solomon Islands. Following the 2007 tsunami, for example, “there were reports of men loitering around bath facilities used by women and girls in evacuation camps”, one case of child sexual abuse was reported, but other incidents of violence were believed to remain unreported “due to women’s fears for their safety should they speak out against the perpetrator” (Tara, 2007, cited in Morioka, 2016, p. 26). Following the 2013 earthquake and tsunami, an assessment acknowledged that gender-
based violence had been a concern before the earthquake, but stated that no increase in violence had been observed although admitting that “there is a general lack of detailed information about the protection situation in the temporary settlements and about possible gender-based violence” (Government of Solomon Islands, 2013, p. 21). A 2019 study noted that data collection about protection of vulnerable groups is routinely lacking, citing assessments carried out following the2016Makiraearthquake,floodinginHoniarain 2018, and TC Liua in 2018 (Sutton, Flint, Lees, & Kenni, 2019, pp. 18–19).
In Tonga, gender inequality is a significant challenge, with social roles heavily influenced by traditional values and gender stereotypes. Cultural norms allocate men decision-making roles in the public arena, and usually in the household as well, with women being “generally excluded from planning and decision-making processes” at all levels from national politics to the village level (CARE, 2018, p. 12). In general, men’s roles tend to lie outside the home and include commercial agriculture, offshorefishing,andtasksrequiringphysicallabor in areas like agriculture and construction; women and girls undertake agricultural work andfishing,mostlyforsubsistencepurposes,andare primarily responsible for caring for family members, for community, family, and church activities, and for making handicrafts(CARE, 2018,p.12).Significantnumbersofmenmigrate overseas as seasonal laborers, and mostly for this reason about 20% of households on Tongatapu and 25% on ’Eua are headed by women (CARE, 2018, p. 6). Both men and women undertake paid work, although the labor force participation rate for women is lower than for men (66% and 81%, respectively) and the unemployment rate for women is much higher than for men (27% and 8%, respectively) (Tonga Statistics Department, 2017a, p. 10). Women do not have the right to own land in
Tonga, except by inheriting land from a male ancestor or a husband where no male heirs exist, which makes women dependent on male relatives’ good will and social convention for accommodation and livelihoods (Allens, 2017), and “some women with no land or income remain in households with violent fathers, uncles, family members or husbands with no viable means of support to leave” (Kingdom of Tonga Ministry of Internal Affairs, 2019, p. 4). Women are active in the informal economy, leading small and micro-enterprises and small retail shops, and making handicrafts (CARE, 2018, p. 4; Government of Tonga, 2018a). Handicraft work, which relies on locally-available natural resources such as pandanus leaves, is vulnerable to natural hazards and climate change (Government of Tonga, 2018a, p. 7). Tonga’s national Gender and Development policy commits to gender equality, but notes that cultural attitudes continue to assign women a lower status than men (CARE, 2018, p. 12).
Some natural hazards affect natural resource-based activities that are primarily undertaken by women. For example, mulberry and pandanus trees, which are strongly affected by cyclones, are used by women for agriculture and handicrafts so damage to them will have significantimpactsonwomen’slivelihoods,while damage to root crops, which are less
Tonga
79
severely affected by high winds, affects incomes of men (CARE, 2018, p. 9). In particular, home-based production of handicrafts, such as weaving mats, baskets and traditional clothing, isprimarilydonebywomenandisasignificantsource of income, especially in the outer islands where handicrafts contribute more than half of household income (CARE, 2018, p. 13; Government of Tonga, 2018a). TC Gita caused extensive damage to several of the species of plants on ’Eua Island that women use to make handicrafts which they sell locally, regionally, and internationally, which may force women to explore other options for producing handicraft, or to seek other business ventures, informal employment, or unpaid work (Government of Tonga, 2018b, pp. 28–29). Similarly, the tsunami of 2009 damaged houses and sheds on the island of Niuatoputapu used by women for weaving pandanus leaf mats for sale, which is one of the main sources of cash income on the island (along with government employment and remittances from relatives overseas) (Kingdom of Tonga, 2009, p. 6). The tsunami also covered the coral reef with silt, which affected thecollectionofshellfishandseacucumbersfrom the reef, which is an activity normally done by women (Kingdom of Tonga, 2009, pp. 6–7).
Gender-based violence in Tonga is widespread and is likely to be exacerbated by natural hazards. In a 2009 survey, 45% of women reported experiencing physical, sexual, or emotional violence from an intimate partner
at any point in their lives, and 19% reported physical and/or sexual violence in the 12 months preceding the survey (Jansen, Johansson-Fua, Hafoka-Blake, & ‘Ilolahia, 2012, p. 40). Violence against women and children is prosecuted and a ‘no drop’ policy26 is in place (CARE, 2018, p. 13), but the 2009 survey found that 75% of abused women never sought helpfromanyofficialauthorities(Jansenetal.,2012, pp. 97, 227). Worldwide, evidence shows that gender-based violence often increases following disasters, in all countries at all stages of development (Masson et al., 2016, p. 11). Following TC Gita, women and girls reported feeling unsafe due to lack of power for lighting27 and phones (Government of Tonga, 2018b, p. 30). Concerns about shortages of food and water, lack of electricity, lost income, cost of repairs to damaged houses, and household duties and caring responsibilities were cited as factorsthatcontributedtotensionandconflictwithin the household (CARE, 2018, pp. 6, 10). Some emergency shelters lacked adequate supplies to support the number of evacuees housed, or did not have the means to provide safe and private spaces for women, children, and lactating mothers (Government of Tonga, 2018b, p. 30). Some women and girls who were relocated to emergency accommodations reported feeling unsafe due to a lack of segregated, well-lit, and lockable toilet and sleeping facilities, separation of children from family members, and a lack of support services (CARE, 2018, p. 5; IFRC, 2018b).
26 Onceacaseofdomesticviolencehasbeenfiled,thesecasescannotbedroppedandmustmoveontobedealtwithin the magistrates’ courts (Nam, 2017).27 Solar-powered street lighting installed in some areas proved to be robust, with most installations surviving undamaged, while those that were damaged were quickly repaired (CARE, 2018, p. 2).
80
In Vanuatu, gender inequality is a significant challenge, and women’s political and economic participation is significantly limited by social norms. Women are largely excluded from decision-making processes at the national and local levels, including the traditional local governance systems present in all communities, and face challenges accessing paid employment outside of agriculture (CARE, 2015b, p. 3; Government of Vanuatu, 2015b, p. 103, 2015a, p. 26). Vanuatu is one of only three countries in the world that has no women in its national parliament (the other two are the Federated States of Micronesia and Vanuatu) (International Parliamentary Union, 2020). Men and women tend to undertake different types of livelihood activities: men typically undertake moreprofitableactivitiesincludingfishing,growing cash crops, and operating shops, while women are typically involved in activities such as weaving mats and baskets, selling prepared food at markets, sewing clothes for sale, and growing vegetables for subsistence or sale (Government of Vanuatu, 2015b, p. 95). Gender-based inequality is deeper in urban areasthaninruralareas,andthereissignificantdisparity in wages and economic opportunities (Rust, 2019, p. 10). The labor force participation rate in 2016 was 61.7% for women and 80.5% for men (ILO, 2017b, p. 29). The government hasmadesignificanteffortstoacknowledgethe impacts of natural hazards on women’s social and economic well-being and to collect sex and age disaggregated data in disaster risk reduction work, and is seeking to increase women’s participation in decision-making forums (Government of Vanuatu, 2015a, pp. 16, 26), and recent post-disaster needs assessments such as the one that followed TC Pam in 2015 demonstratesignificantattentiontogenderissues.
Natural hazards can disproportionately affect women’s livelihoods by damaging natural resources that women rely on and because women’s social roles can inhibit them from pursuing alternative income-earning activities. In Vanuatu, for example, making handicrafts is a major economic activity for women which was badly affected because of extensive damage to pandanus trees (Government of Vanuatu, 2015b, p. 97; Morioka, 2016, p. 24). The government lifted a seasonal ban on sandalwood harvesting, a role taken by men, to stimulate the economy, but the damage to pandanus trees that affected women’s livelihoods did not attract much attention becausetheywerenotofficiallyregardedasan agricultural commodity (Morioka, 2016, p. 24). The loss of food crops was a double blow to women, not only affecting households’ own food supplies but also affecting women who prepared and sold food in markets, which is another major economic activity for women (Morioka, 2016, p. 24). The Government’s post-disaster needs assessment of TC Pam noted that women were more likely than men to be affected by the cyclone because of women’s higher poverty levels, disproportionate share of family care work, and because women are often employed in low-skilled work (Government of Vanuatu, 2015b, pp. 94, 105). A study carried out in 2000 found that women spend four times as many hours as men on unpaid household work (27.2 hours per week compared with 6.6 hours for men) during normal times28 , and women’s domestic and caring workloads increased dramatically following the cyclone (Government of Vanuatu, 2015b, p. 105). Following TC Pam, women tended to have high workloads, experience post-disaster emotional distress,havetheirvoicesfilteredthroughmalemanagers,havetheirfinancescontrolledby
Vanuatu
28Thesefiguresarecitedbymultiplesources,butcomeoriginallyfromastudycarriedoutbyFoundationofthePeopleofSouthPacificInternational:Whyte,J.,S.Siwatibau,etal.(2000).VanuatuRuralTimeUseSurvey.
81
husbands, and undertake stereotypical income-generating activities (Clissold, Westoby, & McNamara, 2020, p. 108). Some authors also note that women played an important role in post-disaster recovery by sharing resources, helping each other across formal and informal socialnetworks,andthroughdiversification,adaptation, and entrepreneurialism (Clissold et al., 2020, p. 108).
Gender-based violence in Vanuatu is widespread and widely accepted based on traditional social norms. A study on violence against women and girls conducted in 2009 found that 60% who have ever been in a relationship have experienced either physical or sexual violence or both by a husband or intimate partner (Vanuatu Women’s Centre, 2011, p. 55). A 2013 survey showed that 56% of men and 60% of women agree that a husband isjustifiedinbeatinghiswife29 (Vanuatu Ministry ofHealth;VanuatuNationalStatisticsOffice;andtheSecretariatofthePacificCommunity,2013, pp. 228–232) Marriage at a young age is common (21% of girls are married before the age of 18), which put girls at high risk of abuse (Girls not Brides, 2020; Taylor & Michael, 2013, pp. 12–13), and the practice of bride-price is cited as a factor in perpetuating violence against women (Taylor & Michael, 2013, p. 12). National policy and law criminalizes gender-based violence, provides access to protection orders, and seeks to counter some traditional discriminatory practices and address gender inequalities (Taylor & Michael, 2013, p. 17), but nevertheless gender-based violence is high,
widely accepted, and often considered to be a private matter to be resolved within families following traditional customs (Anderson et al., 2017b, p. 119; Government of Vanuatu, 2015b, p. 103).
There is limited evidence available about gender-based violence under emergency conditions in Vanuatu. Assessment reports for disasters in Vanuatu have raised concerns and highlighted risks, but provide little robust evidence on the incidence of gender-based violence following disasters. Following two tropical cyclones in 2011, a counseling center on Tanna island reported more than a tripling in domestic violence cases (CARE, 2015b, p. 8). Surveys of evacuees from Ambae island in 2017 found that between 10% and 35% of respondents had observed increases in domestic violence and child abuse (Gender & Protection Cluster, 2017b, p. 5, 2017c, p. 5, 2017a, p. 3). Following TC Pam in 2015, emergency shelter facilities on Emae and Tanna islands were noted to be often overcrowded and lacking privacy and lighting, particularly aroundtoiletfacilities,whichareidentifiedasrisk factors for sexual violence (CARE, 2015b, p. 8; Government of Vanuatu, 2015b, p. 106), but no data on outcomes regarding gender-based violence following TC Pam could be located. A review of the Australian government’s response to Cyclone Pam stated that “Vanuatu Women’s Crisis Centre and communities reported that domestic violence had increased in the weeks and months following the cyclone,” but no figuresaregiven(OfficeofDevelopmentEffectiveness, 2017, p. 61).
29Specifically,respondentsagreedthatahusbandisjustifiedinhittingorbeatinghiswifeforoneormoreofthefollowingreasons: she burns the food, argues with him, goes out without telling him, neglects the children, or refuses to have sexual intercourse with him.
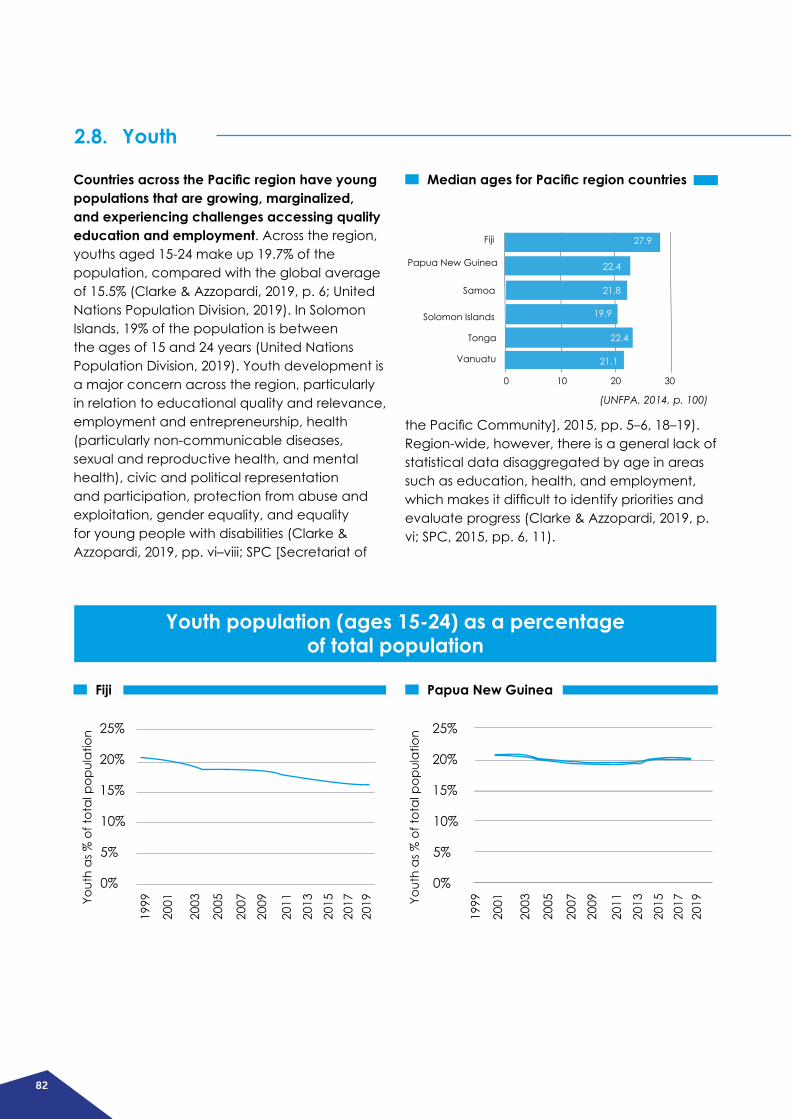
82
Countries across the Pacific region have young populations that are growing, marginalized, and experiencing challenges accessing quality education and employment. Across the region, youths aged 15-24 make up 19.7% of the population, compared with the global average of 15.5% (Clarke & Azzopardi, 2019, p. 6; United Nations Population Division, 2019). In Solomon Islands, 19% of the population is between the ages of 15 and 24 years (United Nations Population Division, 2019). Youth development is a major concern across the region, particularly in relation to educational quality and relevance, employment and entrepreneurship, health (particularly non-communicable diseases, sexual and reproductive health, and mental health), civic and political representation and participation, protection from abuse and exploitation, gender equality, and equality for young people with disabilities (Clarke & Azzopardi, 2019, pp. vi–viii; SPC [Secretariat of
thePacificCommunity],2015,pp.5–6,18–19).Region-wide, however, there is a general lack of statistical data disaggregated by age in areas such as education, health, and employment, whichmakesitdifficulttoidentifyprioritiesandevaluate progress (Clarke & Azzopardi, 2019, p. vi; SPC, 2015, pp. 6, 11).
2.8. Youth
Median ages for Pacific region countries
Fiji
Papua New Guinea
Samoa
Solomon Islands
Tonga
Vanuatu
0 10 20 30
27.9
22.4
21.8
19.9
22.4
21.1
Youth population (ages 15-24) as a percentage of total population
Fiji Papua New Guinea
2001
2001Yo
uth
as %
of t
otal
pop
ulat
ion
Yout
h as
% o
f tot
al p
opul
atio
n
2003
2003
2005
2005
2007
2007
2009
2009
2011
2011
2013
2013
2015
2015
2017
2017
2019
2019
0% 0%
5% 5%
10% 10%
15% 15%
20% 20%
25% 25%
1999
1999
(UNFPA, 2014, p. 100)
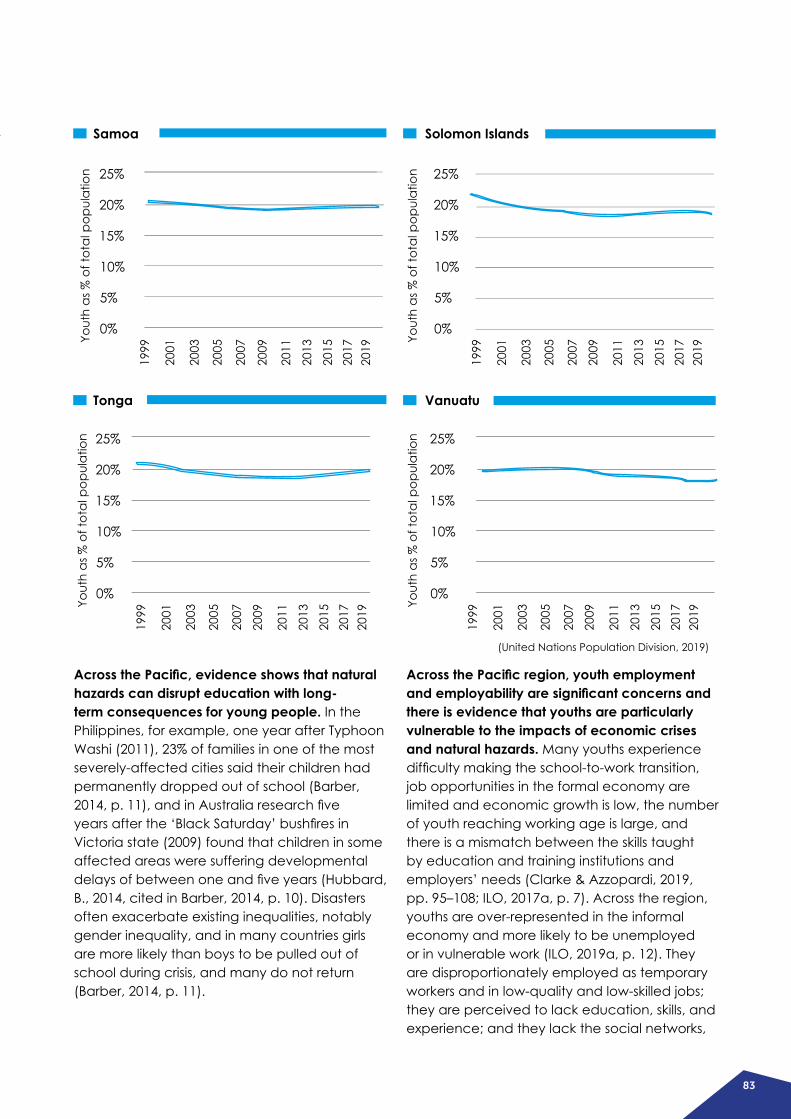
83
Across the Pacific, evidence shows that natural hazards can disrupt education with long-term consequences for young people. In the Philippines, for example, one year after Typhoon Washi (2011), 23% of families in one of the most severely-affected cities said their children had permanently dropped out of school (Barber, 2014,p.11),andinAustraliaresearchfiveyearsafterthe‘BlackSaturday’bushfiresinVictoria state (2009) found that children in some affected areas were suffering developmental delaysofbetweenoneandfiveyears(Hubbard,B., 2014, cited in Barber, 2014, p. 10). Disasters often exacerbate existing inequalities, notably gender inequality, and in many countries girls are more likely than boys to be pulled out of school during crisis, and many do not return (Barber, 2014, p. 11).
Across the Pacific region, youth employment and employability are significant concerns and there is evidence that youths are particularly vulnerable to the impacts of economic crises and natural hazards. Many youths experience difficultymakingtheschool-to-worktransition,job opportunities in the formal economy are limited and economic growth is low, the number of youth reaching working age is large, and there is a mismatch between the skills taught by education and training institutions and employers’ needs (Clarke & Azzopardi, 2019, pp. 95–108; ILO, 2017a, p. 7). Across the region, youths are over-represented in the informal economy and more likely to be unemployed or in vulnerable work (ILO, 2019a, p. 12). They are disproportionately employed as temporary workers and in low-quality and low-skilled jobs; they are perceived to lack education, skills, and experience; and they lack the social networks,
Samoa
Tonga
Solomon Islands
Vanuatu
2001
2001
2001
2001
2003
2003
2003
2003
2005
2005
2005
2005
2007
2007
2007
2007
2009
2009
2009
2009
2011
2011
2011
2011
2013
2013
2013
2013
2015
2015
2015
2015
2017
2017
2017
2017
2019
2019
2019
2019
0%
0%
0%
0%
5%
5%
5%
5%
10%
10%
10%
10%
15%
15%
15%
15%
20%
20%
20%
20%
25%
25%
25%
25%
1999
1999
1999
1999
Yout
h as
% o
f tot
al p
opul
atio
nYo
uth
as %
of t
otal
pop
ulat
ion
Yout
h as
% o
f tot
al p
opul
atio
nYo
uth
as %
of t
otal
pop
ulat
ion
(United Nations Population Division, 2019)
84
jobmarketinformation,andexperiencetofindnew work (Marcus & Gavrilovic, 2010, pp. 9–10). Officialunemploymentfiguresmayunderstateyouth unemployment as many youths drop out of the labor force and give up actively seeking work (ILO, 2017a, p. 7). In economic crisis and as a result of severe weather events, young people are pushed into the informal sector, underemployment, deteriorating employment conditions, and lower earnings (Marcus & Gavrilovic, 2010, pp. 9–19). The effects of a crisis can be long term, including depreciation of skills, failure to develop human capital, delayed transition to adulthood, permanently reduced employment prospects and incomes, and increased vulnerability of social exclusion (Marcus & Gavrilovic, 2010, pp. 9–19). Many young people are employed in an informal capacityinagriculture,tourism,andfisheries,which are particularly vulnerable to climate change and natural hazards (ILO, 2017b, p. 138).
It is often presumed that there is a link between youth unemployment and participation in crime and political violence, but there is little hard evidence of this. There are suggestions in the literature that widespread youth unemployment leads to participation in insurgencies, extremism, and violent gangs, but this appears to be “based more on intuition and assumption than on evidence” (Cramer, 2015, p. 1). Research does not directly disprove such a link, but there isinsufficientdatatoshowclearlythatalinkexists, and studies suggest that more important drivers of instability include weak governance, corruption, injustice, discrimination, humiliation, leadership offered by armed groups, availability of weapons, drug use, dysfunctional family relationships, and experience of violence in a culture of acceptance of violence (Idris, 2016, pp. 2–4).
In Fiji, floods and cyclones have disrupted education, but there is limited evidence about events prior to 2016.WidespreadfloodingintheWestern Division of Fiji in 2012 forced more than 15,000 people from their homes and affected about 150,000 people, and although there are no systematic data on school closures or attendance30 , there were reports of some rural residents being displaced to informal settlements where children lacked access to education (Ravesloot & Sobir, 2017, p. 12). Following TC Evan, also in 2012, assessments reported damage to 118 primary and 32 secondary schools, but similarly no data were available on disruption to education (Ravesloot & Sobir, 2017, p. 12). A study in Cakaudrove Province, a rural area where traditional, non-
mechanized farming practices are used, showed that boys from households affected by Cyclone Ami (2003) had a greater tendency than girls to drop out of school and take up farm work if housing aid was not provided, where housing aid was delivered within two years of the cyclone, dropout rates were reduced and the gender gap in schooling was eliminated (Takasaki, 2017, pp. 75–76).
Tropical cyclone Winston caused considerable damage to school infrastructure and led to reduced academic performance in the year following the storm.Mostschoolsofficiallyreopened within two weeks of the cyclone, althoughthefirstweekortwowastypicallyoccupied with cleaning up debris and providing
Fiji
30Ravesloot & Sobir (2017, p. 11) note that: “Other than damage assessment information, quantitative and qualitative informationwerenotreadilyavailableontheimpactoffloodsandCycloneEvan.AsFEMIS[FijiEducationManagementInformationSystem]wasnotyetfullyfunctionalatthattime,therewasnotsufficientdatacollectedand/orconsolidatedon all relevant EiE/CSS indicators (e.g. for how many days schools were closed).”
85
psycho-social support, with regular teaching only resuming in the third or fourth week (Ravesloot & Sobir, 2017, pp. 13, 18). Very few schools closed entirely, and where necessary students were reassigned and transported to other schools (Ravesloot & Sobir, 2017, p. 17). Repairs have been slow, however, and even seven months after the cyclone many schools were still using tents as temporary teaching facilities because “the bulk of the reconstruction and rehabilitation of affected school infrastructure had not begun” (Ravesloot & Sobir, 2017, pp. 17–19). School attendance dropped by more than half immediately after the cyclone, as teachers, students and families prioritised repairing property damage and cleaning up debris, waited for transport links to be restored, or coped with injury, illness, or death in the family; attendance returned to normal after about three months (Ravesloot & Sobir, 2017, pp. 16–17). Teachers reported that students, especially younger students, showed decreased participation and concentration, and increased behavioural and emotional problems, in the months following the cyclone (Ravesloot & Sobir, 2017, p. 18). Students’ academicperformancedroppedsignificantlyin the two terms following the cyclone in both primary and secondary schools, with slower
learnersandthoseinthefinalyearofhighschool being particularly disadvantaged, “the latter because their performance will account for future eligibility for scholarships for higher education” (Ravesloot & Sobir, 2017, p. 31).
In Fiji, the unemployment rate for youth is high, but there does not appear to be direct evidence about how natural hazards affect youth employment. The unemployment rate for youths is 3.6 times the overall unemployment rate, and the rate for young women is 5.4 times the overall rate (World Bank, 2020e). Most school leavers are forced to seek work in the informal sector because of the lack of job opportunities in the formal economy (Prasad, Chen, & Singh, 2013, p. 31). The unemployment rate for young women is double the rate for young men: 22.0% compared with 11.4% (World Bank, 2020e). For young people with post-secondary education, this disparity holds but is slightly narrower: 23% of young women with post-secondary education are unemployed, compared with 15% of young men with post-secondary education (Prasad et al.,2013,p.43).Officialunemploymentfiguresmay understate youth unemployment in the region, as many youths drop out of the labor force and give up actively seeking work (ILO, 2017a, p. 7).
In Papua New Guinea, natural hazards have disrupted education provision, but there are very little quantitative data about disruptions, and no evidence about the resulting outcomes for students. A survey of internally displaced people across ten provinces (72% of whom had been displaced by the effects of natural hazards, with the remainder displaced as a result of tribal and ethnic violence) found that 29% of households reported having children of school-going age who were not attending school, primarily because of unaffordable school fees, the need for children to work to support the family, or the school being too far away (IOM, 2017, p. 12). A study following the 2018 earthquake found that poor families were
likely to prioritise the education of boys over girls if families were unable to afford school fees for all children (Brun, 2018, p. 1). A study conducted during the 2015 drought described “a high incidence of children and teachers not attending schools as a direct result of the drought” (CARE, 2015a, p. 1). The study team visited ten regions affected by drought and found that schools were either completely closed or only operating half-days due to the lack of food and water at the schools and due to teachers being unable to work as they were coping with the effects of the drought themselves. There was also “a high level” of absenteeism, as parents held back children if they had no food to send with them to school,
Papua New Guinea
86
many children took on additional responsibilities for water collection at home, and some families became unable to afford school fees (CARE, 2015a, pp. 6–7, 10). Following the 2018 volcano on Manam Island, classes on the island were suspended and although school buildings were not damaged at the time of the assessments, teachers had evacuated from the island, and students’ books, uniforms and other equipment in the worst-affected villages were likely to have been lost along with their houses (ACAPS, 2018, p. 4). In 2016, primary net school enrollment rates were 96% for males and 90% for females, lower secondary net enrollment rates were 90% and 81%, and upper secondary rates were 60% and 49%, which are only slightly below average for the region (UNESCO, 2020).
Papua New Guinea’s labor market fails to provide sufficient employment opportunities for youth, and there is considerable interest in increasing youth employment, but no evidence available specifically about the impacts of natural hazards on youth employment. The ILO estimates that only 10,000 of the approximately 80,000schoolleaverseachyearfindworkin
the formal labor market, with the majority of the rest pursuing subsistence livelihoods in their village communities or otherwise remaining unemployed or underemployed in the informal economy which is linked with lower wages, poor working conditions and limited career prospects (ILO, 2017a, p. 7, 2018, p. 3). The youth unemployment rate (4.5% overall, 5.6% for young men and 3.4% for young women) is 1.8 times the overall unemployment rate (2.5%) (World Bank, 2020e). However, the ILO cautionsthatofficialunemploymentfiguresmay understate youth unemployment, as many youths drop out of the labor force and give up actively seeking work (ILO, 2017a, p. 7). Skill shortages are a problem for young people; there are mismatches between employers’ needs and the training offered by educational institutions, on-the-job training and apprenticeship programs are small and inefficient,andthereisalackofentrepreneurialskills (ILO, 2017a, pp. 7–8). In the time available for this study, it was not possible to locate anyevidencethatspecificallyaddressedthe impacts of natural hazards on youth employment.
In Samoa, cyclones and tsunamis have damaged schools and disrupted education provision, but no good quality evidence is available about the resulting outcomes for students.Naturalhazards“aresignificantbarriersto education, not only because they damage the physical infrastructure of schools, preventing attendance, but also because they reportedly affect the physical and psychological well-being of children, who prefer to remain at home rather than attending school during these events” (Anderson, Barnes, Raoof, & Hamilton, 2017a, p. 65). TC Evan in 2012 caused damage and losses to school buildings, furniture, equipment, and educational materials valued at WST 7.8 million (USD 3.4 million), ranging from
minor repairs and cleaning required in schools that were used as emergency shelters up to complete destruction of some school buildings (Government of Samoa, 2013, pp. 50–51). Some 5,300 students were affected (AusAID, 2013) but there appears to be no good evidence available on the extent of the disruption suffered. Emergency shelter workers reported that child labor (typically selling products on the street or begging to provide income for the family) increased as a result of the effects of TC Evan, but there is no robust evidence about the extent of the increase (Anderson et al., 2017a, p. 75; IFRC, 2016c, p. 57). The 2009 tsunami affected seven schools with 1,087 students and caused damage estimated at WST 9.0 million
Samoa
87
(USD 3.6 million) (Government of Samoa, 2009, p. 18). Temporary facilities were established where feasible and students were reallocated to nearby schools as a temporary measure until repairs could be completed; teaching resumed within about three weeks of the tsunami, with priority given to students who were due to take key national exams shortly thereafter (OCHA, 2009, p. 2). Following both of these disasters, there were concerns that the loss of income-earning opportunities and subsistence food production would lead to families having difficultypayingforcostssuchasschoolfees,uniforms, and transportation (Government of Samoa, 2009, p. 20, 2013, p. 51). These pressures were expected to be most severe in the case of the 2009 tsunami, as the area affected was one of the poorest areas in the country (Government of Samoa, 2009, p. 20). Education completion rates in Samoa are high by regional standards, with 76% of Samoans completing primary school, 82% of females and 71% of males continuing on to secondary school, and 68% of the adult (ages 15 to 65) population completing secondary school (Pita & Schoop, 2015, p. 7).
In Samoa, job opportunities in the formal economy are limited and most youths transition from school into the informal economy or subsistence agriculture. The youth unemployment rate is 18.1% (15.3% for young men and 22.8% for young women), which is more than twice the overall unemployment rate of 8.4% (World Bank, 2020e), and the ILO cautionsthatofficialunemploymentfiguresmay understate youth unemployment, as many youths drop out of the labor force and
give up actively seeking work (ILO, 2017a, p. 7). Young women, early school leavers and those with low levels of education, youth with special needs, and youth living in rural areas are more likely to be unemployed than other groups (Pita & Schoop, 2015, p. 10). Many youths in Samoa are disengaged from the formal economy: the proportion of youth not in employment, education, or training is high, at 41% (ILO, 2017b, p. 27), and approximately 13% of youths say they are not interested in formal work (Pita & Schoop, 2015, p. 7). The informal economy involves 68% of the total labor force and absorbs the majority of youths entering the labor force, with many of the rest moving into subsistence agriculture (Pita & Schoop, 2015, p. 6). There is a mismatch between the skills that young Samoans receive at school and in technical and vocational training, and the needs of employers; youth often enter the labor market with poor core employability skills, and weak systems for labor market information and career guidance for youth do not adequately support their transition to work (Pita & Schoop, 2015, pp. 7–9). The private sector struggles to accommodate the numbers of young people coming out of school (approximately 4,000 per year); constraints that limit job creation by MSMEs and hinder young entrepreneurs include limited access to start-up capital and credit,insufficientformsofotherfinancialandnon-financialbusinesssupport,andhightraining costs (Pita & Schoop, 2015, p. 10). There appearstobelittleornoinformationspecificallyaddressing the impacts of natural hazards on youth employment in Samoa, apart from a general impediment to economic growth.

88
In Solomon Islands, there are numerous reports of infrastructure damage and disruption to education caused by natural hazards, but little or no evidence about the resulting outcomes for students. For example, an earthquake and tsunami in February 2013 damaged 21 schools and displaced an estimated 2,714 children, withmostclassesresuminginApril;floodinginMakira in July 2013 disrupted schooling for 144 studentsforoveramonth;floodscausedbyTCIta in 2014 damaged or destroyed 33 schools in Honiara and Guadalcanal; and in 2015 many schools closed or operated short days due to water shortages caused by the El Niño drought (Solomon Islands Government, 2015, pp. 10–11). The Solomon Islands Government has noted that“theimpactofrecurrentfloodingeventson schooling is undocumented but contributes toasignificantnumberofschooldayslostinany given year” (Solomon Islands Government, 2015, p. 10). The Government also notes that there are no documented contingency plans or guidance to assure educational continuity in disasters either at the provincial level or individual school level, that quality of school construction is often low, and that there is a lack of temporary learning facilities apart from tents available from UNICEF and Save the Children (Solomon Islands Government, 2015, pp. 18, 20–23). Gross enrollment rates for females and males in 2013 in primary school were 112% and 113% respectively, and in secondary school
In Tonga, cyclones have damaged schools and disrupted education provision, but there appears to be no evidence available about the resulting outcomes for students. UNICEF, for example, notes that the education system in Tonga is vulnerable to natural hazards, but that “quantitative data on the impact of disasters on school infrastructure and children attending school is unavailable” (Anderson, Barnes, Raoof, & Hamilton, 2019, p. 54) although some information about the extent and nature of damage caused by some past hazards is available. For example, TC Gita caused
49% and 51%; overall completion rates are not available but in 2013 the number of students enrolledinthefirststageofprimaryschoolin2013 was 23,266 and the number enrolled in thefinalyearofsecondaryschoolwasonly596, suggesting that no more than 2.6% of children complete the full course of primary and secondary schooling (Solomon Islands Government, 2015, pp. 4–5). The cost of school feesisasignificantbarrierformuchofthepopulation (Solomon Islands Government, 2015, p. 2).
The Solomon Islands labor market fails to provide sufficient employment opportunities for the majority of the population. Each year, the formal economy produces about 400 new jobs while about 10,000 young people join thelaborforce(ILO,2017a,p.7).Officially,unemployment rates appear very low, with the youth unemployment rate at 1.1% overall (0.8% for young men and 1.3% for young women) being twice the overall unemployment rate (0.6%) (World Bank, 2020e), but the ILO cautionsthatofficialunemploymentfiguresmay understate youth unemployment, as many youths drop out of the labor force and give up actively seeking work (ILO, 2017a, p. 7). Evidencespecificallyaddressingtheimpactsof natural hazards on youth employment in Solomon Islands, beyond generally inhibiting economic growth, does not appear to be available.
widespread damage to 109 out of 150 (73%) educational facilities on the affected islands, affecting 23,000 to 25,000 students (IFRC, 2018b, p. 4; Kingdom of Tonga, 2018a, p. 40). All schools in the affected areas were closed for between four days and three weeks, with students returning to most schools quickly (IFRC, 2018b, p. 4; Kingdom of Tonga, 2018a, p. 77). Students were transported to alternative schools if their regular schools could not be reopened quickly (Kingdom of Tonga, 2018a, p. 40). Temporary relief to damaged schools (provided by UNICEF) included school supplies, tents
Solomon Islands
Tonga
89
In Vanuatu, cyclones have damaged schools and disrupted education provision, but very little evidence is available about the resulting outcomes for students. A UNICEF report notes a lack of data on the impacts of disasters on school infrastructure and school attendance in Vanuatu, although reporting that disasters have an impact in the form of reduced access to schools and school closures, and that “anecdotal evidence suggests that children in Vanuatu are often kept out of school in the aftermath of a natural disaster to help their families with clean-up activities” (Anderson et al., 2017b, p. 64). The physical damage inflictedonschoolsforrecenteventshasbeenincreasingly well documented in recent years, but there is a lack of information about the impact on educational outcomes. TC Pam, for
and tarpaulins, recreation kits, early childhood development kits, and backpacks for students (Kingdom of Tonga, 2018a, p. 77). Media reports indicate, however, that at least 17 months after the cyclone some schools on Tongatapu were still using tents which had been intended to serve as temporary classrooms (Radio New Zealand, 2019b).
Tonga’s youth face poor labor market outcomes and a large proportion of youth fail to transition into employment, remaining unemployed or inactive in the labor market (Government of Tonga, 2018b, p. 35; World Bank, 2017a, p. 4). Economic disadvantages due to the country’s small size, remoteness, exposure to economic shocks and natural hazards have led to slow economic growth and job creation (World Bank, 2017a, p. 3). The unemployment rate for youths is 3.2 times the overall unemployment rate, and the rate for young women is 6.2 times the overall rate (World Bank, 2020e). A relatively high proportion of youths aged 15-34 are not in employment, education or training: 45% of young women and 35% of men (Tonga Statistics Department, 2019, p. 6). A study of youth on ’Eua Island found that although there are increasing expectations that young people
example, is reported to have damaged 64% of primary and secondary schools in affected areas, as well as damaging kindergartens and staff housing, affecting 34,614 students (Government of Vanuatu, 2015b, pp. 47–48). Many school facilities had been built to poor standards or not well maintained, including some built by local communities on limited budgets and not following building standards (Government of Vanuatu, 2015b, p. 46). Schools were typically closed for 10 to 30 days following the cyclone (Ireland, 2016, p. 28); those with minor damage resumed lessons within about two weeks, and all schools were operating within about two months (SPC, 2016, p. 41). However, some schools were still using tents as temporary facilities in late 2016, a year and a half after the cyclone (IMF, 2016, p. 69).
shouldfindpaidworkaftercompletingschool,families also still rely on younger family members tohelpwithfarming,fishingandotherself-provisioning activities, and when formal waged employment is unavailable, many youth work at home instead (Good, 2019, p. 42). A mismatch between the technical and vocational training available and the skills in demand in industry, and a secondary school dropout rate of 25% may also be contributing factors to low youth employability (World Bank, 2017a, p. 4).
Very little information appears to be available specifically addressing the impacts of natural hazards on youth employment in Tonga. UNICEF and World Bank reports cite exposure to natural hazards as a contributing factor for the shortage of employment opportunities for youth in Tonga (Anderson et al., 2019, p. 83; World Bank, 2017a, p.3),butspecificdetailsofhownaturalhazardshave affected employment, beyond generally inhibiting economic growth, do not appear to be available. The Government of Tonga’s post-disaster assessment of TC Gita notes that the high youth unemployment rate “is concerning, especially since it could be further exacerbated by the cyclone” (Government of Tonga, 2018b, p. 28).
Vanuatu

90
Following disasters, children are more likely to drop out of school to support their family through agricultural or domestic work and because of reduced household income to pay for school fees, which is more likely to affect girls than boys because girls tend to take on more domestic responsibilities (Government of Vanuatu, 2015b, pp. 49–50). School enrolment rates in Vanuatu are high at the primary school level, but most children do not go onto secondary school due to the limited number of places available, distances, and costs (Ireland, 2016, p. 26) and because many subsistence households rely on the labor of younger family members (Government of Vanuatu, 2015b, p. 88). Gross enrolment rates for primary school are 130% for males and 125% for females, and for secondary school are 44% for males and 50% for females (Ministry of Education and Training, 2020, p. 20). Only about 5% of the population goes on to tertiary education (SPC, 2015, p. 25). Damage caused by TC Pam in 2015 may have contributed to a reduction in primary school enrolment in 2015 (Anderson et al., 2017b, p. 77) (the primary gross enrollment rate fell by nine percentage points, from 118% to 109%, between 2013 and 2015) (UNESCO, 2020).
Vanuatu’s labor market fails to provide sufficient employment opportunities for the majority of the population (Government of Vanuatu, 2015b, p. 89). The formal economy produces fewer than 700 new jobs each year, and 3,500 to 5,000 young people join the labor force each year (Government of Vanuatu, 2015b, p. 89;
ILO, 2017a, p. 7). The youth unemployment rate (8.8% overall, 8.5% for young men and 9.1% for young women) is twice the overall unemployment rate (4.4%) (ILO, 2017a, p. 6; World Bank, 2020e). However, the ILO cautions thatofficialunemploymentfiguresmayunderstate youth unemployment, as many youths drop out of the labor force and give up actively seeking work (ILO, 2017a, p. 7). Youth employment tends to be informal and insecure (Anderson et al., 2017b, p. 112). A lack of opportunities for adolescents and young people perpetuates cycles of poverty and has led to unhealthy behavior, such as drug and alcohol abuse, and mental health issues (Anderson et al., 2017b, p. 5).
Very little information appears to be available specifically addressing the impacts of natural hazards on youth employment in Vanuatu. The Government of Vanuatu’s post-disaster needs assessment of TC Pam notes that youth are particularly vulnerable: “youth are generally thefirsttolosetheirjobsintimesofeconomiccontraction and the last to gain employment when the economy rebounds” (Government of Vanuatu, 2015b, p. 92). Exposure to natural hazards contributes to weak economic growth and a shortage of employment opportunities for youth in Vanuatu (Anderson et al., 2017b, p. 112),butspecificdetailsofhownaturalhazardshave affected employment, beyond generally inhibiting economic growth, do not appear to be available.
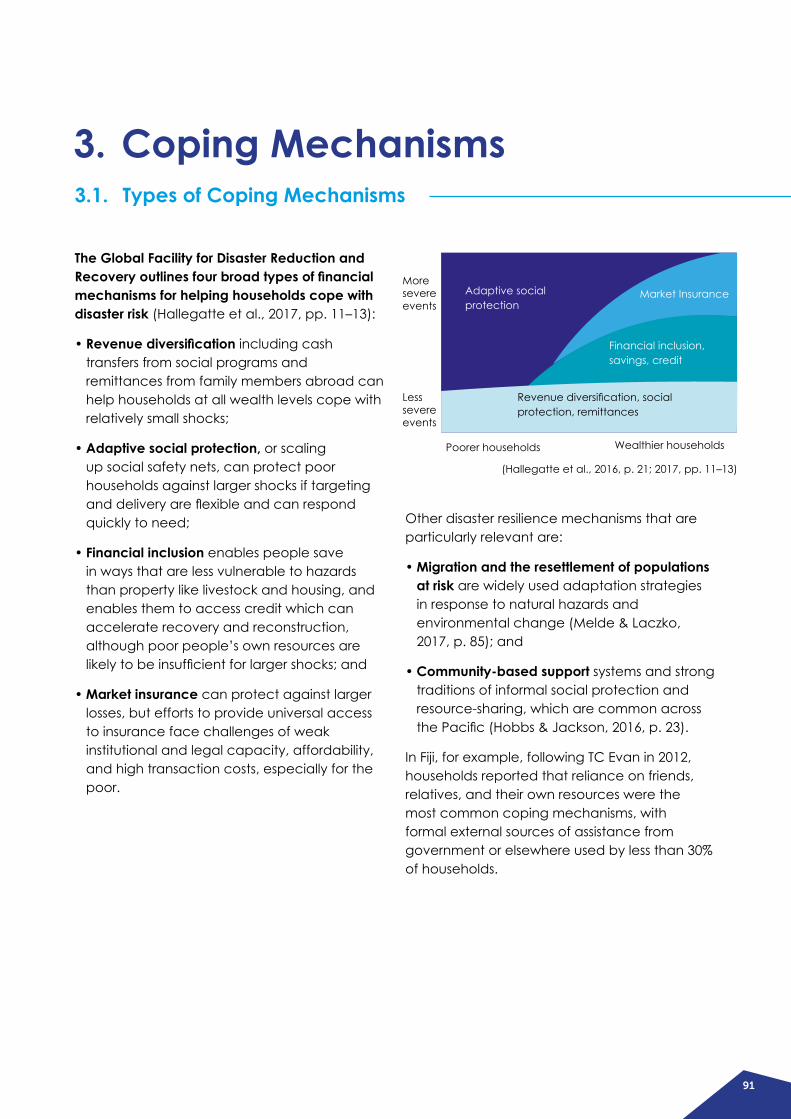
91
3. Coping Mechanisms3.1. Types of Coping Mechanisms
Adaptive social protection
Moresevereevents
Lesssevereevents
Poorer households Wealthier households
(Hallegatte et al., 2016, p. 21; 2017, pp. 11–13)
Market Insurance
Financial inclusion, savings, credit
Revenuediversification,socialprotection, remittances
The Global Facility for Disaster Reduction and Recovery outlines four broad types of financial mechanisms for helping households cope with disaster risk (Hallegatte et al., 2017, pp. 11–13):
• Revenue diversification including cash transfers from social programs and remittances from family members abroad can help households at all wealth levels cope with relatively small shocks;
• Adaptive social protection, or scaling up social safety nets, can protect poor households against larger shocks if targeting anddeliveryareflexibleandcanrespondquickly to need;
• Financial inclusion enables people save in ways that are less vulnerable to hazards than property like livestock and housing, and enables them to access credit which can accelerate recovery and reconstruction, although poor people’s own resources are likelytobeinsufficientforlargershocks;and
• Market insurance can protect against larger losses, but efforts to provide universal access to insurance face challenges of weak institutional and legal capacity, affordability, and high transaction costs, especially for the poor.
Other disaster resilience mechanisms that are particularly relevant are:
• Migration and the resettlement of populations at risk are widely used adaptation strategies in response to natural hazards and environmental change (Melde & Laczko, 2017, p. 85); and
• Community-based support systems and strong traditions of informal social protection and resource-sharing, which are common across thePacific(Hobbs&Jackson,2016,p.23).
In Fiji, for example, following TC Evan in 2012, households reported that reliance on friends, relatives, and their own resources were the most common coping mechanisms, with formal external sources of assistance from government or elsewhere used by less than 30% of households.

92
Coping mechanisms used by households in Fiji following TC Evan
Unconditional help from relatives/ friends
Relied on savings
Relied on less preferred food options
Unconditional help provided by government
Reduced the proportion or number of meals per day
Changed cropping practices (crop choices or technology)
Other
Reduce expenditrures on health and education
Obtained credit
Household member(s) took on more non-farm (wage or selfemployment)
Household member(s) took on more farm wage employment
Sold livestock
Sold durable housdehold assets (agriculture or non-agriculture)
Skipped days without eating
Take children out of a school
Distress sales of animal stock
Transfer children to a different school
Sent children to live elsewhere
Household member(s) migrated
Rented out land/building
Sold land/building
0% 10% 20% 30% 40% 50%(Government of Fiji, 2017b, p. 67)
93
3.2. Adaptive Social Protection
Scaling up social protection schemes quickly by providing cash payments or vouchers to people affected by humanitarian crisis is increasingly common worldwide (Huber & Fischer, 2020, p. 8; Idris, 2017a, pp. 1–2; Save the Children and ACAPS, 2018, p. 12). International experience has shown that a cash-based responseisefficientandeffective,enablesrecipients to identify and prioritise their own needs, supports the dignity of recipients, can bemoretimelyandflexiblethanothertypesofassistance, and supports the recovery of local markets (Fabre, 2017, p. 3; Holt & Hart, 2019, p. 2; Save the Children and ACAPS, 2018, p. 12). Concerns about cash-based programming leading to risks of theft, diversion, corruption, security,targeting,misusebybeneficiaries,inflation,anddisempowermentofwomenhavenotbeenshowntobesignificantinpractice,and there is consensus that the risks of cash-based programming are no greater than those associated with in-kind assistance (Fabre, 2017, p. 9; Idris, 2017b).
In the Pacific, cash-based programming has not been widely used until quite recently, but it is now becoming more accepted (Hobbs & Jackson, 2016, p. 11; Huber & Fischer, 2020, p. 8; Save the Children and ACAPS, 2018, p. 12). Large-scale, in-kind distributions of aid have been preferred to cash transfers, because of limited availability of cash transfer mechanisms and a cultural aversion to cash transfers in many PacificIslandcountries(Costella&Ivaschenko,2015, pp. 7–8; Holt & Hart, 2019, p. 2). However, asPacificIslands’economiesbecomeincreasingly monetized, the role of cash in the wake of disasters has become stronger (Costella & Ivaschenko, 2015, p. 8). Examples of successful activities in the region include responses to TC Pam in Vanuatu in 2015, TC Winston in Fiji in 2016, and the volcanic eruption on Ambae island in Vanuatu in 2018 (Huber & Fischer, 2020, p. 8). Cash transfers in crisis situations are more feasible in countries with prior experience of cash transfers through social protection programs and remittances, and with well-developedfinancialservicesandahighdegreeoffinancialinclusion,althoughcountry-specificsocial,culturalandgender-relatedissues also affect feasibility (Hobbs & Jackson, 2016, pp. 8–9).
In the aftermath of Tropical cyclone Winston, the government of Fiji leveraged the existing social protection system to provide support to the affected population, rapidly adapting three major programs to support existing beneficiaries.ThePovertyBenefitScheme,targeting poor families, the Social Pension Scheme, providing income support to the elderly, and the Care and Protection Scheme / Child Protection Allowance, for children, were used to distributed top-up payments equivalent tothreemonths’worthoftheirregularbenefits(Government of Fiji, 2017b, p. 68; Wehrhahn et al., 2019, p. 19). Supplements were paid to allbeneficiaries,irrespectiveofwhethertheyresided in the affected areas (Government of Fiji, 2017b, p. 68), and were followed up by two additional months of food voucher top-up payments in partnership with the World
Food Programme for people living in the most badly affected areas (Government of Fiji, 2016, p. 34, 2017b, p. 69). Recipients spent their top-up payments on general consumption, transportation, and buying seedlings, livestock, tools, and equipment (Mansur, Doyle, & Ivaschenko, 2018, p. 28). An evaluation of the PovertyBenefitSchemetop-upsfoundthatthree months after the cyclone, households that had received support were 8% to 10% more likely to report having repaired housing damage than those that had not received the additional payments (Mansur et al., 2018, p. 28). One challenge of cash-based programming in other humanitarian contexts has been the challenge of coordination among multiple relief agencies (Idris, 2017a), but in Fiji relief has been coordinated by the government through its own programs.
Fiji
94
A new Help for Homes program was also launched to assist with housing repair and reconstruction. Households earning less than FJD 50,000 received electronic cards pre-loaded with funds that could be spent on hardware and construction materials in approved hardware stores; the amount of funds each household received depended on the amount of damage suffered (Wehrhahn et al., 2019, p. 13). A total of FJD 120 million was distributed to almost 50,000 households under this scheme (Wehrhahn et al., 2019, p. 59), but this is only 16% of the estimated FJD 751 million damage caused by the cyclone (Government of Fiji, 2016, p. 72). The program also partnered with humanitarian agencies to provide training and advice in resilient building techniques to support building back stronger (Government of Fiji, 2017b, p. 69; Hallegatte et al., 2018, p. 19).
In addition, the Fiji National Provident Fund, the principal national contributory pension scheme, allowed members to withdraw a portion of their pension funds if they had been affected by TC Winston. Withdrawals of up to FJD 1,000, plus an additional FJD 5,000 for property owners in affected areas, were permitted and at least 170,000 people took advantage of this opportunity (Mansur et al., 2018, pp. 12–13). This released FJD 275.5 million into the economy (equivalent to 2.7% of GDP) quickly, although at the cost of reduced future pensions for individuals taking advantage of the facility (Government of Fiji, 2016, p. 34, 2017b, p. 69; Prochaska, Levula, & Levula, 2018, p. 10; Wehrhahn et al., 2019, pp. 59–60).
Papua New Guinea has no national social protection programs with universal coverage, although there are some limited employment-linked social protection schemes (CFE-DM, 2019, p. 15; ILO, 2018, p. 5). The country’s social protection programs are very limited by regional standards: the Asian Development Bank’s Social Protection Indicator31 calculates an expenditure of 0.1% of GDP per capita, which is the lowest among the 38 countries in AsiaandthePacificincludedintheindicator(ADB, 2016, pp. 11–12). The Government operates programs related to child protection and disaster relief, and there are employment-linked social protection programs covering people in formal employment; these include compulsory contributory pension schemes in the public and private sectors, a workplace injury compensation scheme, employer-funded
sick pay, paid maternity leave for public sector employees, and labor market training programs (ILO, 2018, p. 5; Wrondimi, 2012, pp. 7–10). The province of New Ireland has operated a non-contributory old age pension anddisabilitybenefitsince2009,providinganannual payment of PGK 360 (USD 103) which is distributed in cash to all residents who are at least60yearsoldorhaveasignificantdisability32 ;in2013,therewere8,362beneficiaries(4.3% of the province’s population) (Sibley, Ivaschenko, Pagau, & Tanhchareun, 2014, pp. 20–23).Recipientsofthisbenefitreportedinfocus group discussions that the funds were typically used for food, medicine, clothing, to pay grandchildren’s school fees, or to buy other goods; some reported saving the money at home or in a bank account, but most participants stated that the funds only lasted two to four weeks (Sibley et al., 2014, p. 29).
Papua New Guinea
31ADB’s Social Protection Indicator calculates countries’ total expenditures on social protection divided by the number of intendedbeneficiaries,expressedasapercentageofGDPpercapita(ADB,2016,p.4).32Eligibility is assessed by local ward councillors and the chairs of village planning committees, as many elderly residents havenobirthcertificates,anddisabilityisnotclearlydefined,leavingscopeforinterpretation.
95
Samoa’s social protection programs are limited in scale by regional standards, but include a universal pension scheme. The Asian Development Bank’s Social Protection Indicator33 calculates an expenditure for Samoa of 1.2% of GDP per capita, which is well belowtheaverageforthePacificregion(1.9%)or for Asia (3.7%) (ADB, 2016, pp. 11–12). Two principal social protection programs exist:
• Samoa National Provident Fund, a contributory, employer-matched pension scheme offering members who reach the retirement age of 55 a lump sum payment or annual pension based on accumulated contributions, as well as life insurance and some loan products (Samoa National Provident Fund, 2020a); and
• Senior Citizens Benefit Fund, a universal pension payable to all Samoan citizens and permanent residents aged 65 or older, providing a monthly payment of WST 135 (approximately USD 51), free travel on government ferries between the main islands, and some free medical services (Samoa National Provident Fund, 2020b). Approximately 12,000 people (6.1% of the population)receivethisbenefit(Hobbs&Jackson, 2016, p. 27).
Cash transfer programming for disaster relief appears unlikely to be feasible in Papua New Guinea in the immediate future. Limited financialinclusionandalackofmarketsand transportation systems to supply goods would likely limit the feasibility of cash transfer programs in rural areas. An IFRC report on the response to the 2018 Kadovar Island volcanic eruption warned that “due to security risks handling money represents, no cash programming can be considered for this operation. The authorities are not allowing this option and PNGRC [Papua New Guinea Red
In Samoa, the use of cash transfers to provide disaster assistance has been limited. In one example, following the 2009 tsunami, the Samoa Red Cross disbursed cash grants to 171 households assessed to be particularly in need. Most of these grants (82%) were worth WST 500 (USD 200), with a few businesses grants ranging up to WST 12,000 (USD 4,800); funds were paid into bank accounts or transferred via Western Union, and were typically used forexpensesrelatedtoagriculture,fishing,orhouse repair (IFRC, 2011, pp. 3, 11–13). Samoa’s National Provident Fund allows partial early withdrawals in the case of certain medical conditions (Samoa National Provident Fund, 2020a) but Samoa is not known to have allowed pension fund members to access funds for disaster recovery (Guo & Narita, 2018, p. 9). A regional study of the feasibility of cash transfer programming noted that markets in Samoa may not have capacity to accommodate demand during emergencies (an important consideration for the feasibility of cash transfer programming), based on observed delays in the delivery of construction materials and the cost of fresh fruit and vegetables to markets following TC Evan (Hobbs & Jackson, 2016, p. 37).
Cross] cannot put its staff and volunteers at risk” (IFRC, 2018a, p. 3). A report for the Papua New Guinea government and UNICEF in 2008 proposed a “conceptual framework” for a cash transfer system targeted at supporting children affected by HIV/AIDS, but did not go as far as evaluating the feasibility of such a system, and did not address the issue of disaster resilience (Samson, 2008). In the time available for this report, no studies were found examining the feasibility of cash transfers or the use of social protection systems for disaster relief and recovery in Papua New Guinea.
Samoa
33ADB’s Social Protection Indicator calculates countries’ total expenditures on social protection divided by the number of intendedbeneficiaries,expressedasapercentageofGDPpercapita(ADB,2016,p.4).
96
Solomon Islands’ social protection system is essentially limited to employment-linked entitlements for people in formal employment, with no large, rapidly-scalable social cash transfer programs appropriate for disaster resilience (ADB, 2019b, p. 16; Huber & Fischer, 2020, p. 20). Solomon Islands’ social programs are limited by regional standards: the Asian Development Bank’s Social Protection Indicator34 calculates an expenditure of 1.3% of GDP per capita, which is well below the averageof1.9%forthePacificregion(ADB,2016, pp. 11–12). Social assistance programs are limited to primary education, primary health care, disaster relief, and (in 2009) a few very small programs providing training, workers’ compensation,andbenefitstopeoplewithdisabilities (ADB, 2019b, p. 16; ILO, 2015, p. 3; Tafoa, 2012, p. 7). Social insurance coverage is provided by the national pension scheme, the Solomon Islands National Provident Fund, which isacompulsory,defined-contributionpensionfor people in formal employment; it also offers a parallel voluntary pension saving scheme for the self-employed, called youSave, which was launched in 2017 and can be operated by mobile phone (Huber & Fischer, 2020, p. 20; Solomon Islands National Provident Fund, 2018). Other social programs include cash-for-work
Tonga’s social protection programs are limited by regional standards. ADB’s Social Protection Indicator35 calculates an expenditure of 0.8% of GDP per capita, which is well below the averageforthePacificregion(1.9%)orforAsia(3.7%) (ADB, 2016, pp. 11–12)(ADB, 2016, pp. 11–12). The government operates two social assistance programs36 : the Social Welfare Program for the Elderly, introduced in 2012,
for unemployed youth, and skills development and training programs (ADB, 2019b, pp. 19–20). A cash-for-work scheme to rehabilitate community infrastructure formed part of the responsetofloodingin2014;theschemewasfunded and managed by the ILO, and provided short-term employment to 121 people (Costella & Ivaschenko, 2015, p. 39; ILO, 2014, pp. 2–5).
Cash transfer programs in response to disasters may be feasible in some areas of Solomon Islands, depending on local infrastructure. A comprehensive study found that feasibility is highest in and near the major economic centers (Honiara, Gizo, Munda, Noro, Auki and Malu’u), and lower in more remote areas due tothelowpenetrationoffinancialservicesandtelecommunication services, limited capacity of local shops and markets to meet surges in demand, limited and expensive transportation services, local shops lacking lines of credit with suppliers,andlowfinancialliteracy(Huber&Fischer, 2020, pp. 5, 29–30, 83). Mobile money systems might offer opportunities for distributing money in emergencies in remote areas, but improvements to logistics chains would be necessary to enable shops and markets to respond to demand (Huber & Fischer, 2020, pp. 5, 20)
providing cash payments of TOP 70 to 80 per month (approximately USD 30 to 40) to people aged 70 or older; and the Disability Welfare Scheme, introduced in 2015, which supports people with severe physical, intellectual, psychological, or sensory disabilities by providing regular ca Tonga, 2018b, p. 33). There are also two contribution-based pension schemes, the Retirement Fund Board (RFB) scheme for central
Solomon Islands
Tonga
34ADB’s Social Protection Indicator calculates countries’ total expenditures on social protection divided by the number of intendedbeneficiaries,expressedasapercentageofGDPpercapita(ADB,2016,p.4).35ADB’s Social Protection Indicator calculates countries’ total expenditures on social protection divided by the number of intendedbeneficiaries,expressedasapercentageofGDPpercapita(ADB,2016,p.4).36A third social assistance program, Skills and Employment for Tongans (funded by the World Bank), began providing conditional cash payments to households based on secondary school enrolment and attendance in 2020 (World Bank, 2020c, p. 1).

97
Vanuatu has limited activity in the area of social protection, and no existing large and scalable cash transfer programs. Vanuatu’s social protection programs are small and limited by regional standards, ranking second-lastinthePacificontheAsianDevelopmentBank’s Social Protection Indicator37 (above only Papua New Guinea) (ADB, 2016, pp. 11–12). Social protection is a relatively new area of activity for Vanuatu (Costella & Ivaschenko, 2015, p. 37); there are no regular social transfer schemes, “the comprehensiveness and impact of Vanuatu’s ‘formal’ social protection system appears quite weak” (Anderson et
government employees, and the National RetirementBenefitsFund(NRBF)forprivateandpublic sector employees (ADB, 2016, p. 26), and pilot programs for supporting children with disabilities and vulnerable older people needing care (ADB, 2016, p. 31).
As part of the response to TC Gita, the Government of Tonga used its existing social protection system to provide cash payments for disaster assistance (Government of Tonga, 2018b, p. 26). Leveraging the Social Welfare Program for the Elderly and the Disability Welfare Scheme, with funding from the Government of Australia, the government distributed one-time top-up payments to existingbeneficiariesintheaffectedareas(approximately 3,558 people in all) within one month of the cyclone worth TOP 225 (approximately USD 101) in addition to regular monthly payments (Department of Foreign Affairs and Trade, 2018; Government of Tonga, 2018b, p. 26). The total value of this assistance was approximately TOP 800,000 (USD 358,000)
al., 2017b, pp. 112–116), and there are no broad-based social protection programs apart from employment-linked pension schemes such as the Vanuatu National Provident Fund (Holt & Hart, 2019, p. 26). Four targeted social assistance programs existed as of 2012: a Home Island Passage Allowance scheme, details of which appear to be unavailable; scholarships for students; a Family Assistance SupportProgramprovidingshort-termfinancialassistance to destitute families; and disaster assistance which consists of emergency supplies such as food, water, clothing, blankets, temporary shelter, and transportation services
(Government of Tonga, 2018b, p. 34). Two other forms of cash assistance were provided by the government following TC Gita: cash grants worth TOP 500,000 were made to 27 registered fisherstosupportrepairstodamagedboatsand fences (Ministry of Finance, 2019, p. 84); and cash grants worth a total of TOP 6.5 million were distributed to 8,217 households based on the amount of property damage suffered (TOP 3,000 for homes that were destroyed, TOP 1,500 for partial damage, and TOP 500 for minor damage) (Ministry of Finance, 2019, pp. 83–84). The national civil service pension scheme also allowed pensioners to borrow money from their pension assets (Retirement Fund Board, 2018). The government of Tonga and UNDP operated cash-for-work programs following the Niuatoputapu tsunami in 2009 (reportedly the firstemergencycash-for-workprograminthePacific)andfollowingTCIanin2014,inwhichpayments were made through the mobile money service provided by Digicel, the largest mobile phone company in the country (Hobbs & Jackson, 2016, pp. 29, 46, 51).
Vanuatu
37ADB’s Social Protection Indicator calculates countries’ total expenditures on social protection divided by the number of intendedbeneficiaries,expressedasapercentageofGDPpercapita(ADB,2016,p.4).
98
(Alatoa, 2012, pp. 6–9). Some small-scale cash transfer programs have been undertaken in the country, including:
• Following the evacuation of Ambae island in 2017 and 2018 due to volcanic activity, Oxfam led a cash transfer program to help displaced people buy goods from local markets (Nalau, McNaught, & Dalesa, 2020, p. 31).
• Following TC Pam, members of the national contributory pension scheme, the Vanuatu National Provident Fund, were permitted to withdraw up to 20% of their pension savings; 21,634 of the approximately 31,000 members of the pension scheme did so, releasing funds amounting to VUV 1.7 billion (approximately USD 15.6 million), equivalent to about 2.1% of GDP (Government of Vanuatu, 2015b, p. 24; IMF, 2016, p. 27; Vanuatu National Provident Fund, 2017, p. 13). The average amount withdrawn was VUV 78,600 (approximately USD 720) per person.
• Cash-for-work projects were also undertaken following TC Pam: Oxfam provided vouchers for agricultural inputs and managed a cash-for-work program in Port Villa for around 500 people to support debris removal and recovery activities (Hobbs & Jackson, 2016, p. 29), and UNDP provided a small-scale cash-for-work project for around 100 people in Port Villa and on Tanna island (Hobbs & Jackson, 2016, p. 29).
Cash transfer programs may be feasible in some parts of Vanuatu, depending on local conditions on each island. A 2016 survey by the Cash Learning Partnership showed that government and humanitarian respondents agreed that there was potential for increasing
the use of cash transfers in emergency response in the most central islands, but that the majority of outer islands could not support cash transfers due to a lack of markets with sufficientcapacity,alackofknowledgeandpractical experience across the country, poor accesstofinancialservices,riskoffraud,poorcoordination among implementing agencies, and the potential to undermine longer-term development programming (Hobbs & Jackson, 2016, p. 29). A follow-up study by Oxfam in 2019 agreed that cash transfer programs were feasible in some locations, but that the level of feasibility varies greatly across different islands with challenges including limited access to markets with necessary goods and capacity to meet surges in demand, limited availabilityandcapacityoffinancialservicesproviders, questions about fairly distributing cash payments between male and female heads of households, targeting of assistance, requirementsforformalidentificationofrecipients, and robustness of communications networks to support electronic payment solutions (Holt & Hart, 2019, pp. 3–4). Oxfam andthefinancialtechnologyfirmsSempoandConsenSys carried out a small-scale trial of a digital cash transfer system using electronic cards and cryptocurrency (blockchain) technology in a project called “UnBlocked Cash” in 2019, distributing VUV 966,443 (approximately USD 8,600) and involving 187 heads of households and 29 vendors in Port Vila over four weeks. The pilot project showed “modestcostsavingsandsignificanttimesavings” compared with other methods of distributing cash and vouchers, particularly inregisteringbeneficiariesandsimplifyingidentificationrequirements(Rust,2019,pp.4–5).
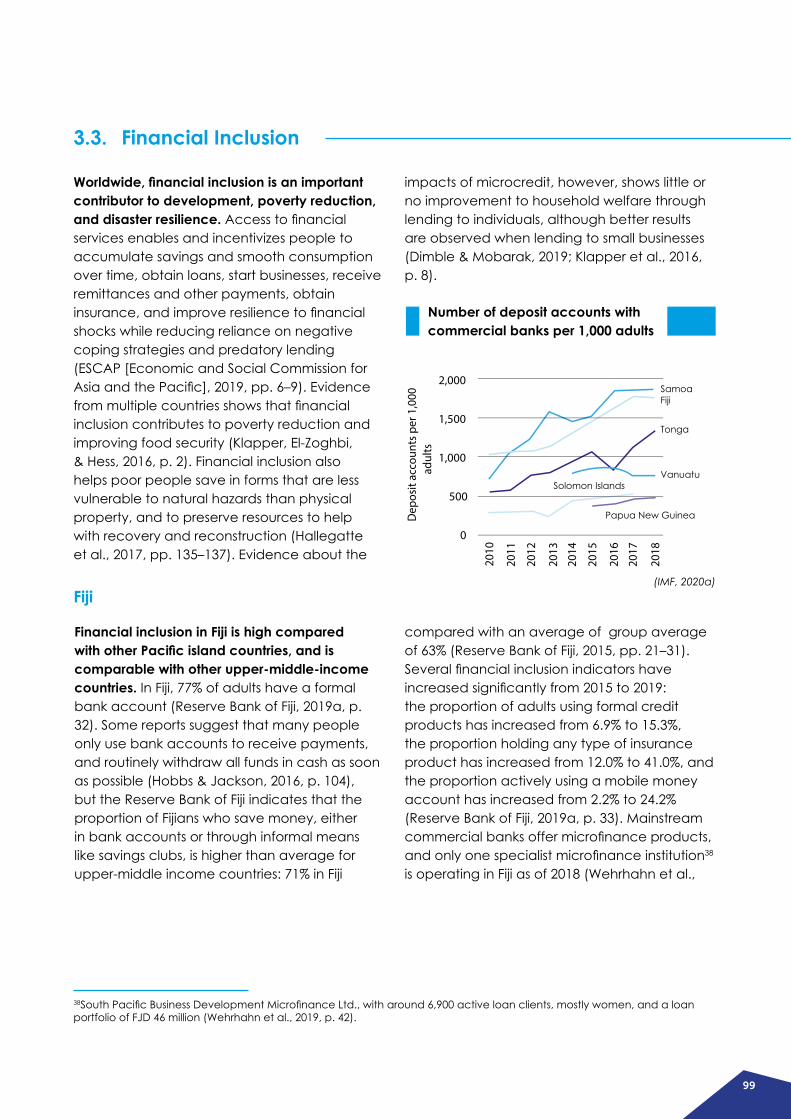
99
3.3. Financial Inclusion
Worldwide, financial inclusion is an important contributor to development, poverty reduction, and disaster resilience.Accesstofinancialservices enables and incentivizes people to accumulate savings and smooth consumption over time, obtain loans, start businesses, receive remittances and other payments, obtain insurance,andimproveresiliencetofinancialshocks while reducing reliance on negative coping strategies and predatory lending (ESCAP [Economic and Social Commission for AsiaandthePacific],2019,pp.6–9).Evidencefrommultiplecountriesshowsthatfinancialinclusion contributes to poverty reduction and improving food security (Klapper, El-Zoghbi, & Hess, 2016, p. 2). Financial inclusion also helps poor people save in forms that are less vulnerable to natural hazards than physical property, and to preserve resources to help with recovery and reconstruction (Hallegatte et al., 2017, pp. 135–137). Evidence about the
Number of deposit accounts with commercial banks per 1,000 adults
Financial inclusion in Fiji is high compared with other Pacific island countries, and is comparable with other upper-middle-income countries. In Fiji, 77% of adults have a formal bank account (Reserve Bank of Fiji, 2019a, p. 32). Some reports suggest that many people only use bank accounts to receive payments, and routinely withdraw all funds in cash as soon as possible (Hobbs & Jackson, 2016, p. 104), but the Reserve Bank of Fiji indicates that the proportion of Fijians who save money, either in bank accounts or through informal means like savings clubs, is higher than average for upper-middle income countries: 71% in Fiji
compared with an average of group average of 63% (Reserve Bank of Fiji, 2015, pp. 21–31). Severalfinancialinclusionindicatorshaveincreasedsignificantlyfrom2015to2019:the proportion of adults using formal credit products has increased from 6.9% to 15.3%, the proportion holding any type of insurance product has increased from 12.0% to 41.0%, and the proportion actively using a mobile money account has increased from 2.2% to 24.2% (Reserve Bank of Fiji, 2019a, p. 33). Mainstream commercialbanksoffermicrofinanceproducts,andonlyonespecialistmicrofinanceinstitution38
is operating in Fiji as of 2018 (Wehrhahn et al.,
Fiji
38SouthPacificBusinessDevelopmentMicrofinanceLtd.,witharound6,900activeloanclients,mostlywomen,andaloanportfolio of FJD 46 million (Wehrhahn et al., 2019, p. 42).
2,000
1,500
1,000
50020
10
2011
Dep
osit
acco
unts
per
1,0
00ad
ults
2012
2013
2014
2015
2016
2017
2018
0
(IMF, 2020a)
SamoaFiji
Tonga
VanuatuSolomon Islands
Papua New Guinea
impacts of microcredit, however, shows little or no improvement to household welfare through lending to individuals, although better results are observed when lending to small businesses (Dimble & Mobarak, 2019; Klapper et al., 2016, p. 8).
100
2019, p. 42). Savings and loan cooperatives, sugarcane cooperatives and other farming cooperatives, and communal cooperatives operate in the country, but many cooperatives that were originally set up as development initiatives have lost ground as infrastructure development has improved access to commercial markets (Wehrhahn et al., 2019, p. 42).
The relatively high level of financial inclusion in Fiji contributes to disaster resilience and is an important component of recovery efforts. The national climate vulnerability assessment notes, for example, that the fact that a large
proportion of households had access to formal banking played an important role in coping and recovery following TC Evan in 2012 (Government of Fiji, 2017b, p. 66). Following TC Winston, 98% of recipients of emergency top-up funds distributed by the government through thePovertyBenefitSchemereceivedtheirfundselectronically (Mansur et al., 2018, p. 24). The government also used Vodafone’s M-PAiSA mobile money platform to pay emergency relief into recipients’ mobile phone wallets and bank accounts through the Help for Homes program following TC Winston in 2016, and the Care for Fiji Initiative following TC Josie and TC Keni in 2018 (Prochaska et al., 2018, pp. 9–10).
The overall level of financial inclusion in Papua New Guinea is similar to that of other Pacific island countries and other lower-middle-income countries, but rural and remote areas are largely excluded. In Papua New Guinea, 37% of adults hold a commercial bank account; this is in the middleoftherangeforPacificislandcountriesand close to the average of 42% (in 2014) for lower-middle-income countries worldwide (Bank of Papua New Guinea, 2016, p. 17; World Bank, 2020a).Useofothertypesoffinancialservicesis low, with just 2% of adults borrowing from a bank39and6%havingamobilefinancialservices account (Bank of Papua New Guinea, 2016, pp. 17, 19). The 2009-2010 Household Income and Expenditure Survey reported that 16.9% of people had some form of outstanding loan obligation (including cash or in-kind loans from any sources, including informal borrowing), with the average loan size being PGK 193 (approximately USD 71) (National Statistical Office,2009,p.121).PapuaNewGuineansalsooftenuseinformalfinancialmechanismsincluding Rotating Savings and Credit
Associations, informal money lenders, wantok members (see section 3.8), and community financeschemes(BankofPapuaNewGuinea,2016, p. 16). Informal money lenders are anecdotally said to charge interest rates “as high as 50-100% fortnightly” (Ganesh, Kohli, Sinha, Arora, Patnaik, Kaushal, & Borthakur, 2016,p.75).Barrierstofinancialinclusionincludea lack of access points such as bank branches or agents, especially in rural areas; limited tailoring of products to low-income people and informal businesses and lack of data necessary for designing products; high costs of banking services;lackoffinancialliteracy;highcrimerates; and gender inequality, as women have significantlylowerlevelsoffinancialinclusionthan men (Bank of Papua New Guinea, 2016, pp. 21–25; Ganesh et al., 2016, p. 82; Sibley, Kauzi, Barker, Zhang, & Gibson, 2015, pp. 46–49). The vast majority of retail transactions, especially lower-value transactions, are made in cash (Bank of Papua New Guinea, 2016, p. 22). Financial education programs have been piloted in one technical-vocational school, with more planned, and a program aimed at
Papua New Guinea
39Another study, covering just two provinces, found that 34% of urban households and 3% of rural households reported formal borrowing, while 24% of urban households and 18% of rural households reported informal borrowing (store credit or borrowing from family, friends, or moneylenders) (Sibley et al., 2015, pp. 45–46).
101
The level of financial inclusion in Samoa is similar to other Pacific island countries and other lower-middle-income countries on most indicators. A survey led by the Central Bank of Samoa in 2015 found that 39% of adults (40% of women and 38% of men40) hold a commercial bank account; this is in the middle oftherangeforPacificislandcountriesandsimilar to the average of 42% (in 2014) for lower-middle-income countries worldwide (Central Bank of Samoa, 2015, p. 3). The number of deposit accounts with commercial banks per capitaishighcomparedwithotherPacificisland countries (IMF, 2020a), but this may be skewed somewhat by Samoa’s relatively small population. The proportion of people who reported saving money is 61%, which is above the average for lower-middle-income countries worldwide, but most people use informal savings instruments, such as saving at home or through savings clubs, and only 11% report savinginaformalfinancialinstitution(CentralBank of Samoa, 2015, pp. 27, 42). Excluding pensions, adults with bank accounts had
developing a savings habit operates in about 150 primary and secondary schools (PFIP, 2018, paras. 5–6).
Papua New Guinea’s financial services sector includes four commercial banks (Australia & New Zealand Banking Group, Bank of South Pacific,KinaBank,andWestpacBank),14licensedfinancialinstitutions(micro-banks),and 16 savings and loan societies licensed by the country’s central bank as of 2019 (Bank of Papua New Guinea, 2019). One mobile phone network, Digicel, offers mobile money services as of 2019, including sending money internationallyviaKlickExPacific(Hahm,Subhanij,&Almeida,2019,p.16),andfivecommercial banks or micro-banks also provided
average balances of WST 1,213 (USD 534) while unbanked individuals using informal savings instruments had average balances of only WST 60 (USD 26) (Central Bank of Samoa, 2015, p. 30).Useofothertypesoffinancialservicesislow,with 13% of adults borrowing from a bank and 3% having a mobile money account (Central Bank of Samoa, 2015, pp. 37–38). Discussions abouthowfinancialeducationcouldbeincluded in primary and secondary school curricula are underway, following a scoping study in 2016 (PFIP, 2018, para. 7), and an adult financialliteracyprogramcalledMoneyMinded,led by the bank ANZ, is reported to have led 44% of participants to increase saving regularly (Hahm et al., 2019, p. 19).
Financial inclusion is higher in urban Apia, among people with higher incomes, and among people in formal employment (Central Bank of Samoa, 2015, pp. 7–8). Eighty percent of unbanked Samoans say that the reason they do not have a bank account is that they do not haveenoughmoney;otherbarrierstofinancialinclusionincludelimitedfinancialliteracyand
banking services via mobile phones as of 2016 (Ganeshetal.,2016,p.81).BankSouthPacific,Westpac Bank, and ANZ Bank are developing networks of agents using smart cards and point-of-sale terminals in rural areas to extend the reach of their services (Ganesh et al., 2016, p. 77).
There is little evidence available about the extent to which financial inclusion supports disaster resilience and recovery in Papua New Guinea.Althoughfinancialinclusionissuesare discussed in the literature in relation to development in general, there appears to be little information available about the extent to whichhouseholdshavedrawnuponfinancialresources such as savings, credit, or other sourcesoffinancefollowingdisasters.
Samoa
40It is unusual for women to have higher rates of bank account ownership than men; this may be a consequence of women needing to receive remittances from male family members working overseas (Central Bank of Samoa, 2015, p. 1).
102
competence, high transaction costs and minimum balance requirements, distance and travel cost to banks, a cultural preference for using cash, the sharing of accounts among household members, and lack of necessary documentation (Central Bank of Samoa, 2015, p. 13; National Financial Inclusion Taskforce, 2017, p. 7).
Samoa’s financial services sector includes:
• Four commercial banks: ANZ, Bank South Pacific,SamoaCommercialBank,andNational Bank of Samoa (Central Bank of Samoa, 2019), all of which offer internet and mobile phone banking services, and report that the majority of their small and medium enterprise customers increasingly use internet banking (Hardin, 2020, para. 12).
• Two mobile phone operators that offer mobile money services: Digicel, which also provides internationaltransfersviaKlickExPacific(Hahmet al., 2019, p. 16), and Vodafone’s41 M-Tala service which provides international transfers from Australia via a linked service called Rocket Remit (Vodafone Samoa, 2020b, 2020a).
• Twelve money transfer operators and one money changer, with numerous associated branches and agents (Central Bank of Samoa, 2019).
• Fourmicrofinanceproviders:SouthPacificBusiness Development (the largest provider), making small loans to approximately 19,000 MSMEs owned by women; Development Bank of Samoa, offering micro-loans to farmers and female entrepreneurs; Samoa Business Hub (formerly the Small Business Enterprise Centre), offering training, business advice, loans and loan guarantees; and Women in Business Development Inc., assisting MSMEs to access
international supply chains through training, advice, mentoring, and loans (ADB, 2018b, p. 194; Hardin, 2020, pp. 1–3; Samoa Business Hub, 2019).
There is little evidence about the extent to which financial inclusion supports disaster resilience and recovery in Samoa, apart from facilitating overseas remittances. There appears to be little information available about the extent to which households have drawn upon financialresourcessuchassavings,credit,orothersourcesoffinancefollowingdisastersin Samoa. Funds available from savings are limited, however: as noted above, adults with bank accounts had average balances of WST 1,213 (USD 534) while unbanked individuals using informal savings instruments had average balances of only WST 60 (USD 26) (Central Bank of Samoa, 2015, p. 30); for context, the average household weekly expenditure in 2013 was WST 950 (Moustafa, 2016, p. 31). Following TC Evan in 2012, few households considered takingrecoveryloansfromformalfinancialinstitutions,mostcitinginsufficientcollateralanda few citing high interest rates as reasons for not borrowingmoney;microfinanceprovidershavemade loans for business purposes to women in the affected areas but details of these are not readily available; and no information appears to be available about informal loans from moneylenders or from family (Government of Samoa, 2013, p. 115). Insurance appears to play only a small role in recovery, as only 6% of Samoans have any form of house insurance and not all insurance policies cover all natural hazards (Central Bank of Samoa, 2015, p. 35). Remittances, however, do play a major role in disaster recovery (see section 3.3), and money transfer networks enable Samoans to access funds remitted by overseas family members within hours of a crisis (Le Dé, Gaillard, Friesen, & Smith, 2015, p. 657).
41Formerly BlueSky Samoa (De Rosbo, 2020).

103
The level of financial inclusion in Solomon Islands is low compared with other Pacific island countries and other lower-middle-income countries.Asurveyofpeople’suseoffinancialservices led by the Central Bank of Solomon Islands in 2015 showed that 26% of adults (20% of women and 32% of men) hold a commercial bankaccount;thisislowforPacificislandcountries and well below the average of 42% (in 2014) for lower-middle-income countries worldwide (Central Bank of Solomon Islands, 2015b, pp. 2–3). Another 8% of adults have an accountwithanothertypeofformalfinancialinstitution such as a credit union or pension fund,35%useinformalfinancialservicessuchas shop credit, moneylenders, or savings clubs, and31%donotuseanytypeoffinancialservices (ADB, 2019a, p. 3). The proportion of people who reported saving money is 87%, which is above the average for lower-middle-income countries worldwide, but only 15% report saving through a bank; most people use informal methods such as saving at home or using savings clubs (Central Bank of Solomon Islands, 2015b, pp. 14–15). Formal borrowing is limited, with only 15% of adults borrowing from a bank (Central Bank of Solomon Islands, 2015b, pp. 10, 15). Financial inclusion is higher among people with higher incomes and in formal employment, and is higher among men than women (Central Bank of Solomon Islands, 2015b, pp. 3–4). The most common reasons that people cite for not having a bank account are that they don’t have enough money (56%), they don’t know how to use a bank account (46%), that distances to banks or bank agents is a barrier (43%), that they lack the necessary documents (31%), or that
the cost is too high (18%) (Central Bank of Solomon Islands, 2015b, p. 8). The geographic reachoffinancialservicesisalsoamajorchallenge: bank branches, ATMs, and point-of-saleterminalsarelimitedtojustfivetownsinthe country, while the population is dispersed over about 300 inhabited islands (Central Bank of Solomon Islands, 2015b, p. 2; Huber & Fischer, 2020, p. 27). For businesses, access to financeisalsoconstrainedbyriskaversionatcommercial banks, unclear land rights, systemic difficultiesinusingmosttypesofcollateralforloans,lackofaninter-bankfinancialclearingsystem outside Honiara, large infrastructure gaps, and lack of business planning skills (Huber & Fischer, 2020, p. 10; Ministry of Commerce Industry Labour and Immigration, 2016, p. 2; World Bank, 2017d, p. 63). Data from 2011 indicate that 68% of MSME borrowers default on loans, leading to a high cost of credit (Ministry of Commerce Industry Labour and Immigration, 2016, p. 2); commercial banks “are effectively notinterestedinthesefirms”duetothehightransaction costs and credit risk (World Bank, 2017d, p. 63).
The financial services sector in Solomon Islands includes four commercial banks (ANZ Banking Group,BankSouthPacific,PanOceanicBank,and BRED Bank), 12 other credit companies andcreditunions,onemicrofinanceinstitution,andthenationaldefined-contributionpensionscheme(ADB,2019a,p.2).Themicrofinanceinstitution,SouthPacificBusinessDevelopment(SPBD),providessavingsandmicrofinanceservices primarily to women; at the end of 2019, clients of SPBD had 7,994 savings accounts and SBD 20 million (approximately USD 2.5 million) in
Solomon Islands
104
loans (Central Bank of Solomon Islands, 2020, p. 25). One mobile money provider, ANZ GoMoney Pacific,hasbeenoperatinginthecountrywitha large network of local shops acting as agents, although it did not support international money transfers (Hahm et al., 2019, p. 16; Huber & Fischer, 2020, p. 27); however, ANZ will withdraw the GoMoney product in November 2020, replacing it with a bank-account-linked mobile app that will support international transfers (ANZ, n.d.; Kekea, 2020). Work is underway to develop andpilot-testafinancialeducationcurriculumfor primary, secondary, and technical-vocational schools (PFIP, 2018, paras. 9–10).
There appears to be little or no evidence available about the extent to which financial inclusion supports disaster resilience and recovery in Solomon Islands. Financial inclusion rates are low and capacities of local markets are limited, especially in rural areas, and the economy is not monetized to the same extent asinsomeneighboringPacificislandcountries.There does not appear to be information available about the extent to which households drawuponfinancialresourcessuchassavings,credit,orothersourcesoffinancefollowingdisasters.
Financial inclusion in Tonga is low compared with other upper-middle-income countries, but similar to other Pacific island countries (National Reserve Bank of Tonga, 2017, p. 26). In Tonga, 41% of people aged 15 or older hold a commercial bank account, with no difference in bank account ownership between men and women (although data are not available on whether men and women might use their accounts differently); this is in the middle of therangeforPacificislandcountries,butwellbelow the average of 70% for upper-middle income countries worldwide (National Reserve Bank of Tonga, 2017, pp. 3–9). The proportion of Tongans who save money is 63%, which is the same as the average for upper middle income countries worldwide, but most people in Tonga use informal instruments, such as saving at home or through savings clubs, and only 18% report savinginaformalfinancialinstitution(NationalReserve Bank of Tonga, 2017, p. 6). Use of other typesoffinancialservicesislow,withonly9%of adults borrowing from a bank, 10% of adults using a mobile money account, and 13% having any type of insurance (National Reserve Bank of Tonga, 2017, pp. 19–25). Financial inclusion is higher among residents of the two largest islands and among people with higher incomes and in formal employment; people living in outlying islands face long journeys to
reach bank branches (National Reserve Bank ofTonga,2017,pp.6–7).Lackofidentificationis a barrier for many, as 19% of adults do not haveofficialphotoidentification,21%donothaveabirthcertificate,and7%haveneither(National Reserve Bank of Tonga, 2017, p. 12). Cash is customarily used for most transactions, 96% of agricultural income is received in cash, and even 70% of people in formal employment receive their salaries in cash (Hahm et al., 2019, p. 19; National Reserve Bank of Tonga, 2017, pp. 12–13).
Tonga’s financial services sector includes microfinance providers and one mobile money operator.ThelargestmicrofinanceorganizationinTongaisSouthPacificBusinessDevelopmentTonga, which lends to almost 5,000 people, almost exclusively women, with a total loan portfolio of more than TOP 2.2 million (Hobbs & Jackson, 2016, p. 71). The Tongan Development Bank, under the direction of the Ministry of Finance & National Planning, also operates twosmallermicrofinanceschemes:oneofthese is valued at USD 280,000 and aimed at supporting women’s groups in the outer islands, while details about the other scheme are not available (Hobbs & Jackson, 2016, p. 71). The largest mobile phone network in Tonga, Digicel, launched a mobile money service in 2011 in collaborationwiththePacificFinancialInclusion
Tonga
105
The level of financial inclusion in Vanuatu is similar to that of other Pacific island countries and other lower-middle-income countries (Reserve Bank of Vanuatu, 2016a, pp. 1, 4). In Vanuatu, 37% of adults (32% of women and 41% of men) hold a commercial bank account, which is in the middle of the range forPacificislandcountriesandsimilartotheaverage of 42% for lower-middle-income countries worldwide (Reserve Bank of Vanuatu, 2016a, pp. 1–4). The proportion of people who reporting saving money is 59% (65% of women and 53% of men), which is above the average for upper-middle-income countries worldwide, but most people use informal savings
Programme, AusAid, and the GSM (Global System for Mobile communications) Association, offering low-cost money transfers from Australia and New Zealand (John Connell, 2015, pp. 147–148) and a “Beep and Go” point-of-sale payment service using mobile phones and electronic tags, but take-up of the latter has been slow as many Tongans prefer to withdraw and use cash instead of making electronic payments (Hobbs & Jackson, 2016, p. 81).
Financial inclusion plays a limited role in disaster resilience and recovery in Tonga, apart from facilitating overseas remittances. Following TC Gita, for example, the Tonga Statistics Department surveyed all households in the main affected islands and found that only 0.8% of households whose houses were damaged by the cyclone had borrowed money for repairs from a bank, relatives, or friends (these categories were not disaggregated), 0.4% had used insurance, 4% had drawn on savings, 10% had used remittances, 14% had used current wages or business income, 67% had repaired their houses by simply reusing materials that
instruments, such as saving at home or through savings clubs, and only 21% report saving in aformalfinancialinstitution(ReserveBankofVanuatu, 2016a, pp. 16–18). Financial inclusion is higher in urban areas and among people with higher incomes; people living outside Port Vila and Luganville face long journeys to reach bank branches (Reserve Bank of Vanuatu, 2016a, pp.8–12).Lackofidentificationisabarrierformany, as 27% of adults across the country do nothaveeitherformalidentificationorabirthcertificate(ReserveBankofVanuatu,2016a,p.7).Useofothertypesoffinancialservicesislow,with 16% of adults borrowing from a bank, only 1% reporting using a mobile money account to send money and 0.7% to receive money,
they already had available (Catalán, 2018, p. 24). Banks offered low-cost (5% interest) loans but information about the number of loans made was not available (Government of Tonga, 2018b, p. 75). The government and humanitarian agencies have limited understanding of and experience using cash transfers in disaster relief, government and civil society are wary of damaging traditional community-recovery approaches and encouraging aid dependency, and there are concerns about weakly functioning markets andfinancialservices,especiallyontheouterislands (Hobbs & Jackson, 2016, p. 65; IFRC, 2018b, p. 6). However, there is a foundation of financialinfrastructureandsocialprotectionexperience in the country and there have been pilots of cash transfer programs using the government’s existing social protection programs (the Social Welfare Program for the Elderly and the Disability Welfare Scheme) to make payments42 after TC Gita, suggesting thatthereispotentialforfinancialinclusiontoplay a larger role (Hahm et al., 2019; Hobbs & Jackson, 2016).
Vanuatu
42Payments under this scheme were originally made directly into bank accounts, but at some point the practice switched tomakingpaymentspersonallyincash,apparentlyattherequestofbeneficiarieswhofeltthatreceivingcashinhandgave them more control (Hobbs & Jackson, 2016, p. 71).

106
and 5% having any type of insurance (Reserve Bank of Vanuatu, 2016a, pp. 27, 32–39). Cash is customarily used for most transactions: 100% of adults who work in agriculture and 69% of those who work in the private sector receive their income in cash (Hahm et al., 2019, pp. 19–20; Reserve Bank of Vanuatu, 2016a, p. 7; Rust, 2019, p. 10), and only 0.2% of MSMEs use electronic payments (Reserve Bank of Vanuatu, 2016b, p. 39). A survey of MSMEs found that only 8% use internet banking (25% of those in urban areas, but only 3% of those in rural areas) (Reserve Bank of Vanuatu, 2016b, pp. 39–40).
The financial services sector includes two microfinance providers and two mobile money service operators.Twomicrofinanceorganizations operate in the country: VANWODS Microfinance(VanuatuWomenDevelopmentScheme),anon-profitcharitableorganization
Worldwide, insurance is as an important tool for managing risks associated with natural hazards, but the Pacific region is “one of the least insured regions in the world” (Leith & Subramanian, 2013, p. 9). The insurance penetration rate43 in the region is 3.6% (Leith & Subramanian, 2013, p. 9), which is well below the average of 8.9% in Organisation for Economic Co-operation and Development (OECD) countries (OECD, 2020). Barriers to uptake include affordability, inadequate disaster risk mitigation measures, insufficientbaselineinformationfordesigninginsurance products, limited availability of reinsurance, consumer awareness and cultural issues, lack of trust, inadequate building codes andcertificationmechanisms,lackofpublicasset registers, aid dependence, and weak mechanisms for distributing pay-outs (Lucas, 2015, pp. 4–5). There is both limited demand for and limited availability of insurance products in the region, and many communities have limited
offering various small-scale savings and loan products to individuals and small businesses (Reserve Bank of Vanuatu, 2016a, p. 2; VANWODSMicrofinance,n.d.);andSouthPacificBusinessDevelopmentMicrofinance(SPBD),aninternationalmicrofinanceorganizationthatoperatesinfivecountries,primarily working with women and supporting micro-enterprise development, savings, life insurance, and loans for education and housing (SouthPacificBusinessDevelopment,n.d.).Twomobile money service providers are operating asof2019:ANZGoMoneyPacific,aserviceofthe Australian bank ANZ, and M-Vatu, operated by Telecom Vanuatu Limited in association with Vodafone Fiji; neither service supports international money transfers (Hahm et al., 2019, p.16;PacificFinancialInclusionProgramme,2019).
accesstofinancialinstitutions(ADB,2018a,p.18). MSMEs, in particular, are often overlooked by insurance companies and regulators, and it is rare for insurance products to be tailored tothespecificneedsofthesmallestbusinesses(Chatterjee & Wehrhahn, 2017, pp. 3–4).
Insurance may not be cost-effective for the poorest of the poor, and is not an appropriate approach for frequently recurring events or for slow-onset, highly predictable events (Germanwatch, 2020, pp. 18–19; Schaefer & Waters, 2016, pp. 50–51; Warner, Kreft, Zissener, Höppe, Bals, Loster, Linnerooth-Bayer, Tschudi, Gurenko, Haas, Young, Kovacs, Dlugolecki, & Oxley, 2012, p. 13). Microinsurance has generally been considered unsuitable for covering risks associated with natural hazards, which affect many people simultaneously, because of the large capital reserves required and the high cost of assessing claims (Ramachandran & Masood, 2019, p. 11).
3.4. Insurance
43An indicator of insurance industry development, calculated as the ratio of total insurance premiums to GDP.
107
In Fiji, the majority of middle- and low-income households have no insurance protection of any kind, including against natural hazards (PCRAFI, 2015a, p. 17; Wehrhahn et al., 2019, p. 37). Fiji’s insurance penetration rate was 3.4% in 2018 (Reserve Bank of Fiji, 2019b, p. 12), and only about 6% of households and 17% of commercial properties have any type of property insurance (Mahul, Cook, & Bailey, 2015, p. 52) – and these rates are for basic coverage that does not necessarily provide protection against major disasters. Cyclone insurance is only available as an extension to basic property coverage and requirescertificationbyaqualifiedengineer,which is a barrier that makes many homes uninsurable, and earthquake and tsunami coverage are also optional extras (PCRAFI, 2015a, p. 18; Wehrhahn et al., 2019, p. 26). Property insurance rates for cyclone cover are only 0.3%, and for earthquakes 0.08% (PCRAFI, 2015a, p. 18). Insurance coverage is more common among larger businesses and in the tourism industry, but very low among low- and middle-income households (Wehrhahn et al., 2019, p. 37). Fiji’s insurance industry is small, has limited capacity, and tends to be conservative compared with international norms (Wehrhahn et al., 2019, pp. 25–26). Low standards in the construction industry, including weak training andcertificationsystemsfortradespeople,arealso a barrier to insuring properties (Wehrhahn et al., 2019, p. 27).
Microinsurance products currently available in Fiji do not cover property damage arising from natural hazards. Three microinsurance products were available as of 201944 providing various combinations of life insurance, funeral benefit,personalaccidentcover,firecover,and hospitalization cover (Wehrhahn et al., 2019, pp. 52–53), but these products do not include protection against natural hazards such ascyclones,floods,ordroughts,anddonotinclude crop insurance (Prochaska et al., 2018, p. 8). Fiji’s insurance market does not have the financialcapacityorexpertisetounderwriterisks associated with natural hazards that affect many people simultaneously (Prochaska et al., 2018, p. 8).
Fiji does not have any form of agricultural insurance (FAO, 2014, cited in Martyn & Rogers, 2016, p. 62; Wehrhahn et al., 2019, p. 27). The government has provided some funds to farmers to support rehabilitation of agriculture in response to past disasters, but FAO estimates that this has only covered 3% of the value of the losses suffered (FAO, 2014, cited in Martyn & Rogers, 2016, p. 62). One example of ad hoc support that was offered to sugarcane farmers following TC Winston was that the Sugar Cane Growers’ Fund, which lends money for working capital and investment purposes, restructured loans and offered grants of up to FJD 10,000 to almost 4,000 growers (Wehrhahn et al., 2019, p. 31).
Fiji
44Microinsurance from FijiCare (http://www.fijicare.com.fj/Pages/MicroInsurance) and Microlife from Life Insurance Corporation of India (http://www.licifiji.com/pages.cfm/products/microinsurance) are available, but the third provider, BIMA (https://www.bima.com.fj),hascloseditsoperationsinFiji.FijiCarewasdevelopedinpartnershipwiththePacificFinancial Inclusion Programme.
108
In Papua New Guinea, the vast majority of people and businesses have no property insurance (Bank of Papua New Guinea, 2016, p. 29). The insurance penetration rate in Papua New Guinea is 1.4%, less than half the3%averagefortheAsia-Pacificregion(Oxford Business Group, 2019b). A study that examined two rural provinces (Morobe and Madang) found that less than 2% of households had either house or motor vehicle insurance, and anecdotal evidence indicates that rates of coverage are low all across the country (Sibley et al., 2015, p. 46). Anecdotal evidence suggests that virtually all local insurance is sold in the two largest cities, Port Moresby and Lae, with only “micro-percentages” in smaller towns and in rural areas, and large-scale extractive industry facilities generally being insured outside the country (Oxford Business Group, 2019a). Demand for insurance is low, partly because people rely mostly on strong community support systems (see section 3.8) (Ganesh et al., 2016, p. 75; Oxford Business Group, 2019b) although life and health micro-insurance packages are available in the market45.
The insurance market for natural hazards is hampered in part by the high frequency of damaging events, which are making reinsurance increasingly expensive. The risks are “considered too great for the private sector or the government to bear” and “the reinsurance market is hardening amid resistance to extend
coverage to the country’s most disaster-prone regions… access to sustainable reinsurance is viewed by some industry stakeholders as the largest constraint to the development of PNG’s insurance sector” (Oxford Business Group, 2020).
No agricultural insurance products currently exist in Papua New Guinea, but a 2013 “pre-feasibility” study suggested that there could be potential to develop insurance products for some cash crops. A World Bank study (Mahul, KC, Stutley, Oliver, Kunda, & Siri, 2013) on the feasibility of crop and livestock insurance in Papua New Guinea noted that no agricultural insurance products were available in the country, and that the domestic insurance industry, farmers, and regulators lacked experience in this area. Barriers to developing agricultural insurance products include a lack of agricultural production data and meteorologicaldata,limitedfinancialresourcesoffarmers,limitedfinancialcapacityofinsurersandpotentialdifficultiesobtainingreinsurancecapacity, and a lack presence of insurance companies in rural areas. The study concluded that there may be potential to develop indemnity-based or parametric insurance products to cover some cash crops (oil palm, rubber and possibly cocoa) against perils such as cyclones, wind, rain, volcanic eruption, or fire;theremayalsobepotentialforthenationalgovernment to take insurance coverage against drought.
Papua New Guinea
45In one unfortunate example, the insurance company BIMA and the Digicel mobile phone network launched a mobile-basedmicro-insuranceproductthatsold800,000policiesinthefirsttwoandahalfyears(OxfordBusinessGroup,2019b), but then experienced problematic levels of fraudulent claims that led to the company withdrawing from the country (Oxford Business Group, 2020). Other life and health micro-insurance packages continue to be sold, typically in partnerships between micro-banks and insurance companies.
109
In Samoa, the majority of people and businesses have no insurance coverage against natural hazards. The non-life insurance penetration rate in Samoa was 2.5% in 2012 (PCRAFI, 2015b, p. 31), which is slightly below theaverageforthePacificregion;anIMFreport estimates a somewhat lower rate of 1.2% in 2013 (IMF, 2015, para. 8). One study reported that 21% of Samoans have insurance coverage (mostly life insurance or accident coverage), only 6% have home insurance, and that 39% of uninsured adults do not know what insurance is (Central Bank of Samoa, 2015, pp. 32–37). Another study suggests higher levels of insurance coverage, reporting that approximately 20% of businesses and 10% of residential properties have cyclone insurance, and that the government insures major public buildings but not other infrastructure assets such as bridges and roads (PCRAFI, 2015b, p. 29). Following the 2009 tsunami, the government’s post-disaster needs assessment noted that “it appears that housing insurance has been totally absent” in the areas affected (Government of Samoa, 2009, p. 37), and when TC Evan struck in 2012, only 8.3% of the value of the damage incurred by tourist accommodation properties and cultural heritage sites was insured
(Government of Samoa, 2013, p. 33). Cyclone insurance is available in the market, subject to an engineer certifying compliance with cyclone standards (storm surge is normally excluded), and coverage for earthquakes and tsunamis is normally included automatically (PCRAFI, 2015b, pp. 29, 31).
The insurance market in Samoa is small but competitive (PCRAFI, 2015b, p. 29). As of 2018, the market includes six insurance companies (DeseretMutualBenefit,SamoaLifeAssuranceCorporation,NationalPacificInsuranceLimited, Progressive Insurance Limited, Apia Insurance Company Limited, and Federal PacificInsuranceLimited)aswellasfourinsurance brokers and 17 insurance agents (Central Bank of Samoa, 2019). The Central Bank of Samoa regulates national companies and the Samoa International Finance Authority regulates international insurance companies operating in the country (PCRAFI, 2015b, p. 29). The IMF argues that regulatory arrangements are unsatisfactory due to a lack of technical capacity on the part of the regulator and inadequatefinancialreportingandauditingpractices (IMF, 2015, para. 43). Approximately 15% of the market is insured with overseas companies (PCRAFI, 2015b, p. 29).
Samoa

110
In Solomon Islands, the vast majority of people and businesses have no insurance coverage against natural hazards. The non-life insurance penetration rate in Solomon Islands was 1.3% in 2012,whichislowcomparedwithotherPacificisland countries (PCRAFI, 2015c, pp. 18, 33). Only 7% of Solomon Islanders report having insurance coverage, and only 9% of those have home insurance; most coverage consists of life, vehicle, or health cover (Central Bank of Solomon Islands, 2015b, p. 18). More than half of all adults say that they do not know what insurance is (Central Bank of Solomon Islands, 2015b, p. 18). The government has no insurance in place for government assets, but some state-owned enterprises do have insurance including earthquake and cyclone perils (PCRAFI, 2015c, p. 38). Insurance against cyclone and earthquake damage is commercially available
In Tonga, most people and businesses have no insurance coverage against natural hazards. The non-life insurance penetration rate in Tonga was only 0.9% in 2012 (Mahul et al., 2015, p. 23), whichiswellbelowtheaverageforthePacificregion. Only 13% of adults report having any form of insurance (mostly life and health cover), while 22% report that they are unfamiliar with what insurance is (National Reserve Bank of Tonga, 2017, pp. 25, 36). Even motor vehicle insurance is not mandatory, which is unusual amongPacificislandcountries(PCRAFI,2015d,p. 16). Coverage for earthquakes is typically included in property insurance policies, but coverage for cyclones is not included although it is available as an extension; insurance rates for cyclone (0.25%) and earthquake (0.15%) perils areaverageforPacificislandcountries(PCRAFI,2015d, p. 16). Insurers only cover properties
and–unusuallyforPacificislandcountries–isautomatically included in insurance products without any preconditions such as an engineer’s report (PCRAFI, 2015c, pp. 18, 36).
The insurance market in Solomon Islands is limited in capacity. There are four licensed insurance companies, four insurance brokers, and two insurance agents in the country (ADB, 2019a, p. 2). The Central Bank of Solomon Islands licenses and regulates the industry (PCRAFI, 2015c, p. 32). Almost half (48%) of the market premium is placed with offshore insurers (PCRAFI, 2015c, p. 34). The Central Bank of Solomon Islands is seeking to support the development of micro-insurance products for rural households, but as of 2019, this objective “has not been progressed due to the challenge of interested players to provide this product” (Central Bank of Solomon Islands, 2020, p. 26).
withanengineer’scertificationofcompliancewith cyclone wind loads (PCRAFI, 2015d, p. 15). Tonga has a national building code based on Australian and New Zealand standards, and although commercial buildings are inspected, there is a lack of supervision of residential construction (PCRAFI, 2015d, p. 34). Tonga has no legislation in place to regulate its insurance industry, which means that the solvency of domestic insurers is not assessed and there is a lack of consumer protection (PCRAFI, 2015d, p. 15), although relevant legislation was being drafted as of 2019 (National Reserve Bank of Tonga, 2019, p. 23).
Only a small number of households and businesses have benefited from insurance following recent disasters, likely because of low insurance penetration especially in outlying islands. Because Tonga has no insurance
Solomon Islands
Tonga

111
In Vanuatu, the vast majority of people and businesses have no insurance coverage against natural hazards. The non-life insurance penetration rate in Vanuatu was 2.1% in 2012 (PCRAFI, 2015e, p. 32), which is below the averageforthePacificregion.Only5%ofadults have any kind of insurance, and this is mostly vehicle, health, or life cover; only 14% of people who do have insurance have coverage for their homes (Reserve Bank of Vanuatu, 2016a, pp. 27, 39). Nearly half (48%) of adults state that they do not know what insurance is (Reserve Bank of Vanuatu, 2016a, pp. 27, 39). Only 23% of MSMEs (58% in urban areas, 13% in rural areas) have any kind of insurance coverage (Reserve Bank of Vanuatu, 2016b, p. 42). Sources in the insurance industry estimate that 80% of clients are in Port Vila and the island of Efate, with 15% in Luganville and only 5% spread throughout the rest of the country (PCRAFI, 2015e, p. 34); the government concurs that there is virtually no insurance in the outer islands, no insurance in the agriculture sector, and no insurance products designed for MSMEs (Government of Vanuatu, 2015b, pp. 26–27). Insurance against cyclone and earthquake damage is commercially available, but cyclone insurance is not automatically included in standard property coverage and is available only by extension, and only for properties with anengineer’scertificationofcompliancewith
regulator, good data on insurance claims are not available (PCRAFI, 2015d, p. 33). However, the 2009 tsunami which destroyed 31% of all houses on the island of Niuatoputapu as well as causing extensive damage to other property (Kingdom of Tonga, 2009, p. 6) is reported to have generated no insurance claims at all (PCRAFI, 2015d, p. 33), likely because of a lack of insurance coverage. TC Ian caused property damage estimated at USD 49 million in 2014, but insurance industry sources indicate that only 70 insurance claims have been made, totaling an estimated USD 660,000 (1% of the
standards for cyclone wind loads (PCRAFI, 2015e, pp. 31–34). Following TC Pam, “many business owners who had not procured cyclone insurance folded in the aftermath of the storm, unabletoreinvestsufficientsavingsintheirbusinesses or to tap sources of credit” (WTO, 2019b, p. 31).
The insurance market in Vanuatu is constrained by its small size and by the difficulty and cost of obtaining reinsurance coverage from the global market. The market currently includes three local insurance companies (QBE Insurance, VanCare Insurance, and Tower Insurance), two external insurance companies (Capital Insurance and Lloyds Australia), and several additional agents, brokers, and managers, all licensed and regulated by the Reserve Bank of Vanuatu (Reserve Bank of Vanuatu, 2020). The market has limited capacity and regulatory requirements and high premiums inhibit obtaining coverage from overseas insurers (PCRAFI, 2015e, pp. 32–34). Insurance companiesinVanuatuhavefaceddifficultiesfollowing recent disasters due to the scale of lossessuffered:afterCycloneUmain1987,fiveof the eight insurance companies operating at the time had to close, and after an earthquake in2002,twoofthefiveinsurersoperatinghadtoclose,inbothcasesduetodifficultyobtainingadequate reinsurance coverage (PCRAFI, 2015e, p. 37).
total damage), also due to the low levels of insurance coverage (PCRAFI, 2015d, p. 33). In 2018, TC Gita struck Tongatapu and ’Eua, where the commercial activity of the country is concentrated, and approximately 30% of businesses affected by the cyclone reported that they had some form of insurance coverage (Government of Tonga, 2018b, p. 53). Among tourism accommodation businesses, 61% reported some form of insurance coverage, but only 44% were covered for cyclone damage (Government of Tonga, 2018b, pp. 53, 63).
Vanuatu
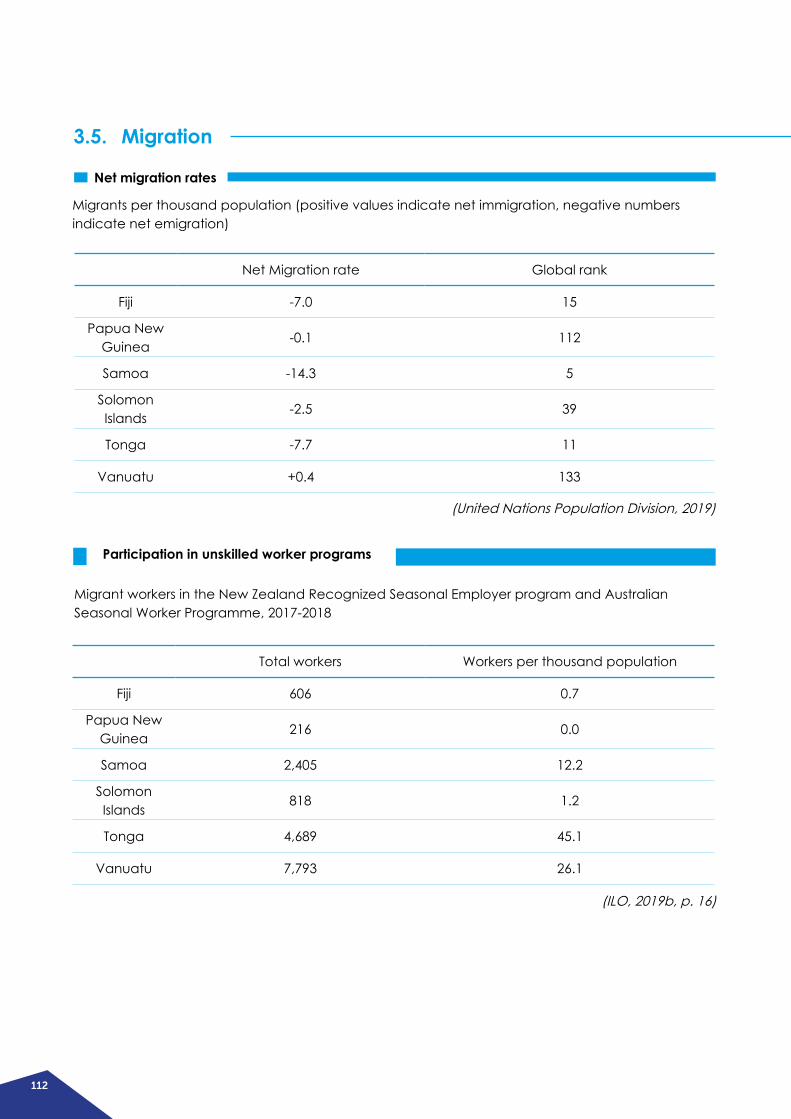
112
3.5. Migration
Net migration rates
Participation in unskilled worker programs
Migrants per thousand population (positive values indicate net immigration, negative numbers indicate net emigration)
Migrant workers in the New Zealand Recognized Seasonal Employer program and Australian Seasonal Worker Programme, 2017-2018
Net Migration rate Global rank
Fiji -7.0 15
Papua New Guinea
-0.1 112
Samoa -14.3 5
Solomon Islands
-2.5 39
Tonga -7.7 11
Vanuatu +0.4 133
Total workers Workers per thousand population
Fiji 606 0.7
Papua New Guinea
216 0.0
Samoa 2,405 12.2
Solomon Islands
818 1.2
Tonga 4,689 45.1
Vanuatu 7,793 26.1
(United Nations Population Division, 2019)
(ILO, 2019b, p. 16)
113
Globally and across the Pacific, migration both within a country and internationally is recognized as a positive adaptation strategy in response to natural hazards and environmental change (Melde & Laczko, 2017, p. 85). Voluntary, well-managed migration of individuals and communities can enhance the adaptive capacity of the migrant-sending community by generating remittances, reducing population pressure, and transferring knowledge and skills (Campbell & Warrick, 2014,p.3).Inonestudyoffivecountriesaround the world, migration in response to environmental change was linked to positive impacts on income and employment and a higher likelihood of adopting future preventive measures including using better building materials; “migrant households surveyed overwhelmingly indicated that migration had beneficialoutcomes”(Melde&Laczko,2017,pp. 86, 88). The ILO reports that across the Pacific,labormigrationhasproducedbenefitsincluding employment, remittances, and increased education and skills development, although some countries have also suffered from the loss of skilled workers where migration
has been permanent rather than temporary or seasonal (ILO, 2019b, pp. vi–vii). The primary reasons for individuals to migrate are to seek economic opportunities and to strengthen kinship ties; climate change impacts are only a major driver of migration when they cause damagingeventssuchasseverefloodingorcyclones, or undermine livelihoods (Campbell & Warrick, 2014, p. 10; ILO, 2019a, p. 16). However, although the media and international community sometimes focus on extreme climate change scenarios that anticipate large-scale international population movements, such scenarios are not yet a reality and Pacificislandersrejecttheimageof“climaterefugees”, preferring instead to emphasise positive adaptation strategies (Campbell & Warrick, 2014, p. 9). Samoa, Tonga, and Fiji have particularly high rates of emigration (ranking among the top 15 migrant-sending countries in the world by proportion of their population). GovernmentsofallPacificislandcountriesgenerally seek to increase their numbers of migrants to ease local labor market pressures, increase remittances, and facilitate skills transfers (ILO, 2019b, p. 38).
114
Fiji is a high labour mobility country, sending significant numbers of migrants to work overseas, including many in skilled roles. Fiji’s estimated net emigration rate in the period 2015 - 2020 is -7.0 per thousand people, the 15th highest in the world (United Nations Population Division, 2019). Fiji’s diaspora is estimated at 222,600 people as of 2019 (IOM, 2020), which is 25% of the country’s population. Fiji participates in the principal regional programs for unskilled seasonal labor migration, New Zealand’s Recognised Seasonal Employer scheme and Australia’s Seasonal Worker Programme, but secures relatively few places on these programs (606 workers in 2017-2018, or 0.7 workers per thousand population) compared with the most successful countries in the region, Tonga, Vanuatu, and Samoa. The country also has accesstotheNewZealandPacificAccessCategory visa lottery scheme, which offers 250 places per year to Fijians (ILO, 2017a, p. 9, 2019b,p.2).Moresignificantly,however,“Fijihasthe most advanced education and skills training systemsinthePacificregion”(ILO,2019b,p.20) and has made good progress in aligning nationaltrainingschemeswithqualificationframeworks in Australia and New Zealand (ILO, 2019b, p. 23), which have enabled it to become oneofthefewPacificislandcountriesableto access opportunities for skilled workers in Australia, New Zealand, and elsewhere (Curtain, Dornan, Doyle, & Howes, 2016, pp. 17–18; ILO, 2019b, pp. 3, 20). Fiji has also been able to accessopportunitiesoutsidethePacificregion,for example sending more than a thousand migrants per year to work for private military
and security companies in the Middle East (these data cover the period from 2006-2011) andelsewhereinthePacificregionaswellassome 450 athletes playing professional rugby in New Zealand, Australia, Europe, and elsewhere (ILO, 2019b, pp. 16, 20; Kanemasu & Molnar, 2017, p. 158). There are concerns that migration of skilled workers could potentially lead to “brain drain” in Fiji if skilled workers do not return or are not replaced (Curtain et al., 2016, pp. 35–36; ILO, 2019b, p. 37). There are indications that the current rate of outward migration is slowing and “further declines are anticipated based on current trends” (Government of Fiji, 2017a, p. 12).
Demand for rural-urban migration is likely to increase, driven by economic pressures and climate change (Campbell & Warrick, 2014, p. 3). Rural-urban migration trends are strong across the region and are expected to increase, with climate change expected to accelerate the growth of towns and cities, which could strain the capacity of urban areas to cope with the impacts of climate change and lead in turn to increased demand for international migration (Campbell & Warrick, 2014, pp. 2, 28). In Fiji, 54% of the population is located in three main urban areas, and the urban population is expected to rise to 61% in the next twenty years (Government of Fiji, 2017b, p. 41, 2017a, p. 12). Rural-urban migration is driven primarily by income differentials: average urban household income is approximately double average rural household income (Government of Fiji, 2017b, p. 41).
Fiji
115
Papua New Guinea sends very few migrant workers overseas. Papua New Guinea has performed very poorly in accessing seasonal worker programs in Australia and New Zealand, theprincipaldestinationsforPacificislandmigrant workers (ILO, 2017a, p. 12). For example, in 2017 18, Papua New Guinea sent only 230 workers overseas, while countries like Tonga and Vanuatu, with much smaller populations, secured around 5,000 and 8,000 placements, respectively (Curtain, 2018, p. 2). This difference in success rates is attributed to Tonga and Vanuatusecuringfirst-moveradvantagesby getting involved in these programs early; differences in the recruiting process, which in the smaller countries is organized by employers through their own agents or returning workers but in Papua New Guinea is organized by a governmentofficewhichhasbeenlessefficientand effective; employer dissatisfaction with workers’ skills and productivity; lack of publicity about opportunities; and cost barriers that hinder recruitment from rural areas (Curtain, 2018, pp. 5–12; ILO, 2019b, pp. 31–32). Other
Migration is a well-established strategy in Samoa for seeking economic opportunities for both skilled and unskilled workers. Samoan families strategically organize sending family members overseas, including selecting where to go and what sorts of opportunities to pursue, and even choosing to send different family members to different places to diversify risk (John Connell, 2015, p. 133). From 2015 to 2020, Samoa’s net migration rate is estimated at -14.3 per thousand people, which is the fifth-highestemigrationrateintheworldamong 201 countries and territories surveyed
authors suggest that cultural attachment to the land makes emigration an option that is not readily considered; immigration policies of the dominant powers in the region have historically deterred emigration from Papua New Guinea and other Melanesian46 countries; and that weak education systems, labor markets, and the limited extent of formal employment in Papua New Guinea have limited people’s ability to acquire appropriate education, skills, and experience to take up international opportunities (Montoya & Au, 2013, pp. 7–11, 16). The Papua New Guinea government supports migration by maintaining a “work-ready pool” of about 1,500 candidates and providing two weeks of pre-departure training for those who are selected (ILO, 2019b, p. 31; Voigt-Graf, 2017, pp. 11, 13), although interviews with one cohort of workers suggests that the selectionprocessisinfluencedbypersonalconnections and that in practice they only attended one or two days of training (Voigt-Graf, 2017, pp. 13, 37).
(United Nations Population Division, 2019). The total number of Samoan migrants abroad was estimated by IOM as approximately 124,000 people in mid-2019, which is 63% of the population of the country (IOM, 2020); other authors suggest that “there are more Samoan-born Samoans living abroad than in the country itself” (John Connell, 2015, p. 129; Le Dé, Gaillard, Friesen, Pupualii, Brown, & Aupito, 2016, p. 133). The broader diaspora with ties to Samoa, including ethnic Samoans born overseas, is even larger: for example, there are currently 183,000 ethnic Samoans living in New Zealand (Statistics New Zealand, 2020).
Papua New Guinea
Samoa
46MelanesiaisageographicandculturalregionofthesouthwestPacificthatincludesPapuaNewGuinea,Fiji,Vanuatu,Solomon Islands, New Caledonia, and parts of Indonesia.
116
Solomon Islands is a “low labor mobility” country, sending very few migrant workers overseas compared with neighboring Pacific island countries. Solomon Islands has had severely restricted access to external labor markets and one of the lowest rates of outward migration in the world (Curtain et al., 2016, p. 1). The total number of emigrants from Solomon Islands is estimated at about 4,200 people, or about 0.6% of the population (IOM [International Organization for Migration], 2020). Lowlevelsofmigrationarepartlyinfluencedbyhistorical factors including colonial policies and post-colonial immigration policies in the region (Craig & Bedford, 2013; Curtain et al., 2016, p. 2), but are also linked to low levels of education, English literacy, and formal employment experience which do not prepare workers well for overseas opportunities (Curtain et al., 2016, p. 34; World Bank, 2017d, p. 68). Solomon Islandsmissedgaining“firstmoveradvantage”(compared with neighboring countries) in taking advantage of important regional temporary worker programs (New Zealand’s Recognized Seasonal Employer program and Australia’s Seasonal Worker Programme), and had inadequate arrangements for sending migrant workers when the Seasonal Worker Programme
Government policy in Samoa actively supports migration.SamoaisoneofthreePacificcountries (the other two are Kiribati and Tuvalu) that have adopted national labor migration policies setting out protection principles for migrant workers, outlining the responsibilities of government to ensure support for migrants, and developing strategies to increase safe labor migration (ILO, 2019b, p. 39). Samoa has benefitedfromlabormigrationprogramsinAustralia and New Zealand, especially New Zealand’s Recognised Seasonal Employer program, for which the government maintains a “work-ready list” of candidates (John Connell, 2015, p. 122), and its Samoan Quota visa lottery
was launched, “causing reputational damage amongemployersthathasbeendifficulttoovercome” (World Bank, 2017d, p. 68).
The Solomon Islands government is actively promoting labor migration and seeking to dramatically increase the number of workers overseas. The government notes that labor migrationproducessignificantbenefitsforaddressing unemployment, generating income and increasing GDP, developing skills, increasing social development, and alleviating poverty (Solomon Islands Government, 2018, p. 5). A Labour Mobility Unit has been established to oversee and regulate the system for labor mobility, work with national stakeholders and registered recruiters, undertake marketing efforts overseas, provide health screenings for workers, and support workers through pre-departure briefingsandtrainingaswellaspastoralcare(Solomon Islands Government, 2018, pp. 9–15). In 2017-2018, Solomon Islands sent 665 workers to New Zealand, 175 workers to Australia, and 30 to Canada through labor mobility schemes, and the country has an ambitious target of increasing the total number of labor migrants by more than six times by 2023 (Solomon Islands Government, 2018, pp. 5, 8).
program, which grants permanent residence to 1,100 Samoans per year (ILO, 2017a, p. 9; New Zealand Immigration, 2020). The migration of unskilled workers has been deliberately encouraged by the government, which has also sought to increase local skills to make migrants more competitive (John Connell, 2015, p. 154). Samoa is negatively affected by the loss of skilled workers, notably in the health and education sectors, but skilled workers send remittances which are sustained for a long time, and on balance “the economic costs of skilled migration are… probably outweighed by the benefits”(JohnConnell,2015,pp.150–154).
Solomon Islands

117
Migration is a well-established and deliberate strategy in Tonga for seeking economic opportunities for both skilled and unskilled workers (John Connell, 2015). The population of Tonga declined from 2011 to 2016 by 2.6%, which is largely attributable to emigration (Government of Tonga, 2018a, p. 5). Between 2010 and 2015, Tonga had a net migration rate of -25.4 per thousand people, which was the second-highest emigration rate in the world (second only to Syria); in the period 2015-2020 emigration slowed to -7.7 per thousand, placing Tonga 11th in the ranking of emigrant-sending countries worldwide (United Nations Population Division, 2019). Tonga now has a diaspora that is approximately the same size as the entire population of the country (WTO, 2019b, p. 8) which not only sends large amounts of money as remittances (see section 3.3), it also has a major effect on the tourism industry: in 2013, at least 42% of international passengers arriving in Tonga were members of the diaspora visiting friends and relatives (the actual percentage
Vanuatu does not have a history of overseas migration for economic opportunities, but numbers of temporary migrants, especially seasonal workers, are increasing. Vanuatu has historically had few migration outlets, but has been sending increasing numbers of temporary workers overseas since the launch of New Zealand’s Recognised Seasonal Employer scheme in 2007 and Australia’s Seasonal Worker Programme in 2012 (ILO, 2019b, pp. v, 2, 37). For example, Vanuatu’s share of visas under the Australian Seasonal Worker Programme has increased from 8% in 2012-13 to 40% in 2017-18, amounting to 3,350 visas (Government of Vanuatu, 2015b, p. 89; Howes, 2018). Direct recruitment of workers for overseas employment is supported by the Vanuatu Department of Labour, which maintains “a work-ready pool of workers” (ILO, 2019b, p. 31). Vanuatu’s
may be higher) (Perrottet & Garcia, 2016, p. 11). There is rural-urban migration from the outer islands to the core island of Tongatapu: net migration between 2011 and 2016 amounted to 1.2% of the population of Tongatapu in 2016 (Tonga Statistics Department, 2017a, pp. 13, 64–65) although the population of Tongatapu still dropped by 1.1% over the same period due to emigration overseas (Tonga Statistics Department, 2017a, p. 10; United Nations Population Division, 2019). Emigration of skilled workers leads to skill shortages in Tonga, although this “brain drain” is partially offset by return migration and largely offset by remittances, to the extent that the economic costs of skilled migration may be balanced or evenoutweighedbythebenefits;emigrationof unskilled workers, on the other hand (mostly to Australia and New Zealand), is considered asignificantoverallbenefitandhasbeendeliberately encouraged (John Connell, 2015, pp. 153–154).
overseas diaspora is estimated at about 7,300 people or 2.5% of the population (IOM, 2020), mostly in neighboring New Caledonia (ILO, 2019b, p. 21). A small-scale study of the effects of migration on food security in one village on Epi island found that migration reduced the availability of labor for agricultural production, and that remittances enabled and encouraged purchasing of food, including imported food, leading many households with migrant family members to abandon agriculture altogether and seek other income-earning opportunities (Craven & Gartaula, 2015). Rural-urban migration is a strong trend in Vanuatu, driven partly by environmental changes in places of origin, but also by people seeking jobs, education, health care, and other services (NDMO, 2018, p. 11).
Tonga
Vanuatu
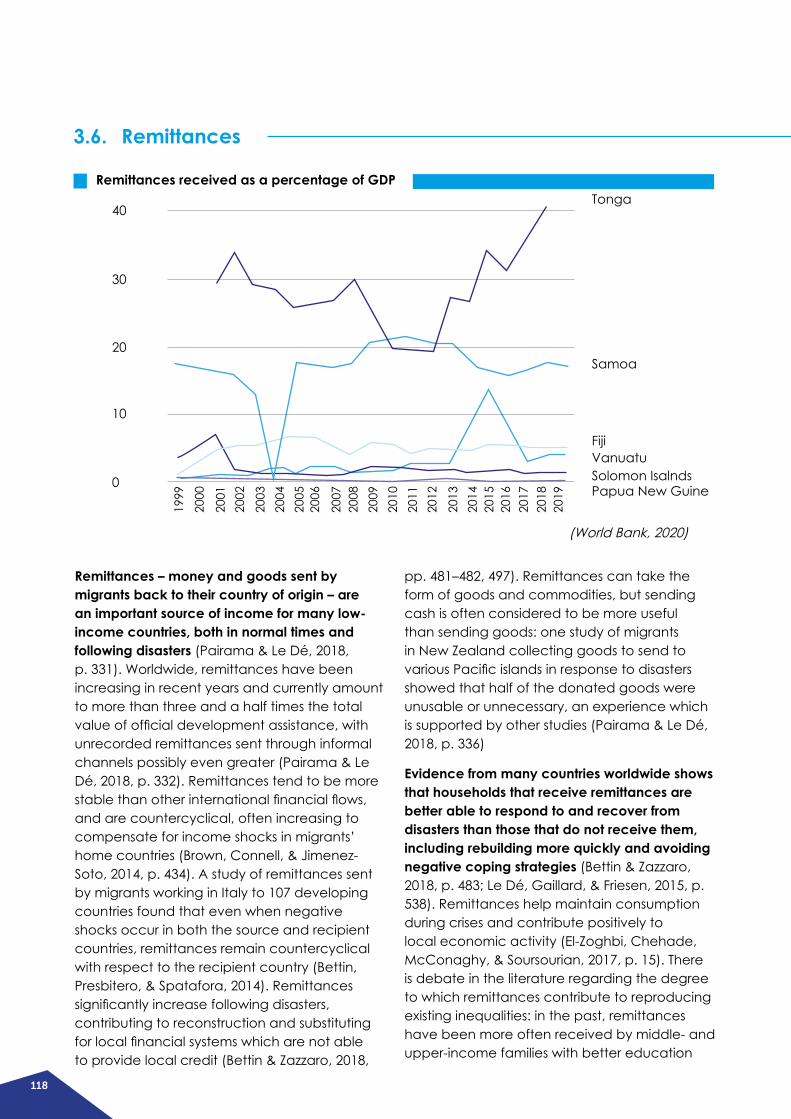
118
Remittances – money and goods sent by migrants back to their country of origin – are an important source of income for many low-income countries, both in normal times and following disasters (Pairama & Le Dé, 2018, p. 331). Worldwide, remittances have been increasing in recent years and currently amount to more than three and a half times the total valueofofficialdevelopmentassistance,withunrecorded remittances sent through informal channels possibly even greater (Pairama & Le Dé, 2018, p. 332). Remittances tend to be more stablethanotherinternationalfinancialflows,and are countercyclical, often increasing to compensate for income shocks in migrants’ home countries (Brown, Connell, & Jimenez-Soto, 2014, p. 434). A study of remittances sent by migrants working in Italy to 107 developing countries found that even when negative shocks occur in both the source and recipient countries, remittances remain countercyclical with respect to the recipient country (Bettin, Presbitero, & Spatafora, 2014). Remittances significantlyincreasefollowingdisasters,contributing to reconstruction and substituting forlocalfinancialsystemswhicharenotableto provide local credit (Bettin & Zazzaro, 2018,
pp. 481–482, 497). Remittances can take the form of goods and commodities, but sending cash is often considered to be more useful than sending goods: one study of migrants in New Zealand collecting goods to send to variousPacificislandsinresponsetodisastersshowed that half of the donated goods were unusable or unnecessary, an experience which is supported by other studies (Pairama & Le Dé, 2018, p. 336)
Evidence from many countries worldwide shows that households that receive remittances are better able to respond to and recover from disasters than those that do not receive them, including rebuilding more quickly and avoiding negative coping strategies (Bettin & Zazzaro, 2018, p. 483; Le Dé, Gaillard, & Friesen, 2015, p. 538). Remittances help maintain consumption during crises and contribute positively to local economic activity (El-Zoghbi, Chehade, McConaghy, & Soursourian, 2017, p. 15). There is debate in the literature regarding the degree to which remittances contribute to reproducing existing inequalities: in the past, remittances have been more often received by middle- and upper-income families with better education
3.6. Remittances
Remittances received as a percentage of GDP
(World Bank, 2020)
1999
2000
2001
2002
2003
2004
2005
2006
2007
2008
2009
2010
2011
2012
2013
2014
2015
2016
2017
2018
2019
Tonga40
30
20
10
0
Samoa
FijiVanuatuSolomon IsalndsPapua New Guine
119
and with funds to pay for transportation and visas, who can then invest further in these assets, but there is evidence suggesting that as migration has become cheaper and more accessible, remittances have increasingly contributed to reducing income inequality (John Connell, 2015, p. 139; Le Dé, Gaillard, & Friesen, 2015; Le Dé, Gaillard, & Wardlow, 2015, p. 2). There is also some question in the literature about how well remittances support disaster preparedness: there is good evidence that remittances substantially contribute to welfare, increased consumption, and improved housing, and that there has been a shift in the use of remittances from consumption to investment where it is feasible to do so and opportunities exist (Bettin & Zazzaro, 2018, pp. 491, 497;
John Connell, 2015, p. 140), but on the other hand some authors argue that remittances are more often spent on basic needs such as food than on investments in adaptive capacity (Melde & Laczko, 2017, p. 86; Pairama & Le Dé, 2018, pp. 340–341). Remittances contribute to macroeconomic stability following disasters, except in a very few cases where they reach very high levels, in excess of 17% of GDP, wheretheycancauseinflationandcreatemoral hazard (Ebeke & Combes, 2013). Across thePacificregion,however,researchonremittances has generally looked at impacts on development with very little work on the role of remittances in disaster resilience (Campbell & Warrick, 2014, p. 31).
Fiji receives substantial funds from remittances, which contribute to poverty reduction, wealth creation, social protection, and economic growth. The total value of remittances received in Fiji was 5.2% of GDP in 2019 (World Bank, 2020e),whichislowerthanotherPacificislandcountries as a percentage of GDP, but higher in dollar terms. Almost a quarter (23%) of adult Fijians receive remittances, with more women (28%) than men (19%) receiving them (Reserve Bank of Fiji, 2015, p. 28). At the household level, a survey carried out in 2005 indicated that 42% of all households in Fiji receive remittances, and also noted that migrants send remittances to households other than their own (20% of households without any migrants received remittances) as well as to churches and other community organizations (Brown et al., 2014, p. 441). There is evidence from Fiji that remittances support poverty alleviation, wealth accumulation, and economic growth, particularly among poorer households. One study, for example, found that remittances are used for education and housing expenditures, and that they are associated with crop diversificationandincreasesinproductionofcashcrops(Xing,2018,pp.42–43).Astudythat attempted to quantify the impact of remittances in Fiji estimated that without remittances, poverty rates would likely increase from 34% to 42.9%, and found a strong positive
impact on the relative wealth of households that receive remittances compared with those that do not (Brown et al., 2014, pp. 446–448); another estimated that at the national aggregate level, a 1% rise in remittances as a percentage of GDP would increase per capita output by 0.12% (Jayaraman, Choong, & Kumar, 2011, p. 537).
Although there is good evidence that remittances provide resources to help recipients manage economic shocks, there is a lack of information about exactly how remittances have been used for disaster relief and recovery in Fiji. Post-disaster needs assessment reports in general terms that “following a disaster people in Fiji help themselves with the assistance of family/community (either those at home or abroad with cash remittances)” (Government of Fiji, 2013), that repairing and rebuilding housing relies on “a combination of government support, household savings, family remittances and local credit” (Government of Fiji, 2016, p. 120), and that “private sector workers and those dependent on remittances were least likely to have been impacted by the cyclone” (Fiji Food Security and Livelihoods Cluster, 2016, p.5).However,specificdataonthevalueofremittances received following disasters and how these funds are used do not appear to be available.
Fiji
120
International remittances are a negligible source of income in Papua New Guinea, but domestic remittances from urban workers to rural households are more common. Remittances have been valued at no more than 0.25% of GDP throughout the past twenty years, and have been decreasing both in dollar terms and as a percentage of GDP47 since the early 1990s; in 2019 remittances reached their lowest level in at least 40 years, at USD 2.5 million or 0.01% of GDP (World Bank, 2020e). Papua New Guinea sends very few migrant workers overseas, both as a proportion of its population andcomparedwithneighboringPacificislandcountries (see section 3.5). Sending domestic remittances from workers in urban areas to their families in rural areas is fairly common, however: it has been estimated that 49% of the population received remittances in 2009-10(NationalStatisticalOffice,2009,p.120),ofwhich the majority were likely to be domestic although a breakdown of international versus domestic remittances does not appear to be available. A study in 2014 looking at two provinces estimated that 60% of the population in those provinces received remittances (Sibley et al., 2015). Most formal domestic remittances aresentviathepostoffice,eventhoughonly40% of the population can access a postal outlet; the quantity of domestic remittances sent through informal channels or hand-carried is not known but is probably larger (Ganesh et al., 2016, pp. 75, 80; Sibley et al., 2015, p. 42). The 2009-10 Household Income and Expenditure Survey reports that remittances amounted to an average of PGK 445 (approximately USD 163) per recipient in 2009-10 (National Statistical Office,2009,p.120).
There is good evidence globally and regionally that remittances help recipients manage economic shocks, but there is a lack of information about how remittances have been used in Papua New Guinea, particularly for disaster relief and recovery purposes. Regarding Papua New Guinea, there appears to be a scarcity of research on remittances for all purposes. One study of low-skilled migrant workers participating in the Australian Seasonal Worker Programme in 2016 found that these workers remitted an average of AUD 3,350 (approximately USD 2,490) each to spouses, parents, children and other relatives, most of which was spent on everyday expenses, health-related and education-related expenses, and customary obligations; some workers said that remittances had also been used for livestock, farmingorfishinginputs,ortostartorinvestina business (Voigt-Graf, 2017, p. 2). However, household incomes of workers who participated in the program for several years were no higher thanthoseoffirst-timeparticipants,andtherewas no relationship between the number of seasons that workers participated in the program and ownership of durable household goods; the authors conclude that remittances were mostly used to support immediate needs, including distribution through the wantok system (customary and reciprocal obligations to assist members of one’s cultural group; see section 3.8), rather than being used for productive investments (Voigt-Graf, 2017, p. 33).
Papua New Guniea
47The decline in value as a percentage of GDP is in part due to domestic economic growth increasing more quickly than remittances, but the general trend in dollar terms has been downwards since the early 1990s.
121
International remittances are a major source of income for Samoa, which is ranked 10th in the world in terms of remittances received as a percentage of GDP (World Bank, 2020e). Amounts received have typically ranged between 15% and 22% of GDP over the past 37 years,withthemostrecentfigurebeing17.3%ofGDP in 2019 (World Bank, 2020e). Remittances are about three times the value of exports and are worth substantially more than the value of foreign aid (John Connell, 2015, p. 133). A survey led by the Central Bank of Samoa in 2015 found that 56% of adults reported receiving remittances from overseas in the past year (Central Bank of Samoa, 2015, p. 17) and it is widely assumed that at least 90% of households receive remittances (John Connell, 2015, p. 133). Samoa has a large diaspora, with strong cultural values that include reciprocal duties to help family and community members (Le Dé et al., 2016, pp. 140–141; Parsons et al., 2018, pp. 655–656). Three-quarters of people receiving remittances receive them regularly, at least once per quarter (Central Bank of Samoa, 2015, p. 24). Money is overwhelmingly (92%) sent via Western Union, with 4% being hand-delivered in case and only 4% sent via bank transfer, mobile money services, or other means (Central Bank of Samoa, 2015, p. 51). In addition to money, 64% of households in Samoa receive in-kind remittances, including food and clothing, appliances like televisions, microwave ovens, refrigerators, and even construction materials and cars (John Connell, 2015, p. 136; Le Dé et al., 2016, p. 137).
Remittances in Samoa support consumption levels and social welfare, and reduce the proportion of the population in poverty (ILO, 2019b, p. 37). Most recipients (69%) report spending remittances on personal expenses such as food and utilities, 40% report using the money for traditional ceremonies (such as weddings, funerals, and church obligations), 35% use the money for other emergencies, 30% for education costs, and 25% use the money
for other purposes (Central Bank of Samoa, 2015, pp. 18–19). There is also evidence of more diverse uses including housing, community projects, education, investment in agriculture, and as start-up capital for shops and other small businesses (John Connell, 2015, p. 137). For example, a study published in 2001 reported that half of all market vendors in Apia, all of whom received remittances, said that remittances had been used as capital for the purchase of seeds, fertilizer and tools to engage in food production for sale (Muliaina 2001, p. 28, cited in John Connell, 2015, p. 137). A study of one village in Samoa after TC Evan found that poor households had less access to remittances than middle- and upper-income households (because poorer households had fewer family members able to take up work overseas, and lower levels of education providing access to better-paying jobs), and that poor households without access to remittances became more vulnerable after the cyclone (Le Dé, Gaillard, & Friesen, 2015, pp. 549–550).
Remittances to Samoa have reliably increased by large amounts following disasters caused by cyclones and tsunamis (Campbell & Warrick, 2014, p. 23; Costella & Ivaschenko, 2015, p. 41; Le Dé et al., 2016, pp. 131, 134). Remittances following the 2009 tsunami, for example, were 3.6 times as high as in a non-disaster year (Le Dé et al., 2016, p. 136). Samoan migrants in New Zealand reported that after the 2009 tsunami they not only sent higher levels of remittances and more in-kind remittances, but also sent remittances to a wider range of relatives and their broader communities (often through churches), and travelled to Samoa themselves to deliver aid and help their communities (Le Dé et al., 2016, pp. 137, 142).
There is good evidence that remittances have helped recipients recover from the impacts of natural hazards in Samoa. Remittances help households meet basic needs during periods of crisis, particularly when livelihoods that rely on natural resources are less productive,
Samoa
122
includingseasonalfluctuations,shocksrelatedto El Niño events, climate trends, and disasters (Campbell & Warrick, 2014, p. 23). Studies of coastal villages in Samoa found that remittances were “one of the most important resources” used by households to cope with disasters, because remittances were available very quickly (within hours or days of the event), wereflexible,andaddressedhouseholds’specificneeds,comparedwiththeslower,moregeneric, and limited support provided by the government and NGOs (Le Dé, Gaillard, Friesen, et al., 2015, pp. 657, 665–669). Recipients of remittances reported that following both the 2009 tsunami and TC Evan in 2012, remittances were “mostly directed to deal with immediate security needs”, including rebuilding and repairing houses, recovering agricultural production, rebuilding community facilities, and supporting other essential expenses such as food, healthcare, and clothing; recipients also
noted that that even though most households received assistance to support housing repairs, thisaidwasnotsufficientandremittanceswere used to complement this aid (Le Dé, Gaillard, & Friesen, 2015, p. 547; Le Dé, Gaillard, & Wardlow, 2015, p. 3; Le Dé, Gaillard, Friesen, et al., 2015, pp. 665, 668). Anecdotal evidence from remitters also supported the conclusion that remittances were used to restart businesses, repair houses, and buy water tanks (Le Dé et al., 2016, p. 136). Remittances were also helpful indirectly in enabling people to access other resources: following TC Evan, low-interest loans were made available (by the Central Bank of Samoa through the Samoa Housing Corporation) to households that had low or no income or assets but did have a family member working overseas who could assist in repaying the loan or serve as a guarantor (Le Dé, Gaillard, & Friesen, 2015, pp. 545–546).
International remittances are only a minor source of income for households in Solomon Islands.Amountsreceivedhavefluctuatedbetween 0.5% of GDP and 2.5% of GDP over the past 20 years, most recently contributing 1.4% of GDP in 2019 (World Bank, 2020e). A survey led by the Central Bank of Solomon Islands in 2015 estimated that 36% of adults had received remittances in the past year, but most of these are domestic remittances, with only 11% of people receiving money from overseas (Central Bank of Solomon Islands, 2015b, p. 12). The Central Bank of Solomon Islands study reports that about one-third of people receive remittances every quarter (Central Bank of Solomon Islands, 2015b, p. 13), while a World Bank study reports that one quarter of rural
households receive remittances from family members working outside the village, usually in Honiara (World Bank, 2017d, p. 90). Remittances are overwhelmingly (68%) received in cash (Central Bank of Solomon Islands, 2015b, p. 13).
There is a lack of information about how remittances have been used in Solomon Islands, including for disaster relief and recovery purposes. In Solomon Islands, there appears to be a scarcity of research on the impacts of remittances in the country, both from a development perspective and from a disaster resilience perspective. The 2012-2013 Household Income and Expenditure Survey indicates that overseas remittances make up about 0.2% of households’ cash income (Solomon Islands NationalStatisticsOffice,2015,pp.57–58).
Solomon Islands
123
Tonga receives more remittances as a percentage of its GDP than any other country in the world, and remittances make a large contribution to poverty reduction, wealth creation, social protection, and economic growth. The value of remittances received in Tonga in 2018 was 40.7% of GDP, which is the highest level of remittances as a proportion of GDP in the world48 (World Bank, 2020e). Remittances are the main source of foreign exchangeinflows,andaremorereliablethanexports (John Connell, 2015, p. 126). Tonga has a large diaspora, approximately the same size as the population of the country, with traditions and values that include expectations of sending money and goods home (Hahm et al., 2019, p. 5; Jimenez-Soto & Brown, 2012, p. 426; WTO, 2019b, p. 8). Migration for economic opportunities is facilitated by the Tongan government and by large seasonal worker programs in Australia and New Zealand, and is broadly seen as valuable and inevitable (John Connell, 2015). At the household level, a survey in 2005 indicated that 91% of all households in Tonga receive remittances (Brown et al., 2014, p. 441); another survey in 2016 found that 70% of adults reported receiving remittances within the past year (National Reserve Bank of Tonga, 2017, p. 21). Migrants also send remittances to households other than their own, such as extended family members and friends (78% of households without any migrants received remittances) (Brown et al., 2014, p. 441), and to churches and other community organizations (18% of all remittances go to such organizations) (Brown et al., 2014, p. 441; Macpherson and Macpherson, 2011, cited in John Connell, 2015, pp. 138–139). The largest mobile phone network in Tonga, Digicel, facilitates low-cost money transfers from Australia and New Zealand (John Connell, 2015, p. 147–148). However, 83% of
Tongans who receive overseas remittances do so through Western Union, followed by bank transfers and hand delivery of cash as the second and third most used mechanisms (Hahm et al., 2019, p. 16).
There is good evidence that remittances contribute to poverty reduction and to managing economic shocks, but a lack of information about exactly how remittances have been used for disaster relief and recovery in Tonga. There is evidence that remittances “have a strong impact on poverty reduction, in terms of both the extent and depth of poverty” (Jimenez-Soto & Brown, 2012, p. 426). A study that attempted to quantify the impact of remittances estimated that without them, poverty rates would likely almost double from 32% to 62%, and found a strong positive impact on the relative wealth of households that receive remittances compared with those that do not (Brown et al., 2014, p. 446–448). “The positive association between remittances and the accumulation of physical assets also indicates that migrant households among the poorest are likely to be much better insulated against negative income shocks than the non-migrant households in the same income category” (Brown et al., 2014, p. 448). Remittancesprovideafiscalbufferbothatthe household level and for MSMEs, because remittanceflowsaretypicallyunaffectedbylocal crises and can increase in times of need (John Connell, 2015, p. 140; WTO, 2019b, p. 12–13). For example, following TC Gita in February 2018, remittances to Tonga grew by TOP 4.4 million (18.5%) to reach a monthly high in March of TOP 28.0 million (WTO, 2019b, p. 12–13). However, data on exactly how remittances are used during disasters do not appear to be available.
Tonga
48Followed by Haiti at 38.5%; no other country exceeds 30% (World Bank, 2020).
124
International remittances are a small but increasingly important source of income for households in Vanuatu. Amounts received have been gradually trending upwards over the past two decades, reaching 3.8% of GDP in2019,withasignificantsurgein2015and2016 following TC Pam (World Bank, 2020e). The Government of Vanuatu estimates that 15% of urban and 38% of rural households receive remittances (Government of Vanuatu, 2015b, p. 89). A survey led by the Reserve Bank of Vanuatu and the Vanuatu National Statistics Officein2016estimatedthat27%ofadultshad sent remittances, and 33% of adults had received remittances in the previous 12 months; most of the latter (72%) receive remittances from within Vanuatu rather than from overseas (Reserve Bank of Vanuatu, 2016a, p. 24). Most people (72%) report spending remittances on short-term personal expenses such as food and utility bills, 34% report spending on education
Relocation of settlements at extreme risk of natural hazards is generally considered a last resort with potentially severe social and cultural impacts. Global experience with planned relocationofsettlementshasidentifiedmanyrisks, including landlessness, unemployment, homelessness, social marginalization, reduced access to common-property resources, food insecurity, increased morbidity and community disarticulation (Cernea, 1997, cited in Campbell & Warrick, 2014, p. 24). The ILO, for example, argues that internal migration “deepens vulnerabilities” and “is not a durable solution to climate change”, except where linked to stable formal employment (ILO, 2017b, p. 144). AcrossthePacific,particularrisksrelatetoland,including loss of identity, culture, livelihoods, family ties and community cohesion, as well asconflictandgovernanceissuesaroundcustomary land rights (Campbell & Warrick, 2014,pp.3,24).InmostcasesacrossthePacific,except perhaps where communities have directly experienced impacts such as severe
costs, and smaller proportions report spending on housing, health, and other costs (Reserve Bank of Vanuatu, 2016a, p. 25). Remittances (which are mostly domestic rather than international) are most often sent through Western Union (55%) or hand-delivered in cash (21%) (Reserve Bank of Vanuatu, 2016a, pp. 24–25).
There is good evidence globally and regionally that remittances provide resources that help recipients manage economic shocks, but there is a lack of information about exactly how remittances have been used for disaster relief and recovery in Vanuatu. In 2015 following TCPam,remittancesspikedtofivetimestheaverage of the previous 15 years (World Bank, 2020e),suggestingasignificantoverseasresponse to the disaster, but data on exactly how remittances are used during disasters do not appear to be available.
coastalerosionorfloodingduetosubsidence,residents typically resist the idea of relocation, and prefer in-place adaptation and sustainable management practices (Beyerl et al., 2018, p. 26; John Connell, 2012).
Fiji has undertaken several small-scale village relocations, and the government expects relocation to become “a more common response to climate related events in the future” (Government of Fiji, 2018a, p. 5). In 2017, the governmentidentified830communitiesasbeing in need of relocation due to climate-related impacts, with 48 being in urgent need (Government of Fiji, 2017a, p. 102). The village of Vunidogoloa (population approximately 140), inCakaudroveProvince,wasthefirstentirevillage to be completely relocated, in 2014; Denimanu (population approximately 170) and Vunisavisavi (population approximately 100), also in Cakaudrove Province, were partially relocated in 2012 and 2015 respectively; and
Vanuatu
Fiji
3.7. Resettlement of Communities at Risk

125
Narikoso (population approximately 105), in Kadavu Province, is now in the process of planning for partial retreat and is undertaking earthworks (McMichael, Katonivualiku, & Powell, 2019, pp. 325–329; Piggott-McKellar, McNamara, Nunn, & Sekinini, 2019, p. 5). In the cases of Vunidogoloa, Vunisavisavi, and Narikoso, relocation was determined to be necessary duetocoastalerosion,highertides,flooding,storm surges, and saltwater intrusion, after other efforts such as seawalls, wave breaks, and mangrove regeneration had failed (McMichael et al., 2019, p. 330–331). In Denimanu, relocation was a response to the destruction of 19 houses, constituting half of the village, by TC Evan in 2012 (Piggott-McKellar et al., 2019, p. 5). The relocations were funded primarily by the government and international agencies with some contributions from villagers, and were short-distance moves within customary land, so villagers were able to continue traditional farmingandfishingpractices(McMichaelet
al., 2019, pp. 332–333). While the relocations resulted in improved housing and village facilities, there were also reports of unwelcome disruptions to traditional culture and complaints thatsomeworkswerenotfinishedaspromisedor were not completed to desired standards (McMichael et al., 2019, pp. 333–334; Piggott-McKellar et al., 2019, p. 8). Relocation of a village is a highly sensitive undertaking, and different studies do not fully agree in their assessment of the process in relation to community participation. The Vunidogoloa relocation, for example, has been described by one study as “an exemplary precedent” with full participation of the residents (Tronquet, 2015, p. 140), while other studies argue that the government applied pressure on the community and that community decision-making processes were manipulated to force decisions (Bertana, 2020), or that the process was consultative but not genuinely participatory (Piggott-McKellar et al., 2019, p. 13).
In Papua New Guinea, resettlement of communities due to the impacts of natural hazards has been attempted, but has often failed to produce positive, sustainable outcomes. An estimated 267,000 people in Papua New Guinea were displaced due to natural hazards from 2008 to 2019 (IDMC, 2019). IOM estimates that 32,125 people were currently displaced in 2017, mostly duetovolcanoesorflooding(IOM,2017,p.6). This type of displacement is particularly problematic in Papua New Guinea, which is a highly diverse and divided country with distinct and competing ethnic groups and tribes; displacement can lead to tensions andconflictbetweengroupscompetingforlimited land and resources (ILO, 2017b, p. 144). Displaced populations frequently report conflictswithhostcommunities;overcrowding;limited access to land, natural resources, and essential services such as education, health care, and water and sanitation services; lack of employment or other livelihood opportunities; and lack of safety, security, and freedom of movement (IOM, 2017, pp. v, 17–19). In Papua New Guinea, land ownership issues are typically
the greatest constraint to resettling displaced populations (ACAPS, 2018, p. 5). Some attempts at relocation have been successful, when supported by traditional practices and access to land, but “thousands of Papua New Guineans have lived in displacement for over a decade without a durable solution” (IOM, 2017, p. 5). Some examples include:
• In some parts of the Highlands, when drought and frost severely affect agricultural production, traditional practices allow large numbers of people to temporarily relocate to lower elevations and share the livelihoods of unaffected communities until they can return home (Campbell & Warrick, 2014, p. 18).
• A post-disaster assessment of four communities following the 2018 earthquake found that in two communities, people who had lost their homes decided not to return because they were able to obtain access to land by verbal agreement with current landowners, while in a third community, people were unable to establish new locations for their gardens and
Papua New Guinea
126
therefore intended to return to their original sites as soon as possible (the fourth community suffered little damage and did not have to relocate) (Roche et al., 2018, p. 9).
• The Carteret Islands are a group of six small islands with a population of about 3,000 people, suffering from coastal erosion, saltwater intrusion, high tides, storm surge, and sea level rise (Boege & Rakova, 2019, p. 3; Dannenberg, Frumkin, Hess, & Ebi, 2019, pp. 6–7). Multiple attempts to resettle portions of the population in the 1980s, 1990s, and2000sfailed,largelyduetodifficultiesobtaining suitable land for resettlement, lack of local participation in the planning process, conflictswithexistingcommunitiesintheareasselected for resettlement, lack of ongoing government support, and concerns on the part of the Carteret Islanders about changes to livelihoods and loss of cultural heritage, identity, and dignity (Boege & Rakova, 2019, p. 8; Edwards, 2013, pp. 63–64; UNDP, 2016b, p. 6). As of the end of 2018, ten families were living on a site provided by the Catholic Church with the intention of preparing it for others to follow, but there were ongoing difficultiesrelatedtoobtainingclearlegaltitleto the land (Boege & Rakova, 2019, pp. 4–7).
• The population of Manam Island, about 9,000 people, was evacuated to temporary care centers on the New Guinea mainland in 2004 after volcanic eruptions made the island uninhabitable. Islanders were given little support, had reduced access to land and water, were not integrated into the localcommunity,haddifficultyadaptingtogrowingnewcropsandreducedfishcatches, lacked access to education and employment, and suffered weakening of traditional governance and social structures. Violentconflictsarosebetweentheislandersand local residents. Plans to relocate the Manam Islanders from the care centers to a more permanent settlement have been under discussion since 2006 (Melde, De Bruyckere, Vigil, & Gemenne, 2017, p. 50). Many Manam Islanders are still living in the care centers, but many have returned home despite ongoing volcanic eruptions, believing that they were better off coping with the volcano than with the food shortages and violence experienced in the care centers (John Connell, 2012; John Connell & Lutkehaus, 2017); As of 2018, the population on the island had returned to about 7,000 people (ACAPS, 2018, p. 1).
In Samoa, populations in vulnerable coastal areas have been relocated inland following major disasters, but available land is limited. Although communities at risk may be aware of dangers, they are often reluctant to take the drastic step of relocating pre-emptively, and only become willing to actually relocate after an event like a major tsunami or cyclone (Government of Samoa, 2009, p. 43; Koskinen-Lewis, Carvalho, Dias, Fernandes, Diogo, Taulealo, Evalu, & Simi, 2016, p. 6). Following the 2009 tsunami, affected communities relocated inland to higher ground which was already owned by the communities, with extensive support from the government and international agencies that included: building 502 new
homes; building new schools; installing services including water, sanitation, electricity, and roads; and assistance to re-establish livelihoods that included tools, planting materials, livestock, fingerlingsandfishingboats(Koskinen-Lewisetal., 2016, p. 6). Following TC Evan in 2012, the prime minister of Samoa called for people to relocate to higher ground, but land is expensive, most land in Samoa is customary land that cannot be sold and the supply of freehold land is limited, and family ties to ancestral lands makeitdifficulttoliveinavillagethatonedoesnot belong to (Government of Samoa, 2013, p. 59; Meldau, 2013, p. 57). The post-disaster needs assessment for TC Evan concluded that “most of the households seem to favor in situ
Samoa
127
reconstruction, as it is the easiest and most affordable option for them” (Government of Samoa, 2013, p. 59).
Relocated populations often return to their original homes due to the practical advantages of living on the coast. Most populations in Samoa that were relocated following cyclones in the 1990s eventually returned to their original coastal locations, as there is a strong preference for living on the coast (Government of Samoa,
2009, pp. 43–44). Similarly, following the 2009 tsunami, families began to return to the coast within one year to rebuild livelihoods around the tourismindustry,andwithinfiveyears,coastalareas had their pre-tsunami utilities and services largely restored and some people have rebuilt homes on the coast, although their permanent homes mostly remain inland where their plantations are located (Koskinen-Lewis et al., 2016, p. 6).
In Solomon Islands, attempts have been made to relocate several settlements in response to natural hazards, with access to land being the main barrier to relocation efforts. Internal relocation of settlements due to the impacts of climate change, including sea level rise, is discussed in the National Adaptation Programmes of Actions as an important policy option despite “serious political, economic and socio-cultural implications” as well as the major barrier of land ownership (Talo, 2008, pp. 42, 80, 86–87). About 87% of land in Solomon Islands is customary land, controlled by tribes and clans in accordance with traditional usage that varies from one cultural group to another across the country (Allens, 2018). One recent academic study reports an anonymous senior government officialassayingthatseveralcommunitiesinthe country are seeking to relocate but have been unable to proceed because of a lack of available land, or because of land disputes in potential resettlement locations, and that there is an increasing risk of unmanaged resettlement into informal settlements (Ha’apio, Wairiu, Gonzalez, & Morrison, 2018, p. 362). Some examples of attempts to relocate populations include:
• AprilRidge,Honiara:Followingfloodsin2014,plans were made to relocate households from a riverside informal settlement in Honiara to a safe location at April Ridge, in East Honiara
(Ha’apio, Gonzalez, & Wairiu, 2019, p. 516). The government began to survey and divide the land into 268 lots, but received more than 1,000 applications which took more than a yeartofinalize,andrequiredsettlerstopayfees to acquire long-term leases, which most could not afford (Ha’apio, Morrison, Gonzalez, Wairiu, & Holland, 2018, pp. 4, 11; Keen & McNeil, 2016, pp. 1–2). In the meantime, politicians allegedly offered land to supporters to win favor and to free up public buildings that were being used as temporary shelters, and more than a hundred people (mostly, but notentirely,legitimatefloodrefugees)movedtotheareabeforetheofficialallocationprocess was completed (Keen & McNeil, 2016, p. 1). By the time the lot allocations were completed, the area was substantially settled, andconflictsemergedbetweenthefirstwaveof squatters and later arrivals including legal leaseholders (Keen & McNeil, 2016, pp. 1–2).
• Mondo/Keigold village, Ranogha island: In 2007, following a tsunami that struck Mondo village on Ranogha island, villagers decided to move inland to a location called Keigold, 145 metres above sea level, which was already under the control of the local chief (Ha’apio et al., 2019, p. 516). The new village received a new school, clinic, church, and water and sanitation facilities, all with
Solomon Islands

128
In Tonga, relocation of settlements is a “sensitive topic” but is being considered in development plans (Kingdom of Tonga, 2019, p. 98). Suggestions for relocating settlements and/or restricting development have been made for vulnerable areas on Tongatapu and Ha’apai (Kingdom of Tonga, 2019, pp. 99, 186), where the government has suggested that relocation is the most effective adaptation option despite requiring “new and additional financial,technicalandhumanresourcesfrom the communities/villages, government and development partners” (Kingdom of Tonga, 2019, p. 186). After the 2009 tsunami in Niuatoputapu, some residents were resettled
significantlybetterfacilitiesthanattheformerlocation in Mondo, and new houses were constructed of sawn timber and iron roofs (Filho et al., 2020, p. 184). Even with all of these supports, however, the majority of those who moved were reluctant to leave their original village, and although 103 households agreed to move from Mondo to Keigold, 21 households later refused to relocate or returned to Mondo despite the village being declared unsafe by the authorities (Ha’apio et al., 2019, p. 516; Ha’apio, Wairiu, et al., 2018, p. 355, 363).
• Taro Island to Choiseul: Most of Taro island lies less than two metres above sea level and its population (currently 800 to 1,200 people) has experienced three evacuations due to tsunamis and seismic activity. Plans
inland, but residents resisted relocation even though 31% of all of the houses on the island had been destroyed, along with much public infrastructure (Kingdom of Tonga, 2009, p. 6). “The Tongan government sought to resettle them (and the hospital and other public buildings) on higher ground more than 10 metres above sea level, but many wished to remain on their own land close to the coast” and only some residents (the exact number is unclear) were eventually resettled inland (John Connell, 2012, pp. 134, 136; Kingdom of Tonga, 2019, p. 100). Some low-lying islands in Tonga do not have the option of relocation.
for permanently relocating to a new site on the nearby larger island of Choiseul began in 1994. Plots of land for a new townsite were purchased by the provincial government in the early 1990s and in 2011, and a Local Planning Scheme, developed with the residents of Taro island and approved in 2016, set out plans for the new community (Benintende, 2019; Dannenberg et al., 2019, p. 7). It is hoped that relocation will progress gradually over the next ten to twenty years, but more work still remains to be done to undertake feasibility studies and technical assessments for infrastructure such as roads, water, power, waste and wastewater management, and funding from the national government appears to have dried up as of 2018 (Benintende, 2019; Haines, 2016).
Tonga
129
In Vanuatu, several settlements have been relocated in response to natural hazards, and a national policy on relocation exists. People in Vanuatu are generally reluctant to resettle except as a last resort, prefer in-situ adaptation measures, and are concerned with maintaining cultural and livelihood links should resettlement occur (Perumal, 2018, p. 46). However, there are numerous examples of relocations taking place, including:
• Tegua island, 2005: a small coastal community of about 58 residents was relocated inland aftersufferingrepeatedfloodingfromhightides and cyclones, an earthquake, and a tsunami. The move was supported by strong traditional knowledge, belief systems, and local identity; strong social networks, collective action, and clear leadership; and availability of land and marine resources (Warrick, 2011).
• Mataso island, 2015: As a consequence of TC Pam in 2015, some communities were temporarily relocated, but lack of consultation with the community led to isolation and poor integration in the new locations (Perumal, 2018, p. 54–55).
• Ambae island, 2017 and 2018: Eruptions of the volcano Manaro Voui led to the government evacuating the entire population
of approximately 11,000 people to other islands for a month in 2017, and then again in mid-2018 for approximately six months; 4,178 people had returned to Ambae by mid-March 2019 (IDMC, 2018, p. 31; IOM, 2019; PCRAFI, 2018, pp. 2–5; Radio New Zealand, 2019a; WTO, 2019b, p. 27).
In 2018, Vanuatu published a comprehensive policy on internal displacement, covering people who have been relocated or are at risk of relocation due to natural hazards or other reasons, as well as addressing people living in informal settlements and internal migrants. The policy aims to minimize the drivers of displacement and relocation; minimize their negative impacts; work towards durable solutions for displaced populations; ensure that displaced people and host populations can make voluntary and informed choices and participate in planning solutions; facilitate well-managed and safe migration; promote access to disaster-resilient housing; and integrate human mobility into other sectoral policy areas (NDMO, 2018). Vanuatu (along with Fiji and Kiribati) is considered to be a leader in incorporating relocation, internally displaced peoples’ rights, and cross-border movements into governance arrangements (IDMC, 2018, p. 29).
Vanuatu
3.8. Community-Based Support
Globally and in the Pacific region, community-based informal coping mechanisms are a common way to reduce risk in rural and poor communities (Germanwatch, 2020, p. 5). Community-based mechanisms rely on reciprocal exchange and trust in tight-knit social networks, and are well-suited to coping with relatively small-scale natural hazards that affect only a few community members at atime.AcrossthePacific,strongextendedfamily ties play a critical role in coping with
disasters(Fletcheretal.,2013,p.6).Pacificisland countries tend to have “a strong tradition of informal social protection, with sharing of resources – in normal times and in times of emergency – common within families and the broader community, including sharing of cash or other items like food, clothing and tools” (Hobbs & Jackson, 2016, p. 23). However, community-based mechanisms can be overwhelmed by large-scale, long-term, or frequent events (Germanwatch, 2020, p. 5–13).
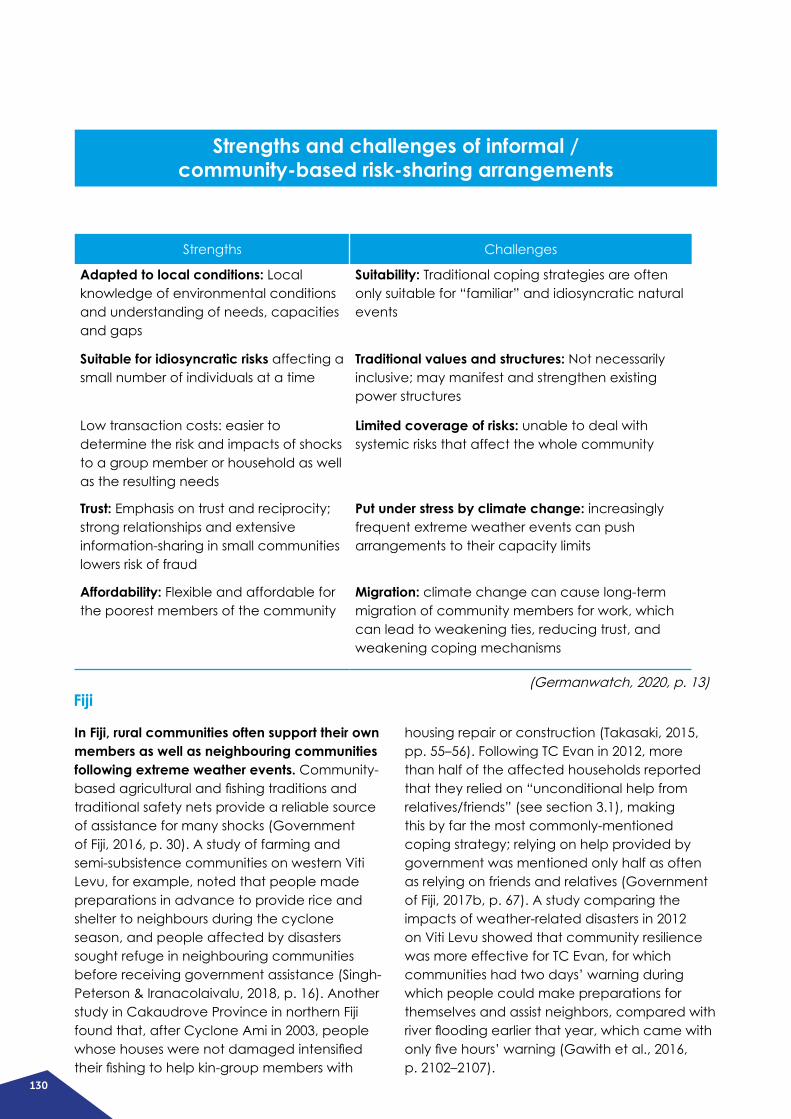
130
Strengths and challenges of informal / community-based risk-sharing arrangements
Strengths Challenges
Adapted to local conditions: Local knowledge of environmental conditions and understanding of needs, capacities and gaps
Suitability: Traditional coping strategies are often only suitable for “familiar” and idiosyncratic natural events
Suitable for idiosyncratic risks affecting a small number of individuals at a time
Traditional values and structures: Not necessarily inclusive; may manifest and strengthen existing power structures
Low transaction costs: easier to determine the risk and impacts of shocks to a group member or household as well as the resulting needs
Limited coverage of risks: unable to deal with systemic risks that affect the whole community
Trust: Emphasis on trust and reciprocity; strong relationships and extensive information-sharing in small communities lowers risk of fraud
Put under stress by climate change: increasingly frequent extreme weather events can push arrangements to their capacity limits
Affordability: Flexible and affordable for the poorest members of the community
Migration: climate change can cause long-term migration of community members for work, which can lead to weakening ties, reducing trust, and weakening coping mechanisms
In Fiji, rural communities often support their own members as well as neighbouring communities following extreme weather events. Community-basedagriculturalandfishingtraditionsandtraditional safety nets provide a reliable source of assistance for many shocks (Government of Fiji, 2016, p. 30). A study of farming and semi-subsistence communities on western Viti Levu, for example, noted that people made preparations in advance to provide rice and shelter to neighbours during the cyclone season, and people affected by disasters sought refuge in neighbouring communities before receiving government assistance (Singh-Peterson & Iranacolaivalu, 2018, p. 16). Another study in Cakaudrove Province in northern Fiji found that, after Cyclone Ami in 2003, people whosehouseswerenotdamagedintensifiedtheirfishingtohelpkin-groupmemberswith
housing repair or construction (Takasaki, 2015, pp. 55–56). Following TC Evan in 2012, more than half of the affected households reported that they relied on “unconditional help from relatives/friends” (see section 3.1), making this by far the most commonly-mentioned coping strategy; relying on help provided by government was mentioned only half as often as relying on friends and relatives (Government of Fiji, 2017b, p. 67). A study comparing the impacts of weather-related disasters in 2012 on Viti Levu showed that community resilience was more effective for TC Evan, for which communities had two days’ warning during which people could make preparations for themselves and assist neighbors, compared with riverfloodingearlierthatyear,whichcamewithonlyfivehours’warning(Gawithetal.,2016,p. 2102–2107).
Fiji(Germanwatch, 2020, p. 13)
131
Papua New Guinea has strong traditions of mutual support within tribes and ethnic groups that contribute to disaster resilience. Family, extended family, religious organizations, clans, villages and local governments all provide coping and recovery mechanisms (Sithole, Naser, Guadagno, & IOM, 2015, p. 13). Traditions of reciprocity and family obligations are fundamental to local culture, and “caring for members of the village is a way of life” (CFE-DM, 2019, p. 15). Obligations of mutual aid extend through the system of wantok – literally “one talk” or “one language” – referring to people of the same ethnic and cultural group, who speak the same language, and to the ties of reciprocity that bind them together (CFE-DM, 2019, p. 15; Naser, 2015, p. 22). The wantok system is a network for mutual assistance in normal times (for example, as a way of obtaining help with heavy tasks such as building or moving a hut, or planting crops), and in times of disaster it can be leveraged for support with relief and recovery, ensuring that resources are shared by the community in times of crisis, and substituting for formal mechanisms of social protection and insurance (Ganesh et al., 2016, p. 71; Sithole et al., 2015, p. 13). For example, in the highlands, members of high-altitude communities may be able to migrate downwards and obtain support from their wantoks in the valleys during times of frost and drought (Sithole et al., 2015, p. 11).
Samoa has a strong culture of community-based support, traditional governance systems, faith-based organizations, and traditional knowledge that contribute to disaster resilience. Social cohesion provided by family and village ties is a core feature of Samoan culture that encourages cooperation, mutual assistance and risk pooling amongst an extended facility or community (Government of Samoa, 2009, p. 84). Disaster preparedness at the village level in Samoa involves community institutions including schools, churches, traditional governance structures (which play major roles
“Wantok is a traditional welfare system for the tribe wherein everything revolves around the well-being of the tribe and no one is left to go hungry or homeless” (CFE-DM, 2019, p. 16). However, capacity to provide support can be overwhelmed by large-scale or long-term events,andconflictsdoarisewhenonegroupattempts to relocate into lands controlled by another group. It must also be emphasized that although reciprocal support is offered within an ethnicandculturalgroupdefinedbywantok, violentconflictbetweendifferent ethnic groups are common in Papua New Guinea.
Traditional knowledge also plays a role in disaster resilience in Papua New Guinea. Knowledge of environmental conditions allows communities to forecast certain kinds of hazards and give warnings to reduce risks and cope with emergencies (Sithole et al., 2015, p. 1). Traditional designs for buildings are adapted to local hazards: for example, coastal communities in Oro build houses on stilts to reducetheimpactoftidesandflooding,andusespecificallyselectedlocalmaterialstoresistwind and ensure limited damage in case of collapse (Sithole et al., 2015, p. 10). Villages develop strategies to increase food and water security,suchascultivatingspecificcropstoresistspecifichazards,andpreservingfoodandstoring water in advance of the rainy season andpotentialflooding(Sitholeetal.,2015,p. 10–11).
in village life and also link to formal national government institutions), and women’s groups (Fletcher, Thiessen, Gero, Rumsey, Kuruppu, & Willetts, 2013, p. 6). Samoans have strong religious ties, and churches play a crucial role in everyday life and an important role in leading disaster resilience efforts (Beyerl et al., 2018, pp. 35–36; Fletcher et al., 2013, p. 5; Meldau, 2013, p. 53). In times of crisis, churches often serve as emergency shelters or coordination points; for example, a study following the 2009 tsunami reported that one particularchurchwas“thefirsttobeonthe
Papua New Guinea
Samoa
132
Solomon Islands has strong traditions of mutual support within communities and kinship groups that contribute to disaster resilience. The principal social protection mechanism in Solomon Islands is a system of reciprocal obligations called wantok (literally meaning “one talk” or “one language”) that binds together people of the same community or kinship group. The informal social network provides a safety net during times of hardship, with inter-household transfers in the form of loans, gifts, and cash remittances sent within the Solomon Islands being routine (Ha’apio et al., 2019, p. 520; World Bank, 2017d, p. 90). The wantok system is a critically important mechanism for saving lives and helping families and communities recover after disasters resulting from natural hazards as well as personal crises (Ha’apio et al., 2019, pp. 515–518; ILO, 2015, p. 2). However, traditional social protection mechanisms have limits in communities with limited resources or experiencing aggregate shocks (ILO, 2015, p. 2), and they can perpetuate social norms such as discrimination against women (ADB, 2019a, p. 1). The obligation to provide support to family and community members can also undermine economically successful businesses and individuals: wantok obligations have been implicated in high rates of MSME loan defaults
ground when the tsunami hit” delivering relief supplies and funds “even before the Red Cross and government representatives came in to do their assessments” (Fletcher et al., 2013, p. 5). Samoans demonstrate strong attitudes of self-reliance in coping with natural hazards: in a survey undertaken in 2011-2012, only 10% of respondents agreed that the government would supply them with all necessities or ensure that impacts of environmental change would not affect them, and 57% disagreed that
and business failures, as money is diverted from business purposes to supporting relatives and other non-business expenses (ADB, 2008, cited in Ministry of Commerce Industry Labour and Immigration, 2016, p. 2), and “the obligation to provide support is particularly strong when it is known that the potential patron has regular access to money – for example a formal job, own business, student allowance, or royalties” (World Bank, 2017d, p. 90).
Traditional or customary governance institutions play a very large role in daily life and in disaster resilience in Solomon Islands (World Bank, 2017d, p. xiii). Customary institutions govern most land in the country, and “for most Solomon Islanders, access to customary land provides a place to live, access to water, a source of food, an opportunity to earn a livelihood, and a foundation for social identity and belonging” (World Bank, 2017d, p. xiii). Customary and church systems of authority play a critical role in maintaining social order, dealingwithdisputes,andconflictsoverresources, particularly in rural areas and informal urban settlements (World Bank, 2017d, p. xiii). These local governance systems vary across the country: for example, Anuta island has hereditary chiefs in a hierarchical structure with some degree of communal decision-making,
they were helpless in avoiding the impacts of environmental change (Beyerl et al., 2018, pp. 37–38). In many instances, especially in ruralareaslackingofficialemergencyshelters,displaced families stayed with extended family members or other host families49 (Government of Samoa, 2013, p. 110). A tradition of communal house building, based on family and community efforts, supports post-disaster reconstruction (Government of Samoa, 2013, p. 61).
Solomon Islands
49In one example, one urban family was reported to have hosted and fed two large families totaling 40 people (Government of Samoa, 2013, p. 110).
133
while Savo has a system of “big men” (chiefs) and elders governing alongside democratically elected representatives who sit in the provincial parliament (Kelman, 2019, p. 409).
Traditional knowledge and practices also play a role in disaster resilience in Solomon Islands. In some parts of the country, traditional methods of preserving and storing food, storing water, and cultivating resilient crops are followed, but these practices are being affected by increasing dependence on rice both in the daily diet and as an expected provision in disaster response (Solomon Islands Government, 2015, p. 14; Vaike & Salili, 2020, p. 18). Traditional building practicesincludeelevatingconcretefloorsto
keep them dry during heavy rains; constructing low, aerodynamic buildings to withstand cyclone winds; and using light, local materials suchaspalmleavesforroofingtoreducethedangerofflyingdebrisduringcyclones(Field, Barros, Mach, Mastrandrea, Yohe, et al., 2014, p. 53; Solomon Islands Government, 2015, p. 14; Vaike & Salili, 2020, p. 18). Rural Solomon Islanders often have a main house near the coast and a second house inland near their food garden, which can be used when threatened by coastal hazards (Solomon Islands Government, 2015, p. 14). Schools are encouraged to have school food gardens to supplement diets (Solomon Islands Government, 2015, p. 14).
Tonga has a strong culture of sharing between families and within communities, which is an important social protection mechanism during crises (Hobbs & Jackson, 2016, p. 72). Respondents to a study of local perceptions ofcyclonesinTongaandotherPacificislands reported well-established routines for preparing for incoming cyclones, which includedasignificantfocusonhelpingothersin their communities prepare, particularly the elderly and those with disabilities (Magee, Verdon-Kidd, Kiem, & Royle, 2016, p. 1098). Churches are focal points for the community, serving as emergency shelters during disasters (Government of Tonga, 2018b, p. 31) and facilitating assessments following disasters due to their close links with their communities
Vanuatu has a strong culture of community-based support, traditional knowledge, traditional governance systems, and faith-based organizations that all contribute to disaster resilience. Vanuatu has long experience with natural hazards, and communities have well-established coping mechanisms for extreme weather events, which have been credited with contributing to the low death toll resulting from TC Pam (Government of Vanuatu, 2015b, p. 37;
and their understanding of members’ and community needs (Kingdom of Tonga, 2018b, p. 8). Church-based giving and receiving is very strong; Tongans make considerable cash contributions to churches during normal times, and churches provide support to the community in the form of cash and vouchers following disasters (Hobbs & Jackson, 2016, pp. 23, 72). One church in Tonga has been reported to supplement the incomes of its members by matching the government’s monthly pension payments (Hobbs & Jackson, 2016, p. 27). Churches often organize collective remittances, facilitating both the collection of goods from migrants overseas and the distribution of goods when they arrive in the country (Pairama & Le Dé, 2018).
Handmer & Iveson, 2017, p. 63). People in rural Vanuatu have a strong sense of community, high levels of social participation, and high levels of trust that helped maintain calm in the recovery period and supported collaborative work (Balaei, Wilkinson, & Potangaroa, 2019, p. 715). One month after TC Pam, 72% of affected households reported that they had completedrepairssufficienttomeettheirown
Tonga
Vanuatu

134
perceived immediate needs, mostly without any external support (60%) or with support only from family and friends (24%) (REACH, 2015, p. 24). Some examples of communities undertaking preparation and recovery efforts on their own include:
• On the island of Erramango, the community disastercommitteeidentifiedsafehouses,organized an evacuation, and organized people to cut down trees in advance to avoid damage when they fell, and to store water. After the cyclone, the community committee conducted assessments, liaised with the relevant authorities, and cleared the airstrip sothatreliefsuppliescouldbedelivered,fivedays later (CARE, 2015, cited in Barber, 2018, p. 145).
• On Emae, people from three communities worked together to clear the coastal road of debris without any coordination from government (Jackson et al., 2017, p. 369).
• In urban areas on Efate island, residents reported mutual help between family members and at the neighborhood level included hosting those who lost their houses, sharing food and providing emotional support (Rey et al., 2017, p. 268).
• In the village of Laonkarai on Efate Island, where water supply systems were severely damaged, residents collaborated to share water resources within and between villages, repaired roofs and gutters, cleaned water catchments, removed obstacles, and fixedwaterpipestorestorecreek-fedandrainwater-harvesting water supply systems using materials and equipment at hand (Balaei et al., 2019).
• A study of villages on the islands of Pele, Moso, and Tanna described how communities work together to move people to evacuation centres, help those who are in need, secure the houses, store water, collect and store breadfruit and bananas, preserve food, and cut down trees and trim leaves of plants to reduce storm damage (McNamara & Prasad, 2014, p. 127).
Local traditional governance structures provide leadership, coordination, and information during crises (Fletcher et al., 2013, p. 6). A study looking at one village on Tongariki island after TC Pam, for example, described how the village chief was central to coordinating and prioritizing reconstruction work, and in collecting food and money for those in greatest need (Jennings et al., 2020, p. 32–33). Faith-based (predominantly Christian) organizations were also an important coping mechanism, with churches used as emergency shelters and church groups playing an important coordinating role in disaster response (Fletcher et al., 2013, p. 5). One study notes that self-reliance in remote rural communities can also mean that reconstruction efforts use locally-available materials that are not robust, and that progress can be slow: in one village recovering from TC Pam, most of the village was still rebuilding four years after the cyclone (Jennings et al., 2020, p. 34). Another study notes that traditional knowledge and cooperation systems may be in decline, with younger people being “more interested in modernity than tradition” and some traditional adaptations being lost while reliance on government, NGOs and international aid increases (Handmer & Iveson, 2017, p. 63).
135
4. Conclusions4.1. Hazard, Exposure, and Vulnerability
All six countries reviewed in this report have significant risks arising from cyclones, which bring high winds, heavy rain, and both coastal and inland flooding. Cyclones arise every year acrossthePacific,andarethemostsignificanthazard facing most of the countries examined. Most of the countries (except for Samoa, which is the smallest country in area) experience an average of one or more cyclones every year. ClimatemodelsforecastthatmostPacificislandcountries are likely to experience a decrease in the frequency of cyclones of between 10 % and 40% by the end of the century, depending on the country, but that maximum wind speeds are likely to increase by 2% to 11%, which would lead to higher damage, and that rainfall within 100 km of cyclone centers could increase by around 20% (ADB, 2018a, p. 5; Australian Bureau of Meteorology and CSIRO, 2014). Global evidence shows that the economic damage cause by cyclones is long-lasting and cumulative (Hsiang & Jina, 2014).
All six countries are also located on or next to the Pacific “Ring of Fire”, an zone of seismic activity that circles the Pacific Ocean, where about 90% of all earthquakes and 75% of all volcanoes in the world occur (National Geographic, 2017). All six countries are at risk of earthquakes and of tsunamis, which are caused by undersea earthquakes and threaten low-lying islands and coastal areas where the vast majorityofthepopulationofPacificislandslives.Volcanoes are also a major hazard in Papua New Guinea, and a less severe hazard in other countries.
Natural hazards disproportionately affect poor people, workers in the informal economy, and women. Poor people tend to be more exposed to hazards than wealthier people, are more severely affected by hazards, and have fewer resources available to them to cope when disasters do occur (Hallegatte et al., 2017, p. 4; ILO, 2019, p. 4; Wehrhahn et al., 2019, p. 60; World Bank, 2017a, p. 90). In all six countries examined in this report:
• Povertyisasignificantissue,andthereare high levels of informal and vulnerable employment and subsistence economic activity, which are insecure and particularly vulnerable to natural hazards.
• Gender equality is a major problem because of traditional social norms. Women and girls are often excluded from political participation, suffer from poor access to services and infrastructure, have limited economic opportunities and limited control land and other economic resources, and suffer high levels of gender-based violence. Disasters affect women and girls more severely than men and boys because their traditional domestic roles tend to become more difficultandtime-consumingunderdisasterconditions, because women’s livelihoods are often less secure and more severely affected by damage to natural resources that they depend on, and because gender-based violence often increases in crises.
• Education is often disrupted by natural hazards, which damage schools and other infrastructure, displace people, and cause students to be withdrawn from school. However, there is little evidence available about the resulting impacts on educational outcomes for youth.
136
• Youth employmentisasignificantchallenge,with youths typically suffering from a lack of formal employment opportunities and often remaining unemployed or under-employed in the informal or subsistence economy. However, there is a scarcity of evidence about how natural hazards affect the employment prospects of youth, other than generally inhibiting economic growth.
Fiji’s agriculture and fisheries industries, and micro-, small, and medium sized enterprises, are particularly vulnerable to damage caused by natural hazards. These sectors are critical sources of livelihoods for a large proportion of the population: 36% of all employment is in agriculture (World Bank, 2020e), half of all rural households have some involvement in subsistencefishing(GovernmentofFiji,2016,p.48), and 60% of employment across all sectors is in MSMEs (Paul, 2016, p. 22). Damage to crops andfisheriescantakemanyyearstorecover:following TC Winston, agricultural production in some areas was not expected to return to pre-cyclonelevelsforfivetotenyears,andsomefisheriescouldtake12yearstorecover(Government of Fiji, 2016, pp. 12, 50–51). Many MSMEs, such as food processing, handicrafts, weaving, and tourism-related products, rely on agricultural production, and many are home-based businesses that suffered when homes were damaged or destroyed (Government of Fiji, 2016, pp. 60, 76, 102). The tourism sector is more resilient to natural hazards, apart from the small, often home-based, businesses that produce handicrafts and other articles for the tourist trade (Government of Fiji, 2016, p. 60).
Papua New Guinea’s economy is dominated by subsistence agriculture, which is highly vulnerable to natural hazards, and by the mining, oil, and gas industries. The majority of Papua New Guinea’s population is supported by rural livelihoods through subsistence and semi-subsistence agriculture (Gwatirisa et al., 2017, pp. 395–396), which is vulnerable to
rapid-onset hazards such as volcanoes and earthquakes, slow-onset hazards like drought, and the long-term impacts of climate change whichareexpectedtosignificantlyworsenfood insecurity by the middle of the century (Rosegrant et al., 2015, p. 80).
Samoa’s relatively small economy, dominated by tourism and subsistence agriculture, is highly vulnerable to natural hazards. Tourism is nature-based and highly dependent on coastal ecosystems vulnerable to damage from natural hazards and climate change (ILO, 2019a, p. 23; Parsons et al., 2018, p. 644; Perrottet & Garcia, 2016, pp. 12–13; Wong et al., 2012, p. 136). Naturalhazardshavecausedsignificantharmto the tourism sector, mostly through damage to accommodation properties, with the heaviest impacts falling on small, family-run businesses (Government of Samoa, 2009, p. 34). Agriculture is extremely important in Samoa, with 97% of all households engaging in agricultural production of some form, mostly for subsistence purposes (Samoa Bureau of Statistics, 2016, p. 1), and agriculture suffers harmful impacts from cyclones and tsunamis, and is vulnerable to the effects of climate change which are expected to include more frequent and extreme rainfall events, longer dry spells and drought events, extreme winds, high air and water temperatures, and rising sea levels (Government of Samoa, 2013, p. 18).
Subsistence agriculture is the main economic activity for the vast majority of Solomon Islanders.Agricultureandfisheriesaccountedfor 22% of GDP in 2018 (Central Bank of Solomon Islands, 2019), but provides livelihoods for 75% to 87% of the population (Government of Solomon Islands, 2013, p. 30, 2014, p. 20; Huber & Fischer, 2020, p. 10). Natural hazards and climate change impair economic development in many industries (Filho et al., 2020, p. 179), but subsistence farmers are particularly vulnerable to their effects (ILO, 2017b, p. 139).
137
Tonga’s relatively small economy, dominated by subsistence agriculture and small, often home-based, businesses, is vulnerable to natural hazards. Agriculture is the dominant economic activity but is mostly carried out on a subsistence basis with limited commercial-scale activity (Government of Tonga, 2018b, pp. 24, 41; WTO, 2019b, p. 14). Cyclones cause extensive damage to crops and equipment, severely affecting the poorest and most vulnerable in the population (Kingdom of Tonga, 2018a, p. 17; WTO, 2019b, p. 14). Climate change is expected to adversely affect agricultureandfisheriesthroughincreasedfrequency of extreme weather, sea level rise, and disruption of aquatic ecosystems (Government of Tonga, 2018a; Kingdom of Tonga, 2019). The tourism industry depends on the health of coastal ecosystems, which are vulnerable to natural hazards and climate change (Kingdom of Tonga, 2019, p. 99; Van Der Veeken et al., 2016), and recent cycloneshavecausedsignificantdamagetoaccommodation businesses which are largely MSMEs (Government of Tonga, 2018b, p. 64;
Kingdom of Tonga, 2018a, p. 31; WTO, 2019b, p. 14). Tonga’s commerce and manufacturing sectorsaresmallandincludeasignificantproportion of activity consisting of home-based production of handicrafts (Tonga Statistics Department, 2017b, pp. 187–188), which are dependent on local natural resources for raw materials, which in turn are vulnerable to natural hazards and climate change (Government of Tonga, 2018a, p. 7).
Vanuatu’s relatively small economy, dominated by tourism and subsistence agriculture, is highly vulnerable to natural hazards. Tourism is nature-based and highly dependent on coastal and inland ecosystems, which are vulnerable to damage from natural hazards, although even in the case of TC Pam, the industry suffered only short-term losses and was able to recover within a year (Eriksson et al., 2017, p. 52; WTO, 2019b, p. 31). Agriculture is vulnerable to damage from cyclones and droughts, and the population of Vanuatu relies heavily on subsistence agriculture for livelihoods and food security (REACH, 2015, pp. 34–35).
4.2. Coping Mechanisms
Recovering from disasters can offer opportunities to not just repair damage and restore pre-existing conditions, but to “build back better” to improve future resilience if coping mechanisms are designed appropriately (United Nations, 2015, para. 32). The Global Facility for Disaster Reduction and Recovery (GFDRR),managedbytheWorldBank,identifiesthree important elements to building back better (Hallegatte et al., 2018):
• Building back stronger ensures that repaired and reconstructed assets are more robust and resilient, better adapted to current and future needs, and use the best available and most productive technologies.
• Building back faster restores assets and incomes of affected populations sooner,
reduces cumulative losses, and reduces the resources needed to support affected populations through the recovery period. This requiresrecoveryplans,agreements,financialarrangements, and materials to be put in place in advance of disasters occurring.
• Building back more inclusively ensures that post-disaster support reaches all affected population groups, including the poor and marginalized, and particularly including women and girls, who are the most vulnerable to natural hazards and who experience the most serious consequences when disasters strike. This requires the development of adaptive social safety nets that can react to shocks, with delivery mechanisms that cover vulnerable populations.
138
4.2.1. Adaptive Social Protection
Most of the countries reviewed in this report do not have social protection schemes that are able to scale up in crisis situations to support disaster relief and recovery. Most of the countries examined have very limited social protection schemes, and only Fiji (and, to a very limited extent, Tonga) has experience leveraging existing social protection systems for disaster relief and recovery purposes.
Fiji has demonstrated the ability to scale up its social protection schemes to deliver cash payments for disaster relief. Various agencies recommend continuing to use these mechanisms to respond to future disasters and to further formalize and institutionalize them by developing standard operating procedures and guidelines and ensuring that existing policies and legislation are supportive (Government of Fiji, 2017b, p. 119; Hobbs & Jackson, 2016, p. 10; Mansur, Doyle, & Ivaschenko, 2017, pp. 48–49; Save the Children and ACAPS, 2018, pp. 7–8). There may be opportunities to update and extend existing social protection databases to enable geographic targeting, extendingbenefitsto“near-poor”householdsthat are just outside poverty thresholds of existing programs, or providing varying levels ofbenefitsdependingonrecipients’incomelevels, special needs, or the severity of particular disasters (Government of Fiji, 2017b, pp. 72, 120; Mansur et al., 2017, p. 50; Save the Children and ACAPS,2018,p.7).Paymentofcashbenefitsisefficientandeffective,butmayneedtobe complemented by strategies to provide other forms of temporary emergency support where markets are not operational, and to pre-position key supplies in advance of the cyclone season to ensure availability in case of need (Mansur et al., 2017, p. 50; Save the Children and ACAPS, 2018, pp. 7–8). Experience from TC Winston suggests that there is a need to improve public communication about social protection programs so that recipients are aware of the
support available and how to access it (Mansur et al., 2017, p. 51; Save the Children and ACAPS, 2018, p. 8).
Papua New Guinea has no broad-based social protection schemes suitable for rapidly scaling up to support disaster relief and recovery, and there appears to be little or no discussion about the role that adaptive social protection could play in disaster relief and recovery in the country. A World Bank review of the New Ireland Old Age and Disability Pension made recommendations for improving the operation of the scheme, and for learning from this experience to design a national pension scheme, but made no mention of using the scheme for disaster relief and recovery (Sibley et al., 2014). The National Policy on Social Protection notes that social protection systems “can be an effective means of getting funds to communities coping with the effects of a disaster” and “can reduce the effect of a disaster on households”, but does not specificallyaddresshowtheseobjectivesare to be achieved other than calling for the creation of a fund to be used by the National DisasterOfficeandDefenseministrytosupportdisaster response (Department for Community Development & Religion, 2015, p. 17).
Samoa’s social protection programs are limited in scale and are not currently used for disaster relief efforts. In Samoa, there are currently no formal policies, procedures, or structures incorporating cash transfers into disaster response planning (Hobbs & Jackson, 2016, p. 30), and there do not appear to be any current efforts to develop such initiatives. The country has an established social protection cash transfer program in the form of the Senior CitizensBenefitFund,andfinancialinclusionisgenerally good, all of which suggest that there is a foundation for cash transfers to play a role in coping with future disasters. A 2012 AusAID report provides the following recommendations
139
for social protection programs in Samoa, althoughtheydonotfocusspecificallyondisaster resilience (Amosa & Samson, 2012, p. 52):
• TheSeniorCitizensBenefitFundshouldberecognized as a key pillar of social protection andmaintainedwithinflation-linkedadjustments to payments;
• Thegovernmentshouldconsiderabenefitprogram for people with disabilities, building on the experience of the Senior Citizens BenefitFund;
• The government and development partners should undertake an evaluation of cash transfer programs to assess the contribution of social protection programs to social and economic development; and
• The government should ensure continued improvement in the quality of social services, particularly healthcare, education and water and sanitation in more remote rural areas.
Solomon Islands has no social protection schemes suitable for rapidly scaling up to support disaster relief and recovery (ADB, 2019b, p. 16; Huber & Fischer, 2020, p. 20). A comprehensive study of the feasibility of cash and voucher programming in Solomon Islandsrecommended:workingwithfinancialservice providers and internet service providers to develop capacity for cash transfers; encouragingfinancialserviceproviderstoestablish systems for mass registrations of bank accounts and other transfer systems; partnering with local banks to help open newbankaccounts;providingfinancialliteracy training; supporting and training small businesses and fresh food market vendors to increase their disaster resilience and ability toscaleup;encouragingfinancialserviceproviders to improve and/or adapt banking infrastructure in rural areas; and focusing efforts and expectations on areas where feasibility is
highest (Huber & Fischer, 2020, p. 6). The World Bank notes that is “a clear case for formal social protection systems for poor and vulnerable households” but that there is also a need to better understand the role of informal social protection systems when designing contextually appropriate formal systems, and warns that experience in other Melanesian countries suggests that “there is virtually no chance of securing [domestic] political support for such systems, at least in the medium-term” (World Bank, 2017d, p. xix).
Tonga has used existing social protection system to deliver emergency cash payments following Tropical cyclone Gita and has delivered cash-for-work programs as part of recovery efforts following the Niuatoputapu tsunami in 2009 and TC Ian in 2014 (Government of Tonga, 2018b, p. 26; Hobbs & Jackson, 2016, pp. 29, 46, 51). As part of future preparedness and recovery efforts, the government has expressed an intention to develop a poverty registry to facilitate targeting of assistance during disasters (Government of Tonga, 2018b, p. 34) and to develop a cash-for-work program to engage unemployed youth in repairing and rebuilding homes (Government of Tonga, 2018b, pp. 32, 75). The Cash Learning Partnership, a global humanitarian network working on policy, practice and research in cash and voucher assistance,arguesthatthereisasufficientlystrongfoundationoffinancialinfrastructure,microfinance,andsocialprotectionexperiencein Tonga to enable the use of cash transfers for emergency assistance, although noting thatfinancialservicesaresignificantlyweakeron the outer islands (Hobbs & Jackson, 2016, pp. 65, 86). The network recommends that the government and humanitarian actors should: further develop knowledge, policies, and assessment tools; incorporate cash transfers within the emergency cluster system; train andsensitizegovernmentofficialsinscaling

140
up social protection systems in emergencies; and collaborate with telecommunications and financialservicesprovidersintheprivatesectorto improve coordination and preparedness for future disaster responses (Hobbs & Jackson, 2016,pp.65,86).Asignificantconcernforthegovernment and civil society actors is that cash transfers could risk damaging traditional self- and community-recovery approaches, and could lead to excessive dependency on cash assistance in the future (Hobbs & Jackson, 2016, p. 65).
Vanuatu has no social protection schemes suitable for rapidly scaling up to support disaster relief and recovery. A UNICEF report argues that the lack of social protection and other social welfare services “limits the ability of the Government to lift vulnerable persons out of poverty and support economic growth” (Anderson et al., 2017b, p. 5). A feasibility
Across the Pacific region, various experts recommend ways of increasing financial inclusion although there is limited evidence about the extent to which financial inclusion supports disaster resilience. Various experts recommend promoting greater access to and useoffinancialservicesincludingdevelopingmore access points, agent networks, digital payment platforms, and mobile money systems (El-Zoghbi et al., 2017, p. 27; ESCAP, 2019, p. 24; Klapper et al., 2016, p. 9). In the longer term, efforts could be made to increase financialliteracyandawareness,especiallyamong marginalized populations (ESCAP, 2019, p. 23); develop regulatory frameworks that accommodate poorer households and improve consumer protection to increase trust inthefinancialsystem(ESCAP,2019,p.23);and incentivize the private sector to develop
study by Oxfam concluded that cash transfer programs could be considered as part of a possible emergency response in some parts of Vanuatu, depending on local capacities, but recommended that: training and pilot-testingshouldbeundertakentofillcapacitygaps; policies for cash transfer amounts should be set appropriately to meet needs; research should explore how to most effectively assist groups disproportionately affected by disasters; procedures for assessing the capacities of markets should be established as part of initial needsassessments;financialserviceprovidersshould be encouraged to extend services to rural and remote areas; systems for mass registration of recipients and establishing cash-out points should be established; and a gender and protection analysis should be undertaken (Holt & Hart, 2019, pp. 4–5).
financialservicesthatareresilientincrisisenvironments (El-Zoghbi et al., 2017, p. 27).
Fiji has a relatively high level of financial inclusion that contributes to disaster resilience; expansion of and is an important component of disaster recovery efforts. The Reserve Bank of Fiji set out objectives in the National Financial Inclusion Strategic Plan for 2016-2020 that include increasing the proportion of the populationservedbyformalfinancialinstitutionsfrom 64% to 85%, including at least 50% women (ReserveBankofFiji,2016,p.11).Specifictargets include empowering women, youth, and people living with disabilities by linking with civil society organizations and MSMEs, developing tailored products and services, and overcoming regulatory barriers; developing andstrengtheningfinancialinfrastructure;supportingthedevelopmentofdigitalfinancial
4.2.2. Financial Inclusion
141
services; developing new products and services that are relevant, affordable, and accessible; improvingfinancialliteracyandconsumerprotection; strengthening public-private sector collaboration and partnership; and improving the collection of data to inform policy and practice (Reserve Bank of Fiji, 2016, pp. 11–15). An ADB report recommends development of “a comprehensive consumer education programforfinancialservices”(Wehrhahnetal., 2019, p. 57) and encouraging the use of digitalfinancialservicesmuchmorewidelybypeople and MSMEs for routine household and business transactions, noting that this would likely strengthen disaster resilience and improve MSMEs’ access to credit (Wehrhahn et al., 2019, p. 62).
Papua New Guinea has a moderate level of financial inclusion by regional standards, but there appears to be no current focus on the role of financial inclusion in supporting disaster resilience. In Papua New Guinea, ESCAP recommends improving mobile telephone network performance, investing in basic infrastructure such as access to electricity, andinvestinginincreasingfinancialliteracyandawarenessoffinancialservices(Hahmet al., 2019, pp. 20–23). Papua New Guinea’s National Financial Inclusion Strategy calls for: supporting the innovative use of technology for scalingupfinancialaccess;expandingofdigitalfinanceservicestoreachremotepartsofthecountry; expanding micro-insurance coverage; improvingfinancialliteracyandfinancialeducation at all levels of the education system; introducing a consumer protection framework forregulatedfinancialinstitutions;enhancingaccesstoandusageoffinanceintheinformaleconomy, in agriculture, and among MSMEs; involving the natural resources sector in financialinclusion;improvingthecollectionanduseofdataonfinancialinclusiontoidentifyopportunities;andintegratingfinancialinclusionin local and national government planning and
implementation processes (Bank of Papua New Guinea, 2016, p. 4).
The level of financial inclusion in Samoa is similar to other Pacific island countries and other lower-middle-income countries on most indicators, and the country has little or no experience with cash transfers in disasters. In Samoa, ESCAP suggests promoting awareness, education,andconsumerconfidenceaboutfinancialservices,andstimulatingthedevelopmentofdigitalfinancialservicesbymaking government payments to individuals through bank transfers and mobile money systems rather than in cash (Hahm et al., 2019, pp. 20–24). The Central Bank of Samoa suggeststhatfinancialinclusioncouldbeincreasedthroughfinancialliteracyeducation,particularly focusing on insurance and mobile money; revisiting guidelines to allow bank agents to open new accounts as well as providing transactions; reducing minimum-balance requirements; and using remittances asanentrypointforbroadeningfinancialinclusion, leveraging them to encourage people to take up other products and services (Central Bank of Samoa, 2015, p. 38). Samoa’s National Financial Inclusion Strategy calls for increasing increase access to and use of financialservices,withparticularattentiontoincreasing access for women and for people in rural areas, developing products and services that suit the needs of more people including rural and low-income people, developing products and services designed for MSMEs andentrepreneurs,promotingdigitalfinancialservices including payment systems and mobile money services, developing inclusive insurance products and services, providing financialeducationforchildrenandadults,improving consumer protection, an improving sector-wide coordination (National Financial Inclusion Taskforce, 2017, pp. 2, 11–12). The IMF suggestspromotingnewfinancialtechnologies(fintechs)includingmobilemoneyandpayment

142
systems,promotingdigitalandfinancialliteracy,increasingcompetitioninthefinancialsector, collecting more and better data on financialinclusionandfinancialservices,continue working to establish a credit bureau and personal property registry, promote the economic use of customary land, improve financialbusinesseducation,andreviewandreform the Small Business Loan Guarantee Scheme to strengthen risk sharing and improve financialreporting(IMF,2015,para.57,2019,para. 13).
Solomon Islands has low levels of financial inclusion by regional standards and there is no significant experience of using financial inclusion to support disaster resilience. In Solomon Islands, ESCAP suggests that fostering cross-border mobile money services and improving mobile telephone network performance are key policy considerations (Hahm et al., 2019, p. 20). The Central Bank of SolomonIslandssuggeststhatfinancialinclusioncould be increased by encouraging banks to establish agents on more islands, tapping into strong savings practices that already exist,increasingfinancialeducation,andaddressing the disparity between women’s andmen’sfinancialinclusion(CentralBankofSolomon Islands, 2015b, p. 19). Priority areas identifiedintheNationalFinancialInclusionStrategy 2016-2020 are: increase the reach and qualityofdigitalfinancialservicesincludingmobile wallets, banking agent platforms, and digital payments in government and largebusinesses;improvedeliveryoffinancialservices to MSMEs; include women, youth and ruraladultsinthenationalfinancialsectorthroughsupportingsavings,financialliteracy,savings clubs, and mobile money; promote financialresiliencebyintegratingfinancialliteracy into the school curriculum, expanding microinsurance coverage, promote savings and pension products for the informal and rural economies, supporting semi-formal
savingsclubs,anddevelopingfinancialliteracytraining for rural areas; and develop consumer protection mechanisms and national standards forfinancialagents(CentralBankofSolomonIslands, 2015b, p. 11).
Tonga has a moderate level of financial inclusion by regional standards, and some experience using cash transfers to support disaster resilience. InTonga,increasingfinancialeducationandconsumerconfidenceshouldbe priorities (Hahm et al., 2019, pp. 17–18, 24). The Tongan government could support financialinclusionbyencouragingtheuseofbank transfers or mobile money for payments to citizens (Hahm et al., 2019, p. 23). The government has expressed interest in supporting theexpansionofmicrofinancefacilitiesforbusiness affected by TC Gita, with particular attention to meeting the needs of women handicraft producers (Government of Tonga, 2018b, p. 56).
Vanuatu has a moderate level of financial inclusion by regional standards, but little experience using cash transfers to support disaster resilience. In Vanuatu, ESCAP suggests that fostering cross-border mobile money services and improving mobile telephone network performance are key policy considerations (Hahm et al., 2019, p. 20), and recommend supporting the development of mobile money operators to reduce costs and increase convenience of domestic and international money transfers (Hahm et al., 2019, p. 22). A survey undertaken by the Cash Learning Partnership found that government and humanitarian respondents from Vanuatu felt that there was potential for using cash transfers in emergency response in the core islands but that most outlying islands lacked marketswithsufficientcapacity,andhighlightedconcerns included lack of knowledge and practical experience implementing cash and voucherprograms,pooraccesstofinancial
143
services, risk of fraud, poor coordination among the organizations that would be involved, and a potential to undermine longer-term development programming (Hobbs & Jackson, 2016, p. 29). The Reserve Bank of Vanuatu suggeststhatfinancialservicesproviderscouldexplorewaysto“improvethefitbetweentheirproducts and their clients’ needs” (Reserve Bank of Vanuatu, 2016a, p. 30). Vanuatu’s National Financial Inclusion Strategy aims to increase the number of active users of formal and semi-formalfinancialservicesanddevelopMSMEfinancingproductsby:creatinganenabling
policyenvironmentandfinancialinfrastructure;promoting and fostering inclusive products, services and channels; supporting MSME financing;andstrengtheningfinancialliteracyand consumer empowerment (Reserve Bank of Vanuatu, 2018, p. 23). The strategy notes that financialinclusionhelpspeoplemitigateshocksand manage expenses related to unexpected events including disasters (Reserve Bank of Vanuatu, 2018, p. 11), but does not recommend actionsspecificallyaimedatimprovingdisasterresilience.
In all of the countries examined in this report, the majority of people and businesses have no insurance covering natural hazards, and there are substantial barriers inhibiting demand and availability of insurance products. Demand for insurance products could potentially be increasedbyincreasingfinancial,insuranceand risk management literacy and awareness amongbeneficiaries,insurers,distributionchannels and governments (Schaefer & Waters, 2016, p. 99), supporting the development of a wider range of products, and increasing access tofinancialservicesincludingdevelopingchannels such as mobile phones (ADB, 2018a, p. 18). However, the poorest and most vulnerable people cannot afford insurance at market prices and may require some form of support (Schaefer & Waters, 2016, pp. 92–93). The insurance industry also requires support to develop new products tailored to local market conditions including improving the availability and use of local risk data (ADB, 2018a, p. 18). Parametric or index-based insurance could potentially be simpler, more transparent, and cheaper than indemnity insurance, but requires considerable technical capacity, data, communications capacity, and public awareness and education (ESCAP, 2015, pp. 17–19; Lucas, 2015, pp. 4–5). Globally, insurers often fail to target the MSME sector and insurance products are often not well-adapted to the needs of MSMEs (Chatterjee & Wehrhahn, 2017, p. 3; GIZ, 2019, p. 1).
In Fiji, households and businesses have limited access to insurance against natural hazards, and no agricultural insurance products are available. In Fiji, in addition to the measures suggested above, demand for insurance products could potentially be increased through improving regulations to raise publictrustandconfidence,undertakingacomprehensive consumer education program forfinancialservicesincludinginsurance,improving access to international insurance markets, and developing mechanisms to enable wider pooling of risk (Wehrhahn et al., 2019, pp. 33, 43, 65, 67). The high cost of insurance has been noted as a particular barrier for MSMEs in Fiji (Naidu & Chand, 2012). The insuranceindustrywouldbenefitfromsupporttodevelop new products (for homeowners and for businesses) tailored to local market conditions, which could involve changes to underwriting standards (ADB, 2018a, p. 18; Wehrhahn et al., 2019, pp. 46, 64), improving the availability and use of local risk data (ADB, 2018a, p. 18), orimprovinginsurancecompanies’financialreserves and mechanisms for pooling or reinsuring risk (Wehrhahn et al., 2019, pp. 47, 64–65). Conventional agricultural insurance products would be unaffordable for farmers in Fiji, and while index-based insurance may have potential, there is a lack of agricultural and weather data necessary to develop risk models (Maher & McCaffrey, 2012). A feasibility study on agriculture insurance in Fiji in 2017
4.2.3. Insurance
144
recommended that an index-based insurance productcoveringwind,flood,anddroughtrisks for sugarcane, dalo, cassava, ginger, coconut, and pineapple could be feasible, but recommended subsidizing premiums to make the product affordable (Fiji Crop and Livestock Council, 2017, cited in Wehrhahn et al., 2019, p. 52).
In Papua New Guinea, there may be some limited opportunities for expanding coverage by developing products tailored to local conditions. A World Bank “pre-feasibility” study of agricultural insurance concluded that the potential for agricultural insurance was limited but that there might be potential to develop indemnity-based or parametric insurance products to cover some cash crops and that ”potential next steps include the implementation of a full feasibility study for agricultural insurance, the design and implementation of crop insurance pilots, the creation of an Agricultural Insurance Committee, and the creation of a Technical Support Unit” (World Bank, 2016a, pp. 21–22). The National Financial Inclusion Strategy 2016-2020 calls for setting up an industry working group, enhancing knowledge and data on insurance services, introducing a regulatory framework for micro-insurance, further exploring the possibilities for agricultural insurance, supporting insurance providers in developing innovative products, assessing the possibility of including life and health insurance within pension schemes, and improving awareness of insurance among the population (Bank of Papua New Guinea, 2016, pp. 50–51). The strategy notes that the regulatory framework for micro-insuranceneedstobeclarified(BankofPapua New Guinea, 2016, p. 19).
In Samoa, the IMF argues that insurance sector regulation is weak and in need of reform. AnIMFreportnotesthatOfficeofInsuranceCommissioner under the Central Bank of Samoa relies on off-site supervision and lacks technical capacity,arguesthatfinancialreportingand auditing practices are inadequate and policyholder’s rights are not properly protected,
and recommends that procedures should be better documented and staff training should be a priority (IMF, 2015, paras. 43–44).
In Solomon Islands, the National Financial Inclusion Strategy has called for expanding micro insurance through product and channel innovation (Central Bank of Solomon Islands, 2015b, p. 10) but it is unclear what progress is being made.
In Tonga, there is currently no national regulator for the insurance industry, and establishing a regulator is seen as a priority (PCRAFI, 2015d, p. 35) and legislation for the licensing of insurance companies and other non-bank financialinstitutionswasbeingdraftedasof2019 (National Reserve Bank of Tonga, 2019, p. 23). The government’s post-disaster assessment of TC Gita recommended encouraging more businesses to insure structures and assets and reducingrisksbyretrofittingandconstructingbuildings in compliance with the building code (Kingdom of Tonga, 2018a, p. 28).
In Vanuatu, the government is seeking to encourage the development of insurance products tailored to local conditions. The government “considers the absence of microinsurance a key market failure that should be addressed to facilitate private sector growth”, noting that the absence of suitable insurance products for MSMEs is a barrier to investment, and calls for studying potential designs for insurance products suitable for informal markets and for the establishment of a private microinsurance market in Vanuatu (Government of Vanuatu, 2015b, p. 27). The government also recognizes the need to improve and enforce building standards and practices and to work with small builders and professionals to ensure uptake of improved standards (Government of Vanuatu, 2015b, p. 40). Vanuatu’s National Financial Inclusion Strategy calls for the development of inclusive insurance products that meet the needs of the excluded population, including insurance for MSMEs and value chains in the agriculture, fisheriesandtourismsectors(ReserveBankofVanuatu, 2018, p. 25).
145
4.2.4. Migration
Globally and across the Pacific region, there is a consensus that migration has beneficial outcomes and should generally be supported, managed, and integrated into environmental, climate change, and urban planning policies (Campbell & Warrick, 2014, p. 30; Melde & Laczko, 2017, pp. 87–89, 93). A World Bank reportrecommendsthat“Pacificgovernmentsshould prioritize labour mobility schemes and monitor their progress at the highest levels”, invest in relevant education and training, and invest in marketing strategies for their workers, and work to mitigate potential negative social impacts on families and communities (Curtain et al., 2016, pp. 33–37). The ILO recommends that Pacificislandcountriesshouldpromotelabormobility and seek opportunities both within and beyondthePacificregion,improveeducationand employment skills, and incentivize migrants to return home (ILO, 2017b, p. 127). The ILO also encourages countries that receive migrant workers to ensure that migration policies support development in source countries, to expand opportunities for low-skilled workers, to improve integration for new migrants, and to increase opportunities for migrants from countries particularly threatened by sea level rise(ILO,2017b,p.128).ThePacificQualificationFramework seeks to align national education and technical training standards across the Pacific,andFiji,PapuaNewGuinea,Samoa,Solomon Islands, Tonga, and Vanuatu have all “made progress in their development of nationalqualificationsagenciesandnationalqualificationsframeworks”alignedwiththisframework (ILO, 2019b, p. 23). The World Bank notes that there is a risk of “brain drain” for countries with skilled workers attracted to work overseas, and recommends that both migrant-sending and migrant-receiving countries should address this issue in migration policies, through skills development strategies (Curtain et al., 2016, pp. 35–36). There is a general lack
of knowledge about migration and climate changeacrossthePacificandaneedforbetter information about international and internal migration trends, the economic and social characteristics of migrants and vulnerable populations, the links among climate change, adaptation options, and migration policy, and the gender implications of migration (Campbell & Warrick, 2014, p. 30; Curtain et al., 2016, p. 36; Melde & Laczko, 2017, pp. 89–92).
Fiji has a large and established diaspora and a substantial body of skilled and unskilled migrant workers. Fiji’s National Adaptation Plan for climate resilience “seeks to facilitate orderly, safe, regular and responsible migration and mobility of people” (Government of Fiji, 2018b, p. 15), in line with the Sustainable Development Goals. The government of Fiji regulates recruitment agents, and the National Employment Centre supports migration of unskilled workers (mostly fruit pickers) including coordinating with the governments of the countries receiving migrant workers, supporting registered recruitment agents, and providing pre-departure training for workers (Sloan, 2019). Migration of skilled workers could lead to “brain drain” in Fiji, which should be addressed as part of a national skills investment strategy (Curtain et al., 2016, pp. 35–36; ILO, 2017a, p. 21, 2019b, p. 37) but it is uncertain whether current policies are addressing these concerns.
Experts who have reviewed Papua New Guinea’s existing systems for supporting labor migration have made several recommendations for improvement. Papua New Guinea has been described as lacking a proactive strategy to attract overseas employers and work with them through effective intermediaries, and lacking resources to manage the recruitment processefficientlyandprovideappropriatesupport to migrants (Curtain, 2018, p. 21). The ILO notes that Papua New Guinea could make

146
greater efforts to promote workers to overseas employers, improve pre-departure training and assistance, and offer reintegration assistance for returning workers to help them transfer skills developed overseas (ILO, 2017b, p. 127) and alsosuggeststhatallPacificislandcountriesthat have not developed national labor migration policies could consider examining the experiences of countries that have done so (notably Kiribati, Samoa, and Tuvalu), to help develop more effective national labor migration policies (ILO, 2019b, p. 39). Interviews with one cohort of participants in the Australian Seasonal Worker Program suggested that Papua New Guinea should increase the publicity given to the program, improve the selection process tofitcandidatestojobsmoreeffectivelyand more transparently, reduce barriers to participation affecting workers from outside Port Moresby, investigate ways of helping returning workers transition to improved and sustainable livelihoods once back in the country, improve pre-departure training with a component on occupational health and safety, arrange better support for workers overseas including workplace site visits, increase opportunities for training and skills development, improve pastoral care for workers, investigate the impacts of recruiting married versus unmarried workers, investigate strategies for encouraging the productive investment of remittances, consider providing reintegration assistance, and introduce transparent complaint procedures (Voigt-Graf, 2017, pp. 36–41). An ACP Observatory on Migration study in 2013 recommended that labor migration might be increased by improving education and training in rural areas for low-skilled workers, encouraging return migration of skilled workers, fostering seasonal worker schemes for Papua New Guineans to work in neighboring countries, setting up a recruitment agency to support job-seekers, and streamlining institutional processes such as strengthening commercial trade relations and simplifying visa procedures (Montoya & Au, 2013, pp. 33–35).
Migration is a well-established strategy in Samoa for seeking economic opportunities for both skilled and unskilled workers. In Samoa, the government pursues policies that encourage and support migration, including upgrading skills (especially in health and education), developing new skills (such as financialliteracy),supportingnewcategoriesof skilled workers (such as nurse practitioners), developing more liberal telecommunications regimes to reduce transaction costs, and seeking to identify and expand employment opportunities overseas for local workers (notably in New Zealand and Australia) (John Connell, 2015, paras. 175–177). The importance that Samoa places on supporting migration is demonstrated by the fact that engagement with New Zealand’s Recognised Seasonal Employer program “is based at the highest level,inthePrimeMinister’sOffice,ratherthaninthe Ministry of Labour which is the usual practice elsewhere” (John Connell, 2015, p. 175). Samoa suffers from “remarkably sparse” data on migrants and migration, perhaps because “migration is regarded as a free choice and not to be constrained in any way” (John Connell, 2015, p. 178).
The Solomon Islands government is actively promoting labor migration and seeking to dramatically increase the number of workers overseas. The World Bank made a series of recommendations in 2017 that included: revising the process of recruiting workers to increase supervision of recruitment agents and increase the capacity of the government’s Labor Mobility Unit to handle recruitment; improving the marketing of Solomon Islands as a source of labor; improving coordination across government to deliver a more effective program, maintain recruitment and training standards, and better engage with stakeholders (World Bank, 2017d, p. 69). Many of these recommendationsappeartobereflectedinthegovernment’s recently-adopted Labour Mobility Strategy (Solomon Islands Government, 2018, pp. 9–15).
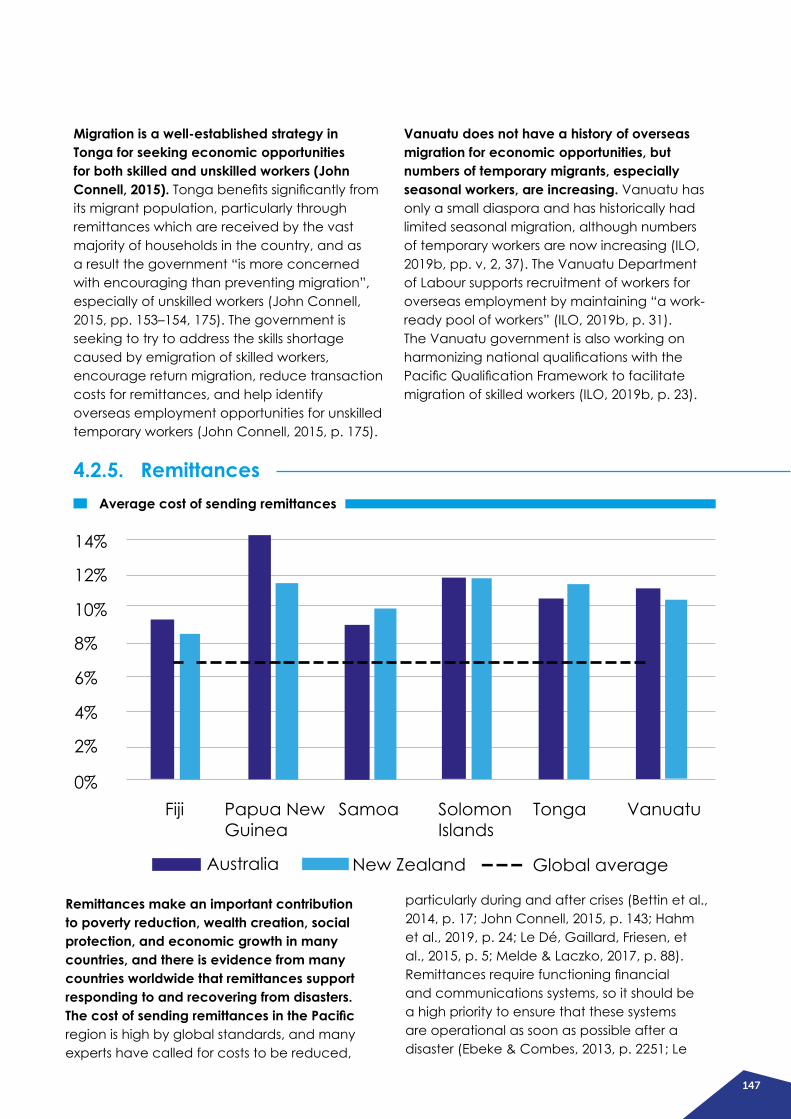
147
Migration is a well-established strategy in Tonga for seeking economic opportunities for both skilled and unskilled workers (John Connell, 2015).Tongabenefitssignificantlyfromits migrant population, particularly through remittances which are received by the vast majority of households in the country, and as a result the government “is more concerned with encouraging than preventing migration”, especially of unskilled workers (John Connell, 2015, pp. 153–154, 175). The government is seeking to try to address the skills shortage caused by emigration of skilled workers, encourage return migration, reduce transaction costs for remittances, and help identify overseas employment opportunities for unskilled temporary workers (John Connell, 2015, p. 175).
Remittances make an important contribution to poverty reduction, wealth creation, social protection, and economic growth in many countries, and there is evidence from many countries worldwide that remittances support responding to and recovering from disasters. The cost of sending remittances in the Pacific region is high by global standards, and many experts have called for costs to be reduced,
particularly during and after crises (Bettin et al., 2014, p. 17; John Connell, 2015, p. 143; Hahm et al., 2019, p. 24; Le Dé, Gaillard, Friesen, et al., 2015, p. 5; Melde & Laczko, 2017, p. 88). Remittancesrequirefunctioningfinancialand communications systems, so it should be a high priority to ensure that these systems are operational as soon as possible after a disaster (Ebeke & Combes, 2013, p. 2251; Le
Vanuatu does not have a history of overseas migration for economic opportunities, but numbers of temporary migrants, especially seasonal workers, are increasing. Vanuatu has only a small diaspora and has historically had limited seasonal migration, although numbers of temporary workers are now increasing (ILO, 2019b, pp. v, 2, 37). The Vanuatu Department of Labour supports recruitment of workers for overseas employment by maintaining “a work-ready pool of workers” (ILO, 2019b, p. 31). The Vanuatu government is also working on harmonizingnationalqualificationswiththePacificQualificationFrameworktofacilitatemigration of skilled workers (ILO, 2019b, p. 23).
4.2.5. Remittances
14%
12%
10%
8%
6%
4%
2%
0%Fiji
Australia New Zealand Global average
Papua New Guinea
Samoa Solomon
IslandsTonga Vanuatu
Average cost of sending remittances
148
Dé, Gaillard, Friesen, et al., 2015, p. 4). Across thePacificregion,someexpertsrecommendoffering training to migrants and to recipients of remittances to encourage greater use of remittances for longer-term investment, includingincreasingaccesstofinancialinstitutions and credit, and encouraging recipients to deposit funds to accumulate savings (Ebeke & Combes, 2013, p. 2252; Jayaraman et al., 2011, p. 538; Le Dé, Gaillard, Friesen, et al., 2015, p. 6; Melde & Laczko, 2017, p.88).Othermeasuresidentifiedregion-widethat can help support remittances in disaster situations include increasing migrants’ access tofinancialservicesinhostcountries(Bettinetal., 2014, p. 17), ensuring that systems are in place to enable people to identify themselves, includingtemporaryidentificationpapersifneeded (Le Dé, Gaillard, Friesen, et al., 2015, p. 5), and supporting tracing and contacting family members affected by disasters (Le Dé, Gaillard, Friesen, et al., 2015, p. 5).
Fiji receives substantial amounts of remittances which contribute to poverty reduction, wealth creation, social protection, economic growth, and disaster resilience. One academic study of the impact of remittances in Fiji recommends developingthefinancialsectortochannelremittanceinflowsintothebankingsystem,incentivizing recipients of remittances to deposit them in the banking system to accumulate savings and investment (possibly by offering higher interest rates for foreign currency deposits), and reducing the cost of sending and receiving remittances (Jayaraman et al., 2011, pp. 538–539). On the other hand, another study of the impact of remittances in Fiji and Tonga advises caution regarding attempts to channelremittancesintotheformalfinancialsector, observing that current informal channels areefficientand“arefunctioningquitewellinthe absence of policy interventions” and that “whatever policies are considered in relation to remittanceflowsandtheiruses,itisimperativethat the functioning of the existing informal
social protection system they provide should not be undermined” (Brown et al., 2014, p. 449). However, the authors do suggest designing and targeting formal social protection systems so as to complement informal remittances, reducing the costs of remittances, and broadening the useofmobilephonebasedfinancialservices(Brown et al., 2014, p. 449).
International remittances are a major source of income for households in Samoa, and make a large contribution to poverty reduction, wealth creation, social protection, and economic growth. Samoan, Tonga, and Fijian migrants in New Zealand highlighted the following priorities from their perspective: transaction costs; reliable communication with family members during and after a disaster; encouraging the investment of remittances in disaster preparedness; and closer collaboration among governments, faith-based organizations, and local NGOs to organize collective remittances (Pairama & Le Dé, 2018, pp. 337–340). Policy recommendations for Samoa arising from an IOM research and capacity-building project include (Le Dé, Gaillard, & Wardlow, 2015, p. 5):
• Keepfinancialandtelecommunicationssystems operational, provide transportation to money agents and banks, and provide internet access in emergency shelters;
• Support documentation such as temporary identificationcardsandfamilytracing;
• Support migrants by informing them about available money transfer options, reducing or eliminating fees during and after crises, enabling migrants to return home temporarily without jeopardizing jobs or visa status, supporting them to travel to disaster-affected locations, and investing in budget training bothforbothmigrantsandbeneficiaries;
• Integrate remittances in post-disaster assessments and improve social protection systems to target populations without access to remittances; and

149
• Include remittances in recovery programs by ensuring that recovery aid complements remittances, remittances are taken into account as part of household income streams, and giving households without access to remittances skills, support, and priority in migration schemes.
Tonga receives more remittances, as a percentage of its GDP, than any other country in the world, and remittances make a large contribution to poverty reduction, wealth creation, social protection, and economic growth.Severalexpertsarguethatfinancialeducation campaigns could help encourage alternatives to traditional money transfer operators, such as mobile money services (John Connell, 2015, p. 143; Hahm et al., 2019, p. 23), which are less expensive and would allow a greater proportion of the value of remittances toreachbeneficiaries.Atechnicalassistanceprogram in Tonga operated by the Organisation ofAfrican,CaribbeanandPacificStatesandthe European Union recommends a wide range ofmeasurestosupporttheflowofremittances,and although these recommendations do not directly address disaster relief and resilience, they would contribute to those objectives (Villacres, 2017):
• Optimise regulatory frameworks for preventing moneylaunderingandthefinancingofterrorism and invest in capacity building and tools for compliance;
• Reduce the cost of sending remittances by encouraging competition, supporting emerging actorsandnewfinancialtechnologies,removingthe country’s tax on foreign exchange, and improvingfinancialliteracy;
• Encourage the use of remittances for longer-term investment; and
• Engage with the diaspora more actively.
Remittances are a negligible source of income in Papua New Guinea, Solomon Islands, and Vanuatu because of low levels of labor migration. Region-wide, experts have made many recommendations for improving the impacts of remittances (discussed above), but most recommendations are of limited relevance to these countries because they send very few migrant workers overseas. In Solomon Islands,domesticremittanceshavebeenidentifiedasparticularlysignificant,andtheCentralBankofSolomon Islands recommends in the 2015 Financial Services Demand Side Survey that the country needs “an accessible domestic remittance solution” as a safer and more cost-effective solution to personally delivering cash, which is the method currently used by about 70% of those who send or receive domestic remittances, but it makes no recommendations regarding international remittances, which are only about one-tenth of domestic remittances (Central Bank of Solomon Islands, 2015a, pp. 12–13).
The need to relocate communities at risk of natural hazards has been recognized across all six countries reviewed in this report. Populations are generally reluctant to relocate, and it often happens that some members of a community either refuse to move or eventually return to their original homes. Recommendations for resettlement initiatives emphasize the importance of community participation and empowerment, providing community services in the new location, and preserving livelihoods and cultures. Access to land and natural resources are major barriers to relocation in most cases, and resettled populations often
endupinconflictwiththeirnewneighborsafterrelocation.
Fiji has undertaken several small-scale village relocations, and the government expects relocation to become “a more common response to climate related events in the future” (Government of Fiji, 2018a, p. 5). National guidelines and independent studies have emphasised the importance of full and genuine community participation and respect for rights, empowerment, culture, and livelihoods (Bertana, 2020; Government of Fiji, 2018a; Piggott-McKellar et al., 2019; Tronquet, 2015, p.
4.2.6. Resettlement
150
140). The country’s National Adaptation Plan for climate resilience calls for strengthening sub-national development planning processes to integrate mobility issues including relocation (Government of Fiji, 2018b, p. 52). The governmenthaspublishedofficialguidelinesto guide the process of planned relocation in response to climate change and disasters (Government of Fiji, 2018a, p. 5).
There have been multiple attempts to relocate settlements at extreme risk of natural hazards in Papua New Guinea, but these have often failed to produce positive, sustainable outcomes. Resettlement is invariably unwelcomed by resettled people and by host communities, and has often been equated with disempowerment and loss of autonomy. Governments are often reluctanttointervene,arerarelystrategic,finditdifficulttodealwithuncertainty,andareoftenunable or unwilling to address local concerns includingconflictsbetween‘hosts’and‘guests’(John Connell & Lutkehaus, 2017, pp. 24–25). The following recommendations have been made by various agencies and experts suggesting how outcomes for displaced people might be improved (Boege & Rakova, 2019, p. 14; John Connell & Lutkehaus, 2017, pp. 24–25; IOM, 2017, pp. 22–23):
• Community involvement: ensure that resettled groups and host communities are fully and meaningfully involved in all stages of the resettlement process, taking into account the needs, interests, and expectations of all stakeholders and recognizing that resettled populations are not homogeneous and that indecision, fragmentation, and division can exist within the population.
• Livelihood and inclusive development planning: provide for appropriate livelihoods, skills development and livelihood diversificationfordisplacedpopulations,ensuring food security, access to land and other resources, and opportunities for inclusive social and economic development.
• Service provision: provide humanitarian assistance including water, sanitation,
education, and shelter assistance and improve safety and security where people are resettled.
• Policy and institutional coordination: develop holistic national policies and integrate stakeholders including international actors, state institutions, local customary institutions, and civil society institutions, to provide the necessary social, physical and legal infrastructures for success
• Traditional knowledge: acknowledge and integrate traditional knowledge with modern climate science.
• Exit strategies: develop exit strategies so that temporary relocations do not become indefinite,andsupportdisplacedpeoplein planning and management of return, resettlement, or reintegration.
• Conflictsensitivity:recognizetheconflictpotential inherent in resettlement, and conductresettlementprogramsinaconflict-sensitive way.
• Time and resources: resettlement requires substantialleadtime,consultation,financialresources and management ability, all of which are rarely available, but resettlement has been least successful where responses to hazards required speed.
• Advanceplanning:developflexiblecontingency plans in advance to help ensure an effective response and accommodate uncertainty, noting that this requires an unusual level of collaboration between scientists, local people and government officials.
In Samoa, policies on relocating populations at risk are under discussion but have not been firmly established. Samoa’s National Disaster Management Plan notes that there is a need to“finddurablesolutionstodisplacementwhich may include return to places of origin, local integration or resettlement” and to “formulate public policies, where applicable, aimed at addressing the issues of prevention or relocation, where possible, of human
151
settlements in disaster risk-prone zones, subject to national law and legal systems” (Ministry of Natural Resources and Environment, 2018, pp. 14, 35). In rural coastal areas, some families have opted to resettle inland using land previously used for agriculture, while in the Apia urban area some have left their normal residences and people with adequate resources have bought land further inland (Nelson, 2020, p. 36). The government has started a consultative process to address the loss of land to coastal erosion and inundation (Nelson, 2020, p. 36). Barriers that will need to be resolved if relocation is to be a viable option for populations at risk include the lack of available and affordable land, and the challenge of breaking customary ties between a family and its ancestral lands (Meldau, 2013, p. 57). Practical recommendations for managing relocation processes, arising from case studies in Samoa and in São Tomé, include (Koskinen-Lewis et al., 2016, paras. 6–7):
• Engage with the community and leadership at each stage of a relocation process;
• Provide compensation to landholders or occupiers, and if a relocation site is already occupied, consider compensation, training, or livelihood assistance for the host community;
• Ensure access to livelihoods and services in relocation areas, and include the host population, if any, as well to defuse potential conflict;
• Keep families together to maintain the social fabric of a community;
• Planforstaffingneedsonthepartofagenciesimplementing the relocation process; and
• Prevent return, but ensure coastal access for communal, leisure, social, and small commerceuseincludingfishing,tourism,andother coastal-based livelihoods.
There have been multiple attempts to relocate settlements at extreme risk of natural hazards in Solomon Islands, with mixed results. In Solomon Islands, land ownership issues have been a major barrier to resettlement of populations at risk (Ha’apio,
Wairiu, et al., 2018, p. 362; Talo, 2008, pp. 42, 80, 86–87). A review of two instances of relocation recommends that the government, international development partners, and local communities should collaborate on developing policies on resettlement that build the long-term adaptation capacity of communities; communities must lead the decision-making process about their relocation and transformation; and governments should invest in building long-term resilience as well as addressing short-term issues including tenure (Ha’apio, Wairiu, et al., 2018, p. 363). Lessons from another case study suggest that resettlement can be both a crisis response and a more measured response to slow-onset problems; resettlement can be used to jump-start new projects such as improved provision of public services, and to bring together a broad assortment of stakeholders to collaborate; the resettlement process can be used to deploy measures that help communities leapfrog stages of development, such as switching from kerosene to solar power; disaster risk reduction and climate change adaptation measures can be mainstreamed into planning and design processes; and integrated approaches can support improvements and collaborations in environmental conservation or remediation (Filho et al., 2020, p. 185). Vanuatu, Fiji, and Kiribati are considered to be leaders in resettlement policy and practice, and guidelines developed in these countries may offer models to consider in the Solomon Islands (Benintende, 2019; IDMC, 2018, p. 29).
In Tonga, relocation of settlements is a sensitive undertaking but is being considered in development plans for some vulnerable areas, and some relocation of settlements has taken place as part of reconstruction efforts, notably following the 2009 tsunami in Niuatoputapu (John Connell, 2012, pp. 134, 136; Kingdom of Tonga, 2019). Tonga’s Third National Communication on Climate Change notes that community relocation “needs to be considered quite seriously in the coming decade”, identifying multiple vulnerable locations but notingthattheavailabilityoflandandfinancingaresignificantchallenges(KingdomofTonga,2019, pp. 98, 135–137).
152
All of the countries reviewed in this report have strong cultures of community-based support, traditional knowledge, traditional governance systems, and faith-based organizations that contribute to disaster resilience. Recommendations for disaster relief and reconstruction call for understanding, recognizing, preserving, and working alongside these existing practices which are deeply embedded in local culture.
In Fiji, UNDRR recommends that traditional practices should be valued and the systems sustaining the mechanisms should be protected to support community resilience (UNDRR, 2019b, p. 14). Effective early warning systems are helpful in giving communities time to respond to hazards (Gawith et al., 2016, p. 2102). Policy interventions can, in principle, complement community mechanisms, but these are likely to be highly context-dependent (Takasaki, 2015, p. 75).
In Papua New Guinea, an IOM report suggests integrating local knowledge into national and local level policies and programs through holding national and local meetings and exchanges to spread indigenous knowledge;
integrating indigenous knowledge in school curricula; using a variety of culturally-appropriate media to communicate indigenous knowledge; integrating indigenous knowledge and practices into community-based disaster preparedness; and training community leaders and teachers (Sithole et al., 2015, pp. 15–16).
In Samoa, understanding and incorporating the roles, functions, and strengths of traditional governance systems and their links to national government systems is considered to be important to support disaster risk reduction and recovery and climate change adaptation (Fletcher et al., 2013, p. 6; Government of Samoa, 2009, p. 22). Churches, in particular, play a central role in leading disaster resilience efforts and should be part of any interventions (Beyerl et al., 2018, pp. 35–36). Traditional knowledge and coping strategies are important mechanisms for enhancing disaster resilience, and “it is important that traditional ways of operating and supporting local communities are understood by external organizations seeking to offer support and provide humanitarian response” (Fletcher et al., 2013, p. 8). Blending the new construction of European-type houses with traditional knowledge of architecture, local
4.2.7. Community support
Several settlements in Vanuatu have been relocated in response to natural hazards, and a comprehensive national policy on relocation exists. Vanuatu’s national policy is considered to be a leader in incorporating relocation, internally displaced peoples’ rights, and cross-border movements into governance arrangements (IDMC, 2018, p. 29). It includes guidance aiming to minimize the drivers of
displacement and relocation; minimize their negative impacts; work towards durable solutions for displaced populations; ensure that displaced people and host populations can make voluntary and informed choices and participate in planning solutions; facilitate well-managed and safe migration; promote access to disaster-resilient housing; and integrate human mobility into other sectoral policy areas (NDMO, 2018).
153
building materials, and community-oriented life style may improve the resilience of buildings to natural hazards (Government of Samoa, 2013, p. 62). Cash-for-work programs have, in at least one instance, appeared to undermine traditional community support mechanisms by creating expectations of payment for work that would previously have been undertaken by community members voluntarily, so should be considered carefully within the local context (Fletcher et al., 2013, p. 7).
In Solomon Islands, the wantok system is a significantcontributortodisasterresilience,and should be understood and taken into account in building resilience and adaptation capacity (Ha’apio et al., 2019, pp. 515–518, 524; ILO, 2015, p. 2). Academic studies suggest that the national government should “create the conditions to enable communities and local governments to organize themselves and respond with self-initiatives for adaptation measures,custom-madeforthespecificlocalcontexts, rather than focusing on centrally-planned mitigation” (Ha’apio et al., 2019, p. 524). The government is increasingly recognizing the importance of traditional knowledge and is taking steps to capture traditional approaches to disaster risk reduction and disaster risk management (Vaike & Salili, 2020, p. 18); for example, the government’s Meteorological Services Division has a Traditional Knowledge Project that aims to record, archive, and revive traditional knowledge to enhance weather prediction and community resilience to extreme weather events and disasters (Meteorological
Services Division, 2017). Local traditional governance institutions are also extremely important and can vary across the country, and any national initiatives must take local systems into account and coordinate with them (Kelman, 2019, p. 409).
Tonga has a strong culture of sharing between families and within communities, which is an important social protection mechanism during crises (Hobbs & Jackson, 2016, p. 72). In Tonga, churches play an extremely important role in daily life and in responding to disasters (Hobbs & Jackson, 2016, p. 72), so coordination with local churches and their international networks could bebeneficialfordisasterreliefandrecoveryefforts.
In Vanuatu, the national Climate Change and Disaster Risk Reduction Policy calls for working collaboratively with and strengthening the capacity of local (including provincial and community) groups, traditional governance systems, and faith-based organizations working on climate change and disaster risk reduction decision-making and implementation (Government of Vanuatu, 2015a, pp. 9, 18–19). The government recognizes traditional knowledge and practices in disaster resilience and aims to collect and record them, incorporate them into planning, make traditional knowledge accessible to decision-makers, and include traditional knowledge in school curricula (Government of Vanuatu, 2015a, p. 14).
154
Annex: Background andMethodologyThis project is part of the Climate Risk Insurance Research Collaboration (CRIRC), a joint initiative of the United Nations University Institute for Environment and Human Security (UNU-EHS), the Munich Climate Insurance Initiative (MCII), theUniversityoftheSouthPacific(USP),TheUniversity of the West Indies (UWI) and the UnitedNationsPacificFinancialInclusionProgramme (PFIP). CRIRC partners undertake academic and policy-related research, share international experience, and develop programmestosupportdisasterriskfinance,insurance and social protection.
This report was commissioned to produce a summary of evidence about the economic impacts of natural hazards on poor and vulnerable populations in Fiji, Vanuatu, Tonga, Solomon Islands, Samoa and Papua New Guinea, based on the most current academic and professional literature available. The results are available in the form of this combined report addressing all six countries, and also as six individual country reports.
The project aimed to answer the following research questions:
1. What are the principal natural hazards that affect each of the countries of interest (Fiji, Vanuatu, Tonga, Samoa, Solomon Islands, and Papua New Guinea)?
2. How do these natural hazards affect people in vulnerable economic sectors, particularly small-scaleagricultureandfishing,workersinthe informal economy, and micro, small, and medium-sized enterprises in retail and tourism; and in vulnerable segments of the population, particularly women, youth, and migrants?
3. What support systems and coping mechanisms are available to support these sectors and populations?
4. What are the gaps in these support systems, and what opportunities might exist for strengthening them?
Thescopeoftheprojectwasdefinedtoinclude:
• Countries of interest: Fiji, Vanuatu, Tonga, Samoa, Solomon Islands, and Papua New Guinea.
• Natural hazards: All natural hazards that arereportedintheliteratureassignificantlyaffecting the countries of interest, including weather- and climate-related hazards, geophysical hazards, and rapid- and medium-onset events (including drought), but excluding slow-onset events such as sea level rise.
• Economic sectors: The project is primarily concerned with people whose livelihoods derivefromsmall-scaleagricultureandfishing,workers in the informal economy, and micro, small, and medium-sized enterprises in the tourism and retail sectors.
• Vulnerable populations: The project is concerned with segments of the population that are most vulnerable to natural hazards in each country, notably people who are poor and live in hazard-prone areas, with women, youth, and migrants being of particular interest.
• Impacts: The project will search for evidence of micro-economic impacts of natural hazards on the populations of interest, focusing on direct, short-term economic losses and immediate aid and reconstruction needs, which could in principle be compensated through insurance mechanisms, with limited attention on the implications for long-term development. It will not address macro-economic impacts, nor impacts on safety, health and life.
155
• Coping mechanisms: The project will provide an overview of compensation and coping mechanisms available to the populations ofinterest,includingofficialaidandreliefprogrammes as well as informal and community-based support systems, and present evidence, where available, about compensated and uncompensated losses, gaps in support systems, and opportunities for strengthening support systems to improve disaster resilience.
This project followed a “quick scoping review” research methodology, incorporating some of the rigorous procedures for searching for evidence that are used in systematic reviews and rapid evidence reviews but with limited scope, informal appraisal of evidence,andnoclassificationormappingof materials, as appropriate to the resources available for the project. An initial search for evidence used systematic keyword searching
in Scopus (scopus.com), Web of Science (webofknowledge.com), Google Scholar, and Google, using keywords for countries, the Pacificregion,andvariousnaturalhazards.Inaddition, websites of organizations known to be working on relevant issues were searched, and a project steering group was consulted for inputs. As the project progressed, further evidence was collected in an organic fashion by following up references in bibliographies of materials selected for inclusion to identify other relevant materials, and by targeted searchingusingGoogletofillininformationgaps. Selection of source material was biased towards meta-reviews, country-wide studies, and studies that look at hazards as a class rather than as individual incidents. Materials were only examined when they were freely available to the public online, or were available online through subscriptions accessible through the researcher’saffiliations.Onlymaterialpublishedin English was included.
156
ACAPS. (2018). Papua New Guinea: Manam Island Volcano - Madang. ACAPS. https://www. humanitarianresponse.info/sites/www.humanitarianresponse.info/files/documents/ files/20180907_acaps_needs_assessment_report_manam_island_volcano_png.pdf
ADB. (2013). TheeconomicsofclimatechangeinthePacific. Asian Development Bank. https:// www.adb.org/sites/default/files/publication/31136/economics-climate-change-pacific.pdf
ADB. (2016). TheSocialProtectionIndicator:AssessingResultsforAsiaandthePacific. Asian DevelopmentBank.https://www.adb.org/sites/default/files/publication/192971/spi-pacific-2016.pdf
ADB. (2018a).EconomicandFiscalImpactsofDisastersinthePacific. Asian Development Bank. https://www.adb.org/sites/default/files/publication/415601/economic-fiscal-impacts-disasters-pacific.pdf
ADB. (2018b). WomenandBusinessinthePacific.Asian Development Bank. https://www.adb.org/sites/default/files/publication/445821/women-business-pacific.pdf
ADB. (2019a). Solomon Islands.AsianDevelopmentBank,PacificLiaisonandCoordinationOffice.https://www.adb.org/sites/default/files/publication/530261/pacific-finance-sector-solomon-islands.pdf
ADB. (2019b). TheSocialProtectionIndicatorforthePacific:AssessingProgress. Asian Development Bank.https://www.adb.org/publications/social-protection-indicator-pacific-assessing-progress
ADB. (2020). Basic Statistics 2020. Asian Development Bank. https://www.adb.org/publications/basic-statistics-2020
Alatoa, H. (2012). Republic of Vanuatu: Updating and Improving the Social Protection Index. Asian DevelopmentBank.https://www.adb.org/sites/default/files/project-document/76087/44152-012-reg-tacr-34.pdf
Albert,S.,Leon,J.X.,Grinham,A.R.,Church,J.A.,Gibbes,B.R.,&Woodroffe,C.D.(2016).Interactions between sea-level rise and wave exposure on reef island dynamics in the Solomon Islands. Environmental Research Letters, 11(5), 054011. https://doi.org/10.1088/1748-9326/11/5/054011
Allen, B. (2018). Disaster Risk Reduction in Papua New Guinea.DepartmentofPacificAffairs, Australian National University. https://openresearch-repository.anu.edu.au/bitstream/1885/143481/1/bryant_allen_ib_2018_13.pdf
Allens. (2017). Housing, Land and Property Law in Tonga. International Federation of Red Cross andRedCrescentSocieties.https://reliefweb.int/sites/reliefweb.int/files/resources/2018_03_23_guidance_hlp_law_in_tonga.pdf
Allens. (2018). Housing, Land and Property Mapping Project: Solomon Islands. International Federation of Red Cross and Red Crescent Societies. https://www.sheltercluster.org/sites/default/files/docs/solomon_islands.docx
Amosa, D., & Samson, M. (2012). Samoa country case study. Australian Agency for International Development.https://www.dfat.gov.au/sites/default/files/samoa-case-study.pdf
References
157
Anderson, K., Barnes, R., Raoof, A., & Hamilton, C. (2017a). Situation Analysis of Children in Samoa. UnitedNationsChildren’sFund(UNICEF).https://www.unicef.org/pacificislands/media/1206/file/Situation-Analysis-of-Children-Samoa.pdf
Anderson, K., Barnes, R., Raoof, A., & Hamilton, C. (2017b). Situation Analysis of Children in Vanuatu. UnitedNationsChildren’sFund(UNICEF).https://www.unicef.org/pacificislands/media/1281/file/Situation-Analysis-of-Children-Vanuatu.pdf
Anderson, K., Barnes, R., Raoof, A., & Hamilton, C. (2019). Situation Analysis of Children in Tonga. UnitedNationsChildren’sFund(UNICEF).https://www.unicef.org/pacificislands/media/1251/file/Situation-Analysis-of-Children-Tonga.pdf
Annamalai,H.,Keener,V.,Widlansky,M.J.,&Hafner,J.(2015).ElNiñoStrengthensinthePacific:Preparing for the Impacts of Drought. In AsiaPacificIssues(AsiaPacificIssues122,Vol.2015,Issue122). https://scholarspace.manoa.hawaii.edu/bitstream/10125/38700/api122.pdf
ANZ. (n.d.). ANZPacificApp. ANZ.Com. https://www.anz.com/solomonislands/en/personal/ways-bank/anz-pacific-app/
AonBenfield.(2015).Global Catastrophe Recap:July2015.AonBenfield.http://thoughtleadership.aonbenfield.com/Documents/20150806-if-july-global-recap.pdf
AusAID. (2013). Six months on since Cyclone Evan. AusAID. https://reliefweb.int/report/samoa/six-months-cyclone-evan
Australian Bureau of Meteorology and CSIRO. (2014). Climate Variability, Extremes and Change intheWesternTropicalPacific:NewScienceandUpdatedCountryReports.Australian Bureau of MeteorologyandCommonwealthScientificandIndustrialResearchOrganisation.https://www.pacificclimatechangescience.org/publications/reports/climate-variability-extremes-and-change-in-the-western-tropical-pacific-2014/
Balaei, B., Wilkinson, S., & Potangaroa, R. (2019). Social capacities in fostering water supply resilience in Vanuatu. Disaster Prevention and Management: An International Journal, 28(5), 706–720. https://doi.org/10.1108/DPM-08-2018-0278
Bank of Papua New Guinea. (2016). National Financial Inclusion Strategy 2016-2020. Bank of PapuaNewGuinea.https://www.bankpng.gov.pg/wp-content/uploads/2014/08/PNG_NFI_&_FIL_STRATEGY_2014-2015_eCopy.pdf
Bank of Papua New Guinea. (2019). Licensed Financial Institutions. Bank of Papua New Guinea. https://www.bankpng.gov.pg/licensed-financial-institutions-lfi/
Barber, R. (2014). No Child Left Behind: EducationinCrisisintheAsia-PacificRegion. Save the ChildrenAustralia.https://protectingeducation.org/wp-content/uploads/documents/documents_save_the_children_australia_-_no_child_left_behind.pdf
Barber, R. (2018). Legal Preparedness for the Facilitation of International Humanitarian Assistance in the Aftermath of Vanuatu’s Cyclone Pam. Asian Journal of International Law, 8(1), 143–165. https://doi.org/10.1017/S2044251316000242
Bell, J., M, T., Amos, M., & N, A. (2016). ClimatechangeandPacificIslandfoodsystems. CGIAR Research Program on Climate Change, Agriculture and Food Security; Technical Centre for Agricultural and Rural Cooperation. https://hdl.handle.net/10568/75610

158
Benintende, E. (2019, October). The relocation of Taro Island. The Architectural League of New York. https://archleague.org/article/the-relocation-of-taro-island/
Bertana, A. (2020). The role of power in community participation: Relocation as climate change adaptation in Fiji. Environment and Planning C: Politics and Space, 239965442090939. https://doi.org/10.1177/2399654420909394
Bettin, G., Presbitero, A. F., & Spatafora, N. L. (2014). Remittances and Vulnerability in Developing Countries (IMF Working Paper WP/14/13). https://www.imf.org/external/pubs/ft/wp/2014/wp1413.pdf
Bettin, G., & Zazzaro, A. (2018). The Impact of Natural Disasters on Remittances to Low- and Middle-Income Countries. Journal of Development Studies, 54(3), 481–500. https://doi.org/10.1080/00220388.2017.1303672
Beyerl, K., Mieg, H. A., & Weber, E. (2018). Comparing perceived effects of climate-related environmentalchangeandadaptationstrategiesforthePacificsmallislandstatesofTuvalu,Samoa, and Tonga. Island Studies Journal, 13(1), 25–44. https://doi.org/10.24043/isj.53
Bill, H. (2012). Weaving a culture of resilience: a gender-sensitive approach to disaster risk reduction in Vanuatu and the Solomon Islands. French Red Cross. https://www.preventionweb.net/publications/view/31402
Boege, V., & Rakova, U. (2019). Climate Change-Induced Relocation: Problems and Achievements - the Carterets Case(PolicyBriefNo.33).TodaPeaceInstitute.https://toda.org/assets/files/resources/policy-briefs/t-pb-33_volker-boege-and-ursula-rakova.pdf
Bogdan, O., McPherlain, C. C., & Yoon, S. (2019). Gendered Impacts of Weather and Climate: EvidencefromAsia,PacificandAfrica. World Meteorological Organization. https://library.wmo.int/doc_num.php?explnum_id=10106
Bokwa, A. (2013). Natural Hazard. In P. T. Bobrowsky (Ed.), Encyclopedia of Natural Hazards (pp. 711–718).Springer.https://doi.org/10.1007/978-1-4020-4399-4_248
Brown, R. P. C., Connell, J., & Jimenez-Soto, E. V. (2014). Migrants’ Remittances, Poverty and Social ProtectionintheSouthPacific:FijiandTonga.Population, Space and Place, 20(5), 434–454. https://doi.org/10.1002/psp.1765
Brun, D. (2018). CARE Rapid Gender Analysis: Papua New Guinea - Highlands earthquake, 22nd of March 2018.CAREInternational.https://fscluster.org/sites/default/files/documents/care_rapid_gender_analysis_png_earthquake_28032018.pdf
Campbell, J., & Warrick, O. (2014). ClimateChangeandMigrationIssuesinthePacific. United NationsEconomicandSocialCommissionforAsiaandthePacific.https://disasterdisplacement.org/wp-content/uploads/2015/03/2.-Climate-Change-and-Migration-Issues-in-the-Pacific.pdf
Cardona, O. ., Aalst, M. K. van, Birkmann, J., Fordham, M., McGregor, G., Perez, R., Pulwarty, R. S., Schipper, E. L. F., & Sinh, B. T. (2012). Determinants of risk: exposure and vulnerability. In C. B. Field, V. Barros, T. F. Stocker, D. Qin, D. J. Dokken, K. L. Ebi, M. D. Mastrandrea, K. J. Mach, G.-K. Plattner, S. K. Allen, M. Tignor, & P. M. Midgley (Eds.), Managing the Risks of Extreme Events and Disasters to Advance Climate Change Adaptation. Cambridge University Press. https://www.ipcc.ch/site/assets/uploads/2018/03/SREX-Chap2_FINAL-1.pdf
159
CARE. (2015a). Initial Rapid Gender Assessment Report: Papua New Guinea 2015 El Niño. CARE. https://reliefweb.int/sites/reliefweb.int/files/resources/15_10_30_care_png_el_nino_gender_analysis_october_2015.pdf
CARE. (2015b). Rapid Gender Analysis, Cyclone Pam, Vanuatu. CARE. https://care.ca/wp-content/uploads/2018/12/RGA-Cyclone-Pam-Vanuatu-7-April-2015.pdf
CARE. (2018). Rapid Gender Analysis: Sub-focus on Shelter and Food Security and Livelihoods, Tropical Cyclone Gita, Kingdom of Tonga. CARE Australia. http://careevaluations.org/wp-content/uploads/RGA_tonga_tc_gita_2018.pdf
Catalán, H. E. N. (2018). Post-Disaster Needs Assessment: Gita Cyclone Report, Tonga 2018. Tonga Statistics Department. https://tongastats.gov.to/download/173/cyclone-gita-survey/4169/gita-cyclone-report
Central Bank of Samoa. (2015). Financial Services Demand Side Survey: Samoa. Central Bank of Samoa.http://www.pfip.org/wp-content/uploads/2016/08/Samoa-DSS-REPORT-web-version.pdf
Central Bank of Samoa. (2019). Licensed Financial Institutions (2019). Central Bank of Samoa. https://www.cbs.gov.ws/index.php/banking-system/supervison-and-regulation/
Central Bank of Solomon Islands. (2015a). Financial Services Demand Side Survey: Solomon Islands. CentralBankofSolomonIslands.http://www.pfip.org/wp-content/uploads/2016/08/Financial-Services-Demand-Side-Survey-Solomon-Islands.pdf
Central Bank of Solomon Islands. (2015b). Solomon Islands National Financial Inclusion Strategy 2016-2020. Central Bank of Solomon Islands. http://www.cbsi.com.sb/wp-content/uploads/2019/11/NFIS2-2016-2020_-Solomon-Islands.pdf
Central Bank of Solomon Islands. (2019). Gross Domestic Product (GDP) by Economic Activity - CurrentandConstantPriceValue(SI$million)&GrowthRates. Central Bank of Solomon Islands. http://www.cbsi.com.sb/statistics/key-statistics/
Central Bank of Solomon Islands. (2020). 2019 Annual Report. Central Bank of Solomon Islands. http://www.cbsi.com.sb/wp-content/uploads/2020/05/CBSI-Annual-Report-2019_FINALL.pdf
CFE-DM. (2019). Papua New Guinea Disaster Management Reference Handbook. Center for Excellence in Disaster Management & Humanitarian Assistance. https://www.cfe-dmha.org/DMHA-Resources/Disaster-Management-Reference-Handbooks
Charan, D., Kaur, M., & Singh, P. (2016). Indigenous Fijian Women’s Role in Disaster Risk Management and Climate Change Adaptation. PacificAsiaInquiry, 7(1), 106–122. https://www.uog.edu/schools-and-colleges/college-of-liberal-arts-and-social-sciences/pacific-asia-inquiry/V7.php
Chatterjee, A., & Wehrhahn, R. (2017). Insurance for Micro, Small, and Medium-sized Enterprises (ADBBriefsNo.78).AsianDevelopmentBank.https://www.adb.org/sites/default/files/publication/298101/insurance-msmes.pdf
Chattier, P. (2015). Women in the House (of Parliament) in Fiji: What’s Gender Got to Do with It? Round Table, 104(2), 177–188. https://doi.org/10.1080/00358533.2015.1017253
160
Clark, A., & Williams, P. (2018, March 1). Exxon’s LNG Plant in Papua New Guinea Could Be Shut for 6 Weeks After Quake. Insurance Journal. https://www.insurancejournal.com/news/international/2018/03/01/482003.htm
Clark, D. (2020). Papua New Guinea. In P. Barnes (Ed.), APacificDisasterPreventionReview. AustralianStrategicPolicyInstituteLimited.https://www.aspi.org.au/report/pacific-disaster-prevention-review
Clarke, D., & Azzopardi, P. (2019). StateofPacificYouth2017. United Nations Population Fund. https://pacific.unfpa.org/en/publications/state-pacific-youth-2017
Clissold, R., Westoby, R., & McNamara, K. E. (2020). Women as recovery enablers in the face of disasters in Vanuatu. Geoforum, 113, 101–110. https://doi.org/10.1016/j.geoforum.2020.05.003
Connell, Jacqueline. (2019). Vanuatu. In Asian Development Outlook 2019: Strengthening Disaster Resilience.AsianDevelopmentBank.https://www.adb.org/sites/default/files/publication/492711/ado2019.pdf
Connell,John.(2012).PopulationResettlementinthePacific:lessonsfromahazardoushistory?Australian Geographer, 43(2), 127–142. https://doi.org/10.1080/00049182.2012.682292
Connell,John.(2015).SamoaandTonga:MigrationandRemittancesintheTwenty-firstCentury.InW. H. Khonje (Ed.), Migration and Development: Perspectives from Small States. Commonwealth Secretariat. https://doi.org/10.14217/9781848599239-8-en
Connell,John,&Lutkehaus,N.(2017).EscapingZaria’sfire?ThevolcanoresettlementproblemofManam Island, Papua New Guinea. AsiaPacificViewpoint, 58(1), 14–26. https://doi.org/10.1111/apv.12148
Costella, C., & Ivaschenko, O. (2015). Integrating Disaster Response and Climate Resilience in SocialProtectionProgramsinthePacificIslandCountries.InSocialProtection and Labor Discussion Paper (Social Protection & Labor Discussion Paper 1507). https://openknowledge.worldbank.org/bitstream/handle/10986/22942/Integrating0di0fic0Island0Countries.pdf
Craig, D., & Bedford, R. (2013). Labour Mobility and Solomon Islands Development. Australian National University, State, Society & Governance in Melanesia Program. http://bellschool.anu.edu.au/sites/default/files/publications/attachments/2015-12/SSGM_IB_2013_18_0.pdf
Cramer, C. (2015). Jobs, Unemployment and Violence (GSDRC Professional Development Reading Pack No. 10.). University of Birmingham, Governance and Social Development Resource Centre. http://gsdrc.org/docs/open/reading-packs/jobsunemploymentviolencerp.pdf
Craven, L. K., & Gartaula, H. N. (2015). Conceptualising the Migration–Food Security Nexus: Lessons from Nepal and Vanuatu. Australian Geographer, 46(4), 455–471. https://doi.org/10.1080/00049182.2015.1058797
CRED. (2020). EM-DAT, The International Disaster Database. https://public.emdat.be/
Curtain, R. (2018). What can Papua New Guinea do to lift its numbers in the seasonal worker programs of Australia and New Zealand? Development Policy Centre, Australian National University. https://papers.ssrn.com/sol3/papers.cfm?abstract_id=3255353
161
Curtain, R., Dornan, M., Doyle, J., & Howes, S. (2016). Labour mobility: the ten billion dollar prize. WorldBank.http://pubdocs.worldbank.org/en/555421468204932199/pdf/labour-mobility-pacific-possible.pdf
Dannenberg, A. L., Frumkin, H., Hess, J. J., & Ebi, K. L. (2019). Managed retreat as a strategy for climate change adaptation in small communities: public health implications. Climatic Change, 153(1–2), 1–14. https://doi.org/10.1007/s10584-019-02382-0
Darko, E., Smith, W., & Walker, D. (2015). Gender violence in Papua New Guinea: The cost to business. ODI.https://www.odi.org/sites/odi.org.uk/files/odi-assets/publications-opinion-files/9886.pdf
Davies, H. L., Simeon, O. B., Hope, G., Petchey, F., & Davies, J. M. (2019). Past major tsunamis and the level of tsunami risk on the Aitape coast of Papua New Guinea. Natural Hazards, 96(3), 1019–1040. https://doi.org/10.1007/s11069-019-03585-5
Day, S. J., Forster, T., Himmelsbach, J., Korte, L., Mucke, P., Radtke, K., Thielbörger, P., & Weller, D. (2019). WorldRiskReport 2019 Focus: Water Supply. Bündnis Entwicklung Hilft and Ruhr University Bochum,InstituteforInternationalLawofPeaceandArmedConflict(IFHV).https://weltrisikobericht.de/english/
De Rosbo, S. (2020). Samoa - Telecoms, Mobile and Broadband - Statistics and Analyses. BuddeComm. https://www.budde.com.au/Research/Samoa-Telecoms-Mobile-and-Broadband-Statistics-and-Analyses
Department for Community Development. (2011). The National Informal Economy Policy 2011-2015. Department for Community Development and the Institute of National Affairs. http://www.inapng.com/pdf_files/Pages%28Black%29.pdf
Department for Community Development & Religion. (2015). National Policy on Social Protection. https://www.dfcd.gov.pg/images/pdf_files/Social-Protection-Policy.pdf
Department of Agriculture. (2009). Report on the Fiji National Agricultural Census 2009. Government ofFiji,DepartmentofAgriculture.http://www.fao.org/fileadmin/templates/ess/ess_test_folder/World_Census_Agriculture/Country_info_2010/Reports/Reports_3/FJI_ENG_REP_2009.pdf
Department of Foreign Affairs and Trade. (2018). Humanitarian preparedness and response: Tropical Cyclone Gita. https://www.dfat.gov.au/aid/topics/investment-priorities/building-resilience/humanitarian-preparedness-and-response/Pages/cyclone-gita
Dilmen, D. I., Titov, V. V., & Roe, G. H. (2015). Evaluation of the Relationship Between Coral Damage and Tsunami Dynamics; Case Study: 2009 Samoa Tsunami. Pure and Applied Geophysics, 172(12), 3557–3572. https://doi.org/10.1007/s00024-015-1158-y
Dimble, V., & Mobarak, A. M. (2019). Savingmicrofinancethroughinnovativelending(IGC Growth BriefSeriesNo.17).https://www.theigc.org/reader/saving-microfinance-through-innovative-lending/citation/
Dornan,M.,&NewtonCain,T.(2015).VanuatuandCyclonePam:Anupdateoneconomic,fiscaland development impacts. PacificEconomicMonitor,July, 23–27. https://researchonline.jcu.edu.au/43129/
162
Drazba, M. C., Yan-Richards, A., & Wilkinson, S. (2018). Landslide Hazards in Fiji, managing the risk and not the disaster, a literature review. Procedia Engineering, 212(2017), 1334–1338. https://doi.org/10.1016/j.proeng.2018.01.172
Ebeke, C., & Combes, J. L. (2013). Do remittances dampen the effect of natural disasters on output growth volatility in developing countries? Applied Economics, 45(16), 2241–2254. https://doi.org/10.1080/00036846.2012.659347
ECHO. (2019). PacificRegion. European Commission, European Civil Protection and Humanitarian AidOperations.https://reliefweb.int/sites/reliefweb.int/files/resources/pacific_region_2019-11-04.pdf
Edmonds,C.,&Noy,I.(2018).TheeconomicsofdisasterrisksandimpactsinthePacific.Disaster Prevention and Management: An International Journal, 27(5), 478–494. https://doi.org/10.1108/DPM-02-2018-0057
Edwards, J. B. (2013). The Logistics of Climate-Induced Resettlement: Lessons from the Carteret Islands, Papua New Guinea. Refugee Survey Quarterly, 32(3), 52–78. https://doi.org/10.1093/rsq/hdt011
El-Zoghbi, M., Chehade, N., McConaghy, P., & Soursourian, M. (2017). The Role of Financial Services in Humanitarian Crises. Consultative Group to Assist the Poor, State and Peace-Building Fund, and WorldBank.https://www.cgap.org/research/publication/role-financial-services-humanitarian-crises
Emilio, P. M., Warek, M., Poienou, M., Pomoso, F., Garalom, M., & Salimbi, J. (2015). New Guinea Islands Drought Assessment Report. Government of Papua New Guinea. https://reliefweb.int/sites/reliefweb.int/files/resources/NGIDrghtAssmentReportFinalisedmp.pdf
Eriksson,H.,Albert,J.,Albert,S.,Warren,R.,Pakoa,K.,&Andrew,N.(2017).Theroleoffishandfisheriesinrecoveringfromnaturalhazards:LessonslearnedfromVanuatu.Environmental Science & Policy, 76, 50–58. https://doi.org/10.1016/j.envsci.2017.06.012
ESCAP. (2015). Financing Disaster Risk Reduction for Sustainable Development in Asia and the Pacific.EconomicandSocialCommissionforAsiaandthePacific.https://www.unescap.org/sites/default/files/8-ESCAP_FfD_FinancingDisaster_24April2015.pdf
ESCAP. (2019). InequalityofOpportunityinAsiaandthePacific:FinancialInclusion. United Nations EconomicandSocialCommissionforAsiaandthePacific.https://www.unescap.org/sites/default/files/Financial-Inclusion-report.pdf
ExxonMobil. (2019). PNG LNG Environmental and Social Report – Annual 2018. ExxonMobil PNG Limited.https://www.banktrack.org/download/environmental_and_social_report/annual_report_2018_exxonmobil_png.pdf
Fabre, C. (2017). Cash-Based Response. Organization for Economic Co-operation and Development. https://www.oecd.org/development/humanitarian-donors/docs/cashbasedresponse.pdf
FAO. (2020). Selected indicators. FAOSTAT. http://www.fao.org/faostat/en/#country

163
Field, C. B., Barros, V. R., Mach, K. J., Mastrandrea, M. D., Aalst, M. van, Adger, W. N., Arent, D. J., Barnett, J., Betts, R., Bilir, T. E., Birkmann, J., Carmin, J., Chadee, D. D., Challinor, A. J., Chatterjee, M., Cramer, W., Davidson, D. J., Estrada, Y. O., Gattuso, J.-P., Hijioka, Y., Hoegh-Guldberg, O., Huang, H. Q., Insarov, G. E., Jones, R. N., Kovats, R. S., Romero-Lankao, P., Larsen, J. N., Losada, I. J., Marengo, J. A., McLean, R. F., Mearns, L. O., Mechler, R., Morton, J. F., Niang, I., Oki, T., Olwoch, J. M., Opondo, M., Poloczanska, E. S., Pörtner, H.-O., Redsteer, M. H., Reisinger, A., Revi, A., Schmidt, D. N., Shaw, M. R., Solecki, W., Stone, D. A., Stone, J. M. R., Strzepek, K. M., Suarez, A. G., Tschakert, P., Valentini, R., Vicuña, S., Villamizar, A., Vincent, K. E., R.Warren, L.L.White, T.J.Wilbanks, P.P.Wong, & Yohe, G. W. (2014). Technical summary. In C. B. Field, V. R. Barros, D. J. Dokken, K. J. Mach, M. D. Mastrandrea, T. E. Bilir, M. Chatterjee, K. L. Ebi, Y. O. Estrada, R. C. Genova, B. Girma, E. S. Kissel, A. N. Levy, S. MacCracken, P. R. Mastrandrea, & L.L.White (Eds.), Climate Change 2014: Impacts,Adaptation, and Vulnerability. Part A: Global and Sectoral Aspects. Contribution of Working Group II to the Fifth Assessment Report of the Intergovernmental Panel on Climate Change. Cambridge University Press.
Fiji Bureau of Statistics. (2015). 2013-14 Household Income and Expenditure Survey Preliminary Findings - Release 1.FijiBureauofStatistics.https://microdata.pacificdata.org/index.php/catalog/314/related-materials
Fiji Food Security and Livelihoods Cluster. (2016). Tropical Cyclone Winston: Food Security and Livelihoods Recovery Needs Assessment, November 2016. Fiji Food Security and Livelihoods Cluster andFijiMinistryofAgriculture.https://cop23.com.fj/wp-content/uploads/2017/06/Fiji_FSL-Recovery-Needs-Assessment_DRAFT_finalcompressed-1.pdf
Fiji Women’s Crisis Centre. (2013). Somebody’s Life, Everybody’s Business! National Research on Women’s Health and Life Experiences in Fiji (2010/2011): A survey exploring the prevalence, incidence and attitudes to intimate partner violence in Fiji. Fiji Women’s Crisis Centre. https://pacificwomen.org/wp-content/uploads/2017/09/FWCC-National-Research-on-Womens-Health-Fiji.pdf
Filho, W. L., Ha’apio, M. O., Lutz, J. M., & Li, C. (2020). Climate change adaptation as a development challenge to small Island states: A case study from the Solomon Islands. Environmental Science and Policy, 107, 179–187. https://doi.org/10.1016/j.envsci.2020.03.008
Fleming, L., Anthonj, C., Thakkar, M. B., Tikoisuva, W. M., Manga, M., Howard, G., Shields, K. F., Kelly, E., Overmars, M., & Bartram, J. (2019). Urban and rural sanitation in the Solomon Islands: How resilient are these to extreme weather events? Science of The Total Environment, 683, 331–340. https://doi.org/10.1016/j.scitotenv.2019.05.253
Fletcher, S. M., Thiessen, J., Gero, A., Rumsey, M., Kuruppu, N., & Willetts, J. (2013). Traditional Coping StrategiesandDisasterResponse:ExamplesfromtheSouthPacificRegion.Journal of Environmental and Public Health, 2013, 1–9. https://doi.org/10.1155/2013/264503
Ganesh, U., Kohli, P., Sinha, S., Arora, Y., Patnaik, S., Kaushal, A., & Borthakur, S. (2016). Seeding Social Enterprise in Papua New Guinea. Intellecap and United Nations Development Programme. https://www.pg.undp.org/content/papua_new_guinea/en/home/library/democratic-governance/seeding-social-enterprise-in-papua-new-guinea-.html
164
Gawith, D., Daigneault, A., & Brown, P. (2016). Does community resilience mitigate loss and damage from climate-related disasters? Evidence based on survey data. Journal of Environmental Planning and Management, 59(12), 2102–2123. https://doi.org/10.1080/09640568.2015.1126241
Gender & Protection Cluster. (2017a). Gender and Protection Monitoring Report: East Ambae. VanuatuNationalDisasterManagementOffice.https://ndmo.gov.vu/resources/downloads/category/69-iec-materials-ambae-2018?download=204:gpc-east-ambae-results-2017
Gender & Protection Cluster. (2017b). Gender and Protection Monitoring Report: North Ambae. VanuatuNationalDisasterManagementOffice.https://ndmo.gov.vu/resources/downloads/category/69-iec-materials-ambae-2018?download=206:gpc-monitoring_north-ambae
Gender & Protection Cluster. (2017c). Gender and Protection Monitoring Report: South Ambae. VanuatuNationalDisasterManagementOffice.https://ndmo.gov.vu/resources/downloads/category/69-iec-materials-ambae-2018?download=207:gpc-monitoring_south-ambae
Germanwatch. (2020). Climate Risk Insurance And Informal-Risk Sharing. Munich Climate Insurance Initiative.https://climate-insurance.org/wp-content/uploads/2020/05/Climate_risk_insurance_and_ISRA_Discussion_Paper_No_4_FINAL-2.pdf
GFDRR. (2016a). CountryProfile:PapuaNewGuinea. Global Facility for Disaster Reduction and Recovery(GFDRR).https://www.gfdrr.org/en/publication/country-profile-papua-new-guinea
GFDRR. (2016b). CountryProfile:SolomonIslands. Global Facility for Disaster Reduction and Recovery(GFDRR).https://www.gfdrr.org/en/publication/country-profile-solomon-islands
GFDRR. (2020). ThinkHazard! Global Facility for Disaster Reduction and Recovery (GFDRR), World Bank. https://thinkhazard.org/en/
Gildea, J., & Carmine, L. Z. (2018). Resettlement Plan: TON: Integrated Urban Resilience Sector Project: Flood Management Sub-Project. Asian Development Bank. https://www.adb.org/sites/default/files/project-documents/49455/49455-002-rp-en.pdf
Girls not Brides. (2020). Child Marriage Around the World. Girls not Brides. https://www.girlsnotbrides.org/where-does-it-happen/
GIZ. (2019). Insurance for Micro, Small and Medium Enterprise Development (Inclusive Insurance Factsheet Series). Deutsche Gesellschaft für Internationale Zusammenarbeit (GIZ) GmbH. https://www.giz.de/fachexpertise/downloads/giz2019-en-factsheet_insurance_msme.pdf
Good, M. K. (2019). Flexibility, Possibility and the Paradoxes of the Present: Tongan Youth Moving into the Future. In H. Lee (Ed.), PacificYouth:LocalandGlobalFutures. Australian National UniversityPress.https://library.oapen.org/bitstream/handle/20.500.12657/23599/pacific.pdf?sequence=1#page=39
Government of Fiji. (2013). Fiji Post-Disaster Needs Assessment: Tropical Cyclone Evan, 17th December 2012.GovernmentofFiji.https://www.gfdrr.org/en/publication/fiji-post-disaster-needs-assessment-tropical-cyclone-evan-december-17th-2012
165
Government of Fiji. (2016). Fiji Post-Disaster Needs Assessment: Tropical Cyclone Winston, February 20, 2016. GovernmentofFiji.https://www.gfdrr.org/sites/default/files/publication/PostDisasterNeeds Assessments CYCLONE WINSTON Fiji 2016 (Online Version).pdf
Government of Fiji. (2017a). 5-Year & 20-Year National Development Plan. Ministry of Economy, RepublicofFiji.https://www.fiji.gov.fj/getattachment/15b0ba03-825e-47f7-bf69-094ad33004dd/5-Year---20-Year-NATIONAL-DEVELOPMENT-PLAN.aspx
Government of Fiji. (2017b). Climate Vulnerability Assessment: Making Fiji Climate Resilient. Government of Fiji, World Bank, and Global Facility for Disaster Reduction and Recovery. http://documents.worldbank.org/curated/en/163081509454340771/pdf/120756-WP-PUBLIC-nov-9-12p-WB-Report-FA01-SP.pdf
Government of Fiji. (2018a). Planned Relocation Guidelines: A framework to undertake climate changerelatedrelocation.MinistryofEconomy,GovernmentofFiji.http://fijiclimatechangeportal.gov.fj/document/planned-relocation-guidelines-framework-undertake-climate-change-related-relocation
Government of Fiji. (2018b). Republic of Fiji National Adaptation Plan: A pathway towards climate resilience. Government of Fiji. https://www4.unfccc.int/sites/NAPC/Documents/Parties/National AdaptationPlan_Fiji.pdf
Government of Papua New Guinea. (2017). Papua New Guinea National Strategy to Prevent and Respond to Gender Based Violence, 2016-2025. Government of Papua New Guinea. http://www.femilipng.org/wp-content/uploads/2018/10/PNG-GBV_Strategy-2016-2025_150816.pdf
Government of Samoa. (2009). Samoa Post-Disaster Needs Assessment Following the Earthquake and Tsunami of 29th September 2009. Government of Samoa. https://www.gfdrr.org/en/publication/samoa-post-disaster-needs-assessment
Government of Samoa. (2013). Samoa Post-disaster Needs Assessment: Cyclone Evan 2012. Government of Samoa. https://www.gfdrr.org/en/publication/samoa-post-disaster-needs-assessment-cyclone-evan-2012
Government of Solomon Islands. (2013). Humanitarian Action Plan for the Santa Cruz Earthquake and Tsunami Response 2013. Government of Solomon Islands, Ministry of Environment, Climate Change,DisasterManagement&Meteorology.https://reliefweb.int/sites/reliefweb.int/files/resources/Humanitarian Action Plan.pdf
Government of Solomon Islands. (2014). Rapid Assessment of the Macro and Sectoral Impacts of Flash Floods in the Solomon Islands, April 2014. Government of Solomon Islands and The World Bank. https://www.gfdrr.org/sites/default/files/publication/pda-2014-solomonislands.pdf
Government of Solomon Islands. (2016). National Gender Equality and Women’s Development Policy 2016-2020. Ministry for Women, Youth, Children and Family Affairs, Government of Solomon Islands.https://www.pacificclimatechange.net/sites/default/files/documents/_national_gender_equality_and_womens_development_policy_2016-....pdf
166
Government of Tonga. (2018a). Joint National Action Plan 2 on Climate Change and Disaster Risk Management (JNAP 2): 2018-2028. Government of Tonga. https://www.preventionweb.net/english/professional/policies/v.php?id=60141
Government of Tonga. (2018b). Post-Disaster Rapid Assessment: Tropical Cyclone Gita. Government of Tonga. https://www.gfdrr.org/en/publication/post-disaster-rapid-assessment-tonga
Government of Vanuatu. (2015a). Vanuatu Climate Change and Disaster Risk Reduction Policy. SecretariatofthePacificCommunity.https://www.nab.vu/sites/default/files/nab/vanuatu_cc_drr_policy_minus_att4v4.pdf
Government of Vanuatu. (2015b). Vanuatu Post-Disaster Needs Assessment: Tropical Cyclone Pam, March 2015. Government of Vanuatu. https://www.gfdrr.org/en/publication/vanuatu-post-disaster-needs-assessment-tropical-cyclone-pam-march-2015
Graue, C. (2018, March 18). Papua New Guinea in bid to quake-proof buildings sitting on the Ring of Fire. Australian Broadcasting Corporation. https://reliefweb.int/report/papua-new-guinea/papua-new-guinea-bid-quake-proof-buildings-sitting-ring-fire
Guo, S., & Narita, F. (2018). Self-insurance Against Natural Disasters: The Use of Pension Funds inPacificIslandCountries. International Monetary Fund. https://www.imf.org/~/media/Files/Publications/WP/2018/wp18155.ashx
Gwatirisa, P. R., Pamphilon, B., & Mikhailovich, K. (2017). Coping with Drought in Rural Papua New Guinea: A Western Highlands Case Study. Ecology of Food and Nutrition, 56(5), 393–410. https://doi.org/10.1080/03670244.2017.1352504
Ha’apio, M. O., Gonzalez, R., & Wairiu, M. (2019). Is there any chance for the poor to cope with extreme environmental events? Two case studies in the Solomon Islands. World Development, 122, 514–524. https://doi.org/10.1016/j.worlddev.2019.06.023
Ha’apio, M. O., Morrison, K., Gonzalez, R., Wairiu, M., & Holland, E. (2018). Limits and Barriers to Transformation: A Case Study of April Ridge Relocation Initiative, East Honiara, Solomon Islands. In W. L. Filho (Ed.), Climate Change Impacts and Adaptation Strategies for Coastal Communities. Climate Change Management (pp. 455–470). Springer. https://doi.org/10.1007/978-3-319-70703-7_24
Ha’apio, M. O., Wairiu, M., Gonzalez, R., & Morrison, K. (2018). Transformation of rural communities: lessons from a local self-initiative for building resilience in the Solomon Islands. Local Environment, 23(3), 352–365. https://doi.org/10.1080/13549839.2017.1420640
Hahm, H., Subhanij, T., & Almeida, R. (2019). Finteching remittances in Paradise: a path to sustainable development (Macroeconomic Policy and Financing for Development DivisionWorking PaperSeriesWP/19/08).https://www.unescap.org/sites/default/files/publications/WP-19-08Fintechand Remittance Paper.pdf
Haines, P. (2016). Choiseul Bay Township Adaptation and Relocation Program, Choiseul Province, Solomon Islands.CoastAdapt.https://coastadapt.com.au/sites/default/files/case_studies/CSS3_Relocation_in_the_Solomon_Islands.pdf
167
Hallegatte, S., Rentschler, J., & Walsh, B. (2018). Building Back Better: Achieving resilience through stronger, faster, and more inclusive post-disaster reconstruction. https://openknowledge.worldbank.org/bitstream/handle/10986/29867/127215.pdf
Hallegatte, S., Vogt-Schilb, A., Bangalore, M., & Rozenberg, J. (2017). Unbreakable: Building the Resilience of the Poor in the Face of Natural Disasters. World Bank. https://openknowledge.worldbank.org/handle/10986/25335
Handmer, J., & Iveson, H. (2017). Cyclone Pam in Vanuatu: Learning from the low death toll. Australian Journal of Emergency Management, 32(2), 60–65. https://knowledge.aidr.org.au/media/3662/ajem-32-02-22.pdf
Handmer,J.,&Nalau,J.(2019).UnderstandingLossandDamageinPacificSmallIslandDevelopingStates. In R. Mechler, L. M. Bouwer, T. Schinko, S. Surminski, & J. Linnerooth-Bayer (Eds.), Loss and Damage from Climate Change: Concepts, Methods and Policy Options. Springer. https://link.springer.com/chapter/10.1007/978-3-319-72026-5_15
Hardin, J. (2020). Micro, Small and Medium-sized Enterprises’ Access to Finance in Samoa. United NationsEconomicandSocialCommissionforAsiaandthePacific.https://www.unescap.org/sites/default/files/MSMEfinancinginSamoa_toshare.pdf
Hobbs, C., & Jackson, R. (2016). CashTransferProgramminginthePacific:aFeasibilityScopingStudy. The Cash Learning Partnership. https://www.calpnetwork.org/wp-content/uploads/2020/01/calp-pacific-scoping-study-web.pdf
Hollema, S., Miller, D., & Chong, A. (2015). Cyclone Pam Impact Maps & Analysis. World Food Programme.https://fscluster.org/sites/default/files/documents/VanuatuWFP-VAMassessment-final.pdf
Holt, C., & Hart, S. (2019). Vanuatu Cash Transfer Feasibility Assessment. Oxfam Australia and Oxfam inVanuatu.https://www.preventionweb.net/files/globalplatform/5cda5138a0a2aOxfam_Vanuatu_CTP_Report_FINAL.pdf
Homan, S., Honda, T., Leung, L., Fulu, E., & Fisher, J. (2019). Transforming Harmful Gender Norms in Solomon Islands: A study of the Oxfam Safe Families Program. The Equality Institute, Monash University, and Oxfam Australia. https://www.oxfam.org.au/wp-content/uploads/2019/10/Transforming-Gender-Norms-Report-FINAL.pdf
Howes, S. (2018). Another bumper year for the Seasonal Worker Programme. Devpolicy Blog. https://devpolicy.org/another-bumper-year-for-the-seasonal-worker-programme-20180731/
Hsiang, S. M., & Jina, A. S. (2014). The Causal Effect of Environmental Catastrophe on Long-Run Economic Growth: Evidence from 6,700 Cyclones (NBER Working Paper 20352). http://www.nber.org/papers/w20352
Huber, C., & Fischer, V. (2020). Solomon Islands: Cash transfer feasibility study. CARE, Live & Learn, Oxfam, Save the Children, World Food Programme. and World Vision. https://resourcecentre.savethechildren.net/node/17639/pdf/stc01684_sols-cash-report_sc-compressed.pdf

168
Human Rights Watch. (2016). World Report 2016. Human Rights Watch. https://www.hrw.org/sites/default/files/world_report_download/wr2016_web.pdf
IASC. (2020). INFORM Global Risk Index Mid-2020. https://drmkc.jrc.ec.europa.eu/inform-index/
IDMC. (2018). Global Report on Internal Displacement. Internal Displacement Monitoring Centre. https://www.internal-displacement.org/publications/2018-global-report-on-internal-displacement
IDMC. (2019). Countryprofiles. Internal Displacement Monitoring Centre. https://www.internal-displacement.org/countries
Idris, I. (2016). Youth unemployment and violence: Rapid literature review. University of Birmingham, Governance and Social Development Resource Centre (GSDRC). https://gsdrc.org/wp-content/uploads/2016/11/YouthUnemployment_Violence.pdf
Idris, I. (2017a). Cash transfer platforms in humanitarian contexts. University of Birmingham, Governance and Social Development Resource Centre (GSDRC). https://gsdrc.org/publications/cash-transfer-platforms-in-humanitarian-contexts/
Idris, I. (2017b). Conflict-sensitivecashtransfers:unintendednegativeconsequences. Institute of DevelopmentStudies.https://gsdrc.org/publications/conflict-sensitive-cash-transfers-unintended-negative-consequences/
IFRC. (n.d.). Typesofdisasters:Definitionofhazard. International Federation of Red Cross and Red Crescent Societies. https://www.ifrc.org/en/what-we-do/disaster-management/about-disasters/definition-of-hazard/
IFRC. (2010). A Practical Guide to Gender-Sensitive Approaches for Disaster Management. International Federation of Red Cross and Red Crescent Societies. https://www.ifrc.org/PageFiles/96532/A Guide for Gender-sensitive approach to DM.pdf
IFRC. (2011). Final Report - Samoa: Earthquake and Tsunami. International Federation of Red Cross andRedCrescentSocieties.https://www.ifrc.org/docs/appeals/09/MDRWS001_FN.pdf
IFRC. (2016a). Emergency Plan of Action (EPoA) Solomon Islands: Earthquake. International FederationofRedCrossandRedCrescentSocieties.https://reliefweb.int/sites/reliefweb.int/files/resources/MDRSB006_DREF.pdf
IFRC. (2016b). Solomon Islands Red Cross reaches earthquake affected communities. International Federation of Red Cross and Red Crescent Societies. https://www.ifrc.org/en/news-and-media/news-stories/asia-pacific/solomon-islands/solomon-islands-red-cross-reaches-earthquake-affected-communities-73753/
IFRC. (2016c). Unseen,Unheard:Gender-BasedViolenceinDisasters:Asia-Pacificcasestudies. InternationalFederationofRedCrossandRedCrescentSocieties,AsiaPacificRegionalOffice.https://www.ifrc.org/Global/Publications/Gender and Diversity/GBV in disasters AP report LR.pdf
IFRC. (2016d). World Disasters Report: Resilience: saving lives today, investing for tomorrow (D. Sanderson & A. Sharma (eds.)). International Federation of Red Cross and Red Crescent Societies. https://www.ifrc.org/Global/Documents/Secretariat/201610/WDR2016-FINAL_web.pdf
169
IFRC. (2018a). Emergency Plan of Action (EPoA) Papua New Guinea: Volcanic Activity. International FederationofRedCrossandRedCrescentSocieties.https://reliefweb.int/sites/reliefweb.int/files/resources/MDRPG007DREF.pdf
IFRC. (2018b). Emergency Plan of Action Final Report - Tonga: Cyclone Gita. International Federation of Red Cross and Red Crescent Societies. https://reliefweb.int/report/tonga/tonga-cyclone-gita-emergency-plan-action-final-report-dref-n-mdrto001
ILO. (2014). Rural community rehabilitation through emergency public works in response to the deadlyflash-flooddamageintheSolomonIslands. International Labour Organization. https://www.ilo.org/wcmsp5/groups/public/---asia/---ro-bangkok/---ilo-suva/documents/publication/wcms_242095.pdf
ILO. (2015). Supportingthedefinitionandextensionofasocialprotectionfloor(SPF)inVanuatuandthe Solomon Islands: Final report. International Labour Organization. https://www.ilo.org/wcmsp5/groups/public/---asia/---ro-bangkok/---ilo-suva/documents/publication/wcms_419453.pdf
ILO. (2017a). AStudyontheFutureofWorkinthePacific.International Labour Organization, ILOOfficeforPacificIslandCountries.https://www.ilo.org/wcmsp5/groups/public/---asia/---ro-bangkok/---ilo-suva/documents/publication/wcms_553880.pdf
ILO. (2017b). ImprovingLabourMarketOutcomesinthePacific:PolicyChallengesandPriorities. International Labour Organization. https://www.ilo.org/wcmsp5/groups/public/---asia/---ro-bangkok/---ilo-suva/documents/publication/wcms_559066.pdf
ILO. (2018). Papua New Guinea Decent Work Country Programme 2018-2022. International Labour Organization. https://doi.org/10.1353/cp.2010.0036
ILO. (2019a). FutureofWorkforClimateResilienceinthePacificIslands. International Labour Organization.https://www.ilo.org/suva/publications/WCMS_712546/lang--en/index.htm
ILO. (2019b). LabourMobilityinPacificIslandCountries. International Labour Organization. https://www.ilo.org/wcmsp5/groups/public/---asia/---ro-bangkok/---ilo-suva/documents/publication/wcms_712549.pdf
ILO. (2020). ILOSTAT database. International Labour Organization. https://ilostat.ilo.org/data/
IMF. (2015). Financial System Stability Assessment. International Monetary Fund. https://www.imf.org/external/pubs/ft/scr/2015/cr15192.pdf
IMF. (2016). Small States’ Resilience to Natural Disasters and Climate Change - Role for the IMF. International Monetary Fund. https://www.imf.org/external/np/pp/eng/2016/110416.pdf
IMF. (2019). Samoa: Staff Concluding Statement of the 2019 Article IV Mission. International Monetary Fund. https://www.imf.org/en/News/Articles/2019/03/04/msc030419samoa-staff-concluding-statement-of-the-2019-article-iv-mission
IMF. (2020a). Financial Access Survey. IMFData.https://data.imf.org/?sk=E5DCAB7E-A5CA-4892-A6EA-598B5463A34C
170
IMF. (2020b). Tonga Technical Assistance Report - Climate Change Policy Assessment (IMF Countr). International Monetary Fund. https://www.imf.org/~/media/Files/Publications/CR/2020/English/1TONEA2020001.ashx
International Parliamentary Union. (2020). Monthly ranking of women in national parliaments. IPU Parline: Global Data on National Parliaments. https://data.ipu.org/women-ranking?month=10&year=2020
IOM. (2014). Helping Cyclone Victims in Papua New Guinea. International Organization for Migration. https://www.iom.int/news/helping-cyclone-victims-papua-new-guinea
IOM. (2017).ProfilingInternallyDisplacedPersonsinPapuaNewGuinea. International Organization forMigration.https://displacement.iom.int/reports/papua-new-guinea-–-profiling-idps-december-2017
IOM. (2019). Vanuatu - Ambae Evacuee Response, Returns Snapshot (14 — 18 March 2019). International Organization for Migration. https://displacement.iom.int/reports/ambae-evacuee-response-returns-snapshot-18-march-2019
IOM. (2020). Migration Data Portal. International Organization for Migration. https://migrationdataportal.org
Ireland, S. (2016).EducationDisrupted:DisasterImpactsonEducationintheAsiaPacificRegionin2015.SavetheChildren.https://resourcecentre.savethechildren.net/node/9956/pdf/education_disrupted_save_the_children_full_report.pdf
Jackson, G., McNamara, K., & Witt, B. (2017). A Framework for Disaster Vulnerability in a Small Island intheSouthwestPacific:ACaseStudyofEmaeIsland,Vanuatu.International Journal of Disaster Risk Science, 8(4), 358–373. https://doi.org/10.1007/s13753-017-0145-6
Jansen, H. A. F. M. (Henriette., Johansson-Fua, S., Hafoka-Blake, B., & ‘Ilolahia, G. R. (2012). National Study on Domestic Violence against Women in Tonga 2009.Ma`aFafinemoeFamiliInc.https://pacific.unfpa.org/sites/default/files/pub-pdf/tonga-vaw-report-final-2012.pdf
Jayaraman,T.K.,Choong,C.K.,&Kumar,R.(2011).RoleofremittancesinsmallPacificIslandeconomies: an empirical study of Fiji. International Journal of Economics and Business Research, 3(5), 526. https://doi.org/10.1504/IJEBR.2011.042316
Jennings, S., Manlutac, J. I., Gonzales, M. J., Kenni, L., Schweizer, L., & Giardina, D. (2020). “What will we eat while waiting for the crops to grow?” Oxfam. https://oxfamilibrary.openrepository.com/bitstream/handle/10546/620949/rr-what-will-we-eat-early-recovery-asia-pacific-180220-en.pdf
Jewkes, R., Fulu, E., Roselli, T., & Garcia-Moreno, C. (2013). Prevalence of and factors associated withnon-partnerrapeperpetration:findingsfromtheUNMulti-countryCross-sectionalStudyonMenandViolenceinAsiaandthePacific. The Lancet Global Health, 1(4), e208–e218. https://doi.org/10.1016/S2214-109X(13)70069-X
Jiang, M., Calgaro, E., Klint, L. M., Dominey-Howes, D., DeLacy, T., & Noakes, S. (2015). Understanding climate change vulnerability and resilience of tourism destinations. In S. Pratt & D. Harrison (Eds.), TourisminPacificIslands:CurrentIssuesandFutureChallenges. Routledge.
171
Jimenez-Soto, E. V., & Brown, R. P. C. (2012). Assessing the Poverty Impacts of Migrants’ Remittances UsingPropensityScoreMatching:TheCaseofTonga*.Economic Record, 88(282), 425–439. https://doi.org/10.1111/j.1475-4932.2012.00824.x
Kanemasu, Y., & Molnar, G. (2017). Private Military and Security Labour Migration: The Case of Fiji. International Migration, 55(4), 154–170. https://doi.org/10.1111/imig.12321
Keen, M., & McNeil, A. (2016). After the Floods: Urban Displacement, Lessons from Solomon Islands. Australian National University, State, Society & Governance in Melanesia Program. https://openresearch-repository.anu.edu.au/bitstream/1885/142787/1/ib-2016-13-keenmcneil_printweb_0.pdf
Kekea, G. (2020, September 15). ANZ Ends goMoney Mobile Phone Banking Services. Solomon Times. https://www.solomontimes.com/news/anz-ends-gomoney-mobile-phone-banking-services/10207#:~:text=TheANZBankisending,ausefulchannelforpeople
Kelman,I.(2019).PacificislandregionalpreparednessforElNiño.Environment, Development and Sustainability, 21(1), 405–428. https://doi.org/10.1007/s10668-017-0045-3
Kingdom of Tonga. (2009). Tsunami Recovery Priority Plan. Kingdom of Tonga. https://reliefweb.int/sites/reliefweb.int/files/resources/TsunamiRecoveryPriorityPlan.pdf
Kingdom of Tonga. (2018a). Disaster Recovery Framework for Tropical Cyclone Gita. Kingdom of Tonga. https://www.gfdrr.org/en/publication/disaster-recovery-framework-tropical-cyclone-gita
Kingdom of Tonga. (2018b). TC Gita 2018 Response Review Workshop Final Report. Kingdom ofTonga,ShelterClusterPacific,andInternationalFederationofRedCrossandRedCrescentSocieties.https://www.sheltercluster.org/sites/default/files/docs/20181016_tsc_response_review_report_final_1.pdf
Kingdom of Tonga. (2019). Third National Communication on Climate Change Report. Ministry of Meteorology, Energy, Information, Disaster Management, Environment, Climate Change and Communications. https://www4.unfccc.int/sites/SubmissionsStaging/NationalReports/Documents/158047_Tonga-NC3-1-FinalTNCReport_December2019.pdf
Kingdom of Tonga Ministry of Internal Affairs. (2019). Gender equality: Where do we stand? The Kingdom of Tonga.SecretariatofthePacificCommunityandKingdomofTongaMinistryofInternalAffairs.https://www.spc.int/DigitalLibrary/Doc/HDP/Gender/Gender_Equality_Where_do_we_stand_The_Kingdom_of_Tonga.pdf
Klapper, L., El-Zoghbi, M., & Hess, J. (2016). Achieving the Sustainable Development Goals: The Role of Financial Inclusion.https://www.cgap.org/sites/default/files/Working-Paper-Achieving-Sustainable-Development-Goals-Apr-2016_0.pdf
Kopel, E. (2017). The Informal Economy in Papua New Guinea: Scoping Review of Literature and Areas for Further Research. The National Research Institute, Papua New Guinea. https://www.pngnri.org/images/Publications/IP25-201704-The-informal-economy-in-PNG-Scoping-Study.pdf
Koskinen-Lewis, P., Carvalho, A. de, Dias, C. M., Fernandes, C., Diogo, O., Taulealo, L., Evalu, F. I., & Simi, N. (2016). Managing Population Retreat from At-Risk Areas. Global Facility for Disaster ReductionandRecovery(GFDRR).https://www.gfdrr.org/sites/default/files/publication/SISRIKnowledge Note 3 Participatory Population Retreat.pdf
172
Le Dé, L., Gaillard, J. C., & Friesen, W. (2015). Poverty and Disasters: Do Remittances Reproduce Vulnerability? The Journal of Development Studies, 51(5), 538–553. https://doi.org/10.1080/00220388.2014.989995
Le Dé, L., Gaillard, J. C., Friesen, W., Pupualii, M., Brown, C., & Aupito, A. (2016). Our family comes first:migrants’perspectivesonremittancesindisaster.Migration and Development, 5(1), 130–148. https://doi.org/10.1080/21632324.2015.1017971
Le Dé, L., Gaillard, J. C., Friesen, W., & Smith, F. M. (2015). Remittances in the face of disasters: a case study of rural Samoa. Environment, Development and Sustainability, 17(3), 653–672. https://doi.org/10.1007/s10668-014-9559-0
Le Dé, L., Gaillard, J. C., & Wardlow, F. (2015). Remittances and disaster: Policy implications for disaster risk management. International Organization for Migration. https://publications.iom.int/system/files/pdf/policy_brief_series_issue2.pdf
Lee, D., Zhang, H., & Nguyen, C. (2018). TheEconomicImpactofNaturalDisastersinPacificIslandCountries: Adaptation and Preparedness (IMF Working Paper WP/18/108). https://www.imf.org/en/Publications/WP/Issues/2018/05/10/The-Economic-Impact-of-Natural-Disasters-in-Pacific-Island-Countries-Adaptation-and-45826
Leith, R., & Subramanian, R. (2013). Building supervisory capacity to create inclusive insurance marketsinthePacific.PacificFinancialInclusionProgramme.http://www.microinsurancecentre.org/resources/documents/building-supervisory-capacity-to-create-inclusive-insurance-markets-in-the-pacific/download.html
Lucas, B. (2015). DisasterriskfinancingandinsuranceinthePacific (Helpdesk Research Report 1314). University of Birmingham, Governance and Social Development Resource Centre (GSDRC). https://gsdrc.org/publications/disaster-risk-financing-and-insurance-in-the-pacific/
Mackenzie-Reur, V. L., & Galgal, K. K. (2018). Building the Evidence Base on the Agricultural Nutrition Nexus: Vanuatu. Technical Centre for Agricultural and Rural Cooperation (CTA). https://cgspace.cgiar.org/bitstream/handle/10568/96917/2029_PDF.pdf
MAFFF. (2015). 2015 Tonga National Agricultural Census: Main Report. Ministry of Agriculture, Food, Forests and Fisheries (MAFFF); Tonga Statistics Department (TSD); Food and Agriculture Organization oftheUnitedNations(FAO).http://www.fao.org/fileadmin/templates/ess/ess_test_folder/World_Census_Agriculture/Country_info_2010/Reports/Reports_5/TON_ENG_REP_2015.pdf
Magee, A. D., Verdon-Kidd, D. C., Kiem, A. S., & Royle, S. A. (2016). Tropical cyclone perceptions, impactsandadaptationintheSouthwestPacific:anurbanperspectivefromFiji,VanuatuandTonga. Natural Hazards and Earth System Sciences, 16(5), 1091–1105. https://doi.org/10.5194/nhess-16-1091-2016
Maher, B., & McCaffrey, M. (2012). Weather Index-Based Insurance in Fiji: Brief on Initial Scoping (No.5;FocusNotes).PacificFinancialInclusionProgramme.http://www.pfip.org/wp-content/uploads/2016/08/PFIP-focus-weather-index-based-insurance-in-Fiji.pdf

173
Mahul, O., Cook, S., & Bailey, B. (2015). AdvancingDisasterRiskFinancing&InsuranceInThePacific. WorldBank.https://www.gfdrr.org/sites/default/files/publication/2015.06.25_PCRAFI_Combined-%5BCompressed%5D-rev-0.9.pdf
Mahul, O., KC, S., Stutley, C., Oliver, A., Kunda, J., & Siri, M. (2013). Papua New Guinea Agricultural Insurance Pre-Feasibility Study: Volume I Main Report. World Bank. https://www.indexinsuranceforum.org/sites/default/files/PNGFeasibilityStudy.pdf
Mansur, A., Doyle, J., & Ivaschenko, O. (2017). Social Protection and Humanitarian Assistance Nexus for Disaster Response: Lessons Learnt from Fiji’ s Tropical Cyclone Winston. World Bank, 1701, 56. https://doi.org/10.1596/26408
Mansur, A., Doyle, J., & Ivaschenko, O. (2018). Cash Transfers for Disaster Response: Lessons from Tropical Cyclone Winston. Australian National University. https://doi.org/10.2139/ssrn.3143459
Marcus, R., & Gavrilovic, M. (2010). The Impacts of the Economic Crisis on Youth: Review of Evidence. Overseas Development Institute. https://assets.publishing.service.gov.uk/media/57a08b1740f0b64974000970/60828_Youth-Evidence-Review-Final.pdf
Martyn, T., & Rogers, S. (2016). Food matters: Policy measures for strengthening food and nutrition securityinthePacificislandcountries. Food and Agriculture Organization of the United Nations, Sub-regionalOfficeforthePacific.http://www.fao.org/3/a-i6605e.pdf
Masson, V. Le, Lim, S., Budimir, M., & Podboj, J. S. (2016). Disasters and violence against women and girls: Can disasters shake social norms and power relations? Overseas Development Institute. https://www.odi.org/sites/odi.org.uk/files/resource-documents/11113.pdf
McMichael, C., Katonivualiku, M., & Powell, T. (2019). Planned relocation and everyday agency in low-lying coastal villages in Fiji. The Geographical Journal, 185(3), 325–337. https://doi.org/10.1111/geoj.12312
McNamara, K. E., & Prasad, S. S. (2014). Coping with extreme weather: communities in Fiji and Vanuatu share their experiences and knowledge. Climatic Change, 123(2), 121–132. https://doi.org/10.1007/s10584-013-1047-2
Meldau, A. (2013). Cyclone Evan in Samoa. In F. Gemenne, P. Brücker, & D. Ionesco (Eds.), The State of Environmental Migration 2013. Institut du développement durable et des relations internationales. https://publications.iom.int/system/files/pdf/state_environmental_migration_2013.pdf
Melde, S., De Bruyckere, L., Vigil, S., & Gemenne, F. (2017). Implications of migration, displacement and planned relocation for adaptation: Empirical results. In S. Melde, F. Laczko, & F. Gemenne (Eds.), Making Mobility Work for Adaptation: Results from the MECLEP Global Research. International Organization for Migration. https://environmentalmigration.iom.int/making-mobility-work-adaptation-environmental-changes-results-meclep-global-research
Melde, S., & Laczko, F. (2017). Conclusion: Implications for policy. In S. Melde, F. Laczko, & F. Gemenne (Eds.), Making Mobility Work for Adaptation: Results from the MECLEP Global Research. InternationalOrganizationforMigration.https://collections.unu.edu/eserv/UNU:6261/meclep_comparative_report.pdf
174
Meleisea, L. M., Meredith, M., Mow, M. I. C., Schoeffel, P., Lauano, S. A., Sasa, H., Boodoosingh, R., & Sahib, M. (2015). Political Representation and Women’s Empowerment in Samoa, Volume 1: Findings and Recommendations. Centre for Samoan Studies, National University of Samoa. https://www.pacwip.org/wp-content/uploads/2017/11/Political-Representation-and-Women’s-Empowerment-in-Samoa.pdf
Meteorological Services Division. (n.d.). Solomon Islands Climate in Brief. Solomon Islands Government, Ministry of Environment, Climate Change, Disaster Management, and Meteorology, Meteorological Services Division. https://www.met.gov.sb/solomon-islands-climate-in-brief
Meteorological Services Division. (2017). Traditional Knowledge Project Overview. Solomon Islands Government, Ministry of Environment, Climate Change, Disaster Management, and Meteorology, Meteorological Services Division. https://www.met.gov.sb/traditional-knowledge
Ming, M. A., Stewart, M. G., Tiller, R. E., Rice, R. G., Crowley, L. E., & Williams, N. J. (2016). Domestic violence in the Solomon Islands. Journal of Family Medicine and Primary Care, 5(1), 16. https://doi.org/10.4103/2249-4863.184617
Ministry for Women Community & Social Development. (2016). Samoa National Policy for Gender Equality. Ministry for Women, Community & Social Development, Government of Samoa. https://www.mwcsd.gov.ws/images/2017/Documents/DFSD/Samoa-gender-policy.pdf
Ministry of Commerce Industry Labour and Immigration. (2016). Micro, Small & Medium Enterprises (SMEs) Policy and Strategy. Solomon Islands Government, Ministry of Commerce Industry, Labour and Immigration. https://www.commerce.gov.sb/component/edocman/39-smes-policy-and-strategy.html
Ministry of Education and Training. (2020). Education Statistics: Basic Tables of 2019. Ministry of Education and Training, Vanuatu. https://moet.gov.vu/docs/statistics/2019 MoET Education StatisticsReport_2020.pdf
Ministry of Finance. (2019). Budget Statement 2019/20.GovernmentofTonga.http://www.finance.gov.to/sites/default/files/2020-02/bud_stmt_1920_en.pdf
Ministry of Finance. (2020). Quarterly Economic Review, Second Quarter FY2019/20 (Oct-Dec 2019). Ministry of Finance, Government of Samoa. https://www.mof.gov.ws/wp-content/uploads/2020/05/2Q19-20.pdf
Ministry of Finance and National Planning. (2018). Budget Statement 2018/19. Government of Tonga.http://www.finance.gov.to/sites/default/files/2018-07/BudgetStatement2018-19_toLA_1.pdf
Ministry of Natural Resources and Environment. (2018). National Disaster Management Plan 2017-2020. Ministry of Natural Resources and Environment, Government of Samoa. https://www.mnre.gov.ws/wp-content/uploads/2017/08/Samoa-national-disaster-management-plan-2017-2020-final-web.pdf
Montoya, M. S. C., & Au, R. S. (2013). South-South Labour Migratoin in Papua New Guinea: Which workersarefillingthegap? ACP Observatory on Migration and International Organization for Migration.https://www.researchgate.net/profile/Mariana_Cifuentes2/publication/261597720_SOUTH-SOUTH_LABOUR_MIGRATION_IN_PAPUA_NEW_GUINEA_Which_workers_are_filling_the_gap_OBSERVATORY_ON_MIGRATION_OBSERVATOIRE_ACP_SUR_LES_MIGRATIONS_OBSERVATORIO_ACP_DAS_MIGRACOES_O/
175
Morioka, K. (2016). Time to ACT on Gender, Climate Change and Disaster Risk Reduction: An overviewofprogressinthePacificregionwithevidencefromtheRepublicofMarshallIslands,Vanuatu and Samoa. United Nations Entity for Gender Equality and the Empowerment of Women (UN Women).
Moustafa, A. (2016). Samoa Hardship and Poverty Report: Analysis of the 2013/14 Household Income and Expenditure Survey.SamoaNationalStatisticsOfficeandUnitedNationsDevelopmentProgrammePacificCentre.https://www.sbs.gov.ws/digi/SamoaHardshipandPovertyReportFINAL- Jun27-2016.pdf
Mudd, G. M., Roche, C., Northey, S. A., Jowitt, S. M., & Gamato, G. (2020). Mining in Papua New Guinea: A complex story of trends, impacts and governance. Science of The Total Environment, 741, 140375. https://doi.org/10.1016/j.scitotenv.2020.140375
Muñoz, B. (2016, March 31). Floods and Landslides Follow Drought in PNG Highlands. IOM - UN Migration.https://weblog.iom.int/floods-and-landslides-follow-drought-png-highlands
Naidu,S.,&Chand,A.(2012).Acomparativestudyofthefinancialproblemsfacedbymicro,smalland medium enterprises in the manufacturing sector of Fiji and Tonga. International Journal of Emerging Markets, 7(3), 245–262. https://doi.org/10.1108/17468801211236974
Nalau, J., McNaught, R., & Dalesa, M. (2020). Vanuatu.InAPacificdisasterpreventionreview. AustralianStrategicPolicyInstituteLimited.https://www.aspi.org.au/report/pacific-disaster-prevention-review
Nam, S. (2017, September). Human Rights in Tonga: Women’s Rights Still Lacking. Borgen Magazine. https://www.borgenmagazine.com/human-rights-in-tonga/
Naser, M. (2015). Assessing the Evidence: Migration, Environment and Climate Change in Papua New Guinea. International Organization for Migration. https://environmentalmigration.iom.int/assessing-evidence-migration-environment-and-climate-change-papua-new-guinea
National Disaster Centre. (2018). Papua New Guinea: Highlands Earthquake Situation Report No. 1 (as of 10 March 2018). Papua New Guinea National Disaster Centre. https://reliefweb.int/sites/reliefweb.int/files/resources/png_earthquake_situation_report_1.pdf
National Financial Inclusion Taskforce. (2017). National Financial Inclusion Strategy for Samoa 2017-2020.NationalFinancialInclusionTaskforce(Samoa).http://www.pfip.org/wp-content/uploads/2017/01/NFISS-web.pdf
National Geographic. (2017, December). The Ring of Fire. National Geographic. https://www.nationalgeographic.co.uk/science/2017/12/ring-fire
National Geophysical Data Center / World Data Service (NGDC/WDS). (2020). GlobalSignificantEarthquake Database. National Oceanic and Atmospheric Administration (NOAA), National Centers for Environmental Information. https://doi.org/10.7289/V5TD9V7K
National Parliament of Solomon Islands. (2019). About us. National Parliament of Solomon Islands. http://www.parliament.gov.sb/index.php?q=node/1153
176
National Reserve Bank of Tonga. (2017). Financial Services Demand Side Survey, Tonga. National ReserveBankofTonga.http://www.pfip.org/wp-content/uploads/2017/08/TONGA-DSS-REPORT-LOWRES-FINAL.pdf
National Reserve Bank of Tonga. (2019). Annual Report 2018 - 2019. National Reserve Bank of Tonga. http://www.reservebank.to/data/documents/Publications/AnnualReports/NRBT_AR_201819_ENG.pdf
NationalStatisticalOffice.(2009).2009-2010 Papua New Guinea Household Income and Expenditure Survey - Summary Tables.
NationalStatisticalOffice.(2019).Papua New Guinea National Accounts 2010 to 2017. National StatisticalOffice.https://www.nso.gov.pg/statistics/economy/gross-domestic-products/
NDMO. (2018). National Policy on Climate Change and Disaster-Induced Displacement. Vanuatu NationalDisasterManagementOffice.https://www.iom.int/sites/default/files/press_release/file/iom-vanuatu-policy-climate-change-disaster-induced-displacement-2018.pdf
Nelson, F. (2020). Samoa. In P. Barnes (Ed.), APacificDisasterPreventionReview. Australian Strategic PolicyInstituteLimited.https://www.aspi.org.au/report/pacific-disaster-prevention-review
New Zealand Immigration. (2020). Information about Samoan Quota Resident Visa. New Zealand Immigration. https://www.immigration.govt.nz/new-zealand-visas/apply-for-a-visa/about-visa/samoan-quota-scheme-resident-visa
Nimau, J. T., Ungaro, J., Crowley, K., Korisa, P., Garaebiti, E., & Cevuard, S. (2019). Ashfall Case Study: Key Literature. National Institute of Water and Atmospheric Research (New Zealand). https://www.geonode.gov.vu/documents/338
OCHA. (2009). Samoa/Tonga Tsunami Situation Report No. 11. https://reliefweb.int/sites/reliefweb.int/files/resources/D1B309DD2B7B7FC8492576580002B102-Full_Report.pdf
OCHA. (2015). ElNiñointhePacific.UnitedNationsOfficefortheCoordinationofHumanitarianAffairs(OCHA).https://www.humanitarianresponse.info/sites/www.humanitarianresponse.info/files/documents/files/rop_hb_nov18.pdf
OECD. (2020). OECD.Stat. Organisation for Economic Co-operation and Development. https://stats.oecd.org/
OfficeofDevelopmentEffectiveness.(2017).HumanitarianAssistanceinthePacific:anEvaluationof the Effectiveness of Australia’s Response to Cyclone Pam. Department of Foreign Affairs and Trade(Australia).https://www.dfat.gov.au/sites/default/files/cyclone-pam-evaluation.pdf
OfficeoftheOmbudsman.(2018).National Public Inquiry into Family Violence in Samoa. Samoa OfficeoftheOmbudsmanandNationalHumanRightsInstitution.https://ombudsman.gov.ws/wp-content/uploads/2019/01/National-Inquiry-Report-into-Family-Violence_-State-of-Human-Rights-Report-2018-SUMMARY_English.pdf
Oxford Business Group. (2019a). Greater insurance coverage to mitigate natural disaster risks in Papua New Guinea. In The Report: Papua New Guinea 2019. Oxford Business Group. https://oxfordbusinessgroup.com/analysis/risky-business-mitigating-risk-natural-disasters-greater-coverage
177
Oxford Business Group. (2019b). Papua New Guinea introduces insurance reforms to improve regulations and product offering. In The Report: Papua New Guinea 2019. Oxford Business Group. https://oxfordbusinessgroup.com/overview/policy-pathway-reforms-aim-improving-regulation-and-product-offering
Oxford Business Group. (2020). Will reforms boost insurance penetration in Papua New Guinea? In The Report: Papua New Guinea 2020. Oxford Business Group. https://oxfordbusinessgroup.com/overview/staying-afloat-ongoing-reforms-and-large-scale-resource-projects-should-help-boost-insurance
PacificFinancialInclusionProgramme.(2019,November1).MobileMoneyServicesNowAvailablein Vanuatu. PacificFinancialInclusionProgramme.http://www.pfip.org/newsroom/programme-update/2019-2/mobile-money-services-now-available-in-vanuatu/
PacificWomeninPolitics.(2020a). Samoa. PacificWomeninPolitics.https://www.pacwip.org/country-profiles/samoa/
PacificWomeninPolitics.(2020b).Solomon Islands.PacificWomeninPolitics.https://www.pacwip.org/country-profiles/solomon-islands/
Pairama,J.,&LeDé,L.(2018).RemittancesforDisasterRiskManagement:PerspectivesfromPacificIsland Migrants Living in New Zealand. International Journal of Disaster Risk Science, 9, 331–343. https://doi.org/10.1007/s13753-018-0183-8
Parsons, M., Brown, C., Nalau, J., & Fisher, K. (2018). Assessing adaptive capacity and adaptation: insights from Samoan tourism operators. Climate and Development, 10(7), 644–663. https://doi.org/10.1080/17565529.2017.1410082
Paul, S. (2016). Fiji National Employment Policy – Draft Framework.UniversityoftheSouthPacificandUniversityofWesternSydney.https://www.researchgate.net/publication/322538468_Fiji_National_Employment_Policy-Draft_Framework
PCRAFI. (2011a). CountryRiskProfile:Fiji.PacificCatastropheRiskAssessmentandFinancingInitiative.https://www.pacificclimatechange.net/sites/default/files/PCRAFI_country-risk-profile_Fiji.pdf
PCRAFI. (2011b). CountryRiskProfile:PapuaNewGuinea.PacificCatastropheRiskAssessmentandFinancingInitiative.http://pcrafi.spc.int/documents/177
PCRAFI. (2011c). CountryRiskProfile:Samoa.PacificCatastropheRiskAssessmentandFinancingInitiative.http://pcrafi.spc.int/documents/171
PCRAFI. (2011d). Country RiskProfile:SolomonIslands.PacificCatastropheRiskAssessmentandFinancingInitiative.http://pcrafi.spc.int/documents/185
PCRAFI. (2011e). CountryRiskProfile:Tonga.PacificCatastropheRiskAssessmentandFinancingInitiative.http://pcrafi.spc.int/documents/135
PCRAFI. (2011f). CountryRiskProfile:Vanuatu.PacificCatastropheRiskAssessmentandFinancingInitiative.http://pcrafi.spc.int/documents/136

178
PCRAFI. (2013a). Catastrophe Risk Assessment Methodology.WorldBank,SecretariatofthePacificCommunity,andAsianDevelopmentBank.https://www.gfdrr.org/sites/default/files/publication/PCRAFI_Catastrophe_Risk_Assessment_Methodology.pdf
PCRAFI. (2013b). CountryRiskProfile:SolomonIslands.PacificCatastropheRiskAssessmentandFinancingInitiative.http://pcrafi.spc.int/documents/190
PCRAFI. (2015a). Country Note: Fiji.WorldBank.http://pcrafi.spc.int/documents/193
PCRAFI. (2015b). Country Note: Samoa.WorldBank.http://pcrafi.spc.int/documents/172
PCRAFI. (2015c). Country Note: Solomon Islands.WorldBank.http://pcrafi.spc.int/documents/185
PCRAFI. (2015d). Country Note: Tonga.WorldBank.http://pcrafi.spc.int/documents/186
PCRAFI. (2015e). Country Note: Vanuatu.WorldBank.http://pcrafi.spc.int/documents/183
PCRAFI. (2018). Volcano Risk in Vanuatu: Can Insurance Play a Role ?PacificCatastropheRiskAssessment and Financing Initiative. https://www.gfdrr.org/en/publication/volcanic-risk-vanuatu-can-insurance-play-role
Perrottet,J.,&Garcia,A.F.(2016).PacificPossible:Tourism. http://pubdocs.worldbank.org/en/95491462763645997/WB-PP-Tourism.pdf
Perumal, N. (2018). “The place where I live is where I belong”: community perspectives on climate changeandclimate-relatedmigrationinthePacificislandnationofVanuatu.Island Studies Journal, 13(1), 45–64. https://doi.org/10.24043/isj.50
PFIP. (2018). Improving Financial Inclusion In The Region.PacificFinancialInclusionProgramme.https://www.forumsec.org/2018/05/09/2018-femm-improving-financial-inclusion-in-the-region/
Piggott-McKellar, A. E., McNamara, K. E., Nunn, P. D., & Sekinini, S. T. (2019). Moving people in a changing climate: Lessons from two case studies in Fiji. Social Sciences, 8(5). https://doi.org/10.3390/socsci8050133
Pita, M. S. V., & Schoop, J. (2015). Samoa National Action Plan on Youth Employment (SNAP). Ministry of Women Community and Social Development, Government of Samoa. https://samoayouthemployement.files.wordpress.com/2015/12/samoa-national-action-plan-web.pdf
Prasad, B., Chen, H., & Singh, B. (2013). An analysis of employment prospects in Fiji’s urban area. TheJournalofPacificStudies,33(2),30–47.http://repository.usp.ac.fj/7648/1/An_Analysis_of_Employment_prospects_in_Fiji’s_Urban_Area.pdf
Prochaska, K., Levula, V., & Levula, A. (2018). Reserve Bank of Fiji’s Experience with Financial Inclusion and Climate Change.AllianceforFinancialInclusion.https://www.afi-global.org/sites/default/files/publications/2018-11/AFIFICC_Fiji_casestudy_AW_digital.pdf
Radio New Zealand. (2019a, January 22). Vanuatu government approves return to Ambae. Radio New Zealand.https://www.rnz.co.nz/international/pacific-news/380617/vanuatu-government-approves-return-to-ambae
179
Radio New Zealand. (2019b, August 27). Tonga schools still in tents 17 months after Cyclone Gita. RNZ.https://www.rnz.co.nz/international/pacific-news/397548/tonga-schools-still-in-tents-17-months-after-cyclone-gita
Radio New Zealand International. (2013, May 17). Samoa women’s NGO says farmers nearly back to business after Evan. Radio New Zealand International. https://web.archive.org/web/20130809195932/http://www.rnzi.com/pages/news.php?op=read&id=76324
Ramachandran, V., & Masood, J. S. (2019). ArethePacificIslandsInsurable?ChallengesandOpportunities for Disaster Risk Finance (Working Paper 516). https://www.cgdev.org/publication/are-pacific-islands-insurable-challenges-opportunities-disaster-risk-finance
Ravesloot, B., & Sobir, R. (2017). Post-Disaster Educational Continuity in Fiji and the Impact of Disaster Risk Reduction and Education in Emergencies Programming. Tango International and Save the Children.https://resourcecentre.savethechildren.net/node/14173/pdf/fiji_post_winston_edu_continuity_report_eng_2017.pdf
REACH. (2015). Shelter and Settlements Vulnerability Assessment - Final Report - Cyclone Pam Response.ShelterCluster.https://www.sheltercluster.org/sites/default/files/docs/shelter_cluster_report_shelter_and_settlements_vulnerability_assessment_after_cyclone_pam_may2015.pdf
Reserve Bank of Fiji. (2015). Financial Services Demand Side Survey: Republic of Fiji. Reserve Bank of Fiji.http://www.pfip.org/wp-content/uploads/2016/08/Fianancial-Services.pdf
Reserve Bank of Fiji. (2016). National Financial Inclusion Strategic Plan 2016–2020. Reserve Bank of Fiji. http://www.pfip.org/wp-content/uploads/2016/09/2016-2020-Fiji-FI-Strategy-Aug26.pdf
Reserve Bank of Fiji. (2019a). 2019 Financial Inclusion Report.ReserveBankofFiji.http://www.nfitfiji.com/wp-content/uploads/Fiji-Financial-Inclusion-Annual-report-2019_final.pdf
Reserve Bank of Fiji. (2019b). Insurance Annual Report 2018. Reserve Bank of Fiji. http://www.parliament.gov.fj/wp-content/uploads/2019/08/Reserve-Bank-of-Fiji-2018-Insurance-Annual-Report-1.pdf
Reserve Bank of Vanuatu. (2016a). Financial Services Demand Side Survey: Vanuatu.PacificFinancialInclusionProgramme.http://www.pfip.org/wp-content/uploads/2017/05/VANUATU-DSS.pdf
Reserve Bank of Vanuatu. (2016b). Vanuatumicro,smallmediumenterprises(MSME)-finance2016 survey: Exploring the MSMEs survey challenges and understanding the MSME characteristics for ways forward.ReserveBankofVanuatu.https://www.rbv.gov.vu/images/Financial_Inclusion/VanuatuMSMEFinanceSurveyReport_2016.pdf
Reserve Bank of Vanuatu. (2018). Vanuatu National Financial Inclusion Strategy 2018-2023. Reserve BankofVanuatu.https://www.rbv.gov.vu/images/Financial_Inclusion/VanuatuNationalFinancialInclusion Strategy 2018-2023.pdf
Reserve Bank of Vanuatu. (2020). Insurance Companies and Intermediaries. Reserve Bank of Vanuatu: Financial Stability: Authorized Financial Institutions. https://www.rbv.gov.vu/index.php/en/financial-stability/authorised-banks-supervised-financial-institutions/2-uncategorised/76-insurance-companies-and-intermediaries
180
Retirement Fund Board. (2018). Retirement Fund Board Annual Report 2017/2018. Retirement Fund Board. http://www.rfb.to/ANR/AnnualReport20172018E.pdf
Rey, T., Le Dé, L., Leone, F., & Gilbert, D. (2017). An integrative approach to understand vulnerability and resilience post-disaster. Disaster Prevention and Management: An International Journal, 26(3), 259–275. https://doi.org/10.1108/DPM-07-2016-0137
Robbins, J. C., & Petterson, M. G. (2015). Landslide inventory development in a data sparse region: spatial and temporal characteristics of landslides in Papua New Guinea. Natural Hazards and Earth System Sciences Discussions, 3(8), 4871–4917. https://doi.org/10.5194/nhessd-3-4871-2015
Robinson, A., Hulme-Moir, S., Puloka, V., Smith, M., Stanley, J., & Signal, L. (2017). Housing as a Determinant of Tongan Children’s Health: Innovative Methodology Using Wearable Cameras. INTERNATIONAL JOURNAL OF ENVIRONMENTAL RESEARCH AND PUBLIC HEALTH, 14(10). https://doi.org/10.3390/ijerph14101170
Roche, N., Diou, S., Malagian, A., Mupu’e, L., & Osake, O. (2018). Post Disaster Needs Assessment Report: Huiya and Walagu, Hela Province; Dodomona and Mougulu, Western Province; Papua New Guinea.CAREInternational.https://reliefweb.int/sites/reliefweb.int/files/resources/FinalAssessmentReport 29th May 2018 FINAL.pdf
Ronkentuo, S. (2018). Rapid Needs Assessment Report on Kadovar Island Volcanic Eruption, East Sepik, Papua New Guinea.https://reliefweb.int/sites/reliefweb.int/files/resources/rapid_needs_assessment_report_-_kadovar_island_jan_11th_2018.pdf
Rosegrant, M. W., Valmonte-Santos, R., Thomas, T., You, L., & Chiang, C. (2015). Climate change, foodsecurity,andsocioeconomiclivelihoodinPacificIslands. Asian Development Bank and International Food Policy Research Institute. https://www.adb.org/publications/climate-change-food-security-socioeconomic-livelihood-pacific
Roubin, D., Billy, A., Hilly, G., Nardi, G., Nuia, N., Fernando, D., Gesiau, J., Maneka, M., & Gerea, L. (2018). Community Perceptions of Gender Norms and Economic Opportunity in Rural Solomon Islands. Strongim Bisnis and Oxfam in Solomon Islands. https://strongimbisnis.com.sb/resources/women-s-economic-empowerment/12-gender-norms-and-economic-opportunity-2018/file.html
Rust, B. (2019). UnBlocked Cash : piloting accelerated cash transfer delivery in vanuatu research report. Oxfam. https://reliefweb.int/report/vanuatu/unblocked-cash-piloting-accelerated-cash-transfer-delivery-vanuatu-research-report
Saefoa, D. (2020, October 23). BCWG push to standardize building codes in Solomon Islands. PacificTenders.https://www.pacifictenders.com/news/bcwg-push-standardize-building-codes-solomon-islands
Samoa Bureau of Statistics. (2016). Agricultural survey 2015 report. Government of Samoa. https://www.maf.gov.ws/images/STATS/2015 Samoa Agricultural Survey.pdf
Samoa Bureau of Statistics. (2017). Samoa Labour Force Survey 2017. Samoa Bureau of Statistics. https://www.sbs.gov.ws/digi/2017-Social Statistics-Samoa LFS Report 2017.pdf
181
Samoa Bureau of Statistics. (2020a). Gross Domestic Product, December 2019 Quarter. Government ofSamoa.https://www.sbs.gov.ws/images/sbs-documents/Finance/GDP/GDP_Report-December2019Final.pdf
Samoa Bureau of Statistics. (2020b). HIES and Poverty (Household Income and Expenditure 2018 data tables). Economics. https://www.sbs.gov.ws/economics
Samoa Business Hub. (2019). Samoa Business Hub. Samoa Business Hub. http://www.samoabusinesshub.ws/
Samoa National Provident Fund. (2020a). Members FAQs. Samoa National Provident Fund. https://www.npf.ws/membersfaqs
Samoa National Provident Fund. (2020b). SeniorCitizensBenefitFund. https://www.npf.ws/scbf
Samson, M. (2008). Cash Transfers to Improve the Protection and Care of Vulnerable Children and to Empower Families in the Context of the HIV Epidemic in Papua New Guinea: Conceptual Framework. Department for Community Development (Papua New Guinea), Institute of National Affairs(PapuaNewGuinea),andUNICEF.http://www.inapng.com/pdf_files/SocialCashTransfers-Concept -Samson UNICEF-INA-DfCD.pdf
Save the Children and ACAPS. (2018). Introductory Research on the Feasibility of Cash and Voucher Assistance in Rural Fiji.SavetheChildrenandACAPS.https://reliefweb.int/report/fiji/introductory-research-feasibility-cash-and-voucher-assistance-rural-fiji
Schaefer, L., & Waters, E. (2016). Climate Risk Insurance for the Poor & Vulnerable: How to Effectively Implement the Pro-Poor Focus of Insuresilience. Munich Climate Risk Insurance Initiative (MCII). https://collections.unu.edu/eserv/UNU:5956/MCII_CRI_for_the_Poor_and_Vulnerable_meta.pdf
Schimel, A. (2020). Fiji. In P. Barnes (Ed.), APacificdisasterpreventionreview. Australian Strategic PolicyInstituteLimited.https://www.aspi.org.au/report/pacific-disaster-prevention-review
Schmidt, E., Gilbert, R., Holtemeyer, B., Rosenbach, G., & Benson, T. (2019). Papua New Guinea survey report: Rural household survey on food systems. International Food Policy Research Institute. https://doi.org/10.2499/p15738coll2.133067
Schoeffel, P. (2006). Country Gender Assessment: Republic of the Fiji Islands. Asian Development Bank.https://www.adb.org/sites/default/files/institutional-document/32240/cga-fiji.pdf
SendMoneyPacific.(2020).SendMoneyPacific.SendMoneyPacific.https://www.sendmoneypacific.org/
Shao,K.,Liu,W.,Gao,Y.,&Ning,Y.(2019).Theinfluenceofclimatechangeontsunami-likesolitarywave inundation over fringing reefs. Journal of Integrative Environmental Sciences, 16(1), 71–88. https://doi.org/10.1080/1943815X.2019.1614071
Shelter Cluster. (2015). Shelter Response Evaluation Final Report: Cyclone Pam Response, Vanuatu. Shelter Cluster and International Federation of Red Cross and Red Crescent Societies. https://reliefweb.int/report/vanuatu/vanuatu-shelter-response-evaluation-final-report-cyclone-pam-response-september-2015
182
Sibley, J., Ivaschenko, A., Pagau, K., & Tanhchareun, T. (2014). The New Ireland Social Pension. World Bank. https://openknowledge.worldbank.org/bitstream/handle/10986/22525/The0new0Irelan0ional0social0pension.pdf?sequence=1
Sibley, J., Kauzi, G., Barker, P., Zhang, W., & Gibson, J. (2015). Financial Inclusion and Financial Capability in Morobe and Madang Provinces, Papua New Guinea. Papua New Guinea Institute for National Affairs, Bank of Papua New Guinea, and The World Bank. https://www.bankpng.gov.pg/wp-content/uploads/2014/06/PNG-Financial-Capability-Survey_1601939_Web-6Nov25.pdf
Simard, N. S., Militz, T. A., Kinch, J., & Southgate, P. C. (2019). Artisanal, shell-based handicraft in Papua New Guinea: Challenges and opportunities for livelihoods development. Ambio, 48(4), 374–384. https://doi.org/10.1007/s13280-018-1078-z
Singh-Peterson, L., & Iranacolaivalu, M. (2018). Barriers to market for subsistence farmers in Fiji – A gendered perspective. Journal of Rural Studies, 60, 11–20. https://doi.org/10.1016/j.jrurstud.2018.03.001
Singh,A.(2020).BenefitsofcropdiversificationinFiji’ssugarcanefarming.Asia&thePacificPolicyStudies, 7(1), 65–80. https://doi.org/10.1002/app5.291
Singh,S.R.(2019).SouthPacificEconomies.InAsianDevelopmentOutlook2019:StrengtheningDisasterResilience.AsianDevelopmentBank.https://www.adb.org/sites/default/files/publication/492711/ado2019.pdf
Sithole, W. W., Naser, M. M., Guadagno, L., & IOM. (2015). Indigenous Knowledge for Disaster Risk Reduction: Documenting Community Practices in Papua New Guinea. International Organization forMigration.https://environmentalmigration.iom.int/sites/default/files/PNGindigenousknowledgereport print.pdf
Sloan,J.(2019).Migrantworkers:legalandotherchallengesforFijiandthePacific.Siwatibau&Sloan.http://www.sas.com.fj/commercial-law-updates/regulation-of-migrant-workers-in-fiji-and-the-pacific
Soaki, P. (2017). Casting her vote: Women’s political participation in Solomon Islands. In Transformations of Gender in Melanesia. Australian National University Press. https://www.jstor.org/stable/pdf/j.ctt1q1crwn.9.pdf
Solomon Islands Government. (2015). Education Sector Snapshot for Comprehensive School Safety and Education in Emergencies: Solomon Islands. Solomon Islands Government and Save the Children.https://www.preventionweb.net/files/67964_6796408esscsseiereportslbeng2015.pdf
Solomon Islands Government. (2018). Solomon Islands Labour Mobility Strategy 2019-2023. Solomon Islands Government. http://www.mfaet.gov.sb/resources/72-labour-mobility-strategy-2019-2023/download.html
Solomon Islands National Provident Fund. (2018). Solomon Islands National Provident Fund. Solomon Islands National Provident Fund. http://www.sinpf.org.sb/
SolomonIslandsNationalStatisticalOffice.(2012).StatisticalBulletinNo.6/2012,SolomonIslands 2009 Population and Housing Census, Basic Tables and Census Description.
183
SolomonIslandsNationalStatisticsOffice.https://www.statistics.gov.sb/component/advlisting/?view=download&format=raw&fileId=411
SolomonIslandsNationalStatisticsOffice.(2015).SolomonIslands2012/13HouseholdIncomeandExpenditureSurveyNationalAnalyticalReportVolumeI.SolomonIslandsNationalStatisticsOffice,Ministry of Finance and Treasury. https://www.statistics.gov.sb/statistics/demographic-statistics/household-income-and-expenditure-surveys
Solomon Times. (2019, October 28). Good Ridge Mines Reopen for Business. Solomon Times. https://www.solomontimes.com/news/good-ridge-mines-reopen-for-business/9426
SouthPacificBusinessDevelopment.(n.d.).SPBD:SouthPacificBusinessDevelopment.SouthPacificBusinessDevelopment.http://www.spbdmicrofinance.com/
SPC.(2006).TheSamoaFamilyHealthandSafetyStudy.SecretariatofthePacificCommunity.https://pacific.unfpa.org/en/publications/samoa-family-health-safety-study
SPC. (2009). Solomon Islands Family Health and Safety Study: A study on violence against women andchildren.SecretariatofthePacificCommunity.https://pacific.unfpa.org/sites/default/files/pub-pdf/SolomonIslandsFamilyHealthandSafetyStudy.pdf
SPC.(2015).ThePacificYouthDevelopmentFramework2014–2023:Acoordinatedapproachtoyouth-centreddevelopmentinthePacific.SecretariatofthePacificCommunity.https://www.spc.int/sites/default/files/resources/2018-05/Pacific_Youth_Development_Framework.pdf
SPC.(2016).TropicalCyclonePamLessonsLearnedWorkshopReport.PacificCommunity.https://reliefweb.int/sites/reliefweb.int/files/resources/tc_pam_lessons_learned_report_final_170316.pdf
SPC.(2018).RegionalEnvironmentalandSocialManagementFramework(ESMF).PacificResilience Program.http://documents1.worldbank.org/curated/ru/940631526461037117/Regional-environmental-and-social-management-framework.docx
Statistics New Zealand. (2020). 2018 Census group ethnic summaries. Statistics New Zealand. https://www.stats.govt.nz/tools/2018-census-ethnic-group-summaries
Steven, H. (2016). Urban live, internal migratoin and development: the need to re-address internal migration as a positive nexus for growth and development in PNG. Devpolicy Blog. http://devpolicy.org/Events/2016/PNG-Update/2a_Steven.pdf
Sutton, K., Flint, J., Lees, J., & Kenni, L. (2019). Protecting People in Locally Led Disaster Response. Humanitarian Advisory Group, Australian Red Cross, and Humanitarian Policy Group. https://humanitarianadvisorygroup.org/wp-content/uploads/2019/03/HAG_Protecting-people-in-locally-led-disaster-response_FINAL-electronic_140319.pdf
Tafoa, J. (2012). Solomon Islands: Updating and Improving the Social Protection Index. Asian DevelopmentBank.https://www.adb.org/sites/default/files/project-document/76080/44152-012-reg-tacr-24.pdf
Takasaki, Y. (2015). Learning from disaster: community-based marine protected areas in Fiji. EnvironmentandDevelopmentEconomics,21(1),53–77.https://doi.org/10.1017/S1355770X15000108
184
Takasaki, Y. (2017). Do Natural Disasters Decrease the Gender Gap in Schooling? World Development, 94(SI), 75–89. https://doi.org/10.1016/j.worlddev.2016.12.041
Talo, F. (2008). Solomon Islands National Adaptation Programmes of Action. Ministry of Environment, ConservationandMeteorology.https://www.adaptation-undp.org/sites/default/files/downloads/solomon_islands_napa.pdf
Taua’a, T. S. (2015). Women in the Informal Sector: The Samoan Experience. Journal of Samoan Studies, 3. https://journal.samoanstudies.ws/2015/08/23/women-in-the-informal-sector-the-samoan-experience/
Taylor, C., & Michael, S. (2013). Gender domestic violence and its big bite on small island states- Fiji, Solomon Islands and Vanuatu. 14th Annual Global Development Network Conference: Inequality, SocialProtectionandInclusiveGrowth.http://www.gdn.int/admin/uploads/editor/files/2013Conf_Papers/CharlotteTaylor_paper.pdf
Thomalla, F., & Boyland, M. (2017). Enhancing Resilience to Extreme Climate Events: Lessons from the2015-2016ElNiñoEventinAsiaandthePacific.UnitedNationsDevelopmentProgramme,UnitedNationsEconomicandSocialCommissionforAsiaandthePacific,UnitedNationsOfficeforthe Coordination of Humanitarian Affairs, Regional Integrated Multi-Hazard Early Warning System for Africa and Asia, an. https://www.unaprcm.org/publications/enhancing-resilience-to-extreme-climate-events-lessons-from-the-2015-2016-el-niño-event
Thomas, A. S., Mangubhai, S., Vandervord, C., Fox, M., & Nand, Y. (2019). Impact of Tropical CycloneWinstononwomenmudcrabfishersinFiji.ClimateandDevelopment,11(8),699–709.https://doi.org/10.1080/17565529.2018.1547677
Thomas, V., Kauli, J., & Rawstorne, P. (2017). Understanding Gender-Based and Sorcery-Related ViolenceinPapuaNewGuinea.Oxfam.https://pacificwomen.org/research/gender-based-sorcery-related-violence-papua-new-guinea-analysis-data-collected-oxfam-partners-2013-2016/
Tonga Statistics Department. (2017a). Tonga 2016 Census of Population and Housing, Volume 1: Basic Tables and Administrative Report. Tonga Statistics Department. https://tongastats.gov.to/census/population-statistics/#22-60-wpfd-2016-1498707296
Tonga Statistics Department. (2017b). Tonga Household Income and Expenditure Survey 2015/2016. SecretariatofthePacificCommunityandTongaStatisticsDepartment.https://sdd.spc.int/news/2018/02/02/tonga-household-income-and-expenditure-survey-20152016-report
Tonga Statistics Department. (2019). Tonga’s Youth: Analysis of the situation of young people based on the 2016 Population and Housing Census. Government of Tonga. https://tongastats.gov.to/download/139/youth/3271/tonga-youth-thematic-report-2019.pdf
TRIP Consultants. (2015). The Solomon Islands National Tourism Development Strategy 2015 - 2019. SouthPacificTourismOrganisation.http://mecdm.gov.sb/resources/ministry-documents/strategies/solomon-islands-national-tourism-development-strategy-2015-2019/download.html
Tronquet, C. (2015). From Vunidogoloa to Kenani: An insight into successful relocation. The State of Environmental Migration, 121–142. http://labos.ulg.ac.be/hugo/wp-content/uploads/sites/38/2017/11/The-State-of-Environmental-Migration-2015-121-142.pdf
UNDP. (2016a). Painim Aut Na Luksave: Understanding Gender-Based Violence to Secure Sustainable Development in Papua New Guinea. UNDP, The Equality Institute, and the Department for Community Development and Religion. https://static1.squarespace.
185
com/static/5656cae6e4b00f188f3228ee/t/581ac17cbebafb322e72c267/1478148488967/UNDP+PNG+Painim+Aut+Report_FINAL.pdf
UNDP. (2016b). Tulele Peisa, Papua New Guinea (Equator Initiative Case Study Series). https://www.equatorinitiative.org/wp-content/uploads/2017/05/case_1473429470.pdf
UNDP. (2019). Human Development Report 2019. United Nations Development Programme. http://hdr.undp.org/sites/default/files/hdr2019.pdf
UNDRR. (2019a). Disaster Risk Reduction in Papua New Guinea: Status Report 2019. United Nations OfficeforDisasterRiskReduction(UNDRR).https://reliefweb.int/report/papua-new-guinea/disaster-risk-reduction-papua-new-guinea-status-report-july-2019
UNDRR.(2019b).DisasterRiskReductionintheRepublicofFiji:StatusReport2019.UNOfficeforDisasterRiskReductionandAsianDisasterPreparednessCenter.https://reliefweb.int/report/fiji/disaster-risk-reduction-republic-fiji-status-report-july-2019
UNDRR.(2020).DesInventarPacificIslandsdataset.UnitedNationsOfficeforDisasterRiskReduction(UNDRR). https://www.desinventar.net/DesInventar/main.jsp
UNESCO. (2020). Data for the Sustainable Development Goals. UNESCO Institute of Statistics. http://uis.unesco.org/
UNFPA. (n.d.). Gender equality. UNFP Papua New Guinea. https://png.unfpa.org/en/topics/gender-equality-12
UNFPA.(2014).PopulationandDevelopmentProfiles:PacificIslandCountries.UnitedNationsPopulationFund.https://pacific.unfpa.org/sites/default/files/pub-pdf/web__140414_UNFPAPopulationandDevelopmentProfiles-PacificSub-RegionExtendedv1LRv2_0.pdf
United Nations. (2015). Sendai Framework for Disaster Risk Reduction 2015-2030 (Third UN World Conference on Disaster Risk Reduction, Sendai, Japan, March 18, 2015). United Nations. https://www.preventionweb.net/files/43291_sendaiframeworkfordrren.pdf
United Nations Population Division. (2019). World Population Prospects 2019. https://population.un.org/wpp/Download/Standard/Population
Utz,R.(2017).PacificPossible:Long-termEconomicOpportunitiesandChallengesforPacificIslandCountries. World Bank. http://documents1.worldbank.org/curated/en/168951503668157320/pdf/ACS22308-PUBLIC-P154324-ADD-SERIES-PPFullReportFINALscreen.pdf
Vaike,L.F.,&Salili,D.H.(2020).SolomonIslands.InP.Barnes(Ed.),APacificDisasterPreventionR2eview.AustralianStrategicPolicyInstituteLimited.https://www.aspi.org.au/report/pacific-disaster-prevention-review
Van Der Veeken, S., Calgaro, E., Munk Klint, L., Law, A., Jiang, M., de Lacy, T., Dominey-Howes, D., & Reis, A. C. (2016). Tourism destinations’ vulnerability to climate change: Nature-based tourism in Vava’u, the Kingdom of Tonga. Tourism and Hospitality Research, 16(1), 50–71. https://doi.org/10.1177/1467358415611068
Vanuatu Department of Agriculture and Rural Development. (2016). Vanuatu National Kava Strategy 2016-2025. Vanuatu Department of Agriculture and Rural Development. https://pafpnet.spc.int/attachments/article/562/VANUATU_KavaStrategy.pdf
186
Vanuatu Department of Industry. (2017). Handicraft Sector Action Plan 2018-2020. Vanuatu Department of Industry. https://doi.gov.vu/images/docs/doi-strategy-plans/Handicraft Sector Action Plan 2018-2020.pdf
VanuatuMinistryofHealth;VanuatuNationalStatisticsOffice;andtheSecretariatofthePacificCommunity.(2013).VanuatuDemographicandHealthSurvey2013.SecretariatofthePacificCommunity.https://vnso.gov.vu/images/Special_Report/Vanuatu_Demographic_and_Health_Survey_Report/2013_VDHS_FINAL_Report.pdf
Vanuatu National Provident Fund. (2017). 2015 Annual Report. Vanuatu National Provident Fund. https://www.vnpf.com.vu/includes/doc/ar/2015.pdf
VanuatuNationalStatisticsOffice.(2017).Vanuatu2016PostTCPamMini-CensusReport,Volume1:BasicTables.https://vnso.gov.vu/images/Public_Documents/Census_Surveys/Census/2016/2016_Mini_Census_Main_Report_Vol_1.pdf
VanuatuNationalStatisticsOffice.(2020).InternationalMerchandiseTradeStatistics:December2019ProvisionalHighlights.VanuatuNationalStatisticsOffice.https://vnso.gov.vu/images/Public_Documents/Statistics_by_Topic/Economics/Merchandise_Trade/2019/12_IMTS_December_2019.pdf
Vanuatu Women’s Centre. (2011). Vanuatu National Survey on Women’s Lives and Family Relationships.VanuatuWomen’sCentre.https://mjcs.gov.vu/images/research_database/Vanuatu_National_Survey_on_Womens_Lives_and_Family_Relationships.pdf
VANWODSMicrofinance.(n.d.).VANWODSMicrofinance.http://www.vanwods.org.vu/
Villacres, D. (2017). Strenghtening diaspora engagement and remittances in the Kingdom of Tonga. OrganisationofAfrican,CaribbeanandPacificStates;EuropeanUnion;InternationalOrganizationforMigration.https://acpeumigrationaction.iom.int/sites/default/files/tonga_dissemination-pages.pdf
Vincent, K., Tschakert, P., Barnett, J., Rivera-Ferre, M. G., & Woodward, A. (2014). Gender and Climate Change. In C. B. Field, V. R. Barros, D. J. Dokken, K. J. Mach, M. D. Mastrandrea, T. E. Bilir, M. Chatterjee, K. L. Ebi, Y. O. Estrada, R. C. Genova, B. Girma, E. S. Kissel, A. N. Levy, S. MacCracken, P. R. Mastrandrea, & L. L. White (Eds.), Climate Change 2014: Impacts, Adaptation, and Vulnerability. Part A: Global and Sectoral Aspects. Contribution of Working Group II to the Fifth Assessment Report of the Intergovernmental Panel on Climate Change (pp. 105–107). Cambridge University Press. https://www.ipcc.ch/site/assets/uploads/2018/02/WGIIAR5-PartA_FINAL.pdf
Vodafone Samoa. (2020a). M-Tala. Vodafone Samoa2. https://www.vodafone.com.ws/m-tala/
Vodafone Samoa. (2020b). M-Tala Rocket Remit. Vodafone Samoa. https://www.vodafone.com.ws/m-tala/m-tala-rocket-remit/
Voigt-Graf, C. (2017). PNG Tracer Study Report. Australian Government. https://www.dfat.gov.au/sites/default/files/labour-mobility-assistance-program-papua-new-guinea-tracer-study-interim-report.pdf
Wari,P.(2018,March12).Inspectionteamfindsgovernmentbuildingspoorlybuilt.TheNational.https://www.thenational.com.pg/inspection-team-finds-government-buildings-poorly-built/
Warner, K., Kreft, S., Zissener, M., Höppe, P., Bals, C., Loster, T., Linnerooth-Bayer, J., Tschudi, S., Gurenko, E., Haas, A., Young, S., Kovacs, P., Dlugolecki, A., & Oxley, A. (2012). Insurance solutions in the context of climate change-related loss and damage: Needs, gaps, and roles of the Convention
187
in addressing loss and damage. Munich Climate Insurance Initiative. https://collections.unu.edu/eserv/UNU:1835/pdf10573.pdf
Warrick, O. (2011). The adaptive capacity of the Tegua island community, Torres Islands, Vanuatu. CommonwealthofAustralia.https://www.nab.vu/sites/default/files/documents/usp-adaptive-capacity-vanuatu.pdf
Wehrhahn, R., Oza, A., Savage, L., Walsh, R., Veisamasama, G., & Pascual, M. C. (2019). The Enabling Environment for Disaster Risk Financing in Fiji: Country Diagnostics Assessment. Asian DevelopmentBank.https://www.adb.org/publications/fiji-environment-disaster-risk-financing
Weir, T., Dovey, L., & Orcherton, D. (2017). Social and cultural issues raised by climate change in PacificIslandcountries:anoverview.RegionalEnvironmentalChange,17(4),1017–1028.https://doi.org/10.1007/s10113-016-1012-5
Wentworth, C. (2020). Unhealthy Aid: Food Security Programming and Disaster Responses to Cyclone Pam in Vanuatu. Anthropological Forum, 30(1–2), 73–90. https://doi.org/10.1080/00664677.2019.1647830
WFP. (2012). Tonga Emergency Preparedness Operational Logistics Contingency Plan, Part 1 - Risk Profile&DisasterManagement.WorldFoodProgramme.https://reliefweb.int/sites/reliefweb.int/files/resources/1.TONGALogisticsOperationalPlan-Part1-RiskProfileandDisasterManagement.pdf
WFP. (2016). Vanuatu emergency operation to assist affected people by cyclone Pam: Standard Project Report 2015. World Food Programme. https://documents.wfp.org/stellent/groups/public/documents/projects/wfp283202.pdf
Wong, E. P. Y., de Lacy, T., & Jiang, M. (2012). Climate change adaptation in tourism in the South Pacific—Potentialcontributionofpublic–privatepartnerships.TourismManagementPerspectives,4, 136–144. https://doi.org/10.1016/j.tmp.2012.08.001
World Bank. (2016a). Achievements in ACP Countries by Global Index Insurance Facility: Phase 1 (2010–2015). World Bank. http://documents1.worldbank.org/curated/pt/482761490702615329/pdf/113713-WP-ENGLISH-GIIF-ACP-Report-Eng-Web-PUBLIC.pdf
World Bank. (2016b). Climate change and Disaster Management. World Bank. http://documents.worldbank.org/curated/en/655081503691935252/pdf/119111-WP-PUBLIC-p154324-ppClimatechangebackgroundfinal.pdf
World Bank. (2017a). Pathways for Tongan Youth Employability: Project Information Document / Integrated Safeguards Data Sheet (PID/ISDS). World Bank. http://documents1.worldbank.org/curated/pt/908911502688557320/pdf/ITM00184-P161541-08-14-2017-1502688554596.pdf
World Bank. (2017b). Program Information Document: Second Inclusive Growth Development Policy Operation - Tonga. World Bank. http://documents1.worldbank.org/curated/en/231491488166978981/pdf/113034-PGID-P159262-Appraisal-Stage-Box402891B-PUBLIC-Disclosed-2-23-2017.pdf
World Bank. (2017c). Republic of Fiji: Systematic Country Diagnostic. World Bank. http://documents1.worldbank.org/curated/en/668391506585108864/pdf/120106-SCD-P160757-PUBLIC-FijiSCDpostDecisionclean.pdf
World Bank. (2017d). Solomon Islands Systematic Country Diagnostic Priorities for Supporting Poverty Reduction & Promoting Shared Prosperity. World Bank. http://documents1.worldbank.org/curated/en/112901498499975277/pdf/Solomon-Islands-Systematic-Country-Diagnostic-2017-06222017.pdf
188
World Bank. (2018a). Gender Inclusive Value Chains: Improving women’s participation in Solomon Islands. World Bank. http://documents1.worldbank.org/curated/en/353911538724168885/pdf/130528-4-10-2018-15-19-5-SIReport.pdf
WorldBank.(2018b).Poverty&EquityBrief,EastAsia&Pacific:Vanuatu.WorldBank.http://documents1.worldbank.org/curated/en/683301528204825660/pdf/Vanuatu-PEB-Spring-2018.pdf
World Bank. (2018c). Tonga Second Inclusive Growth Development Policy Operation: Supplemental Financing (Report No. 125384-TO). World Bank. http://documents1.worldbank.org/curated/en/960381529292681958/pdf/125384-CORR-IDA-R2018-0194-2-PUBLIC.pdf
World Bank. (2020a). Global Financial Inclusion. World Bank Databank. https://databank.worldbank.org/reports.aspx?source=1228
World Bank. (2020b). Remittance Prices Worldwide. World Bank. https://remittanceprices.worldbank.org/en
World Bank. (2020c). Skills and Employment for Tongans: Implementation Status & Results Report 4. World Bank. http://documents1.worldbank.org/curated/en/341241593410708649/pdf/Disclosable-Version-of-the-ISR-Skills-and-Employment-for-Tongans-P161541-Sequence-No-04.pdf
World Bank. (2020d). The World Bank In Papua New Guinea. Www.Worldbank.Org. https://www.worldbank.org/en/country/png/overview
World Bank. (2020e). World Bank Open Data. https://data.worldbank.org/
World Health Organization. (2020). Malnutrition. Fact Sheets. https://www.who.int/news-room/fact-sheets/detail/malnutrition
World Travel & Tourism Council. (2020). Economic Impact Reports. World Travel & Tourism Council. https://wttc.org/Research/Economic-Impact
Wrondimi, G. H. (2012). Papua New Guinea: Updating and Improving the Social Protection Index. AsianDevelopmentBank.https://www.adb.org/sites/default/files/project-document/76074/44152-012-reg-tacr-19.pdf
WTO. (2019a). Natural Disasters and Trade: Study I. In Third Symposium on Natural Disasters andTrade.WorldTradeOrganization.https://www.wto.org/english/tratop_e/devel_e/study1_sympnaturaldisaster29112019_e.pdf
WTO.(2019b).Pacificstudy(focusingonFiji,TongaandVanuatu).InThirdSymposiumonNaturalDisastersandTrade.WorldTradeOrganization.https://www.wto.org/english/tratop_e/devel_e/study_1_pacific_country_annex_18_april_draft_final.pdf
Xing,Z.(2018).DevelopmentImpactsofRemittancesinAgriculturalHouseholds:FijiExperience.Remittances Review, 3(1), 19–49. https://doi.org/10.33182/rr.v3i1.425

Check out our websitewww.uncdf.org
Twitter@UNCDFdigital
Facebook@UNCDFdigital
This publication is brought to you by the United Nations Capital Development Fund (UNCDF) aspartofitsfoundationalworkunderthePacificInsuranceandClimateAdaptationProgramme being implemented jointly with the United Nations University, Institute for Environment and Human Security (UNU-EHS) and the United Nations Development
Programme (UNDP). Brian Lucas is the author of this literature review report.
Copyright December 2020 @UN Capital Development Fund.
The views expressed in this publication are the author(s) alone and are not necessarily
the views of the New Zealand Aid Programme, the Australian Government, the
United Nations, including UNCDF, or their member states.
Supported by the Governments of New Zealand and Australia.