relation of the baroreflex mechanism with the photoplethysmographic volume in healthy humans during...
TRANSCRIPT

Arch Cardiol Mex 2012;82(2):82-90
1405-9940/$ - see front matter © 2012 Instituto Nacional de Cardiología Ignacio Chávez. Publicado por Elsevier México. Todos los derechos reservados.
www.elsevier.es
Corresponding author: Oscar Infante Vázquez. Departament of Electromechanical Instrumentation, Instituto Nacional de Cardio-logía Ignacio Chávez. Juan Badiano # 1, Sección XVI, Tlalpan. Z.P. 14080. Mexico City, Mexico. Telephone: +52 (55) 5573 2911, ext 1386. Fax. +52 (55) 5573 0926. E-mail address: [email protected]
EXPErIMENTAl ClINICAl rESEArCh
Relation of the baroreflex mechanism with the photoplethysmo-graphic volume in healthy humans during orthostatism
Paola Martínez-García,1 Claudia Lerma,2 Óscar Infante.2
1 Graduate Studies in Medical Physics, Institute of Physics, UNAM. Mexico City, Mexico.2 Department of Electromechanical Instrumentation, National Institute of Cardiology Ignacio Chávez. Mexico City, Mexico.
received on March 14, 2011; accepted on February 2, 2012.
KEYWORDSBaroreflex mechanism; Blood volume regulation; Orthostatic challenge; Mexico.
AbstractObjective: Our aim was to evaluate the effect of the baroreflex mechanism upon peripheral blood volume during sympathetic stimulation by orthostatism.Methods: Nineteen clinically healthy volunteers were included (12 men), 28.4 ± 6.2 years old. Blood pressure was monitored with a Finometer and blood volume with a photoplethysmo-graph during supine position and orthostatism (15 minutes each), in order to obtain systolic blood pressure (SBP), diastolic blood pressure (DBP), systolic volume (SysV), diastolic volume (DiaV), and inter beat intervals (IBI) measurements. Baroreflex sensitivity index (IBI/SBP) and baroreflex effect on blood volume (IBI/SysV) were estimated by the sequence method. The pertinence of using only systolic values was tested by linear regression analysis of systolic versus diastolic measurements.Results: More than 70% of DBP and DiaV variations can be explained by SBP and SysV, respec-tively (p<0.001), with coherence >0.5 in frequencies between 0.04 and 0.15 hz. IBI/SBP and IBI/SysV were linearly correlated (r>0.4) and both decreased during orthostatism (p<0.05). Conclusion: The sequence method showed a strong baroreflex effect upon peripheral blood volume that became more apparent during sympathetic stimulation with orthostatism. This approach could be clinically useful for the evaluation of blood volume regulation for many diseases such as diabetes mellitus and heart failure, and during therapeutic interventions such as hemodialysis.
Document downloaded from http://www.elsevier.es, day 05/09/2012. This copy is for personal use. Any transmission of this document by any media or format is strictly prohibited.

Baroreflex mechanism and photoplethysmographic volume during orthostatism 83
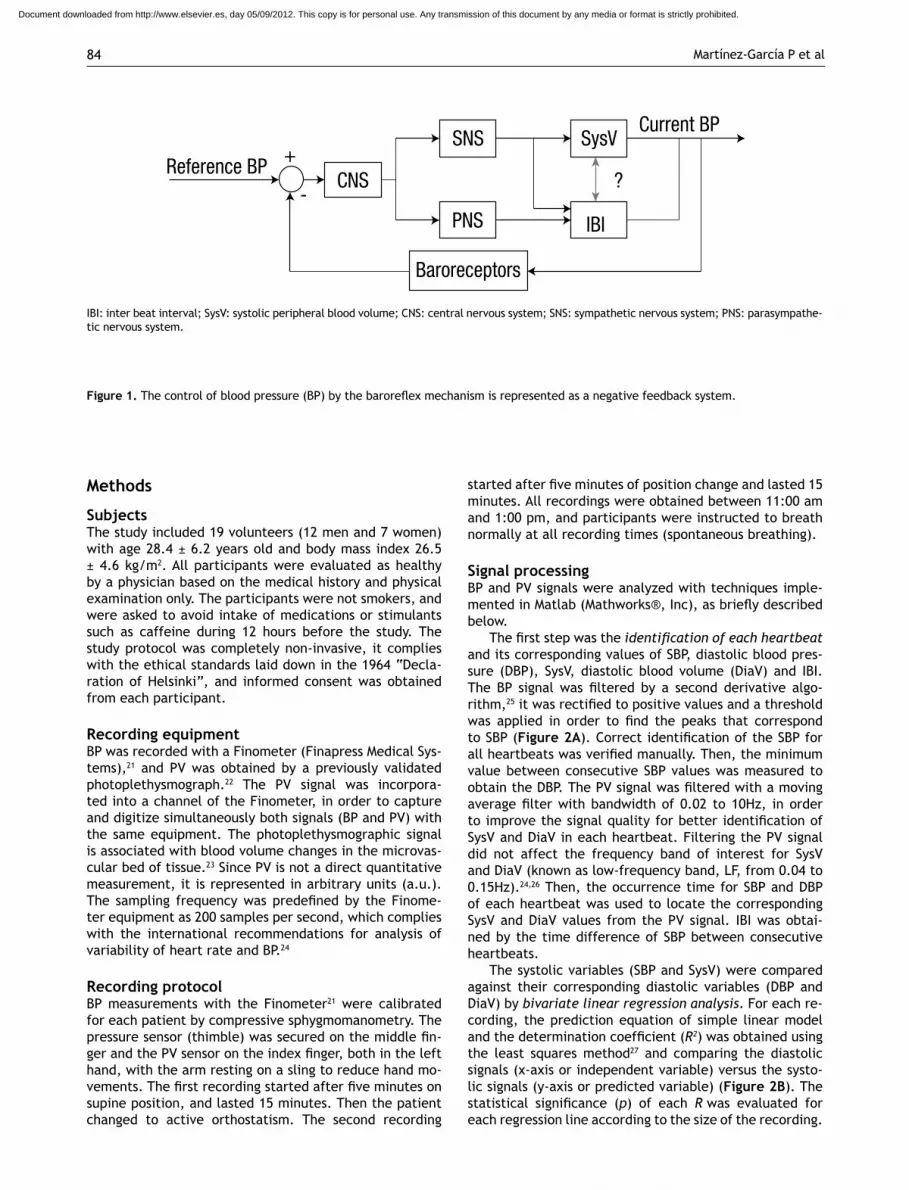
IntroductionThe baroreflex mechanism allows an adequate short-term control of blood pressure (BP), in response to daily-life stimuli such as orthostatism.1-3 The neural and cardio- vascular components of the baroreflex mechanism are complex, both anatomically and physiologically.4,5 howe-ver, the basic baroreflex function is often referred as a negative feedback mechanism, as it is illustrated in Figu-re 1. The reference variable (i.e. the BP) is “monitored” by the central nervous system through the baroreceptors, and in response to changes of BP, the central nervous sys-tem modulates the autonomic activity towards the heart and blood vessels, with the aim of increasing or decrea-sing BP by changes in heart rate (or inter beat interval, IBI) and peripheral arteries resistance.2,6 The baroreflex sensitivity is then defined as the magnitude of the chan-ge in IBI with respect to a change in BP,7 which normally takes effect between 1 to 3 seconds of the BP change (baroreflex delay).8-11
Impairment of the baroreflex mechanism, evidenced by decreased baroreflex sensitivity, occurs in many di-seases such as essential arterial hypertension,1,12 diabe-tes mellitus,13 myocardial infarction14 and chronic renal failure.15 Two examples of clinical implications are: 1) the association of low baroreflex sensitivity with a high risk of cardiac mortality in patients with myocardial infarction,14 and 2) the observation of reduced baroreflex sensitivity during hypotension in patients with chronic renal failure prone to intra-hemodialysis hypotension.16
Several non-invasive methods for baroreflex sensi-tivity evaluation have been developed,7,17,18 that have
contributed to the understanding of the pathophysiology of the baroreflex mechanism. However, most studies are focused on the heart rate as the controlled variable, and little is known about the effect that the baroreflex has upon the peripheral blood volume. Considering that sym-pathetic regulation of peripheral resistance is one of the regulated variables necessary to control BP,6 we hypothe-size that, given that the blood volume regulation has an important role on the cardiovascular control through the baroreflex mechanism19,20 this contribution must be seen in photoplethysmographic recordings. According to the representation proposed in Figure 1, correlated chan-ges in systolic blood volume (SysV) and IBI (highlighted by a question mark) could be associated to sympathetic control on both variables. In that case, and considering no other confounding variables, the spectral coherence between both signals would be significant within the fre-quency band of 0.04 to 0.15 hz. Furthermore, the effect of the baroreflex mechanism has been studied by systolic blood pressure (SBP) in most methods, but the equivalen-ce of using systolic measurements or diastolic values has not been tested.
The aim of this work was to evaluate the effect of the baroreflex mechanism upon the peripheral blood volume as it is seen by photoplehysmography. linear regression analysis was applied to the systolic and diastolic measure-ments of BP and photoplethysmographic volume (PV), to test the pertinence of using only the systolic values in the subsequent analysis. We applied a non-invasive method for assessment of baroreflex sensitivity to measurements of SBP, SysV and IBI, both in supine position and during active orthostatism.
PALABRAS CLAVEMecanismo barorreflejo; regulación de volumen sanguíneo; reto ortostáti-co; México.
Relación del mecanismo barorreflejo con el volumen fotopletismográfico en humanos sa-nos durante ortostatismo
ResumenObjetivo: Evaluar el efecto del mecanismo barorreflejo sobre el volumen sanguíneo periférico durante estimulación inducida por ortostatismo.Métodos: Se incluyeron 19 voluntarios sanos (12 hombres), con edad de 28.4 ± 6.2 años. La presión arterial se midió con un Finometer y el volumen sanguíneo con un fotopletismógrafo, ambos durante posiciones supina y ortostatismo activo (15 minutos cada una), para obtener los valores de presión arterial sistólica (PAS), presión arterial diastólica (PAD), volumen sis-tólico (VS), volumen diastólico (VD) e intervalo inter pulso (IIP). Se estimó la sensibilidad barorrefleja (IIP/PAS) y el efecto barorreflejo sobre el volumen sanguíneo (IIP/VS) mediante el método de secuencias. La pertinencia de usar sólo variables sistólicas, se evaluó median- te análisis de regresión lineal de las mediciones sistólicas versus las diastólicas.Resultados: Más de 70% de las variaciones de presión arterial diastólica y volumen diastólico pueden ser explicadas mediante presión arterial sistólica y volumen sistólico, respectiva-mente (p<0.001), con coherencia >0.5 en frecuencias entre 0.04 y 0.15 Hz. IIP/PAS y IIP/VS tuvieron correlación positiva (R>0.4) y ambos disminuyeron durante ortostatismo (p<0.05).Conclusiones: El método de secuencias demostró un importante efecto barorreflejo sobre el volumen sanguíneo periférico que se hizo más notable durante estimulación simpática con ortostatismo. Este enfoque podría ser clínicamente útil en la evaluación de la regulación del volumen sanguíneo en distintas enfermedades como diabetes mellitus o falla cardiaca, y durante intervenciones terapéuticas como la hemodiálisis.
Document downloaded from http://www.elsevier.es, day 05/09/2012. This copy is for personal use. Any transmission of this document by any media or format is strictly prohibited.
Martínez-García P et al84
Methods
SubjectsThe study included 19 volunteers (12 men and 7 women) with age 28.4 ± 6.2 years old and body mass index 26.5 ± 4.6 kg/m2. All participants were evaluated as healthy by a physician based on the medical history and physical examination only. The participants were not smokers, and were asked to avoid intake of medications or stimulants such as caffeine during 12 hours before the study. The study protocol was completely non-invasive, it complies with the ethical standards laid down in the 1964 “Decla-ration of helsinki”, and informed consent was obtained from each participant.
Recording equipmentBP was recorded with a Finometer (Finapress Medical Sys-tems),21 and PV was obtained by a previously validated photoplethysmograph.22 The PV signal was incorpora- ted into a channel of the Finometer, in order to capture and digitize simultaneously both signals (BP and PV) with the same equipment. The photoplethysmographic signal is associated with blood volume changes in the microvas-cular bed of tissue.23 Since PV is not a direct quantitative measurement, it is represented in arbitrary units (a.u.). The sampling frequency was predefined by the Finome-ter equipment as 200 samples per second, which complies with the international recommendations for analysis of variability of heart rate and BP.24
Recording protocolBP measurements with the Finometer21 were calibrated for each patient by compressive sphygmomanometry. The pressure sensor (thimble) was secured on the middle fin-ger and the PV sensor on the index finger, both in the left hand, with the arm resting on a sling to reduce hand mo-vements. The first recording started after five minutes on supine position, and lasted 15 minutes. Then the patient changed to active orthostatism. The second recording
started after five minutes of position change and lasted 15 minutes. All recordings were obtained between 11:00 am and 1:00 pm, and participants were instructed to breath normally at all recording times (spontaneous breathing).
Signal processing BP and PV signals were analyzed with techniques imple-mented in Matlab (Mathworks®, Inc), as briefly described below.
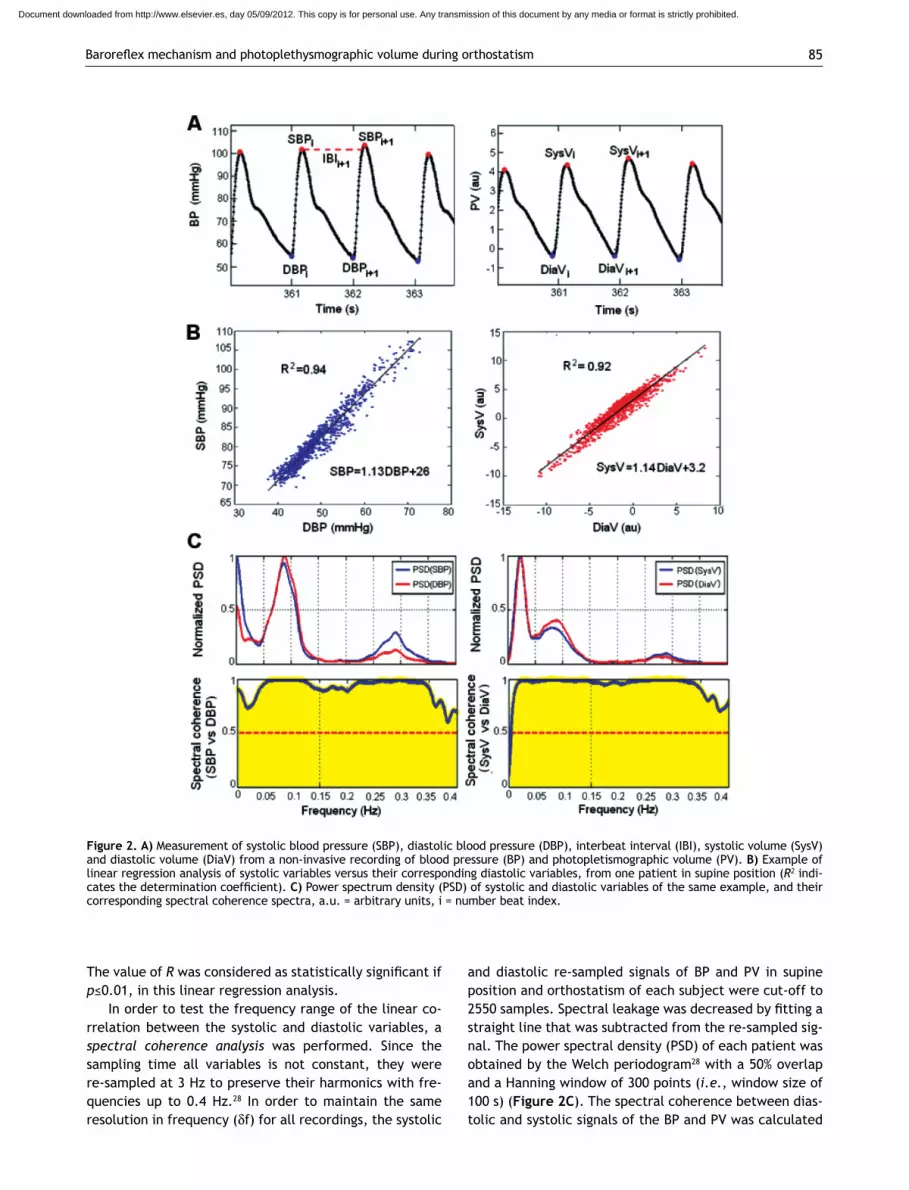
The first step was the identification of each heartbeat and its corresponding values of SBP, diastolic blood pres-sure (DBP), SysV, diastolic blood volume (DiaV) and IBI. The BP signal was filtered by a second derivative algo-rithm,25 it was rectified to positive values and a threshold was applied in order to find the peaks that correspond to SBP (Figure 2A). Correct identification of the SBP for all heartbeats was verified manually. Then, the minimum value between consecutive SBP values was measured to obtain the DBP. The PV signal was filtered with a moving average filter with bandwidth of 0.02 to 10Hz, in order to improve the signal quality for better identification of SysV and DiaV in each heartbeat. Filtering the PV signal did not affect the frequency band of interest for SysV and DiaV (known as low-frequency band, lF, from 0.04 to 0.15hz).24,26 Then, the occurrence time for SBP and DBP of each heartbeat was used to locate the corresponding SysV and DiaV values from the PV signal. IBI was obtai-ned by the time difference of SBP between consecutive heartbeats.
The systolic variables (SBP and SysV) were compared against their corresponding diastolic variables (DBP and DiaV) by bivariate linear regression analysis. For each re-cording, the prediction equation of simple linear model and the determination coefficient (R2) was obtained using the least squares method27 and comparing the diastolic signals (x-axis or independent variable) versus the systo-lic signals (y-axis or predicted variable) (Figure 2B). The statistical significance (p) of each R was evaluated for each regression line according to the size of the recording.
Reference BP +
-CNS
SNS SysV
?
Current BP
IBIPNS
Baroreceptors
Figure 1. The control of blood pressure (BP) by the baroreflex mechanism is represented as a negative feedback system.
IBI: inter beat interval; SysV: systolic peripheral blood volume; CNS: central nervous system; SNS: sympathetic nervous system; PNS: parasympathe-tic nervous system.
Document downloaded from http://www.elsevier.es, day 05/09/2012. This copy is for personal use. Any transmission of this document by any media or format is strictly prohibited.
Baroreflex mechanism and photoplethysmographic volume during orthostatism 85
The value of R was considered as statistically significant if p≤0.01, in this linear regression analysis.
In order to test the frequency range of the linear co-rrelation between the systolic and diastolic variables, a spectral coherence analysis was performed. Since the sampling time all variables is not constant, they were re-sampled at 3 hz to preserve their harmonics with fre-quencies up to 0.4 hz.28 In order to maintain the same resolution in frequency (df) for all recordings, the systolic
and diastolic re-sampled signals of BP and PV in supine position and orthostatism of each subject were cut-off to 2550 samples. Spectral leakage was decreased by fitting a straight line that was subtracted from the re-sampled sig-nal. The power spectral density (PSD) of each patient was obtained by the Welch periodogram28 with a 50% overlap and a hanning window of 300 points (i.e., window size of 100 s) (Figure 2C). The spectral coherence between dias-tolic and systolic signals of the BP and PV was calculated
Figure 2. A) Measurement of systolic blood pressure (SBP), diastolic blood pressure (DBP), interbeat interval (IBI), systolic volume (SysV) and diastolic volume (DiaV) from a non-invasive recording of blood pressure (BP) and photopletismographic volume (PV). B) Example of linear regression analysis of systolic variables versus their corresponding diastolic variables, from one patient in supine position (R2 indi-cates the determination coefficient). C) Power spectrum density (PSD) of systolic and diastolic variables of the same example, and their corresponding spectral coherence spectra, a.u. = arbitrary units, i = number beat index.
Document downloaded from http://www.elsevier.es, day 05/09/2012. This copy is for personal use. Any transmission of this document by any media or format is strictly prohibited.
Martínez-García P et al86
using Equation 1, where f is the frequency in hertz, PSDxy denotes the crossed PSD between the diastolic signal (x) and the systolic signal (y), PSDx refers to the PSD of the diastolic signal (x), and PSDy is the PSD of the systolic signal (y).
Equation 1: Cxy(f) = |PSDxy(f)|2 / (PSDx(f) · PSDy(f))
A value of spectral coherence Cxy≥0.5 was considered significant, and this was considered of interest within the lF band because blood vessels have no parasympathetic innervations (Figure 2C).4,6,26,29
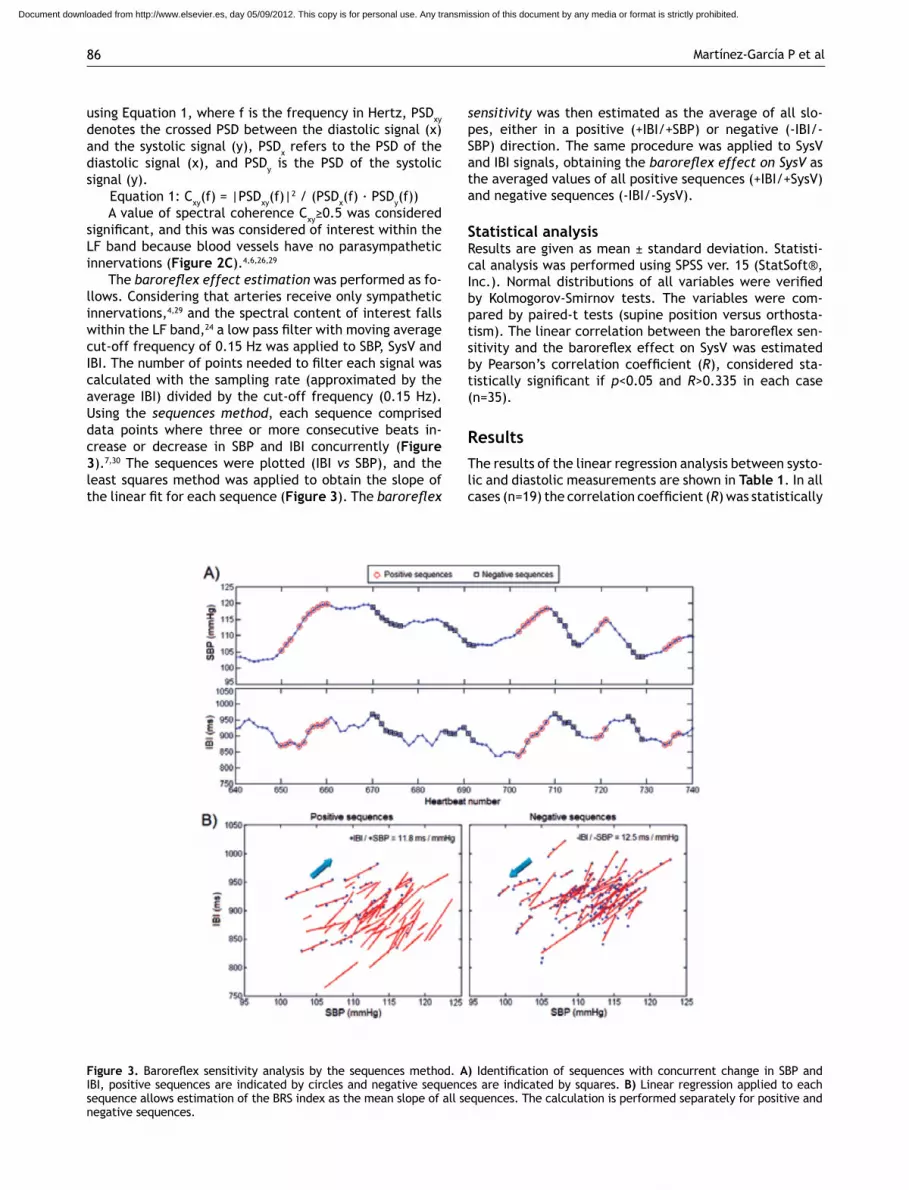
The baroreflex effect estimation was performed as fo-llows. Considering that arteries receive only sympathetic innervations,4,29 and the spectral content of interest falls within the lF band,24 a low pass filter with moving average cut-off frequency of 0.15 hz was applied to SBP, SysV and IBI. The number of points needed to filter each signal was calculated with the sampling rate (approximated by the average IBI) divided by the cut-off frequency (0.15 hz). Using the sequences method, each sequence comprised data points where three or more consecutive beats in-crease or decrease in SBP and IBI concurrently (Figure 3).7,30 The sequences were plotted (IBI vs SBP), and the least squares method was applied to obtain the slope of the linear fit for each sequence (Figure 3). The baroreflex
sensitivity was then estimated as the average of all slo-pes, either in a positive (+IBI/+SBP) or negative (-IBI/-SBP) direction. The same procedure was applied to SysV and IBI signals, obtaining the baroreflex effect on SysV as the averaged values of all positive sequences (+IBI/+SysV) and negative sequences (-IBI/-SysV).
Statistical analysisresults are given as mean ± standard deviation. Statisti-cal analysis was performed using SPSS ver. 15 (StatSoft®, Inc.). Normal distributions of all variables were verified by Kolmogorov-Smirnov tests. The variables were com-pared by paired-t tests (supine position versus orthosta-tism). The linear correlation between the baroreflex sen-sitivity and the baroreflex effect on SysV was estimated by Pearson’s correlation coefficient (R), considered sta-tistically significant if p<0.05 and R>0.335 in each case (n=35).
ResultsThe results of the linear regression analysis between systo-lic and diastolic measurements are shown in Table 1. In all cases (n=19) the correlation coefficient (R) was statistically
Figure 3. Baroreflex sensitivity analysis by the sequences method. A) Identification of sequences with concurrent change in SBP and IBI, positive sequences are indicated by circles and negative sequences are indicated by squares. B) linear regression applied to each sequence allows estimation of the BrS index as the mean slope of all sequences. The calculation is performed separately for positive and negative sequences.
Document downloaded from http://www.elsevier.es, day 05/09/2012. This copy is for personal use. Any transmission of this document by any media or format is strictly prohibited.
Baroreflex mechanism and photoplethysmographic volume during orthostatism 87
significant (p<0.001) according to the number of data for each signal (between 900 and 1200 data points), with R2>0.7. Therefore, a significant amount of DBP variation can be explained by SBP and also a significant amount of variation of DiaV can be explained by SysV.
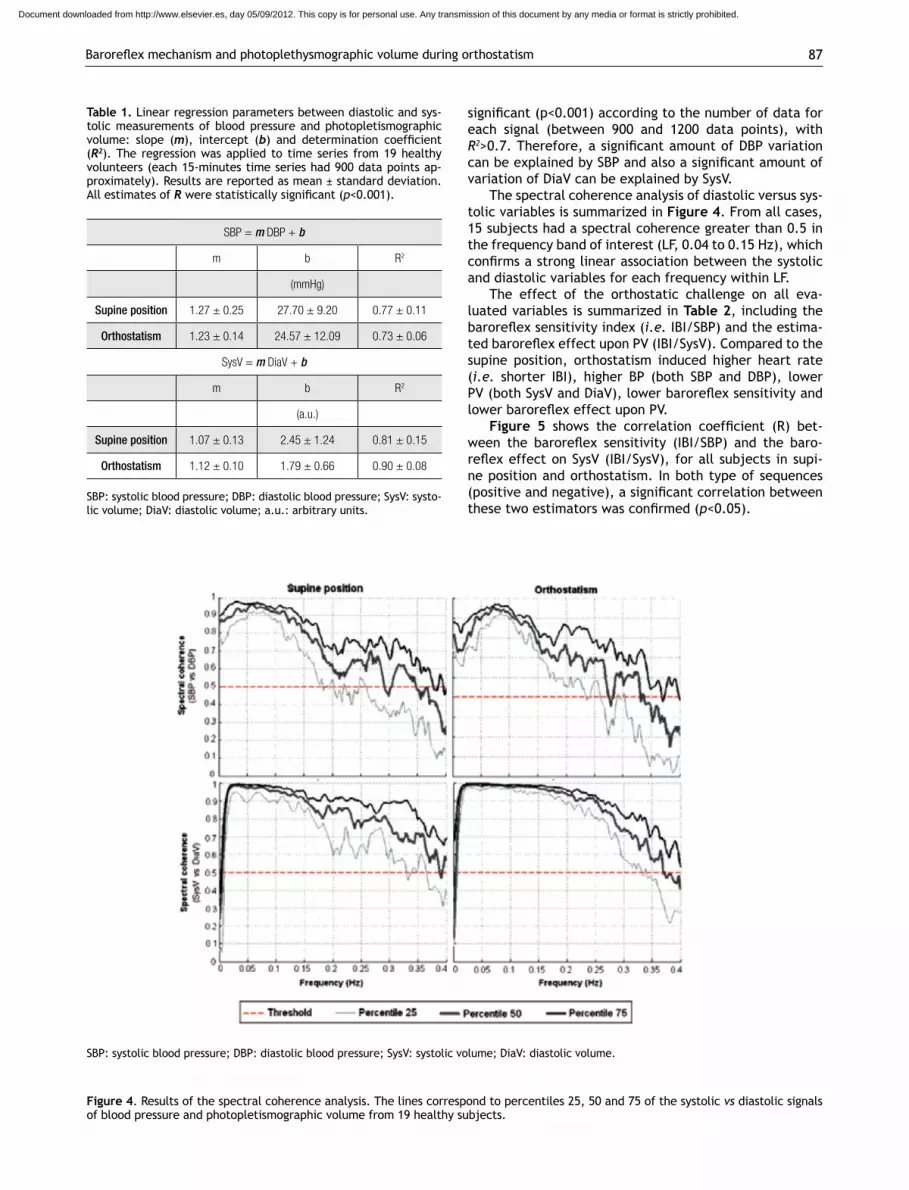
The spectral coherence analysis of diastolic versus sys-tolic variables is summarized in Figure 4. From all cases, 15 subjects had a spectral coherence greater than 0.5 in the frequency band of interest (lF, 0.04 to 0.15 hz), which confirms a strong linear association between the systolic and diastolic variables for each frequency within lF.
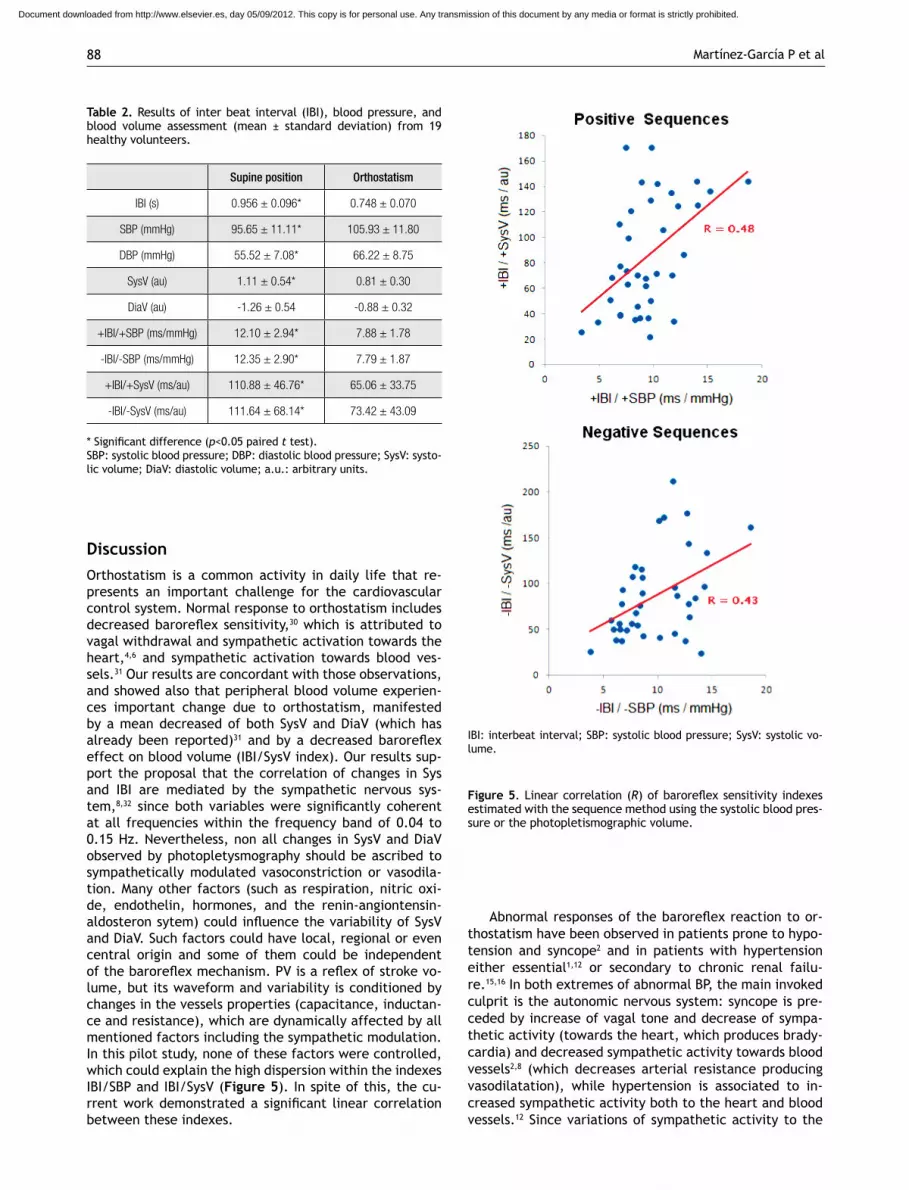
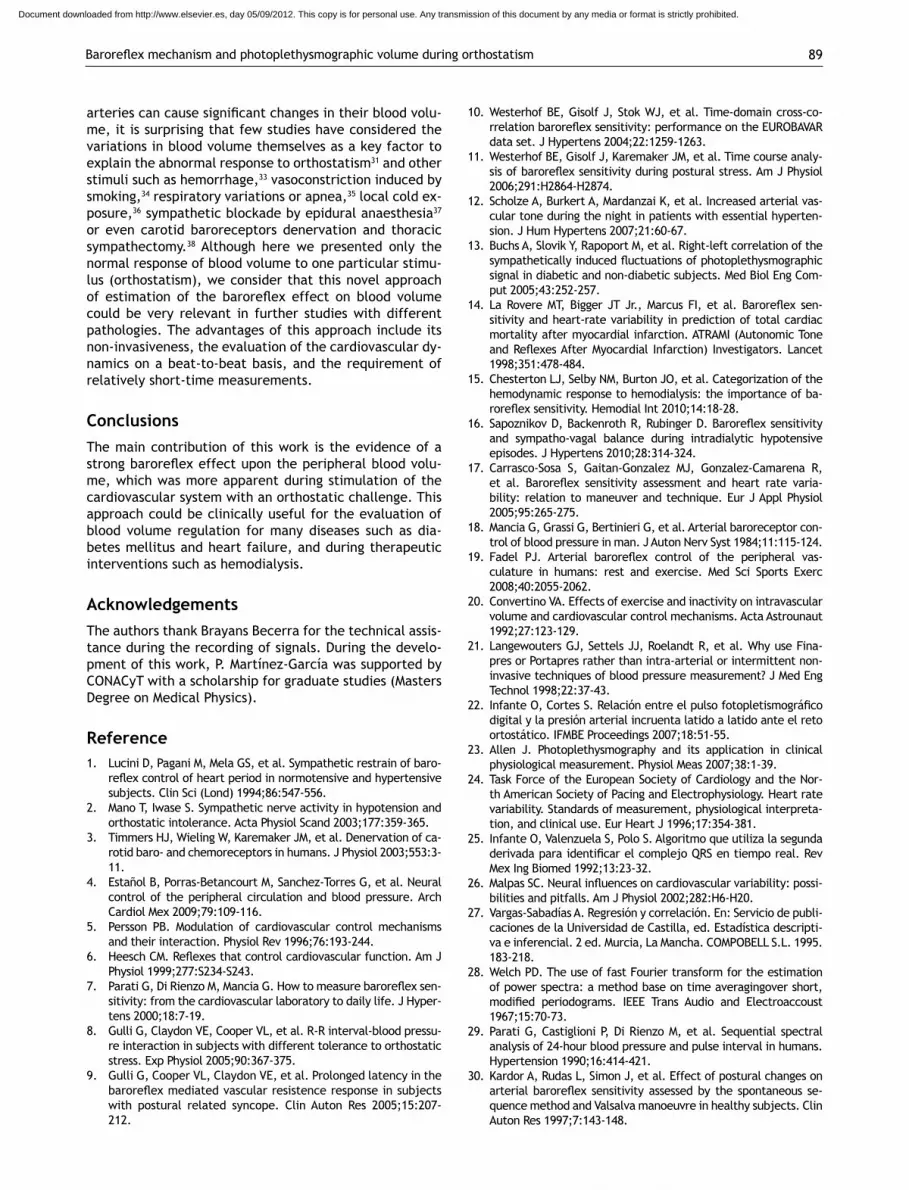
The effect of the orthostatic challenge on all eva-luated variables is summarized in Table 2, including the baroreflex sensitivity index (i.e. IBI/SBP) and the estima-ted baroreflex effect upon PV (IBI/SysV). Compared to the supine position, orthostatism induced higher heart rate (i.e. shorter IBI), higher BP (both SBP and DBP), lower PV (both SysV and DiaV), lower baroreflex sensitivity and lower baroreflex effect upon PV.
Figure 5 shows the correlation coefficient (R) bet-ween the baroreflex sensitivity (IBI/SBP) and the baro-reflex effect on SysV (IBI/SysV), for all subjects in supi-ne position and orthostatism. In both type of sequences (positive and negative), a significant correlation between these two estimators was confirmed (p<0.05).
Table 1. linear regression parameters between diastolic and sys-tolic measurements of blood pressure and photopletismographic volume: slope (m), intercept (b) and determination coefficient (R2). The regression was applied to time series from 19 healthy volunteers (each 15-minutes time series had 900 data points ap-proximately). results are reported as mean ± standard deviation. All estimates of R were statistically significant (p<0.001).
SBP = m DBP + b
m b R2
(mmHg)
Supine position 1.27 ± 0.25 27.70 ± 9.20 0.77 ± 0.11
Orthostatism 1.23 ± 0.14 24.57 ± 12.09 0.73 ± 0.06
SysV = m DiaV + b
m b R2
(a.u.)
Supine position 1.07 ± 0.13 2.45 ± 1.24 0.81 ± 0.15
Orthostatism 1.12 ± 0.10 1.79 ± 0.66 0.90 ± 0.08
SBP: systolic blood pressure; DBP: diastolic blood pressure; SysV: systo-lic volume; DiaV: diastolic volume; a.u.: arbitrary units.
Figure 4. results of the spectral coherence analysis. The lines correspond to percentiles 25, 50 and 75 of the systolic vs diastolic signals of blood pressure and photopletismographic volume from 19 healthy subjects.
SBP: systolic blood pressure; DBP: diastolic blood pressure; SysV: systolic volume; DiaV: diastolic volume.
Document downloaded from http://www.elsevier.es, day 05/09/2012. This copy is for personal use. Any transmission of this document by any media or format is strictly prohibited.
Martínez-García P et al88
DiscussionOrthostatism is a common activity in daily life that re-presents an important challenge for the cardiovascular control system. Normal response to orthostatism includes decreased baroreflex sensitivity,30 which is attributed to vagal withdrawal and sympathetic activation towards the heart,4,6 and sympathetic activation towards blood ves-sels.31 Our results are concordant with those observations, and showed also that peripheral blood volume experien-ces important change due to orthostatism, manifested by a mean decreased of both SysV and DiaV (which has already been reported)31 and by a decreased baroreflex effect on blood volume (IBI/SysV index). Our results sup-port the proposal that the correlation of changes in Sys and IBI are mediated by the sympathetic nervous sys-tem,8,32 since both variables were significantly coherent at all frequencies within the frequency band of 0.04 to 0.15 hz. Nevertheless, non all changes in SysV and DiaV observed by photopletysmography should be ascribed to sympathetically modulated vasoconstriction or vasodila-tion. Many other factors (such as respiration, nitric oxi-de, endothelin, hormones, and the renin-angiontensin-aldosteron sytem) could influence the variability of SysV and DiaV. Such factors could have local, regional or even central origin and some of them could be independent of the baroreflex mechanism. PV is a reflex of stroke vo-lume, but its waveform and variability is conditioned by changes in the vessels properties (capacitance, inductan-ce and resistance), which are dynamically affected by all mentioned factors including the sympathetic modulation. In this pilot study, none of these factors were controlled, which could explain the high dispersion within the indexes IBI/SBP and IBI/SysV (Figure 5). In spite of this, the cu-rrent work demonstrated a significant linear correlation between these indexes.
Abnormal responses of the baroreflex reaction to or-thostatism have been observed in patients prone to hypo-tension and syncope2 and in patients with hypertension either essential1,12 or secondary to chronic renal failu-re.15,16 In both extremes of abnormal BP, the main invoked culprit is the autonomic nervous system: syncope is pre-ceded by increase of vagal tone and decrease of sympa-thetic activity (towards the heart, which produces brady-cardia) and decreased sympathetic activity towards blood vessels2,8 (which decreases arterial resistance producing vasodilatation), while hypertension is associated to in-creased sympathetic activity both to the heart and blood vessels.12 Since variations of sympathetic activity to the
Table 2. results of inter beat interval (IBI), blood pressure, and blood volume assessment (mean ± standard deviation) from 19 healthy volunteers.
Supine position Orthostatism
IBI (s) 0.956 ± 0.096* 0.748 ± 0.070
SBP (mmHg) 95.65 ± 11.11* 105.93 ± 11.80
DBP (mmHg) 55.52 ± 7.08* 66.22 ± 8.75
SysV (au) 1.11 ± 0.54* 0.81 ± 0.30
DiaV (au) -1.26 ± 0.54 -0.88 ± 0.32
+IBI/+SBP (ms/mmHg) 12.10 ± 2.94* 7.88 ± 1.78
-IBI/-SBP (ms/mmHg) 12.35 ± 2.90* 7.79 ± 1.87
+IBI/+SysV (ms/au) 110.88 ± 46.76* 65.06 ± 33.75
-IBI/-SysV (ms/au) 111.64 ± 68.14* 73.42 ± 43.09
* Significant difference (p<0.05 paired t test).SBP: systolic blood pressure; DBP: diastolic blood pressure; SysV: systo-lic volume; DiaV: diastolic volume; a.u.: arbitrary units.
Figure 5. linear correlation (R) of baroreflex sensitivity indexes estimated with the sequence method using the systolic blood pres-sure or the photopletismographic volume.
IBI: interbeat interval; SBP: systolic blood pressure; SysV: systolic vo-lume.
Document downloaded from http://www.elsevier.es, day 05/09/2012. This copy is for personal use. Any transmission of this document by any media or format is strictly prohibited.
Baroreflex mechanism and photoplethysmographic volume during orthostatism 89
arteries can cause significant changes in their blood volu-me, it is surprising that few studies have considered the variations in blood volume themselves as a key factor to explain the abnormal response to orthostatism31 and other stimuli such as hemorrhage,33 vasoconstriction induced by smoking,34 respiratory variations or apnea,35 local cold ex-posure,36 sympathetic blockade by epidural anaesthesia37 or even carotid baroreceptors denervation and thoracic sympathectomy.38 Although here we presented only the normal response of blood volume to one particular stimu-lus (orthostatism), we consider that this novel approach of estimation of the baroreflex effect on blood volume could be very relevant in further studies with different pathologies. The advantages of this approach include its non-invasiveness, the evaluation of the cardiovascular dy-namics on a beat-to-beat basis, and the requirement of relatively short-time measurements.
ConclusionsThe main contribution of this work is the evidence of a strong baroreflex effect upon the peripheral blood volu-me, which was more apparent during stimulation of the cardiovascular system with an orthostatic challenge. This approach could be clinically useful for the evaluation of blood volume regulation for many diseases such as dia-betes mellitus and heart failure, and during therapeutic interventions such as hemodialysis.
AcknowledgementsThe authors thank Brayans Becerra for the technical assis-tance during the recording of signals. During the develo-pment of this work, P. Martínez-García was supported by CONACyT with a scholarship for graduate studies (Masters Degree on Medical Physics).
Reference1. lucini D, Pagani M, Mela GS, et al. Sympathetic restrain of baro-
reflex control of heart period in normotensive and hypertensive subjects. Clin Sci (Lond) 1994;86:547-556.
2. Mano T, Iwase S. Sympathetic nerve activity in hypotension and orthostatic intolerance. Acta Physiol Scand 2003;177:359-365.
3. Timmers hJ, Wieling W, Karemaker JM, et al. Denervation of ca-rotid baro- and chemoreceptors in humans. J Physiol 2003;553:3-11.
4. Estañol B, Porras-Betancourt M, Sanchez-Torres G, et al. Neural control of the peripheral circulation and blood pressure. Arch Cardiol Mex 2009;79:109-116.
5. Persson PB. Modulation of cardiovascular control mechanisms and their interaction. Physiol rev 1996;76:193-244.
6. Heesch CM. Reflexes that control cardiovascular function. Am J Physiol 1999;277:S234-S243.
7. Parati G, Di Rienzo M, Mancia G. How to measure baroreflex sen-sitivity: from the cardiovascular laboratory to daily life. J hyper-tens 2000;18:7-19.
8. Gulli G, Claydon VE, Cooper Vl, et al. r-r interval-blood pressu-re interaction in subjects with different tolerance to orthostatic stress. Exp Physiol 2005;90:367-375.
9. Gulli G, Cooper Vl, Claydon VE, et al. Prolonged latency in the baroreflex mediated vascular resistence response in subjects with postural related syncope. Clin Auton res 2005;15:207-212.
10. Westerhof BE, Gisolf J, Stok WJ, et al. Time-domain cross-co-rrelation baroreflex sensitivity: performance on the EUROBAVAR data set. J hypertens 2004;22:1259-1263.
11. Westerhof BE, Gisolf J, Karemaker JM, et al. Time course analy-sis of baroreflex sensitivity during postural stress. Am J Physiol 2006;291:h2864-h2874.
12. Scholze A, Burkert A, Mardanzai K, et al. Increased arterial vas-cular tone during the night in patients with essential hyperten-sion. J hum hypertens 2007;21:60-67.
13. Buchs A, Slovik Y, rapoport M, et al. right-left correlation of the sympathetically induced fluctuations of photoplethysmographic signal in diabetic and non-diabetic subjects. Med Biol Eng Com-put 2005;43:252-257.
14. La Rovere MT, Bigger JT Jr., Marcus FI, et al. Baroreflex sen-sitivity and heart-rate variability in prediction of total cardiac mortality after myocardial infarction. ATrAMI (Autonomic Tone and Reflexes After Myocardial Infarction) Investigators. Lancet 1998;351:478-484.
15. Chesterton lJ, Selby NM, Burton JO, et al. Categorization of the hemodynamic response to hemodialysis: the importance of ba-roreflex sensitivity. Hemodial Int 2010;14:18-28.
16. Sapoznikov D, Backenroth R, Rubinger D. Baroreflex sensitivity and sympatho-vagal balance during intradialytic hypotensive episodes. J hypertens 2010;28:314-324.
17. Carrasco-Sosa S, Gaitan-Gonzalez MJ, Gonzalez-Camarena r, et al. Baroreflex sensitivity assessment and heart rate varia-bility: relation to maneuver and technique. Eur J Appl Physiol 2005;95:265-275.
18. Mancia G, Grassi G, Bertinieri G, et al. Arterial baroreceptor con-trol of blood pressure in man. J Auton Nerv Syst 1984;11:115-124.
19. Fadel PJ. Arterial baroreflex control of the peripheral vas-culature in humans: rest and exercise. Med Sci Sports Exerc 2008;40:2055-2062.
20. Convertino VA. Effects of exercise and inactivity on intravascular volume and cardiovascular control mechanisms. Acta Astrounaut 1992;27:123-129.
21. langewouters GJ, Settels JJ, roelandt r, et al. Why use Fina-pres or Portapres rather than intra-arterial or intermittent non-invasive techniques of blood pressure measurement? J Med Eng Technol 1998;22:37-43.
22. Infante O, Cortes S. Relación entre el pulso fotopletismográfico digital y la presión arterial incruenta latido a latido ante el reto ortostático. IFMBE Proceedings 2007;18:51-55.
23. Allen J. Photoplethysmography and its application in clinical physiological measurement. Physiol Meas 2007;38:1-39.
24. Task Force of the European Society of Cardiology and the Nor-th American Society of Pacing and Electrophysiology. heart rate variability. Standards of measurement, physiological interpreta-tion, and clinical use. Eur heart J 1996;17:354-381.
25. Infante O, Valenzuela S, Polo S. Algoritmo que utiliza la segunda derivada para identificar el complejo QRS en tiempo real. Rev Mex Ing Biomed 1992;13:23-32.
26. Malpas SC. Neural influences on cardiovascular variability: possi-bilities and pitfalls. Am J Physiol 2002;282:h6-h20.
27. Vargas-Sabadías A. regresión y correlación. En: Servicio de publi-caciones de la Universidad de Castilla, ed. Estadística descripti-va e inferencial. 2 ed. Murcia, la Mancha. COMPOBEll S.l. 1995. 183-218.
28. Welch PD. The use of fast Fourier transform for the estimation of power spectra: a method base on time averagingover short, modified periodograms. IEEE Trans Audio and Electroaccoust 1967;15:70-73.
29. Parati G, Castiglioni P, Di rienzo M, et al. Sequential spectral analysis of 24-hour blood pressure and pulse interval in humans. hypertension 1990;16:414-421.
30. Kardor A, rudas l, Simon J, et al. Effect of postural changes on arterial baroreflex sensitivity assessed by the spontaneous se-quence method and Valsalva manoeuvre in healthy subjects. Clin Auton res 1997;7:143-148.
Document downloaded from http://www.elsevier.es, day 05/09/2012. This copy is for personal use. Any transmission of this document by any media or format is strictly prohibited.

Martínez-García P et al90
31. Foo JY, lim CS, Wilson SJ. Photoplethysmographic assessment of hemodynamic variations using pulsatile tissue blood volume. Angiology 2008;59:745-752.
32. hermosillo AG, Marquez MF, Jauregui-renaud K, et al. Orthosta-tic hypotension, 2001. Cardiol rev 2001;9:339-347.
33. Middleton PM, Chan GS, O’lone E, et al. Changes in left ventri-cular ejection time and pulse transit time derived from finger photoplethysmogram and electrocardiogram during moderate haemorrhage. Clin Physiol Funct Imaging 2009;29:163-169.
34. Guerrisi M, Vannucci I, Toschi N. Differential response of peri-pheral arterial compliance-related indices to a vasoconstrictive stimulus. Physiol Meas 2009;30:81-100.
35. Palada I, Eterovic D, Obad A, et al. Spleen and cardiovascular function during short apneas in divers. J Appl Physiol 2007;103:1958-1963.
36. raamat r, Jagomagi K, Talts J. Calibrated photoplethysmogra-phic estimation of digital pulse volume and arterial compliance. Clin Physiol Funct Imaging 2007;27:354-362.
37. Babchenko A, Davidson E, Ginosar Y, et al. Photoplethysmo-graphic measurement of changes in total and pulsatile tissue blood volume, following sympathetic blockade. Physiol Meas 2001;22:389-396.
38. Nitzan M, Babchenko A, Shemesh D, et al. Influence of thoracic sympathectomy on cardiac induced oscillations in tissue blood volume. Med Biol Eng Comput 2001;39:579-583.
Document downloaded from http://www.elsevier.es, day 05/09/2012. This copy is for personal use. Any transmission of this document by any media or format is strictly prohibited.