reforming public service provision: what have we learned?
TRANSCRIPT
econstorMake Your Publications Visible.
A Service of
zbwLeibniz-InformationszentrumWirtschaftLeibniz Information Centrefor Economics
Sørensen, Peter Birch
Working Paper
Reforming public service provision: What have welearned?
EPRU Working Paper Series, No. 2015-01
Provided in Cooperation with:Economic Policy Research Unit (EPRU), University of Copenhagen
Suggested Citation: Sørensen, Peter Birch (2015) : Reforming public service provision: Whathave we learned?, EPRU Working Paper Series, No. 2015-01, University of Copenhagen,Economic Policy Research Unit (EPRU), Copenhagen
This Version is available at:http://hdl.handle.net/10419/123493
Standard-Nutzungsbedingungen:
Die Dokumente auf EconStor dürfen zu eigenen wissenschaftlichenZwecken und zum Privatgebrauch gespeichert und kopiert werden.
Sie dürfen die Dokumente nicht für öffentliche oder kommerzielleZwecke vervielfältigen, öffentlich ausstellen, öffentlich zugänglichmachen, vertreiben oder anderweitig nutzen.
Sofern die Verfasser die Dokumente unter Open-Content-Lizenzen(insbesondere CC-Lizenzen) zur Verfügung gestellt haben sollten,gelten abweichend von diesen Nutzungsbedingungen die in der dortgenannten Lizenz gewährten Nutzungsrechte.
Terms of use:
Documents in EconStor may be saved and copied for yourpersonal and scholarly purposes.
You are not to copy documents for public or commercialpurposes, to exhibit the documents publicly, to make thempublicly available on the internet, or to distribute or otherwiseuse the documents in public.
If the documents have been made available under an OpenContent Licence (especially Creative Commons Licences), youmay exercise further usage rights as specified in the indicatedlicence.
www.econstor.eu

EPRU Working Paper Series 2015-01
Economic Policy Research Unit Department of Economics University of Copenhagen Øster Farimagsgade 5, Building 26 DK‐1353 Copenhagen K DENMARK Tel: (+45) 3532 4411 Fax: (+45) 3532 4444 Web: http://www.econ.ku.dk/epru/
Reforming Public Service Provision: What have we learned?
Peter Birch Sørensen
ISSN 0908‐7745
August 2014
REFORMING PUBLIC SERVICE PROVISION:
WHAT HAVE WE LEARNED?
Peter Birch Sørensen
University of Copenhagen, EPRU and CESifo
Background paper for keynote lecture presented at the
CESifo Venice Summer Institute Workshop on
REFORMING THE PUBLIC SECTOR
at Venice International University, 25-26 July 2014
Abstract: The essay discusses some key features of the wawe of public sector reforms that has
swept through the OECD area during the last three decades under the heading of New Public
Management. I review what economic theory and the empirical evidence can say about the
effects of introducing pay for performance, performance measurement and various forms of
competition in the public sector. I also review some evidence on the growing bureaucratization
of the public sector and discuss the drivers behind this trend. The final part of the essay draws
some implications for the design of public sector reforms.
Address for correspondence:
Peter Birch Sørensen
University of Copenhagen, Department of Economics
Øster Farimagsgade 5, 1353 Copenhagen K, Denmark.
E-mail: [email protected]
REFORMING PUBLIC SERVICE PROVISION:
WHAT HAVE WE LEARNED?
Peter Birch Sørensen1
University of Copenhagen, EPRU and CESifo
“It is quite true what philosophy says, that life must be understood backward.
But then one forgets the other principle, that it must be lived forward.”
Søren Kierkegaard, Danish philosopher, 1813-1855.
Setting the scene
As Søren Kierkegaard told us, we humans are doomed to take actions without being
able to foresee their consequences. This leads to many regrets, in public affairs as well
as in personal life. In particular, when we experiment with reforming an organism as
complex as the modern public sector, regrets are almost inevitable, and this paper will
illustrate some examples.
Public sector reform has been high on the policy agenda in the OECD area for at
least three decades now. In the early 1980s many OECD governments struggled with
large budget deficits during the recession triggered by the second OPEC oil price shock.
Following a long period of rapid public sector expansion, several countries embarked on
a series of public sector reforms aimed at containing public expenditure and improving
public sector productivity.
Today the situation is very similar. In the wake of the recent financial crisis and the
European sovereign debt crisis, the advanced economies need to consolidate their public
finances, and governments are seeking new ways of meeting the need for public services
with fewer resources. In a longer run perspective, population ageing will also increase the
pressure on public budgets and is already forcing governments to rethink many of their
spending programs and practices.
Against this background I will discuss some important issues of public sector reform.
To limit the scope of the analysis, I will not consider reforms of public transfer pro-
grams such as social insurance systems.2 Instead I will focus on reforms of public service
provision.
1In preparing this paper I have drawn on my work as chairman of the Danish government’s Produc-
tivity Commission in 2012-2014 and as a current member of the Norwegian government’s Productivity
Commission. I thank the members of these committees and their secretariats for inspiring discussions.
I have also benefited from the studies prepared for the Danish Productivity Commission by Lotte Bøgh
Andersen, Peter Bogetoft, Jørgen Grønnegaard Christensen, Niels Ejersbo, Carsten Greve, Anne Line
Tenney Jordan, Kurt Houlberg and Jesper Wittrup. None of these persons or institutions are accountable
for any viewpoints expressed in this paper or for any shortcomings of my analysis.2I have done so elsewhere together with Lans Bovenberg and Martin Hansen. See, e.g., Bovenberg
and Sørensen (2004) and Bovenberg, Hansen and Sørensen (2012).
2
Only a few public services provided by the modern welfare state are genuine public
goods such as defence, police protection, the court system and basic infrastructure. Most
public services are private goods that are rival and excludable in consumption and could
alternatively be purchased in the marketplace. James Tobin (1970) coined the term
“specific egalitarianism” to explain why most western governments have nevertheless
decided to offer these services to citizens free of charge or at user fees far below the costs
of production. As Tobin argued, certain goods such as education and health care are
so important for individual welfare that every citizen should be guaranteed a minimum
level of consumption of these goods regardless of his or her ability to pay. In other words,
it is the duty of the state to ensure that the unequal distribution of income does not
generate a similar inequality in the consumption of certain vital goods. I take for granted
that the welfare states in Europe and elsewhere wish to uphold the principle of specific
egalitarianism and will therefore continue to provide several important services to citizens
via the public budget. I will discuss what economic theory and evidence can say about
the possibilities for delivering these services in a more efficient manner.
The social science literature on public administration and public sector reform is
enormous, so my discussion has to be highly selective. I will focus on normative issues
and will only sporadically discuss the political economy factors determining whether
public sector reforms can actually be successfully implemented.3 I start in section 1 by
motivating why public sector reform is so important. Section 2 reviews some peculiar
features of the public sector that any reform strategy must take into account. In section
3 I sketch the main elements of the so-called New Public Management (NPM) that has
provided the agenda for many public sector reforms in recent decades. Sections 4 through
6 discuss whether public sector efficiency can be improved through NPMmechanisms such
as pay for performance, performance measurement, yardstick competition, vouchers and
outsourcing of public service provision. In section 7 I discuss the drivers behind “red
tape” in the public sector. The concluding section 8 summarizes my main findings and
discusses their implications for public sector reform. Two technical appendices document
some of the theoretical results reported in the main text.
1. A fundamental threat to the welfare state: Baumol’s cost dis-
ease
One simple reason why an efficient public sector is important for prosperity and welfare
is that so many people work there. As illustrated in figure 1, almost a third of the labour
force works for the general government in countries like Norway and Denmark, and the
average OECD government employed about 16 percent of the country’s total work force
3For an overview of this important issue see, e.g., Høj et al. (2006) and Bunse and Fritz (2012).
3
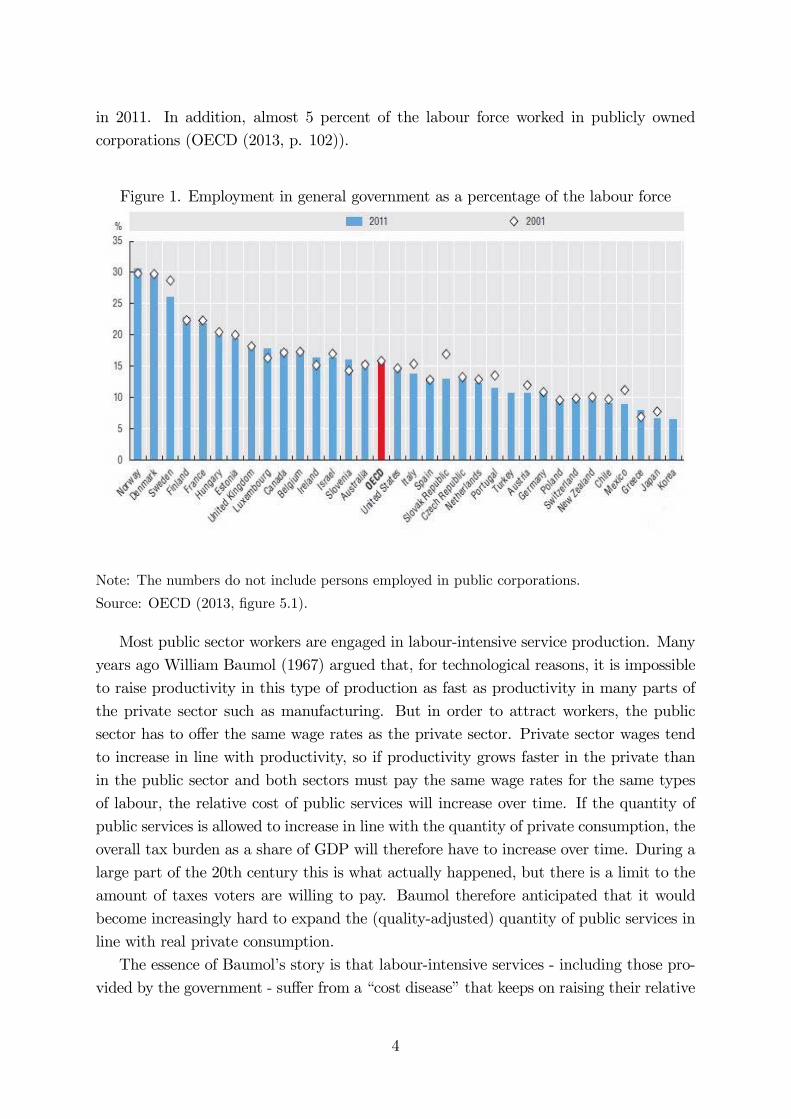
in 2011. In addition, almost 5 percent of the labour force worked in publicly owned
corporations (OECD (2013, p. 102)).
Figure 1. Employment in general government as a percentage of the labour force
Note: The numbers do not include persons employed in public corporations.
Source: OECD (2013, figure 5.1).
Most public sector workers are engaged in labour-intensive service production. Many
years ago William Baumol (1967) argued that, for technological reasons, it is impossible
to raise productivity in this type of production as fast as productivity in many parts of
the private sector such as manufacturing. But in order to attract workers, the public
sector has to offer the same wage rates as the private sector. Private sector wages tend
to increase in line with productivity, so if productivity grows faster in the private than
in the public sector and both sectors must pay the same wage rates for the same types
of labour, the relative cost of public services will increase over time. If the quantity of
public services is allowed to increase in line with the quantity of private consumption, the
overall tax burden as a share of GDP will therefore have to increase over time. During a
large part of the 20th century this is what actually happened, but there is a limit to the
amount of taxes voters are willing to pay. Baumol therefore anticipated that it would
become increasingly hard to expand the (quality-adjusted) quantity of public services in
line with real private consumption.
The essence of Baumol’s story is that labour-intensive services - including those pro-
vided by the government - suffer from a “cost disease” that keeps on raising their relative
4
prices, since productivity growth in these areas of production cannot keep pace with
productivity growth elsewhere in the economy.
Productivity growth in many private service industries is hard to measure, because
changes in service quality can be difficult to observe. Productivity growth in public
service production is even harder to pin down, since these services are not traded in a
marketplace where observed market prices provide an indicator of the value of output
to consumers. However, the national income statistics of OECD countries do suggest a
long run tendency for labour productivity to grow more slowly in most private service
industries than in agriculture and manufacturing. In recent years the national statisti-
cal offices in EU member states have implemented a so-called output-based method of
productivity measurement aimed at estimating the growth of labour productivity in the
public sector. For what they are worth, these statistics also suggest that productivity
growth in the public sector tends to lag behind the average productivity growth rate in
the private sector.4
Such unbalanced productivity growth has some unpleasant implications for the future
of tax-financed public services. This may be illustrated by some model simulations pre-
sented in a recent report by the Danish Productivity Commission (2014b, ch. 5). The
simulations were carried out by the DREAMModelling Group (2014), using a large scale
dynamic overlapping generations model of the Danish economy. According to the Danish
national income accounts, the average annual growth rate in real output per hour worked
in the period 2001-2010 was roughly 1.5 percent in the private sector, whereas it was
only about 0.5 percent in the public sector. In a baseline scenario it was assumed that
these average productivity growth rates will be maintained in the future and that the
ratio of total public consumption to GDP measured in current prices will be kept roughly
constant. On these assumptions the DREAM model was used to project the underlying
trend in real private consumption and in the real public service level. The latter variable
was calculated as the ratio between the projected real public service output and the ser-
vice output that would be needed to maintain the 2012-level of public service provision
for each person of a given age, sex and ethnic background in each of the various public
service areas such as education, child care, care for the elderly etc., given the expected
demographic developments in Denmark.5
In figure 2 the overall public service level and real private consumption have both
been normalized to 1.0 in 2012. The solid green curve shows the evolution of the public
service level in the baseline scenario, and the black curve with the white circular dots
4One serious limitation of official national income statistics is that - because of limited data availability
- they do not attempt to adjust for changes in the quality of public services. Another limitation is that
the value of non-market public services has to be measured from the cost side, even though the cost of
production does not necessarily reflect citizens’ willingness to pay for the services.5In the health care sector it was assumed that some of the health care services to the elderly will
gradually be postponed to a higher age due to so-called “healthy aging”.
5
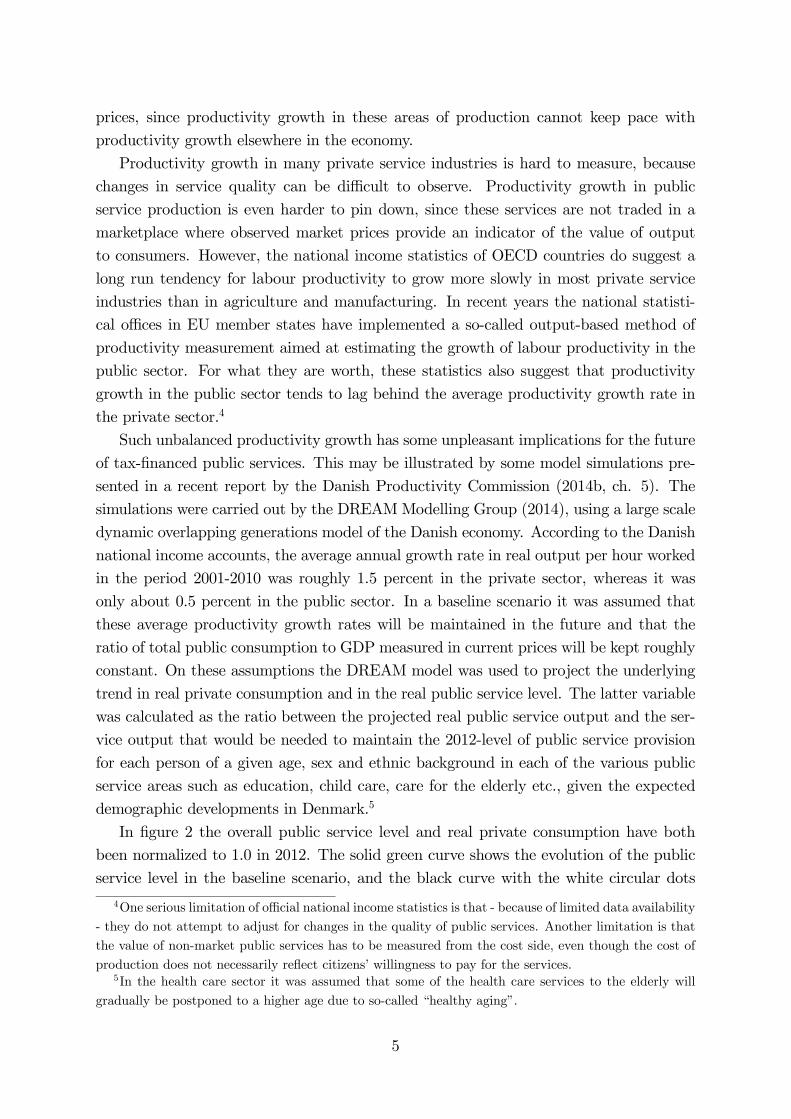
shows the path of private consumption which is projected to increase by almost 50 percent
between 2012 and 2040, roughly in line with the growth of GDP. By contrast, we see that
the public service level only increases by about 15 percent in the baseline scenario. The
main driver of the latter increase is the assumed 0.5 percent annual increase in labour
productivity, but since this is much lower than the 1.5 percent private sector productivity
growth rate, and since public consumption in current prices is not allowed to increase
relative to GDP, the public service level is projected to lag seriously behind real private
consumption.
Figure 2. Projected private and public consumption in Denmark
Note: The public service level is calculated as the ratio of actual real public consumption to
the amount of public consumption that would be needed to keep public service provision per
person in each demographic group constant. See the text for further explanation.
Source: Danish Productivity Commission (2014b, figure 30).
In an alternative scenario indicated by the white dotted line in figure 2, it is assumed
that labour productivity growth in the public sector is gradually doubled from 0.5 percent
to 1 percent per year between 2012 and 2020. Between 2020 and 2030 annual public
sector productivity growth is maintained at 1 percent, but is then assumed to fall back
gradually to 0.5 percent in 2040. We see that such a temporary doubling of public sector
productivity growth will only close a small part of the projected rising gap between
private and public consumption.
6
These simulations highlight the powerful long run implications of Baumol’s cost dis-
ease. While the income elasticity of demand for public services such as education and
health care is often believed to be at least one, the actual consumption of such services
will have to grow much slower than private consumption and GDP, unless voters are
prepared to let the government tax away an ever-increasing share of their income. This
underscores the importance of thinking about ways to increase public sector productivity
to counter the growing mismatch between private living standards and public service
provision.
2. What is special about the public sector?
The high labour-intensity of public service production is one important characteristic
of the public sector. The sector also has some other special features that any reform
strategy must take into account. Unfortunately several of these features tend to inhibit
productivity growth. In this section I will discuss those features that seemmost important
from an economic perspective.
A basic observation is that, whereas private firms are owned by entrepreneurs or
shareholders, public agencies are owned collectively by political communities and funded
largely by taxation rather than fees paid directly by customers. Thus public sector
organizations are controlled by political forces rather than market forces. This distinction
leads to a number of hypotheses regarding the particular goals, structures and values of
public sector organizations (see, e.g., Boyne (2002)). Some peculiarities that are often
emphasized in the literature are listed below.6
2.1. Special features of public sector organizations
Little or no competitive pressure. Although the users of public services may sometimes
choose freely among alternative providers, many public sector organizations are (local)
monopoly suppliers of the service they produce, and their budgets are determined in a
political or bureaucratic process. The absence of competition and the political constraint
on total spending mean that the more efficient public sector organizations cannot grow at
the expense of less efficient organizations. This contrasts with the private sector where the
more efficient firms can conquer markets shares from the less efficient producers through
the process of competition and creative destruction. Moreover, the lack of competition
may stifle the incentive to keep costs low and to innovate.
Weak or distorted economic incentives. For a number of reasons elaborated in section
4, the use of economic incentives such as performance bonuses and performance-based pay
6The list is far from complete, but it includes the features that seem most important to me. For an
elaboration see, e.g., Rainey and Bozeman (2000) and Boyne (2002).
7
schemes is less prevalent in the public than in the private sector. Hence the public sector
must rely more on other forms of motivation and incentives to ensure good performance.
In some cases the economic incentives in public sector organizations may even encourage
waste. A standard example is a scenario where an agency engages in unnecessary spending
towards the end of the fiscal year for fear that its budget for next year will otherwise be
cut. A related problem is that a public agency may have no incentive to make investments
that will reduce future costs if it expects that all of the cost saving will translate into a
smaller future budget.
Multiple or ambiguous goals. A private firm may have several intermediate goals and
groups of stakeholders, but in the end all other goals are irrelevant if the firm cannot make
enough profit to survive and generate the minimum return required by its owners. Public
sector organizations typically have many stakeholders such as the users of their services,
their employees, the general public, and politicians of different persuasions, and they
rarely have a single ultimate goal overriding all the others. Hence public agencies may
often strive to achieve several and even conflicting goals, and it may not be clear what
weight they are expected to put on the different objectives. Moreover, since the stated
goals of public institutions may reflect political compromises, they may be deliberately
vague due to a lack of political consensus. Such ambiguity poses a challenge to public
sector managers and makes it difficult to determine whether public sector organizations
perform well or badly.
Bureaucracy. A classic perception is that public sector organizations are more loaded
with “red tape” than private firms. This may be unavoidable, since resource allocation in
the public sector cannot be guided by market mechanisms, and since basic principles such
as the rights of all citizens to receive equal treatment and the need to prevent corruption
necessitate the use of various bureaucratic procedures. Of course, a private firm must
also use command-and-control mechanisms to allocate resources within the organization,
but the popular belief is that there is a stronger inherent tendency in the public sector
to create excessive bureaucracy. In section 7 I will discuss how such a tendency may
arise. Here I just note that if the public sector does in fact generate a lot of unnecessary
bureaucracy, productivity will obviously suffer.
Special values and preferences. It is often claimed that public sector managers and
employees are less materialistic and more altruistic than their private sector counterparts.
It is believed that public sector workers have a stronger motive to serve the public interest
and do good for their customers/clients or for society at large, either because individuals
with such motivation self-select into public sector employment; because the idealistic goals
of public sector organizations tend to instil such values into the minds of their employees,
or because people are more willing to behave altruistically when they work for a not-
for-profit employer who cannot exploit their idealism. Another hypothesis is that public
sector workers are on average more averse to risk than private sector workers, perhaps
8
because people with stronger risk aversion prefer to work in the public sector where job
security tends to be greater than in the private sector. Sometimes it is also claimed
that individuals with a relatively high marginal disutility of work (“lazy” people) tend
to select into public sector jobs because many of these jobs require less effort or shorter
working hours than private sector employers demand.
A more regulated labour market. Trade union density tends to be greater in the public
than in the private sector and centralized, collective bargaining over wages and work
conditions seems to be more prevalent in the public sector. In addition, many countries
have long traditions of offering certain groups of public employees a status as public
servants (in German: “Beamter”) with high job security and strong emphasis on pay
schedules based on seniority.7 More generally, important conditions of work and pay are
typically determined above the level of the individual public agency. Hence the individual
public sector manager may have little freedom to fire underperforming employees or to
differentiate the wage rates within the organization. Further, if trade unions are stronger
or more prevalent in the public than in the private sector, the average wage level for a
given type of workers may be higher in the public sector. At the same time the more
centralized wage setting there may imply a lower degree of wage dispersion and a lower
average wage for public than for private managers.
2.2. Evidence on the differences between public and private sector organiza-
tions
Testing the above hypotheses on the difference between public and private organizations
is not necessarily easy. For example, how do you measure the degree of bureaucracy, the
degree of public service motivation and risk aversion, or the ambiguity of the goals of an
organization? Most of the empirical research on these issues has relied on surveys and
questionnaires where managers and workers are asked a number of questions about their
practices, perceptions and attitudes. Sometimes such data on self-reported behaviour and
preferences has been combined with hard data on observed behaviour and characteristics.
The proposition that public sector organizations are on average less subject to com-
petitive (market) pressures than private firms seems obvious and has not really been
disputed in the literature. Likewise, it is widely acknowledged that performance-based
pay schemes and similar economic incentive mechanisms are less widespread in the public
sector (this is also reflected in the data on wage dispersion presented below).
Most comparative studies of public and private sector organizations have tried to
uncover differences regarding organizational goals, the degree of bureaucracy, and the
preferences and values of managers and employees. In a meta-analysis Boyne (2002)
7In return for job security, some of these public servants may not have the right to strike, even if they
are allowed to be members of a union.
9
evaluates evidence from 34 empirical studies of differences between public agencies and
private firms.8 He finds that the balance of the evidence offers some support for the
proposition that public agencies have more ambiguous goals. The evidence is not com-
pelling, however, and in the United States the answers of public managers to survey
questions about goal complexity and ambiguity do not seem to differ significantly from
the answers given by business managers, as pointed out by Rainey and Bozeman (2000).
Among the studies that have compared the degree of bureaucracy, Boyne (2002) finds
that a majority of them supports the hypothesis that there is more bureaucracy in public
agencies. This contrasts with the literature review by Rainey and Bozeman (2000) who
report that public managers do not differ from business managers in response to survey
questions about the degree of formalization and red tape within their organizations.
Perhaps this ambiguity of findings reflects the difficulty of defining and measuring such
a thing as “red tape”.
The review by Boyne (2002) reveals considerable empirical support for the hypoth-
esis that public managers are less materialistic in the sense of being less motivated by
monetary rewards than private business managers. Quite a few studies have also tried
to identify differences in preferences between public and private sector workers below the
management level. Most of these studies find that, on average, public sector employees
do indeed seem to have a stronger public service motivation (wishing to do good for
others or for society at large) than private sector employees. For example, the study
by Jakobsen and Sørensen (2012), using survey data for 13 countries for 1989, 1997 and
2005, finds a significant and stable difference in the degree of public service motivation
between the two sectors.
One weakness of survey data is that they reflect self-reported behaviour or preferences
which may deviate from actual behaviour and preferences. Buurman et al. (2012) avoid
this problem by using experimental data on revealed rather than stated preferences to
study whether public sector employees are more altruistic and risk averse than people
employed in the private sector. Respondents to a large-scale survey were offered a sub-
stantial financial reward and could choose between a widely redeemable gift certificate,
a lottery ticket, or making a donation to a charity. The authors found that public sector
employees were significantly less likely to choose the risky option (lottery). This is con-
sistent with the hypothesis that public employees tend to be more risk averse. Buurman
et al. (2012) also found that, at the start of their career, public sector workers were more
likely to choose the pro-social option (charity). However, as job tenure increased, the
difference in pro-social behaviour disappeared and was even reversed at some point. The
authors explained this reversal by a gradual disillusionment effect reflecting that public
sector workers with long tenures feel that they already contribute enough to society for
8Only a subset of these studies has tested all of the hypotheses regarding organizational goals, bu-
reaucracy and values and preferences.
10
too little pay.
An interesting issue is whether the stronger public service motivation of public workers
reflects the institutional environment or whether it results from self-selection of idealistic
people into the public sector. Gregg et al. (2011) try to resolve this issue by exploiting
data on unpaid overtime work from the British Household Panel Survey. They show that
individuals in the economy’s non-profit sector (which includes the general government)
are significantly more likely to do unpaid overtime than those in the for-profit sector, in
line with the hypothesis that public workers display more pro-social behaviour. However,
when individuals who are willing to “donate” labour move from the non-profit to the
for-profit sector, they seem no less willing to do unpaid overtime work. This suggests
that the stronger inclination towards pro-social behaviour in the public sector reflects a
self-selection effect rather than an effect of the institutional environment.
Another interesting issue is whether such a selection effect simply reflects that people
with a pro-social motivation select into specific occupations such as nursing, (nursery)
teaching, medicine, and other occupations within the classical welfare services that are
predominant in the public sector. Andersen and Pedersen (2013) use Danish survey
data to test for significant differences in motivation between private and public sector
employees within a given occupation. According to their study, employees in publicly
owned organizations more frequently report that is is important to contribute to the
community and that it is a civic duty to deliver public service. However, employees in
private organizations are found to have higher levels of user orientation, reporting more
frequently that it motivates them to know that they helped the user, that the job is
done when the user is satisfied, and that the individual user is more important than
formal rules. Thus both private and public sector employees may be said to harbour pro-
social preferences, but in the public sector these preferences are more oriented towards
serving the general public whereas they are more geared towards serving the individual
client/customer in the private sector.
As mentioned in the previous section, some people have claimed that the public sector
tends to attract more “lazy” workers, because public sector employers do not always
require as much effort (or as long working hours) from their employees as do private
employers. If this claim is true, we should expect to see “lazy” workers moving more
frequently from private to public sector jobs than moving in the opposite direction. But
how do we determine whether a worker is “lazy”? Delfgaauw and Dur (2008) use U.S.
and Dutch survey data when trying to answer this question. In their U.S. data set the
indicator of laziness is the response to the statement: ‘I see myself as someone who is
lazy at times.’ In the Dutch survey data the degree of laziness is measured by the answer
to the question whether a preference for reduced work load was one of the three most
important reasons for leaving the previous job. Using these indicators, Delfgaauw and
Dur found that “lazy” workers in both countries do in fact tend to move from private to
11
public sector jobs more frequently than they move in the opposite direction. The issue of
course is whether this really reflects that public sector workers are inherently more lazy
in the sense of having a higher marginal disutility of work for any given amount of effort,
or whether it reflects that some people working in the public sector have to spend more
time on (family) duties at home or choose to invest some of their working time outside
the formal labour market (e.g. doing voluntary work).
While testing for differences in preferences across private and public sector workers is
hard, due to the difficulty of observing preferences, it is easier to document the differences
between private and public sector labour markets. Using data for 14 OECD countries,
including the Anglo-Saxon countries and France, Germany and Spain, among others,
Visser (2006, table 4) shows that trade union densities are generally much higher in
the public than in the private sector. This is in line with the findings of Gregory and
Borland (1999) who also point out the following main facts: (i) Public sector employment
tends to be concentrated in professional and clerical jobs and to require workers with
relatively high levels of education. (ii) Public sector employees are generally found to have
higher average earnings than private sector employees, in part reflecting higher levels of
educational attainment, and partly reflecting (in most countries) a genuine wage premium
that could be due to a higher degree of unionization. (iii) Public sector employees have
a more compressed distribution of earnings than private sector employees.
The latter fact is illustrated in figure 3 which shows the wage distribution for public
and private sector clerical workers in Denmark. The picture is the same for other occu-
pational groups in Denmark: the wage distribution is much more narrow in the public
than in the private sector. The Danish Productivity Commission (2013, table 8) also
documents that only 8 percent of the Danish public sector wage bill is subject to local
wage negotiations at the level of the individual work place; the remaining 92 percent of
the wage bill is settled through centralized collective bargaining. This is in sharp contrast
to the Danish private labour market where only 14 percent of the wage bill is determined
through centralized bargaining, the remaining part being negotiated at the firm level.
As a general rule, management decisions on personnel also seem to be significantly
more constrained in the public sector. For example, in the United States a large number
of surveys have revealed sharp differences between the responses of public and private
managers to questions about constraints under personnel rules. A high percentage of
public managers say that they do not have enough authority to remove, hire, promote
and determine the pay of their employees (Rainey and Bozeman, 2000, p. 455).
12
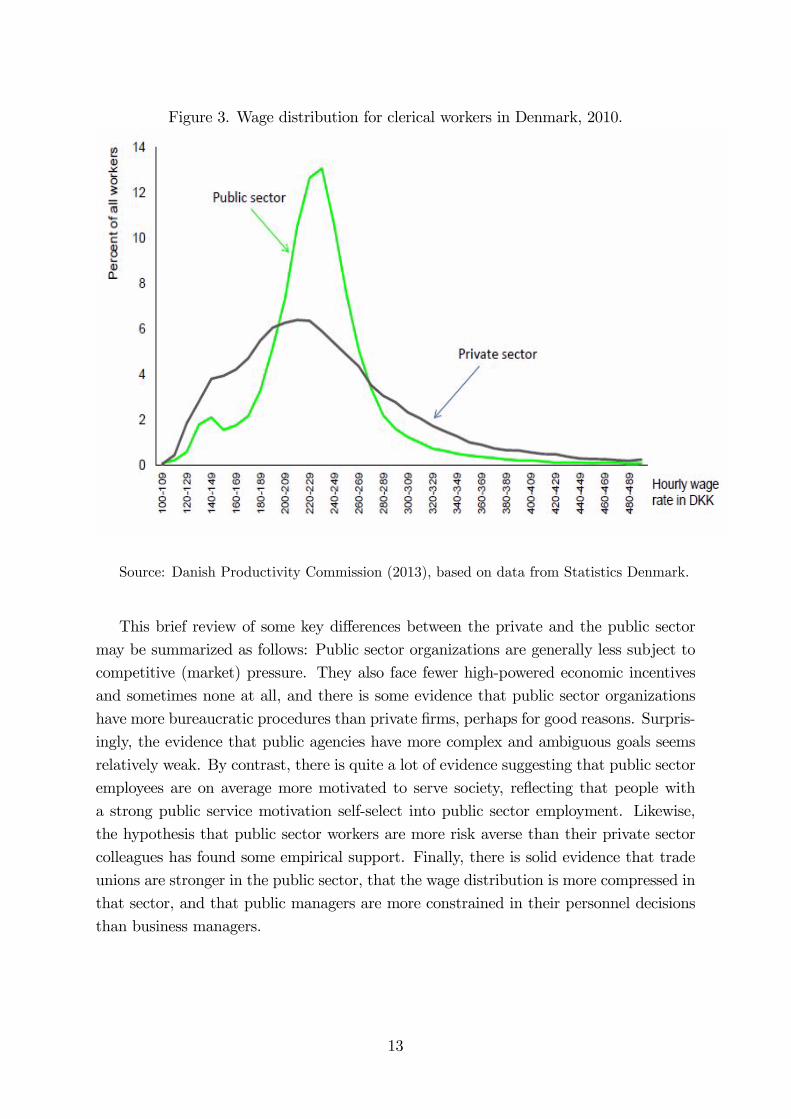
Figure 3. Wage distribution for clerical workers in Denmark, 2010.
Source: Danish Productivity Commission (2013), based on data from Statistics Denmark.
This brief review of some key differences between the private and the public sector
may be summarized as follows: Public sector organizations are generally less subject to
competitive (market) pressure. They also face fewer high-powered economic incentives
and sometimes none at all, and there is some evidence that public sector organizations
have more bureaucratic procedures than private firms, perhaps for good reasons. Surpris-
ingly, the evidence that public agencies have more complex and ambiguous goals seems
relatively weak. By contrast, there is quite a lot of evidence suggesting that public sector
employees are on average more motivated to serve society, reflecting that people with
a strong public service motivation self-select into public sector employment. Likewise,
the hypothesis that public sector workers are more risk averse than their private sector
colleagues has found some empirical support. Finally, there is solid evidence that trade
unions are stronger in the public sector, that the wage distribution is more compressed in
that sector, and that public managers are more constrained in their personnel decisions
than business managers.
13
3. A conventional reform agenda: From Old Public Administra-
tion to New Public Management
During the 1980s and 1990s a wave of public sector reforms swept through the OECD area
and beyond, often under slogans such as “modernization”, “debureaucratization” and
“reinventing government”. In several cases the reforms were triggered by fiscal crises, but
they also reflected a growing dissatisfaction with the performance of existing government
structures and a shift in the prevailing political and ideological mood in favour of more
market-oriented policies. At least within the OECD, the reforms had many common
features, following (albeit with different degrees of rigour) a paradigm which became
known as the New Public Management (NPM). In this section I will sketch the main
elements of NPM and briefly review the controversy that this reform agenda has created.
3.1. Key features of New Public Management
Proponents of NPM sought to escape from the principles of the so-called Old Public
Administration characterized by centralized and hierarchical administrative structures
and an emphasis on rules-based behaviour and fixed, impersonal bureaucratic procedures.
NPM is not a tightly knit set of principles and policies. Its main ideas have evolved over
time, and different authors have stressed different aspects of the paradigm (see, e.g., Hood
(1989), Barzelay (2000) and Gruening (2001)). Both practitioners and academics have
contributed to the development of the ideas underlying NPM. Some of these ideas were
clearly stimulated by developments within the science of economics such as the emergence
of principal-agent theory, and some reflected an attempt to transfer methods of private
business management to the public sector. Inspired by Dunleavy et al. (2005), we may
summarize some important features of NPM under the following headings.
Decentralization: Many NPM reforms involved a splitting up of large centralized and
hierarchical administrative units into a number of smaller public agencies with more
specialized tasks, separated by arms-length distance to the relevant central ministries.
As part of this process, a clear distinction was introduced between the purchaser of some
public service (e.g., a central ministry) and the provider of that service which could be
a specialized government agency or a private firm. Instead of management by direct
orders from the central administrative unit, the relationship between purchasers and
providers typically came to be governed by some form of contract specifying the services
and performance expected from the decentralized units. An important idea was that
the managers of the decentralized units should be given more flexibility to solve their
assigned tasks. “Let managers manage” became a slogan, and there was talk of a “big
bargain” in which local managers would be freed from a lot of the centrally imposed
regulation of work processes in return for greater accountability for the final results
14
produced by their organizations. As Robert D. Behn has put it: ‘Under the New Public
Management, civil servants are not automatons, merely implementing policies according
to rules promulgated from above. Rather, the public management paradigm assumes
that civil servants are intelligent, that they understand the problems their agencies are
charged with alleviating, that they have some useful ideas, either their own ones or
borrowed from others, about how to fix those problems, and that they can, given the
freedom, quickly convert those ideas into effective action. Indeed, the public management
paradigm assumes that, because front line civil servants are close to the problems, they
are in a very good position (perhaps the best position) to decide what approach to take
in solving public problems.’ (Behn, 1998, p. 133).
Incentivization: NPM reforms have often also sought to introduce stronger economic
incentives for good performance in public sector organizations. For example, the per-
formance contracts governing the relationships between purchasers and providers typ-
ically involved some kind of performance-related pay or bonus to local managers, and
sometimes performance-based pay was also introduced for the employees at lower lev-
els. Other important ways of strengthening economic incentives were the privatization of
many formerly state-owned enterprises and the deregulation of various network industries
previously under tight government control. Along with the introduction of performance-
related incentives followed the need for a more systematic measurement of performance,
so efforts were made (at least in theory) to secure improved performance measurement
and auditing on a systematic recurrent basis. The emphasis on decentralization and
incentivization also created a need for improved methods of accounting and financial
management within government agencies, and some countries introduced principles of
accruals accounting and more sophisticated methods of cost allocation in their public
sectors.
Competition: The introduction of various forms of competition in the public sector as
an incentive to strengthen performance was an important element in many NPM reforms.
Often this took the form of outsourcing the provision of public services via a process of
competitive public tender. Although this frequently meant that a private firm took over
the provision of the service, the incumbent public in-house provider was sometimes also al-
lowed to bid for the task. Some countries and local governments also started experiments
with various voucher schemes, allowing citizens to choose between alternative providers
of a specific public service, thus empowering citizens to “vote with their feet” if they
were unhappy with the performance of a particular provider. In cases where outsourc-
ing or vouchers were thought to be impractical, governments often sought to introduce
some form of “yardstick competition” as an integral part of performance measurement
by requiring or encouraging individual public sector organizations to benchmark their
performance against that of comparable units.
15
3.2. Experience with and critique of New Public Management
The brief description above is a stylized account of NPM as it was supposed to work. In
practice different countries emphazised different aspects of NPM in their specific reform
efforts, and not all reforming countries have been equally zealous in adhering to the
principles laid out above. In general, NPM was adopted most broadly and vigorously
in the Anglo-Saxon countries, often with New Zealand and Australia as front-runners,
whereas the continental European countries have been more hesitant and selective in
drawing from the NPM toolbox (see Pollitt et al. (2007)).
Over the years the attempts to introduce elements of NPM have created heated con-
troversies within the communities of scholars, civil servants, politicians and the general
public. Sometimes the debate has degenerated into cultural and ideological warfare.9
Yet, although views on the merits or demerits of NPM still differ quite a lot, there is a
growing acknowledgment that many of the NPM-inspired reforms have not in practice
lived up to the orginal hopes and expectations. In the OECD, long inclined to advo-
cate NPM, two officials wrote in 2003 that it had become evident that the public sector
reforms of the two previous decades had generated some unforeseen negative and even
perverse results (Matheson and Kwon (2003, p. 10)).10
In the eyes of some observers, this experiencee mainly reflected that the reforms often
failed to implement NPM principles in the way originally conceived. For example, Behn
(2002, p. 7) writes: ‘If you ask public managers if they are using the various techniques
of performance management, they will, of course, answer “yes”. But if you examine
what they are really doing, you will discover that they are not truly employing the
principles in a manner that is apt to produce real improvements in outcomes and value.
Performance management has not swept the world; it lives more in rhetoric than reality.’
In particular, it seems that politicians and top executives failed to honour their “big
bargain” promise of giving the decentralized executive bodies more flexibility to solve
their tasks in return for more accountability for the final outcomes. Several observers in
countries like the United States and United Kingdom noted that process controls over
decentralized agencies were in many cases retained and augmented and that increased
formality and regulation were imposed on them during the period when NPM reforms
were carried out (Hood and Peters, 2004, p. 271). In short, it seems that the increased
efforts to measure performance often resulted in more paperwork and bureaucracy.
9Reflecting such an atmosphere, the title of the article by Lapsley (2009) reads: ‘New Public Man-
agement: The Cruellest Invention of the Human Spirit?’ However, the discussion by the author himself
is quite balanced.10In Denmark, a group of former civil servants from the Ministry of Finance created quite a stir in 2007
when they published a newspaper article denouncing their earlier promotion of performance contracts
and performance management. Their feature article carried the headline: ‘Please forgive us - We didn’t
know what we were doing.’ One is reminded of the quote from Søren Kierkegaard at the beginning of
this essay.
16
Many other observers (e.g., Savoie, 1995) have argued that NPM reforms were doomed
to fail from the outset because they were based on much too narrow views of how the
public sector works (and should work) and how its employees are motivated. Below I
briefly mention some of the most frequent points of criticism against NPM.
Fragmentation: The splitting up of large public sector hierarchies into many smaller
and more autonomous units with specialized tasks has been criticized for creating coordi-
nation problems within the public sector and for making it more difficult for the central
government to steer the public sector in a desired direction in response to new societal
needs. This critique, which will not be elaborated further in this paper, has led to the
so-called Whole-of-Government Approach to public sector reform which stresses the need
for greater horizontal and vertical collaboration and coordination between the different
parts of the public sector (see, e.g., Christensen and Lægreid, 2007).
Naive belief in the scope for performance measurement: Critics of NPM often stress
that the goals of many important public sector organizations are multidimensional and
that the fulfilment of many of them (e.g., the goal of nurturing the social skills of school
children) is hard to measure in quantitative terms. Thus a balanced performance mea-
surement must often rely on qualitative judgements, so performance auditing and bench-
marking based on quantitative indicators that are more easily measured runs the risk of
distorting the incentives of public sector organizations, inducing them to put too much
emphasis on the measured activities.
Increased bureaucracy and poorer working conditions as a result of outsourcing: Some
critics point out that the alleged efficiency gains from outsourcing of public services are
dubious, in part because private providers usually have a higher cost of capital than the
government, and partly because of the transactions costs involved in organizing compet-
itive public tenders, writing contracts with providers, and monitoring their performance.
As a corollary, it is argued that the apparent cost savings from outsourcing often arise
from a deterioration of the wages and working conditions of employees following the
transition from public to private sector employment.
Clash with professional and civil service norms: This is perhaps the most fundamen-
tal criticism against NPM. The argument here is that economic incentives such as pay
for performance and various forms of competition in the public sector tend to promote
materialistic and self-interested behaviour at the expense of altruistic and public-service
minded behaviour. This is the problem of extrinsic motivation potentially crowding out
intrinsic motivation (see, e.g., Frey (1997)). There is a link here to the problem of perfor-
mance measurement: if the incentive schemes only reward those activities and outcomes
that are measurable, the result may be disillusionment among those employees who per-
form other important tasks which cannot be measured.
Because of these perceived shortcomings, the NPM paradigm has been proclaimed to
be “dead” (Dunleavy et al. (2005)). However, even though OECD governments have
17
begun to stress other objectives in recent public sector reforms,11 many elements of NPM
have remained in place in one way or the other, and components from the NPM toolbox
continue to pop up in new reform proposals here and there. For these reasons, I will now
discuss in more detail what we know and do not know about the usefulness of some of the
most prominent features of NPM: pay for performance, performance measurement, and
the introduction of competition in the public sector through vouchers and outsourcing.
Following that, I will offer some reflections on the drivers behind excessive bureaucracy.12
4. Pay for performance: does it work in the public sector?
4.1. An early experiment in New Public Management
Critics of NPM argue that incentive schemes like pay for performance will not work
in the public sector, either because the most important aspects of performance cannot
be measured properly, or because public employees will not react to material incentives
in the way expected. A mainstream economist would say that, if you pay a person to
do more of some activity, you can normally expect that person to actually carry out
more of that activity. Probably our economist would also say that, even though some of
the outputs produced by public sector employees are hard to measure, other important
outputs can in fact be measured, so that would leave at least some scope for the use of
performance-related pay in the public sector.
An interesting historical example provides some encouragement for our mainstream
economist.13 The English civil servant Edwin Chadwick (1800-1890) once suggested an
improvement of the regulation of the transportation of British convicts to Australia.
Originally the captains of the vessels commissioned for the transport were paid a flat fee
per prisoner taken on board in the port of departure. At Chadwick’s suggestion, the pay
scheme was changed so that the captains were instead paid per prisoner who disembarked
alive in Australia. Following this, the survival rate among the criminals increased from
40 percent to 98.5 percent! So at least this early experiment in New Public Management
must be deemed a success.
Yet in section 2.2 we noted that pay for performance is not very frequently used in the
public sector, at least not below the management level. The question is whether there are
good reasons for this from the perspective of economic science? I will start by discussing
what basic principal-agent theory - which assumes that people are self-interested - can
11See Greve (2013) for a review of some important recent ideas and trends in public sector reforms.12To limit the scope of the paper I will not discuss the experience with privatization of state-owned
enterprises. Megginson and Netter (2001) review the empirical evidence on this issue.13The example is given by Sandmo (2014) who in turn draws on the account of Ekelund and Hébert
(1997).
18
teach us about this issue. I will then discuss how the answer might change once we allow
for pro-social behavour of one kind or another.
4.2. The scope for pay for performance: what can we learn from principal-
agent theory?
The idea that you cannot rely on trust alone when organizing public affairs is not an
invention of economists. For example, in 1887 the later U.S. president Woodrow Wilson
wrote: ‘All sovereigns are suspicious of their servants, and the sovereign people is no
exception to the rule’ (Wilson, 1887, p. 20). And Vladimir Lenin is famously supposed
to have said: ‘Trust is good, but control is better.’
Principal-agent theory analyzes the optimal design of incentive schemes for an “agent”
such as a worker when a “principal” such as a manager wants the agent to carry out some
task that he does not necessarily want to do, and when the principal cannot fully observe
and control the agent’s behaviour. We can use insights from this theory to evaluate the
scope for pay for performance in the public sector.14
The basic principal-agent model with moral hazard
Consider first a situation with one principal (say, a public manager) and one agent
(say, a representative public service worker). The agent exerts effort which results in a
stochastic outcome given by
= + (1)
where is a random variable with zero mean and constant variance. This variable reflects
that the outcome in which the principal is interested (say, howmuch school children learn)
is subject to some influences beyond the control of the agent (e.g., the socioeconomic
bacground of the pupils). The agent gets utility from his net payoff −, where is the
agent’s income, and is his cost of effort given by
=2
2 0 constant. (2)
According to (2) the agent’s marginal cost of effort is , so the parameter measures
the steepness of the rise in marginal cost as effort increases.
The principal can observe the outcome of the agent’s effort and make his pay depend
on it. For reasons of simplicity and transparency, the principal is constrained to use
a linear pay scheme. Thus the agent is paid according to the following linear reward
14The exposition in the rest of this subsection is heavily inspired by Dixit (2002) but the results
presented in eqs. (9) and (13) below are new, and my formulas (16) and (19) extend the related formulas
in Dixit’s paper by allowing for risk aversion on the part of the principal. Both Dixit and I draw on the
more fundamental contributions by Holmström (1979, 1982) and Holmström and Milgrom (1991).
19
schedule, where and are parameters chosen by the principal:
= + (3)
As shown in appendix A, an agent maximizing his expected utility will exert effort up to
the point where
=
(4)
Not surprisingly, we see that the principal can call forth more effort from the agent by
offering a higher marginal reward () for additional output.15
The principal’s realized utility depends on his net payoff −. The principal chooses
and so as to maximize his expected utility, subject to the constraint that he must
offer the agent an expected utility level at least as high as the expected utility the agent
could attain in the best available alternative employment opportunity. Suppose now that
the random variable in (1) follows a normal distribution with variance 2 and that
the principal and the agent both have constant absolute risk aversion. The principal’s
coefficient of risk aversion is ( 0), while the agent has a coefficient of risk aversion
( 0). In these circumstances, appendix A shows that the value of the pay parameter
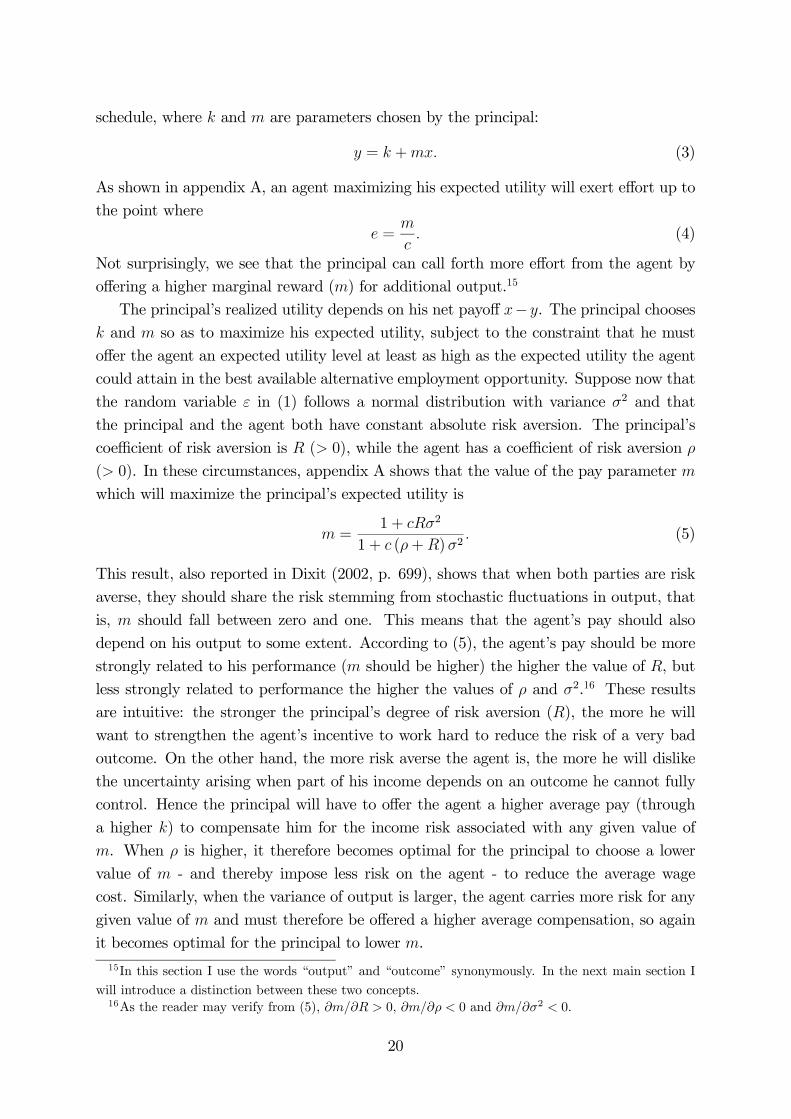
which will maximize the principal’s expected utility is
=1 + 2
1 + (+)2 (5)
This result, also reported in Dixit (2002, p. 699), shows that when both parties are risk
averse, they should share the risk stemming from stochastic fluctuations in output, that
is, should fall between zero and one. This means that the agent’s pay should also
depend on his output to some extent. According to (5), the agent’s pay should be more
strongly related to his performance ( should be higher) the higher the value of , but
less strongly related to performance the higher the values of and 2.16 These results
are intuitive: the stronger the principal’s degree of risk aversion (), the more he will
want to strengthen the agent’s incentive to work hard to reduce the risk of a very bad
outcome. On the other hand, the more risk averse the agent is, the more he will dislike
the uncertainty arising when part of his income depends on an outcome he cannot fully
control. Hence the principal will have to offer the agent a higher average pay (through
a higher ) to compensate him for the income risk associated with any given value of
. When is higher, it therefore becomes optimal for the principal to choose a lower
value of - and thereby impose less risk on the agent - to reduce the average wage
cost. Similarly, when the variance of output is larger, the agent carries more risk for any
given value of and must therefore be offered a higher average compensation, so again
it becomes optimal for the principal to lower .
15In this section I use the words “output” and “outcome” synonymously. In the next main section I
will introduce a distinction between these two concepts.16As the reader may verify from (5), 0, 0 and 2 0.
20
This simple model suggests two reasons why it may be optimal to rely less on pay
for performance in the public than in the private sector. As mentioned in section 3.2,
there is some evidence that public sector workers are on average more risk averse than
workers in the private sector. If is indeed relatively high in the public sector, eq. (5)
implies that public sector wages should be less dependent on observed outputs. Second,
it has been argued that many services in the public education and health care sectors are
quite complex and that the final outcomes to which these sectors contribute (learning,
social skills, health conditions, etc.) depend on a lot of factors beyond the control of the
individual service worker. In the context of our model, this would mean that the variance
2 is relatively high in the public sector. As we have seen, this also calls for a relatively
low value of , ceteris paribus.
On the other hand, eq. (5) also suggests one reason why the public sector might
actually want to relymore on performance-related pay. Specifically, the owners of private
firms often have opportunities to diversify their risks. Hence principals in the private
sector (owners and their appointed managers) may not worry so much as public principals
about the risk associated with the activities of invididual production units. Indeed, since
many of the services produced by public sector organizations are quite important for the
welfare of citizens, and given the tendency of the media and the general public to focus
on examples of bad performance in public agencies, the degree of risk aversion of public
sector principals may well be relatively high. As Robert Behn has claimed: ‘Indeed,
in government, it does not matter if you get it right 99 percent of the time because
the focus will be on the one percent of the time you get it wrong. That is why The
Ten Commandments of Government are: Thou shalt not make a mistake. Thou shalt
not make a mistake....Thou shalt not make a mistake’ (Behn, 1998, p. 149). If public
principals are in fact relatively risk averse, implying a high value of , it follows from
(5) that they should give their employees strong incentives to work hard (through a high
value of ) to reduce the risk of very bad outcomes.
In summary, it is not quite clear from this basic principal-agent model with moral
hazard - where agents have an incentive to shirk unless they are sufficiently rewarded for
not doing so - that public sector organizations should rely less on performance-related
pay than private firms. We will now consider some situations where the case for using
low-powered incentives in the public sector becomes more clear-cut.
Multiple agents
Let us abstract for a moment from stochastic influences on output, and let us assume
that there are two agents, 1 and 2, whose efforts 1 and 2 contribute equally to total
service output:
= 1 + 2 (6)
Total output is still fully observable, but each agent’s contribution to it can only be
21
measured with a stochastic, symmetric normally distributed error, , with zero mean and
constant variance 2. Hence the measured outputs of the two agents (indicated by hat
superscripts) are b1 = 1 + b2 = 2 − (7)
The individual agent is paid according to his measured performance, so the income of
agent () is
= +b = 1 2 (8)
Agent obtains utility from his payoff − . For both agents the cost of effort () is
given by (2), so they will both choose the level of effort reported in (4). Both of them
also have the same degree of constant absolute risk aversion, , and they must be offered
a minimum level of expected utility equal to their best outside option (assumed to be the
same for both agents).
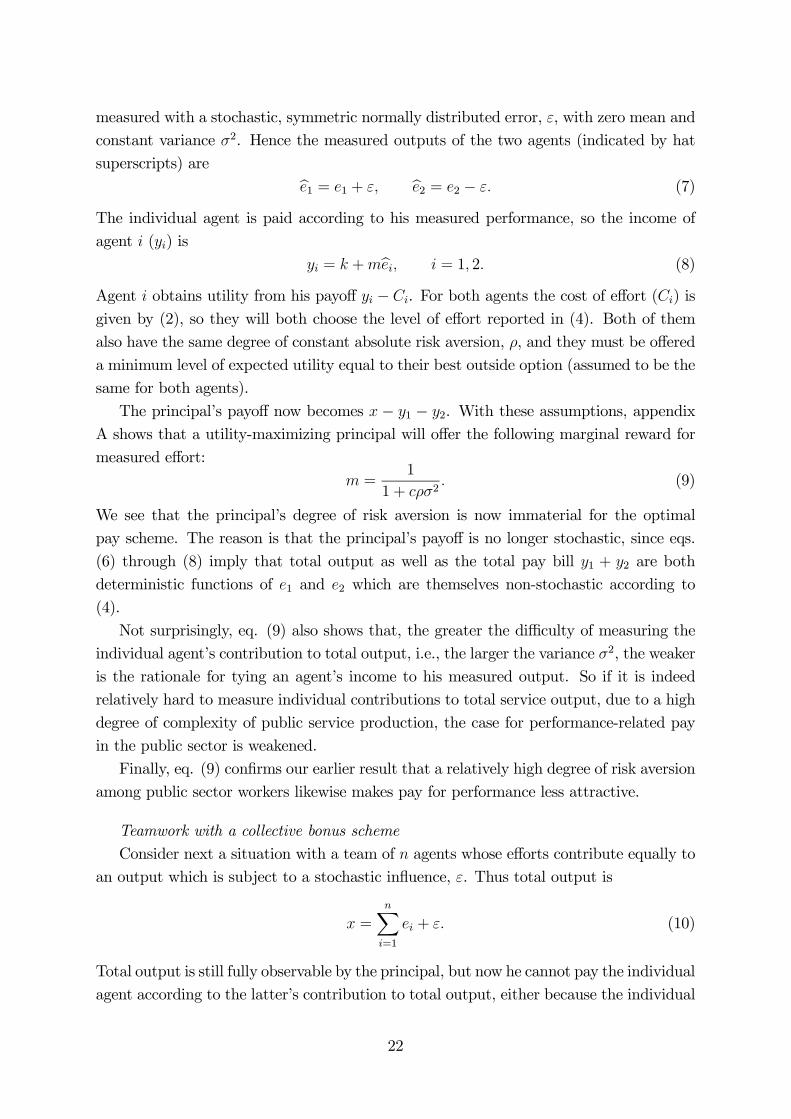
The principal’s payoff now becomes − 1 − 2. With these assumptions, appendix
A shows that a utility-maximizing principal will offer the following marginal reward for
measured effort:
=1
1 + 2 (9)
We see that the principal’s degree of risk aversion is now immaterial for the optimal
pay scheme. The reason is that the principal’s payoff is no longer stochastic, since eqs.
(6) through (8) imply that total output as well as the total pay bill 1 + 2 are both
deterministic functions of 1 and 2 which are themselves non-stochastic according to
(4).
Not surprisingly, eq. (9) also shows that, the greater the difficulty of measuring the
individual agent’s contribution to total output, i.e., the larger the variance 2, the weaker
is the rationale for tying an agent’s income to his measured output. So if it is indeed
relatively hard to measure individual contributions to total service output, due to a high
degree of complexity of public service production, the case for performance-related pay
in the public sector is weakened.
Finally, eq. (9) confirms our earlier result that a relatively high degree of risk aversion
among public sector workers likewise makes pay for performance less attractive.
Teamwork with a collective bonus scheme
Consider next a situation with a team of agents whose efforts contribute equally to
an output which is subject to a stochastic influence, . Thus total output is
=
X=1
+ (10)
Total output is still fully observable by the principal, but now he cannot pay the individual
agent according to the latter’s contribution to total output, either because the individual
22
contribution is unobservable, or because an egalitarian norm dictates that all agents be
paid the same wage.17 Instead, the principal pays each agent a wage consisting of a fixed
component plus a bonus which is proportional to the average output per team member
():
= = +
(11)
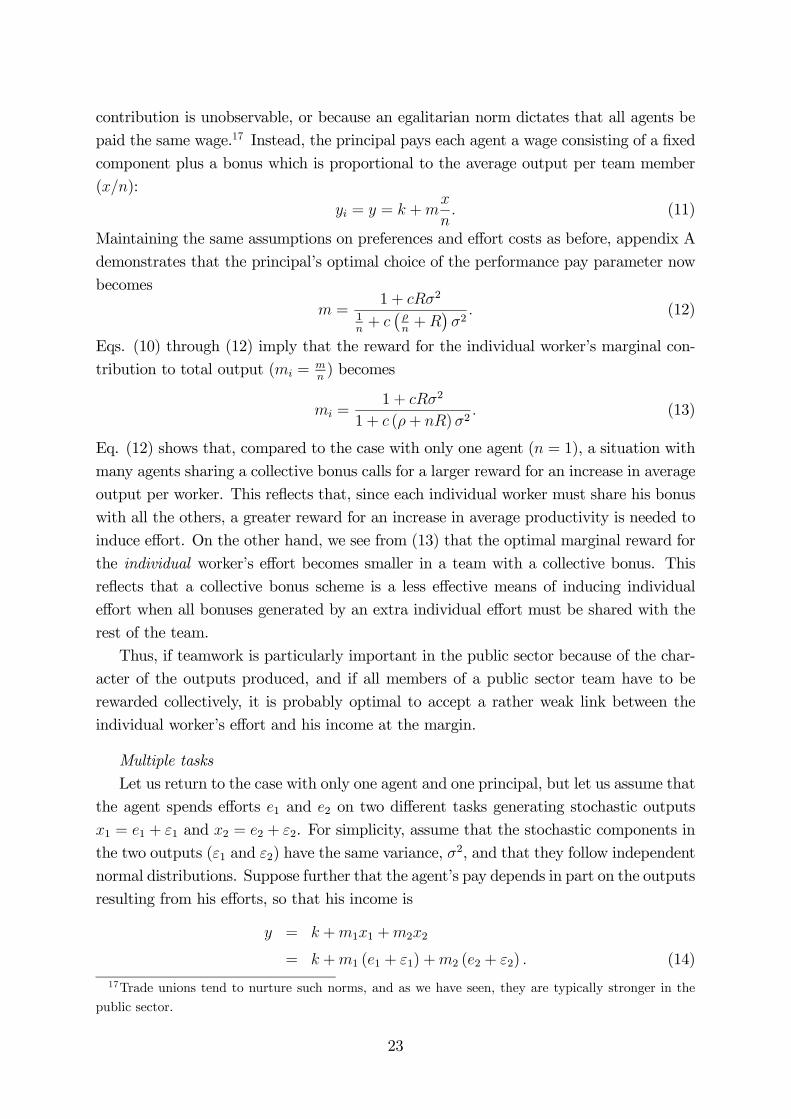
Maintaining the same assumptions on preferences and effort costs as before, appendix A
demonstrates that the principal’s optimal choice of the performance pay parameter now
becomes
=1 + 2
1+
¡
+
¢2
(12)
Eqs. (10) through (12) imply that the reward for the individual worker’s marginal con-
tribution to total output ( =) becomes
=1 + 2
1 + (+ )2 (13)
Eq. (12) shows that, compared to the case with only one agent ( = 1), a situation with
many agents sharing a collective bonus calls for a larger reward for an increase in average
output per worker. This reflects that, since each individual worker must share his bonus
with all the others, a greater reward for an increase in average productivity is needed to
induce effort. On the other hand, we see from (13) that the optimal marginal reward for
the individual worker’s effort becomes smaller in a team with a collective bonus. This
reflects that a collective bonus scheme is a less effective means of inducing individual
effort when all bonuses generated by an extra individual effort must be shared with the
rest of the team.
Thus, if teamwork is particularly important in the public sector because of the char-
acter of the outputs produced, and if all members of a public sector team have to be
rewarded collectively, it is probably optimal to accept a rather weak link between the
individual worker’s effort and his income at the margin.
Multiple tasks
Let us return to the case with only one agent and one principal, but let us assume that
the agent spends efforts 1 and 2 on two different tasks generating stochastic outputs
1 = 1 + 1 and 2 = 2 + 2. For simplicity, assume that the stochastic components in
the two outputs (1 and 2) have the same variance, 2, and that they follow independent
normal distributions. Suppose further that the agent’s pay depends in part on the outputs
resulting from his efforts, so that his income is
= +11 +22
= +1 (1 + 1) +2 (2 + 2) (14)
17Trade unions tend to nurture such norms, and as we have seen, they are typically stronger in the
public sector.
23
Following Dixit (2002, p. 705), let the agent’s total cost of effort be
= (21 + 22 + 212)
2 (15)
This specification implies that if 0, the marginal cost of effort in one task increases
with the amount of effort spent on the other task. In this case the tasks are said to be
substitutes: spending more time and effort on one task reduces the possibility of doing a
good job in the other task. Conversely, if 0, the two tasks are said to be complements,
since the marginal cost of effort in one task will then decline as the agent spends more
effort on the other task. In that case it becomes easier to do a good job in the second
task if you put more effort into the first task, and vice versa.
The principal values both outputs equally, so his net payoff is now 1 + 2 − .
Maintaining the other assumptions from the basic principal-agent model, it follows from
the analysis in appendix A that the principal will choose
1 = 2 = =1 + (1 + )2
1 + (1 + ) (+)2 (16)
Since workers are subject to a time constraint, the case where 0 is probably the
more frequent one: if the agent spends more time on one task, he has less total time
available, so his marginal disutility from spending additional time on the other task goes
up. Eq. (16) then implies that pay should be less dependent on output when agents
carry out multiple tasks than when they perform only a single task.18 The reason is that,
if the agent is induced to perform more of one task, his marginal effort cost of solving
the other task will increase (when 0), and hence he will want to spend less effort on
that task. Therefore the principal will be cautious not to reward a particular task too
generously for fear that this may divert too much effort away from the other task. Since
this concern applies to both tasks, the end result is that the marginal rewards for both
tasks get muted.
Several writers, including Dixit (2002, p. 697), have stressed that multitasking may be
more prevalent in the public than in the private sector because of the many different goals
public agencies are expected to pursue. If this is correct, and if the case of substitutability
between tasks ( 0) is in fact the more common one, the analysis here does suggest
that there is less scope for the use of high-powered incentives in the public sector.
Multiple principals and tasks
As mentioned in section 3.1, public sector organizations typically have many stake-
holders whose interests must all be taken into account. The fact that public sector agents
often have several tasks may thus reflect that they have several principals. Consider there-
fore a scenario where one agent carries out two tasks for two different principals, and .
18This follows from the fact that (16) implies = −2[1+(1+)(+)2]2
0
24
The two stochastic outputs 1 and 2 produced by the agent are still given as 1 = 1+1
and 2 = 2 + 2 (with the same assumptions on 1 and 2 as before), but now his total
income consists of the sum of the incomes and received from the two principals.
Both principals pay the agent according to a linear pay schedule, but the coefficients in
the reward schemes differ because the principals have different preferences for the two
outputs. Hence we have
= +1 1 +
2 2 (17)
= +1 1 +
2 2 (18)
The payoffs for principals and are 1− and 2−, respectively, so gets utilityfrom 1, whereas gets satisfaction from 2. The two principals do not coordinate, so
chooses his pay parameters , 1 and
2 so as to maximize his expected utility, taking
the parameters , 1 and
2 chosen by as given, and vice versa. For simplicity,
we now assume that the two tasks performed by the agent are neither substitutes nor
complements, i.e., the parameter in (15) is zero. We also assume that the two principals
have the same degree of risk aversion.
With these assumptions, appendix A shows that the agent’s total marginal reward
for additional output in each of the two tasks will be the same and equal to
=1 + 2
1 + (+) 2 + 2 (19)
Comparing (19) to (5), we note that the marginal reward for output is muted when
there is more than one principal. As shown in appendix A, this is because each principal
chooses a negative -coefficient on the output that does not generate utility for him, to
induce the agent to shift effort into the other task which generates valuable output for
that particular principal. In this way the principals get in the way of each other.
Summing up the lessons from basic principal-agent theory
In summary, basic principal-agent theory suggests a number of reasons why public
sector employers may want to rely less on performance-related pay than private employ-
ers. These reasons include a relatively high degree of risk-aversion among public sector
employees; external influences on public service output beyond the control of the individ-
ual service worker; the difficulty of measuring individual contributions to the output of a
team of public service workers; a possible preference for the use of collective rather than
individual bonus schemes; the need for public sector workers to perform several different
tasks, and the existence of multiple stakeholders who disagree on which tasks should be
given priority.
At the same time the models described above also suggest that pay should be related
to performance to some extent even in the public sector: none of the models implied
that should be zero. Moreover, the basic principal-agent model also suggested that
25
if service output is stochastic and if public sector principals are more risk averse than
principals in the private sector - which may well be the case - this will call for a stronger
relation between pay and performance in the public sector, ceteris paribus.
However, below we shall discuss some additional factors which may further limit the
scope for the use of material incentives for public sector workers.
4.3. Intrinsic versus extrinsic motivation
Principal-agent theory assumes that agents will not exert any effort unless they receive a
material reward for it.19 But as already noted, many people - including many who work
for the government - have an intrinsic motivation to carry out a task, e.g. because of a
sense of duty, or because doing the job is simply good fun for them. For a long time many
social psychologists and other scholars outside the economics profession have argued that
the introduction of extrinsic incentives such as pay for performance may crowd out the
intrinsic motivation that fosters pro-social behaviour.
The following example, likely to be familar to many parents, illustrates the point:
you feel that your son ought to do the family the service of mowing the lawn regularly.
He is far from enthusiastic about it, but if you appeal to his sense of duty, he will do it.
But some day when he is reluctant, you decide to offer him money to get the work done.
After that day you may find that he will never mow the lawn again without getting paid
for it. By offering him money, you signalled that it is not really his inherent duty to mow
the lawn after all. In this way you destroyed his intrinsic motivation.
Over the years psychologists, experimental economists, and other social scientists have
accumulated a lot of evidence that extrinsic incentives may crowd out intrinsic motivation
(see the surveys by Frey and Jegen (2001) and Gneezy et al. (2011)). Economists such
as Frey (1997), Kreps (1997), Bénabou and Tirole (2003), Besley and Ghatak (2003,
2005) along with many others have argued that this evidence should be taken seriously
by mainstream economics, and many economists have followed their lead in recent years.
The literature has emphasized several psychological mechanisms which may explain
why extrinsic incentives can harm intrinsic motivation. For example, if an external in-
tervention such as the introduction of performance-related pay is seen by agents as an
attempt to control their behaviour, their inner motivation may suffer because they resent
being ‘manipulated’. Alternatively, agents may conclude that their previous willingness
to put in extra effort without being directly rewarded is not really needed, because the
new external control mechanism (reward scheme) will ensure that what needs to be done
will actually get done. A related possibility is that agents get ‘offended’ because they in-
terpret the incentive scheme as a signal of mistrust that does not recognize their previous
19See eq. (4) which implies that = 0 if = 0.
26
efforts. It may also be that agents lose self-esteem (and thereby motivation) if they see
the incentive scheme as a lack of willingness to acknowledge their intrinsic motivation.
It is actually quite easy to allow for such psychological mechanisms in a principal-agent
framework. Suppose an agent has the utility function ( − ), where is his income
given by our familiar performance-related pay scheme = + = + (+ ), and
is his cost of effort. Suppose further that the psychological cost of exerting effort is
influenced by the presence of the incentive scheme so that the cost of effort is given by
the function
= () () 0 () 0 (20)
where () and () are the first and second derivatives with respect to effort.
Thus we make the standard assumptions that the marginal cost of effort is positive
and increasing in effort. If the utility function ( − ) displays constant absolute risk
aversion, one can show that an agent who maximizes his expected utility will exert effort
to the point where the marginal cost of effort equals the expected marginal reward for
effort ():
() = (21)
From (21) it follows that
=1−
(22)
where the cross-derivative ≡ 2measures the impact of a more high-powered
incentive scheme on the marginal cost of effort. The term 1 in (22) captures the usual
positive incentive effect stressed by standard economic theory. But if extrinsic incentives
tend to crowd out intrinsic motivation, we have 0. The term− in (22) will
then be negative, and the sign of will be indeterminate, reflecting that stronger
material incentives may not work as intended. If the motivation-crowding effect ()
is strong enough, the incentive scheme will backfire ( 0), and it will certainly
dampen any positive net effect on effort.
Many economists, including Pendergast (2011, p. 133), doubt that such perverse
effects can occur except in special contexts such as charities. These skeptics often point
to Ed Lazear’s study of the productivity effects of performance pay on productivity. Using
data from a large autoglass company that changed its compensation structures between
1994 and 1995, he found that the introduction of performance pay raised the firm’s
productivity by anywhere from about 20 to 36 percent (Lazear, 1996). However, Frey
and Jegen (2001, pp. 595-596) argue that mounting glass windshields in cars is a simple
task environment where one would not expect motivation crowding to occur. Rather, the
evidence suggests that such crowding out is more likely to occur when ‘interesting’ tasks
are involved, and in environments where personal relationships involving reciprocity, ‘gift
exchange’ and altruistic behaviour play a role.
27
Still, several other empirical studies of performance pay and our example with the
transportation of British criminals to Australia suggest that in many contexts, monetary
incentive schemes do work as intended: if you pay people to do things, they will do more
of it. The evidence surveyed by Frey and Jegen (2001) and Gneezy et al. (2011) also
includes cases where extrinsic incentive schemes seem to have had a positive crowding-in
effect on intrinsic motivation (i.e., cases where 0 in our notation). This may
occur if the extrinsic incentive is seen by agents as supporting the norms underlying their
intrinsic motivation. An example may illustrate how positive motivation crowding could
occur: Suppose a university department decides to use part of the funds available for pay
rises to grant bonuses to staff members for their publications in top journals. If the other
staff members feel pride on behalf of the department when some of their colleagues get
exposure through prestigious publications, such a bonus scheme may well strengthen the
individual staff member’s inner motivation to do high-quality research.
The point is that motivation crowding effects are context-specific. In many cases a
negative effect of extrinsic on intrinsic motivation may not occur at all; in some cases the
effect may even be positive, but in other cases an unintended crowding-out effect will pop
up. Hence performance pay is an instrument that should be used with care; successful use
may require considerable psychological insight on the part of managers. This conclusion
holds for the private as well as the public sector, but it may be particularly relevant
in the latter. As mentioned in section 2.2, there is some evidence in favour of Tim
Besley’s and Maitreesh Ghatak’s hypothesis that people with a particular preference for
the missions of public sector organizations select into public sector employment (Besley
and Ghatak (2003)). If public sector workers derive much of their motivation from the
pro-social missions that often characterize public organizations, there may be many cases
where high-powered monetary incentives could have a negative crowding effect on intrinsic
motivation in the public sector.
5. Performance measurement and yardstick competition
If government employers wish to base (part of) the pay of public managers and workers
on their performance, they will obviously need to measure it. Even if pay is not based on
performance, there may be other reasons why performance measurement may be useful.
This section reviews the purposes and pitfalls of performance measurement. It also
discusses how the performances of comparable government agencies may be benchmarked
against each other and how that might help to improve average performance.
28
5.1. The rationale for performance management
Throughout the OECD area, governments try to measure the performance of their agen-
cies, although practices and ambitions in this respect differ widely. A Policy Brief from
the OECD (2004) explains how information on performance can help governments man-
age and control public services, enable parliaments to check whether taxpayers are getting
value for money from public agencies, and help citizens to keep governments and their
agencies accountable for their actions.
Ideally, one would like to measure performance by the final outcomes of government
activities. Does the police force offer effective protection against crime? Does the health
care system ensure that citizens are in good health? Does the education system provide
students with skills that will make them productive workers and responsible citizens? Do
public job centres actually manage to get the unemployed back into jobs? etc. However,
many aspects of such outcomes are hard to measure in quantitative terms, and they also
depend in large part on circumstances beyond the control of individual public agencies.
Hence the auditors of government agencies often resort to measuring their outputs: How
many arrests did the police make, and how many criminal cases did they manage to
solve? How many hospital treatments of different kinds did public hospitals carry out?
How many classroom hours did teachers produce? But the trouble with many data on
public sector output is that they do not necessarily tell much about the quality of the
services delivered. And even worse: data on many important outputs of government
agencies are scarce, so quite often auditors have to rely on statistics on inputs into public
production that are believed to be positively correlated with outputs and outcomes, e.g.:
What are the numbers of teachers per student at different levels of education and across
different educational institutions? What is the average number of nursery assistants per
child in public kindergartens? What is the ratio of doctors and nurses to the number of
citizens in need of treatment? etc.
If we are interested in measuring the welfare of citizens, we should obviously focus on
data on outcomes, in so far as they are available. If we want to measure the contribution
of public agencies to citizen welfare, it may be more relevant to focus on their outputs,
but then we should try as much as possible to adjust for changes in service quality.
Focusing on the evolution of inputs into public service production seems a third-best
option to which we may have to resort in case of missing data on outcomes and outputs.
In any case, when measuring the performance (effectiveness) of public sector agencies,
we should consider the ratios of their outcomes, outputs and/or quantitative inputs to
their expenditures to evaluate their ability to create value for money. And for a fair
judgement of performance, we should acknowledge that the environments of individual
public agencies may differ a lot, so any two public sector units delivering the same kind
of service may not be able to generate the same outcome or output per euro expended,
even if they are equally competent and dedicated to their task. In the next subsection I
29
will discuss how this problem of performance measurement may be addressed.
The relevant level of aggregation and detail of performance measures depends on who
is going to use them. The measures that the central government needs in order to evalu-
ate the performance of local governments will probably differ from the measures that the
individual public manager will find useful in the management of his organization. Behn
(2003) discusses how public managers may use performance measurement to improve their
management practices. He stresses that the ultimate motive for measuring performance
must be to find ways to improve it. For this purpose the manager must develop perfor-
mance measures that will help him to evaluate how well his agency is currently doing,
ensure that his subordinates are doing the right things, direct the agency’s allotted funds
towards the most effective programs and projects, motivate line staff, middle-managers
and other stakeholders, promote the agency vis á vis political superiors and the general
public, celebrate the agency’s successes, and learn which of the agency’s practices that
work and which that do not. For each of these purposes the manager may need different
performance measures, so Behn (2003, p. 599) warns against “the futile search for the
one best measure”.
5.2. Yardstick competition and benchmarking
In so far as comparable public agencies use similar performance measures, these measures
will help voters and other principals to compare performance across agencies and juris-
dictions. If the local service-producing units in some municipality seem to perform badly
compared to similar units in neighbouring municipalities, local voters may conclude that
local politicians are doing a poor job and may not want to reelect them. Knowing this,
the politicians will be more keen to ensure a good performance of local public sector in-
stitutions. In this way performance measurement may help to create a healthy yardstick
competition across jurisdictions.20
This was the purpose when the UK Department of Health introduced the Social
Services Performance Rating (SSPR) in 2002. The SSPR provided an annual statistical
overview of the performance and rating of a number of social services delivered by the
local councils. According to Revelli (2006, p. 461), who quotes the Social Services
Inspectorate (2002), the objective of the SSPR was ‘to ensure that social care issues are
properly addressed, to promote good practice and to identify councils that are performing
poorly (. . .) The ratings are intended to improve public information about the current
performance of services (. . .) People have a right to know how well their councils
are performing in meeting these responsibilities, whether they are receiving such services
themselves, have a family member receiving such services, or are a council tax payer’.
20It may also create yardstick competition across similar units within each jurisdiction, since it enables
local politicians to compare the performance of individual public managers in each service area.
30
There is a large literature on yardstick competition and several empirical studies sug-
gesting that such competition does in fact take place in many countries (see, e.g., Besley
and Case (1995a, 1995b), Heyndels and Vuchelen (1998), Schaltegger and Kuttel (2002),
Bordignon et al. (2003), Revelli (2006), Revelli and Tovmo (2007)). One might think
that yardstick competition can never harm citizen welfare and will generally improve it.
Unfortunately things are not that simple. As Besley and Smart (2007) have shown, the
effect of yardstick competition on voter welfare is theoretically ambiguous. To illustrate,
suppose there are only two jurisdictions, A and B. If politicians in B are good at creat-
ing value for their taxpayer’s money, yardstick competition will make it harder for bad
politicians in A to remain in office. This should help to improve voter welfare in A. But if
the politicians in B are incompetent or malevolent, resulting in poor public services in B,
voters in jurisdiction A may choose to reelect their own mediocre politicians, since they
do not seem to be so bad compared to those in B. In this situation yardstick competition
actually helps incompetent politicians in both jurisdictions to stay in office.
This ambiguous welfare effect of yardstick competition stems from the voters’ imper-
fect information: they cannot easily figure out if their elected politicians are competent,
because voters do not know the true cost of producing public services. Hence voters look
to other jurisdictions to see how much service other politicians are able to deliver, but
this is an imperfect signal of the relative competence of local politicians because their
colleagues across the border may face a different cost of public service production.
These observations suggest that yardstick competition would work better if voters
had more information on best practices in the various areas of public service production.
If voters knew how much service the best-performing public sector units (in the relevant
area of comparison) would be able to produce per dollar spent if they were placed in the
local jurisdiction, it would be easier to evaluate the skills of local politicians and their
officials.
Such information on best practices can be obtained by combining performance mea-
surement with systematic benchmarking of local jurisdictions against each other.21 But
then one must confront two major challenges head on. The first one is that of sepa-
rating the effect of exogenous influences on service cost and quality from the impact of
factors that politicians and public sector employees can actually control. If performance
benchmarking is to be fair, it must focus on the latter. The second challenge, often
overlooked, is to design indicators of service quality that allow local jurisdictions to put
different weights on different aspects of quality, depending on local circumstances and
preferences. After all, one important motivation for having local governments and grant-
ing them some autonomy is that this helps to tailor public service provision to local needs
and preferences.
21Bogetoft (2012) reviews alternative methods of performance benchmarking and Worthington and
Dollery survey techniques of performance benchmarking of local governments.
31
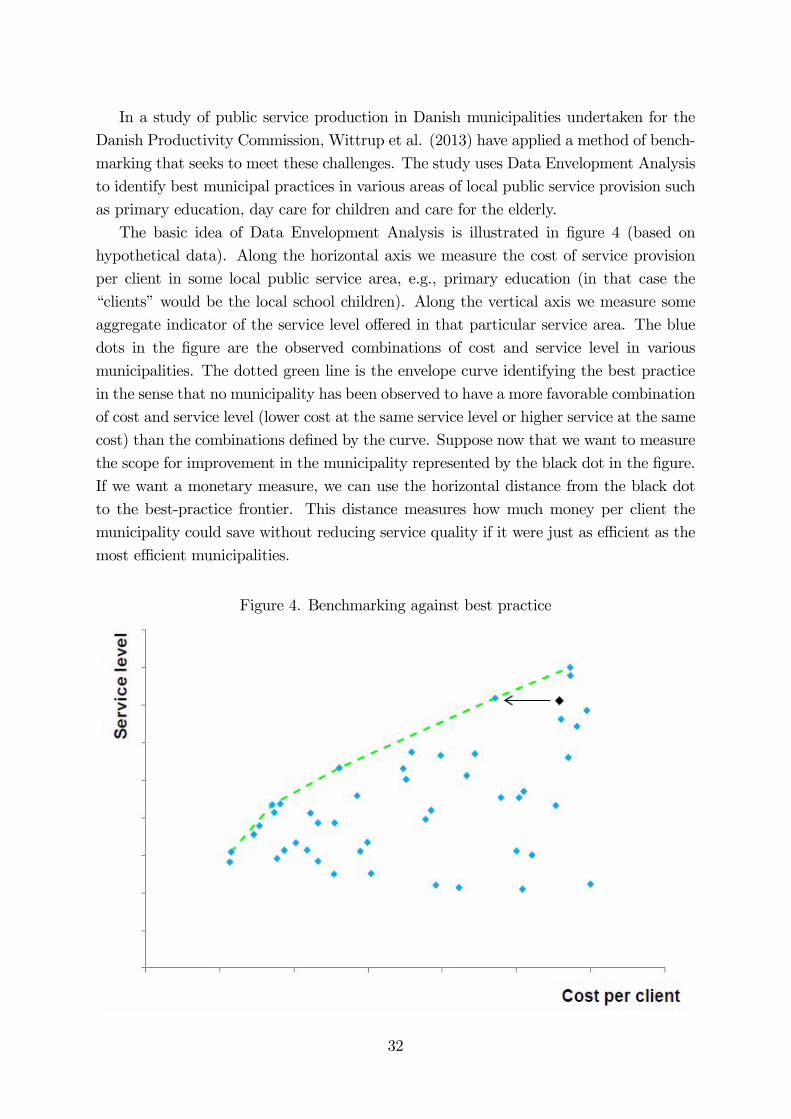
In a study of public service production in Danish municipalities undertaken for the
Danish Productivity Commission, Wittrup et al. (2013) have applied a method of bench-
marking that seeks to meet these challenges. The study uses Data Envelopment Analysis
to identify best municipal practices in various areas of local public service provision such
as primary education, day care for children and care for the elderly.
The basic idea of Data Envelopment Analysis is illustrated in figure 4 (based on
hypothetical data). Along the horizontal axis we measure the cost of service provision
per client in some local public service area, e.g., primary education (in that case the
“clients” would be the local school children). Along the vertical axis we measure some
aggregate indicator of the service level offered in that particular service area. The blue
dots in the figure are the observed combinations of cost and service level in various
municipalities. The dotted green line is the envelope curve identifying the best practice
in the sense that no municipality has been observed to have a more favorable combination
of cost and service level (lower cost at the same service level or higher service at the same
cost) than the combinations defined by the curve. Suppose now that we want to measure
the scope for improvement in the municipality represented by the black dot in the figure.
If we want a monetary measure, we can use the horizontal distance from the black dot
to the best-practice frontier. This distance measures how much money per client the
municipality could save without reducing service quality if it were just as efficient as the
most efficient municipalities.
Figure 4. Benchmarking against best practice
32
But how do we measure the service level and the cost of providing it in a way that
addresses the two basic challenges mentioned above? As for the service level, Wittrup et
al. (2013) opt for the so-called Benefit-of-the-Doubt (BoD) index surveyed by Cherchye
et al. (2006). For any given service area, the authors identify a number of quantitative
indicators which are generally considered to be positively correlated with the quantity or
quality of service delivered. Depending on data availability, these indicators may reflect
outcomes, outputs or inputs. The indicators are weigthed together to obtain an aggregate
index of the service level. Let denote the observed value of indicator in municipality
and let be the weight assigned to this indicator. Suppose further that there is a
total of indicators and municipalities. When calculating the “pure” BoD index of
service performance for municipality , the weights of the various service indicators
are then found by solving the following linear programming problem:
Maximize =
X=1
with respect to , = 1 (23)
subject to the constraints
X=1
≤ 1 for all = 1 , ≥ 0 for all = 1 . (24)
Thus the BoD index for municipality maximizes the weighted sum of its service indi-
cators subject to the constraint that no municipality can attain a weigthed sum greater
than 1 when the same weights are applied to the observed values of its indicators. If
= 1, it means that no other municipality has attained a higher service level, given the
chosen weights. On the other hand, if 1, there is at least one other municipality
that has achieved a higher service level than municipality. But municipality is given
the benefit of the doubt in the sense that, when it is benchmarked against other munic-
ipalities, the auditor in charge of the benchmarking chooses the weight of each service
indicator in a way that will place the relative service performance of municipality in
the most favourable light. Specifically, the auditor assigns greater weights to indicators
where municipality has scored well relative to other municipalities. The justification
for this procedure is that if a jurisdiction has a high score on certain indicators, it is
probably because local voters assign particular importance to those aspects of service
quality. In this way the BoD index respects the rights of individual municipalities to
express their local political preferences through the way in which they structure their
service provision.
Two further attractive properties of the BoD index should be mentioned. First, by
allowing for many different service indicators within a given service area, it acknowledges
that no single indicator is likely to capture all of the aspects of service provision that
citizens value. By incorporating many indicators, it is possible to account for multidi-
mensional goals in each service area. Second, the BoD index is invariant to a proportional
33
rescaling of the indicators. Thus, the units in which the indicators are measured do not
matter for the value of the overall index.
The procedure in (23) and (24) for calculating the weights of the individual service
indicators gives the individual municipality the maximum benefit of the doubt. For
example, the weight attached to an indicator where a municipality has a very low score
could well be zero. However, the central government may have limited tolerance for
variations in the character of services offered by local governments. A desire to limit
the differences in the treatment of citizens across municipalities could be accomodated
by adding the following additional constraints to the maximization problem in (23) and
(24):
≤ ≤ for all = 1 , and all = 1 . (25)
Because of the constraint in (24), will always fall between zero and one. The
constants and in (25) are numbers in the unit interval that further constrain the
permissible variation of the weight of each individual service indicator in the overall BoD
index. The closer and are to each other, the smaller is the scope for variation, so the
higher is the priority given to equal treatment of citizens, and the lower is the degree to
which individual municipalities are given the benefit of the doubt. In their benchmarking
of Danish municipalities, Wittrup et al. (2013) incorporate constraints of the form (25)
where = 12 and = 2. Thus, in a service area with, say, five service indicators
( = 5), the weight of the individual indicator in the BoD index can vary between 10
percent and 40 percent. In the end, choosing the limits and is a political trade-off
that the authority in charge of the benchmarking (or its principal) must make.
The service level offered by a municipality must be held up against the cost of pro-
viding it. To control for exogenous cost drivers, Wittrup et al. (2013) deflate the actual
cost per client by the expected cost. The latter is calculated from a regression analysis
explaining the variation in cost per client across all Danish municipalities by differences
in various demographic, socioeconomic and geographical factors. Thus the cost per client
measured along the horizontal axis in figure 4 is really the actual cost as a ratio of the
cost per client one would expect in each municipality, given its particular demographic,
socioeconomic and geographical structure, and given the average impact of these vari-
ables on the cost of service production. In this way the measure of cost accounts for
differences in production conditions that are difficult for the individual municipality to
control. However, acknowledging that their regression analysis probably does not capture
all relevant exogenous cost drivers, Wittrup et al. (2013) suggest that a benchmarking
exercise should only include a group of municipalities which are not too different from
each other in terms of demographic, socioeconomic and geographical characteristics.
Armed with these measures of service levels and costs, the auditor can now identify
and quantify the potential for efficiency improvements in each municipality. As men-
tioned, the measure of cost recorded along the horizontal axis in figure 4 is , where
34
is actual cost per client and is the expected cost per client. If the measured hor-
izontal distance to the best-practice frontier in figure 4 is, say, for some municipality,
the absolute amount of money per client that the municipality could save by adopting
best practice would then be equal to · .
Benchmarking by means of the BoD index will not only help to expose potentials
for productivity improvements; it should also encourage individual jurisdictions to learn
from each other by giving each of them the benefit of the doubt. If municipality B scores
better than municipality A even when the service level index gives the largest weights to
indicators that are given high priority in A, local politicians and public managers in A
should be more motivated to investigate and possibly import the practices of municipality
B.
5.3. Second thoughts: the performance paradox
The previous subsection described a method of benchmarking that should stimulate learn-
ing and help to make yardstick competition work well. Several other methods of intelli-
gent benchmarking are also available, as described in the handbook of the OECD and the
European Commission (2008).22 As Behn (2002, p. 6) has emphasized, the objective of
performance management in the public sector is to move from process-oriented and rule-
driven management to performance-oriented and results-driven management that will
create greater value for citizens. Yet many writers and critics of the New Public Man-
agement have argued that performance measurement and management may not work as
intended and that performance may actually worsen the more you try to measure it. This
is the so-called performance paradox discussed by van Thiel and Leeuw (2002). Below
I will briefly review some reasons why performance measurement may turn out to be
ineffective or even counterproductive.
Lacking motivation
It is hard to argue against the general proposition that governments ought to be
held accountable for their performance. That is why we have so much performance
measurement - at least on paper. But in reality the politicians who are expected to
demand it and the public employees who are expected to deliver it may not really want
performance to be meticulously measured. The policiticians who are supposed to set
the goals and targets of public agencies may prefer to keep them broad and elusive
rather than stating them very precisely. Goals that are more clear are often also more
controversial and harder for politicians to agree on. Clearer goals are supposed to make it
22Ballanti et al. (2014) note that policy makers have been reluctant to embrace relatively complicated
benchmarking techniques based on Data Envelopment Analysis. They suggest a simpler (but quite
elegant) method for monitoring the performance of local governments that relies on the same data as
those used in fiscal equalization schemes.
35
easier to detect poor performance, but sometimes this may be politically inconvenient if
it puts stronger pressure on politicians to take action against strong interest groups that
extract rents from the public sector. Moreover, because of term limits on public office and
looming elections, politicians tend to have short horizons. Yet it may take several years
or even decades before a public agency can realistically be expected to deliver on specific
targets set up for them, so why should politicians bother to spell out goals and targets in
detail?23 For a politician seeking (re)election, it may be more useful to formulate “grand
visions” with broadly stated goals rather than detailed policy schemes specifying who is
supposed to do what for whom within which time horizon.
All of this is not to say that politicians will never set clearly formulated performance
targets. It is only to say that they may not have strong incentives to do so. A possible
reaction to this problem could be to delegate the choice of more specific performance
targets to the managers and employees of individual public agencies. Such empowerment
of public employees could strengthen their commitment to the goals of their organization
and increase their motivation, thereby improving performance. Working in the other
direction, it may be more difficult to hold individual public sector units accountable for
their performance when goal setting is decentralized. In a recent study which carefully
controls for the influence of other factors, Nielsen (2013) finds that decentralizing goal
setting in the Danish primary education sector has actually tended to weaken perfor-
mance, measured by student grade points in nationally standardized tests. This is not
encouraging for those who hope that decentralization may strengthen performance.
Furthermore, if politicians often prefer vague and ambiguous goals to more precise
ones (even if they pay lip service to performance management), what is the incentive for
public managers and employees to engage in detailed performance measurement? Indeed,
with more precise performance measures, managers and employees may worry that there
is a greater risk that they will be punished in some way if their organization scores poorly
(Behn, 2002, p. 12). Alternatively, public employees can “sabotage” a performance audit
if they consider it an act of distrust (van Thiel and Leeuw, 2002, p. 274). More generally,
public managers and employees may not trust a promise that if they submit to stricter
performance measurement, they will be given more flexibility to meet the performance
targets. As emphasized by Behn (2002, p. 15), even high-ranking government officials
can rarely credibly promise their subordinates that from now on they will be subject
to fewer rules regarding procurement, personnel, budgeting, work processes etc., since
there are many reasons - some rational and some less rational - why such rules have been
23True, president Kennedy’s 1961 speech committing the U.S. to land a man on the moon before the
end of the decade was an example of a specific target with a fairly long horizon. But it also had the
flavour of a “grand vision” capturing the imagination of ordinary people. Most detailed targets and
instructions for public agencies do not have that characteristic if they are meant to be useful. Rather,
they will have a technocratic character appealing only to individuals with a specific interest in the details
of particular types of public service production.
36
introduced (see the discussion in section 7). So front line workers and their immediate
superiors may have good reasons to fear that more specific performance targets will just
add another layer of paperwork on top of an already big pile of reporting requirements.
In sum, despite a general agreement that governments and their agencies should be
held accountable for their actions, there are many reasons why politicians and public
sector employees may not be keen to embrace performance measurement. Obviously this
reduces the likelihood that it will work as intended.
Unintended side effects
Even if performance measurement is adopted without prejudice, it may still fail to
deliver improved performance and may even worsen it. Perhaps the greatest pitfall is
that what doesn’t get measured doesn’t get done. If some activity is used as an indicator
of performance, you are likely to see more of that activity. The problem is that this
may happen at the expense of some other activity which is also important but which is
not included in the performance audit because it cannot be measured, or at least cannot
be measured in quantitative terms. In that case performance measurement distorts the
incentives of public organizations. The net effect on social welfare may still be positive if
the most important outcomes or outputs are easy to measure and the unmeasurable ones
are less important. But this may not always be the case, and then you get unintended
side effects of performance measurement such as suboptimizaton and “tunnel vision”
where public agencies focus too narrowly on optimizing the activities for which they are
credited in performance audits. For example, if school performance is measured only
by the ability of pupils to perform in certain standardized and narrowly defined tests,
teachers may focus excessively on “teaching to the test” at the expense of other learning
activities that society might also want schools to carry out.
A related problem is that rigorous performance measurement, when coupled with
fears that poor performance will be punished, may induce public organizations to engage
in “cream skimming” or “cherry picking”. This is the tendency to concentrate service
efforts on those groups of clients who are most easy to service or treat so that performance
targets are more easily met. This may lead to underprovision of services to individuals
who are difficult to help, e.g., long-term unemployed persons with severe social problems,
the cronically ill, etc.
When combined with a lack of motivation, the typical asymmetry of information
between principals and agents may also make performance measurement ineffective. If
the manager and/or the employees in a public sector unit do not feel that the performance
measures imposed on them from above are really the most relevant ones, they will be
tempted to engage in “gaming”. That is, they will pretend to measure their performance
by the indicators dictated to them, and may even come up with some nice numbers that
the relevant principal is not really in a position to verify, and then they will continue
37
doing business as usual.24
Yet another problem is that, in practice, many attempts to introduce refined perfor-
mance measurement seem to have resulted in more bureaucracy, even though the idea of
the “big bargain” of the New Public Management was to offer more flexibility and less
red tape in return for more rigorous measurement of performance. Van Thiel and Leeuw
(2002) talk of an “audit explosion” which has led to a strong increase in the number of
regulators and auditors in OECD countries, according to the evidence they cite. This
appears to confirm the concerns of those who fear that performance measurement just
adds new layers of bureaucracy on top of existing ones.
The risk of creating more bureaucracy increases if performance measurement leads to
a proliferation of performance goals and indicators over time. Once the idea of measuring
performance on a recurrent basis is accepted, it is not surprising if the relevant principals
come to think of new criteria for good performance which they would also like to measure
in addition to the existing ones. In Denmark, Binderkrantz and Christensen (2009) found
that the number of targets in the performance contracts between central ministries and
their agencies increased by 85 percent between 1995 and 2005. With an ever-growing
number of performance measures, public managers and their principals may end up with
the so-called DRIP syndrome - Data Rich but Information Poor (Behn, 2003, p. 592).
This is a situation where the mass of performance indicators is so big and diversified that
it is difficult to extract useful information from them - one cannot see the forest for the
trees.25
As the number of diverse goals and targets in performance contracts increases, it may
become more difficult to determine whether performance is good or bad - different indi-
cators may point in different directions and it may be unclear which indicators are the
more important ones. In practice, having many goals may be equivalent to having no
goals and may undermine the ability of principals to hold public agencies accountable for
their performance. Perhaps reflecting this, or maybe due to the phenomenon of “gam-
ing” mentioned earlier, Binderkrantz and Christensen (2012) were unable to detect any
systematic relationship between the performance of Danish central government agencies
and the bonuses paid to their managers under performance contracts.
These problems, overwhelming as they may seem, do not imply that performance
measurement should be given up - after all, if public agencies are to be held account-
24Sir Josiah Stamp (1927) gave an early warning against gaming when he wrote: ‘Public agencies are
very keen on amassing statistics - they collect them, add them, raise them to the nth power, take the
cube roots, and prepare wonderful diagrams. But what you must never forget is that every one of those
figures comes in the first instance from the village watchman, who just puts down what he damn pleases.’
Baker (1992) offers a theoretical analysis of the “gaming” problem related to performance measurement.25Perhaps in recognition of the DRIP problem, the central ministries in Denmark have actually started
to cut back on the number of targets in the performance contracts negotiated with their agencies after
2005.
38
able, we must evaluate their performance in some way. While there is no easy way
to escape the pitfalls mentioned above, empirical research by Moynihan and Ingraham
(2003) suggests that performance measurement can be made to work well (in the sense
of helping to improve performance) if it is designed well. Key design elements that seem
to increase the likelihood of success are a strong focus on measuring results for citizens,
including the quality of the service, a strong link between the various components of the
performance measurement system, including information exchange and utilization, and
avoidance of overly complicated performance measures. However, the available evidence
and experience indicates that, like performance-related pay, performance measurement is
an instrument that needs to be used with care.
6. Introducing competition in the public sector
As a supplement to yardstick competition, governments have also tried to improve per-
formance by introducing “genuine” competition in the public sector, most frequently
through various voucher schemes and through outsourcing of public service provision via
competitive public tender. This main section discusses how such instruments work in
theory and practice.
6.1. Vouchers
Vouchers, surveyed by Valkama and Bailey (2001), are found in the private as well as the
public sector. In the public sector, a voucher gives the holder a right to receive a certain
amount of some public service free of charge or at a subsidized price. A voucher need
not take the physical form of a document (a “coupon”); it may just be a legally defined
right to receive the public service if some objective criteria are met. A key feature of
vouchers is that users may choose among alternative certified suppliers of the service.
The suppliers may be public sector units, private firms, or a combination of the two. The
freedom of choice may be a goal in itself, but it also introduces competition. The hope is
that this will improve service quality, strenghthen cost control, and stimulate innovation
and entrepreneurship internally in the public sector as well as externally among private
service providers.
OECD central and local governments have used voucher schemes in many important
areas of public service provision, including some parts of the education and health care
sectors, care for children and the elderly, etc. Voucher schemes encourage public service
providers to compete on quality but not on price, as the price of the service is typically
set at a common level for all providers by the public agency that pays for their services.
Valkama and Bailey (2001, p. 43) point out that voucher schemes are likely to work
most effectively when the following conditions are met: (i) The preferences of public
39
service users differ significantly, and these differences are recognized as legitimate. (ii)
Service users are well-informed about market conditions and have an incentive to shop
energetically to find the best supplier of the service. (iii) There are many competing
service suppliers, or start-up costs are low so that the market is fully contestable even
if there are only a few suppliers. (iv) Service users can easily assess and determine the
quality of the service. (v) The service is relatively inexpensive and purchased frequently,
so users learn by experience. In short, heterogeneous preferences, low transactions costs
and low barriers to entry increase the likelihood that vouchers will improve efficiency.
The more the above conditions fail to be met, the weaker is the case for a voucher
scheme. Indeed, vouchers may sometimes reduce overall productivity in public service
provision, as pointed out by the Danish Productivity Commission (2014a, ch. 5). Vouch-
ers may increase administrative costs, especially if they are means-tested, and they may
make public budgeting and the planning of public production capacity more difficult.
The authorities are usually obliged to ensure that all citizens entitled to a given service
can actually be serviced. Since it may be difficult to predict how many users/clients will
be served by private providers, the authorities may have to keep a larger public produc-
tion capacity in reserve than would be needed if users had no choice between public and
private suppliers. Further, the co-existence of many public and private suppliers may
hamper effective coordination of services and the utilization of economies of scale.
All of these observations relate to the efficiency aspects of voucher schemes. But
concerns about equity have also played an important role in the debate on vouchers. In
the health care sector some countries have introduced opt-out vouchers allowing people
on a waiting list for public medical treatment or nursing to “jump the queue” and choose
a private health care provider who can offer faster treatment. In that case the local
authority will pay the private provider an amount equal to the average cost of the relevant
treatment in the public health care system, and the citizen will then sometimes have to
top up this payment in cases where private health care is more expensive. While such
opt-out vouchers may seem to involve a Pareto improvement, they have been criticized
for violating the basic welfare state principle that all citizens should have equal access to
health care.
Equity concerns have also been prominent in the international debate on education
vouchers. In particular, critics (e.g., Ladd, 2002) have argued that universal education
vouchers will create selection and segregation effects that will hurt disadvantaged stu-
dents. Epple and Romano (1998) present an interesting theoretical analysis that speaks
to this debate. They set up a model in which tuition-free public schools co-exist with
competing, tuition-financed private schools. Public and private schools are assumed to be
equally effective in delivering education when given the same inputs and the same group
of students. Students differ in their ability and in their family’s income. A student’s
achievement depends not only on his own ability; ceteris paribus he/she will perform bet-
40
ter the higher the average ability of his/her peers in the classroom - a well-documented
peer effect. This provides an incentive for private schools to structure their tuition fees so
as to attract high-ability students, since they thereby become more attractive, allowing
them to charge higher average fees. Thus, private schools attract high-ability, low-income
students by offering them tuition discounts and/or fellowships. In the equilibrium of this
model, the public schools end up with students with a relatively low average ability, and
there is a hierarchy of private schools with different average student abilities and tuition
fees. Because the demand for education increases with income, students with higher fam-
ily incomes tend to get concentrated in the private schools. When school vouchers are
introduced in this environment, the private schools expand because more able students
from low-income families can now afford to switch from public to private schools. These
students experience a gain from the introduction of vouchers, but the students left behind
in the public schools - those with relatively low income and ability - lose out because of a
negative peer effect on their attainment as more able students switch to private schools.
At the same time a calibrated version of the model suggests that vouchers will have a
moderate positive effect on average welfare and educational achievement.
This analysis by Epple and Romano (1998) suggests how universal school vouchers
may lead to increased social stratification and a poorer quality of public schools. Without
embracing school vouchers, Ladd (2002) argues that such negative effects could be reduced
if vouchers are means-tested and if private schools are restricted in their tuition policies.
As this discussion shows, education vouchers must be carefully designed if one wants
to minimize undesirable segregation effects. Vouchers for education remain a contentious
issue. Belfield and Levin (2005) argue that their design must reflect a trade-off between
four important social goals: (i) freedom of choice, (ii) efficiency, i.e., maximization of
educational outcomes for any given resource constraint, (iii) equity, i.e., equal access
to education, and (iv) social cohesion, i.e., a common educational experience that will
encourage all students to become full participants in the social, political and economic
institutions of society. Trading off these worthy goals against each other is obviously not
an easy task.
6.2. Outsourcing via competitive public tender
Under voucher schemes there is a continuous ongoing competition among public service
providers to attract “customers”. The price of the service is determined by the relevant
public authority, so service suppliers compete on quality. An alternative model of public
service provision is to arrange a competitive public tender where potential private and
public service providers make a bid for a contract that will give the winner the sole right
to deliver a certain public service within a specified time period. Usually this exclusive
right is given to the supplier offering to deliver a specified amount and quality of output
41
at the lowest price, but it may also be given to the bidder offering the most attractive
combination of price and quality. Under this model of service provision there is price
competition (or competition on price and quality) at the time of the public tender, but
during the contract period the winner of the competition has a temporary monopoly.
In principle, the potential private and public suppliers compete for the contract on
equal terms, provided the bid submitted by the incumbent public supplier reflects all
relevant costs of delivering the service, including overhead and capital costs. In principle,
it will then be immaterial whether the contract is signed with a private provider or with
the incumbent public provider, as long as the right to deliver the service is given to the
provider who can produce the service (of a given quality) at the lowest cost. In practice, it
may be impossible to level the competitive playing field for private and public providers,
for two reasons. First, it may be very difficult to allocate all relevant overhead and capital
costs to the individual public sector production unit, since these costs are often hidden
in the budget for the central administration of the relevant jurisdiction. Second, public
sector organizations are rarely allowed to go bankrupt (in fact, it may not be legally
possible for them to do so) and will therefore be subject to lower pressure from market
forces. These factors may explain why public authorities often decide in advance to
outsource service provision to a private provider, without allowing the incumbent public
provider to participate in the public tender.
Outsourcing has been a common practice of central and local governments in the
OECD area for many years, but its merits or demerits are still disputed.26 Proponents
emphasize that the competition involved in outsourcing via public tender helps to identify
the least-cost and best-practice providers to the benefit of taxpayers. They also argue
that the mere possibility of outsourcing helps to keep incumbent public service providers
on their toes, thereby improving efficiency even if outsourcing does not actually take
place. Further, they argue that a for-profit provider has a stronger incentive to minimize
cost than a public provider.
Opponents argue that the additional transactions costs necessitated by outsourcing
are often overlooked; that the profit motive may induce private providers to lower ser-
vice quality in order to save costs, that private providers have a higher cost of capital
because of the risk premium required by private investors, and that the cost savings from
outsourcing that may nevertheless be observed typically stem from lower service quality
and/or lower wages or poorer working conditions for service workers.
Below I will describe a simple model of outsourcing incorporating these elements.
The model seeks to clarify some key trade-offs that policy makers will face - and the
parameters defining the terms of this trade-off - when they decide whether or not to
outsource the provision of some public service.
26The arguments on both sides of the debate have not changed very much since Jensen and Stonecash
(2005) wrote their survey.
42
A simple model of outsourcing
The model is described in detail in appendix B. It is a variant of the principal-
agent model with costly verification of effort set up in Knabe and Sørensen (2006), but I
make more specific assumptions on preferences and technology which allows me to derive
sharper predictions from the model.
In the model a government principal such as a municipality pays an agent to provide
some service to citizens. Under in-house provision, the agent is a public service worker;
under outsourcing he is a private entrepreneur. In both cases the agent has the same
exogenous outside option which means that the principal must offer him the same min-
imum level of expected utility to secure the provision of the service. In addition to the
(wage) payment needed to secure the participation of the agent, the cost of providing
the service includes a fixed overhead cost and a cost of monitoring service quality. Under
in-house provision, the fixed overhead cost is borne by the principal; under outsourcing
it is carried by the entrepreneur. The quality-adjusted amount of service delivered to
citizens is directly proportional to the effort exerted by the agent. For the public service
worker, the cost of effort is given by eq. (2) above. Because effort is costly, the public
service worker has no incentive to make any effort to reduce the cost of service provision.
By contrast, a private for-profit provider has such an incentive, so he divides his effort
between servicing the clients and reducing his fixed overhead cost, say, by carrying out
some of the firm’s administrative work himself rather than hiring someone else to do it.
The private provider thus engages in two tasks, and his cost of effort is given by eq.
(15) above, with 0. This assumption on means that the two tasks are substitutes
competing for the agent’s attention and effort. The principal can observe the level of ser-
vice quality by incurring a monitoring (audit) cost. If the quality (and, by implication,
the agent’s effort) is found to fall short of some exogenous benchmark level, the agent is
punished by a fine which is proportional to the shortfall. If service quality is found to
exceed the benchmark level, the agent is rewarded by a bonus proportional to his “over-
performance”. An audit of service quality occurs with some probability determined by
the principal. The agent’s realized utility is a concave function of his income net of the
cost of effort. The agent maximizes his expected utility, accounting for the probability
that an audit will occur. The optimal effort will then be an increasing function of the
audit probability , so by adjusting and the associated monitoring cost, the principal
can indirectly control service quality.
In this set-up one can identify the factors which will determine whether there is a
social gain from outsourcing. This can be done by assuming that, under both modes of
provision, the principal chooses an audit probability that will ensure that actual service
quality equals the benchmark level. The utility of the citizen clients will then be the
same in both cases. In that situation outsourcing will yield a social gain if it allows the
principal to secure the provision of the benchmark service level at a lower net budgetary
43
cost than the cost of in-house provision. Whether such a gain will actually occur turns
out to depend on the balance of the following effects (see eq. (B.33) in appendix B):
Competition effect. Even if the private provider does not make any effort to reduce
his overhead cost, outsourcing via public tender may still reduce the fixed cost of service
provision by helping the principal to find the most effective supplier. This is the gain
from competition emphasized by the advocates of outsourcing. However, the model also
allows the possibility that the competition effect (as defined here) could be negative, say,
if the public provider has a lower fixed cost per unit of service because of economies
of scale, or if the cost of capital is significantly higher for a private than for a public
provider.
Ownership effect. This effect, which might also be termed an incentive effect, arises
from the fact that the private entrepreneur is the residual claimant to any gain from lower
costs of production. This gives the private provider an incentive to engage in cost-saving
measures, including measures to reduce overhead costs. Under in-house provision there
is no such incentive because the in-house provider is not the residual claimant to the
gain from cost savings. According to the model, the ownership effect therefore makes an
unambiguously positive contribution to the gain from outsourcing.
Transactions cost effect. By contrast, this effect detracts from the gain from out-
sourcing, for two reasons. First, to reap the potential gain from the competition effect,
a public tender must be implemented at regular intervals, and there is a fixed transac-
tion cost of organizing a tender. Second, because a private provider has an incentive to
divert effort away from servicing the clients toward cost-saving activities, the principal
must incur larger monitoring costs to secure the same service quality under outsourcing
as under in-house provision. The model thus addresses the concerns of those who fear
that outsourcing will lead to lower service quality. Unless the principal is prepared to
intensify monitoring, quality will indeed deteriorate.27 However, the higher the rate of
penalty imposed on the service provider in case poor quality is detected, the lower will
be the necessary increase in monitoring cost under outsourcing.
On balance, one cannot say a priori whether outsourcing will yield a social net gain
since this will depend on the context. The ownership effect speaks unambigously in favour
of outsourcing, and typically one might also expect the competition effect to do so, but
the transactions cost effect works in the other direction. In the end, the political decision-
makers will have to evaluate the likely size of these different effects in each specific case
before making a decision to organize a public tender for outsourcing.
27Actually there may be odd cases where the principal does not need to incur additional monitoring
costs to secure the benchmark service quality, as I explain in appendix B (see my comments on eq.
(B.33)). But in the normal case quality will fall unless monitoring costs are allowed to increase.
44
Further issues raised by outsourcing
It should be noted that the model described above does not predict what will actually
happen to service quality in case of outsourcing, since this will depend on whether the
government purchaser is willing to incur higher monitoring costs. The model assumes
that service quality can be observed and verified, albeit only at a cost. Other models of
public procurement, including the influential one developed by Hart, Shleifer and Vishny
(1997), frequently assume that product quality is not verifiable in a way that can serve
as the basis for sanctions enforced by the legal system. In such a setting with incomplete
contracting where quality-improving and cost-reducing effort is non-contractible, Hart et
al. find that outsourcing of public services will always lead to lower costs, since private
owners have an incentive for cost-cutting, whereas service quality may be either higher
or lower than under public provision.28
The inability to write contracts allowing for all possible contingencies may also mean
that outsourcing reduces the government’s flexibility to react to unforeseen events. When
such events occur, a renogotiation of the contract with the private provider may be
needed. If the search and transactions costs of switching to an alternative supplier within
the contract period are significant, the resulting bargaining power may enable the current
private supplier to extract rents from the government when the contract is renegotiated.
This is the “hold-up” problem associated with outsourcing, discussed by Jensen and
Stonecash (2005, p. 775).29 The risk of hold-up is a cost of outsourcing that must be
considered in addition to the factors mentioned earlier.
Another issue is whether the intrinsic motivation of service workers will suffer if service
provision is outsourced. Francois (2000) argues that it may well do so. In his model all
workers have some public service motivation (PSM), regardless of whether they work for
the government or for a private for-profit firm. Thus workers do not care who provides
some service that society values, but their PSM means that they care about the level
of service provided. For such PSM to motivate a worker’s own effort, he must believe
that, were he not to make any effort, the level of service would fall. Francois argues that,
when the service is publicly provided, workers will expect that service will in fact be
reduced if they “shirk”, because the public agency has no high-powered incentive to take
offsetting actions. But if they work for a private provider, individual workers will expect
28Interestingly, when the government can write a contract with a public in-house provider that allows
the latter to share in any gain from cost-savings, and when the government can also appropriate part
of a private provider’s gain from cost-cutting (say, through taxation), the model in appendix B implies
that the regimes of in-house provision and outsourcing will generate exactly the same outcomes when
the cost-sharing parameters are the same (see the last section of appendix B). This result - previously
demonstrated by Knabe and Sørensen (2006) - shows that it is the inability to write complete contracts
which causes outcomes under in-house provision and outsourcing to differ.29See also Andersson and Jordahl (2011) for a further discussion of incomplete-contracting models of
outsourcing.
45
that their employer will take some action to at least partially offset the loss in service
output in case they shirk, for otherwise the employer will lose too much profit. Given
these expectations, workers will be less motivated to exert effort under outsourcing than
under in-house provision, so outsourcing may lead to lower productivity. This argument
is interesting, but it assumes that the stronger inclination towards pro-social behaviour
in the public sector reflects the institutional differences between the public and private
sectors as such rather than a self-selection of people with a stronger PSM into the public
sector. This does not fit with the evidence cited in section 2.2 which suggested that the
greater prevalence of PSM in the public sector reflects a selection effect.
What is the evidence on the effects of outsourcing?
The evidence on the effects of outsourcing has recently been surveyed by Jensen and
Stonecash (2005) and Andersson and Jordahl (2011). Here I will make only a few remarks
on the main findings in the literature. To evaluate whether outsourcing leads to higher
productivity in public service provision, we need data indicating how the ratio between
the cost of provision and the quality-adjusted quantity of services delivered is affected by
outsourcing. Productivity improves only if the cost per unit of quality-adjusted service
goes down. Observing that the total cost of provision goes up or down does not in itself
tell us what has happened to productivity. Several years ago, Starr (1988, pp. 6-7)
complained that ‘...most studies comparing public and private organizations lack any
evidence about the quality of services, thereby making it difficult to judge whether lower
costs result from greater efficiency or reduced service.’ Unfortunately this complaint is
also relevant for several studies carried out since then, because of lacking data on service
quality.
However, a stylized finding from the accumulated evidence is that, when it comes
to technical services with small contracting difficulties (e.g., garbage collection, main-
tenance of roads, vehicles, warehouses and parks, cleaning and housekeeping, student
transportation etc.), outsourcing typically leads to cost savings in the order of 5-15 per-
cent (sometimes more, sometimes less) without loss of quality. These findings must be
taken with the proviso that the data on quality may be fragile and that the full trans-
actions costs associated with oursourcing may not be included. With these important
caveats, it does seem that outsourcing of technical services tends to improve productivity.
When it comes to core welfare services such as child care, home care for the elderly,
and the operation of nursing homes, quality requirements are more difficult to specify
and write into contracts. In a review of the experience with outsourcing of these three
types of welfare service in Denmark and Sweden, Petersen and Hjelmar (2014) find that
the evidence regarding effects on costs and quality is mixed. Their main finding is that
many studies are characterized by lack of data (especially on quality) and methodological
shortcomings that make it very hard to draw strong conclusions on the effects of out-
46
sourcing of welfare services to children and the elderly in Scandinavia.30 Andersson and
Jordahl (2011) review some other studies (from Scandinavia and elsewhere) of service
areas with contracting difficulties and likewise conclude that the effects of outsourcing
on productivity appears to be mixed.
An interesting issue is whether the efficiency gains from outsourcing - when they
materialize - result from a competition effect or from an ownership effect. Many authors
have tended to conclude that the competition effect is the more important of the two,
but as Andersson and Jordahl (2011) point out, it is very difficult to disentangle the
two effects since they are often introduced in tandem. Andersson and Jordahl cite some
empirical studies of the UK health care system indicating that competition between public
hospitals raises productivity. This is evidence of a competition effect, but whether this
is stronger than the ownership effect remains unresolved.
A final contentious issue is whether and how much the observed cost savings from
outsourcing reflect a redistribution effect rather than increased efficiency or lower service
quality. A redistribution effect occurs if outsourcing leads to lower wages or tougher
working conditions for service workers, say, because public sector union contracts no
longer apply. Jensen and Stonecash (2005) refer to a number of studies from various
countries indicating that such a redistribution effect does sometimes occur. Whether
this effect is desirable or not depends on whether one thinks the public or the private
sector should set the standard for pay and working conditions. From a general taxpayer
perspective it seems desirable to eliminate rents extracted from the public sector. On
the other hand, if one feels that the employees working for private service providers are
being exploited, say, because they are not unionized, one may deem any redistribution
effect to be undesirable. Political opinions on this issue are likely to differ.
Innovation and risk-sharing in public procurement: public-private partnerships
Public procurers are often keen to specify in great detail the products they want and
the way in which services are to be delivered. While this may help to prevent disputes
during the contract period, it may also stifle innovation by preventing potential private
suppliers from suggesting new ways of producing the service or new types of service
satisfying the same needs in a better way. As we have seen, a failure to specify in
advance who is going to bear what risks may also require costly negotiations and create
hold-up problems after an outsourcing contract has been signed.
In an attempt to address these problems, many OECD governments have experi-
mented for some years with more advanced forms of public procurement, including so-
30However, in a recent study that does not suffer from the shortcomings mentioned above, Andersen
and Jakobsen (2011) analyze hip operations in the Danish health care sector by combining survey and
register data. The authors find that, although private health clinics do not achieve better clinical results
than public clinics, patient satisfaction is nevertheless higher with private clinics, because they optimize
non-clinical factors such as waiting time much more than public clinics.
47
called public-private partnerships (PPPs). PPPs have mainly been used in infrastructure
and construction projects, but they are also finding their way into other areas of public
service provision.31 Under a PPP, a local or central government agency enters a long-
term contract with a private supplier (usually a consortium of firms) for the delivery of
some services. The supplier takes responsibility for building the necessary infrastructure
and for subsequently maintaining it. Traditionally the private supplier has also provided
the finance for the infrastructure investment, but in recent years (part of) the finance
for some PPPs has come from governments. PPP contracts often have a length of 20-30
years. Apart from bundling the design, building, finance and operation of the project
into one contract, PPP contracts also specify which particular risks must be borne by
which partner(s) during the entire term of the contract.
There are two main advantages of PPPs over the traditional form of public pro-
curement. First, because a PPP contract encompasses the construction as well as the
subsequent operation of the facility, it can provide better incentives for investments that
will reduce future costs or improve future service quality, since the contract can be de-
signed to ensure that those who carry the cost of the investments also receive the future
benefits from them. This goes some way towards encouraging innovative investments.
Second, the explicit focus on risk-sharing in a PPP helps to identify key risk factors and
to allocate the various types of risk to the partners who are in the best position to carry
them, thereby reducing the overall cost of risk-taking.
However, there are also drawbacks of PPPs compared to traditional public procure-
ment. In particular, the long contract period in a PPP reduces the flexibility of the
public procurer by tying him to a particular supplier for a very long time, and the very
detailed and complex structure of many PPP contracts also imply high transactions costs
when contracts are negotiated. Private finance for PPP projects may also make them
more expensive, because private investors typically have a higher cost of capital than
governments who can usually borrow at the risk-free interest rate.32
There is a burgeoning literature on PPPs; see Hodge et al. (2010) for a survey. Iossa
and Martimort (2014) offer a recent theoretical analysis of the pros and cons relating to
PPPs. They find that PPPs are more likely to improve welfare when a better quality
of the infrastructure can significantly reduce future costs (including maintenance cost),
when infrastructure quality has a great impact on the quality of the service and on service
demand, when service quality is verifiable, and when demand for the service is stable and
easy to forecast. They argue that this points to the suitability of PPPs in sectors such as
transport and water supply, where infrastructure quality is key and demand is relatively
stable. To the extent that the conditions just mentioned fail to prevail, PPPs are less
31For example, in Denmark a recent PPP involves the building and subsequent operation of a complex
of nursing homes and accommodations for elderly citizens.32Usually, but not always, as the European sovereign debt crisis sadly taught us!
48
likely to deliver efficiency gains and may even generate losses compared to simpler forms
of procurement.
Against this background it may not be surprising that evaluations of the practical
experience with PPPs vary from great praise to strong criticism. Reviewing the evidence
on PPPs available at the time, Hodge and Greve (2009, p. 38) concluded: ‘The evidence
to date is largely based on business case estimates, has an unclear counterfactual and
suffers from a host of poor evaluative design features.’ Regarding the PPP objective of
creating greater value for the taxpayers’ money, they continued: ‘..the most optimistic
reading of the evidence thus far is that it is mixed. There is a wide range of both sup-
porting and opposing study results. Much remains to be done to improve the reliability
of these findings.’ In a more recent Danish survey of the experience with PPPs, Petersen
(2013) drew a similar conclusion.
In summary, it seems that public-private partnerships can sometimes be more efficient
than traditional forms of public procurement, but like the other policy instruments dis-
cussed in this paper, PPPs can also be counterproductive if used in a context for which
they are not fit.
7. Bureaucracy: What drives it? Do we really want to get rid of
it?
As long as anyone can remember, politicians have proclaimed their determination to fight
bureaucracy. Rarely does a new government come into office without announcing some
new initiative to eliminate unnecessary red tape, to debureaucratize the public sector
etc. - or at least not without declaring its intention to take some such future initiative
(do you remember Sir Humphrey Appleby?)33. Regardless of whom you ask: everyone is
against bureaucracy.34 Indeed, in an eloquent paper Robert Behn argued that one of the
Three Big Questions of public management is the “micromanagement question”: ‘How
can public managers break the micromanagement cycle - an excess of procedural rules,
which prevents public agencies from producing results, which leads to more procedural
rules, which leads to...?’ (Behn, 1995, p. 315). And one of the key objectives of the New
Public Management was to reduce bureaucracy by shredding rigid process rules in return
for greater accountability for results.
So how come that government bureaucracy seems to be ever-expanding if nobody
wants it? Is it really true that governments are becoming ever more bureaucratic? And
if so, what are the drivers of this process which everyone is apparently against and which
33If not, you will find some indispensable information here:
http://en.wikipedia.org/wiki/Humphrey_Appleby34If the reader has ever come across a politician who argued in favour of more bureaucracy, kindly
send me an e-mail!
49
seems to reduce prosperity and welfare? In this section I venture a few observations on
these issues, realizing that they are clearly too complex and important to be settled in a
few pages.
7.1. Red tape: Is it expanding?
Everybody seems to know that bureaucracy is increasing, but to my knowledge there isn’t
a lot of hard evidence on this issue, for how do you measure the extent of bureaucracy
and its change over time? One approach to doing so is to count the total number of words
in all existing laws and departmental orders and see how this number evolves. Jakobsen
and Mortensen (2014) have done so for Denmark. They found that, on average, the total
number of words in existing laws grew by about 3 percent per year between 1989 and
2011, whereas the number of words in departmental orders grew by 4 percent annually.
These numbers reflect the net increase in the complexity of laws and executive orders,
accounting for the expiry or abolition of old laws and regulations as well as for the
introduction of new ones and for changes to existing ones.
Taking a somewhat different approach to measuring bureaucracy, Hood, James and
Scott (2000) looked at the internal regulation of the UK government, focusing on the so-
called secondary overseers of public bodies beyond the courts and the legislature. This
involves oversight of bureaucracies by other public agencies operating at arm’s length from
the direct line of command, the overseers having some sort of official authority over their
charges. The secondary regulation is typically a combination of information-gathering,
standard setting and attempts to control or modify the behaviour of the regulated bodies.
The authors measured the evolution of the number of national-level “regulator” organi-
zations overseeing public-sector bodies, the evolution of their staff size and of the total
budgetary cost of running them. They also tried to track the evolution of the total direct
costs of complying with the regulations.
The findings of Hood, James and Scott (2000) were remarkable. According to their
figures, the number of “regulator” organizations overseeing government grew by over a
fifth in the two decades to the mid-1990s. The overall real spending on regulation of
government more than doubled over the period, and the total staffing of regulators grew
by about 90 percent. This dramatic staff growth took place in a period where the total
number of civil servants fell by more than 30 percent and where local authority staff
fell by over 20 percent. As the authors note, there was no official policy of increasing
regulation of UK government over the twenty years of mostly Conservative government
up until 1997. On the contrary, this was a period where the New Public Management
slogan of “letting managers manage” was supposed to have led to less regulation of public
agencies! Moreover, Hood and his coauthors saw no tendency towards a break with the
increasing internal regulation of government during the early years of Tony Blair’s New
50
Labour government.
Some years earlier, the Inspectors-General in the US federal government criticized the
US Congress and the President for ‘a willingness to impose an ever-increasing level of
regulatory and reporting requirements on executive agencies and their employees’ (Light,
1993, p. 17), and the National Performance Review (1993, p. iii) talked of the need to
eliminate ‘the structures of overcontrol and micromanagement that now bind the federal
government’.
This evidence from three rather different countries on trends that have persisted under
governments with quite different ideas on the role of the state suggests that the popular
perception of an ever-expanding amount of government bureaucracy is no myth. It seems
to be a stark reality. The tough question is: what drives this juggernaut?
7.2. Red tape: What are the drivers?
The above quotation from Behn (1995) summarizes a popular answer to this question:
rules create the need for more rules in a vicious circle of bureaucracy. Suppose that, for
some reason, politicians are unhappy with the performance of some government agency.
They therefore enact a new law or ask the relevant ministry to issue a new executive
order laying out some rules for how the agency is supposed to do its work. The rules
impose new reporting requirements on the agency, drawing some of the effort of its
staff away from servicing citizens towards filling forms and writing reports. Perhaps the
new rules also reflect an imperfect understanding of the best way to run the agency,
thereby constraining the agency’s flexibility to find the best solutions to the problems it
is supposed to solve. As a result, the performance of the agency declines. Politicians now
become more unhappy with the agency. Apparently, the first set of rules was not enough
to secure the changes in agency behaviour they demanded. Obviously, politicians reason,
there is a need for further rules clarifying how we want the agency staff to do its job.
They asked for it! As a result of the next layer of rules, the agency’s room for maneuver
is further constrained, more paperwork needs to be done, and agency performance takes
another dive. Now politicians get really annoyed, so...
In this version of the story of the vicious circle of bureaucracy, it is the politicians who
are the villains. If only they could concentrate on defining the broader goals and targets
of public policy and leave it to the managers and employees of individual agencies to find
the best technical ways of doing their day-to-day business. Politicians should steer, not
row: Let public managers manage!
Sometimes the media are seen as the ultimate villains who start the vicious circle of
bureaucracy. Perhaps some individual agency - or some individual staff member in an
agency - has made a mistake or has engaged in misconduct that hurts some innocent
citizen or group of citizens. As soon as the media and the general public get news of this,
51
the scandal is blown up, and some member of the political opposition asks the relevant
minister what the government will do to prevent such a thing from ever happening again.
The incident may not be very representative (perhaps not at all representative) of what
normally happens in the sector or agency of government in question, but the pressure on
the minister to do something - or at least to seem to be doing something - is mounting
and ultimately becomes irresistible. Perhaps it also offers a welcome opportunity for
the minister to take some initiative that will create favourable media coverage. So the
minister and his staff issue a new executive order setting out new rules on how agencies
or public sector units of the type in question are required to organize their affairs so that
things such as the recent scandal can never occur again. The vicious circle of bureaucracy
has been set in motion.
The story lines above may have a familiar ring, but they are too simplistic. As
Behn (1995, p. 316) points out himself, it is not only the politicians who distrust the
ability of public managers and employees to do their jobs properly - the distrust is
mutual: people working in the executive branch do not always trust that politicians
know best how to run the government (did anyone mention Sir Humphrey again?). This
is not a simple problem of mutual bad will reflecting that, by some social misfortune,
people with a “wrong” mindset somehow end up in the government and the civil service.
Rather, it reflects the uncomfortable fact that the role of politicians cannot in practice
be fully separated from the role of civil servants in the way that Woodrow Wilson (1887)
hoped. In his vision, politicians would make the decisions about public policy, and career
officials would then figure out the most efficient ways to implement these policies, loyally
respecting the intentions of the legislature. The problem is that political intentions and
decisions are often not stated very clearly, because they are the outcome of an arduous
political compromise, or because they reflect a vain hope to avoid unpleasant trade-
offs. Sometimes this leaves considerable room for judgement when the civil servants try
to carry out the will of politicians. Even if they try to be loyal, it may not be clear
exactly how some policy ought to be implemented. Moreover, sometimes a civil servant
may feel that a political decision reflects a lack of understanding of his particular area
of administration. If the instructions from policians lack clarity and are felt to reflect
ignorance, it is tempting for the civil servant to conclude that he may as well pursue his
own agenda when implementing public policy. ‘Minister, I admire your idealism, but this
simply cannot be done. Never in the history of governments has it been seen to work’,
Sir Humphrey might say.
As we know, he was sometimes right, but not always. At any rate, even though
they are supposed to deal only with the technicalities of administration, civil servants
inevitably end up making (and not just implementing) public policy when political de-
cisions leave holes to be filled. Behn (1995) sees this as a basic source of the distrust
between politicians and civil servants. Politicians know that their laws leave scope for
52
interpretation, so they are tempted to intervene in the administration of policies to make
sure that their intentions are carried out. Civil servants resent such intervention, partly
because different politicians may seek to move the administration in different directions.
Civil servants can react in different ways (‘if you distrust us, we will distrust you’): to
avoid criticism, they can start working rigidly by the rules and not take any innovative
actions, or they can try to get around the rules by various forms of “gaming”, as discussed
earlier. And so the vicious circle of bureaucracy rolls on.
Identifying the lack of mutual trust as the root of the problem of bureaucracy may be
too simplistic, although it is probably part of the true story. In Denmark many public
sector employees and their organizations have called for a “Trust Reform” of the public
sector, asking to be freed from the many rules and regulations constraining their ability
to serve the citizens in a responsive and flexible manner, and asking politicians to trust
that adherence to time-honoured professional norms in public administration and service
production will suffice to protect citizens from incompetence and misconduct in public
agencies.
However, if the source of the mutual distrust is the impossibility of separating decisions
on policy from the administration of policy, it may be very hard to break it down.
Political leaders with such diverse persuasions as James Madison and Vladimir Lenin did
not believe that government can be built only on trust. Nor did Woodrow Wilson, as we
noted earlier.
Yet this does not mean that nothing at all can be done to curb bureaucracy, as I will
argue in the concluding section. But before then, it is worth asking:
7.3. Do we really want less bureaucracy?
The reason for asking is that, if red tape in the government continues to grow regardless of
whom we elect to run it, perhaps bureaucracy serves some useful social purpose after all.
Max Weber (1947) gave a famous describtion of the positive aspects of bureaucracy. He
pointed out that all organizations need some amount of bureaucracy to allocate resources
and carry out decisions in an effective manner. He noted that as society becomes more
complex, it needs more complex institutions involving more bureaucracy. According to
Weber the ideal type bureaucracy is characterized by well-delineated specialized tasks
for each staff member and clear rules on decision-making. A well-defined hierarchy is
an organizing principle in a bureaucracy. In a well-functioning bureau, the hierarchy of
authority is accepted by all employees, and its management is based on written orders.
The employees of the bureau are selected on the basis of professional merit to avoid
nepotism, and job security is high, often based on life-long employment contracts. Pay
increases with promotion in the hierarchy. Weber considered this bureacratic form of
organization - characterized by impersonal implementation of impersonal though rational
53
rules - to be an effective way of ensuring that the personal interests of individual employees
would not hamper the proper functioning of the organization.
In short, Weber considered such an impersonal and rules-bound bureaucracy to be
both efficient and fair. In particular, Weberian bureaucracy is well-designed to safeguard
the principle of equal treatment of citizens, whether their status in society be high or
low. This is an important theme for many other writers on government “bureaucracy”.
For example, Herbert Kaufman (1977, p. 4) observed that ‘One person’s ‘red tape’ may
be another’s treasured procedural safeguard.’
Hood, James and Scott (2000) interviewed some 80 British civil servants to find out
if they saw a need for a significant reduction of the formal regulation of government
described earlier. The interviews included both regulators and public managers subject
to regulation. Interestingly, several respondents argued that the tendency to move away
fromWeber-type career service and jobs-for-life employment patterns in the public sector
had increased the need for internal regulation through formal rules by undermining the
traditional career-based incentives that supported informal controls based on mutual
dependence. Some respondents also argued that changes in social norms had necessitated
more regulation, as citizens had tended to become more litigious and less compliant
consumers with less deference to public-service officials.
Thus, factors like the increasing complexity of society and changing employment pat-
terns and social norms may help to explain some of the increase in “bureaucracy”. Jakob-
sen and Mortensen (2014) also report some findings from Denmark that do not fit well
with the simple “vicious-circle-of-bureaucracy” story told earlier. In particular, they
found that the policy areas that were initially subject to the greatest amount of rules
also experienced the smallest growth in the amount of rules over the period 1989-2011.
This suggest that the infamous vicious circle begins to move more slowly as the number
of rules goes up: apparently there is a limit to the amount of regulation a given policy
area can absorb. The authors also found that new regulation is not mainly driven by
“scandals”, but rather by issues that appear to be of particular interest to politicians and
the general public for more extended periods of time.
A main conclusion in Jakobsen and Mortensen (2014) is that the growth in rules is
driven by politicians wanting to make policy, and not by trigger-happy civil servants
wishing to increase their power. In a way this is reassuring: we probably would not want
it to be the other way around. It is also natural. After all, there are only two basic
ways in which politicians can make an impact on society: they can levy taxes and spend
the money on persons or activities deemed worthy of public support, or they can create
rules regulating the behaviour of individuals and firms. It would be both unrealistic and
unreasonable to expect politicians to stop making new rules. But perhaps they could
become better at getting rid of old rules that may no longer be needed. I will come back
to this theme below.
54
In summary, bureaucracy is here to stay, so we had better get used to it. Presumably
there is an “optimal” amount of bureaucracy in any society at any given point in time,
although I am sure we shall never be in a position to identify (or agree on) the exact
location of that optimum. Still, given the pervasive complaints about government red
tape, and considering the dramatic growth in rules, regulations and regulating bodies in
recent decades, most OECD countries have most likely ended up with more bureaucracy
than they need. In the final section I will present a few ideas on what can be done about
it.
8. Conclusions and final reflections on public sector reform
Demographic trends, mounting government debt burdens and Baumol’s cost disease put
public budgets under severe pressure, forcing governments to think of ways to increase
productivity in public service production. This essay has discussed three tools of public
administration and management that have featured prominently in public sector reforms
in recent decades, often under the heading of New Public Management (NPM): pay for
performance, performance management, and competition in public service provision. I
have also discussed some reasons why public administration seems to have become more
bureaucratic over time, despite the intention of NPM to move from rules-based to results-
oriented management of public agencies.
It is fair to say that NPM-inspired reforms have generally not lived up to expectations
and have often created undesirable side effects. Hence the NPM paradigm has fallen into
disgrace in many circles. Yet many key elements of the earlier reforms remain in place
throughout the OECD and continue to be debated, and they also continue to pop up
in many reform proposals. This explains my choice of focus for this essay. I will start
this final section by summarizing my main conclusions. I will then discuss what these
conclusions imply for future attempts to reform the public sector.
8.1. The main conclusions so far
Pay for performance
Critics of NPM often argue that the introduction of pay for performance (PFP) in the
public sector represents a misguided attempt to apply principal-agent theory in a context
where it has little or no relevance. But as I showed in section 4.2, principal-agent theory
can actually explain why it may make good sense to rely less on (PFP) in the public than
in the private sector. Public service production is typically said to be characterized by
phenomena such as a relatively high degree of risk-aversion among employees; external
influences on public service output beyond the control of the individual service worker;
55
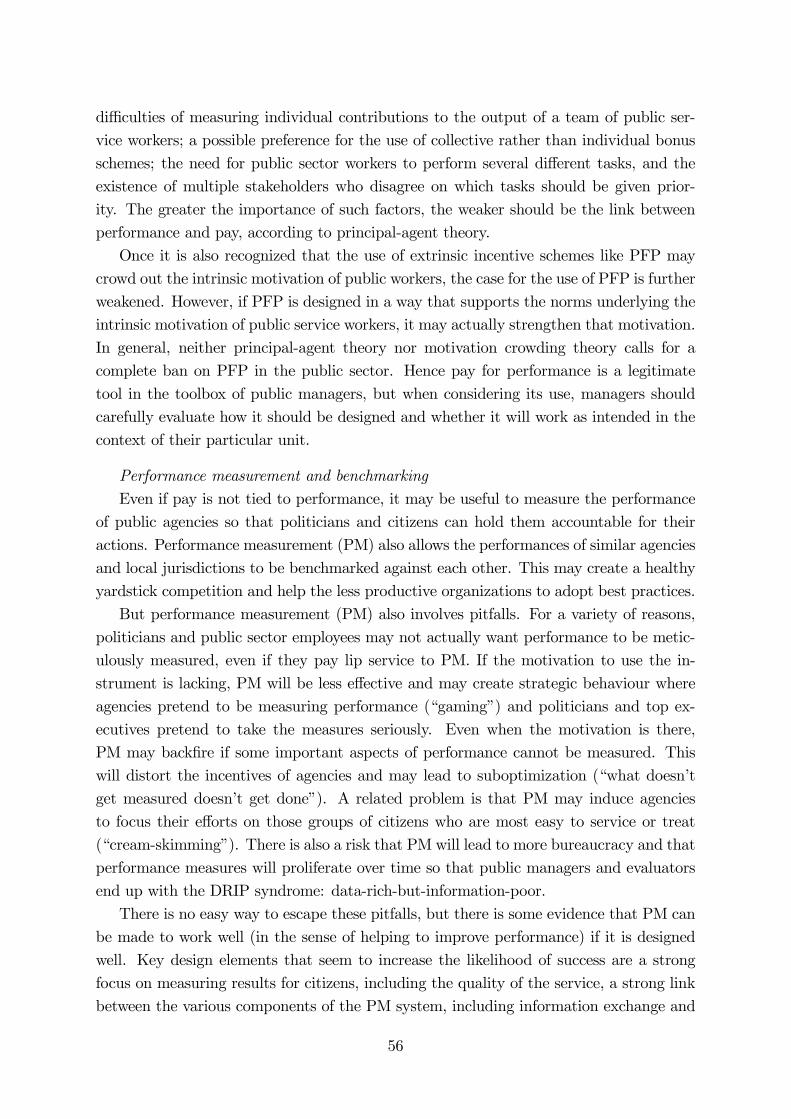
difficulties of measuring individual contributions to the output of a team of public ser-
vice workers; a possible preference for the use of collective rather than individual bonus
schemes; the need for public sector workers to perform several different tasks, and the
existence of multiple stakeholders who disagree on which tasks should be given prior-
ity. The greater the importance of such factors, the weaker should be the link between
performance and pay, according to principal-agent theory.
Once it is also recognized that the use of extrinsic incentive schemes like PFP may
crowd out the intrinsic motivation of public workers, the case for the use of PFP is further
weakened. However, if PFP is designed in a way that supports the norms underlying the
intrinsic motivation of public service workers, it may actually strengthen that motivation.
In general, neither principal-agent theory nor motivation crowding theory calls for a
complete ban on PFP in the public sector. Hence pay for performance is a legitimate
tool in the toolbox of public managers, but when considering its use, managers should
carefully evaluate how it should be designed and whether it will work as intended in the
context of their particular unit.
Performance measurement and benchmarking
Even if pay is not tied to performance, it may be useful to measure the performance
of public agencies so that politicians and citizens can hold them accountable for their
actions. Performance measurement (PM) also allows the performances of similar agencies
and local jurisdictions to be benchmarked against each other. This may create a healthy
yardstick competition and help the less productive organizations to adopt best practices.
But performance measurement (PM) also involves pitfalls. For a variety of reasons,
politicians and public sector employees may not actually want performance to be metic-
ulously measured, even if they pay lip service to PM. If the motivation to use the in-
strument is lacking, PM will be less effective and may create strategic behaviour where
agencies pretend to be measuring performance (“gaming”) and politicians and top ex-
ecutives pretend to take the measures seriously. Even when the motivation is there,
PM may backfire if some important aspects of performance cannot be measured. This
will distort the incentives of agencies and may lead to suboptimization (“what doesn’t
get measured doesn’t get done”). A related problem is that PM may induce agencies
to focus their efforts on those groups of citizens who are most easy to service or treat
(“cream-skimming”). There is also a risk that PM will lead to more bureaucracy and that
performance measures will proliferate over time so that public managers and evaluators
end up with the DRIP syndrome: data-rich-but-information-poor.
There is no easy way to escape these pitfalls, but there is some evidence that PM can
be made to work well (in the sense of helping to improve performance) if it is designed
well. Key design elements that seem to increase the likelihood of success are a strong
focus on measuring results for citizens, including the quality of the service, a strong link
between the various components of the PM system, including information exchange and
56
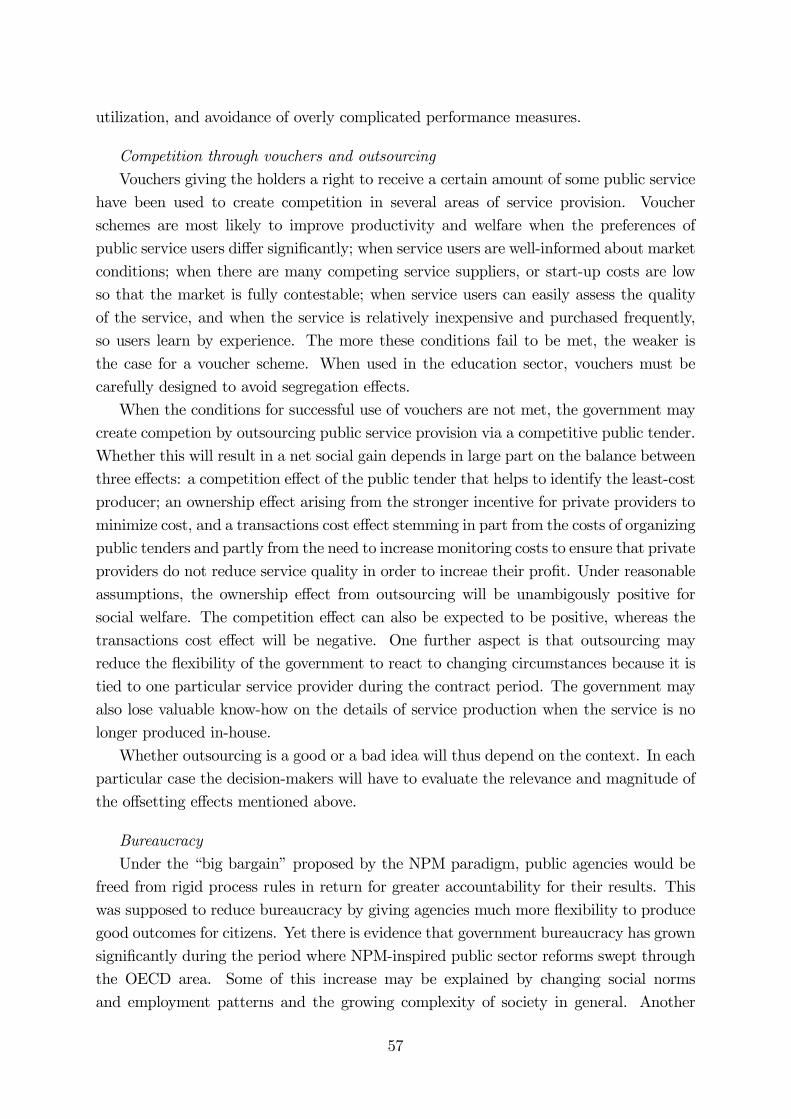
utilization, and avoidance of overly complicated performance measures.
Competition through vouchers and outsourcing
Vouchers giving the holders a right to receive a certain amount of some public service
have been used to create competition in several areas of service provision. Voucher
schemes are most likely to improve productivity and welfare when the preferences of
public service users differ significantly; when service users are well-informed about market
conditions; when there are many competing service suppliers, or start-up costs are low
so that the market is fully contestable; when service users can easily assess the quality
of the service, and when the service is relatively inexpensive and purchased frequently,
so users learn by experience. The more these conditions fail to be met, the weaker is
the case for a voucher scheme. When used in the education sector, vouchers must be
carefully designed to avoid segregation effects.
When the conditions for successful use of vouchers are not met, the government may
create competion by outsourcing public service provision via a competitive public tender.
Whether this will result in a net social gain depends in large part on the balance between
three effects: a competition effect of the public tender that helps to identify the least-cost
producer; an ownership effect arising from the stronger incentive for private providers to
minimize cost, and a transactions cost effect stemming in part from the costs of organizing
public tenders and partly from the need to increase monitoring costs to ensure that private
providers do not reduce service quality in order to increae their profit. Under reasonable
assumptions, the ownership effect from outsourcing will be unambigously positive for
social welfare. The competition effect can also be expected to be positive, whereas the
transactions cost effect will be negative. One further aspect is that outsourcing may
reduce the flexibility of the government to react to changing circumstances because it is
tied to one particular service provider during the contract period. The government may
also lose valuable know-how on the details of service production when the service is no
longer produced in-house.
Whether outsourcing is a good or a bad idea will thus depend on the context. In each
particular case the decision-makers will have to evaluate the relevance and magnitude of
the offsetting effects mentioned above.
Bureaucracy
Under the “big bargain” proposed by the NPM paradigm, public agencies would be
freed from rigid process rules in return for greater accountability for their results. This
was supposed to reduce bureaucracy by giving agencies much more flexibility to produce
good outcomes for citizens. Yet there is evidence that government bureaucracy has grown
significantly during the period where NPM-inspired public sector reforms swept through
the OECD area. Some of this increase may be explained by changing social norms
and employment patterns and the growing complexity of society in general. Another
57
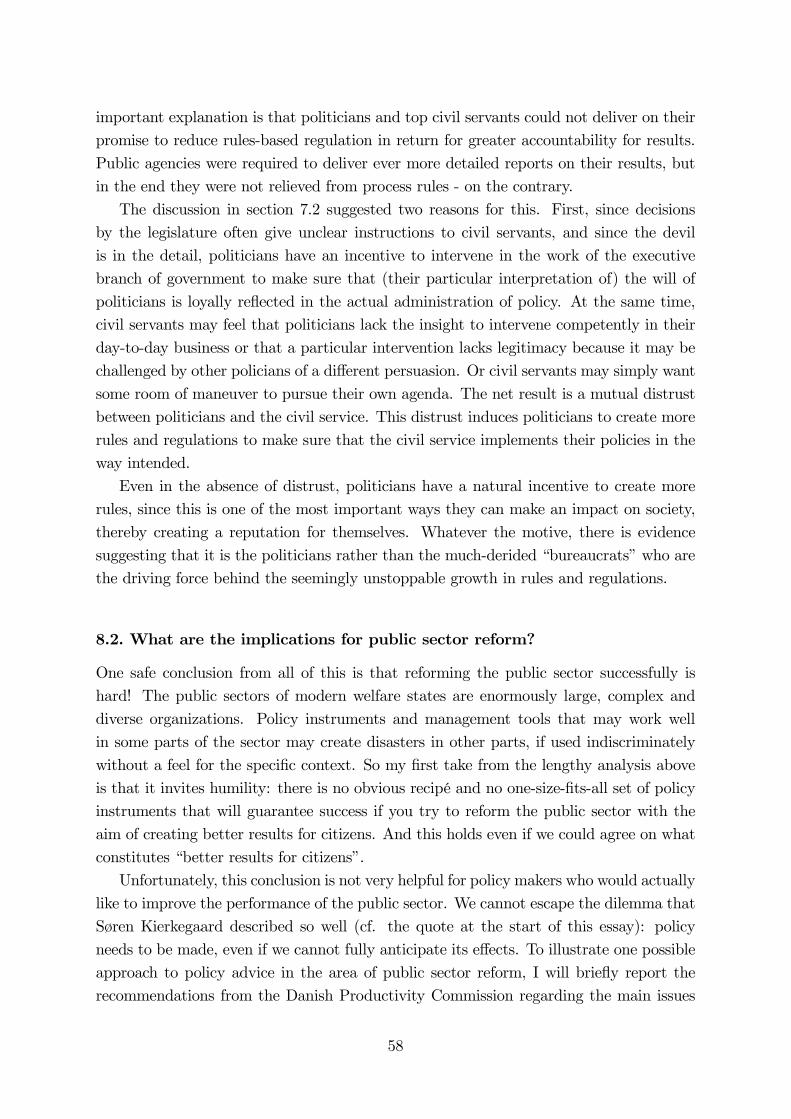
important explanation is that politicians and top civil servants could not deliver on their
promise to reduce rules-based regulation in return for greater accountability for results.
Public agencies were required to deliver ever more detailed reports on their results, but
in the end they were not relieved from process rules - on the contrary.
The discussion in section 7.2 suggested two reasons for this. First, since decisions
by the legislature often give unclear instructions to civil servants, and since the devil
is in the detail, politicians have an incentive to intervene in the work of the executive
branch of government to make sure that (their particular interpretation of) the will of
politicians is loyally reflected in the actual administration of policy. At the same time,
civil servants may feel that politicians lack the insight to intervene competently in their
day-to-day business or that a particular intervention lacks legitimacy because it may be
challenged by other policians of a different persuasion. Or civil servants may simply want
some room of maneuver to pursue their own agenda. The net result is a mutual distrust
between politicians and the civil service. This distrust induces politicians to create more
rules and regulations to make sure that the civil service implements their policies in the
way intended.
Even in the absence of distrust, politicians have a natural incentive to create more
rules, since this is one of the most important ways they can make an impact on society,
thereby creating a reputation for themselves. Whatever the motive, there is evidence
suggesting that it is the politicians rather than the much-derided “bureaucrats” who are
the driving force behind the seemingly unstoppable growth in rules and regulations.
8.2. What are the implications for public sector reform?
One safe conclusion from all of this is that reforming the public sector successfully is
hard! The public sectors of modern welfare states are enormously large, complex and
diverse organizations. Policy instruments and management tools that may work well
in some parts of the sector may create disasters in other parts, if used indiscriminately
without a feel for the specific context. So my first take from the lengthy analysis above
is that it invites humility: there is no obvious recipé and no one-size-fits-all set of policy
instruments that will guarantee success if you try to reform the public sector with the
aim of creating better results for citizens. And this holds even if we could agree on what
constitutes “better results for citizens”.
Unfortunately, this conclusion is not very helpful for policy makers who would actually
like to improve the performance of the public sector. We cannot escape the dilemma that
Søren Kierkegaard described so well (cf. the quote at the start of this essay): policy
needs to be made, even if we cannot fully anticipate its effects. To illustrate one possible
approach to policy advice in the area of public sector reform, I will briefly report the
recommendations from the Danish Productivity Commission regarding the main issues
58
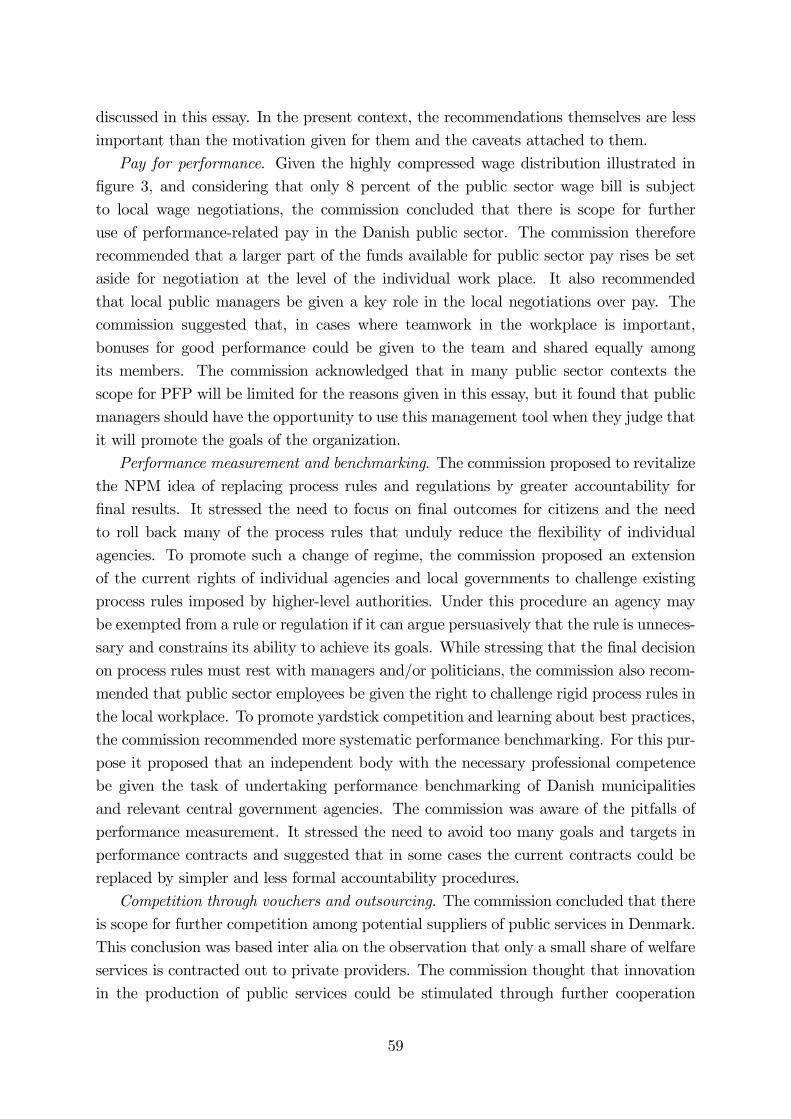
discussed in this essay. In the present context, the recommendations themselves are less
important than the motivation given for them and the caveats attached to them.
Pay for performance. Given the highly compressed wage distribution illustrated in
figure 3, and considering that only 8 percent of the public sector wage bill is subject
to local wage negotiations, the commission concluded that there is scope for further
use of performance-related pay in the Danish public sector. The commission therefore
recommended that a larger part of the funds available for public sector pay rises be set
aside for negotiation at the level of the individual work place. It also recommended
that local public managers be given a key role in the local negotiations over pay. The
commission suggested that, in cases where teamwork in the workplace is important,
bonuses for good performance could be given to the team and shared equally among
its members. The commission acknowledged that in many public sector contexts the
scope for PFP will be limited for the reasons given in this essay, but it found that public
managers should have the opportunity to use this management tool when they judge that
it will promote the goals of the organization.
Performance measurement and benchmarking. The commission proposed to revitalize
the NPM idea of replacing process rules and regulations by greater accountability for
final results. It stressed the need to focus on final outcomes for citizens and the need
to roll back many of the process rules that unduly reduce the flexibility of individual
agencies. To promote such a change of regime, the commission proposed an extension
of the current rights of individual agencies and local governments to challenge existing
process rules imposed by higher-level authorities. Under this procedure an agency may
be exempted from a rule or regulation if it can argue persuasively that the rule is unneces-
sary and constrains its ability to achieve its goals. While stressing that the final decision
on process rules must rest with managers and/or politicians, the commission also recom-
mended that public sector employees be given the right to challenge rigid process rules in
the local workplace. To promote yardstick competition and learning about best practices,
the commission recommended more systematic performance benchmarking. For this pur-
pose it proposed that an independent body with the necessary professional competence
be given the task of undertaking performance benchmarking of Danish municipalities
and relevant central government agencies. The commission was aware of the pitfalls of
performance measurement. It stressed the need to avoid too many goals and targets in
performance contracts and suggested that in some cases the current contracts could be
replaced by simpler and less formal accountability procedures.
Competition through vouchers and outsourcing. The commission concluded that there
is scope for further competition among potential suppliers of public services in Denmark.
This conclusion was based inter alia on the observation that only a small share of welfare
services is contracted out to private providers. The commission thought that innovation
in the production of public services could be stimulated through further cooperation
59
with private providers and through further experiments with innovation-friendly forms
of procurement, including public-private partnerships. The commission stressed the need
to measure and monitor the quality of services delivered and recognized that outsourcing
will typically increase the monitoring and transactions costs associated with public service
production. The commission also pointed out that the use of voucher schemes under the
Danish “Free choice” legislation may sometimes reduce public sector productivity (for the
reasons mentioned in section 6.1) and recommended further analysis of this issue. Hence
the commission emphasized that, although there is scope for further competition in the
Danish public sector, vouchers and outsourcing are not always warranted, and the case
for the use of these instruments must be evaluated carefully in each particular context.
The case for a piecemeal approach to reform and the rolling back of bureaucracy
Since the public sector is so large and complex, and since there is so much uncertainty
regarding the effects of many proposed policy initiatives, there is a strong case for exper-
imenting on a small scale with new initiatives and policy instruments to see if they work,
before one applies them across the board. Such experimentation can take place through
pilot schemes. For such schemes to be useful, they must be carefully designed so as to
allow a systematic ex-post evaluation of their effects. Of course it is also important to
follow up on each scheme: if it seems to work, the new policy should be implemented on
a broader scale.
In recent years the Danish government has experimented with two frameworks for
pilot schemes intended to roll back excessive bureaucracy. Under the “Free Commune”
legislation, Danish municipalities can apply for temporary exemption from specific rules
and regulations imposed by the central government if they can demonstrate that this will
lead to a better use of resources in local service provision. When the period of exemption
expires, the municipality must evaluate the experiment and publish the results of the
evaluation. Since the legislation is quite recent, no evaluations have so far been published.
Further, under the “Right-to-Challenge” legislation, an individual public sector unit
in the Danish municipalities and regions (counties) can apply for temporary exemption
from rules and regulations imposed by the central or local government. Such experiments
are currently allowed until 2015.
As an illustration of the difficulty of rolling back bureaucracy, the Danish central gov-
ernment has rejected a large part of the applications submitted under the Free Commune
and Right-to-Challenge programs, often with the motivation that an exemption from a
certain rule “goes against government policy”. The Danish Productivity Commission
has recommended a more liberal central government attitude towards the pilot schemes
proposed under the two programs. It has also recommended that the Right-to-Challenge
be extended to all public sector units, including those of the central government. Fur-
ther, the commission recommended that all pilot schemes under the two programs be
systematically evaluated by an independent body, that the Danish parliament be obliged
60

to follow up on all evaluations and to consider a general (i.e., nationwide) abolition or
modification of a particular rule whenever the evaluation of a pilot scheme suggests that
the rule is unnecessary or harmful. Finally, the commission has proposed that parliament
as well as local governments systematically review all major internal regulations of the
central and local governments at regular intervals to evaluate whether existing rules have
outlived their purpose and may be scrapped.
It is not clear whether such a pragmatic and piecemeal approach to debureaucratiza-
tion and public sector reform will work. But since previous reform efforts have met with
limited success, it seems worthwhile to experiment with new approaches. In any case:
the debate on public sector reform continues!
61

APPENDIX A
SOME BASIC PRINCIPAL-AGENT MODELS
This appendix documents the findings from the principal-agent models reported in
section 5.2. As mentioned there, the analysis is much inspired by Dixit (2002), but we
also present some new results.
The basic principal-agent model with moral hazard
In this model there is one principal and one agent. The agent exerts effort which
results in a stochastic outcome given by
= + ∼ ¡0 2
¢ (A.1)
where ∼ (0 2) signifies that the noise variable is normally distributed with mean
zero and variance 2. The realized utility of the agent is
= ( − ) 0 0 00 0 (A.2)
where is the agent’s income, and is his cost of effort. The principal can observe
the outcome of the agent’s effort and pays him according to the following linear reward
scheme, where and are parameters chosen by the principal:
= + (A.3)
The agent’s marginal cost of effort is increasing, as reflected in the quadratic cost function
=2
2 0 constant. (A.4)
Since is normally distributed and is non-stochastic, it follows from (A.1) and (A.3)
that − is also normally distributed. Assuming that the utility function (·) displaysconstant absolute risk aversion, maximization of the agent’s expected utility is therefore
equivalent to maximizing the following utility function where E[·] indicates a mean andvar[·] indicates a variance:35
= E [ − ]−
2var [ − ] 0 constant. (A.5)
The parameter is the agent’s coefficient of absolute risk aversion. From (A.1), (A.3)
and (A.4) we find the mean value of the agent’s net payoff to be
E [ − ] = +− 2
2 (A.6)
35This follows from the general result that an agent’s expected utility may be expressed as a linear
function of the mean and the variance of the utility-generating variable when the latter follows a normal
distribution and the agent has constant absolute risk aversion. See, e.g., Silberberg and Suen (2001, pp.
407-408) for a proof of this result.
62
while the variance of his net payoff is
var [ − ] = E£( + (+ )− −)
2¤= E
£()
2¤= 22 (A.7)
Inserting (A.6) and (A.7) in (A.5), we may write the (monotonic transformation of the)
agent’s expected utility as
= +− 2
2− 22
2 (A.8)
To maximize his expected utility, the agent must meet the first-order condition =
0. From (A.8) this implies that his optimal effort is given by
=
(A.9)
The principal’s realized utility level is
= (− ) 0 0 00 0 (A.10)
where the utility function (·) displays constant absolute risk aversion with a coefficientof risk aversion equal to . Eqs. (A.1) and (A.3) imply that the principal’s net payoff
− follows a normal distribution. Maximization of the principal’s expected utility is
thus equivalent to maximizing the utility function
= E [− ]−
2var [− ] 0 constant, (A.11)
where (A.1) and (A.3) yield
E [− ] = (1−) − (A.12)
and
var [− ] = (1−)22 (A.13)
Substituting (A.9), (A.12) and (A.13) in (A.11), we may write the principal’s expected
utility as
=(1−)
− − 2 (1−)
2
2 (A.14)
The principal maximizes with respect to the pay scheme parameters and , subject
to the participation constraint that he must secure the agent an expected utility level at
least as high as the exogenous (expected) utility ∗ obtainable in the agent’s best available
outside option. Inserting (A.9) in (A.8), we may write this participation constraint as
+2
2− 22
2≥ ∗ (A.15)
In the principal’s optimum the participation constraint will be binding, since otherwise he
could reduce , thereby increasing his utility without inducing the agent to exercise the
63
outside option. From (A.14) and (A.15) we then get the principal’s Lagrangian, where
is the Lagrange multiplier associated with the participation constraint:
=(1−)
− − 2 (1−)
2
2+
µ +
2
2− 22
2− ∗
¶ (A.16)
The principal’s first-order conditions are
= 0 =⇒ = 1 (A.17)
= 0 =⇒ 1− 2
+2 (1−) + ³− 2
´= 0 (A.18)
The optimal value of stated in eq. (5) in section 5.2 follows from (A.17) and (A.18).
Once is found, we can derive from (A.15), given that the participation constraint
must be satisfied with equality in the principal’s optimum.
Multiple agents
We now abstract from stochastic influences on output. Instead we assume that there
are two agents, 1 and 2, whose efforts 1 and 2 contribute equally to total service output:
= 1 + 2 (A.19)
Total output is still fully observable, but each agent’s contribution to total output can
only be measured with a stochastic, symmetric normally distributed error, . Hence the
measured outputs of the two agents (indicated by hat superscripts) are
b1 = 1 + b2 = 2 − ∼ ¡0 2
¢ (A.20)
The individual agent is paid according to his measured performance, so the income of
agent () is
= +b = 1 2 (A.21)
For both agents the cost of effort is given by (A.4), and they both have the utility
function (A.2) with constant absolute risk aversion. Hence they both have an expected
utility function of the form (A.5), where (A.20) and (A.21) imply that
E [ − ] = + − 22 var [ − ] = 22 = 1 2 (A.22)
Inserting (A.22) in (A.5) and maximizing each agent’s expected utility with respect to
his effort, we get
= =
(A.23)
Thus both agents will exert the same effort level because they both face the same pay
scheme.
64

Since total output is deterministic, the principal obtains the safe payoff
= − 1 − 2
= 1 + 2 − 2 − (1 + 2)
=2
(1−)− 2 (A.24)
where we have used (A.21) and (A.23) to arrive at the bottom line in (A.24). The
participation constraint requires that the individual agent be offered an expected utility
at least equal to his outside option ∗. From (A.5), (A.22) and (A.23) it follows that
the participation constraint takes exactly the same form as (A.15). The principal will
therefore wish to maximize (A.24) with respect to and , subject to (A.15). The
first-order conditions for the solution to this problem yield eq. (9) in section 5.2.
Teamwork with a collective bonus scheme
Consider next a situation with a team of agents whose efforts contribute equally to
an output which is subject to a stochastic influence. Specifically, total output is
=
X=1
+ ∼ ¡0 2
¢ (A.25)
Total output is still fully observable by the principal, but he cannot pay the individual
agent according to the latter’s contribution to total output, either because the individual
contribution is unobservable or because an egalitarian norm dictates that all agents be
paid the same wage. Instead, the principal pays each agent a wage consisting of a fixed
component plus a bonus which is proportional to the average output per team member
():
= = +
(A.26)
The individual agent’s cost of effort and his expected utility are still given by (A.4) and
(A.5), respectively, but (A.26) implies that the mean and the variance of his net payoff
are
E [ − ] = +
− 2
2 var [ − ] =
³
´22 ∀ (A.27)
Inserting (A.27) into (A.5) and maximizing with respect to , we find that all agents will
want to exert the same amount of effort given by
= =
(A.28)
The principal’s net payoff is −. From (A.26) and (A.28) we obtain the mean and
the variance of this payoff:
E [− ] =(1−)
− (A.29)
var [− ] = (1−)22 (A.30)
65
With constant absolute risk aversion, it follows from (A.29) and (A.30) that the principal’s
expected utility is
= E [− ]−
2var [− ]
=(1−)
− − (1−)
22
2 (A.31)
Using (A.4), (A.5), (A.27) and (A.28), we may write the representative team member’s
participation constraint as
= E [ − ]−
2var [ − ] ≥ ∗ =⇒
+2
µ1− 1
2
¶− 22
22≥ ∗ (A.32)
The principal maximizes (A.31) with respect to and , subject to (A.32). From the
first-order conditions for a maximum we obtain eq. (12) in section 5.2.
Multiple tasks
Let us return to the case with only one agent and one principal, but let us assume that
the agent spends efforts 1 and 2 on two different tasks generating stochastic outputs
1 and 2. For simplicity, we assume that the stochastic components in the two outputs
have the same variance, 2, and that they follow independent normal distributions:
1 = 1 + 1 1 ∼ ¡0 2
¢ (A.33a)
2 = 2 + 2 2 ∼ ¡0 2
¢ E [12] = 0 (A.33b)
The agent’s performance pay is a linear function of the outputs resulting from his efforts,
so his income is
= +11 +22
= +1 (1 + 1) +2 (2 + 2) (A.34)
Following Dixit (2002, p. 705), we assume that the agent’s total cost of effort is
= (21 + 22 + 212)
2 (A.35)
Hence the marginal costs of effort in the two tasks are
1 = (1 + 2) 2 = (2 + 1) (A.36)
If 0, the marginal cost of effort in one task increases with the amount of effort spent
on the other task. In this case the tasks are said to be substitutes. Conversely, if 0,
the two tasks are said to be complements, since the marginal cost of effort in one task
will then decline as the agent spends more effort on the other task.
66

The agent’s expected utility is still given by (A.5), so by using (A.33) through (A.35)
we find his expected utility to be
= E [ − ]−
2var [ − ]
= +11 +22 − (21 + 22 + 212)
2− 2 (2
1 +22)
2(A.37)
By maximizing (A.37) with respect to 1 and 2, we can use the first-order conditions to
find the agent’s optimal efforts:
1 =1 − 2
(1− 2) 2 =
2 − 1
(1− 2) (A.38)
The principal cares about the total output produced by the agent, so his realized
net payoff is 1 + 2 − . Using (A.33) and (A.34) and maintaining the assumption of
constant absolute risk aversion, we can write the principal’s expected utility as
= E [1 + 2 − ]−
2var [1 + 2 − ]
= (1−1) 1 + (1−2) 2 − − 2£(1−1)
2+ (1−2)
2¤
2 (A.39)
With an outside option ∗, it follows from (A.37) that the agent’s participation constraint
is
= +11 +22 − (21 + 22 + 212)
2− 2 (2
1 +22)
2≥ ∗ (A.40)
The principal maximizes (A.39) subject to (A.40), accounting for the effects of his choice
of 1 and 2 on the agent’s efforts (cf. (A.38)). The principal’s first-order conditions for
the optimal choice of , 1 and 2 can be shown to imply the following relationships:
2 (1−1)− 21+1
1
+2
1
− 1
µ1
1
+ 2
1
¶− 2
µ2
1
+ 1
1
¶= 0
(A.41)
2 (1−2)− 22+1
2
+2
2
− 1
µ1
2
+ 2
2
¶− 2
µ2
2
+ 1
2
¶= 0
(A.42)
From (A.38) we have
1
1
=2
2
=1
(1− 2)
2
1
=1
2
=−
(1− 2) (A.43)
Inserting (A.43) in (A.41) and (A.42) and using the fact that (1− 2) = (1 + ) (1− ),
we obtain
2 (1−1)− 21 +1
(1 + )
µ1 +
2 −1
1−
¶= 0 (A.44)
2 (1−2)− 22 +1
(1 + )
µ1 +
1 −2
1−
¶= 0 (A.45)
67

Solving (A.44) and (A.45) for 1 and 2, we find that 1 = 2 = , where is given
by eq. (16) in section 5.2.
Multiple principals and tasks
Consider finally a scenario where one agent carries out two tasks for two different
principals, and . The two outputs 1 and 2 produced by the agent are still given
by (A.33), but now his total income consists of the sum of the incomes and
received from the two principals. Both principals pays the agent according to a linear
pay scheme, but the coefficients in the reward schemes differ because the principals have
different preferences for the two outputs. Hence we have
= + (A.46)
= +1 1 +
2 2 (A.47)
= +1 1 +
2 2 (A.48)
The two tasks performed by the agent are neither substitutes nor complements, i.e., the
parameter in (A.35) is zero, so the agent’s cost of effort is
= (21 + 22)
2 (A.49)
The agent’s expected utility is still described by (A.5). Using this along with (A.33) and
(A.46) through (A.49), we thus find the agent’s expected utility to be
= E [ − ]−
2var [ − ] =⇒
= + +¡1 +
1
¢1 +
¡2 +
2
¢2 − (21 + 22)
2
−2
h¡1 +
1
¢2+¡2 +
2
¢2i2
(A.50)
From the first-order conditions 1 = 0 and 2 = 0 we obtain the agent’s
optimal efforts:
1 =1 +
1
2 =
2 +
2
(A.51)
Substituting (A.51) in (A.50), we can write the agent’s participation constraint as
++
¡1 +
1
¢22
+
¡2 +
2
¢22
−2
h¡1 +
1
¢2+¡2 +
2
¢2i2
≥ ∗ (A.52)
Principal cares only about the output 1 from task 1, so from (A.33), (A.47) and
(A.51) we find his expected utility to be
= E£1 −
¤−
2var£1 −
¤=
¡1−
1
¢1 −
2 2 − −2
h¡1−
1
¢2+¡2
¢2i2
=⇒
68

=¡1−
1
¢µ1 +
1
¶−
2
µ2 +
2
¶− −
2h¡1−
1
¢2+¡2
¢2i2
(A.53)
The principals play Nash against each other. Thus principal maximizes (A.53) with
respect to , 1 and
2 subject to (A.52), taking , 1 and
2 as given. The
first-order conditions for the solution to this problem can be shown to imply that
1 =
1 + 2¡−
1
¢1 + 2 (+)
2 =
−22
1 + 2 (+) (A.54)
In contrast to principal , principal cares only about the output 2, so his realized
net payoff is 2 − . Hence solves a problem symmetric to that of yielding
1 =
−21
1 + 2 (+)
2 =1 + 2
¡−
2
¢1 + 2 (+)
(A.55)
From (A.54) and (A.55) one finds
1 =
(1 + 2) [1 + 2 (+)]
[1 + 2 (+)]2 − (2)2 (A.56)
1 =
−2 (1 + 2)
[1 + 2 (+)]2 − (2)2 (A.57)
According to (A.56) and (A.57), the agent’s total bonus from producing an extra unit of
1 is
1 ≡ 1 +
1 =(1 + 2)
2
≡ £1 + 2 (+)
¤2 − ¡2¢2 (A.58)
Calculating the denominator in (A.58), we obtain
=¡1 + 2
¢ ¡1 + 2+ 22
¢ (A.59)
We may now substitute (A.59) into (A.58) to get
1 =1 + 2
1 + 2 (+) + 2 (A.60)
which is identical to eq. (19) in section 5.2. Because of the symmetry properties of the
model, 2 ≡ 2 +
2 is found from (A.56) and (A.57) to be identical to the expression
in (A.60).
69
APPENDIX B
A SIMPLE MODEL OF OUTSOURCING
This appendix describes the model of outsourcing of public service provision discussed
in section 6.2.36 We start by analyzing the situation with in-house public production of
the service considered. Then we compare that situation to a scenario where the service
is produced by a private firm paid by the government.
In-house provision
The public service worker
The government principal pays an agent (a public sector worker or a group of identical
workers) to provide some service to citizens. The (quality-adjusted) amount of service
output is a deterministic linear function of the effort exerted by the agent:
= (B.1)
The agent’s cost of effort () is
=2
2 0 (B.2)
and his level of utility () is a concave function of his net payoff, :
= () 0 0 00 0 (B.3)
The principal does not observe the amount of service output on a continuous basis,
but with some frequency (0 1) per period he undertakes an inspection enabling
him to verify the amount of service delivered to citizens. If the observed actual service
falls short of some exogenous benchmark level ∗, the agent (the service worker) is
penalized by a fine which is proportional to the service shortfall. Symmetrically, if the
actual service is found to exceed the benchmark level, the service worker is rewarded by
a proportional bonus. Thus we have
= (∗ − ) ∗ (B.4)
where is the total fine, and − is the bonus if ∗. The parameter is the
exogenous rate of penalty or reward which is assumed to exceed the marginal cost of
effort at the benchmark service level ∗ (note from (B.1) and (B.2) that this marginal
effort cost is ∗). In addition to the fine or bonus, the agent’s income includes a fixed
wage component, . The agent’s total payoff is his income minus his cost of effort.
Hence
= − − with probability = − with probability 1− (B.5)
36The model is a modified version of the one set up in Knabe and Sørensen (2006).
70
From (B.1) through (B.5) it follows that the agent’s expected utility is
=
µ − 2
2− (∗ − )
¶+ (1− )
µ − 2
2
¶ (B.6)
The agent chooses his effort so as to maximize his expected utility. According to (B.6)
the necessary and sufficient conditions for the solution to this problem are
= 0 =⇒
0µ − 2
2− (∗ − )
¶( − )− (1− )0
µ − 2
2
¶ = 0 (B.7)
2 ()2 0 (B.8)
The first-order condition (B.7) can be written as an implicit function of the form ( ) =
0 where
= −
= − 2
2 ()2 (B.9)
The second-order condition (B.8) implies that the denominator in (B.9) is negative. From
the expression on the left-hand side of (B.7) we find the numerator to be
2
= 0
µ − 2
2− (∗ − )
¶( − ) + 0
µ − 2
2
¶ (B.10)
In an economically meaningful equilibrium with positive marginal utility and positive
effort (i.e., 0 (·) 0 and 0), it follows from (B.7) that in the agent’s optimum
(since 0 1). According to (B.10) we can therefore be sure that 2 0.
From (B.8) and (B.9) we then get 0. In other words, the agent’s optimal effort
is a monotonously increasing function of the monitoring intensity , that is:
= () 0 0 (B.11)
By choosing an appropriate value of , the principal can therefore ensure any desired
service level = .
Government expenditure under in-house provision
Suppose the principal chooses the monitoring intensity ∗ that will generate the bench-
mark service level ∗, i.e., the value of satisfying ∗ = ∗ = (∗). The first-order
condition (B.7) then simplifies to
∗ ( − ∗)− (1− ∗) ∗ = 0 ⇐⇒
∗ =∗
(B.12)
For the purpose of comparing to a scenario with outsourcing, we want to identify the
public expenditure necessary to generate the benchmark service level ∗ under in-house
71
provision. We assume that, in addition to the wage paid to the service worker, the
government must also pay a fixed overhead cost to be able to able to deliver the public
service. Moreover, we assume that the government incurs a constant marginal cost
whenever it increases the monitoring intensity . Hence the government’s total cost of
in-house provision of the benchmark service level is
= + + ∗ (B.13)
Note that the government budget in (B.13) does not include any revenue from fines or
expenses on bonuses since these will be zero when the benchmark service level is attained.
To attract a public sector worker, the government must pay him a wage that ensures
him an expected utility at least as high as the utility (∗) he would get from the
(exogenous) payoff ∗ he could obtain in the private labour market. When = ∗, we
have = ∗ and = 0, so the worker’s utility from public employment will be ( − )
whether he is inspected or not. Using (B.2), we can then easily calculate the minimum
wage the government must offer to attract the service worker (the wage ensuring that
− = ∗):
= ∗ + (∗)2
2 (B.14)
Inserting (B.12) and (B.14) into (B.13), we get
= + ∗ + (∗)2
2+
∗
(B.15)
Below we will compare the spending level in (B.15) to that emerging under outsourcing.
Outsourcing
The private entrepreneur
Under in-house provision the public service worker has no incentive to exert effort to
reduce the fixed cost of service provision since this does not affect his pay. But when
service delivery is outsourced to a private entrepreneur, the entrepreneur will have such
an incentive since the cost saving will increase his profit. We therefore assume that, in
addition to the effort 1 spent on servicing the citizens, the entrepreneur may also exert
an effort 2 on activities that will reduce his overhead cost of service production.
Specifically, we assume that this overhead cost varies negatively and (within the relevant
range of variation) linearly with 2:
= − 2 0 0 (B.16)
Parallel to eq. (A.35) in appendix A, we assume that the marginal cost of effort ex-
erted on one task may affect the marginal cost of performing the other task so that the
entrepreneur’s total cost of effort is
= (21 + 22 + 212)
2 (B.17)
72
As in appendix A, the parameter may be either positive or negative, depending on
whether the two tasks are substitutes or complements.
The level of service provided to citizens is now = 1. The government principal
monitors the performance of the entrepreneur with the frequency and imposes a fine
or pays a bonus in accordance with (B.4) if the observed service level deviates from the
benchmark level ∗. Hence the entrepreneur’s payoffs in the two possible states are
= − − − (∗ − 1) with probability (B.18a)
= − − with probability 1− (B.18b)
where is a fixed payment and is the rate of penalty or bonus, as in the case of
in-house provision. The entrepreneur’s realized utility is (), so from (B.16) through
(B.18) we find his expected utility () to be
=
µ − + 2 − (21 + 22 + 212)
2− (∗ − 1)
+(1− )
µ − + 2 − (21 + 22 + 212)
2
¶ (B.19)
The entrepreneur maximizes with respect to 1 and 2. Using (B.19), we may write
the entrepreneur’s first-order conditions in the form
1= 0 =⇒
1 (1 2 ) = 0 (B.20)
2= 0 =⇒
2 (1 2 ) = 0 (B.21)
where
1 (1 2 ) = 0
µ − + 2 − (21 + 22 + 212)
2− (∗ − 1)
¶[ − (1 + 2)]
− (1− )0µ − + 2 − (21 + 22 + 212)
2
¶ (1 + 2) (B.22)
2 (1 2 ) = 0
µ − + 2 − (21 + 22 + 212)
2− (∗ − 1)
¶[− (2 + 1)]
+ (1− )0µ − + 2 − (21 + 22 + 212)
2
¶[− (2 + 1)] (B.23)
The system (B.20) and (B.21) implicitly defines 1 and 2 as functions of . Differentiating
the system and solving by Cramer’s rule, we find that37
1
=− (
1 ) (2 2)
∆ (B.24)
37When deriving (B.24), I use the fact that 2 = 0, since (B.21) and (B.23) imply that −
(2 + 1) = 0
73
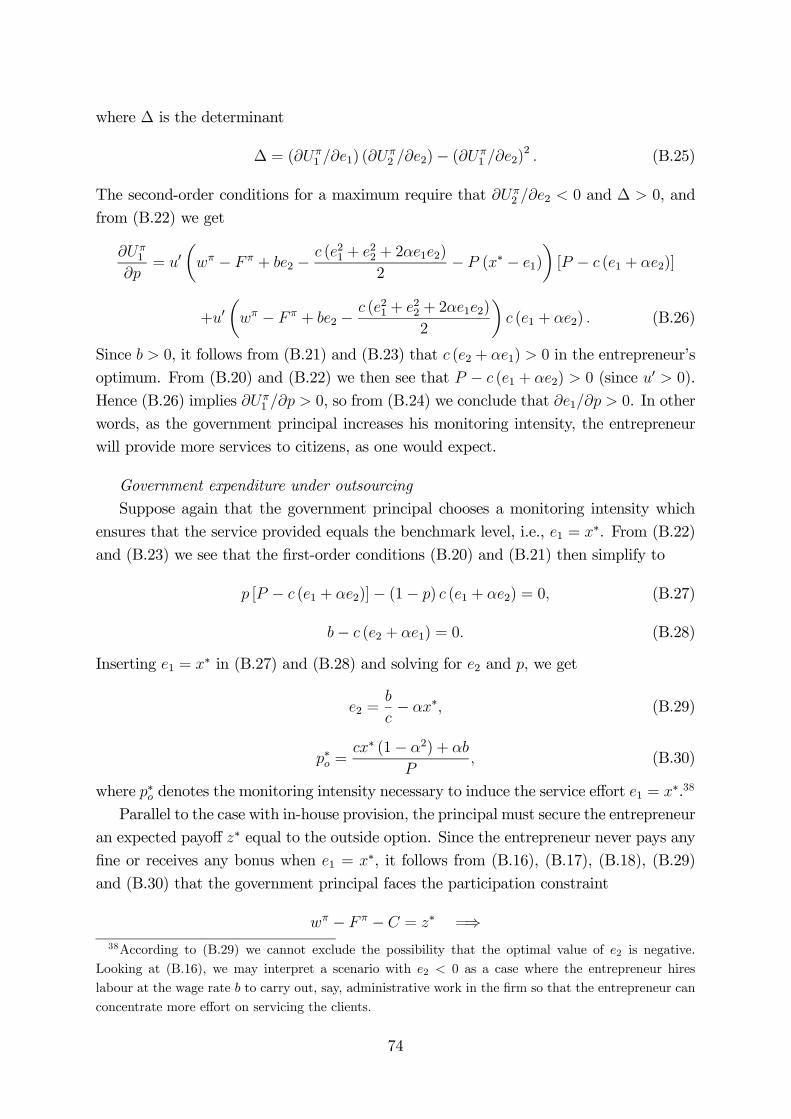
where ∆ is the determinant
∆ = (1 1) (
2 2)− (
1 2)2 (B.25)
The second-order conditions for a maximum require that 2 2 0 and ∆ 0, and
from (B.22) we get
1
= 0
µ − + 2 − (21 + 22 + 212)
2− (∗ − 1)
¶[ − (1 + 2)]
+0µ − + 2 − (21 + 22 + 212)
2
¶ (1 + 2) (B.26)
Since 0, it follows from (B.21) and (B.23) that (2 + 1) 0 in the entrepreneur’s
optimum. From (B.20) and (B.22) we then see that − (1 + 2) 0 (since 0 0).
Hence (B.26) implies 1 0, so from (B.24) we conclude that 1 0. In other
words, as the government principal increases his monitoring intensity, the entrepreneur
will provide more services to citizens, as one would expect.
Government expenditure under outsourcing
Suppose again that the government principal chooses a monitoring intensity which
ensures that the service provided equals the benchmark level, i.e., 1 = ∗. From (B.22)
and (B.23) we see that the first-order conditions (B.20) and (B.21) then simplify to
[ − (1 + 2)]− (1− ) (1 + 2) = 0 (B.27)
− (2 + 1) = 0 (B.28)
Inserting 1 = ∗ in (B.27) and (B.28) and solving for 2 and , we get
2 =
− ∗ (B.29)
∗ =∗ (1− 2) +
(B.30)
where ∗ denotes the monitoring intensity necessary to induce the service effort 1 = ∗.38
Parallel to the case with in-house provision, the principal must secure the entrepreneur
an expected payoff ∗ equal to the outside option. Since the entrepreneur never pays any
fine or receives any bonus when 1 = ∗, it follows from (B.16), (B.17), (B.18), (B.29)
and (B.30) that the government principal faces the participation constraint
− − = ∗ =⇒38According to (B.29) we cannot exclude the possibility that the optimal value of 2 is negative.
Looking at (B.16), we may interpret a scenario with 2 0 as a case where the entrepreneur hires
labour at the wage rate to carry out, say, administrative work in the firm so that the entrepreneur can
concentrate more effort on servicing the clients.
74
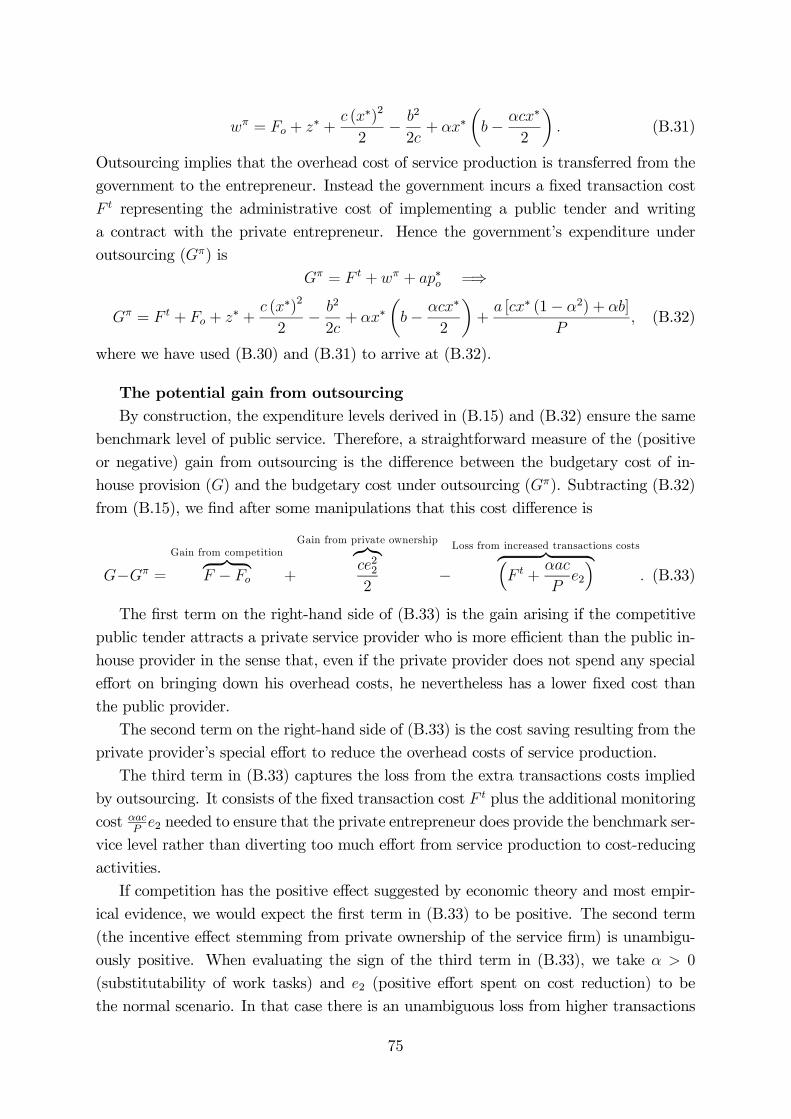
= + ∗ + (∗)2
2− 2
2+ ∗
µ− ∗
2
¶ (B.31)
Outsourcing implies that the overhead cost of service production is transferred from the
government to the entrepreneur. Instead the government incurs a fixed transaction cost
representing the administrative cost of implementing a public tender and writing
a contract with the private entrepreneur. Hence the government’s expenditure under
outsourcing () is
= + + ∗ =⇒
= + + ∗ + (∗)2
2− 2
2+ ∗
µ− ∗
2
¶+
[∗ (1− 2) + ]
(B.32)
where we have used (B.30) and (B.31) to arrive at (B.32).
The potential gain from outsourcing
By construction, the expenditure levels derived in (B.15) and (B.32) ensure the same
benchmark level of public service. Therefore, a straightforward measure of the (positive
or negative) gain from outsourcing is the difference between the budgetary cost of in-
house provision () and the budgetary cost under outsourcing (). Subtracting (B.32)
from (B.15), we find after some manipulations that this cost difference is
− =
Gain from competitionz }| { − +
Gain from private ownershipz}|{222
−Loss from increased transactions costsz }| {³
+
2
´ (B.33)
The first term on the right-hand side of (B.33) is the gain arising if the competitive
public tender attracts a private service provider who is more efficient than the public in-
house provider in the sense that, even if the private provider does not spend any special
effort on bringing down his overhead costs, he nevertheless has a lower fixed cost than
the public provider.
The second term on the right-hand side of (B.33) is the cost saving resulting from the
private provider’s special effort to reduce the overhead costs of service production.
The third term in (B.33) captures the loss from the extra transactions costs implied
by outsourcing. It consists of the fixed transaction cost plus the additional monitoring
cost 2 needed to ensure that the private entrepreneur does provide the benchmark ser-
vice level rather than diverting too much effort from service production to cost-reducing
activities.
If competition has the positive effect suggested by economic theory and most empir-
ical evidence, we would expect the first term in (B.33) to be positive. The second term
(the incentive effect stemming from private ownership of the service firm) is unambigu-
ously positive. When evaluating the sign of the third term in (B.33), we take 0
(substitutability of work tasks) and 2 (positive effort spent on cost reduction) to be
the normal scenario. In that case there is an unambiguous loss from higher transactions
75
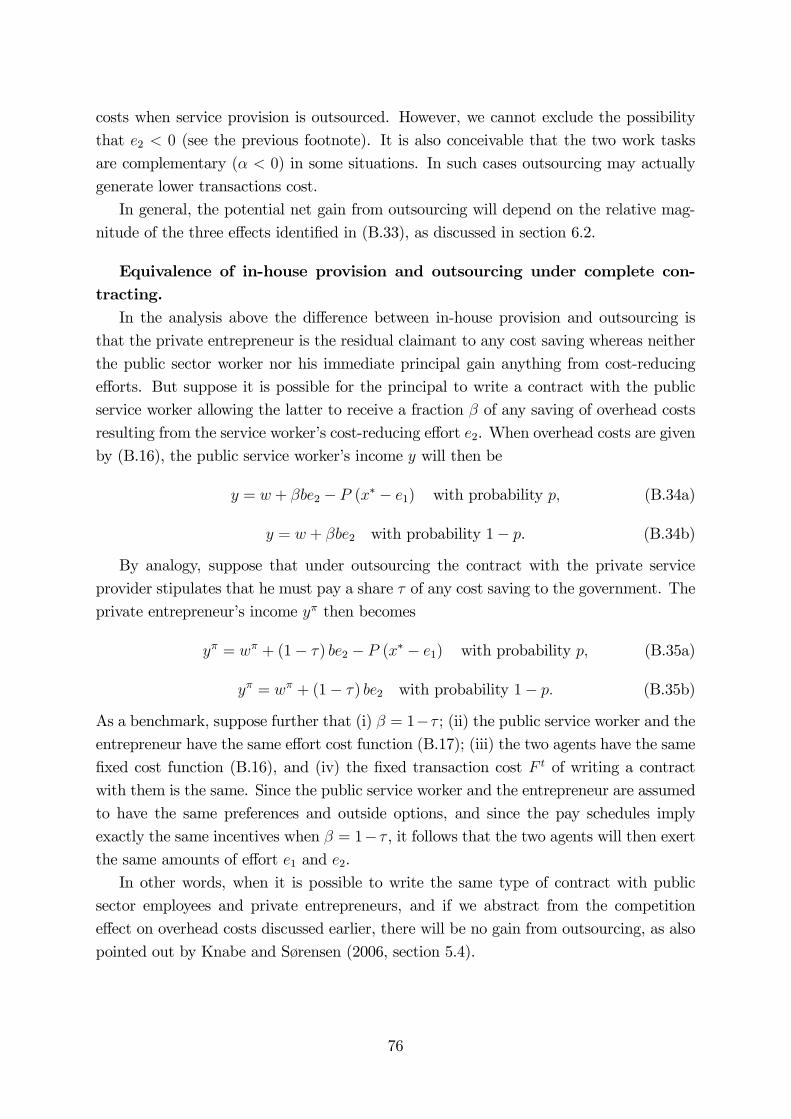
costs when service provision is outsourced. However, we cannot exclude the possibility
that 2 0 (see the previous footnote). It is also conceivable that the two work tasks
are complementary ( 0) in some situations. In such cases outsourcing may actually
generate lower transactions cost.
In general, the potential net gain from outsourcing will depend on the relative mag-
nitude of the three effects identified in (B.33), as discussed in section 6.2.
Equivalence of in-house provision and outsourcing under complete con-
tracting.
In the analysis above the difference between in-house provision and outsourcing is
that the private entrepreneur is the residual claimant to any cost saving whereas neither
the public sector worker nor his immediate principal gain anything from cost-reducing
efforts. But suppose it is possible for the principal to write a contract with the public
service worker allowing the latter to receive a fraction of any saving of overhead costs
resulting from the service worker’s cost-reducing effort 2. When overhead costs are given
by (B.16), the public service worker’s income will then be
= + 2 − (∗ − 1) with probability (B.34a)
= + 2 with probability 1− . (B.34b)
By analogy, suppose that under outsourcing the contract with the private service
provider stipulates that he must pay a share of any cost saving to the government. The
private entrepreneur’s income then becomes
= + (1− ) 2 − (∗ − 1) with probability (B.35a)
= + (1− ) 2 with probability 1− (B.35b)
As a benchmark, suppose further that (i) = 1− ; (ii) the public service worker and theentrepreneur have the same effort cost function (B.17); (iii) the two agents have the same
fixed cost function (B.16), and (iv) the fixed transaction cost of writing a contract
with them is the same. Since the public service worker and the entrepreneur are assumed
to have the same preferences and outside options, and since the pay schedules imply
exactly the same incentives when = 1− , it follows that the two agents will then exert
the same amounts of effort 1 and 2.
In other words, when it is possible to write the same type of contract with public
sector employees and private entrepreneurs, and if we abstract from the competition
effect on overhead costs discussed earlier, there will be no gain from outsourcing, as also
pointed out by Knabe and Sørensen (2006, section 5.4).
76
REFERENCES
Andersen, L.B. and M. Jakobsen (2011). Does ownership matter for the provision of profes-
sionalized services? Hip operations at publicly and privately owned clinics in Denmark. Public
Administration 89: 956-974.
Andersen, L.B. and L.H. Pedersen (2013). Does ownership matter for employee motivation
when occupation is controlled for? International Journal of Public Administration 36: 840-856.
Andersson,. F. and H. Jordahl (2011). Outsourcing public services: ownership, commpeti-
tion, quality and contracting. IFN Working Paper No. 874, Research Institute of Industrial
Economics, Stockholm.
Ballanti, D., R. Dispotico, F. Porcelli and F. Vidoli (2014). A simple four quadrants model
to monitor the performance of local governments. Paper presented at the CESifo workshop on
“Reforming the Public Sector” at Venice International University, 25-26 July 2014.
Baker, G.P. (1992). Incentive contracts and performance measurement. Journal of Political
Economy 100: 598-614.
Barzelay, M. (2000). The New Public Management. University of California Press, Berkeley,
CA.
Baumol, W.J. (1967). Macroeconomics of unbalanced growth: The anatomy of urban crisis.
American Economic Review 57: 415-426.
Behn, R.D. (1995). The Big Questions of Public Management. Public Administration Review
55: 313-324.
Behn, R.D. (1998). The New Public Management paradigm and the search for democratic
accountability. International Public Management Journal 1: 131-164.
Behn, R.D. (2002). The psychological barriers to performance management: or why isn’t every-
one jumping on the performance-management bandwagon? Public Performance & Management
Review 26: 5-25.
Behn, R.D. (2003). Why Measure Performance? Different Purposes Require Different Measures.
Public Administration Review 63: 586-606.
Belfield, C. and H.M. Levin (2005). Vouchers and public policy: when ideology trumps evidence.
American Journal of Education 111: 548-567.
Bénabou, R. and J. Tirole (2003). Intrinsic and Extrinsic Motivation. Review of Economic
Studies 70: 489—520.
77
Besley, T. and A. Case (1995a). Incumbent behaviour: vote seeking, tax setting and yardstick
competition. American Economic Review 85: 25—45.
Besley, T. and A. Case (1995b). Does electoral accountability affect economic policy choices?
Evidence from gubernatorial term limits. Quarterly Journal of Economics 110: 769—798.
Besley, T. and M. Ghatak (2003). Incentives, choice, and accountability in the provision of
public services. Oxford Review of Economic Policy 19: 235-249.
Besley, T. and M. Ghatak (2005). Competition and incentives with motivated agents. American
Economic Review 95: 616-636.
Binderkrantz, A.S. and J.G. Christensen (2009). Governing Danish Agencies by Contract: From
Negotiated Freedom to the Shadow of Hierarchy. Journal of Public Policy 29: 55 - 78.
Binderkrantz, A.S. and J.G. Christensen (2012). Agency performance and executive pay in
government: an empirical test. Journal of Public Administration Research and Theory 22:
31-54.
Bogetoft, P. (2012). Performance Benchmarking - Measuring and Managing Performance.
Springer, New York.
Bordignon, M., F. Cerniglia and F. Revelli (2003). In search of yardstick competition: a spatial
analysis of Italian municipality property tax setting. Journal of Urban Economics 54: 199— 217.
Bovenberg, A.L. and P.B. Sørensen (2004). Improving the equity-efficiency trade-off: Manda-
tory savings accounts for social insurance. International Tax and Public Finance 11: 507-529.
Bovenberg, A.L., M.I. Hansen and P.B. Sørensen (2012). Efficient redistribution of lifetime
income through welfare accounts. Fiscal Studies 33: 1-37.
Boyne, G.A. (2002). Public and private management: what’s the difference? Journal of Man-
agement Studies 39: 97-122.
Bunse, S. and V. Fritz. Making public sector reforms work - Political and economic contexts,
incentives, and strategies. The World Bank, Policy Research Working Paper 6174, August 2012.
Buurman, M., J. Delfgaauw, R. Dur and S. Van den Bossche (2012). Public sector employees:
risk averse and altruistic? Journal of Economic Behavior & Organization 83: 279-291.
Cherchye, L., W. Moesen, N. Rogge, T. Van Puyenbroeck (2006). An Introduction To Benefit
of the Doubt Indicators. Social Indicators Research 82: 111-45.
Christensen, T. and P. Lægreid (2007). The Whole-of-Government approach to public sector
reform. Public Administration Review, November/December 2007: 1059-1066.
78
Danish Productivity Commission (2013). Overenskomster, Arbejdstid og Løndannelse i den
Offentlige Sektor (Collective Bargaining Agreements, Work Hours and Wage Formation in the
Public Sector). Background report, Copenhagen, September 2013.
Danish Productivity Commission (2014a). Offentlig-Privat Samarbejde (Public-Private Cooper-
ation). Analyserapport 6, Copenhagen, February 2014 (www.produktivitetskommissionen.dk).
Danish Productivity Commission (2014b). Det Handler om Velstand og Velfærd (Prosperity
and Welfare). Final report, Copenhagen, March 2014 (www.produktivitetskommissionen.dk).
Delfgaauw, J. and R. Dur (2008). Incentives and workers’ motivation in the public sector.
Economic Journal 118: 171-191.
Dixit, A. (2002). Incentives and organizations in the public sector: An interpretative review.
Journal of Human Resources 37: 696-727.
DREAM Modelling Group (2014). Produktiviteten i den offentlige sektor (Productivity in the
public sector). Working Paper, March 2014 (www.dreammodel.dk).
Dunleavy, P., H. Margetts, S. Bastow and J. Tinkler (2005). New Public Management is dead -
Long live Digital-Era Governance. Journal of Public Administration Research and Theory 16:
467-494.
Ekelund, R.B. and R.F. Hébert (1997). A History of Economic Theory and Method. Fourth
Edition. New York: McGraw-Hill.
Epple, D. and R.E. Romano (1998). Competition between private and public schools, vouchers,
and peer-group effects. American Economic Review 88: 33-62.
Francois, P. (2000). ‘Public service motivation’ as an argument for government provision.
Journal of Public Economics 78: 275-299.
Frey, B. (1997). A constitution for knaves crowds out public virtues. Economic Journal 107:
1043-1053.
Frey, B. and R. Jegen (2001). Motivation crowding theory. Journal of Economic Surveys 15:
589-611.
Gneezy, U., S. Meier and P. Rey-Biel (2011). When and why incentives (don’t) work to modify
behavior. Journal of Economic Perspectives 25: 191-209.
Gregg, P., P.A. Grout, A. Ratcliffe, S. Smith and F. Windmeijer (2011). How important is pro-
social behaviour in the delivery of public services? Journal of Public Economics 95: 758-766.
79
Gregory, R.G. and J. Borland (1999). Recent developments in public sector labor markets.
Chapter 53 in O. Ashenfelter and D. Card (eds.), Handbook of Labor Economics, Volume 3,
Elsevier Science B.V.
Greve, C. (2013). Ideas in public management reform for the 2010s. Digitalization, value
creation and involvement. Public Organization Review, November 2013, DOI 10.1007/s11115-
013-0253-8.
Gruening, G. (2001). Origin and theoretical basis of New Public Management. International
Public Management Journal 4: 1-25.
Hart, O., A. Shleifer and R. Vishny (1997). The proper scope of government: theory and an
application to prisons. Quarterly Journal of Economics 112: 1127-1161.
Heyndels, B. and J. Vuchelen (1998). Tax mimicking among Belgian municipalities. National
Tax Journal 51: 89— 101.
Hodge, G.A. and C. Greve (2009). PPPs: the passage of time permits a sober reflection.
Economic Affairs 29: 33-39.
Hodge, G.A., C. Greve and A.E. Boardman (eds.) (2010). International Handbook on Public
Private Partnership. UK: Edward Elgar Publishing.
Holmström, B. (1979). Moral hazard and observability. Bell Journal of Economics 10: 74-92.
Holmström, B. (1982). Moral hazard in teams. Bell Journal of Economics 13: 324-340.
Holmström, B. and P. Milgrom (1991). Multitask principal-agent analysis: incentive contracts,
asset ownership, and job design. Journal of Law, Economics and Organization 7 (special issue):
24-52.
Hood, C. (1989). Public Administration and public policy: intellectual challenges for the 1990s.
Australian Journal of Public Administration 48: 346-358.
Hood, C., O. James and C. Scott (2000). Regulation of government: has it increased, is it
increasing, should it be diminished? Public Administration 78: 283-304.
Hood, C. and G. Peters (2004). The middle-aging of New Public Management: into the age of
paradox? Journal of Public Administration Research and Theory 14: 267-282.
Høj, J., V. Galasso, G. Nicoletti and T-T. Dang (2006). The political economy of structural
reform: Empirical Evidence from OECD countries. OECD Economics Department Working
Papers, No. 501, OECD Publishing.
80
Jakobsen, M.L.F. and R.J. Sørensen (2012). Er offentligt ansatte (blevet) som de private? En
analyse af arbejdsmotivation i den offentlige og private sektor over tid. Politica 44: 26-46.
Jakobsen, M.L.F. and P.B. Mortensen (2014). Regelstaten. Væksten i danske love og bekendt-
gørelser 1989-2011. Copenhagen, Djoef Publishing.
Jensen, P.H. and R.E. Stonecash (2005). Incentives and the efficiency of public sector outsourc-
ing contracts. Journal of Economic Surveys 19: 767-787.
Kaufman, H. (1977). Red Tape: Its Origins, Uses, and Abuses. Washington, DC: Brookings
Institution.
Knabe, A. and P.B. Sørensen (2006). Outsourcing of public service provision: When is it more
efficient? Finnish Economic Papers 19: 3-15.
Kreps, D. M. (1997). Intrinsic motivation and extrinsic incentives. American Economic Review
87: 359-364.
Ladd, H.F. (2002). School vouchers: a critical view. Journal of Economic Perspectives 16: 3-24.
Lapsley, I. (2009). New Public Management: the cruellest invention of the human spirit?
ABACUS 45: 1-21.
Lazear, E.P. (1996). Performance pay and productivity. National Bureau of Economic Research
Working Paper 5672, July 1996.
Light, P. (1993). Monitoring Government. Washington, D.C.: The Brookings Institution.
Matheson, A. and H.-S. Kwon (2003). Public sector modernisation: a new agenda. OECD
Journal on Budgeting 3: 7-23.
Megginson, W.L. and J.M. Netter (2001). From state to market: a survey of empirical studies
on privatization. Journal of Economic Literature 39: 321-389.
Moynihan, D.P. and P.W. Ingraham (2003). Look for the silver lining: when performance-
based accountability systems work. Journal of Public Administration Research and Theory 13:
469-490.
National Performance Review (1993). From Red Tape to Results: Creating a Government that
Works Better and Costs Less. Washington, DC: U.S. Government Printing Office.
Nielsen, P.A. (2013). Public management, managerial authority, and public service perfor-
mance. Forthcoming in Journal of Public Administration Research and Theory.
OECD (2013). Government at a Glance 2013. OECD Publishing.
81
OECD and European Commission (2008). Handbook on Constructing Composite Indicators -
Methodology and User Guide. OECD.
Petersen, O.H. (2013). Offentlige-private partnerskaber (OPP). Notat om danske og inter-
nationale erfaringer med OPP. KORA, Det Nationale Institut for Kommuners og Regioners
Analyse og Forskning. København, april 2013.
Petersen, O.H. and U. Hjelmar (2014). Marketization of welfare services in Scandinavia: a
review of Swedish and Danish experiences. Scandinavian Journal of Public Administration 17:
3-20.
Pollitt, C., S. van Thiel and V. Homburg (2007). New Public Management in Europe. Man-
agement Online Review, October 2007 (www.moreexpertise.com).
Prendergast, C. (2011). What have we learnt about pay for performance? The Economic and
Social Review 42: 113-134.
Revelli, F. (2006). Performance rating and yardstick competition in social service provision.
Journal of Public Economics 90: 458—474.
Revelli, F. and P. Tovmo (2007). Revealed yardstick competition: Local government efficiency
patterns in Norway. Journal of Urban Economics 62: 121—134.
Rainey, H.G. and B. Bozeman (2000). Comparing public and private organizations: Empirical
research and the power of the a priori. Journal of Public Administration Research and Theory
10: 447-469.
Sandmo, A. (2014). The market in economics: behavioural assumptions and value judgments.
Paper presented at the conference on Markets, Ethics and Religion held at the Danish Academy
of Science and Letters, Copenhagen 6-7 February, 2014.
Savoie, D.J. (1995). What is wrong with the new public management? Canadian Public
Administration/Administration Publique Du Canada 38: 112-121.
Schaltegger, C. and D. Kuttel (2002). Exit, voice, and mimicking behaviour: evidence from
Swiss cantons. Public Choice 113:
1—23.
Silberberg, E. and W. Suen (2001). The Structure of Economics - A Mathematical Analysis.
Third Edition, McGraw-Hill.
Social Services Inspectorate (2002). Performance Ratings for Social Services in England. De-
partment of Health, London.
82
Stamp, J. (1927). The statistical verification of social and economic theory. The Sidney Ball
Lecture, November 5, 1926. Barnett House Papers, No. 10, London: Oxford University Press.
Tirole, J. (1994). The internal organization of government. Oxford Economic Papers 46: 1-29.
Tobin, J. (1970). On limiting the domain of inequality. Journal of Law and Economics 13:
263-277.
Van Thiel, S. and F.L. Leeuw (2002). The performance paradox in the public sector. Public
Performance and Management Review 25: 267-281.
Valkama, P. and S.J. Bailey (2001). Vouchers as an alternative public sector funding system.
Public Policy and Administration 16: 32-58.
Visser, J. (2006). Union membership in 24 countries. Monthly Labor Review, January 2006:
38-49.
Weber, M. (1947). The Theory of Social and Economic Organization (translation by A.M.
Henderson and T. Parsons). Glencoe, IL: The Free Press.
Wilson, W. (1887). The study of administration. Political Science Quarterly 2. Reprinted on
pp. 1l-24 in J. M. Shafritz and A. C. Hyde (eds.), Classics of Public Administration, 3rd ed.,
Pacific Grove, CA: Brooks/Cole.
Wittrup, J., K. Houlberg, A.L.T. Jordan and P. Bogetoft (2013). Kommunale serviceniveauer
og produktivitet. KORA, Det Nationale Institut for Kommuners og Regioners Analyse og
Forskning. Copenhagen (www.produktivitetskommissionen.dk).
Worthington, A.C. and B.E. Dollery (2000). An empirical survey of frontier efficiency measure-
ment techniques in local government. Local Government Studies 26: 23-52.
83