reflection extraction from sonic log waveforms using
TRANSCRIPT

Reflection extraction using K-L transform
Reflection extraction from sonic log waveforms usingKarhunen-Loeve transform
Junxiao Li, Kris Innanen, Guo Tao and Laurence R. Lines
ABSTRACT
Sonic reflection logging, a recently developed borehole geophysical scheme, is in prin-ciple capable of providing a clear view of structures up to 40 m away from well site the-oretically. Under acoustic well logging conditions, reflected wave signals used in sonicreflection logging are generally lost in the full waveform records, hidden by the dominantdirect waves (direct P- and S- waves, and the Stoneley wave). It is critical, therefore, toeffectively extract the reflection signals from the acoustic full waveforms in acoustic reflec-tion well logging data processing. The Karhunen-Loeve (KL) transformations combinedwith a band limiting filter is used to extract reflections of interest out of dominant directwaves. Based on energy difference of each wave component, the direct Stoneley wave,S wave and P wave are to be eliminated separately from high to low energy component.Therefore, the extracted reflections can then be used in migration so as to get a clear imageof the structures outside borehole.
INTRODUCTION
Sonic logging was first proposed to measure the speed of sound in a short interval ofrock traversed in a wellbore by using a transmitter and two receivers (Marguerite, 1940).However, it was not specifically used to measure P- and S-wave velocities until the 1960s(Kokesh et al., 1965). Usually, a recorded waveform generated by the transmitter consistsof not only refracted P- and S-wave, but also the Pseudo Rayleigh wave and the Stone-ley wave (Cheng and Toksöz, 1981). Compared with body waves (P- and S-waves) fromsurface seismic data, sonic P- and S-waves in the borehole (also called head waves) usu-ally exist as higher-frequency and shorter-wavelength. Pseudo Rayleigh waves, which onlyexist under the circumstance when the formation shear velocity is greater than the fluid ve-locity in the borehole (Tang and Cheng, 2004), is a surface wave characterized by ellipticalparticle motion and transmitted along the formation fluid interface. The Stoneley wave,which shows dispersive characteristics, is always slower than the head waves and tends todominate the full recorded waveform.
Conventionally, sonic logging technology uses direct sonic arrivals (P- and S-waves)to calculate formation P- and S- wave velocities (Kimball and Marzetta, 1984). It is alsoused to determine in suit attenuation from full waveform acoustic logs (Cheng et al., 1982).In 1989, Hornby discovered the influence of formation permeability on Stoneley waveslowness and proposed a method for determining formation permeability using these waves(Hornby et al., 1989).
Recently, secondary arrivals (reflections from structures outside the borehole) have in-creasingly been used for characterizing geological structures away from a wellbore (Hornby,1989b; Coates and Schoenberg, 1995; Chabot et al., 2001). This idea, however, was orig-inated almost 30 years ago when Hornby (Hornby, 1989a) presented data processing and
CREWES Research Report — Volume 27 (2015) 1
Li et. al
imaging methods involving secondary compression arrivals to form an image of the for-mation structures, in which a frequency-wavenumber transform is used for elimination ofthe direct arrivals and other sources of noise. However, the reflected waves are difficultto discover amongst the much higher amplitude head waves. Extraction of reflections isa key technological hurdle to practical use of sonic full waveforms. A combination ofFK and median filtering techniques has been tested for reflection extraction in single-wellimaging with acoustic reflection survey (Li et al., 2002). The median filter is used to re-move direct waves, and then the FK filter is applied to separate downgoing and upgoingreflections. Tang (2004), and Zheng et al. (2005) used the parametric prediction method toextract reflection waves from waveforms. When this did not achieve satisfactory results,a geometric spreading factor was introduced to modify the parametric prediction method(Bing et al., 2011). Independently, blind source separation (BSS) was introduced to bore-hole geophysics (Li et al., 2014a) to extract reflections. However, amplitude information ismissed using BSS, which makes it difficult to obtain ideal reflections by simply deductingthe extracted head waves by applying BSS from the full waveforms.
The Karhunen-Loeve (KL) transformation has been widely used in data analysis suchas imaging compression (Ahmed and Rao, 2012) and image coding (Andrews and Patter-son III, 1976). The KL transformation has also been used in seismic exploration for signal-to-noise improvement (Hermon and Mace, 1978), diffraction separation from reflections(Yedlin et al., 1987). Hsu (1990) used the KL transformation to sonic logging waveformsto extract direct waves. In his paper, a threshold detection scheme is first applied beforeusing KL transformation to exclude the unwanted signals. The KL transformation is ap-plied in acoustic reflection well logging to extract reflections from direct waves. However,when extracting the reflection signals, based on the energy difference (the direct waves havehigher energy than do the reflections), the unwanted signals can be eliminated by choos-ing a wide processing window, where a precise threshold is not necessary needed. Whenfractures exist around the borehole, a Stoneley signal will generate the so-called reflectionStoneley when traveling through fractures (Paillet and White, 1982; Hornby et al., 1989).Therefore, for the Stoneley wave elimination in field data, a band limit filter is instead used,because the reflected Stoneley can not be mitigated by KL transformation.
KARHUNEN-LOEVE(KL) TRANSFORM
The typical sonic log can be considered as a N-dimensional vector X = (X1, X2, · ··, Xn) , each vector Xi can be treated as a recorded waveform at specific depth. Therefore,N denotes the total number of recorded waveforms. The mean value of this N-dimensionalvector can be described as,
µX =1
N
N∑i=1
Xi (1)
Its covariance matrix thus can be written as,
CX = E{(Xi − µX)(Xi − µX)T} = 1
N
N∑i=1
(Xi − µX)(Xi − µX)T (2)
where, E denotes the mathematical expectation and T denotes the transpose of the matrix.
2 CREWES Research Report — Volume 27 (2015)
Reflection extraction using K-L transform
Assume λi(i = 1, 2, · · ·, N) being the eigenvalue of the covariance matrix with its corre-spondent eigenvector ei(i = 1, 2, · · ·, N), therefore, we have an orthogonal matrix of A,where A can be described as,
A =
eT1
eT2
eT3
· · ·
eTN
(3)
for λ1 >= λ2 >= λ3 >= · · · >= λN . Therefore, we have,
Y = A(X− µX)
Yi = eTi (Xi − µX) (4)
Yi denotes each component of Y . Because Ais an orthogonal matrix (A− = AT ), theN-dimensional vector X can be stated as,
X = ATY + µX (5)
Now, let’s consider the first k largest eigenvectors,
A =
eT1
eT2
eT3
· · ·
eTk
(6)
for λ1 >= λ2 >= λ3 >= · · · >= λk, k < N .
Then we have an approximate matrix of A,
X̂ = AkY + µX
X̂i = eTi Yi + µX (7)
CREWES Research Report — Volume 27 (2015) 3
Li et. al
where,X̂i denotes each component of X̂ . The mean square error between X and X̂ becomes,
ε(k) = E{(X− X̂)T (X− X̂)} = 1
N − k
N∑i=k+1
XiXTi (8)
In geophysical signal analysis, the received signal is usually considered as a zero meanvalue (Saggaf and Robinson, 2000), which means µX is equal to 0. Therefore, the meansquare error will be minimized when
CXei = λiei, i = k + 1, · · ·, N (9)
Therefore, we have
ε(k) =N∑
i=k+1
λi (10)
The approximated term in equation (7) thus can be used to reconstruct the original signal ifand only if the mean square error approximates 0. This means if the first k number of dom-inant eigenvectors are used to reconstruct the original information, the dominant energycan be reconstructed by this method, which is called KL transformation. In acoustic reflec-tion logging, most of the energy comes from the direct P- and S- waves, and the Stoneleywaves, which can be extracted from the full waveforms by means of KL transformation.Whereas the residuals excluding the direct waves should be the reflections, which can befurther used in acoustic reflection logging.
WAVE SEPARATION USING KL TRANSFORMATION
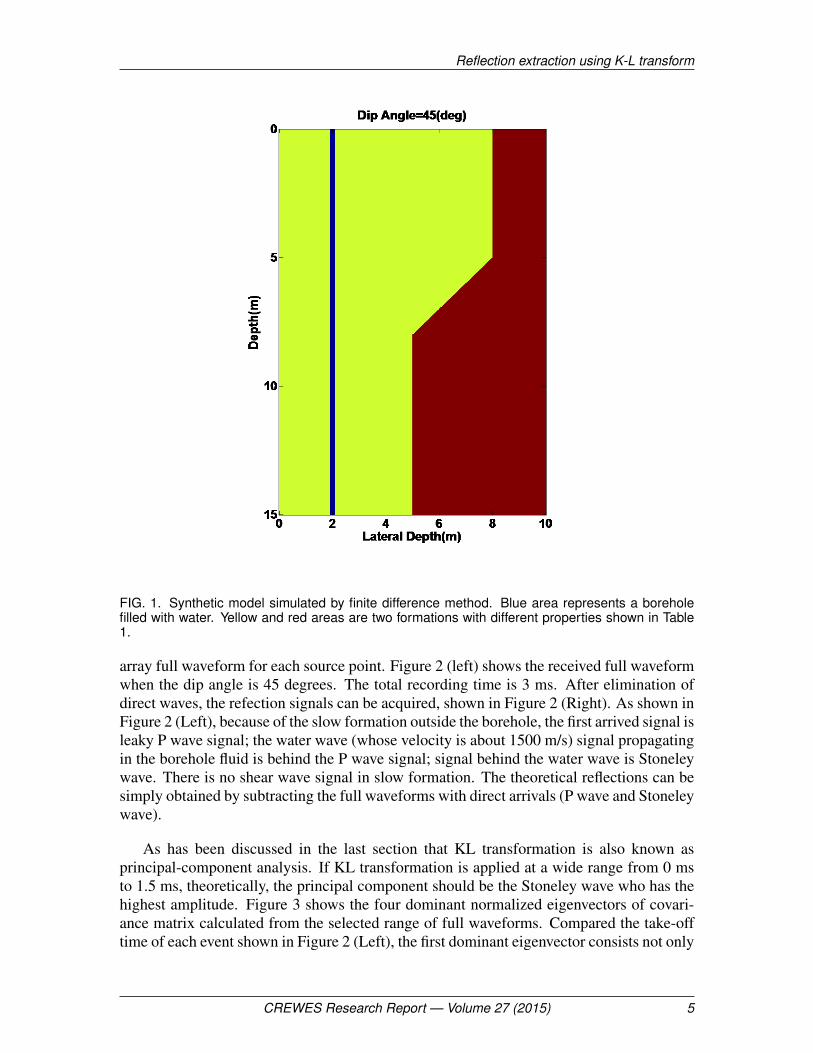
In order to demonstrate the reflection extraction from sonic logging by KL transforma-tion. A synthetic data simulated by finite difference method is used. The model (shown inFigure 1) is a fluid filled borehole model with a fault like interface lies on the one side ofthe borehole with a dip of 45 degrees. The model is 15 m high by 10 m long, in which thediameter of the borehole is 0.2 m. The borehole located at the lateral depth of 1m, is filledwith water, shown in blue color. The formation in red stands for medium I and that in yel-low is medium II. The acoustic reflection logging tool is designed to have a source-receiverspacing of 3 m, and a total number of thirteen receivers separated with an interval of 0.15m. The borehole and formation parameters are shown in Table 1.
Table 1. Parameters of fault-like model outside the borehole
c11 c13 c33 c44 ρ(g/cm3)Yellow 23.87 9.79 15.33 2.77 2.5
Borehole 2.25 2.25 2.25 0 1Red 40 13.55 40 13.225 2.5
Firstly, we move the source point from depth of 2 m to 10.85 m with altogether 60 shots,whose depth interval is 0.15 m. A 2D FD numerical modeling is used to acquire the acoustic
4 CREWES Research Report — Volume 27 (2015)
Reflection extraction using K-L transform
FIG. 1. Synthetic model simulated by finite difference method. Blue area represents a boreholefilled with water. Yellow and red areas are two formations with different properties shown in Table1.
array full waveform for each source point. Figure 2 (left) shows the received full waveformwhen the dip angle is 45 degrees. The total recording time is 3 ms. After elimination ofdirect waves, the refection signals can be acquired, shown in Figure 2 (Right). As shown inFigure 2 (Left), because of the slow formation outside the borehole, the first arrived signal isleaky P wave signal; the water wave (whose velocity is about 1500 m/s) signal propagatingin the borehole fluid is behind the P wave signal; signal behind the water wave is Stoneleywave. There is no shear wave signal in slow formation. The theoretical reflections can besimply obtained by subtracting the full waveforms with direct arrivals (P wave and Stoneleywave).
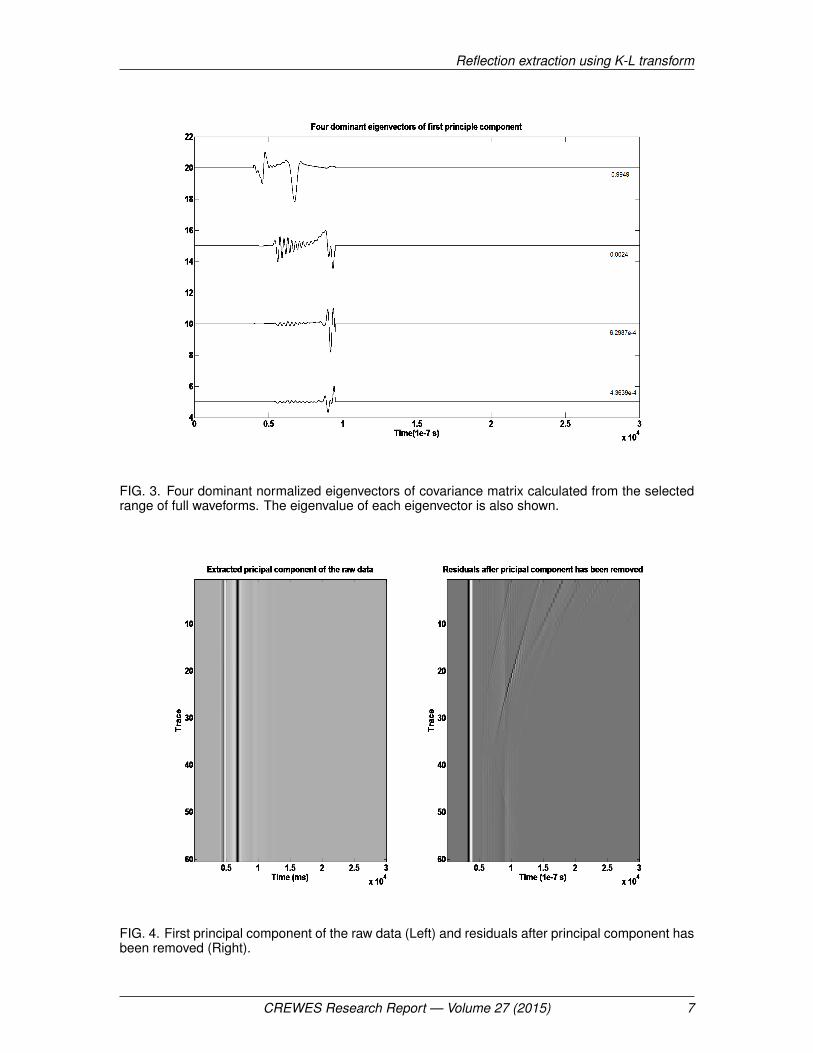
As has been discussed in the last section that KL transformation is also known asprincipal-component analysis. If KL transformation is applied at a wide range from 0 msto 1.5 ms, theoretically, the principal component should be the Stoneley wave who has thehighest amplitude. Figure 3 shows the four dominant normalized eigenvectors of covari-ance matrix calculated from the selected range of full waveforms. Compared the take-offtime of each event shown in Figure 2 (Left), the first dominant eigenvector consists not only
CREWES Research Report — Volume 27 (2015) 5

Li et. al
FIG. 2. Received full waveform when the dip angle is 45 degree (Left) and theoretical refectionsignals after the direct signals have been removed (Right).
of the Stoneley component, but also of the water wave component as well. The eigenvalueof the first dominant eigenvector is 0.9949, which shows 99 percent of total energy comesfrom the first eigenvector.
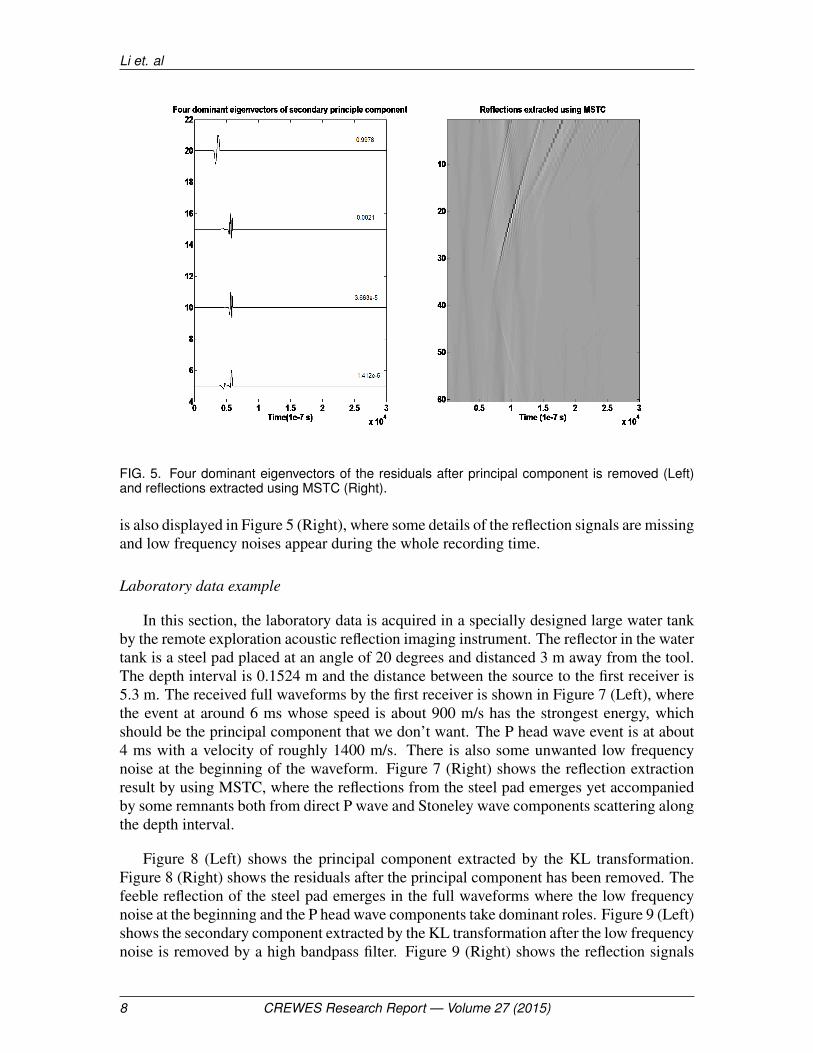
As a result, first principal component can be reconstructed by only using the first domi-nant eigenvector shown in Figure 4 (Left) and Figure 4 (Right) shows the covariance resid-uals after the first principal component is eliminated. The reflected waves emerge as asubsequence following the new principal component in Figure 4 (Right).
Following the water wave and Stoneley wave extraction, the head P wave becomes thedominant event. A same time window from 0 ms to 1.5 ms is applied to calculate covariancematrix of the waveform and its four dominant eigenvectors are then show in Figure 5(Left).
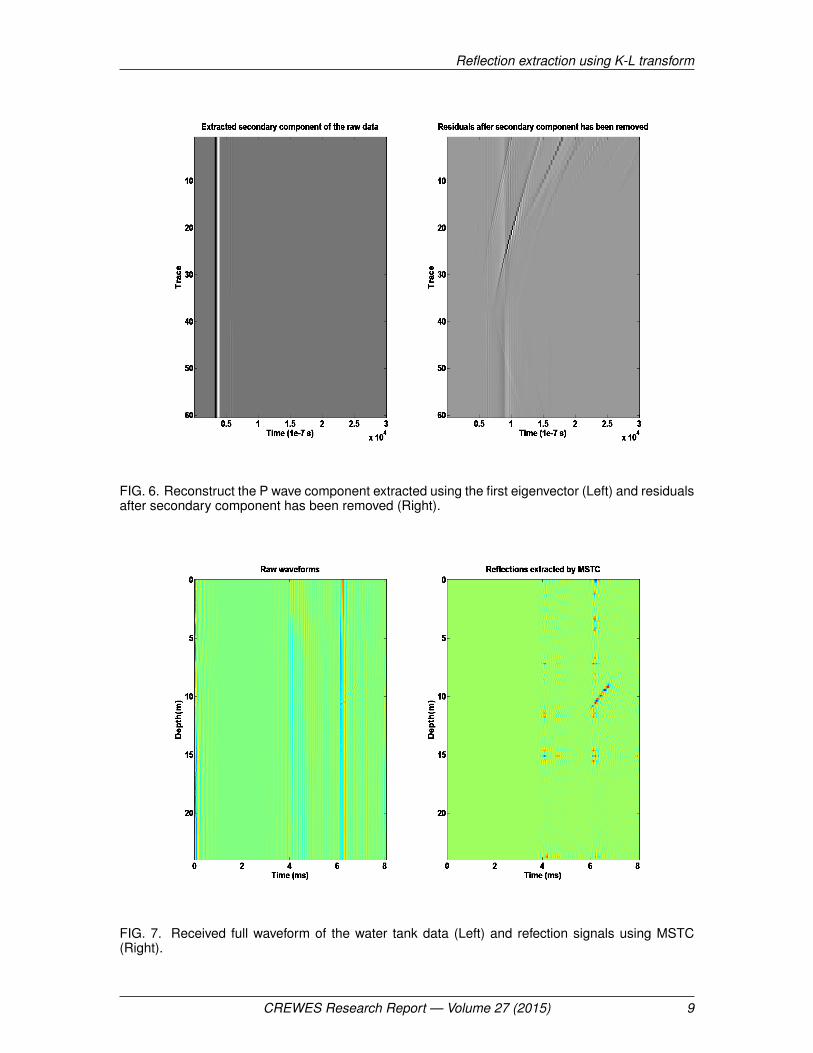
The first eigenvector has a eigenvalue of 0.9976, which shows most of the P waveenergy has been converged into the first dominant eigenvector. Therefore, only the firstdominant eigenvector is used to reconstruct the P wave, shown in Figure 6(Left). Figure 6(Right) shows the residuals after the P wave component has been removed, which actuallyis the extracted reflections after eliminating the direct P wave, water wave and Stoneleywave respectively. Compared with the theoretical reflections shown in Figure 2 (Right),almost all the reflection details have been revealed. To make a comparison, the result ofreflections extracted using multi-scale slowness-time-coherence (MSTC) (Tao et al., 2008)
6 CREWES Research Report — Volume 27 (2015)
Reflection extraction using K-L transform
FIG. 3. Four dominant normalized eigenvectors of covariance matrix calculated from the selectedrange of full waveforms. The eigenvalue of each eigenvector is also shown.
FIG. 4. First principal component of the raw data (Left) and residuals after principal component hasbeen removed (Right).
CREWES Research Report — Volume 27 (2015) 7
Li et. al
FIG. 5. Four dominant eigenvectors of the residuals after principal component is removed (Left)and reflections extracted using MSTC (Right).
is also displayed in Figure 5 (Right), where some details of the reflection signals are missingand low frequency noises appear during the whole recording time.
Laboratory data example
In this section, the laboratory data is acquired in a specially designed large water tankby the remote exploration acoustic reflection imaging instrument. The reflector in the watertank is a steel pad placed at an angle of 20 degrees and distanced 3 m away from the tool.The depth interval is 0.1524 m and the distance between the source to the first receiver is5.3 m. The received full waveforms by the first receiver is shown in Figure 7 (Left), wherethe event at around 6 ms whose speed is about 900 m/s has the strongest energy, whichshould be the principal component that we don’t want. The P head wave event is at about4 ms with a velocity of roughly 1400 m/s. There is also some unwanted low frequencynoise at the beginning of the waveform. Figure 7 (Right) shows the reflection extractionresult by using MSTC, where the reflections from the steel pad emerges yet accompaniedby some remnants both from direct P wave and Stoneley wave components scattering alongthe depth interval.
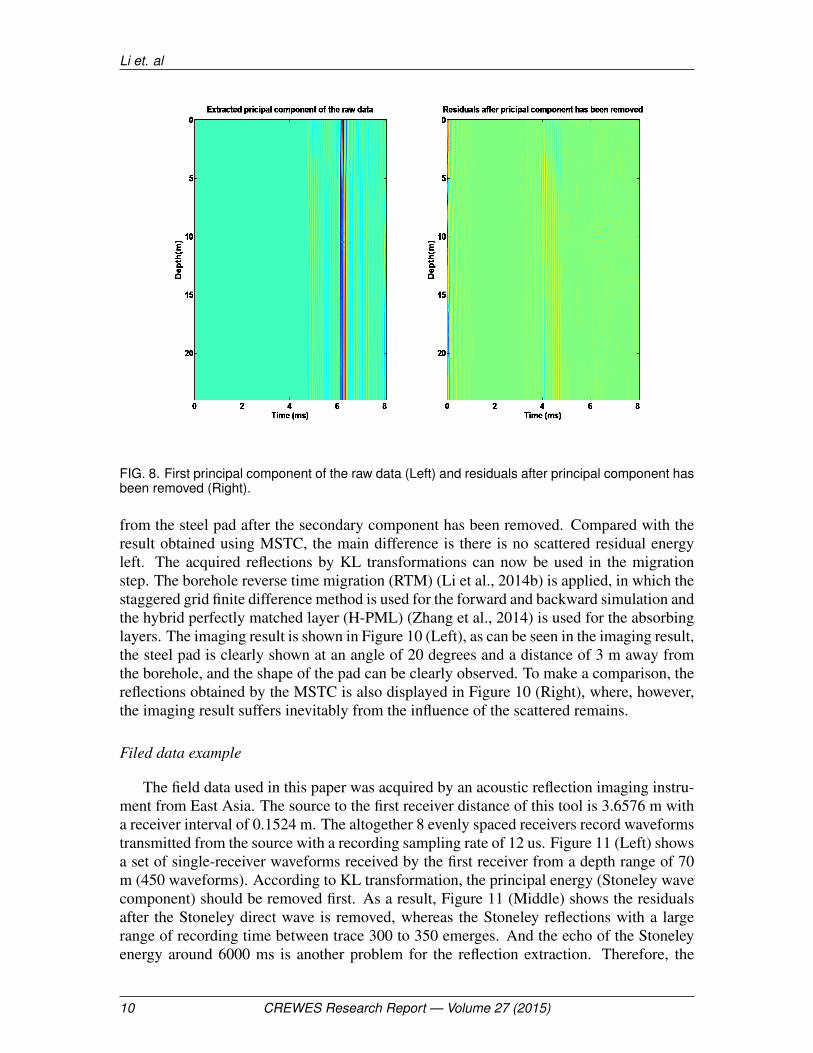
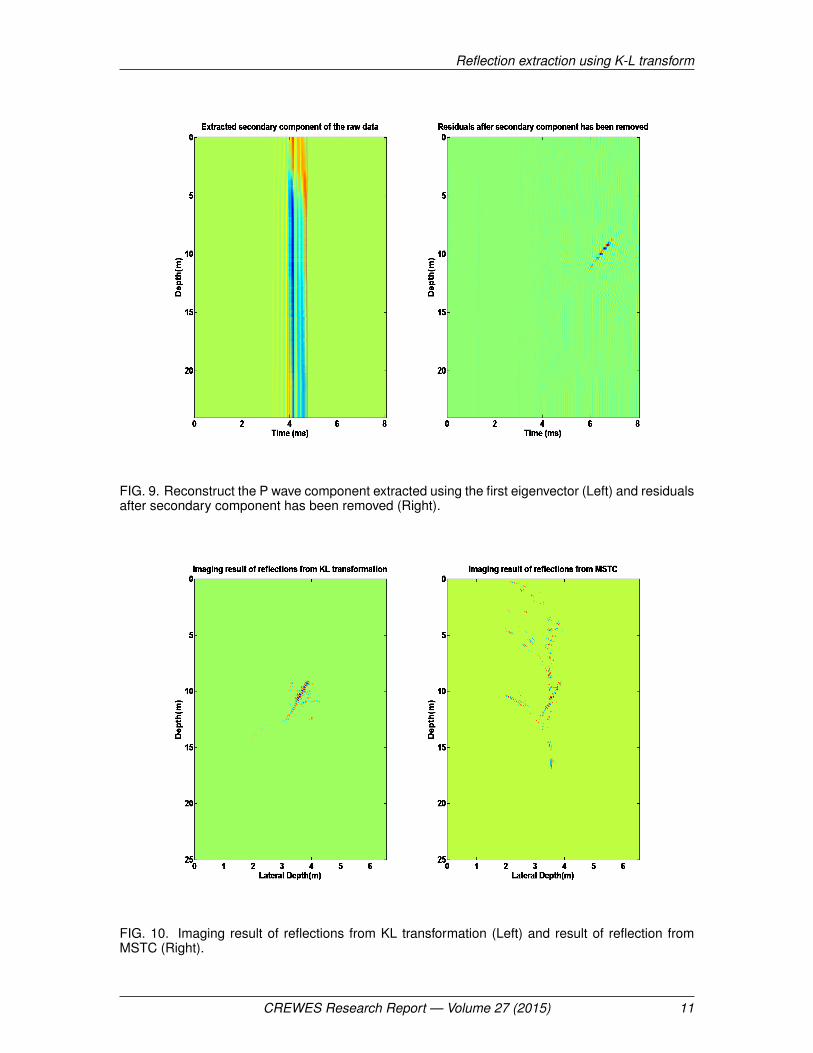
Figure 8 (Left) shows the principal component extracted by the KL transformation.Figure 8 (Right) shows the residuals after the principal component has been removed. Thefeeble reflection of the steel pad emerges in the full waveforms where the low frequencynoise at the beginning and the P head wave components take dominant roles. Figure 9 (Left)shows the secondary component extracted by the KL transformation after the low frequencynoise is removed by a high bandpass filter. Figure 9 (Right) shows the reflection signals
8 CREWES Research Report — Volume 27 (2015)
Reflection extraction using K-L transform
FIG. 6. Reconstruct the P wave component extracted using the first eigenvector (Left) and residualsafter secondary component has been removed (Right).
FIG. 7. Received full waveform of the water tank data (Left) and refection signals using MSTC(Right).
CREWES Research Report — Volume 27 (2015) 9
Li et. al
FIG. 8. First principal component of the raw data (Left) and residuals after principal component hasbeen removed (Right).
from the steel pad after the secondary component has been removed. Compared with theresult obtained using MSTC, the main difference is there is no scattered residual energyleft. The acquired reflections by KL transformations can now be used in the migrationstep. The borehole reverse time migration (RTM) (Li et al., 2014b) is applied, in which thestaggered grid finite difference method is used for the forward and backward simulation andthe hybrid perfectly matched layer (H-PML) (Zhang et al., 2014) is used for the absorbinglayers. The imaging result is shown in Figure 10 (Left), as can be seen in the imaging result,the steel pad is clearly shown at an angle of 20 degrees and a distance of 3 m away fromthe borehole, and the shape of the pad can be clearly observed. To make a comparison, thereflections obtained by the MSTC is also displayed in Figure 10 (Right), where, however,the imaging result suffers inevitably from the influence of the scattered remains.
Filed data example
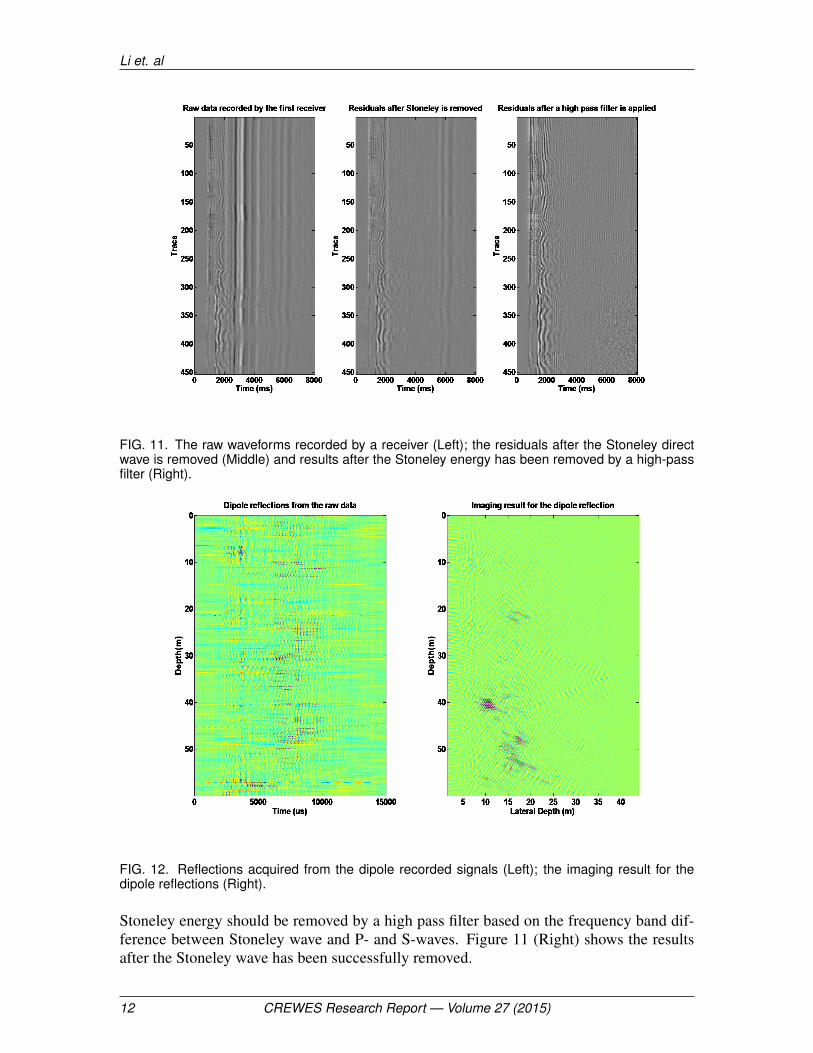
The field data used in this paper was acquired by an acoustic reflection imaging instru-ment from East Asia. The source to the first receiver distance of this tool is 3.6576 m witha receiver interval of 0.1524 m. The altogether 8 evenly spaced receivers record waveformstransmitted from the source with a recording sampling rate of 12 us. Figure 11 (Left) showsa set of single-receiver waveforms received by the first receiver from a depth range of 70m (450 waveforms). According to KL transformation, the principal energy (Stoneley wavecomponent) should be removed first. As a result, Figure 11 (Middle) shows the residualsafter the Stoneley direct wave is removed, whereas the Stoneley reflections with a largerange of recording time between trace 300 to 350 emerges. And the echo of the Stoneleyenergy around 6000 ms is another problem for the reflection extraction. Therefore, the
10 CREWES Research Report — Volume 27 (2015)
Reflection extraction using K-L transform
FIG. 9. Reconstruct the P wave component extracted using the first eigenvector (Left) and residualsafter secondary component has been removed (Right).
FIG. 10. Imaging result of reflections from KL transformation (Left) and result of reflection fromMSTC (Right).
CREWES Research Report — Volume 27 (2015) 11
Li et. al
FIG. 11. The raw waveforms recorded by a receiver (Left); the residuals after the Stoneley directwave is removed (Middle) and results after the Stoneley energy has been removed by a high-passfilter (Right).
FIG. 12. Reflections acquired from the dipole recorded signals (Left); the imaging result for thedipole reflections (Right).
Stoneley energy should be removed by a high pass filter based on the frequency band dif-ference between Stoneley wave and P- and S-waves. Figure 11 (Right) shows the resultsafter the Stoneley wave has been successfully removed.
12 CREWES Research Report — Volume 27 (2015)
Reflection extraction using K-L transform
In order to get an imaging result with a wide lateral detection depth. The dipole re-flections acquired from the dipole recorded signals shown in Figure 12 (Left) are used inmigration. Figure 12 (Right) shows the imaging result for the dipole reflections. The re-flectors can be clearly seen at about 10 m to 20 m outside of borehole. As can also be seen,the lateral depth for dipole signals can reach up to 40 m away from borehole.
CONCLUSIONS
The KL transformation is applied in this paper to separate reflections away from directsignals in acoustic reflection well logging data. Based on energy difference of each signalcomponent, the direct P- and S waves as well as the Stoneley wave can be efficiently re-moved. Comparisons with MSTC method both from synthetic and laboratory data showKL transformation is capable of providing much more precise reflection signals. For thefield data, a high pass filter is applied first to mitigate Stoneley direct and reflect signals,given the reason that the KL transformation can not remove the Stoneley reflections.
ACKNOWLEDGMENTS
The authors thank the sponsors of CREWES for continued support. This work wasfunded by CREWES industrial sponsors and NSERC (Natural Science and EngineeringResearch Council of Canada) through the grant CRDPJ 461179-13. Author 1 was alsosupported by SEG scholarship and Shell.
REFERENCES
Ahmed, N., and Rao, K. R., 2012, Orthogonal transforms for digital signal processing: Springer Science &Business Media.
Andrews, H. C., and Patterson III, C. L., 1976, Singular value decomposition (svd) image coding: Commu-nications, IEEE Transactions on, 24, No. 4, 425–432.
Bing, W., Guo, T., Hua, W., and Bolei, T., 2011, Extracting near-borehole p and s reflections from array soniclogging data: Journal of Geophysics and Engineering, 8, No. 2, 308.
Chabot, L., Henley, D. C., Brown, R. J., Bancroft, J. et al., 2001, Single-well imaging using the full waveformof an acoustic sonic, in 2001 SEG Annual Meeting, Society of Exploration Geophysicists.
Cheng, C. H., and Toksöz, M. N., 1981, Elastic wave propagation in a fluid-filled borehole and syntheticacoustic logs: Geophysics, 46, No. 7, 1042–1053.
Cheng, C. H., Toksöz, M. N., and Willis, M. E., 1982, Determination of in situ attenuation from full waveformacoustic logs: Journal of Geophysical Research: Solid Earth (1978–2012), 87, No. B7, 5477–5484.
Coates, R. T., and Schoenberg, M., 1995, Finite-difference modeling of faults and fractures: Geophysics, 60,No. 5, 1514–1526.
Hornby, B., Johnson, D., Winkler, K., and Plumb, R., 1989, Fracture evaluation using reflected stoneley-wavearrivals: Geophysics, 54, No. 10, 1274–1288.
Hornby, B. E., 1989a, Imaging of near-borehole structure using full-waveform sonic data: Geophysics, 54,No. 6, 747–757.
Hornby, B. E., 1989b, Method for determining formation permeability by comparing measured tube waveswith formation and borehole parameters, uS Patent 4,797,859.
CREWES Research Report — Volume 27 (2015) 13
Li et. al
Hsu, K., 1990, Wave separation and feature extraction of acoustic well-logging waveforms using karhunen-loeve transformation: Geophysics, 55, No. 2, 176–184.
Kimball, C. V., and Marzetta, T. L., 1984, Semblance processing of borehole acoustic array data: Geophysics,49, No. 3, 274–281.
Kokesh, F., Schwartz, R., Wall, W., Morris, R. et al., 1965, A new approach to sonic logging and otheracoustic measurements: Journal of Petroleum Technology, 17, No. 03, 282–286.
Li, J., Tao, G., Zhang, K., and Liu, H., 2014a, Acoustic reflection signals extraction by applying blind signalseparation, in 76th EAGE Conference and Exhibition 2014.
Li, J., Tao, G., Zhang, K., Wang, B., and Wang, H., 2014b, An effective data processing flow for the acousticreflection image logging: Geophysical Prospecting, 62, No. 3, 530–539.
Li, Y., Zhou, R., Tang, X., Jackson, J., and Patterson, D., 2002, Single-well imaging with acoustic reflectionsurvey at mounds, oklahoma, usa, in 64th EAGE Conference & Exhibition.
Marguerite, L. D. A., 1940, Method of and apparatus for surveying the formations traversed by a bore hole,uS Patent 2,191,119.
Paillet, F., and White, J., 1982, Acoustic modes of propagation in the borehole and their relationship to rockproperties: Geophysics, 47, No. 8, 1215–1228.
Saggaf, M., and Robinson, E. A., 2000, A unified framework for the deconvolution of traces of nonwhitereflectivity: Geophysics, 65, No. 5, 1660–1676.
Tang, X. M., 2004, Imaging near-borehole structure using directional acoustic-wave measurement: Geo-physics, 69, No. 6, 1378–1386.
Tang, X.-M., and Cheng, C. H. A., 2004, Quantitative borehole acoustic methods, vol. 24: Gulf ProfessionalPublishing.
Tao, G., He, F., Yue, W., and Chen, P., 2008, Processing of array sonic logging data with multi-scale stctechnique: Petroleum Science, 5, No. 3, 238–241.
Yedlin, M. J., Jones, I. F., and Narod, B. B., 1987, Application of the karhunen-loève transform to diffractionseparation: Acoustics, Speech and Signal Processing, IEEE Transactions on, 35, No. 1, 2–8.
Zhang, K., Tao, G., Li, J., Wang, H., Liu, H., and Ye, Q., 2014, 3d fdm modeling of acoustic reflectionlogging in a deviated well, in 76th EAGE Conference and Exhibition 2014.
Zheng, Y., Tang, X. et al., 2005, Imaging near-borehole structure using acoustic logging data with pre-stackfk migration, in 2005 SEG Annual Meeting, Society of Exploration Geophysicists.
14 CREWES Research Report — Volume 27 (2015)