crosshole sonic logging (csl)
TRANSCRIPT

Crosshole Sonic Logging (CSL)
FREEDOM DATA PC PLATFORM
System Reference Manual
Freedom Data PC with CSL Software Version 4.3

1
CROSSHOLE SONIC LOGGING (CSL)
www.olsoninstruments.com | www.olsonengineering.com
NOTICES Errors and Omissions This document is believed to be accurate, but Olson Instruments, Inc. will not be responsible for errors or omissions, which may be found. Further, Olson Instruments will not be responsible for any damages resulting from any errors or omissions. Proprietary Information This document, as well as all software written by Olson Instruments, Inc., is proprietary to Olson Instruments, Inc. This manual may not be sold, reproduced, or used with any other product other than the Olson Instruments Crosshole Sonic Logging system unless approved by Olson Instruments, Inc. Further, this manual and the accompanying software may not be used by any party other than the original purchaser without prior approval by Olson Instruments, Inc. Warranty
(See Sales Contract Documents) Copyright Copyright 2012 by Olson Instruments, Inc. All rights reserved. No part of this publication may be reproduced or utilized in any form or by any means, electronic or mechanical, including photocopying, recording, or by any information storage or retrieval system, without prior written permission of the above named copyright holder. Written by: Olson Instruments, Inc. 12401 W. 49th Avenue Wheat Ridge, Colorado USA 80033-1927 Office: (303)423-1212 Fax: (303)423-6071 E-Mail: [email protected] Revised: January 2012

2
CROSSHOLE SONIC LOGGING (CSL)
www.olsoninstruments.com | www.olsonengineering.com
Table of Contents
1.0 INTRODUCTION ..............................................................................................................................................4
1.1 Organization and Scope of Manual ..............................................................................................................5
1.2 System Requirements and Components ......................................................................................................5
1.3 Test Methodology .........................................................................................................................................6
2.0 FREEDOM DATA PC HARDWARE.................................................................................................................7
2.1 Main Components of Freedom Data PC.......................................................................................................7
2.2 Freedom Data PC Hardware Component List ..............................................................................................8
2.3 Freedom Data PC Hardware Setup..............................................................................................................9
2.4 Freedom Data PC Hardware Operation .....................................................................................................11
2.4.1 Freedom Data PC Operation Notes.........................................................................................................12
2.4.1.1 General Maintenance and Usage .........................................................................................................12
2.4.1.2 Battery Charging and Usage.................................................................................................................13
2.4.1.3 Removing/Replacing Batteries and Modules........................................................................................15
3.0 CSL HARDWARE SETUP..............................................................................................................................16
3.1 Equipment List for Crosshole Sonic Logging (CSL) ...................................................................................16
3.2 Step by Step Guide for Hardware Setup ....................................................................................................17
4.0 CSL FIELD TEST PROCEDURE ...................................................................................................................24
5.0 CSL SOFTWARE SETUP ..............................................................................................................................29
5.1 CSL Software Installation............................................................................................................................29
5.2 CSL Software Update .................................................................................................................................30
5.3 Printer Installation (for Direct Printing only) ................................................................................................30
5.4 Microsoft Word Setup (Recommended Function to Produce Reports) ......................................................31
5.5 Set Up Company Letterhead for Automatically Generated CSL Report ....................................................31
5.6 CSL2 Software Uninstallation .....................................................................................................................31
5.7 First Time Running the CSL2 Software ......................................................................................................32
6.0 GUIDES TO CSL DATA ACQUISITION.........................................................................................................34
6.1 Start CSL Software .....................................................................................................................................34
6.2 Test New Shaft and Set Up Shaft Information............................................................................................36
6.3 Number of CSL Receivers ..........................................................................................................................39
6.4 Tube Pair Search ........................................................................................................................................41
6.5 Enter Card Parameters and MS Word Information....................................................................................41
6.6 Data Acquisition – View Mode ....................................................................................................................42
6.6.1 Data Acquisition Parameters ...................................................................................................................43
6.6.2 Automatic Tube Pair Search Option ........................................................................................................46
6.6.3 CSL-2 System..........................................................................................................................................46
6.6.4 Gain Control .............................................................................................................................................47

3
CROSSHOLE SONIC LOGGING (CSL)
www.olsoninstruments.com | www.olsonengineering.com
6.7 Data Acquisition – Recording Data Mode...................................................................................................48
6.8 Retest Existing Shaft...................................................................................................................................53
7.0 GUIDES TO CSL DATA ANALYSIS...............................................................................................................54
7.1 Start CSL Software .....................................................................................................................................54
7.2 Shaft Analysis – Shaft Information Screen .................................................................................................55
7.3 Shaft Analysis – Basic CSL Analysis Functions .........................................................................................57
7.3.1 Key Strokes..............................................................................................................................................57
7.3.2 Scanning Parameters ..............................................................................................................................58
7.3.3 Manual Pick of the Arrival Times .............................................................................................................58
7.3.4 Stickup .....................................................................................................................................................59
7.3.5 Defect Analyzer........................................................................................................................................60
7.3.6 Saving Data..............................................................................................................................................61
7.3.7 Display Options........................................................................................................................................61
7.3.8 Add CSL Logs..........................................................................................................................................62
7.3.9 Delete Current Log...................................................................................................................................62
7.3.10 Set Bottom Depth...................................................................................................................................62
7.3.11 Change Tube Pair Name .......................................................................................................................63
8.0 GUIDELINES FOR PRINTING CSL REPORTS ............................................................................................64
8.1 Link CSL Logs to MS Word.........................................................................................................................64
8.2 Report Generation .......................................................................................................................................66
9.0 HARDWARE TROUBLESHOOTING .............................................................................................................68
9.1 Hardware System Check ............................................................................................................................68
9.1.1 INPUT Module Test .................................................................................................................................68
9.1.2 PULSER Module Test..............................................................................................................................68
10.0 FREQUENTLY ASKED QUESTIONS..........................................................................................................69
APPENDIX A ............................................................................................................................................................71
EXAMPLE CSL REPORT .....................................................................................................................................71
APPENDIX B ............................................................................................................................................................97
EXAMPLE CSL SPECIFICATIONS......................................................................................................................97
B1.0 CROSSHOLE SONIC LOGGING (CSL) OF DRILLED SHAFT FOUNDATIONS........................................98
B1.1 DRILLED SHAFT FOUNDATION PREPARATION......................................................................................98
B1.2 CSL TEST EQUIPMENT ..............................................................................................................................99
B1.3 CSL LOGGING PROCEDURES ..................................................................................................................99
B1.4 CSL RESULTS ...........................................................................................................................................100
B1.5 ACCEPTANCE OF COMPLETED DRILLED SHAFT FOUNDATIONS.....................................................101

4
CROSSHOLE SONIC LOGGING (CSL)
www.olsoninstruments.com | www.olsonengineering.com
1.0 INTRODUCTION The Olson Instruments Crosshole Sonic Logging (CSL) system is used for quality assurance testing of a variety of concrete foundations and slurry walls as shown in the figure below. The basic requirement for any structure to be testable by this system is that some form of access (such as cast-in-place tubes or boreholes) must be provided for the transducers. When used for quality assurance testing on drilled shafts, slurry walls, etc, the sonic logging system is a powerful, state-of-the-art tool in verifying concrete integrity, locating defects, and evaluating repair effectiveness.
The Crosshole Sonic Logging system (CSL-1) consists of 4 basic components for most testing applications: 1. Freedom Data PC with high-speed data
acquisition card, Windows based CSL acquisition and analysis software installed
2. CSL Pulser and Input Modules, installed 3. Depth Measurement Wheel Assembly 4. Interchangeable source/receiver hydrophones (2).
CSL-2 option for 3rd hydrophone for two simultaneous logs.
1
2
3
4
Cable Guides
Pinch Rollers
Depth Wheel
Tripod

5
CROSSHOLE SONIC LOGGING (CSL)
www.olsoninstruments.com | www.olsonengineering.com
These components are connected with cables to form a complete system (see Section 3.1). This manual covers hardware setup and operation instructions for the Olson Instruments Freedom Data PC CSL-1 and CSL-2 systems. The Windows CSL software included in the system is a real time display program supporting circular shaft and rectangle diaphragm wall templates. This includes real time displays of waveforms, first arrival time logs, velocity plots, time and energy logs and waterfall plots. The Software acquires the data for 1 channel (CSL-1 system) or 2 channels (CSL-2 system) simultaneously. The software can also be used to perform tomographic data acquisition to image defects (with purchase of TOMO-1 option). This manual covers step-by-step instructions for data acquisition, data analysis, and report generation (or output generation for tomography that links the summary report and CSL logs directly to a Microssoft Word document). If a TOMO-1 system is purchased, an additional manual is available for details on tomography data collection and processing. The system is designed/manufactured to be in accordance with ASTM D6760-02 Standard Test Method for Integrity Testing of Concrete Deep Foundations by Ultrasonic Crosshole Testing.
1.1 Organization and Scope of Manual
This operation manual for the Olson Instruments Crosshole Sonic Logging system includes all required instruction for the use of the software and hardware included with the system. Also included is a troubleshooting guide to help overcome any problems experienced and answer any questions. If any problems occur that are not covered in this manual, please call Olson Instruments at the number included in the front of this manual. Note that training in the use of the system by Olson Instruments personnel is recommended for the most effective operation of this system.
1.2 System Requirements and Components
The Crosshole Sonic Logging system can only be purchased with the OLSON Freedom Data PC (FDPC), as the pulser and amplifier modules are custom designed for this computer. When the system is purchased, Olson Instruments personnel will install the required software. Each software installation is based on the options purchased.

6
CROSSHOLE SONIC LOGGING (CSL)
www.olsoninstruments.com | www.olsonengineering.com
1.3 Test Methodology
Crosshole Sonic Logging (CSL) – The CSL test relies on propagation of ultrasonic waves between two or more water-filled access tubes to measure the velocity and signal strength of the propagated waves. The testing can be performed on any concrete foundation provided two or more access tubes or coreholes capable of holding water are present in the foundation. CSL can also be used to check the integrity of underwater concrete piers and foundations by strapping access tubes to the sides. Crosshole Tomography can be performed to image critical anomalies found in CSL tests as discussed. A companion of the CSL test is the Singlehole Sonic Logging (SSL) test, which can be performed in one access tube or corehole to check the integrity of the concrete foundation around the tube in a fashion similar to Gamma-Gamma nuclear density tests. CSL tests are typically performed on concrete, particularly concrete drilled shafts. Other materials which support transmission of ultrasonic waves can be tested such as: slurry, rock, grout, water saturated media, cemented radioactive wastes.

7
CROSSHOLE SONIC LOGGING (CSL)
www.olsoninstruments.com | www.olsonengineering.com
2.0 FREEDOM DATA PC HARDWARE
The one or two channel Crosshole Sonic Logging system, CSL, consists of several basic components packaged into a padded carrying case plus the Freedom Data PC in its own case. The padded case stores the hydrophones, depth wheel, tripod, and cables. A description of each of these components as well as their connection and operation is included in the following section.
2.1 Main Components of Freedom Data PC
Before the computer is turned on, verify that the correct Input (6) and Pulser Module (8) are installed in the computer for the test method you are performing. Each test has its own set of modules that come pre-installed by Olson Instruments, Inc. Should you ever need to remove/replace the modules, the Input Module is installed in the top pocket and the Pulser Module in the bottom pocket.
Main Components of Freedom DATA PC
1. Case Latches
2. Backlight Switch Control
3. External Power Supply Jack
4. CRT, LAN USB (2), COM, and Parallel Port Location
5. Lithium Ion Battery pocket with cover in place
6. Input Module
7. Power On/Off Buttons and Battery Condition Indicator Lights
8. Pulser Module
9. Mouse Buttons
10. Pressure Relief Valve
1 1
2
3
4 5 6
7 8
9
10
!

8
CROSSHOLE SONIC LOGGING (CSL)
www.olsoninstruments.com | www.olsonengineering.com
2.2 Freedom Data PC Hardware Component List
COMPONENT NAMECOMPONENT NAMECOMPONENT NAMECOMPONENT NAME
QTYQTYQTYQTY
DESCRIPTIONDESCRIPTIONDESCRIPTIONDESCRIPTION
Freedom DATA PCFreedom DATA PCFreedom DATA PCFreedom DATA PC [National Instruments A/D Data Card]
1111
12” Diagonal LCD Transflective Screen (1024x768) for Sunlight/Night Viewing, Windows XP based low power 1.1 GHz Intel Pentium M Processor, 512 MB DRAM, 120 GB Hard Drive with external CD-RW, 10/100MB LAN, USB (2), C RT, Serial and Parallel Ports.
Input ModuleInput ModuleInput ModuleInput Module (top right slot) Newer models will not have rings on thumbscrews
1111
Olson Instruments built electronic unit configured for the system method purchased. The CSL Module includes 1 Channel (for CSL-1) or 2 Channel (for CSL-2) hydrophone signal amplification and filtering circuits with internal interface cable to data acquisition card. Mounts into Freedom Data PC top right slot.
Pulser ModulePulser ModulePulser ModulePulser Module (bottom right slot)
1111
Olson Instruments built electronic unit configured for system method purchased. Mounts into the Freedom Data PC bottom right slot. Note: Not all systems require a pulser module, in which case a blank cover plate is substituted into the slot.
External Power Supply/ChargerExternal Power Supply/ChargerExternal Power Supply/ChargerExternal Power Supply/Charger 12 VDC 12 VDC 12 VDC 12 VDC Automobile AdapterAutomobile AdapterAutomobile AdapterAutomobile Adapter
1111
120/240 VAC 50-60 Hz autoswitching power supply for Freedom Data PC plus 12 volt DC Automobile Adapter.
LLLLithium Ion Batteriesithium Ion Batteriesithium Ion Batteriesithium Ion Batteries
1111
Shown with the cover removed, exposing 2 Internal Lithium Ion Batteries, with 8 to 10 hours of operation time.

9
CROSSHOLE SONIC LOGGING (CSL)
www.olsoninstruments.com | www.olsonengineering.com
2.3 Freedom Data PC Hardware Setup
A step-by-step procedure for connecting the various system components is illustrated below. Please refer to these figures during connection of the components. 1. Lay the instrument case and Freedom Data PC down on a flat, stable surface. Unlock the
case if locked. Next, open the Freedom Data PC case. The location of the Freedom PC should be within 15 m (50 ft) of the subject/material to be tested.
2. Next, if desired, connect the Freedom Data PC to the external power supply with the
120/240 VAC Power Supply/Charger. The external power supply/charger automatically switches between120/240 Volts AC.

10
CROSSHOLE SONIC LOGGING (CSL)
www.olsoninstruments.com | www.olsonengineering.com
3. BATTERY INSTALLATION: If it is necessary to replace the batteries, remove the battery
cover as shown. Insert both batteries with the (+) polarity to the right (photo below).
BATTERY CONDITION INDICATOR LIGHTS Green Light – Batteries are fully charged Yellow Light – Batteries are charging Red Light – Low Battery, ~ 15 minutes usage left, apply external power supply at this point
The computer is designed to be resistant to light rain or other moisture but should not be exposed to heavy rain.
Fully charged batteries should power the IE system for 8 – 10 hours depending on the processor speed of the unit used. The Freedom Data PC can also be powered from a car cigarette lighter socket using a 12 VDC adapter. However, this may drain a weak car battery in a few hours if the engine is not running.
i
i

11
CROSSHOLE SONIC LOGGING (CSL)
www.olsoninstruments.com | www.olsonengineering.com
2.4 Freedom Data PC Hardware Operation
After the Freedom Data PC hardware is properly set up, operation is straightforward and primarily involves the use of the Freedom Data PC and the installed modules. The use of the Input Module and Pulser Module is described in this section. 1. Power
If the battery LED is red, do not try to operate the computer, as the batteries are very low. In this case, the system should be run on external power rather than off the batteries. Charging of the batteries will begin once external power is attached. A running automobile outputs approximately 14.2 VDC, which will charge the batteries to around 85% of full charge. To achieve 100% charging power, use the 16 VDC AC powered external power supply that is shipped with your instrument.
When operating the computer on external power with partially or fully discharged batteries, a “Fault” light may appear after a period of time. This yellow flashing light is normal, and is due to the combined current drain of the computer operation and the battery charge current. The batteries will charge normally when the power supply is connected with the computer shut off (such as overnight). Totally drained batteries will require 12 – 13 hours for full charging.
i
Battery Condition Indicator Lights
Power on Freedom Data PC by pressing the “ON” Button as shown.

12
CROSSHOLE SONIC LOGGING (CSL)
www.olsoninstruments.com | www.olsonengineering.com
2.4.1 Freedom Data PC Operation Notes
The Freedom Data PC is a self-contained data conditioning, collection, and processing platform usable for a number of types of NDT tasks as well as general data acquisition. The data acquisition tasks for which the Freedom Data PC is capable, depends on the modules installed (up to two at a time). The following section discusses the basics of the hardware operation of the Freedom Data PC, including module replacement, battery charging and replacement, external powering, and general maintenance.
2.4.1.1 General Maintenance and Usage
The Freedom Data PC is a rugged unit designed for field conditions. It is normally water and air tight when closed and latched, which will protect it in most storage and transportation conditions. While the Freedom Data PC is watertight when closed, it is water resistant (not water tight) when open or operating. Thus, rain or other normal moisture should not bother the unit, but it should NOT be submerged or sprayed at high pressure. Also, water should not be allowed to collect on the face of the computer unit. When used in a field environment, the Freedom Data PC should be expected to get dirty. If this happens, wipe the unit with a damp (not wet), clean towel. Do not allow water to flow into any of the components, and do not wipe the screen with a dry or dirty towel.
Never expose the external power supply/charger to rain or moisture.
The screen is subject to damage if impacted or pressed on.
!
!

13
CROSSHOLE SONIC LOGGING (CSL)
www.olsoninstruments.com | www.olsonengineering.com
2.4.1.2 Battery Charging and Usage
The batteries inside the Freedom Data PC consist of 2 sealed units, each of which is 12 VDC, 11 Ampere-Hours. Depending on the usage, these batteries should last for 8-12 hours of continuous use. After this, the batteries should be recharged or switched out with a fully charged pair. The batteries used are Lithium Ion batteries with internal protection circuitry. There is no memory effect, so batteries can be used freely with only a partial charge.
Charging the Batteries
1. Turn off “POWER” to the Freedom Data PC. 2. Plug the external power supply/charger into the jack in the
upper left-hand corner on the front panel of the unit (top left photo). The yellow “CHARGE” lights will come on for each battery for the bulk of the charge cycle. At 85% of capacity, the green “FULL” lights will light, with all lights out when the battery is completely charged. Always charge the batteries in a protected environment, at normal room temperatures. The batteries red “charge” light indicates that the batteries are nearly fully drained and need recharging.
To prolong battery life, always recharge the batteries immediately after use.
Do not disassemble, incinerate, short out, or otherwise abuse the batteries as there is a possible risk of fire or explosion.
i
!
External power supply jack
Opening battery cover
Cover removed, exposing 2 Lithium Ion batteries

14
CROSSHOLE SONIC LOGGING (CSL)
www.olsoninstruments.com | www.olsonengineering.com
If power is available at the field site (110/220 VAC), the external power supply/charger can be used to power the Freedom Data PC with or without batteries installed. The external power supply/charger will run the unit and start to charge the batteries if installed. Note that the Freedom Data PC should be turned OFF before connecting or disconnecting the external power supply/charger. Disconnecting the power supply/charger during operation may cause the Freedom PC to reboot and lose data in memory, especially if the batteries are very low. If it does reboot, turn off power, then turn on again for normal operation. A 12VDC adaptor can also be used to power the unit off of a car battery.
Notes on maximizing battery life. The following can help maximize the run-time of the batteries:
• Turn off the computer when not in use (when moving or setting up other equipment)
• Use external power when easily available
• Recharge the batteries immediately after each use to preserve capacity

15
CROSSHOLE SONIC LOGGING (CSL)
www.olsoninstruments.com | www.olsonengineering.com
2.4.1.3 Removing/Replacing Batteries and Modules
The batteries and Amplifier/Pulser Modules on the Freedom Data PC are field replaceable. They all use thumbscrew fasteners for securing. To remove the modules, turn off power to the Freedom Data PC, disconnect all cables from the module, and unscrew the thumbscrews counterclockwise. Then pull up firmly and evenly on the screws to remove the module. To replace, simply press the module fully into the slot and tighten the screws.
Replacing the batteries in the Freedom Data PC is a similar operation. Unscrew the 8 thumbscrews then lift off the battery cover. The battery cover should lift up freely. Next, lift the batteries out by the lifting cord. Install new batteries by dropping them into the compartment (they are keyed for polarity and cannot be inserted wrong). Replace the cover. Finally, press and tighten each of the thumbscrews.
ThumbscrewsThumbscrews
The amplifier module should be in the upper position and the pulser module, if required, in the lower position. No damage will occur by switching the locations, but no signal will be coupled from the amplifier module to the data acquisition card, and thus the modules must be placed in the right position. �i

16
CROSSHOLE SONIC LOGGING (CSL)
www.olsoninstruments.com | www.olsonengineering.com
3.0 CSL HARDWARE SETUP
3.1 Equipment List for Crosshole Sonic Logging (CSL)
(1) - 1 Olson Freedom Data PC (2) - 1 CSL Input Module (1 Channel High Pass) (3) - 1 CSL Pulser Module (4) - 2 Orange Reels of CSL Cable (3 Pin MS to Phone Jack) (5) - 1 Depth Wheel (6) - 2 Hydrophones (7) - 1 Tripod (8) - 1 Depth Wheel Cable (Yellow Cable, 3 Pin Adapter) (9) - 1 CSL Source Cable (Phone Plug to Phone Plug) (10) - 1 CSL Receiver Cable (Phone Plug to 4 Pin Adapter) (11) - 4 Cable Guides (2- 1-1/2" diameter, 2- 2" diameter guides) Equipment/Software Required for Testing Not Shown in Photo: - 1 Tape Measure - Latest CSL2 Software - Field Notebook & Pen
1
23
4
5
6
7
89
10
11

17
CROSSHOLE SONIC LOGGING (CSL)
www.olsoninstruments.com | www.olsonengineering.com
3.2 Step by Step Guide for Hardware Setup
1. Insert the Input Module
After opening the Freedom Data PC, insert the input module into the top module pocket if not already present. This pocket is reserved for the input module. 2. Insert the Pulser Module
Next insert the CSL Pulser module into the bottom right module pocket if not already present. This pocket is reserved for the pulser module.
3. Secure Modules
Now that the modules for this test are resting in their appropriate module pockets, handtighten the screws on each module to secure them into the Freedom Data PC. The screws must be properly aligned with the holes in the Freedom Data PC.

18
CROSSHOLE SONIC LOGGING (CSL)
www.olsoninstruments.com | www.olsonengineering.com
4. Set Up the Tripod
a. Open the tripod’s legs by loosening the locking lever connected to the center of the tripod and pulling the legs in the outward direction.
b. Set the tripod to the desired height and tighten the locking lever by hand. c. Loosen and tighten the thumbscrew at the bottom of each leg to adjust the legs of the
tripod. d. The center of the tripod can be raised or lowered by adjusting the knob at the top of the
tripod.
5. Attach Depth Wheel to Tripod
a. Carefully screw the depth wheel onto the tripod by aligning the screw with the hole in the
bottom of the depth wheel. Rotate clockwise and hand-tighten.
4a 4b 4c 4d

19
CROSSHOLE SONIC LOGGING (CSL)
www.olsoninstruments.com | www.olsonengineering.com
6. Connect Depth Wheel to Freedom Data PC
a. Attach the yellow three-pin depth wheel cable to the encoder on the depth wheel. This is done by pulling back on the small black sleeve at the end of the cable and carefully lining up the three holes on the cable with the three pins on the encoder.
b. The other end of the yellow cable will then attach to the pulser module on the computer. Attach the cable to the input port on the pulser module labeled “DEPTH WHEEL” by aligning the three pins with their appropriate holes.

20
CROSSHOLE SONIC LOGGING (CSL)
www.olsoninstruments.com | www.olsonengineering.com
7. Connect Hydrophone to CSL Cable Attach a hydrophone to one of the orange reels of CSL cable by aligning the three pins of the hydrophone with the three holes on the 3-pin MS end of the CSL cable and carefully hand-tighten the hydrophone to the cable as you push the connector in. Reverse the step to remove the hydrophone(s).
8. Connect Adapter Cable to CSL Cable Next attach the yellow receiver cable to the side of an orange reel of CSL cable. The phone plug can simply be inserted into the side of the orange spool by pushing it in; alignment is not necessary. The yellow cable will have a four-pin connection on the other end of it to connect to the input module on the Freedom Data PC.
The transducers are subject to damage if impacted. NEVER drop a transducer, or allow one to swing on a cable end and impact any hard object. Olson Instruments DOES NOT WARRANTY transducers against physical damage.
DO NOT ROTATE CABLE CLAMP ASSEMBLY AS PERMANENT DAMAGE MAY OCCUR
HAND TIGHTEN ONLY!
!

21
CROSSHOLE SONIC LOGGING (CSL)
www.olsoninstruments.com | www.olsonengineering.com
9. Connect Adapter Cable to Input Module
Once the phone plug has been securely attached to the orange spool, the four-pin adapter can be attached to the computer. This can be done by pulling back on the small black sleeve at the end of the cable and carefully lining up the four holes on the cable with the four pins on the input module.
10. Connect Hydrophone to CSL Cable
Next you will need to attach the other hydrophone to the other orange reel of CSL cable. Attach the hydrophone to the CSL cable by aligning the three pins of the hydrophone with the three corresponding holes on the 3-pin MS end of the CSL cable and carefully hand-tighten.
HAND TIGHTEN ONLY!
DO NOT ROTATE CABLE CLAMP ASSEMBLY AS PERMANENT DAMAGE MAY OCCUR

22
CROSSHOLE SONIC LOGGING (CSL)
www.olsoninstruments.com | www.olsonengineering.com
11. Connect Adapter Cable to CSL Cable
Attach the phone plug source cable to the side of the 2nd orange reel of CSL cable. Both ends of the cable have phone plug adapters. Insert one of the phone plugs into the side of the orange reel by pushing it in; alignment is not necessary.
12. Connect Adapter Cable to Pulser Module
Once the phone plug has been securely attached to the 2nd orange reel, the other end can be attached to the pulser module on the computer. Insert the phone plug into the pulser module where the words “PULSE OUT” appear. Lift the black cover and insert the phone plug fully until you hear it click.
PUSH THE PHONE PLUG ALL THE WAY INTO THE “PULSE OUT” PORT UNTIL YOU HEAR IT CLICK INTO PLACE. THIS PHOTO SHOWS THE
PLUG PARTIALLY OUT FOR LOCATION REFERENCE ONLY.

23
CROSSHOLE SONIC LOGGING (CSL)
www.olsoninstruments.com | www.olsonengineering.com
13. Align CSL Cables on Depth Wheel
The Depth Wheel requires the downhole cables to be placed in the grooves of the wheel for accurate depth measurements. Refer to the following steps:
• Squeeze the pinch roller latch spring with one hand and with your other hand, rotate the pinch roller assembly upwards until it can go no further (photo 13a).
• Place downhole cables in outer grooves of depth wheel. You will not use the center groove for the CSL-1 test. Pull cables enough to remove any slack in the downhole cable, leaving the hydrophones at bottom of tubes.
• While holding slack from cables, rotate pinch roller assembly back to its LOCK position (photo 13b and photo 13c).
• It is now OK to let go of the cables as the one way clutch in the depth wheel prevents cables from going slack.
13a -Squeeze latch spring and rotate pinch roller assembly upward at the same time, as
13b - Holding wires, rotate pinch roller
assembly back to LOCK position.
13c - Slack adjusted in cable, rollers in LOCK
position.

24
CROSSHOLE SONIC LOGGING (CSL)
www.olsoninstruments.com | www.olsonengineering.com
4.0 CSL FIELD TEST PROCEDURE
You are now ready to begin Field Testing Procedures using CSL. The following are the simplified steps that need to be followed in order to collect data in the field: 1. Set up the equipment at the
test site as described in Section 3 - the CSL Hardware Setup.
2. Place the tripod with depth
wheel 3 - 6 feet (1 - 2m) away from the shaft and ensure the depth wheel is higher in elevation than the tops of the test tubes. Failure to properly elevate the depth wheel will result in slippage and improper depth measurements.
approx. distance: 5 feet

25
CROSSHOLE SONIC LOGGING (CSL)
www.olsoninstruments.com | www.olsonengineering.com
3. Assign tube numbers to each of the test tubes, starting with 1 (one) and increasing in a clockwise order. If testing more than one shaft, it is recommended to have tube 1 on all shafts oriented in the same direction (i.e. northernmost tube).
4. Measure tube spacing for all tube pairs (center of tube to center of tube).

26
CROSSHOLE SONIC LOGGING (CSL)
www.olsoninstruments.com | www.olsonengineering.com
5. Set up data acquisition as described in Section 6.
6. Lower hydrophones in the first tube pair (1 - 2) and ensure cable guides are properly inserted. Inserting the cable guides will prevent abrasion of the cables. Failure to insert the cable guides will decrease the life of the hydrophone cables.
7. Ensure that the tips of the hydrophones are gently resting at the bottom of the test tubes. The hydrophones should be within 3 - 6 inches (7.5 - 15cm) of each other in elevation in order to collect accurate data. The bottom can be felt by removing all slack in the cables and gently raising and lowering the hydrophone several inches (cm).

27
CROSSHOLE SONIC LOGGING (CSL)
www.olsoninstruments.com | www.olsonengineering.com
8. Once the hydrophones are at the proper elevation, lock the cables into the depth wheel to prevent slippage.
9. Test signal as described in Section 6.6. If a strong signal is displayed, proceed to step
10. If the signal is weak (requiring too high a gain) or not seen at all, check all connections and re-adjust hydrophone elevations to ensure they within 3 - 6 inches (7.5 - 15cm) in elevation from each other and not laying on their sides. Test signal and repeat if necessary.
10. Start acquisition as described in Section 6.7 of the manual.
11. Raise both of the hydrophones at same time, at a rate of no faster than 2 ft/second.
(0.6m/s). When the hydrophones reach the top of the test tubes, make sure that the hydrophones are within 6 inches (15cm) or less in elevation of each other. If the elevation difference is greater than 6 inches, (15cm), repeat Steps 5 - 9 for the same tube pair. If the tubes are of different lengths, repeat the log and measure the cables for the source and receiver hydrophones to lower them to the depth of the shortest tube.

28
CROSSHOLE SONIC LOGGING (CSL)
www.olsoninstruments.com | www.olsonengineering.com
12. If the hydrophones are within six inches in elevation of each other, Finish and Save the data set for this tube pair.
13. Place hydrophones and cable guards in the next tube pair. It is strongly recommended to
unlock the depth wheel before moving the hydrophones in order to prevent knocking over the tripod.
14. Repeat Steps 5 - 12 until all tube pairs have been tested.
15. Finish and save the complete data set for all tube pairs tested.
Photo showing field testing setup and procedure

29
CROSSHOLE SONIC LOGGING (CSL)
www.olsoninstruments.com | www.olsonengineering.com
5.0 CSL SOFTWARE SETUP
The software for the CSL System is pre-installed and thoroughly tested at the manufacturer. If for any reason you need to reinstall/uninstall the software, or if you are installing software on a desktop/laptop computer, the steps required are included in this section.
5.1 CSL Software Installation
1. National Instruments Data Acquisition (NIDAQ) software is necessary to run the Olson Instruments CSL program. Your FDPC was supplied with the required version of NIDAQ and a copy was included on a separate CD for installation on your personal computer. The NIDAQ driver can be downloaded at:
http://www.ni.com/ It is very important to uninstall any previous versions of NIDAQ before installing a new version. NIDAQ Version 8.3 is required for Windows XP, Vista and 7 - 32 bit. The software does not operate with 64 bit Windows as of the writing of this manual. If retrieving files from the web, download the necessary zip file. Unzip the file and install the NIDAQ program by running the SETUP file and using the recommended defaults (the minimum possible install options will run the WinTFS software). Note that an account (free of charge) may be required to proceed to the download page.
Installing the CSL Software: 2. Uninstall the previous version of CSL2 3. Run “Setup.exe” from the Olson Instruments installation CD 4. Follow the default setup 5. After finishing the installation, the “CSL2.exe” file will be found on:
drive C:\Program Files\Olson Instruments\CSL2\ . The shortcut to “CSL2.exe” can be placed on the desktop
Failure to install the prerequisites will result in an error when running the CSL software.
Failure to uninstall the previous version of CSL will prevent the installation of the new version.
!
!

30
CROSSHOLE SONIC LOGGING (CSL)
www.olsoninstruments.com | www.olsonengineering.com
5.2 CSL Software Update
Updating the CSL2 Software: 1. For updates to software, the only file that is necessary is the “CSL2.exe” file. This file must
be copied in the drive c:\Program Files\Olson Instruments\CSL2 directory. If not, the shortcut on the desktop references the old version of CSL2. Simply replace the existing “CSL2.exe” by copying and pasting the new version into the directory.
2. Verify the default.prm file is located in the directory listed below:
c:\program files\olsoninstruments\CSL2\ Otherwise a parameter file error will pop up during the initial execution of the software. The default parameter file will be created after “Save Data Parameters” is clicked under the “Acquisition” tab.
5.3 Printer Installation (for Direct Printing only)
1. For Windows 98 Users a. Go to the dos prompt, go to directory c:\windows\system> b. Type: regsvr32 nireports.dll
2. For Windows 2000 Users a. Type: regsvr32 c:\winnt\system32\nireports.dll (in the Run Command line)
3. For Windows XP Users
a. Type: regsvr32 c:\windows\system32\nireports.dll (in the Run Command line)
Please note that the “direct printing” functions are no longer supported by Olson Instruments. It is recommended to use “Word Linking” functions to produce the report.
i

31
CROSSHOLE SONIC LOGGING (CSL)
www.olsoninstruments.com | www.olsonengineering.com
5.4 Microsoft Word Setup (Recommended Function to Produce Reports)
CSL software version 3.0 or higher allows users to link the CSL logs and reports to the MS Word program (version 2002 or higher.) Instructions on how to set up the MS word software to accommodate the CSL software are described in this section: 1. Open the MS Word program
2. Set the margin of MS Word program by going to File/Page Setup. Select the Margin option
and set the left margin at 1” (25.4mm) and right margin at 0.8” (20mm). Finally, click on the “Default” button to save the new setup values into the default file. Failure to perform this step will result in misalignment of logs and the picture of the shaft template.
3. Set the picture’s text wrapping property to be “in front of text” by going to Insert/Picture/From File. Then select any picture in the PC. Click on the picture and go to Format/Picture. Select the “Layout” option, click on “in front of text” option, then select OK. Finally, save the main document onto doc1.dat. Failure to perform this step may result in misalignment of logs and the picture of the shaft template.
5.5 Set Up Company Letterhead for Automatically Generated CSL Report
CSL software version 3.4 or higher allows users to add company letterhead to the top of the front page of the CSL report. The letterhead is required to be in a bitmap format (.bmp) with a maximum height of 1.15 inches. Rename the letterhead file to “letterhead.bmp” and move this file to c:\program files\olson instruments\CSL2\.
5.6 CSL2 Software Uninstallation
1. Click on Start/Settings/Control Panel 2. Select “Add/Remove Programs” 3. Highlight CSL2, select “Remove”
The uninstall process will begin automatically, removing all installed components including shortcuts.

32
CROSSHOLE SONIC LOGGING (CSL)
www.olsoninstruments.com | www.olsonengineering.com
5.7 First Time Running the CSL2 Software
1. Double click on the “Launch CSL.EXE” icon on the desktop
2. An error message “OlsonKey.dat” is not found” will appear on the screen the first time the
software is run. Click ok to proceed to the next step.
3. The tomography option will be disabled without the correct software key registered in the PC
4. To register the software key in the PC, enter any directory in the “Project Name” field, then click on “CSL” button. The main menu will appear on the screen. Go to “Test New Shaft” option. Then go to the menu: Help/Software Key. Finally enter the 9 digit code printed on the front of your CD (See Item 7).

33
CROSSHOLE SONIC LOGGING (CSL)
www.olsoninstruments.com | www.olsonengineering.com
5. Note that the first time the CSL2 software is run and the default parameter file (default.prm) does not exist on the system, one of the warnings below will appear on the screen followed by an applet for data acquisition card selection. The user MUST select one type of National Instruments data acquisition card (E or M) for the Freedom Data PC. This information will affect the gain control during data acquisition. In general, a Freedom Data PC with Transmeta CPU comes with an E card and a Pentium M system comes with an M card.
6. A template warning will appear on the screen the first time the CSL2 software is run. Once the program detects that a template file does not exist, it will automatically generate and save the template file.
7. The Shaft Information screen will appear on the screen. Go to Help/Software Key and enter the 9 digit number printed on the front of your CSL CD. Failure to register the software key on the PC will result in an warning message every time the CSL software is executed.

34
CROSSHOLE SONIC LOGGING (CSL)
www.olsoninstruments.com | www.olsonengineering.com
6.0 GUIDES TO CSL DATA ACQUISITION
6.1 Start CSL Software
1. Locate the "CSL2.exe" file or its shortcut 2. Double click on either the "CSL2.exe" file or the shortcut you created on the desktop 3. The following dialog box should appear on the screen:
4. Perform the following steps:
1. Enter the desired project name in the top entry field. This name will be used to create a new directory (if the directory does not already exist). If the directory already exists, you can also click on the Browse button to select the existing directory.
2. Check the date in the bottom entry field. The correct testing date should appear on the entry. If the date is wrong, enter the correct date. Correct the clock on the Freedom Data PC if necessary.
3. If the user needs to perform a zero offset Crosshole Sonic Logging (the standard horizontal log which will be referred as CSL for the rest of the text), press the Enter key or click the “CSL” button then go to next page. If the user needs to perform tomography tests, click the “Tomography” button then, please consult the Crosshole Tomography manual. Please note that this tomography button will be disabled unless the additional TOMO-1 software is purchased.
Tomography button disabled if Tomo-1 software was not
purchased
1
2
3

35
CROSSHOLE SONIC LOGGING (CSL)
www.olsoninstruments.com | www.olsonengineering.com
A new dialogue box offering six options will open on the screen as shown below.
1. Option 1 — Test New Shaft
Allows users to perform the CSL test to acquire data on new shafts. If this option is selected, please continue to Section 6.2.
2. Option 2 — Retest Existing Shaft
Allows users to continue testing on previously tested shafts. If this option is selected, please continue to Section 6.8.
3. Option 3 — Analyze Shaft
Allows users to analyze data in the office that was previously acquired in the field. If this option is selected, please continue to Section 7.2.
4. Option 4 — Print Report
Allows users to prepare the automated CSL final report. This option will let user customize the report (whether printing full reports or just printing logs). Please note that this option is no longer supported for new customers. It is recommended for new customers to use Option 5 – Link Report to MS Word to produce reports.
5. Option 5 — Link Report to MS Word (optional software feature)
Allows users to link the automatically generated CSL report directly to MS Word. If this option is selected, please continue to Section 8.
6. Option 6 — Generate Output for GeoTom Crosshole Tomograhy Analysis
Allows users to export CSL data (zero offset data) to be processed using 3-D imaging software.
The first and second options “Test New Shaft” and “Retest Existing Shaft” allow users to acquire and post-process the data right after data collection in the field. The remaining options do not allow data acquisition.
1
2
3
4
5
6
i

36
CROSSHOLE SONIC LOGGING (CSL)
www.olsoninstruments.com | www.olsonengineering.com
6.2 Test New Shaft and Set Up Shaft Information
If this is the first time executing the CSL software and the default.prm file does not exist, a dialog box saying “default.prm file not found” will appear on your screen as a warning; simply click OK to clear the message. Then the program automatically generates a default parameter file called default.prm (as mentioned earlier in Section 5.7). This file will be saved in c:\program files\olson instruments\CSL2\. These parameter values can be changed by going to Acquisition/Parameter Setup and can be saved for future use by going to Acquisition/Save Parameter Setup (or F10). The “Test New Shaft” option allows users to perform CSL data collection. The figure below should appear on the screen:
The following 12 steps must be completed as shown in the figure above 1. Enter the name of the shaft to be tested in Entry 1. This name will be used as a filename
saved in the previously created directory. This field input is mandatory.
2. Enter the estimated concrete shaft length in Entry 2. This field is not required. If this field is not filled, an estimated length of 40 ft will be assumed. This shaft length will be used in a real time first arrival time scanning. After the logging process is completed, the actual shaft depth will be calculated based on the depth wheel calibration and the actual number of records collected.

37
CROSSHOLE SONIC LOGGING (CSL)
www.olsoninstruments.com | www.olsonengineering.com
3. Enter an average measured tube stickup height above concrete in Entry 3. This field is not required. This stickup will be used in real time first arrival time scanning only. This data can be changed after the data collection is complete.
4. Check the placement date in Entry 4. The default placement date will be a day before the testing date. Correct this date if it is incorrect. This field is mandatory if the report generation option is desired. However, this placement date can be changed later in the analysis.
5. The test date will be automatically filled using the day in the calendar in the computer. This
field is required if the report generation option is desired. 6. Enter any comments the user might notice during data collection in the Shaft Note box
(Entry 6) such as cracked concrete, water below tops of tubes, etc. To move to the next line in Entry 6, press “Ctrl+Enter”. This field is not required.
7. Change the number of access tubes in Entry 7. This field is mandatory and cannot be
changed later in the analysis. 8. In Entry 8, the user can select three types of CSL test setups; Shaft, Wall and Matrix Wall.
Note that the difference between the Wall and Matrix Wall is that the Wall setup includes a zigzag pattern of tube layouts and the Matrix Wall setup includes a matrix pattern of tube layouts.
9. The CSL software version 2.14 or higher supports user-defined tube templates. Custom
tube templates can be defined, saved and loaded. To define a tube template, click on “Define Tube Template” button. An applet as shown below will appear on the screen. Users can add/remove tubepairs from the pre-defined template. The user-defined template can be saved by clicking on “Save Template” button. Note that the last selected template will be saved in the default file (default.prm) and will be loaded with the program next time. In addition, the button will be enabled if the number of tubes is 3 or higher.

38
CROSSHOLE SONIC LOGGING (CSL)
www.olsoninstruments.com | www.olsonengineering.com
10. If a user defined template was created and saved in Step 9, it can be opened for a later use by clicking on “Load Tube Template”
11. Click on “Tube Spacing” to enter the measured center to center spacing between tube pairs. This option is not mandatory during the data collection, but strongly suggested since some of the scanning parameters are calculated from tube spacing. If they are not entered correctly during data collection, a spacing value of 12 inches will be assumed between each tube pair and the calculated velocity during real time data collection will not be correct. In addition, the real-time scan may not be correct due to the assumed parameters. Note that Group 1 includes perimeter tube pairs and Group 2 includes diagonal tube pairs.
12. The button “Tomography Setup” is available for Tomography testing and is disabled in the CSL option.
13. If user prefers to enter coordinates of the tubes (in terms of X and Y) instead of inputting tube spacings, it can be done by clicking on “Tube Coordinates”. Note that it should be done one way or the other, either entering tube spacings or tube coordinates (Step 11 or Step 13). If information for both are entered, the program will use the tube coordinates to calculate for tube spacings.
14. Click on “View Signal” to proceed to the data acquisition screen (see Section 6.6 for CSL
data acquisition).

39
CROSSHOLE SONIC LOGGING (CSL)
www.olsoninstruments.com | www.olsonengineering.com
6.3 Number of CSL Receivers
The CSL system comes with 2 options; 1 receiver (CSL-1) and 2 receivers (CSL 2). The CSL system with 1 source and 2 receivers allows for faster data collection by simultaneously acquiring data from two tube pairs at the same time. This option can be selected by going to “Acquisition/Number of Receivers”. Then an applet as shown in the figure below will appear on the screen. Select “Different Tubes” option if the two transducers will be inserted into two different tubes to speed up the CSL testing process. However, if angled CSL testing is to be performed, both receivers can be inserted into the same tube with a predefined transducer spacing (select “Same Tube” option in the applet below). In this case, if the receiver from Ch1 is below the receiver from Ch2, a negative number for transducer spacing is entered in the applet. If the receiver from Ch1 is above the receiver from Ch2, a positive number for transducer spacing is used.

40
CROSSHOLE SONIC LOGGING (CSL)
www.olsoninstruments.com | www.olsonengineering.com
Note the number of CSL receivers used is displayed in the upper right corner of the screen as shown below.

41
CROSSHOLE SONIC LOGGING (CSL)
www.olsoninstruments.com | www.olsonengineering.com
6.4 Tube Pair Search
The software runs in either automatic channel search mode or manual mode. Go to the main menu, select "Acquisition/Automatic Tube Pair Search" as shown below. If this option is on, the program will automatically search for an appropriate next tube pair. The order of the search is based on the order set in the tube template. If this option is off, the user must manually input the tube numbers every time after the current testing is complete.
6.5 Enter Card Parameters and MS Word Information
When the CSL Program first runs, it creates a default file that contains necessary information about the data acquisition card and MS version that was supplied with your FDPC. If this information has changed due to a recent upgrade, you may need to reset these parameters. Set your data acquisition card parameters according to the instructions below: Click on “Acquisition” and select “Enter Card and MS Word Information”. If you have an MM model FDPC, check the box for “M Series”. For an earlier Transmetta model FDPC, check the box for “E series”. For your personal computer or laptop, check the box for “No Data Acquisition Card”. Before you leave this dialogue box, check the appropriate box for your version of MS Word.

42
CROSSHOLE SONIC LOGGING (CSL)
www.olsoninstruments.com | www.olsonengineering.com
6.6 Data Acquisition – View Mode
When the data collection screen appears on the monitor, it will be in “VIEW MODE”. In “VIEW MODE”,the program will let the user view the signal (for the purpose of gain setting or auto gaining) without recording the data. When viewing the signal (pulsing data), the waveform will appear on the Waveform Screen (right plot in screen) as shown in the figure below. In the VIEW mode, pushing the “Test” button on the CSL Pulser module automatically sets the gain. The signal amplitude will stabilize after a few seconds (gain will be increased or decreased so that the amplitude of the signal is between 4 – 8 v) if the autogain feature is on (see Section 6.6.4). If the autogain feature is off, the user must manually set gain until the maximum amplitude of the signal is between 4 – 8 v. This gain setting process can be set at the bottom of the shaft if the shaft is sound, or higher up if there is a soft bottom. Before collecting the data, there are a few things that the user should know. This is not mandatory, but useful knowledge. The software will reload the default data collection parameters from the file “c:default.prm” on program start-up, and then will automatically adjust the scan time parameter based on previous input (such as tube spacing).

43
CROSSHOLE SONIC LOGGING (CSL)
www.olsoninstruments.com | www.olsonengineering.com
6.6.1 Data Acquisition Parameters
Once the CSL program is loaded, the acquisition parameters will be recalled from the file “c:default.prm” (except the scan time). If the user desires to change the data parameters, go to the main menu, select Acquisition/Data Parameter (or press F4) and the dialog box as shown below should appear on the screen: Data Parameter Setup: 1. The data parameter dialog box will appear with the default settings. The parameters in the
box on the left hand side are associated with the data collection setup, and the parameters in the box on the right hand side are for the first arrival time scanning routine. The first parameter on the left side is scan time. The initial value of scan time start will be calculated from the input tube spacing (with an assumed faster concrete velocity of 15,000 ft/sec or 4570 meter/sec) and the stop scan time will be 1024 microseconds unless changed by the user.
2. Number of Points / Record is number of sampling points for each waveform. The higher this
value, the more data acquired in each waveform (also dependent on Time/Point). 3. Time/Point is the sampling rate. In this case, the default is set at 2 microseconds. This
means the system will acquire data at 2 microsecond intervals. For the CSL-2 system with 2 transducers, the minimum Time/Point is 2 microseconds and for the CSL-1 system, the minimum Time/Point is 1 microsecond.
44
CROSSHOLE SONIC LOGGING (CSL)
www.olsoninstruments.com | www.olsonengineering.com
4. Depth Wheel Calibration is a calibration number for each depth wheel. In this case, the depth wheel calibration is 2.4. This means that the CSL system will produce a pulse every 2.4 inches (6 cm) at Setting C “Normal”. The default depth wheel calibration is always set at “Normal”. The depth wheel calibration number will not change for other settings such as “High”. The program will adjust the number for other settings.
5. Input Calibration is the full-scale setting of the data collection hardware. This should be left
at 10,000 millivolts for standard CSL-1 and CSL-2 systems. 6. The Depth Wheel Pulse Setting for the Freedom NDT PC and our new Freedom Data PC:
• Freedom NDT PC can be set to 4 different pulse interval options: 1. A (1.5 cm), 2. B (3 cm) 3. C (6 cm) 4. D (7.5 cm)
• Freedom Data PC can be set to 2 different pulse interval options: 1. Normal (C – 6 cm) 2. High (A-1.5 cm)
7. Minimum Threshold is the minimum voltage level that can be accepted as a CSL signal
arrival in millivolts (mV). 8. Threshold 1 is the multiplier that is applied to the maximum background noise in the Noise
Window to set the threshold for each record that the signal must be greater than (positive or negative) to pick the signal arrival time. Threshold 1 must be less than Threshold 2 and a typical value might be 1.5 (range from 0.8 to 2 depending on signal).
9. Threshold 2 is the second multiplier threshold and it must be greater than Threshold 1 and
less than Threshold 3.
10. Threshold 3 is the third multiplier and it must be greater than Threshold 2.
11. Noise Window is a divisor that is used to define the Noise Window preceding the CSL signal. The Noise Window is defined as being between the Start Scan time divided by the Noise Window input to the Start Scan Time.
12. Noise Edit Level is the signal voltage level at which, if a noisy signal (from hydrophone
receiver bouncing) exceeds this value in mV, then the CSL log is marked with a black dot at
The recommended setting for a regular CSL test is Setting C or “Normal” i

45
CROSSHOLE SONIC LOGGING (CSL)
www.olsoninstruments.com | www.olsonengineering.com
the signal arrival time. A typical value is 1000 mV, while setting this value to 10000 mV turns off the automatic Noise Edit Level feature.
After the data parameters are set, the user should save the parameters in “c:default.prm” file by going to the main menu and selecting the "Acquisition/Save Parameter Setup as shown below:
The default.prm file contains acquisition parameter setups and unit settings (English or Metric) i

46
CROSSHOLE SONIC LOGGING (CSL)
www.olsoninstruments.com | www.olsonengineering.com
6.6.2 Automatic Tube Pair Search Option
The software runs in either automatic channel search mode or manual mode. Go to the main menu, select "Acquisition/Automatic Tube Pair Search" as shown below. If this option is on, the program will automatically search for an appropriate next tube pair (based on the order in the tube template). If this option is off, the user must manually input the tube numbers.
6.6.3 CSL-2 System
The software allows users to change the number of receivers (1 or 2) in the data acquisition screen. If 2 receivers are selected, the user can simultaneously acquire data with 2 channels (2 receivers and 1 source). Go to the main menu, select "Acquisition/Number of Receivers/CSL-2 System" as shown below. Note that for the CSL-2 system (2 receivers), the automatic tube pair search feature will be turned off and the tube pairs must be input manually for testing (see Section 6.3 for more information). For the CSL-2 system (with 2 channels), a toggle button (2nd Log) as shown below is used to switch between the first and second logs that are acquired simultaneously. This “2nd Log” button is used during the testing mode and analysis mode for angled CSL logs.
Note that if this parameter is turned off, the user will not be able to turn it back on for the current shaft. To turn off the automatic tube pair search feature, press F5.
i

47
CROSSHOLE SONIC LOGGING (CSL)
www.olsoninstruments.com | www.olsonengineering.com
6.6.4 Gain Control
In “VIEW MODE”, the CSL system automatically adjusts the gain of the amplifier until the peak signal amplitude is between 4 – 8 volts. The software also allows the user to manually adjust and set the gain by going to the main menu and selecting "Acquisition/Gain Control/Manual Gain" (or simply press F2). In the manual gain dialog box, use the mouse to slide the gain control slide bar or press “Alt+I” to increase and “Alt+D” to decrease the gain. To restore auto gain mode, press F3.
Note that if 2 receivers are used, the “2nd Log” button will be enabled for users to view the second log after data acquisition is complete. However, the “2nd log” button will be disabled in the analysis mode even though 2 receivers are used (unless angled CSL testing is performed with 2 receivers). There will be no difference in data analysis for either 1 or 2 receivers system (if the receivers are inserted in two different tubes).
i

48
CROSSHOLE SONIC LOGGING (CSL)
www.olsoninstruments.com | www.olsonengineering.com
6.7 Data Acquisition – Recording Data Mode
Follow step-by-step guidelines for CSL data acquisition: 1. After gain is stabilized in the VIEW MODE (if the autogain feature is on), click on the “Start
Recording” button to proceed to the actual data acquisition process. The word “Recording Data” should appear on the top of the screen as shown in the figure below. Now the system is ready to acquire and record the data and the user can start pulling the CSL cables.
Note that there are four modes of logs available for the real time log display in the CSL software. This includes first arrival time, velocity, time and energy, and waterfall plots. While the user is logging the data, the real time CSL log (as defined by users) and real time wave form are displayed on the screen as shown in the figure on the next page.

49
CROSSHOLE SONIC LOGGING (CSL)
www.olsoninstruments.com | www.olsonengineering.com
2. After the CSL logging process is finished for the current tube pair, click on the “Finish and
Save” button (or press Key “Alt+F”) to recalculate the actual logging depths and save the data. Remember that the shaft depth previously entered in the Shaft Information Screen is just an estimated maximum depth for real-time first arrival time scanning purposes. The actual depth will be calculated after the logging is completed. This step is not mandatory but strongly suggested. If the user does not save the data for the current test tube pair, the data can still be saved later after testing the next tube pair for the same shaft. It is recommended to save the file after finishing each test of each tube pair to prevent accidental lost of data.
3. To continue the CSL test on the next tube pair, click “Next Tube Pair” button (or press Key “Alt+N”).
Real time waveform display
Real time display of first arrival time (in the first
arrival time mode)

50
CROSSHOLE SONIC LOGGING (CSL)
www.olsoninstruments.com | www.olsonengineering.com
In the automatic tube pair search or default mode, the program will display a new screen allowing the user to view untested tube pairs, tested tube pairs, and designate the next tube pair to be tested.
A list of tube pairs appears on the left side of the dialog box (1) and the graphical image of the tested/untested tube pairs is shown on the right side of the dialog box (2). In the graphical display shown in area (2) above, the following are represented with different lines: A. Solid red line represents the tested tube pair B. Dotted blue line represents the untested tube pair C. Heavy solid light blue line represents the next tube pair to be tested There are 7 options that the user can set as shown in the figure above. The program remembers the last option in the parameter default file (go to the main menu/Acquisition/Save Parameter Setup) if the user wants the selected option for future tests. In this case, the graphical image shown in the dialog box has the option of “Show All Tube Pairs”. The figure on the next page shows the same graphical image with a different option (Untested Perimeter Tube Pairs):

51
CROSSHOLE SONIC LOGGING (CSL)
www.olsoninstruments.com | www.olsonengineering.com
The user can also change the source and receiver for the next test. In this case, the next tube pair to be tested is tube Pair 2 - 3. The user can also select to see only the tube pairs that relate to a certain tube by entering the number of the tube in “Related to Tube# ….”. If this value is 0, it means that it will show all the tube pairs that fit one of the seven options the user selected.
In the manual tube pair search mode, the dialog box as shown below should appear on the screen (for CSL-1 system). The user can enter the desired tube number for the source and receiver. In CSL-1, source and receiver tubes can be switched.

52
CROSSHOLE SONIC LOGGING (CSL)
www.olsoninstruments.com | www.olsonengineering.com
4. After completing the CSL tests for all necessary tube pairs in the shaft, either click on the “Home” button (or press “Alt + M”) or go to the main menu, click on "File/New" to go back to the main menu screen. Then select Option 1 – “Test New Shaft” if more shafts are to be tested.
1
2
3
4
5
6

53
CROSSHOLE SONIC LOGGING (CSL)
www.olsoninstruments.com | www.olsonengineering.com
6.8 Retest Existing Shaft
This option allows the user to perform CSL data collection on a previously tested shaft. In order to use this option, the file has to exist. This option will load the existing file and allow the user to retest the tube pairs or add more tests in the shaft. 1. The dialog box as shown in the figure below should appear on the screen to let the user
select the existing shaft (or file). Select the shaft needed to be re-tested and click “open”.
2. The program will load the data from the selected shaft and a screen similar to the one shown in the figure in Section 6.2 should appear with the saved information (such as shaft name, length, stickup, number or tubes, etc.). Then click on the “View Signal” button to proceed to the data acquisition screen.
3. Follow the instructions in Section 6.3. If the selected tube pair has been tested, the program will load the plots with the saved data. If the selected tube pair has not been tested, the plot will appear blank and is ready for data acquisition. For re-testing the tube pair, simply view the signal until the gain is properly set and click on “Start Recording” to start the testing. Please note that the user can simply click on the “Next Tubepair” button until the desired tube pair appears on the screen.

54
CROSSHOLE SONIC LOGGING (CSL)
www.olsoninstruments.com | www.olsonengineering.com
7.0 GUIDES TO CSL DATA ANALYSIS
7.1 Start CSL Software
1. Locate the "CSL2.exe" file or its shortcut 2. Double click on either the "CSL2.exe" file or the shortcut you created on the desktop 3. The following dialog box should appear on the screen:
4. Perform the following steps:
1. Enter the desired project name (or Browse directories) in the top entry field. This name is the existing directory that the CSL files reside in.
2. For data analysis purposes, leave the test date as is. 3. Click on “CSL” button 4. To perform CSL analysis, select Option 3 – Analyze Shaft and proceed to Section 7.2.
Tomography button disabled if Tomo-1 software was not
purchased
1
2
3
4
5
6
1
2
3

55
CROSSHOLE SONIC LOGGING (CSL)
www.olsoninstruments.com | www.olsonengineering.com
7.2 Shaft Analysis – Shaft Information Screen
This option allows the user to analyze the CSL data. This option will not allow the user to re-record the raw waveform. The user can change and resave the processed data (such as time of arrival, energy, etc.), but the waveform data cannot be changed. The following are simple steps to the analysis procedure: 1. The dialog box as shown below should appear on the screen to let the user select an
existing shaft (or file). Select the shaft needed to be analyzed and click “open”.

56
CROSSHOLE SONIC LOGGING (CSL)
www.olsoninstruments.com | www.olsonengineering.com
2. The program will load the data from the selected shaft and the screen as shown below will appear with the saved information (such as shaft name, length, stickup, number of tubes, and tube spacings etc.). The user is allowed to change any information except the number of tubes (these entries will appear disabled with gray color on the screen), maximum log length (this number is calculated from the data), and stick up information (this value can be changed in the waveform screen).
3. Correct the necessary information (such as tube spacings) and proceed to the next screen by clicking “View Signal” button.
4. A waveform-log display will appear on the screen.
5. Continue to Section 7.3 to learn about basic CSL analysis functions.

57
CROSSHOLE SONIC LOGGING (CSL)
www.olsoninstruments.com | www.olsonengineering.com
7.3 Shaft Analysis – Basic CSL Analysis Functions
7.3.1 Key Strokes
Simply use "Alt + Arrow Keys" (Up and Down) or mouse (click approximately at the trace on the plot) to move the cursor to the desired record. If users desire to move faster, use "Alt + Home" to go to the top record, use "Alt + End" to go to the bottom record, use "Alt + Insert" to move 12 records up and use "Alt + Delete" to move 12 records down. Note that the cursor is designed to snap to the line plot so the mouse click has to be at (or close to) the line. The waveform plot (the right plot) shows the current record according to the cursor in the left plot.

58
CROSSHOLE SONIC LOGGING (CSL)
www.olsoninstruments.com | www.olsonengineering.com
7.3.2 Scanning Parameters
If the scanning parameters (such as Scan Time, Threshold Level, Noise Edit Level, etc.) need to be adjusted, go to main menu and select "Acquisition/Parameter Setup". A dialog box below will appear on the screen. The user can remove any of the analysis (scanning) parameters, but is not permitted to change the saved acquisition parameter (such as Time Per Point and Point Per Record). Click on “Scan” to rescan the first arrival time. After changing ANY of the scanning parameters, the user must rescan the data to take into account the new parameters. Section 6.6.1 explains the function of each parameter.
7.3.3 Manual Pick of the Arrival Times
If the automatic scanning routine results in an incorrect pick, the user can correct the pick in the waveform plot by moving the blue cursor to the correct position and clicking on the new location. If the automatic scanning routine yields numerous bad picks, the user might want to change the scan time. After a manual pick has been made, a small black dot will appear on the record (on the left plot). If the black dot appears on the record without the manual pick, it means the waveform has high noise (higher than NSE) and the scanning routine has automatically used the data from the previous record.

59
CROSSHOLE SONIC LOGGING (CSL)
www.olsoninstruments.com | www.olsonengineering.com
7.3.4 Stickup
Click on “Stickup” to input the stickup length of the tested tubes. The dialog box as shown below should appear on the screen. Users can type stickup length into the entry field or left click on the actual location of the stickup on the log plot. Note that the units for the stickup are either in “inches” or “cm”. After inputting the stickup length, the user has the option of either showing the stickup or hiding the stickup. If the “show stickup” option is selected, the plot will be zeroed at the bottom of the stickup and the stickup portion is shown in a negative depth zone. If the “hide stickup” option is selected, the plot will be zeroed at the bottom of the stickup and the stickup portion will not be shown. This stickup value can also be copied to other tubepairs by clicking on “Copy Stickup Value to Other Tubepairs”.
Enter the stickup length or click on the location of the actual stickup

60
CROSSHOLE SONIC LOGGING (CSL)
www.olsoninstruments.com | www.olsonengineering.com
7.3.5 Defect Analyzer
Click on “Defect” button to automatically analyze for defect zones in the shaft. This step is optional. However, if the user wants to use the automated report generation option (see Section 8.0) that comes with the program, this step is required. At this point, the figure below should appear on your screen.
In this dialog box, the user can click on “Auto Defect Analyzer” to let the program look for the defect zones. The defect analyzer function is designed to automatically detect the anomalies including debonding, soft bottom and any low velocity zones in the tubepair. When performing “Auto Defect Analyzer”, the program calculates the average velocity of the entire log and then searches for data points that have a velocity reduction of more than 10%, starting from top to bottom of the tubepair. Once the program finds a location with low velocity, it goes back up to look for the starting location of this anomaly by looking for the first encountered location that has a velocity of at least the average velocity. Then the analyzer starts from the detected low velocity zone and goes down to find the end of this anomaly by looking for the first location that has a velocity of at least the average velocity. Therefore, the starting and ending locations for the defect might be slightly different than the actual locations. In this case, the “Manually Added Defect” feature can be used to correct the locations. The program automatically calculates the velocity reduction by looking for the data point with lowest velocity in the defect zone and computes the velocity reduction based on the mean velocity. When the user manually adds a defect, the velocity reduction can be calculated by using left mouse click on the log plot directly at the point that has lowest velocity in the defect zone. The user can add and delete defects to and from the list. After the defect analyzing process is complete, click on “Done” to save the defects and go back to the previous screen.

61
CROSSHOLE SONIC LOGGING (CSL)
www.olsoninstruments.com | www.olsonengineering.com
7.3.6 Saving Data
After the analysis of the current tube pair is complete, click “Finish and Save” (or press Key “Alt+F”) to save the processed data. To proceed to the next tube pair, click “Next Tubepair” (or press Key “Alt+N”). To go back to the previous tube pair, click “Previous Tubepair” (or press Key “Alt+P”).
7.3.7 Display Options
There are currently 7 different plot options the user can display as shown in the figure below:
1. First Arrival Time (FAT) plot: Alt + 1 or Plot/Log, Plot/Arrival, Time Plot 2. Velocity Plot: Alt + 2 or Plot/Log, Plot/Velocity Plot 3. Energy and FAT Plot: Alt + 3 or Plot/Log, Plot/Energy, and Time Plot 4. Stack Plot: Alt + 4 or Plot/Log, Plot/Stack Plot 5. Waterfall or Z Banded Plot: Alt+5 or Plot/Log, Plot/Z Banded Plot 6. Velocity and Energy Plot: Alt+6 or Plot/Log, Plot/Velocity and Energy Plot 7. Amplitude Ratio Plot: Alt + 8 or Plot/Log, Plot/Topography Plot

62
CROSSHOLE SONIC LOGGING (CSL)
www.olsoninstruments.com | www.olsonengineering.com
7.3.8 Add CSL Logs
The CSL program allows users to add or merge CSL logs from a separate file into a current CSL file. Go to Analysis/Add CSL Log(s) then select the filename of the CSL logs to be added/merged to the current CSL file. If the CSL software detects the same tubepair in both files, the program will display an applet as shown below prompting the user to select the desired file for the repeated tube pairs.
7.3.9 Delete Current Log
The current log can be deleted in the analysis mode by going to Analysis/Delete Current Log. The CSL log on the screen will be permanently deleted. This action can not be reversed if the file is saved after deleting a log.
7.3.10 Set Bottom Depth
The bottom depth of the CSL logs can be set by going to Analysis/Set Bottom Depth. Then an applet will be displayed as shown below. Users can set the bottom depth of the current log or all the logs in the file. Note that the depth of the log will be re-calculated when the user clicks on “Scan” and engages the Scan Function. This process should be set after scanning.

63
CROSSHOLE SONIC LOGGING (CSL)
www.olsoninstruments.com | www.olsonengineering.com
7.3.11 Change Tube Pair Name
The tube number of the tested tube pair can be changed by going to Analysis/Change Tube Pair Name. An applet below should appear on your screen. Enter the correct tube numbers for source and receiver and click on OK. Note that if the new name of the tubepairs already exists, the program will not allow the name change.

64
CROSSHOLE SONIC LOGGING (CSL)
www.olsoninstruments.com | www.olsonengineering.com
8.0 GUIDELINES FOR PRINTING CSL REPORTS
Note that the direct printing functions are no longer supported by Olson Instruments. Currently supported functions for reporting are functions that link the contents to MS Word. Please note that the user needs to set up the MS word program to be compatible with the CSL software before using these functions (see Section 5.4).
8.1 Link CSL Logs to MS Word
To send the logs to MS Word go to File/Send Log(s) to Microsoft Word. There are three options: send only this log, send all logs from this shaft or send all logs from all the tested shafts. Select one of the three options shown in the above dialog box. The following dialogue box will appear on the screen (see next page). The program allows up to 3 logs per page to be linked to MS Word. If more than 1 log per page is set, shaft information and template cannot be included in the print-out due to space limitations. Select “OK” and the software will open up MS Word and send the log(s) to the program. Users can send up to 3 types of logs (Time and Energy, Velocity or Z Banded Plots) to MS Word program.

65
CROSSHOLE SONIC LOGGING (CSL)
www.olsoninstruments.com | www.olsonengineering.com
The software allows the user to print up to three of the same type of logs on the same page. Use “How many logs per page?” to input the number of logs you wish to be displayed on each page. You can also print up to three different types of logs on the same page by checking the box for “Same Page”. If this option is selected, the input box for “How many logs per page?” is disabled and the different types of logs selected are printed on each page. The number of logs printed per page is determined by how many logs are selected.

66
CROSSHOLE SONIC LOGGING (CSL)
www.olsoninstruments.com | www.olsonengineering.com
8.2 Report Generation
This option allows users to link the automatically generated CSL report directly to Microsoft Word (version 2002 and higher). It uses the client information database incorporated into the CSL program. From the Main Menu as shown below, select Option 5 - Link Report to MS Word. The dialog box below should appear on the screen. Users can enter all the required information and save this information in a client file that can be reloaded in the future.
1
2
3
4
5
6

67
CROSSHOLE SONIC LOGGING (CSL)
www.olsoninstruments.com | www.olsonengineering.com
The software automatically generates a CSL summary report, CSL background, a summary table and CSL logs. In addition, company letterhead can be automatically inserted in the report if the “letterhead option” is selected. Click on “Open” to open the shafts to be included with the report. The summary report includes basic client information and a summary of the conditions of the tested foundations including number of defects, locations of each defect, the affected tubepairs as well as the maximum percentage of velocity reduction. The CSL background included in the report is a standard CSL brief written by Olson Engineering, Inc. A summary table included in the report lists the conditions of the shaft (as analyzed and saved in the Defect Analyzer). After the shafts are selected, the CSL software opens the Microsoft Word application and sends the selected report option to the program. The report can then be saved in MS Word format by the user. An example CSL report is included in Appendix A.

68
CROSSHOLE SONIC LOGGING (CSL)
www.olsoninstruments.com | www.olsonengineering.com
9.0 HARDWARE TROUBLESHOOTING
This section will allow the user to check the CSL system to verify everything is working properly. If the recommendations do not solve the problem, or if the particular problem is not covered, please contact Olson Instruments.
9.1 Hardware System Check
There are several procedures which can be used to check the operation of the system prior to data collection, or if problems are encountered during data collection. These procedures are described in the following sections. Note that not all procedures apply to all systems.
9.1.1 INPUT Module Test
The primary way to test the Input Module unit is to set the gain to a high level with a transducer attached, and then go into the ‘View Signal’ mode in the data collection submenu. Press the test switch on the pulser module and observe the screen. If the transducers are connected to the input module and pulser module, and the two transducers are near each other (or horizontally opposed in a water bath or concrete shaft), a signal should appear on-screen. If no pulser transducer is connected (or it is suspected that the pulser is not functioning), the receiver signal on-screen should show noise or other signals on-screen (gain=8000). Tapping the transducer while holding the test button on the module should result in a large signal on-screen. If not, check the signal connections, raise the gain on the amplifier, and make sure that the transducer cables at the cable reel and amplifier module are fully connected as tugging on the short transducer interface cable may pull it part way out of the socket on the cable reel. If all else checks out, but the test signal is still not visible, contact Olson Instruments at 303.423.1212.
9.1.2 PULSER Module Test
Testing the Pulser Module involves one simple test. This test will also verify the functionality of a cable and transducer pair. The test is performed by connecting a transducer to the pulser output and listening for a clicking sound in the transducer when it pulses. To do this, first connect the transducer to a cable, and then the cable to the pulser output. Next, connect the box to power (power light should be on). When the TEST switch is depressed, the transducer should click at 2-20 clicks/second. If no clicking is audible from the transducer, first verify that the computer is turned on and the pulser module firmly seated. If this does not result in the clicking being heard, retest the system with another transducer and/or cable to verify that the problem is not in either of these components. If no combination of cables and transducers produces the clicking sound, then the Pulser Module is suspect and Olson Instruments should be contacted. A final check of both the Pulser and the Input Modules can be made with the two transducers lowered into a water bath. Submerge the source and receiver transducer in water about 30 to 60 cm apart (this must be measured) and check that the velocity of water is measured for the known spacing and water temperature. Typical water velocity at 21 degrees C is 1,493 meters per second.

69
CROSSHOLE SONIC LOGGING (CSL)
www.olsoninstruments.com | www.olsonengineering.com
10.0 FREQUENTLY ASKED QUESTIONS
I cannot follow the tube combination order when I perform the CSL tests. What should I do?
There are a couple ways to handle this situation:
1) If you know the order of tube pairs to be tested at the beginning, simply change the tube template to follow your order. Click on “Define Tube Template” and then you can add/delete tube pairs so that it is in your desired order.
2) If you know from the beginning that you will not be able to follow the tube combination order, turn the Automatic Tubepair "off" in the menu as shown in Section 6.4. If you turn this feature off before you get into the data acquisition screen, you will be able to input the tube pair manually from the first test. If you realize this after you get in the data acquisition screen, you can turn this feature off anyway. Then click on “Next Tube Pair” or “Alt + N” to input the test manually. Remember that once you turn this feature off, you cannot turn it back on again.
My Freedom Data PC reboots itself (due to batteries or other circumstances) before I finish testing the shaft. How do I finish the test on the shaft?
Hopefully you have been saving your data often. You can finish testing by entering “Retest Existing Shaft” from the main menu and recall the filename. Click “View Signal” or “Alt +V” to proceed to the data acquisition screen. The software will start from your first test in “Analysis Mode”. Keep hitting “Next Tube Pair” or “Alt + N” until you reach the tubepair you wish to test. If there is no data in the tubepair, the program will switch to “View Mode”. If you wish to retest the tube pair you already tested (appear in “Analysis Mode”), you can simply click “Start Recording” or Alt + R to retest.
I need to set up all the acquisition parameters and unit every time I run the program. Why?
If you wish to automatically reload your acquisition parameter setup and unit settings every time you run the program, you need to save these parameters by going to the menu and clicking on “Acquisition/Save Parameter Setup”. These parameters will be saved in “default.prm” on your c:\program files\olson instruments\csl2
I accidentally put my test in the wrong tube pair. How do I fix this?
Go ahead and finish your test. You can change the tubepair name in the analysis mode. In the analysis mode, please click on “Next Tube Pair” until you are in the tube pair for which you

70
CROSSHOLE SONIC LOGGING (CSL)
www.olsoninstruments.com | www.olsonengineering.com
want to change the name. Go to the menu and Click on “Analysis/Change Tube Pair Name”. Note that you cannot rename your tube pair after an existing tube pair. If you want to switch between Tube 1 – 2 and 2 – 3, you need to go in to Tube 1 – 2 and change name to “6 – 1” (if you do not have 6 – 1 in your test). Then go into Tube 2 – 3 and change name to Tube 1 – 2. Finally you have to go back to Tube 6 – 1 and change it to Tube 2 – 3. It seems a bit awkward, but it guarantees that you will not need to repeat the tube pair.
When I record the data and pull the cables up, I do not see a line on the screen. What did I do wrong?
If you do not see the log on the screen as you acquire the data or after you scan the data, it is possible that the scan time was set wrong. Press F4 to bring up the parameter setup dialog box and change the first Scan Time to a number less than the actual arrival time. Then close the dialog box by hitting Enter. Finally, press “Alt +S” or click on “Scan” to rescan the data. You should see a log on the left plot.
I would like to print logs directly to the printer. What do I do?
The direct printing commands are no longer supported. You will have to use the commands to link to MS words program instead. See Sections 8.1 and 8.2 for more details
I accidentally collected CSL data from the same shaft in two files. How do I combine the data from both files.
See Section 7.3.8.

71
CROSSHOLE SONIC LOGGING (CSL)
www.olsoninstruments.com | www.olsonengineering.com
APPENDIX A
_______________________________________________________
EXAMPLE CSL REPORT

May 24, 2010
My Construction, Inc.
1234 4th Ave.
Aurora, CO 80011
Attn: Mr. Jimmy John
Phone: 303-123-4567
Fax: 303-123-5678
Email: [email protected]
RE: Report No.8
Crosshole Sonic Logging (CSL) Results
Shafts B871.7 P3 S1 and B872.2 P5 S1
My job site
Abo, New Mexibco
OE Job No: 1234H
Ladies and Gentlemen:
This letter presents the results of Nondestructive Testing (NDT) performed on 2 drilled shaft foundations for
Ames Construction at the above mentioned project in Abo, New Mexico. The CSL testing was performed on May 24,
2010 by James Knox of Olson Engineering, Inc. using the Crosshole Sonic Logging (CSL) Method. The detailed CSL
results are included in Table I and the CSL logs are presented in Appendix A. The following is a brief summary of the
CSL test results:
- The CSL results showed that Shaft B872.2 P5 S1 is sound with no anomalies identified.
- The CSL results showed that Shaft B871.7 P3 S1 had 1 anomaly identified as follows:
1) One anomaly was detected from depths of 23.1 to 25.7 ft (Tubes 2 - 3, 3 - 4, 4 - 5, 5 - 6) resulting in
velocity reductions of up to 42%.
There is not a direct measurement relationship between the low-strain velocity and the high strain strength of
concrete. However, modulus is proportional to velocity squared and based on correlations between modulus and
compressive strength (ACI 228.1R-89), In Place Methods for Determination of Strength of Concrete), strength can be
related to velocity. Based on the relationship that is stated in the American Concrete Institute (ACI) reference, strength
is proportional to modulus squared which translates to strength being proportional to velocity to the power 4. If sizes
and shapes of the defects stated above are desired, Olson Engineering can perform Crosshole Tomography (at additional
cost) to measure the size and shape of the defects. The CSL logs show plots of signal arrival time and signal energy
versus depth for each of the tube pairs tested in the shaft. Tube 1 is always the northernmost tube.

OE Job No: 1234H 73
CLOSURE
For additional information as to the interpretation of the logs, please refer to Table II in this report. If you have
any questions, or require further information, please do not hesitate to call.
Respectfully submitted,
Olson Engineering, Inc.
_____________________________
James Knox
Project Engineer
_____________________________
Yajai Tinkey, Ph.D., P.E.
Associate Engineer
(1 copy faxed or emailed and 2 copies mailed)

OE Job No: 1234H 74
TABLE I
CSL RESULTS SUMMARIES
VELOCITIES, LENGTH, TEST DATE AND ANOMALY ZONES
Shaft Name Avg.
Vel.
(ft/sec)
Test
Length
(ft)
Test Date Age
When
Tested
(days)
Appendix
A
Figure
Numbers
Concrete
Condition
Rating
Anomalous Concrete Zones (Tubes,
Depths, %Velocity Reduction)
B871.7 P3 S1 13300 25.7 05/24/2010 5 1 - 9 P/Q Tubes 2 - 3, Depths 25.3 to 25.7 ft, 16%.
Tubes 3 - 4, Depths 24.8 to 25.5 ft, 29%.
Tubes 4 - 5, Depths 23.1 to 25.5 ft, 21%.
Tubes 5 - 6, Depths 24.6 to 25.7 ft, 42%.
B872.2 P5 S1 14000 31. 05/24/2010 13 10 - 18 G
Notes:* All depths are measured from the top of concrete.
** The percentage of velocity reduction is relative to the measured compression wave velocity of sound concrete
adjacent to the anomalous zone

OE Job No: 1234H 75
TABLE II
CROSSHOLE SONIC LOGGING (CSL) CONDITION RATING CRITERIA
This CSL rating criteria categorizes abrupt increases in the signal arrival times that correspond to decreases in
the average signal velocity of the material between the test probes. These abrupt changes are a result of one or more of
the following conditions: (1) increased signal path length as the signal travels around the flaw; (2) a decrease in the
signal velocity as it travels through a lower velocity material such as weaker concrete, honeycomb, or contaminated
concrete; and (3) deterioration of the bond between the access tube and the concrete. Of the three conditions that cause
increased signal arrival times, the deterioration of the tube-concrete bond is the least common and is typically identified
only in the upper portions of shafts and in shafts with PVC access tubes.
This CSL rating criteria is based on the percentage reduction of the signal velocity through the flawed area
versus the signal velocity through sound material immediately adjacent to the flaw. This ensures that the signal arrival
times used to calculate the signal velocities are measured through the same amount of material, which is very important
if a tube pair is not evenly spaced from shaft top to bottom. This CSL criteria is in large part based on experience with
ultrasonic pulse velocity measurements of structural concrete, which uses signal velocities to determine material
integrity. However, the calculated signal velocities in the CSL testing are reduced by inherent delays due to the slower
water, and PVC tube materials. This signal delay yields artificially lower signal velocity for path lengths of 24 inches
or less. In contrast, the percentage change in signal velocity between good and flawed material is unaffected by
inherent signal delays. Our general rating criteria for CSL results appears below.
Rating NDT Results indicative of Drilled Shaft Concrete Condition
Good (G) No signal distortion and decrease in signal velocity of 10% or less is indicative of good
quality concrete.
Questionable (Q) Minor signal distortion and a lower signal amplitude with a decrease in signal velocity
between 10% and 20%. Results indicative of minor contamination or intrusion and/or
questionable quality concrete. Investigation of anomalies with 10% to 15% reductions
in velocity have identified sound concrete at some sites and flawed concrete at others.
Poor/Defect (P/D) Severe signal distortion and much lower signal amplitude with a decrease in signal
velocity of 20% or more. Results indicative of water slurry contamination or soil
intrusion and/or poor quality concrete.
No Signal (NS) No signal was received. Highly probable that a soil intrusion or other severe defect
has absorbed the signal (assumes good bonding of the tube-concrete interface). If
PVC tubes are used or if measurement is from near the shaft top the tube-concrete
bonding is more suspect.
Water (W) A measured signal velocity of nominally V = 4,800 to 5,000 fps. This is indicative of
a water intrusion or of a water filled gravel intrusion with few or no fines present.

OE Job No: 1234H 76

OE Job No: 1234H 77
Appendix A
CSL Logs

Project Name: 2804h
Shaft Name: B871.7 P3
S1
Test Date: 5/24/2010
Tube Spacing: 25. inches
Cursor Depth: 25.706 ft
- Velocity = 12550 ft/sec
- First Arrival Time =
166. us
- Signal Energy = 0.3842
V-us
B871.7 P3 S1 -- Tubes 1 - 2
-- Arrival Time (us), ** Energy (V - us /5.)0 50 100 150 200 250 300 350 400 450 500
0
1
2
3
4
5
6
7
8
9
10
11
12
13
14
15
16
17
18
19
20
21
22
23
24
25

OE Job No: 1234H 79
Project Name: 2804h
Shaft Name: B871.7 P3
S1
Test Date: 5/24/2010
Tube Spacing: 23.5
inches
Cursor Depth: 25.706 ft
- Velocity = 10760 ft/sec
- First Arrival Time =
182. us
- Signal Energy = 14.35
V-us
B871.7 P3 S1 -- Tubes 2 - 3
-- Arrival Time (us), ** Energy (V - us /5.)0 50 100 150 200 250 300 350 400 450 500
0
1
2
3
4
5
6
7
8
9
10
11
12
13
14
15
16
17
18
19
20
21
22
23
24
25

OE Job No: 1234H 80
Project Name: 2804h
Shaft Name: B871.7 P3
S1
Test Date: 5/24/2010
Tube Spacing: 24. inches
Cursor Depth: 25.523 ft
- Velocity = 13514 ft/sec
- First Arrival Time =
148. us
- Signal Energy = 22.95
V-us
B871.7 P3 S1 -- Tubes 3 - 4
-- Arrival Time (us), ** Energy (V - us /5.)0 50 100 150 200 250 300 350 400 450 500
0
1
2
3
4
5
6
7
8
9
10
11
12
13
14
15
16
17
18
19
20
21
22
23
24
25

OE Job No: 1234H 81
Project Name: 2804h
Shaft Name: B871.7 P3
S1
Test Date: 5/24/2010
Tube Spacing: 21.5
inches
Cursor Depth: 25.523 ft
- Velocity = 6944.4 ft/sec
- First Arrival Time =
258. us
- Signal Energy = 8.509
V-us
B871.7 P3 S1 -- Tubes 4 - 5
-- Arrival Time (us), ** Energy (V - us /5.)0 50 100 150 200 250 300 350 400 450 500
0
1
2
3
4
5
6
7
8
9
10
11
12
13
14
15
16
17
18
19
20
21
22
23
24
25

OE Job No: 1234H 82
Project Name: 2804h
Shaft Name: B871.7 P3
S1
Test Date: 5/24/2010
Tube Spacing: 24. inches
Cursor Depth: 25.706 ft
- Velocity = 10101 ft/sec
- First Arrival Time =
198. us
- Signal Energy = 5.644
V-us
B871.7 P3 S1 -- Tubes 5 - 6
-- Arrival Time (us), ** Energy (V - us /5.)0 50 100 150 200 250 300 350 400 450 500
0
1
2
3
4
5
6
7
8
9
10
11
12
13
14
15
16
17
18
19
20
21
22
23
24
25

OE Job No: 1234H 83
Project Name: 2804h
Shaft Name: B871.7 P3
S1
Test Date: 5/24/2010
Tube Spacing: 20.5
inches
Cursor Depth: 25.523 ft
- Velocity = 10951 ft/sec
- First Arrival Time =
156. us
- Signal Energy = 9.359
V-us
B871.7 P3 S1 -- Tubes 6 - 1
-- Arrival Time (us), ** Energy (V - us /5.)0 50 100 150 200 250 300 350 400 450 500
0
1
2
3
4
5
6
7
8
9
10
11
12
13
14
15
16
17
18
19
20
21
22
23
24
25

OE Job No: 1234H 84
Project Name: 2804h
Shaft Name: B871.7 P3
S1
Test Date: 5/24/2010
Tube Spacing: 46.5
inches
Cursor Depth: 25.523 ft
- Velocity = 12747 ft/sec
- First Arrival Time =
304. us
- Signal Energy = 25.6 V-
us
B871.7 P3 S1 -- Tubes 1 - 4
-- Arrival Time (us), ** Energy (V - us /5.)0 50 100 150 200 250 300 350 400 450 500
0
1
2
3
4
5
6
7
8
9
10
11
12
13
14
15
16
17
18
19
20
21
22
23
24
25

OE Job No: 1234H 85
Project Name: 2804h
Shaft Name: B871.7 P3
S1
Test Date: 5/24/2010
Tube Spacing: 46. inches
Cursor Depth: 25.523 ft
- Velocity = 11759 ft/sec
- First Arrival Time =
326. us
- Signal Energy = 10.23
V-us
B871.7 P3 S1 -- Tubes 2 - 5
-- Arrival Time (us), ** Energy (V - us /5.)0 50 100 150 200 250 300 350 400 450 500
0
1
2
3
4
5
6
7
8
9
10
11
12
13
14
15
16
17
18
19
20
21
22
23
24
25

OE Job No: 1234H 86
Project Name: 2804h
Shaft Name: B871.7 P3
S1
Test Date: 5/24/2010
Tube Spacing: 46. inches
Cursor Depth: 25.523 ft
- Velocity = 13310 ft/sec
- First Arrival Time =
288. us
- Signal Energy = 9.769
V-us
B871.7 P3 S1 -- Tubes 3 - 6
-- Arrival Time (us), ** Energy (V - us /5.)0 50 100 150 200 250 300 350 400 450 500
0
1
2
3
4
5
6
7
8
9
10
11
12
13
14
15
16
17
18
19
20
21
22
23
24
25

OE Job No: 1234H 87
Project Name: 2804h
Shaft Name: B872.2 P5
S1
Test Date: 5/24/2010
Tube Spacing: 34.5
inches
Cursor Depth: 30.606 ft
- Velocity = 19167 ft/sec
- First Arrival Time =
150. us
- Signal Energy = 0.1933
V-us
B872.2 P5 S1 -- Tubes 1 - 2
-- Arrival Time (us), ** Energy (V - us /5.)0 50 100 150 200 250 300 350 400 450 500
0
2
4
6
8
10
12
14
16
18
20
22
24
26
28
30

OE Job No: 1234H 88
Project Name: 2804h
Shaft Name: B872.2 P5
S1
Test Date: 5/24/2010
Tube Spacing: 16.5
inches
Cursor Depth: 30.789 ft
- Velocity = 10742 ft/sec
- First Arrival Time =
128. us
- Signal Energy = 78.14
V-us
B872.2 P5 S1 -- Tubes 2 - 3
-- Arrival Time (us), ** Energy (V - us /5.)0 50 100 150 200 250 300 350 400 450 500
0
2
4
6
8
10
12
14
16
18
20
22
24
26
28
30

OE Job No: 1234H 89
Project Name: 2804h
Shaft Name: B872.2 P5
S1
Test Date: 5/24/2010
Tube Spacing: 28. inches
Cursor Depth: 30.789 ft
- Velocity = 14583 ft/sec
- First Arrival Time =
160. us
- Signal Energy = 126.5
V-us
B872.2 P5 S1 -- Tubes 3 - 4
-- Arrival Time (us), ** Energy (V - us /5.)0 50 100 150 200 250 300 350 400 450 500
0
2
4
6
8
10
12
14
16
18
20
22
24
26
28
30

OE Job No: 1234H 90
Project Name: 2804h
Shaft Name: B872.2 P5
S1
Test Date: 5/24/2010
Tube Spacing: 31.5
inches
Cursor Depth: 30.972 ft
- Velocity = 21169 ft/sec
- First Arrival Time =
124. us
- Signal Energy = 230.9
V-us
B872.2 P5 S1 -- Tubes 4 - 5
-- Arrival Time (us), ** Energy (V - us /5.)0 50 100 150 200 250 300 350 400 450 500
0
2
4
6
8
10
12
14
16
18
20
22
24
26
28
30

OE Job No: 1234H 91
Project Name: 2804h
Shaft Name: B872.2 P5
S1
Test Date: 5/24/2010
Tube Spacing: 19.5
inches
Cursor Depth: 30.789 ft
- Velocity = 10980 ft/sec
- First Arrival Time =
148. us
- Signal Energy = 91.47
V-us
B872.2 P5 S1 -- Tubes 5 - 6
-- Arrival Time (us), ** Energy (V - us /5.)0 50 100 150 200 250 300 350 400 450 500
0
2
4
6
8
10
12
14
16
18
20
22
24
26
28
30

OE Job No: 1234H 92
Project Name: 2804h
Shaft Name: B872.2 P5
S1
Test Date: 5/24/2010
Tube Spacing: 20.5
inches
Cursor Depth: 30.423 ft
- Velocity = 13777 ft/sec
- First Arrival Time =
124. us
- Signal Energy = 85.4 V-
us
B872.2 P5 S1 -- Tubes 6 - 1
-- Arrival Time (us), ** Energy (V - us /5.)0 50 100 150 200 250 300 350 400 450 500
0
2
4
6
8
10
12
14
16
18
20
22
24
26
28
30

OE Job No: 1234H 93
Project Name: 2804h
Shaft Name: B872.2 P5
S1
Test Date: 5/24/2010
Tube Spacing: 49. inches
Cursor Depth: 30.606 ft
- Velocity = 14583 ft/sec
- First Arrival Time =
280. us
- Signal Energy = 49.67
V-us
B872.2 P5 S1 -- Tubes 1 - 4
-- Arrival Time (us), ** Energy (V - us /5.)0 50 100 150 200 250 300 350 400 450 500
0
2
4
6
8
10
12
14
16
18
20
22
24
26
28
30
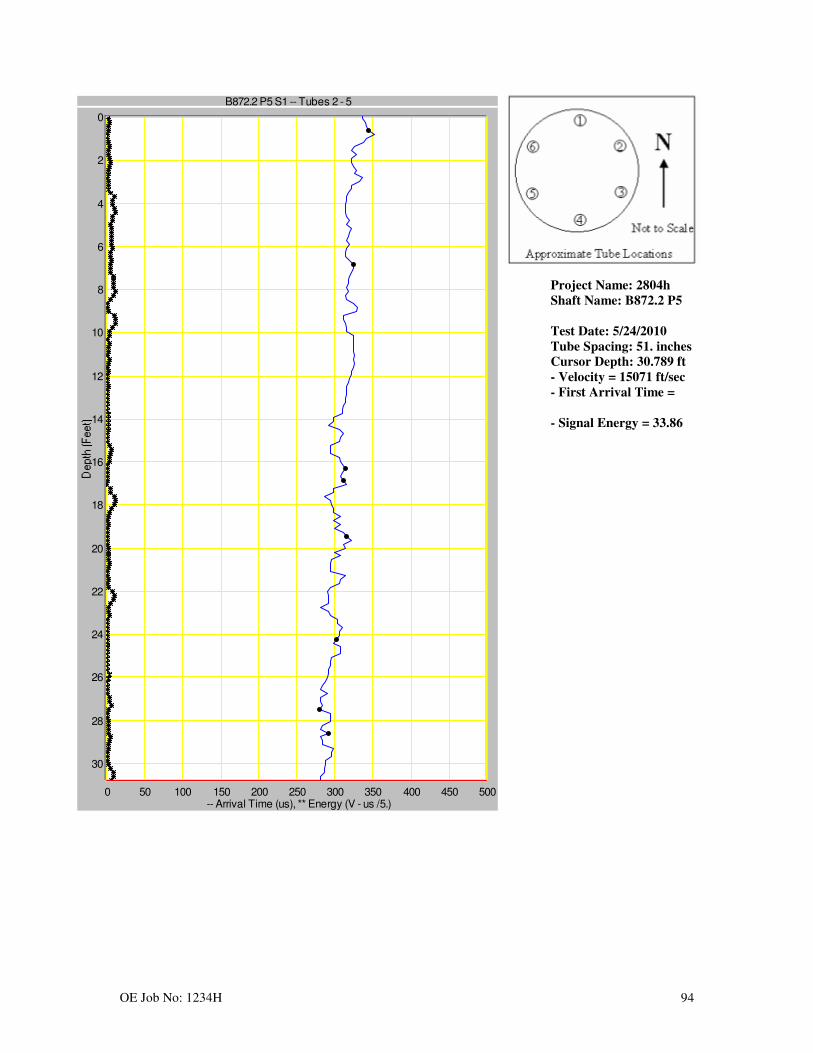
OE Job No: 1234H 94
Project Name: 2804h
Shaft Name: B872.2 P5
S1
Test Date: 5/24/2010
Tube Spacing: 51. inches
Cursor Depth: 30.789 ft
- Velocity = 15071 ft/sec
- First Arrival Time =
282. us
- Signal Energy = 33.86
V-us
B872.2 P5 S1 -- Tubes 2 - 5
-- Arrival Time (us), ** Energy (V - us /5.)0 50 100 150 200 250 300 350 400 450 500
0
2
4
6
8
10
12
14
16
18
20
22
24
26
28
30

OE Job No: 1234H 95
aPPENDIX
Project Name: 2804h
Shaft Name: B872.2 P5
S1
Test Date: 5/24/2010
Tube Spacing: 50. inches
Cursor Depth: 30.789 ft
- Velocity = 13982 ft/sec
- First Arrival Time =
298. us
- Signal Energy = 37.66
V-us
B872.2 P5 S1 -- Tubes 3 - 6
-- Arrival Time (us), ** Energy (V - us /5.)0 50 100 150 200 250 300 350 400 450 500
0
2
4
6
8
10
12
14
16
18
20
22
24
26
28
30

OE Job No: 1234H 96

97
APPENDIX B _______________________________________________________
EXAMPLE CSL SPECIFICATIONS

98
CROSSHOLE SONIC LOGGING (CSL)
www.olsoninstruments.com | www.olsonengineering.com
B1.0 CROSSHOLE SONIC LOGGING (CSL) OF DRILLED SHAFT FOUNDATIONS
The completed drilled shaft foundations shall be tested with the nondestructive testing (NDT) method called Crosshole Sonic Logging (CSL) after at least 1 day (24 hours) of curing time has elapsed to allow the concrete to harden sufficiently. The Engineer may specify a longer minimum time if special retarders, mix designs, or other factors result in slower setting concrete. All CSL testing must be completed within 45 calendar days of concrete placement for steel access tubes, or 10 days for PVC access tubes (PVC tubes can debond from the concrete above the water table for larger shafts at more than 10 days of age). The choice of PVC versus steel tubes should be made in consultation with the CSL testing firm, and will depend on shaft size, testing schedule, and other factors. The CSL tests shall be undertaken by an experienced and approved independent testing organization. The CSL test measures the time it takes for an ultrasonic pulse to travel from a signal source in one access tube to a receiver in another access tube. In uniform, good quality concrete, the travel time between equi-distant tubes will be relatively constant and correspond to a reasonable concrete pulse velocity from the bottom to the top of the foundation. In uniform, good quality concrete, the CSL test will also produce records with good signal amplitude and energy. Longer travel times and lower amplitude/energy signals indicate the presence of irregularities such as poor quality concrete, void, honeycomb and soil intrusions. The signal will be completely lost by the receiver and CSL recording system for the more severe defects such as void and soil intrusions.
B1.1 DRILLED SHAFT FOUNDATION PREPARATION
A number of tubes, typically between 2 to 6, shall be installed in each shaft to permit access for CSL. The number of tubes installed will be as designated on the design drawings for each foundation. If the number and placement of the tubes are not specifically called out on the drawings, then the general guidelines in the table below should be followed. Shaft Diameter Recommended Number of Tubes Tube Spacing
D < 2.5 ft 2 minimum 180° 2.5 < D < 3.5 ft 3 minimum 120° 3.5 < D < 5.0 ft 4 minimum 90° 5.0 < D < 8.0 ft 6 minimum 60° D < 8.0 ft. 8 minimum 45°
The tubes shall be 1.5 to 2.0 inch inside diameter schedule 40 steel or PVC pipe. The pipes shall have a round, regular internal diameter free of defects or obstructions, including any at pipe joints, in order to permit the free, unobstructed passage of 1.35 inch or smaller diameter, typically 6 to 10 inches long, source and receiver probes. The tubes shall be watertight and free from corrosion with clean internal and external faces to ensure passage of the probes and to ensure a good bond between the concrete and the tubes.

99
CROSSHOLE SONIC LOGGING (CSL)
www.olsoninstruments.com | www.olsonengineering.com
The pipes shall each be fitted with a watertight shoe on the bottom and a removable cap on the top. The pipes shall be securely attached to the interior of the reinforcement cage with a minimum cover of 3 inches. The pipes may be attached to exterior of the cage if approved by the Engineer and if the minimum cover requirements are maintained. The tubes shall be installed in each shaft in a regular, symmetric pattern such that each tube is spaced the maximum distance possible from each adjacent tube, with a spacing in degrees around the perimeter of the cage to correspond to the design drawings or that called out in the table above for the selected number of tubes. The tubes are typically wire-tied to the reinforcing cage every 3 feet or otherwise secured such that the tubes stay in position during placement of the rebar cage and concrete placement. The Contractor shall submit to the Engineer his selection of tube material and size, along with his proposed method to install the tubes, prior to construction. The tubes shall be as near to vertical and parallel as possible. The tubes shall extend from the shaft bottoms to at least 3 feet above the shaft tops. Under no circumstance should the tubes be allowed to rest on the bottom of the drilled excavation. If the shaft top is subsurface, the tubes shall extend at least 2 feet above the ground surface. Any joints required to achieve full length tubes shall be made watertight. Care shall be taken during reinforcement installation operations in the drilled shaft hole not to damage the tubes. After placement of the reinforcement cage, the tubes shall be filled with clean water as soon as possible (immediately before or after concrete placement - no later than 4 hours after placement) and the tube tops capped or sealed to keep debris out of the tubes. Care shall be exercised in the removal of caps or plugs from the pipes after installation so as not to apply excess torque, hammering, or other stresses which could break the bond between the tubes and the concrete. Upon completion of the CSL testing, all water shall be removed from the access pipes and any other drilled holes. The pipes and holes shall then be completely filled with an approved grout.
B1.2 CSL TEST EQUIPMENT
The CSL equipment consists of the following components:
- A microprocessor based CSL system for display of individual CSL records, analog-digital conversion and recording of CSL data, analysis of receiver responses and printing of CSL logs - Ultrasonic source and receiver probes for 1.5 or 2 inch I.D. pipe, as appropriate - An ultrasonic voltage pulser to excite the source with a synchronized triggering system to start the recording system - A depth measurement device to determine record depths - Appropriate amplification and cable systems for CSL testing
B1.3 CSL LOGGING PROCEDURES
Information on the shaft bottom and top elevations and/or length, along with construction dates should be provided to the testing organization before or at the time of the CSL tests. CSL tests shall be conducted between pairs of tubes, with the determination of which pairs to be tested to be made as part of the testing contract. Typically, perimeter and/or major diagonal tube

100
CROSSHOLE SONIC LOGGING (CSL)
www.olsoninstruments.com | www.olsonengineering.com
pairs are tested. Additional logs may be conducted in the event any anomalies are detected in the specified logs. The full depth of all pipes shall be used for conducting CSL tests unless approved otherwise by the engineer. Should an access tube be blocked, the Engineer shall determine what action should be taken in response. The CSL tests shall be carried out with the source and receiver probes in the same horizontal plane unless test results indicate potential anomalies/defects in which case the questionable zone may be further evaluated with angled tests (source and receiver vertically offset in the tubes). CSL measurements shall be made at depth intervals of 0.2 feet or less, and shall be done from the bottom to the top of each shaft. The probes shall be pulled simultaneously, starting from the bottoms of the tubes, over the depth measuring device. Any slack shall be removed from the cables prior to pulling to provide for accurate depth measurements in the CSL records. Any anomalies/defects indicated by longer pulse arrival times and significantly lower amplitude/energy signals should be reported to the Engineer on-site and any further tests carried out as required to evaluate the extent of such anomalies defects. Additional NDT methods which could be used include Angled Crosshole Sonic Logging, Crosshole Tomography, Singlehole Sonic Logging, Gamma-Gamma Nuclear Density Logging, and/or Sonic Echo and Impulse Response tests.
B1.4 CSL RESULTS
The CSL results shall be presented in a report. The test results shall include CSL logs with analyses of:
- Initial pulse arrival time or compression wave velocity versus depth - Pulse energy/amplitude versus depth
A CSL log shall be presented for each tube pair tested with any anomaly/defect zones discussed in the report as appropriate.

101
CROSSHOLE SONIC LOGGING (CSL)
www.olsoninstruments.com | www.olsonengineering.com
B1.5 ACCEPTANCE OF COMPLETED DRILLED SHAFT FOUNDATIONS
The acceptance of each drilled shaft shall be the decision of the Engineer, based on the results of the shaft integrity testing report(s) and other information on the shaft placement. Rejection of a shaft based on the shaft integrity testing shall require conclusive evidence that a defect exists in the shaft which will result in inadequate or unsafe performance under service loads. If the NDT records are complex or inconclusive, the Engineer may require coring or excavation of the shaft to verify shaft conditions. If a defect is confirmed, the Contractor shall pay for all coring or excavation costs. If no defect is encountered, the State shall pay for all coring or excavation costs, including grouting of all coreholes. In the case that any shaft is determined to be unacceptable, the contractor shall submit a plan for remedial action to the Engineer for approval. Any modifications to the foundation shafts and load transfer mechanisms caused by the remedial action will require calculations and working drawings stamped by a registered professional engineer for all foundation elements affected. All labor and materials required to perform remedial shaft action shall be provided at no cost to the State and with no extension of the contract time. In the event the equipment or software is functioning incorrectly these are some steps to use to identify why the problem is occurring or what is causing the problem, i.e. bad cable.