refame: rain estimation using forward-adjusted advection of microwave estimates
TRANSCRIPT
REFAME: Rain Estimation Using Forward-Adjusted Advectionof Microwave Estimates
ALI BEHRANGI,* BISHER IMAM, KUOLIN HSU, AND SOROOSH SOROOSHIAN
Center for Hydrometeorology and Remote Sensing, The Henry Samueli School of Engineering, and Department
of Civil and Environmental Engineering, University of California, Irvine, Irvine, California
TIMOTHY J. BELLERBY
University of Hull, Hull, United Kingdom
GEORGE J. HUFFMAN
NASA GSFC Laboratory for Atmospheres and Science Systems and Applications, Inc., Greenbelt, Maryland
(Manuscript received 3 December 2009, in final form 21 August 2010)
ABSTRACT
A new multiplatform multisensor satellite rainfall estimation technique is proposed in which sequences of
Geostationary Earth Orbit infrared (GEO-IR) images are used to advect microwave (MW)-derived pre-
cipitation estimates along cloud motion streamlines and to further adjust the rainfall rates using local cloud
classification. The main objective of the Rain Estimation using Forward-Adjusted advection of Microwave
Estimates (REFAME) is to investigate whether inclusion of GEO-IR information can help to improve the
advected MW precipitation rate as it gets farther in time from the previous MW overpass. The technique
comprises three steps. The first step incorporates a 2D cloud tracking algorithm to capture cloud motion
streamlines through successive IR images. The second step classifies cloudy pixels to a number of predefined
clusters using brightness temperature (Tb) gradients between successive IR images along the cloud motion
streamlines in combination with IR cloud-top brightness temperatures and textural features. A mean pre-
cipitation rate for each cluster is calculated using available MW-derived precipitation estimates. In the third
step, the mean cluster precipitation rates are used to adjust MW precipitation intensities advected between
available MW overpasses along cloud motion streamlines. REFAME is a flexible technique, potentially ca-
pable of incorporating diverse precipitation-relevant information, such as multispectral data. Evaluated over
a range of spatial and temporal scales over the conterminous United States, the performance of the full
REFAME algorithm compared favorably with products incorporating either no cloud tracking or no intensity
adjustment. The observed improvements in root-mean-square error and especially in correlation coefficient
between REFAME outputs and ground radar observations demonstrate that the new approach is effective in
reducing the uncertainties and capturing the variation of precipitation intensity along cloud advection
streamlines between MW sensor overpasses. An extended REFAME algorithm combines the adjusted
advected MW rainfall rates with infrared-derived precipitation rates in an attempt to capture precipitation
events initiating and decaying during the interval between two consecutive MW overpasses. Evaluation
statistics indicate that the extended algorithm is effective to capture the life cycle of the convective pre-
cipitation, particularly for the interval between microwave overpasses in which precipitation starts or ends.
1. Introduction
High-quality precipitation data at fine time and space
resolution have many hydrometeorological applications
including flood forecasting, drought monitoring, disaster
management, and initialization of numerical weather
prediction models, among others. The current constella-
tion of earth observing satellites allows global retrieval
* Current affiliation: Jet Propulsion Laboratory, California
Institute of Technology, Pasadena, California.
Corresponding author address: Ali Behrangi, Jet Propulsion
Laboratory, California Institute of Technology, 4800 Oak Grove
Dr., MS 183-301, Pasadena, CA 91109.
E-mail: [email protected]
DECEMBER 2010 B E H R A N G I E T A L . 1305
DOI: 10.1175/2010JHM1248.1
� 2010 American Meteorological Society
of precipitation data that complement ground precipi-
tation observations from relatively sparse radar/gauge
networks. While high-resolution precipitation remote
sensing is gaining popularity within several scientific
communities, it faces many challenges. The main chal-
lenge is not only to derive high-quality precipitation
intensity from each individual sensor, but also to com-
bine information from different sensors in order to im-
prove consistency, accuracy, coverage, and timeliness
of high-resolution precipitation estimation. Currently,
the two most commonly used types of sensors in space-
based precipitation monitoring are passive microwave
(MW) and infrared (IR) sensors. Microwave sensors,
which are so far available only aboard Low Earth Orbit
(LEO) satellites, are sensitive to cloud hydrometeors
and yield relatively accurate instantaneous precipitation
estimates for those times when the satellite passes over a
given geographical region. On the other hand, IR sen-
sors aboard Geostationary Earth Orbit (GEO) satellites
can only image clouds rather than the hydrometeors
they contain. GEO satellite data alone yield relatively
inaccurate rainfall intensity estimates that nonetheless
provide comprehensive spatial and temporal coverage.
Given that in the latter case, precipitation is indirectly
estimated from cloud forms present in frequent GEO
images, attempts to combine GEO-IR estimates with
the less frequent but higher-quality precipitation infor-
mation from LEO-MW data has been a major research
issue for more than a decade. These efforts, which will
significantly benefit from the anticipated launch and oper-
ation of the National Aeronautics and Space Administra-
tion (NASA) Global Precipitation Measurement (GPM)
mission, can be categorized into four major groups.
The first and most common type of IR–MW combina-
tion approach includes techniques that retrieve precipi-
tation intensity by establishing an empirical relationship
between GEO-IR images and microwave precipitation
estimates to yield an improved, locally calibrated func-
tion mapping IR imagery to surface rainfall rates. This
includes (i) methods that use microwave estimates to
adjust an IR threshold for rain area delineation followed
by rain-rate estimation (Adler et al. 1993; Kummerow
and Giglio 1995; Xu et al. 1999), (ii) probability/histogram
matching methods in which the cumulative distribution
functions of MW rain rates and IR brightness temper-
atures are matched to provide IR-rain-rate equations
under the general assumption that colder clouds statis-
tically produce more intense rainfall (Hong et al. 2004;
Huffman et al. 2007; Kidd et al. 2003; Sorooshian et al.
2000; Todd et al. 2001; Turk et al. 2000), and (iii) regres-
sion methods in which MW estimates are directly related
to coincident IR pixel data to establish a regression-
based equation for rain-rate estimation (Kuligowski 2002;
Martin et al. 1990; Miller et al. 2001; Vicente et al. 1998).
As discussed by Kidd et al. (2003), calibration-based
combination strategies are affected by the inherent
trade-off between the temporal and spatial details of the
calibration domain. A longer calibration time scale al-
lows for better retention of spatial details but at the
expense of short-term variation in the IR–rainfall re-
lationship. Conversely, when calibration uses coincident
MW–IR images, the algorithm can better capture short-
term variability of IR–rainfall relationships, but at the
expense of information regarding their spatial variabil-
ity because of the limited number or coincident samples.
A second combination strategy, which may be used in
concert with the first, focuses on obtaining the ‘‘best’’
local estimate for a given grid box. This approach has
been employed for generating robust medium-resolution
precipitation products as opposed to finer temporal res-
olution time series. The 3B42-RT product of the Tropical
Rainfall Measuring Mission (TRMM) Multisatellite Pre-
cipitation Analysis (TMPA; Huffman et al. 2007) relies
on collecting available MW estimates from various sat-
ellites within a time bracket of 3 h for each cell on a
0.258 3 0.258 grid and then filling gaps in the grid with
MW-calibrated IR estimates. Clearly, the fundamental
differences between what IR and MW instruments
observe may affect the spatial consistency of rainfall
estimates, introducing discontinuities that may be prob-
lematic for studies focusing on rainfall structures. These
problems can arise in other MW–IR algorithms where
the discontinuities in sensor coverage translate into dis-
continuities in product characteristics.
Cloud motion tracking, which is increasingly becom-
ing a common operational application of GEO satellite
imagery, forms the core element of the third combina-
tion strategy. The Climate Prediction Center Morphing
Method (CMORPH; Joyce et al. 2004) estimates a tem-
porally and spatially complete precipitation field, exclu-
sively from MW observations through guided propagation
of precipitation estimates between two MW images us-
ing IR-based cloud tracking. In brief, CMORPH con-
sists of the following steps: 1) the spatial lag correlations
obtained from successively collocated IR images are
used to calculate cloud motion vectors, 2) the relatively
high-quality MW-derived precipitation estimates are
propagated forward in time along the cloud motion vec-
tors until the next MW overpass is reached, 3) the latter
MW precipitation field is propagated backward in time
using the existing motion vectors, and 4) a time-weighted
linear interpolation of the MW precipitation is obtained
by averaging the forward- and backward-propagated
precipitation fields. The interpolation allows for modifi-
cation of shape and intensity (morphing) of the precipi-
tation field between two microwave overpasses.
1306 J O U R N A L O F H Y D R O M E T E O R O L O G Y VOLUME 11
CMORPH has shown good results based on evalua-
tion statistics reported during the Pilot Evaluation of
High-Resolution Precipitation Products (PEHRPP) ini-
tiative as well as in few other studies (Dinku et al. 2008;
Sapiano and Arkin 2009; Tian et al. 2007). However,
a few concerns can be raised. First, the morphed pre-
cipitation product relies on the MW precipitation esti-
mates at the two ends of a cloud advection path. As such,
the method is unable to capture precipitation events
that may form and dissipate between two MW over-
passes such as convective precipitation. More generally,
CMORPH may not result in accurate estimates if the
precipitation field during the morphing process varies
nonlinearly.
The Global Satellite Mapping of Precipitation (GSMaP)_
moving vector with Kalman filter (MVK) algorithm (Ushio
et al. 2009) incorporates the frequently available GEO
information in adjusting the propagated precipitation
field. Although GSMaP_MVK is similar to CMORPH
in propagating the MW-derived precipitation field using
the IR-derived motion vectors, it differs from CMORPH
in that it also uses cloud-top brightness temperatures
to adjust the propagated precipitation intensities along
the motion vectors. More specifically, by considering
the relationship between Tb and precipitation rate and
its associated uncertainties, a Kalman filter is applied
to the propagated precipitation to update the IR–Tb
relationship. The same Kalman gain value may be used
to adjust precipitation intensities along a given mo-
tion vector in both forward- and backward-propagation
stages. The final rain-rate estimate at each interval is
eventually obtained after weighted averaging of the
forward- and backward-propagated precipitation esti-
mates based on the root-mean-square uncertainties as-
sociated with each stage. Note that the CMORPH group
is also pursuing a Kalman filter methodology by using
IR-based estimates to improve their algorithm (Joyce
et al. 2008).
The combination of backward and forward propaga-
tion of MW precipitation estimates is an attempt to
capture the dynamics of growing or decaying precipi-
tation systems. However, the need for a pair of consec-
utive MW observations along the motion vectors, which
are generally separated by a time lag up to 3 h or more,
reduces the effectiveness of this approach in real-time
monitoring of precipitation. Even with GPM in full op-
eration, the revisit time between two MW overpasses
will not improve significantly. Real-time precipitation
monitoring at high time and space resolution is critical
for extreme hydrologic events such as flash floods.
To improve real-time high-resolution estimation of
precipitation rate using GEO-IR-based cloud tracking
and MW data, Bellerby et al. (2009) and Hsu et al. (2009)
developed the Lagrangian Model (LMODEL) algorithm
that combines a high-resolution 2D cloud tracking sys-
tem (Bellerby 2006) and a conceptual semi-Lagrangian
cloud model. The model estimates convective and strat-
iform precipitable water fluxes from GEO imagery and
uses these to model bulk cloud liquid water content and
associated rainfall rates as they evolve along stream-
lines. Model parameters are locally adjusted at MW
overpasses and these adjustments are interpolated along
streamlines between overpasses. State variables are se-
quentially updated using a Kalman filter at each MW
overpass. The method has been tested under the con-
terminous United States and has been demonstrated to
be effective at capturing rainfall variability between MW
overpasses. A weakness of the current LMODEL algo-
rithm is that is does not contain any mechanism to dis-
tinguish between cloud types.
In this study, we propose a new tracking-based MW–
IR rainfall estimation approach that incorporates cloud
classification to improve real-time precipitation estima-
tion. The Rain Estimation using Forward-Adjusted ad-
vection of Microwave Estimates (REFAME) algorithm
computes cloud motion vectors from frequent GEO-IR
cloud-top images using the method developed by Bellerby
(2006). Calculated temperature gradients between suc-
cessive Tb images along with other textural and bright-
ness temperature features are then used to classify GEO
satellite grid boxes into a predetermined number of
clusters. Mean precipitation rates for each cluster are
then derived from time–space-matched MW-derived pre-
cipitation rates in manners similar to the recently reported
Precipitation Estimation from Remotely Sensed Infor-
mation using Artificial Neural Networks–Multispectral
Analysis (PERSIANN-MSA) method (Behrangi et al.
2009b). The cluster mean precipitation rates are used to
adjust the MW precipitation intensities as they are ad-
vected along cloud motion streamlines.
The datasets used in this study are described in sec-
tion 2. The development and structure of the REFAME
algorithm along with few other variations of the algo-
rithm are described in section 3. The variations facilitate
the evaluation of the REFAME. A detailed evaluation
and comparison of the REFAME and the reference
products is provided in section 4. Finally, conclusions
are presented in section 5.
2. Dataset
GEO-IR data from the Climate Prediction Center
(CPC) merged IR dataset (Janowiak et al. 2001) and
MW-derived precipitation estimation from the CPC
merged microwave dataset (Joyce et al. 2004) were ob-
tained for a study region covering the continental United
DECEMBER 2010 B E H R A N G I E T A L . 1307
States (CONUS) for the period June–August 2006. The
CPC IR dataset is a composite of all available GEO-IR
(;11 mm) images, with zenith angle corrections, and is
available at 4-km spatial resolution every 30 min. The
IR data were remapped onto 0.088 spatial resolution
for this study. The CPC merged MW precipitation data
includes data from the Defense Meteorological Sat-
ellite Program (DMSP) Special Sensor Microwave
Imager (SSM/I), Polar Operational Environmental Sat-
ellite (POES) Advanced Microwave Sounding Unit-B
(AMSU-B), the Aqua Advanced Microwave Scanning
Radiometer-E (AMSR-E), and the TRMM Microwave
Imager (TMI) instruments (Ferraro 1997; Ferraro et al.
2000; Kummerow et al. 2001; Weng et al. 2003). As de-
scribed by Joyce et al. (2004), the merged MW precipi-
tation data is obtained via mapping the MW precipitation
estimates to the nearest grid point on rectilinear grids
at ;0.078 latitude–longitude, separately for each half-
hour and for each satellite. For the grids with no pre-
cipitation data, an inverse distance squared weighting
interpolation of the nearest grids with precipitation es-
timate is used. Finally, by implementing an order of pre-
cedence in regions of overlapping sensors, a spatially
complete field of merged MW precipitation estimate
is obtained at ;0.078 latitude–longitude for each half-
hour. Subsequently, in the present work, the merged
product is interpolated to a common 0.088 spatial and
30-min temporal resolution.
The reference precipitation dataset was obtained from
hourly ground-based weather radar systems, provided
by the National Centers for Environmental Prediction
(NCEP) and Environmental Modeling Center (EMC;
Lin and Mitchell 2005). The NCEP/EMC 4-km gridded
radar rainfall estimates were remapped to a 0.088 latitude–
longitude grid maps, compatible with the IR and MW
dataset.
In this study, the first half period (1 June–15 July 2006)
dataset was used for training and calibration purpose
and the rest was used to evaluate the results. The ground
radar precipitation data is the reference for deriving all
statistical measures for REFAME and its variations are
discussed in section 4 in more detail.
3. Methodology
The REFAME technique comprises three steps. In
the first step, cloud motion streamlines are captured from
successive high-resolution (0.048 latitude–longitude every
30 min) IR images using a 2D cloud tracking algorithm
described in section 3a. In the second step, described in
section 3b, the IR grids are classified into predefined
number of classes using brightness temperature (Tb)
gradients between successive IR images along the cloud
motion streamlines in combination with IR cloud-top
brightness temperatures and textural features. Subse-
quently, the mean precipitation rate for each cluster is
calculated using corresponding MW-derived precipita-
tion estimates. This step is conducted using training
samples prior to the testing/validation phase. In other
words, during the testing/validation period the calcu-
lated mean precipitation rate for each class remains
unchanged. In the third step, described in section 3c, the
mean cluster precipitation rates are used to adjust MW
precipitation intensities advected between available
MW overpasses along cloud motion streamlines. In sec-
tion 3d, a potential extension of REFAME is described
in which GEO-IR-derived precipitation is averaged with
REFAME-derived precipitation to account for those
convective precipitations that may not be captured at
the previous MW overpass.
a. High-resolution 2D cloud tracking
This study employs the high-resolution 2D cloud
tracking algorithm developed by Bellerby (2006). The
algorithm matches equivalent cloud pixels location be-
tween a pair of GEO-IR images using a combination of
hierarchical template matching and mesh-based tracking
techniques. The procedure, fully described in Bellerby
(2006), consists of mapping regular mesh grid centers
(nodes) of a given image (image A) to corresponding
locations in the previous image (image B). The mapping
starts at coarse resolution and uses localized template
matching to optimize the local correspondence between
the two images at and near the nodes. The mapped
nodes are then connected to create a convex quadrilateral
mesh over image B. Both the regular grid over image A
and the irregular grid over image B are interpolated
to twice their current resolution before the procedure
is iterated. In this, and subsequent, iterations, the local
image distortion, including rotation and shear, repre-
sented by the irregular mesh are incorporated into the
local image matching process. The matching points on
image B are again joined to form an irregular mesh over
image B and both regular and irregular meshes inter-
polated to double their resolution. These steps demon-
strated in Fig. 1 are then repeated until the original
resolution of the Geostationary Operational Environ-
mental Satellite (GOES) image is reached. To reduce
potentially ambiguous matches, the procedure includes
consistency checking, mesh untangling, and edge effect
management steps. As a result, and at the end of the
procedure, a Lagrangian representation of cloud devel-
opment is obtained that provides, at each cloudy pixel
location in image A, a translational vector that maps the
pixel to its best match in image B, while explicitly incor-
porating the effect of cloud motion, growth, deformation,
1308 J O U R N A L O F H Y D R O M E T E O R O L O G Y VOLUME 11
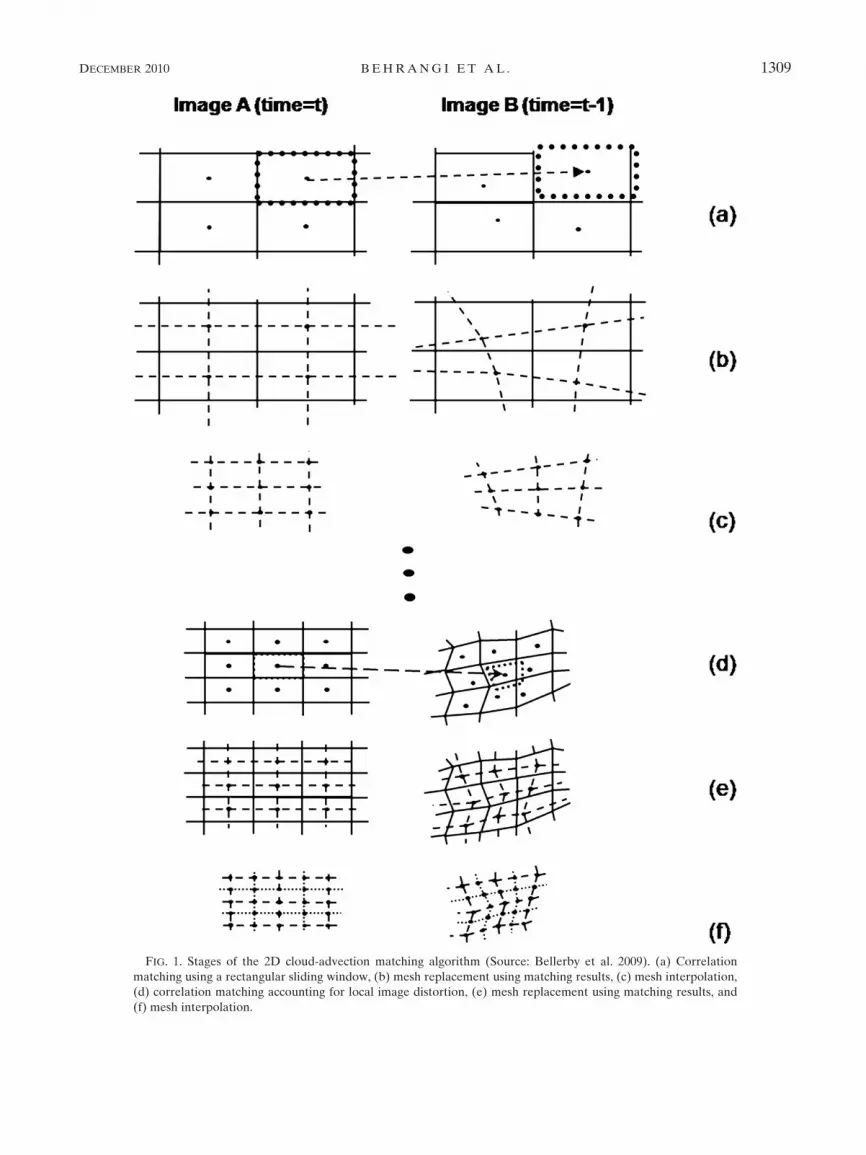
FIG. 1. Stages of the 2D cloud-advection matching algorithm (Source: Bellerby et al. 2009). (a) Correlation
matching using a rectangular sliding window, (b) mesh replacement using matching results, (c) mesh interpolation,
(d) correlation matching accounting for local image distortion, (e) mesh replacement using matching results, and
(f) mesh interpolation.
DECEMBER 2010 B E H R A N G I E T A L . 1309
and dispersal (decay). Case studies show that the algo-
rithm is more effective and accurate in tracking cloud
deformation between successive GOES images than
straightforward single-stage template matching ap-
proaches (Bellerby 2006; Bellerby et al. 2009).
b. GEO input-feature extraction and classification
Because of the strong relation between Tb and cloud
height, frequent high-resolution IR observations of
cloud-top properties from GEO satellite images can
provide information on cloud morphology, texture, and
evolution, which in turn may be used to infer infor-
mation relevant to precipitation intensity. For example,
successive IR images may be used to detect a growing
convective system where a gradient of temperature
change (DTb) along the cloud motion streamlines is
negative. A mature convective system that reaches a
high elevation usually demonstrates very low cloud-top
brightness temperature and small DTb. Stratus clouds,
on the other hand, do not usually demonstrate signifi-
cant DTb along the cloud motion streamline. They also
typically appear horizontally flat in IR imagery, mani-
festing only insignificant changes in Tb between neigh-
boring grid boxes.
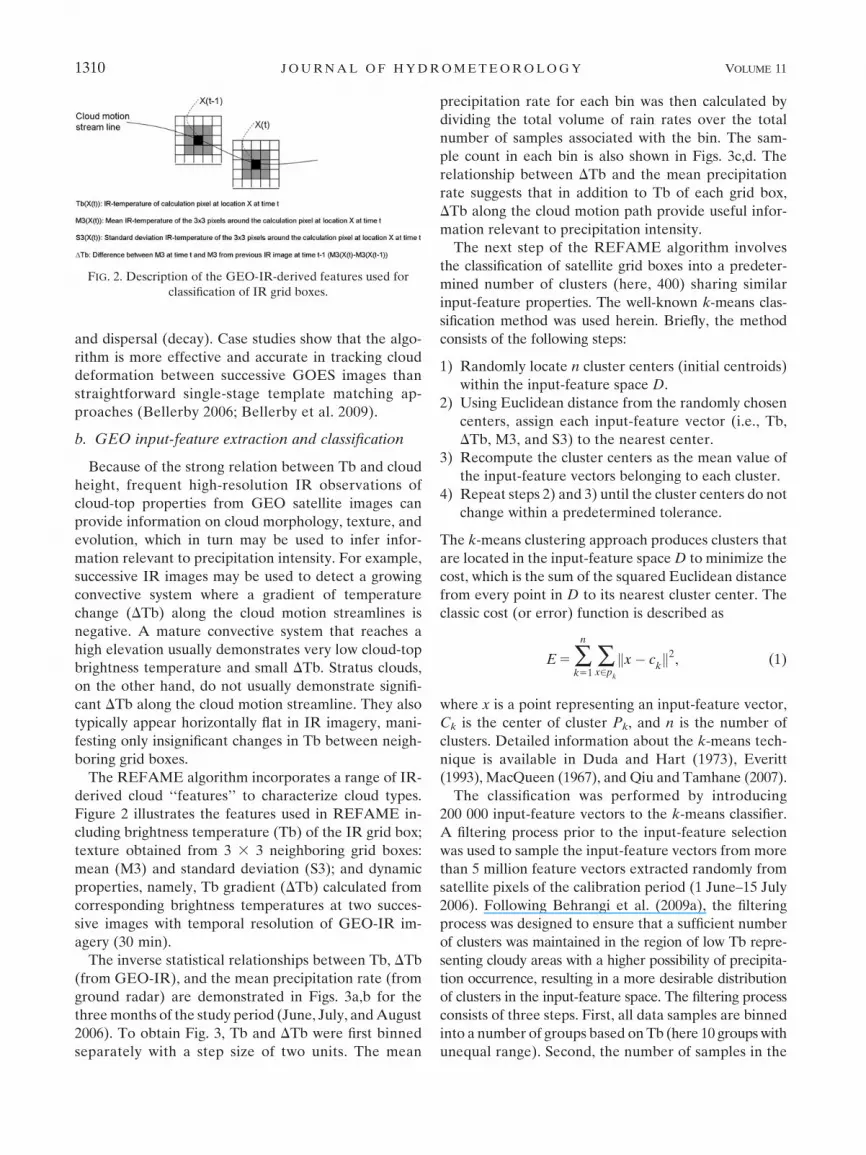
The REFAME algorithm incorporates a range of IR-
derived cloud ‘‘features’’ to characterize cloud types.
Figure 2 illustrates the features used in REFAME in-
cluding brightness temperature (Tb) of the IR grid box;
texture obtained from 3 3 3 neighboring grid boxes:
mean (M3) and standard deviation (S3); and dynamic
properties, namely, Tb gradient (DTb) calculated from
corresponding brightness temperatures at two succes-
sive images with temporal resolution of GEO-IR im-
agery (30 min).
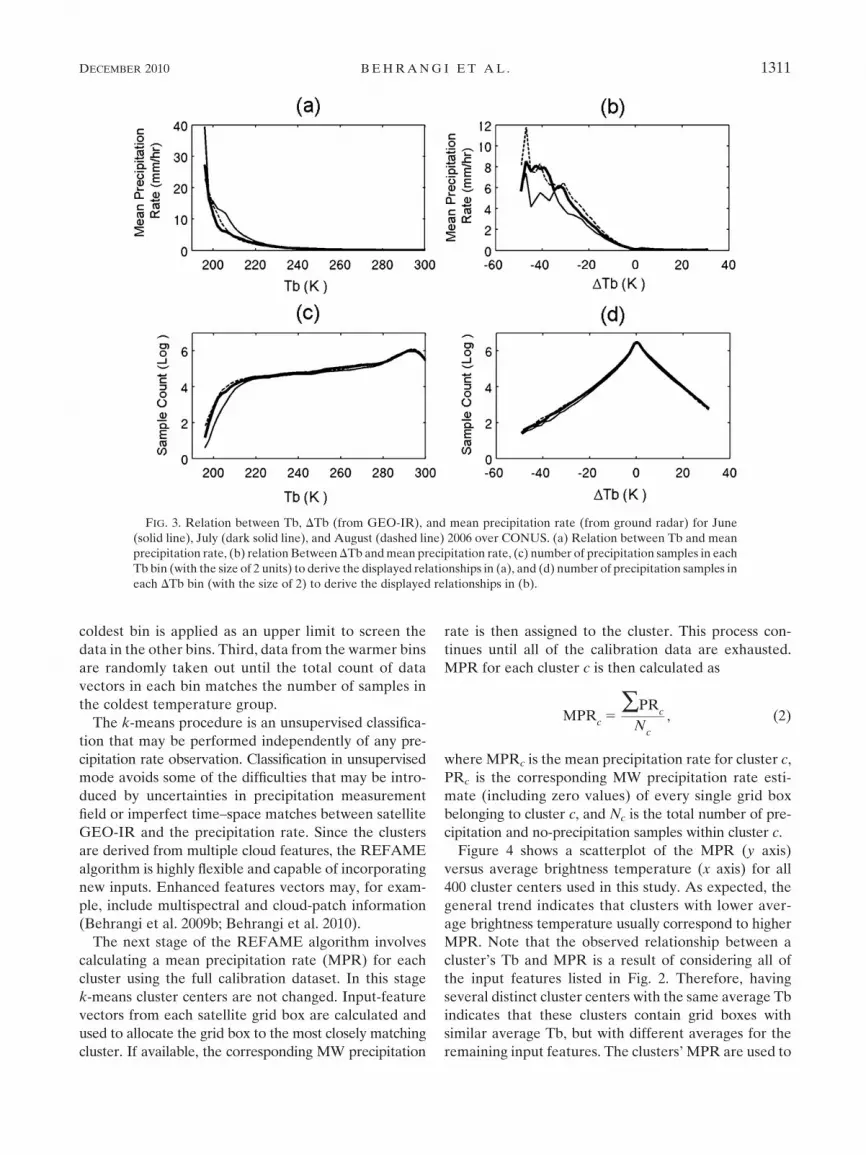
The inverse statistical relationships between Tb, DTb
(from GEO-IR), and the mean precipitation rate (from
ground radar) are demonstrated in Figs. 3a,b for the
three months of the study period (June, July, and August
2006). To obtain Fig. 3, Tb and DTb were first binned
separately with a step size of two units. The mean
precipitation rate for each bin was then calculated by
dividing the total volume of rain rates over the total
number of samples associated with the bin. The sam-
ple count in each bin is also shown in Figs. 3c,d. The
relationship between DTb and the mean precipitation
rate suggests that in addition to Tb of each grid box,
DTb along the cloud motion path provide useful infor-
mation relevant to precipitation intensity.
The next step of the REFAME algorithm involves
the classification of satellite grid boxes into a predeter-
mined number of clusters (here, 400) sharing similar
input-feature properties. The well-known k-means clas-
sification method was used herein. Briefly, the method
consists of the following steps:
1) Randomly locate n cluster centers (initial centroids)
within the input-feature space D.
2) Using Euclidean distance from the randomly chosen
centers, assign each input-feature vector (i.e., Tb,
DTb, M3, and S3) to the nearest center.
3) Recompute the cluster centers as the mean value of
the input-feature vectors belonging to each cluster.
4) Repeat steps 2) and 3) until the cluster centers do not
change within a predetermined tolerance.
The k-means clustering approach produces clusters that
are located in the input-feature space D to minimize the
cost, which is the sum of the squared Euclidean distance
from every point in D to its nearest cluster center. The
classic cost (or error) function is described as
E 5 �n
k51�x2p
k
kx� ckk2, (1)
where x is a point representing an input-feature vector,
Ck is the center of cluster Pk, and n is the number of
clusters. Detailed information about the k-means tech-
nique is available in Duda and Hart (1973), Everitt
(1993), MacQueen (1967), and Qiu and Tamhane (2007).
The classification was performed by introducing
200 000 input-feature vectors to the k-means classifier.
A filtering process prior to the input-feature selection
was used to sample the input-feature vectors from more
than 5 million feature vectors extracted randomly from
satellite pixels of the calibration period (1 June–15 July
2006). Following Behrangi et al. (2009a), the filtering
process was designed to ensure that a sufficient number
of clusters was maintained in the region of low Tb repre-
senting cloudy areas with a higher possibility of precipita-
tion occurrence, resulting in a more desirable distribution
of clusters in the input-feature space. The filtering process
consists of three steps. First, all data samples are binned
into a number of groups based on Tb (here 10 groups with
unequal range). Second, the number of samples in the
FIG. 2. Description of the GEO-IR-derived features used for
classification of IR grid boxes.
1310 J O U R N A L O F H Y D R O M E T E O R O L O G Y VOLUME 11
coldest bin is applied as an upper limit to screen the
data in the other bins. Third, data from the warmer bins
are randomly taken out until the total count of data
vectors in each bin matches the number of samples in
the coldest temperature group.
The k-means procedure is an unsupervised classifica-
tion that may be performed independently of any pre-
cipitation rate observation. Classification in unsupervised
mode avoids some of the difficulties that may be intro-
duced by uncertainties in precipitation measurement
field or imperfect time–space matches between satellite
GEO-IR and the precipitation rate. Since the clusters
are derived from multiple cloud features, the REFAME
algorithm is highly flexible and capable of incorporating
new inputs. Enhanced features vectors may, for exam-
ple, include multispectral and cloud-patch information
(Behrangi et al. 2009b; Behrangi et al. 2010).
The next stage of the REFAME algorithm involves
calculating a mean precipitation rate (MPR) for each
cluster using the full calibration dataset. In this stage
k-means cluster centers are not changed. Input-feature
vectors from each satellite grid box are calculated and
used to allocate the grid box to the most closely matching
cluster. If available, the corresponding MW precipitation
rate is then assigned to the cluster. This process con-
tinues until all of the calibration data are exhausted.
MPR for each cluster c is then calculated as
MPRc5
�PRc
Nc
, (2)
where MPRc is the mean precipitation rate for cluster c,
PRc is the corresponding MW precipitation rate esti-
mate (including zero values) of every single grid box
belonging to cluster c, and Nc is the total number of pre-
cipitation and no-precipitation samples within cluster c.
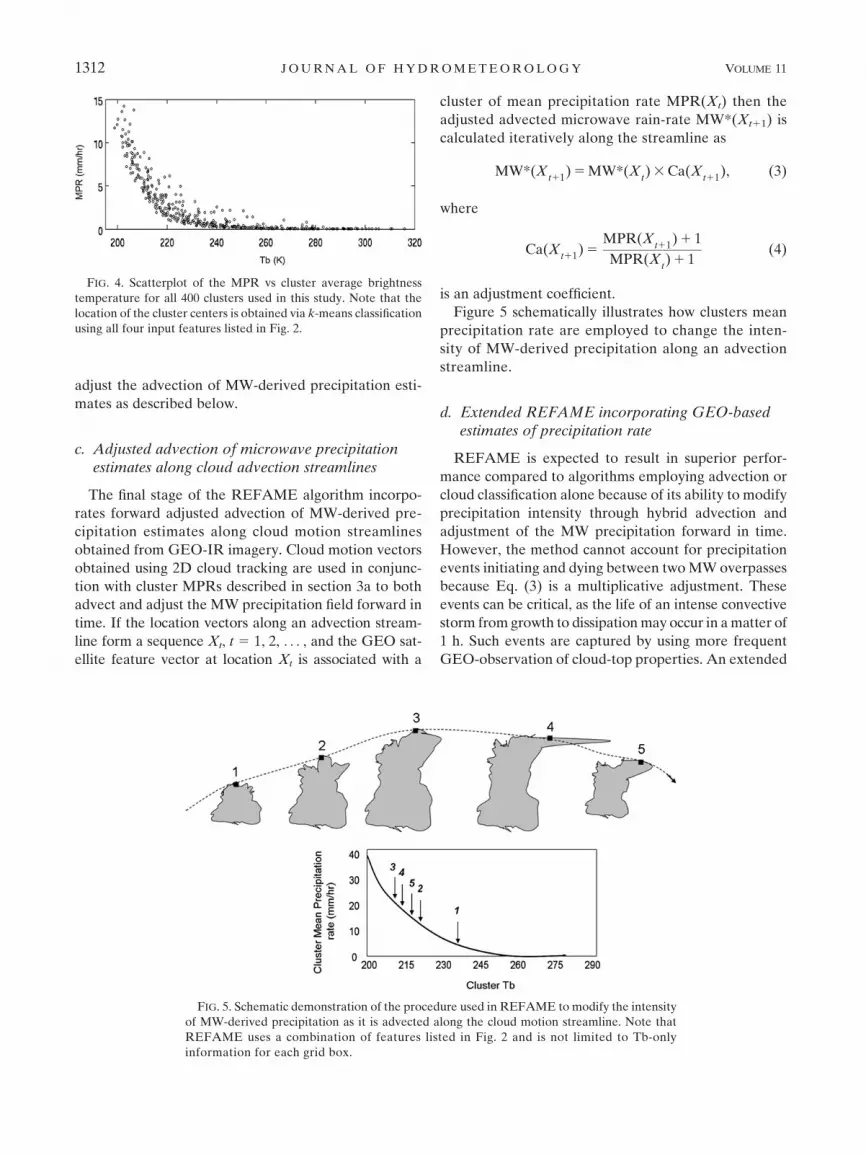
Figure 4 shows a scatterplot of the MPR (y axis)
versus average brightness temperature (x axis) for all
400 cluster centers used in this study. As expected, the
general trend indicates that clusters with lower aver-
age brightness temperature usually correspond to higher
MPR. Note that the observed relationship between a
cluster’s Tb and MPR is a result of considering all of
the input features listed in Fig. 2. Therefore, having
several distinct cluster centers with the same average Tb
indicates that these clusters contain grid boxes with
similar average Tb, but with different averages for the
remaining input features. The clusters’ MPR are used to
FIG. 3. Relation between Tb, DTb (from GEO-IR), and mean precipitation rate (from ground radar) for June
(solid line), July (dark solid line), and August (dashed line) 2006 over CONUS. (a) Relation between Tb and mean
precipitation rate, (b) relation Between DTb and mean precipitation rate, (c) number of precipitation samples in each
Tb bin (with the size of 2 units) to derive the displayed relationships in (a), and (d) number of precipitation samples in
each DTb bin (with the size of 2) to derive the displayed relationships in (b).
DECEMBER 2010 B E H R A N G I E T A L . 1311
adjust the advection of MW-derived precipitation esti-
mates as described below.
c. Adjusted advection of microwave precipitationestimates along cloud advection streamlines
The final stage of the REFAME algorithm incorpo-
rates forward adjusted advection of MW-derived pre-
cipitation estimates along cloud motion streamlines
obtained from GEO-IR imagery. Cloud motion vectors
obtained using 2D cloud tracking are used in conjunc-
tion with cluster MPRs described in section 3a to both
advect and adjust the MW precipitation field forward in
time. If the location vectors along an advection stream-
line form a sequence Xt, t 5 1, 2, . . . , and the GEO sat-
ellite feature vector at location Xt is associated with a
cluster of mean precipitation rate MPR(Xt) then the
adjusted advected microwave rain-rate MW*(Xt11) is
calculated iteratively along the streamline as
MW*(Xt11
) 5 MW*(Xt) 3 Ca(X
t11), (3)
where
Ca(Xt11
) 5MPR(X
t11) 1 1
MPR(Xt) 1 1
(4)
is an adjustment coefficient.
Figure 5 schematically illustrates how clusters mean
precipitation rate are employed to change the inten-
sity of MW-derived precipitation along an advection
streamline.
d. Extended REFAME incorporating GEO-basedestimates of precipitation rate
REFAME is expected to result in superior perfor-
mance compared to algorithms employing advection or
cloud classification alone because of its ability to modify
precipitation intensity through hybrid advection and
adjustment of the MW precipitation forward in time.
However, the method cannot account for precipitation
events initiating and dying between two MW overpasses
because Eq. (3) is a multiplicative adjustment. These
events can be critical, as the life of an intense convective
storm from growth to dissipation may occur in a matter of
1 h. Such events are captured by using more frequent
GEO-observation of cloud-top properties. An extended
FIG. 4. Scatterplot of the MPR vs cluster average brightness
temperature for all 400 clusters used in this study. Note that the
location of the cluster centers is obtained via k-means classification
using all four input features listed in Fig. 2.
FIG. 5. Schematic demonstration of the procedure used in REFAME to modify the intensity
of MW-derived precipitation as it is advected along the cloud motion streamline. Note that
REFAME uses a combination of features listed in Fig. 2 and is not limited to Tb-only
information for each grid box.
1312 J O U R N A L O F H Y D R O M E T E O R O L O G Y VOLUME 11
algorithm (REFAME-GEOmsa) has been developed
to target this problem. REFAME-GEOmsa combines
a GEO-IR-derived precipitation rate with that derived
from REFAME by assigning proper weighs to the ele-
ments of the combination for each time-step difference
from the most recent MW overpass. The development
of the extended algorithm is described below.
1) GEO-IR-DERIVED PRECIPITATION RATE
As discussed in the introduction, a majority of the
GEO-IR-based precipitation estimation algorithms use
power-law regression or histogram-matching techniques
to establish a relationship between cloud-top brightness
temperature and reference precipitation measurements.
The calibrated relationship is then used to estimate pre-
cipitation rate. The common result is that precipitation
rate increases as cloud-top temperature decreases. How-
ever, as shown in Behrangi et al. (2009b) and Behrangi
et al. (2010), the assumption does not always hold.
These and other studies have demonstrated that in addi-
tion to IR brightness temperature other GEO-derived
precipitation-relevant features, such as cloud texture, can
improve precipitation rate estimation from GEO satellites.
Although establishing a relationship between multiple
features and reference precipitation rate is challenging,
the method outlined in section 3a can readily incorporate
multiple features, through the calculated clusters’ MPR,
to estimate gridbox precipitation rate. By employing
a multidimensional clustering/histogram-matching tech-
nique; originally developed for multispectral precipitation
estimation (PERSIANN-MSA; Behrangi et al. 2009b),
GEO-IR precipitation rates are calculated from the GEO
satellite feature vectors described in section 3b. In brief,
clusters are assigned ranks in a descending order based on
their corresponding mean rain rates (highest to lowest).
In parallel, the entire rain-rate sample is also ranked in
descending order. The histogram matching stage then con-
sists of reassigning members of the rain-rate sample into
the above-described clusters according to the number
of samples associated with each cluster. For example,
if cluster C1 with the highest calculated mean rain rate has
N1 samples, the highest N1 rain-rate values are reassigned
to this cluster. The next highest N2 rain-rate values are
reassigned to cluster C2 having N2 samples, and so on for
all of the clusters in the map. The rainfall estimate for a
given cluster is then set equal to the mean of the samples
reassigned to that cluster. Note that the use of histogram-
matched rain-rate values as opposed to the original cluster
means ensures that the resulting rainfall product displays
a realistic dynamic range and accounts for possible mis-
matches between rain-rate and cloud feature locations
in the calibration dataset. As with cloud classification, this
technique may be readily extended to multispectral data.
2) WEIGHTED AVERAGING OF REFAME AND
GEOMSA
REFAME and GEOmsa outputs were linearly com-
bined using weights derived from a comparison of both
products to a ground radar reference dataset. Figures 6a,c
demonstrate that the performance of REFAME, as de-
termined using correlation and root-mean-square error
(RMSE) scores, drops as the time-distance from the pre-
vious MW overpass increases. Figures 6b,d suggest that
the combination weights should be identified with respect
to the time-distance from the last MW overpass. While
the correlation coefficient of REFAME is more sensitive
to time-distance than GEOmsa, it is less sensitive to sam-
ple counts (Figs. 6e,f), particularly as the time-distance
gets larger. The large value of RMSE can be attributed
to the considerable differences between MW-derived
and radar precipitation estimates. Radar precipitation
rates may exceed 100 mm h21 as opposed to MW-derived
precipitation, which does not exceed 50 mm h21. There-
fore, it is expected that the uncertainty in correlation co-
efficient, unlike RMSE, becomes less sensitive to the
existing differences in rain intensity, as the former deals
with patterns and the latter deals with actual values of
precipitation. While RMSE-based combination weights
(Fig. 6d) could be also used, in this study COR was se-
lected as the performance metric to assign combination
weights to REFAME and GEOmsa at each time-distance
(DT ) from previous MW overpasses (Fig. 6b). The com-
bination weights (WREFAME and WGEOmsa) are calcu-
lated by solving the following set of equations:
WREFAME
(DT)
WGEOmsa
(DT)5
CORREFAME
(DT)
CORGEOmsa
(DT), (5)
WREFAME
(DT) 1 WGEOmsa
(DT) 5 1, (6)
where CORREFAME(DT ) and CORGEOmsa(DT ) are cor-
responding correlation coefficients for REFAME and
GEOmsa as compared to the reference ground radar es-
timates at time-distance DT from the most recent MW
estimate along the cloud motion streamlines.
Once the proper weights with respect to the time-
distance from the previous MW overpass were obtained
for each method, the REFAME-GEOmsa is calculated
to identify the precipitation rate for each grid box as
follows:
if DT 6¼ 0,
PRREFAME-GEOmsa
(Xt) 5 W
REFAME(DT)
3 PRREFAME
(Xt)
1 WGEOmsa
(DT) 3 PRGPR
(Xt);
(7)
DECEMBER 2010 B E H R A N G I E T A L . 1313

otherwise,
PRREFAME-GEOmsa
(Xt) 5 MW(X
t), (8)
where PRREFAME-GEOmsa(Xt), PRREFAME(Xt), and
PRGEOmsa(Xt) are the precipitation rate from the al-
ternative product REFAME-GEOmsa, REFAME, and
GEOmsa, respectively, at location X at time t along the
cloud motion streamline.
It must be noted that in the construction of Fig. 6,
the hourly radar precipitation was assumed to have
occurred at uniform intensity during each interval,
which may affect the correlation coefficients and RMSE
values.
4. Evaluation and comparison of results
a. Model validation
REFAME is useful to investigate if inclusion of GEO-
IR information can help to improve the propagated MW
precipitation rate as it gets farther in time from the
previous MW overpass. To assess the contributions made
by the elements of the proposed adjusted-advection pro-
cess, two variations of the algorithm were developed and
compared to REFAME using the ground radar pre-
cipitation rate as reference:
1) Fixed MW precipitation field (MWfix).
2) Forward advection of MW precipitation field
(MWadv).
FIG. 6. Analysis using the ground radar precipitating rate during the calibration period to identify combination
weights to combine REFAME and GEOmsa. (a) COR of REFAME, MWfix and GEOmsa with respect to time-
distance from the most recent MW overpass, (b) correlation-based combination weights (WCOR) for REFAME and
GEOmsa, (c) RMSE of REFAME, MWfix, and GEOmsa with respect to time-distance from the most recent MW
overpass, (d) RMSE-based combination weights (WRMSE) for REFAME and GEOmsa, (e) number of samples
collected during the calibration period to derive the statistics with respect to time-distance from the most recent MW
overpass, and (f) cumulative distribution function of the sample counts with respect to time-distance from the most
recent MW overpass.
1314 J O U R N A L O F H Y D R O M E T E O R O L O G Y VOLUME 11
In MWfix, the MW estimate of precipitation for gridbox B
is kept unchanged both in location and intensity until the
next MW overpass provides new precipitation estimate
for B. This product was considered to provide a MW-only
baseline that does not account for cloud motion, and does
not use IR estimates to adjust MW estimates. MWfix,
therefore, to some extent resembles the near–real time
TMPA (TMPA-RT) scheme in implementing MW-
derived precipitation rate in the final precipitation prod-
uct. However, as described in Huffman et al. (2007) and
summarized in the introduction section of the present
manuscript, TMPA-RT also benefits from a MW-
calibrated IR estimates to fill the remaining gaps within
each time bracket of 3 h. This may lead to considerable
differences between TMPA-RT and MWfix. As will be
shown in the results section, MWfix can result in significant
misplacement of the MW precipitation particularly when
clouds are subject to rapid movement and the time-
distance from previous MW overpass is large. In addi-
tion, the product cannot account for changes in rainfall
intensity.
In MWadv the MW precipitation grid boxes are advec-
ted forward in time along cloud motion streamlines ob-
tained from successive GEO-IR images using the 2D cloud
motion algorithm described in section 3a. Assuming a per-
fect tracking of cloud grid boxes, MWadv is expected to
significantly improve the positioning of MW precipitation,
compared to MWfix. However, it does not account for
changes in precipitation intensity between two successive
MW overpasses as REFAME does. The second variation,
MWadv, is tailored to be similar to the scheme imple-
mented in CMORPH. However, as described in Joyce et al.
(2004) and summarized in section 1, CMORPH also ben-
efits from the backward propagation of the next MW-
precipitation overpass to adjust the precipitation intensity
at the expense of postponing the near real-time estimate
of precipitation intensity for up to few hours. While
by excluding the backward propagation of the next
MW precipitation overpass ‘‘QMORPH’’ (Joyce et al.
2004) is a more timely precipitation product, REFAME
was not compared to QMORPH in the present work. The
main reason is QMORPH uses different tracking strategy
and employs a few other adjustments that make it difficult
to conclude whether the differences between REFAME
and QMORPH are algorithmic or due to the variation of
input features.
Evaluation of REFAME, its variations, and REFAME-
GEOmsa were performed using the hourly ground radar
precipitation data as ‘‘ground truth.’’ Four evaluation
statistics are used: equitable treat score (ETS), correlation
coefficient (COR), RMSE, and BIAS (see the appendix
for detail). ETS is computed through the construction of
a binary contingency table to measure the skill of each
product in delineating rain/no-rain areas. This is attained
by selecting a threshold (0.1 mm h21) above which a pre-
cipitation event is considered to have occurred. The rest of
the statistical indices use quantitative values and measure
how well the products can estimate rain rate compared to
the reference radar rain rate. Table 1 summarizes the
evaluation of 3-h aggregated rainfall products at 0.088 and
0.248 latitude–longitude resolutions. With the exception of
BIAS, a performance gain/loss metric is calculated for
each index to facilitate the comparison against the refer-
ence product (MWfix). The gain/loss performance metric
of a given product is computed as
Gain/Lossscenario
% 5S
scenario� S
MWfix
SMWfix
3 100. (9)
Whether the above performance metric is considered as
gain or loss depends on whether an increase or decrease
of the value of the metric is better or worse. As such,
obtaining a negative performance value for RMSE is
gain while it is considered a loss for the rest of the evalu-
ation indices reported in Table 1.
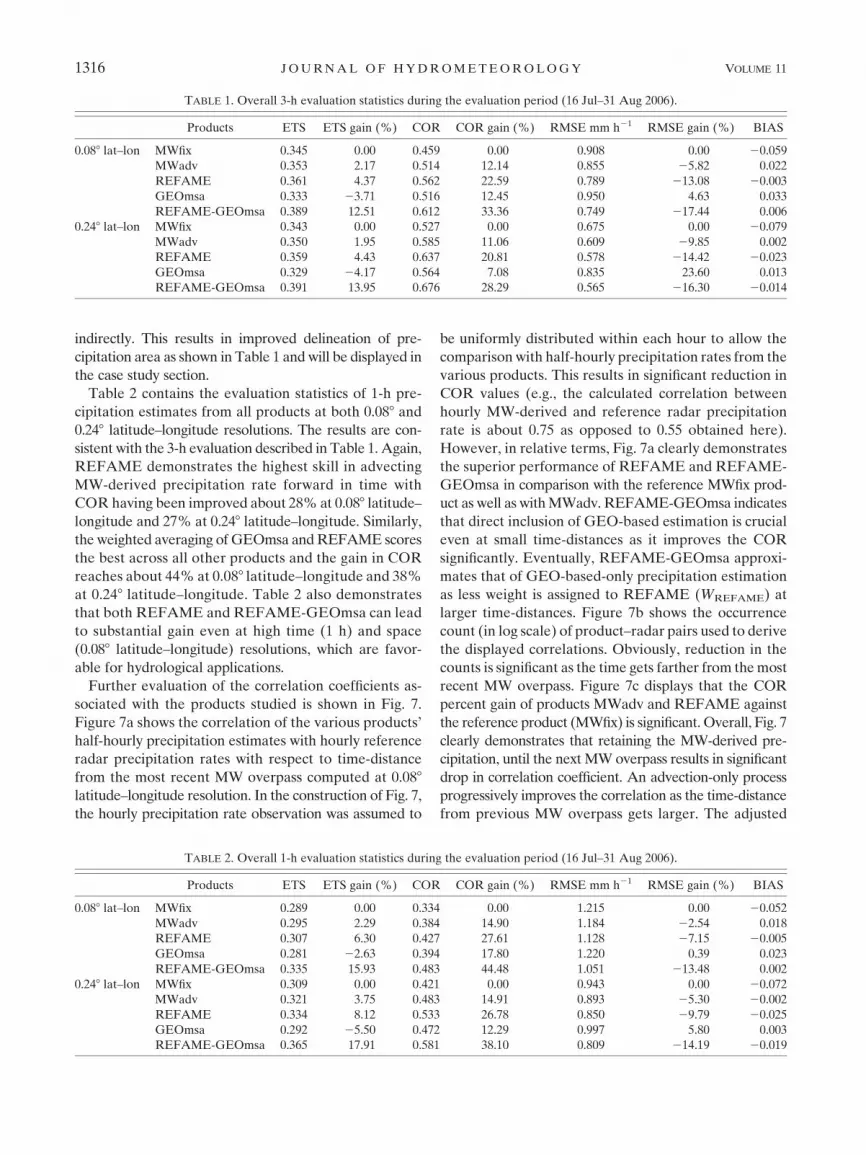
The results in Table 1 highlight several issues: First,
by advecting the MW-derived precipitation rate (MWadv),
the overall evaluation statistics with respect to the refer-
ence product (MWfix) are improved. The largest gain is
reported for the correlation coefficient (;12% at 0.088
latitude–longitude and ;11% at 0.248 latitude–longitude).
Second, REFAME results in significant overall improve-
ment over both MWfix and MWadv. The improvement in
COR (;23% gain at 0.088 latitude–longitude and ;21%
gain at 0.248 latitude–longitude) is more remarkable than
the rest of the evaluation indices. The improved corre-
lation in conjunction with gain in RMSE (;13% at 0.088
latitude–longitude and ;14% at 0.248 latitude–longitude)
implies that REFAME is very effective for both advection
and adjustment of the MW-precipitation rate along the
cloud motion stream lines. Third, REFAME-GEOmsa
results in another significant improvement over all other
products with gains in COR (;33% at 0.088 latitude–
longitude and ;28% at 0.248 latitude–longitude), RMSE
(;17% at 0.088 latitude–longitude and ;16% at 0.248
latitude–longitude), and ETS (;13% at 0.088 latitude–
longitude and ;14% at 0.248 latitude–longitude). Fourth,
all of the products capture the total volume of precipi-
tation quite well when compared to the reference radar
precipitation estimates. One major shortcoming for MWfix,
MWadv, and REFAME is that they rely on the previous
MW observation of precipitation field. As such, they may
fail to capture the start or end of precipitation events be-
tween two MW overpasses. In contrast, the GEO-based
precipitation estimation method estimates precipitation
from frequent IR images, where rapid and short-lived
changes in cloud-top temperature can be monitored, albeit
DECEMBER 2010 B E H R A N G I E T A L . 1315
indirectly. This results in improved delineation of pre-
cipitation area as shown in Table 1 and will be displayed in
the case study section.
Table 2 contains the evaluation statistics of 1-h pre-
cipitation estimates from all products at both 0.088 and
0.248 latitude–longitude resolutions. The results are con-
sistent with the 3-h evaluation described in Table 1. Again,
REFAME demonstrates the highest skill in advecting
MW-derived precipitation rate forward in time with
COR having been improved about 28% at 0.088 latitude–
longitude and 27% at 0.248 latitude–longitude. Similarly,
the weighted averaging of GEOmsa and REFAME scores
the best across all other products and the gain in COR
reaches about 44% at 0.088 latitude–longitude and 38%
at 0.248 latitude–longitude. Table 2 also demonstrates
that both REFAME and REFAME-GEOmsa can lead
to substantial gain even at high time (1 h) and space
(0.088 latitude–longitude) resolutions, which are favor-
able for hydrological applications.
Further evaluation of the correlation coefficients as-
sociated with the products studied is shown in Fig. 7.
Figure 7a shows the correlation of the various products’
half-hourly precipitation estimates with hourly reference
radar precipitation rates with respect to time-distance
from the most recent MW overpass computed at 0.088
latitude–longitude resolution. In the construction of Fig. 7,
the hourly precipitation rate observation was assumed to
be uniformly distributed within each hour to allow the
comparison with half-hourly precipitation rates from the
various products. This results in significant reduction in
COR values (e.g., the calculated correlation between
hourly MW-derived and reference radar precipitation
rate is about 0.75 as opposed to 0.55 obtained here).
However, in relative terms, Fig. 7a clearly demonstrates
the superior performance of REFAME and REFAME-
GEOmsa in comparison with the reference MWfix prod-
uct as well as with MWadv. REFAME-GEOmsa indicates
that direct inclusion of GEO-based estimation is crucial
even at small time-distances as it improves the COR
significantly. Eventually, REFAME-GEOmsa approxi-
mates that of GEO-based-only precipitation estimation
as less weight is assigned to REFAME (WREFAME) at
larger time-distances. Figure 7b shows the occurrence
count (in log scale) of product–radar pairs used to derive
the displayed correlations. Obviously, reduction in the
counts is significant as the time gets farther from the most
recent MW overpass. Figure 7c displays that the COR
percent gain of products MWadv and REFAME against
the reference product (MWfix) is significant. Overall, Fig. 7
clearly demonstrates that retaining the MW-derived pre-
cipitation, until the next MW overpass results in significant
drop in correlation coefficient. An advection-only process
progressively improves the correlation as the time-distance
from previous MW overpass gets larger. The adjusted
TABLE 1. Overall 3-h evaluation statistics during the evaluation period (16 Jul–31 Aug 2006).
Products ETS ETS gain (%) COR COR gain (%) RMSE mm h21 RMSE gain (%) BIAS
0.088 lat–lon MWfix 0.345 0.00 0.459 0.00 0.908 0.00 20.059
MWadv 0.353 2.17 0.514 12.14 0.855 25.82 0.022
REFAME 0.361 4.37 0.562 22.59 0.789 213.08 20.003
GEOmsa 0.333 23.71 0.516 12.45 0.950 4.63 0.033
REFAME-GEOmsa 0.389 12.51 0.612 33.36 0.749 217.44 0.006
0.248 lat–lon MWfix 0.343 0.00 0.527 0.00 0.675 0.00 20.079
MWadv 0.350 1.95 0.585 11.06 0.609 29.85 0.002
REFAME 0.359 4.43 0.637 20.81 0.578 214.42 20.023
GEOmsa 0.329 24.17 0.564 7.08 0.835 23.60 0.013
REFAME-GEOmsa 0.391 13.95 0.676 28.29 0.565 216.30 20.014
TABLE 2. Overall 1-h evaluation statistics during the evaluation period (16 Jul–31 Aug 2006).
Products ETS ETS gain (%) COR COR gain (%) RMSE mm h21 RMSE gain (%) BIAS
0.088 lat–lon MWfix 0.289 0.00 0.334 0.00 1.215 0.00 20.052
MWadv 0.295 2.29 0.384 14.90 1.184 22.54 0.018
REFAME 0.307 6.30 0.427 27.61 1.128 27.15 20.005
GEOmsa 0.281 22.63 0.394 17.80 1.220 0.39 0.023
REFAME-GEOmsa 0.335 15.93 0.483 44.48 1.051 213.48 0.002
0.248 lat–lon MWfix 0.309 0.00 0.421 0.00 0.943 0.00 20.072
MWadv 0.321 3.75 0.483 14.91 0.893 25.30 20.002
REFAME 0.334 8.12 0.533 26.78 0.850 29.79 20.025
GEOmsa 0.292 25.50 0.472 12.29 0.997 5.80 0.003
REFAME-GEOmsa 0.365 17.91 0.581 38.10 0.809 214.19 20.019
1316 J O U R N A L O F H Y D R O M E T E O R O L O G Y VOLUME 11

advection of the MW precipitation rate is superior to
both the products with about 90% gain in correlation
coefficient 2 h after the most recent MW. The improve-
ment continues in time and as the time-distance reaches
about 5 h, the gain is nearly 300% (Fig. 7c).
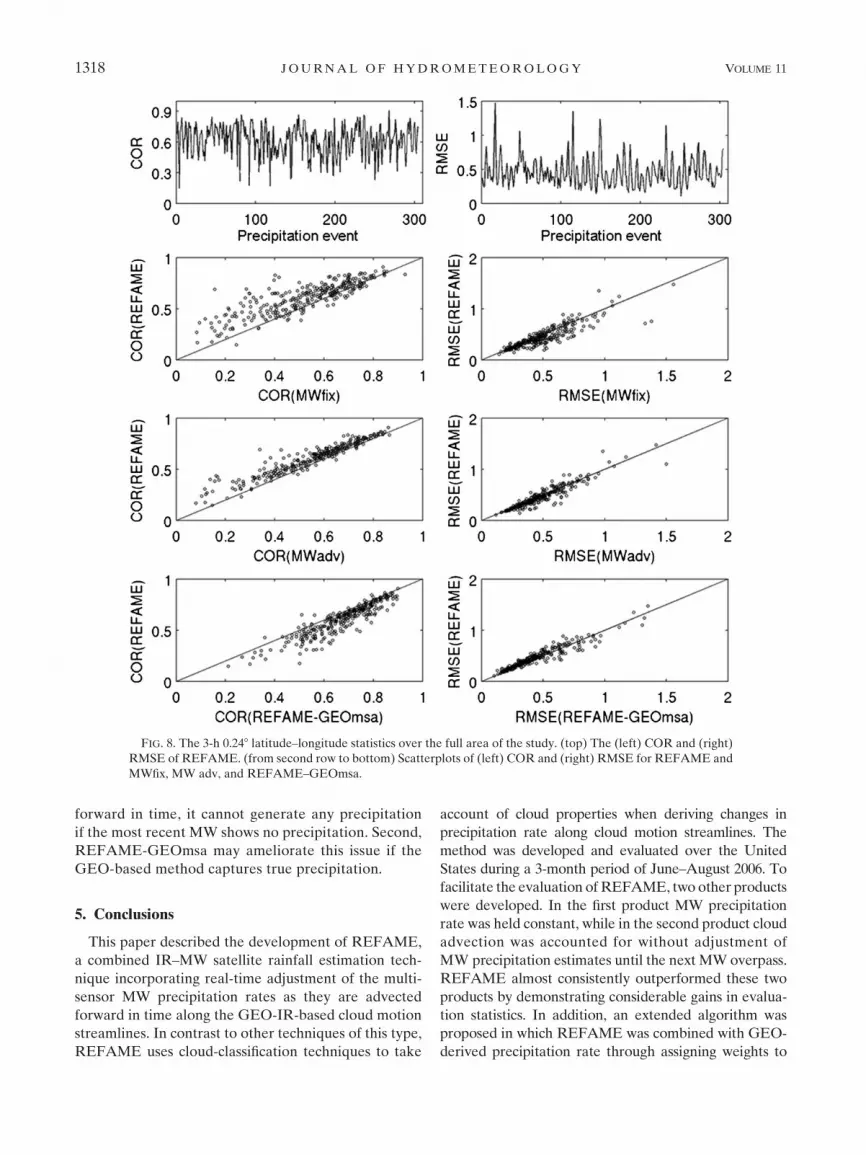
The above discussion focused on statistical measures
that provide summaries of overall performance. It is also
important to examine the performance of the various
products for individual events as identified by the best
matched pairs of observation/estimates. Figure 8 presents
a comparison of COR and RMSE between 3-hourly,
0.248 precipitation estimates obtained from REFAME,
MWfix, MWadv, and REFAME-GEOmsa and corre-
sponding radar observations. Although the comparison
covers the entire evaluation period over the full study
area, 3-h radar precipitation maps associated with the
lowest 10% number of rain grid boxes were excluded
from the analysis to focus on extensive precipitation
events. As seen in the first row, REFAME shows fairly
high COR and low RMSE for a reasonable portion of
the samples. When compared with MWfix and MWadv
(rows 2 and 3), REFAME’s COR and RMSE values
demonstrate superior performance in a majority of cases
as indicated by the large number of points above the
1:1 line for COR and below the 1:1 line for RMSE. The
only product with better overall performance than
REFAME is REFAME-GOEmsa (bottom row).
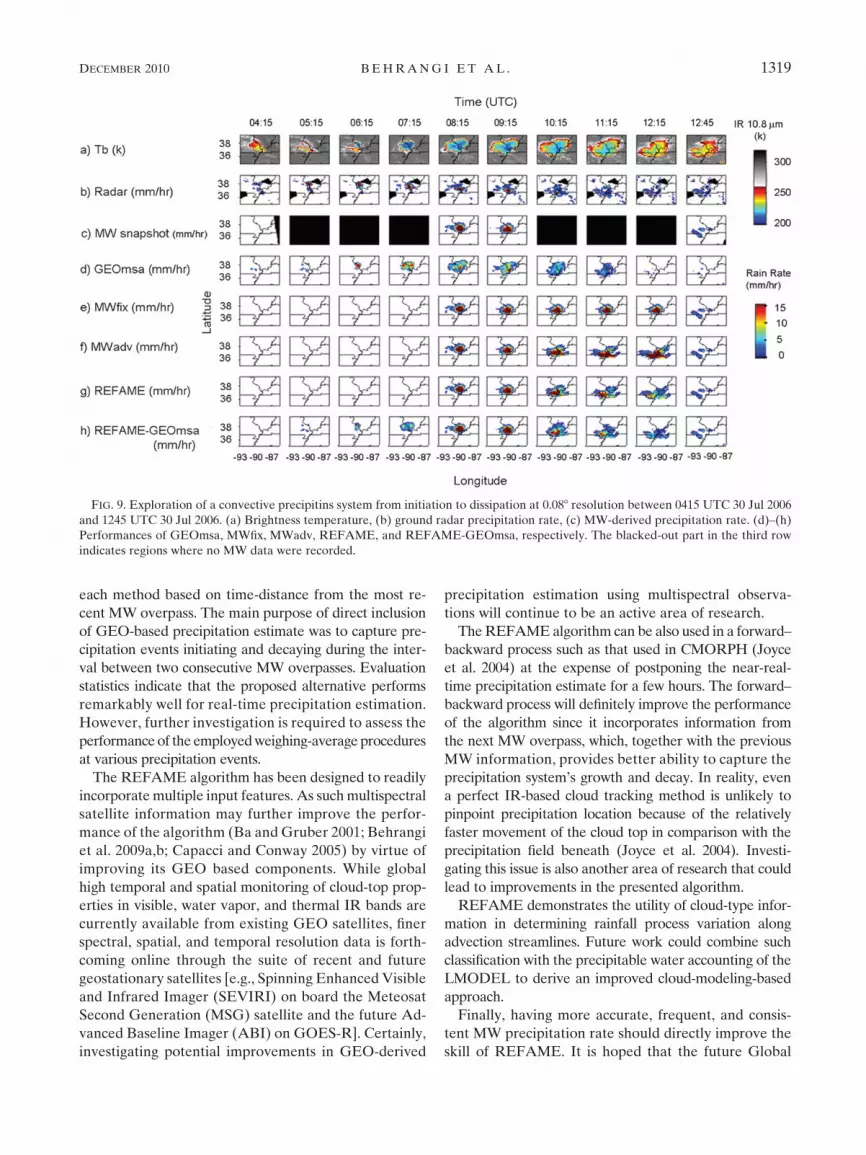
b. Case study: Convective precipitation event
To examine the detailed workings of REFAME, a
case study was investigated that covered a convective
precipitation event from initiation all the way to the
dissipation stage. The event, which is explored at 0.088
resolution, occurred between 0415 UTC 30 July 2006 and
1245 UTC 30 July 2006. Figure 9 shows brightness tem-
perature (IR10.7 mm) and ground radar rain-rate maps
in addition to the various satellite rainfall products. The
third row displays the MW-derived precipitation maps
for all available MW overpasses with missing data shown
in black.
Starting at 0415 UTC, both ground radar and GEO-
msa show scattered precipitation, indicating the initia-
tion stage of the convective system. No precipitation is
captured by MW, and thus no precipitation is estimated
from MWfix, MWadv, and REFAME until 0815 UTC.
At 0815 and 0915 an MW sensor passes over the con-
vective system, which is already in its mature stage.
Although MW and radar demonstrate major discrep-
ancies in detecting precipitation area and estimating its
intensity, both indicate that the convective system has
reached to its mature state. On the other hand, the fre-
quent observation of cloud-top Tb clearly shows the
system’s growth as it gradually gets colder at top and the
area of the cold region gets larger. Therefore, GEOmsa
and as a result REFAME-GEOmsa fairly well capture
the convective growth. During the dissipation stage no
MW overpass is available until 1245 UTC where the
precipitation field has nearly faded. Meanwhile, MWfix
and MWadv continue to show the large intense pre-
cipitation area as estimated from the most recent MW
observation at 0915 UTC. However, at 1245 UTC, the
large intense precipitation field is abruptly replaced by
a smaller low intensity precipitation field. The observed
expansion in precipitation area in MWadv (row 6) can
be attributed to the ability of the 2D cloud hierarchical
tracking algorithm to account for cloud divergence as
discussed in Bellerby (2006). Guided by Tb obser-
vations, REFAME adjusts the MW precipitation in-
tensities as advected along the cloud motion stream
lines and demonstrates, contrary to MWFix, a fairly
smooth transition toward the next MW-derived pre-
cipitation field at 1245 UTC. As expected, the dissipa-
tion trend is also captured by both GEOmsa method and
REFAME-GEOmsa, which agrees with radar precip-
itation maps as well. By exploring the convective sys-
tem two issues need to be highlighted: first, although
REFAME has the ability to include GEO-IR-derived
input features to adjust the MW precipitation intensities
FIG. 7. Analyzing the correlation coefficient of the developed
products with respect to time-distance from the most recent MW
overpass. In this figure the evaluation dataset is used (16 Jul–
31 Aug 2006). Hourly ground radar precipitation rate is assumed
uniform in time to serve as a reference for comparing the half-hourly
precipitation rates derived from different products. (a) Correlation
coefficient, (b) number of available samples at each time-distance to
derive the correlation coefficients reported in (a), and (c) correlation
gain for MWadv and REFAME calculated from Eq. (9).
DECEMBER 2010 B E H R A N G I E T A L . 1317
forward in time, it cannot generate any precipitation
if the most recent MW shows no precipitation. Second,
REFAME-GEOmsa may ameliorate this issue if the
GEO-based method captures true precipitation.
5. Conclusions
This paper described the development of REFAME,
a combined IR–MW satellite rainfall estimation tech-
nique incorporating real-time adjustment of the multi-
sensor MW precipitation rates as they are advected
forward in time along the GEO-IR-based cloud motion
streamlines. In contrast to other techniques of this type,
REFAME uses cloud-classification techniques to take
account of cloud properties when deriving changes in
precipitation rate along cloud motion streamlines. The
method was developed and evaluated over the United
States during a 3-month period of June–August 2006. To
facilitate the evaluation of REFAME, two other products
were developed. In the first product MW precipitation
rate was held constant, while in the second product cloud
advection was accounted for without adjustment of
MW precipitation estimates until the next MW overpass.
REFAME almost consistently outperformed these two
products by demonstrating considerable gains in evalua-
tion statistics. In addition, an extended algorithm was
proposed in which REFAME was combined with GEO-
derived precipitation rate through assigning weights to
FIG. 8. The 3-h 0.248 latitude–longitude statistics over the full area of the study. (top) The (left) COR and (right)
RMSE of REFAME. (from second row to bottom) Scatterplots of (left) COR and (right) RMSE for REFAME and
MWfix, MW adv, and REFAME–GEOmsa.
1318 J O U R N A L O F H Y D R O M E T E O R O L O G Y VOLUME 11
each method based on time-distance from the most re-
cent MW overpass. The main purpose of direct inclusion
of GEO-based precipitation estimate was to capture pre-
cipitation events initiating and decaying during the inter-
val between two consecutive MW overpasses. Evaluation
statistics indicate that the proposed alternative performs
remarkably well for real-time precipitation estimation.
However, further investigation is required to assess the
performance of the employed weighing-average procedures
at various precipitation events.
The REFAME algorithm has been designed to readily
incorporate multiple input features. As such multispectral
satellite information may further improve the perfor-
mance of the algorithm (Ba and Gruber 2001; Behrangi
et al. 2009a,b; Capacci and Conway 2005) by virtue of
improving its GEO based components. While global
high temporal and spatial monitoring of cloud-top prop-
erties in visible, water vapor, and thermal IR bands are
currently available from existing GEO satellites, finer
spectral, spatial, and temporal resolution data is forth-
coming online through the suite of recent and future
geostationary satellites [e.g., Spinning Enhanced Visible
and Infrared Imager (SEVIRI) on board the Meteosat
Second Generation (MSG) satellite and the future Ad-
vanced Baseline Imager (ABI) on GOES-R]. Certainly,
investigating potential improvements in GEO-derived
precipitation estimation using multispectral observa-
tions will continue to be an active area of research.
The REFAME algorithm can be also used in a forward–
backward process such as that used in CMORPH (Joyce
et al. 2004) at the expense of postponing the near-real-
time precipitation estimate for a few hours. The forward–
backward process will definitely improve the performance
of the algorithm since it incorporates information from
the next MW overpass, which, together with the previous
MW information, provides better ability to capture the
precipitation system’s growth and decay. In reality, even
a perfect IR-based cloud tracking method is unlikely to
pinpoint precipitation location because of the relatively
faster movement of the cloud top in comparison with the
precipitation field beneath (Joyce et al. 2004). Investi-
gating this issue is also another area of research that could
lead to improvements in the presented algorithm.
REFAME demonstrates the utility of cloud-type infor-
mation in determining rainfall process variation along
advection streamlines. Future work could combine such
classification with the precipitable water accounting of the
LMODEL to derive an improved cloud-modeling-based
approach.
Finally, having more accurate, frequent, and consis-
tent MW precipitation rate should directly improve the
skill of REFAME. It is hoped that the future Global
FIG. 9. Exploration of a convective precipitins system from initiation to dissipation at 0.088 resolution between 0415 UTC 30 Jul 2006
and 1245 UTC 30 Jul 2006. (a) Brightness temperature, (b) ground radar precipitation rate, (c) MW-derived precipitation rate. (d)–(h)
Performances of GEOmsa, MWfix, MWadv, REFAME, and REFAME-GEOmsa, respectively. The blacked-out part in the third row
indicates regions where no MW data were recorded.
DECEMBER 2010 B E H R A N G I E T A L . 1319
Precipitation Measurement (GPM) mission will be a
significant step toward such estimates. The REFAME
concept is currently under development for operational
implementation. The operational product will be com-
pared with the existing products in a future work and
hopefully over the International Precipitation Working
Group (IPWG) validation sites (Ebert et al. 2007).
Acknowledgments. Partial financial support was made
available from NASA Earth and Space Science Fel-
lowship (NESSF Award NNX08AU78H), NASA-PMM
(Grant NNG04GC74G), NOAA/NESDIS GOES-R Pro-
gram Office (GPO) via the GOES-R Algorithm Working
Group (AWG), NSF STC for Sustainability of Semi-Arid
Hydrology and Riparian Areas (SAHRA; Grant EAR-
9876800), and NASA NEWS (Grant NNX06AF934)
programs. The authors thank Mr. Dan Braithwaite for
his technical assistance on processing the satellite/radar
data for this experiment.
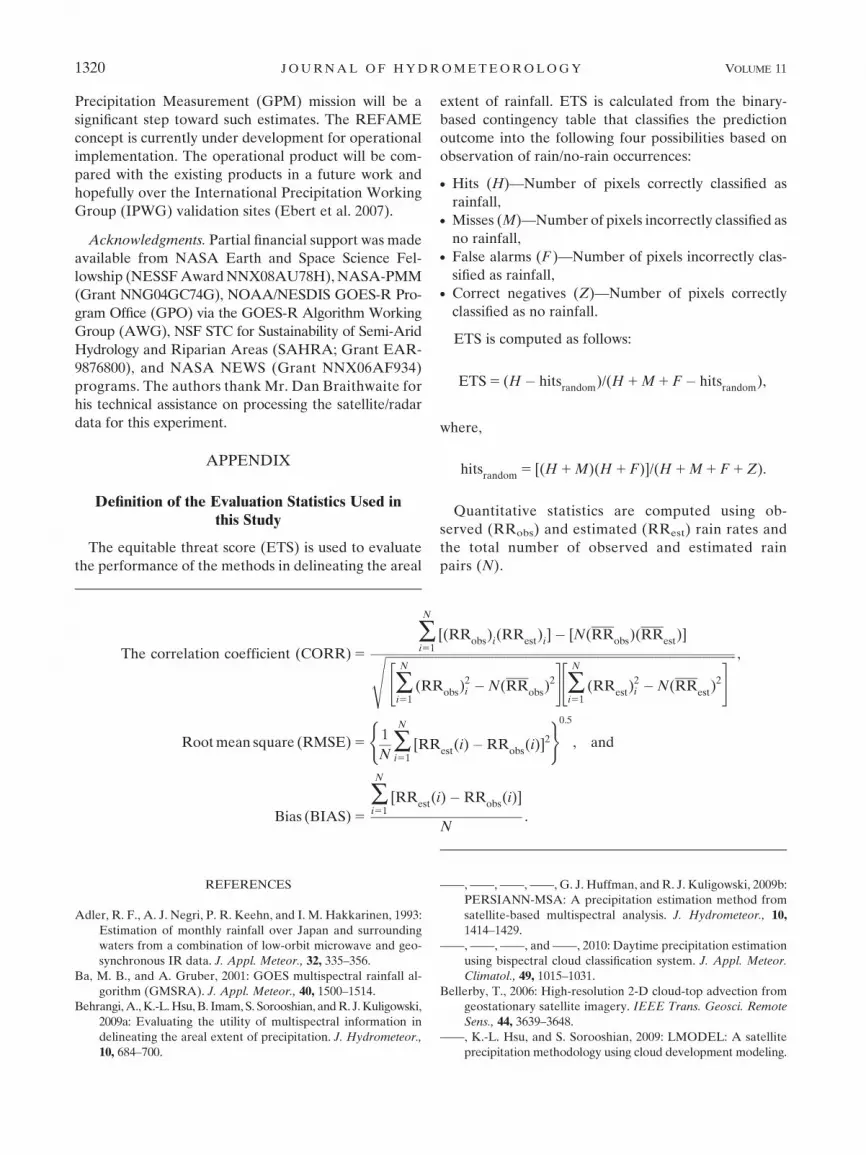
APPENDIX
Definition of the Evaluation Statistics Used inthis Study
The equitable threat score (ETS) is used to evaluate
the performance of the methods in delineating the areal
extent of rainfall. ETS is calculated from the binary-
based contingency table that classifies the prediction
outcome into the following four possibilities based on
observation of rain/no-rain occurrences:
d Hits (H)—Number of pixels correctly classified as
rainfall,d Misses (M)—Number of pixels incorrectly classified as
no rainfall,d False alarms (F )—Number of pixels incorrectly clas-
sified as rainfall,d Correct negatives (Z)—Number of pixels correctly
classified as no rainfall.
ETS is computed as follows:
ETS 5 (H � hitsrandom
)/(H 1 M 1 F � hitsrandom
),
where,
hitsrandom
5 [(H 1 M)(H 1 F)]/(H 1 M 1 F 1 Z).
Quantitative statistics are computed using ob-
served (RRobs) and estimated (RRest) rain rates and
the total number of observed and estimated rain
pairs (N).
The correlation coefficient (CORR) 5
�N
i51[(RR
obs)
i(RR
est)
i]� [N(RR
obs)(RR
est)]ffiffiffiffiffiffiffiffiffiffiffiffiffiffiffiffiffiffiffiffiffiffiffiffiffiffiffiffiffiffiffiffiffiffiffiffiffiffiffiffiffiffiffiffiffiffiffiffiffiffiffiffiffiffiffiffiffiffiffiffiffiffiffiffiffiffiffiffiffiffiffiffiffiffiffiffiffiffiffiffiffiffiffiffiffiffiffiffiffiffiffiffiffiffiffiffiffiffiffiffiffiffiffiffiffiffiffiffiffiffiffiffiffiffiffi
�N
i51(RR
obs)2
i �N(RRobs
)2
" #�N
i51(RR
est)2
i �N(RRest
)2
" #vuut,
Root mean square (RMSE) 51
N�N
i51[RR
est(i)�RR
obs(i)]2
( )0.5
, and
Bias (BIAS) 5
�N
i51[RR
est(i)�RR
obs(i)]
N.
REFERENCES
Adler, R. F., A. J. Negri, P. R. Keehn, and I. M. Hakkarinen, 1993:
Estimation of monthly rainfall over Japan and surrounding
waters from a combination of low-orbit microwave and geo-
synchronous IR data. J. Appl. Meteor., 32, 335–356.
Ba, M. B., and A. Gruber, 2001: GOES multispectral rainfall al-
gorithm (GMSRA). J. Appl. Meteor., 40, 1500–1514.
Behrangi, A., K.-L. Hsu, B. Imam, S. Sorooshian, and R. J. Kuligowski,
2009a: Evaluating the utility of multispectral information in
delineating the areal extent of precipitation. J. Hydrometeor.,
10, 684–700.
——, ——, ——, ——, G. J. Huffman, and R. J. Kuligowski, 2009b:
PERSIANN-MSA: A precipitation estimation method from
satellite-based multispectral analysis. J. Hydrometeor., 10,
1414–1429.
——, ——, ——, and ——, 2010: Daytime precipitation estimation
using bispectral cloud classification system. J. Appl. Meteor.
Climatol., 49, 1015–1031.
Bellerby, T., 2006: High-resolution 2-D cloud-top advection from
geostationary satellite imagery. IEEE Trans. Geosci. Remote
Sens., 44, 3639–3648.
——, K.-L. Hsu, and S. Sorooshian, 2009: LMODEL: A satellite
precipitation methodology using cloud development modeling.
1320 J O U R N A L O F H Y D R O M E T E O R O L O G Y VOLUME 11
Part I: Algorithm construction and calibration. J. Hydrome-
teor., 10, 1081–1095.
Capacci, D., and B. J. Conway, 2005: Delineation of precipitation
areas from MODIS visible and infrared imagery with artificial
neural networks. Meteor. Appl., 12, 291–305.
Dinku, T., S. Chidzambwa, P. Ceccato, S. J. Connor, and
C. F. Ropelewski, 2008: Validation of high-resolution satel-
lite rainfall products over complex terrain. Int. J. Remote Sens.,
29, 4097–4110.
Duda, R., and P. Hart, 1973: Pattern Classification and Scene
Analysis. John Wiley & Sons, 482 pp.
Ebert, E. E., J. E. Janowiak, and C. Kidd, 2007: Comparison of
near-real-time precipitation estimates from satellite observa-
tions and numerical models. Bull. Amer. Meteor. Soc., 88, 47–64.
Everitt, B. S., 1993: Cluster Analysis. 3rd ed. Halsted Press, 170 pp.
Ferraro, R. R., 1997: Special sensor microwave imager derived
global rainfall estimates for climatological applications.
J. Geophys. Res., 102, 16 715–16 736.
——, F. Weng, N. C. Grody, and L. Zhao, 2000: Precipitation
characteristics over land from the NOAA-15 AMSU sensor.
Geophys. Res. Lett., 27, 2669–2672.
Hong, Y., K. L. Hsu, S. Sorooshian, and X. G. Gao, 2004: Pre-
cipitation Estimation from Remotely Sensed Imagery using an
Artificial Neural Network cloud classification system. J. Appl.
Meteor., 43, 1834–1852.
Hsu, K.-L., T. Bellerby, and S. Sorooshian, 2009: LMODEL: A
satellite precipitation methodology using cloud develop-
ment modeling. Part II: Validation. J. Hydrometeor., 10,
1096–1108.
Huffman, G. J., and Coauthors, 2007: The TRMM Multisatellite
Precipitation Analysis (TMPA): Quasi-global, multiyear,
combined-sensor precipitation estimates at fine scales. J. Hydro-
meteor., 8, 38–55.
Janowiak, J. E., R. J. Joyce, and Y. Yarosh, 2001: A real-time
global half-hourly pixel-resolution infrared dataset and its
applications. Bull. Amer. Meteor. Soc., 82, 205–217.
Joyce, R. J., J. E. Janowiak, P. A. Arkin, and P. Xie, 2004:
CMORPH: A method that produces global precipitation es-
timates from passive microwave and infrared data at high
spatial and temporal resolution. J. Hydrometeor., 5, 487–503.
——, P. Xie, and Y. Yarosh, 2008: A Kalman filter approach to
blend various satellite rainfall estimates in CMORPH. Fourth
Workshop of the IPWG, Beijing, China, IPWG, 194 pp.
Kidd, C., D. R. Kniveton, M. C. Todd, and T. J. Bellerby, 2003:
Satellite rainfall estimation using combined passive micro-
wave and infrared algorithms. J. Hydrometeor., 4, 1088–1104.
Kuligowski, R. J., 2002: A self-calibrating real-time GOES rainfall
algorithm for short-term rainfall estimates. J. Hydrometeor., 3,
112–130.
Kummerow, C., and L. Giglio, 1995: A method for combining
passive microwave and infrared rainfall observations. J. Atmos.
Oceanic Technol., 12, 33–45.
——, and Coauthors, 2001: The evolution of the Goddard Profiling
Algorithm (GPROF) for rainfall estimation from passive mi-
crowave sensors. J. Appl. Meteor., 40, 1801–1820.
Lin, Y., and K. E. Mitchell, 2005: The NCEP stage II/IV hourly
precipitation analyses: Development and applications. Pre-
prints, 19th Conf. on Hydrology, San Diego, CA, Amer.
Meteor. Soc., 1.2. [Available online at http://ams.confex.com/
ams/pdfpapers/83847.pdf.]
MacQueen, J. B., 1967: Some methods for classification and anal-
ysis of multivariate observations. Proceedings of the Fifth
Berkeley Symposium on Mathematical Statistics and Proba-
bility, Vol. 1, University of California Press, 281–297.
Martin, D. W., B. Goodman, T. J. Schmit, and E. C. Cutrim, 1990:
Estimation of daily rainfall over the Amazon basin. J. Geo-
phys. Res., 95, 17 043–17 050.
Miller, S. W., P. A. Arkin, and R. Joyce, 2001: A combined
microwave/infrared rain rate algorithm. Int. J. Remote Sens.,
22, 3285–3307.
Qiu, D., and A. C. Tamhane, 2007: A comparative study of
the k-means algorithm and the normal mixture model for
clustering: Univariate case. J. Stat. Plann. Infer., 137, 3722–
3740.
Sapiano, M. R. P., and P. A. Arkin, 2009: An intercomparison
and validation of high-resolution satellite precipitation
estimates with 3-hourly gauge data. J. Hydrometeor., 10,
149–166.
Sorooshian, S., K. L. Hsu, X. Gao, H. V. Gupta, B. Imam, and
D. Braithwaite, 2000: Evaluation of PERSIANN system satellite-
based estimates of tropical rainfall. Bull. Amer. Meteor. Soc., 81,2035–2046.
Tian, Y., C. D. Peters-Lidard, B. J. Choudhury, and M. Garcia,
2007: Multitemporal analysis of TRMM-based satellite pre-
cipitation products for land data assimilation applications.
J. Hydrometeor., 8, 1165–1183.
Todd, M. C., C. Kidd, D. Kniveton, and T. J. Bellerby, 2001: A
combined satellite infrared and passive microwave technique
for estimation of small-scale rainfall. J. Atmos. Oceanic Technol.,
18, 742–755.
Turk, F. J., G. D. Rohaly, J. Hawkins, E. A. Smith, F. S. Marzano,
A. Mugnai, and V. Levizzani, 2000: Meteorological appli-
cations of precipitation estimation from combined SSM/I,
TRMM, and infrared geostationary satellite data. Microwave
Radiometry and Remote Sensing of the Earth’s Surface and
Atmosphere, P. Pampaloni and S. Paloscia, Eds., VSP In-
ternational Science Publishers, 353–363.
Ushio, T., and Coauthors, 2009: A Kalman filter approach to the
Global Satellite Mapping of Precipitation (GSMaP) from
combined passive microwave and infrared radiometric data.
J. Meteor. Soc. Japan, 87A, 137–151.
Vicente, G. A., R. A. Scofield, and W. P. Menzel, 1998: The op-
erational GOES infrared rainfall estimation technique. Bull.
Amer. Meteor. Soc., 79, 1883–1898.
Weng, F. W., L. Zhao, R. Ferraro, G. Pre, X. Li, and N. C. Grody,
2003: Advanced microwave sounding unit (AMSU) cloud and
precipitation algorithm. Radio Sci., 38, 8068–8079.
Xu, L., X. Gao, S. Sorooshian, P. A. Arkin, and B. Imam, 1999:
A microwave infrared threshold technique to improve the
GOES precipitation index. J. Appl. Meteor., 38, 569–579.
DECEMBER 2010 B E H R A N G I E T A L . 1321