reducing the germinable weed seedbank with soil disturbance and cover crops
TRANSCRIPT
DOI: 10.1111/j.1365-3180.2010.00792.x
Reducing the germinable weed seedbank with soildisturbance and cover crops
S B MIRSKY*, E R GALLANDT�, D A MORTENSEN�, W S CURRAN� &D L SHUMWAY§*Sustainable Agricultural Systems Laboratory, USDA, Agricultural Research Service, Beltsville, MD, USA, �Department of Plant, Soil and
Environmental Sciences, University of Maine, Orono, ME, USA, �Department of Crop and Soil Sciences, The Pennsylvania State University,
University Park, PA, USA, and §Department of Statistics, The Pennsylvania State University, University Park, PA, USA
Received 26 May 2009
Revised version accepted 24 February 2010
Summary
Ecologically based weed management relies heavily on a
greater integration of cultural and mechanical control
tactics than conventional weed management. As such,
management outcomes are more dependent on biotic
interactions among the crop, weed and methods of
management. In this study, we assessed the influence of
soil disturbance and cover cropping on the germinable
seedbank of Chenopodium album, Abutilon theophrasti
and Setaria spp. across a range of initial weed seedbank
densities. Cover crop system treatments ranged from
greater reliance on tillage at one extreme, to a greater
reliance on cover cropping to accomplish weed suppres-
sion at the other. In general, seedbank losses to
germination were highest when soil disturbance was
associated with cover cropping. Of the five cover crop
systems (1 year duration), the summer fallow and the
yellow mustard ⁄buckwheat ⁄winter rape mixture consis-
tently decreased the weed seedbank. The magnitude of
decline in these high disturbance systems reached
complete depletion of the Setaria spp. germinable
seedbank and an 85% and 80% reduction for C. album
and A. theophrasti respectively. Both systems included
tilling the soil three to four times throughout the
growing season. In contrast, treatments which involved
less soil disturbance had weed escapes that set seed in
one or more site years. Cover crop systems that
stimulated weed seed germination and where weeds
were either suppressed by the cover crop or where
subsequent tillage provided control, resulted in the
greatest weed seedbank declines.
Keywords: cover crop, seedbank, sustainable agricul-
ture, population dynamics, mechanical weed control,
Chenopodium album, Abutilon theophrasti, Setaria.
MIRSKY SB, GALLANDT ER, MORTENSEN DA, CURRAN WS & SHUMWAY DL (2010). Reducing the germinable weed
seedbank with soil disturbance and cover crops. Weed Research.
Introduction
Weed management outcomes are linked to infestation
size, as larger resident weed seedbanks often require
more weed control to adequately manage the population
(Hartzler & Roth, 1993). Ecologically based weed
management (EBWM) strategies rely on an integrated
suite of control tactics to achieve an acceptable level of
weed suppression (Liebman & Gallandt, 1997). Such
EBWM strategies are used by growers interested in
reducing reliance on herbicides and are central to
organic production. Cropping systems that rely less on
herbicides, have a greater emphasis on cultural (crop
rotation diversification and cover cropping) and
mechanical weed control practices (e.g., cultivation).
However, the efficacy of these practices is more variable
than chemical weed management (Ryan, 2007). For
example, EBWM that relies on timely tillage operations
can be compromised when fields are too wet to till
(Ryan, 2007) with a resulting increase in the weed
Correspondence: Steven B Mirsky, Sustainable Agricultural Systems Laboratory, USDA, Agricultural Research Service, 10300 Baltimore Avenue,
Bldg. 001, Rm. 117, BARC-W, Beltsville, MD 20705, USA. Tel: (+01) 301 5045324; Fax: (+01) 301 5048370; E-mail: [email protected]
� Published 2010. This article is a US Government work and is in the public domain in the USA
Journal Compilation � 2010 European Weed Research Society Weed Research
seedbank (Forcella & Lindstrom, 1988). It is therefore
critical to design and assess new tactics that reduce this
variation in performance.
The size of the weed seedbank strongly influences the
success of anyweedmanagement practice and is critical to
the success of EBWM (Forcella et al., 1993). Jordan
(1996) suggests that EBWM �must be buttressed by efforts
to reduce weed seedbanks and maintain them at low
levels�. Ecologically based strategies for manipulating
weed population and community dynamics include:
(i) reducing the seedbank pool size by stimulating seed
death, (ii) stimulating germination, (iii) limitingweed seed
production of emerged plants or (iv) completely removing
above-ground weed biomass (Swanton & Booth, 2004).
The germinable fraction of the seedbank has the most
substantial impact on weed seedbank flux, with the
potential to account for more than half of seedbank
losses annually (Gallandt et al., 2004). Therefore, EBWM
that targets the germinable weed seedbank and prevents
seed production will likely have the greatest impact on
seedbank size. Gallandt (2006) suggests an effective way
to achieve these reductions is through tillage-induced
germination and subsequent control.
Germination of many species is stimulated by soil
disturbance (Cavers & Benoit, 1989); in this way the
expressed germinable fraction can be increased. Poten-
tial mechanisms for this germination response include:
exposure to light for light-sensitive species (Gallagher &
Cardina, 1998); temperature fluctuations (Thompson &
Grime, 1983), and movement of seed to favourable
germination sites (Milberg et al., 1996). Tillage also
increases microbial biomass through enhanced soil
aeration and by exposing occluded labile soil organic
matter fractions (Plante & McGill, 2002). The increase
in microbial activity can also increase biosynthesis of
ethylene (Hilhorst & Darssen, 2000), which is a known
germination stimulant (Schonbeck & Egley, 1980).
Synchrony of management tactics and germination
periodicity can be an effective way of �expressing� andthen controlling emerged plants. Growers using EBWM
have relied on weed expressive tactics, such as the stale-
seedbed approach before planting where germination
stimulation of weeds are used to lower weed seedbanks
(Lonsbary et al., 2003). However, because the germina-
tion period is species-specific, the timing of EBWM can
result in weed community changes (Booth & Swanton,
2002). Identifying weed management practices that
consistently reduce weed seedbanks across a range of
weed life history strategies (i.e., broadleaved vs. grasses;
annuals vs. perennials; early vs. late emerging weeds)
will further the adoption of EBWM. Additionally,
coupling cover crop use with �expressive tactics� couldoffset the environmental downsides of excessive tillage as
cover crop residues reduce weed emergence and early
growth (Mohler, 2001; Reberg-Horton et al., 2005) and
can help build soil carbon content (Mirsky et al., 2008).
This study assessed whether the weed seedbank could
be depleted by a range of cover crop and tillage treatments
arranged in a system representative of vegetable cropping
practices in north-eastern North America. We hypothes-
ised that: (i) the magnitude of decline in the germinable
weed seedbank will increase with increasing frequency of
soil disturbance and cover cropping, (ii) the frequency of
soil disturbance and cover cropping must increase as the
density of the weed seedbank increases in order to
preserve a constant level of weed suppression and (iii)
consistency in weed decline across geographic regions and
weed life history traits will increase with increasing soil
disturbance and cover crop system intensity.
Methods
Field experiments were conducted from 2003 to 2006 at
the Rogers Farm in Old Town, Maine (ME) (44�55¢N,
68�41¢W) and the Russell E. Larson Agricultural
Research Center in Rock Springs, Pennsylvania (PA)
(40�44¢N, 77�57¢W) to evaluate the influence of soil
disturbance and cover cropping practices on the ger-
minable weed seedbank for three summer annual weeds.
The experiment was initiated in the fall of 2003 and
repeated in 2004 in PA and winter of 2004 and 2005 in
ME, in adjacent fields at the two locations. Site years
will be referenced by the year that the cover cropping
systems received management that included soil distur-
bance (2004 and 2005). The study was conducted on a
Hagerstown silt loam soil (Fine, mixed, mesic, Typic
Hapludalfs; 12% sand, 70% silt, 18% clay) in PA and a
Buxton silt loam soil (Fine, illitic, frigid Aquic Dystric
Eutrudepts; 11% sand, 47% silt, 42% clay) in ME.
The experiment was arranged as a split-plot rando-
mised complete block with four replicates. Main plot
treatments were five cover crop systems representing
different crops, levels of soil disturbance, duration of
cover and quantity and quality of cover crop biomass
(Fig. 1). Subplots were supplemented with a mixture of
weed seeds at a range of weed seedbank densities per
species (four factor levels). An experimental replicate
consisted of five main plots (12.2 · 12.2 m), and five
weed seedbank density sub-plots (2.7 · 1.5 m).
Cover crop systems
Cover crop treatments were established in the spring of
2004 and 2005 in adjacent fields. In PA, the previous
crops were field maize and soyabean and in ME, fallow
and maize silage for 2004 and 2005, respectively. The
timing and number of field operations for each cover
crop system are provided in Fig. 1. The five cover crop
2 S B Mirsky et al.
� Published 2010. This article is a US Government work and is in the public domain in the USA
Journal Compilation � 2010 European Weed Research Society Weed Research

treatments included: (i) summer fallow where no crop
was grown (SF); (ii) an oat (Avena sativa L. �Ogle�) cashcrop followed by rye (Secale cereale L. �Aroos-
took�) ⁄hairy vetch (Vicia villosa Roth.) in PA (O-R ⁄HV) or a green bean (Phaseolus vulgaris L. �Provider�)cash crop followed by rye ⁄hairy vetch in ME (GB-
R ⁄HV); (iii) oat ⁄pea (Pisum sativum L. �Maxum�)followed by rye ⁄hairy vetch (O ⁄P-R ⁄HV); (iv) oats ⁄ redclover (Trifolium pratense L. �Mammoth�) (O ⁄RC); and
(v) yellow mustard (Brassica juncea L. �Idagold�) fol-
lowed by buckwheat (Fagopyrum esculentum Moench.)
followed by winter rape (Brassica napus L. �Dwarf
Essex�) (M-BW-C).
In PA, fields were disked and culti-mulched twice to
ensure a smooth seedbed prior to establishing the
seedbank density sub-plot. In ME, primary tillage con-
sisted of chisel ploughing followed by two passes with a
soil conditioner (Perfecta Harrow, Unverferth Manufac-
turing, 18107 U.S. 224 West P.O. Box 357, Kalida, OH
45853). Prior to establishing the cover crop treatments in
the spring, primary tillage was completed in ME with a
Perfecta II s-tine cultivator (2·), while in PA, fields were
tilled with a cultimulcher (2·). All legume cover crops
were inoculated with appropriate strains of Rhizobium
spp. prior to planting. Crops were seeded in 19 cm spaced
rows with either a Great Plains drill (1006NT) in PA or a
Massy Harris drill in ME, or for buckwheat and mustard
species with a Brillion (�SS-Solid Stand�; 1.5 m width)
seeder (both locations) in 10 cm rows. The green bean
cash crop was planted in 76 cm rows.
The oat cash crop was treated with 0.56 kg a.e ha)1
MCPA amine, post-emergence about 6 weeks after
seeding for control of annual broad-leaved weeds, while
the green bean cash crop was managed without herbi-
cides relying on cultivation for weed control. The oats
and green beans were machine harvested for grain or
fresh market produce, respectively in early August. The
oat cover crop within the O ⁄RC system was terminated
by mowing the oats to a height of 15 cm (c. 1 cm above
the red clover canopy). Cover crops were flail or rotary
mowed prior to soil incorporation in the O-R ⁄HV,
O ⁄P-R ⁄HV, O ⁄RC and M-BW-C systems. For treat-
ments with more than one crop grown in a season, the
preceding cover crop was flail or rotary mowed or
the cash crop harvested (oats and green bean) and the
residue incorporated and the soil was then prepared for
the subsequent crop using a rotary cultivator. In PA,
plots were additionally cultimulched (2·) prior to
seeding. The direction of travel during each tillage
operation was alternated to minimise the movement of
weed seed out of the density plots. Above-ground cover
crop and weed biomass were measured prior to each
termination event by clipping all above-ground plant
material from two 0.25 m2 quadrats in each plot. The
biomass was dried at 50�C for 1 week prior to weighing.
Biomass was reported for the spring and summer sown
cover crops.
Supplemented weed seedbank
Weed seedbanks were supplemented in the late fall (PA),
or early spring (Maine). Prior to planting the cover crops,
weed seeds (collected in nearby fields in the autumn prior
to sowing) were hand applied at PA and then lightly
incorporated using a leaf rake or tine weeder (<3 cm
deep), while in Maine weed seeds were frost-seeded in
early spring. The following commonly occurring weeds
were selected for the study:Setaria faberiL. (giant foxtail)
in PA or Setaria glauca (L.) Beauv. (yellow foxtail) in
Maine, and Chenopodium album L. (fat-hen or common
lambsquarters) and Abutilon theophrasti Medik. (velvet-
leaf) at both sites. Seed additions of 0 (control), 60 (low),
450 (medium), and 2100 (high) seeds m)2 of each species
were applied for a combined seedbank supplementation
of 0, 180, 1350, 6300 seeds m)2. To assess the efficiency of
weed seed recovery, 2100 ceramic beads m)2 (Macrolite
0.06–0.02 sphere diameter, ML1430; Freeman Manufac-
turing and Supply, 1101 Moore Road, Avon, OH 44011)
were added to the high weed seedbank density plot
(Mohler et al., 2006).
Quantifying changes in the weed seedbank
The initial and final weed seedbank densities were
enumerated at both locations in the spring of the estab-
lishment year andagain in the springof the following year,
using glasshouse germination and direct extraction meth-
ods (Gross, 1990; Gallandt et al., 1998). Glasshouse
germination was used to estimate the readily germinable
(non-dormant to partially dormant) fraction of the
Primary tillage Mowing Herbicide
Secondary tillage Living cover/cash crop
J F M AA M J J A S O N D
Month of the year
O/RC
SF
O-R/HV
GB-R/HV
M-BW-C
O/P-R/HV
Fig. 1 Aschematic depicting the disturbance events andduration of
living cover in the cropping systems: SF, summer fallow;O-R ⁄HV,oats
green bean-rye ⁄hairy vetch;M-BW-C, yellowmustard-buckwheat-
rape;O ⁄P-R ⁄HV, oats ⁄pea-rye ⁄hairy vetch;O ⁄RC, oats ⁄ red clover.
Soil disturbance, cover crops and seedbanks 3
� Published 2010. This article is a US Government work and is in the public domain in the USA
Journal Compilation � 2010 European Weed Research Society Weed Research
seedbank from the density sub-plots (Gallandt et al.,
1998).Ten (8.3 cmdiameterby10 cmdeep) soil coreswere
collected from control, low and medium density subplots
and 15 cores from the high density sub-plots. Soil cores
were randomly collected from half (2.7 · 0.75 m) of each
density sub-plot, while recruitment data were taken from
the other half of the sub-plot. Direct extraction of Setaria
spp., A. theophrasti and the ceramic bead seed surrogates
was accomplished using a modified hydropneumatic root
elutriator (Gillison�s Variety Fabrication) (Gross, 1990).
This procedurewas performed on soil taken from the high
density subplots, to check against the results of the
glasshouse assay. Weed seed and organic residues were
separated fromthe soil byfirst running the sample through
the elutriator, then seeds were sorted under a dissecting
microscope. Seed viability was estimated by applying
pressure to seeds with forceps; firm seeds were assumed to
be viable (Andersson &Milberg, 1998).
Recruitment was measured in the field prior to each
field disturbance between May and August. Seedling
emergence was quantified by placing a 0.5 m2 quadrat
within each density sub-plot and counting the target
weed species, including other dominant weed species
present in the field. Although fecundity of mature weeds
in the different cover crop systems was not quantified,
mature weed populations capable of introducing seeds
were documented.
Statistical methods
The relationship between the two seedbank enumeration
methods was determined using correlation analysis.
Analysis of variance (ANOVA) was conducted using a
Proc Mixed procedure in SAS v. 9.1 (SAS Institute Inc.,
2004) to test for variations in the initial germinable
seedbank at both locations and site years. Preliminary
analyses showed site year to be significant at both
locations; therefore, the change in seedbank, hereafter
referred to as D germinable seedbank, was evaluated
across cover crop systems by location and site year using
analysis of covariance (ANCOVA), with initial seedbank
density as a covariate. Annual seedbank change can be
examined using proportional change (final ⁄ initial) or bycomputing the difference. The latter method was
selected for the population dynamics analysis, because
of zero initial weed seedbank counts in some sub-plots.
ANCOVA was performed using Proc Mixed in SAS
version 9.1. The ANCOVA output included a linear
expression of the relationship between initial germinable
seedbank and D germinable seedbank (slope and inter-
cept). ANOVA was also used to test the effects of site year,
location and cover crop system on cumulative weed
seedling recruitment. All mean comparisons were per-
formed using the Tukey–Kramer method (P < 0.05).
The influence of the cover crop treatment on weed
community composition was examined using redun-
dancy analysis (RDA) with CANOCO 4.5 (ter braak
CJFAS, 2002; Reberg-Horton et al., 2006). A con-
strained form of principle component analysis, RDA is
similar to principle component analysis, in that RDA
identifies optimal linear models describing community
structure and predicts species response. Regression
coefficients in RDA were constrained by factors in the
experimental design, as well as environmental gradients,
which allowed for hypothesis testing by partitioning
treatment effects into individual factors (Reberg-Horton
et al., 2006). RDA was performed on the proportional
change (final ⁄ initial seedbank) of the three target weed
species by constraining the weed community with the
following explanatory variables: location, cover crop
systems, site year and the disturbance gradient. This
analysis was only performed on high density plots,
because of zero seedbank counts in low density treat-
ments. A Monte Carlo permutation test (499 permuta-
tions) was used to test for a significant community
gradient. The significance of the community gradient
was determined by calculating the proportion of
F-statistics generated from the permutated environmen-
tal matrices that were greater than the F-statistic
calculated from the empirical species-environmental
matrix. The environmental variables that best predict
the species response was then determined by using a
forward selection procedure on the environmental vari-
ables. Biplots, developed in CanoDraw (graphical
package bundled with CANOCO 4.5) were then used
to visualise the degree of association of the target weed
species and explanatory variables. Those visualisations
were supported by a complimentary permutational
multivariate analysis of variance, PERMANOVA
(Anderson, 2001), to account for treatment effects and
interactions. PERMANOVA, a permutation method, simul-
taneously tests for responses of multiple variables (i.e.,
weed species) on multiple treatment factors (i.e., cover
crop systems, site year and location) based on distance
measures, retaining the structure of the experimental
design (Anderson, 2001). A single distance measure is
computed from community signatures, distance mea-
sures of community composition are then compared
between samples, and an F-statistic was calculated as
mentioned above.
Results
Cover and cash crop biomass
The cover crop treatments (with the exception of SF)
had living cover present for much of the experimental
period. Cover crop systems typically produced biomass
4 S B Mirsky et al.
� Published 2010. This article is a US Government work and is in the public domain in the USA
Journal Compilation � 2010 European Weed Research Society Weed Research
levels in excess of 3000 kg ha)1 during the 12 month
experimental period. The following cover crop biomass
levels are reported by site and cropping system and
pooled over site year. The O ⁄P treatment produced the
greatest cover crop biomass, averaging 5200 and
8000 kg ha)1 in Maine and PA, respectively. The
O ⁄RC and M-BW-C treatments produced 2700 and
3800 kg ha)1 of cover crop biomass in Maine and PA,
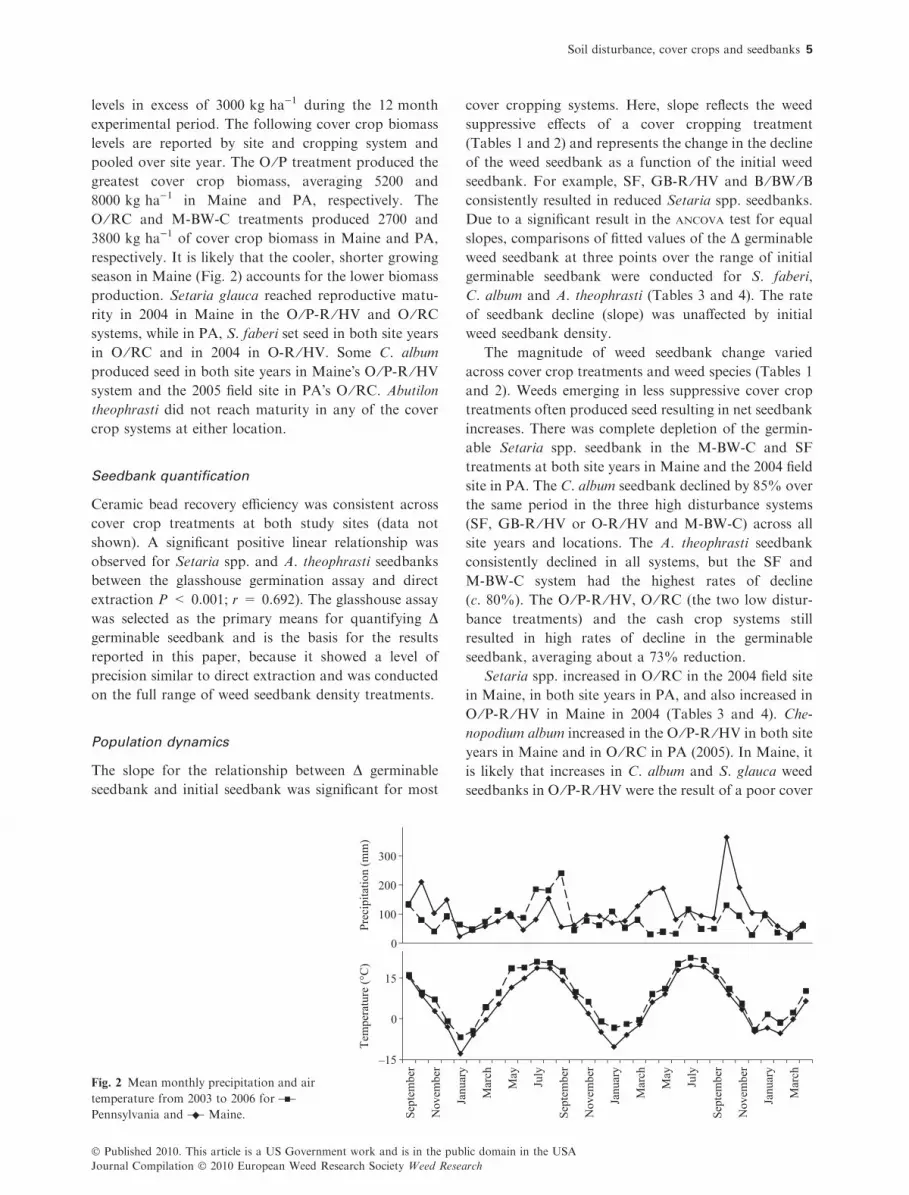
respectively. It is likely that the cooler, shorter growing
season in Maine (Fig. 2) accounts for the lower biomass
production. Setaria glauca reached reproductive matu-
rity in 2004 in Maine in the O ⁄P-R ⁄HV and O ⁄RC
systems, while in PA, S. faberi set seed in both site years
in O ⁄RC and in 2004 in O-R ⁄HV. Some C. album
produced seed in both site years in Maine�s O ⁄P-R ⁄HV
system and the 2005 field site in PA�s O ⁄RC. Abutilon
theophrasti did not reach maturity in any of the cover
crop systems at either location.
Seedbank quantification
Ceramic bead recovery efficiency was consistent across
cover crop treatments at both study sites (data not
shown). A significant positive linear relationship was
observed for Setaria spp. and A. theophrasti seedbanks
between the glasshouse germination assay and direct
extraction P < 0.001; r = 0.692). The glasshouse assay
was selected as the primary means for quantifying Dgerminable seedbank and is the basis for the results
reported in this paper, because it showed a level of
precision similar to direct extraction and was conducted
on the full range of weed seedbank density treatments.
Population dynamics
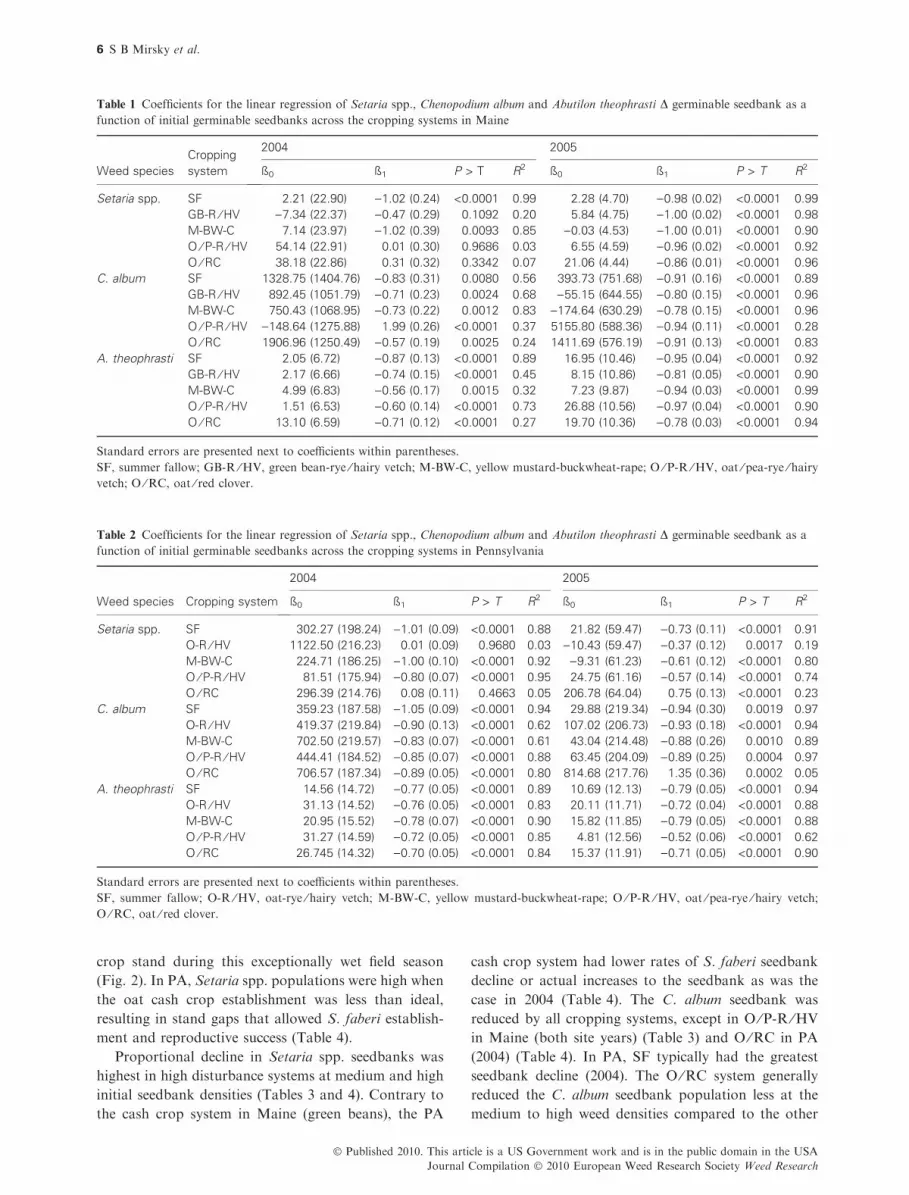
The slope for the relationship between D germinable
seedbank and initial seedbank was significant for most
cover cropping systems. Here, slope reflects the weed
suppressive effects of a cover cropping treatment
(Tables 1 and 2) and represents the change in the decline
of the weed seedbank as a function of the initial weed
seedbank. For example, SF, GB-R ⁄HV and B ⁄BW ⁄Bconsistently resulted in reduced Setaria spp. seedbanks.
Due to a significant result in the ANCOVA test for equal
slopes, comparisons of fitted values of the D germinable
weed seedbank at three points over the range of initial
germinable seedbank were conducted for S. faberi,
C. album and A. theophrasti (Tables 3 and 4). The rate
of seedbank decline (slope) was unaffected by initial
weed seedbank density.
The magnitude of weed seedbank change varied
across cover crop treatments and weed species (Tables 1
and 2). Weeds emerging in less suppressive cover crop
treatments often produced seed resulting in net seedbank
increases. There was complete depletion of the germin-
able Setaria spp. seedbank in the M-BW-C and SF
treatments at both site years in Maine and the 2004 field
site in PA. The C. album seedbank declined by 85% over
the same period in the three high disturbance systems
(SF, GB-R ⁄HV or O-R ⁄HV and M-BW-C) across all
site years and locations. The A. theophrasti seedbank
consistently declined in all systems, but the SF and
M-BW-C system had the highest rates of decline
(c. 80%). The O ⁄P-R ⁄HV, O ⁄RC (the two low distur-
bance treatments) and the cash crop systems still
resulted in high rates of decline in the germinable
seedbank, averaging about a 73% reduction.
Setaria spp. increased in O ⁄RC in the 2004 field site
in Maine, in both site years in PA, and also increased in
O ⁄P-R ⁄HV in Maine in 2004 (Tables 3 and 4). Che-
nopodium album increased in the O ⁄P-R ⁄HV in both site
years in Maine and in O ⁄RC in PA (2005). In Maine, it
is likely that increases in C. album and S. glauca weed
seedbanks in O ⁄P-R ⁄HV were the result of a poor cover
0
100
200
300
Prec
ipita
tion
(mm
)
–15
0
15
Sept
embe
r
Nov
embe
r
Janu
ary
Mar
ch
May
July
Sept
embe
r
Nov
embe
r
Janu
ary
Mar
ch
May
July
Sept
embe
r
Nov
embe
r
Janu
ary
Mar
ch
Tem
pera
ture
(°C
)
Fig. 2 Mean monthly precipitation and air
temperature from 2003 to 2006 for
Pennsylvania and Maine.
Soil disturbance, cover crops and seedbanks 5
� Published 2010. This article is a US Government work and is in the public domain in the USA
Journal Compilation � 2010 European Weed Research Society Weed Research
crop stand during this exceptionally wet field season
(Fig. 2). In PA, Setaria spp. populations were high when
the oat cash crop establishment was less than ideal,
resulting in stand gaps that allowed S. faberi establish-
ment and reproductive success (Table 4).
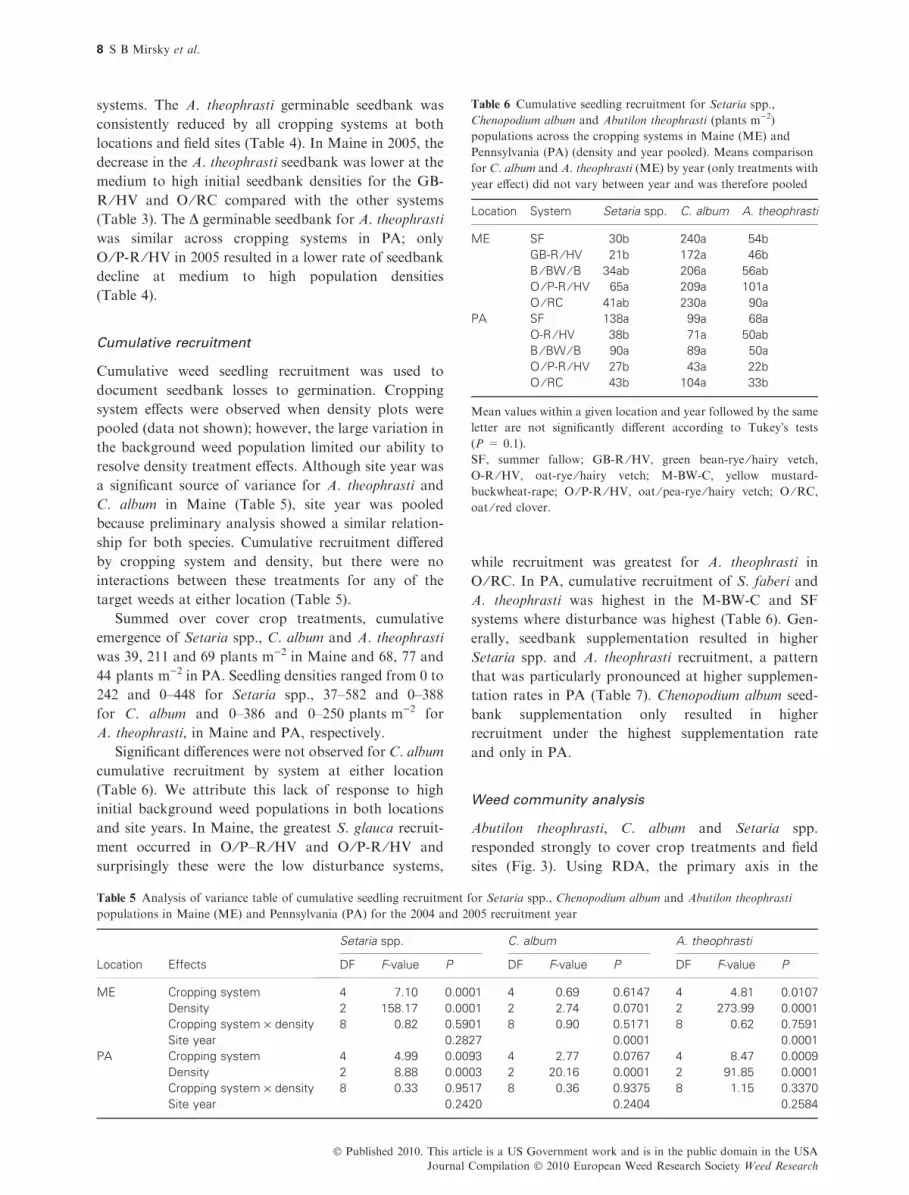
Proportional decline in Setaria spp. seedbanks was
highest in high disturbance systems at medium and high
initial seedbank densities (Tables 3 and 4). Contrary to
the cash crop system in Maine (green beans), the PA
cash crop system had lower rates of S. faberi seedbank
decline or actual increases to the seedbank as was the
case in 2004 (Table 4). The C. album seedbank was
reduced by all cropping systems, except in O ⁄P-R ⁄HV
in Maine (both site years) (Table 3) and O ⁄RC in PA
(2004) (Table 4). In PA, SF typically had the greatest
seedbank decline (2004). The O ⁄RC system generally
reduced the C. album seedbank population less at the
medium to high weed densities compared to the other
Table 1 Coefficients for the linear regression of Setaria spp., Chenopodium album and Abutilon theophrasti D germinable seedbank as a
function of initial germinable seedbanks across the cropping systems in Maine
Weed species
Cropping
system
2004 2005
ß0 ß1 P > T R2 ß0 ß1 P > T R2
Setaria spp. SF 2.21 (22.90) )1.02 (0.24) <0.0001 0.99 2.28 (4.70) )0.98 (0.02) <0.0001 0.99
GB-R ⁄ HV )7.34 (22.37) )0.47 (0.29) 0.1092 0.20 5.84 (4.75) )1.00 (0.02) <0.0001 0.98
M-BW-C 7.14 (23.97) )1.02 (0.39) 0.0093 0.85 )0.03 (4.53) )1.00 (0.01) <0.0001 0.90
O ⁄ P-R ⁄ HV 54.14 (22.91) 0.01 (0.30) 0.9686 0.03 6.55 (4.59) )0.96 (0.02) <0.0001 0.92
O ⁄ RC 38.18 (22.86) 0.31 (0.32) 0.3342 0.07 21.06 (4.44) )0.86 (0.01) <0.0001 0.96
C. album SF 1328.75 (1404.76) )0.83 (0.31) 0.0080 0.56 393.73 (751.68) )0.91 (0.16) <0.0001 0.89
GB-R ⁄ HV 892.45 (1051.79) )0.71 (0.23) 0.0024 0.68 )55.15 (644.55) )0.80 (0.15) <0.0001 0.96
M-BW-C 750.43 (1068.95) )0.73 (0.22) 0.0012 0.83 )174.64 (630.29) )0.78 (0.15) <0.0001 0.96
O ⁄ P-R ⁄ HV )148.64 (1275.88) 1.99 (0.26) <0.0001 0.37 5155.80 (588.36) )0.94 (0.11) <0.0001 0.28
O ⁄ RC 1906.96 (1250.49) )0.57 (0.19) 0.0025 0.24 1411.69 (576.19) )0.91 (0.13) <0.0001 0.83
A. theophrasti SF 2.05 (6.72) )0.87 (0.13) <0.0001 0.89 16.95 (10.46) )0.95 (0.04) <0.0001 0.92
GB-R ⁄ HV 2.17 (6.66) )0.74 (0.15) <0.0001 0.45 8.15 (10.86) )0.81 (0.05) <0.0001 0.90
M-BW-C 4.99 (6.83) )0.56 (0.17) 0.0015 0.32 7.23 (9.87) )0.94 (0.03) <0.0001 0.99
O ⁄ P-R ⁄ HV 1.51 (6.53) )0.60 (0.14) <0.0001 0.73 26.88 (10.56) )0.97 (0.04) <0.0001 0.90
O ⁄ RC 13.10 (6.59) )0.71 (0.12) <0.0001 0.27 19.70 (10.36) )0.78 (0.03) <0.0001 0.94
Standard errors are presented next to coefficients within parentheses.
SF, summer fallow; GB-R ⁄HV, green bean-rye ⁄ hairy vetch; M-BW-C, yellow mustard-buckwheat-rape; O ⁄P-R ⁄HV, oat ⁄ pea-rye ⁄ hairyvetch; O ⁄RC, oat ⁄ red clover.
Table 2 Coefficients for the linear regression of Setaria spp., Chenopodium album and Abutilon theophrasti D germinable seedbank as a
function of initial germinable seedbanks across the cropping systems in Pennsylvania
Weed species Cropping system
2004 2005
ß0 ß1 P > T R2 ß0 ß1 P > T R2
Setaria spp. SF 302.27 (198.24) )1.01 (0.09) <0.0001 0.88 21.82 (59.47) )0.73 (0.11) <0.0001 0.91
O-R ⁄ HV 1122.50 (216.23) 0.01 (0.09) 0.9680 0.03 )10.43 (59.47) )0.37 (0.12) 0.0017 0.19
M-BW-C 224.71 (186.25) )1.00 (0.10) <0.0001 0.92 )9.31 (61.23) )0.61 (0.12) <0.0001 0.80
O ⁄ P-R ⁄ HV 81.51 (175.94) )0.80 (0.07) <0.0001 0.95 24.75 (61.16) )0.57 (0.14) <0.0001 0.74
O ⁄ RC 296.39 (214.76) 0.08 (0.11) 0.4663 0.05 206.78 (64.04) 0.75 (0.13) <0.0001 0.23
C. album SF 359.23 (187.58) )1.05 (0.09) <0.0001 0.94 29.88 (219.34) )0.94 (0.30) 0.0019 0.97
O-R ⁄ HV 419.37 (219.84) )0.90 (0.13) <0.0001 0.62 107.02 (206.73) )0.93 (0.18) <0.0001 0.94
M-BW-C 702.50 (219.57) )0.83 (0.07) <0.0001 0.61 43.04 (214.48) )0.88 (0.26) 0.0010 0.89
O ⁄ P-R ⁄ HV 444.41 (184.52) )0.85 (0.07) <0.0001 0.88 63.45 (204.09) )0.89 (0.25) 0.0004 0.97
O ⁄ RC 706.57 (187.34) )0.89 (0.05) <0.0001 0.80 814.68 (217.76) 1.35 (0.36) 0.0002 0.05
A. theophrasti SF 14.56 (14.72) )0.77 (0.05) <0.0001 0.89 10.69 (12.13) )0.79 (0.05) <0.0001 0.94
O-R ⁄ HV 31.13 (14.52) )0.76 (0.05) <0.0001 0.83 20.11 (11.71) )0.72 (0.04) <0.0001 0.88
M-BW-C 20.95 (15.52) )0.78 (0.07) <0.0001 0.90 15.82 (11.85) )0.79 (0.05) <0.0001 0.88
O ⁄ P-R ⁄ HV 31.27 (14.59) )0.72 (0.05) <0.0001 0.85 4.81 (12.56) )0.52 (0.06) <0.0001 0.62
O ⁄ RC 26.745 (14.32) )0.70 (0.05) <0.0001 0.84 15.37 (11.91) )0.71 (0.05) <0.0001 0.90
Standard errors are presented next to coefficients within parentheses.
SF, summer fallow; O-R ⁄HV, oat-rye ⁄ hairy vetch; M-BW-C, yellow mustard-buckwheat-rape; O ⁄ P-R ⁄HV, oat ⁄ pea-rye ⁄ hairy vetch;
O ⁄RC, oat ⁄ red clover.
6 S B Mirsky et al.
� Published 2010. This article is a US Government work and is in the public domain in the USA
Journal Compilation � 2010 European Weed Research Society Weed Research

Table 3 Comparisons for fitted values of D germinable weed seedbanks (seeds m)2) at three points over the range of initial germinable
seedbank of the Setaria spp., Chenopodium album and Abutilon theophrasti using ANCOVA with initial germinable weed seedbank as the
covariate (Maine)
Species
Site
year
Initial
seedbank
D germinable seedbanks
SF GB-R ⁄ HV B ⁄ BW ⁄ B O ⁄ P-R ⁄ HV O ⁄ RC
Setaria spp. 2004 25 )23a )23a )18a 54b 46b
60 )59a )59a )54a 55b 57b
120 )121a )121a )115a 56b 76b
2005 50 )47a )44a )50a )41a )22b
400 )390ab )395ab )398a )378b )322c
750 )734a )745a )746a )714a )622b
C. album 2004 2200 )495a )666a )860a 4220b 647a
4500 )2402a )2296a )2544a 8786c )669b
6500 )4060ab )3713ab )4009a 12757c )1815b
2005 1200 )701ab )1018a )1116a 4030c 316b
3000 )2342a )2461a )2528a 2342b )1328a
4800 )3984a )3905ab )3939ab 653c )2973b
A. theophrasti 2004 10 )7a )5a )1a )4a 6a
55 )46a )39ab )26b )31ab )26b
100 )85a )72a )51a )58a )58a
2005 50 )30a )32a )40a )22a )19a
300 )267ab )235bc )275a )265ab )213c
500 )456a )398b )463a )460a )369b
Mean values within a row for a given location and site year followed by the same letter are not significantly different according to the Tukey–
Kramer test for mean separation (P < 0.05).
SF, summer fallow; GB-R ⁄HV, green bean-rye ⁄ hairy vetch; M-BW-C, yellow mustard-buckwheat-rape; O ⁄ P-R ⁄HV, oat ⁄ pea-rye ⁄ hairyvetch; O ⁄RC, oat ⁄ red clover.
Table 4 Comparisons for fitted values of D germinable weed seedbanks (seeds m)2) at three points over the range of initial germinable
seedbank of the Setaria faberi, Chenopodium album and Abutilon theophrasti using ANCOVA with initial germinable weed seedbank as the
covariate (Pennsylvania)
Species Site year Initial seedbank
D germinable seedbanks
SF O-R ⁄ HV B ⁄ BW ⁄ B O ⁄ P-R ⁄ HV O ⁄ RC
S. faberi 2004 1000 )711a 1126c )779a )718a 373b
2000 )1723a 1130c )1784a )1518a 450b
3000 )2736a 1134d )2788a )2317b 527c
2005 50 )15a )29a )40a )4a 244b
400 )270a )159b )253ab )203ab 507c
700 )489a )271b )435a )374ab 733c
C. album 2004 750 )429a )256ab )81b )194ab 41b
1800 )1532a )1202b )790c )1088b )892bc
3800 )3633a )3003ab )2448b )2791b )2668b
2005 100 )65a 14a )45a )26a 950b
800 )726a )638a )663a )650a 1894b
1600 )1481a )1383a )1368a )1364a 2972b
A. theophrasti 2004 50 )24a )6a )18a )5a )8a
350 )254a )232a )251a )222a )218a
550 )408a )382a )406a )367a )358a
2005 50 )29a )16a )24a )21a )20a
350 )264a )233a )260a )178b )234a
500 )382a )341a )378a )256b )341a
Mean values within a row for a given location and site year followed by the same letter are not significantly different according to the Tukey–
Kramer test for mean separation (P < 0.05).
SF, summer fallow; O-R ⁄HV, oat-rye ⁄ hairy vetch; M-BW-C, yellow mustard-buckwheat-rape; O ⁄P-R ⁄HV, oat ⁄ pea-rye ⁄ hairy vetch;
O ⁄RC, oat ⁄ red clover.
Soil disturbance, cover crops and seedbanks 7
� Published 2010. This article is a US Government work and is in the public domain in the USA
Journal Compilation � 2010 European Weed Research Society Weed Research
systems. The A. theophrasti germinable seedbank was
consistently reduced by all cropping systems at both
locations and field sites (Table 4). In Maine in 2005, the
decrease in the A. theophrasti seedbank was lower at the
medium to high initial seedbank densities for the GB-
R ⁄HV and O ⁄RC compared with the other systems
(Table 3). The D germinable seedbank for A. theophrasti
was similar across cropping systems in PA; only
O ⁄P-R ⁄HV in 2005 resulted in a lower rate of seedbank
decline at medium to high population densities
(Table 4).
Cumulative recruitment
Cumulative weed seedling recruitment was used to
document seedbank losses to germination. Cropping
system effects were observed when density plots were
pooled (data not shown); however, the large variation in
the background weed population limited our ability to
resolve density treatment effects. Although site year was
a significant source of variance for A. theophrasti and
C. album in Maine (Table 5), site year was pooled
because preliminary analysis showed a similar relation-
ship for both species. Cumulative recruitment differed
by cropping system and density, but there were no
interactions between these treatments for any of the
target weeds at either location (Table 5).
Summed over cover crop treatments, cumulative
emergence of Setaria spp., C. album and A. theophrasti
was 39, 211 and 69 plants m)2 in Maine and 68, 77 and
44 plants m)2 in PA. Seedling densities ranged from 0 to
242 and 0–448 for Setaria spp., 37–582 and 0–388
for C. album and 0–386 and 0–250 plants m)2 for
A. theophrasti, in Maine and PA, respectively.
Significant differences were not observed for C. album
cumulative recruitment by system at either location
(Table 6). We attribute this lack of response to high
initial background weed populations in both locations
and site years. In Maine, the greatest S. glauca recruit-
ment occurred in O ⁄P–R ⁄HV and O ⁄P-R ⁄HV and
surprisingly these were the low disturbance systems,
while recruitment was greatest for A. theophrasti in
O ⁄RC. In PA, cumulative recruitment of S. faberi and
A. theophrasti was highest in the M-BW-C and SF
systems where disturbance was highest (Table 6). Gen-
erally, seedbank supplementation resulted in higher
Setaria spp. and A. theophrasti recruitment, a pattern
that was particularly pronounced at higher supplemen-
tation rates in PA (Table 7). Chenopodium album seed-
bank supplementation only resulted in higher
recruitment under the highest supplementation rate
and only in PA.
Weed community analysis
Abutilon theophrasti, C. album and Setaria spp.
responded strongly to cover crop treatments and field
sites (Fig. 3). Using RDA, the primary axis in the
Table 5 Analysis of variance table of cumulative seedling recruitment for Setaria spp., Chenopodium album and Abutilon theophrasti
populations in Maine (ME) and Pennsylvania (PA) for the 2004 and 2005 recruitment year
Location Effects
Setaria spp. C. album A. theophrasti
DF F-value P DF F-value P DF F-value P
ME Cropping system 4 7.10 0.0001 4 0.69 0.6147 4 4.81 0.0107
Density 2 158.17 0.0001 2 2.74 0.0701 2 273.99 0.0001
Cropping system · density 8 0.82 0.5901 8 0.90 0.5171 8 0.62 0.7591
Site year 0.2827 0.0001 0.0001
PA Cropping system 4 4.99 0.0093 4 2.77 0.0767 4 8.47 0.0009
Density 2 8.88 0.0003 2 20.16 0.0001 2 91.85 0.0001
Cropping system · density 8 0.33 0.9517 8 0.36 0.9375 8 1.15 0.3370
Site year 0.2420 0.2404 0.2584
Table 6 Cumulative seedling recruitment for Setaria spp.,
Chenopodium album and Abutilon theophrasti (plants m)2)
populations across the cropping systems in Maine (ME) and
Pennsylvania (PA) (density and year pooled). Means comparison
for C. album and A. theophrasti (ME) by year (only treatments with
year effect) did not vary between year and was therefore pooled
Location System Setaria spp. C. album A. theophrasti
ME SF 30b 240a 54b
GB-R ⁄ HV 21b 172a 46b
B ⁄ BW ⁄ B 34ab 206a 56ab
O ⁄ P-R ⁄ HV 65a 209a 101a
O ⁄ RC 41ab 230a 90a
PA SF 138a 99a 68a
O-R ⁄ HV 38b 71a 50ab
B ⁄ BW ⁄ B 90a 89a 50a
O ⁄ P-R ⁄ HV 27b 43a 22b
O ⁄ RC 43b 104a 33b
Mean values within a given location and year followed by the same
letter are not significantly different according to Tukey�s tests
(P = 0.1).
SF, summer fallow; GB-R ⁄HV, green bean-rye ⁄ hairy vetch,
O-R ⁄HV, oat-rye ⁄ hairy vetch; M-BW-C, yellow mustard-
buckwheat-rape; O ⁄P-R ⁄HV, oat ⁄ pea-rye ⁄ hairy vetch; O ⁄RC,
oat ⁄ red clover.
8 S B Mirsky et al.
� Published 2010. This article is a US Government work and is in the public domain in the USA
Journal Compilation � 2010 European Weed Research Society Weed Research

bi-plot, which accounts for the greatest amount of
variation in the weed communities, represents a soil
disturbance gradient (F = 11.85, P = 0.002) (Fig. 3).
The cover crop treatments were strongly associated with
the disturbance gradient; as a result, SF, M-BW-C, GB-
R ⁄HV and O-R ⁄HV treatments were on one extreme
and O ⁄RC and O ⁄P-R ⁄HV on the other. The species
vectors were negatively correlated with disturbance.
Setaria spp. was strongly associated with O ⁄RC,
particularly in PA. Chenopodium album increased in
Maine and was strongly positively associated with
O ⁄P-R ⁄HV. Abutilon theophrasti displayed little associ-
ation with either disturbance gradient or site year.
Species vectors tended to associate with locations where
the greatest increases in the populations were observed:
S. faberi and C. album in PA in 2004 and C. album for
both years in Maine (Table 8). The M-BW-C and SF
systems were both negatively correlated with A. theo-
phrasti, C. album and Setaria spp. (Fig. 3). The cash
crops systems were negatively correlated with C. album
and not correlated to A. theophrasti. The orthogonal
secondary axis represented a growing condition gradient
(site years) (F = 3.11, P = 0.002). Location had a
minor influence on the community gradient, as indicated
by proximity to the centroid in the biplot, and based on
the forward selection analysis not being significant
(P = 0.940).
Weed community was significantly influenced by site
year and cover crop systems, and interactions between
site year and location, and site year and cover crop
systems (Fig. 3). These results confirm the significant
community gradient observed in the ordination biplots,
where species vectors and several cover crop systems
strongly associated with a given site year. Location was
not a significant source of variance, but there was an
interaction with site year. Interactions between location
and site year may have resulted from variation in
background seedbank populations between locations,
causing greater changes in the seedbank, PA having a
higher A. theophrasti population in 2004 and Maine in
2005 (Table 8). As both cover crop systems and the
species vectors were distributed along the disturbance
gradient, the results indicate the SF and M-BW-C were
the only cover crop systems that consistently reduced all
weed populations. These results confirmed our hypoth-
esis that consistent depletion of the germinable seedbank
increases with greater frequency of soil disturbance and
cover cropping.
Discussion
These results indicate the combination of tillage and
cover crops resulted in very high seedbank depletion
rates, rates considerably higher than under more con-
ventional management. Teasdale et al. (2004) reported
>50% reductions in the Amaranthus hybridus L.
germinable seedbank in years of good weed management
in a soyabean cash crop. In another study that included
eight locations across the US Corn Belt, C. album,
S. faberi and A. theophrasti seedbanks declined 40–47%,
Table 7 Cumulative seedling recruitment for Setaria spp.,
Chenopodium album and Abutilon theophrasti (plants m)2)
populations in the density plots for the recruitment year (years
pooled) across the supplement seedbank densities in Maine (ME)
and Pennsylvania (PA) (cropping system and year pooled). Means
comparison for C. album and A. theophrasti (ME) by year (only
treatments with year effect) did not vary between year and was
therefore pooled
Location Density Setaria spp. C. album A. theophrasti
ME Low 4c 194a 6c
Medium 28b 206a 35b
High 83a 234a 167a
PA Low 54c 46b 6c
Medium 68b 55b 25b
High 121a 101a 102a
Mean values within a given location and site year followed by the
same letter are not significantly different according to Tukey�s tests(P = 0.05) for the high density plots.
1.0
1.0
SET. spp.
PA
2004
2005
M-BW-C
–1.0
–1.0
CHEAL
ABUTH
SF ME
O-R/HV &
GB-R/HV
O/P-R/HV
O/RC
Tillage
Treatment P(perm)Field site year 0.002
Location 0.182System 0.018
Field site year x location 0.002Field site year x system 0.002
Fig. 3 Biplot ordinations from a redundancy analysis displaying
the associative relationships between the proportional change
(final ⁄ initial) in the weed community assembled from the three
target weed species (CHEAL – Chenopodium album; SETFA –
Setaria spp.; ABUTH – Abutilon theophrasti) and the explanatory
variables: site years ( ) (2004; 2005), location (m) (Maine-ME;
Pennsylvania-PA), cropping system (j) (O – Oats; RC – red clover;
HV – hairy vetch; P – pea; GB – green bean; M – Mustard; BW –
buckwheat; C – rape), and tillage (- - -). Multivariate analysis of
variance table using permutational multivariate analysis of
variance of site year, location, and system treatment factors.
Soil disturbance, cover crops and seedbanks 9
� Published 2010. This article is a US Government work and is in the public domain in the USA
Journal Compilation � 2010 European Weed Research Society Weed Research

78% and 42%, respectively over a 1 year period (Davis
et al., 2005).
The stimulating effect of disturbance on weed
seedling recruitment in PA is consistent with other
reports in the literature. Mulugeta and Stoltenberg
(1997) observed up to a sixfold increase in S. faberi
and C. album emergence in tilled vs. untilled soils.
Additionally, these authors reported 16-fold reductions
in C. album and sixfold reductions in S. faberi seedbanks
in a single season. Therefore, it is likely that specific
treatments, through disturbance and microclimate,
favoured germination losses to the seedbank more than
others, and that this germination is the primary mech-
anism for drawing down the seedbank (Forcella, 2003).
While cumulative weed emergence strongly corre-
sponded to initial seedbank densities, it is unclear why
emergence was not similarly influenced at the Maine
study site. It is possible that cooler soils at the time of
tillage, or the presence of higher concentration of cover
crop-derived allelochemicals may have played a role
(Mohler, 2001).
The species-specific response to cover crop treat-
ments, resulted in a restructuring of the weed commu-
nity. While we chose to study three summer annual weed
species, they reflect differences in seed size, longevity and
responsiveness to germination stimulants (disturbance
and cover crop induced germination). Therefore, we
infer that these systems would act in a similar way on a
broader spectrum of summer annual weed species. In
their framework for long-term management of weed
seedbanks, Swanton and Booth (2004) identified four
management tactics that target critical life history stages:
increase seed mortality, manipulate seed germination
and emergence, reduce seed production, or complete
removal of the above-ground biomass. The success of
our community-based weed management approach was
a result of the direct effects of cover crops and tillage
targeting all of these critical life history stages. A distinct
feature of the SF and M-BW-C systems is the distribu-
tion of soil disturbance evenly throughout the growing
season, thereby stimulating germination and then
controlling the germinated plants. In effect, the SF and
M-BW-C serve as a full season form of stale-seedbed
management. The success of this stale-seedbed approach
is only realised, if resulting weed cohorts are managed
and not allowed to reproduce (Bond & Grundy, 2001;
Gallandt, 2006). Given the M-BW-C system has a lower
disturbance frequency than the cash crops systems,
which varied in its weed suppressive performance, the
distribution of the disturbance events are likely to be as
important as frequency.
The SF system served as the control system and was
expected to provide consistent suppression of weed
populations, because it directly targeted weeds before
maturity. However Cyperus esculentus L., one of the
naturally occurring perennial weeds at the study site,
increased threefold in the SF compared with the
M-BW-C system in PA (data not shown). Most of the
C. esculentus emergence in the glasshouse assays
appeared to arise from vegetative structures, rather than
from seed. Clearly tillage alone (SF) was not enough to
manage C. esculentus. In contrast, the M-BW-C system
provided significant suppression of C. esculentus. In
addition to the disturbance and cover crop biomass
produced by this system, additional weed suppression
may have been provided by the Brassica cover crop
which is known to produce glucosinolates (Bhowmik &
Inderjit, 2003), a weed suppressive allelochemical. This
finding is significant, in that it identifies a cover crop
treatment that is broadly suppressive of both annual and
perennial weeds common to such cropping systems.
Our results also suggest that the timing of soil
disturbance is as important as frequency in reducing
weed seedbank populations. For example, managing for
high cover crop biomass in the O ⁄P-R ⁄HV system in
Maine, resulted in large increases in the C. album weed
seedbank. Similarly, poor crop stand establishment and
delays in management in the oat cash crop in PA
resulted in S. faberi surviving to reproductive maturity,
with corresponding increases in the Setaria spp. seed-
bank. Variations in timing of disturbance can cause
species shifts. If the disturbance coincides with the
emergence period of a species, that species will be
effectively controlled (Crawley, 2004).
Table 8 Mean, standard deviation and range of initial germinable seedbank for Setaria spp., Chenopodium album and Abutilon theophrasti
(seeds m)2) populations at Maine (ME) and Pennsylvania (PA) for 2004 and 2005
Location Site year
Setaria* spp. C. album A. theophrasti
Mean SD Range Mean SD Range Mean SD Range
ME 2004 41 58 0–301 4270 2152 844–12 357 26 41 0–181
2005 152 233 0–1266 2938 2107 121–11 212 131 197 0–1236
PA 2004 1734 1229 91–6030 1768 1182 364–6333 166 212 0–939
2005 309 276 0–1364 447 639 0–4061 113 176 0–788
*Setaria faberi in Pennsylvania and Setaria glauca in Maine.
10 S B Mirsky et al.
� Published 2010. This article is a US Government work and is in the public domain in the USA
Journal Compilation � 2010 European Weed Research Society Weed Research
Conclusion
Field experiments, conducted in PA and Maine, demon-
strated that soil disturbance associated with cover crop-
ping encouragedweed seed germination, thereby reducing
the density of germinable seed in the weed seedbank. Of
the five cover cropping systems, one, M-BW-C, consis-
tently depleted the weed seedbank through weed expres-
sion and subsequent control of emerged plants. That same
system also provided the greatest suppression of the
troublesome perennial C. esculentus. The frequency and
even temporal distribution of soil disturbance in the
M-BW-C system stimulated weed seed germination,
controlled emerged plants and pre-empted weed seed
rain. We also found that in slower growing perennial
cover crops, weedy species like Setaria spp. were able
grow and set seed in the growing cover crop. When this
happened, the �debits� resulting fromweed seed emergence
were overwhelmed by the resulting seed rain �credits�(Forcella, 2003). The M-BW-C system provided an
effective and consistent community-based approach to
weed management (Swanton & Booth, 2004). The lower
disturbance and cash crop systems may still provide a
useful population-based approach to managing weeds.
However, their weaknesses were revealed during the
course of this study.
A first step in the development of weed management
systems that are durable enough to withstand the
inherent variability of weather and management is the
reduction of the weed seed bank. Our work indicates
that the seedbanks of weedy fields can be dramatically
reduced in a single field season using cover crops and
tillage. These results may be particularly relevant to
farms in transition to organic production or small
holder vegetable production where crops are less com-
petitive and where herbicides are less likely to be used.
This practice primarily served as a rescue practice when
weed management in the previous year is compromised.
The highly dormant fraction of the seedbank will still
persist and will require continuous management. Future
research addressing the persistent fraction of the
seedbank could identify practices that would further
reduce seedbanks, a step that would make EBWM more
robust.
References
ANDERSON MJ (2001) A new method for non-parametric
multivariate analysis of variance. Austral Ecology 26, 32–46.
ANDERSSON TN & MILBERG P (1998) Weed flora and the
relative importance of site, crop, crop rotation, and nitrogen.
Weed Science 46, 30–38.
BHOWMIK PC & INDERJIT (2003) Challenges and opportunities
in implementing allelopathy for natural weed management.
Crop Protection 22, 661–671.
BOND W & GRUNDY AC (2001) Non-chemical weed manage-
ment in organic farming systems. Weed Research 41,
383–405.
BOOTH BD & SWANTON CJ (2002) Assembly theory applied
to weed communities. Weed Science 50, 2–13.
CAVERS PB & BENOIT DL (1989) Seed banks in arable land.
In: Ecology of Soils Seed Banks (eds MA LECK, BT PARKER &
R SIMPSON), 309–328. Academic Press, San Diego, CA,
USA.
TER BRAAK CJFAS P (2002) CANOCO Reference Manual and
CanoDraw for Windows User�s Guide: Software for CanonicalCommunity Ordination (Version 4.5). Micro Computer
Power, Ithaca, NY, USA.
CRAWLEY MJ (2004) Timing of disturbance and coexistence
in a species-rich ruderal plant community. Ecology 85,
3277–3288.
DAVIS AS, CARDINA J, FORCELLA F et al. (2005) Environmental
factors affecting seed persistence of annual weeds across
the US corn belt. Weed Science 53, 860–868.
FORCELLA F (2003) Debiting the seedbank: priorities and
predictions. Aspects of Applied Biology 69, 151–162.
FORCELLA F & LINDSTROM MJ (1988) Movement and
germination of weed seeds in ridge-till crop production
systems. Weed Science 36, 56–59.
FORCELLA F, ERADATOSKOUI K & WAGNER SW (1993)
Application of weed seedbank ecology to low-input crop
management. Ecological Applications 3, 74–83.
GALLAGHER RS & CARDINA J (1998) The effect of light
environment during tillage on the recruitment of various
summer annuals. Weed Science 46, 214–216.
GALLANDT ER (2006) How can we target the weed seedbank?
Weed Science 54, 588–596.
GALLANDT ER, LIEBMAN M, CORSON S, PORTER GA &
ULLRICH SD (1998) Effects of pest and soil management
systems on weed dynamics in potato. Weed Science 46,
238–248.
GALLANDT ER, FUERST EP & KENNEDY AC (2004) Effect of
tillage, fungicide seed treatment, and soil fumigation on seed
bank dynamics of wild oat (Avena fatua). Weed Science
52, 597–604.
GROSS KL (1990) A comparison of methods for estimating seed
numbers in the soil. Journal of Ecology 78, 1079–1093.
HARTZLER RG & ROTH GW (1993) Effect of prior year�s weedcontrol on herbicide effectiveness in corn (Zea mays). Weed
Technology 7, 611–614.
HILHORST HWM & DARSSEN CM (2000) Effect of chemical
environment on seed germination. In: The Ecology of
Regeneration in Plant Communities (ed M FENNER), 293–309.
CABI Publishing, Wallingford, UK.
JORDAN N (1996) Weed prevention: priority research for
alternative weed management. Journal of Production
Agriculture 9, 485–490.
LIEBMAN M & GALLANDT ER (1997) Many little hammers:
ecological management of crop-weed interactions. In:
Ecology in Agriculture (ed LE JACKSON), 291–343.
Academic Press, San Diego.
LONSBARY SK, O�SULLIVAN J & SWANTON CJ (2003)
Stale-seedbed as a weed management alternative for
machine-harvested cucumbers (Cucumis sativus). Weed
Technology 17, 724–730.
Soil disturbance, cover crops and seedbanks 11
� Published 2010. This article is a US Government work and is in the public domain in the USA
Journal Compilation � 2010 European Weed Research Society Weed Research

MILBERG P, ANDERSSON L, ELFVERSON C & REGNER S (1996)
Germination characteristics of seeds differing in mass.
Seed Science Research 6, 191–197.
MIRSKY SB, LANYON LE & NEEDELMAN BA (2008) Evaluating
soil management using particulate and chemically labile soil
organic matter fractions. Soil Science Society of America
Journal 72, 180–185.
MOHLER CL (2001) Enhancing the competitive ability of crops.
In: Ecological Management of Agricultural Weeds
(eds M LIEBMAN, CL MOHLER & CP STAVER), 269–321.
Cambridge University Press, Cambridge, UK.
MOHLER CL, FRISCH JC & MCCULLOCH CE (2006) Vertical
movement of weed seed surrogates by tillage implements and
natural processes. Soil & Tillage Research 86, 110–122.
MULUGETA D & STOLTENBERG DE (1997) Weed and seedbank
management with integrated methods as influenced by
tillage. Weed Science 45, 706–715.
PLANTE AF & MCGILL WB (2002) Soil aggregate dynamics and
the retention of organic matter in laboratory-incubated soil
with differing simulated tillage frequencies. Soil & Tillage
Research 66, 79–92.
REBERG-HORTON SC, BURTON JD, DANEHOWER DA et al.
(2005) Changes over time in the allelochemical content
of ten cultivars of rye (Secale cereale L.). Journal of Chemical
Ecology 31, 179–193.
REBERG-HORTON C, GALLANDT ER & MOLLOY T (2006)
Measuring community shifts in a weed seedbank study
with the use of distance-based redundancy analysis. Weed
Science 54, 861–866.
RYAN MR (2007) Stability of Weed Management Efficacy and
Weed-Crop Competition in a Long-Term Cropping Systems
Trial. MS thesis, The Pennsylvania State University,
University Park.
SCHONBECK MW & EGLEY GH (1980) Effects of temperature,
water potential, and light on germination responses of
redroot pigweed seeds to ethylene. Plant Physiology 65,
1149–1154.
SWANTON CJ & BOOTH BD (2004) Management of weed
seedbanks in the context of populations and communities.
Weed Technology 18, 1496–1502.
TEASDALE JR, MANGUM RW, RADHAKRISHNAN J & CAVIGELLI
MA (2004) Weed seedbank dynamics in three organic
farming crop rotations. Agronomy Journal 96, 1429–1435.
THOMPSON K & GRIME JP (1983) A comparative study of
germination responses to diurnally-fluctuating temperatures.
Journal of Applied Ecology 20, 141–156.
12 S B Mirsky et al.
� Published 2010. This article is a US Government work and is in the public domain in the USA
Journal Compilation � 2010 European Weed Research Society Weed Research