red guides paper 43 creating presentable powerpoint mic
TRANSCRIPT
Red Guides Paper 43
Creating presentable PowerPoint
Presentations (including reference to students with dyslexia or who do not have English as their first
language)
Mic Porter
Red Guides address educational and staff development issues within Higher Education and are aimed at colleagues within the University and at other institutions. Some describe current good practice in Higher education, others evaluate and/or comment on curriculum development and many provide ideas for teaching. All are meant to stimulate discussion, initiate action and implement change. The guides may be reproduced for work with, or distribution to, students of Northumbria University and can be purchased by those outside our own institution. The author (s) of this guide: Mic Porter School of Design Northumbria University New edition: ISBN 978 1 86135 426 6 British Library Cataloguing in Publication Data A catalogue record for this book is available from the British Library © Northumbria University 2008
1
Introduction Unfortunately we have all sat in lectures where the message has struggled to be communicated because, at least in part, the quality of the visual presentation. This problem is not new; thirty years ago Ian Galer produced guidance for presenters at the Ergonomic Society Conference and then made it available to a much wider academic audience (Galer 1976). However, technology progressed; chalk and projected photographic transparencies were replaced by OHP films and, more recently PowerPoint “slides”. These developments have increased the possibilities, reduced the need for intervention by others; who were, perhaps, more experienced graphically than most teaching staff. Today, most lecturers will produce their own visual materials but few will have more than an intuitive notion as to how to ensure effective visual communication.
In addition to the available technology (the ubiquitous PowerPoint1) there are three other aspects to be considered when presentations are developed.
• The Message content and the mode of delivery
• The Audience
• The Environment in which the presentation will be given
It was professional self interest and many unsatisfactory experiences, as presenter and audience member that drove this evaluation. It quickly became clear that in this area benefits are easily obtained from, simply, applying fundamental ergonomic principles! Something we could all do! The purpose of this guide is to help you create presentations that work and thus to enhance 1 Google’s “Star Office” is an “Open source” alternative.
2
communication of your material to the audience. It is underpinned by the fundamental belief that good communication enhances learning!
Fundamentals PowerPoint is a low resolution, projected display facilitation technology the adoption of which often degrades the communication that it is intended to enhance.
Today, typically, the usually installed projection system will only cope with an image of 1024 x 768 pixels and even this may be reduced by poor location of the projector and/or the screen relative to the seating. Indeed, the physical dimensions of the room, location of windows, level of lighting/black-out, lectern etc may greatly influence the effectiveness of a presentation. The inability to appropriately control illumination levels and vector may hinder the effectiveness of the technology and, of course, the ability of the audience to attend to the content, and take (or annotate) written notes.
Sound emitted from your presentation and then echoing round a room with, generally, hard surfaces can disrupt audio communication. Simply the student may not be able to distinguish your remarks from the background “noise” (what you might have intended as “mood music”)! Furthermore, in many venues sound cannot be stopped from “bleeding in” from the surroundings. Adding your PowerPoint audio to this will often be problematic!
PowerPoint is not without dialects and may not behave, as expected, when presentations are transferred between locations. Mathematical symbols, non-English Characters, images and graphs are, most commonly, problematic. Saving as PowerPoint 2003 or 2007 show versions can work but it may probably be safest (but still not without risk) to “wrap up” the presentation with Impatica (we have copies
3
within Northumbria University2). Unless you are confident about the technology you will find when you go to present, it will be best to check your show on both PC and iMAc based presentation systems.
Presentations, which, as they should, use slides with restricted content to support readability and usability can tempt the lecturer into a fast pace which can hinder the slower reader and give an unintended implication of urgency. Dyslexic3 and international students, in particular, can find such pacing of the presentation stressful and an additional barrier to learning.
Presenters may often, but should not, leave the creation of PowerPoint slides to the last minute. They should allow time to check against the original text of the paper/lecture and to rehearse the presentation; preferably in the location where the talk will be given. PowerPoint should only contain the headlines, and any technical material that will be referred to, probably in a discursive manner. The core record of the session will come from the presenter’s talk, notes made and the circulated paper or lecture.
It is often useful to complete the notes section of PowerPoint to prompt for your input and, if you are able to use a sophisticated, two screen computer system, then the lectern arrangement will probably show the notes of the presentation on one screen and the projected slide on the other. It is essential that you avoid simply reading either4! Look at; engage with, your audience.
2 Staff within Northumbria University can contact MARCET Staff Development Resource Centre for details 3 Of course this is only one of the many conditions that can influenced learning and may be exacerbated by poor PowerPoint presentations, others, that may be “hidden”/unknown to the presenter, include Dyspraxia and Dyscalculia and a wide range of visual or audio impairments. 4 In fact the argument for just reading a script is that it ensures that “first fixation” is yours and does not reside with the student recording the Lecture; essential for the creation of Copyright and other Intellectual Property Rights (IPRs).
4
Finally, don’t forget that Murphy, AKA “a Kerryman”5, like most engineers, was an optimist when considering situations that include artefacts and people!
The message content and the mode of delivery This guide cannot advise on the content of your presentation but must remind you that the projected mode of communication is restricted in what can be transmitted, received and interpreted. You must consider what you wish the audience to remember from your presentation and the change, if any, you wish to induce within the individuals present and beyond.
You will need to break down your material into small segments and remember that the audience will need some way to integrate the individual slides into the whole. The pace of a presentation is critical and, especially if the slides/images/graphs shown are complex can easily “lose” an audience. Remember you are familiar with the content and context but this is less likely for the majority of your audience.
If the importance of planning and critically reviewing the message to be communicated is ever doubted remember the Space Shuttle Columbia. In his article “Death by PowerPoint” Edward Tufte (2005, see also Tufte 2003) argues that the degree to which Challenger’s protective tiles were compromised by impacts, during the launch, was not effectively communicated by Boeing to NASA. This was due to poor design of the PowerPoint slides used at the critical mission conference that occurred while the shuttle was still orbiting. The slides all contained “the shorthand of acronyms, phase fragments and clipped jargon in order to get at least some of the information into the right format.” 5 Porter’s addendum to Murphy’s Law states that she is an optimist! Not only does the toast fall, as described, buttered side down but on bending down to clear up the mess you slip and bang your head on the worktop! An alternative example may also be noted that when anything soft/wet hits a fan there is no reason to expect an even distribution!
5
This style became necessary once the technological choice of PowerPoint was made. The three Boeing reports, presented to NASA, all had, at the very bottom of one PowerPoint Slide:
“Flight condition is significantly outside the test database Volume of ramp is 1920 cu in vs 3 cu in for test”6
The point that PowerPoint technology was implicated in the poor communication between the various technical teams was, substantially accepted by the “Columbia Accident Investigation Board”:
“… it is easy to understand how a senior manager might read this PowerPoint slide and not realize that it addresses a life-threatening situation….” Gehman (2003) (p191)
Clearly few of us will need to accurately and rapidly communicate such life critical messages but should aim for clarity and effectiveness in our work. It should be a matter of craft pride that we can communicate the detail and, no doubt, the enthusiasm we hold for the topic in our teaching and conference presentations.
It is common to mitigate this cognitive load by handing out pre-printed versions of the slides which may, or may not, include formalised space for the individual to add their own notes.
The usual format is an A4 sized handout with 3 slides (with note space) or 6 slides (without) per page. If these are simply taken from the presentation they can be difficult to read and unless the guidance that follows in this guide is 6 In fact this entry is pointing out that the volume of one of the three pieces of debris that was assumed to have damaged the left wing of Columbia shortly after take-off has 640 times the volume of anything that was ever impact tested on the tiles. No evidence was found that significant was used, by Boeing, in the sense of statistically significant or that the implication that previous research was irrelevant to the current situation was reported.
6
closely followed they may be impossible to read without resorting to a magnifying glass!
Using the option of 6 sides per A4 page or 3 (with space for notes) will result in unreadable text if the original slide was less than 24 point or not of a clear font. Unlike the actual PowerPoint presentation serif fonts (eg the classic Times (new) Roman & Batang can work for printed text but others (eg Blackadder) should only be used exceptionally and with great care by people, graphic designers, who know! Note that sans serif fonts are preferable for the PowerPoint slides themselves.
While giving the audience the slides will be helpful it is often beneficial to offer a narrative (or more formal) paper to support your presentation. Alternatively a link to your whole presentation does permit follow-up investigation but even this does not necessarily add to the understanding of the message – just its readability. It should, however, be noted that an electronic version of your presentation might be welcomed by many and seen as a step towards inclusion, especially by, for example, dyslexic or overseas students and those handicapped by the environment, poor vision or hearing.
Reading the reproduced “handout” slides you know well in the, hopefully, appropriate conditions of your office might suggest to you that 20 (or even 18) point text is readily acceptable but try the same, with unfamiliar content, in the low level of illumination typical of a lecture or seminar room, while trying to divide attention between the slide, the presenter and the person sitting next to you. You will appreciate a clear 24 point (or larger) font is essential for effective communication. Additionally, if your audience is ageing, has uncorrected vision, needs to switch between reading and distance glasses or uses multi/vari-focals then
7
effective learning can be seriously hampered by the small printed text and the need to attend to the projected image!
Complex graphs rarely print out clearly; remember that printing in colour may not be available and will never be as cheap as black-on-white paper! Use various line qualities to distinguish between different variables not colour alone.
In conclusion, printing PowerPoint slides to distribute as a handout is common but rarely satisfactory; better write the paper! Indeed, if you have cramped slides and adopt, offered default of 3 or 6 images per A4 page then some elements will be unreadable under any conditions. Furthermore, in informal discussions with students; in the feedback given in “Programme Review Committees” and “Staff-Student meetings”; it is clear that expecting students to print their own copies annoys especially if the presentation demands colour for clarity of understanding.
The Audience In any audience there may be a spread of enthusiasm for your message and there could also be a wide range of sensory and cognitive abilities. Some students may simply see the minimum engagement necessary to obtain the (?low) level of award that will satisfy them while others will take your material and enthusiastically enhance it. As lecturers we should be addressing both extremes and all that lie between. Indeed, our role is to encourage the whole cluster of students to improve and engage with our material.
It may be that members of your audience who have particular needs may make themselves known to you but they may not. You might also notice a clue to an individual’s needs but, fundamentally, you often can’t tell who, in the audience, has what needs and preferences. You should, however, seek to maximise the effectiveness of your normal presentation while offering alternatives that will
8
support any particular needs of which you may become aware. In some cases this will be a legal imperative under the Disability Discrimination Act (1995) (DDA) but for all it should be an essential part of their role. Note that some relevant amendments to the DDA came into force in September 2007 including those concerning the responsibilities of Professional Bodies and thus those offering membership qualifying qualifications.
In the previous section reference was made to some of the, possibly “corrected” issue of visual acuity and the advantages to be gained from making the PowerPoint presentation available to such audience members electronically and, preferably, in advance. It should be remembered that any requirement to change focal plane may be problematic, and that the proportion of those having difficulty will increase with the age of an audience. It may be that a presentation first devised for a “Research Seminar” within the University does not translate well to a large group of, more elderly, distinguished academics or practitioners attending your Conference Keynote.
It is likely that audience members who do not share the language of presentation may find it difficult to understand and interpret your PowerPoint slides. An individual, even the most experienced in your language, rarely reads as fast as one who was brought up in the language and thus they will need more time to read the material presented.
The use of English as a second language, and as a language of instruction, is growing globally. The audience member might also not share your cultural or colloquial references and thus find it harder to absorb your message. The student from a Mediterranean area might find it difficult to come to terms with our focus on building houses and offices to retain heat. While I have confused a group of Asian students by referring to an article that started with “X is the toast of the design profession”. In that case after
9
rapid, surreptitious delving into their electronic translation devices the students came back with definitions relating to “lightly burnt bread”. The funding and cultural imperatives that encourage Universities to take students for whom English is not their first language also impose upon us a requirement to maximise the benefit the student gains from studying with us. It is worth noting that the student for whom English is not their first language may have similar debilitating difficulties with poor presentations/materials as will dyslexic students.
Dyslexia is not only an issue for the “native” English speaker (or learner) but the multi-root nature of the language may be a particularly disabling factor for all. Goulandris (2003). An Asian student from an icon based language may find themselves “dyslexic” when working in English in a way that they are not in their first language.
The concept of dyslexia has been subject to discussion and investigation for over 100 years (Hinshelwood, 1896). The multi-factorial causes are still the subject of research and it is clear that there is unlikely to be a single simple recipe for overcoming the handicap to learning of poor presentations. Indeed as understanding of effective learning styles develops so does the knowledge that the mode and style of teaching must support the diversity to be found within the learners. This is not only professional self interest; it is a powerful reason for reviewing and investigating a topic. As previously mentioned benefits are easily obtained from simply applying fundamental ergonomic principles which is something we could all learn to do.
There are, however, some traits that are more common among dyslexic students that might exacerbate the impact of poor slides upon them. They are, for example, more likely than the general population to reduced colour discrimination; finding, for example red/green or blue/yellow confusingly similar. In rare cases they might also be
10
completely “colour blind”. (However, it must also be noted that within the UK population “colour blindness”, not apparently associated with dyslexia, is not uncommon. For example 1:12 (Γ) or 1:200 (Ε) will be unable to distinguish between red and green, usually seeing both as a “brown”. Any slide that uses red, green or brown to distinguish, for example, lines on a graph will not be readily interpretable by these individuals. There is also evidence that students diagnosed with dyslexia are more prone to problems resolving un-steady images and working with poor lighting than the general population is.
These factors can result in the need to spend additional time re-reading or checking work and thus the student finds themselves working way beyond the nominal 100 hours per 10 point module and perhaps suffering from additional stress especially as assignments become due. There is also the secondary effect that these additional time demands reduce the time available for socialising, sports or any, perhaps essential, paid employment. Finally there is also the stress that might be caused by simply not wanting to “get the English wrong” or to otherwise draw attention themselves. Thus strategies are devised and adopted to disguise difficulties and errors and, perhaps, the incentive to work with others is, unacceptably, encouraged.
There are many guides and services offering help to produce web based materials that are accessible and meet the requirements of the DDA including, for example, RNIB (2007). However, much less has been written about producing, public, web based materials suitable for use in the “classroom” or conference presentation. There are also locations for advice to the student to help with their study skills (for example, Anon, no date and Anon 2007)
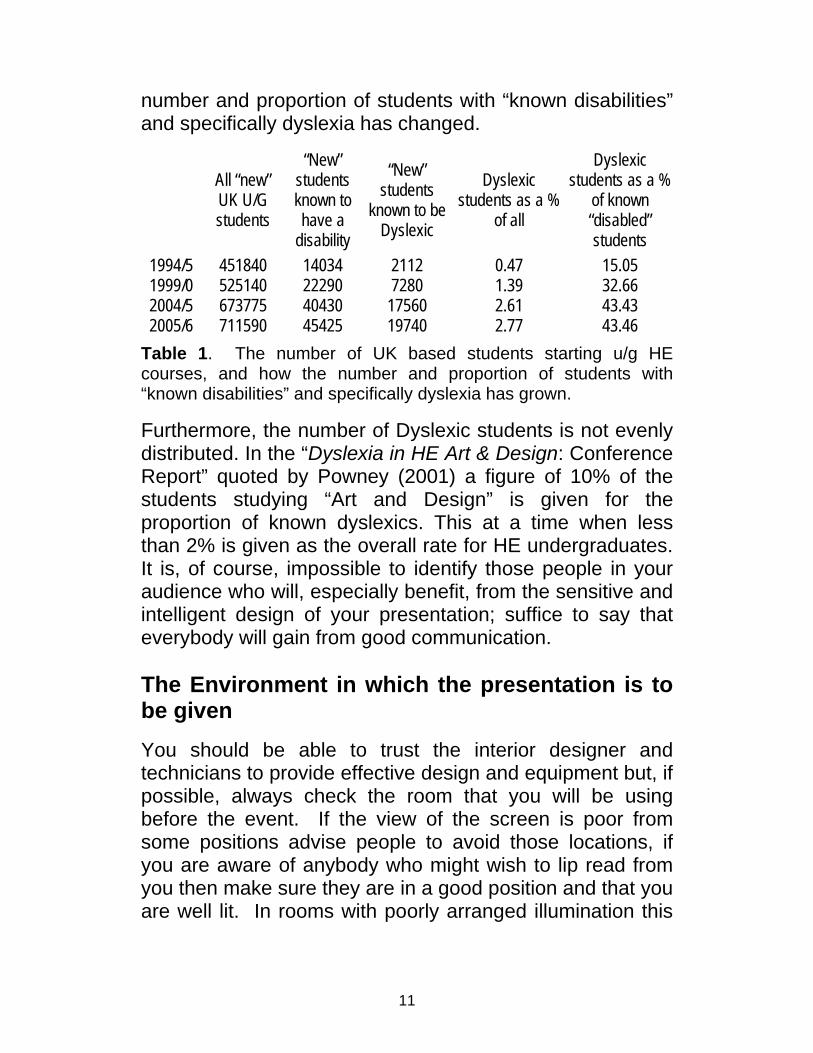
The HESA (2007) data presented in the table below shows how the number of UK based undergraduate students starting in Higher Education has changed and how the
11
number and proportion of students with “known disabilities” and specifically dyslexia has changed.
All “new” UK U/G students
“New” students known to have a
disability
“New” students
known to be Dyslexic
Dyslexic students as a %
of all
Dyslexic students as a %
of known “disabled” students
1994/5 451840 14034 2112 0.47 15.05 1999/0 525140 22290 7280 1.39 32.66 2004/5 673775 40430 17560 2.61 43.43 2005/6 711590 45425 19740 2.77 43.46
Table 1. The number of UK based students starting u/g HE courses, and how the number and proportion of students with “known disabilities” and specifically dyslexia has grown.
Furthermore, the number of Dyslexic students is not evenly distributed. In the “Dyslexia in HE Art & Design: Conference Report” quoted by Powney (2001) a figure of 10% of the students studying “Art and Design” is given for the proportion of known dyslexics. This at a time when less than 2% is given as the overall rate for HE undergraduates. It is, of course, impossible to identify those people in your audience who will, especially benefit, from the sensitive and intelligent design of your presentation; suffice to say that everybody will gain from good communication.
The Environment in which the presentation is to be given You should be able to trust the interior designer and technicians to provide effective design and equipment but, if possible, always check the room that you will be using before the event. If the view of the screen is poor from some positions advise people to avoid those locations, if you are aware of anybody who might wish to lip read from you then make sure they are in a good position and that you are well lit. In rooms with poorly arranged illumination this
12
may not be possible as your light may flood onto the Screen.
The adjustability of the lighting, the effectiveness of window blinds, the weather and even the time of year can make a big difference to how the room is lit and thus the design of your presentation. If the room is totally blacked then people will find it difficult to make notes. If possible adjust the lighting so that the audience has sufficient to read and write but if that is not possible make your PowerPoint slides with black writing on a white (or very light) background. The light reflected from the screen will help the audience but only those sitting close to the screen.
If the room has some light – naturally through the (thin) blinds or from dimmed lighting – then white (or very light) text on a dark background is preferable. I often use white text on a dark blue background and find that this works well. Thus if you are unaware of the room for your presentation and cannot get accurate information from the venue then I advise that you prepare two version of the presentations – one black text on a white background and one with white text on a dark blue background. Of course, if your presentation is purely text then this “reversal” is relatively easily obtained by changing the PowerPoint Master Slide but check – surprising effects can occur with text pasted in, graphs or images.
The acoustics of the room, especially if large, should be checked and, if you are using sound, playing video clips etc, check the sound levels before the event. Don’t forget that using a fixed microphone may limit your ability to point (even with a laser pen) at your slides. Body worn microphones are usually best but note that the levels of the mic and any PowerPoint sound will need to be separately set. Before, like me, you start to wander remember that you may have a lip reader in the audience.
13
When setting levels in a large lecture theatre pay attention to the location of the speakers and check out the level for those sitting away from them. This is one aspect of a presentation that is, largely, in the control of the venue but take particular care (and expect to find some unsatisfactory locations) when you are scheduled to speak in a large flat, multipurpose room such as provided by many hotels for the conferences they host. In such large flat rooms also expect many in the audience to have difficulty seeing your presentation.
It can also be important to check how the technicians are going to deal with your presentation. I was recently giving a keynote presentation in a large, purpose built, very high quality venue where the dais was centre stage between two large projection screens. At the start of the presentation both screens showed my introductory screen but part way through the presentation I became aware that only half of the audience could see my presentation; one screen continued to show the PowerPoint slides but the other was filled with a close up of me! For my true fan this might have been of delight but for me it was a disaster as I tried to explain the impact of the cost/benefit analysis on patient handling incidents in the health service! I was then required to repeat elements of my presentation while socialising afterwards!
Designing the Presentation – the detail Master Slide Design
Careful use of design of templates and Master Slides7 can aid the creation of consistent slides. However, they can also offer temptations that must be resisted! Clever, complex backgrounds are offered by the software and others may be readily downloaded from the web but an
7 Until 2003 only two masters were permitted – Title and Presentation but subsequent version support multiple Masters.
14
imposing background will never make a poor lecture exciting. However, they can:
• hinder readability
• distract
• appear lazy when standard MS templates/option are used
Use “flat colour” backgrounds and only include essential applied decoration – especially if animated – with care. Simplicity, of style, is to be preferred and there is rarely any need for logos/slogans/strap-lines on each slide even if they are appropriate at the start and/or finish of the presentation. Resist the temptation to include visually enticing logos, “strap-lines” etc in “headers” and/or “footers”; they distract! To satisfy any IPR role the information does not need to be large and the audience is, hopefully, unlikely to need frequent reminding as to your affiliation or the title of the event they are attending.
If you want to improve the presentation then improve the content. Audience boredom is unlikely to be solved by changing the slide decoration but by improving the presentation. PowerPoint should be used to support the individual cognitive learning style of each member of the audience. PowerPoint must not dominate, disrupt, dismay or trivialise the content to be presented.
Slide Content Design/Layout
Never, simply reproduce printed text, graphs or images from material published on paper and expect the outcome to be legible or effective for the learner. PowerPoint is good for presenting limited quantities of information in a strictly hierarchical structure and at a low resolution but little else!
15
Including images on the slide can help recall learning but use with care and respect the copyright of others. “Clip art” and standard images attract attention away from the content; especially when the audience can’t quite remember where the item has been taken from or where they have seen it before!
While a 35mm photograph has the aspect ratio of 2:3 (24mm x 36mm) a typical projection system will, usually, be a “squarer” 3:4 (1:1.33) while the screen may often drop from the ceiling and thus suggest that the presentation may be of “portrait”8 orientation. A computer screen or projector resolution of 768 x 1024 pixels is typical and working with images of 8 inches (203mm) by 10.67 inches (271mm) at 96 dpi works well.
Digital cameras are useful for the creation of images but aspect ratios, resolutions and image size vary. In many cases the image produced is of low resolution but of large (virtual) size; 1m x 1.5m @ 72 dpi is not atypical and produces approximately a 12Mb Tiff format file.
If your images contain more information than is required then not only will the additional quality not be visible but it will also result in an unnecessarily large PowerPoint file and slow slide loading and projection. However, higher quality images may be beneficial if the slides are to be printed larger than the PowerPoint defaults. Simply using “save as” and giving the presentation a new name can reduce the file size, perhaps by 50%
As PowerPoint keeps track of the image to be shown and, if it has been edited, the original as well, the overall PowerPoint file size is smaller if imported images are of appropriate size and are not cropped/resized within the programme. Standard graphical packages are, also, 8 The alternative orientation of images is often described as “portrait” or “landscape”. The former is taller than it is wide wile the latter, vice versa.
16
generally easier to work with for image manipulation than the tools within PowerPoint.
Don’t include sounds, animations or moving images unless they are crux of the session. Don’t use numerous slide transitions as they can often debilitate, distract or simply annoy the audience. However, do build all but the simplest diagrams and graphs, element-by-element to aid comprehension of the whole.
Some basic rules:
• In rooms that are not blacked out then light text on a dark background is preferable. However, dark text on a light background is preferable when the room has a good black out but under such conditions do not expect notes to be taken!
• Never more than 7 points per slide and 5 is much better. Better to create another slide than to “squash” the material.
• Use a san serif font (Arial, Comic Sans, Helvetica, Tahoma, Trebuchet, Verdana, etc.)
• Sized as 24 point or larger, but not larger than 32.
• Mix upper and lower case letters, never just CAPITALISE.
• Capitalise conventionally and left align text; never justify.
• Add emphasis with bold not italics or underlining. Colour may also be used for emphasis but take care and avoid using red and green together.
• Space lines at 1.5 times or even twice normal.
17
• Use bullets and numbering to identify points. Both work well for dyslexic students (but some screen readers prefer numbers to bullets.)
• Keep it simple - limit the number of presentational features, per slide, to only one or two colours, fonts, transitional or animation effects. [Classic KISS9 advice].
• Hyphenate rather than compound words; under-graduate/un-blocked/well-being preferred by most dyslexic and international students to undergraduate/unblocked/wellbeing.
• In how many ways will your presentation be used? Create it to support all the uses expected! The following points, for example, not only relate to the presentation itself but may be especially important if the PowerPoint file is to be made available electronically.
• Use the Notes facility of PowerPoint. This not only will help you the presenter but, if the presentation is made available electronically, to those that open it. Additionally, the Notes section is accessible to the supportive technologies, screen readers, automatic website converters, etc.
• Add punctuation at the end of paragraphs, headings, bullets, and tables. There is some evidence that this helps the dyslexic reader but they are essential if the presentation is to be made available electronically and may be “read” by screen voicers.
• Take care with tables or columns within the text but remember that some dyslexic people prefer the structural framework these may give. However,
9 KISS = “Keep it stupidly simple”
18
they can be difficult to locate appropriately (although the arrow keys can help by nudging the attached item pixel by pixel). Incorporated images and untagged diagrams or pictures can confuse the voicers.
• When incorporating graphs into presentations ensure that you use both line quality and colour to distinguish the variables. Always, check to see how the result prints in black and white as this will be more likely, and certainly cheaper, than colour.
• Finally a general rule for all presentations – 200:1. You can read from 200 times the height of the capital “E”. So if your text has an “E” of 2mm high then it can be read from 400mm away. So if you want your headline to be read from across the room – 20m away then it must 10 cm high. This “rule” works for “normal” fonts, under reasonable lighting conditions and for people with (reasonably) corrected eyesight.
Conclusions In 2004 Simons suggested that there were between 20 and 30 million presentations given, each day, world-wide, with PowerPoint (PPT). Curiously, with a typical audience of 10 this could imply that between 3% and 5% of the population of the world are, listening to a PowerPoint presentation; thankfully this daily exposure/experience is not evenly distributed!
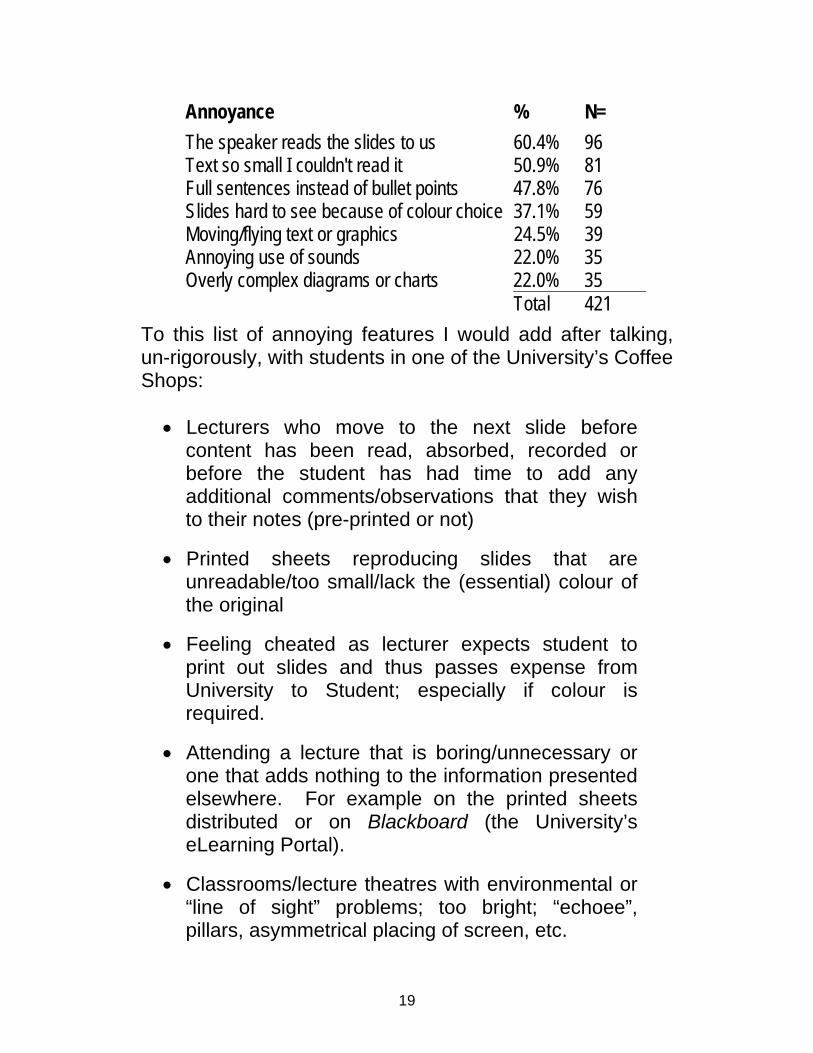
Paradi (2003) asked a few (n=159) people what they found most annoying about the PowerPoint presentations that they see. The published summary reported an average of 2.65 annoyances per respondent.
19
Annoyance % N= The speaker reads the slides to us 60.4% 96 Text so small I couldn't read it 50.9% 81 Full sentences instead of bullet points 47.8% 76 Slides hard to see because of colour choice 37.1% 59 Moving/flying text or graphics 24.5% 39 Annoying use of sounds 22.0% 35 Overly complex diagrams or charts 22.0% 35 Total 421 To this list of annoying features I would add after talking, un-rigorously, with students in one of the University’s Coffee Shops:
• Lecturers who move to the next slide before content has been read, absorbed, recorded or before the student has had time to add any additional comments/observations that they wish to their notes (pre-printed or not)
• Printed sheets reproducing slides that are unreadable/too small/lack the (essential) colour of the original
• Feeling cheated as lecturer expects student to print out slides and thus passes expense from University to Student; especially if colour is required.
• Attending a lecture that is boring/unnecessary or one that adds nothing to the information presented elsewhere. For example on the printed sheets distributed or on Blackboard (the University’s eLearning Portal).
• Classrooms/lecture theatres with environmental or “line of sight” problems; too bright; “echoee”, pillars, asymmetrical placing of screen, etc.
20
• Detail that is too small to see on the screen but that is critical
• Presented material taken directly from books or articles and is thus unreadable due to size, style or image quality. (Probably also a breach of copyright!)
• “Naff” clip art
PowerPoint might be (nearly) ubiquitous but it is not universally welcomed and may fail completely as a technology supporting communication between the presenter and the audience. Remember Columbia!
If your presentation is important then spend the time preparing the paper, the script and the PPT headline slides. If it is not important then; what are you doing making the presentation?
"The cognitive style characteristics of the standard default PPT presentation: foreshortening of the evidence and thought, low spatial resolution, a deeply hierarchical single-path structure as the model for organising every type of content, breaking up of the narrative and data into slides and minimal fragments, rapid temporal sequencing of thin information rather than focussed spatial analysis, conspicuous decoration and Phluff, a preoccupation with format not content, and an attitude of commercialism that turns everything into a sales pitch." (Tufte 2003)
21
References [Last access for all websites 20/06/07]
Anon (no date) http://www.dyslexia-college.com/
Anon (2007) http://www.skill.org.uk/
Galer, I (1976) Projector slides - preparation, construction and use. Applied Ergonomics 7(4) 190 -196
Gehman, WS (Chair) (2003, August) Columbia Accident Investigation Board Report [Volume 1] NASA: Washington
HESA (2007) Table 2e - All HE students by level of study, mode of study, subject of study (#1), domicile and gender 2005/06 http://www.hesa.ac.uk/index.php?option=com_datatables&Itemid=121&task=show_category&catdex=3
Paradi, D (2003) Survey Shows How to Stop Annoying Audiences With Bad PowerPoint.
http://www.communicateusingtechnology.com/articles/pptsurvey_article.htm
RNIB (2007)
http://www.rnib.org.uk/xpedio/groups/public/documents/code/public_rnib008789.hcsp
Simons, T (2004) Does PowerPoint make you stupid? Presentations magazine (March)
[www.presentations.com/presentations/delivery/article_display.jsp?vnu_content_id=1000482464 ]
22
Tufte, E. R. (2003) The Cognitive Style of PowerPoint. Graphic Press: Mass.
Tufte, E. R. (2005) PowerPoint does Rocket Science and better techniques for technical reports. http://www.edwardtufte.com/bboard/q-and-a-fetch-msg?msg_id=0001yB&topic_id=1
Some additional Sources of Information/Guidance (especially concerning dyslexic students)
Child D, Crompton S, Hewitt P, Horgan J, Nicholls P, Preston B & Russell A. (2003) Supporting students with disabilities and additional requirements. Open University: Milton Keynes
The Dyslexia Institute [www.dyslexia-inst.org.uk]
Disability Rights Commission (DRC) [www.disabilityrights.org.uk]
Goulandris N (ed) (2003) Dyslexia in Different Languages: Cross-Linguistic Comparisons. Dyslexia Association of Singapore. [www.das.org.sg/news/differntorthographics.htm]
Mortimore, T (2003) Dyslexia and Learning Style, Whurr Publishers.
RNIB (Royal National Institute for the Blind) Guidance material and services concerning accessible web materials at: http://www.rnib.org.uk/xpedio/groups/public/documents/code/public_rnib001951.hcsp
23
The Subject specific Learning & Teaching Support Network (LTSN) - For example, LTSN Engineering [www.engsc.ac.uk/index.asp] and LTSN Art, Design & Communication [www.bton.ac.uk/adc-ltsn]
The National Bureau for Students with Disabilities [www.skill.org.uk/info/demos/dyslexia.asp]
Technology and Disabilities, TechDis & the Association for Learning Technologies [http://www.techdis.ac.uk/] (Chair) (2003, August)