red clover increases micronutrient concentrations in forage mixtures
TRANSCRIPT
R
BCa
b
c
a
ARR1A
KGLLTSH
1
et(rmg(wfa
B((
h0
Field Crops Research 169 (2014) 99–106
Contents lists available at ScienceDirect
Field Crops Research
jou rn al hom epage: www.elsev ier .com/ locate / fc r
ed clover increases micronutrient concentrations in forage mixtures
odil E.M. Lindströma,∗, Bodil E. Frankow-Lindberga, A. Sigrun Dahlinb,hristine A. Watsonc, Maria Wivstada
Swedish University of Agricultural Sciences, Department of Crop Production Ecology, Box 7043, SE-750 07 Uppsala, SwedenSwedish University of Agricultural Sciences, Department of Soil and Environment, Box 7014, SE-750 07 Uppsala, SwedenScotland’s Rural College, Craibstone Estate, Aberdeen AB21 9YA, UK
r t i c l e i n f o
rticle history:eceived 29 May 2014eceived in revised form6 September 2014ccepted 19 September 2014
eywords:rassegumeeyrace elementoilerb
a b s t r a c t
Forage crops provide micronutrients as well as energy, protein and fibre to ruminants. However, themicronutrient concentrations of forage plant species differ, legumes generally having higher concentra-tions than grasses. In addition to that there are also strong effects of soil type. Typically, the concentrationsof one or several micronutrients in forage are too low to meet the nutritional requirement of dairy cows.We hypothesized that the overall micronutrient (Co, Cu, Fe, Mn, Mo, Zn) concentrations of forage mixturesare affected by the red clover dry matter (DM) proportion and site effects. This hypothesis was testedat three contrasting sites. The results showed that increased red clover proportion increased the overallconcentrations of several micronutrients in the mixtures at all sites. At the site with the widest rangeof red clover proportion (0–70%) in the mixture, the Co, Cu and Fe concentrations more than doubledbetween the lowest and highest red clover DM proportion. At the other two sites a smaller increase inred clover proportion (from 10% to 25% or from 25% to 50%) also increased the overall concentrations ofCo by up to 80% but less for other micronutrients. One of the sites generally had higher micronutrient
concentrations in the crop and removed larger amounts of micronutrients with the harvested biomasscompared to the other two sites. This could be explained by differences in pH and micronutrient con-centrations of the soils at the sites. We conclude that increased red clover proportion in the sward hasthe potential to increase the overall micronutrient concentrations but that the effect of the soil is also acontrolling factor.© 2014 Elsevier B.V. All rights reserved.
. Introduction
Forages are important in ruminant production. In addition tonergy, fibre and protein, the forages provide macro- and micronu-rients required for sustainable animal production and healthSuttle, 2010). Thus, in livestock production systems which mainlyely on forage the plants are the main source of the essentialicronutrients such as cobalt (Co), copper (Cu), iron (Fe), man-
anese (Mn) and zinc (Zn) as well as the beneficial molybdenumMo). However, the micronutrient concentrations of forage vary
ith site (Hopkins et al., 1994), largely due to the influence of dif-erences in soil properties such as texture, organic matter, pH, totalnd available micronutrient concentrations of the soil (e.g. Kähäri
∗ Corresponding author. Tel.: +46 0 18 67 12 81; fax: +46 0 18 67 31 56.E-mail addresses: [email protected] (B.E.M. Lindström),
[email protected] (B.E. Frankow-Lindberg), [email protected]. Dahlin), [email protected] (C.A. Watson), [email protected]. Wivstad).
ttp://dx.doi.org/10.1016/j.fcr.2014.09.012378-4290/© 2014 Elsevier B.V. All rights reserved.
and Nissinen, 1978; Paasikallio, 1978). Thus farms who base feedon locally produced forage, for example organic farms, depend onthe soil properties of the farm.
To ensure that feed rations meet livestock requirements, asspecified by e.g. National Research Council (2001), mineral supple-mentations are allowed in both conventional and organic livestocksystems. Such supplementation may lead to a relatively rapidincrease in micronutrient concentrations in the soils of livestockfarms (Andersson, 1992; Knutson, 2011) which in the long termmay lead to excessive concentrations affecting important micro-bial processes on some soils (Giller et al., 1998). However, theuse and dependency of mineral supplementation may be reducedby altering the species mixture of the sward. Studies on differ-ent species mixtures have shown that grass–legume mixtureshave higher micronutrient concentrations (Govasmark et al., 2005;Kunelius et al., 2006) and higher micronutrient removals in the har-
vested biomass (Høgh-Jensen and Søegaard, 2012) than pure grassswards. This is because of the generally higher micronutrient con-centrations found in legumes compared to grasses (e.g. Lindströmet al., 2013; Pirhofer-Walzl et al., 2011). However, the relationship
100 B.E.M. Lindström et al. / Field Crops
Table 1Soil characteristics of the experimental soils (top soil depth 25 cm): particle sizedistribution, pH in water (H2O) and calcium chloride (CaCl2) solution, total C andN, micronutrient concentrations in EDTA extracts and macro- and micronutrientconcentrations in nitric acid and hydrogen peroxide (HNO3 + H2O2) extracts.
Soil properties Site
Rådde Lillerud Ås
Clay (%) 8 27 24Silt (%) 41 56 40Sand (%) 51 17 36pH (H2O) 5.78 5.63 7.45pH (CaCl2) 5.25 5.25 7.18C (%) 3.1 1.7 3.4N (%) 0.22 0.14 0.31EDTA extractable elements (mg kg−1 DM)Co 0.04 0.21 0.40Cu 0.5 2.2 3.1Fe 69 153 178Mn 6 31 125Mo 0.00 0.00 0.04Zn 0.69 2.01 2.69HNO3 + H2O2 extractable elements (mg kg−1 DM)P 727 791 1050K 395 1200 1280S 320 186 465Ca 1860 2660 9870Mg 916 2340 4090Co 2.8 5.1 12.7Cu 5.4 11.0 17.0Fe 10,100 11,900 22,100Mn 254 473 1950Mo 0.51 0.25 1.06
bcFcseetmr
2
c(tmfdafc(iThLtcIt“E
made on each of the sown species from the first two harvests. To
Zn 22 69 104
etween the legume proportion and the overall micronutrientoncentrations of the mixed sward has rarely been evaluated.urthermore, the strong link between plant micronutrient con-entrations and soil properties needs to be taken into account intudies regarding micronutrient concentrations in forage. A fieldxperiment with a range of timothy-red clover dominated mixturesstablished at three contrasting sites provided an excellent oppor-unity to explore this. The hypothesis tested was that the overall
icronutrient concentrations of forage mixtures are affected by theed clover dry matter (DM) proportion and by site effects.
. Materials and methods
A field experiment was established in 2010 at three sites withontrasting soils in Sweden: Rådde (57◦36′N, 13◦15′E), Lillerud59◦38′N, 13◦23′E) and Ås (63◦14′N, 14◦33′E). The soil at Rådde is aill with sandy loam texture developed from mainly granitic parent
aterial, at Lillerud the soil is a postglacial silty loam originatingrom mainly granitic and sandstone bedrock, and at Ås a loamy tilleveloped from alum shales. A composite soil sample, taken along
transect of each field before the trials were sown, was analysedor pH, total C and N, pseudo-total macro- and micronutrient con-entrations and of “plant available” micronutrient concentrationsTable 1). Soil pH was first analysed in deionized water and thenn 0.01 M calcium chloride solution according to Sumner (1994).otal N and C concentrations in soil samples were analysed byigh temperature (1250 ◦C) induction furnace combustion usingECO CN2000 (LECO Corporation, St Joseph, MI, USA). Pseudo-otal macro- and micronutrient concentrations were extracted withoncentrated nitric acid and hydrogen peroxide and analysed onCP–SFMS at ALS Scandinavia AB in Luleå, Sweden (same labora-
ory and method as the Swedish arable soil monitoring program).Plant available” soil micronutrients were extracted with 0.05 MDTA (pH 7) and analysed by ICP–MS (Ure and Berrow, 1970).Research 169 (2014) 99–106
The experiment included five species: timothy (Phleum pratenseL., cv. Grindstad), meadow fescue (Festuca pratensis Huds., cv.Sigmund at Rådde and Lillerud, cv. Kasper at Ås), red clover (Tri-folium pratense L., cv. Ares at Rådde and Lillerud, cv. Torun at Ås),white clover (Trifolium repens L., cv. Ramona at Rådde and Lillerud,Undrom at Ås) and chicory (Cichorium intybus L., cv. Grassland’sPuna). All species except chicory have the bulk of their root sys-tem in the upper 25 cm of the soil profile. These species weresown in four different mixtures; (i) timothy and red clover (15 and5 kg ha−1, respectively); (ii) timothy, red clover and meadow fescue(4.2, 10.8 and 5 kg ha−1, respectively); (iii) timothy, red clover andwhite clover (2, 15, 3 kg ha−1, respectively); and (iv) timothy, redclover and chicory (3, 15, 5 kg ha−1, respectively). The experimentaldesign was a randomized block design with three replicates. Plotsize harvested was 12.0, 14.0 and 13.5 m2 at Rådde, Lillerud and Ås,respectively.
The forage species were under-sown in spring barley (Hordeumvulgare L.) (sown at rates of 120–200 kg seed ha−1) on 7 May 2010at Rådde, 24 May 2010 at Lillerud and 2 July at Ås. Correspondingharvest dates of barley were 6 July, 10 August and 6 September2010. The barley crop was fertilized with 70 kg N ha−1, 10 kg P ha−1,33 kg K ha−1 at Rådde, 60 kg N ha−1, 12 kg P ha−1 and 15 kg K ha−1 atLillerud and 40 kg N ha−1, 50 kg P ha−1 and 95 kg K ha−1 at Ås. Weedingression was controlled at Rådde by topping on 26 August.
In the spring of 2011 the crops at all sites received 60 kg N ha−1
and another 50 kg N ha−1 was applied after each cut except thelast. In addition, the crop at Rådde was fertilized with 14 kg P ha−1,75 kg K ha−1 and 7 kg S ha−1 in the spring and 27 kg K ha−1 aftereach cut except the last. The crop at Lillerud was fertilized with12 kg P ha−1 and 21 kg K ha−1 in the spring and 10 kg P ha−1 and18 kg K ha−1 after each cut except the last. The amounts of P, K andS fertilizer applied were based on previous soil analyses. Differentproducts with different combinations of N:P:K:S from Yara Interna-tional ASA were used as fertilizers. With the exception of YaraMila22:0:12, which has 0.1% Zn and were used after first cut at Rådde(227 kg ha−1), none explicitly contains micronutrients. Data fromEriksson (2001) have been used to estimate amounts of micronu-trients found as unlabelled traces in mineral fertilizers. The yearbefore ley establishment (2009) cereals were grown on all sites,hence any carry over effect can be considered to have affected thesoil and nutrients similarly at all sites.
In the spring and summer of 2010, the mean air temperatures atall sites were close to the 30 year average but all sites received moreprecipitation than normal (Table 2). The following autumn and win-ter were dry, in particular at Rådde, and November–December wascolder than usual at all three sites. The mean air temperature andamount of precipitation was close to the 30 years mean during thespring and summer of 2011.
In 2011, the plots were harvested three times at Rådde (8 June,20 July and 14 September) and Lillerud (7 June, 19 July and 4October) and twice at Ås (16 June and 30 August). The first har-vest was carried out at the ear emergence stage of timothy, andsubsequent harvests according to farming practise at the respec-tive sites. Plots were harvested with a Haldrup (Løgstør, Denmark)plot harvester to a stubble height of approximately 5 cm.
Two composite plant samples of forage species were takenfrom each plot on all harvest occasions. One sample was dried at105 ◦C for at least 48 h for DM determination. The other samplewas stored cool in a perforated plastic bag (hole diameter 0.4 mm;Cryovac®, Duncan, S.C.) and sorted fresh within 48 h into sowncomponents and unsown species, which were dried in a forced-draught oven (55 ◦C, minimum 48 h). Micronutrient analyses were
this end, these samples were milled (particle size <1 mm) in a cut-ting mill (Grindomix GM 200, Retsch GmbH, Haan, Germany) witha titanium knife and a plastic container which ensured minimal

B.E.M. Lindström et al. / Field Crops Research 169 (2014) 99–106 101
Table 2Monthly total precipitation and mean air temperature during the experimental period 2010–2011 and the 30 years mean (1961–1990) at the field experiment sites Rådde,Lillerud and Ås.
Month Precipitation (mm) Temperature (◦C)
2010–2011 30 year mean 2010–2011 30 year mean
Råddea Lillerudb Åsc Rådded Lillerudb Åse Råddea Lillerudb Åse Rådded Lillerudb Åse
April Missing 25 26 54 38.2 32.4 5.3 5.2 2.6 3.5 3.8 1.3May 86 Missing 100 60 42.3 39.3 9.2 9.7 6.6 9.2 10 7.6June 58 50 125 75 56 58.3 13.2 14.1 10.3 13.5 14.8 12.5July 160 125 87 94 63.2 86.1 17.4 17.7 15.5 14.7 16.1 13.9Aug 133 111 78 91 72.2 59.9 15 15.5 13.2 13.5 15 12.7Sept 66 71 60 102 73.1 64.5 10.4 10.5 8.8 10 11 8.2Oct 60 57 13 98 68.2 44.9 5.2 5.2 4.1 6.1 6.6 3.8Nov 63 64 18 104 72.5 40.4 −0.2 −2 −6.2 1.2 1.3 −2.4Dec 21 32 46 87 51.2 44 −8.5 −10.8 −13.4 −2.1 −2.6 −6.3Jan 44 56 34 78 45.3 35.6 −2.85 −3.8 −4.7 −3.9 −4.4 −8.9Feb 38 43 25 51 32.5 28.5 −4 −5.7 −7.6 −3.9 −4.5 −7.6March 34 23 13 59 38.5 30 0.5 0 −1.8 −0.6 −1 −3.5April 20 18 18 54 38.2 32.4 8.6 8.8 5.3 3.5 3.8 1.3May 55 57 76 60 42.3 39.3 10 10.3 8.2 9.2 10 7.6June 97 52 55 75 56 58.3 14.7 15.7 13.6 13.5 14.8 12.5July 96 79 64 94 63.2 86.1 16.4 17.4 15.8 14.7 16.1 13.9Aug 192 113 95 91 72.2 59.9 14.8 15.4 14 13.5 15 12.7Sept 126 126 78 102 73.1 64.5 12.2 12.6 10.5 10 11 8.2Oct 93 65 10 98 68.2 44.9 7.2 7.1 5.7 6.1 6.6 3.8
a Data from Rådde reseach station, 1 km from field.b Data from Karlstad airport, ca 15 km from field.
mTata
3
DwslTcmawbreNifna
4
4
vtRt
proportion were taken into account. Further, red clover and tim-
c Data from Rösta, ca 2 km from field.d Data from Borås, ca 30 km from field.e Data from Frösön airport, ca 6 km from field.
icronutrient contamination of the samples (Dahlin et al., 2012).he milled samples were wet digested with 7 M ultrapure nitriccid and concentrated hydrogen fluoride at increasing tempera-ure until boiling, then filtered and analysed for Co, Cu, Fe, Mn, Mond Zn by ICP-SFMS at ALS Scandinavia AB in Luleå, Sweden.
. Statistics
Micronutrient concentration and off-take (species proportion ofM yield × concentration) differences between species at all sitesere analysed for each harvest with a linear mixed model with
pecies and site as fixed factors and block as a random factor, fol-owed by Tukey’s HSD test, using JMP 8.0.1 (SAS Institute Inc., 2009).he overall micronutrient concentrations of the mixtures were cal-ulated by taking the botanical proportion of each species in eachixture into account. Within each harvest, total DM yield and aver-
ge micronutrient concentrations for each mixture were analysedith a linear mixed model with mixture and site as fixed factors and
lock as a random factor, followed by Tukey’s HSD test. The effect ofed clover proportion (of sown species) on the average micronutri-nt concentration was analysed per site in SAS (Institute Inc., Cary,C, USA) with the procedure MIXED where site, mixture and the
nteraction between site and red clover proportion were set as fixedactors and block as a random factor. Where the residuals showed aon-normal distribution the data were ln-transformed and resultsre presented as back-transformed least square means.
. Results
.1. Dry matter yield and botanical composition
Rådde and Lillerud had similar DM yields at the first two har-
ests in 2011 but Lillerud had a larger DM yield than Rådde at thehird harvest (Table 3). The DM yields were smaller at Ås than atådde and Lillerud at the first harvest but larger than at Rådde athe second harvest. The accumulated DM yields of the differentmixtures were 11.5–13.4 t DM ha−1 at Rådde, 14.6–16.6 t DM ha−1
at Lillerud and 7.4-–10.8 t DM ha−1 at Ås.Timothy and red clover dominated the mixtures at all three
sites with similar proportions of red clover among the mixturesat Lillerud and Rådde whereas there was greater variation in redclover proportion between mixtures at Ås (Table 3). The mean redclover DM proportion at all harvests was 29% (min 17–max 37%) atRådde, 34% (min 19–max 44%) at Lillerud and 44% (min 0.1–max73%) at Ås. The DM proportion of meadow fescue was between 10and 30% at Rådde and Ås, but around 5% at Lillerud in the first twoharvests. The DM proportion of white clover and chicory at all siteswas well below 10%, with the exception of chicory (15%) in thesecond harvest at Ås.
4.2. Micronutrient concentrations and off-takes of species
Generally, chicory had the highest micronutrient concentrationsof all species whereas timothy had the lowest (Table 4). The excep-tion was at Rådde and Lillerud where white clover had higher Moconcentrations than chicory and timothy which had similar con-centrations. Red clover and white clover had higher micronutrientconcentrations than timothy with the exception of Mn and Zn. Thetwo clovers had similar micronutrient concentrations, althoughthere was a tendency for the concentrations to be higher in whiteclover. There were few clear differences between species withregard to Mn concentrations although timothy had higher con-centrations than red clover at Lillerud and Rådde. Meadow fescuegenerally had micronutrient concentrations between those of tim-othy and red clover.
Despite the higher micronutrient concentrations chicory hadsmaller micronutrient off-take (often < 10% of total mixture) com-pared to timothy (<80% of total mixture) (Table 5), when DM yield
othy generally had similar micronutrient off-take. The exceptionwas Rådde where timothy had larger off-take than red clover forall micronutrients but Co. In contrast, red clover had larger Co, Cuand Fe off-take than timothy in the second harvest at Ås.

102 B.E.M. Lindström et al. / Field Crops Research 169 (2014) 99–106
Table 3Dry matter yield (t DM ha−1) and species proportions (% of DM) of mixtures with two or three species grown at three sites (Rådde, Lillerud and Ås) and harvested at two orthree occasions (1st, 2nd and 3rd). Dry matter yield presented as least square means (n = 3). Values within the same column followed by the same letter are not significantlydifferent at P < 0.05.
Site Mix Yield Timothy Red clover 3rd sown species Unsown
(t DM ha−2) (%) (%) (%) (%)
1st 2nd 3rd 1st 2nd 3rd 1st 2nd 3rd 1st 2nd 3rd 1st 2nd 3rd
Rådde Timothy + red clover 6.6a 3.5cde 2.9b 82 81 58 17 17 42 – – – 1 2 0Rådde +Meadow fescue 7.1a 3.4de 3.2b 59 67 56 24 18 24 17 10 20 0 5 0Rådde +White clover 6.7a 3.4de 3.0b 82 72 65 13 12 27 4 4 8 1 12 0Rådde +Chicory 6.9a 3.4de 2.9b 75 80 60 19 16 38 5 3 2 1 1 0Lillerud Timothy + red clover 6.3a 4.8bc 4.4a 58 49 47 37 50 53 – – – 5 1 0Lillerud +Meadow fescue 5.8a 4.6bcd 4.1a 48 48 27 43 47 50 5 4 23 4 1 0Lillerud +White clover 6.1a 4.5bcd 4.5a 61 60 54 20 32 37 7 7 9 12 1 0Lillerud +Chicory 6.4a 4.5bcd 4.4a 57 57 32 37 38 61 4 1 7 2 4 0Ås Timothy + red clover 3.4b 6.9a – 45 30 – 48 67 – – – – 7 3 –Ås +Meadow fescue 3.4b 5.7ab – 22 10 – 56 60 – 20 28 – 2 2 –Ås +White clover 2.5b 5.6ab – 75 80 – 7 1 – 2 2 – 16 17 –Ås +Chicory 3.4b 6.2ab – 35 23 – 57 54 – 2 15 – 6 8 –
P-value
4m
aehÅeravm(cT
TMhs
Site <0.001 <0.001 0.007Mixture 0.394 0.026 0.956Site × Mixture 0.342 0.673 0.357
.3. Effect of site and red clover proportion on mixtureicronutrient concentrations and off-takes
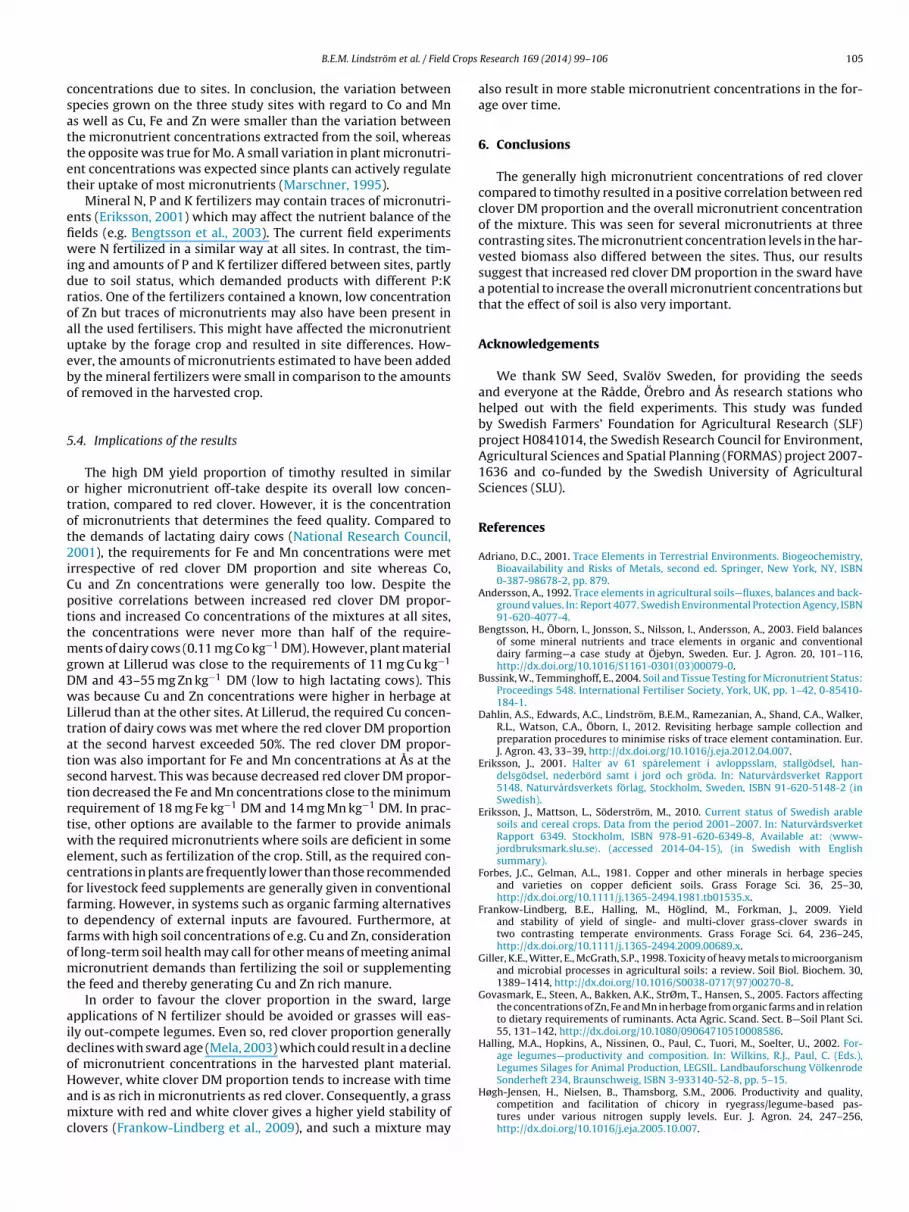
The overall micronutrient concentrations of the mixtures werelways significantly affected by site but there were few differ-nces between mixture types. The mixtures at Lillerud generallyad higher micronutrient concentrations than those at Rådde ands, in particular at the second harvest (Fig. 1). Average micronutri-nt off-take of mixtures also indicates that higher amounts wereemoved with both harvests from Lillerud compared with Råddend Ås (Table 5). Molybdenum concentration showed the largestariation between sites and was always significantly higher in the
ixtures grown at Ås compared to those at Rådde and LillerudFig. 1). The Co concentration of the mixtures was always positivelyorrelated with the red clover proportion in the harvested biomass.his was also the case for Cu concentrations in mixtures grown
able 4icronutrient concentrations (mg kg−1 DM) in timothy, red clover, meadow fescue, white
arvest occasion in 2011. Least square means of timothy and red clover (n = 12), other significantly different at P < 0.05.
Site Species Co Cu Fe
1st 2nd 1st 2nd 1st
Rådde Timothy 0.020g 0.008g 2.66i 3.29fg 34.8h
Meadow fescue 0.038def 0.044cde 2.24i 5.14de 62.6efg
Red clover 0.077b 0.067ab 5.29h 5.53e 61.3f
White clover 0.121a 0.076a 5.41gh 5.99cde 108bc
Chicory 0.070bc 0.050cd 7.73de 6.52cde 92.9cd
Lillerud Timothy 0.010h 0.028ef 5.71fh 7.07cde 40.7h
Meadow fescue 0.018g 0.040cdef 6.81eg 8.46bcd 58.7fg
Red clover 0.031f 0.041d 12.89b 12.09ab 64.6f
White clover 0.051cd 0.049bcd 9.68c 9.32abc 101bc
Chicory 0.046de 0.091a 14.63a 15.91a 98.0c
Ås Timothy 0.016g 0.005g 5.0h 2.6g 52.2g
Meadow fescue 0.031ef 0.018fg 7.48e 4.85ef 91.0cd
Red clover 0.039de 0.029def 7.56e 5.82de 75.5de
White clover 0.054cd 0.035def 7.02ef 5.17de 137ab
Chicory 0.075bc 0.064abc 9.10cd 8.42bcd 160a
P-valuesSite <0.001 0.001 <0.001 <0.001 <0.001Species <0.001 <0.001 <0.001 <0.001 <0.001Site × Species <0.001 <0.001 <0.001 0.006 0.002
at Ås and Lillerud. With one exception, the mixtures at Ås alwaysshowed a positive correlation between the red clover DM propor-tion and micronutrient concentrations. However, this relationshipdid not hold for Zn where concentration was negatively correlatedwith red clover DM proportion at the first harvest and unrelated tored clover DM at the second harvest. Iron and Zn concentrations atRådde and Mo concentrations at Lillerud were positively correlatedwith red clover DM proportion at the second harvest occasion.
5. Discussion
5.1. Dry matter yield and botanical compositions
The accumulated DM yields recorded at all three sites werewithin the range previously reported for grass/clover leys inSweden (e.g Frankow-Lindberg et al., 2009; Halling et al., 2002).
clover and chicory at the experimental sites Rådde, Lillerud and Ås, first and secondpecies (n = 3). Values within the same column followed by the same letter are not
Mn Mo Zn
2nd 1st 2nd 1st 2nd 1st 2nd
23.5fg 42.6abdefg 31.2de 0.64g 0.78cd 20.5ghi 17.0fg
51.2bcde 45.8abcdefg 45.9bc 0.99de 0.73bcde 18.5hi 20.6cdefg
41.2cde 36.1chi 26.5defg 1.24d 1.16b 28.0def 21.2cef
55.7bcd 42.2abcdefghi 30.7def 1.78c 1.09bc 22.4ghi 17.7efg
49.1bcde 45.3abdefg 33.4cde 0.66fg 0.41efg 41.4bc 31.4bd
47.9bcd 48.4abcei 54.9b 0.38i 0.30g 39.3bc 39.5b
55.9bcd 54.7abc 67.6ab 0.43hi 0.47defg 37.1bcd 31.6bcd
52.3bc 42.6dfgh 34.6cd 0.49h 0.41f 40.7b 34.5b
64.4b 50.8abcdeghi 33.9cde 0.86ef 0.76bcde 33.9cde 31.5bcd
119a 55.2ab 94.2a 0.41hi 0.29fg 76.0a 78.4a
19.9g 31.6f 20.2g 1.88c 3.40a 26.2efg 16.0fg
32.6ef 51.2abcdgh 25.6defg 3.53a 4.44a 24.7fgh 12.8g
38.6de 34.8efi 21.2fg 2.73b 4.26a 19.4i 14.5g
53.6bce 44.2bcgh 22.4efg 3.29ab 3.64a 17.4i 15.0fg
50.5bcd 59.2ad 33.2cd 3.28ab 3.60a 36.2bcd 26.3bcde
<0.001 0.171 <0.001 <0.001 <0.001 <0.001 <0.001 <0.001 <0.001 <0.001 <0.001 <0.001 <0.001 <0.001 <0.001 <0.001 <0.001 <0.001 <0.001 <0.001 0.003

B.E.M. Lindström et al. / Field Crops Research 169 (2014) 99–106 103
Table 5Average micronutrient off-take (g ha−1) of all mixtures as well as in each species: timothy, red clover, meadow fescue, white clover and chicory, at the experimental sitesRådde, Lillerud and Ås, first and second harvest occasion in 2011. Least square means of mixtures (n = 12) and of species: timothy and red clover (n = 12), other species (n = 3).Values within the same column followed by the same letter are not significantly different at P < 0.05, for comparisons of side effects of mixtures (X, Y, Z) and site effects ofspecies and species differences (a, b, c etc.).
Site Species Co Cu Fe Mn Mo Zn
1st 2nd 1st 2nd 1st 2nd 1st 2nd 1st 2nd 1st 2nd
Rådde Mixture 0.22X 0.06Y 22Y 12Z 288X 89Z 229XY 45Y 5.2X 2.7Y 140 25Z
Timothy 0.1a 0.02bc 13ab 8bc 175a 59ab 214a 79ab 3a 2b 103a 43bc
Meadow fescue 0.04abcd 0.01bcd 3cdef 2defg 73abcd 17cdef 53bcde 15defg 1abcdef 0.2cde 226bc 7efgh
Red clover 0.09a 0.03ab 6bcd 3def 73bc 20cd 43cd 13ef 2bcd 0.6cd 33b 10ef
White clover 0.03bcde 0.01bcd 1efg 0.9fg 22cdef 8def 9fgh 4fghi 0.4efg 0.2def 5cde 3gh
Chicory 0.02cdefg 0.004d 2defg 0.5g 22cdef 4f 11efgh 3hi 0.2g 0.03fg 10bcd 3gh
Lillerud Mixture 0.11Y 0.15X 50X 42X 298X 228X 268X 210X 2.5Y 1.6Z 229 170X
Timothy 0.03bcd 0.07a 19a 17ab 137ab 116a 163ab 133a 1cde 0.7c 132a 96a
Meadow fescue 0.005fg 0.006cd 2defg 1efg 16def 9def 15defgh 11defgh 0.1g 0.08ef 10bcd 5fgh
Red clover 0.06ab 0.08a 25a 23a 125ab 98a 83bc 65abc 1def 0.8c 79a 65ab
White clover 0.02bcdef 0.02bcd 4bcde 3cde 41bcdef 19bcde 21defg 10defghi 0.4fg 0.2cde 14bcd 10defg
Chicory 0.01defg 0.003d 3cdef 0.6g 21cdef 4ef 12defgh 3ghi 0.09g 0.01g 17bc 3gh
Ås Mixture 0.083Y 0.12X 19Y 27Y 196Y 179Y 120Y 178X 6.5X 22X 70 120Y
Timothy 0.02de 0.008cd 6cd 4cde 61bc 32bc 37cde 32cd 2abc 5a 31bc 25cd
Meadow fescue 0.02bcdef 0.03abc 5bcde 7abcd 57abcde 49abc 32cdef 39bcde 2abcd 7ab 16bc 20bcdef
Red clover 0.04abcd 0.07a 9bc 17ab 83ab 107a 39cde 61abc 3ab 12a 22b 41bc
White clover 0.003g 0.004d 0.4g 0.5g 8f 5ef 3h 2i 0.2g 0.4cde 1e 2h
Chicory 0.006efg 0.06ab 0.8fg 8abcd 13ef 47abc 5gh 31bcde 0.3fg 3ab 3de 24bcde
P-value site effects of species and species differencesSite <0.001 0,065 <0.001 <0.001 0,012 <0.001 <0.001 <0.001 <0.001 <0.001 <0.001 <0.001Species <0.001 <0.001 <0.001 <0.001 <0.001 <0.001 <0.001 <0.001 <0.001 <0.001 <0.001 <0.001Site × Species <0.001 <0.001 <0.001 <0.001 <0.001 <0.001 <0.001 <0.001 <0.001 <0.001 <0.001 <0.001
0.001
TttsaaotatolwAr2pcsctt
5
tPccsttef
P-value site effects of mixturesSite <0.001 <0.001 <0.001 <0.001 <
he results can be considered representative for the sites, as theemperature was normal and the precipitation only slightly higherhan normal compared to the long-term average (Table 2). The foureed mixtures produced stands of different botanical compositionst the three sites, with a wide range of red clover DM proportionst Ås and less variation at Rådde and Lillerud. The overall increasef red clover and meadow fescue DM proportion, at the expense ofimothy, with each harvest is similar to the findings of Jørgensennd Junttila (1994) and Mela (2003). But, the overall grass propor-ion was similar irrespective of the mixture contained timothy only,r timothy and meadow fescue. White clover DM proportions wereow at all sites and all harvests, in contrast to Halling et al. (2002)
ho found increases of white clover with each subsequent harvest.lso, the DM proportion of chicory was much lower than thoseeported from other sites in northern Europe (Høgh-Jensen et al.,006; Weller and Bowling, 2002). This was due to the unexpectedlyoor establishment of this species at all sites. Hence, the presence ofhicory and white clover had little impact on the botanical compo-ition and thus were less important with respect to micronutrientoncentration of the whole mixture. This means that the propor-ions of red clover and timothy were the main components affectinghe total micronutrient concentration of the crop.
.2. Micronutrient concentrations
The micronutrient concentrations of the species were similar tohe levels found in other studies (e.g. Forbes and Gelman, 1981;irhofer-Walzl et al., 2011). Exceptions were the generally low Cooncentrations in the species at all sites and unusually high Mooncentrations at Ås. Micronutrient concentrations in the differentpecies was generally in the order chicory > clover > grass. Amongst
he grass species timothy had the lowest micronutrient concentra-ions. This is similar to the species rankings published by Lindströmt al. (2012) and to conclusions regarding differences betweenorbs, legumes and grasses in previous studies (e.g. Pirhofer-Walzl<0.001 <0.001 <0.001 <0.001 <0.001 0.103 <0.001
et al., 2011). Furthermore, our study confirms that chicory tends tohave relatively low Mo concentrations compared to other species,which could be due to the fact that it can use ammonium as an Nsource (Santamaria et al., 1998), and that there are few differencesbetween species now studied with regard to Mn concentrations.
Red clover and timothy dominated the species mixtures andhence affected the overall micronutrient concentration and off-takeof the mixtures most strongly. This was most obvious at Ås wherethe large variation in red clover DM proportion resulted in positivecorrelations between the red clover proportion and the overall con-centrations of the mixtures of all micronutrients except Zn (Fig. 1).A similar pattern was observed at Rådde and Lillerud, in particularfor Co where even a small increase of red clover DM proportionincreased the overall Co concentration of the mixture. An increasein red clover DM proportion from 10% to 25% at Rådde or from 25%to 50% at Lillerud and Ås increased the average Co concentration ofthe mixture by more than 30% at the first harvest and more than80% at the second harvest. Within the same range of red clover DMproportions, Cu and Fe concentrations increased by more than 15%and 40% at the first and second harvests, respectively, at Ås for bothmicronutrients, at Lillerud for Cu and at Rådde for Fe. Moreover, atÅs, the concentrations of Co, Cu and Fe more than doubled whencomparing the lowest red clover DM proportion with the highestproportion. These findings support our hypothesis that the overallmicronutrient concentrations of forage mixtures are affected by thered clover DM proportion and site effects. Our findings also increasethe available information on the impact of clovers on the micronu-trient concentration of grass–legume mixtures compared to puregrass swards, as suggested by Govasmark et al. (2005), Høgh-Jensenand Søegaard (2012), and Kunelius et al. (2006).
5.3. Site effects
The three sites were deliberately chosen to have contrastingsoil micronutrient concentrations, as analysed by nitric acid. The

104 B.E.M. Lindström et al. / Field Crops
200 40 60 80
0.00
0.01
0.02
0.03
0.04
First harvestov
eral
l Co
(mg
kg−
1 D
M)
Red clover proportion (%)
**
******
200 40 60 80
0.00
0.01
0.02
0.03
0.04
Second harvest
Red clover proportion (%)
*
*
***
200 40 60 80
10
over
all C
u (m
g kg
−1
DM
)
**
***
20 0 40 60 80
10 *
***
200 40 60 80
2030
4050
6070
80
over
all F
e (m
g kg
−1
DM
)
Red clo ver proportion (%)
***
200 40 60 80
2030
4050
6070
80
Red clo ver proportion (%)
Red clo ver proportion (%) Red clo ver proportion (%)
Red clo ver proportion (%) Red clo ver proportion (%)
Red clo ver proportion (%) Red clo ver proportion (%)
Red clo ver proportion (%) Red clo ver proportion (%)
*
***
200 40 60 80
1020
3040
5060
over
all M
n (m
g kg
−1
DM
)
*
200 40 60 80
1020
3040
5060
200 40 60 80
5
over
all M
o (m
g kg
−1
DM
)
*
200 40 60 80
5
**
***
200 40 60 80
1020
3040
50
over
all Z
n (m
g kg
−1
DM
)
*
200 40 60 80
1020
3040
50
*
Fig. 1. Overall micronutrient concentration in relation to red clover propor-tion (% of DM of the sown species) of species mixture at first (left row)and second (right row) harvest occasions, in 2010, at Rådde (©-----), Lillerud(� ) and Ås (� ······). Regression lines indicate significant (* P < 0.05; **
P < 0.01–0.001; *** P < 0.001) and near-significant (P-values in figure) relation-ships. Horizontal dashed-dotted line indicate minimum dairy cow requirementfor low lactating cows; for Co this falls above the graph range (0.11 mg kg−1 DM).
Research 169 (2014) 99–106
soil at Ås belongs to the 10% of Swedish soils with the highestCo, Mn and Zn concentrations and has above average Cu and Moconcentrations, according to the Swedish arable soils monitoringprogram (Eriksson et al., 2010). Lillerud has average (25–75 per-centile) Co, Cu, Mn and Zn concentrations in the soil. Rådde has Co,Cu and Zn concentrations within the lowest 25% but more aver-age concentrations of the other micronutrients studied. However,plant micronutrient concentrations are also affected by a range ofother site factors including soil organic matter (Adriano, 2001),proportion of clay (McBride, 1994) and the weather during theexperimental period (Roche et al., 2009).
The generally higher micronutrient concentrations in the foragespecies grown at Lillerud indicated that soil micronutrients wererelatively available at this site compared to the other sites. The soilat Ås had higher micronutrient concentrations (pseudo-total con-centrations extracted by nitric acid and EDTA used as a proxy for theplant available fraction) than Lillerud but the micronutrients wereobviously less plant available. This might be explained by the highpH (above 7) of the Ås soil since this limits the availability of mostmicronutrients except Mo (McBride, 1994). The high plant Mo con-centration at Ås is a further sign of this. However, we cannot excludetemperature effects (Whitehead, 2000). Another explanation of therelatively low micronutrient concentrations of the mixtures at thesecond harvest at Ås could, at least partly, be due to a dilution effectsince the DM yield of this harvest was larger than at the other sites.
The Rådde soil had a similar pH to the Lillerud soil but ahigher total C concentration, lower clay proportion and lower soilmicronutrient concentrations. The DM yields at the two sites weresimilar but the micronutrient concentrations of the plants werelower at Rådde. The availability of micronutrients may be nega-tively or positively correlated with the organic C of a soil dependingon the affinity of the respective micronutrient for the organic mat-ter (Adriano, 2001) and whether there is a net immobilization intoor mineralization from the soil organic matter pool. Further, a highclay proportion typically gives a high micronutrient availability(McBride, 1994). In addition to the higher micronutrient concen-trations in the soil at Lillerud compared to that of Rådde, this couldbe the reason for the higher micronutrient concentrations in thebiomass harvested at Lillerud than at Rådde.
Our results exemplify the difficulty in interpreting soil micronu-trient analysis since the uptake by plants is a continuousbiochemical process in contrast to soil analysis which is purelychemical processes and presents a snapshot of the soil micronutri-ent status (Bussink and Temminghoff, 2004). As seen in studies byJarvis and Whitehead (1981, 1983) the variation in soil Cu concen-trations between the twenty-one soils they studied was wider thanbetween the Cu concentrations of the plants grown on them, in thiscase pure stands of perennial ryegrass and white clover. A similarcomparison between species mixtures in this study (at a commonred clover DM proportion of 25%) shows that the largest varia-tions in EDTA-extracted soil occurred for Co and Mn concentrationswhich varied by a factor 10–20 between the three sites, whileplant concentrations varied at most 2.5 times. The largest varia-tion between mixtures due to red clover DM proportion was 8.5times for Co concentration and 1.2 times for Mn concentrations, atÅs at the second harvest. This was due to the large differences in Coconcentrations but small differences in Mn concentrations betweenred clover and timothy. On the other hand, Mo concentrations var-
ied little between soils (the EDTA-extractable concentrations werebelow detection limit, but nitric acid extractable concentrationsvaried 4.2 times) while there was a 12-fold difference in plant MoWith the exception of Co at the second harvest, all data were ln-transformed dur-ing statistical analyses but the graph presents actual values, hence the lines arepresented back-transformed (n = 12).
Crops
csattet
efiwidroauebo
5
otot2iCpttmgDwLtatstrtwecfftfomt
aidoHamc
B.E.M. Lindström et al. / Field
oncentrations due to sites. In conclusion, the variation betweenpecies grown on the three study sites with regard to Co and Mns well as Cu, Fe and Zn were smaller than the variation betweenhe micronutrient concentrations extracted from the soil, whereashe opposite was true for Mo. A small variation in plant micronutri-nt concentrations was expected since plants can actively regulateheir uptake of most micronutrients (Marschner, 1995).
Mineral N, P and K fertilizers may contain traces of micronutri-nts (Eriksson, 2001) which may affect the nutrient balance of theelds (e.g. Bengtsson et al., 2003). The current field experimentsere N fertilized in a similar way at all sites. In contrast, the tim-
ng and amounts of P and K fertilizer differed between sites, partlyue to soil status, which demanded products with different P:Katios. One of the fertilizers contained a known, low concentrationf Zn but traces of micronutrients may also have been present inll the used fertilisers. This might have affected the micronutrientptake by the forage crop and resulted in site differences. How-ver, the amounts of micronutrients estimated to have been addedy the mineral fertilizers were small in comparison to the amountsf removed in the harvested crop.
.4. Implications of the results
The high DM yield proportion of timothy resulted in similarr higher micronutrient off-take despite its overall low concen-ration, compared to red clover. However, it is the concentrationf micronutrients that determines the feed quality. Compared tohe demands of lactating dairy cows (National Research Council,001), the requirements for Fe and Mn concentrations were met
rrespective of red clover DM proportion and site whereas Co,u and Zn concentrations were generally too low. Despite theositive correlations between increased red clover DM propor-ions and increased Co concentrations of the mixtures at all sites,he concentrations were never more than half of the require-
ents of dairy cows (0.11 mg Co kg−1 DM). However, plant materialrown at Lillerud was close to the requirements of 11 mg Cu kg−1
M and 43–55 mg Zn kg−1 DM (low to high lactating cows). Thisas because Cu and Zn concentrations were higher in herbage at
illerud than at the other sites. At Lillerud, the required Cu concen-ration of dairy cows was met where the red clover DM proportiont the second harvest exceeded 50%. The red clover DM propor-ion was also important for Fe and Mn concentrations at Ås at theecond harvest. This was because decreased red clover DM propor-ion decreased the Fe and Mn concentrations close to the minimumequirement of 18 mg Fe kg−1 DM and 14 mg Mn kg−1 DM. In prac-ise, other options are available to the farmer to provide animalsith the required micronutrients where soils are deficient in some
lement, such as fertilization of the crop. Still, as the required con-entrations in plants are frequently lower than those recommendedor livestock feed supplements are generally given in conventionalarming. However, in systems such as organic farming alternativeso dependency of external inputs are favoured. Furthermore, atarms with high soil concentrations of e.g. Cu and Zn, considerationf long-term soil health may call for other means of meeting animalicronutrient demands than fertilizing the soil or supplementing
he feed and thereby generating Cu and Zn rich manure.In order to favour the clover proportion in the sward, large
pplications of N fertilizer should be avoided or grasses will eas-ly out-compete legumes. Even so, red clover proportion generallyeclines with sward age (Mela, 2003) which could result in a declinef micronutrient concentrations in the harvested plant material.
owever, white clover DM proportion tends to increase with timend is as rich in micronutrients as red clover. Consequently, a grassixture with red and white clover gives a higher yield stability oflovers (Frankow-Lindberg et al., 2009), and such a mixture may
Research 169 (2014) 99–106 105
also result in more stable micronutrient concentrations in the for-age over time.
6. Conclusions
The generally high micronutrient concentrations of red clovercompared to timothy resulted in a positive correlation between redclover DM proportion and the overall micronutrient concentrationof the mixture. This was seen for several micronutrients at threecontrasting sites. The micronutrient concentration levels in the har-vested biomass also differed between the sites. Thus, our resultssuggest that increased red clover DM proportion in the sward havea potential to increase the overall micronutrient concentrations butthat the effect of soil is also very important.
Acknowledgements
We thank SW Seed, Svalöv Sweden, for providing the seedsand everyone at the Rådde, Örebro and Ås research stations whohelped out with the field experiments. This study was fundedby Swedish Farmers’ Foundation for Agricultural Research (SLF)project H0841014, the Swedish Research Council for Environment,Agricultural Sciences and Spatial Planning (FORMAS) project 2007-1636 and co-funded by the Swedish University of AgriculturalSciences (SLU).
References
Adriano, D.C., 2001. Trace Elements in Terrestrial Environments. Biogeochemistry,Bioavailability and Risks of Metals, second ed. Springer, New York, NY, ISBN0-387-98678-2, pp. 879.
Andersson, A., 1992. Trace elements in agricultural soils—fluxes, balances and back-ground values. In: Report 4077. Swedish Environmental Protection Agency, ISBN91-620-4077-4.
Bengtsson, H., Öborn, I., Jonsson, S., Nilsson, I., Andersson, A., 2003. Field balancesof some mineral nutrients and trace elements in organic and conventionaldairy farming—a case study at Öjebyn, Sweden. Eur. J. Agron. 20, 101–116,http://dx.doi.org/10.1016/S1161-0301(03)00079-0.
Bussink, W., Temminghoff, E., 2004. Soil and Tissue Testing for Micronutrient Status:Proceedings 548. International Fertiliser Society, York, UK, pp. 1–42, 0-85410-184-1.
Dahlin, A.S., Edwards, A.C., Lindström, B.E.M., Ramezanian, A., Shand, C.A., Walker,R.L., Watson, C.A., Öborn, I., 2012. Revisiting herbage sample collection andpreparation procedures to minimise risks of trace element contamination. Eur.J. Agron. 43, 33–39, http://dx.doi.org/10.1016/j.eja.2012.04.007.
Eriksson, J., 2001. Halter av 61 spårelement i avloppsslam, stallgödsel, han-delsgödsel, nederbörd samt i jord och gröda. In: Naturvårdsverket Rapport5148. Naturvårdsverkets förlag, Stockholm, Sweden, ISBN 91-620-5148-2 (inSwedish).
Eriksson, J., Mattson, L., Söderström, M., 2010. Current status of Swedish arablesoils and cereal crops. Data from the period 2001–2007. In: NaturvårdsverketRapport 6349. Stockholm, ISBN 978-91-620-6349-8, Available at: 〈www-jordbruksmark.slu.se〉. (accessed 2014-04-15), (in Swedish with Englishsummary).
Forbes, J.C., Gelman, A.L., 1981. Copper and other minerals in herbage speciesand varieties on copper deficient soils. Grass Forage Sci. 36, 25–30,http://dx.doi.org/10.1111/j.1365-2494.1981.tb01535.x.
Frankow-Lindberg, B.E., Halling, M., Höglind, M., Forkman, J., 2009. Yieldand stability of yield of single- and multi-clover grass-clover swards intwo contrasting temperate environments. Grass Forage Sci. 64, 236–245,http://dx.doi.org/10.1111/j.1365-2494.2009.00689.x.
Giller, K.E., Witter, E., McGrath, S.P., 1998. Toxicity of heavy metals to microorganismand microbial processes in agricultural soils: a review. Soil Biol. Biochem. 30,1389–1414, http://dx.doi.org/10.1016/S0038-0717(97)00270-8.
Govasmark, E., Steen, A., Bakken, A.K., StrØm, T., Hansen, S., 2005. Factors affectingthe concentrations of Zn, Fe and Mn in herbage from organic farms and in relationto dietary requirements of ruminants. Acta Agric. Scand. Sect. B—Soil Plant Sci.55, 131–142, http://dx.doi.org/10.1080/09064710510008586.
Halling, M.A., Hopkins, A., Nissinen, O., Paul, C., Tuori, M., Soelter, U., 2002. For-age legumes—productivity and composition. In: Wilkins, R.J., Paul, C. (Eds.),Legumes Silages for Animal Production, LEGSIL. Landbauforschung Völkenrode
Sonderheft 234, Braunschweig, ISBN 3-933140-52-8, pp. 5–15.Høgh-Jensen, H., Nielsen, B., Thamsborg, S.M., 2006. Productivity and quality,competition and facilitation of chicory in ryegrass/legume-based pas-tures under various nitrogen supply levels. Eur. J. Agron. 24, 247–256,http://dx.doi.org/10.1016/j.eja.2005.10.007.

1 Crops
H
H
J
J
J
K
K
K
L
M
M
06 B.E.M. Lindström et al. / Field
øgh-Jensen, H., Søegaard, K., 2012. Robustness in the mineral supply fromtemporary grasslands. Acta Agric. Scand. Sect. B—Soil Plant Sci. 62, 79–90,http://dx.doi.org/10.1080/09064710.2011.577443.
opkins, A., Adamson, A.H., Bowling, P.J., 1994. Response of permanent and reseededgrassland to fertilizer nitrogen, 2. Effects on concentrations of Ca, Mg, K, Na, S, P,Mn, Zn, Cu, Co and Mo in herbage at a range of sites. Grass Forage Sci. 49, 9–20,http://dx.doi.org/10.1111/j.1365-2494.1994.tb01971.x.
arvis, S.C., Whitehead, D.C., 1981. The influence of some soil and plant factorson the concentration of copper in perennial ryegrass. Plant Soil 60, 275–286,http://dx.doi.org/10.1007/BF02374111.
arvis, S.C., Whitehead, D.C., 1983. The absorption, distribution and concentrationof copper in white clover grown on a range of soils. Plant Soil 75, 427–434,http://dx.doi.org/10.1007/BF02369976.
ørgensen, M., Junttila, O., 1994. Competition between meadow fescue (Festucapratensis Huds.) and timothy (Phleum pratense L.) at three levels of nitrogenfertilization. J. Agron. Crop Sci. 173, 326–337.
nutson, P., 2011. Trace elements in arable soils in Sweden—flows, trends and fieldbalances. In: Examensarbeten 2011:02. Department of Soil and Environment,SLU, Uppsala (in Swedish with English abstract).
unelius, H.T., Durr, G.H., McRae, K.B., Fillmore, S.A.E., 2006. Performance of timothy-based grass/legume mixtures in cold winter region. J. Agron. Crop Sci. 192,159–167, http://dx.doi.org/10.1111/j.1439-037X.2006.00195.x.
ähäri, J., Nissinen, H., 1978. The mineral element contents of timothy (Phleumpratense L.) in Finland, Part 1: The elements, calcium, magnesium, phospho-rus, potassium, chromium, cobalt, copper, iron, manganese, sodium and zinc.Acta Agric. Scand. Suppl. 20, 26–39.
indström, B.E.M., Frankow-Lindberg, B.E., Dahlin, A.S., Wivstad, M., Watson, C.A.,2013. Micronutrient concentrations in common and novel forage species andvarieties grown on two contrasting soils. Grass Forage Sci. 68, 427–436,
http://dx.doi.org/10.1111/gfs.12006arschner, H., 1995. Mineral Nutrition of Higher Plants. Academic Press, Cambridge,UK, ISBN 978-0-12-473542-2, pp. 889.
cBride, M.B., 1994. Environmental Chemistry of Soils. Oxford University Press,Oxford, England, pp. 406, 10: 0195070119.
Research 169 (2014) 99–106
Mela, T., 2003. Red clover grown in a mixture with grasses: yield, persistence anddynamics of quality characteristics. Agric. Food Sci. Finland 12, 195–212.
National Research Council, 2001. Nutrient Requirements of Dairy Cattle, seventhrevised ed. National Academies of Sciences, Washington, D.C., U.S.A., ISBN 0-309-06997-1, pp. 408.
Paasikallio, A., 1978. Mineral element contents of timothy (Phleum pratense L.) inFinland, Part 2: The elements aluminum, boron, molybdenum, strontium, leadand nickel. Acta Agric. Scand. Suppl. 20, 40–51.
Pirhofer-Walzl, K., SØegaard, K., HØgh-Jensen, H., Eriksen, J., Sanderson, M.A.,Rasmussen, J., 2011. Forage herbs improve mineral composition of grasslandherbage. Grass Forage Sci. 66, 415–423, http://dx.doi.org/10.1111/j.1365-2494.2011.00799.x.
Roche, J.R., Turner, L.R., Lee, J.M., Edmeades, D.C., Donaghy, D.J., Macdonald, K.A.,Penno, J.W., Berry, D.P., 2009. Weather, herbage quality and milk productionin pastoral systems. 3: Inter-relationships and associations between weathervariables and herbage growth rate, quality and mineral concentration. Anim.Prod. Sci. 49, 211–221, http://dx.doi.org/10.1071/EA07309.
Santamaria, P., Elia, A., Papa, G., Serio, F., 1998. Nitrate and ammonium nutri-tion in chicory and rocket salad plants. J. Plant Nutr. 21, 1779–1789,http://dx.doi.org/10.1080/01904169809365523.
Suttle, N., 2010. Mineral Nutrition of Livestock, fourth ed. CAB International, Walling-ford, UK, ISBN 978-1-84593-472-9, pp. 579.
Sumner, M.E., 1994. Measurement of soil pH—problems and solutions. Commun. SoilSci. Plant Anal. 25, 859–879, http://dx.doi.org/10.1080/00103629409369085.
Ure, A.M., Berrow, M.L., 1970. Analysis of EDTA extracts of soils for copper, zinc andmanganese by atomic absorption spectrophotometry with mechanically seper-ated flame. Anal. Chim. Acta 52, 247–257, http://dx.doi.org/10.1016/S0003-2670(01)80955-7.
Weller, R.F., Bowling, P.J., 2002. The yield and quality of plant species grown in
mixed organic swards. In: Kyriazakis, I., Zervas, G. (Eds.), Organic Meat and Milkfrom Ruminants. Wageningen Academic, Wageningen, ISBN 90-76998-08-6, pp.177–180.Whitehead, D.C., 2000. Nutrient Elements in Grasslands. Soil Plant Animal Relation-ships. CABI Publishing, Wallingford, UK.