recovery of iron/iron oxide nanoparticles from solution: comparison of methods and their effects
TRANSCRIPT
RESEARCH PAPER
Recovery of iron/iron oxide nanoparticles from solution:comparison of methods and their effects
James T. Nurmi • Vaishnavi Sarathy •
Paul G. Tratnyek • Donald R. Baer •
James E. Amonette • Abhi Karkamkar
Received: 23 June 2009 / Accepted: 26 April 2010 / Published online: 15 May 2010
� Springer Science+Business Media B.V. 2010
Abstract Most methods currently being used to
recover Fe0-core/oxide-shell nanoparticles from solu-
tions (including the solvents they are synthesized or
stored in) are potentially problematic because they
may alter the particle composition (e.g., depositing
salts formed from solutes) or leave the particles prone
to transformations during subsequent storage and
handling (e.g., due to residual moisture). In this
study, several methods for recovery of nanoparticles
from aqueous solution were studied to determine how
they affect the structure and reactivity of the recov-
ered materials. Simple washing of the nanoparticles
during vacuum filtration (i.e., ‘‘flash drying’’) can
leave up to *17 wt% residual moisture. Modeling
calculations suggest this moisture is mostly capillary
or matric water held between particles and particle
aggregates, which can be removed by drying for short
periods at relative vapor pressures below 0.9. Flash
drying followed by vacuum drying, all under N2,
leaves no detectable residue from precipitation of
solutes (detectable by X-ray photoelectron spectros-
copy, XPS), no significant changes in overall particle
composition or structure (determined by transmission
electron microscopy, TEM), and negligible residual
moisture (by thermogravimetric analysis, TGA).
While this improved flash-drying protocol may be
the preferred method for recovering nanoparticles for
many purposes, we found that Fe0-core/oxide-shell
nanoparticles still exhibit gradual aging during stor-
age when characterized electrochemically with
voltammetry.
Keywords Recovery � Flash drying �Weight loss � Colloids � Thermogravimetric analysis �Transmission electron microscopy �X-ray diffraction � X-ray photoelectron
spectroscopy � Linear sweep voltammetry
Introduction
Many nanomaterials consist of, or are made from,
freely dispersible (i.e., unattached) nanoparticles
(NPs). During the manufacture use, and/or character-
ization of these NPs, it is often necessary to recover
them from suspension in solvents. The methods
J. T. Nurmi � V. Sarathy � P. G. Tratnyek (&)
Division of Environmental and Biomolecular Systems,
Oregon Health & Science University, 20000 NW Walker
Road, Portland, OR 97006, USA
e-mail: [email protected]
D. R. Baer (&)
Environmental Molecular Sciences Laboratory, Pacific
Northwest National Laboratory, Box 999, Richland,
WA 99352, USA
e-mail: [email protected]
J. E. Amonette � A. Karkamkar
Fundamental and Computational Sciences Directorate,
Pacific Northwest National Laboratory, Box 999,
Richland, WA 99352, USA
123
J Nanopart Res (2011) 13:1937–1952
DOI 10.1007/s11051-010-9946-x

currently being used for recovery of NPs are numer-
ous, but—with a few exceptions (e.g., Lienemann
et al. 1998; Perret et al. 1991; Sweeney et al. 2006)—
are not standardized, generally not well validated, and
sometimes not even well documented. These factors
likely contribute to variations in the apparent structure
and properties of NPs (Baer et al. 2008; Burleson et al.
2004; Grainger and Castner 2008), but the scope of
this problem is unclear because very few studies have
made an effort to systematically assess the effects of
NP recovery methods. As a result of these challenges,
methods of NP recovery from solution are among the
issues included in several on-going initiatives to
standardize materials and protocols for use in research
related to NP-based technologies (European Network
on the Health and Environmental Impact of Nanom-
aterials 2008; National Institute of Standards and
Technology 2008).
The degree to which recovery procedures affect
NP structure and properties will vary with the
stability of the material and the property of concern.
Modest (but potentially significant) effects are to be
expected with NPs whose reactivity is largely cata-
lytic—leaving little or no change in the overall NP
composition and structure—as is the case with Ag,
Au, ZnO, ZnS, TiO2, carbon nanotubes, and fuller-
enes (Klabunde 2001; Obare and Meyer 2004; Zhang
et al. 2003). In contrast, larger effects of recovery
procedures are to be expected with NPs that are
substantially transformed in reactions with their
medium. A prominent example of the latter type is
the Fe0-core FeII/III-oxide shell NPs (herein, referred
to as nano-Fe0) that are widely studied and used for
remediation of contaminated groundwater (Li et al.
2006a, b; Rose et al. 2007; Tratnyek and Johnson
2006). In addition to a considerable amount of work
on the reactivity of nano-Fe0 with contaminants (e.g.,
Kim et al. 2008; Liu et al. 2005; Lowry and Johnson
2004; Song and Carraway 2005, 2006, 2008), recent
studies have described changes in the structure and
properties of these NPs due to processes associated
with handling and storage (Baer et al. 2008; Liu and
Lowry 2006; Nurmi et al. 2005; Sarathy et al. 2008).
Also, the dynamic characteristics of these NPs add to
the challenges in studying nano-Fe0 transport, fate,
and toxicity, which together determine what risk
these materials might pose when introduced into the
environment (Wiesner et al. 2006).
In the majority of studies of nano-Fe0, the original
material was a slurry, either because the NPs were
freshly precipitated from solutions of Fe2? or because
the NPs were made into a slurry for stabilization prior
to shipping. The solution phase of the slurries may
contain residual counter anions (e.g., Cl-, SO42-,
B(OH)4-), surfactants, and co-solvents (because of
the way these materials typically are prepared); the
pH may be high and dissolved oxygen low (because
of corrosion by nano-Fe0); and surface layers on the
NPs will include significant quantities of amorphous
and hydrated iron oxide phases. Some of these
characteristics are interrelated, so any procedure for
separating the solid and liquid phases of these slurries
is likely to alter composition and structure of the
recovered NPs. In addition to changes in structure
and composition of individual particles, the bulk
material may be altered during recovery due to
selective recovery, size fractionation, aggregation,
sintering, and cementation.
While the criteria for an optimal recovery process
depend somewhat on the objectives of study, the
potentially important characteristics of the recovery
process usually include: (i) removing residual solutes
to avoid redeposition of salts, (ii) removing solvent
and co-solvents in a manner that minimizes aggrega-
tion, (iii) eliminating non-structural water without
significantly transforming hydrated phases, (iv) min-
imizing erosion of original surface coatings by
dissolution or abrasion, and (v) avoiding reactions
with the medium or its contaminants by excluding
oxygen and other potentially reactive species. The
degree to which these requirements are met by any
particular recovery protocol depends on how the steps
(washing, dialyzing, decanting, filtering, magnetic
retention, centrifuging, passive/evaporative drying,
active drying with vacuum and/or heat, freeze drying,
etc.) are integrated and implemented. Actual prac-
tices to date have been highly variable, and in most
cases it is unlikely that the protocols used would
meet all, or even most, of the five criteria given
above.
In this study, we examine how the methods used to
recover nano-Fe0 from solution influence the struc-
ture and properties of the resulting materials, focus-
ing primarily on the retention of solvent. One
outcome of this study is an improved protocol that
we recommend for recovery of reactive NPs from
1938 J Nanopart Res (2011) 13:1937–1952
123

aqueous solution. We also provide analysis of how
selected properties measured on recovered materials
are affected by the commonly used recovery meth-
ods. Some of the general and specific results obtained
here for nano-Fe0 should be relevant to other types of
NPs.
Experimental
Materials
The nano-Fe0 used in this study (RNIP-10DS,
obtained from Toda Americas Corp., Schaumberg,
IL) is produced by reduction of goethite and hematite
with H2 at 200–600� C (Uegami et al. 2007). Here,
we continue to designate the material as FeH2, to
distinguish it from nano-Fe0 synthesized by other
methods (Baer et al. 2008; Nurmi et al. 2005; Sarathy
et al. 2008). We worked with FeH2 received as a dry
powder (FeH2(D)), which had minimal exposure to
moisture or oxygen during production, and FeH2
received as a wet slurry (FeH2(W)), which we recov-
ered 6 months after receipt using ‘‘flash-drying’’
method 1 (described below). Both FeH2(D) and
flash-dried FeH2(W) were stored under dry, anoxic
conditions. The specific surface areas (as) of these
materials—measured by BET gas adsorption—were
29 ± 2 m2 g-1 for FeH2(D) and 5 ± 2 m2 g-1 for
flash-dried FeH2(W), which agree well with previously
reported values (Nurmi et al. 2005; Reardon et al.
2008). Prior to testing, the dry materials were made
into solutions using deoxygenated/deionized (DO/DI)
water, generally at 1 g/L. The pH of these suspen-
sions varied from 8 to 10, depending on the aging
time.
The solvents (acetone and methanol) used in the
recovery methods described below were all HPLC
grade from Fisher Scientific and were used without
drying or other purification.
Recovery methods
All steps of both flash-drying procedures were
performed in high quality glove boxes containing
anoxic and low-humidity atmospheres. In one case,
recirculation of H2 (5% in N2) in the atmosphere over
a heated Pd catalyst maintained O2 at \1 ppm and a
desiccant filter kept the relative humidity \50%. In
the other system, continuous exchange with pure N2
(from boil-off of liquid N2) gave an atmosphere with
\3 ppm O2, \12–15 ppm H2O, and no H2.
Original flash dry method (FDv1)
A standard vacuum filtration apparatus was assem-
bled with a 0.02-lm PTFE filter (Whatman) and a
vacuum pump capable of producing -20 mm Hg
(Gast Manufacturing, Inc, MI). After pouring the NP
suspension onto the filter, about 30 s was typically
needed to remove the original solvent. Then the
filtrate was washed three times with acetone (or other
hygroscopic solvent), each time using just enough to
completely cover the filtered NPs. After washing, the
vacuum was maintained until the particle layer
appeared dry (typically 5–10 min). At this stage,
most types of nano-Fe0 gave a loose powder that was
readily transferred to a container for storage or
testing. Variations on FDv1 that were tested include:
rinsing with acetone, methanol, and DO/DI water.
New flash dry method (FDv2)
This method is similar to FDv1, except for several
modifications designed to give more controlled and
complete removal of solvent. After the third and final
wash with solvent, the top of the Buchner funnel was
sealed with a silicone stopper, and a vacuum gauge
was used to adjust the pressure inside the funnel to
-20 mm Hg. This condition was maintained for
30 min [because it was determined that this was
sufficient time for removal of most of the residual
solvent (see below)]. Finally, the vacuum was
relieved without disrupting the layer of NPs on the
filter by slowly opening a needle valve on a stainless
steel tube that pierced the silicone stopper. In this
case, the flash-dried powder was usually transferred
to an amber vial and stored (loosely capped) in a
vacuum desiccator containing a 50/50 mix of Drie-
rite� and activated charcoal.
Other recovery methods
The ‘‘passive drying’’ (PD) method used here
consisted of decanting most of the solvent and then
allowing the residual to evaporate under the glove
box atmosphere for 12 or more hours until the sample
J Nanopart Res (2011) 13:1937–1952 1939
123

appeared dry. This method did not include a sample-
washing step.
Thermal analyses
Differential scanning calorimetry (DSC), thermo-
gravimetric analysis (TGA), and mass spectrometry
(MS) were performed on a TG/DSC STA 449
Netzsch instrument equipped with an Aeolos QMS
300 MS by heating the samples under Ar. The MS
uses a standard electron impact ionization detector.
Within 30 min of their recovery, the NPs were
transferred to the thermal analysis laboratory where
they were stored, processed, and loaded in pre-
weighed alumina crucibles in a pure N2 atmosphere
glove box. In a typical procedure, a sample of 10–
20 mg was transferred from a N2 atmosphere glove
box to an alumina sample pan and quickly placed
under Ar stream at a flow rate of 25 mL/min in the
TGA. Experiments were performed starting at 25� C
and ramping the temperature up to 250� C at a rate of
1� C/min. The sampling rate for TGA was 10 data
points per min.
BET measurements
Batch weight-loss measurements were done by
measuring the difference in weight before and after
drying. Drying of the samples was done using the
VacPrep 061 Sample Degas System (Micromeritics).
Typically, 100–200 mg of sample was put in a sealed
BET vial in the glove box and weighed (pre-drying
weight). The sample in the BET vial was then put in
the VacPrep 061 in which the samples were heated
under flowing UHP N2 at 200� C. At selected times,
the samples were allowed to cool and then weighed
(after-drying weight).
X-ray diffraction
X-ray diffraction (XRD) measurements included
conventional ex situ XRD, which was used to
compare NP samples recovered after exposure to
water for various amounts of time. The samples were
loaded onto off-axis quartz substrates in a N2
atmosphere glove box, then protected from exposure
to oxygen during transfer to the XRD by coating the
samples with 5% glycerol (in methanol) and allowing
the excess methanol to evaporate overnight.
Additional details on this method have been reported
previously (Sarathy et al. 2008; Nurmi et al. 2005).
X-ray diffraction data were also obtained for
selected samples in solution (in situ) using a recently
installed Rigaku D/MAX RAPID II microdiffractom-
eter with a curved imaging plate and a rotating Cr
anode operating at 35 kV and 25 mA. For these
measurements, powder samples were loaded in
0.3-mm dia. quartz capillary tubes. Whole pattern
fitting was used for quantitation of the phases.
X-ray photoelectron spectrometry
X-ray photoelectron spectrometry (XPS) measure-
ments were performed using methods, calibration,
and apparatus that we have described previously
(Baer et al. 2007; Nurmi et al. 2005; Sarathy et al.
2008). This study involved the use of Physical
Electronics Quantum 2000 Scanning ESCA Micro-
probe with a focused monochromatic Al Ka X-ray
(1486.7 eV) source and a spherical section analyzer.
The X-ray beam was typically operated near 100 W
power, focused to 100 lm diameter, and rastered
over a 1.4-mm by 0.2-mm rectangle on the sample.
The NP samples for XPS were mounted using
*5 mm2 pieces of double sided Scotch tape (#34-
8505-86354) fixed to the surfaces of clean *1 cm2
Si(100). In order to avoid reaction of the particles
with O2 from air, samples were mounted onto the
tape and transferred into the spectrometer under a N2
atmosphere.
Charging differences in the XPS data were
corrected by aligning the binding energy scales at
the main oxygen peak using 529.8 eV. Reported
binding energies for the O 1s photoelectron peak of
Fe2O3 range from 529.8 to 530.3 (Anderson et al.
1998; Chambers et al. 1998; Moulder et al. 1992),
and the corresponding values for well-characterized
Fe2O3 and Fe3O4 are essentially identical (Chambers
et al. 1998).
Transmission electron microscopy
High-resolution transmission electron microscopy
(TEM) images were collected using a JEOL JEM
2010 operated at 200 kV, as described previously
(Baer et al. 2007; Nurmi et al. 2005; Sarathy et al.
2008). The point-to-point resolution of the micro-
scope is 0.194 nm. All images were digitally
1940 J Nanopart Res (2011) 13:1937–1952
123
recorded using a charge-coupled device (CCD)
camera and were analyzed using Gatan Digital
Micrograph 3.3.1. Dry or flash-dried samples of
nano-Fe0 were mounted onto the carbon-coated TEM
grids inside a recirculated N2 atmosphere glove box
maintained at \0.5 ppm oxygen. The grid was then
mounted in an airtight TEM sample holder (Gatan
UK Model VTST4006-003) while still inside the
glove box to minimize exposure to atmospheric O2.
TEM images were collected from at least five
different locations on the grid.
Electrochemistry
Linear sweep voltamograms (LSVs) were obtained in
three-electrode cells, containing a powder disk elec-
trode (PDE) made with FeH2, a Pt wire counter
electrode, and a Ag/AgCl reference. Details of the
design and electrochemical properties of the PDE
used in this study have been published previously
(Nurmi et al. 2004, 2005; Nurmi and Tratnyek 2008;
Sarathy et al. 2008). All potentials are reported
relative to the Ag/AgCl reference, and currents are
reported in accord with IUPAC convention (anodic
currents are positive and cathodic currents are
negative).
Results
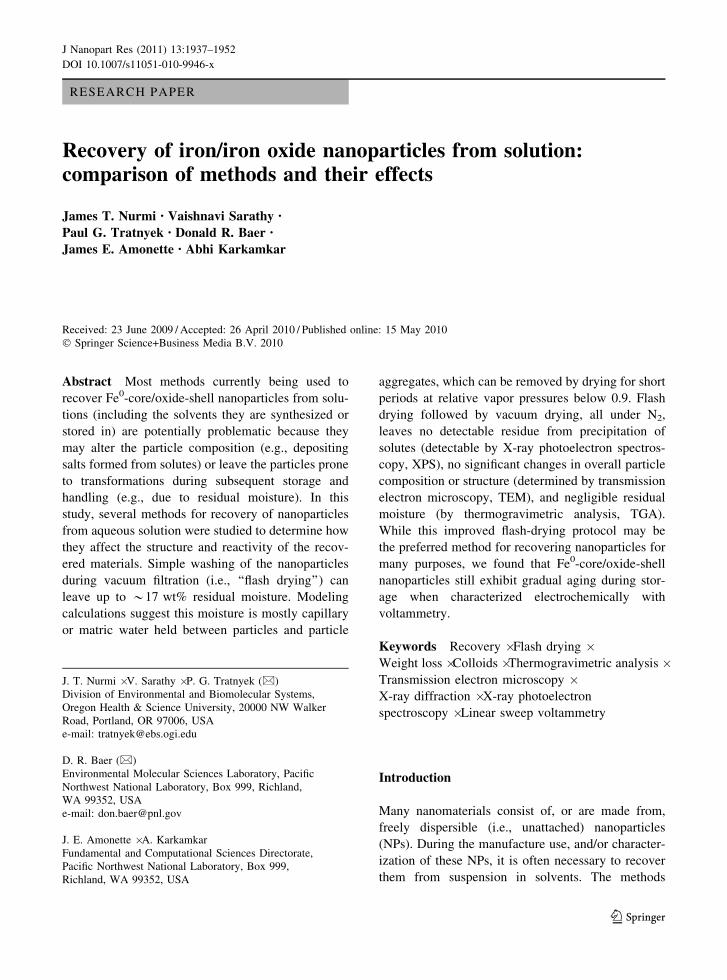
In the study where we first introduced FDv1 (Nurmi
et al. 2005), it was shown with preliminary electro-
chemical data (LSVs obtained using PDEs) that this
recovery method produced nano-Fe0 that was more
stable during storage and gave more consistent
corrosion kinetics than nano-Fe0 recovered by pas-
sive, evaporative drying in an anaerobic glovebox.
However, in a subsequent study of nano-Fe0 aging
using FDv1, we found that rather subtle changes in
NP composition and structure could have significant
impacts on reactivity. Replotting some of the data
from our earlier work (Nurmi et al. 2005) in Fig. 1
reveals that the corrosion potential (Ecorr, the negative
peak in these LSVs) shifts to more anodic values
when the material recovered by FDv1 was stored
under glovebox conditions for significant time peri-
ods (e.g., 20 days) or when the material was recov-
ered by the more gradual process of passive drying
(PD under N2/H2). The observed anodic shift
indicates oxidation, in this case of the aged nano-
Fe0 that comprises the electro-active surface area of
the electrode.
Additional evidence that the method of NP recov-
ery from solution can affect the stability of the
resulting material is available from XRD data.
Analysis of XRD data from our study of FeH2 aging
in solution (Sarathy et al. 2008) showed a gradual
shift in composition from Fe0 to Fe3O4 for freshly
recovered material (by FDv1), but characterization of
similarly aged FeH2 samples that were stored for ca.
2 months between recovery and XRD analysis
showed significantly more oxidation of Fe0 to
Fe3O4 (Fig. 2a). Preliminary data from XRD analysis
of FeH2 in situ (i.e., without recovery) agrees well
with the data obtained when XRD was performed
immediately (several hours) after recovery by FDv1
(Fig. 2a); therefore, supporting the conclusion that
FeH2 recovered by FDv1 is susceptible to significant
changes in composition during storage under anoxic
conditions over several months. In addition to
causing systematic differences between properties
measured on recovered NPs versus unrecovered NPs
(i.e., NPs in situ), the instability of recovered NPs
during storage is likely to contribute to indeterminant
variability between samples. This could be responsi-
ble for the relatively large degree of scatter in oxide
-8.0
-7.5
-7.0
-6.5
-6.0
-5.5
-5.0
-4.5
-4.0
-3.5
log
|Cur
rent
(A
)|
-0.85 -0.80 -0.75 -0.70 -0.65 -0.60 -0.55
Potential (V) vs. Ag/AgCl
t = 5 min after FDv1 (Fig 3 + S7) t = 24 hrs after FDv1 (Fig S7) t = 20 days after flash-drying (Fig S7) PD under N2/H2 (Fig 3)
Fig. 1 Log absolute current versus potential plot of anodic
polarization curves for stationary powder disk electrodes
packed with flash-dried FeH2(W) in anaerobic aqueous borate
(pH = 8.4). Scan rate = 0.1 mV/s. Legend refers to figures in
(Nurmi et al. 2005)
J Nanopart Res (2011) 13:1937–1952 1941
123

content of samples of FeH2 that were aged in solution
for more than 5 days (Fig. 2b).
Both the electrochemical and XRD results sug-
gested to us that a more extensive characterization of
the stability of flash-dried nano-Fe0 was needed. For
this purpose, there are many additional characteriza-
tion methods that might reveal changes due to—or
influenced by—the process of recovering NPs from
solution (Burleson et al. 2004; Rose et al. 2007; Sun
et al. 2006). Here, we chose to focus on four
approaches: (i) weight-loss measurements to assess
the amount and type of residual solvent retained by
the NPs after recovery, (ii) TEM to look for changes
in NP size and morphology, (iii) XPS to determine
the surface composition chemical composition of the
particles, and (iv) electrochemistry to characterize
reactivity. These methods were applied to character-
ize the two types of nano-Fe0 (FeH2(D) and FeH2(W)),
with and without pretreatment (e.g., exposing FeH2(D)
to H2O), after recovery using the two flash-drying
methods with several variations (e.g., rinsing with
methanol instead of acetone). All of the combinations
of material, treatment, and recovery method for
which results are reported here are summarized in
Table 1.
Each combination of material, treatment, and
recovery method listed in Table 1 is represented by
a label where the starting material is represented by D
and W for FeH2(D) and FeH2(W), respectively; the
exposure step described by 0 or W, for no exposure or
water; the exposure time is represented with m, h, or
d, for min, hours, or days; the recovery method is
represented as 0, 1, or 2, for nothing, FDv1, or FDv2;
and the washing solvent during recovery is repre-
sented by a, m, or w, for acetone, methanol, or water.
For example, D/Wd/2a specifies FeH2(D) that was
exposed to water for 1 day and recovered by FDv2
with acetone.
Weight loss
The weight-loss experiments were of two types:
batch measurements of weight loss under typical
degassing conditions used for sample preparation
prior to surface area analysis by BET gas adsorption
80
60
40
20
0
Oxi
de W
eigh
t %
302520151050
Preexposure Time (days)
D/Wd/0 then stored 2 months
B
80
60
40
20
0
Oxi
de W
eigh
t %
543210Preexposure Time (days)
D/0/1a then stored 2 months D/Wd/1a analyzed immediately D/Wd/1a analyzed immediately, replicate D/Wd/0 ("In situ", i.e., w/o recovery)
A
Fig. 2 Effect of recovery and storage methods on XRD
determined oxidation (aging) after immersion of FeH2(D) in
dilute aqueous solutions for up to 5 days (a) and for up to a
month (b). The measurement is the ratio of iron as oxide
(magnetite) versus iron as Fe0. A sample series processed by
FDv1 and stored for more than 2 months prior to analysis
showed both a faster initial rate of oxidation at shorter time and
a large variability for the longer time measurements
Table 1 Treatments tested
Label Treatment (aging) Recovery method
D/0/0 FeH2(D) None None
D/0/1a FeH2(D) None FDv1 w/Acetone
D/0/1m FeH2(D) None FDv1 w/Methanol
D/Wh/1a FeH2(D) DO/DI 30 min FDv1 w/Acetone
D/Wh/2a FeH2(D) DO/DI 30 min FDv2 w/Acetone
D/Wd/0 FeH2(D) DO/DI 1 day None
D/Wd/0 FeH2(D) DO/DI 1 day PD under N2
D/Wd/1a FeH2(D) DO/DI 1 day FDv1 w/Acetone
D/Wd1-5/1a FeH2(D) DO/DI 1–5 day FDv1 w/Acetone
D/Wd/1m FeH2(D) DO/DI 1 day FDv1 w/Methanol
D/Wd/2a FeH2(D) DO/DI 1 day FDv2 w/Acetone
D/Wd/2m FeH2(D) DO/DI 1 day FDv2 w/Methanol
D/Wd/1w FeH2(D) DO/DI 1 day FDv1 w/Water
D/Wd/2w FeH2(D) DO/DI 1 day FDv2 w/Water
W/0/1a FeH2(W) None FDv1 w/Acetone
W/0/2a FeH2(W) None FDv2 w/Acetone
W/Wh/1a FeH2(W) DO/DI 30 min FDv1 w/Acetone
W/Wh/2a FeH2(W) DO/DI 30 min FDv2 w/Acetone
DO/DI deoxygenated deionized water, FDv1 flash dry method
version 1, FDv2 flash dry method version 2, PD passive drying
1942 J Nanopart Res (2011) 13:1937–1952
123

and continuous measurement of weight loss versus
time and temperature by TGA. Results from the batch
experiments are shown in Figs. 3 and 6 and from
TGA in Figs. 4, 5, and 7.
Using samples of FeH2(D) and FeH2(W) that were
recovered from solution using FDv1, we dried
batches of the samples—for time periods from 0 to
35 min—at 200� C under a constant flow of N2 using
the sample preparation station of the BET instrument.
We observed a weight loss of 15 and 9% using
FeH2(D) that had received no treatment other than
rinsing with methanol or acetone, respectively, during
FDv1 (Fig. 3, D/0/1m and D/0/1a). When acetone
was used to rinse during FDv1 on the FeH2(W) sample
(W/0/1a), approximately 13% weight loss was
observed. The greater weight loss for FeH2(W) versus
FeH2(D) could be because long-term storage of FeH2 in
water leads to transformations of the oxide shell to
phases that incorporate more structural water (that
would not be removed by washing with acetone). In
contrast to the three sets of results for FDv1, the
sample that was recovered with FDv2 showed much
less weight loss (*2%) after drying at 200� C
(Fig. 3, D/Wh/2a), indicating that FDv2 is more
effective at removing residual solvent. However, for
the experiments shown in Fig. 3, heating of the
sample to 200� C was essentially immediate and the
weight loss was complete within a few minutes;
therefore, these data are not conducive to more
detailed interpretation of the drying process.
In order to better characterize these weight-loss
effects, TGA was performed on samples of FeH2
prepared and recovered by various methods (specified
in Table 1). For samples recovered by FDv1, the TGA
data from 25 to 80� C are shown in Fig. 4, along with
the first derivative of each time series. The data for the
samples that were exposed to water (W/0/1a, D/Wh/
1a, and W/Wh/1a) have two prominent features—a
sharp transition at 26–29� C and a broader one
centered around 35–45� C—that are not seen in the
samples that had little or no exposure to water (D/0/0
and D/0/1a). These features represent loss of acetone
and water, respectively, as demonstrated by the MS
data (Fig. 5a, b) for atomic masses 42, 43, and 58
(acetone), and 17 and 18 (water). The amount of
weight loss due to acetone was negligible for FeH2
with no exposure to water prior to flash drying (D/0/
1a), but is substantial and roughly constant (*5%) for
all the materials that were exposed to water (W/0/1a,
D/Wh/1a, and W/Wh/1a). We assume that a primary
role of the solvent wash is to fully or partially replace
water loosely associated with the sample. When water
100
95
90
85
Wei
ght (
%)
403020100
Drying Time (min)
D/0/1a
W/0/1a
D/0/1m
D/Wh/2a
Fig. 3 Sample weights measured after drying for different
periods (at 200� C) for FeH2 obtained by a variety of recovery
methods. Treatment and recovery conditions are given in
Table 1
Fig. 4 Thermogravimetric analysis and the first derivative of the
weight-loss data for samples that were recovered by FDv1.
Treatment and recovery conditions are summarized in Table 1.
Markers are shown on every 3–5 data points. TGA analyses of
replicate preparations of W/Wh/1a yielded the same distinctive
profile and comparatively large overall weight loss (data not shown)
J Nanopart Res (2011) 13:1937–1952 1943
123

is retained within a sample, the removal of the acetone
is less rapid, possibly because dilution with water
increases the boiling point of acetone. Only the three
samples that had been preexposed to water (D/Wh/1a,
W/0/1a, and W/Wh/1a) showed notable water loss
after FDv1 with TGA (Fig. 4). The W/Wh/1a data
show a large (ca. 16%) and broad (over 20�) water loss
peak, suggesting this moisture includes a variety of
types (interfacial, capillary, etc., as defined in the
discussion section) of weakly bound structural water
and/or occluded pore water as well as adsorbed water.
The data in Figs. 4 and 5 indicate that FDv1 can
leave variable but significant residues of water—or
other solvents—on samples of recovered FeH2. After
testing a variety of alternative recovery methods, we
settled on FDv2 as a protocol that preserves the
advantages of flash drying, is more aggressive about
removing residual moisture, and yet is still practical
for a wide variety of materials and applications. The
key difference between FDv1 and FDv2 is a vacuum
drying stage after the washing steps are complete,
which greatly decreases the amount of residual
moisture on the recovered material, as shown by the
weight-loss data in Fig. 6. The experiments repre-
sented in Fig. 6 were performed with FeH2(W),
because—as concluded from Fig. 3—it provided
higher resistance to drying than did the FeH2(D)
sample. The conditions that apply to the first point in
Fig. 6 (t = 0) correspond to the data series for
sample W/0/1a in Fig. 3 and both give about the
same weight loss (17 and 15%, respectively), as
expected. The last point in Fig. 6 corresponds to
holding the sample under -20 mm Hg (*1 bar) for
30 min, which produced a residual moisture level of
2–3% (by weight). This treatment became the
standard protocol for FDv2. Figure 6 also shows that
the 2–3% moisture that is left on the sample after
FDv2 can be removed by storage for 24 h in
desiccator filled with 50:50 anhydrous calcium sul-
fate and activated charcoal.
For comparison with the batch weight-loss data for
FDv2 (Fig. 3, 6), we did TGA on several samples
20
15
10
5
0
% W
eigh
t Los
s
302520151050
Time (min)
Under Desiccant for 24 hr
Fig. 6 Percent weight loss of W/0/1a as a function of drying
time under -20 mm Hg (*1 bar) vacuum (open circles) and
under a desiccant for 24 h (horizontal line)
A B C
Fig. 5 Mass spectral data for three of the TGA runs shown in
Figs. 4 and 7. a FeH2(W) without treatment and recovered by
FDv1 with acetone, b FeH2(D) with 30 min in DO/DI water and
recovery by FDv1 with acetone, c FeH2(D) with 30 min in DO/
DI water and recovery by FDv2 with acetone. Treatment
details in Table 1
1944 J Nanopart Res (2011) 13:1937–1952
123

recovered by FDv2 in order to clarify the nature of
moisture retained under the various treatments. These
data (Fig. 7) again show transitions at 26 and 40� C
although the changes are much smaller than observed
with FDv1. The corresponding mass spectral data
(Fig. 5c) show that FDv2 was particularly effective at
removing residual acetone, as almost all the weight
loss for samples obtained by FDv2 was due to water.
In Fig. 7, the weight loss shown with D/Wh/2a is
greater than for W/Wh/2a, although this is the reverse
of what was expected from the data for FDv1. The
significance this comparison is uncertain, however,
because all of the weight losses obtained for FDv2
are quite small, especially when compared to those
obtained with FDv1 (c.f., Fig. 4 vs. Fig. 7).
Composition and structure
Differences in recovery methods—as exemplified by
the weight-loss data showing variability in quantity of
water and rinsing solvents that are retained by
recovered FeH2—have implications for the interpre-
tation of data on the composition and structure of the
recovered materials. Of particular interest are the
possibilities that (i) incomplete drying facilitates
aging (by oxidation or other solid-state
transformations) of the material during storage, (ii)
incomplete rinsing or concentration of solutes during
evaporation of solvents leads to precipitation of
residues on the particle surfaces, and (iii) incomplete
removal of solvents leaves behind species that can
alter the kinetics and mechanisms of reaction
between the NPs and target solutes (e.g., probe
compounds or model contaminants). In order to
investigate some of these possibilities, TEM, XRD,
and XPS were performed on several types of FeH2,
aged in water for various time periods, and recovered
by flash drying and other methods.
Baseline characterization of FeH2 particle size and
structure is available from TEM data reported in
numerous earlier studies (e.g., Nurmi et al. 2005): the
material consists of irregularly rounded, variably
aggregated, particles with size generally between 30
and 50 nm. Furthermore, TEM data obtained over the
course of our previously reported work (Baer et al.
2008, Fig. 3; Sarathy et al. 2008, Fig. S2) show that
exposing FeH2(D) to water for various time periods
followed with recovery by flash drying (FDv1)
resulted in structural changes in the primary particles
and formation of new secondary phases due to
solution-phase aging processes. Similar but less
pronounced aging effects were observed with FeH2(W)
that had been aged as a concentrated alkaline slurry
and then recovered with FDv1 (Sarathy et al. 2008,
Fig. S3). Additional TEM data obtained for this study
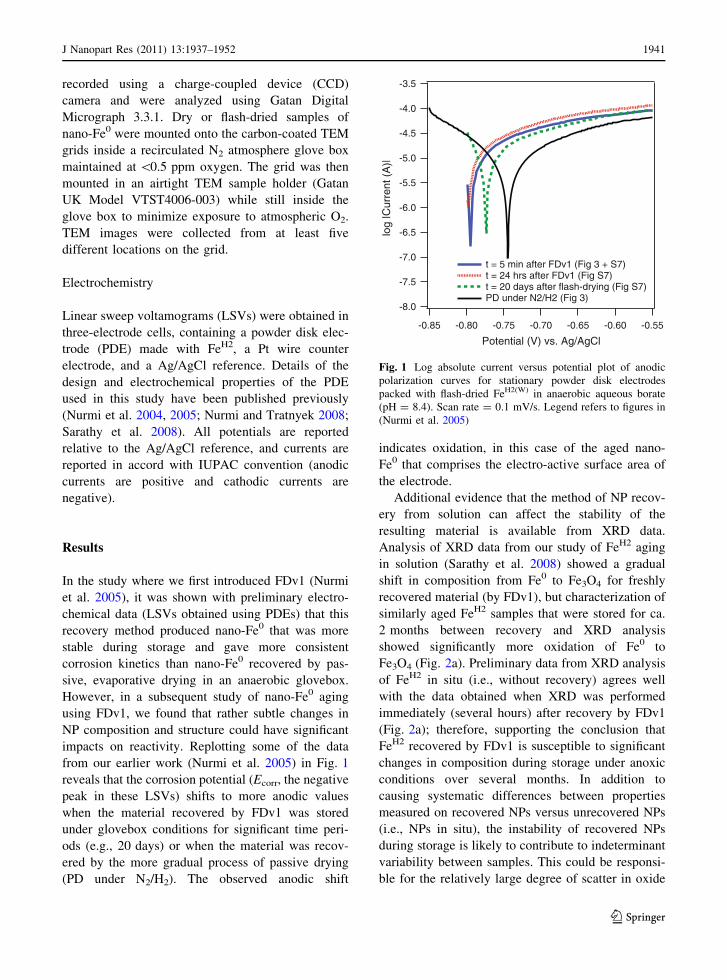
(Fig. 8) are consistent with those earlier results. In
particular, micrographs show no differences in the
apparent composition or structure of the recovered
material due to differences in the method of flash
drying. In contrast, FeH2 recovered by the less
controlled method of passive drying in a glove box
(PD) showed extensive structural changes and accu-
mulation of authigenic precipitates. These results
suggest that both flash-drying methods tested are
sufficient to minimize the first two of the three
possible recovery method effects noted above. How-
ever, possible effect (iii) (i.e., affects of residual
solvent on reactivity) and more subtle manifestations
of (i) and (ii) are not likely to be evident in TEM,
whereas they might be detected by more surface-
selective methods such as XPS.
In preliminary work for this study, XPS was
performed on many samples of FeH2, treated by
various ways, and recovered by FDv1. The data for
the OH and H2O portions of the O 1s photoelectron
Fig. 7 Thermogravimetric analysis and the first derivative of
the weight-loss data for samples that were recovered using
FDv2. Treatment and recovery conditions are summarized in
Table 1. Markers are shown on every 3–5 data points
J Nanopart Res (2011) 13:1937–1952 1945
123
peaks (not shown) revealed significant variability but
no significant trends. These observations further
encouraged the development of FDv2, which pro-
duced more consistent results by XPS.
Figure 9 shows XPS data for the Fe 2p peaks and
the C 1s and O 1s photoelectron peaks obtained with
FeH2(D) exposed to DO/DI water for various time
periods, and recovered several ways. In the Fe 2p
region (Fig. 9a), there is little variation between the
treated samples, all of which show notable broaden-
ing of the main iron oxide peak at *710.7 eV
relative to that for the D/0/0 sample. This broadening
mainly occurs on the lower binding energy side of the
peak and reflects increased Fe(II) content in the oxide
film on the particles due to autooxidation of Fe0
during exposure to water (Sarathy et al. 2008). The
data also suggest a small shoulder at *706.7 eV,
which is consistent with the influence of Fe0 in the
core of these particles, as we have discussed previ-
ously (Nurmi et al. 2005; Sarathy et al. 2008). In the
C 1s region (Fig. 9b), there does not appear to be a
systematic trend in C=O (peak at *289 eV) or C–O
(shoulder at *286.5 eV) relative to C–H and C–C
(peak at *0.8 eV). This contrasts with what we
Passive Dried (PD) FDv1 FDv2 0 hr
0.5 hr
24 hr
Fig. 8 TEM images of FeH2(D) before (0 h) and after 0.5- and
24-h exposure to DO/DI water, followed by recovery with
passive drying in an N2/H2 glove box, with FDv1 or with
FDv2. Because the passive drying process involved no solvent
exposure, the 0-h PD sample is that of the initial, as received
material
1946 J Nanopart Res (2011) 13:1937–1952
123

observed previously when natural organic matter is
adsorbed to FeH2(D) NPs (Johnson et al. 2009). In this
case, we conclude that the variation in the C 1s data is
negligible, and that no significant residue of organic
solvent (acetone or methanol) from flash-drying
survives the sample handling and preparation for
XPS. In the O 1s region (Fig. 9b), however, a
significant effect of the recovery procedure is appar-
ent: both samples obtained by flash drying without
the final steps of rinsing with methanol or acetone
show much greater intensity around 532 eV. This
suggests the oxide shell on these samples retains
some adsorbed H2O and perhaps contains a high
portion of relatively hydrous iron oxides like FeOOH
(*533 and *531.8–532.1 eV; Grosvenor et al.
2004) relative to Fe2O3 (*530.2 eV; Chambers
et al. 1998).
Electrochemistry
At the outset of this study, it was shown that FeH2
recovered by FDv1 underwent substantial changes in
electrochemical properties during storage under con-
ditions typical of N2/H2 glove box (Fig. 1). Since
FDv2 is more effective at removing solvent from
FeH2 recovered from solution (Figs. 3, 4, 5, 6, 7), and
the resulting material is stable with respect to changes
that might be detected by TEM, XPS, or XRD
(Figs. 3, 7, 9), increased stability vis-a-vis electro-
chemical properties was also expected. Figure 10
shows LSVs for D/W/2 as a function of time the
sample was stored in a sealed vessel. The data show
that Ecorr shifts anodically with time, but at a much
smaller rate (2.6 X) than for samples obtained by
FDv1 (Fig. 1). The inset shows that the change in
Ecorr was not entirely linear, but further investigation
of the kinetics of this process was not performed.
Discussion
A fundamental issue that arises from the measure-
ments reported in this article concerns the magnitude
and source of the weight losses reported during the
drying of material that had been flash dried. In
principle, the varying amounts of solvent associated
with the NPs studied here might include ‘‘structural’’
A
B
C
Fig. 9 Comparison of XPS data for FeH2(D) after various
exposure and recovery regimes. a Fe 2p region, b C 1s
photoelectron region, and c O 1s photoelectron region. Binding
energies were all aligned to the main oxygen peak at 529.8 eV.
Details for each treatment are given in Table 1
J Nanopart Res (2011) 13:1937–1952 1947
123

water (water chemically bonded to the nanoparticle
surfaces or incorporated into the oxide shell), but as
this is not likely to be significantly affected by our
treatments or analyses (transitions among iron oxide
phases due to changes in structural water are typically
observed at temperatures [100� C; Cao et al. 1995;
Chin and Yaacob 2006), we will focus solely on
solvent associated in less energetic ways with the
surface of the NPs. We classify this surface-associ-
ated solvent into three categories: (i) interfacial
(retained by molecular-scale forces and located
within two atomic layers of the solid surface); (ii)
capillary (retained by surface tension in pores and
other void spaces at matric potentials of -0.05 bar or
more negative); and (iii) bulk (retained very loosely
at matric potentials more positive than -0.05 bar).
The potential significance of interfacial, capillary,
and bulk water is addressed by the calculations
below.
The solvent content (hgrav), here defined as the
ratio of the mass of retained fluid (water and other
solvents) to the dry mass of the particles, can be
calculated as a function of spherical-particle packing
efficiency using the densities of the particles and the
solvent. In order to determine mean particle density,
we analyzed the untreated FeH2(D) NPs by XRD
(n = 8), from which a mean Fe3O4 content of
16.6 wt%, and a corresponding mean particle density
of 7.42 g cm-3 were estimated. The relationships
between particle packing efficiency and maximum
hgrav, which assumes no gas-filled porosity, are
shown in Fig. 11 for cases where the retained
solvents are water or acetone. For reference, we have
annoted the graph with lines showing the measured
packing efficiency for the dry untreated FeH2(D) NPs
(0.14) and for the calculated maximum packing
efficiencies associated with loose random packing
(0.60; Bordia 1984) and crystalline close packing
(0.74; Bordia 1984) of monodisperse spheres. The
very low packing efficiency (0.14) observed for the
dry untreated FeH2(D) NPs would be expected for
extremely large particle aspect ratios (e.g., Jia et al.
2007, Fig. 3a), which are not seen in the TEM images
we collected (Fig. 8). This result suggests that some
sort of magnetic ordering might be occurring in the
dry powder to prevent the NPs from settling into a
random packing configuration. Possible evidence for
magnetic ordering can be seen in Fig. 8, where only
clusters or aggregates of primary particles are
observed.
The maximum weight losses we observed (e.g.,
Figs. 3, 4) are equivalent to hgrav values of about 0.22
for FeH2(W) and 0.10 for FeH2(D). These values of hgrav
are greater than the maximum values calculated for
-9.0
-8.5
-8.0
-7.5
-7.0
-6.5
-6.0
-5.5
-5.0
log
|Cur
rent
(A
)|
-0.85 -0.80 -0.75 -0.70 -0.65 -0.60 -0.55
Potential (V) vs. Ag/AgCl
t = 0 day t = 0.5 t = 1 t = 10 t = 30
-0.772
-0.770
-0.768
-0.766
-0.764
-0.762
Eco
rr (
V)
3020100
Time (days)
Fig. 10 Anodic polarization curves obtained with FeH2(D)
recovered by FDv2 after 30 min exposure to DO/DI water (D/
Wh/2a) and then stored from 0 to 30 days in sealed evacuated
bottles in an anoxic glove box at 50% RH. Obtained by linear
sweep voltammetry at 0.1 mV/s using powder disk electrodes
immersed in deoxygenated aqueous borate (pH = 8.4)
Fig. 11 Calculated solvent content (hgrav) for FeH2(D) NPs
over the range of possible packing efficiencies
1948 J Nanopart Res (2011) 13:1937–1952
123
the loose random packing limits with acetone and
water solvents (0.07 and 0.09, respectively), but
obviously could be as low as zero if no solvent was
retained. More importantly, they are substantially less
than the maximum possible values of 0.65–0.83
calculated for the untreated FeH2(D) indicating that a
substantial fraction of the solvent is removed by the
flash-drying treatments, as expected, but that ener-
getic or kinetic factors could be preventing complete
removal. To help resolve this, we will focus the next
portion of the discussion on the energetic factors
responsible for solvent retention.
Of the three categories of surface-associated
solvent, the interfacial solvent is held the most tightly
and therefore would be the least easily removed by
flash drying. In order to estimate the maximum
portion of the solvent that can be considered inter-
facial, we first calculated the relationship between
spherical particle radius and mass of solvent held in
the first two atomic layers (two Langmuirs) assuming
the bulk molar volumes for each solvent were
approximately correct for the interfacial region.
Because the primary NPs that comprise FeH2(D) are
not smooth spheres, we estimated an effective
spherical particle radius, using the surface area
reported in (Nurmi et al. 2005) and the mean particle
density to calculate a volume-normalized geometric
surface area that could be compared with one
calculated directly from spherical particle geometry.
We obtained an effective radius of about 14 nm,
which by comparison with the mean particle radius of
22 nm reported by (Nurmi et al. 2005) yields a
surface roughness factor of 1.58 for the FeH2(D) NPs.
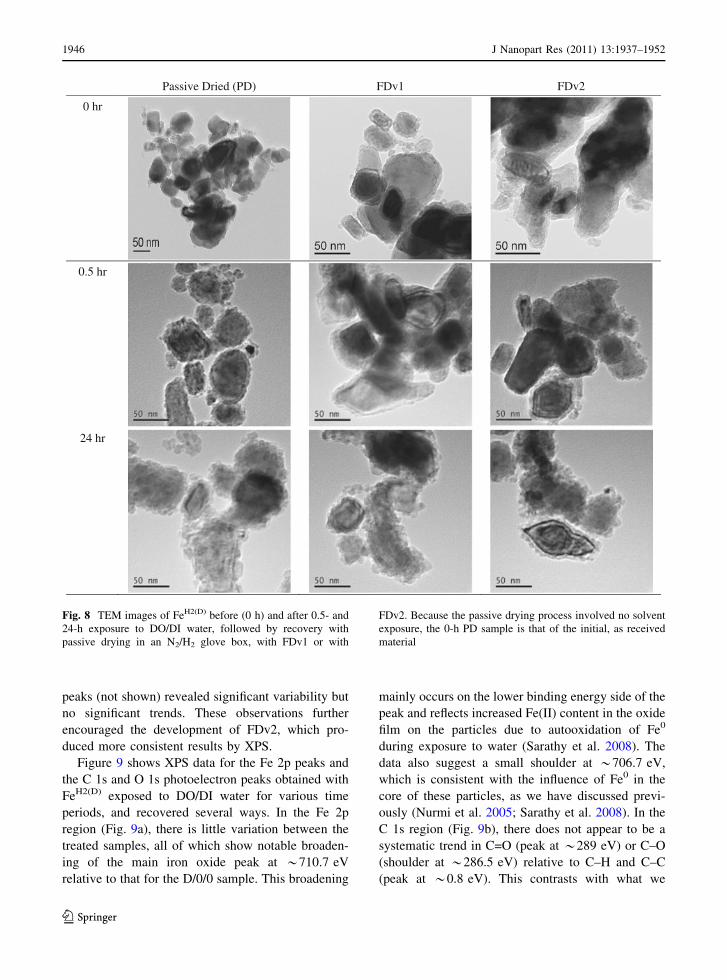
The general relationship between effective NP radius
and interfacial solvent content (Fig. 12) shows the
expected exponential decrease with increasing radius
and a slightly larger mass fraction for acetone relative
to water or methanol. Our estimates of the maximum
interfacial solvent content for FeH2(D) using the
effective radius of 14 nm range from 0.018 to
0.022, which is a small, but not insignificant, portion
of the solvent retained after the FDv1 treatment and is
comparable to the solvent contents measured after the
FDv2 treatment (e.g., Fig. 3, 6, 7).
It seems, therefore, that most of the solvent
retained after the FDv1 treatment is held by capillary
forces, as the bulk solvent should be easily removed
by normal vacuum filtration. The energy with which
capillary solvent is retained (under saturation vapor
pressures) can be calculated as matric potential
(wmatric) using the Young–LaPlace equation and has
units of negative pressure. It is inversely proportional
to the surface tension of the solvent and directly
proportional to the radius of the capillary. One might
expect, therefore, that as particle size decreases—and
with it the dimensions of capillary spaces between the
particles—that wmatric would become more negative.
Indeed, a significant impact of capillary forces on
enhancing solution retention is not a major surprise
and has been observed for nanoporous materials
(Gaspar et al. 2005).
The relation between capillary radius and wmatric is
shown in Fig. 13 for several solvents. Also shown is
the typical vacuum applied by laboratory vacuum
pumps (0.8–1 bar). From the figure, it is clear that for
removal of water under saturated vapor pressure
conditions (i.e., 100% relative humidity) the typical
laboratory vacuum pump cannot access capillary
pores below about 2000 nm in radius. This barrier is
lowered to about 500 nm by exchange of other
solvents for water, but even this level is only part way
into the NP regime, where capillaries having radii on
the order of tens of nm may dominate. This situation
is made even more challenging by the loss of
connectivity between pores as the larger pores drain,
which prevents further increases in vacuum from
removing solvent by the forces of surface tension.
Removal of solvent by vacuum filtration thus needs a
way around the loss of connectivity and the eventual
0.06
0.05
0.04
0.03
0.02
0.01
0.00
Inte
rfac
ial S
olve
nt (
mas
s fr
actio
n)
5040302010
Effective Particle Radius (nm)
100
80
60
40
20
0
Effective S
SA
(m2/g)
RNIP
Acetone (mass fraction) Methanol (mass fraction) Water (mass fraction) Effective Surface Area
Fig. 12 Estimated values for interfacial solvent content for the
FeH2(D) particles assuming two Langmuirs of adsorbed solvent
J Nanopart Res (2011) 13:1937–1952 1949
123

500–1500 bar energetic barrier exerted by capillary
forces in the NP regime.
Fortunately, the connectivity and energy barriers
to solvent removal can be diminished by decreasing
the vapor pressure of the atmosphere in the vicinity of
the capillaries. The calculated impact of vapor
pressure ratio on wmatric for water, the most tenacious
solvent, is shown in Fig. 14. A decrease in vapor
pressure ratio to about 33% of saturation is sufficient
to offset a wmatric of -1500 bar induced by capillary
forces. With lower vapor pressure ratios, a strong
driving force is created for removal of water by
evaporative processes. For example, the water vapor
pressure ratio maintained by CaSO4, the active
ingredient in Drierite� a common desiccant, is about
2.3 9 10-4, well below the 0.33 threshold. The
comparable radii of capillaries that can be emptied at
each vapor pressure ratio are also plotted in Fig. 14.
These confirm that nanometer-sized pores can be
emptied when vapor pressure ratios below the 0.33
threshold are used.
In summary, our analysis shows that because the
energetics of solvent retention by capillary forces are
much higher for NPs than for micron-sized powders,
the driving force required to remove the solvent at a
comparable rate is higher. The FDv1 approach did
not fully appreciate the importance of this factor. The
FDv2 modification, however, expressly considers the
kinetics and energetics of the process. Our calcula-
tions suggest that for best results, the relative
humidity in glove boxes should be maintained at
33% relative humidity or less, and sufficient vacuum
Fig. 13 Relation between solvent matric potential and capil-
lary radius for water and several organic solvents at saturated
vapor pressure. The matric suction exerted by typical
laboratory diaphragm vacuum pumps is also shown. Solvent
held at matric potentials more negative than this level of
suction will not be removed by pumping under these conditions
Fig. 14 Calculated
decrease in water matric
potential achieved by
application of vapor
pressure ratios below
saturation during vacuum
filtration. The effective
capillary radius for each
vapor pressure ratio is also
shown. Capillaries having
radii larger than this value
will release their water to
the atmosphere given
sufficient time
1950 J Nanopart Res (2011) 13:1937–1952
123

filtration time (30–60 min) must be allowed, to
completely dry the NPs. Replacing water in the NP
sample with a higher vapor pressure solvent such as
acetone before drying speeds the process by increas-
ing wmatric. And, storage of samples over a desiccant
is essential to removing vestigial water and main-
taining the surfaces of the NPs in a completely dry
state, if further reaction is to be avoided. Finally,
verification of the moisture content of any nominally
dry sample is essential in order to avoid artifacts in
subsequent reactivity studies.
Conclusions
The recovery of reactive nanoparticles by washing
during vacuum filtration under anoxic conditions
(FDv1) has various advantages over more commonly
employed methods such as freeze drying or decanting
and evaporation under an anoxic glove box atmo-
sphere. Most conspicuously, FDv1 avoids most of the
deposition of salts, etching, and cementation that is
visible in TEMs of nano-Fe0 recovered by evapora-
tion; however, further investigation revealed addi-
tional, more subtle effects such as shifts in redox state
(by voltammetry) and altered rates of NP aging (by
XRD). Furthermore, thermal analysis showed that
FDv1 left as much as 17 wt% residual solvent
associated with the recovered material, and modeling
calculations show that most of this moisture must be
capillary or matric water, which provides a medium
for continued aging and other reactions. A further
consequence of aging and related transformations of
NPs during storage is variability in the results of
subsequent characterizations (e.g., reactivity with
contaminants).
The residual moisture that is left behind by FDv1
was largely eliminated by a refined recovery proce-
dure involving flash drying followed by vacuum
drying (FDv2). Fe0 NPs recovered by FDv2 were
found to be essentially free of secondary precipitates,
erosion or etching, and surface oxidation. Immedi-
ately after vacuum drying, they retained \3 wt%
water, and this residual was completely removed by
storage overnight in an anoxic desiccator. By a range
of characterization methods, Fe0 NPs recovered with
FDv2 appear to be stable and reproducible, although
gradual aging (by autooxidation) was still detectable
electrochemically. For most purposes, FDv2 would
be a considerable improvement over the recovery
protocols that are most commonly used. For some
purposes, FDv2 might not be ideal, or even adequate,
but alternative methods should be evaluated critical,
as we have done here. The approach and general
considerations used here to evaluate FDv1 versus
FDv2 may provide guidance for evaluation of other
recovery methods for nanoparticles from solution.
Acknowledgments We acknowledge and thank C.-M. Wang,
P. Nachimuthu, M.H. Engelhard, J. Kwak, and C.K. Russell for
their assistance with TEM, XRD, XPS, and BET measurements
and sample preparation. Samples of nano-Fe0 were donated by
the Toda Kogyo Corp. We would also like to thank students
Abram J. Ledbetter and Jharana Dhal who conducted some
exploratory work on particle recovery during a Nanotechnology
course hosted by the Pacific Northwest National Laboratory
(PNNL) and the William R. Wiley Environmental Molecular
Sciences Laboratory (EMSL). This work was supported by the
U.S. Department of Energy (DOE) Division of Chemical
Sciences, Geosciences, and Biosciences. Parts of the work were
conducted at the EMSL, which is located at PNNL. EMSL is a
DOE User Facility operated by Battelle for the DOE Office of
Biological and Environmental Research. PNNL is operated for
the DOE under Contract DE-AC06-76RLO 1830.
References
Anderson JF, Kuhn M, Diebold U (1998) Epitaxially grown
Fe3O4 thin films: an XPS study. Surf. Sci. Spectra 4:266–
272
Baer DR, Tratnyek PG, Qiang Y, Amonette JE, Linehan J,
Sarathy V, Nurmi JT, Wang C, Anthony J (2007) Syn-
thesis, characterization, and properties of zero-valent iron
nanoparticles. In: Fryxell GE (ed) Environmental appli-
cations of nanomaterials: synthesis, sorbents, and sensors.
Imperial College Press, London, pp 49–86
Baer DR, Amonette JE, Engelhard MH, Gaspar DJ, Karakoti
AS, Kuchibhatla S, Nachimuthu P, Nurmi JT, Qiang Y,
Sarathy V, Seal S, Sharma A, Tratnyek PG, Wang C-M
(2008) Characterization challenges for nanomaterials.
Surf. Interface Anal. 40:529–537
Bordia RK (1984) A theoretical analysis of random packing
densities of mono-sized spheres in two and three dimen-
sions. Scr Metall Mater 18:725–730
Burleson DJ, Driessen MD, Penn RL (2004) On the charac-
terization of environmental nanoparticles. J Environ Sci
Health A 39:2707–2753
Cao X, Koltypin Y, Kataby G, Prozorov R, Gedanken A (1995)
Controlling the particle size of amorphous iron nanopar-
ticles. J Mater Res 10:2952–2957
Chambers SA, Kim YJ, Gao Y (1998) Fe 2p Core-level spectra
for pure, epitaxial a-Fe2O3(0001), c-Fe2O3(001), and
Fe3O4(001). Surf Sci Spectra 5:219–228
Chin AB, Yaacob II (2006) Synthesis and characterization of
iron oxides nanoparticles. Key Eng Mater 306–308:1115–
1119
J Nanopart Res (2011) 13:1937–1952 1951
123

European Network on the Health and Environmental Impact of
Nanomaterials (2008) NanoImpactNet workshop 1—
strategies to standardize nanomaterials for environmental
and ecotoxicological research (3–5 September 2008,
Zurich, Switzerland)
Gaspar DJ, Engelhard MH, Henry MC, Baer DR (2005) Ero-
sion rate variations during XPS sputter depth profiling of
nanoporous films. Surf Interface Anal 37:417–423
Grainger DW, Castner DG (2008) Nanobiomaterials and
nanoanalysis: opportunities for improving the science to
benefit biomedical technologies. Adv Mater 20:867–877
Grosvenor AP, Kobe BA, McIntyre NS (2004) Studies of the
oxidation of iron by water vapour using X-ray photoelec-
tron spectroscopy and QUASES. Surf Sci 572:217–227
Jia X, Gan M, Williams RA, Rhodes D (2007) Validation of a
digital packing algorithm in predicting powder packing
densities. Powder Technol 174:10–13
Johnson RL, O’Brien Johnson R, Nurmi JT, Tratnyek PG
(2009) Natural organic matter enhanced mobility of nano
zero-valent iron. Environ Sci Technol 43:5455–5460
Kim J-H, Tratnyek PG, Chang Y-S (2008) Rapid dechlorina-
tion of polychlorinated dibenzo-p-dioxins (PCDDs) by
bimetallic and nano-sized zerovalent iron. Environ Sci
Technol 42:4106–4112
Klabunde KJ (2001) Nanoscale materials in chemistry. Wiley,
New York
Li L, Fan M, Brown R, Van Leeuwen J, Wang J, Wang W, Song
Y, Zhang P (2006a) Synthesis, properties, and environ-
mental applications of nanoscale iron-based materials: a
review. Crit Rev Environ Sci Technol 36:405–431
Li X-Q, Elliott DW, Zhang W-X (2006b) Zero-valent iron
nanoparticles for abatement of environmental pollutants:
materials and engineering aspects. Crit Rev Solid State
Mater Sci 31:111–122
Lienemann C-P, Heissenberger A, Leppard GG, Perret D
(1998) Optimal preparation of water samples for the
examination of colloidal materials by transmission elec-
tron microscopy. Aquat Microb Ecol 14:205–213
Liu Y, Lowry GV (2006) Effect of particle age (Fe0 content)
and solution pH on nZVI reactivity: H2 evolution and
TCE dechlorination. Environ Sci Technol 40:6085–6090
Liu Y, Majetich Sara A, Tilton Robert D, Sholl David S,
Lowry Gregory V (2005) TCE dechlorination rates,
pathways, and efficiency of nanoscale iron particles with
different properties. Environ Sci Technol 39:1338–1345
Lowry GV, Johnson KM (2004) Congener-specific dechlori-
nation of dissolved PCBs by microscale and nanoscale
zerovalent iron in a water/methanol solution. Environ Sci
Technol 38:5208–5216
Moulder JF, Stickle WF, Sobol PE, Bomben KD (eds) (1992)
Handbook of X-ray photoelectron spectroscopy. Perkin-
Elmer Corp, Eden Prairie, MN
National Institute of Standards and Technology (2008) ISO,
IEC, NIST, and OECD international workshop on docu-
mentary standards for measurement and characterization
of nanotechnologies (26–28 February 2008)
Nurmi JT, Tratnyek PG (2008) Electrochemical studies of
packed iron powder electrodes: effects of common
constituents of natural waters on corrosion potential.
Corros Sci 50:144–154
Nurmi JT, Bandstra JZ, Tratnyek PG (2004) Packed powder
electrodes for characterizing the reactivity of granular iron
in borate solutions. J Electrochem Soc 151:B347–B353
Nurmi JT, Tratnyek PG, Sarathy V, Baer DR, Amonette JE,
Pecher K, Wang C, Linehan JC, Matson DW, Penn RL,
Driessen MD (2005) Characterization and properties of
metallic iron nanoparticles: spectroscopy, electrochemis-
try, and kinetics. Environ Sci Technol 39:1221–1230
Obare SO, Meyer GJ (2004) Nanostructured materials for
environmental remediation of organic contaminants in
water. J Environ Sci Health A 39:2549–2582
Perret D, Leppard GG, Mueller M, Belzile N, De Vitre R,
Buffle J (1991) Electron microscopy of aquatic colloids:
non-perturbing preparation of specimens in the field.
Water Res 25:1333–1343
Reardon EJ, Fagan R, Vogan JL, Przepiora A (2008) Anaerobic
corrosion reaction kinetics of nano-sized iron. Environ Sci
Technol 42:2420–2425
Rose J, Thill A, Brant J (2007) Methods of structural and
chemical characterization of nanomaterials. In: Wiesner
MR, Bottero J-Y (eds) Environmental nanotechnology.
McGraw Hill, New York, pp 105–154
Sarathy V, Tratnyek PG, Nurmi JT, Baer DR, Amonette JE,
Chun C, Penn RL, Reardon EJ (2008) Aging of iron
nanoparticles in aqueous solution: effects on structure and
reactivity. J Phys Chem C 112:2286–2293
Song H, Carraway ER (2005) Reduction of chlorinated ethanes
by nanosized zero-valent iron: kinetics, pathways, and
effects of reaction conditions. Environ Sci Technol
39:6237–6245
Song H, Carraway ER (2006) Reduction of chlorinated meth-
anes by nano-sized zero-valent iron: kinetics, pathways,
and effect of reaction conditions. Environ Eng Sci
23:272–284
Song H, Carraway ER (2008) Catalytic hydrodechlorination of
chlorinated ethenes by nanoscale zero-valent iron. Appl
Catal B 78:53–60
Sun Y-P, Li X-Q, Cao J, Zhang W-X, Wang HP (2006)
Characterization of zero-valent iron nanoparticles. Adv
Colloid Interface Sci 120:47–56
Sweeney SF, Woehrle GH, Hutchison JE (2006) Rapid puri-
fication and size separation of gold nanoparticles via
diafiltration. J Am Chem Soc 128:3190–3197
Tratnyek PG, Johnson RL (2006) Nanotechnologies for envi-
ronmental cleanup. NanoToday 1:44–48
Uegami M, Kawano J, Okita T, Fujii Y, Okinaka K, Kakuya K,
Yatagai S (2007) Process for purifying contaminated soil
or groundwater with iron particles. Toda Kogyo Corp.,
United States Patent, No. 7,220,366 B2
Wiesner MR, Lowry GV, Alvarez P, Dionysiou D, Biswas P
(2006) Assessing the risks of manufactured nanomaterials.
Environ Sci Technol 40:4336–4345
Zhang H, Gilbert B, Huang F, Banfield JF (2003) Water-driven
structure transformation in nanoparticles at room tem-
perature. Nature 424:1025–1029
1952 J Nanopart Res (2011) 13:1937–1952
123
Positive contrast MR-lymphography using inversion recovery with ON-resonant water suppression (IRON)
Surface Engineering of Core/Shell Iron/Iron Oxide Nanoparticles from Microemulsions for Hyperthermia