recent terrestrial and carbonate fluxes in the pelagic eastern mediterranean; a comparison between...
TRANSCRIPT
Palaeogeography, Palaeoclimatology, Palaeoecology 158 (2000) 197–213www.elsevier.nl/locate/palaeo
Recent terrestrial and carbonate fluxes in the pelagic easternMediterranean; a comparison between sediment trap and
surface sediment
A. Rutten a,*, G.J. de Lange a, P. Ziveri b,c, J. Thomson d, P.J.M. van Santvoort a,S. Colley d, C. Corselli b
a Institute of Earth Sciences, Department of Geochemistry, Utrecht University, Budapestlaan 4, 3584 CDUtrecht, The Netherlandsb Department of Earth Sciences, University of Milan, Via Mangiagalli 34, 20133 Milan, Italy
c Geomarine Center, Vrije Universiteit Amsterdam, De Boelelaan 1085, 1081 HV Amsterdam, The Netherlandsd Southampton Oceanographic Centre, European Way, Empress Dock, Southampton SO14 3ZH, UK
Accepted for publication 15 June 1999
Abstract
A sediment trap mooring was deployed in the central eastern Mediterranean from November 1991 to August 1994.At 3000 m water depth, total mass, Al, Ca, Mg, Sr and 230Th fluxes recovered by the sediment trap are highlyseasonal, with highest fluxes during early spring in 1992 and 1993, and during late-spring/early-summer in 1994.Comparison of historic annual satellite-derived chlorophyll records (coastal zone colour scanner) with the trap fluxtime series indicates a lag of 4–6 months between maximum primary production in the surface ocean and maximumflux recorded by the trap. Only the flux of coccospheres to the trap is at a maximum ~1 month after maximumpigment concentrations in surface waters, a value commonly found in other areas. Quantification of the inorganic( lithogenic) flux to the trap indicates that Saharan dust is likely to be the major contributor to the trap mass flux.The trapping efficiency of the sediment trap, as calculated from the intercepted 230Th flux, is only 23%, and the trapAl-flux is similarly ×4 lower than Al fluxes measured in nearby uppermost sediments. Compared with surfacesediments, the trap-intercepted carbonate fluxes are even lower (×9) than the corresponding lithogenic fluxes. This ispartly due to the very low abundance of large (>32 mm) foraminifera and pteropods found in the trap materialcompared to the surface sediment. We speculate that the period of our sediment trap deployment was insufficientlylong to recover episodical large fluxes, such as may be triggered by North Atlantic Oscillation variations. © 2000Elsevier Science B.V. All rights reserved.
Keywords: aluminium; calcium; east Mediterranean; flux; recent; sediment traps; surface sediment
1. Introduction expression of this is the recurrent presence ofnumerous organic carbon rich layers [sapropels;
The eastern Mediterranean Sea is an area that Kidd et al. (1978)] in marine cores as well as inis particularly sensitive to climate change. One marine sections on land, dating back as far as the
Miocene (e.g. Cita et al., 1977; Thunell et al., 1977;Kidd et al., 1978; Sigl et al., 1978; Calvert, 1983;* Corresponding author.
E-mail address: [email protected] (A. Rutten) Pruysers et al., 1991; Rohling, 1994; Van Os et al.,
0031-0182/00/$ - see front matter © 2000 Elsevier Science B.V. All rights reserved.PII: S0031-0182 ( 00 ) 00050-X
198 A. Rutten et al. / Palaeogeography, Palaeoclimatology, Palaeoecology 158 (2000) 197–213
1994; Nijenhuis et al., 1996). The regular occur- The overall sedimentation rate in the deep east-ern Mediterranean is in the order ofrence of sapropels was shown to be related to
Milankovitch cycles (e.g. Rossignol-Strick, 1985; 2–4 cm kyear−1 (e.g. Thomson et al., 1995; VanSantvoort et al., 1996). Bioturbation causes aHilgen, 1991; Lourens, 1994). Sapropels are
thought to represent periods of high primary pro- mixed depth of 1–2 cm (Thomson et al., 1995),thereby obscuring changes in the sediment flux onductivity and of wet climate [see review by Rohling
(1994)] related to maximum Northern Hemisphere yearly and decadal time scales in the geologicalrecord. This means that the relation between pri-insolation caused by a minimum in the Earth’s
solar precession. At present, during a period of mary production, climate and seasonal fluxes tothe sediment cannot be assessed directly from thedry climate and close to a precession maximum,
the eastern Mediterranean basin is an oligotrophic sediment record. This relation needs to be betterunderstood so as to obtain insight in the diversitywater body with low primary production.
Furthermore, the Saharan desert is an important of processes that govern the eastern Mediterraneanecosystem. In addition, this relation is needed forcontributor to the sedimentation during present
time [e.g. Guerzoni et al. (1997), and references the development of better models for the predictionof the response of the Mediterranean ecosystem totherein] due to the prevailing dry climate.
However, its contribution is known to strongly changing climate. One approach to assess seasonalmass fluxes is by using time-series sediment traps.decrease during a wet climatic period (e.g. Dominik
and Stoffers, 1979). Such alternation leads to A sediment trap deployment was undertakenfrom November 1991 to August 1994 in the centralvariations in the amount and origin of terrestrial
matter input into the eastern Mediterranean, which eastern Mediterranean. In this paper, we reportchemical data on terrestrial and carbonate fluxes,is related to precession cycles.
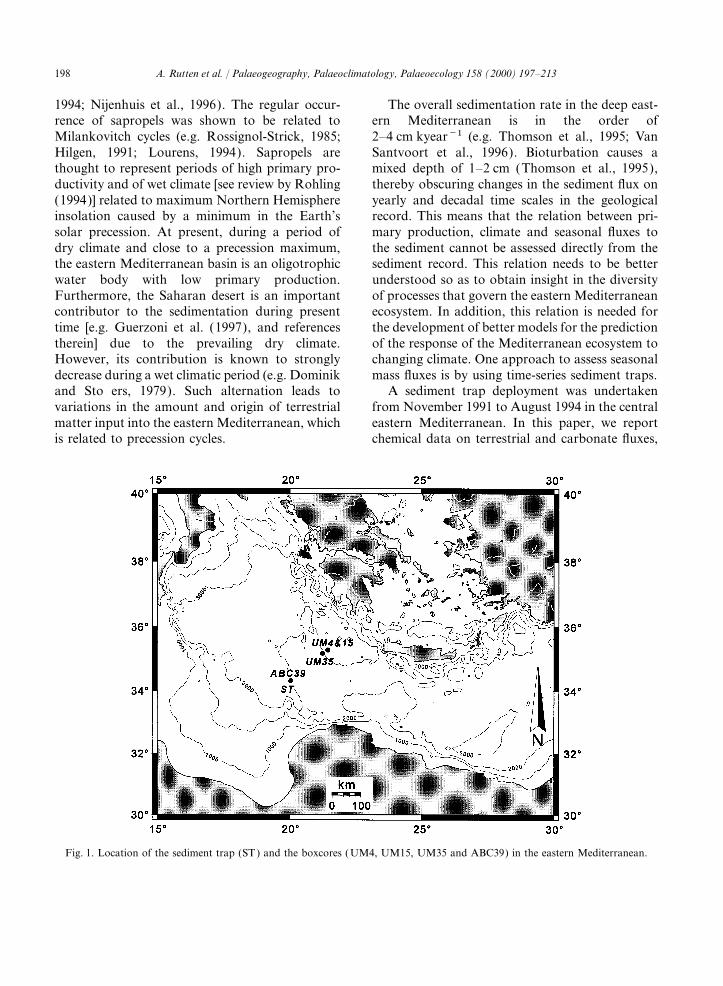
Fig. 1. Location of the sediment trap (ST) and the boxcores (UM4, UM15, UM35 and ABC39) in the eastern Mediterranean.
199A. Rutten et al. / Palaeogeography, Palaeoclimatology, Palaeoecology 158 (2000) 197–213
and discuss its relevance in view of seasonal nearly continuous period of 34 months (Table 1).No preservatives were used in the sample bottles.changes. Furthermore, these results will be com-
pared to those estimated from the uppermost However, this will not have altered our resultssignificantly (Peterson et al., 1993; Khripounoffsediment of boxcores from nearby sites.and Crassous, 1994). In this study we focus onthe upper, oxic trap.
2. Materials and methods2.1.2. Boxcores
The upper few centimetres of three eastern2.1. MaterialMediterranean boxcores, from different waterdepths and located near the sediment trap, were2.1.1. Sediment trap
Two 1 m2 sediment traps (Technicap PPS5/2) analysed (Fig. 1; Table 2). The tops of UM4,UM15 and UM35 contained an oxic, light-brownwere deployed in a time series in the southwestern
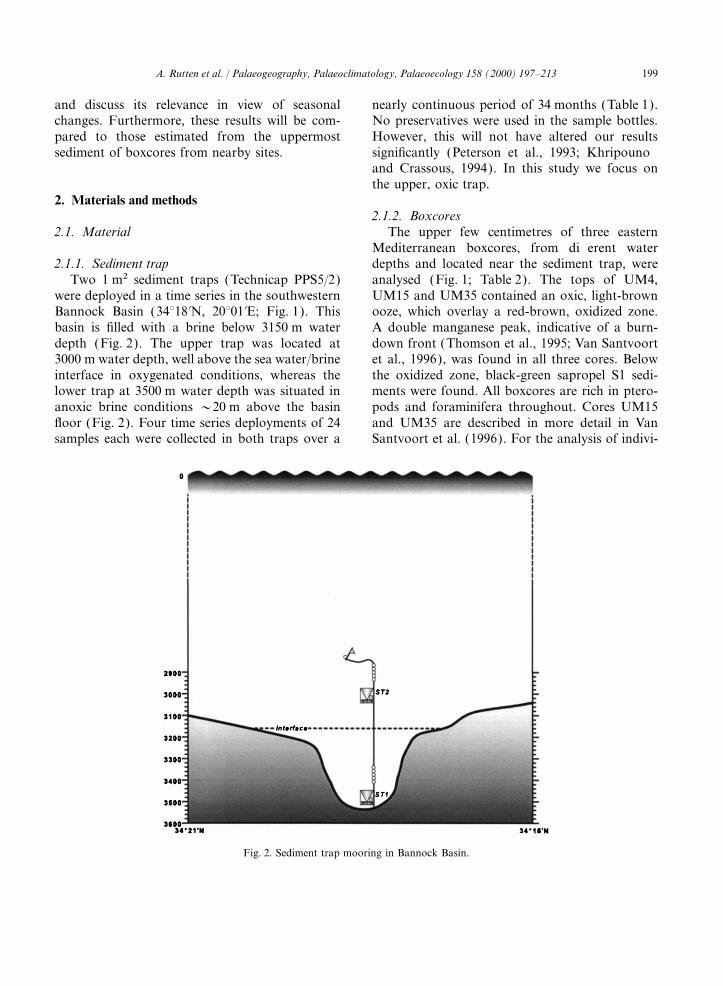
Bannock Basin (34°18∞N, 20°01∞E; Fig. 1). This ooze, which overlay a red-brown, oxidized zone.A double manganese peak, indicative of a burn-basin is filled with a brine below 3150 m water
depth (Fig. 2). The upper trap was located at down front (Thomson et al., 1995; Van Santvoortet al., 1996), was found in all three cores. Below3000 m water depth, well above the sea water/brine
interface in oxygenated conditions, whereas the the oxidized zone, black-green sapropel S1 sedi-ments were found. All boxcores are rich in ptero-lower trap at 3500 m water depth was situated in
anoxic brine conditions ~20 m above the basin pods and foraminifera throughout. Cores UM15and UM35 are described in more detail in Vanfloor (Fig. 2). Four time series deployments of 24
samples each were collected in both traps over a Santvoort et al. (1996). For the analysis of indivi-
Fig. 2. Sediment trap mooring in Bannock Basin.
200 A. Rutten et al. / Palaeogeography, Palaeoclimatology, Palaeoecology 158 (2000) 197–213
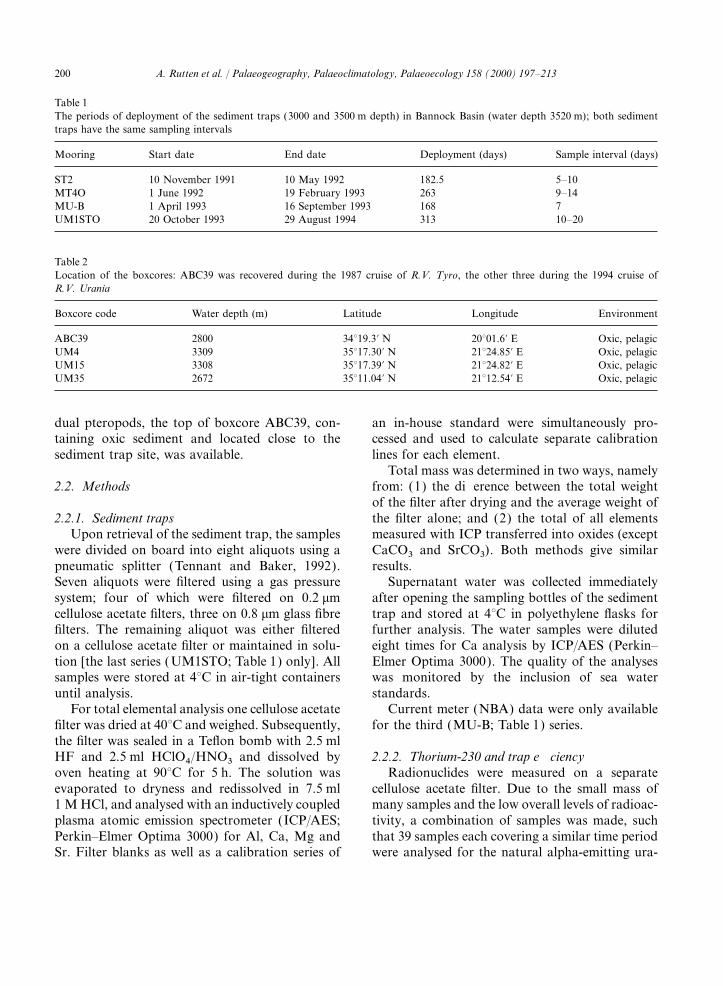
Table 1The periods of deployment of the sediment traps (3000 and 3500 m depth) in Bannock Basin (water depth 3520 m); both sedimenttraps have the same sampling intervals
Mooring Start date End date Deployment (days) Sample interval (days)
ST2 10 November 1991 10 May 1992 182.5 5–10MT4O 1 June 1992 19 February 1993 263 9–14MU-B 1 April 1993 16 September 1993 168 7UM1STO 20 October 1993 29 August 1994 313 10–20
Table 2Location of the boxcores: ABC39 was recovered during the 1987 cruise of R.V. Tyro, the other three during the 1994 cruise ofR.V. Urania
Boxcore code Water depth (m) Latitude Longitude Environment
ABC39 2800 34°19.3∞ N 20°01.6∞ E Oxic, pelagicUM4 3309 35°17.30∞ N 21°24.85∞ E Oxic, pelagicUM15 3308 35°17.39∞ N 21°24.82∞ E Oxic, pelagicUM35 2672 35°11.04∞ N 21°12.54∞ E Oxic, pelagic
dual pteropods, the top of boxcore ABC39, con- an in-house standard were simultaneously pro-cessed and used to calculate separate calibrationtaining oxic sediment and located close to the
sediment trap site, was available. lines for each element.Total mass was determined in two ways, namely
from: (1) the difference between the total weight2.2. Methodsof the filter after drying and the average weight ofthe filter alone; and (2) the total of all elements2.2.1. Sediment traps
Upon retrieval of the sediment trap, the samples measured with ICP transferred into oxides (exceptCaCO3 and SrCO3). Both methods give similarwere divided on board into eight aliquots using a
pneumatic splitter (Tennant and Baker, 1992). results.Supernatant water was collected immediatelySeven aliquots were filtered using a gas pressure
system; four of which were filtered on 0.2 mm after opening the sampling bottles of the sedimenttrap and stored at 4°C in polyethylene flasks forcellulose acetate filters, three on 0.8 mm glass fibre
filters. The remaining aliquot was either filtered further analysis. The water samples were dilutedeight times for Ca analysis by ICP/AES (Perkin–on a cellulose acetate filter or maintained in solu-
tion [the last series (UM1STO; Table 1) only]. All Elmer Optima 3000). The quality of the analyseswas monitored by the inclusion of sea watersamples were stored at 4°C in air-tight containers
until analysis. standards.Current meter (NBA) data were only availableFor total elemental analysis one cellulose acetate
filter was dried at 40°C and weighed. Subsequently, for the third (MU-B; Table 1) series.the filter was sealed in a Teflon bomb with 2.5 mlHF and 2.5 ml HClO4/HNO3 and dissolved by 2.2.2. Thorium-230 and trap efficiency
Radionuclides were measured on a separateoven heating at 90°C for 5 h. The solution wasevaporated to dryness and redissolved in 7.5 ml cellulose acetate filter. Due to the small mass of
many samples and the low overall levels of radioac-1 M HCl, and analysed with an inductively coupledplasma atomic emission spectrometer (ICP/AES; tivity, a combination of samples was made, such
that 39 samples each covering a similar time periodPerkin–Elmer Optima 3000) for Al, Ca, Mg andSr. Filter blanks as well as a calibration series of were analysed for the natural alpha-emitting ura-
201A. Rutten et al. / Palaeogeography, Palaeoclimatology, Palaeoecology 158 (2000) 197–213
nium and thorium isotopes and 210Pb (Colley et al., tion was, therefore, used:1995). Even with the combination of samples,
MAR=DBD×SR (2)these were demanding low-level radiochemicalmeasurements, and counting times were typically where MAR is the mass accumulation rate
(mg cm−2 year−1), DBD the dry bulk density7 days and frequently longer.Recent applications of 230Th data generally (g cm−3) and SR the sedimentation rate
(cm kyear−1). The dry bulk density was calculatedinvolve the assumption that this natural radionu-clide provides the best approximation to a constant as follows:flux tracer from the ocean to the sediments (Bacon,
DBD=(1−por)r (3)1984). 230Th is continuously produced from the234U present in the sea water, and its short resi- where por is the mean porosity of the upper, oxic
interval and r is 2.5 g cm−3.dence time in the water column gives rise to apredictable (230Thexcess)0 flux to the underlying For the average composition of each boxcore
top, the samples from the upper 1 to 2 cm, that is,sediments which is a linear function of water depth:the surface mixed layer (Thomson et al., 1995),
Flux (230Thexcess)0=bz=0.00263z were averaged. Part of the top two samples ofUM4 were wet-sieved to discriminate fractions(dpm cm−2 kyear−1) (1)smaller and larger than 32 mm. The separate sizefractions were analysed the same way as the sedi-where b is the production rate of 230Th from thement samples above.constant 234U concentration in sea water (Chen
Clean pteropods from the top of boxcoreet al., 1986) and z is the water column depth inABC39 were handpicked and divided in 10–15 mgmetres. For sediment traps, the formula is bestsamples (four samples, three to four pteropods perused over a long time period [at least 1 year; Baconsample). Each sample was dissolved in 1 Met al. (1985)] because of the usual good correlationHNO3. The solutions were analysed with ICP/AESbetween the total mass flux and the fluxes of(Perkin–Elmer Optima 3000) for Ca and Sr. Aradionuclides in sediment traps (e.g. Fisher et al.,blank was included, and ICP analysis was moni-1988; Moore and Dymond, 1988).tored by the inclusion of standards.
2.2.3. BoxcoresDried boxcore subsamples (250 mg) were sealed 3. Results
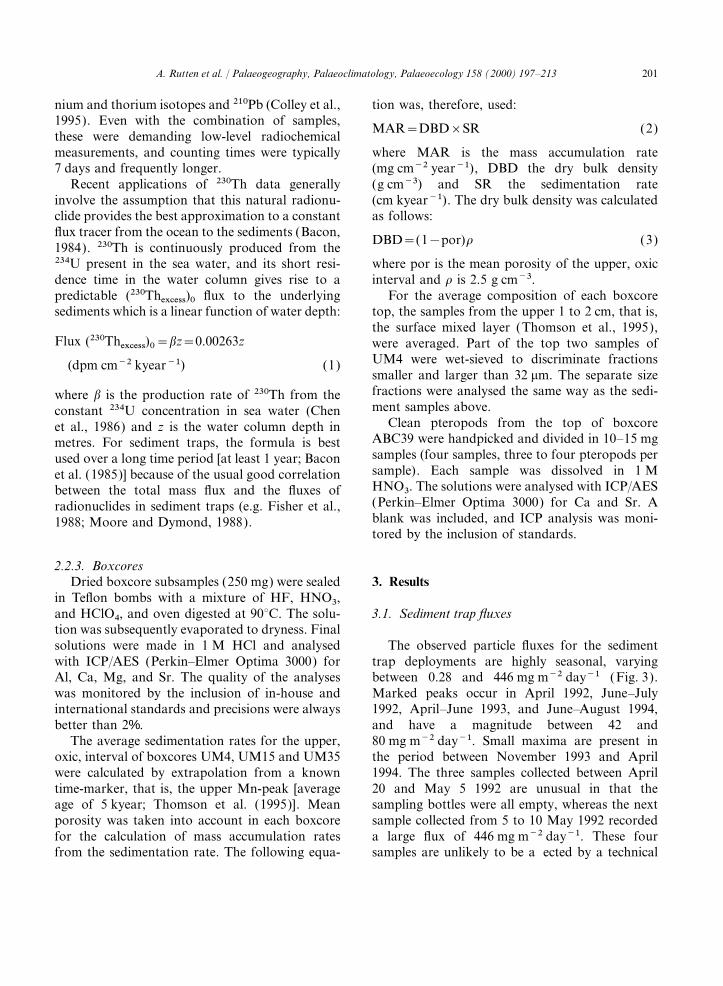
in Teflon bombs with a mixture of HF, HNO3,and HClO4, and oven digested at 90°C. The solu- 3.1. Sediment trap fluxestion was subsequently evaporated to dryness. Finalsolutions were made in 1 M HCl and analysed The observed particle fluxes for the sediment
trap deployments are highly seasonal, varyingwith ICP/AES (Perkin–Elmer Optima 3000) forAl, Ca, Mg, and Sr. The quality of the analyses between 0.28 and 446 mg m−2 day−1 (Fig. 3).
Marked peaks occur in April 1992, June–Julywas monitored by the inclusion of in-house andinternational standards and precisions were always 1992, April–June 1993, and June–August 1994,
and have a magnitude between 42 andbetter than 2%.The average sedimentation rates for the upper, 80 mg m−2 day−1. Small maxima are present in
the period between November 1993 and Apriloxic, interval of boxcores UM4, UM15 and UM35were calculated by extrapolation from a known 1994. The three samples collected between April
20 and May 5 1992 are unusual in that thetime-marker, that is, the upper Mn-peak [averageage of 5 kyear; Thomson et al. (1995)]. Mean sampling bottles were all empty, whereas the next
sample collected from 5 to 10 May 1992 recordedporosity was taken into account in each boxcorefor the calculation of mass accumulation rates a large flux of 446 mg m−2 day−1. These four
samples are unlikely to be affected by a technicalfrom the sedimentation rate. The following equa-
202 A. Rutten et al. / Palaeogeography, Palaeoclimatology, Palaeoecology 158 (2000) 197–213
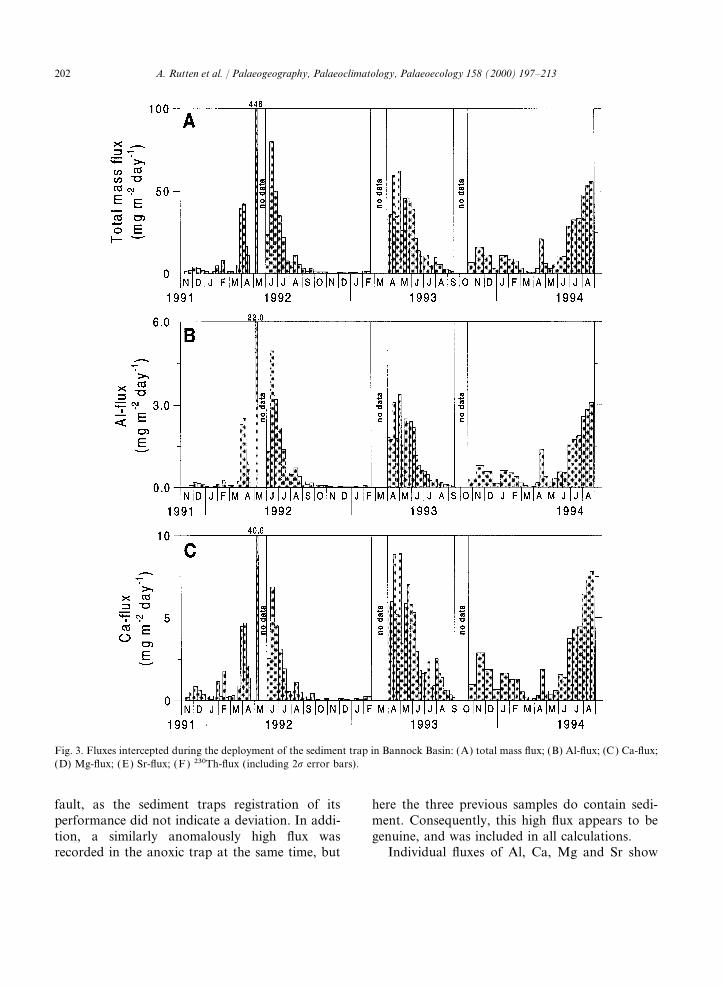
Fig. 3. Fluxes intercepted during the deployment of the sediment trap in Bannock Basin: (A) total mass flux; (B) Al-flux; (C) Ca-flux;(D) Mg-flux; (E) Sr-flux; (F) 230Th-flux (including 2s error bars).
fault, as the sediment traps registration of its here the three previous samples do contain sedi-ment. Consequently, this high flux appears to beperformance did not indicate a deviation. In addi-
tion, a similarly anomalously high flux was genuine, and was included in all calculations.Individual fluxes of Al, Ca, Mg and Sr showrecorded in the anoxic trap at the same time, but
203A. Rutten et al. / Palaeogeography, Palaeoclimatology, Palaeoecology 158 (2000) 197–213
Fig. 3. (continued).
the same trend as the total mass flux (Fig. 3). other. In particular, the 1993 flux maximum of Caand Sr is relatively high compared to those inHowever, there are subtle differences between bio-
genic elements such as Ca and Sr on the one hand 1992 and 1994, whereas it is relatively low forAl and Mg.and terrestrial elements like Al and Mg on the
204 A. Rutten et al. / Palaeogeography, Palaeoclimatology, Palaeoecology 158 (2000) 197–213
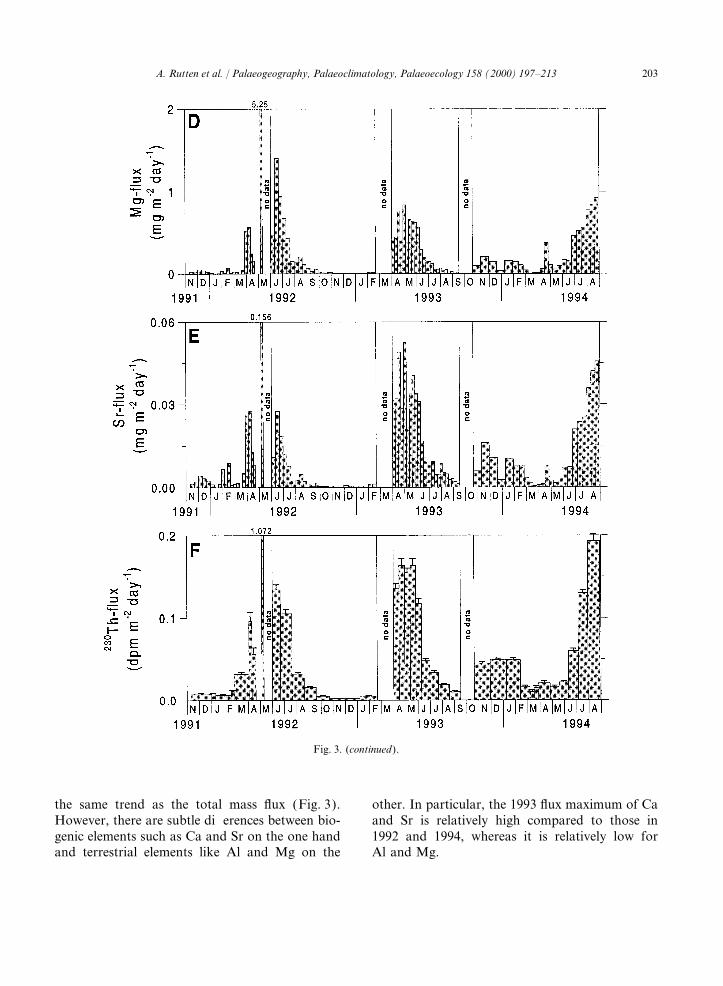
3.2. Thorium-230 notably low abundance. The major component ofthe mass flux in the sediment trap is lithogenicmaterial (60.4 wt%). This amount was estimatedThe flux of 230Th to the sediment trap is highly
seasonal (Fig. 3) and correlates linearly with the in two ways, namely from: (1) the constant ratioof lithogenic material to Al [Terr/Al=0.0885;total mass flux (Fig. 4; r2=0.94). The slope of the
regression line indicates an observed average 230 Rutten et al. (in prep.)]; and (2) the differencebetween ‘total mass’ and the biogenic componentsTh concentration of 3.13 dpm g−1 in the sediment
trap samples. The average measured mass flux (CaCO3 and organic matter). Both estimates givesimilar results.over the complete deployment of 34 months
is 15.9 mg m−2 day−1 (0.58 g cm−2 k year−1), giv-ing a mean measured 230Th flux of 3.4. Boxcores1.82 dpm cm−2 k year−1. The 230Th flux for a trapat 3000 m was calculated from Eq. (1) to be Average total mass fluxes calculated for oxic
boxcore tops (UM4, UM15 and UM35) corre-7.89 dpm cm−2 k year−1. The average sedimenttrap efficiency is, therefore, 23%. spond to 85–115 mg m−2 day−1 (Table 3). Fluxes
of Al and Ca vary between 3.56–5.40 and17.7–23.4 mg m−2 day−1, respectively. The Ca3.3. Composition of sediment trap samplescontent, mainly from CaCO3, is around 20 wt%,resulting in a carbonate content of ~50 wt%.The average carbonate content in the sediment
trap samples, calculated from total Ca, is 31.5 wt%. Aluminium concentrations are 4.2–4.7 wt% andare indicative of the lithogenic component.Biogenic carbonate is the main carbonate contri-
butor and mostly consists of coccolithophorids, The size fraction analysis of the topmost samplein oxic boxcore UM4 (0–0.5 cm) reveals distinc-calcareous dinoflagellates and juvenile foraminifers
(Ziveri et al., 1995, 2000). Pteropods and large tively different compositions for the two size classes(Table 4). The >32 mm fraction contains a highforaminifers, that is, the coarse fraction, have aamount of Ca (~ 31 wt%), low Al (~2 wt%) anda low Sr/Ca ratio (~3.2 mg g−1), whereas the<32 mm fraction is characterized by a Ca contentof ~15 wt%, high Al (~5.4 wt%) and high Sr/Caratios (~5.5 mg g−1). The sample immediatelybelow the topmost sample (0.5–1 cm) yielded sim-ilar results. The individual analysis of the Sr/Caratio of eastern Mediterranean pteropods yields aratio of 3.60±0.03 mg g−1.
4. Discussion
4.1. Seasonal variations recovered in the sedimenttrap samples
A profound seasonality is recorded in the sedi-ment trap samples recovered between November1991 and August 1994 (Fig. 3). Maximum fluxesoccur between April and July in 1992 and 1993,
Fig. 4. Total mass flux versus 230Th flux during the sedimentand between June and August (end of the recordingtrap deployment in Bannock Basin. The vertical error bars des-period) in 1994. The timing of the flux peaks,ignate the error due to counting statistics. The sample collected
between 5 and 10 May 1992 is not shown. therefore, differs per year, as do the flux maxima.
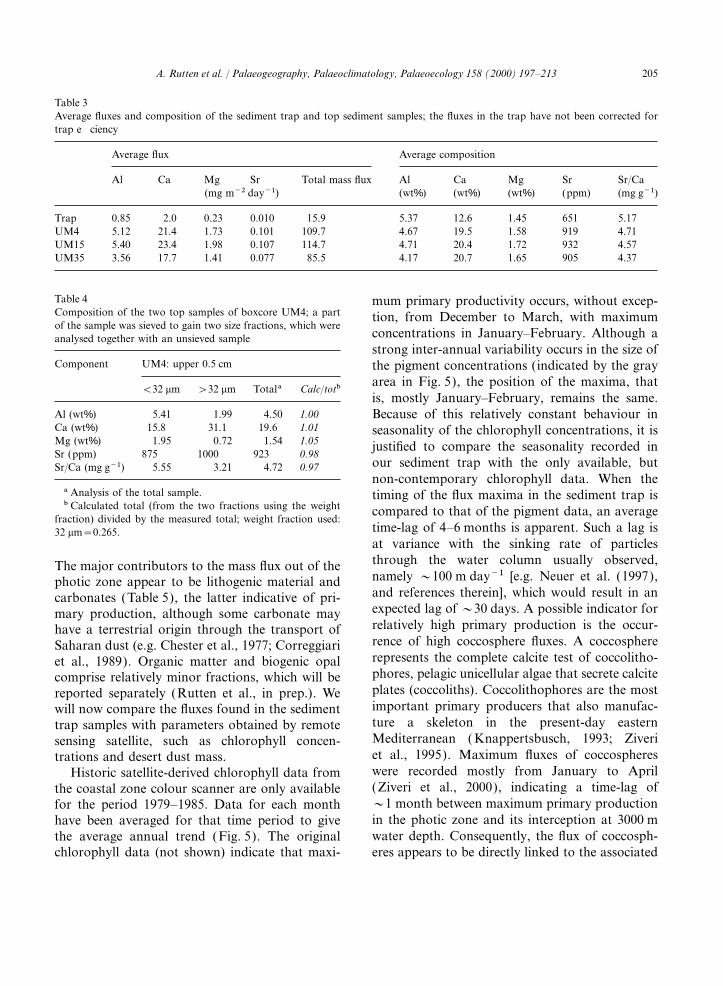
205A. Rutten et al. / Palaeogeography, Palaeoclimatology, Palaeoecology 158 (2000) 197–213
Table 3Average fluxes and composition of the sediment trap and top sediment samples; the fluxes in the trap have not been corrected fortrap efficiency
Average flux Average composition
Al Ca Mg Sr Total mass flux Al Ca Mg Sr Sr/Ca(mg m−2 day−1) (wt%) (wt%) (wt%) (ppm) (mg g−1)
Trap 0.85 2.0 0.23 0.010 15.9 5.37 12.6 1.45 651 5.17UM4 5.12 21.4 1.73 0.101 109.7 4.67 19.5 1.58 919 4.71UM15 5.40 23.4 1.98 0.107 114.7 4.71 20.4 1.72 932 4.57UM35 3.56 17.7 1.41 0.077 85.5 4.17 20.7 1.65 905 4.37
Table 4 mum primary productivity occurs, without excep-Composition of the two top samples of boxcore UM4; a part tion, from December to March, with maximumof the sample was sieved to gain two size fractions, which were
concentrations in January–February. Although aanalysed together with an unsieved samplestrong inter-annual variability occurs in the size of
Component UM4: upper 0.5 cm the pigment concentrations (indicated by the grayarea in Fig. 5), the position of the maxima, that
<32 mm >32 mm Totala Calc/totbis, mostly January–February, remains the same.
Al (wt%) 5.41 1.99 4.50 1.00 Because of this relatively constant behaviour inCa (wt%) 15.8 31.1 19.6 1.01 seasonality of the chlorophyll concentrations, it isMg (wt%) 1.95 0.72 1.54 1.05 justified to compare the seasonality recorded inSr (ppm) 875 1000 923 0.98
our sediment trap with the only available, butSr/Ca (mg g−1) 5.55 3.21 4.72 0.97non-contemporary chlorophyll data. When the
a Analysis of the total sample. timing of the flux maxima in the sediment trap isb Calculated total (from the two fractions using the weight compared to that of the pigment data, an average
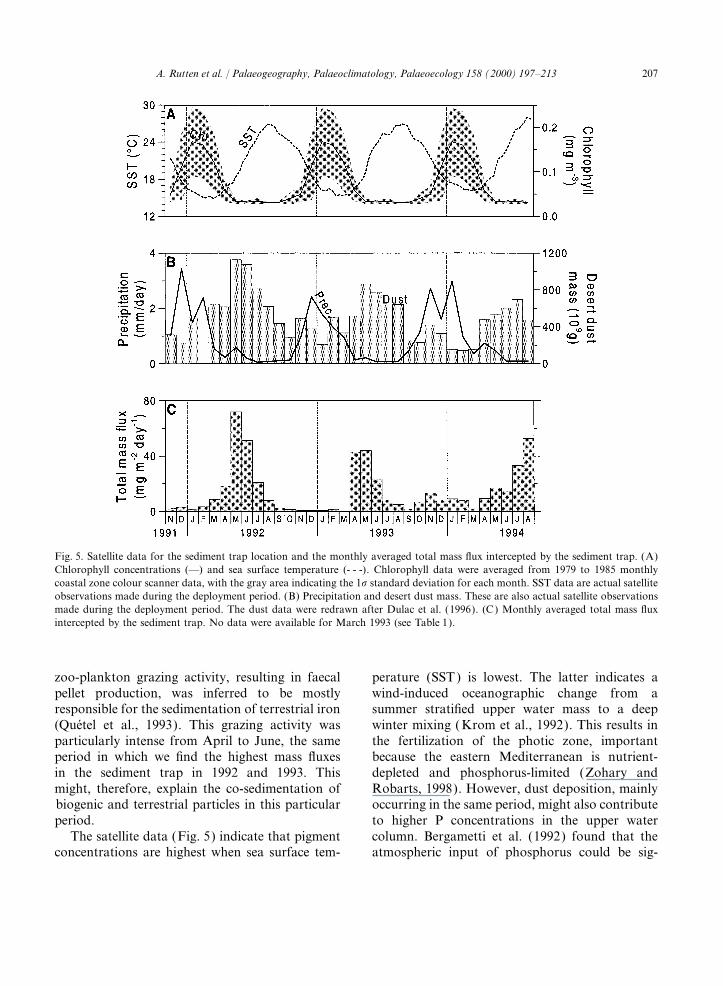
fraction) divided by the measured total; weight fraction used:time-lag of 4–6 months is apparent. Such a lag is32 mm=0.265.at variance with the sinking rate of particlesthrough the water column usually observed,The major contributors to the mass flux out of thenamely ~100 m day−1 [e.g. Neuer et al. (1997),photic zone appear to be lithogenic material andand references therein], which would result in ancarbonates (Table 5), the latter indicative of pri-expected lag of ~30 days. A possible indicator formary production, although some carbonate mayrelatively high primary production is the occur-have a terrestrial origin through the transport ofrence of high coccosphere fluxes. A coccosphereSaharan dust (e.g. Chester et al., 1977; Correggiarirepresents the complete calcite test of coccolitho-et al., 1989). Organic matter and biogenic opalphores, pelagic unicellular algae that secrete calcitecomprise relatively minor fractions, which will beplates (coccoliths). Coccolithophores are the mostreported separately (Rutten et al., in prep.). Weimportant primary producers that also manufac-will now compare the fluxes found in the sedimentture a skeleton in the present-day easterntrap samples with parameters obtained by remoteMediterranean (Knappertsbusch, 1993; Ziverisensing satellite, such as chlorophyll concen-et al., 1995). Maximum fluxes of coccospherestrations and desert dust mass.were recorded mostly from January to AprilHistoric satellite-derived chlorophyll data from(Ziveri et al., 2000), indicating a time-lag ofthe coastal zone colour scanner are only available~1 month between maximum primary productionfor the period 1979–1985. Data for each monthin the photic zone and its interception at 3000 mhave been averaged for that time period to givewater depth. Consequently, the flux of coccosph-the average annual trend (Fig. 5). The original
chlorophyll data (not shown) indicate that maxi- eres appears to be directly linked to the associated
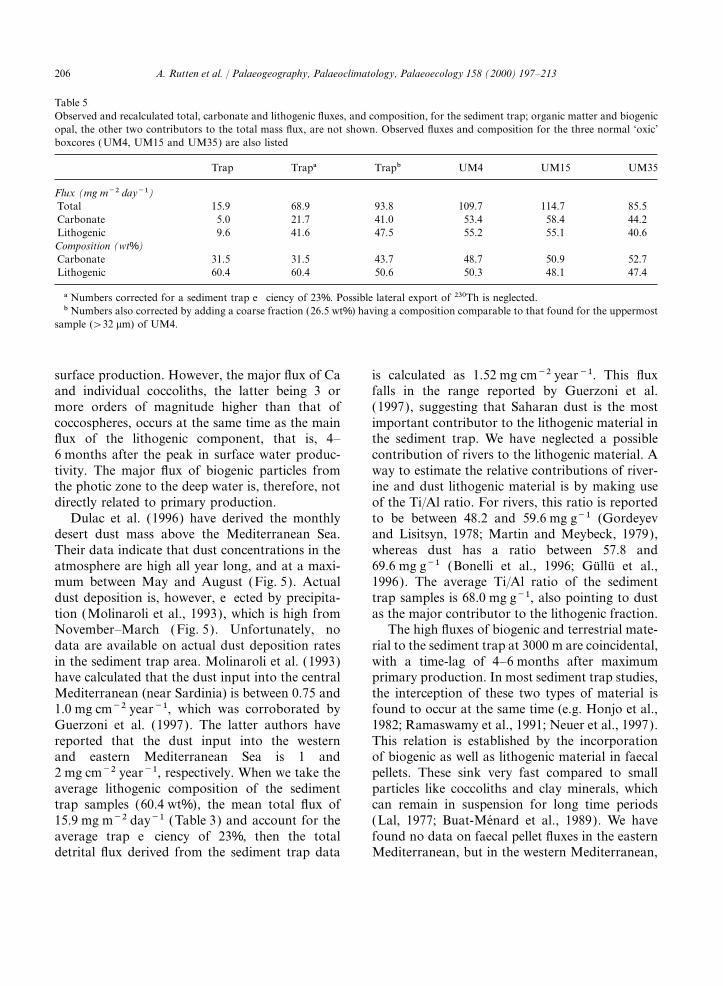
206 A. Rutten et al. / Palaeogeography, Palaeoclimatology, Palaeoecology 158 (2000) 197–213
Table 5Observed and recalculated total, carbonate and lithogenic fluxes, and composition, for the sediment trap; organic matter and biogenicopal, the other two contributors to the total mass flux, are not shown. Observed fluxes and composition for the three normal ‘oxic’boxcores (UM4, UM15 and UM35) are also listed
Trap Trapa Trapb UM4 UM15 UM35
Flux (mg m−2 day−1)Total 15.9 68.9 93.8 109.7 114.7 85.5Carbonate 5.0 21.7 41.0 53.4 58.4 44.2Lithogenic 9.6 41.6 47.5 55.2 55.1 40.6Composition (wt%)Carbonate 31.5 31.5 43.7 48.7 50.9 52.7Lithogenic 60.4 60.4 50.6 50.3 48.1 47.4
a Numbers corrected for a sediment trap efficiency of 23%. Possible lateral export of 230Th is neglected.b Numbers also corrected by adding a coarse fraction (26.5 wt%) having a composition comparable to that found for the uppermost
sample (>32 mm) of UM4.
surface production. However, the major flux of Ca is calculated as 1.52 mg cm−2 year−1. This fluxfalls in the range reported by Guerzoni et al.and individual coccoliths, the latter being 3 or
more orders of magnitude higher than that of (1997), suggesting that Saharan dust is the mostimportant contributor to the lithogenic material incoccospheres, occurs at the same time as the main
flux of the lithogenic component, that is, 4– the sediment trap. We have neglected a possiblecontribution of rivers to the lithogenic material. A6 months after the peak in surface water produc-
tivity. The major flux of biogenic particles from way to estimate the relative contributions of river-ine and dust lithogenic material is by making usethe photic zone to the deep water is, therefore, not
directly related to primary production. of the Ti/Al ratio. For rivers, this ratio is reportedto be between 48.2 and 59.6 mg g−1 (GordeyevDulac et al. (1996) have derived the monthly
desert dust mass above the Mediterranean Sea. and Lisitsyn, 1978; Martin and Meybeck, 1979),whereas dust has a ratio between 57.8 andTheir data indicate that dust concentrations in the
atmosphere are high all year long, and at a maxi- 69.6 mg g−1 (Bonelli et al., 1996; Gullu et al.,1996). The average Ti/Al ratio of the sedimentmum between May and August (Fig. 5). Actual
dust deposition is, however, effected by precipita- trap samples is 68.0 mg g−1, also pointing to dustas the major contributor to the lithogenic fraction.tion (Molinaroli et al., 1993), which is high from
November–March (Fig. 5). Unfortunately, no The high fluxes of biogenic and terrestrial mate-rial to the sediment trap at 3000 m are coincidental,data are available on actual dust deposition rates
in the sediment trap area. Molinaroli et al. (1993) with a time-lag of 4–6 months after maximumprimary production. In most sediment trap studies,have calculated that the dust input into the central
Mediterranean (near Sardinia) is between 0.75 and the interception of these two types of material isfound to occur at the same time (e.g. Honjo et al.,1.0 mg cm−2 year−1, which was corroborated by
Guerzoni et al. (1997). The latter authors have 1982; Ramaswamy et al., 1991; Neuer et al., 1997).This relation is established by the incorporationreported that the dust input into the western
and eastern Mediterranean Sea is 1 and of biogenic as well as lithogenic material in faecalpellets. These sink very fast compared to small2 mg cm−2 year−1, respectively. When we take the
average lithogenic composition of the sediment particles like coccoliths and clay minerals, whichcan remain in suspension for long time periodstrap samples (60.4 wt%), the mean total flux of
15.9 mg m−2 day−1 (Table 3) and account for the (Lal, 1977; Buat-Menard et al., 1989). We havefound no data on faecal pellet fluxes in the easternaverage trap efficiency of 23%, then the total
detrital flux derived from the sediment trap data Mediterranean, but in the western Mediterranean,
207A. Rutten et al. / Palaeogeography, Palaeoclimatology, Palaeoecology 158 (2000) 197–213
Fig. 5. Satellite data for the sediment trap location and the monthly averaged total mass flux intercepted by the sediment trap. (A)Chlorophyll concentrations (—) and sea surface temperature (- - -). Chlorophyll data were averaged from 1979 to 1985 monthlycoastal zone colour scanner data, with the gray area indicating the 1s standard deviation for each month. SST data are actual satelliteobservations made during the deployment period. (B) Precipitation and desert dust mass. These are also actual satellite observationsmade during the deployment period. The dust data were redrawn after Dulac et al. (1996). (C) Monthly averaged total mass fluxintercepted by the sediment trap. No data were available for March 1993 (see Table 1).
zoo-plankton grazing activity, resulting in faecal perature (SST) is lowest. The latter indicates awind-induced oceanographic change from apellet production, was inferred to be mostly
responsible for the sedimentation of terrestrial iron summer stratified upper water mass to a deepwinter mixing (Krom et al., 1992). This results in(Quetel et al., 1993). This grazing activity was
particularly intense from April to June, the same the fertilization of the photic zone, importantbecause the eastern Mediterranean is nutrient-period in which we find the highest mass fluxes
in the sediment trap in 1992 and 1993. This depleted and phosphorus-limited (Zohary andRobarts, 1998). However, dust deposition, mainlymight, therefore, explain the co-sedimentation of
biogenic and terrestrial particles in this particular occurring in the same period, might also contributeto higher P concentrations in the upper waterperiod.
The satellite data (Fig. 5) indicate that pigment column. Bergametti et al. (1992) found that theatmospheric input of phosphorus could be sig-concentrations are highest when sea surface tem-
208 A. Rutten et al. / Palaeogeography, Palaeoclimatology, Palaeoecology 158 (2000) 197–213
nificant to northwestern Mediterranean surface However, the current meter data from the third(MU-B; Table 1) series indicate low velocities,waters, especially in summer.mostly below the detection limit of 1 cm s−1.Speeds were never higher than 7 cm s−1. In addi-4.2. Comparison between trap and sedimenttion, the tilt meter mounted on the sediment trapindicates no deviations from the vertical during4.2.1. Efficiency of the sediment trap
To compare fluxes recorded in a sediment trap the sampling period. Consequently, hydrodynamicbiases were negligible for the particle flux datawith those of surface sediments, it has to be
established first whether the flux is efficiently (Baker et al., 1988; Gust et al., 1992).Overviewing these three influencing factors, wetrapped. A widely used method is that by applying
230Th (see Section 2). The calculated value of 23% believe that only boundary scavenging, if similarto the open ocean, may explain part of the lowis extremely low when compared to other sediment
trap studies (Anderson et al., 1983a; Bacon et al., trapping efficiency as calculated by the 230Thmethod. Because we cannot quantify this process1985; Fisher et al., 1988; Colley et al., 1995). The
low efficiency may be the result of three phen- on the basis of 230Th trap data alone, we willcompare fluxes between the sediment trap and topomena, namely (1) boundary scavenging; (2) a
water column with unusually low U concen- sediment in Section 4.2.2.trations; and (3) high current velocities.
Boundary scavenging, that is, lateral export of 4.2.2. Comparison of fluxes and compositionObviously, average mass fluxes are much lower230Th away from the water column above the
sediment trap, has not been accounted for in the in the sediment trap samples than in surface sedi-ments (Table 3). We will compare the fluxes in themodel calculation. Comparison of 230Th and
231Pa inventories in pelagic as well as near-coastal sediment trap with those found in boxcores UM4,UM15 and UM35. These boxcores are not in thetraps and sediments has shown that a net export
of these radionuclides out of the pelagic realm to immediate vicinity of the sediment trap location.However, a gravity core taken in Bannock Basin,the ocean boundaries must occur (e.g. Kadko,
1980; Anderson et al., 1983a,b). Because of the containing oxic top sediments and sapropel S1(GC17; Van Os et al., 1991), has a sedimentpelagic location of our sediment trap, this might
also happen at the Bannock site. However, to the composition and an accumulation rate comparableto that in UM35. Therefore, a comparison betweenbest of our knowledge, no 231Pa data for eastern
Mediterranean sediments have yet been published. the oxic boxcores and the sediment trap is justified.We will mainly concentrate on the fluxes in UM35Therefore, no quantification of this boundary scav-
enging effect can be made. Kadko (1980) found because of the similar accumulation rate comparedto sediments near the trap location.an average of 30% deficit of 230Thexcess in deep
open ocean sediments. This value can, therefore, The Al flux in the sediment trap is ~4 timeslower than it is in UM35 (0.85 versusnot fully explain the observed deficit of 77% in
our sediment trap samples (see also Section 4.2.2). 3.56 mg m−2 day−1), which is close to the esti-mated trap efficiency of 23%. This similarity indi-A much lower concentration of 234U in the
Mediterranean water column relative to the open cates that boundary scavenging of 230Th is notsignificant and that the estimated trap efficiency isocean might also result in lower 230Th fluxes to
the sediment trap. This, however, is ruled out by reliable. Because current velocities are low and tiltmeter data show no offset from the vertical, wethe long residence time and stability of dissolved
U in sea water. Furthermore, the actual think that the low sediment trap efficiency cannotbe caused by either hydrodynamic bias or bound-U-concentration is even slightly higher than
average sea water just above the Bannock brine ary scavenging of 230Th. A possible alternate expla-nation which may be significant for these low massinterface (Van der Weijden et al., 1990).
The occurrence of high current velocities would fluxes, is the sticking of settling particles to theinner cone of the trap.seriously hamper the collection of particles.
209A. Rutten et al. / Palaeogeography, Palaeoclimatology, Palaeoecology 158 (2000) 197–213
The fluxes of Ca, Mg and Sr in the sediment the fine surface sediment fraction (5.5 mg g−1)(compare Tables 3 and 4). All evidence giventrap are relatively even lower when compared to
the surface sediment samples. For Ca, this factor above, therefore, is consistent with the scarcity ofthe coarse carbonate fraction in the sediment trapis ~9, for Mg ~6, and for Sr ~8. In the eastern
Mediterranean Sea, Ca and Sr reside almost exclu- samples. At this moment, however, it is not clearwhy this fraction is absent in the trap.sively in the carbonate fraction, whereas Mg is
found in both clay minerals (i.e. the lithogenic Hydrodynamic bias in trapping, if at all present,would be expected to lead to a greater loss offraction) and carbonates (Rutten and De Lange,
in prep.). Al is indicative for clay minerals. The smaller particles rather than larger ones.Dissolution can also be ruled out; coccoliths, evenmagnitude of the flux and the correlation of Al
with other terrestrial elements (K, Ti) must domi- delicate forms, are well preserved (Ziveri et al.,2000), and the Ca concentration of the supernatantnate any biogenic scavenging of Al as found by
Murray and Leinen (1996) in the central equatorial water in sediment trap sampling bottles is similarto the sea water value. The observed deviationPacific Ocean. Consequently, variations in Al
content cannot be related to variations in biogenic might arise from the distribution of the coarse sizefraction of biogenic carbonate through time. Asscavenging but rather to changes in terrestrial
input alone. It appears, therefore, that the carbon- juvenile foraminifers are always present in the trapsamples, the distribution of the large foraminifersate component of the total flux is relatively more
undertrapped than the terrestrial one. From the and pteropods could be highly variable in timeand in place. The resulting magnitude of fluxes atfaunal and floral analysis of the sediment trap
samples, it is clear that the large biogenic carbonate one site may, therefore, have varied over the courseof time. A bloom associated with a major hydrody-particles, that is, pteropods and large foraminifers,
are rare (Ziveri et al., 2000), whereas they are namic or atmospheric event, and occurring, forexample, once every 10 years has a large prob-common in surface sediments of the eastern
Mediterranean. To investigate this geochemically, ability of not being trapped during a 3 year deploy-ment. An example of such a phenomenon wastwo different fractions of surface sediment from
UM4, namely one (<32 mm) containing the small reported at the Cap Blanc sediment trap site, offthe coast of Northwest Africa ( Wefer and Fischer,biogenic fraction (e.g. coccoliths, calcareous dino-
cysts, juvenile foraminifers) and the other 1993). In a single sampling interval of 17 days,out of 3 years, an extremely high flux was recorded(>32 mm) including large biogenic particles (fora-
minifers and pteropods), were analysed. The in the >1 mm size fraction. This fraction con-tained a monospecific assemblage of pteropodsresults indicate that the fine fraction contains only
half as much Ca (16 wt%) as the large fraction ( Kalberer et al., 1993). Another example is asediment trap study conducted during >19 years(30%; Table 4). The Sr/Ca values in the fine frac-
tion are distinctly higher than they are in the in the deep Sargasso Sea, which exhibited anepisodic occurrence of large, short-lived fluxcoarse fraction. Although higher Sr/Ca values are
often interpreted to be due to enhanced pteropod maxima that are not associated with the annualspring bloom in that area and do not necessarilycontents (Winland, 1969; Sutherland et al., 1984),
Krinsley and Bieri (1959) observed a relatively occur every year (Conte et al., 1998). A phenome-non, similar to the ones at Cap Blanc or in thelow average Sr/Ca of 2.5 mg g−1 for eastern
Mediterranean pteropods from plankton tows as Sargasso Sea, and possibly related to NorthAtlantic Oscillation (NAO), might occur in thewell as surface sediment. We have also analysed
pteropods from the top of a nearby boxcore, and usually low-productive eastern Mediterranean.Moulin et al. (1997) have shown that atmospherichave found a Sr/Ca ratio of 3.60±0.03 mg g−1.
The latter Sr/Ca ratio is comparable to the one export of Saharan dust to the Mediterranean andNorth Atlantic Ocean is controlled by NAO.found in our coarse sediment fraction. In contrast,
the sediment trap samples have a much higher Clearly, long time series sediment trap sampling isneeded so as to fully understand the dynamics ofSr/Ca ratio, namely 5.2 mg g−1, close to that of
210 A. Rutten et al. / Palaeogeography, Palaeoclimatology, Palaeoecology 158 (2000) 197–213
seasonal and annual variations in the eastern and clay minerals, comprising most of the biogenicand lithogenic material respectively, can remain inMediterranean biogeochemical fluxes.
We will now evaluate if an additional (coarse) suspension for a long time, they are scavengedand quickly transported by faecal pellets.fraction in the sediment trap samples might explain
the difference between sediment trap and surface Quantification of the lithogenic flux indicates thatdesert dust is likely to be the major component ofsediments. When such a coarse fraction, containing
31.1 wt% Ca (i.e. 77.7 wt% CaCO3) and having a the detrital matter. The Th-230 based trap effi-ciency is low (23%), but is substantiated by theweight fraction of 0.265 [as found in the uppermost
sample of UM4 (Table 4)], is added to the average four times lower Al flux of samples in the sedimenttrap compared to those in boxcore top sediments.sediment in the trap, the CaCO3 content would
rise to 43.7 wt%, much closer to the concentrations Boundary scavenging of 230Th, the most commonfactor determining the trapping efficiency of 230Thfound in the oxic boxcores (Table 5). The
CaCO3 flux would, when including the trap effi- is, therefore, unlikely to be the major cause forthe low trap efficiency. In addition, hydrodynamicciency correction, increase to 41.0 mg m−2 day−1.
This flux is still lower than that found in the oxic bias can be excluded. Alternatively, sticking ofsettling particles to the inner cone of the sedimentboxcore tops, although close to the Ca-flux in
UM35 (Table 5), possibly reflecting subtle differ- trap might have significant influence on the lowmass flux, and, consequently, may have caused theences in the primary production in the photic zone,
hence export production, at the different locations low trapping efficiency. The relative recovery ofcarbonate in samples from the trap compared to(e.g. sediment trap site versus UM35 or
UM4/UM15 site). those in the sediment is even lower (1/9). The nearabsence of the coarse carbonate fraction consistingWe have related the lithogenic flux in the trap
to the input of Saharan dust. For UM35, the of large foraminifers and pteropods in the trapsamples, compared to their abundant occurrencelithogenic flux is 1.48 mg cm−2 year−1, and for
UM4 and UM15 2.01 mg cm−2 year−1. These in top sediment samples, may account for most ofthis deficiency. Episodically occurring majorvalues are in the same range as those reported by
Guerzoni et al. (1997), discussed earlier. Therefore, blooms may have resulted in brief intervals ofmajor coarse carbonate ( large foraminifers andthe sediment trap and boxcore samples are both
consistent with the notion that Saharan dust input pteropods) fluxes that have not been recordedduring the time period of our sediment samplingis the major source for lithogenic matter in this
region at present. (i.e. from November 1991 to August 1994) andare possibly related to NAO. Clearly, long timeseries sediment trap observations are needed forthis area that is sensitive for recording subtle5. Conclusionsglobal climatic variations, so as to fully understandthe dynamics of seasonal and annual variations.The total flux of suspended material out of the
photic zone to the deep water is low and highlyseasonal in the pelagic eastern Mediterranean. Thecoccosphere-indicated primary productivity maxi- Acknowledgementsmum reaches the trap ca. 1 month after the satel-lite-inferred chlorophyll maximum. However, the G. Nobbe and H. de Waard are thanked for
their analytical assistence. The pigment data aremajor sediment flux, containing a lithogenic aswell as a biogenic fraction (the latter comprised courtesy of the Joint Research Centre (European
Commission/European Space Agency). The SSTmainly of coccoliths), does not coincide with thecoccosphere flux, but rather is recorded 4– data were extracted from the Weekly NCEP SST
Database at the NOAA/WRC Server Ferret and6 months later, probably due to intense zoo-plank-ton grazing, resulting in high faecal pellet pro- the precipitation data from the GPCP Global
Combined Precipitation Dataset (part of theduction, from April to June. Because coccoliths
211A. Rutten et al. / Palaeogeography, Palaeoclimatology, Palaeoecology 158 (2000) 197–213
232Th and 210Pb fluxes recorded by the 1989/90 BOFS sedi-Climatology Interdisciplinary Data Collection).ment trap time-series at 48°N, 20°W. Deep-Sea Res. I 42,This paper greatly benefited from the comments833–848.of two anonymous reviewers. This study was Conte, M.H., Weber, J.C., Ralph, N., 1998. Episodic particle
supported by MARFLUX (MAST1-90022C), flux in the deep Sargasso Sea: an organic geochemical assess-PALAEOFLUX (MAS2-CT93-0051) and SAP ment. Deep-Sea Res. I 45, 1819–1841.
Correggiari, A., Guerzoni, S., Lenaz, R., Quarantotto, G.,(MAS3-CT97-0137) European programmes. ThisRampazzo, G., 1989. Dust deposition in the central Mediter-is The Netherlands Sedimentary Research Schoolranean (Tyrrhenian and Adriatic Seas): relationships with(NSG) contribution No. 990402.marine sediments and riverine input. Terra Nova 1, 549–558.
Dominik, J., Stoffers, P., 1979. The influence of Late Quater-nary stagnations on clay sedimentation in the eastern Medi-terranean Sea. Geol. Rundsch. 68, 302–317.References
Dulac, F., Moulin, C., Lambert, C.E., Guillard, F., Poitou, J.,Guelle, W., Quetel, C.R., Schneider, X., Ezat, U., 1996.
Anderson, R.F., Bacon, M.P., Brewer, P.G., 1983a. RemovalQuantitative remote sensing of African dust transport to theof 230Th and 231Pa from the open ocean. Earth Planet. Sci.Mediterranean. In: Guerzoni, S., Chester, R. (Eds.), TheLett. 62, 7–23.Impact of Desert Dust across the Mediterranean, Environm.Anderson, R.F., Bacon, M.P., Brewer, P.G., 1983b. RemovalSci. Technol. Libr. 11, 25–49.of 230Th and 231Pa at ocean margins. Earth Planet. Sci. Lett.
Fisher, N.S., Cochran, J.K., Krishnaswami, S., Livingstone,66, 73–90.H.D., 1988. Predicting the oceanic flux of radionuclides onBacon, M.P., 1984. Glacial to interglacial changes in carbonatesinking biogenic debris. Nature 335, 622–625.and clay sedimentation in the Atlantic Ocean estimated
Gordeyev, V.V., Lisitsyn, A.P., 1978. The average chemicalfrom 230Th measurements. Isotope Geosci. 2, 97–111.composition of suspensions in the world’s rivers and theBacon, M.P., Huh, C.A., Fleer, A.P., Deuser, W.G., 1985. Sea-supply of sediments to the ocean by streams. Doklady, Earthsonality in the flux of natural radionuclides and plutoniumSci. Section 238, 150–153.in the deep Sargasso Sea. Deep-Sea Res. 32, 273–286.
Guerzoni, S., Molinaroli, E., Chester, R., 1997. Saharan dustBaker, E.T., Milburn, H.B., Tennant, D.A., 1988. Field assess-inputs to the western Mediterranean Sea: depositional pat-ment of sediment trap efficiency under varying flow condi-terns, geochemistry and sedimentological implications.tions. J. Mar. Res. 46, 573–592.Deep-Sea Res. II 44, 631–654.Bergametti, G., Remoudaki, E., Losno, R., Steiner, E., Cha-
Gullu, G.H., Olmez, I., Tuncel, G., 1996. Chemical concen-tenet, B., Buat-Menard, P., 1992. Source, transport andtrations and elements size distributions of aerosols in thedeposition of atmospheric phosphorus over the northwest-eastern Mediterranean during strong dust storms. In:ern Mediterranean. J. Atm. Chem. 14, 501–513.Guerzoni, S., Chester, R. (Eds.), The Impact of DesertBonelli, P., Braga Marcazzan, G.M., Cereda, E., 1996. Elemen-Dust across the Mediterranean, Environm. Sci. Technol.tal composition and air trajectories of African dust trans-Libr. 11, 339–347.ported in northern Italy. In: Guerzoni, S., Chester, R.
Gust, G., Byrne, R.H., Bernstein, R.E., Betzer, P.R., Bowles,(Eds.), The Impact of Desert Dust across the Mediterra-W., 1992. Particle fluxes and moving fluids: experience fromnean, Environm. Sci. Technol. Libr. 11, 275–283.synchronous trap collections in the Sargasso Sea. Deep-SeaBuat-Menard, P., Davies, J., Remoudaki, E., Miquel, J.C., Ber-Res. 39, 1071–1083.gametti, G., Lambert, C.E., Ezat, U., Quetel, C., La Rosa,
Hilgen, F.J., 1991. Astronomical calibration of Gauss to Matu-J., Fowler, S.W., 1989. Non-steady-state biological removalyama sapropels in the Mediterranean and implication forof atmospheric particles from Mediterranean surface waters.the geomagnetic polarity time scale. Earth Planet. Sci. Lett.Nature 340, 131–134.104, 226–244.Calvert, S.E., 1983. Geochemistry of Pleistocene sapropels and
Honjo, S., Manganini, S.J., Cole, J.J., 1982. Sedimentation ofassociated sediments from the Eastern Mediterranean.biogenic matter in the deep ocean. Deep-Sea Res. 29,Oceanol. Acta 6, 255–267.609–625.Chen, J.H., Edwards, P.L., Wasserburg, G.J., 1986. 238U, 234U
Kadko, D., 1980. 230Th, 226Ra and 222Rn in abyssal sediments.and 232Th in seawater. Earth Planet. Sci. Lett. 80, 241–251.Earth Planet. Sci. Lett. 49, 360–380.Chester, R., Baxter, G.G., Behairy, A.K.A., Connor, K., Cross,
Kalberer, M., Fischer, G., Patzold, J., Donner, B., Segl, M.,D., Eldersfield, H., Padgham, R.C., 1977. Soil-sized eolianWefer, G., 1993. Seasonal sedimentation and stable isotopedusts from the lower troposphere of the eastern Mediterra-records of pteropods off Cap Blanc. Mar. Geol. 113,nean Sea. Mar. Geol. 24, 201–217.305–320.Cita, M.B., Vergnaud-Grazzini, C., Robert, C., Chamley, H.,
Khripounoff, A., Crassous, P., 1994. Particulate material degra-Ciaranfi, N., d’Onofrio, S., 1977. Paleoclimatic record of adation in sediment traps at 2000 m depth on the Meriadzecklong deep sea core from the eastern Mediterranean. Quatern.Terrace (Bay of Biscay). Deep-Sea Res. I 41, 821–829.Res. 8, 205–235.
Colley, S., Thomson, J., Newton, P.P., 1995. Detailed 230Th, Kidd, R.B., Cita, M.B., Ryan, W.B.F., 1978. Stratigraphy of
212 A. Rutten et al. / Palaeogeography, Palaeoclimatology, Palaeoecology 158 (2000) 197–213
Eastern Mediterranean sapropel sequences recovered during iron flux and distribution in northwestern Mediterraneanwaters. Deep-Sea Res. I 40, 989–1002.DSDP Leg 42A and their paleoenvironmental significance.
In: Hsu, K.J., Montadert, L., et al., (Eds.), Initial Reports Ramaswamy, V., Nair, R.R., Manganini, S., Haake, B., Ittek-kot, V., 1991. Lithogenic fluxes to the deep Arabian Seaof the Deep-Sea Drilling Project vol. 42. US Govt Printing
Office, Washington, DC, pp. 421–443. measured by sediment traps. Deep-Sea Res. 38, 169–184.Rohling, E.J., 1994. Review and new aspects concerning theKnappertsbusch, M., 1993. Geographic distribution of living
and Holocene coccolithophores in the Mediterranean Sea. formation of eastern Mediterranean sapropels. Mar. Geol.122, 1–28.Mar. Micropaleontol. 21, 219–247.
Krinsley, D., Bieri, R., 1959. Changes in the chemical composi- Rossignol-Strick, M., 1985. Mediterranean Quaternary sapro-pels, an immediate response of the African monsoon to vari-tion of pteropod shells after deposition on the sea floor.
J. Paleontol. 33, 682–684. ation of insolation. Palaeogeogr. Palaeoclimatol.Palaeoecol. 49, 237–263.Krom, M.D., Brenner, N.K., Neori, A., Gordon, L.I., 1992.
Nutrient dynamics and new production in a warm-core eddy Sigl, W., Chamley, H., Fabricius, F., Giroud d’Argoud, G.,Muller, J., 1978. Sedimentology and environmental condi-from the Eastern Mediterranean Sea. Deep-Sea Res. 39,
467–480. tions of sapropels. In: Hsu, K.J., Montadert, L., et al.,(Eds.), Initial Reports of the Deep-Sea Drilling ProjectLal, D., 1977. The oceanic microcosm of particles. Science
198, 997–1009. vol. 42. US Govt Printing Office, Washington, DC,pp. 445–465.Lourens, L.J., 1994. Astronomical forcing of Mediterranean
climate during the last 5.3 million years. Thesis Utrecht Sutherland, H.E., Calvert, S.E., Morris, R.J., 1984. Geochemi-cal studies of the recent sapropel and associated sedimentUniversity.
Martin, J.-M., Meybeck, M., 1979. Elemental mass-balance of from the Hellenic Outer Ridge, eastern Mediterranean Sea.I: Mineralogy and chemical composition. Mar. Geol. 56,material carried by major world rivers. Mar. Chem. 7,
173–206. 79–92.Tennant, D.A., Baker, E.T., 1992. A fast high-precision splitterMolinaroli, E., Guerzoni, S., Rampazzo, G., 1993. Contribu-
tion of Saharan dust to the central Mediterranean Basin. for particle suspensions. Mar. Geol. 108, 247–252.Thomson, J., Higgs, N.C., Wilson, T.R.S., Croudace, I.W., DeGeol. Soc. Am. Spec. Paper 284, 303–312.
Moore, W.S., Dymond, J., 1988. Correlation of 210Pb removal Lange, G.J., Van Santvoort, P.J.M., 1995. Redistributionand geochemical behaviour of redox-sensitive elementswith organic carbon fluxes in the Pacific Ocean. Nature
331, 339–341. around S1, the most recent eastern Mediterranean sapropel.Geochim. Cosmochim. Acta 59, 3487–3501.Moulin, C., Lambert, C.E., Dulac, F., Dayan, U., 1997. Control
of atmospheric export of dust from North Africa by the Thunell, R.C., Williams, D.F., Kennett, J.P., 1977. Late Quater-nary paleoclimatology, stratigraphy and sapropel history inNorth Atlantic Oscillation. Nature 387, 691–694.
Murray, R.W., Leinen, M., 1996. Scavenged excess aluminum Eastern Mediterranean deep-sea sediments. Mar. Micro-paleontol. 2, 371–388.and its relationship to bulk titanium in biogenic sediments
from the central equatorial Pacific Ocean. Geochim. Cos- Van der Weijden, C.H., Middelburg, J.J., De Lange, G.J., Vander Sloot, H.A., Hoede, D., Woittiez, J.R.W., 1990. Profilesmochim. Acta 60, 3869–3878.
Neuer, S., Ratmeyer, V., Davenport, R., Fischer, G., Wefer, of the redox-sensitive trace elements As, Sb, V, Mo and Uin the Tyro and Bannock Basins (eastern Mediterranean).G., 1997. Deep water particle flux in the Canary Island
region: seasonal trends in relation to long-term satellite Mar. Chem. 31, 171–186.Van Os, B.J.H., Middelburg, J.J., De Lange, G.J., 1991. Pos-derived pigment data and lateral source. Deep-Sea Res. I
44, 1451–1466. sible diagenetic mobilization of barium in sapropelic sedi-ment from the eastern Mediterranean. Mar. Geol. 100,Nijenhuis, I.A., Schenau, S.J., Van der Weijden, C.H., Hilgen,
F.J., Lourens, L.J., Zachariasse, W.J., 1996. On the origin 125–136.Van Os, B.J.H., Lourens, L.J., Hilgen, F.J., De Lange, G.J.,of upper Miocene sapropelites: a case study from the Faner-
omeni section, Crete (Greece). Paleoceanography 11, Beaufort, L., 1994. The formation of Pliocene sapropels andcarbonate cycles in the Mediterranean: diagenesis dilution633–645.
Peterson, M.L., Hernes, P.J., Thoreson, D.S., Hedges, J.I., Lee, and productivity. Paleoceanography 9, 601–617.Van Santvoort, P.J.M., De Lange, G.J., Thomson, J., Cussen,C., Wakeham, S.G., 1993. Field evaluation of a valved sedi-
ment trap. Limnol. Oceanogr. 38, 1741–1761. H., Wilson, T.R.S., Krom, M.D., Strohle, K., 1996. Activepost-depositional oxidation of the most recent sapropel (S1)Pruysers, P.A., De Lange, G.J., Middelburg, J.J., 1991. Geo-
chemistry of eastern Mediterranean sediments: Primary sed- in sediments of the eastern Mediterranean Sea. Geochim.Cosmochim. Acta 60, 4007–4024.iment composition and diagenetic alteration. Mar. Geol.
100, 137–154. Wefer, G., Fischer, G., 1993. Seasonal patterns of vertical par-ticle flux in equatorial and coastal upwelling areas of theQuetel, C.R., Remoudaki, E., Davies, J.E., Miquel, J.-C.,
Fowler, S.W., Lambert, C.E., Bergametti, G., Buat-Menard, eastern Atlantic. Deep-Sea Res. I 40, 1613–1645.Winland, H.D., 1969. Stability of calcium carbonate poly-P., 1993. Impact of atmospheric deposition on particulate

213A. Rutten et al. / Palaeogeography, Palaeoclimatology, Palaeoecology 158 (2000) 197–213
morphs in warm shallow seawater. J. Sediment. Petrol. 39, C., 2000. Present-day coccolith fluxes recorded in centraleastern Mediterranean sediment traps and surficial sedi-1579–1587.
Ziveri, P., Grandi, C., Stefanetti, A., 1995. Biogenic fluxes in ments. Palaeogeogr. Palaeoclimatol. Palaeoecol. 158,175–195 (this issue).Bannock Basin: first results from a sediment trap study
(November 1991–May 1992). Rend. Fis. Acc. Lincei s 6 Zohary, T., Robarts, R.D., 1998. Experimental study of micro-bial P limitation in the eastern Mediterranean. Limnol.(9), 131–145.
Ziveri, P., Rutten, A., De Lange, G.J., Thomson, J., Corselli, Oceanogr. 43, 387–395.