recent la plata basin drought conditions observed by satellite gravimetry
TRANSCRIPT

Recent La Plata basin drought conditions observedby satellite gravimetry
J. L. Chen,1 C. R. Wilson,1,2 B. D. Tapley,1 L. Longuevergne,2,3 Z. L. Yang,2
and B. R. Scanlon3
Received 28 June 2010; revised 10 August 2010; accepted 17 August 2010; published 18 November 2010.
[1] The Gravity Recovery and Climate Experiment (GRACE) provides quantitativemeasures of terrestrial water storage (TWS) change. GRACE data show a significantdecrease in TWS in the lower (southern) La Plata river basin of South America over theperiod 2002–2009, consistent with recognized drought conditions in the region. GRACEdata reveal a detailed picture of temporal and spatial evolution of this severe drought event,which suggests that the drought began in lower La Plata in around austral spring 2008 andthen spread to the entire La Plata basin and peaked in austral fall 2009. During the peak,GRACE data show an average TWS deficit of ∼12 cm (equivalent water layer thickness)below the 7 year mean, in a broad region in lower La Plata. GRACE measurements areconsistent with accumulated precipitation data from satellite remote sensing and withvegetation index changes derived from Terra satellite observations. The Global Land DataAssimilation System model captures the drought event but underestimates its intensity.Limited available groundwater‐level data in southern La Plata show significant groundwaterdepletion, which is likely associated with the drought in this region. GRACE‐observed TWSchange and precipitation anomalies in the studied region appear to closely correlate withthe ENSO climate index, with dry and wet seasons corresponding to La Niña and El Niñoevents, respectively.
Citation: Chen, J. L., C. R. Wilson, B. D. Tapley, L. Longuevergne, Z. L. Yang, and B. R. Scanlon (2010), Recent La Platabasin drought conditions observed by satellite gravimetry, J. Geophys. Res., 115, D22108, doi:10.1029/2010JD014689.
1. Introduction
[2] The La Plata basin is the fifth largest basin in the worldand second largest in South America, next to the Amazonbasin. With a total area of about 3.5 million km2, coveringparts of five countries (Argentina, Uruguay, Paraguay, Brazil,and Bolivia) (Figure 1), the basin is of great ecological andeconomic significance, with challenging problems includingvulnerability to excess floods and increasing demands as awater resource and source of hydropower [Barros et al.,2004, 2006]. The basin is also home to the Pampas (thedark green area in Figure 1), one of the world’s richest grass-lands in terms of size and biodiversity and amajor agriculturalresource [Viglizzo and Frank, 2006].[3] The La Plata basin shows evidence of changes that may
be identified with long‐term climate variation [Barros et al.,2006; Viglizzo and Frank, 2006]. Over the past several dec-ades, the basin has been experienced frequent floods [Minetti
et al., 2004; Barros et al., 2006], and more recently hasexperienced drought. For many areas, especially in the south,the last few years have seen the worst drought in over acentury, with official declarations of calamity, a sharp declinein grain and meat output, and economic havoc (M. Valente,AGRICULTURE‐ARGENTINA:Worst drought in 100 years,2009, http://ipsnews.net/news.asp?idnews = 45498). The con-sequences have been especially significant for Argentina, theworld’s second largest exporter of corn and coarse grains, andthe third largest exporter of wheat [Food and AgricultureOrganization, 2000]. The recent drought is likely connectedto abnormal climate conditions related to the prolonged 2007/2009 La Niña event [Diaz et al., 1998; de Rojas and Alicia,2000; Grimm et al., 2000; Seiler and Kogan, 2002].[4] Monitoring and quantification of the spatial extent and
intensity of drought are limited by conventional data re-sources (in situ meteorological and hydrological observationswith sparse spatial and temporal sampling). Deficits in ter-restrial water storage (TWS) are particularly difficult to esti-mate from such data. Drought indices from satellite remotesensing of soil moisture and vegetation change have beenused for monitoring drought extent and intensity [e.g., Simset al., 2002; Wang and Qu, 2007]. Numerical climate andland surface models are valuable in analyzing and diagnosingclimate variability, but are imperfect at quantifying extremeclimate events, including droughts [Chen et al., 2009].
1Center for Space Research, University of Texas at Austin, Austin,Texas, USA.
2Department of Geological Sciences, Jackson School of Geosciences,University of Texas at Austin, Austin, Texas, USA.
3Bureau of Economic Geology, Jackson School of Geosciences,University of Texas at Austin, Austin, Texas, USA.
Copyright 2010 by the American Geophysical Union.0148‐0227/10/2010JD014689
JOURNAL OF GEOPHYSICAL RESEARCH, VOL. 115, D22108, doi:10.1029/2010JD014689, 2010
D22108 1 of 12

[5] TWS change is a major component of the global watercycle, and represents the total change of water stored in soil,as snow over land, and in groundwater reservoirs. In a givenbasin, TWS change reflects the sum of accumulated precip-itation, evapotranspiration, and surface and subsurface run-off, and provides a reliable measure of abnormal climateconditions such as droughts and floods. Quantification ofTWS change is difficult because of the lack of fundamentalobservations of groundwater, soil moisture, snow water equiv-alent, precipitation, evapotranspiration, and river discharge atbasin or smaller scales. Numerical models often poorly esti-mate TWS changes, especially at interannual and longer timescales [Matsuyama et al., 1995; Chen et al., 2009]. Remotesensing data (e.g., TRMM satellite precipitation data) and insitu measurements (e.g., river discharge at gauge stations) arevaluable in estimating TWS changes [Crowley et al., 2008;Zeng et al., 2008], but other hydrological parameters are alsorequired (e.g., evapotranspiration).[6] Satellite gravity measurements from the Gravity Recov-
ery And Climate Experiment (GRACE) provide a means toestimate TWS by direct monitoring of water mass changes.Since March 2002, GRACE measurements of gravity changeat monthly intervals [Tapley et al., 2004] have been used toinfer mass variation at Earth’s surface [Wahr et al., 1998].GRACE time‐variable gravity observations are able to mon-itor mass changes with a precision of ∼1.5 cm of equivalentwater thickness change [Wahr et al., 2004, 2006]. Earlystudies applied GRACE data to a variety of problems
including TWS change [e.g.,Wahr et al., 2004; Tapley et al.,2004; Strassberg et al., 2009; Longuevergne et al., 2010],polar ice sheet mass balance [e.g., Velicogna and Wahr,2006; Chen et al., 2006], and oceanic mass change [e.g.,Chambers et al., 2004; Lombard et al., 2007].[7] With improved background geophysical models and
data processing techniques [Swenson and Wahr, 2006;Bettadpur, 2007a], reprocessed GRACE release‐04 (RL04)gravity fields show significantly improved quality and spatialresolution, ≤500 km [Chen et al., 2008, 2009]. These im-provements have enabled applications to a much wider classof problems than during the first few years of the mission, andwith nearly 8 years of observations, an understanding ofinterannual and longer‐term changes in TWS is now possible.Here we examine TWS change in the La Plata basin usingGRACE RL04 data, along with TWS estimates from theGlobal Land Data Assimilation System (GLDAS) [Rodellet al., 2004]. The goal is to quantify the extent and intensityof the recent La Plata basin drought, and to compare GRACEestimates with others from satellite remote sensing and pre-cipitation data and GLDAS.
2. Data Processing
2.1. TWS Changes From GRACE GravityMeasurements
[8] We use GRACE RL04 time‐variable gravity solutions,provided by the Center for Space Research (CSR), University
Figure 1. Map of the La Plata basin (outlined in red) in South America.
CHEN ET AL.: RECENT LA PLATA DROUGHT OBSERVED BY GRACE D22108D22108
2 of 12
of Texas at Austin [Bettadpur, 2007b]. The 86 approximatelymonthly gravity solutions cover the period April 2002through August 2009, and consist of normalized sphericalharmonic (SH) coefficients, to degree and order 60. GRACESH coefficients are contaminated by noise, including longi-tudinal stripes (when SH coefficients are converted into massfields), and other errors, especially at high degrees and orders.The longitudinal stripes have been shown to be associatedwith unquantified correlations among certain SH coefficients,and removal of these correlations significantly reduces thestripes [Swenson and Wahr, 2006]. For SH orders 6 andabove, a least square fit of degree 4 polynomial is removedfrom even and odd degree coefficient pairs [Swenson andWahr, 2006]. For example, for SH coefficients of order 6(e. g., Cn,6, n = 6, 7, …, 60), we fit a degree 4 polynomialto the even degree pair (e.g., C6,6, C8,6, …, C60,6) andremove the polynomial fit from the coefficients, and applythe same to the odd degree pair (e.g., C7,6, C9,6, …, C59,6).We call this decorrelation filter P4M6. After P4M6 filtering,a 300 km Gaussian low‐pass filter is applied to furthersuppress the remaining short‐wavelength errors [Jekeli,1981] and the mean of all 86 monthly solutions is removedfrom SH coefficient. Monthly mass change fields, expressedas equivalent water layer thickness change on a 1° × 1° grid,are then computed [Wahr et al., 1998].[9] Atmospheric and oceanic mass changes have been
removed in GRACE data using estimates from numericalmodels during solving GRACE gravity solutions, in a pro-cedure to reduce alias errors in GRACE monthly solutions,
due to high‐frequency atmospheric and oceanic signals[Bettadpur, 2007b]. Therefore, GRACEmass variations overland should reflect primarily TWS change (including snow/ice) and solid Earth geophysical signals such as postglacialrebound (PGR). Over the La Plata basin, surface mass varia-tions should be dominantly due to near‐surface water storagechanges. Errors in GRACE estimates over the La Plata basinare expected to arise from spatial leakage associated with afinite range of SH coefficients, signal attenuation due tospatial filtering, residual atmospheric signals, and GRACEmeasurement errors. Spatial leakage has been a major sourceof error in GRACE TWS estimates, because SH coefficientsare limited to degrees and orders below 60. Additional fil-tering is required to attenuate noise in high degree and ordercoefficients, leading to attenuation of some signal. As a result,TWS variance leaks into surrounding regions (e.g., oceans)(see Figure 2). In this study, a 300 km Gaussian low‐passfilter is applied. This relatively modest filter causes about5–10% leakage to adjacent regions when estimating largebasin‐scale TWS averages at seasonal time scales [Chenet al., 2007].
2.2. TWS Changes From GLDAS Model Estimates
[10] GLDAS ingests satellite‐ and ground‐based observa-tions, using advanced land surface modeling and data assim-ilation techniques, to generate estimates of land surface statesand fluxes [Rodell et al., 2004]. Precipitation gauge ob-servations, satellite and radar precipitation measurements,and downward radiation flux and analyses from atmospheric
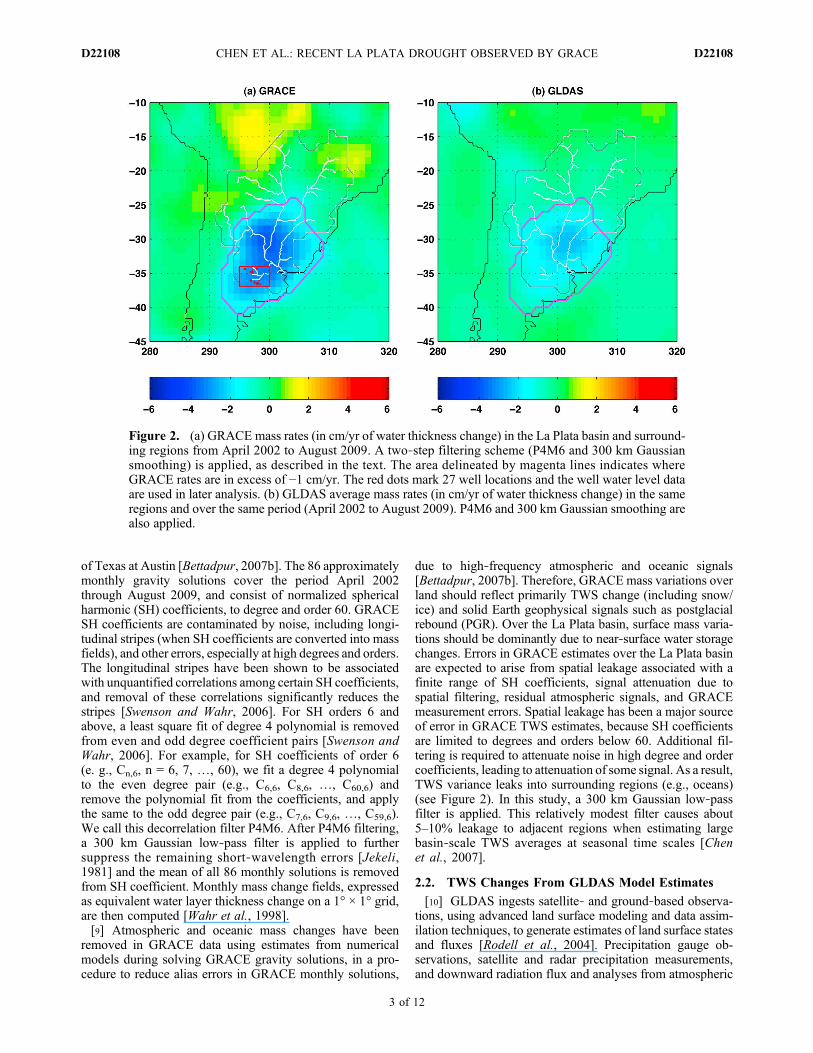
Figure 2. (a) GRACE mass rates (in cm/yr of water thickness change) in the La Plata basin and surround-ing regions from April 2002 to August 2009. A two‐step filtering scheme (P4M6 and 300 km Gaussiansmoothing) is applied, as described in the text. The area delineated by magenta lines indicates whereGRACE rates are in excess of −1 cm/yr. The red dots mark 27 well locations and the well water level dataare used in later analysis. (b) GLDAS average mass rates (in cm/yr of water thickness change) in the sameregions and over the same period (April 2002 to August 2009). P4M6 and 300 km Gaussian smoothing arealso applied.
CHEN ET AL.: RECENT LA PLATA DROUGHT OBSERVED BY GRACE D22108D22108
3 of 12

data assimilation systems are used as forcing. The GLDASestimates used in this study are from the Noah land surfacemodel [Ek et al., 2003], with inputs of precipitation from aspatially and temporally downscaled version of the NOAAClimate Prediction Center’s Merged Analysis of Precipita-tion, and solar radiation data from the Air Force WeatherAgency’s AGRMET system. Monthly average soil moisture(2 m column depth) and snow water equivalent were com-puted from 1979 to present, with TWS at each grid pointcomputed from the sum of soil and snow water. GreenlandandAntarctica are excluded because themodel omits ice sheetphysics. Groundwater is also not modeled by GLDAS.[11] GLDAS fields need to be spatially filtered in a similar
way to the GRACE data to compare the two. To accomplishthis, GLDAS TWS gridded fields were represented in a SHexpansion to degree and order 100, and the P4M6 and 300 kmGaussian smoothing filters were applied. SH coefficientswere truncated at degree and order 60, and SH coefficients fordegree 0 and degree 1 were set to zero as they are for GRACEfields. Finally, the GLDAS SH expansion was evaluated on aglobal 1° × 1° grid.
2.3. Groundwater Level Data
[12] A collaborative groundwater monitoring project hasbeen set up under the coordination of GEA (Grupo deEstudios Ambientales, Universidad Nacional de San Luis andCONICET) and IyDA‐Agritest in the Argentinean Pampas,the southern part of the study area. A total of 27 wells (markedby red dots on Figure 2a) monitor the shallow groundwater.For each well, monthly water levels were transformed intoequivalent water layer using a uniform specific yield (effectiveporosity) of 0.1 [Aradas et al., 2002]. For each month, waterlayers were then interpolated using kriging [Wackernagel,1995] and spatially averaged to extract regional groundwaterstorage variations.
3. Results
3.1. GRACE and Climate Model Estimates
[13] At each 1° × 1° grid point there is a time series of TWSvariations relative to the mean. We use unweighted leastsquares to estimate a linear trend, and to evaluate non sea-sonal changes, we fit and remove sinusoids at annual, semi-annual, and 161 day periods (161 days is the recognized aliasperiod of the S2 tide) [Ray and Luthcke, 2006]. Figure 2ashows mass rates (slope of the linear trend) in the La Platabasin (delineated by the gray lines) in units of cm/yr ofequivalent water thickness change. GRACE shows signifi-cant TWS negative trends (up to ∼3.5 cm/yr) in the lower LaPlata basin during the period April 2002 to August 2009. Thearea delineated by magenta lines identifies the region wherenegative trends exceed 1 cm/yr. TWS decreases are seenprimarily in eastern Argentina and Uruguay. During the sameperiod, the northern La Plata and southern Amazon basinsshow slight TWS increases. GRACE observations of TWSdecrease are consistent with reported drought conditions inthe La Plata basin. TWS rate estimates from GLDAS areshown in Figure 2b (the same magenta contour line inFigure 2a is superimposed here for comparison). GLDASshows similar TWS decreases in the lower La Plata basin, butthe magnitudes are significantly less than GRACE values(−2.2 versus −3.5 cm/yr in peak values).
[14] To examine temporal evolution of the drought event,we show mean TWS changes over the lower La Plata basin(delineated by magenta lines in Figures 2a and 2b) estimatedfrom GRACE and GLDAS (Figure 3, top). For a givenmonth, the GRACE uncertainty level is estimated using RMSresiduals over the Pacific Ocean within the same latitude zoneof 40°S–25°S and at longitudes distant from land, 180°E–270°E. This provides an approximate measure of GRACEerror. The true error is unknown, due to the lack of inde-pendent measurements of TWS change. Consistent with theTWS rate maps (Figures 2a and 2b), both GRACE mea-surements and GLDAS estimates show a long‐term decreasewith superimposed seasonal variability. The two estimates(GRACE and GLDAS) agree with each other reasonably wellover much of this period. However, GRACE shows muchlarger TWS increases in the austral spring of 2002 andgreater decreases in the falls of 2008 and especially 2009(the seasons discussed in the present study refer to theSouthern Hemisphere).[15] Nonseasonal GRACE and GLDAS time series both
indicate a steady decrease in TWS over time; however,GRACE shows a sharper decrease (Figure 3, bottom). Itseems that the large discrepancies in 2002 and 2008/2009between GRACE and GLDAS primarily drive the differencein slopes. During 2007, both GRACE and GLDAS estimatesshow significant TWS increases, indicating a reasonably wetseason in the lower La Plata basin. GRACE data indicate thatby fall 2009, average TWS deficit in lower La Plata (withrespect to the 7 year mean) is about −12 cm, equivalent to∼248 Gigatonne (Gt) of water: almost enough water to supplythe entire United States for one half year [Kenny et al., 2009].The ∼ 248 Gt only represents the apparent TWS deficit in theregion and the actual amount could be considerably larger, aswe have neglected leakage effects due to filtering and trun-cation of spherical harmonic coefficients here. However,these effects are likely not very significant for large regionalaverage as discussed previously (see section 2.1) [Chen et al.,2007].[16] The present study reveals a different picture of ‘long‐
term’ TWS change in the La Plata basin than that of a pre-vious study [Klees et al., 2008], which does not show a TWSdecrease during the period (January 2003 to February 2006).The discrepancy is mainly attributed to two factors: (1) thepresent study uses a much longer record (∼7 years) ofGRACE data, relative to ∼3 years from Klees et al. [2008],and (2) the present study focuses on the lower (or southern)La Plata (outlined in magenta in Figures 2a and 2b), whileKlees et al. [2008] target the entire La Plata basin. The recentdrought mainly affects the southern part of the La Plata basin(see Figure 2a).[17] We compute yearly average GRACE nonseasonal
TWS changes for 2003 through 2009 (see Figures 4a–4g).Each map is the mean over 12 months from July of the pre-vious year to June of current year (solutions for July 2002 andJune 2003 are not available, so the 2003 mean is based on 10solutions). Ocean areas are masked out for clarity. Thiseffectively illustrates the recent drought condition in the LaPlata basin, which appears to become worse in spring 2008,and reach the maximum in fall 2009 (Figure 3, bottom). TheTWS decrease during spring 2008 and fall 2009 is clearlyshown byGRACE (Figure 4f, the 12month average over July2008 to June 2009). In 2007 (average of July 2006 to June
CHEN ET AL.: RECENT LA PLATA DROUGHT OBSERVED BY GRACE D22108D22108
4 of 12

2007), northern La Plata and southern Amazon (and To-cantins Sao Francisco basins) show significant TWS in-creases, while lower La Plata TWS remained about average.[18] To further illustrate the temporal and spatial develop-
ment of this severe drought, we show monthly TWS anom-alies for a 12 month period from September 2008 to August2009 (Figures 5a–5l). Annual and semiannual variations havebeen removed from each grid point (pixel) using anunweighted least squares fit to these frequencies (ocean areasare masked out for clarity). The recent drought apparentlybegan in the lower (southern) La Plata in spring 2008 (seeFigures 5a–5d), and peaked in fall 2009 (see Figures 5h–5j).During the peak months (April–June 2009), the droughtspread over the entire La Plata basin. By August 2009, theupper (northern) La Plata basin returned to normal and evenslightly wetter condition, while the lower La Plata remained
in a drought condition with reduced magnitude. More recentGRACE data (not shown here) suggest that the drought hasended and conditions are actually wetter than normal by late2009.
3.2. Comparisons With Other Observations
[19] From the Global Precipitation Climatology Project(GPCP) daily precipitation estimates (V1.1) [Adler et al.,2003], we also compute yearly precipitation anomaly maps(using GPCP data) in the La Plata river basin and surroundingregions over the same period (July 2002 through June 2009).Following a similar definition as used in GRACE yearly TWSmaps (Figures 4a–4g), yearly precipitation totals are the sumfrom July of the previous year through June of current year.The yearly precipitation anomalies are the yearly totals withrespect to themean of the 7 yearly totals (2003 through 2009);
Figure 3. (top) Comparison of TWS change in the lower La Plata basin (average within the area delineatedby magenta lines in Figures 1 and 2) from GRACE (blue curve) and GLDAS (red curve). (bottom) Com-parison of nonseasonal TWS changes in the lower La Plata basin from GRACE (blue curve) and GLDAS(red curve). Annual and semiannual signals have been removed using an unweighted least squares fit. TheGRACE uncertainty level is estimated using RMS residuals over the Pacific Ocean in the same latitude zonewithin the area of 40°S–25°S and 180°E–270°E.
CHEN ET AL.: RECENT LA PLATA DROUGHT OBSERVED BY GRACE D22108D22108
5 of 12

that is, the average yearly total precipitation over the 7 years isremoved from each of the yearly maps (Figures 6a–6g).Consistent with GRACE observations, during the 2009 sea-son (i.e., July 2008 through June 2009), the La Plata basin,especially the south part, received significantly less amount(up to over 30 cm) of precipitation than the average years, andduring the 2003 season (i.e., July 2002 through June 2003),the lower La Plata basin received up to over 50 cm moreprecipitation than usual. Both GRACE and precipitation datashow that 2007 is a wet season. It’s interesting to see thatGRACE sees a relatively wet season in lower La Plata in 2004(Figure 4b), while precipitation data (Figure 6b) appear toshow an average or even dry season. This suggests that theremay be a lag between precipitation and TWS anomalies. Asprecipitation is only one of the three major parameters (alongwith evapotranspiration and runoff) that contribute to TWS
change (when groundwater pumping due to human activitiesis neglected), it is difficult to directly or quantitatively com-pare GRACE TWS and precipitation anomalies (Figure 4versus Figure 6).[20] We also compute accumulated yearly (July through
June, to match periods represented Figure 4) precipitationtotals in the lower La Plata basin (the area delineated bymagenta lines on Figures 2a and 2b) for the period 1998through 2009. Figure 7a shows the result, with GPCP pre-cipitation totals for the GRACE period (after 2002) in gray.Precipitation has decreased since 2003 and average precipi-tation from 2003 through 2009 is 1072 mm, considerably lessthan the 1998 through 2002 average of 1265 mm. GRACEobservations began during the relatively wet 2003 season,while 2009 recorded the least amount of precipitation duringthe 12 years, up to 500 mm less than the peak in 2003. These
Figure 4. Evolution of yearly TWS deficits (cm of water thickness change) from GRACE in the La Platariver basin and surrounding regions over the 7 years (August 2002 to June 2009). Yearly averages are meanTWS changes from July of the previous year through June (solutions for July 2002 and June 2003 are notavailable). For example, the 2004 TWS deficit is the mean from July 2003 through June 2004. The meanover the 7 year period is removed from all seven maps. Ocean areas are masked out for clarity.
CHEN ET AL.: RECENT LA PLATA DROUGHT OBSERVED BY GRACE D22108D22108
6 of 12

features are qualitatively consistent with GRACE observa-tions (Figure 3, bottom). There is clear correlation with the LaPlata drought indicated in Figure 4. After 2003, the lower LaPlata basin experienced mostly dry years, although 2007 is
relatively wet. The drought condition strengthened through-fall 2009, consistent with GRACE observations (Figure 3(bottom) and Figure 4f). The variation and decrease ofyearly precipitation in the lower La Plata basin are supported
Figure 5. Monthly TWS anomalies during a 12 month period from September 2008 to August 2009.Annual and semiannual variations have been removed from each grid point (pixel) using unweighted leastsquares fit. Ocean areas are masked out for clarity.
CHEN ET AL.: RECENT LA PLATA DROUGHT OBSERVED BY GRACE D22108D22108
7 of 12

by similar estimates (see Figure 7b) of yearly precipita-tion totals from the Tropical Rainfall Measuring Mission(TRMM) merged monthly precipitation analysis (3B43, V6)[Huffman et al., 2007]. The TRMM 3B43 precipitation esti-mates are only available since 1998, so the July through Juneyearly total for 1998 (i.e., the yearly total over July 1997through June 1998) is not available from TRMM (Figure 7b).The significantly reduced amount of precipitation in the lowerLa Plata basin in recent years is clearly the cause of the severedrought condition in the region, and is expected to be asso-ciated with reduced evapotranspiration, river discharge, andgroundwater recharge.[21] Figure 7c shows the NINO3.4 index for 1997 through
2009. NINO3.4 is the average sea surface temperature (SST)anomaly in the tropical Pacific region bounded by 5°N to 5°S,from 170°W to 120°W. This area shows large variability at ElNiño time scales, and changes in local SST there shift the
region of rainfall typically located in the far western Pacific.An El Niño or La Niña event is identified if the 5 monthrunning average of the NINO3.4 index exceeds +0.4°C for ElNiño or −0.4°C for La Niña for at least 6 consecutive months.The NINO3.4 index time series is provided by the RoyalNetherlands Meteorological Institute (http://www.knmi.nl)[Burgers, 1999]. Comparing Figures 7a and 7c, wet years arewell correlated with major El Niño events (e.g., 1997/1998,2002/2003, and 2007), and dry years with La Niña (e.g.,1999/2000 and 2006, 2008/2009) or weak El Niño events(e.g., 2004).[22] Figure 8 shows satellite‐based normalized difference
vegetation index (NDVI) [Sims et al., 2002; Wang and Qu,2007] for the lower La Plata from the Moderate ResolutionImaging Spectroradiometer (MODIS) from the NASA Terrasatellite. This NDVI map (NASA Earth Observatory) re-presents the index for 17 January to 1 February 2009 relative
Figure 6. Evolution of yearly precipitation anomalies (centimeters of water thickness) from GPCP in theLa Plata river basin and surrounding regions over the 7 years (July 2002 to June 2009). Yearly precipitationtotals are the sum of July of the previous year through June. The yearly precipitation anomalies are the yearlytotals with respect to the mean yearly total over the 7 year period (i.e., the mean yearly total precipitationover the 7 years is removed from each of the seven maps).
CHEN ET AL.: RECENT LA PLATA DROUGHT OBSERVED BY GRACE D22108D22108
8 of 12

to the average index during the same period from 2000through 2008. The brown color indicates below averagevegetation, corresponding to a dry season; white shows nor-mal conditions; and green indicates above average, a wetseason. Dry conditions are evident in the lower La Plata basinin early 2009. Although NDVI is not a quantitative measureof TWS change, it is useful for monitoring surface droughtconditions and is consistent with GRACE estimates.[23] Currently groundwater level data are not available for
the entire area (lower and southern La Plata) examined in thisstudy. Limited groundwater level data are available in a smallarea in the southern La Plata basin (see Figure 2a). In this area,the topography is extremely flat and surface water and shal-low groundwater are strongly interconnected [Aragon et al.,2010]. Groundwater storage changes were compared withGRACE and GLDAS TWS estimates in the area delineatedby the red box in Figure 2a. The discrepancy betweenGRACE and GLDAS estimates (in this area, Figures 9a and9b) appears much greater than that for the broad drought area(shown in Figures 2 and 3). Groundwater storage data fromthe wells show a significant decreasing trend, consistent withGRACE observations. When groundwater storage data fromthe wells is added to GLDAS estimates (which does notinclude a groundwater component or surface water routing),GRACE TWS estimates and the combined GLDAS and welltime series show significantly better agreement, at both sea-sonal and long‐term time scales (Figure 9b). The decreasingtrend in groundwater storage may not necessarily be resultedfrom the drought condition in the region, and more likelyreflects the combined effect from increased groundwaterpumping (due to agricultural and industrial usage) anddecreased groundwater recharge due to the drought conditionon the surface. However, the area of interest (i.e., southern LaPlata) is not well equipped with irrigation system, comparedto other agricultural regions (e.g., Central Valley, California,or the High Plains Aquifer) [Siebert et al., 2005]. Ground-water pumping might have been increased during the droughtto meet water needs, but it might not contribute to a signifi-cant part of the groundwater level decrease. Nevertheless,quantification of these two separate contributions is difficultand beyond the scope of this study.
4. Conclusions and Discussion
[24] GRACE data indicate a significant decrease in TWS inthe lower La Plata basin in recent years and provide a quan-titative measure of recent drought conditions. GRACE TWSestimates provide a detailed picture of temporal and spatialevolution of this severe drought event, and suggest that thedrought conditions worsened in 2009, with average TWSdeficit (with respect to the 7 year mean) reaching ∼12 cmequivalent water thickness by fall 2009 (in a broad region inlower La Plata). GRACE estimates are consistent with GPCPand TRMM precipitation analysis and vegetation indexmeasurements from satellite remote sensing.[25] The GLDAS land surface model shows similar water
storage changes in the lower La Plata, but with considerablysmaller magnitude at longer time scales. The lack of agroundwater component in GLDAS appears to be partlyresponsible for this discrepancy, at least in the study area inthe south La Plata basin where well water level data areavailable (Figures 9a and 9b). Available groundwater data in
Figure 7. (a) Accumulated yearly (July–June) total precipi-tation in the lower La Plata basin (delineated by the magentalines in Figures 2a and 2b) for 1998–2009 fromGPCP (V1.1).Gray bars are the period spanned by GRACE. (b) Accumu-lated yearly (July–June) total precipitation in the lower LaPlata basin (delineated by the magenta lines in Figures 2a and2b) for 1999–2009 fromTRMM3B43 (V6). Gray bars are theperiod spanned by GRACE. (c) The NINO3.4 index 1997–2009. NINO3.4 is the average sea surface temperature (SST)anomaly in the region bounded by 5°N to 5°S, from 170°W to120°W. This region has large variability on El Niño timescales and is associated with the area of rainfall that is typi-cally located in the far western Pacific. The NINO3.4 timeseries is provided by the Royal Netherlands MeteorologicalInstitute (http://www.knmi.nl).
CHEN ET AL.: RECENT LA PLATA DROUGHT OBSERVED BY GRACE D22108D22108
9 of 12

this region show significant groundwater depletion, which islikely associated with the drought. Supplementing GLDASTWS estimates with groundwater level data significantlyimproves the agreement with GRACE estimates. Unfortu-nately, there are no adequate in situ TWS measurements tofully validate GRACE estimates. Precipitation data are help-ful for qualitatively understanding TWS changes, but cannotbe used quantitatively in the absence of evapotranspirationand runoff. This highlights the unique strength of satellitegravity observations in monitoring large spatial‐scale TWSchanges, and providing an independent measurement for cal-ibrating, evaluating, and improving climate and land surfacemodels [Oleson et al., 2008].[26] Drought and flood conditions in the La Plata basin
appear to be closely connected to El Niño and La Niña events.These events cause abnormal changes in general circulationpatterns and bring increased or decreased precipitation toaffected regions [Diaz et al., 1998; de Rojas and Alicia, 2000;Grimm et al., 2000; Seiler and Kogan, 2002]. This relation-ship is reinforced by high correlation between precipitationchanges in the lower La Plata basin (Figures 7a and 7b) andthe NINO3.4 SST anomaly index (Figure 7c) over the period1997 to 2009. GRACE nonseasonal TWS estimates (Figure 3,bottom) also correlate well with and the NINO3.4 SST index
(Figure 7c). The 2008/2009 drought in the lower La Platabasin is likely connected to the 2008/2009 La Niña event. Themuch stronger 1999/2000 La Niña event also corresponds to amajor drought in the La Plata basin [Zanvettor and Ravelo,2000], however, its magnitude (at least in the lower La Platabasin) appears less significant than the recent drought, assuggested by precipitation data (see Figure 7a). This indicatesthat other factors (in addition to the 2008/2009 La Niña event)may have contributed to the recent severe drought in lower LaPlata basin as well.[27] It is difficult to directly validate GRACE estimates in
the absence of adequate in situ TWS or related measurements.Residual variations over the oceans (where the expectedsignal is zero, if the ocean model estimates used in GRACEdealiasing processing are correct) can serve as an approxi-mate of GRACE error [Wahr et al., 2004]. GRACE‐observedTWS anomalies in the lower La Plata basin greatly exceed theresiduals over the ocean, providing confidence that that thesignal is reliable. TheGRACEmission has been extended untilat least 2013, and a reprocessed GRACE data set (release 5)will soon incorporate improved background geophysicalmodels and processing methods. These should lead toimproved estimates of TWS change for monitoring climate
Figure 8. Normalized difference vegetation index (NDVI) for the lower La Plata basin from the ModerateResolution Imaging Spectroradiometer (MODIS) and NASA Terra satellite observations. This shows theindex for 17 January to 1 February 2009, relative to the average index of 2000–2008. Brown indicates veg-etation below average levels, associated with a dry season; white shows normal conditions; and green showsa higher than average index, associated with a wet season. (NASA image from http://earthobservatory.nasa.gov/NaturalHazards/view.php?id = 37239.)
CHEN ET AL.: RECENT LA PLATA DROUGHT OBSERVED BY GRACE D22108D22108
10 of 12

impacts on water resources and providing independent con-straints on climate and land surface models.
[28] Acknowledgments. We are grateful to the three anonymous re-viewers for their insightful comments, which led to improved presentationof the results. We would like to thank the “Grupo de Estudios Ambientales,Universidad Nacional de San Luis and CONICET” and IyDA‐Agritest forsharing groundwater data. This study was supported by NASA PECASEAward (NNG04G060G), NASA GRACE Program (NNX08AJ84G), andNSF IPY program (ANT‐0632195).
ReferencesAdler, R. F., et al. (2003), The version 2 Global Precipitation ClimatologyProject (GPCP) monthly precipitation analysis (1979–present), J. Hydro-meteorol., 4, 1147–1167, doi:10.1175/1525-7541(2003)004<1147:TVGPCP>2.0.CO;2.
Aradas, R., J. Lloyd, and J. Palmer (2002), Groundwater problems in lowelevations regional plains: The Buenos Aires province example, in
Groundwater and Human Development, edited by E. Bocanegra, D.Martinez, and H. Massone, pp. 613–623, A. A. Balkema, Brookfield, Vt.
Aragon, R., E. G. Jobbag, and E. Viglizzo (2010), Surface and groundwaterdynamics in the sedimentary plains of the western Pampas, Ecohydrol-ogy, doi:10.1002/eco, in press.
Barros, V., L. Chamorro, G. Coronel, and J. Báez (2004), The major dis-charge events in the Paraguay River: Magnitudes, source regions, andclimate forcings, J. Hydrometeorol., 5(6), 1161–1170, doi:10.1175/JHM-378.1.
Barros, V., R. Clarke, and P. S. Dias (Eds.) (2006), Climate change in theLa Plata Basin, report, Inter‐Am. Inst. for Global Change Res., São Josédos Campos, Brazil.
Bettadpur, S. (2007a), CSR level‐2 processing standards document forproduct release 04, GRACE 327–742, Cent. for Space Res., Univ. ofTexas at Austin, Austin.
Bettadpur, S. (2007b), Level‐2 gravity field product user handbook,GRACE 327–734, Cent. for Space Res., Univ. of Texas at Austin, Austin.
Burgers, G. (1999), The El Niño stochastic oscillator, Clim. Dyn., 15, 521–531, doi:10.1007/s003820050297.
Chambers, D. P., J. Wahr, and R. S. Nerem (2004), Preliminary observa-tions of global ocean mass variations with GRACE, Geophys. Res. Lett.,31, L13310, doi:10.1029/2004GL020461.
Figure 9. (a) Comparison of TWS changes from GRACE, GLDAS, and average groundwater storagechange from 27 wells (marked by red dots in Figure 2a) in the south La Plata basin. GRACE andGLDAS time series are the average estimates within the area delineated by red box in Figure 2a. (b) Same as9a but with seasonal variations removed using unweighted least squares fit. A specific yield (effectiveporosity) of 10% is applied when computing groundwater storage from well water level data.
CHEN ET AL.: RECENT LA PLATA DROUGHT OBSERVED BY GRACE D22108D22108
11 of 12

Chen, J. L., C. R. Wilson, and B. D. Tapley (2006), Satellite gravity mea-surements confirm accelerated melting of Greenland ice sheet, Science,313(5795), 1958–1960, doi:10.1126/science.1129007.
Chen, J. L., C. R. Wilson, J. S. Famiglietti, and M. Rodell (2007), Atten-uation effects on seasonal basin‐scale water storage change fromGRACE time‐variable gravity, J. Geod., 81(4), 237–245, doi:10.1007/s00190-006-0104-2.
Chen, J. L., C. R. Wilson, B. D. Tapley, D. D. Blankenship, and D. Young(2008), Antarctic regional ice loss rates from GRACE, Earth Planet. Sci.Lett., 266(1–2), 140–148, doi:10.1016/j.epsl.2007.10.057.
Chen, J. L., C. R. Wilson, B. D. Tapley, Z. L. Yang, and G. Y. Niu (2009),The 2005 drought event in the Amazon River basin as measured byGRACE and climate models, J. Geophys. Res. , 114, B05404,doi:10.1029/2008JB006056.
Crowley, J. W., J. X. Mitrovica, R. C. Bailey, M. E. Tamisiea, and J. L.Davis (2008), Annual variations in water storage and precipitation in theAmazon Basin, J. Geod., 82(1), 9–13, doi:10.1007/s00190-007-0153-1.
de Rojas, C., and E. Alicia (2000), The climatic impact of La Niña‐relateddroughts in Entre Rios (Argentina), Drought Network News, 12(2), 7–8.
Diaz, A. F., C. D. Studzinski, and C. R. Mechoso (1998), Relationshipsbetween precipitation anomalies in Uruguay and southern Brazil andsea surface temperature in the Pacific and Atlantic oceans, J. Clim., 11,251–271, doi:10.1175/1520-0442(1998)011<0251:RBPAIU>2.0.CO;2.
Ek, M. B., K. E. Mitchell, Y. Lin, E. Rogers, P. Grunmann, V. Koren,G. Gayno, and J. D. Tarpley (2003), Implementation of the upgradedNoah land‐surface model in the NCEP operational mesoscale Eta model,J. Geophys. Res., 108(D22), 8851, doi:10.1029/2002JD003296.
Food and Agriculture Organization (2000), Crop production statistics,report, Rome.
Grimm, A. M., V. R. Barros, and M. E. Doly (2000), Climate variabilityin southern South America associated with El Niño and La Niñaevents, J. Clim., 13, 35–58, doi:10.1175/1520-0442(2000)013<0035:CVISSA>2.0.CO;2.
Huffman, G. J., R. F. Adler, D. T. Bolvin, G. Gu, E. J. Nelkin, K. P.Bowman, Y. Hong, E. F. Stocker, and D. B. Wolff (2007), The TRMMMultisatellite Precipitation Analysis: Quasi‐global, multi‐year,combined‐sensor precipitation estimates at fine scale, J. Hydrometeorol.,8(1), 38–55, doi:10.1175/JHM560.1.
Jekeli, C. (1981), Alternative methods to smooth the Earth’s gravity field,Ph. D Thesis, Dep. of Geod. Sci. and Surv., Ohio State Univ., Columbus.
Kenny, J. F., N. L. Barber, S. S. Hutson, K. S. Linsey, J. K. Lovelace, andM. A. Maupin (2009), Estimated use of water in the United States in2005, U.S. Geol. Surv. Circ., 1344, 52 pp. (Available at http://pubs.usgs.gov/circ/1344/)
Klees, R., X. Liu, T. Wittwer, B. C. Gunter, E. A. Revtova, R. Tenzer, P.Ditmar, H. C. Winsemius, and H. H. G. Savenije (2008), A comparisonof global and regional GRACE models for land hydrology, Surv. Geo-phys., 29, 335–359, doi:10.1007/s10712-008-9049-8.
Lombard, A., D. Garcia, G. Ramillien, A. Cazenave, R. Biancale, J. M.Lemoine, F. Flechtner, R. Schmidt, and M. Ishii (2007), Estimation ofsteric sea level variations from combined GRACE and Jason‐1 data, EarthPlanet. Sci. Lett., 254(1–2), 194–202, doi:10.1016/j.epsl.2006.11.035.
Longuevergne, L., B. R. Scanlon, and C. R. Wilson (2010), GRACE hydro-logical estimates for small basins: Evaluating processing approaches onthe High Plains Aquifer, USA, Water Resour. Res., doi:10.1029/2009WR008564, in press.
Matsuyama, H., T. Oki, and K. Masuda (1995), Applicability of ECMWF’s4DDA data to interannual variability of the water budget of the Missis-sippi River basin, J. Meteorol. Soc. Jpn., 73, 1167–1174.
Minetti, J. L., W. M. Vargas, A. G. Poblete, L. R. Acuña, and G. Casa-grande (2004), Non‐linear trends and low frequency oscillations inannual precipitation over Argentina and Chile, 1931–1999, Atmosfera,16, 119–135.
Oleson, K. W., et al. (2008), Improvements to the Community Land Modeland their impact on the hydrological cycle, J. Geophys. Res., 113,G01021, doi:10.1029/2007JG000563.
Ray, R. D., and S. B. Luthcke (2006), Tide model errors and GRACE gra-vimetry: Towards a more realistic assessment, Geophys. J. Int., 167(3),1055–1059, doi:10.1111/j.1365-246X.2006.03229.x.
Rodell, M., et al. (2004), The Global Land Data Assimilation System, Bull.Am. Meteorol. Soc., 85(3), 381–394, doi:10.1175/BAMS-85-3-381.
Seiler, R. A., and F. Kogan (2002), Monitoring ENSO cycles and their im-pacts on crops in Argentina from NOAA‐AVHRR satellite data, Adv.Space Res., 30(11), 2489–2493, doi:10.1016/S0273-1177(02)80316-7.
Siebert, S., P. Döll, J. Hoogeveen, J.‐M. Faures, K. Frenken, and S. Feick(2005), Development and validation of the global map of irrigation areas,Hydrol. Earth Syst. Sci., 9, 535–547, doi:10.5194/hess-9-535-2005.
Sims, A. P., D. D. S. Niyogi, and S. Raman (2002), Adopting drought indi-ces for estimating soil moisture: A North Carolina case study, Geophys.Res. Lett., 29(8), 1183, doi:10.1029/2001GL013343.
Strassberg, G., B. R. Scanlon, and D. Chambers (2009), Evaluation ofgroundwater storage monitoring with the GRACE Satellite: Case studyof the High Plains Aquifer, central United States, Water Resour. Res.,45, W05410, doi:10.1029/2008WR006892.
Swenson, S., and J. Wahr (2006), Post‐processing removal of correlated er-rors in GRACE data, Geophys. Res. Lett., 33, L08402, doi:10.1029/2005GL025285.
Tapley, B. D., S. Bettadpur, M. M. Watkins, and C. Reigber (2004), TheGravity Recovery and Climate Experiment: Mission overview and earlyresults, Geophys. Res. Lett., 31, L09607, doi:10.1029/2004GL019920.
Velicogna, I., and J. Wahr (2006), Measurements of time‐variable gravityshow mass loss in Antarctica, Science, 311(5768), 1754–1756,doi:10.1126/science.1123785.
Viglizzo, E. F., and F. C. Frank (2006), Ecological interactions, feedbacks,thresholds and collapses in the Argentine Pampas in response to climateand farming during the last century, Quat. Int., 158(1), 122–126,doi:10.1016/j.quaint.2006.05.022.
Wackernagel, H. (1995), Multivariate Geostatistics, 256 pp., Springer,New York.
Wahr, J., M. Molenaar, and F. Bryan (1998), Time variability of the Earth’sgravity field: Hydrological and oceanic effects and their possible detectionusing GRACE, J. Geophys. Res., 103, 30,205–30,230, doi:10.1029/98JB02844.
Wahr, J., S. Swenson, V. Zlotnicki, and I. Velicogna (2004), Time‐variablegravity from GRACE: First results, Geophys. Res. Lett., 31, L11501,doi:10.1029/2004GL019779.
Wahr, J., S. Swenson, and I. Velicogna (2006), Accuracy of GRACE massestimates, Geophys. Res. Lett., 33, L06401, doi:10.1029/2005GL025305.
Wang, L., and J. J. Qu (2007), NMDI: A normalized multi‐band droughtindex for monitoring soil and vegetation moisture with satellite remotesensing, Geophys. Res. Lett., 34, L20405, doi:10.1029/2007GL031021.
Zanvettor, R., and A. Ravelo (2000), Using the SPI to monitor the 1999–2000 drought in northeastern Argentina, Drought Network News, 12(3),3–4. (Available at http://digitalcommons.unl.edu/droughtnetnews/108/)
Zeng, N., J. H. Yoon, A. Mariotti, and S. Swenson (2008), Variability ofbasin‐scale terrestrial water storage from a P‐E‐R water budget method:The Amazon and the Mississippi, J. Clim., 21, 248–265, doi:10.1175/2007JCLI1639.1.
J. L. Chen, B. D. Tapley, and C. R. Wilson, Center for Space Research,University of Texas at Austin, 3925 West Braker Ln., Ste. 200, Austin, TX78759, USA. ([email protected])L. Longuevergne and Z. L. Yang, Department of Geological Sciences,
Jackson School of Geosciences, University of Texas at Austin, Austin,TX 78712, USA.B. R. Scanlon, Bureau of Economic Geology, Jackson School of
Geosciences, University of Texas at Austin, Austin, TX 78712, USA.
CHEN ET AL.: RECENT LA PLATA DROUGHT OBSERVED BY GRACE D22108D22108
12 of 12