rear seat occupant thorax protection in near side impacts
TRANSCRIPT

Rear Seat Occupant Thorax Protection in Near Side Impacts
Katarina Bohman 1) 2) Erik Rosén 1)
Cecilia Sunnevang 1) Ola Boström 1)
1) Autoliv Research, Vårgårda, Sweden. 2) Karolinska Institutet, Department of Public Health Science, Stockholm, Sweden.
__________________________________
ABSTRACT – Thoracic side-airbags (SAB) have proven to protect front seat occupants in side impacts. This benefit has not been evaluated for rear seat occupants who are typically small statured. The objective was to analyze field data from rear seat occupants in near side impacts, and evaluate the effect of a SAB in the rear seat, through full scale vehicle tests. A field study using the NASS-CDS database was performed to review rear seat crash characteristics, occupant injuries (Abbreviated Injury Scale 3+, AIS3+) and injury sources. Full scale tests were performed with the side impact dummy SID-IIs at two different crash severities, with and without SAB in a midsize passenger car. Field data showed that of all AIS3+ injured restrained occupants 13 years and older, 59% had AIS3+ thoracic injuries and 38% had AIS3+ head injuries. The thoracic injuries were distributed to lungs (60%), skeletal fractures (38%) and injuries to arteries (1,26%) and heart (0,1%). For AIS3+ injured children, age 4-12, 51% had AIS3+ thoracic injuries and 54% had AIS3+ head injuries. Compared to adults, children sustained less fractures and more lung injuries. The rear side interior was the main injury source regardless of age group. In the full scale tests, the thoracic side-airbag reduced the average rib deflection by 50% and resulted in an AIS3+ injury risk reduction from 36% to 3%. At the higher impact speed, SAB reduced the injury risk from 93% to 24%. The full scale crash tests showed that SAB offer a significant potential for thoracic injury reduction in the crash severities causing the majority of serious injuries in real life crashes.
__________________________________
INTRODUCTION
In the US there are about 40,000,000,000 trips annually with rear seat occupants (Kent, 2009). Side impact is the crash direction, after rollovers, with highest severe injury rate for rear seated adults (Parenteau and Viano, 2003). The findings are similar for children (Arbogast et al. 2001, Braver et al. 1989). Besides, Howard et al. (2004) found that the injury risk was higher for a near side occupant compared to a far side one.
Occupants of all ages can be seated in the rear seat. Due to the presence of frontal airbags the rear seat may be the only available space for children in the car. The occupant in the rear seat is typically small statured. Smith et al. (2004) found that 62% of all rear seat occupants in tow-away crashes were below the age of 15.
Arbogast et al. (2001) found the distribution of AIS2+ injuries among 22 children in side impacts (both near and far side) to be 40% to the head, 23% to the extremities and 21% to the abdomen. Due to the children’s smaller stature and lower sitting height,
children have the potential to sustain serious head injuries from contact with the vehicle interior even in minor crashes. Studies showing the injury situation for adults in side impacts in the rear seat, are missing.
The European new car assessment program (EuroNCAP) has included small child dummies in the rear seat in the side impact testing. The focus is kept on head containment within the child restraint system. Other than that, no European requirement evaluates rear seat protection in side impacts. In the U.S. both legal requirements (FMVSS 214) and consumer rating programs (USNCAP), as well as the Insurance Institute for Highway Safety (IIHS) evaluates rear seat protection in side impacts. Until now, FMVSS 214 and USNCAP have used a 50th percentile male side impact dummy, USSID, in the rear seat. It has been evaluated with the same injury assessment reference values (IARV’s) as the front seat dummy (Head Injury Criterion - HIC, Thoracic Trauma Index - TTI and pelvis acceleration). In the recent upgrade of these tests, the rear USSID was replaced by a SID-IIs, in order to improve protection to a greater segment of rear seat occupants (Kahane,
53rd AAAM Annual ConferenceAnnals of Advances in Automotive Medicine
October 5-7, 2009
Vol 53 • October 2009
3

2007). The SID-IIs represent a 5th percentile female, which also is the similar size of a 12-year old child. HIC, lower spine acceleration and pelvis force are evaluated. However, thoracic rib deflection is not included in the rating. Since 2003 IIHS have evaluated side impact protection, using a moving deformable barrier simulating a sport utility vehicle (SUV) front, using two SID-IIs dummies in the impacted vehicle. The rear seat dummy is evaluated with the same IARV’s as the front seat one (also SID-IIs) including HIC, thorax and abdomen rib deflection, and pelvis force. A vehicle will pass the IIHS level of good performance with an average rib deflection of 34 mm (IIHS, 2008b). A maximum rib deflection of 34 mm corresponds to a 36% risk of AIS3+ thoracic injuries (Kuppa, 2004).
The thoracic side airbag was introduced in the front seat in the mid 1990’s. Studies have estimated the efficacy of the SAB in the front seat to about 25% (Kahane 2007, McCartt and Kyrychenko 2007). In the rear seat there is a low presence of SABs. Out of 212 car models 2008 in the US, 6% had SAB as standard in the rear seat and another 13% offered SAB as an option, while in the front seat 92% had SAB as standard and another 5% offered SAB as an option (NHTSA, 2008).
This study examined the hypotheses that the existence of a consumer rating or legal requirement motivating vehicles to be equipped with rear seat SAB, would considerably benefit the safety of rear seat occupants.
The objective was to describe typical near side impacts with severely injured rear seat occupants by analyzing field data, and to evaluate the injury-reducing effect when adding a thoracic side-airbag in the rear seat, at two different side impact speeds.
METHODS
The study consists of two parts, a field study of near side collisions and three full-scale side impact tests with and without thoracic side-airbag.
Field Study
NASS-CDS data from 1994 to 2007 was queried for severely injured, that is MAIS3+ or fatality (version AIS 90), rear seat occupants involved in near side collisions. The primary CDC (Collision Deformation Classification) required was a near side impact, i.e., general area of deformation was “right” and direction of force was 2, 3 or 4 o’clock. Alternatively, the general area of deformation was “left” and direction of force was 8, 9 or 10 o’clock. All vehicles that
sustained a rollover were excluded. Belted as well as unbelted occupants were included and analyzed separately, since previous studies (Håland 1991, Schueller 1989) suggest that seat belts may be effective in side impacts. Case vehicles included cars, vans and SUV’s. To increase the sample size, no restrictions on car model or age were applied.
The data was weighted to become representative of the national U.S. population of tow-away crashes during 1994 to 2007. All results were derived for both the weighted and the raw data sample in order to see the effect of the weighting procedure. This was considered important since the sample size was rather small, which typically implies sensitivity to large weight factors. When providing an overview of crash characteristics, occupants of all ages were treated together. However, conducting the injury analysis, occupants were divided into two groups; occupants 13 years and older formed the “adult group” and occupants aged 4-12 years formed the “child group”.
Full-scale tests
Full-scale tests, with two different midsize passenger cars, were performed according to IIHS side impact crash test protocol (version V, IIHS 2008a). According to the test procedure, a 1500 kg high bumper moving deformable barrier impacts the side of the vehicle perpendicularly at 50 km/h. Occupant protection is evaluated using two SID-IIs, representing a 5th percentile female as well as a 50th percentile 12-year old child, one in the driver seat, and one in the left rear seat position. Structural behavior is evaluated by measuring the struck side contour before and after testing. The full-scale tests, vehicle and barrier preparation, instrumentation, data acquisitioning and filtering, structural measurements and dummy positioning were performed according to IIHS specifications (IIHS 2008b).
In this study, the results from four full scale tests were used. Three of the tests were carried out by Autoliv and one of these tests was performed by IIHS prior to this study (see Table 1). Two of the three tests were performed at an impact speed of 64 km/h instead of the specified 50 km/h. In the forth test, it was the same vehicle as in the first test (vehicle A) and it was performed at an impact speed of 50 km/h.
Table 1 Test matrix. Test no Vehicle Barrier
velocityT-SAB Test
performerPreten-sioner
1 A 50 km/h Yes Autoliv Yes2 B 64 km/h No Autoliv Yes3 B 64 km/h Yes Autoliv Yes4 A 50 km/h No IIHS No
©Annals of Advances in Automotive Medicine
4
To evaluate thoracic protection for the rear seat occupant, tests were performed with and without SAB at both impact speeds. In all tests, a SID-IIs was seated in the rear seat, restrained by a lap and shoulder belt. Only rear seat occupant protection was considered, and dummy injury measures were evaluated using IIHS guidelines for rating (IIHS 2008a) and risk curves for SID-IIs developed by NHTSA (Kuppa 2004).
The shoulder belt pretensioner was fired in three of the four tests. For the test performed by IIHS, the rear seat pretensioner was not fired, since this was not standard for this specific vehicle.
The tested vehicles did not have a thoracic side airbag, standard or optional. Therefore, the SAB used in the tests could not be integrated inside the rear seat side bolster. Instead, the side bolster was removed and the SAB was installed by attaching it directly to the car structure. The SAB had a volume of approximately 8 liters and it was an in-production rear seat bag for another midsize passenger car.
RESULTS
Field study
The NASS-CDS sample comprised 231 MAIS3+ or fatally injured occupants, representing 16,895 occupants when weighted. From now on, only weighted results will be presented unless otherwise stated.
It was found that 37% (34% unweighted) of the occupants were restrained by a safety belt. Of these, 67% had a lap and shoulder belt, 19% a lap belt only, and 14% were restrained by a child restraint system together with either a lap belt or a lap and shoulder belt. None of the occupants had thoracic side-airbag protection. Two of the occupants had head side-airbag protection, but in only one of the cases the airbag deployed.
There were 4003 fatalities, equally distributed between restrained and unrestrained occupants. In the child sample 4-12 years, there were 1133 fatally injured children of which 61% were restrained. In the adult sample, >13 years, there were 2779 fatalities of which 46% were restrained.
Ninety-nine percent of all restrained occupants were seated on row two, and 1% on row three. The corresponding figures for the unrestrained occupants were 96% and 4% respectively.
The distribution of case vehicle was 82% car, 14% van and 4% SUV for the restrained occupants. The corresponding figures for the unrestrained occupants were 82% car, 8% van and 11% SUV.
The distribution of the bullet vehicles/objects for the restrained occupants were divided into car (25%), light trucks and vans (LTV, 51%), bus and heavy truck (11%), pole (7%) and other non-vehicle (6%). The corresponding figures for the unrestrained occupants were car (35%), LTV (38%), bus and heavy truck (3%), pole (21%) and other non-vehicle (3%).
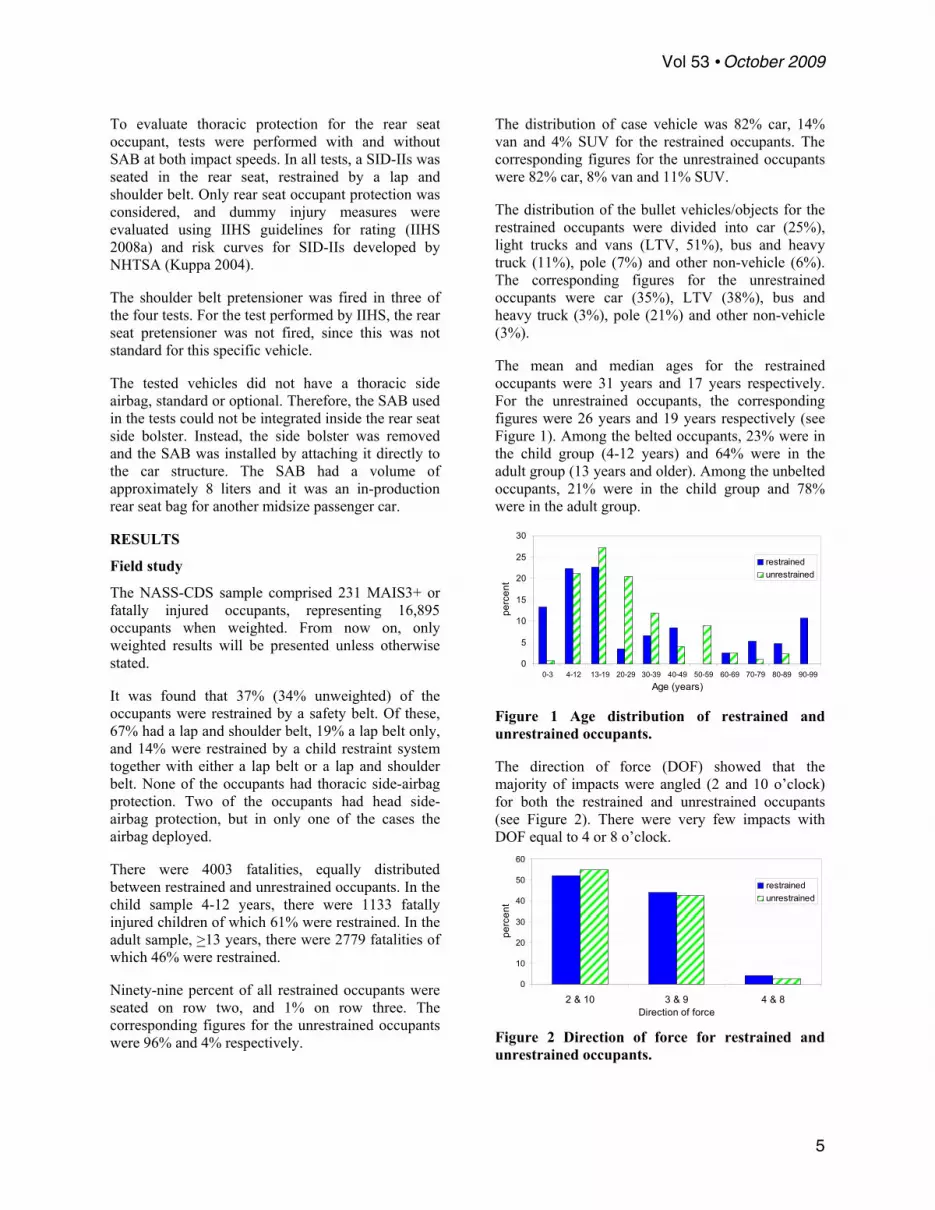
The mean and median ages for the restrained occupants were 31 years and 17 years respectively. For the unrestrained occupants, the corresponding figures were 26 years and 19 years respectively (see Figure 1). Among the belted occupants, 23% were in the child group (4-12 years) and 64% were in the adult group (13 years and older). Among the unbelted occupants, 21% were in the child group and 78% were in the adult group.
0
5
10
15
20
25
30
0-3 4-12 13-19 20-29 30-39 40-49 50-59 60-69 70-79 80-89 90-99
Age (years)
perc
ent
restrainedunrestrained
Figure 1 Age distribution of restrained and unrestrained occupants.
The direction of force (DOF) showed that the majority of impacts were angled (2 and 10 o’clock) for both the restrained and unrestrained occupants (see Figure 2). There were very few impacts with DOF equal to 4 or 8 o’clock.
0
10
20
30
40
50
60
2 & 10 3 & 9 4 & 8Direction of force
perc
ent
restrainedunrestrained
Figure 2 Direction of force for restrained and unrestrained occupants.
Vol 53 • October 2009
5

Both the mean and median changes of lateral velocity (DV) for the restrained occupants equaled 26 km/h. For the unrestrained occupants, these figures were 28 km/h and 25 km/h respectively (see Figure 3).
0
10
20
30
40
50
0-9 10-19 20-29 30-39 40-49 50-59 60-69Lateral DV (km/h)
perc
ent
RestrainedUnrestrained
Figure 3 Lateral DV for restrained and unrestrained occupants.
The crush extent, according to the CDC coding, most often equaled 3 or 4, for both restrained and unrestrained occupants (see Figure 4).
0
10
20
30
40
50
60
70
ext 1 ext 2 ext 3 ext 4 ext 5 ext 6 ext 7 ext 8 ext 9Crush extent
perc
ent
restrainedunrestrained
Figure 4 CDC crush extent for restrained and unrestrained occupants.
The lateral intrusion at the near side rear seat occupant is shown in Figure 5. Of all cases, 56% of the restrained and 53% of the unrestrained had an intrusion between 15 and 45 cm.
0
10
20
30
40
0-2 3-14
15-29
30-45
46-60 61
-
catas
troph
ic
Intrusion (cm)
perc
ent
RestrainedUnrestrained
Figure 5 Lateral intrusion at the rear seat occupant compartment for restrained and unrestrained occupants.
When considering all AIS3+ injuries, head injuries were most frequent, followed by thoracic injuries.
This is valid for both restrained and unrestrained occupants 13 years and older (see Figure 6).
0
10
20
30
40
50
Head
Thorax
Pelvis
Abdom
en
Lower
extr. Arm
Back
Face
Neck
perc
ent
RestrainedUnrestrained
Figure 6 Distribution of all AIS3+ injuries for occupants 13 years and older.
Figure 7 shows the percentage of MAIS3+ injured occupants 13 years and older with AIS3+ injury to the different body regions. It shows that 38% of the restrained occupants sustained at least one AIS3+ injury to the head and 59% to the thorax. Hence, the relative importance of the head and thorax is reversed when compared to the injury distribution in Figure 6, for both restrained and unrestrained occupants.
0
1020
3040
5060
70
Head
Thorax
Pelvis
Abdom
en
Lower
extr. Arm
Back
Face
Neck
perc
ent
RestrainedUnrestrained
Figure 7 Percentage of MAIS3+ injured occupants 13 years and older with injuries to the different body regions.
The thoracic injury sources, as presented in Figure 8, were counted maximum once per occupant. The side interior accounted for 97% of all injury sources for the restrained occupants and 77% for the unrestrained ones. In addition, it was found that the majority of the injuries to the abdomen and pelvis were due to contact with the side interior, while the head had a larger spread of contact sources, including side interior, b-pillar, other pillar, window frame and other vehicle (see table 3 in appendix).
©Annals of Advances in Automotive Medicine
6

0
20
40
60
80
100
Side in
terior
Seat b
ack
C/D-pi
llar
Ground
Other v
ehicl
e
Other o
ccup
ants
Other
B-pilla
r
Thorax injury sourcepe
rcen
t
RestrainedUnrestrained
Figure 8 Distribution of thoracic injury sources for occupants 13 years and older.
The distribution of all AIS3+ injuries for restrained children (4 to 12 years), showed that there were most injuries to the head followed by the thorax (see Figure 9). The high rate of facial injuries among unrestrained children was due to a single case with a large weight factor. This is further explained in the discussion.
0
10
20
30
40
50
60
70
Head
Thorax
Pelvis
Abdom
en
Lower
Extr.
ArmBac
kFac
eNec
k
perc
ent
RestrainedUnrestrained
Figure 9 Distribution of all AIS3+ injuries for the age group 4-12 years.
Figure 10 shows the percentage of MAIS3+ injured occupants 4-12 years with AIS3+ injury to the different body regions. It shows that 54% of the restrained occupants sustained at least one AIS3+ injury to the head and 51% to the thorax. Hence, the relative importance of the head and thorax becomes equally important for the restrained children, compared to the injury distribution in Figure 8.
0
10
20
30
40
50
60
70
Head
Thorax
Pelvis
Abdom
en
Lower
extr. Arm
Back
Face
Neck
perc
ent
RestrainedUnrestrained
Figure 10 Percentage of MAIS3+ injured occupants 4-12 years with injuries to the different body regions.
The thoracic injury sources for children 4-12 years, as presented in Figure 11, were counted maximum once per occupant, regardless of the number of injuries incurred by each source. Similar as for the adults, the side interior (door/panel) was the main source of all thoracic injuries for both restrained and unrestrained children, 83% versus 70%. Also, the side interior was the main injury source for abdomen and pelvis for both groups (see table 3 in Appendix).
0
20
40
60
80
100
Side interior Seat back Otheroccupants
Ground Exterior object
Thorax injury source
perc
ent
RestrainedUnbelted
Figure 11 Distribution of thoracic injury sources for occupants 4-12 years.
Of the occupants with thoracic injuries, the most common injury was a skeletal injury for the restrained adults, while contusions and lacerations to the lungs were more common in the children and unrestrained adults. Injuries to the heart, veins and arteries were rare, but when they occurred they were typically quite severe (AIS4, AIS5 and AIS6) compared to injuries to the lungs and the majority of the skeletal injuries (see Figure 12).
0
20
40
60
80
Skeletal Lungs Artery/vein Heart
Type of thorax injury
perc
ent
4-12y Restrained4-12y Unrestrained13y+ Restrained13y+ Unrestrained
Figure 12 Distribution of thoracic injury type divided by restraint use and age group.
Full scale tests
In the two impacts performed in IIHS standard impact speed (50 km/h), maximum lateral intrusion occurred at mid-door level height. The maximum B-pillar intrusion was measured to 27 and 33 cm with about 20 cm intrusion at the H-point of the rear seated SID-IIs in both tests (see Table 2). In the two tests performed at higher impact speed, 64 km/h, the intrusion was measured to 52 and 55 cm at B-pillar, and 37 versus 39 cm at the H-point at mid-door level
Vol 53 • October 2009
7
height. The lateral delta-v was measured to 25 km/h and 32 km/h, in the two different crash severities.
Table 2 Intrusion (cm) at mid door level for each of the four tests.
Test 1 Test 2 Test 3 Test 4B-pillar 27 33 52 55H-point rear seat 21 20 39 37
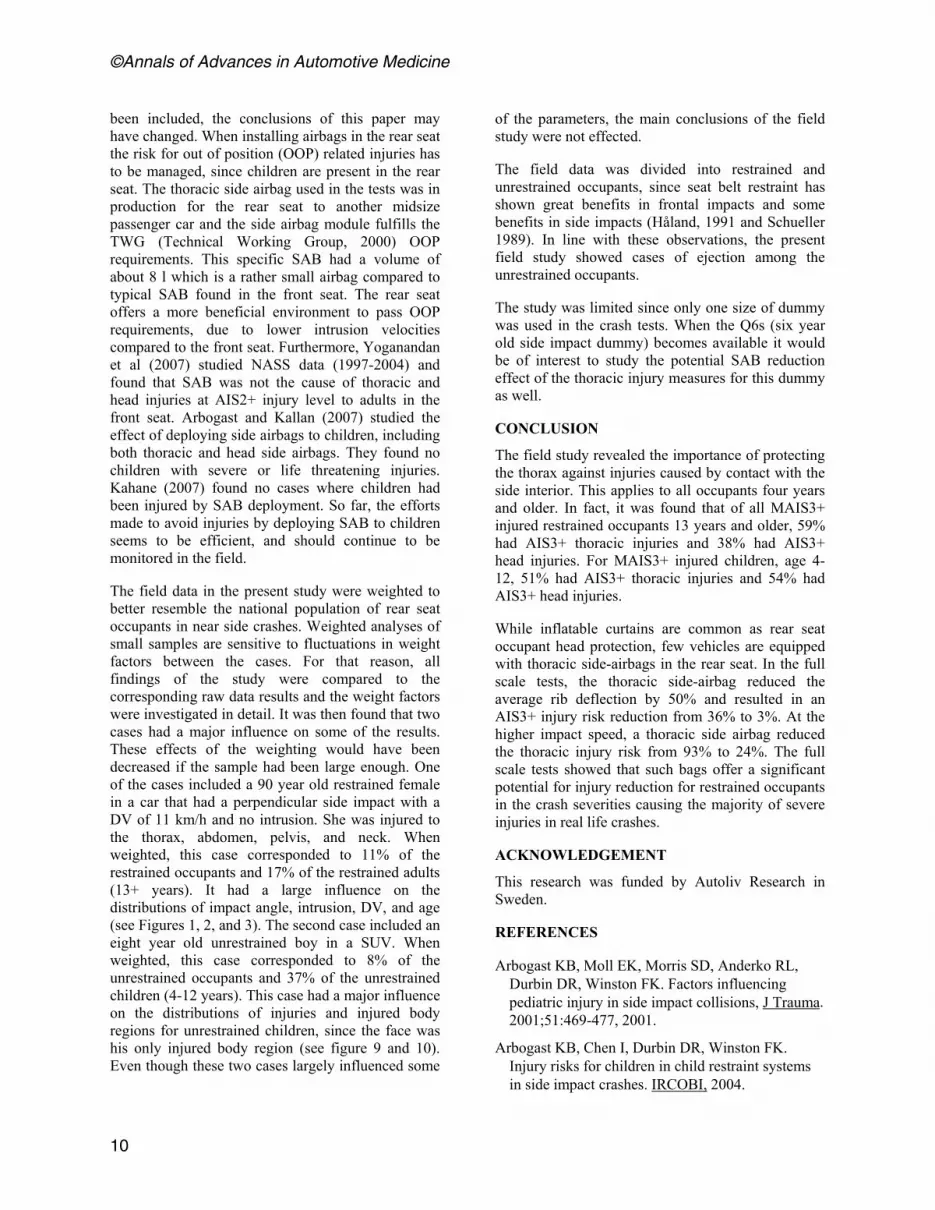
In the test at IIHS standard impact velocity, the average rib deflection without thoracic side airbag was 31 mm (see Figure 13). With a thoracic side airbag the average rib deflection was 15 mm. In addition, based on risk curves published by NHTSA (Kuppa, 2004), the maximum rib deflection corresponded to a risk reduction of severe thoracic injuries (AIS3+) from 36% to 3%. The vehicle passed the IIHS level of good performance of an average rib deflection of 34 mm. A maximum rib deflection of 34 mm corresponds to a 36% risk of severe thoracic injuries (Kuppa, 2004).
In the increased crash severity, the average rib deflection was 51 mm without thoracic side airbag and 23 mm with thoracic side airbag. The maximum thoracic rib deflection showed a risk reduction from 93% to 24% of severe thoracic injuries.
Average rib deflection
0
20
40
60
IIHS standard IIHS + 14 km/h
defle
ctio
n (m
m)
Reference
With SAB
Figure 13 SID-IIs average rib deflection in IIHS standard impact velocity test and in IIHS standard velocity+14 km/h test with and without thoracic side airbag.
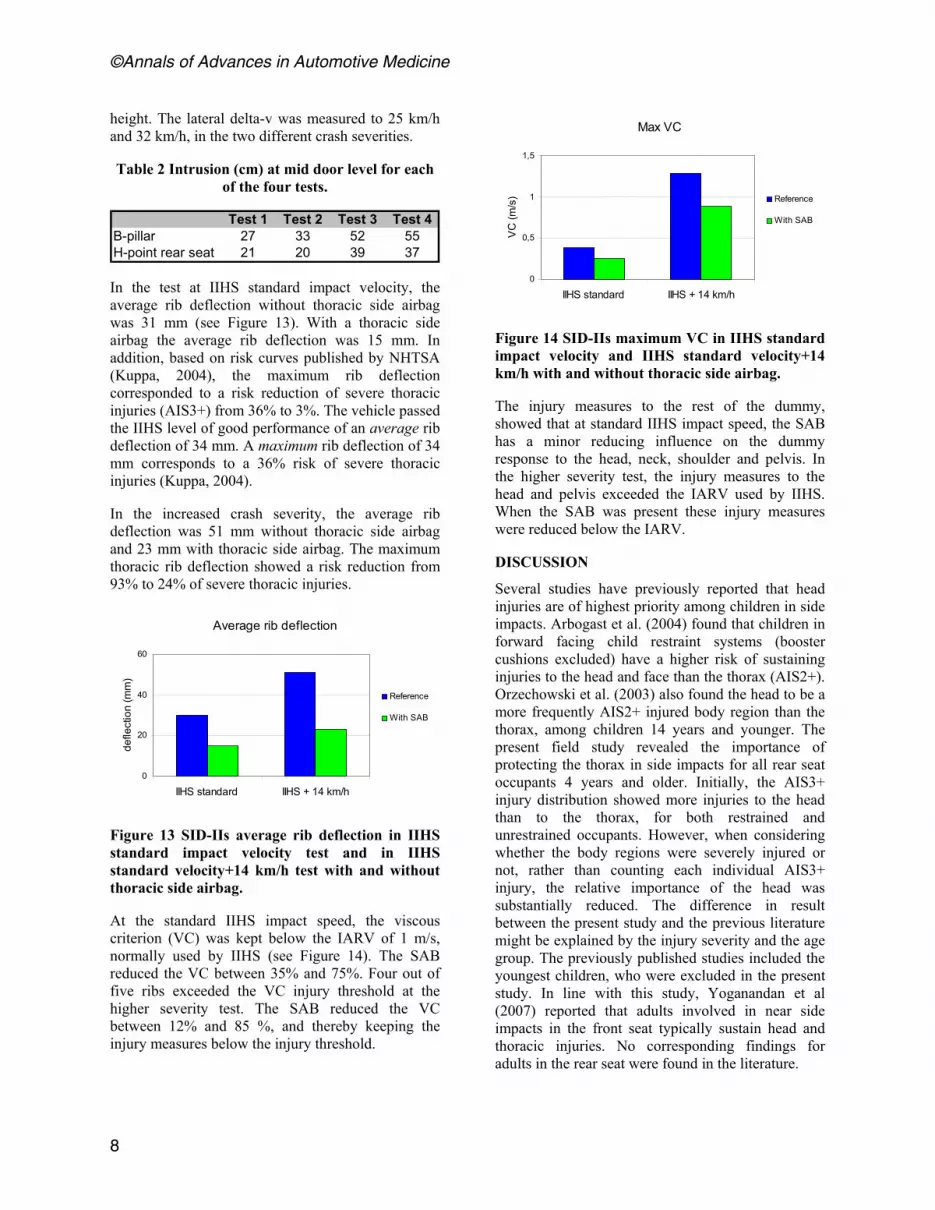
At the standard IIHS impact speed, the viscous criterion (VC) was kept below the IARV of 1 m/s, normally used by IIHS (see Figure 14). The SAB reduced the VC between 35% and 75%. Four out of five ribs exceeded the VC injury threshold at the higher severity test. The SAB reduced the VC between 12% and 85 %, and thereby keeping the injury measures below the injury threshold.
Max VC
0
0,5
1
1,5
IIHS standard IIHS + 14 km/h
VC
(m/s
) Reference
With SAB
Figure 14 SID-IIs maximum VC in IIHS standard impact velocity and IIHS standard velocity+14 km/h with and without thoracic side airbag.
The injury measures to the rest of the dummy, showed that at standard IIHS impact speed, the SAB has a minor reducing influence on the dummy response to the head, neck, shoulder and pelvis. In the higher severity test, the injury measures to the head and pelvis exceeded the IARV used by IIHS. When the SAB was present these injury measures were reduced below the IARV.
DISCUSSION
Several studies have previously reported that head injuries are of highest priority among children in side impacts. Arbogast et al. (2004) found that children in forward facing child restraint systems (booster cushions excluded) have a higher risk of sustaining injuries to the head and face than the thorax (AIS2+). Orzechowski et al. (2003) also found the head to be a more frequently AIS2+ injured body region than the thorax, among children 14 years and younger. The present field study revealed the importance of protecting the thorax in side impacts for all rear seat occupants 4 years and older. Initially, the AIS3+ injury distribution showed more injuries to the head than to the thorax, for both restrained and unrestrained occupants. However, when considering whether the body regions were severely injured or not, rather than counting each individual AIS3+ injury, the relative importance of the head was substantially reduced. The difference in result between the present study and the previous literature might be explained by the injury severity and the age group. The previously published studies included the youngest children, who were excluded in the present study. In line with this study, Yoganandan et al (2007) reported that adults involved in near side impacts in the front seat typically sustain head and thoracic injuries. No corresponding findings for adults in the rear seat were found in the literature.
©Annals of Advances in Automotive Medicine
8

In the crash tests with SAB deployed; significant reduction of the dummy response to the thorax was observed at both crash severities, both in terms of rib deflection and VC. The risk of severe thoracic injuries due to rib deflection was reduced from 93% to 24% in the high severity crash. The authors did not find any published risk curves for VC for the SID-IIs. However, risk curves published for EuroSID (Kuppa, 2004), showed a considerable risk reduction of VC in the more severe crash test. Overall, the tests show that the SAB has a considerable potential of reducing the risk of thoracic injuries to the rear seat occupant.
The most common thoracic injury source was the side interior, which included the whole door side area, but excluded the side window and window frame. Most injuries to the thorax, abdomen and pelvis were due to side interior contact, for both children and adults. However, among the unrestrained occupants, there was a larger spread of contact sources than for the restrained ones. The side interior accounted for 77%. Other contact sources were seat back, ground, other occupant, b-c-d-pillar and other vehicle, indicating the importance of being restrained. Maltese et al. (2007) located the contact points for thorax, abdomen, pelvis and head injuries for restrained children ages 4 to 15. The contact area was relatively limited for the thorax, abdomen and pelvis. Suggesting, that if the torso motion is controlled by seat belt and pretensioner and thus limiting the forward motion during breaking or angled impact, an accurate prediction of where the thorax will impact the door can be done. Thereby the area that should be covered by a SAB can be optimized.
In the restrained child group, roughly one quarter had head injuries due to side interior contact. Among the restrained group 13 years and older, about 20% had head injuries due to side interior contact (see table 3 in Appendix). It is therefore possible that SAB’s will reduce both head and thorax injuries among children. Besides, Arbogast and Kallan (2007) found that children in side impacts without SAB and/or head side-airbag had injuries with greater severity compared to children who had been restrained with SAB and/or head side-airbag.
The present field study showed that the mean lateral DV for MAIS3+ and fatally injured rear seat occupants was 24 km/h for restrained and 26 km/h for unrestrained occupants. In the two different crash severities tested, the lateral DV was 25 km/h and 32 km/h, covering 64% and 82 % of all cases with AIS3+ injuries to restrained occupants. Furthermore, the field study showed that 56% of the restrained
cases and 53% of the unrestrained had an intrusion between 15 and 45 cm in the rear seat compartment In the two crash severities tested, the standard IIHS test had an intrusion between 27 and 33 cm at the H-point, while the higher severity test had an intrusion between 37 and 39 cm. The two tested crash severities represented the majority of severe crashes in real life, both in terms of lateral DV and intrusion in the rear seat compartment.
The EuroNCAP side impact testing, requires a thoracic injury risk (AIS3+) of maximum 5% for both thorax deflection and VC, to achieve the highest rating. The lower performance level is set at an AIS3+ injury risk of 30% of the thorax deflection and 50% of the VC. The lower performance level in EuroNCAP is in line with the legal requirements according to ECER95.
In the IIHS side impact test, the highest rating (“good”) is achieved, if the average rib deflection is 34 mm or less. Of the 107 vehicles (passenger cars, SUV’s and vans) tested by IIHS from 2006 to 2008, 98% as achieved “good” performance rating in the rear seat. However, if the IIHS thoracic injury risk level would be 5% for “good” performance as it is in EuroNCAP, only 4% of the IIHS tested vehicles (2006-2008) would have reached this rating. In this comparison it was assumed that a 5% severe thoracic injury risk corresponded to a maximum thorax rib deflection of 19 mm (Kuppa, 2004).
Conversely, EuroNCAP uses only small child dummies (1,5 years and 3 years) in the rear seat. In a majority of the tested vehicles, the children are seated in forward facing child seats restrained by an internal five-point harness. The rating of the dynamic performance is based on head containment within, and head contact with, the child restraint (EuroNCAP, 2009). Therefore, the vehicle’s implemented safety systems are not really taken into account when rating the rear seat in side impacts.
Consumer rating tests have been beneficial for the development of crash safety in the front seat (Lie and Tingvall, 2000). Consumer rating programs ought to distinguish very good vehicles from vehicles passing legal requirements. In fact, the results of this study indicate that today’s rear seat injury risk levels could be substantially reduced by the implementation of thoracic side airbags, which are standard in the front seat, and the cars would still achieve the highest rating.
The focus of this study was severe thoracic injuries, that are AIS3+ injuries. If AIS2 injuries would have
Vol 53 • October 2009
9
been included, the conclusions of this paper may have changed. When installing airbags in the rear seat the risk for out of position (OOP) related injuries has to be managed, since children are present in the rear seat. The thoracic side airbag used in the tests was in production for the rear seat to another midsize passenger car and the side airbag module fulfills the TWG (Technical Working Group, 2000) OOP requirements. This specific SAB had a volume of about 8 l which is a rather small airbag compared to typical SAB found in the front seat. The rear seat offers a more beneficial environment to pass OOP requirements, due to lower intrusion velocities compared to the front seat. Furthermore, Yoganandan et al (2007) studied NASS data (1997-2004) and found that SAB was not the cause of thoracic and head injuries at AIS2+ injury level to adults in the front seat. Arbogast and Kallan (2007) studied the effect of deploying side airbags to children, including both thoracic and head side airbags. They found no children with severe or life threatening injuries. Kahane (2007) found no cases where children had been injured by SAB deployment. So far, the efforts made to avoid injuries by deploying SAB to children seems to be efficient, and should continue to be monitored in the field.
The field data in the present study were weighted to better resemble the national population of rear seat occupants in near side crashes. Weighted analyses of small samples are sensitive to fluctuations in weight factors between the cases. For that reason, all findings of the study were compared to the corresponding raw data results and the weight factors were investigated in detail. It was then found that two cases had a major influence on some of the results. These effects of the weighting would have been decreased if the sample had been large enough. One of the cases included a 90 year old restrained female in a car that had a perpendicular side impact with a DV of 11 km/h and no intrusion. She was injured to the thorax, abdomen, pelvis, and neck. When weighted, this case corresponded to 11% of the restrained occupants and 17% of the restrained adults (13+ years). It had a large influence on the distributions of impact angle, intrusion, DV, and age (see Figures 1, 2, and 3). The second case included an eight year old unrestrained boy in a SUV. When weighted, this case corresponded to 8% of the unrestrained occupants and 37% of the unrestrained children (4-12 years). This case had a major influence on the distributions of injuries and injured body regions for unrestrained children, since the face was his only injured body region (see figure 9 and 10). Even though these two cases largely influenced some
of the parameters, the main conclusions of the field study were not effected.
The field data was divided into restrained and unrestrained occupants, since seat belt restraint has shown great benefits in frontal impacts and some benefits in side impacts (Håland, 1991 and Schueller 1989). In line with these observations, the present field study showed cases of ejection among the unrestrained occupants.
The study was limited since only one size of dummy was used in the crash tests. When the Q6s (six year old side impact dummy) becomes available it would be of interest to study the potential SAB reduction effect of the thoracic injury measures for this dummy as well.
CONCLUSION
The field study revealed the importance of protecting the thorax against injuries caused by contact with the side interior. This applies to all occupants four years and older. In fact, it was found that of all MAIS3+ injured restrained occupants 13 years and older, 59% had AIS3+ thoracic injuries and 38% had AIS3+ head injuries. For MAIS3+ injured children, age 4-12, 51% had AIS3+ thoracic injuries and 54% had AIS3+ head injuries.
While inflatable curtains are common as rear seat occupant head protection, few vehicles are equipped with thoracic side-airbags in the rear seat. In the full scale tests, the thoracic side-airbag reduced the average rib deflection by 50% and resulted in an AIS3+ injury risk reduction from 36% to 3%. At the higher impact speed, a thoracic side airbag reduced the thoracic injury risk from 93% to 24%. The full scale tests showed that such bags offer a significant potential for injury reduction for restrained occupants in the crash severities causing the majority of severe injuries in real life crashes.
ACKNOWLEDGEMENT
This research was funded by Autoliv Research in Sweden.
REFERENCES
Arbogast KB, Moll EK, Morris SD, Anderko RL, Durbin DR, Winston FK. Factors influencing pediatric injury in side impact collisions, J Trauma. 2001;51:469-477, 2001.
Arbogast KB, Chen I, Durbin DR, Winston FK. Injury risks for children in child restraint systems in side impact crashes. IRCOBI, 2004.
©Annals of Advances in Automotive Medicine
10

Arbogast KB, Kallan MJ, The exposure of children to deploying side air bags: an initial field assessment, AAAM 2007.
Braver E, Kyrychenko S. Efficacy of Side Airbags in ReducingDriver Deaths in Driver Side Collisions. American Journal of Epidemiology, vol. 159, No. 6, pp.556-564, 2004.
EuroNCAP, Child Protection Assessment Protocol, Version 1.2, February 2009. Available online. http://www.euroncap.com/files/Euro-NCAP-Child-Protection-Assessment-Protocol-Version-1.2---82c746df-2306-4e28-a0e8-82c96ade0ba5.pdf. Downloaded 20th of February, 2009.
Howard H, Rothman L, Moses McKeagA.Pazmino-Canizares J, Monk B, Comeau JL, Mills D, Blazeski S, Hale I, German A. Children in side-impact motor vehicle crashes: seating positions and injury mechanisms, J Trauma. 56:1276-1285, 2004.
Håland Y. The restraining effect of seat belts in various lateral impact direction, Chalmers Publication, 1991.
IIHS. Side impact Crashworthiness Evaluation – Crash test protocol (version V). Insurance Institute for Highway Safety, Arlington, VA. 2008a.
IIHS. Side impact Crashworthiness Evaluation – Guidelines for rating injury measures (version II). Insurance Institute for Highway Safety, Arlington, VA. 2008b.
Kahane CJ, An evaluation of side impact protection, National Center for Statisitics and Anlaysis, DOT HS 810 748, NHTSA Technical Report. 2007.
Kent R., Personal communication, 2009.
Kuppa S. Injury criteria for side impact dummies, NHTSA. 2004. Available online at http://www.nhtsa.dot.gov/staticfiles/DOT/NHTSA/NRD/Multimedia/PDFs/Biomechanics%20&%20Trauma/MiscBio/NPRM_SID.pdf. Downloaded 1 of October 2008.
Lie A, Tingvall C, How does Euro NCAP results correlate to real life injury risks~A paired comparison study of car-to-car crashes, IRCOBI,pp.123-130, 2000.
Maltese MR, Locey CM, Jermakian JS, Nance ML, Arbogst KB. Injury Causation Scenartios in Belt-Restrained Near Side Child Occupants, Stapp Car Crash Journal, Vol.51 (2007) pp.299-311, 2007.
McCartt AT, Kyrychenko S. Efficacy of Side Airbags Reducing Driver Deaths in Driver-Side Car and SUV Collisions. Traffic Injury Prevention, Vol. 8, pp. 162-170, 2007.
NHTSA; 2008. Available online. http://www.safercar.gov/portal/site/safercar. Downloaded 30 of October 2008.
Orzechowski KM, Edgerton E, Bulas DI, McLaughlin PM, Eichelberger MR. Patterns of injury to restrained children in side impact motor vehicle crshes: the side impact syndrome, J Trauma, 54 :1094-1101, 2003.
Parenteau C, Viano D. Field data analysis of rear occupant injuries Part I:Adults and teenagers, SAE paper no 2003-01-0153, 2003.
Schueller E, Beier G, Steiger T. Injury patterns of restrained car occupants in near-side impacts, SAE paper no 890376, 1989.
Smith KM, Cummings P. Passenger seating position and the risk of passenger death or injury in traffic crashes, Accident, Analysis and Prevention, Vol. 36, pp.257-260, 2004.
TWG (Technical Working Group – a joint project of Alliance, AIAM, AORC and IIHS). Recommended procfedures for evaluating occupant risk from deploying side airbags, 2000.
Yoganadan N, Pintar F, Zhang J, Gennarelli T. Lateral impact injuries with side airbag deployments – A descriptivie study, Accident Analysis Prevention. January; 39(1):22-27, 2007.
Vol 53 • October 2009
11

APPENDIX
Table 3 Contact source by body region, for restrained and unrestrained occupants, and two age groups (frequency, weighted data).
Restrained4 to 12 years
13+ years
4 to 12 years
13+ years
4 to 12 years
13+ years
4 to 12 years
13+ years
4 to 12 years
13+ years
4 to 12 years
13+ years
4 to 12 years
13+ years
4 to 12 years
13+ years
4 to 12 years
13+ years
4 to 12 years
13+ years
4 to 12 years
13+ years
Side interior 151 293 444 2243 93 1290 201 1255 560 75 98 135B-pillar 186 675 86C/D-pillar 45 363 13 22 26Seat back 33 87 53 127 32 10 10 11Child seatSide window frame/sill 18 32 670Window glassOther vehicle 124Other occupants 3Roof/roof rail 41 6 41Non-contact 39Exterior object 81GroundOther 8
Head Chest Pelvis Abdomen Face NeckThigh Knee Arm BackLower leg
Unrestrained4 to 12 years
13+ years
4 to 12 years
13+ years
4 to 12 years
13+ years
4 to 12 years
13+ years
4 to 12 years
13+ years
4 to 12 years
13+ years
4 to 12 years
13+ years
4 to 12 years
13+ years
4 to 12 years
13+ years
4 to 12 years
13+ years
4 to 12 years
13+ years
Side interior 22 178 259 3147 19 942 778 7 237 17 88 183 134 26 65 887 174 1 76B-pillar 802 45 87 47 1 193C/D-pillar 81 687 13 13 2 317Seat back 327 291 79 136 46 79 14Child seat 22Side window frame/sill 91 22 29Window glass 50 291Other vehicle 295 88 88 88 88Other occupants 8 73 296 74Roof/roof rail 429 21Non-contact 8 13Exterior object 26 129 29Ground 171 124 82 398 109 28 10 32 16 350 31Other 48 62
Face NeckThigh Knee Arm BackLower legHead Chest Pelvis Abdomen
©Annals of Advances in Automotive Medicine
12