reaping what we sew - annualreports.com
TRANSCRIPT

Reaping What We Sew
2014 Annual Report
Technologies Limited
130 Spy Court, 2nd FloorMarkham, ON, Canada L3R 5H6
T. 905.477.3065www.excocorp.com
®
®
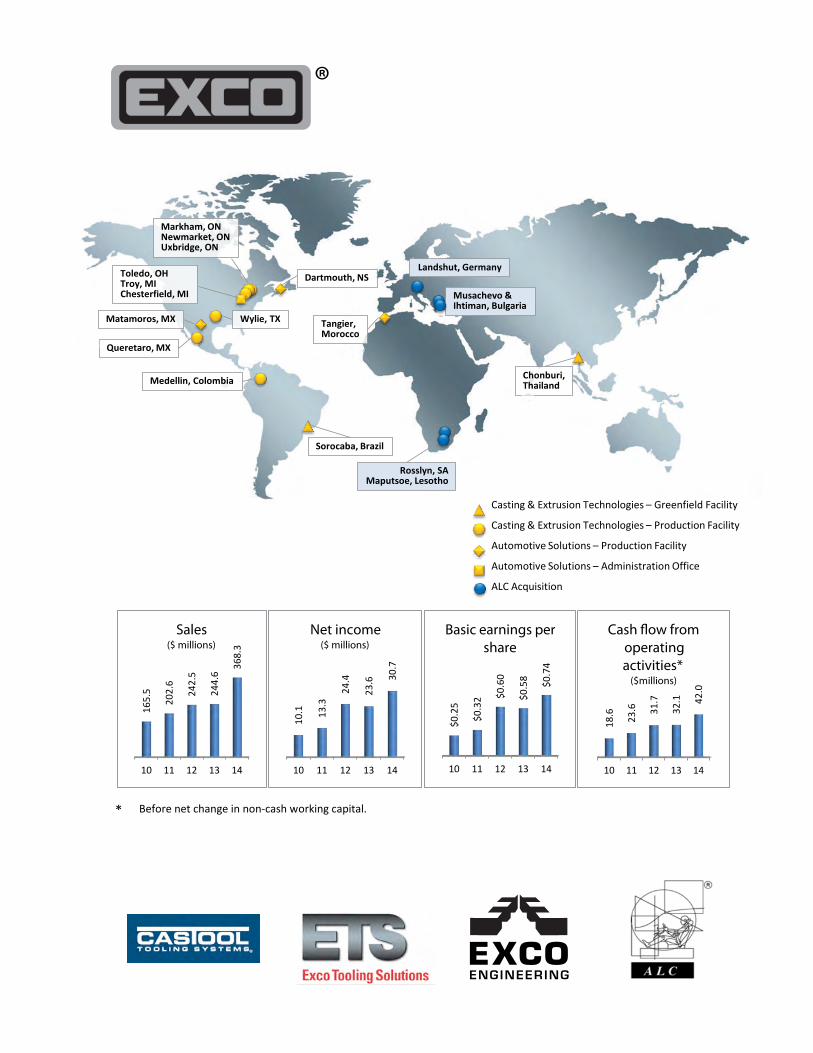
Casting & Extrusion Technologies – Greenfield Facility
Casting & Extrusion Technologies – Production Facility
Automotive Solutions – Production Facility
Automotive Solutions – Administration Office
ALC Acquisition
Dartmouth, NS
Markham, ON Newmarket, ON Uxbridge, ON
Toledo, OH Troy, MI Chesterfield, MI
Wylie, TX Matamoros, MX
Queretaro, MX
Medellin, Colombia
Sorocaba, Brazil
Tangier, Morocco
Chonburi, Thailand
Rosslyn, SA Maputsoe, Lesotho
Musachevo & Ihtiman, Bulgaria
Landshut, Germany
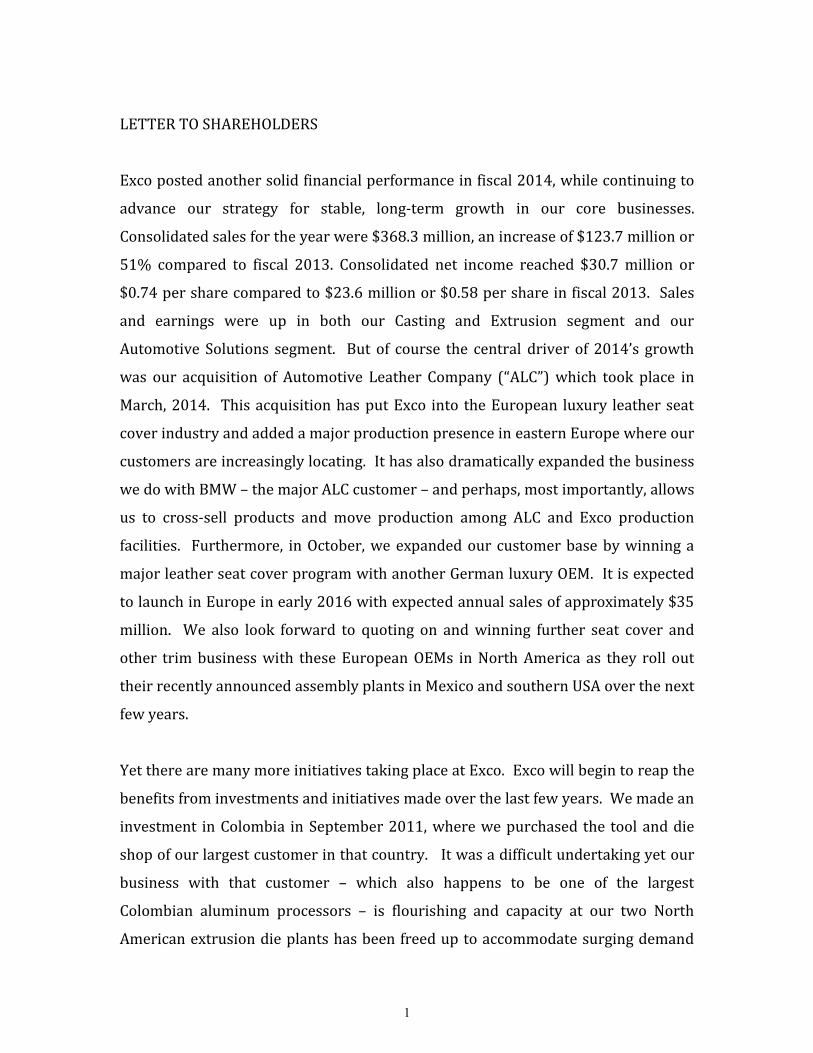
Before net change in non-cash working capital. *
®
10 11 12 13 14
165.
5
202.
6
242.
5
244.
6
368.
3
Sales ($ millions)
10 11 12 13 14
10.
1
13.
3 2
4.4
23.
6
30.
7
Net income ($ millions)
10 11 12 13 14
$0.2
5
$0.3
2 $0
.60
$0.5
8
$0.7
4
Basic earnings per share
10 11 12 13 14
18.
6
23.
6
31.
7
32.
1
42.
0
Cash �ow from operating activities*
($millions)
CORPORATE INFORMATION
Board of Directors Laurie T.F. Bennett, CPA, CA Corporate Director Edward H. Kernaghan, MSc Senior Investment Advisor Kernaghan & Partners Ltd. Nicole A. Kirk, BA, MBA Corporate Director Robert B. Magee, PEng Chairman Woodbridge Group Philip B. Matthews, MA, CPA, CA Corporate Director Brian A. Robbins, PEng President and CEO of the Company Peter van Schaik Founder and Chairman Van Rob Inc. ______________________________ Corporate Officers Brian A. Robbins, PEng President and CEO Paul Riganelli, MA, MBA, LLB Senior Vice President and COO Mary H. Nguyen, CPA, CMA Vice President Finance, CFO and Secretary
Transfer Agent and Registrar TMX Equity Transfer Services 200 University Avenue, Suite 300 Toronto, Ontario M5H 4H1 Phone: 416.361.0152 www.equitytransfer.com ______________________________ Auditors Ernst & Young LLP Chartered Accountants ______________________________ Stock Listing Toronto Stock Exchange (XTC) ______________________________ Corporate Office Exco Technologies Limited 130 Spy Court, 2nd Floor Markham, Ontario L3R 5H6 Phone: 905.477.3065 www.excocorp.com ______________________________ 2014 Annual Meeting The 2014 Annual Meeting for the Shareholders will be held at EXCO at 130 Spy Court, 2nd Floor, Markham, Ontario on Wednesday, January 28, 2015, at 4:30 pm.
LETTER TO SHAREHOLDERS
Exco posted another solid financial performance in fiscal 2014, while continuing to
advance our strategy for stable, long-term growth in our core businesses.
Consolidated sales for the year were $368.3 million, an increase of $123.7 million or
51% compared to fiscal 2013. Consolidated net income reached $30.7 million or
$0.74 per share compared to $23.6 million or $0.58 per share in fiscal 2013. Sales
and earnings were up in both our Casting and Extrusion segment and our
Automotive Solutions segment. But of course the central driver of 2014’s growth
was our acquisition of Automotive Leather Company (“ALC”) which took place in
March, 2014. This acquisition has put Exco into the European luxury leather seat
cover industry and added a major production presence in eastern Europe where our
customers are increasingly locating. It has also dramatically expanded the business
we do with BMW – the major ALC customer – and perhaps, most importantly, allows
us to cross-sell products and move production among ALC and Exco production
facilities. Furthermore, in October, we expanded our customer base by winning a
major leather seat cover program with another German luxury OEM. It is expected
to launch in Europe in early 2016 with expected annual sales of approximately $35
million. We also look forward to quoting on and winning further seat cover and
other trim business with these European OEMs in North America as they roll out
their recently announced assembly plants in Mexico and southern USA over the next
few years.
Yet there are many more initiatives taking place at Exco. Exco will begin to reap the
benefits from investments and initiatives made over the last few years. We made an
investment in Colombia in September 2011, where we purchased the tool and die
shop of our largest customer in that country. It was a difficult undertaking yet our
business with that customer – which also happens to be one of the largest
Colombian aluminum processors – is flourishing and capacity at our two North
American extrusion die plants has been freed up to accommodate surging demand
1

in the United States. Along the way Extrusion Colombia has also picked up many
other new customers in that region.
The same dynamic was at work in January 2013 when we acquired a tool and die
shop in Texas. With a significant market position in that growing regional US
market, our Extrusion Texas operation has met or exceeded our expectations while
further freeing up capacity in our two North American plants. Today we are reaping
the benefits of this strategy as sales in our extrusion die group have risen over 15%
over last year and pretax earnings have also increased over 23%. In fact, demand
has driven the need to expand this Texas facility and a new and larger plant is
currently under construction in Wylie, Texas to replace the rented premises. This
new facility will also allow the extrusion group to: 1) meet the growing demand
from ‘reshoring’ of extrusion capacity to North America from China caused by the
anti-dumping duties currently in place against China and 2) meet the growing
demand for aluminum extruded components in automobiles caused by the light
weighting of vehicles.
Our initiative in this group does not stop there. Last year we started construction on
a new state-of-the-art extrusion die facility in Brazil. It is a large dynamic market
with numerous vertically integrated aluminum mining and processing players.
These players could not be effectively serviced in the long term by our other die
plants owing to prohibitively high Brazilian import tariffs. In 2013 and 2014 we
spent $10.3 million on this facility and in June 2014 it produced its first die. Now,
we are poised to reap the benefits of this greenfield operation with anticipated
annual sales by 2017 in the range of $8 million.
Turning to our Castool business we can report that our unrelenting focus on
controlling and improving the thermo dynamic characteristics of consumable
components used in the injection systems of die cast and extrusion machinery has
further enhanced our long-standing leading position in this niche product market.
In response to strong demand from our Asian and European customers for our
2
products, we invested $8.7 million in 2013 and 2014 in a new production facility in
Thailand. This will dramatically reduce manufacturing costs, transport costs and
delivery lead times and signals our long-term commitment to servicing the large and
growing Asian market. This has also heightened our awareness of Asian raw
material and equipment suppliers which has allowed Castool to both improve its
product quality and reduce costs. In July 2014, we produced our first part.
Combined Castool sales in 2014 increased over 7% over last year. In 2015 we look
forward to reaping the benefits of this investment in Thailand and we are hopeful
that combined Castool sales will grow to the $52 million level.
The startup losses of the Brazil and Thailand greenfields in 2014 were high at
approximately $2.4 million pretax. These losses were partially offset by
improvement in earnings at our Colombian and Texas operations which moved from
a pretax loss of approximately $900 thousand in 2013 to a pretax profit of
approximately $650 thousand – an improvement of approximately $1.55 million.
The remaining business in the Casting and Extrusion segment – the large mould
business – has not built new plants since the greenfield plant was established in
Mexico in 2008. Instead our large mould business has focused almost exclusively on
meeting our automotive customers’ demands as they aggressively reengineer their
powertrain systems in order to meet ever more stringent fuel efficiency and CO2
reduction standards. We have long talked of the beneficial impact on our large
mould business of the 54.5 mpg mandate in the US by 2025. We are now only at the
start of this long and difficult process. Europe too this year has introduced average
fleet emission limits of CO2 to 95 grams per kilometer in 2021 – down from 132
grams per kilometer now. We have been awarded major next generation engine
block and 10 speed transmission programs which will keep us very busy for years to
come.
Yet powertrain is only one method of achieving these standards. Reducing vehicle
weight is another important imperative. This has driven the use of lighter weight
3
aluminum instead of steel to make structural automotive components. In 2014 we
have begun benefiting from this trend with our commercial production of silafont
crossmember and engine cradle die cast moulds. This is an exciting new technology
that is ideally suited to our large mould operation. It holds the promise of enormous
growth, which may dwarf our traditional tooling business for engine block and
transmission housings.
If we turn to our Automotive Solutions segment we are pleased to report that
segment sales more than doubled and pretax earnings increased over 40%. The
ALC operation, which was included in 7 months of the fiscal year, was certainly a
factor in this outcome; however, the other businesses – Polytech, Polydesign and
Neocon – also grew over 39% in 2014. Several factors seem to be at play here.
There is a discernible trend among OEMs to make their vehicles more appealing to
the buying public by better accessorizing and trimming the vehicle interiors. This
has caused an explosion in the number of new models being launched, and as
importantly, vehicle refreshes taking place. This results in more opportunity for
companies such as Exco which specialize in manufacturing niche interior trim and
accessories – everything from rigid and flexible cargo and restraint systems,
shift/brake boots, center console and instrument panel subassemblies,
headliner/visor subassemblies, glove box subassemblies, floor mats and a variety of
other injection molded subassemblies and cut and sew products. And let’s not
forget the extensive use of leather in not only luxury but also midmarket vehicles as
well. This dynamic has mitigated the impact on Exco of any potential weakness in
unit vehicle production levels. Even if vehicle production goes flat or declines
modestly in years to come we expect that our increased trim content per vehicle will
drive growth in our Automotive Solutions segment at a higher rate than that implied
by vehicle production.
One might ask why we are so confident that we will be successful in winning this
business. We would respond by saying that our niche is high labor content trim
4
subassemblies which the traditional large integrators are not ideally positioned to
efficiently service – indeed they typically subcontract these subassemblies to
suppliers such as Exco. Given our strategic location in some of the lowest cost
countries in the world – Mexico, Morocco, Bulgaria and Lesotho – we are confident
that we are among the lowest cost quality producers in North America and Europe.
Indeed we are increasingly finding that we are even competitive against Chinese
competition.
No discussion of these global initiatives is complete without mentioning our human
resources which are so critical to our ability to execute our plans.
We have long been aware of the complexities and challenges of building new
production facilities in faraway places where language, time zones and business
practices are very different. This requires capable and dedicated people who are
prepared to step forward, accept responsibility and ‘make things happen.’ At Exco
the past year has demonstrated we are fortunate in having a multicultural
workforce in our core operations that are both very comfortable operating in Asia,
Latin America and South America and are also familiar with our products and
manufacturing processes. Furthermore, we have accumulated much experience
from our long history of successfully operating in emerging countries such as
Mexico and Morocco. Given these seasoned and diverse human resources we, at
Exco, continue to be confident that we have the resources to get the job done.
Of course none of these opportunities can be exploited without our ability to
generate strong profit. We are fundamentally averse to compromising on our strong
financial performance as from it flows our ability to take advantage of these market
opportunities without complicated and protracted discussions with lenders and
suppliers. We are also mindful of our need to reward our shareholders by
continuing our practice of paying reasonable dividends.
5

We expect Exco will achieve strong and steady performance as we gear up to create
a larger and more diversified platform for sustainable earnings growth. Market
fundamentals remain positive in our core markets with steady vehicle production,
growing OEM demand and steady introduction of new vehicles and powertrains
supporting our prospects in both the Casting and Extrusion and Automotive
Solutions segments.
Exco’s dedicated employees, now numbering 5,009 strong and growing, have
enabled Exco to deliver on its commitments during a very busy year. I would also
like to thank the Board of Directors for their invaluable insight and guidance in
helping to chart Exco’s course, as well as the many customers whose loyalty has
been so vital to our success.
Sincerely,
Brian A. Robbins
President and CEO
6
CONTENTS
8
Management's Discussion and Analysis
23
Management's Responsibility for Financial Reporting
24
Independent Auditors’ Report
25
Consolidated Financial Statements
29
Notes to Consolidated Financial Statements
This Management’s Discussion and Analysis of Financial Condition and Results of Operations (“MD&A”) should
be read in conjunction with the consolidated financial statements and related notes for the year ended September
30, 2014. This MD&A has been prepared as of November 26, 2014.
Additional information on Exco, including copies of its continuous disclosure materials such as its Annual
Information Form, is available on its website at www.excocorp.com or through the SEDAR website at
www.sedar.com .
In this MD&A, reference is made to EBITDA and adjusted net income and adjusted earnings per share, which are
not measures of financial performance under International Financial Reporting Standards (“IFRS”). Exco
calculates EBITDA as earnings before interest, taxes, depreciation and amortization, and calculates adjusted net
income and adjusted earnings per share as presented in Table A herein. EBITDA, adjusted net income and adjusted
earnings per share are used by management, from time to time, to facilitate period-to-period operating comparisons
and we believe some investors and analysts use them as well. These measures, as calculated by Exco, may not be
comparable to similarly titled measures used by other companies.
CAUTIONARY STATEMENT
Information in this document relating to projected growth and financial performance of the Company’s business
units, contribution of our start-up business units, contribution of awarded programs yet to be launched, margin
performance, financial performance of acquisitions and operating efficiencies are forward-looking statements.
Readers are cautioned not to place undue reliance on forward-looking statements found mainly in the Outlook
section but also elsewhere throughout this document. These forward-looking statements are based on our plans,
intentions or expectations which are based on, among other things, assumptions about the number of automobiles
produced in North America and Europe, the number of extrusion dies required in North America and South
America, the rate of economic growth in North America, Europe and emerging market countries, investment by
OEMs in drivetrain architecture and other initiatives intended to reduce fuel consumption and/or the weight of
automobiles, weakening raw material prices, continuing economic recovery, currency fluctuations which may in fact
not occur and the rate at which our new operations in Brazil and Thailand achieve profitability. These forward-
looking statements include known and unknown risks, uncertainties, assumptions and other factors which may cause
actual results or achievements to be materially different from those expressed or implied. For a more extensive
discussion of Exco’s risks and uncertainties see the ‘Risks and Uncertainties’ section in this Annual Report, our
7
Annual Information Form (“AIF”) and other reports and securities filings made by the Company. This information
is available at www.sedar.com.
While Exco believes that the expectations expressed by such forward-looking statements are reasonable, we cannot
assure that they will be correct. In evaluating forward-looking information and statements, readers should carefully
consider the various factors which could cause actual results or events to differ materially from those indicated in
the forward-looking information and statements. Readers are cautioned that the foregoing list of important factors is
not exhaustive. Furthermore, the Company will update its disclosure upon publication of each fiscal quarter’s
financial results and otherwise disclaims any obligations to update publicly or otherwise revise any such factors or
any of the forward-looking information or statements contained herein to reflect subsequent information, events or
developments, changes in risk factors or otherwise.
MANAGEMENT’S DISCUSSION AND ANALYSIS
CORE BUSINESSES
Exco is a global designer, developer and manufacturer of dies, moulds, components and assemblies, and consumable
equipment for the die-cast, extrusion and automotive industries. The Company reports in two business segments.
The Casting and Extrusion segment designs, develops and manufactures die-casting and extrusion tooling and
consumable parts for both aluminum die-casting and aluminum extrusion machines. Operations are based in North
and South America and Thailand and serve automotive and industrial markets around the world. Exco is a leader in
most of these markets. In die-casting and extrusion tooling markets, Exco is further entrenching itself by reducing
lead times and manufacturing costs through design and process enhancements. In the machine consumables market,
Exco is leveraging its long tradition as a reliable, high-quality supplier of consumable components for the injection
system of die-cast machines and aluminum extrusion presses by evaluating, coordinating and ultimately maximizing
customers’ overall equipment performance and longevity. The Canadian, European and United States markets are
Exco’s primary focus for die-cast moulds, extrusion dies and machine consumable parts, although South America
and Asia are also being developed.
The Automotive Solutions segment designs, develops and manufactures automotive interior trim components and
assemblies primarily for passenger and light truck vehicles. The Polytech and Polydesign businesses manufacture
synthetic net and other cargo restraint products, injection-moulded components, shift/ brake boots, related console
components and assemblies. Polydesign is also a manufacturer of injection moulded interior trim and instrument
panel components, seat covers, head rests and other cut and sew products. Neocon is a supplier of soft plastic trunk
trays and rigid plastic trunk organizer systems. ALC is a manufacturer of leather/fabric seat covers for automobile
interiors. Automotive Solutions facilities are located in Canada, the United States, Mexico, Bulgaria, Morocco,
South Africa and Lesotho supplying the North American, European and Asian automotive markets.
VISION AND STRATEGY
For the past few years, Exco has pursued several key strategies designed to achieve sustainable revenue and earnings
growth. These include: (1) strengthening our technological leadership and competitive position in our chosen
markets, (2) minimizing our cost structure, (3) shifting our productive capacity to low-cost jurisdictions in closer
proximity to our customers’ operations, (4) diversifying our revenue base with new products and services that
leverage our competitive strengths, and (5) capitalizing on growth opportunities in selected developing markets.
8
The performance of the North American automotive industry continued to improve in fiscal 2014, with most OEMs
and tier one suppliers having strong sales and credit ratings. Production of light vehicles continued to increase,
driven by strong economic demand and widespread introduction of new vehicle models. Automobile manufacturers
continue to invest in the development and production of more innovative and fuel-efficient powertrains in response
to consumer demand, as well as U.S. government-mandated Corporate Average Fuel Economy (“CAFE”) standards
that require fleet average fuel economy of 54.5 miles per gallon by 2025. These developments continue to bode well
for our large mould business creating promising new opportunities for growth. During fiscal 2014, Exco
successfully extended its technological leadership into the production of die-cast moulds for structural parts that use
an advanced aluminum alloy called silafont. To date, Exco has shipped numerous silafont moulds and has orders for
various additional programs.
The balance of Exco’s Casting and Extrusion segment also performed well amid steady demand in automotive and
industrial markets. Our Castool business continues to grow in North America and overseas. Surging global demand
for these products has prompted Castool to build a production facility in Asia to more efficiently meet this demand.
Our extrusion die businesses are also positioned to meet increasing demand occasioned by the imposition of anti-
dumping duties against Chinese imports into Canada and the US on aluminum extrusions and by the general
migration to aluminum content on automobiles. In fact, our decision to establish ourselves in Colombia and Texas
has proven prescient as strong demand for extrusion dies in Canada and the USA has enabled us to transfer our
South American accounts from Extrusion Canada (Markham) to Extrusion Colombia. Extrusion Texas has also
helped Extrusion USA with surging demand for extrusion dies in the US market.
Higher vehicle production volumes also propelled sales and profit in the Automotive Solutions interior trim segment
as our North American units, Neocon and Polytech, kept pace with strong order flow in North America.
Furthermore, a higher proportion of the vehicles produced are refreshed or completely new models. This enables us
to increase our content per vehicle and also replace older programs which have been ‘costed down’ over the years
with new programs reflecting current costs and better margins. Sales and profit at Polydesign also improved
dramatically as the lingering recession in Europe seems to be receding and new program launches kicked in during
the year.
While the North American automobile industry is well positioned for steady growth, our opinion continues to be that
prospects for the larger economy here, and in Europe, are nonetheless limited by several structural trends. These
include: a steadily aging population, modest economic growth, and historically high levels of consumer and
government debt. As a result, it is likely that the U.S. and the Euro zone economies will, over the long term,
underperform the economies of most developing countries – particularly, in Latin and South America and Southeast
Asia.
In recognition of these trends, Exco reaffirms its commitment to establishing a larger presence in these markets to
plant the seeds of revenue and earnings growth for future years. Our focus has been on relatively low-risk
opportunities in markets that are already familiar to us, and which leverage our technological leadership and existing
product and service capabilities.
Exco has exported to these emerging markets for many years. We have also established several plants in low-cost
jurisdictions to support the manufacturing of products for export to developed countries. We have now reached the
point in our evolution where it makes sense to both manufacture and sell our products in certain developing
countries where the industrial base is expanding to keep pace with growing domestic demand. The increasingly
sophisticated customers in these emerging markets are looking for superior quality, innovative product solutions and
the benefit of local sourcing, product development and service. By manufacturing locally, we also significantly
reduce transportation costs and mitigate the effect of unfavorable currency trends.
9

This is the rationale for our greenfield facilities in Brazil and Thailand. In November 2012, we announced the
construction of a new extrusion die production facility near Sao Paulo, Brazil. It has been producing since June
2014. It will serve existing and potential extrusion die customers in Brazil’s rapidly growing industrial base. In
January 2013, we also announced construction of a new Castool facility in Thailand to better serve Castool’s current
export customers and take advantage of lower production and shipping costs to Asian and European customers. This
facility has been producing since July 2014.
Notwithstanding Exco’s investment in developing markets, we also continue to look for selective acquisitions that
will bolster our position and enhance profitability in North America and Europe. In January 2013, we acquired an
extrusion die manufacturer located in Wylie Texas which services the south-central region of the United States. The
acquisition has given us a strong presence in a distinct and growing geographic market segment where proximity to
customers is a key element for success. It has also allowed us to absorb overflow business from our Extrusion USA
plant in Michigan – so much so that in 2015 we will be expanding this operation with a new and larger facility.
On March 1, 2014 we also purchased Automotive Leather Company which specializes in the manufacture and
export of luxury leather interior trim components to the middle and luxury automotive sector. The primary customer
is BMW and its tier one supplier Faurecia although other German OEMs and their tiers are also customers. This
acquisition gives us a facility in Eastern Europe, to which European automotive manufacturing has migrated, and a
central European technical and service centre from which we can better serve our European customers.
Looking ahead, light vehicle production in North America is projected to remain robust in 2015 despite the gradual
rate of growth in the larger economy. Market fundamentals also remain strong. There is still significant demand for
new automobiles as the average age of cars on the road in the USA continues to climb. At the same time,
increasingly stringent mileage and co2 emission requirements are expected to keep fuelling the steady pace of new
model and global platform introductions in both North America and Europe in the year ahead. These developments
will continue to benefit both our Casting and Extrusion and Automotive Solutions segments.
2014 RESULTS
Consolidated Results - Sales
Annual sales totalled $368.3 million compared to $244.6 million last year – an increase of $123.6 million or 51%
over last year. Included in the current year was $83.9 million in sales from ALC acquired in March 2014. Excluding
sales from ALC, annual sales totalled $284.3 million – an increase of $39.7 million or 16% over last year. In
addition, over the year, the US dollar has appreciated 9% against the Canadian dollar contributing $10.4 million in
additional sales to the current year. Since the ALC acquisition date, the Euro depreciated against the Canadian
dollar by 7% reducing sales from ALC by approximately $2.4 million.
10
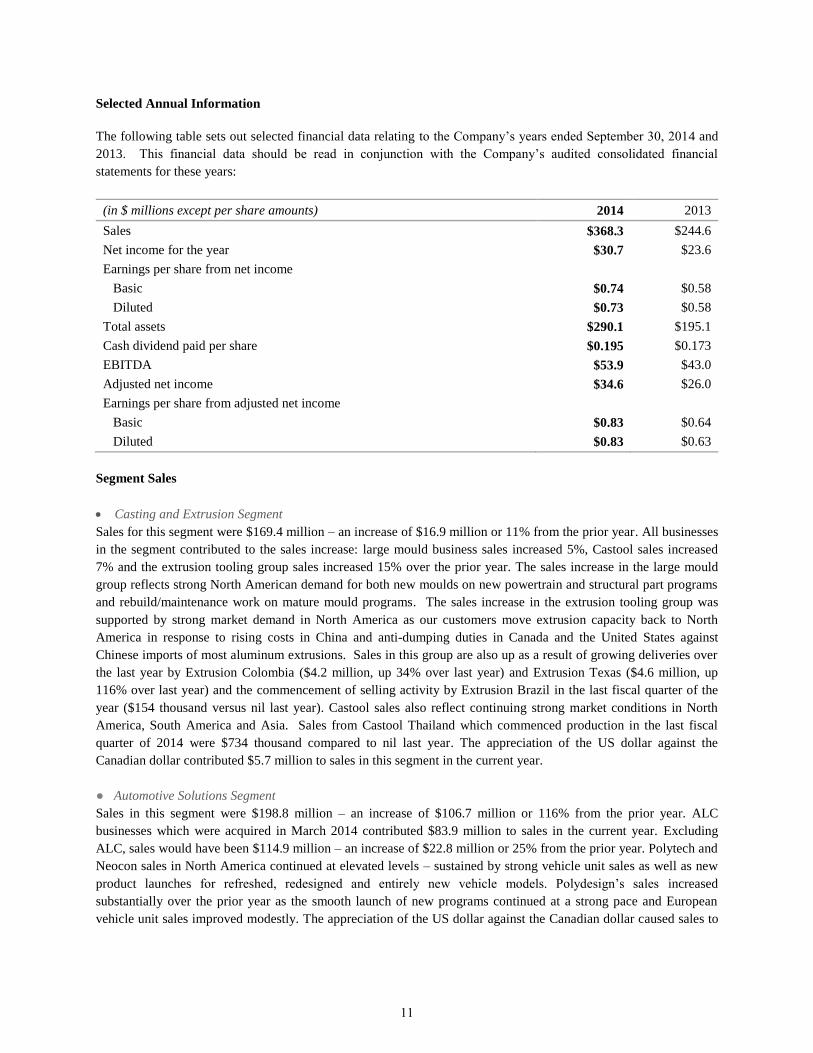
Selected Annual Information
The following table sets out selected financial data relating to the Company’s years ended September 30, 2014 and
2013. This financial data should be read in conjunction with the Company’s audited consolidated financial
statements for these years:
(in $ millions except per share amounts) 2014 2013
Sales $368.3 $244.6
Net income for the year $30.7 $23.6
Earnings per share from net income
Basic $0.74 $0.58
Diluted $0.73 $0.58
Total assets $290.1 $195.1
Cash dividend paid per share $0.195 $0.173
EBITDA $53.9 $43.0
Adjusted net income $34.6 $26.0
Earnings per share from adjusted net income
Basic $0.83 $0.64
Diluted $0.83 $0.63
Segment Sales
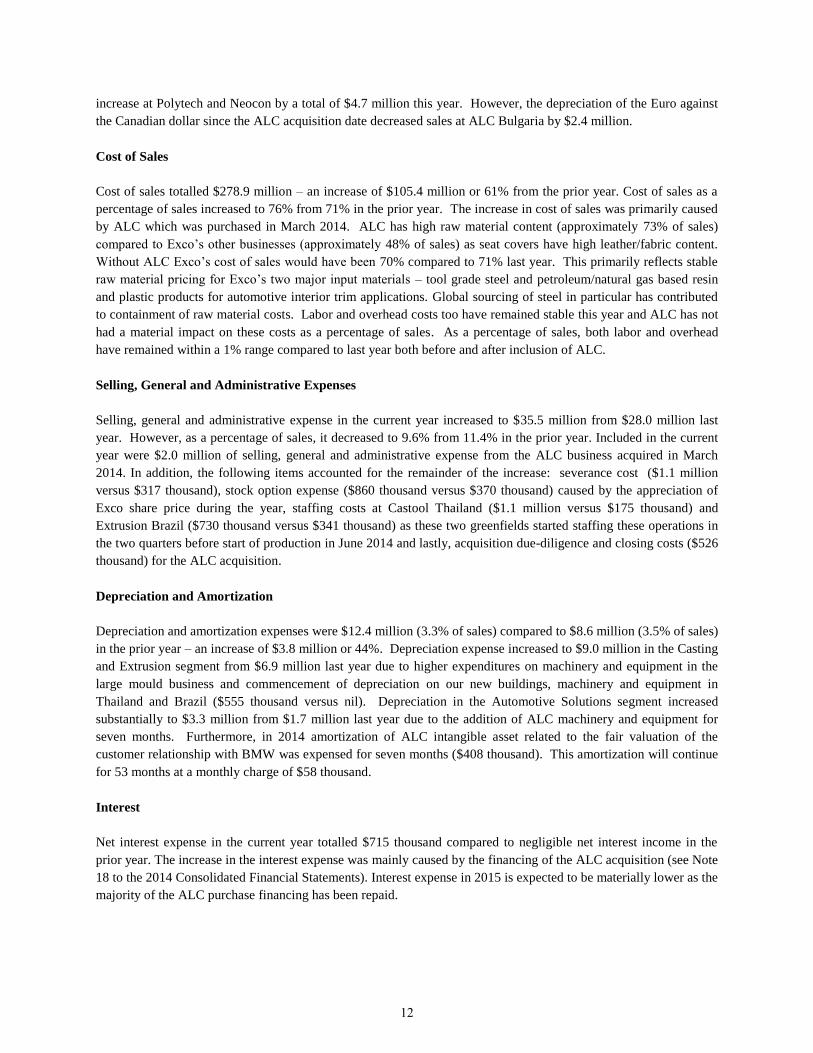
Casting and Extrusion Segment
Sales for this segment were $169.4 million – an increase of $16.9 million or 11% from the prior year. All businesses
in the segment contributed to the sales increase: large mould business sales increased 5%, Castool sales increased
7% and the extrusion tooling group sales increased 15% over the prior year. The sales increase in the large mould
group reflects strong North American demand for both new moulds on new powertrain and structural part programs
and rebuild/maintenance work on mature mould programs. The sales increase in the extrusion tooling group was
supported by strong market demand in North America as our customers move extrusion capacity back to North
America in response to rising costs in China and anti-dumping duties in Canada and the United States against
Chinese imports of most aluminum extrusions. Sales in this group are also up as a result of growing deliveries over
the last year by Extrusion Colombia ($4.2 million, up 34% over last year) and Extrusion Texas ($4.6 million, up
116% over last year) and the commencement of selling activity by Extrusion Brazil in the last fiscal quarter of the
year ($154 thousand versus nil last year). Castool sales also reflect continuing strong market conditions in North
America, South America and Asia. Sales from Castool Thailand which commenced production in the last fiscal
quarter of 2014 were $734 thousand compared to nil last year. The appreciation of the US dollar against the
Canadian dollar contributed $5.7 million to sales in this segment in the current year.
● Automotive Solutions Segment
Sales in this segment were $198.8 million – an increase of $106.7 million or 116% from the prior year. ALC
businesses which were acquired in March 2014 contributed $83.9 million to sales in the current year. Excluding
ALC, sales would have been $114.9 million – an increase of $22.8 million or 25% from the prior year. Polytech and
Neocon sales in North America continued at elevated levels – sustained by strong vehicle unit sales as well as new
product launches for refreshed, redesigned and entirely new vehicle models. Polydesign’s sales increased
substantially over the prior year as the smooth launch of new programs continued at a strong pace and European
vehicle unit sales improved modestly. The appreciation of the US dollar against the Canadian dollar caused sales to
11
increase at Polytech and Neocon by a total of $4.7 million this year. However, the depreciation of the Euro against
the Canadian dollar since the ALC acquisition date decreased sales at ALC Bulgaria by $2.4 million.
Cost of Sales
Cost of sales totalled $278.9 million – an increase of $105.4 million or 61% from the prior year. Cost of sales as a
percentage of sales increased to 76% from 71% in the prior year. The increase in cost of sales was primarily caused
by ALC which was purchased in March 2014. ALC has high raw material content (approximately 73% of sales)
compared to Exco’s other businesses (approximately 48% of sales) as seat covers have high leather/fabric content.
Without ALC Exco’s cost of sales would have been 70% compared to 71% last year. This primarily reflects stable
raw material pricing for Exco’s two major input materials – tool grade steel and petroleum/natural gas based resin
and plastic products for automotive interior trim applications. Global sourcing of steel in particular has contributed
to containment of raw material costs. Labor and overhead costs too have remained stable this year and ALC has not
had a material impact on these costs as a percentage of sales. As a percentage of sales, both labor and overhead
have remained within a 1% range compared to last year both before and after inclusion of ALC.
Selling, General and Administrative Expenses
Selling, general and administrative expense in the current year increased to $35.5 million from $28.0 million last
year. However, as a percentage of sales, it decreased to 9.6% from 11.4% in the prior year. Included in the current
year were $2.0 million of selling, general and administrative expense from the ALC business acquired in March
2014. In addition, the following items accounted for the remainder of the increase: severance cost ($1.1 million
versus $317 thousand), stock option expense ($860 thousand versus $370 thousand) caused by the appreciation of
Exco share price during the year, staffing costs at Castool Thailand ($1.1 million versus $175 thousand) and
Extrusion Brazil ($730 thousand versus $341 thousand) as these two greenfields started staffing these operations in
the two quarters before start of production in June 2014 and lastly, acquisition due-diligence and closing costs ($526
thousand) for the ALC acquisition.
Depreciation and Amortization
Depreciation and amortization expenses were $12.4 million (3.3% of sales) compared to $8.6 million (3.5% of sales)
in the prior year – an increase of $3.8 million or 44%. Depreciation expense increased to $9.0 million in the Casting
and Extrusion segment from $6.9 million last year due to higher expenditures on machinery and equipment in the
large mould business and commencement of depreciation on our new buildings, machinery and equipment in
Thailand and Brazil ($555 thousand versus nil). Depreciation in the Automotive Solutions segment increased
substantially to $3.3 million from $1.7 million last year due to the addition of ALC machinery and equipment for
seven months. Furthermore, in 2014 amortization of ALC intangible asset related to the fair valuation of the
customer relationship with BMW was expensed for seven months ($408 thousand). This amortization will continue
for 53 months at a monthly charge of $58 thousand.
Interest
Net interest expense in the current year totalled $715 thousand compared to negligible net interest income in the
prior year. The increase in the interest expense was mainly caused by the financing of the ALC acquisition (see Note
18 to the 2014 Consolidated Financial Statements). Interest expense in 2015 is expected to be materially lower as the
majority of the ALC purchase financing has been repaid.
12
Income Taxes
Exco’s effective income tax rate was 25.0% compared to an effective income tax rate of 31.2% in fiscal 2013.
Included in the current year’s income tax expense was $220 withholding tax paid on the repatriation of surplus from
a subsidiary. Included in the prior year was $1.5 million withholding tax paid on the repatriation of surplus from a
subsidiary. Excluding these tax charges, Exco’s adjusted effective income tax rate in the current year would have
been 24.4% compared to 26.8% in the prior year. The lower adjusted effective income tax rate in the current year
was due mainly to higher earnings contribution from lower tax jurisdiction such as Morocco and Bulgaria (see Note
14 to the 2014 Consolidated Financial Statements).
Net Income
Consolidated
The Company reported consolidated net income of $30.7 million or basic earnings of $0.74 per share and diluted
earnings of $0.73 per share compared to consolidated net income of $23.6 million or basic and diluted earnings of
$0.58 per share last year – an increase of 30%.
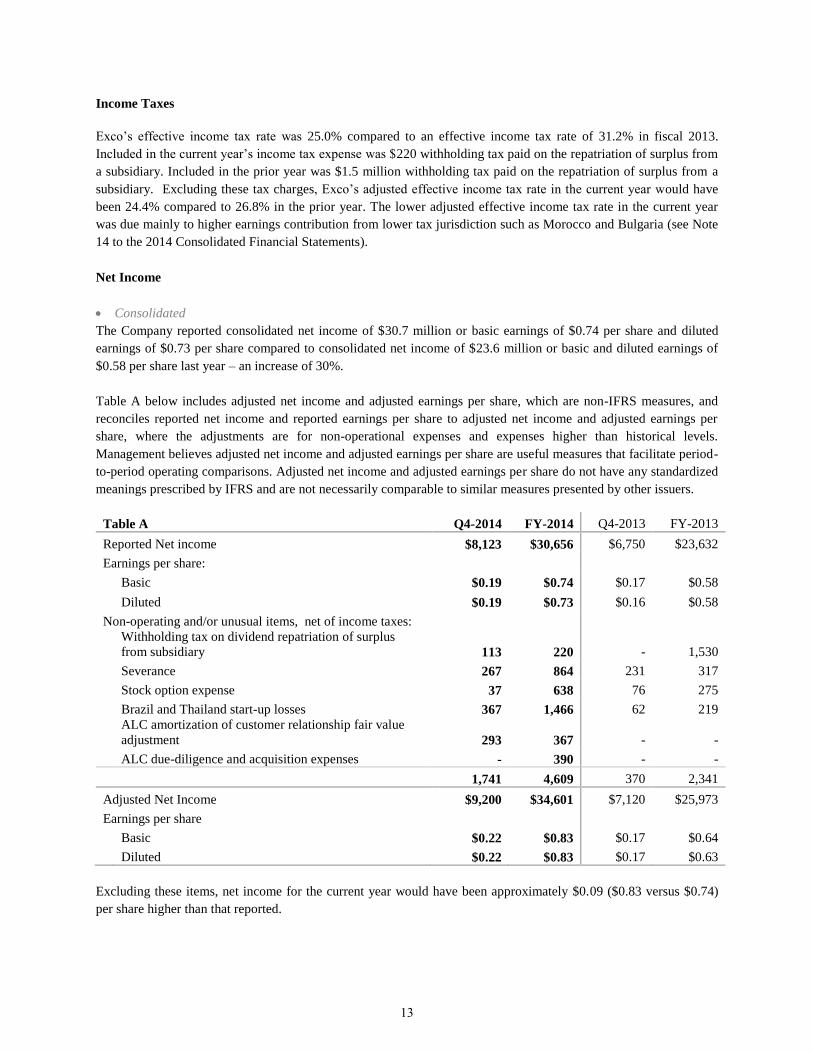
Table A below includes adjusted net income and adjusted earnings per share, which are non-IFRS measures, and
reconciles reported net income and reported earnings per share to adjusted net income and adjusted earnings per
share, where the adjustments are for non-operational expenses and expenses higher than historical levels.
Management believes adjusted net income and adjusted earnings per share are useful measures that facilitate period-
to-period operating comparisons. Adjusted net income and adjusted earnings per share do not have any standardized
meanings prescribed by IFRS and are not necessarily comparable to similar measures presented by other issuers.
Table A Q4-2014 FY-2014 Q4-2013 FY-2013
Reported Net income $8,123 $30,656 $6,750 $23,632
Earnings per share:
Basic $0.19 $0.74 $0.17 $0.58
Diluted $0.19 $0.73 $0.16 $0.58
Non-operating and/or unusual items, net of income taxes:
Withholding tax on dividend repatriation of surplus
from subsidiary 113 220 - 1,530
Severance 267 864 231 317
Stock option expense 37 638 76 275
Brazil and Thailand start-up losses 367 1,466 62 219
ALC amortization of customer relationship fair value
adjustment 293 367
-
-
ALC due-diligence and acquisition expenses - 390 - -
1,741 4,609 370 2,341
Adjusted Net Income $9,200 $34,601 $7,120 $25,973
Earnings per share
Basic $0.22 $0.83 $0.17 $0.64
Diluted $0.22 $0.83 $0.17 $0.63
Excluding these items, net income for the current year would have been approximately $0.09 ($0.83 versus $0.74)
per share higher than that reported.
13
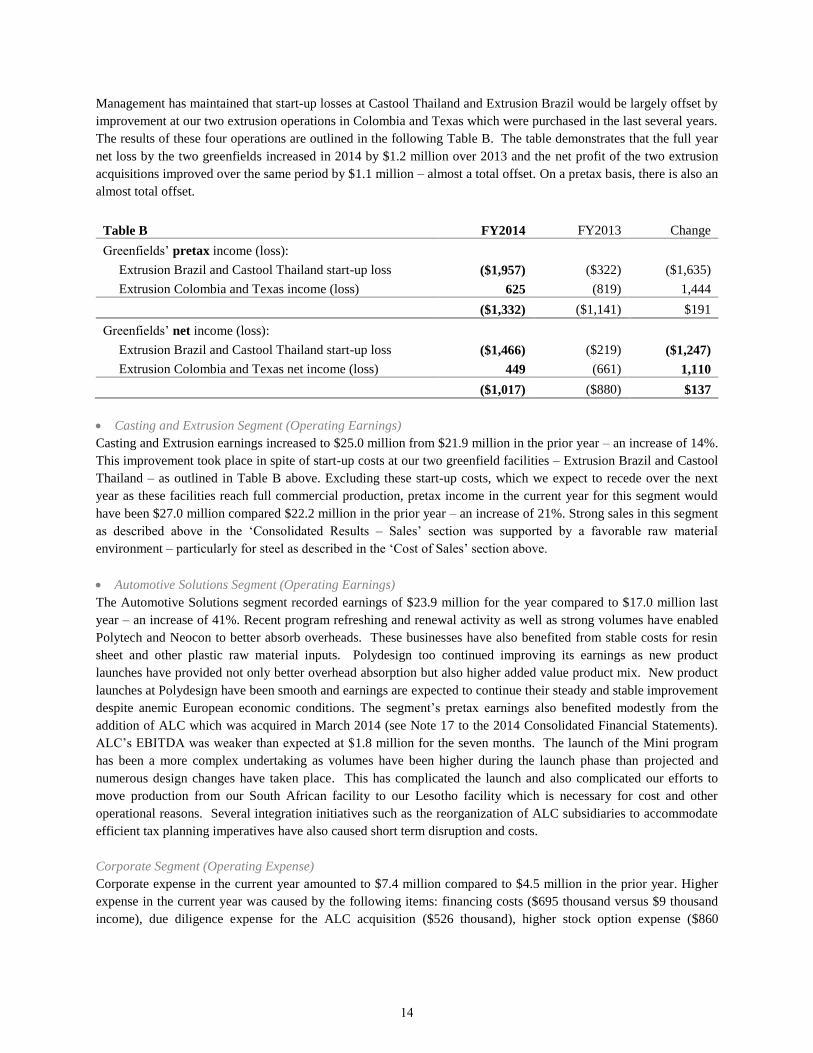
Management has maintained that start-up losses at Castool Thailand and Extrusion Brazil would be largely offset by
improvement at our two extrusion operations in Colombia and Texas which were purchased in the last several years.
The results of these four operations are outlined in the following Table B. The table demonstrates that the full year
net loss by the two greenfields increased in 2014 by $1.2 million over 2013 and the net profit of the two extrusion
acquisitions improved over the same period by $1.1 million – almost a total offset. On a pretax basis, there is also an
almost total offset.
Table B FY2014 FY2013 Change
Greenfields’ pretax income (loss):
Extrusion Brazil and Castool Thailand start-up loss ($1,957) ($322) ($1,635)
Extrusion Colombia and Texas income (loss) 625 (819) 1,444
($1,332) ($1,141) $191
Greenfields’ net income (loss):
Extrusion Brazil and Castool Thailand start-up loss ($1,466) ($219) ($1,247)
Extrusion Colombia and Texas net income (loss) 449 (661) 1,110
($1,017) ($880) $137
Casting and Extrusion Segment (Operating Earnings)
Casting and Extrusion earnings increased to $25.0 million from $21.9 million in the prior year – an increase of 14%.
This improvement took place in spite of start-up costs at our two greenfield facilities – Extrusion Brazil and Castool
Thailand – as outlined in Table B above. Excluding these start-up costs, which we expect to recede over the next
year as these facilities reach full commercial production, pretax income in the current year for this segment would
have been $27.0 million compared $22.2 million in the prior year – an increase of 21%. Strong sales in this segment
as described above in the ‘Consolidated Results – Sales’ section was supported by a favorable raw material
environment – particularly for steel as described in the ‘Cost of Sales’ section above.
Automotive Solutions Segment (Operating Earnings)
The Automotive Solutions segment recorded earnings of $23.9 million for the year compared to $17.0 million last
year – an increase of 41%. Recent program refreshing and renewal activity as well as strong volumes have enabled
Polytech and Neocon to better absorb overheads. These businesses have also benefited from stable costs for resin
sheet and other plastic raw material inputs. Polydesign too continued improving its earnings as new product
launches have provided not only better overhead absorption but also higher added value product mix. New product
launches at Polydesign have been smooth and earnings are expected to continue their steady and stable improvement
despite anemic European economic conditions. The segment’s pretax earnings also benefited modestly from the
addition of ALC which was acquired in March 2014 (see Note 17 to the 2014 Consolidated Financial Statements).
ALC’s EBITDA was weaker than expected at $1.8 million for the seven months. The launch of the Mini program
has been a more complex undertaking as volumes have been higher during the launch phase than projected and
numerous design changes have taken place. This has complicated the launch and also complicated our efforts to
move production from our South African facility to our Lesotho facility which is necessary for cost and other
operational reasons. Several integration initiatives such as the reorganization of ALC subsidiaries to accommodate
efficient tax planning imperatives have also caused short term disruption and costs.
Corporate Segment (Operating Expense)
Corporate expense in the current year amounted to $7.4 million compared to $4.5 million in the prior year. Higher
expense in the current year was caused by the following items: financing costs ($695 thousand versus $9 thousand
income), due diligence expense for the ALC acquisition ($526 thousand), higher stock option expense ($860
14
thousand versus $370 thousand) and higher incentive plan provision related to higher earnings ($1.5 million versus
$1.3 million). Also included in the prior year was $386 thousand SR&ED credits received compared to none in the
current year.
EBITDA
This metric has acquired increasing significance as the acquisition of ALC has created significant intangible assets
which must be amortized and therefore impact Exco’s net income. Amortization, like depreciation, is a non-cash
expense and the EBITDA metric isolates the impact of amortization so that the underlying operational performance
of the enterprise can be more readily understood. EBITDA in the current year amounted to $53.9 compared to
$43.0 million in the prior year – an increase of 26%. EBITDA as a percentage of sales decreased from 18% last
year to 15% this year as a result of the ALC acquisition, which has high leather /raw material content and fewer
depreciable fixed assets and consequently lower EBITDA margin than Exco’s traditional products. This dynamic
also accounts for the lower EBITDA margin in the Automotive Solutions segment (14% compared to 20% last year)
although EBITDA increased to $27.4 million from $18.7 million last year – an increase of 46%. In the Casting and
Extrusion segment, EBITDA grew by 18% ($34.1 million compared to $28.8 million last year).
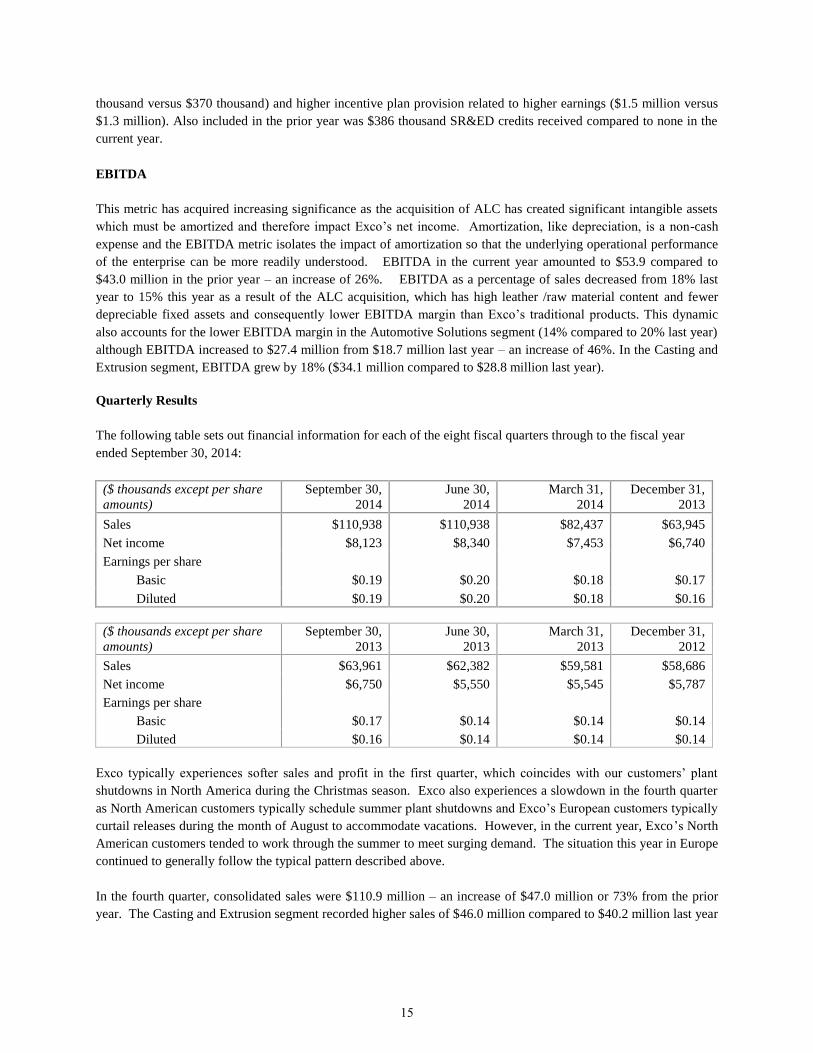
Quarterly Results
The following table sets out financial information for each of the eight fiscal quarters through to the fiscal year
ended September 30, 2014:
($ thousands except per share
amounts)
September 30,
2014
June 30,
2014
March 31,
2014
December 31,
2013
Sales $110,938 $110,938 $82,437 $63,945
Net income $8,123 $8,340 $7,453 $6,740
Earnings per share
Basic $0.19 $0.20 $0.18 $0.17
Diluted $0.19 $0.20 $0.18 $0.16
($ thousands except per share
amounts)
September 30,
2013
June 30,
2013
March 31,
2013
December 31,
2012
Sales $63,961 $62,382 $59,581 $58,686
Net income $6,750 $5,550 $5,545 $5,787
Earnings per share
Basic $0.17 $0.14 $0.14 $0.14
Diluted $0.16 $0.14 $0.14 $0.14
Exco typically experiences softer sales and profit in the first quarter, which coincides with our customers’ plant
shutdowns in North America during the Christmas season. Exco also experiences a slowdown in the fourth quarter
as North American customers typically schedule summer plant shutdowns and Exco’s European customers typically
curtail releases during the month of August to accommodate vacations. However, in the current year, Exco’s North
American customers tended to work through the summer to meet surging demand. The situation this year in Europe
continued to generally follow the typical pattern described above.
In the fourth quarter, consolidated sales were $110.9 million – an increase of $47.0 million or 73% from the prior
year. The Casting and Extrusion segment recorded higher sales of $46.0 million compared to $40.2 million last year
15
– an increase of 14%. The Automotive Solutions segment experienced a 173% increase in sales from $23.7 million
last year to $64.9 million. Included in the fourth quarter was $34.3 million of sales from ALC. Excluding ALC, the
Automotive Solutions segment’s sales were $30.7 million – an increase of 29% from the same quarter last year.
The Company’s fourth quarter consolidated net income increased to $8.1 million or basic and diluted earnings of
$0.19 per share compared to $6.8 million or basic earnings of $0.17 per share and diluted earnings of $0.16 per
share in the same quarter last year – an increase of 11%. Fourth quarter pretax earnings increased in the Casting and
Extrusion segment by $1.7 million or 34% over the same quarter last year as the favorable business environment
discussed above with respect to the full year results continued to manifest themselves in the fourth quarter. Fourth
quarter pretax earnings also increased in the Automotive Solutions segment by $1.8 million or 41% over the same
quarter last year reflecting a continuation of the strong performance experienced throughout the year. ALC reported
a loss of $568 thousand in the fourth quarter caused partly by those reasons set forth in the ‘Net Income –
Automotive Solutions Segment (Operating Earnings)’ section, but also by low sales in August when BMW
experienced its plant closures for summer holidays. The Corporate segment in the fourth quarter incurred $1.7
million in expense compared to $841thousand due to the same factors discussed under Net Income – Corporate
Segment (Operating Expense) above.
FINANCIAL RESOURCES, LIQUIDITY AND CAPITAL RESOURCES
Cash Flows from Operating Activities
Operating cash flow before net changes in non-cash working capital increased this year to $42.0 million from $32.1
million in fiscal 2013. This increase is primarily the result of a 30% increase in Net Income and a 44% increase in
depreciation and amortization caused by: a) amortization of ALC intangible assets and b) depreciation on our
greenfield assets which commenced in the last half of fiscal 2014. For further detail see ‘Depreciation and
Amortization’ section above. Stock based compensation which is a non-cash expense linked to the valuation of
outstanding stock options and deferred stock units was also up 132% over last year in keeping with Exco’s share
price increase over that period.
Net change in non-cash working capital was $1.6 million cash used compared to $9.2 million cash used last year.
The non-cash working capital acquired from the ALC acquisition is included in the cash used in investing activities
discussed under ‘Cash Flows from Investing Activities - Capital Expenditures’ section below. Excluding ALC,
there were no material changes in non-cash working capital this year end compared to last year end. Cash provided
by operating activities increased to $40.4 million compared to $22.9 million last year – an increase of 77%.
Cash Flows from Financing Activities
Cash provided by financing activities amounted to $5.3 million compared to $6.8 million cash used in fiscal 2013.
The increase in bank indebtedness reflects borrowings to pay the cash portion of the ALC purchase price. The
issuance of share capital of $1.7 million reflects higher stock options exercised in the current year (423,205 common
shares compared to 91,822 common shares last year). The issuance of 1,007,711 shares as part of the consideration
for the ALC acquisition was a non-cash transaction and therefore did not affect the cash flow from financing
activities. Partially offsetting these cash inflows was higher dividends paid of $8.1 million compared to $7.0 million
last year.
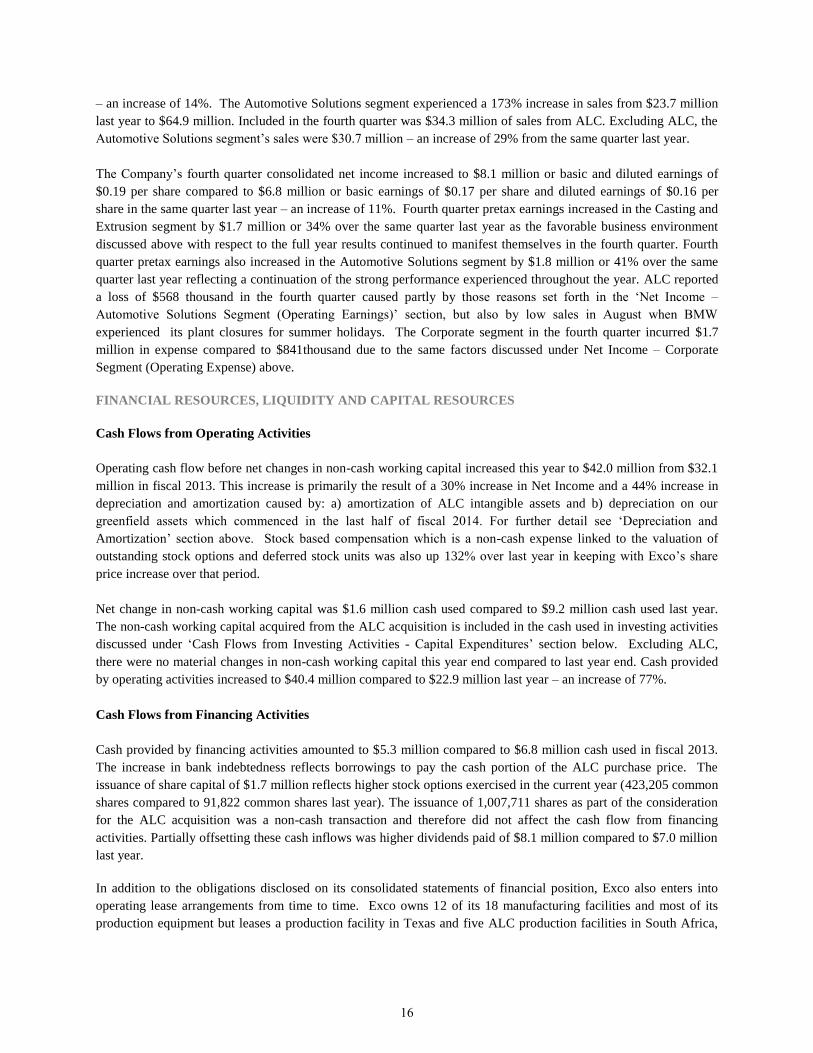
In addition to the obligations disclosed on its consolidated statements of financial position, Exco also enters into
operating lease arrangements from time to time. Exco owns 12 of its 18 manufacturing facilities and most of its
production equipment but leases a production facility in Texas and five ALC production facilities in South Africa,
16
Lesotho and Bulgaria. It also leases other warehousing and sales offices as necessary and some equipment at ALC.
The following table summarizes all short-term and long-term commitments Exco has entered.
Total < 1 year 1-3 years 4-5 years Over 5 years
Long-term debts $2,332 $720 $1,309 $303 $-
Operating leases 4,812 1,981 2,620 211 -
Purchase commitments 24,170 24,170 - - -
Capital expenditures 5,349 5,349 - - -
$36,663 $32,220 $3,929 $514 $-
Exco leases facilities, automotive, material handling vehicles and other miscellaneous office equipment. It is not Exco’s policy
to purchase these assets at the expiry of their terms but occasionally it may purchase the assets at the end of the lease terms when
the purchase options are favorable. Exco does not expect any material liquidity or capital resource impacts from these possible
purchases.
Cash Flows from Investing Activities - Capital Expenditures
Cash used in investing activities in the current year totalled $42.5 million compared to $23.2 million last year.
Included in the current year was $17.3 million cash paid for the acquisition of ALC compared to $1.5 million for the
acquisition of Extrusion Texas last year. Capital spending in the current year was also higher at $24.7 million
compared to $21.6 million last year as it included $7.4 million investment in the Castool Thailand greenfield and
$4.7 million investment in the Extrusion Brazil greenfield compared to last year which included $1.2 million for the
purchase of the remainder of the Colombian production facility, $5.6 million investment in the Extrusion Brazil
greenfield and $1.3 million investment in the Castool Thailand greenfield.
In fiscal 2015, Exco plans to invest approximately $24.5 million in capital expenditures of which $6.7 million
(including machinery and equipment) is for the construction of a new production facility for Extrusion Texas to
replace the existing leased facility. The remainder of the spending will be on machinery and equipment to maintain
and increase capacity at Exco’s existing plants in both segments.
We expect that in fiscal 2015 our cash flow from operations will exceed anticipated capital expenditures and,
accordingly, our cash deposits and our credit lines will be more than sufficient to meet our operating and capital
requirements.
Financial Position and Cash Balance
Exco’s financial position remains strong. Exco’s determination to maintain a strong balance sheet with no bank debt
has served it well throughout the turmoil in financial markets and has allowed it to take advantage of acquisition
opportunities and further organic growth as circumstances permit.
Exco had no net bank debt as at September 30, 2014 even after spending $17.3 in cash for the ALC acquisition and
closed the year with net cash deposits of $10.0 million compared to $5.4 million upon closing of the ALC
acquisition in Q2 and $26.1 million at last year end. At year end, Exco had operating lines of credit totalling $50.9
million, of which $29.7 million was unused and available. The Company does not presently anticipate the need for
long-term bank debt, other than those currently on the consolidated statements of financial position, in its capital
structure and does not expect to assume any over the coming year.
17
Outstanding Share Capital
As at November 26, 2014, the Company had 42,155,096 common shares outstanding. In addition, as at November
26, 2014, the Company had outstanding stock options for the purchase of up to 826,086 common shares.
CRITICAL ACCOUNTING POLICIES
The preparation of Exco’s financial statements in conformity with International Financial Reporting Standards
requires management to make estimates and assumptions. These estimates and assumptions affect the reported
amounts of assets and liabilities and disclosure of contingent assets and liabilities at the date of the financial
statements, as well as the reported amount of revenue and expenses during the reporting period.
Exco recognizes revenue upon percentage of completion of long-term contracts in the large die-cast moulds business
and upon product completion for all other businesses. For short-term contracts in the large die-cast moulds business
and all contracts in the extrusion and other tooling products and the Automotive Solutions segment products,
completion is defined as shipment to customers.
Management estimates and expenses the fair value of stock-based compensation granted after January 1, 2002. This
fair value is amortized to earnings over the remaining vesting period using the Black-Scholes option pricing model.
The Company believes that the estimate of stock-based compensation is a “critical accounting estimate” because
management is required to make significant forward-looking assumptions including expected stock volatility, the
change in expected dividend yields and the expected option term. Currently the compensation expense is recorded
in the selling, general and administration category in the consolidated statements of income and comprehensive
income.
We evaluate property, plant and equipment and other long-lived assets for impairment whenever indicators of
impairment exist. Indicators of impairment include prolonged operating losses or a decision to dispose of, or
otherwise change the use of, an existing fixed or other long-lived asset.
We believe that accounting estimates related to property, plant and equipment and other long-lived asset impairment
assessments are “critical accounting estimates” because: (i) they are subject to a significant measurement uncertainty
and are susceptible to changes as management is required to make forward-looking assumptions regarding the
impact of improvement plans on current operations, in-sourcing and other new business opportunities, program price
and cost assumptions on current and future business, the timing of new program launches and future forecasted
production volumes; and (ii) any resulting impairment loss could have a material impact on our consolidated net
income and on the amount of assets reported on our consolidated statements of financial position.
RECENT ACCOUNTING CHANGES AND EFFECTIVE DATES
Refer to Note 2 to the consolidated financial statements for information pertaining to the accounting changes and
issued accounting pronouncements effective in 2014 and future years.
18
DISCLOSURE CONTROLS AND PROCEDURES
The Chief Executive Officer, Chief Operating Officer and Chief Financial Officer, together with other members of
management, after evaluating the effectiveness of the Company’s disclosure controls and procedures, have
concluded that the Company’s disclosure controls and procedures are adequate and effective in ensuring that
material information relating to the Company and its consolidated subsidiaries would have been known to them.
INTERNAL CONTROLS OVER FINANCIAL REPORTING
The Chief Executive Officer, the Chief Financial Officer and the Chief Operating Officer, together with other
members of management, after having designed internal controls over financial reporting and conducted an
evaluation of its effectiveness based on the integrated framework issued by the Committee of Sponsoring
Organization of the Treadway Commission to provide reasonable assurance regarding the reliability of financial
reporting and the preparation of financial reporting in accordance with generally accepted accounting principles,
have not identified any changes to the Company’s internal control over financial reporting which would materially
affect, or is reasonably likely to materially affect, the Company’s internal control over financial reporting.
RISKS AND UNCERTAINTIES
Exco’s Automotive Solutions segment services automotive component suppliers (and Tier 1 suppliers) around the
world. The results of this segment depend on demand for automobiles and the level of automobile production,
which can fluctuate significantly with consumer confidence, general economic conditions, the cost and/or
availability of consumer credit and gasoline, as well as, the market share of individual OEM customers. Contraction
and slowing GDP growth in BRIC countries, North America and Europe may also have a dampening effect on
consumer demand for automobiles in these regions.
Exco has in 2011, 2013 and 2014 made four acquisitions (Allper AG, Exco Colombia, Extrusion Texas and
Automotive Leather Company) and may make others in the future. Acquisitions inherently involve risk. While
Exco has concluded many acquisitions that have been very successful, there have been several disappointing
acquisitions which have adversely impacted earnings regardless of the size of the acquisition or the maturity of the
business acquired. With respect to ALC, programs will be expiring in 2015 and beyond. While Exco is quoting on
the next generation programs and has no reason to believe that it will not be successful, there is no assurance that
ALC will be awarded the programs or that if awarded, the pricing and margin will be the same.
The Casting and Extrusion segment is a capital goods business. Interest rates, exchange rates, corporate capital
spending, the general economic climate and business confidence affect the demand for Exco’s dies, moulds and
consumable parts for die-cast and extrusion machines. Abrupt changes in these factors often bring about dramatic
changes in demand and pricing. Exco believes that its broad product line, geographic diversification and leadership
position in its niche markets mitigate against this risk but some risk remains.
In some cases, OEMs can decide to design the Company’s products out of the automobile (“de-contented”) or
reduce the trim level on which the Company’s products are installed for either aesthetic, cost or product redesign
reasons. While Exco believes its focus on evolving from component supplier to a designer and integrator of small
assemblies and sub-assemblies used in automotive and trunk interiors reduces the risk of de-contenting and
trimming down decisions; Automotive Solutions products are not critical power train components and may still be
de-contented.
19
OEMs or their tiers may have excess production capacity or collective agreements which preclude efficient capacity
reduction. In these cases OEMs and/or their tiers may choose to fill their excess capacity by taking production from
their suppliers and manufacturing the parts themselves. This process of ‘in-sourcing’ may have the impact of
reducing the amount of business available to suppliers such as Exco.
Exco’s Canadian operations negotiate sales contracts with customers in both Canadian and U.S. dollars and Euro.
We also purchase raw material in these currencies. U.S. dollar and Euro purchases provide a natural hedge against
U.S. dollar and Euro sales of Exco’s Canadian operations. As for the remaining foreign exchange exposure not
naturally hedged, Exco may enter into forward contracts and incur U.S. dollar or Euro debt, from time to time.
However, forward contracts are only short-term mitigating instruments. In the final analysis, Exco is structurally a
net seller of U.S. dollars and, to a lesser extent Euro, with foreign exchange exposure increasing as the U.S. dollar
and Euro decline in value against the Canadian dollar. While Exco has made considerable progress in reducing its
reliance on U.S. dollar sales, markets which Exco currently services may experience rising competition from
imports which have become more competitive as a result of foreign exchange movements.
Exco’s U.S. operations earn profits in U.S. dollars. A stronger Canadian dollar results in lower Canadian dollar
profit on translation. This does not, however, affect the competitiveness of these operations within the U.S. market
or other U.S. dollar-denominated markets. For fiscal 2015, it is estimated that Exco’s U.S. operations will be
exposed to foreign exchange risk on the translation of pre-tax profit of about US$17.2 million. If the Canadian
dollar were to strengthen or weaken by $0.01 in fiscal 2015, pre-tax profit would change by $172 thousand or about
$112 thousand after tax.
Note 9 to the Consolidated Financial Statements sets out information concerning Exco’s foreign exchange forward
contracts. During fiscal 2013, the U.S. dollar appreciated about 9% against the Canadian dollar to close the year at
$1.12. Although it did not happen in fiscal 2014, the appreciation of the Canadian dollar is a challenge for Exco.
To remain competitive, we are focused on a number of initiatives. Wherever possible, throughout its Canadian
operations, the Company is attempting to sell in Canadian dollars and source inputs and equipment in U.S. dollars,
thereby improving its natural hedge. It is very difficult to dislodge the dominance of U.S. dollars as the commercial
currency of choice. In addition, pricing in Canadian dollars may make the Company’s products uncompetitive and
result in lost business.
For fiscal 2015, we estimate our Canadian operations will be exposed to fluctuation in the value of the Canadian
dollar relative to the U.S. dollar on about US$50.1 million compared to an exposure of US$29.2 million in fiscal
2014. These figures represent the estimated net exposure calculated as U.S. dollar revenue less U.S. dollar expenses
and forwards. If the Canadian dollar were to strengthen or weaken by $0.01 in fiscal 2015, we estimate pre-tax
profit would change by $501 thousand or about $372 thousand after tax. These estimates are based on historical
norms and may be materially different in 2015 if customers deviate from their past practices.
Exco has manufacturing facilities in Mexico, Colombia, Brazil, Thailand, Bulgaria, South Africa, Lesotho and
Morocco. Some of these operations incur labor costs and often other operating expenses in local currency. In
several of these countries, sales contracts and major purchases such as material and equipment are negotiated in U.S.
dollars or Euro. In other countries, sales contracts and major purchases are negotiated in local functional currencies
as well. Major long-term fluctuations in the value of the local currencies against the U.S. dollar and Euro have the
potential to affect Exco’s operating results. Exco may enter into forward contracts or ‘collar’ contracts from time to
time in order to protect itself from currency fluctuations. These contracts are derivative instruments which,
depending on their structure, may not qualify for hedge accounting treatment and accordingly may be ‘marked to
market’ each quarter and expensed if necessary. It is difficult to anticipate fluctuations in these local currencies in
the event of major economic, fiscal or political instability in these countries.
20

The cost of manufacturing our products is a critical factor in determining our success over the long term.
Manufacturing has generally expanded to developing countries where competing technologies and lower labor-cost
structures exist. Exco must compete against companies doing business in these developing countries. Exco has met
this challenge by manufacturing some labour-intensive products in Mexico, Thailand, Bulgaria, South Africa,
Lesotho and Morocco; however, many of our operations based in Canada and the U.S. must compete with products
manufactured in lower-cost environments.
With the acquisition of Extrusion Colombia, Automotive Leather Company the greenfields in Brazil and Thailand
and the operation of numerous subsidiaries in US, Europe, Mexico and Morocco, Exco is increasingly conducting
business in diverse countries and in diverse functional currencies. Given the size and persistence of global trade
imbalances, sovereign debt concerns and political instability various currencies in which Exco and its subsidiaries
carry on business may experience high volatility from time to time. This may materially impact Exco’s earnings,
retained earnings and the value of its investment in these countries.
A significant portion of Exco’s receivables are with automotive customers. These customers have varying degrees
of financial strength. These receivables are subject to varying degrees of collectability. The majority of these
receivables are with U.S. entities that can avail themselves of Chapter 11 protection from creditors in certain
circumstances and avoid payment of the Company’s receivables that are over 20 days from the date of the Chapter
11 filing. Exco’s receivables may also be with highly leveraged customers that may have recently merged or chosen
to leverage their balance sheet for tax purposes or otherwise increase their investment yield. Doing business with
such customers typically increases the risk of default and filing for bankruptcy protection. The Company uses its
best efforts to collect accounts receivable under 60 days but in many cases the terms may be as long as 180 days and
often in other currencies thereby requiring Exco to bear the exchange rate risk. The Company often has the benefit
of statutory or common law liens on its products, however, it is not uncommon for significant receivables to be
outstanding for considerable periods, particularly in the large mould business.
OUTLOOK
As we look toward the next year we believe the improved state of the North American automotive industry will
continue throughout 2015 and should continue to grow at a gradual yet steady pace. With U.S. interest rates
expected to remain at historic low levels through 2015, unit sales of light vehicles should continue to benefit from
affordable leasing and financing charges. The climbing average age of North American automobiles on the road
today - in excess of 11 years - and the better mileage of new vehicles also support stronger demand for light
vehicles. This will directly benefit our automotive component business which should continue to experience strong
sales and efficient overhead absorption. This will also indirectly benefit our large mould business, Castool and
increasingly our extrusion die business which sells moulds, dies and consumable components/tooling to OEMs and
their tiers.
In Europe, fiscal austerity and low growth throughout the Euro zone is prevalent and automobile sales are expected
to remain at historic lows. Our reliance on the European market, excluding ALC, is minimal and it is expected there
will be a minimal overall impact on Exco’s performance next year as our Polydesign business unit will continue
launching new programs for a wide array of products. This should compensate for static production volumes on
existing programs. Our ALC operation has experienced strong sales and our recent award by Audi of a $35 million
seat cover program bodes well for our competitive position and our goal of diversifying the customer base.
Operationally, ALC will continue to be impacted in the short term by the launch of the Mini program, the transfer of
production to Lesotho from South Africa and other integration initiatives. ALC is also focused on securing the
21

award of some next generation BMW seat cover programs which it is currently running at our ALC Bulgaria
facility.
During the year an unprecedented number of new assembly plants have been announced for North America by
German, Japanese and American OEMs with others seriously considering the same. With our strong presence in
these markets we are ideally situated to competitively and effectively supply these new assembly plants with both
interior trim and tooling when they begin operations in the years to come. Our large mould plant in Queretaro
Mexico and our Polytech interior trim plant in Matamoros/Brownsville will figure prominently in this regard and we
expect to become meaningful suppliers to these new assembly plants.
The need to improve mileage in the US in 2017 and each year thereafter until 2025 when 54.5 mpg is achieved will
ensure significant investment by all OEMs in next generation engine and transmission architecture and use of lighter
material and components. The reputation of Exco's large mould business as the global 'go to' source for the design
and manufacture of engine block and transmission housing dies and its capabilities in silafont die casting technology
ensures that Exco will benefit from these trends well into the future. In Europe the same trend is discernible as the
EU requires significant reductions in carbon emissions by 2021.
Our extrusion tooling business is also expected to continue experiencing its current buoyancy. While the U.S.
industrial and commercial construction markets are growing much more slowly than the automotive industry,
anti-dumping duties in the U.S. and Canada against Chinese imports of aluminum extrusions is creating the
conditions necessary for stronger demand. Our tool shop in Colombia, Thailand and Brazil will continue to grow
and capture market share in these markets. Modest start-up costs at our operations in Thailand and Brazil will
continue through the year however we continue to expect that these will be offset by improvement in our operations
in Colombia and Texas.
In the meantime, Exco itself enters 2015 with no net bank debt and cash on hand of $31.2 million or 75 cents per
share after paying $8.1 million in dividends and investing another $51.6 million in acquisition, greenfields and
machinery/equipment to keep us competitive. A weak raw material cost environment should further support our
efforts to control costs and maintain margins. We believe that our net debt-free status and greater efficiency will
help insulate us from the volatility in the global economy that persistently flares up from time to time.
22
MANAGEMENT’S RESPONSIBILITY FOR FINANCIAL REPORTING
The accompanying consolidated financial statements of Exco Technologies Limited and all the
information in this annual report are the responsibility of management and have been approved by the
Board of Directors.
The consolidated financial statements have been prepared by management in accordance with
International Financial Reporting Standards. When alternative accounting methods exist, management
has chosen those it deems most appropriate in the circumstances. Financial statements are not precise
since they include certain amounts based on estimates and judgements. Management has determined
such amounts on a reasonable basis in order to ensure that the consolidated financial statements are
presented fairly, in all material respects. Management has prepared the financial information presented
elsewhere in the annual report and has ensured that it is consistent with that in the consolidated financial
statements.
The Company maintains systems of internal accounting and administrative controls of high quality,
consistent with reasonable cost. Such systems are designed to provide reasonable assurance that the
financial information is relevant, reliable and accurate and that the Company’s assets are appropriately
accounted for and adequately safeguarded.
The Board of Directors is responsible for ensuring that management fulfills its responsibilities for
financial reporting and is ultimately responsible for reviewing and approving the consolidated financial
statements. The Board carries out this responsibility principally through its Audit Committee. The Audit
Committee is appointed by the Board, and all of its members are outside directors. The Committee
meets regularly with management, as well as the external auditors, to discuss internal controls over
discharging its responsibilities and to review the annual report, the financial statements and the external
auditors’ report. The Committee reports its findings to the Board for consideration when approving the
financial statements for issuance to the shareholders. The Committee also considers, for review by the
Board and approval by the shareholders, the engagement or re-appointment of external auditors.
The consolidated financial statements have been audited by Ernst & Young LLP, the external auditors,
in accordance with Canadian generally accepted auditing standards on behalf of the shareholders. Ernst
& Young LLP has full and free access to the Audit Committee.
Exco Technologies Limited
December 3, 2014
23
INDEPENDENT AUDITORS’ REPORT
To the Shareholders of Exco Technologies Limited
Report on the Consolidated Financial Statements
We have audited the accompanying consolidated financial statements of Exco Technologies Limited,
which comprise the consolidated statements of financial position as at September 30, 2014 and 2013, and
the consolidated statements of income and comprehensive income, changes in shareholders’ equity and
cash flows for the years then ended and a summary of significant accounting policies and other
explanatory information.
Management's responsibility for the consolidated financial statements
Management is responsible for the preparation and fair presentation of these consolidated financial
statements in accordance with International Financial Reporting Standards, and for such internal control
as management determines is necessary to enable the preparation of consolidated financial statements that
are free from material misstatement, whether due to fraud or error.
Auditors’ responsibility
Our responsibility is to express an opinion on these consolidated financial statements based on our audits.
We conducted our audits in accordance with Canadian generally accepted auditing standards. Those
standards require that we comply with ethical requirements and plan and perform the audit to obtain
reasonable assurance about whether the consolidated financial statements are free from material
misstatement.
An audit involves performing procedures to obtain audit evidence about the amounts and disclosures in
the consolidated financial statements. The procedures selected depend on the auditors’ judgment,
including the assessment of the risks of material misstatement of the consolidated financial statements,
whether due to fraud or error. In making those risk assessments, the auditors consider internal control
relevant to the entity's preparation and fair presentation of the consolidated financial statements in order
to design audit procedures that are appropriate in the circumstances, but not for the purpose of expressing
an opinion on the effectiveness of the entity's internal control. An audit also includes evaluating the
appropriateness of accounting policies used and the reasonableness of accounting estimates made by
management, as well as evaluating the overall presentation of the consolidated financial statements.
We believe that the audit evidence we have obtained in our audits is sufficient and appropriate to provide
a basis for our audit opinion.
Opinion
In our opinion, the consolidated financial statements present fairly, in all material respects, the financial
position of Exco Technologies Limited as at September 30, 2014 and 2013, and its financial performance
and its cash flows for the years then ended in accordance with International Financial Reporting
Standards.
Toronto, Canada
December 3, 2014
24
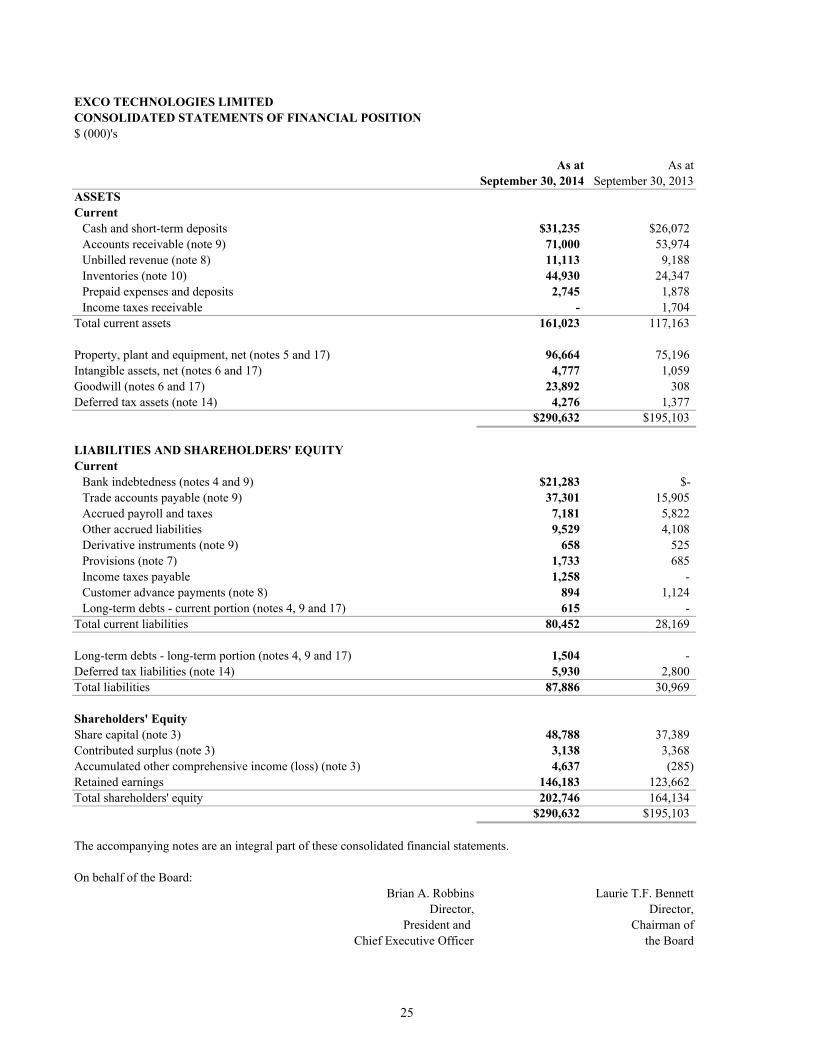
EXCO TECHNOLOGIES LIMITEDCONSOLIDATED STATEMENTS OF FINANCIAL POSITION $ (000)'s
As at As atSeptember 30, 2014 September 30, 2013
ASSETSCurrent
Cash and short-term deposits $31,235 $26,072Accounts receivable (note 9) 71,000 53,974Unbilled revenue (note 8) 11,113 9,188Inventories (note 10) 44,930 24,347Prepaid expenses and deposits 2,745 1,878Income taxes receivable - 1,704
Total current assets 161,023 117,163
Property, plant and equipment, net (notes 5 and 17) 96,664 75,196Intangible assets, net (notes 6 and 17) 4,777 1,059Goodwill (notes 6 and 17) 23,892 308Deferred tax assets (note 14) 4,276 1,377
$290,632 $195,103
LIABILITIES AND SHAREHOLDERS' EQUITYCurrent
Bank indebtedness (notes 4 and 9) $21,283 $- Trade accounts payable (note 9) 37,301 15,905Accrued payroll and taxes 7,181 5,822Other accrued liabilities 9,529 4,108Derivative instruments (note 9) 658 525Provisions (note 7) 1,733 685Income taxes payable 1,258 -Customer advance payments (note 8) 894 1,124Long-term debts - current portion (notes 4, 9 and 17) 615 -
Total current liabilities 80,452 28,169
Long-term debts - long-term portion (notes 4, 9 and 17) 1,504 -Deferred tax liabilities (note 14) 5,930 2,800Total liabilities 87,886 30,969
Shareholders' EquityShare capital (note 3) 48,788 37,389Contributed surplus (note 3) 3,138 3,368Accumulated other comprehensive income (loss) (note 3) 4,637 (285)Retained earnings 146,183 123,662Total shareholders' equity 202,746 164,134
$290,632 $195,103
The accompanying notes are an integral part of these consolidated financial statements.
On behalf of the Board:Brian A. Robbins Laurie T.F. Bennett
Director, Director,President and Chairman of
Chief Executive Officer the Board
25

EXCO TECHNOLOGIES LIMITED
CONSOLIDATED STATEMENTS OF INCOME AND COMPREHENSIVE INCOME
$ (000)'s except for income per common share
2014 2013
Sales (note 8) $368,258 $244,610
Cost of sales before the following 278,948 173,534
Selling, general and administrative expenses (notes 3, 9 and 12(B)) 35,454 27,972
Depreciation and amortization (notes 5 and 6) 12,378 8,600
(Gain) loss on disposal of property, plant and equipment (note 5) (91) 150
Interest expense (income) (note 18) 715 (4)
327,404 210,252
Income before income taxes 40,854 34,358
Provision for (recovery of) income taxes (note 14)
Current 10,941 11,046
Deferred (743) (320)
10,198 10,726
Net income for the year $30,656 $23,632
Other comprehensive income
Items that may be reclassified to profit or loss in subsequent periods:
Net unrealized loss on derivatives designated as cash flow hedges (notes 3 and 9) (99) (306)
Unrealized gain from foreign currency translation (note 3) 5,021 3,698
4,922 3,392
Comprehensive income $35,578 $27,024
Income per common share
Basic $0.74 $0.58
Diluted $0.73 $0.58
Basic 41,491 40,676Diluted 41,871 41,024
The accompanying notes are an integral part of these consolidated financial statements.
Years ended September 30
Weighted average number of common shares outstanding (note 13)
26
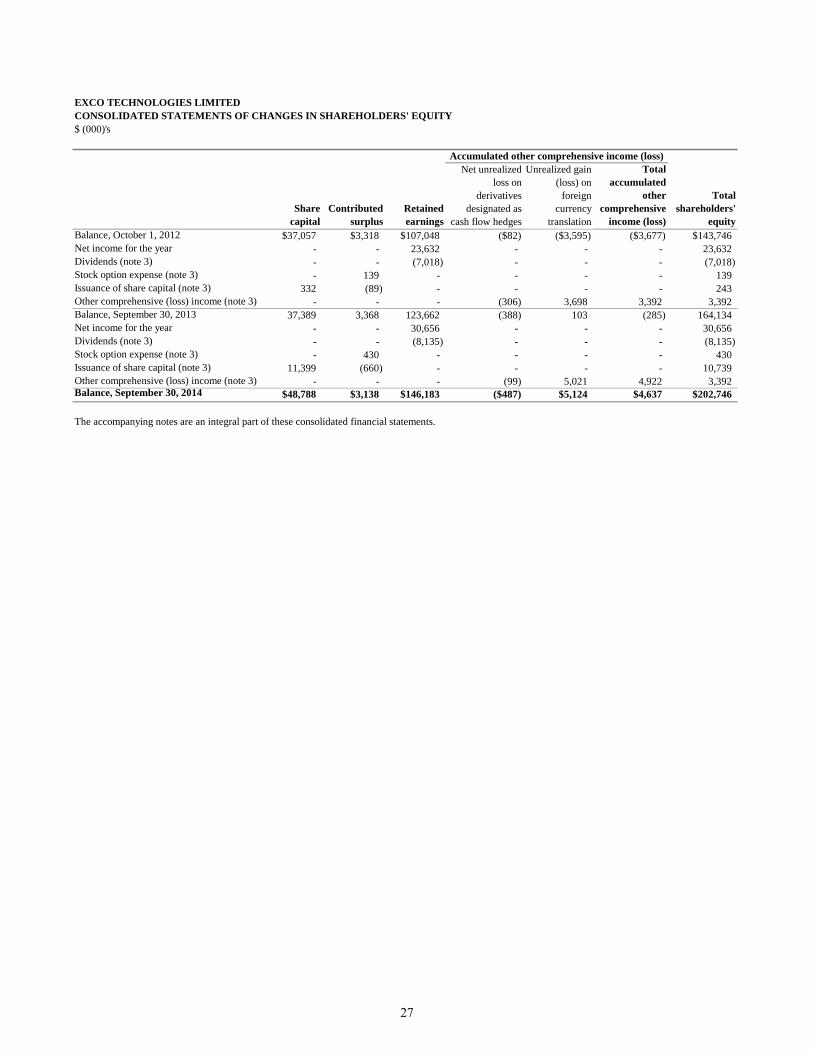
EXCO TECHNOLOGIES LIMITED
CONSOLIDATED STATEMENTS OF CHANGES IN SHAREHOLDERS' EQUITY
$ (000)'s
Share
capital
Contributed
surplus
Retained
earnings
Net unrealized
loss on
derivatives
designated as
cash flow hedges
Unrealized gain
(loss) on
foreign
currency
translation
Total
accumulated
other
comprehensive
income (loss)
Total
shareholders'
equity
Balance, October 1, 2012 $37,057 $3,318 $107,048 ($82) ($3,595) ($3,677) $143,746
Net income for the year - - 23,632 - - - 23,632
Dividends (note 3) - - (7,018) - - - (7,018)
Stock option expense (note 3) - 139 - - - - 139
Issuance of share capital (note 3) 332 (89) - - - - 243
Other comprehensive (loss) income (note 3) - - - (306) 3,698 3,392 3,392
Balance, September 30, 2013 37,389 3,368 123,662 (388) 103 (285) 164,134
Net income for the year - - 30,656 - - - 30,656
Dividends (note 3) - - (8,135) - - - (8,135)
Stock option expense (note 3) - 430 - - - - 430
Issuance of share capital (note 3) 11,399 (660) - - - - 10,739
Other comprehensive (loss) income (note 3) - - - (99) 5,021 4,922 3,392Balance, September 30, 2014 $48,788 $3,138 $146,183 ($487) $5,124 $4,637 $202,746
The accompanying notes are an integral part of these consolidated financial statements.
Accumulated other comprehensive income (loss)
27

EXCO TECHNOLOGIES LIMITED
CONSOLIDATED STATEMENTS OF CASH FLOWS
$ (000)'s
2014 2013
OPERATING ACTIVITIES:
Net income for the year $30,656 $23,632
Add (deduct) items not involving a current outlay of cash
Depreciation and amortization (notes 5 and 6) 12,378 8,600
Stock-based compensation expense (note 3) 860 370
Deferred income taxes (1,836) (511)
(Gain) loss on disposal of property, plant and equipment (91) 150
Gain on financial instruments valuation - (119)
41,967 32,122
Net change in non-cash working capital (note 15) (1,593) (9,238)
Cash provided by operating activities 40,374 22,884
FINANCING ACTIVITIES:
Increase in bank indebtedness 12,591 -
Repayment of long-term debts (note 4) (869) -
Dividends paid (note 3) (8,135) (7,018)
Issuance of share capital (note 3) 1,709 243
Cash provided by (used in) financing activities 5,296 (6,775)
INVESTING ACTIVITIES:
Business acquisition, net of cash acquired (note 17) (17,327) (1,485)
Purchase of property, plant and equipment (note 5) (24,741) (21,554)
Purchase of intangible assets (note 6) (967) (445)
Proceeds on disposal of property, plant and equipment 534 254
Cash used in investing activities (42,501) (23,230)
Effect of exchange rate changes on cash 1,994 1,950
Net increase (decrease) in cash during the year 5,163 (5,171)
Cash and short-term deposits, beginning of year 26,072 31,243
Cash and short-term deposits, end of year $31,235 $26,072
The accompanying notes are an integral part of these consolidated financial statements.
Years ended September 30
28

NOTES TO THE CONSOLIDATED FINANCIAL STATEMENTS
$(000)’s except per share amounts
1. CORPORATE INFORMATION
Exco Technologies Limited (the “Company”) is a global designer, developer and manufacturer of dies, moulds,
components and assemblies, and consumable equipment for the die-cast, extrusion and automotive industries.
Through 18 strategic locations, the Company services a diverse and broad customer base. The Company is
incorporated and domiciled in Canada. The registered office is located at 130 Spy Court, Markham, Ontario, Canada.
2. SUMMARY OF SIGNIFICANT ACCOUNTING POLICIES
The Company’s significant accounting policies are outlined below:
Statement of compliance
These consolidated financial statements have been prepared in accordance with International Financial Reporting
Standards (“IFRS”) as issued by the International Accounting Standards Board (“IASB”).
The consolidated financial statements and accompanying notes as at and for the year ended September 30, 2014
were authorized for issue by the Board of Directors on December 3, 2014.
Basis of consolidation
The consolidated financial statements incorporate the financial statements of the Company and the entities
controlled by the Company, its subsidiaries. Control exists when the Company has the power, directly or indirectly,
to govern the financial and operating policies of an entity so as to obtain benefits from its activities. The financial
statements of the subsidiaries are included in the consolidated financial statements from the date that control
commences until the date that control ceases. All intercompany transactions and balances have been eliminated on
consolidation.
Functional and presentation currency
Items included in the financial statements of each of the Company’s entities are measured using the currency of the
primary economic environment in which the entity operates (the “functional currency”). The consolidated financial
statements are presented in Canadian dollars, which is the parent company’s functional and presentation currency.
Transactions
Foreign currency transactions are translated into the functional currency using the exchange rates prevailing at the
dates of the transactions. Monetary assets and liabilities denominated in foreign currencies are retranslated at the
rates of exchange at the consolidated statement of financial position dates. Non-monetary items that are measured in
terms of historical cost in a foreign currency are translated using the exchange rate as at the date of the initial
transaction. Foreign exchange gains and losses resulting from the settlement of such transactions and from the
translation at year end exchange rates of monetary assets and liabilities denominated in foreign currencies are
recognized in profit or loss in the consolidated statements of income and comprehensive income.
Translation of foreign operations
The results and financial position of all the group entities that have a functional currency different from the
presentation currency are translated into the presentation currency as follows:
Assets and liabilities for each statement of financial position presented are translated at the closing rate at the
date of the statement of financial position; and
Income and expenses for each statement of income and comprehensive income are translated at the exchange
rates prevailing at the dates of the transactions.
On consolidation, exchange differences arising from the translation of the net investment in foreign operations are
recorded in other comprehensive income.
When a foreign operation is sold, exchange differences that were recorded in accumulated other comprehensive
income (loss) are recognized in the consolidated statements of income and comprehensive income as part of the gain
or loss on sale.
29
NOTES TO THE CONSOLIDATED FINANCIAL STATEMENTS
$(000)’s except per share amounts
Segment Reporting
Management has determined the operating segments based on the information regularly reviewed for the purposes of
decision making, allocating resources and assessing performance by the Company’s chief operating decision maker.
The Company evaluates the financial performance of its operating segments primarily based on net income before
interest and income taxes.
Business combinations
Business combinations are accounted for using the acquisition method. The cost of the business combination is
measured as the aggregate of the fair values (at the date of exchange) of assets acquired and liabilities incurred or
assumed. The acquiree’s identifiable assets, liabilities and contingent liabilities that meet the conditions for
recognition under IFRS 3, Business Combinations, are recognized at their fair values at the acquisition date.
Acquisition costs are expensed as incurred.
Goodwill arising on acquisition is recognized as an asset and initially measured at cost, being the excess of the cost
of the business combination over the Company’s interest in the net fair value of the identifiable assets, liabilities and
contingent liabilities recognized. If the Company’s interest in the fair value of the acquiree’s identifiable assets,
liabilities and contingent liabilities exceeds the cost of the business combination, the excess is recognized
immediately in profit or loss.
After initial recognition, goodwill is measured at cost less any accumulated impairment losses. For the
purpose of impairment testing, goodwill acquired in a business combination is, from the acquisition date, allocated
to each of the groups of cash-generating units that are expected to benefit from the synergies of the
combination, irrespective of whether other assets or liabilities of the acquiree are assigned to those units. A cash-
generating unit is the smallest identifiable group of assets that generates cash inflows that are largely independent of
the cash inflows from other assets or groups of assets.
Where goodwill forms part of a cash-generating unit and part of the operation within that unit is disposed of, the
goodwill associated with the operation disposed of is included in the carrying amount of the operation when
determining the gain or loss on disposal of the operation. Goodwill disposed of under this circumstance is measured
based on the relative fair values of the operation disposed of and the portion of the cash-generating unit retained.
Revenue recognition
Revenue is recognized when it can be measured reliably, the significant risks and rewards of ownership are
transferred to the customer, and it is probable that future economic benefits will flow to the Company.
Revenue is measured at the fair value of the consideration received, excluding discounts, rebates, sales taxes and
duties.
Revenue from short-term casting contracts, extrusion and other tooling, and Automotive Solutions segment
products are recognized when the significant risks and rewards of ownership of the goods have passed to the
buyer, usually upon shipment or acceptance by customers.
Revenue from long-term large die-cast mould contracts are recognized using the percentage of completion
method according to IAS 11, Construction Contracts, under which:
- When the outcome of a contract can be reliably estimated, revenue and costs associated with a contract are
recognized as revenue and expenses, respectively by reference to the stage of completion of the contract at
the consolidated statement of financial position dates. The stage of completion is determined by the
percentage of the costs incurred to date to the total estimated cost.
- When the outcome of a contract cannot be reliably estimated, revenue is recognized only to the extent of
contract costs incurred. When the uncertainties that prevented reliable estimation of the outcome of a
contract no longer exist, contract revenue and expenses are recognized using the percentage of completion
method.
- If the expected outcome of a contract is a loss, it is recognized immediately regardless of whether or not
work has commenced on the contract.
30
NOTES TO THE CONSOLIDATED FINANCIAL STATEMENTS
$(000)’s except per share amounts
- For contracts in progress for which costs incurred plus recognized profits (less recognized losses) exceed
progress billings, a gross amount due from customers for contract work is recognized as unbilled revenue -
an asset in the consolidated statements of financial position. For all contracts in progress for which progress
billings exceed costs incurred plus recognized profits (less recognized losses), a gross amount due to
customers for contract work is recognized as customer advance payments - a liability in the consolidated
statements of financial position.
Share-based payments
The Company grants stock options to buy common shares of the Company to officers and employees. The Board of
Directors grants such options for periods of up to 10 years, with vesting periods determined at its sole discretion and
at prices equal to the average closing market prices for the five days preceding the date on which the options were
granted.
The Company follows the fair value based method of accounting for stock-based compensation. The fair value of
the options is recognized as compensation expense in selling, general and administrative expenses in the
consolidated statements of income and comprehensive income over the vesting period with a corresponding increase
to contributed surplus. The contributed surplus balance is reduced as the options are exercised and the amount
initially recorded for the options in contributed surplus is credited to share capital, along with the proceeds received
on exercise.
On November 18, 2005, the Board adopted a Deferred Share Unit (“DSU”) plan for Independent Directors. The
DSU plan replaces the past practice of granting eligible directors stock options under the Stock Option plan. Under
the DSU plan, quarterly remuneration of a director is credited to the director’s DSU account in the form of deferred
share units on the last business day of the quarter. The number of deferred share units credited to the director’s
account is determined by dividing a director’s quarterly remuneration by the weighted average price of the common
share value traded in the last five business days of the quarter. Deferred share units are fully vested upon being
credited to a director’s DSU account. The deferred share units will be redeemed by the Company in cash payable 60
days after the Independent Director departs from the Board at the fair market value at the payment date.
Income taxes
Income tax expense consists of current and deferred income taxes. Income tax expense is recognized in the
consolidated statements of income and comprehensive income.
Current tax expense is the expected tax payable on the taxable income for the year, using tax rates enacted or
substantively enacted at year end, adjusted for amendments to taxes payable with regards to previous years.
Deferred income taxes are recorded using the statement of financial position liability method. Under the statement
of financial position liability method, deferred tax assets and liabilities are recognized for future tax consequences
attributable to differences between the financial statement carrying amounts of existing assets and liabilities and
their respective tax bases. Deferred tax assets and liabilities are measured using the enacted or substantively enacted
tax rates expected to apply when the asset is realized or the liability settled.
Deferred tax liabilities are generally recognized for all taxable temporary differences and deferred tax assets are
recognized to the extent that it is probable that taxable income will be available against which deductible timing
differences can be utilized.
Deferred taxes are charged or credited in the consolidated statements of income and comprehensive income, except
when it relates to items credited or charged directly to equity in which case the deferred taxes are also dealt with in
equity.
The carrying amount of deferred income tax assets is reviewed at each reporting date and reduced to the extent that
it is no longer probable that all or part of the deferred income tax asset will be utilized. Unrecognized deferred
income tax assets are reassessed at each reporting date and are recognized to the extent that it has become probable
that the benefit will be recovered.
31
NOTES TO THE CONSOLIDATED FINANCIAL STATEMENTS
$(000)’s except per share amounts
Other comprehensive income
Other comprehensive income is the change in the Company’s net assets that results from translations, events and
circumstances from sources other than the Company’s shareholders and includes items that would not normally be
included in net income such as foreign currency gains or losses on the translation of the financial statements of
foreign operations and foreign exchange gains or losses on the fair valuation of foreign exchange contracts
designated as cash flow hedges. The Company’s other comprehensive income, components of other comprehensive
income and cumulative translation adjustments are presented in the consolidated statements of income and
comprehensive income and the consolidated statements of changes in shareholders’ equity.
Cash and short-term deposits
Cash and short-term deposits include cash on hand, balances with banks and short-term deposits with maturities at
their acquisition date of three months or less.
Property, plant and equipment
(i) Machinery and equipment
Machinery and equipment are recorded at cost less accumulated depreciation and accumulated impairment
losses. All direct costs related to the acquisition and installation of machinery and equipment are
capitalized until the properties to which they are related are capable of carrying out their intended use.
Machinery and equipment are depreciated using the diminishing balance method based on their estimated
useful lives, which range from 4 to 20 years.
(ii) Other assets
Other assets are recorded at cost less accumulated depreciation and accumulated impairment losses and
depreciated using the straight-line method based on estimated useful lives, which generally range from 3 to
10 years, with the exception of buildings which have estimated useful lives of 30 years. Land is not
depreciated.
Where an item of property, plant and equipment comprises major components with different useful lives, the
components are accounted for as separate items of property, plant and equipment.
Expenditures incurred to replace a component of an item of property, plant and equipment that is accounted for
separately, including major inspection and overhaul expenditures, are capitalized. Directly attributable expenses
incurred for major capital projects are capitalized and no depreciation is recorded until the asset is brought to a
working condition for its intended use.
The costs of day-to-day servicing are expensed as incurred. These costs are more commonly referred to as
“maintenance and repairs”.
The depreciation methods and useful lives are assessed annually or when critical events occur that may affect the
useful lives and expected pattern of consumption of economic benefits embodied in the asset.
(iii) Subsequent costs
The cost of replacing part of an item within property, plant and equipment is capitalized when the cost is
incurred or if it is probable that the future economic benefits will flow to the business unit and the cost of
the item can be measured reliably. The carrying amount of the replaced part is derecognized. All other costs
are expensed as incurred.
Intangible assets and goodwill
An intangible asset is defined as being identifiable, able to bring future economic benefits to the Company and
controlled by it. Intangible assets are recorded initially at cost and relate primarily to computer software, production
and technology rights and customer relationships. An intangible asset is recognized when it is probable that the
expected future economic benefits attributable to the asset will flow to the Company and the cost of the asset can be
measured reliably. Intangible assets with finite lives are amortized over their useful economic life and assessed for
impairment whenever there is an indication that the intangible asset may be impaired. Amortization is provided
based on the following estimated useful lives using the straight-line method:
32
NOTES TO THE CONSOLIDATED FINANCIAL STATEMENTS
$(000)’s except per share amounts
- Customer relationship: 5 years
- Software and production and technology rights: 2-4 years.
Intangible assets acquired in a business acquisition are primarily customer relationship and are initially recorded at
fair value and subsequently at cost less amortization and impairment losses. Other intangible assets are comprised of
computer software and production and technology rights.
Identifiable intangible assets are recognized separately from goodwill. Goodwill represents the excess of the cost of
an acquisition over the fair value of the net identifiable assets of the acquired subsidiary at the date of the
acquisition. Separately recognized goodwill is carried at cost less impairment losses.
Impairment of long-lived assets and goodwill
(i) Impairment of long-lived assets
The Company’s tangible assets are reviewed for indicators of impairment at each consolidated statement of
financial position date. If indication of impairment exists, the asset’s recoverable amount is estimated.
An impairment loss is recognized when the carrying amount of an asset, or its cash-generating unit, exceeds
its recoverable amount. Impairment loss is recognized in income or loss for the period. Impairment losses
recognized in respect of cash-generating units are allocated first to reduce the carrying amount of any
goodwill allocated to the cash-generating units (“CGU”) and then to reduce the carrying amount of the
other assets in the CGU on a pro-rata basis.
The recoverable amount is the greater of the asset’s fair value less costs to sell and value in use. In
assessing value in use, the estimated future cash flows are discounted to their present value using a pre-tax
discount rate that reflects current market assessments of the time value of money and the risks specific to
the asset. For an asset that does not generate largely independent cash inflows, the recoverable amount is
determined for the CGU to which the asset belongs.
An impairment loss is reversed if there is an indication that there has been a change in the estimates used to
determine the recoverable amount. An impairment loss is reversed only to the extent that the asset’s
carrying amount does not exceed the carrying amount that would have been determined, net of
depreciation, if no impairment loss had been recognized.
(ii) Impairment of goodwill
Goodwill is allocated to CGU groups for the purpose of impairment testing based on the level at which it is
monitored by management. The Company’s CGU groups are its two operating segments, Automotive
Solutions and Casting and Extrusion. The allocation is made to the CGU groups that are expected to benefit
from the business acquisition in which the goodwill arose. Goodwill is tested for impairment annually and
whenever there is indicator that the CGU group, in which it resides, may be impaired. Impairment is
determined for goodwill by assessing the recoverable amount of each CGU group to which the goodwill
relates. Where the recoverable amount of the CGU group is less than its carrying amount, an impairment
loss is recognized. Impairment losses relating to goodwill cannot be reversed in future periods. The
recoverable amounts of the CGU groups are determined based on the greater of fair value less costs to sell
or value in use.
For purposes of the Company’s annual goodwill impairment test, the recoverable amount of its CGU
groups was based on a level III measure of fair value less costs to sell. The Company used a trailing
EBITDA multiple model to measure the fair value less costs to sell of its CGU groups using a multiple of
10 times. The multiple was determined with reference to recent market transactions and other external
sources of information. The risk profile, growth expectations and capital requirements are similar between
the Company’s CGU groups based on historical and forecast results as well as the maturity of the sector.
The Company also considered its market capitalization and a reasonable control premium compared to the
fair value less costs to sell of its CGU groups. The resulting fair value less costs to sell exceeded the
carrying value of the CGU groups. The Company does not anticipate that there could be a reasonably
33
NOTES TO THE CONSOLIDATED FINANCIAL STATEMENTS
$(000)’s except per share amounts
possible change in a key assumption in the coming year that would cause the recoverable amount of its
CGU groups to decline below carrying value.
Inventories
Inventories, comprising raw materials, work-in-process, finished goods and production supplies, are valued at the
lower of cost and net realizable value. Cost is determined substantially on a first-in, first-out basis and an
appropriate portion of normal overhead expenditure and labour. Net realizable value is the estimated selling price in
the ordinary course of business, less the estimated costs of completion and selling expenses. Obsolete, redundant
and slow-moving stock is identified and written down. When circumstances that previously caused inventories to be
written down below cost no longer exist, the amount of the write-down previously recorded is reversed.
Determination of fair value
Fair value is determined based on the price that would be received to sell an asset or paid to transfer a liability in an
orderly transaction between market participants at the measurement date. Fair value is measured using the
assumptions that market participants would use when pricing an asset or liability. Fair value is determined by using
quoted prices in active markets for identical or similar assets or liabilities. When quoted prices in active markets are
not available, fair value is determined using valuation techniques that maximize the use of observable inputs.
When observable valuation inputs are not available, significant judgment is required to determine fair value by
assessing the valuation techniques and valuation inputs. The use of alternative valuation techniques or valuation
inputs may result in a different fair value.
Financial instruments
As defined under IAS 39, Financial Instruments, financial assets and liabilities are recognized in the Company’s
consolidated statements of financial position when the Company becomes a party to the contractual provisions of the
instrument. Financial assets are derecognized when the Company no longer has the rights to such cash flows, the
risks and rewards of ownership or control of the asset. Financial liabilities are derecognized when the obligation
under the liability is discharged, cancelled or expired.
Financial instruments recognized in the consolidated statements of financial position comprise cash, trade accounts
receivable, trade accounts payable, bank indebtedness, other accrued liabilities, customer advance payments,
derivative financial instruments and long-term debts.
Financial instruments are measured at their fair values on initial recognition. After initial recognition,
financial instruments are measured at their fair values, except for financial assets classified as held-to-
maturity or loans and receivables and other financial liabilities, which are measured at amortized cost using the
effective interest rate method.
Changes in fair value are included in the consolidated statements of income and comprehensive income unless
the instrument is included in a cash flow hedge. If the instruments are included in a cash flow hedging
relationship, which is effective, changes in value are recorded in other comprehensive income. When the hedged
forecast transaction occurs, amounts previously recorded in other comprehensive income are recognized in the
consolidated statements of income and comprehensive income. Amounts recognized as other comprehensive income
are transferred to profit or loss when the hedged transaction affects profit or loss, such as when the hedged financial
income or financial expense is recognized or when a forecast purchase occurs.
Accounts receivable are initially recognized at the transaction value and subsequently carried at amortized cost less
impairment losses. The impairment loss of accounts receivable is based on a review of all outstanding amounts at
year end. Bad debts are written off during the period in which they are identified. Accounts payable and customer
advance payments are initially recognized at the transaction value and subsequently carried at amortized cost.
The Company uses derivative financial instruments, such as forward foreign currency exchange contracts in the
form of put and call option contracts (“Collars”), to hedge cash outflows anticipated to be made in Mexican peso
denominated payments against foreign currency fluctuations between U.S. dollars and Mexican pesos. The
Company does not hold or issue derivative financial instruments for trading or speculative purposes. Such derivative
financial instruments are initially recognized at fair value on the date on which a derivative contract is entered into
34
NOTES TO THE CONSOLIDATED FINANCIAL STATEMENTS
$(000)’s except per share amounts
and are subsequently remeasured at fair value. Derivative financial instruments are carried as financial assets when
the fair value is positive and as financial liabilities when the fair value is negative.
At the inception of a hedge relationship, the Company formally designates and documents the hedge relationship to
which the Company wishes to apply hedge accounting and the risk management objective and strategy for
undertaking the hedge. The documentation includes identification of the hedging instrument, the hedged item or
transaction, the nature of the risk being hedged and how the entity will assess the effectiveness of changes in the
hedging instrument’s fair value in offsetting the exposure to changes in the cash flows attributable to the hedged
risk. Such hedges are expected to be highly effective in achieving offsetting changes in cash flows and are assessed
on an ongoing basis to determine that they actually have been highly effective throughout the financial reporting
periods for which they were designated.
The effective portion of the gain or loss on the hedging instrument is recognized directly in other comprehensive
income in the cash flow hedge reserve, while any ineffective portion is recognized immediately to profit or loss.
If the forecast transaction or firm commitment is no longer expected to occur, the cumulative gain or loss previously
recognized in other comprehensive income is transferred to profit or loss. If the hedging instrument expires or is
sold, terminated or exercised without replacement or rollover, or if its designation as a hedge is revoked, any
cumulative gain or loss previously recognized in other comprehensive income remains in other comprehensive
income until the forecast transaction or firm commitment affects profit or loss.
Forward foreign exchange contracts are negotiated with JP Morgan Chase with a long-term debt rating of A+ as
determined by Standard & Poor’s. The Company does not anticipate non-performance by JP Morgan Chase, which
is the counterparty to these contracts.
The Company’s financial assets and liabilities recorded at fair value in the consolidated statements of financial
position have been categorized into three categories based on a fair value hierarchy. Fair value of assets and
liabilities included in Level I is determined by reference to quoted prices in active markets for identical
assets and liabilities. Assets and liabilities in Level II include valuations using inputs other than the quoted prices
for which all significant inputs are based on observable market data, either directly or indirectly. Level III
valuations are based on inputs that are not based on observable market data.
Transaction costs are expensed as incurred for financial instruments classified or designated as a derivative
or held for trading. Transaction costs for financial assets classified as available for sale are added to the value
of the instruments at the acquisition date. Transaction costs related to other financial liabilities are added to the
value of the instrument at the acquisition date and recorded in income using the effective interest rate method.
Provisions
As required under IAS 37, Provisions, Contingent Liabilities and Contingent Assets, provisions are recorded when a
present legal or constructive obligation exists as a result of past events where it is probable that an outflow of
resources embodying economic benefits will be required to settle the obligation, and a reliable estimate of the
amount of the obligation can be made.
The amount recognized as a provision is the best estimate of the consideration required to settle the present
obligation at the consolidated statement of financial position dates, taking into account the risks and uncertainties
surrounding the obligation. Where a provision is measured using cash flows estimated to settle the present
obligation, its carrying amount is the present value of those cash flows. When some or all of the economic benefits
required to settle a provision are expected to be recovered from a third party, the receivable is recognized as an asset
if it is virtually certain that reimbursement will be received and the amount of the receivable can be measured
reliably.
Leases
As required under IAS 17, Leases, assets held under finance leases are recognized as assets of the Company at the
lower of the fair value at the inception of the lease or the present value of the minimum lease payments. The
corresponding amount is recognized as a finance lease liability. The finance lease liability is reduced by lease
payments less finance charges, which are expensed as part of interest expense in the consolidated statements of
35
NOTES TO THE CONSOLIDATED FINANCIAL STATEMENTS
$(000)’s except per share amounts
income and comprehensive income. Under operating leases, payments are recognized as expense over the term of
the relevant leases.
Employee future benefits
(i) Leave pay
Employee entitlements to annual leave are recognized as they are earned by the employees. A provision,
stated at current cost, is made for the estimated liability at year end.
(ii) Termination benefits
The Company is subject to Mexican statutory laws and regulations governing employee termination
benefits. Employee future benefits include statutorily mandated accrued benefits payable to employees in
the event of termination in certain circumstances. Termination benefits are recognized as an expense and
an associated liability at the discounted value of the expected future payments.
Critical judgments and use of estimates
The preparation of the consolidated financial statements requires management to make judgements, estimates and
assumptions that affect the application of policies and reported amounts of assets, liabilities, revenue and expenses.
The estimates and associated assumptions are based on historical experience and various other factors that are
believed to be reasonable under the circumstances, the results of which form the basis of making the judgments
about carrying values of assets and liabilities that are not readily apparent from other sources. Actual results may
differ from these estimates.
The estimates and underlying assumptions are reviewed on an ongoing basis. Revisions to accounting estimates are
recognized in the period in which the estimate is revised if the revision affects only that period or in the period of the
revision and future periods if the review affects both current and future periods.
Significant accounts that require estimates as the basis for determining the stated amounts include accounting for
doubtful accounts receivable, unbilled revenue, inventories, property, plant and equipment, contingent liabilities,
income taxes, fair value of financial instruments and stock option valuation.
Measurement for doubtful accounts receivable requires management to make estimates and assumptions based on
prior experience and assessment of current financial conditions of customers, as well as the general economic
environment and industry sectors in which they operate.
Several divisions engage in the construction of custom-order large die-cast moulds. Such activities fall into the
scope of IAS 11, Construction Contracts, where revenue is recognized using the percentage of completion method.
Under this method, at every reporting date, management is required to estimate the expected outcome on all
outstanding contracts as well as measurement of their progress achieved towards their completion. The estimation
requires management to make certain assumptions and judgments. These assumptions and judgments are
continuously reviewed and updated. If different assumptions are used, it is possible that different amounts would be
recognized in the consolidated financial statements.
Net realizable value of inventories is dependent upon the estimated selling price in the ordinary course of business,
less the estimated costs of completion and selling expenses based on prior experience and assessment of current
market conditions.
Depreciation and amortization of property, plant and equipment and intangible assets are dependent upon estimates
of useful lives which are determined with the exercise of judgment. The assessment of any impairment of property,
plant and equipment and intangible assets is dependent upon estimates of recoverable amounts that take into account
factors such as economic and market conditions and the useful lives of assets.
The estimated useful lives of property, plant and equipment and intangible assets are reviewed on an annual basis.
Assessing the reasonableness of the estimated useful lives of property, plant and equipment and intangible assets
requires judgment and is based on currently available information. Property, plant and equipment and intangible
assets are also reviewed for potential impairment on a regular basis or whenever events or changes in circumstances
36
NOTES TO THE CONSOLIDATED FINANCIAL STATEMENTS
$(000)’s except per share amounts
indicate that the carrying amount may not be recoverable.
Changes in circumstances, such as technological advances and changes to business strategy can result in
actual useful lives and future cash flows differing significantly from estimates. The assumptions used, including
rates and methodologies, are reviewed on an ongoing basis to ensure they continue to be appropriate.
Revisions to the estimated useful lives of property, plant and equipment and intangible assets or future cash flows
constitute a change in accounting estimates and are applied prospectively.
Income taxes are determined based on estimates of the Company’s current income taxes and estimates of deferred
income taxes resulting from temporary differences. Deferred tax assets are assessed to determine the
likelihood that they will be realized from future taxable income before they expire.
The valuation of the Company’s derivative instruments and certain other financial instruments requires estimation of
the fair value of each instrument at the reporting date.
The Company uses the Black-Scholes option pricing model to estimate the fair value of the options granted at the
grant date. This model requires the input of a number of assumptions including expected dividend yields, expected
stock volatility, expected time until exercise, expected forfeitures, and risk-free interest rates. Although the
assumptions used reflect management’s best estimates, they involve inherent uncertainties based upon market
conditions generally outside the control of the Company. If other assumptions were used, stock-based compensation
expense could be significantly impacted.
Accounting standards adopted in the current year
IFRS 7 Disclosures – Offsetting Financial Assets and Financial Liabilities – Amendments to IFRS 7 and IAS 32
These amendments require an entity to disclose information about rights to set-off and related arrangements. The
disclosures would provide users with information that is useful in evaluating the effect of netting arrangements on an
entity’s financial position. The new disclosures are required for all recognized financial instruments that are set off
in accordance with IAS 32 Financial Instruments: Presentation. The disclosures also apply to recognized financial
instruments that are subject to an enforceable master netting arrangement or similar arrangement, irrespective of
whether they are set off in accordance with IAS 32. This standard became effective for annual periods beginning on
or after January 1, 2013. The adoption of these amendments to IFRS 7 did not have any impact on the disclosures of
the Company.
IFRS 10 Consolidated Financial Statements, IAS 27 Separate Financial Statements
IFRS 10 replaces the portion of IAS 27 Consolidated and Separate Financial Statements that addresses the
accounting for consolidated financial statements. It also includes the issues raised in SIC-12 Consolidation —
Special Purpose Entities. IFRS 10 establishes a single control model that applies to all entities, including special
purpose entities. The changes introduced by IFRS 10 will require management to exercise significant judgment to
determine which entities are controlled and, therefore, are required to be consolidated by a parent, compared with
the requirements that were in IAS 27. This standard became effective for annual periods beginning on or after
January 1, 2013. The adoption of IFRS 10 had no impact on the consolidated financial statements for the period or
prior periods presented as the adoption did not result in a change in the consolidation status of any of the Company’s
subsidiaries or investees or the identification of any additional subsidiaries.
IFRS 11 Joint Arrangements
IFRS 11 supersedes IAS 31, Interest in Joint Ventures and SIC-13, Jointly Controlled Entities – Non-Monetary
Contributions. Through an assessment of the rights and obligations in an arrangement, IFRS 11 establishes
principles to determine the type of joint arrangement, which are classified as either joint operations or joint ventures,
and provides guidance for financial reporting activities required by the entities that have an interest in arrangements
that are controlled jointly. Investments in joint ventures are required to be accounted for using the equity method. As
a result of the issuance of IFRS 10 and IFRS 11, IAS 28, Investments in Associates and Joint Ventures, has been
amended to correspond to the guidance provided in IFRS 10 and IFRS 11. This standard became effective for annual
periods beginning on or after January 1, 2013. The adoption of this standard did not have an impact on the
Company’s consolidated financial statements.
37

NOTES TO THE CONSOLIDATED FINANCIAL STATEMENTS
$(000)’s except per share amounts
IFRS 12 Disclosure of Involvement with Other Entities
IFRS 12 includes all of the disclosures that were previously in IAS 27 related to consolidated financial statements,
as well as all of the disclosures that were previously included in IAS 31 and IAS 28. These disclosures relate to an
entity’s interests in subsidiaries, joint arrangements, associates and structured entities. A number of new disclosures
are also required, but this has no impact on the Company’s financial position or performance. This standard became
effective for annual periods beginning on or after January 1, 2013. The adoption of this standard did not have
an impact on the Company’s consolidated financial statements.
IFRS 13 Fair Value Measurement
IFRS 13 establishes a single source of guidance under IFRS for all fair value measurements. IFRS 13 does not
change when an entity is required to use fair value, but rather provides guidance on how to measure fair value under
IFRS when fair value is required or permitted. This standard became effective for annual periods beginning on or
after January 1, 2013. The adoption of this standard did not have an impact on the Company’s consolidated
financial statements.
IAS 1 Financial Statement Presentation – Presentation of Items of Other Comprehensive Income
The amendments to IAS 1 change the grouping of items presented in other comprehensive income. Items that could
be reclassified (or “recycled”) to profit or loss at a future point in time (for example, upon derecognition or
settlement) would be presented separately from items that will never be reclassified. The amendment became
effective for annual periods beginning on or after January 1, 2013. The amendment affects presentation only and has
no impact on the Company’s financial position or performance.
IAS 19 Employee Benefits (Revised)
The IASB has issued numerous amendments to IAS 19. These range from fundamental changes such as removing
the corridor mechanism and the concept of expected returns on plan assets to simple clarifications and rewording.
This standard became effective for annual periods beginning on or after January 1, 2013. The adoption of this
standard did not have an impact on the Company’s consolidated financial statements.
IAS 36 Impairment of Assets
In May 29, 2013, the IASB published amendments to IAS 36 which reduce the circumstances in which the
recoverable amount of CGU is required to be disclosed and clarify the disclosures required when an impairment loss
has been recognized or reversed in the period. This amendment is effective for annual periods beginning on or after
January 1, 2014; however, the Company has adopted them early starting October 1, 2013. The adoption of IAS 36
did not have an impact on the Company’s consolidated financial statements.
Accounting standards issued but not yet applied
The following standards are not yet effective for the year ended September 30, 2014. The Company is in the process
of reviewing the standard to determine the impact on the consolidated financial statements.
IFRS 9 Financial Instruments
IFRS 9, Financial Instruments, as issued in 2014, introduces new requirements for the classification and
measurement of financial instruments, a new expected loss impairment model that will require more timely
recognition of expected credit losses and a substantially reformed model for hedge accounting, with enhanced
disclosures about risk management activity. IFRS 9 also removes the volatility in profit or loss that was caused by
changes in an entity’s own credit risk for liabilities selected to be measured at fair value. IFRS 9 is effective for
annual periods beginning on or after January 1, 2018, which will be October 1, 2018 for the Company. Earlier
application is permitted.
IFRS 15 Revenue from Contracts with Customers
IFRS 15 Revenue from Contracts with Customers was issued in May 2014, which will replace IAS 11 Construction
Contracts, IAS 18 Revenue Recognition, IFRIC 13 Customer Loyalty Programmes, IFRIC 15 Agreements for the
Construction of Real Estate, IFRIC 18 Transfer of Assets from Customers, and Standard Interpretations Committee
(“SIC”) 31 Revenue – Barter Transactions Involving Advertising Services. IFRS 15 provides a single, principles-
based five-step model that will apply to all contracts with customers with limited exceptions. In addition to the five-
step model, the standard specifies how to account for the incremental costs of obtaining a contract and the costs
38
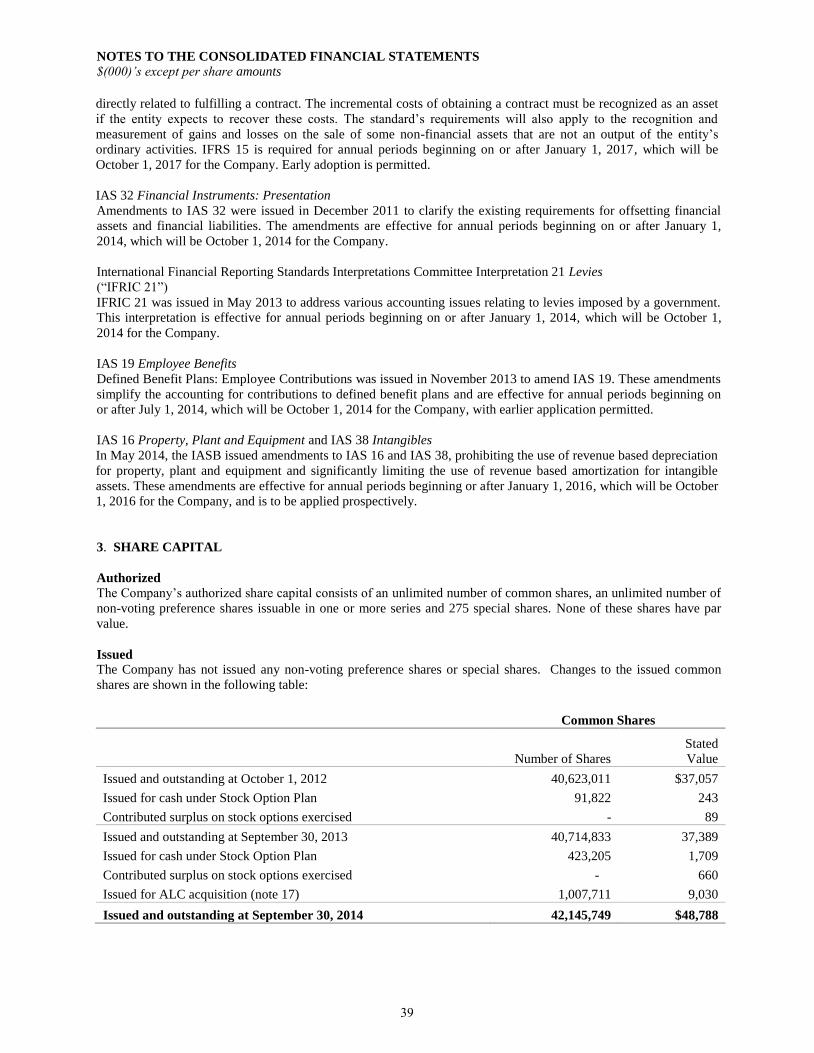
NOTES TO THE CONSOLIDATED FINANCIAL STATEMENTS
$(000)’s except per share amounts
directly related to fulfilling a contract. The incremental costs of obtaining a contract must be recognized as an asset
if the entity expects to recover these costs. The standard’s requirements will also apply to the recognition and
measurement of gains and losses on the sale of some non-financial assets that are not an output of the entity’s
ordinary activities. IFRS 15 is required for annual periods beginning on or after January 1, 2017, which will be
October 1, 2017 for the Company. Early adoption is permitted.
IAS 32 Financial Instruments: Presentation
Amendments to IAS 32 were issued in December 2011 to clarify the existing requirements for offsetting financial
assets and financial liabilities. The amendments are effective for annual periods beginning on or after January 1,
2014, which will be October 1, 2014 for the Company.
International Financial Reporting Standards Interpretations Committee Interpretation 21 Levies
(“IFRIC 21”)
IFRIC 21 was issued in May 2013 to address various accounting issues relating to levies imposed by a government.
This interpretation is effective for annual periods beginning on or after January 1, 2014, which will be October 1,
2014 for the Company.
IAS 19 Employee Benefits
Defined Benefit Plans: Employee Contributions was issued in November 2013 to amend IAS 19. These amendments
simplify the accounting for contributions to defined benefit plans and are effective for annual periods beginning on
or after July 1, 2014, which will be October 1, 2014 for the Company, with earlier application permitted.
IAS 16 Property, Plant and Equipment and IAS 38 Intangibles
In May 2014, the IASB issued amendments to IAS 16 and IAS 38, prohibiting the use of revenue based depreciation
for property, plant and equipment and significantly limiting the use of revenue based amortization for intangible
assets. These amendments are effective for annual periods beginning or after January 1, 2016, which will be October
1, 2016 for the Company, and is to be applied prospectively.
3. SHARE CAPITAL
Authorized
The Company’s authorized share capital consists of an unlimited number of common shares, an unlimited number of
non-voting preference shares issuable in one or more series and 275 special shares. None of these shares have par
value.
Issued
The Company has not issued any non-voting preference shares or special shares. Changes to the issued common
shares are shown in the following table:
Common Shares
Number of Shares
Stated
Value
Issued and outstanding at October 1, 2012 40,623,011 $37,057
Issued for cash under Stock Option Plan 91,822 243
Contributed surplus on stock options exercised - 89
Issued and outstanding at September 30, 2013 40,714,833 37,389
Issued for cash under Stock Option Plan 423,205 1,709
Contributed surplus on stock options exercised - 660
Issued for ALC acquisition (note 17) 1,007,711 9,030
Issued and outstanding at September 30, 2014 42,145,749 $48,788
39
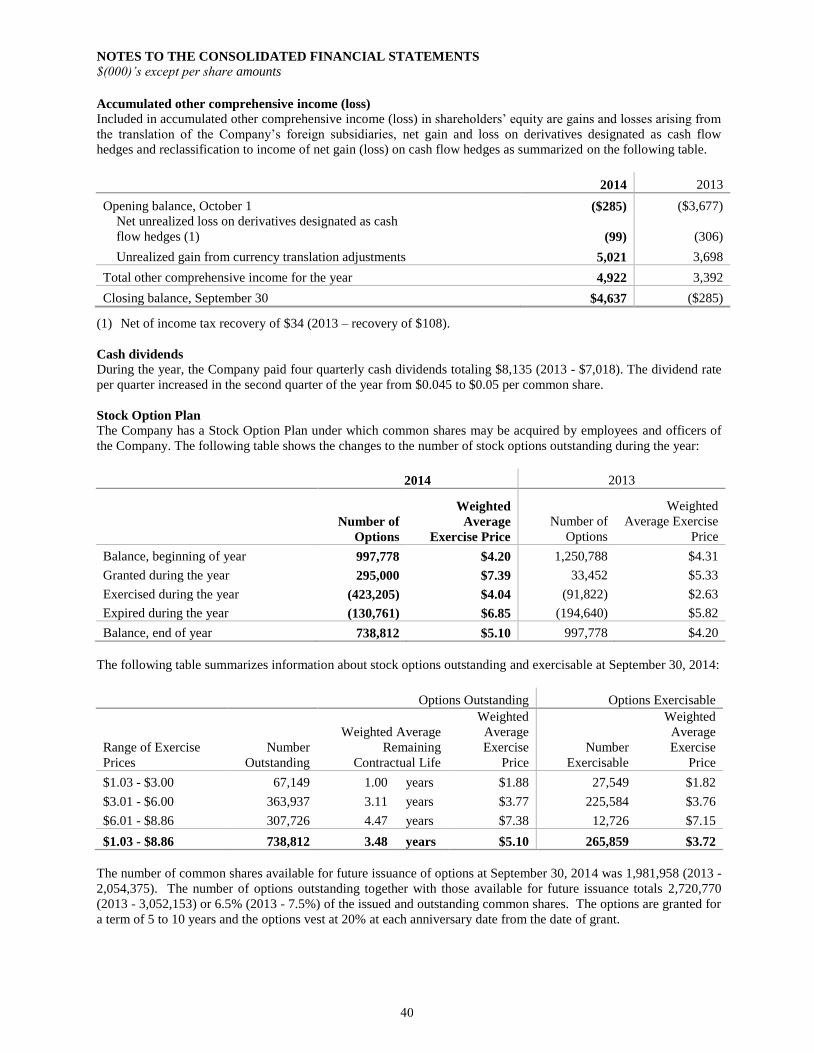
NOTES TO THE CONSOLIDATED FINANCIAL STATEMENTS
$(000)’s except per share amounts
Accumulated other comprehensive income (loss)
Included in accumulated other comprehensive income (loss) in shareholders’ equity are gains and losses arising from
the translation of the Company’s foreign subsidiaries, net gain and loss on derivatives designated as cash flow
hedges and reclassification to income of net gain (loss) on cash flow hedges as summarized on the following table.
2014 2013
Opening balance, October 1 ($285) ($3,677)
Net unrealized loss on derivatives designated as cash
flow hedges (1) (99) (306)
Unrealized gain from currency translation adjustments 5,021 3,698
Total other comprehensive income for the year 4,922 3,392
Closing balance, September 30 $4,637 ($285)
(1) Net of income tax recovery of $34 (2013 – recovery of $108).
Cash dividends
During the year, the Company paid four quarterly cash dividends totaling $8,135 (2013 - $7,018). The dividend rate
per quarter increased in the second quarter of the year from $0.045 to $0.05 per common share.
Stock Option Plan
The Company has a Stock Option Plan under which common shares may be acquired by employees and officers of
the Company. The following table shows the changes to the number of stock options outstanding during the year:
2014 2013
Number of
Options
Weighted
Average
Exercise Price
Number of
Options
Weighted
Average Exercise
Price
Balance, beginning of year 997,778 $4.20 1,250,788 $4.31
Granted during the year 295,000 $7.39 33,452 $5.33
Exercised during the year (423,205) $4.04 (91,822) $2.63
Expired during the year (130,761) $6.85 (194,640) $5.82
Balance, end of year 738,812 $5.10 997,778 $4.20
The following table summarizes information about stock options outstanding and exercisable at September 30, 2014:
Options Outstanding Options Exercisable
Range of Exercise
Prices
Number
Outstanding
Weighted Average
Remaining
Contractual Life
Weighted
Average
Exercise
Price
Number
Exercisable
Weighted
Average
Exercise
Price
$1.03 - $3.00 67,149 1.00 years $1.88 27,549 $1.82
$3.01 - $6.00 363,937 3.11 years $3.77 225,584 $3.76
$6.01 - $8.86 307,726 4.47 years $7.38 12,726 $7.15
$1.03 - $8.86 738,812 3.48 years $5.10 265,859 $3.72
The number of common shares available for future issuance of options at September 30, 2014 was 1,981,958 (2013 -
2,054,375). The number of options outstanding together with those available for future issuance totals 2,720,770
(2013 - 3,052,153) or 6.5% (2013 - 7.5%) of the issued and outstanding common shares. The options are granted for
a term of 5 to 10 years and the options vest at 20% at each anniversary date from the date of grant.
40
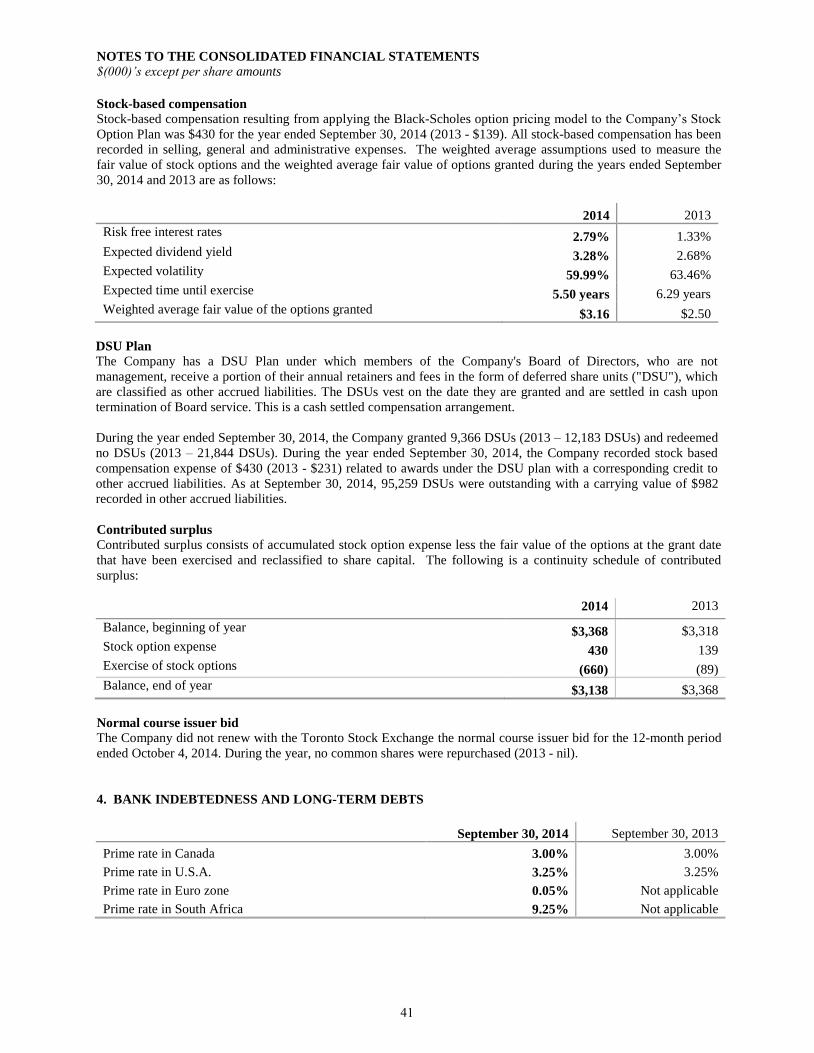
NOTES TO THE CONSOLIDATED FINANCIAL STATEMENTS
$(000)’s except per share amounts
Stock-based compensation
Stock-based compensation resulting from applying the Black-Scholes option pricing model to the Company’s Stock
Option Plan was $430 for the year ended September 30, 2014 (2013 - $139). All stock-based compensation has been
recorded in selling, general and administrative expenses. The weighted average assumptions used to measure the
fair value of stock options and the weighted average fair value of options granted during the years ended September
30, 2014 and 2013 are as follows:
2014 2013
Risk free interest rates 2.79% 1.33%
Expected dividend yield 3.28% 2.68%
Expected volatility 59.99% 63.46%
Expected time until exercise 5.50 years 6.29 years
Weighted average fair value of the options granted $3.16 $2.50
DSU Plan
The Company has a DSU Plan under which members of the Company's Board of Directors, who are not
management, receive a portion of their annual retainers and fees in the form of deferred share units ("DSU"), which
are classified as other accrued liabilities. The DSUs vest on the date they are granted and are settled in cash upon
termination of Board service. This is a cash settled compensation arrangement.
During the year ended September 30, 2014, the Company granted 9,366 DSUs (2013 – 12,183 DSUs) and redeemed
no DSUs (2013 – 21,844 DSUs). During the year ended September 30, 2014, the Company recorded stock based
compensation expense of $430 (2013 - $231) related to awards under the DSU plan with a corresponding credit to
other accrued liabilities. As at September 30, 2014, 95,259 DSUs were outstanding with a carrying value of $982
recorded in other accrued liabilities.
Contributed surplus
Contributed surplus consists of accumulated stock option expense less the fair value of the options at the grant date
that have been exercised and reclassified to share capital. The following is a continuity schedule of contributed
surplus:
2014 2013
Balance, beginning of year $3,368 $3,318
Stock option expense 430 139
Exercise of stock options (660) (89)
Balance, end of year $3,138 $3,368
Normal course issuer bid
The Company did not renew with the Toronto Stock Exchange the normal course issuer bid for the 12-month period
ended October 4, 2014. During the year, no common shares were repurchased (2013 - nil).
4. BANK INDEBTEDNESS AND LONG-TERM DEBTS
September 30, 2014 September 30, 2013
Prime rate in Canada 3.00% 3.00%
Prime rate in U.S.A. 3.25% 3.25%
Prime rate in Euro zone 0.05% Not applicable
Prime rate in South Africa 9.25% Not applicable
41
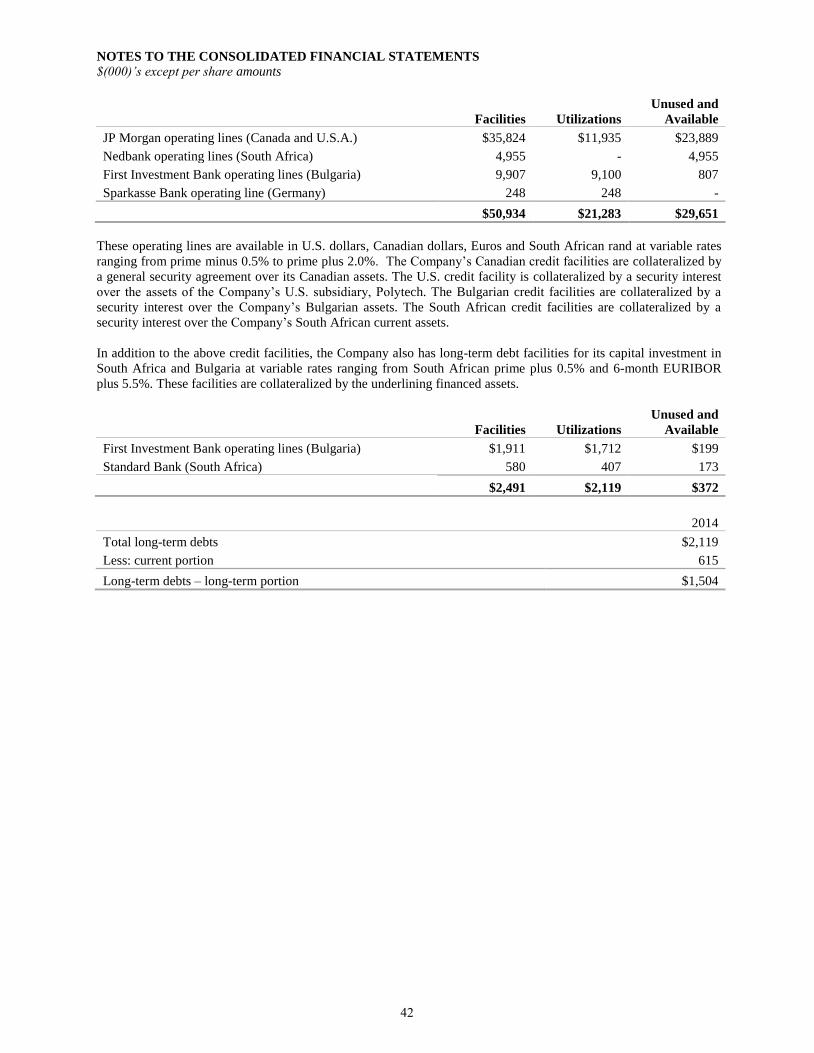
NOTES TO THE CONSOLIDATED FINANCIAL STATEMENTS
$(000)’s except per share amounts
Facilities Utilizations
Unused and
Available
JP Morgan operating lines (Canada and U.S.A.) $35,824 $11,935 $23,889
Nedbank operating lines (South Africa) 4,955 - 4,955
First Investment Bank operating lines (Bulgaria) 9,907 9,100 807
Sparkasse Bank operating line (Germany) 248 248 -
$50,934 $21,283 $29,651
These operating lines are available in U.S. dollars, Canadian dollars, Euros and South African rand at variable rates
ranging from prime minus 0.5% to prime plus 2.0%. The Company’s Canadian credit facilities are collateralized by
a general security agreement over its Canadian assets. The U.S. credit facility is collateralized by a security interest
over the assets of the Company’s U.S. subsidiary, Polytech. The Bulgarian credit facilities are collateralized by a
security interest over the Company’s Bulgarian assets. The South African credit facilities are collateralized by a
security interest over the Company’s South African current assets.
In addition to the above credit facilities, the Company also has long-term debt facilities for its capital investment in
South Africa and Bulgaria at variable rates ranging from South African prime plus 0.5% and 6-month EURIBOR
plus 5.5%. These facilities are collateralized by the underlining financed assets.
Facilities Utilizations
Unused and
Available
First Investment Bank operating lines (Bulgaria) $1,911 $1,712 $199
Standard Bank (South Africa) 580 407 173
$2,491 $2,119 $372
2014
Total long-term debts $2,119
Less: current portion 615
Long-term debts – long-term portion $1,504
42
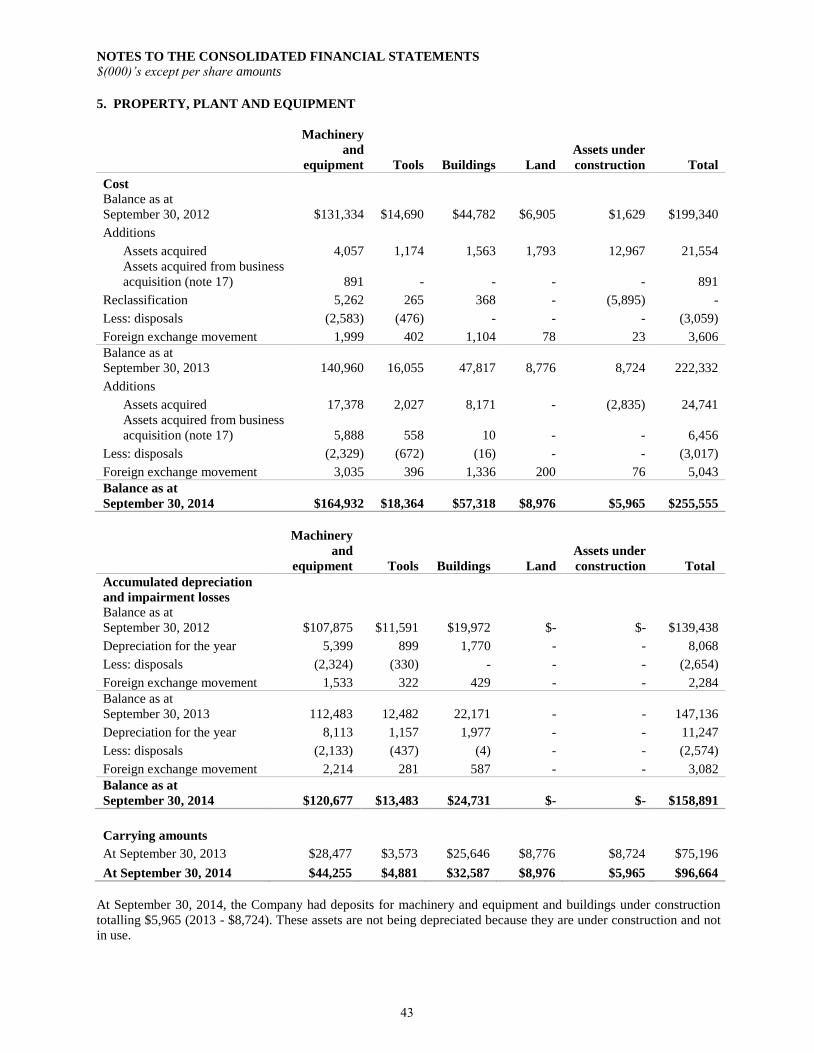
NOTES TO THE CONSOLIDATED FINANCIAL STATEMENTS
$(000)’s except per share amounts
5. PROPERTY, PLANT AND EQUIPMENT
Machinery
and
equipment Tools Buildings Land
Assets under
construction Total
Cost
Balance as at
September 30, 2012 $131,334 $14,690 $44,782 $6,905 $1,629 $199,340
Additions
Assets acquired 4,057 1,174 1,563 1,793 12,967 21,554
Assets acquired from business
acquisition (note 17)
891
-
-
- - 891
Reclassification 5,262 265 368 - (5,895) -
Less: disposals (2,583) (476) - - - (3,059)
Foreign exchange movement 1,999 402 1,104 78 23 3,606
Balance as at
September 30, 2013 140,960 16,055 47,817 8,776 8,724 222,332
Additions
Assets acquired 17,378 2,027 8,171 - (2,835) 24,741
Assets acquired from business
acquisition (note 17)
5,888
558
10 - - 6,456
Less: disposals (2,329) (672) (16) - - (3,017)
Foreign exchange movement 3,035 396 1,336 200 76 5,043
Balance as at
September 30, 2014 $164,932 $18,364 $57,318 $8,976 $5,965 $255,555
Machinery
and
equipment Tools Buildings Land
Assets under
construction Total
Accumulated depreciation
and impairment losses
Balance as at
September 30, 2012 $107,875 $11,591 $19,972 $- $- $139,438
Depreciation for the year 5,399 899 1,770 - - 8,068
Less: disposals (2,324) (330) - - - (2,654)
Foreign exchange movement 1,533 322 429 - - 2,284
Balance as at
September 30, 2013 112,483 12,482 22,171 - - 147,136
Depreciation for the year 8,113 1,157 1,977 - - 11,247
Less: disposals (2,133) (437) (4) - - (2,574)
Foreign exchange movement 2,214 281 587 - - 3,082
Balance as at
September 30, 2014 $120,677 $13,483 $24,731 $- $- $158,891
Carrying amounts
At September 30, 2013 $28,477 $3,573 $25,646 $8,776 $8,724 $75,196
At September 30, 2014 $44,255 $4,881 $32,587 $8,976 $5,965 $96,664
At September 30, 2014, the Company had deposits for machinery and equipment and buildings under construction
totalling $5,965 (2013 - $8,724). These assets are not being depreciated because they are under construction and not
in use.
43
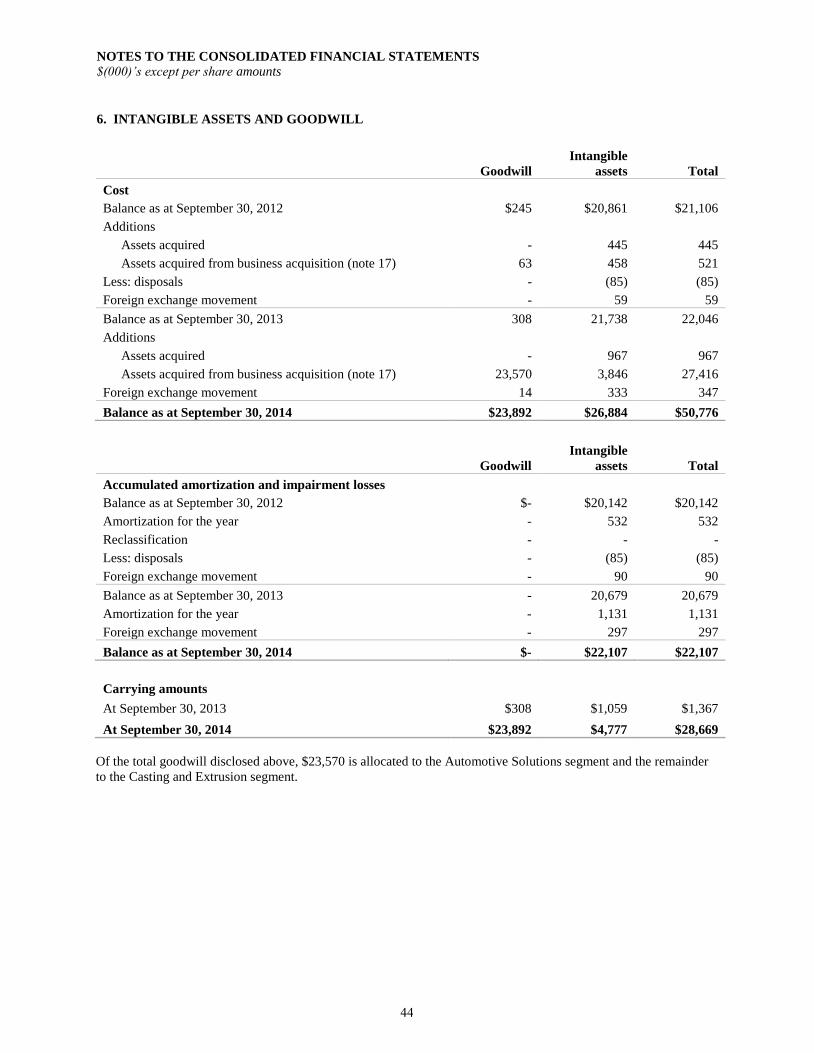
NOTES TO THE CONSOLIDATED FINANCIAL STATEMENTS
$(000)’s except per share amounts
6. INTANGIBLE ASSETS AND GOODWILL
Goodwill
Intangible
assets Total
Cost
Balance as at September 30, 2012 $245 $20,861 $21,106
Additions
Assets acquired - 445 445
Assets acquired from business acquisition (note 17) 63 458 521
Less: disposals - (85) (85)
Foreign exchange movement - 59 59
Balance as at September 30, 2013 308 21,738 22,046
Additions
Assets acquired - 967 967
Assets acquired from business acquisition (note 17) 23,570 3,846 27,416
Foreign exchange movement 14 333 347
Balance as at September 30, 2014 $23,892 $26,884 $50,776
Goodwill
Intangible
assets Total
Accumulated amortization and impairment losses
Balance as at September 30, 2012 $- $20,142 $20,142
Amortization for the year - 532 532
Reclassification - - -
Less: disposals - (85) (85)
Foreign exchange movement - 90 90
Balance as at September 30, 2013 - 20,679 20,679
Amortization for the year - 1,131 1,131
Foreign exchange movement - 297 297
Balance as at September 30, 2014 $- $22,107 $22,107
Carrying amounts
At September 30, 2013 $308 $1,059 $1,367
At September 30, 2014 $23,892 $4,777 $28,669
Of the total goodwill disclosed above, $23,570 is allocated to the Automotive Solutions segment and the remainder
to the Casting and Extrusion segment.
44
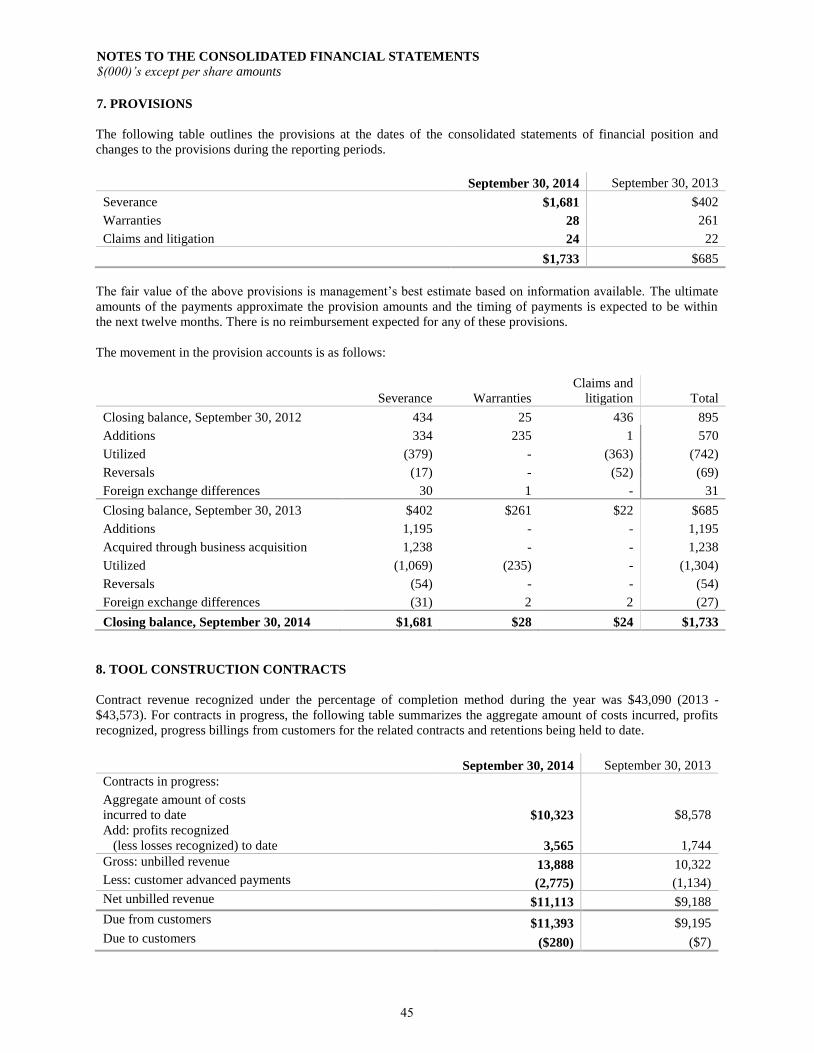
NOTES TO THE CONSOLIDATED FINANCIAL STATEMENTS
$(000)’s except per share amounts
7. PROVISIONS
The following table outlines the provisions at the dates of the consolidated statements of financial position and
changes to the provisions during the reporting periods.
September 30, 2014 September 30, 2013
Severance $1,681 $402
Warranties 28 261
Claims and litigation 24 22
$1,733 $685
The fair value of the above provisions is management’s best estimate based on information available. The ultimate
amounts of the payments approximate the provision amounts and the timing of payments is expected to be within
the next twelve months. There is no reimbursement expected for any of these provisions.
The movement in the provision accounts is as follows:
Severance Warranties
Claims and
litigation Total
Closing balance, September 30, 2012 434 25 436 895
Additions 334 235 1 570
Utilized (379) - (363) (742)
Reversals (17) - (52) (69)
Foreign exchange differences 30 1 - 31
Closing balance, September 30, 2013 $402 $261 $22 $685
Additions 1,195 - - 1,195
Acquired through business acquisition 1,238 - - 1,238
Utilized (1,069) (235) - (1,304)
Reversals (54) - - (54)
Foreign exchange differences (31) 2 2 (27)
Closing balance, September 30, 2014 $1,681 $28 $24 $1,733
8. TOOL CONSTRUCTION CONTRACTS
Contract revenue recognized under the percentage of completion method during the year was $43,090 (2013 -
$43,573). For contracts in progress, the following table summarizes the aggregate amount of costs incurred, profits
recognized, progress billings from customers for the related contracts and retentions being held to date.
September 30, 2014 September 30, 2013
Contracts in progress:
Aggregate amount of costs
incurred to date $10,323 $8,578
Add: profits recognized
(less losses recognized) to date 3,565 1,744
Gross: unbilled revenue 13,888 10,322
Less: customer advanced payments (2,775) (1,134)
Net unbilled revenue $11,113 $9,188
Due from customers $11,393 $9,195
Due to customers ($280) ($7)
45
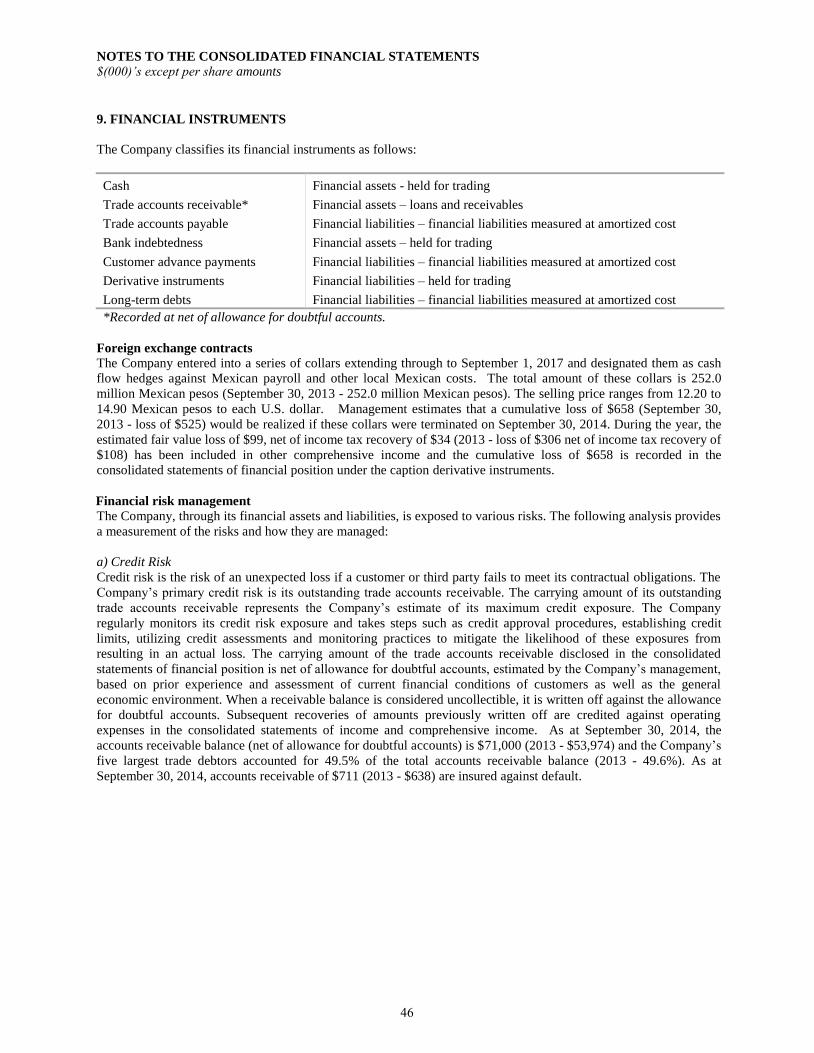
NOTES TO THE CONSOLIDATED FINANCIAL STATEMENTS
$(000)’s except per share amounts
9. FINANCIAL INSTRUMENTS
The Company classifies its financial instruments as follows:
Cash Financial assets - held for trading
Trade accounts receivable* Financial assets – loans and receivables
Trade accounts payable Financial liabilities – financial liabilities measured at amortized cost
Bank indebtedness Financial assets – held for trading
Customer advance payments Financial liabilities – financial liabilities measured at amortized cost
Derivative instruments Financial liabilities – held for trading
Long-term debts Financial liabilities – financial liabilities measured at amortized cost
*Recorded at net of allowance for doubtful accounts.
Foreign exchange contracts
The Company entered into a series of collars extending through to September 1, 2017 and designated them as cash
flow hedges against Mexican payroll and other local Mexican costs. The total amount of these collars is 252.0
million Mexican pesos (September 30, 2013 - 252.0 million Mexican pesos). The selling price ranges from 12.20 to
14.90 Mexican pesos to each U.S. dollar. Management estimates that a cumulative loss of $658 (September 30,
2013 - loss of $525) would be realized if these collars were terminated on September 30, 2014. During the year, the
estimated fair value loss of $99, net of income tax recovery of $34 (2013 - loss of $306 net of income tax recovery of
$108) has been included in other comprehensive income and the cumulative loss of $658 is recorded in the
consolidated statements of financial position under the caption derivative instruments.
Financial risk management The Company, through its financial assets and liabilities, is exposed to various risks. The following analysis provides
a measurement of the risks and how they are managed:
a) Credit Risk
Credit risk is the risk of an unexpected loss if a customer or third party fails to meet its contractual obligations. The
Company’s primary credit risk is its outstanding trade accounts receivable. The carrying amount of its outstanding
trade accounts receivable represents the Company’s estimate of its maximum credit exposure. The Company
regularly monitors its credit risk exposure and takes steps such as credit approval procedures, establishing credit
limits, utilizing credit assessments and monitoring practices to mitigate the likelihood of these exposures from
resulting in an actual loss. The carrying amount of the trade accounts receivable disclosed in the consolidated
statements of financial position is net of allowance for doubtful accounts, estimated by the Company’s management,
based on prior experience and assessment of current financial conditions of customers as well as the general
economic environment. When a receivable balance is considered uncollectible, it is written off against the allowance
for doubtful accounts. Subsequent recoveries of amounts previously written off are credited against operating
expenses in the consolidated statements of income and comprehensive income. As at September 30, 2014, the
accounts receivable balance (net of allowance for doubtful accounts) is $71,000 (2013 - $53,974) and the Company’s
five largest trade debtors accounted for 49.5% of the total accounts receivable balance (2013 - 49.6%). As at
September 30, 2014, accounts receivable of $711 (2013 - $638) are insured against default.
46
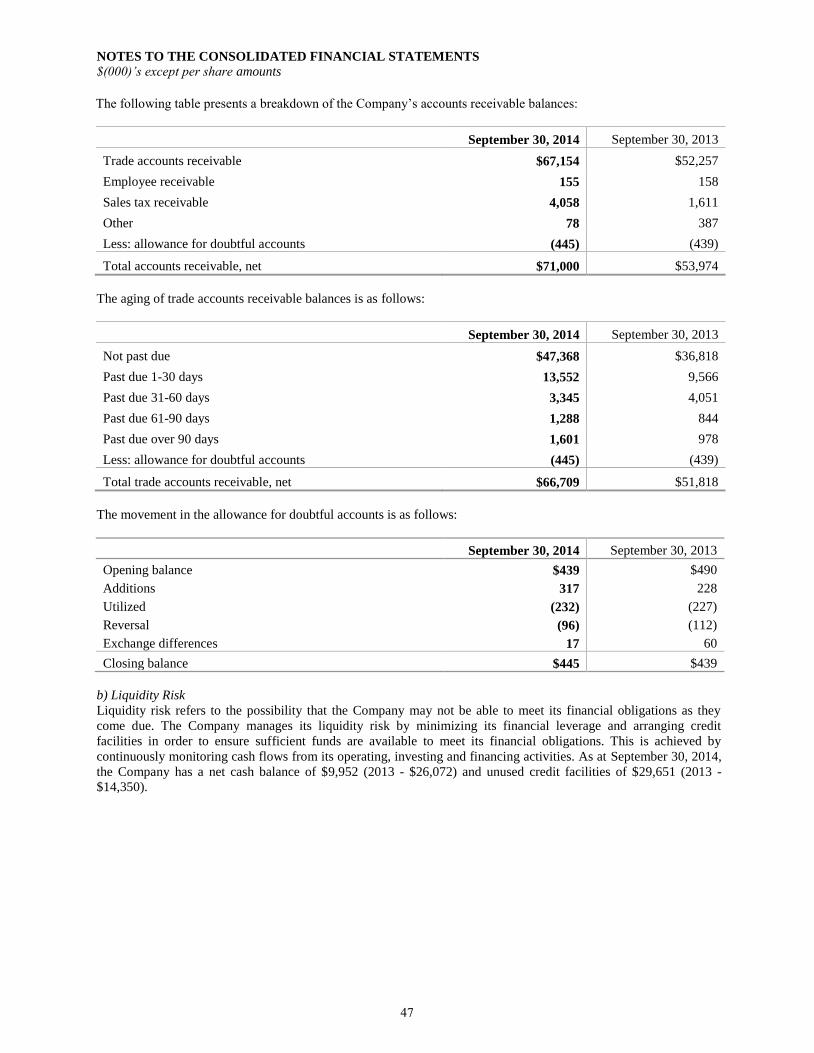
NOTES TO THE CONSOLIDATED FINANCIAL STATEMENTS
$(000)’s except per share amounts
The following table presents a breakdown of the Company’s accounts receivable balances:
September 30, 2014 September 30, 2013
Trade accounts receivable $67,154 $52,257
Employee receivable 155 158
Sales tax receivable 4,058 1,611
Other 78 387
Less: allowance for doubtful accounts (445) (439)
Total accounts receivable, net $71,000 $53,974
The aging of trade accounts receivable balances is as follows:
September 30, 2014 September 30, 2013
Not past due $47,368 $36,818
Past due 1-30 days 13,552 9,566
Past due 31-60 days 3,345 4,051
Past due 61-90 days 1,288 844
Past due over 90 days 1,601 978
Less: allowance for doubtful accounts (445) (439)
Total trade accounts receivable, net $66,709 $51,818
The movement in the allowance for doubtful accounts is as follows:
September 30, 2014 September 30, 2013
Opening balance $439 $490
Additions 317 228
Utilized (232) (227)
Reversal (96) (112)
Exchange differences 17 60
Closing balance $445 $439
b) Liquidity Risk
Liquidity risk refers to the possibility that the Company may not be able to meet its financial obligations as they
come due. The Company manages its liquidity risk by minimizing its financial leverage and arranging credit
facilities in order to ensure sufficient funds are available to meet its financial obligations. This is achieved by
continuously monitoring cash flows from its operating, investing and financing activities. As at September 30, 2014,
the Company has a net cash balance of $9,952 (2013 - $26,072) and unused credit facilities of $29,651 (2013 -
$14,350).
47
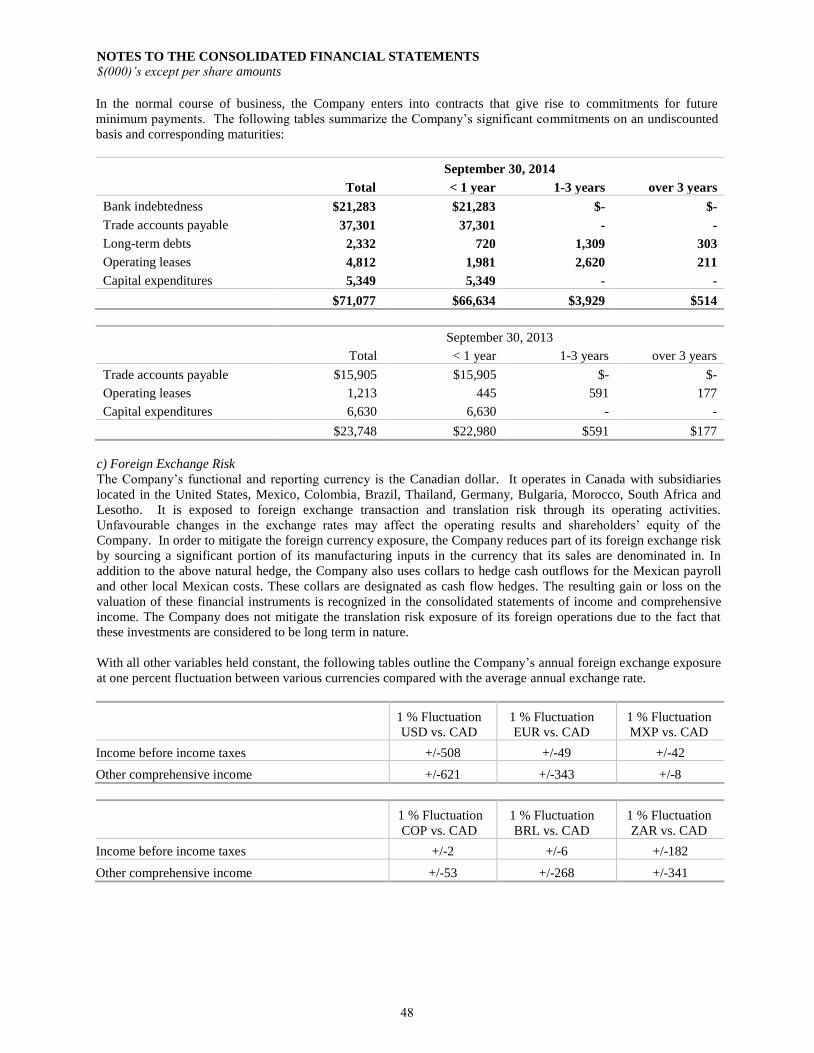
NOTES TO THE CONSOLIDATED FINANCIAL STATEMENTS
$(000)’s except per share amounts
In the normal course of business, the Company enters into contracts that give rise to commitments for future
minimum payments. The following tables summarize the Company’s significant commitments on an undiscounted
basis and corresponding maturities:
September 30, 2014
Total < 1 year 1-3 years over 3 years
Bank indebtedness $21,283 $21,283 $- $-
Trade accounts payable 37,301 37,301 - -
Long-term debts 2,332 720 1,309 303
Operating leases 4,812 1,981 2,620 211
Capital expenditures 5,349 5,349 - -
$71,077 $66,634 $3,929 $514
September 30, 2013
Total < 1 year 1-3 years over 3 years
Trade accounts payable $15,905 $15,905 $- $-
Operating leases 1,213 445 591 177
Capital expenditures 6,630 6,630 - -
$23,748 $22,980 $591 $177
c) Foreign Exchange Risk
The Company’s functional and reporting currency is the Canadian dollar. It operates in Canada with subsidiaries
located in the United States, Mexico, Colombia, Brazil, Thailand, Germany, Bulgaria, Morocco, South Africa and
Lesotho. It is exposed to foreign exchange transaction and translation risk through its operating activities.
Unfavourable changes in the exchange rates may affect the operating results and shareholders’ equity of the
Company. In order to mitigate the foreign currency exposure, the Company reduces part of its foreign exchange risk
by sourcing a significant portion of its manufacturing inputs in the currency that its sales are denominated in. In
addition to the above natural hedge, the Company also uses collars to hedge cash outflows for the Mexican payroll
and other local Mexican costs. These collars are designated as cash flow hedges. The resulting gain or loss on the
valuation of these financial instruments is recognized in the consolidated statements of income and comprehensive
income. The Company does not mitigate the translation risk exposure of its foreign operations due to the fact that
these investments are considered to be long term in nature.
With all other variables held constant, the following tables outline the Company’s annual foreign exchange exposure
at one percent fluctuation between various currencies compared with the average annual exchange rate.
1 % Fluctuation
USD vs. CAD
1 % Fluctuation
EUR vs. CAD
1 % Fluctuation
MXP vs. CAD
Income before income taxes +/-508 +/-49 +/-42
Other comprehensive income +/-621 +/-343 +/-8
1 % Fluctuation
COP vs. CAD
1 % Fluctuation
BRL vs. CAD
1 % Fluctuation
ZAR vs. CAD
Income before income taxes +/-2 +/-6 +/-182
Other comprehensive income +/-53 +/-268 +/-341
48
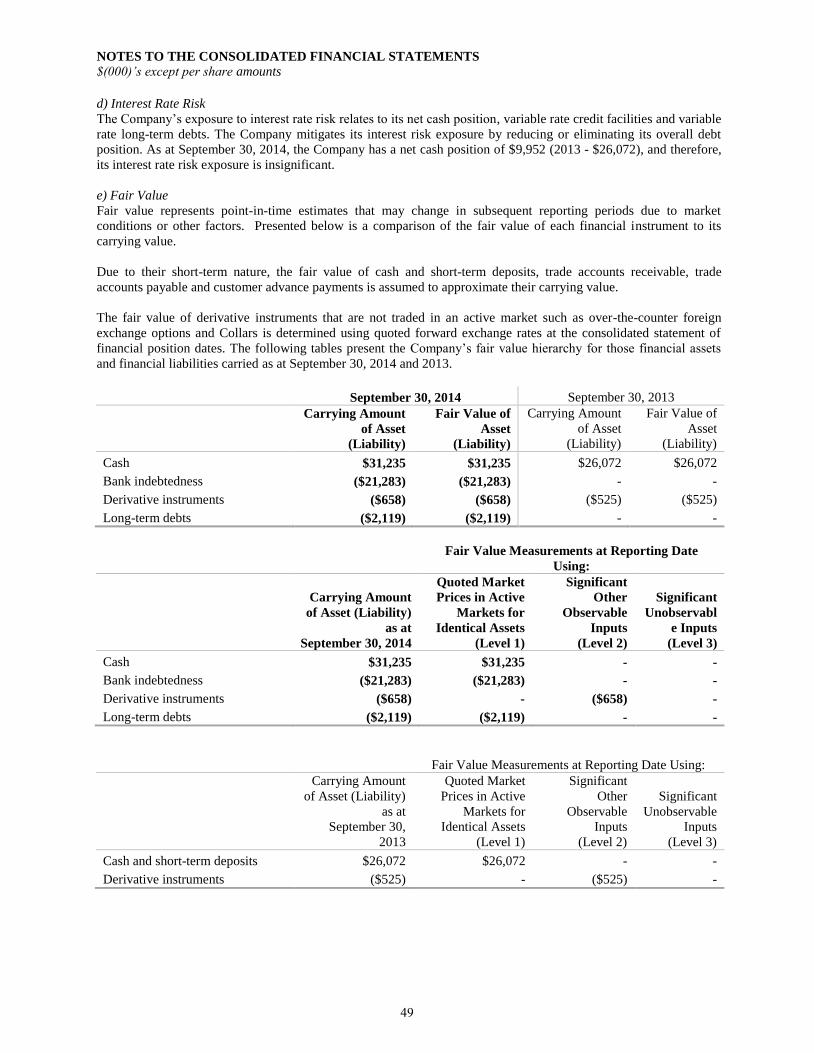
NOTES TO THE CONSOLIDATED FINANCIAL STATEMENTS
$(000)’s except per share amounts
d) Interest Rate Risk
The Company’s exposure to interest rate risk relates to its net cash position, variable rate credit facilities and variable
rate long-term debts. The Company mitigates its interest risk exposure by reducing or eliminating its overall debt
position. As at September 30, 2014, the Company has a net cash position of $9,952 (2013 - $26,072), and therefore,
its interest rate risk exposure is insignificant.
e) Fair Value
Fair value represents point-in-time estimates that may change in subsequent reporting periods due to market
conditions or other factors. Presented below is a comparison of the fair value of each financial instrument to its
carrying value.
Due to their short-term nature, the fair value of cash and short-term deposits, trade accounts receivable, trade
accounts payable and customer advance payments is assumed to approximate their carrying value.
The fair value of derivative instruments that are not traded in an active market such as over-the-counter foreign
exchange options and Collars is determined using quoted forward exchange rates at the consolidated statement of
financial position dates. The following tables present the Company’s fair value hierarchy for those financial assets
and financial liabilities carried as at September 30, 2014 and 2013.
September 30, 2014 September 30, 2013
Carrying Amount
of Asset
(Liability)
Fair Value of
Asset
(Liability)
Carrying Amount
of Asset
(Liability)
Fair Value of
Asset
(Liability)
Cash $31,235 $31,235 $26,072 $26,072
Bank indebtedness ($21,283) ($21,283) - -
Derivative instruments ($658) ($658) ($525) ($525)
Long-term debts ($2,119) ($2,119) - -
Fair Value Measurements at Reporting Date
Using:
Carrying Amount
of Asset (Liability)
as at
September 30, 2014
Quoted Market
Prices in Active
Markets for
Identical Assets
(Level 1)
Significant
Other
Observable
Inputs
(Level 2)
Significant
Unobservabl
e Inputs
(Level 3)
Cash $31,235 $31,235 - -
Bank indebtedness ($21,283) ($21,283) - -
Derivative instruments ($658) - ($658) -
Long-term debts ($2,119) ($2,119) - -
Fair Value Measurements at Reporting Date Using:
Carrying Amount
of Asset (Liability)
as at
September 30,
2013
Quoted Market
Prices in Active
Markets for
Identical Assets
(Level 1)
Significant
Other
Observable
Inputs
(Level 2)
Significant
Unobservable
Inputs
(Level 3)
Cash and short-term deposits $26,072 $26,072 - -
Derivative instruments ($525) - ($525) -
49

NOTES TO THE CONSOLIDATED FINANCIAL STATEMENTS
$(000)’s except per share amounts
10. INVENTORIES
September 30, 2014 September 30, 2013
Raw materials $25,506 $12,937
Work in process 8,079 7,291
Finished goods 12,311 5,602
Production supplies 1,180 215
Less: obsolescence provision (2,146) (1,698)
$44,930 $24,347
The movement in the obsolescence provision accounts is as follows:
September 30, 2014 September 30, 2013
Opening balance $1,698 $1,797
Additions 528 736
Acquired through business acquisition 559
Utilized (698) (930)
Reversals (13) -
Exchange differences 72 95
Closing balance $2,146 $1,698
During the year, inventories of $177,320 (2013 - $102,011) were expensed, of which $515 was from the write-downs
of inventories (2013 - $736), net of $13 reversal of write-downs (2013 – nil).
11. CAPITAL MANAGEMENT
The Company defines capital as net debt and shareholders’ equity. As at September 30, 2014, total managed capital
was $202,746 (2013 - $164,134), consisting of net debt of nil (2013 – nil) and shareholders’ equity of $202,746
(2013 - $164,134).
The Company’s objectives when managing capital are to:
utilize short-term funding sources to manage its working capital requirements and fund capital expenditures
required to execute its operating and strategic plans, and
maintain low overall debt levels relative to shareholders’ equity with a strong bias for short-term debt in order to
minimize the cost of capital and allow maximum flexibility to respond to current and future industry, market and
economic risks and opportunities.
The following ratios are used by the Company to monitor its capital:
As at September 30, 2014 September 30, 2013
Net debt to equity ratio 0.00:1 0.00:1
Current ratio 2.19:1 3.23:1
50
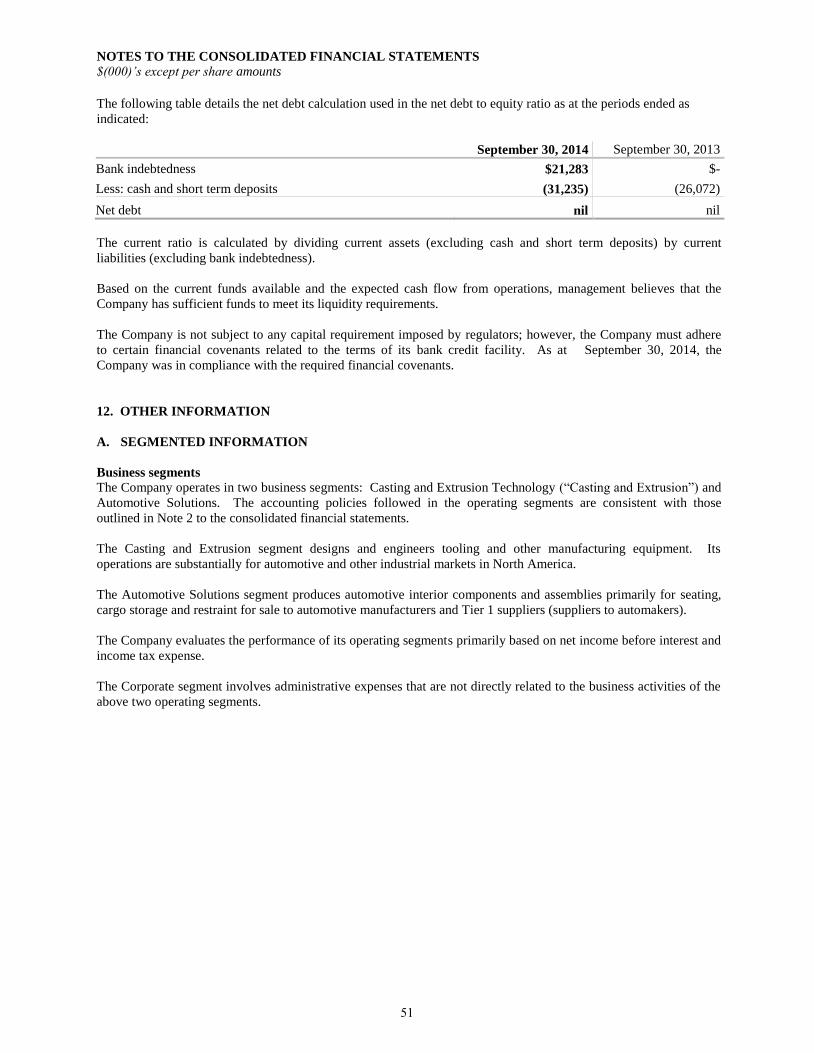
NOTES TO THE CONSOLIDATED FINANCIAL STATEMENTS
$(000)’s except per share amounts
The following table details the net debt calculation used in the net debt to equity ratio as at the periods ended as
indicated:
As at September 30, 2014 September 30, 2013
Bank indebtedness $21,283 $-
Less: cash and short term deposits (31,235) (26,072)
Net debt nil nil
The current ratio is calculated by dividing current assets (excluding cash and short term deposits) by current
liabilities (excluding bank indebtedness).
Based on the current funds available and the expected cash flow from operations, management believes that the
Company has sufficient funds to meet its liquidity requirements.
The Company is not subject to any capital requirement imposed by regulators; however, the Company must adhere
to certain financial covenants related to the terms of its bank credit facility. As at September 30, 2014, the
Company was in compliance with the required financial covenants.
12. OTHER INFORMATION
A. SEGMENTED INFORMATION
Business segments
The Company operates in two business segments: Casting and Extrusion Technology (“Casting and Extrusion”) and
Automotive Solutions. The accounting policies followed in the operating segments are consistent with those
outlined in Note 2 to the consolidated financial statements.
The Casting and Extrusion segment designs and engineers tooling and other manufacturing equipment. Its
operations are substantially for automotive and other industrial markets in North America.
The Automotive Solutions segment produces automotive interior components and assemblies primarily for seating,
cargo storage and restraint for sale to automotive manufacturers and Tier 1 suppliers (suppliers to automakers).
The Company evaluates the performance of its operating segments primarily based on net income before interest and
income tax expense.
The Corporate segment involves administrative expenses that are not directly related to the business activities of the
above two operating segments.
51
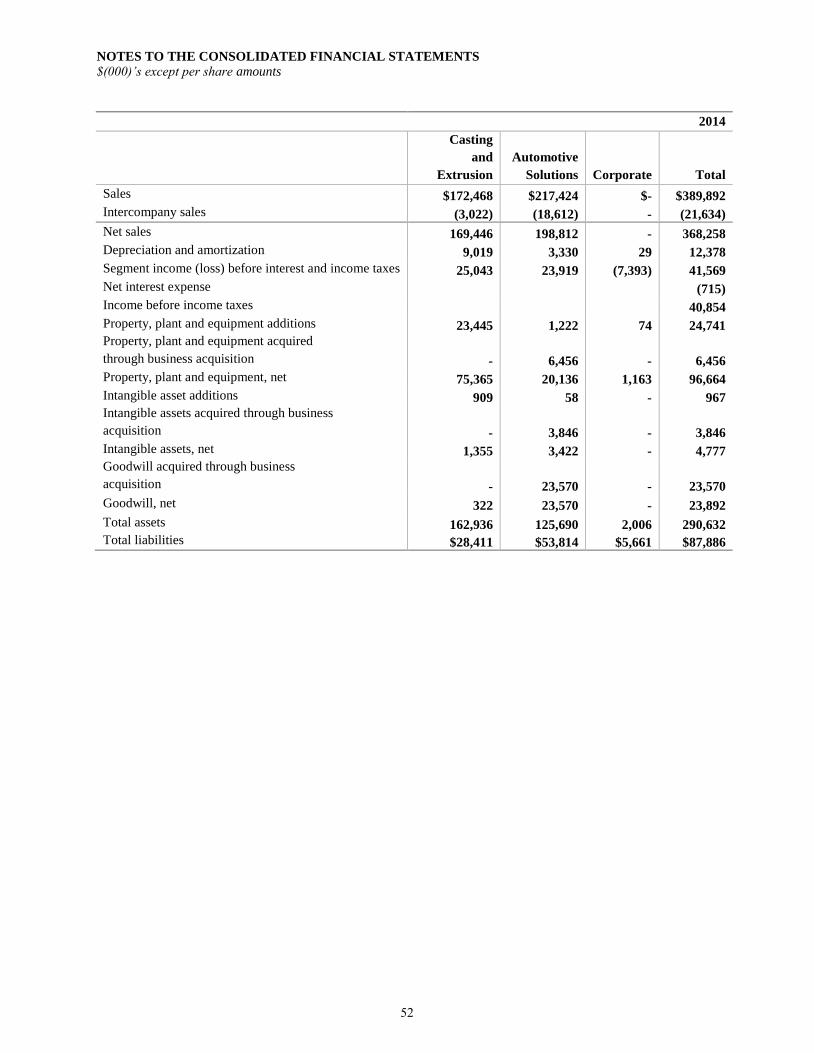
NOTES TO THE CONSOLIDATED FINANCIAL STATEMENTS
$(000)’s except per share amounts
2014
Casting
and
Extrusion
Automotive
Solutions Corporate
Total
Sales $172,468 $217,424 $- $389,892
Intercompany sales (3,022) (18,612) - (21,634)
Net sales 169,446 198,812 - 368,258
Depreciation and amortization 9,019 3,330 29 12,378
Segment income (loss) before interest and income taxes 25,043 23,919 (7,393) 41,569
Net interest expense (715)
Income before income taxes 40,854
Property, plant and equipment additions 23,445 1,222 74 24,741
Property, plant and equipment acquired
through business acquisition - 6,456 - 6,456
Property, plant and equipment, net 75,365 20,136 1,163 96,664
Intangible asset additions 909 58 - 967
Intangible assets acquired through business
acquisition - 3,846 - 3,846
Intangible assets, net 1,355 3,422 - 4,777
Goodwill acquired through business
acquisition - 23,570 - 23,570
Goodwill, net 322 23,570 - 23,892
Total assets 162,936 125,690 2,006 290,632
Total liabilities $28,411 $53,814 $5,661 $87,886
52
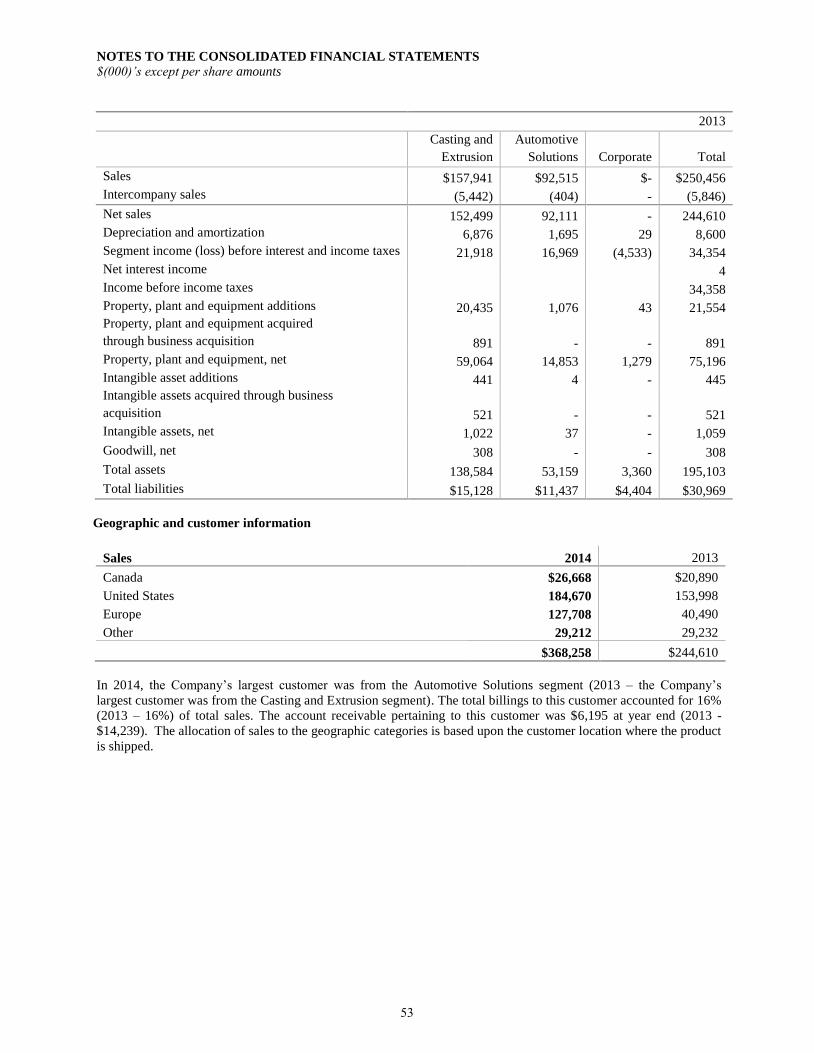
NOTES TO THE CONSOLIDATED FINANCIAL STATEMENTS
$(000)’s except per share amounts
2013
Casting and
Extrusion
Automotive
Solutions Corporate
Total
Sales $157,941 $92,515 $- $250,456
Intercompany sales (5,442) (404) - (5,846)
Net sales 152,499 92,111 - 244,610
Depreciation and amortization 6,876 1,695 29 8,600
Segment income (loss) before interest and income taxes 21,918 16,969 (4,533) 34,354
Net interest income 4
Income before income taxes 34,358
Property, plant and equipment additions 20,435 1,076 43 21,554
Property, plant and equipment acquired
through business acquisition 891 - - 891
Property, plant and equipment, net 59,064 14,853 1,279 75,196
Intangible asset additions 441 4 - 445
Intangible assets acquired through business
acquisition 521 - - 521
Intangible assets, net 1,022 37 - 1,059
Goodwill, net 308 - - 308
Total assets 138,584 53,159 3,360 195,103
Total liabilities $15,128 $11,437 $4,404 $30,969
Geographic and customer information
Sales 2014 2013
Canada $26,668 $20,890
United States 184,670 153,998
Europe 127,708 40,490
Other 29,212 29,232
$368,258 $244,610
In 2014, the Company’s largest customer was from the Automotive Solutions segment (2013 – the Company’s
largest customer was from the Casting and Extrusion segment). The total billings to this customer accounted for 16%
(2013 – 16%) of total sales. The account receivable pertaining to this customer was $6,195 at year end (2013 -
$14,239). The allocation of sales to the geographic categories is based upon the customer location where the product
is shipped.
53
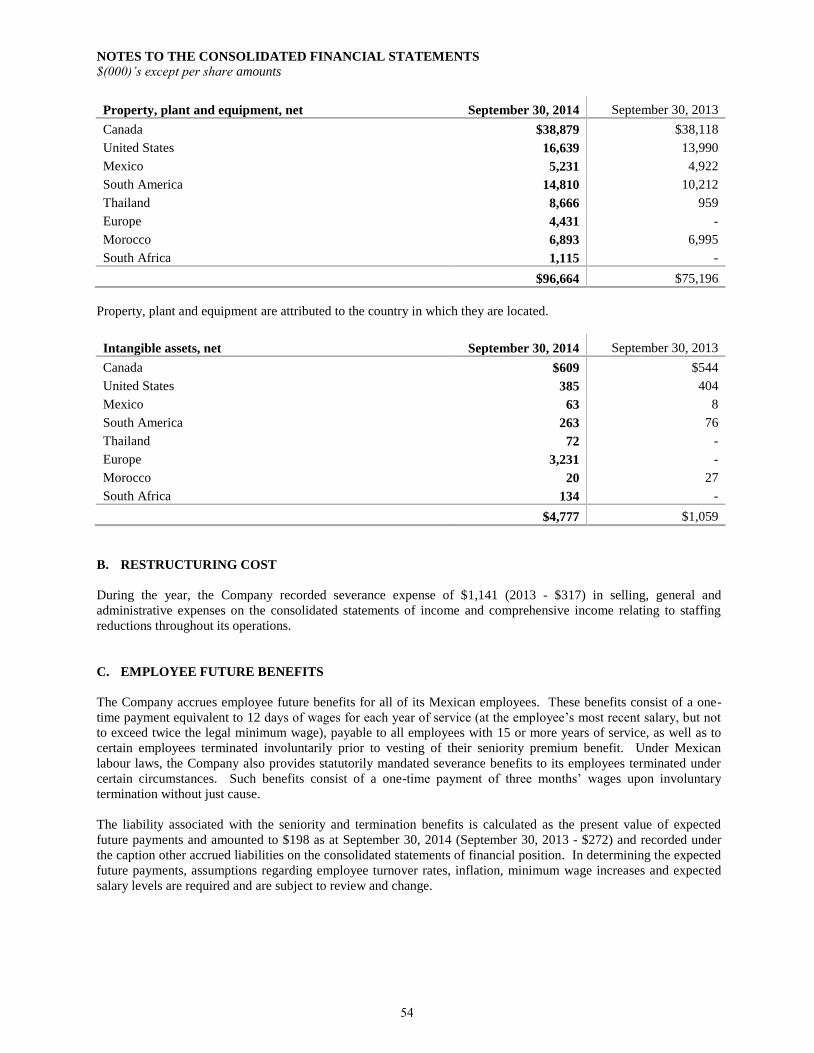
NOTES TO THE CONSOLIDATED FINANCIAL STATEMENTS
$(000)’s except per share amounts
Property, plant and equipment, net September 30, 2014 September 30, 2013
Canada $38,879 $38,118
United States 16,639 13,990
Mexico 5,231 4,922
South America 14,810 10,212
Thailand 8,666 959
Europe 4,431 -
Morocco 6,893 6,995
South Africa 1,115 -
$96,664 $75,196
Property, plant and equipment are attributed to the country in which they are located.
Intangible assets, net September 30, 2014 September 30, 2013
Canada $609 $544
United States 385 404
Mexico 63 8
South America 263 76
Thailand 72 -
Europe 3,231 -
Morocco 20 27
South Africa 134 -
$4,777 $1,059
B. RESTRUCTURING COST
During the year, the Company recorded severance expense of $1,141 (2013 - $317) in selling, general and
administrative expenses on the consolidated statements of income and comprehensive income relating to staffing
reductions throughout its operations.
C. EMPLOYEE FUTURE BENEFITS
The Company accrues employee future benefits for all of its Mexican employees. These benefits consist of a one-
time payment equivalent to 12 days of wages for each year of service (at the employee’s most recent salary, but not
to exceed twice the legal minimum wage), payable to all employees with 15 or more years of service, as well as to
certain employees terminated involuntarily prior to vesting of their seniority premium benefit. Under Mexican
labour laws, the Company also provides statutorily mandated severance benefits to its employees terminated under
certain circumstances. Such benefits consist of a one-time payment of three months’ wages upon involuntary
termination without just cause.
The liability associated with the seniority and termination benefits is calculated as the present value of expected
future payments and amounted to $198 as at September 30, 2014 (September 30, 2013 - $272) and recorded under
the caption other accrued liabilities on the consolidated statements of financial position. In determining the expected
future payments, assumptions regarding employee turnover rates, inflation, minimum wage increases and expected
salary levels are required and are subject to review and change.
54
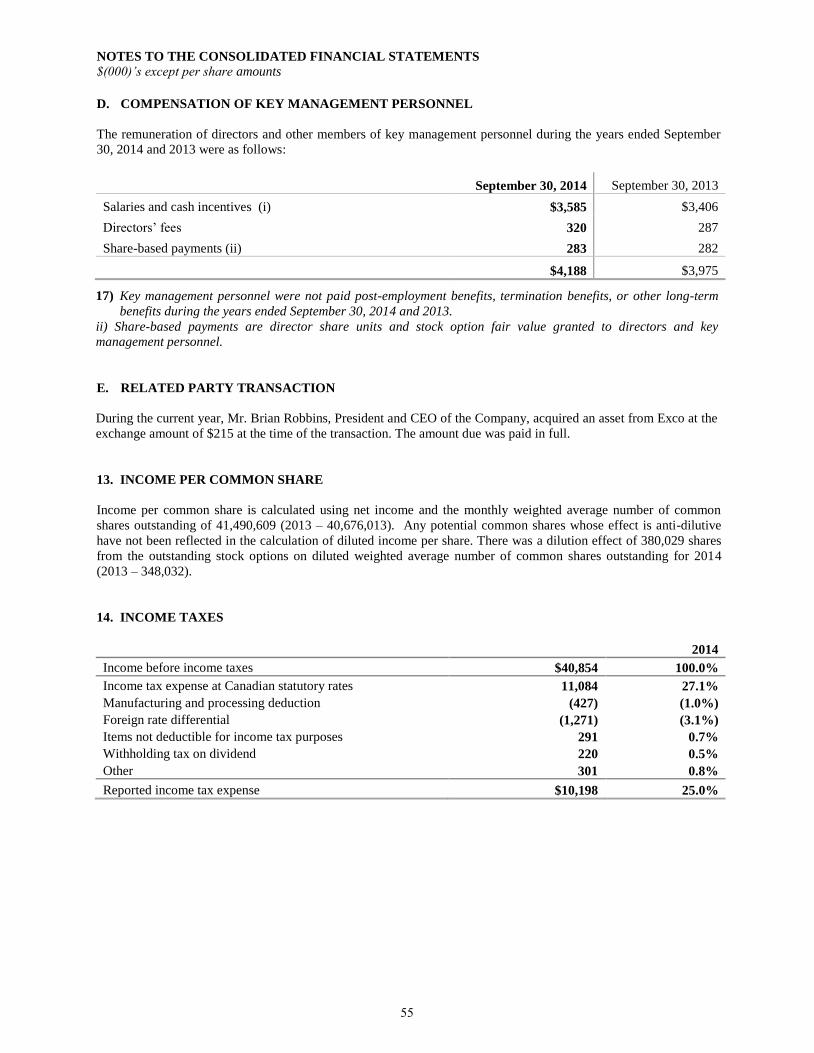
NOTES TO THE CONSOLIDATED FINANCIAL STATEMENTS
$(000)’s except per share amounts
D. COMPENSATION OF KEY MANAGEMENT PERSONNEL
The remuneration of directors and other members of key management personnel during the years ended September
30, 2014 and 2013 were as follows:
September 30, 2014 September 30, 2013
Salaries and cash incentives (i) $3,585 $3,406
Directors’ fees 320 287
Share-based payments (ii) 283 282
$4,188 $3,975
17) Key management personnel were not paid post-employment benefits, termination benefits, or other long-term
benefits during the years ended September 30, 2014 and 2013.
ii) Share-based payments are director share units and stock option fair value granted to directors and key
management personnel.
E. RELATED PARTY TRANSACTION
During the current year, Mr. Brian Robbins, President and CEO of the Company, acquired an asset from Exco at the
exchange amount of $215 at the time of the transaction. The amount due was paid in full.
13. INCOME PER COMMON SHARE
Income per common share is calculated using net income and the monthly weighted average number of common
shares outstanding of 41,490,609 (2013 – 40,676,013). Any potential common shares whose effect is anti-dilutive
have not been reflected in the calculation of diluted income per share. There was a dilution effect of 380,029 shares
from the outstanding stock options on diluted weighted average number of common shares outstanding for 2014
(2013 – 348,032).
14. INCOME TAXES
2014
Income before income taxes $40,854 100.0%
Income tax expense at Canadian statutory rates 11,084 27.1%
Manufacturing and processing deduction (427) (1.0%)
Foreign rate differential (1,271) (3.1%)
Items not deductible for income tax purposes 291 0.7%
Withholding tax on dividend 220 0.5%
Other 301 0.8%
Reported income tax expense $10,198 25.0%
55
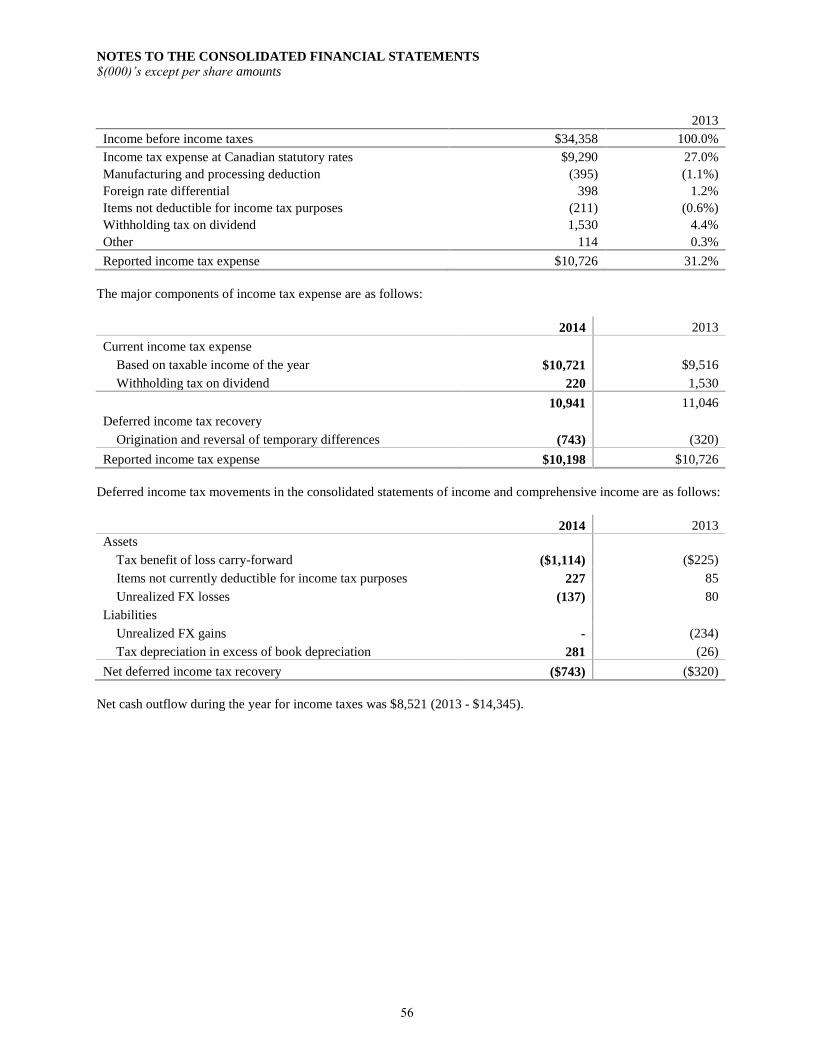
NOTES TO THE CONSOLIDATED FINANCIAL STATEMENTS
$(000)’s except per share amounts
2013
Income before income taxes $34,358 100.0%
Income tax expense at Canadian statutory rates $9,290 27.0%
Manufacturing and processing deduction (395) (1.1%)
Foreign rate differential 398 1.2%
Items not deductible for income tax purposes (211) (0.6%)
Withholding tax on dividend 1,530 4.4%
Other 114 0.3%
Reported income tax expense $10,726 31.2%
The major components of income tax expense are as follows:
2014 2013
Current income tax expense
Based on taxable income of the year $10,721 $9,516
Withholding tax on dividend 220 1,530
10,941 11,046
Deferred income tax recovery
Origination and reversal of temporary differences (743) (320)
Reported income tax expense $10,198 $10,726
Deferred income tax movements in the consolidated statements of income and comprehensive income are as follows:
2014 2013
Assets
Tax benefit of loss carry-forward ($1,114) ($225)
Items not currently deductible for income tax purposes 227 85
Unrealized FX losses (137) 80
Liabilities
Unrealized FX gains - (234)
Tax depreciation in excess of book depreciation 281 (26)
Net deferred income tax recovery ($743) ($320)
Net cash outflow during the year for income taxes was $8,521 (2013 - $14,345).
56

NOTES TO THE CONSOLIDATED FINANCIAL STATEMENTS
$(000)’s except per share amounts
Deferred income tax assets and liabilities consist of the following temporary differences:
2014 2013
Deferred tax assets
Tax benefit of loss carry-forward $3,258 $513
Items not currently deductible for income tax purposes 608 734
Unrealized foreign exchange losses 410 130
4,276 1,377
Deferred tax liabilities
Tax depreciation in excess of book depreciation (3,265) (2,800)
Investment in subsidiaries (2,665) -
(5,930) (2,800)
Net deferred income tax liabilities ($1,654) ($1,423)
The temporary difference associated with investments in subsidiaries for which deferred tax liabilities have not been
recognized aggregated to $25,862 (2013 - $19,676).
15. CONSOLIDATED STATEMENTS OF CASH FLOW
Net change in non-cash working capital
The net change in non-cash working capital balances related to operations consists of the following:
2014 2013
Accounts receivable $431 ($6,935)
Unbilled revenue (1,890) 4,378
Inventories (8,285) (2,634)
Prepaid expenses and deposits 216 (112)
Trade accounts payable 3,515 (298)
Accrued payroll and taxes 399 375
Other accrued liabilities 1,957 (769)
Derivative instruments 133 295
Provisions (933) (210)
Customer advance payments (246) 14
Income taxes payable 3,002 (3,342)
Long-term debts – current portion 108 -
($1,593) ($9,238)
Financing activities
Included in the financing activities was $740 interest paid on the bank indebtedness and $63 interest paid on the
long-term debts (note 18).
Non-cash investing activities
Not included in the investing activities was $9,030 of common shares issued as part of the consideration for the
ALC acquisition on March 1, 2014 (note 17).
57

NOTES TO THE CONSOLIDATED FINANCIAL STATEMENTS
$(000)’s except per share amounts
16. CONTINGENT LIABILITIES
In the ordinary course of business, the Company may be contingently liable for litigation and claims with customers,
suppliers and former employees. On an ongoing basis, the Company assesses the likelihood of any adverse
judgments or outcomes to these matters as well as potential ranges of probable costs and losses and a determination
of the provision required, if any, for these contingencies is made after analysis of each individual issue. Other than
amounts already provided for in the consolidated financial statements, there are no material contingent liabilities as
at September 30, 2014 (2013 – nil).
17. BUSINESS ACQUISITION
The Company accounts for acquisitions using the acquisition method of accounting with the results of operations
included in the Company’s consolidated financial statements from the respective date of the acquisition.
On March 1, 2014, the Company acquired all of the shares of Automotive Leather Company Group (Pty) Limited
(“ALC”), a private company organized under the laws of South Africa for a total consideration of $26,373, of which
$17,343 was in cash and $9,030 was in Exco’s common shares which were fair valued at the market price at the
closing date. ALC specializes in the manufacture and export of luxury leather interior trim components to the middle
and luxury automotive sectors. The primary customers are BMW and its tiers, although other German OEMs and
their tiers are also customers. The acquisition will enable Exco to supply the German OEMs in Europe and other
parts of the world. It will also provide the Company with production facilities in Eastern Europe from which to
supply the European automotive market with its other interior trim products.
The final purchase price was allocated to the identifiable assets acquired and liabilities assumed based on the fair
value of the total consideration as follows:
Cash $16
Trade accounts receivable and other 18,053
Inventories 12,231
Property, plant and equipment 6,456
Intangible assets 3,846
Goodwill 23,570
Bank indebtedness (8,692)
Trade accounts payable, accrued liabilities and other (24,153)
Deferred tax liabilities (2,073)
Long-term debts (2,881)
$26,373
Due-diligence and closing costs for the ALC acquisition amounted to $526 and were expensed under selling, general
and administrative expenses on the consolidated statements of income and comprehensive income.
The fair value of the trade accounts receivable equals the gross amount of the trade accounts receivable less
allowance for bad debts and amounts to $17,520. The net contractual amount is collectible.
The goodwill of $23,570 is allocated to the entire Automotive Solutions segment. None of the goodwill recognized
is expected to be deductible for income tax purposes.
58
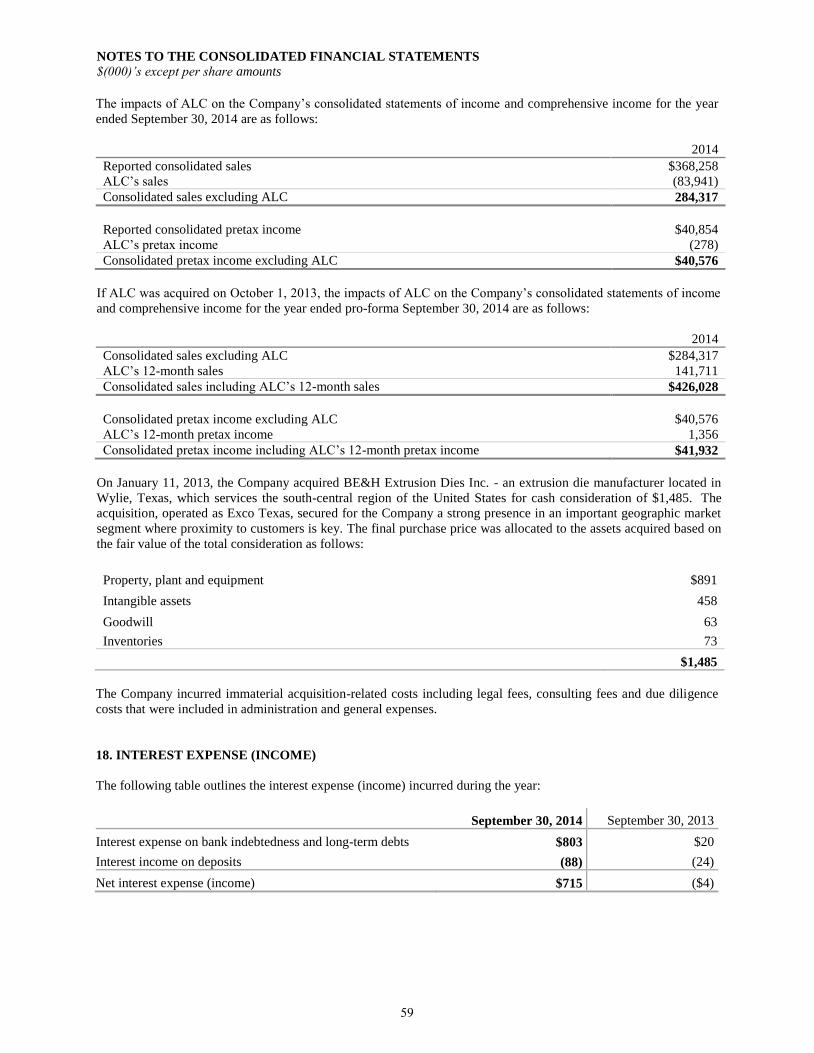
NOTES TO THE CONSOLIDATED FINANCIAL STATEMENTS
$(000)’s except per share amounts
The impacts of ALC on the Company’s consolidated statements of income and comprehensive income for the year
ended September 30, 2014 are as follows:
2014
Reported consolidated sales $368,258
ALC’s sales (83,941)
Consolidated sales excluding ALC 284,317
Reported consolidated pretax income $40,854
ALC’s pretax income (278)
Consolidated pretax income excluding ALC $40,576
If ALC was acquired on October 1, 2013, the impacts of ALC on the Company’s consolidated statements of income
and comprehensive income for the year ended pro-forma September 30, 2014 are as follows:
2014
Consolidated sales excluding ALC $284,317
ALC’s 12-month sales 141,711
Consolidated sales including ALC’s 12-month sales $426,028
Consolidated pretax income excluding ALC $40,576
ALC’s 12-month pretax income 1,356
Consolidated pretax income including ALC’s 12-month pretax income $41,932
On January 11, 2013, the Company acquired BE&H Extrusion Dies Inc. - an extrusion die manufacturer located in
Wylie, Texas, which services the south-central region of the United States for cash consideration of $1,485. The
acquisition, operated as Exco Texas, secured for the Company a strong presence in an important geographic market
segment where proximity to customers is key. The final purchase price was allocated to the assets acquired based on
the fair value of the total consideration as follows:
Property, plant and equipment $891
Intangible assets 458
Goodwill 63
Inventories 73
$1,485
The Company incurred immaterial acquisition-related costs including legal fees, consulting fees and due diligence
costs that were included in administration and general expenses.
18. INTEREST EXPENSE (INCOME)
The following table outlines the interest expense (income) incurred during the year:
As at September 30, 2014 September 30, 2013
Interest expense on bank indebtedness and long-term debts $803 $20
Interest income on deposits (88) (24)
Net interest expense (income) $715 ($4)
59
Casting & Extrusion Technologies – Greenfield Facility
Casting & Extrusion Technologies – Production Facility
Automotive Solutions – Production Facility
Automotive Solutions – Administration Office
ALC Acquisition
Dartmouth, NS
Markham, ON Newmarket, ON Uxbridge, ON
Toledo, OH Troy, MI Chesterfield, MI
Wylie, TX Matamoros, MX
Queretaro, MX
Medellin, Colombia
Sorocaba, Brazil
Tangier, Morocco
Chonburi, Thailand
Rosslyn, SA Maputsoe, Lesotho
Musachevo & Ihtiman, Bulgaria
Landshut, Germany
Before net change in non-cash working capital. *
®
10 11 12 13 14
165.
5
202.
6
242.
5
244.
6
368.
3
Sales ($ millions)
10 11 12 13 14
10.
1
13.
3 2
4.4
23.
6
30.
7
Net income ($ millions)
10 11 12 13 14
$0.2
5
$0.3
2 $0
.60
$0.5
8
$0.7
4
Basic earnings per share
10 11 12 13 14
18.
6
23.
6
31.
7
32.
1
42.
0
Cash �ow from operating activities*
($millions)
CORPORATE INFORMATION
Board of Directors Laurie T.F. Bennett, CPA, CA Corporate Director Edward H. Kernaghan, MSc Senior Investment Advisor Kernaghan & Partners Ltd. Nicole A. Kirk, BA, MBA Corporate Director Robert B. Magee, PEng Chairman Woodbridge Group Philip B. Matthews, MA, CPA, CA Corporate Director Brian A. Robbins, PEng President and CEO of the Company Peter van Schaik Founder and Chairman Van Rob Inc. ______________________________ Corporate Officers Brian A. Robbins, PEng President and CEO Paul Riganelli, MA, MBA, LLB Senior Vice President and COO Mary H. Nguyen, CPA, CMA Vice President Finance, CFO and Secretary
Transfer Agent and Registrar TMX Equity Transfer Services 200 University Avenue, Suite 300 Toronto, Ontario M5H 4H1 Phone: 416.361.0152 www.equitytransfer.com ______________________________ Auditors Ernst & Young LLP Chartered Accountants ______________________________ Stock Listing Toronto Stock Exchange (XTC) ______________________________ Corporate Office Exco Technologies Limited 130 Spy Court, 2nd Floor Markham, Ontario L3R 5H6 Phone: 905.477.3065 www.excocorp.com ______________________________ 2014 Annual Meeting The 2014 Annual Meeting for the Shareholders will be held at EXCO at 130 Spy Court, 2nd Floor, Markham, Ontario on Wednesday, January 28, 2015, at 4:30 pm.

Reaping What We Sew
2014 Annual Report
Technologies Limited
130 Spy Court, 2nd FloorMarkham, ON, Canada L3R 5H6
T. 905.477.3065www.excocorp.com
®
®