real-time detection of crowded buses via mobile phones
TRANSCRIPT

REAL-TIME DETECTION OF CROWDED BUSES VIA MOBILE PHONES
Alex HaigCarnegie Mellon [email protected]
Shirley Anugrah HayatiCarnegie Mellon [email protected]
Anthony TomasicCarnegie Mellon [email protected]
Word Count: 4727 words + 6 figure(s) x 250 + 5 table(s) x 250 = 7477 words
Submission Date: November 15, 2018
A. Haig, S. A. Hayati, and A. Tomasic 2
ABSTRACTAutomated passenger counting (APC) technology is central to many aspects of the public transitexperience. APC information informs public transit planners about utilization in a public transitsystem and operations about dynamic fluctuations in demand. Perhaps most importantly, APCinformation provides one metric to the rider experience – standing during a long ride because ofa crowded vehicle is an unpleasant experience. Several technologies have been successfully usedfor APC including light beam sensing and video image analysis. However, these technologies areexpensive and must be installed in buses. In this paper, we analyze a new source of data usingstatistical models: rider smartphone accelerometers. Smartphones are ubiquitous in society andaccelerometers have been shown to accurately model user states such as walking and sitting. Weextend these models to use accelerometers to detect if the rider is standing or sitting on a bus.Standing riders are a signal that the bus is crowded. This paper provides evidence that user smart-phones are a valid source of participatory sensing and thus a new source of automated passengercounting data.
Keywords: Automatic Passenger Counter, Participatory Sensing, Machine Learning
A. Haig, S. A. Hayati, and A. Tomasic 3
INTRODUCTIONAccurate knowledge about the utilization of public transit vehicles by riders, such as bus fullness,is critical information for public transit planners. Automatic Passenger Counters (APC) are used tocount riders in public transit systems. APC information is used by transit planners to detect transitbottlenecks. A vehicle with a passenger counter higher than the numbers of seats available indi-cates that capacity is approaching the limit. APC counting is also used in real time by operationsteams to assess overcrowding of vehicles – a signal to dispatch additional vehicles on demand.Finally, APC data provides evidence that the rider experience is poor - high APC counts, relativeto the capacity of the vehicle, indicate that riders are probably standing in a crowded vehicle duringthe trip.
In this paper, we investigate a new technique for recording information about bus vehiclefullness. Participatory sensing, via a user’s smartphone accerolmeter and GPS, can be used intransit systems to gather information about users and vehicles (1) without requiring action from theuser – in this case whether the rider is sitting or standing. This information, aggregated across ridersin a vehicle, provides a signal about current conditions. The fullness of a bus can be estimated bythe number of riders standing or sitting on the bus. Since smartphones are now equipped withaccelerometers, machine learning algorithms can predict the state of riders and thus infer the stateof the vehicle with respect to fullness. This method of determining fullness is thus complementaryto APC data.
While APC data may be a good measure of rider counts in aggregate, it can suffer fromhigh error when considering individual vehicles (cf. Results Section) due to compounding errors.Thus, APC data is not always reliable. On the other hand, using phone sensors may not be ableto produce an exact rider count, but aggregating across phone sensors provides an independent,direct, measurement of the state of riders. In addition, the error associated with each measurementis independent.
Third party transit information providers want information about the fullness of a bus priorto its arrival to provide to riders. Such information will be especially useful for riders with accessi-bility issues. However, these transit information providers typically do not have access to the APCdata in real-time. Participatory sensing provides a direct method of providing this information,independent of the budgetary constraints of the transit agency (2).
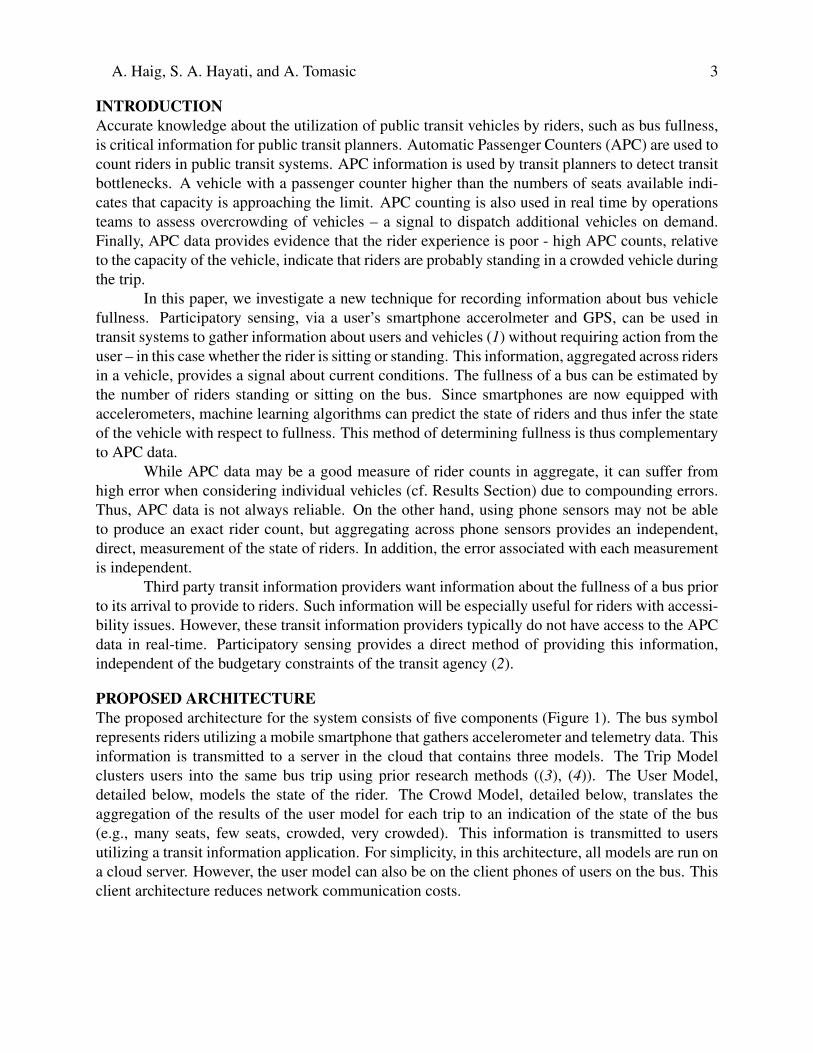
PROPOSED ARCHITECTUREThe proposed architecture for the system consists of five components (Figure 1). The bus symbolrepresents riders utilizing a mobile smartphone that gathers accelerometer and telemetry data. Thisinformation is transmitted to a server in the cloud that contains three models. The Trip Modelclusters users into the same bus trip using prior research methods ((3), (4)). The User Model,detailed below, models the state of the rider. The Crowd Model, detailed below, translates theaggregation of the results of the user model for each trip to an indication of the state of the bus(e.g., many seats, few seats, crowded, very crowded). This information is transmitted to usersutilizing a transit information application. For simplicity, in this architecture, all models are run ona cloud server. However, the user model can also be on the client phones of users on the bus. Thisclient architecture reduces network communication costs.
A. Haig, S. A. Hayati, and A. Tomasic 4
FIGURE 1 System Functional Architecture
METHODOLOGYThis study is organized into three linked sections. In the first section, we analyze APC data for thePort Authority of Allegheny County (PAAC) to estimate its accuracy. The next section describesthe methodology, via direct field observations, for measuring the relationship between bus fullnessand riders standing on the bus. In the third section, accelerometer data from smartphones is logged.The logs provide training data to model a rider’s current state, specifically to detect if they were ona bus, and if so were they standing or sitting.
Automatic Passenger Counter Data AccuracyTo examine the APC data, we obtained two months worth of data for the PAAC bus system, fromNovember of 2016 and March of 2017. PAAC buses use light beams mounted at the doors of busesto count riders entering and exiting buses. This data does not contain ground-truth measurementsof rider counts. We estimate its accuracy by using an internal consistency argument: the totalnumber of riders getting on a bus must equal the total number of riders getting off a bus for eachbus’s block. We use blocks because a rider can theoretically ride the entire chain of trips withina block continuously. However, a rider cannot get on the bus before the start of the block andmust get off before or at the end of the block. The block error is thus the difference between thetotal number of counted embarking minus the total number of disembarking. This value shouldalways be zero. Estimating the error in this case is just a simple matter of calculating the differencebetween the sum of the number of people recorded as getting on, and the sum of the number peoplerecorded as getting off. Of course, this methodology does not account for errors that cancel eachother out, such as person getting both on and off the bus without being recorded in either instance,but it still gives us a rough upper-bound on the accuracy overall.
A. Haig, S. A. Hayati, and A. Tomasic 5
Bus Fullness ObservationIf someone is standing on the bus then there is a high probability that the bus is full or close tofull. To test this hypothesis, we conducted field observations while riding buses. Every time a busleft a stop, we counted the number of riders sitting and the number of riders standing. In addition,we kept track of the bus number for each bus which uniquely identifies the bus model and thus thenumber of seats.
Overall we recorded 246 data points from March to April 2018 across 12 different buseson 5 routes over 168 stops.
This gathered data serves as our Crowd Model. This model is a simple function that trans-lates the empirically gathered data into predefined categories.
User Activity State ModelingActivity detection consists of multiple steps: gathering a supervised set of training data, iterativeengineering of a machine learning model, and generation of the final evaluation statistics of thebest model.
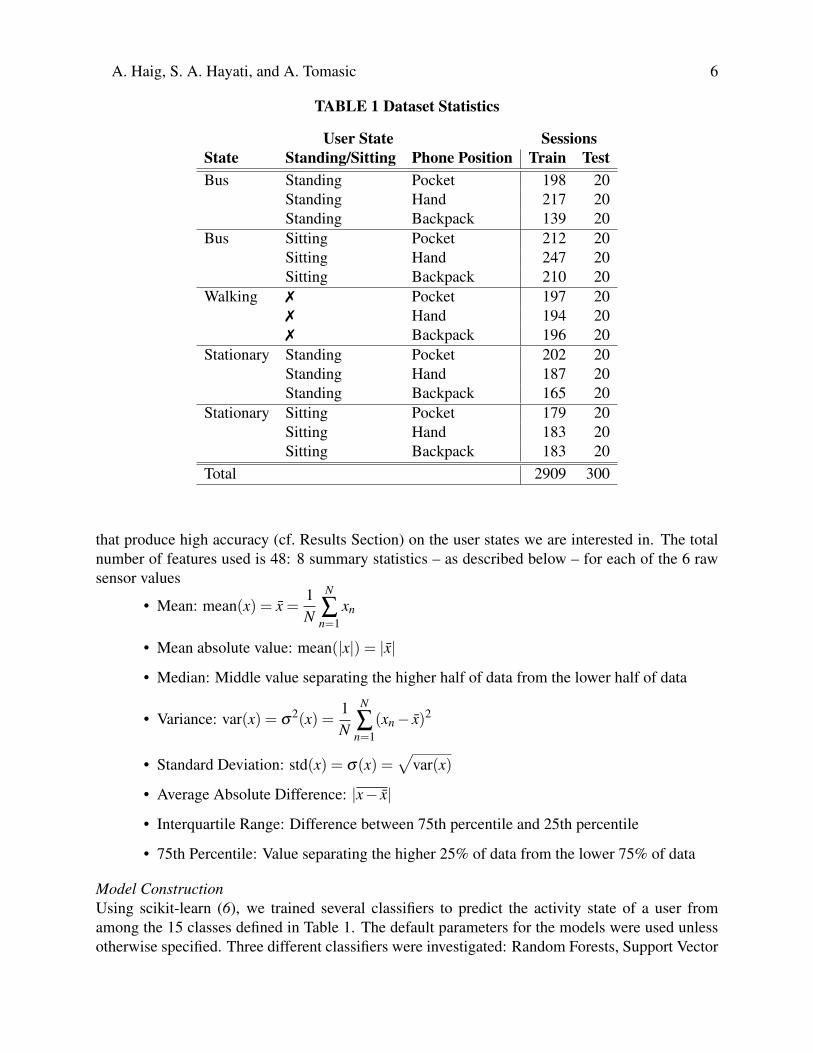
Data CollectionTo determine the activity state of riders, we built a custom mobile app for Android and iOS thatcollected raw data from the GPS, accelerometer, and compass sensors in the phone. The app allowsusers to select one of the 15 activity conditions show in Table 1. Upon selection of a state, the appwaits 5 seconds to allow the user to position the phone correctly, records data for 15 seconds, andthen stops automatically. This cycle comprises one data session. The timing for the recordingof data for each session results in clean data that is less affected by random real-world factors.Using this app and 5 different phones we recorded a total of 3209 sessions (approximately 13hours) of real-world data from October 2017 to July 2018. Table 1 shows the specific breakdownof the data including how the data was split into training and test sets when training our machinelearning models. The true distribution of users’ activity states varies per user in the real-world, sowe balanced our test set across the different states in order to get a fair comparison of the accuracyfor each state. The entire dataset was split into two parts: a training set and a test set. Duringtraining, a validation set was split from the training set. This set was used to iteratively improvethe machine learning models described below. The test set was used after the end of the iterativeimprovements to produce the final values reported in this paper.
Data PreprocessingTo clean the noise in the dataset, we filter the dataset by selecting sessions that have at least 200points of sensor readings over a time span of at least 10 seconds. This cleaning was performed toaccount for recording errors caused by bugs in the app itself. Such errors would be significantlyless common in a fully implemented production system. Table 1 shows our data after cleaning.
FeaturesFrom the phone sensors, the app obtains seven values: acceleration in x-axis, acceleration in y-axis, acceleration in z-axis, latitude, longitude, speed and heading. Then, we follow Elhoushi et al.(5) for extracting statistical features from each of these raw sensor values – except for headingwhich reduced the performance of our machine learning models. Note that we do not implementall the features mentioned in Elhoushi et al. (5). The six values are translated into a set of features
A. Haig, S. A. Hayati, and A. Tomasic 6
TABLE 1 Dataset Statistics
User State SessionsState Standing/Sitting Phone Position Train TestBus Standing Pocket 198 20
Standing Hand 217 20Standing Backpack 139 20
Bus Sitting Pocket 212 20Sitting Hand 247 20Sitting Backpack 210 20
Walking 7 Pocket 197 207 Hand 194 207 Backpack 196 20
Stationary Standing Pocket 202 20Standing Hand 187 20Standing Backpack 165 20
Stationary Sitting Pocket 179 20Sitting Hand 183 20Sitting Backpack 183 20
Total 2909 300
that produce high accuracy (cf. Results Section) on the user states we are interested in. The totalnumber of features used is 48: 8 summary statistics – as described below – for each of the 6 rawsensor values
• Mean: mean(x) = x̄ =1N
N
∑n=1
xn
• Mean absolute value: mean(|x|) = |x̄|
• Median: Middle value separating the higher half of data from the lower half of data
• Variance: var(x) = σ2(x) =
1N
N
∑n=1
(xn− x̄)2
• Standard Deviation: std(x) = σ(x) =√
var(x)
• Average Absolute Difference: |x− x̄|
• Interquartile Range: Difference between 75th percentile and 25th percentile
• 75th Percentile: Value separating the higher 25% of data from the lower 75% of data
Model ConstructionUsing scikit-learn (6), we trained several classifiers to predict the activity state of a user fromamong the 15 classes defined in Table 1. The default parameters for the models were used unlessotherwise specified. Three different classifiers were investigated: Random Forests, Support Vector
A. Haig, S. A. Hayati, and A. Tomasic 7
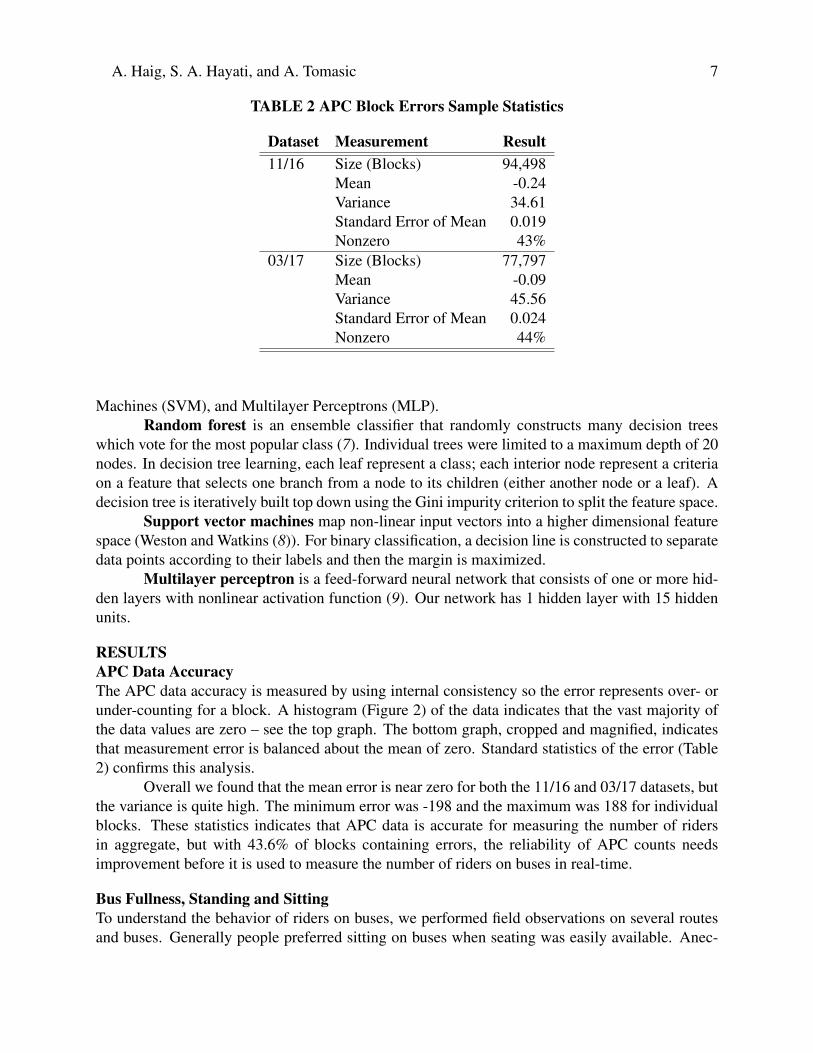
TABLE 2 APC Block Errors Sample Statistics
Dataset Measurement Result11/16 Size (Blocks) 94,498
Mean -0.24Variance 34.61Standard Error of Mean 0.019Nonzero 43%
03/17 Size (Blocks) 77,797Mean -0.09Variance 45.56Standard Error of Mean 0.024Nonzero 44%
Machines (SVM), and Multilayer Perceptrons (MLP).Random forest is an ensemble classifier that randomly constructs many decision trees
which vote for the most popular class (7). Individual trees were limited to a maximum depth of 20nodes. In decision tree learning, each leaf represent a class; each interior node represent a criteriaon a feature that selects one branch from a node to its children (either another node or a leaf). Adecision tree is iteratively built top down using the Gini impurity criterion to split the feature space.
Support vector machines map non-linear input vectors into a higher dimensional featurespace (Weston and Watkins (8)). For binary classification, a decision line is constructed to separatedata points according to their labels and then the margin is maximized.
Multilayer perceptron is a feed-forward neural network that consists of one or more hid-den layers with nonlinear activation function (9). Our network has 1 hidden layer with 15 hiddenunits.
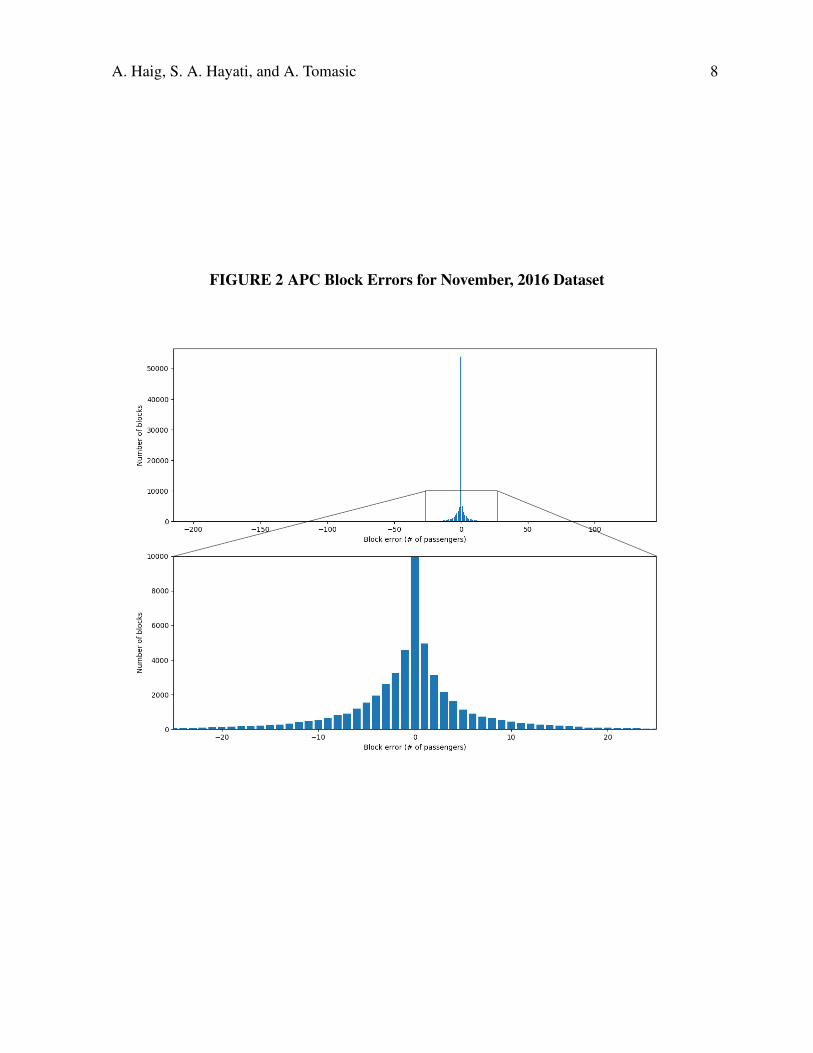
RESULTSAPC Data AccuracyThe APC data accuracy is measured by using internal consistency so the error represents over- orunder-counting for a block. A histogram (Figure 2) of the data indicates that the vast majority ofthe data values are zero – see the top graph. The bottom graph, cropped and magnified, indicatesthat measurement error is balanced about the mean of zero. Standard statistics of the error (Table2) confirms this analysis.
Overall we found that the mean error is near zero for both the 11/16 and 03/17 datasets, butthe variance is quite high. The minimum error was -198 and the maximum was 188 for individualblocks. These statistics indicates that APC data is accurate for measuring the number of ridersin aggregate, but with 43.6% of blocks containing errors, the reliability of APC counts needsimprovement before it is used to measure the number of riders on buses in real-time.
Bus Fullness, Standing and SittingTo understand the behavior of riders on buses, we performed field observations on several routesand buses. Generally people preferred sitting on buses when seating was easily available. Anec-
A. Haig, S. A. Hayati, and A. Tomasic 8
FIGURE 2 APC Block Errors for November, 2016 Dataset
A. Haig, S. A. Hayati, and A. Tomasic 9
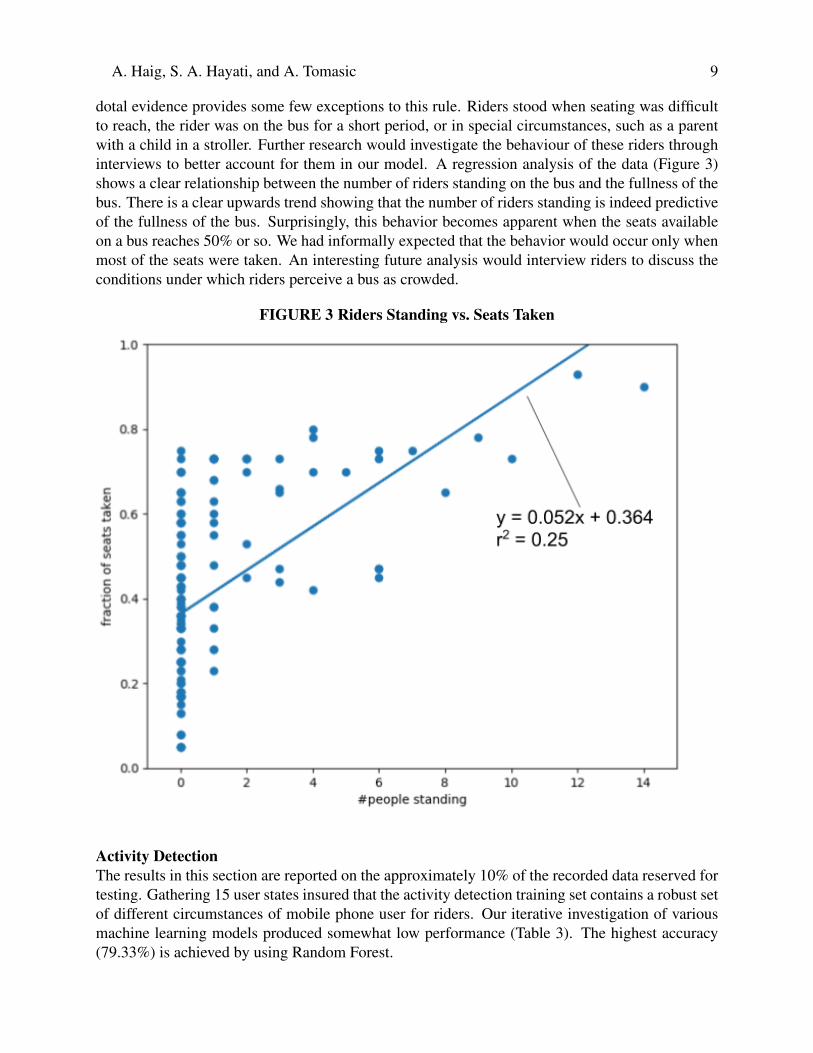
dotal evidence provides some few exceptions to this rule. Riders stood when seating was difficultto reach, the rider was on the bus for a short period, or in special circumstances, such as a parentwith a child in a stroller. Further research would investigate the behaviour of these riders throughinterviews to better account for them in our model. A regression analysis of the data (Figure 3)shows a clear relationship between the number of riders standing on the bus and the fullness of thebus. There is a clear upwards trend showing that the number of riders standing is indeed predictiveof the fullness of the bus. Surprisingly, this behavior becomes apparent when the seats availableon a bus reaches 50% or so. We had informally expected that the behavior would occur only whenmost of the seats were taken. An interesting future analysis would interview riders to discuss theconditions under which riders perceive a bus as crowded.
FIGURE 3 Riders Standing vs. Seats Taken
Activity DetectionThe results in this section are reported on the approximately 10% of the recorded data reserved fortesting. Gathering 15 user states insured that the activity detection training set contains a robust setof different circumstances of mobile phone user for riders. Our iterative investigation of variousmachine learning models produced somewhat low performance (Table 3). The highest accuracy(79.33%) is achieved by using Random Forest.
A. Haig, S. A. Hayati, and A. Tomasic 10
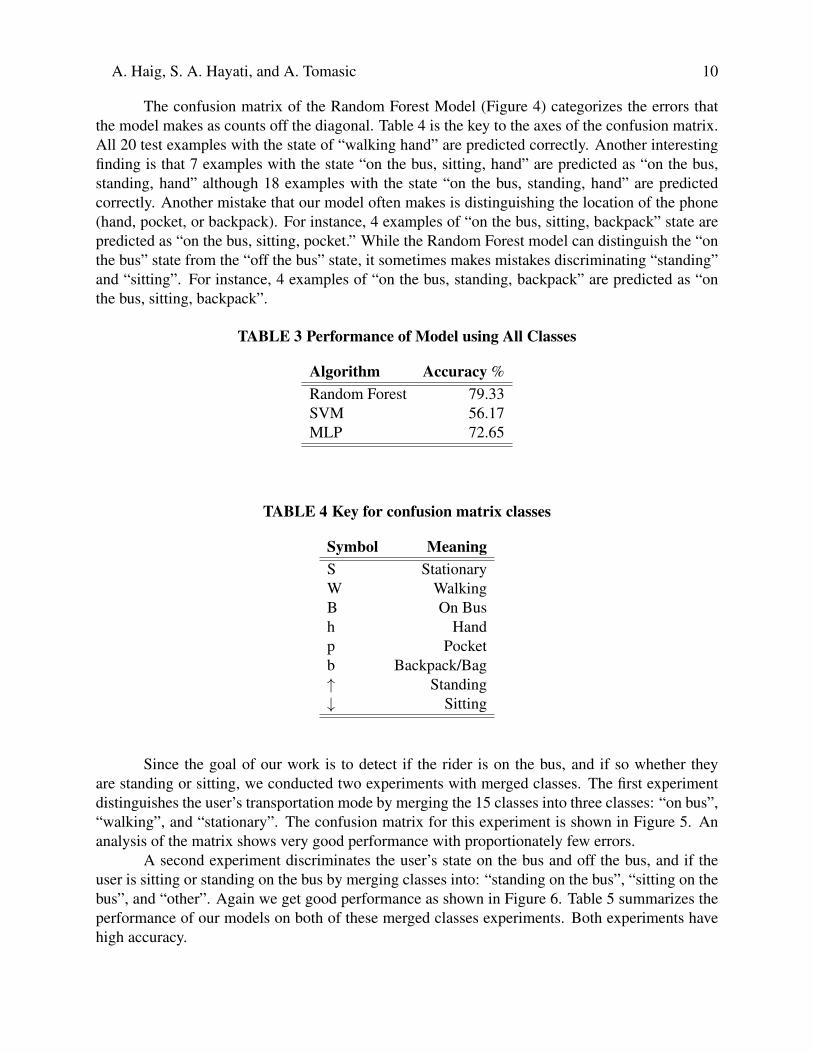
The confusion matrix of the Random Forest Model (Figure 4) categorizes the errors thatthe model makes as counts off the diagonal. Table 4 is the key to the axes of the confusion matrix.All 20 test examples with the state of “walking hand” are predicted correctly. Another interestingfinding is that 7 examples with the state “on the bus, sitting, hand” are predicted as “on the bus,standing, hand” although 18 examples with the state “on the bus, standing, hand” are predictedcorrectly. Another mistake that our model often makes is distinguishing the location of the phone(hand, pocket, or backpack). For instance, 4 examples of “on the bus, sitting, backpack” state arepredicted as “on the bus, sitting, pocket.” While the Random Forest model can distinguish the “onthe bus” state from the “off the bus” state, it sometimes makes mistakes discriminating “standing”and “sitting”. For instance, 4 examples of “on the bus, standing, backpack” are predicted as “onthe bus, sitting, backpack”.
TABLE 3 Performance of Model using All Classes
Algorithm Accuracy %Random Forest 79.33SVM 56.17MLP 72.65
TABLE 4 Key for confusion matrix classes
Symbol MeaningS StationaryW WalkingB On Bush Handp Pocketb Backpack/Bag↑ Standing↓ Sitting
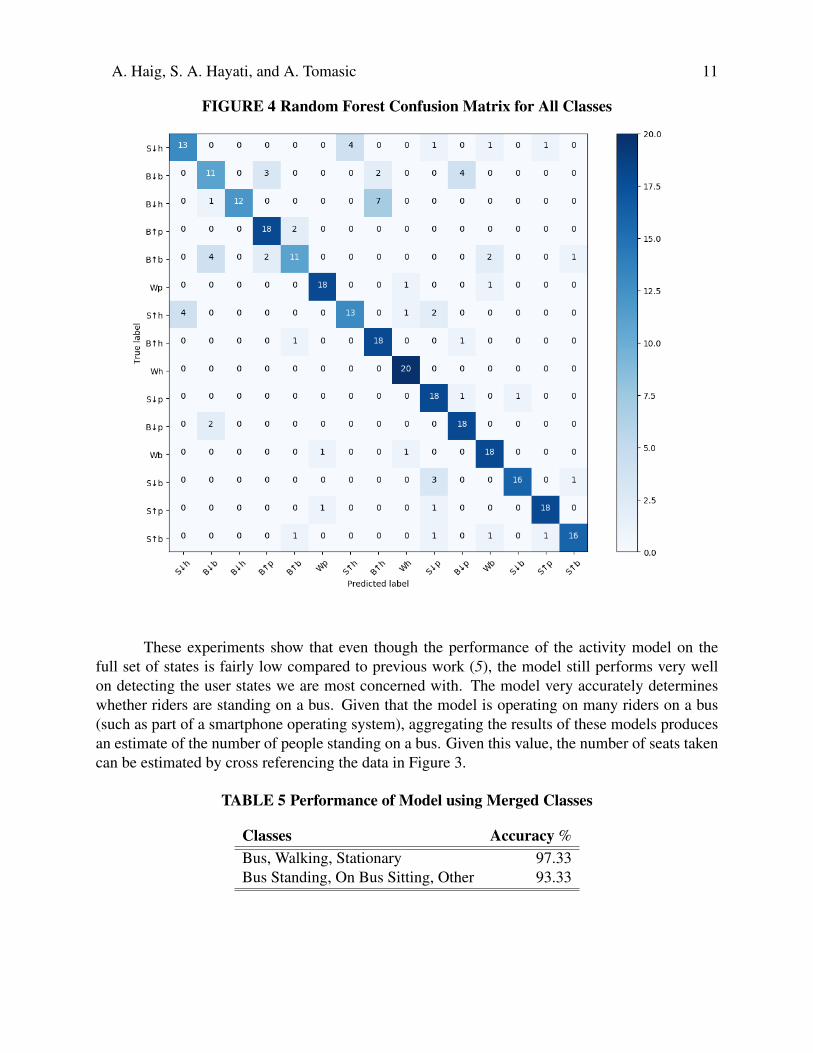
Since the goal of our work is to detect if the rider is on the bus, and if so whether theyare standing or sitting, we conducted two experiments with merged classes. The first experimentdistinguishes the user’s transportation mode by merging the 15 classes into three classes: “on bus”,“walking”, and “stationary”. The confusion matrix for this experiment is shown in Figure 5. Ananalysis of the matrix shows very good performance with proportionately few errors.
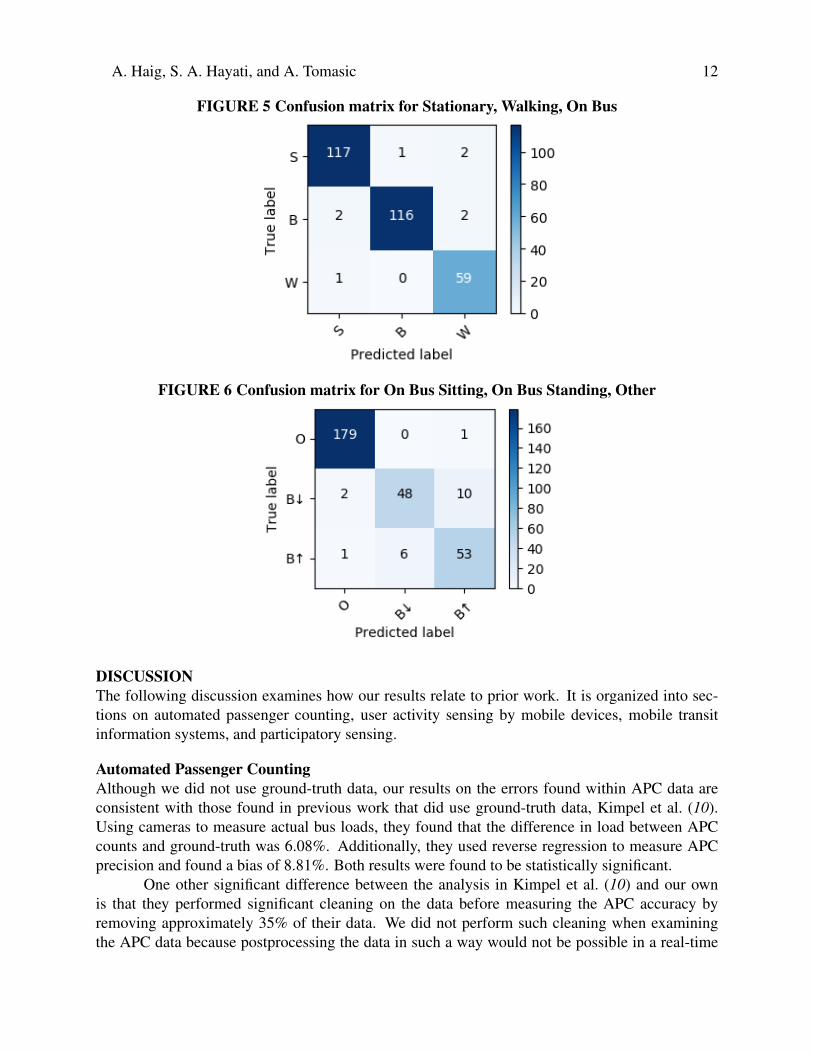
A second experiment discriminates the user’s state on the bus and off the bus, and if theuser is sitting or standing on the bus by merging classes into: “standing on the bus”, “sitting on thebus”, and “other”. Again we get good performance as shown in Figure 6. Table 5 summarizes theperformance of our models on both of these merged classes experiments. Both experiments havehigh accuracy.
A. Haig, S. A. Hayati, and A. Tomasic 11
FIGURE 4 Random Forest Confusion Matrix for All Classes
These experiments show that even though the performance of the activity model on thefull set of states is fairly low compared to previous work (5), the model still performs very wellon detecting the user states we are most concerned with. The model very accurately determineswhether riders are standing on a bus. Given that the model is operating on many riders on a bus(such as part of a smartphone operating system), aggregating the results of these models producesan estimate of the number of people standing on a bus. Given this value, the number of seats takencan be estimated by cross referencing the data in Figure 3.
TABLE 5 Performance of Model using Merged Classes
Classes Accuracy %Bus, Walking, Stationary 97.33Bus Standing, On Bus Sitting, Other 93.33
A. Haig, S. A. Hayati, and A. Tomasic 12
FIGURE 5 Confusion matrix for Stationary, Walking, On Bus
FIGURE 6 Confusion matrix for On Bus Sitting, On Bus Standing, Other
DISCUSSIONThe following discussion examines how our results relate to prior work. It is organized into sec-tions on automated passenger counting, user activity sensing by mobile devices, mobile transitinformation systems, and participatory sensing.
Automated Passenger CountingAlthough we did not use ground-truth data, our results on the errors found within APC data areconsistent with those found in previous work that did use ground-truth data, Kimpel et al. (10).Using cameras to measure actual bus loads, they found that the difference in load between APCcounts and ground-truth was 6.08%. Additionally, they used reverse regression to measure APCprecision and found a bias of 8.81%. Both results were found to be statistically significant.
One other significant difference between the analysis in Kimpel et al. (10) and our ownis that they performed significant cleaning on the data before measuring the APC accuracy byremoving approximately 35% of their data. We did not perform such cleaning when examiningthe APC data because postprocessing the data in such a way would not be possible in a real-time
A. Haig, S. A. Hayati, and A. Tomasic 13
system.Another method of counting riders (Chen et al. (11)) is to install cameras in buses and
use computer vision techniques to detect riders getting on or off. Such a system can achieve anaccuracy comparable to that found in APC systems, but it still requires bus agencies to installcameras in all of the buses, potentially a significant expense.
User Activity Sensing in Mobile PhonesMany prior works employ mobile phone sensors and supervised learning to determine user ac-tivity, either related to transportation mode or not. In detecting user activity, previous studiesexplored three main approaches: location-based (GPS), sensor-based (accelerometer), and hybridof location-based and sensor-based approaches.
Ashbrook and Starner (12), Zheng et al. (13), Zheng et al. (14), and Stenneth et al. (4)use GPS to infer the motion or transportation mode of users. Sohn et al. (15) explored the usageof GSM sensors to detect daily physical activities such as walking, driving, or being stationary.Myrvoll et al. (16) counts the number of passengers on a bus through monitoring WiFi proberequests, a potential complementary source of passenger count data.
Microelectromechanical systems motion sensors (accelerometer, gyroscope, magnetome-ter, and barometer), without any location signals, can be used to detect indoor motion, such aswalking, stationary, and going up/down stairs (Elhoushi et al. (5)). Nham et al. (17) collected ac-celeration data from mobile phones for predicting walking, biking, running, driving, riding a train,or riding a bus. Hemminki et al. (18) introduce a gravity estimation technique for accelerometersto produce more accurate horizontal acceleration measurements to discern information from usermotion from noise like gravity. The user model in this paper extends this body of work to thespecific case of classifying user activities on a bus.
Several works focus on the transportation mode of a user. Fang et al. (19) classified trans-portation mode using the accelerometer, magnetometer, and gyroscope sensors from smartphonesand ran three machine learning algorithms (decision trees, K-nearest neighbor, and support vectormachine). Yu et al. (20) applied four strategies which are big data, small footprint, data substitu-tion, and multi-tier design in minimizing power consumption and memory requirement to detecttransportation mode. Reddy et al. (21) used both accelerometer and GPS to identify transporta-tion mode (stationary, walking, running, biking, in motorized transport). Jahangiri and Rakha (22)tried to detect the transportation mode (including driving a car, riding a bicycle, riding a bus, walk-ing, and running) of a user via mobile phones using K-nearest neighbor, support vector machines(SVMs), and tree-based models such as decision tree, bagging, and random forest. Their best resultwas achieved by using random forest and SVM, similar to our results.
Mobile Transit Information SystemsThis paper also extends a body of previous work using mobile phones to collect transit data fromusers and then using this data to improve the users experience on transit systems. For examplethe Tiramisu Transit system (1, 3) used crowd sourcing to generate real-time arrival informationfor the PAAC bus system before real-time information was provided by PAAC itself. The systempresented in this study would be a novel extension by using user’s phones to detect real timebus fullness, and then improving the user’s transit experience by presenting fullness information.Zimmerman et al. (3) provides methodology for clustering users into the associated bus trips thatthey are on. The system simply asks the user directly as a form of crowdsourcing. Incentives to
A. Haig, S. A. Hayati, and A. Tomasic 14
encourage users to report this information are studied in Tomasic et al. (23). Stenneth et al. (4)uses automated methods to gather the same information.
Participatory SensingOur work is also related to participatory sensing for applications related to public transportationtracking. Zhou et al. (24) presented a crowdsourced bus arrival time estimation system by utilizinglow-energy sensing resources, such as cell tower signals, movement statuses, and audio record-ings. Thiagarajan et al. (25) also proposed crowdsourced transit (bus and train) tracking. Theyintroduced power-efficient activity classification to detect if riders are in the vehicle or not, low-memory route-matching algorithm, and a method to track underground trains.
Pi et al. (26) studied the how users perceived bus fullness by investigating the relationshipbetween APC data and crowdsourced bus fullness ratings from users of Tiramisu. They built aclassification model to infer riders’ fullness perception from APC data and other factors. Theirmodel could also be used by transit agency to help predict bus fullness. Our work is distinguishedby the fact that we indirectly but independently estimate bus fullness using phone sensors whereasthey use APC data.
CONCLUSIONReal time bus fullness (the crowd on a bus) information is important to both transit users andplanners. In this paper we showed that the reliability of APC data needs to be improved beforepresenting this information in real time. We then conjectured that the same information could bederived by determining how many people were standing in a bus. Field observations confirmed adirect relationship between people standing and the number of seats taken on a bus. To make thisinformation available to riders in real time, the paper demonstrated that smartphone sensors canprovide relevant real time data. Several machine learning models were applied to the logs of users’activities, both on and off buses, and were shown to be highly accurate in detecting when a userwas standing or sitting on a bus. Thus, adding these models to mobile phone operating systems orapplications, and transmitting the results of these models in real-time, would provide an accuratefoundation for this feature in transit information systems.
In future work, the results of this work can easily be extended to many different publictransit systems, such as trains or subways. Additionally, with more data we could improve theresults of our activity model and better learn the relationship between bus fullness and the numberof people standing.
ACKNOWLEDGEMENTSSpecial thanks to the software engineers of the first version of the data collection app: NapatLuevisadpaibul and Wenqing Yuan. This work was supported in part by the National Institute onDisability, Independent Living, and Rehabilitation Research (NIDILRR Grant 90RE5011-01-00)and by US DOT FAST Act - Mobility National (2016 - 2022) - CMU 2017 Mobility21 UTC #31.
AUTHOR CONTRIBUTION STATEMENTThe authors confirm contribution to the paper as follows: study conception and design: Alex Haig,Shirley Anugrah Hayati, Anthony Tomasic; data collection: Alex Haig, Shirley Anugrah Hay-ati, Anthony Tomasic; analysis and interpretation of results: Alex Haig, Shirley Anugrah Hayati,Anthony Tomasic; draft manuscript preparation: Alex Haig, Shirley Anugrah Hayati, Anthony

A. Haig, S. A. Hayati, and A. Tomasic 15
Tomasic. All authors reviewed the results and approved the final version of the manuscript.
A. Haig, S. A. Hayati, and A. Tomasic 16
REFERENCES[1] Tomasic, A., J. Zimmerman, C. Garrod, Y. Huang, T. Nip, and A. Steinfeld, The perfor-
mance of a crowdsourced transportation information system. In TRB 94th Annual MeetingCompendium of Papers, Transportation Research Board of the National Academies, 2015.
[2] Steinfeld, A., J. Zimmerman, A. Tomasic, D. Yoo, and R. Aziz, Mobile transit informationfrom universal design and crowdsourcing. Transportation Research Record: Journal of theTransportation Research Board, , No. 2217, 2011, pp. 95–102.
[3] Zimmerman, J., A. Tomasic, C. Garrod, D. Yoo, C. Hiruncharoenvate, R. Aziz, N. R. Thiru-vengadam, Y. Huang, and A. Steinfeld, Field trial of tiramisu: crowd-sourcing bus arrivaltimes to spur co-design. In Proceedings of the SIGCHI Conference on Human Factors inComputing Systems, ACM, 2011, pp. 1677–1686.
[4] Stenneth, L., O. Wolfson, P. S. Yu, and B. Xu, Transportation Mode Detection Using MobilePhones and GIS Information. In Proceedings of the 19th ACM SIGSPATIAL InternationalConference on Advances in Geographic Information Systems, ACM, New York, NY, USA,2011, GIS ’11, pp. 54–63.
[5] Elhoushi, M., J. Georgy, A. Noureldin, and M. J. Korenberg, Motion mode recognition forindoor pedestrian navigation using portable devices. IEEE Transactions on Instrumentationand Measurement, Vol. 65, No. 1, 2016, pp. 208–221.
[6] Scikit Python Machine Learning Library, 2018, http://scikit-learn.org/stable/.[7] Breiman, L., Random forests. Machine learning, Vol. 45, No. 1, 2001, pp. 5–32.[8] Weston, J. and C. Watkins, Multi-class Support Vector Machines, 1998.[9] Freund, Y. and R. E. Schapire, Large Margin Classification Using the Perceptron Algorithm.
Mach. Learn., Vol. 37, No. 3, 1999, pp. 277–296.[10] Kimpel, T., J. Strathman, D. Griffin, S. Callas, and R. Gerhart, Automatic passenger counter
evaluation: Implications for national transit database reporting. Transportation ResearchRecord: Journal of the Transportation Research Board, , No. 1835, 2003, pp. 93–100.
[11] Chen, C.-H., Y.-C. Chang, T.-Y. Chen, and D.-J. Wang, People counting system for gettingin/out of a bus based on video processing. In Intelligent Systems Design and Applications,2008. ISDA’08. Eighth International Conference on, IEEE, 2008, Vol. 3, pp. 565–569.
[12] Ashbrook, D. and T. Starner, Using GPS to learn significant locations and predict movementacross multiple users. Personal and Ubiquitous Computing, Vol. 7, No. 5, 2003, pp. 275–286.
[13] Zheng, Y., Q. Li, Y. Chen, X. Xie, and W.-Y. Ma, Understanding mobility based on GPS data.In Proceedings of the 10th international conference on Ubiquitous computing, ACM, 2008,pp. 312–321.
[14] Zheng, Y., Y. Chen, Q. Li, X. Xie, and W.-Y. Ma, Understanding Transportation Modes Basedon GPS Data for Web Applications. ACM Trans. Web, Vol. 4, No. 1, 2010, pp. 1:1–1:36.
[15] Sohn, T., A. Varshavsky, A. LaMarca, M. Y. Chen, T. Choudhury, I. Smith, S. Consolvo,J. Hightower, W. G. Griswold, and E. de Lara, Mobility Detection Using Everyday GSMTraces. In UbiComp 2006: Ubiquitous Computing (P. Dourish and A. Friday, eds.), SpringerBerlin Heidelberg, Berlin, Heidelberg, 2006, pp. 212–224.
[16] Myrvoll, T. A., J. E. Håkegård, T. Matsui, and F. Septier, Counting public transport passengerusing WiFi signatures of mobile devices. In Intelligent Transportation Systems (ITSC), 2017IEEE 20th International Conference on, IEEE, 2017, pp. 1–6.
[17] Nham, B., K. Siangliulue, and S. Yeung, Predicting mode of transport from iphone ac-celerometer data. In Machine Learning Final Projects, Stanford, CA, USA, 2008.
A. Haig, S. A. Hayati, and A. Tomasic 17
[18] Hemminki, S., P. Nurmi, and S. Tarkoma, Accelerometer-based Transportation Mode Detec-tion on Smartphones. In Proceedings of the 11th ACM Conference on Embedded NetworkedSensor Systems, ACM, New York, NY, USA, 2013, SenSys ’13, pp. 13:1–13:14.
[19] Fang, S.-H., H.-H. Liao, Y.-X. Fei, K.-H. Chen, J.-W. Huang, Y.-D. Lu, and Y. Tsao, Trans-portation modes classification using sensors on smartphones. Sensors, Vol. 16, No. 8, 2016,p. 1324.
[20] Yu, M.-C., T. Yu, S.-C. Wang, C.-J. Lin, and E. Y. Chang, Big Data Small Footprint: TheDesign of a Low-power Classifier for Detecting Transportation Modes. Proc. VLDB Endow.,Vol. 7, No. 13, 2014, pp. 1429–1440.
[21] Reddy, S., M. Mun, J. Burke, D. Estrin, M. Hansen, and M. Srivastava, Using Mobile Phonesto Determine Transportation Modes. ACM Trans. Sen. Netw., Vol. 6, No. 2, 2010, pp. 13:1–13:27.
[22] Jahangiri, A. and H. A. Rakha, Applying Machine Learning Techniques to TransportationMode Recognition Using Mobile Phone Sensor Data. IEEE Transactions on Intelligent Trans-portation Systems, Vol. 16, No. 5, 2015, pp. 2406–2417.
[23] Tomasic, A., J. Zimmerman, A. Steinfeld, and Y. Huang, Motivating contribution in a par-ticipatory sensing system via quid-pro-quo. In Proceedings of the 17th ACM conference onComputer supported cooperative work & social computing, ACM, 2014, pp. 979–988.
[24] Zhou, P., Y. Zheng, and M. Li, How long to wait?: predicting bus arrival time with mobilephone based participatory sensing. In Proceedings of the 10th international conference onMobile systems, applications, and services, ACM, 2012, pp. 379–392.
[25] Thiagarajan, A., J. Biagioni, T. Gerlich, and J. Eriksson, Cooperative Transit Tracking UsingSmart-phones. In Proceedings of the 8th ACM Conference on Embedded Networked SensorSystems, ACM, New York, NY, USA, 2010, SenSys ’10, pp. 85–98.
[26] Pi, X., Z. S. Qian, A. Steinfeld, and Y. Huang, Understanding Human Perception of BusFullness: An Empirical Study of Crowdsourced Fullness Ratings and Automatic PassengerCounter Data. In Transportation Research Board 97th Annual Meeting, TRB, 2018.