raman spectroscopic and optical imaging of high spin/low spin domains in a spin crossover complex
TRANSCRIPT
Chemical Physics Letters 499 (2010) 94–99
Contents lists available at ScienceDirect
Chemical Physics Letters
journal homepage: www.elsevier .com/locate /cplet t
Raman spectroscopic and optical imaging of high spin/low spin domainsin a spin crossover complex
Salma Bedoui a,b, Gábor Molnár a,b,⇑, Sylvestre Bonnet c, Carlos Quintero a,b, Helena J. Shepherd a,b,William Nicolazzi a,b, Lionel Salmon a,b, Azzedine Bousseksou a,b,⇑⇑a Laboratoire de Chimie de Coordination, CNRS UPR8241, F-31077 Toulouse, Franceb Université de Toulouse, UPS, INPT, F-31077 Toulouse, Francec Leiden Institute of Chemistry, Leiden University, P.O. Box 9502, 2300 RA Leiden, The Netherlands
a r t i c l e i n f o
Article history:Received 23 July 2010In final form 8 September 2010Available online 21 September 2010
0009-2614/$ - see front matter � 2010 Elsevier B.V. Adoi:10.1016/j.cplett.2010.09.027
⇑ Corresponding author. Address: Laboratoire de CUPR8241 and Université de Toulouse; UPS, INPT, F-3+33 561553003.⇑⇑ Corresponding author. Address: Laboratoire de CUPR8241 and Université de Toulouse; UPS, INPT, F-3+33 561553003.
E-mail addresses: [email protected] ([email protected] (A. Bousseksou).
a b s t r a c t
Using optical microscopy and various contrast methods we have investigated the spatio-temporal devel-opment of the two-step spin transition in single crystals of the [Fe(bapbpy)(NCS)2] complex. Nucleationand growth of domains displaying different molecular spin states were directly inferred from Ramanspectroscopic images. The high-temperature transition proceeds in most cases by nucleation at a macro-scopic defect, followed by growth along the c axis of the crystal. The development of elastic strain andassociated birefringence are proved by polarized light measurements. The low-temperature transitionis accompanied by the onset of twinning, which leads to a particular multi-domain growth mechanism.
� 2010 Elsevier B.V. All rights reserved.
1. Introduction
Bistable molecular materials displaying vibronic lability, such asspin crossover systems, offer an interesting playground to studythe coupling between electronic and lattice degrees of freedomand associated phase transition phenomena [1]. Understandingthe spatio-temporal aspects of the spin state change in these sys-tems seems to be the key to control the switchable properties –including switching by light irradiation, applied magnetic field,pressure or temperature. Sorai and Seki [2] were the first to discussthe domain formation process in connection with discontinuous(first order) spin transition and hysteresis phenomena. Here, a do-main is defined as an ensemble of molecules in the same spin state.Experimental evidence for the nucleation and growth process ofdomains was provided by powder X-ray diffraction [3] and, in amore conclusive way, using single-crystal X-ray diffraction bothfor the thermal [4] and light-induced [5] spin transitions. Domainformation has also been characterized by application of the Everetttheorems [6], the Preisach model [7], the first-order reversal curve(FORC) method [8] and the kinetic Ising model [9]. It was inferredthat abrupt spin transitions occur by the conversion of indepen-
ll rights reserved.
himie de Coordination, CNRS1077 Toulouse, France. Fax:
himie de Coordination, CNRS1077 Toulouse, France. Fax:
. Molnár), azzedine.boussek
dent domains, the size of which is limited by grain boundariesand crystal defects. A number of theoretical studies of spin transi-tions have also pointed out the obvious role of elastic strain in thenucleation and growth mechanism [10–12].
It is evident that the spatio-temporal observation of domainkinetics and understanding the microscopic details of the phaseseparation process is a very important issue in view of the currentprogress in the spin crossover field. A challenging question con-cerns the minimum size of domains, i.e. down to which size canphase separation still be observed. Recent experiments with thinfilms and nanoparticles seem to indicate a lowest limit of only afew nanometers [13–17]. A directly related topic concerns themanipulation of spin crossover solids by short light pulses andthe plausible percolation phenomenon during the decay of thehighly non-equilibrium states [18–20]. Much remains unknownconcerning the nucleation and growth kinetics in general. Whereand how many nuclei form? How fast do they propagate? Howare these phenomena influenced by the release of latent heat andthe buildup of elastic stress and strain [21]? How do they dependon the morphology (size, shape, . . .) and structure (crystal, micro,meso-structure as well) of the sample?
In this context it is somewhat surprising that the in situ obser-vation of the nucleation, the evolution of the phase boundaries andthe associated changes of the microstructure have been scarcelyreported in spin crossover solids. In particular, optical microscopyis a powerful non-contact and non-invasive technique for real-timeobservation of spin state transitions with high temporal and rea-sonable spatial resolution [22,23]. Recently, the Varret group re-ported a number of interesting optical microscopy observationson the thermal and light-induced spin transition in different SCO
0
400
800
0
400
800
2050 2100 2150 22000
400
800
210 K
300 K
Ram
an in
tens
ity (a
rb. u
.)
Raman shift (cm-1 )
130 K
(c)(b)(a)
140 160 180 200 220 240 260
0.0
0.2
0.4
0.6
0.8
1.0
Ram
an In
tens
ity ra
tio
Temperature (K)
χ MT
(cm
3Km
ol-
Cooling modeHeating mode
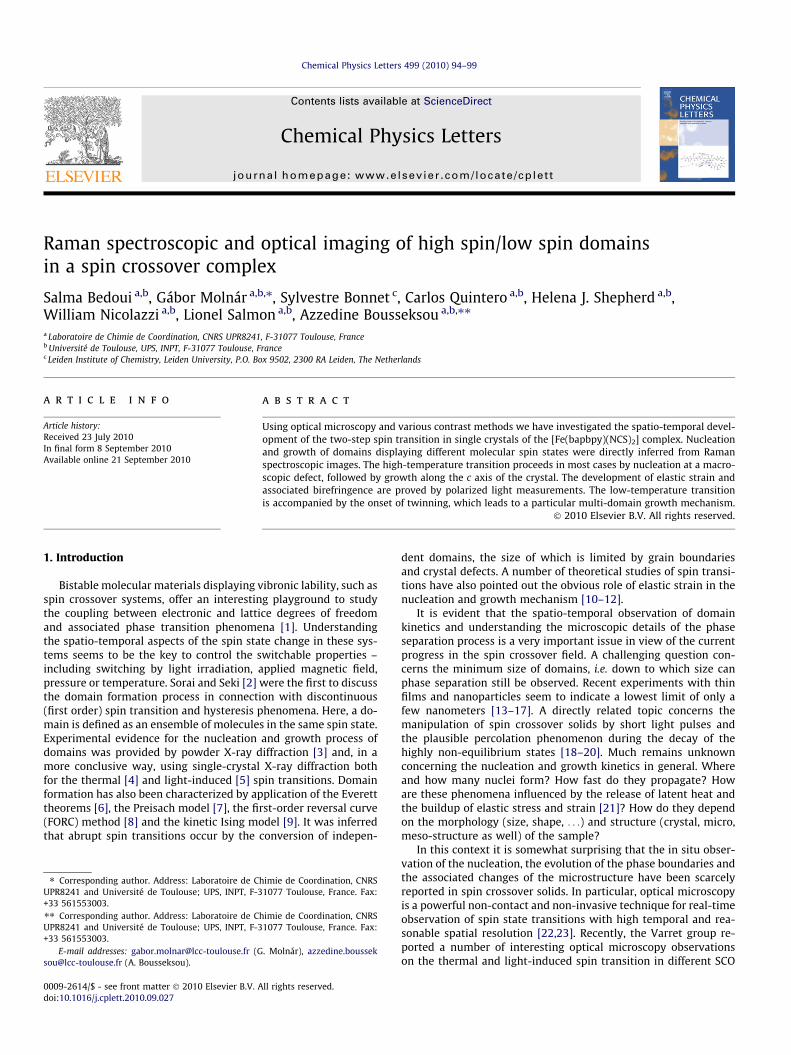
Figure 1. (a) Molecular structure of [Fe(bapbpy)(NCS)2]. (b) Raman spectra of the HS (300 K), IP (210 K) and LS (130 K) phases in the CN stretching (mCN) mode region. c) Thethermal spin transition curve of a single crystal of [Fe(bapbpy)(NCS)2] obtained from the normalized Raman intensity of the mCN modes: IHS/(IHS + ILS). The insert shows thetemperature dependence of the molar magnetic susceptibility for an ensemble of crystals [27].
S. Bedoui et al. / Chemical Physics Letters 499 (2010) 94–99 95
complexes [24,25]. They have shown that the skillful use of thistechnique can reveal many interesting details of the transition,such as the decoupling of electronic and crystallographic transi-tions, the development of elastic stresses, etc.
In the present Letter we present an optical microscopy study oforiented single crystals of the [Fe(bapbpy)(NCS)2] complex (Fig-ure 1a) displaying a spin transition in two steps. In our previousbright-field microscopy study of this compound we observed thedomain growth process associated with the first transition occur-ring along a particular crystallographic direction [26]. Here we ex-tend this study to both steps of the transition using variouscontrast methods. In particular we focus on the Raman spectralimaging of the crystals providing clear-cut spectroscopic evidencefor the spin state of molecules in the coexisting domains.
2. Experimental
The [Fe(bapbpy)(NCS)2] sample (where bapbpy = N-(6-(6-(pyri-din-2-ylamino)pyridin-2-yl)pyridin-2-yl)pyridin-2-amine) wassynthesized using the method described in Ref. [27]. All resultspresented in this Letter (apart from Fig. S1 and Movie S1 in theSupplementary) were obtained using the same single crystal witha size of 0.5 mm*0.2 mm*0.3 mm, though the reproducibility ofthe observed phenomena has also been tested on a number ofother crystals. We should emphasize that – contrary to numerousspin crossover complexes – the physical properties and mechanicalintegrity of these crystals remain virtually unaffected during ther-mal cycling.
The sample was enclosed in a Linkam THMS600 liquid nitrogencryostat equipped either with glass or BaF2 windows. Two differentmicroscopy setups were used separately for wide-field optical andconfocal Raman imaging.
Optical microscopy images of the crystal were recorded usingan Olympus BX51 microscope equipped with a thermoelectricallycooled, megapixel format CCD camera (Andor Ikon-M with13 lm pixel size) and a 50 � objective (numerical apertureNA = 0.5, working distance WD = 10.6 mm). The sample was illu-minated by a halogen lamp (400–700 nm), but in certain casesthe spectral range was reduced using band-pass filters. We usedsystematically three different illumination techniques: bright-fieldin transmission mode, dark-field and polarized light (crossedpolarizers) in reflection mode. If not stated otherwise, heatingand cooling rates were 0.5 Kmin�1 and images were taken every6 s.
Raman images were acquired by means of a LabramHR (HoribaJobin Yvon) confocal micro-spectrometer equipped with a Peltier-
cooled CCD detector (Andor DU420) and an Olympus BXFM opticalmicroscope. The cryostat was mounted on a motorized stage en-abling reproducible micrometric xy displacements of the sample.Using a 600 grooves/mm grating and a slit width of 100 lm thespectral resolution was ca. 3 cm�1. A HeNe laser operating at632.8 nm was used as an excitation source with 0.07 mW excita-tion power on the sample. The absence of significant laser heatingeffects was carefully tested. The laser beam was focused on a spotof approximately 2 lm via a 50 � long-working-distance objective(NA = 0.45, WD = 15 mm), which also served to collect the scat-tered photons. The confocal hole was kept at 1000 lm. The Ray-leigh scattering was removed by a holographic notch filter andthe Raman spectra were recorded between 1150 and 2200 cm�1
with acquisition times between 10 and 100 s. At each temperaturethe sample was allowed to stabilize for 5 min prior tomeasurements.
To measure the temperature gradient in the crystal, we em-ployed an infrared camera (CEDIP JADE III MW). This deep-cooled(93 K), 320 � 240 pixels camera detects the infrared light emittedby the specimen in the 3–5 lm range and reconstructs its thermalimage. For the lack of IR emissivity data, the temperature calibra-tion was based on the temperature sensor reading of the cryostatproviding plausibly less accuracy, but sufficiently high precision.The spatial resolution was estimated to be ca. 20 lm/pixel.
3. Results and discussion
The compound [Fe(bapbpy)(NCS)2] is a mononuclear iron(II)complex displaying a two-step thermal spin transition (Figure 1).Both steps involved in the transition are first order and show widehysteresis loops. The ordered intermediate phase (IP) is character-ized by a repetition of a [Low spin – High spin – Low spin] motif, i.e.two third of the iron sites are in the low spin (LS) state and theremaining sites are high spin (HS) [27]. The crystal packing re-mains similar in the three phases. They show comparable H-bond-ing and p–p stacking interactions along the [001] direction. Thespace group of the HS and intermediate phases are the same(monoclinic, C2/c), although the unit cell volume increases by afactor of three on undergoing the first spin transition due to theformation of the [LS–HS–LS] motif. On the other hand, the volumecontraction per molecule is ca. 2.5%, which is mainly related to thecontraction of the coordination polyhedron in the LS state. Duringthe low-temperature transition the space group changes to P-1,which was previously modeled in the non-standard C-1 settingto facilitate comparison with the previous C-centred phases. Thevolume of the centred cell is comparable to that of the HS phase
96 S. Bedoui et al. / Chemical Physics Letters 499 (2010) 94–99
and three times smaller than in the IP case. The volume contractionper molecule is ca. 1% [27].
Raman spectra were acquired on an oriented single crystal of[Fe(bapbpy)(NCS)2]. In the high wavenumber region (2070–2160 cm�1), we note that CN stretching modes of the thiocyanateligands display large differences in the three phases (Figure 1b).In the HS phase (at 300 K), a single Raman active stretching modewas observed at 2096 cm�1. In the IP phase (210 K) two modeswere observed at 2098 and 2138 cm�1, which can be assigned tothe HS and LS molecules, respectively. In the LS phase (130 K)two well-resolved vibrational modes are observed at 2134 and2139 cm�1. The CN stretching modes are very sensitive to the lightpolarization. Spectra in Figure 1 were acquired using a verticallypolarized laser light and we analyzed only the horizontally polar-ized light component backscattered by the crystal, whose c axiswas parallel to the incident field direction (~E==c). We have re-corded Raman spectra at different temperatures upon coolingand heating. By plotting the ratio of integrated area of the mCN
modes at each temperature, we could reproduce the two-step spintransition observed by magnetic measurements on an ensemble ofcrystals (Figure 1c). It is worth noting that while the overall shapeof the transition curves is the same, we observed that each individ-ual crystal displays somewhat different transition temperaturesand hysteresis widths – due most likely to their different micro-structure (i.e. structural defects).
3.1. First (high-temperature) transition
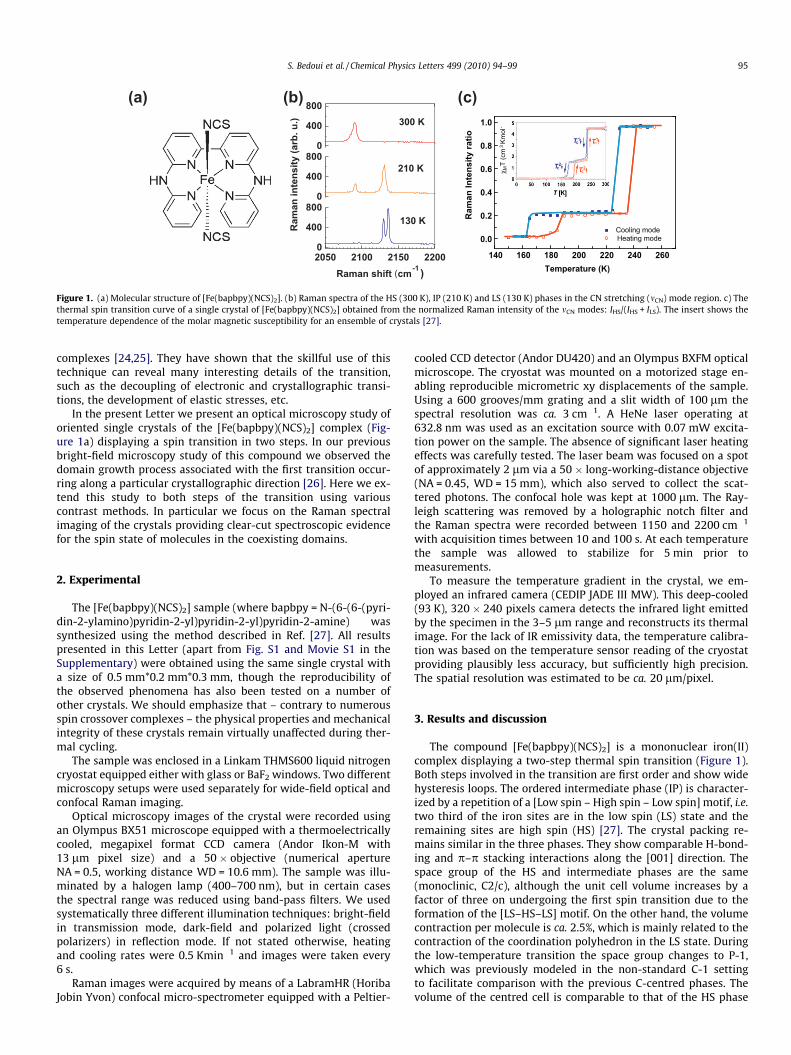
The first hysteresis is characterized by an abrupt spin transitionat 231 K and 235 K in the cooling and warming modes, respec-tively. During the first spin transition the color of the crystalchanges from red to dark red on decreasing the temperature(Fig. S1, Movie S1). Microscopy images with crossed polarizer(CP) as well as in bright field (BF) and dark field (DF) were recordedfor several crystals of [Fe(bapbpy)(NCS)2]. Figure 2a shows CPimages of the spin transition of a single crystal at four differenttemperatures in the cooling mode (Movie S2). At 233.0 K the crys-tal is entirely in the HS state, but at 232.0 K we can see the nucle-ation of the IP phase at the top of the photograph around amacroscopic defect. By lowering the temperature to 229.8 K andthen 228.8 K, one can observe the IP phase (dark contrast) propa-
Figure 2. (a) Selected images of the first transition (cooling mode) under crossed polarizePoint-by-point Raman spectral mapping of the spin fractions in a region of 76 � 70temperatures in the cooling mode. The images display the ratio of Raman spectral intenblue for the IP. (For interpretation of the references to colour in this figure legend, the r
gating along the c axis of the crystal. In the heating mode the spintransition starts from the bottom of the crystal and moves towardthe top, still along the same axis. The spatio-temporal behavior ap-pears to be reversible, but the transition in the heating mode ismore abrupt (Fig. S2, Movie S3). The fact that the transition followsa reverse path during heating and cooling is rather surprising sinceone may expect the nucleation occurring at the same defect. How-ever, it is possible that at the end of the transition there remain afew sub-micrometric (i.e. non-observable) residual HS domains,which may serve as nucleation sites for the reverse transition. An-other explanation could be the presence of a small temperaturegradient along the crystal (vide infra). It is worth noting also thatwe observed the nucleation in each crystal either around a macro-scopic defect or at the edge of the crystal. In a few cases we ob-served multiple nucleation sites as well, but the general behaviorduring the first transition is a unique nucleation site (i.e. a uniquedetected domain at the observation scale) followed by a uni-direc-tional growth of the new phase along the c axis, which is thus theslowest propagation direction. This anisotropy of the propagationprocess is especially clear in the Movie S1.
The CP images resemble closely the bright field images we re-ported previously [26]. However, while in BF images the contrastis essentially related to absorbance changes (i.e. electronic transi-tions) the analysis of CP images is more complex. In particular,when the incident light is polarized along an optical axis of thecrystal (i.e. at the highest extinction) we can efficiently extractinformation about the elastic strain accompanying the spin transi-tion. Indeed, such CP images revealed bright zones (circles in Fig-ure 2a), which appear due to the birefringence of regionsdeformed by elastic stress and strain. These images reveal thatthe appearance/disappearance of strain-induced birefringence alsofollows the displacement of the transition along the c axis of thecrystal, but the propagation is slowed down at several instances– most likely at randomly distributed defect sites where localstructural relaxation and associated change of elastic energy canoccur. It is worth noting that pinning of domain boundaries at mac-roscopic defects can also be inferred from DF images (Movies S4,S5). By changing the rate of cooling between 0.1 and 2 Kmin�1
we tried to obtain information concerning the phase boundarykinetics. Obviously, the velocity of the phase boundary is not con-stant due to the presence of defects and elastic strain. On the
rs. The circles indicate strong birefringence due to locally enhanced elastic strain. b)lm of the crystal (indicated by a rectangle in the first photograph) at differentsities of the mCN modes, IHS/(IHS + ILS), associated with red color for the HS phase andeader is referred to the web version of this article.)
S. Bedoui et al. / Chemical Physics Letters 499 (2010) 94–99 97
whole, however, we could determine from these measurements atypical propagation velocity of the order of 1–40 lm/s, which iscomparable with the values reported by Chong et al. [24]. Ofcourse, this velocity is determined mainly by the temperature rateand possibly also by the rate of dissipation of the released latentheat, but not by the dynamics of the structural relaxation, whichis faster.
We have also acquired Raman spectra in a 76 � 70 lm region ofthe same crystal at different temperatures. Figure 2b shows se-lected Raman images obtained during the first transition in thecooling mode. The images display the Raman intensity ratio ofCN stretching modes, which is closely proportional to the spin frac-tion. Red and blue colors correspond to the pure HS and IP phases,respectively. On cooling from room temperature to 233 K all ironcenters remain in the HS state. Subsequent cooling of the crystalwas carried out at 0.1 Kmin�1 and it was left to equilibrate for5 min at each temperature before recording additional Ramanspectral images for the same region. At a given temperature, theacquisition of an image of 15 � 15 points lasts about 90 min. At231 K, we observed the spectral signature of IP phase clusters,which appear at the top of the scanned region. An aggregate ofneighboring molecules change their spin state and the HS phaseis transformed into the IP. By decreasing the temperature between231 and 230 K we observed the propagation of this latter phasealong the crystal, and we clearly detected spin domains of thetwo phases. These results are in good agreement with the opticalmicroscopy observations. We have also undertaken the Ramanmapping in the same region of the crystal during the heatingbranches and we observed that the nucleation of the HS phasehas started at the same region of the crystal where the transitionin the cooling mode finished (Fig. S3). One should note that thecoexisting pure phases are separated by a rather broad apparent‘mixed region’. We believe that the phase separation must be sig-nificantly sharper in reality and the phase boundary region shouldnot be wider than a few unit cells. Therefore, this observation is notthe signature of a gradual spatial variation of the spin fractions, butis most likely an artifact related to the lack of axial resolution inour experiments. This problem can be solved by means of a 3Dscanning technique or, what is better, by investigating thin filmsamples.
It is important to note also that the spin domain structuresshown in Figure 2b are stable in time: Two successive scans of90 min of the same area at a fixed temperature are comparable.In other words, the coexisting domains form a quasi-static meta-stable state. At a first glance, this observation may seem contradic-tory with the apparent single-domain-like growth process, whichshould lead to a very abrupt jump without the possibility ofobtaining such quasi-static domain structures. However, theexperimental resolution may hide the presence of sub-micrometricdomain structures and thus a spatio-temporal distribution ofnucleation barriers (i.e. a distribution of transition temperatures).Furthermore, the presence of defects and inhomogeneities mayalso block the propagation process. In spite of the inevitable smalltemperature fluctuations in the experiment, we were able to ob-serve in certain crystals the pinning of the phase boundary for atleast several hours.
In addition to the stability of the temperature, another impor-tant issue concerns the temperature homogeneity within the crys-tal. We have chosen a fairly small and ‘well-shaped’ crystal andused an exchange gas (N2) in the cryostat in conjunction withlow cooling/heating rates, but the fact that the transition proceedsspatially reversibly might be an indication for the existence of anon-negligible lateral temperature gradient. We have tried to mea-sure this gradient using an infrared camera. Due to the low sensi-tivity of the camera at low temperatures we carried outmeasurements above room temperature (293–343 K), but obvi-
ously the same tendencies should be observed below room tem-perature. From these measurements we could infer that – withinthe precision of the measurement (±1 K) – there is no observabletemperature gradient in the crystal after 5 min waiting time at a gi-ven temperature (Fig. S4). Of course the very abrupt transition inour sample must be influenced by the presence of even smallergradients, but these cannot be detected by standard micro-ther-mometry methods.
3.2. Second (low-temperature) transition
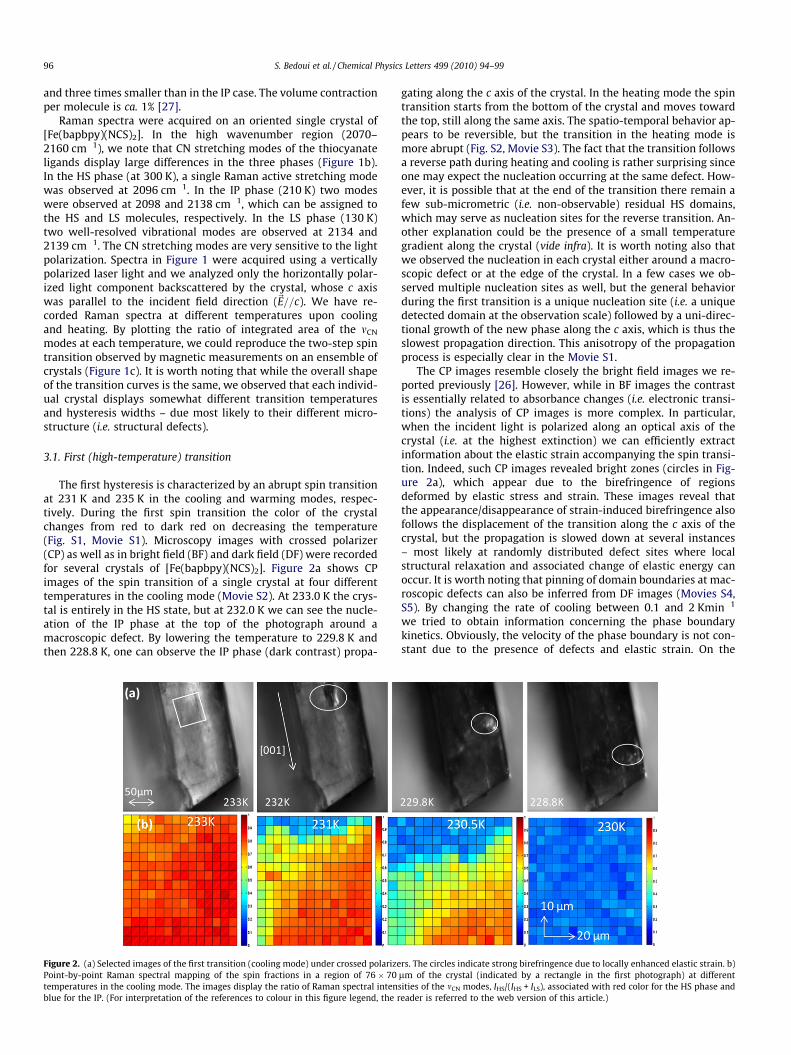
The second hysteresis of the [Fe(bapbpy)(NCS)2] compound ischaracterized by an abrupt spin transition at 165 K (189 K) in thecooling (warming) modes. Both the IP and the LS phases are deepred and they exhibit so little difference in color that detailed fea-tures are extremely difficult to discern in BF microscopy. We havethus followed the transition using dark field illumination, which isparticularly efficient for revealing edges and boundaries (MoviesS6, S7). In a similar manner to the first transition, the nucleationof the LS phase starts at the top of the crystal at 165 K (coolingmode) and propagates primarily along the c axis (Figure 3a). Ithas been previously shown by single-crystal X-ray diffraction thatthe LS phase is non-merohedraly twinned [27]. Striking imagesfrom DF microscopy reveal undulations on the surface of the crys-tal (Figure 3a), which we have attributed to this twinning process.Upon heating these undulations disappear completely with theemergence of the IP phase (Fig. S5, Movie S7). Contrary to the firsthysteresis, however, in this case the heating transition does not fol-low a reverse path when compared to the cooling.
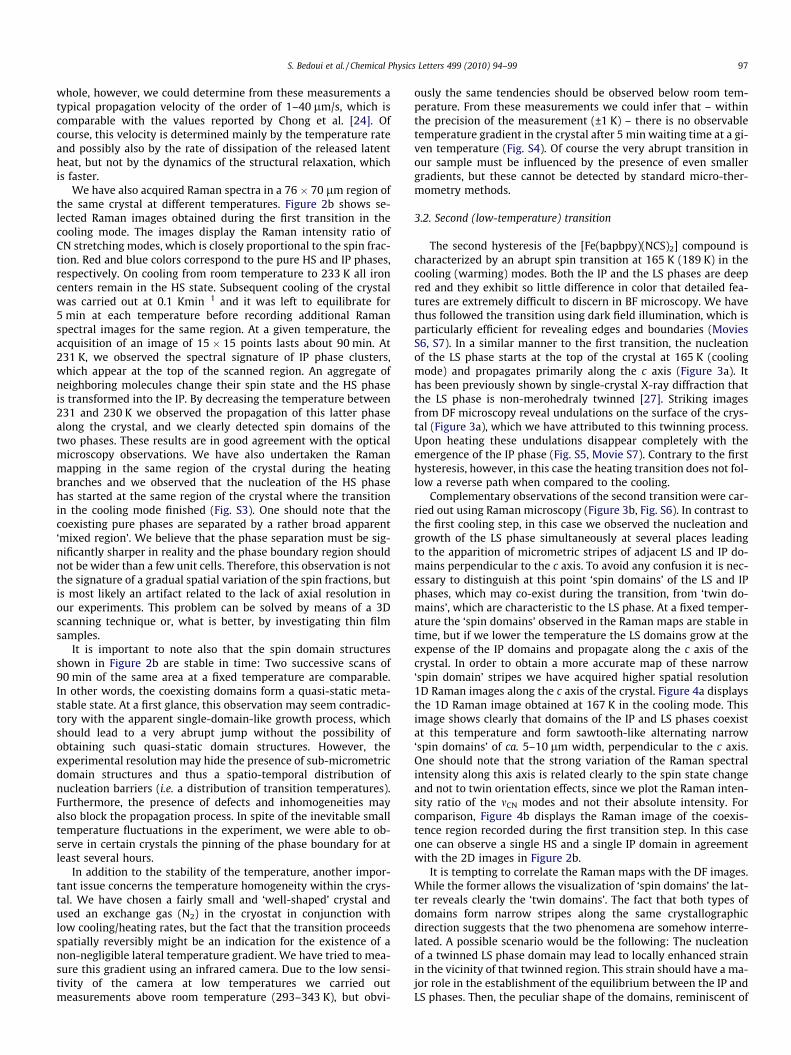
Complementary observations of the second transition were car-ried out using Raman microscopy (Figure 3b, Fig. S6). In contrast tothe first cooling step, in this case we observed the nucleation andgrowth of the LS phase simultaneously at several places leadingto the apparition of micrometric stripes of adjacent LS and IP do-mains perpendicular to the c axis. To avoid any confusion it is nec-essary to distinguish at this point ‘spin domains’ of the LS and IPphases, which may co-exist during the transition, from ‘twin do-mains’, which are characteristic to the LS phase. At a fixed temper-ature the ‘spin domains’ observed in the Raman maps are stable intime, but if we lower the temperature the LS domains grow at theexpense of the IP domains and propagate along the c axis of thecrystal. In order to obtain a more accurate map of these narrow‘spin domain’ stripes we have acquired higher spatial resolution1D Raman images along the c axis of the crystal. Figure 4a displaysthe 1D Raman image obtained at 167 K in the cooling mode. Thisimage shows clearly that domains of the IP and LS phases coexistat this temperature and form sawtooth-like alternating narrow‘spin domains’ of ca. 5–10 lm width, perpendicular to the c axis.One should note that the strong variation of the Raman spectralintensity along this axis is related clearly to the spin state changeand not to twin orientation effects, since we plot the Raman inten-sity ratio of the mCN modes and not their absolute intensity. Forcomparison, Figure 4b displays the Raman image of the coexis-tence region recorded during the first transition step. In this caseone can observe a single HS and a single IP domain in agreementwith the 2D images in Figure 2b.
It is tempting to correlate the Raman maps with the DF images.While the former allows the visualization of ‘spin domains’ the lat-ter reveals clearly the ‘twin domains’. The fact that both types ofdomains form narrow stripes along the same crystallographicdirection suggests that the two phenomena are somehow interre-lated. A possible scenario would be the following: The nucleationof a twinned LS phase domain may lead to locally enhanced strainin the vicinity of that twinned region. This strain should have a ma-jor role in the establishment of the equilibrium between the IP andLS phases. Then, the peculiar shape of the domains, reminiscent of
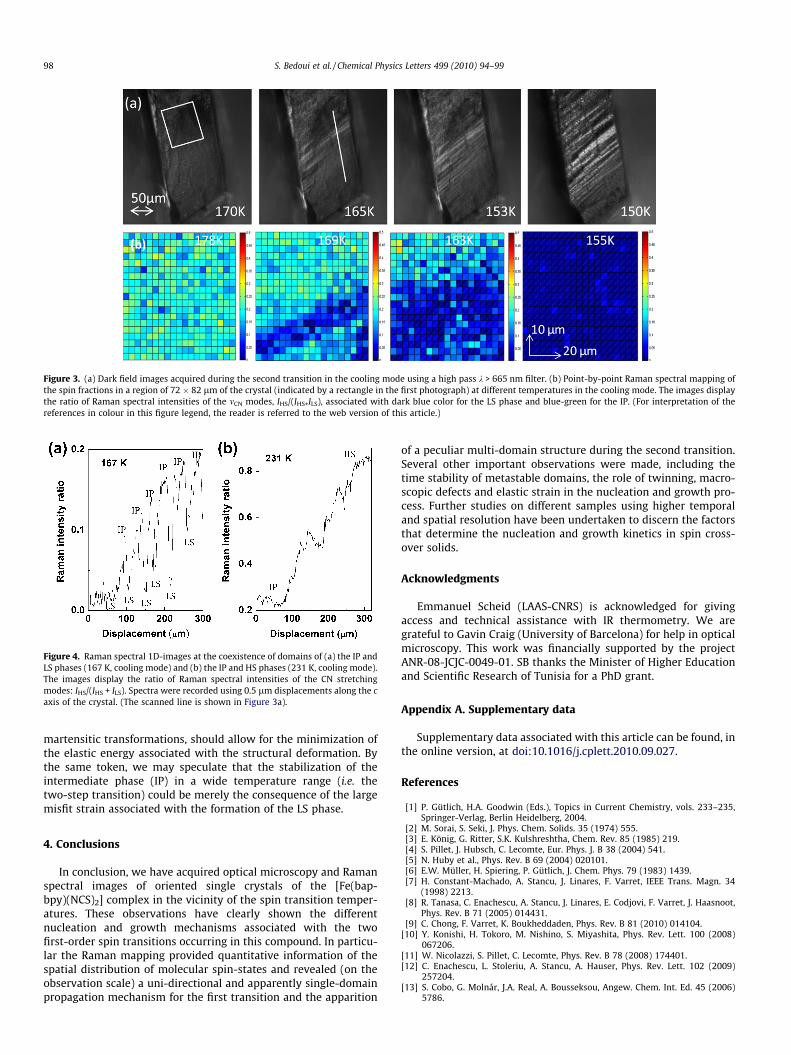
Figure 3. (a) Dark field images acquired during the second transition in the cooling mode using a high pass k > 665 nm filter. (b) Point-by-point Raman spectral mapping ofthe spin fractions in a region of 72 � 82 lm of the crystal (indicated by a rectangle in the first photograph) at different temperatures in the cooling mode. The images displaythe ratio of Raman spectral intensities of the mCN modes, IHS/(IHS+ILS), associated with dark blue color for the LS phase and blue-green for the IP. (For interpretation of thereferences in colour in this figure legend, the reader is referred to the web version of this article.)
Figure 4. Raman spectral 1D-images at the coexistence of domains of (a) the IP andLS phases (167 K, cooling mode) and (b) the IP and HS phases (231 K, cooling mode).The images display the ratio of Raman spectral intensities of the CN stretchingmodes: IHS/(IHS + ILS). Spectra were recorded using 0.5 lm displacements along the caxis of the crystal. (The scanned line is shown in Figure 3a).
98 S. Bedoui et al. / Chemical Physics Letters 499 (2010) 94–99
martensitic transformations, should allow for the minimization ofthe elastic energy associated with the structural deformation. Bythe same token, we may speculate that the stabilization of theintermediate phase (IP) in a wide temperature range (i.e. thetwo-step transition) could be merely the consequence of the largemisfit strain associated with the formation of the LS phase.
4. Conclusions
In conclusion, we have acquired optical microscopy and Ramanspectral images of oriented single crystals of the [Fe(bap-bpy)(NCS)2] complex in the vicinity of the spin transition temper-atures. These observations have clearly shown the differentnucleation and growth mechanisms associated with the twofirst-order spin transitions occurring in this compound. In particu-lar the Raman mapping provided quantitative information of thespatial distribution of molecular spin-states and revealed (on theobservation scale) a uni-directional and apparently single-domainpropagation mechanism for the first transition and the apparition
of a peculiar multi-domain structure during the second transition.Several other important observations were made, including thetime stability of metastable domains, the role of twinning, macro-scopic defects and elastic strain in the nucleation and growth pro-cess. Further studies on different samples using higher temporaland spatial resolution have been undertaken to discern the factorsthat determine the nucleation and growth kinetics in spin cross-over solids.
Acknowledgments
Emmanuel Scheid (LAAS-CNRS) is acknowledged for givingaccess and technical assistance with IR thermometry. We aregrateful to Gavin Craig (University of Barcelona) for help in opticalmicroscopy. This work was financially supported by the projectANR-08-JCJC-0049-01. SB thanks the Minister of Higher Educationand Scientific Research of Tunisia for a PhD grant.
Appendix A. Supplementary data
Supplementary data associated with this article can be found, inthe online version, at doi:10.1016/j.cplett.2010.09.027.
References
[1] P. Gütlich, H.A. Goodwin (Eds.), Topics in Current Chemistry, vols. 233–235,Springer-Verlag, Berlin Heidelberg, 2004.
[2] M. Sorai, S. Seki, J. Phys. Chem. Solids. 35 (1974) 555.[3] E. König, G. Ritter, S.K. Kulshreshtha, Chem. Rev. 85 (1985) 219.[4] S. Pillet, J. Hubsch, C. Lecomte, Eur. Phys. J. B 38 (2004) 541.[5] N. Huby et al., Phys. Rev. B 69 (2004) 020101.[6] E.W. Müller, H. Spiering, P. Gütlich, J. Chem. Phys. 79 (1983) 1439.[7] H. Constant-Machado, A. Stancu, J. Linares, F. Varret, IEEE Trans. Magn. 34
(1998) 2213.[8] R. Tanasa, C. Enachescu, A. Stancu, J. Linares, E. Codjovi, F. Varret, J. Haasnoot,
Phys. Rev. B 71 (2005) 014431.[9] C. Chong, F. Varret, K. Boukheddaden, Phys. Rev. B 81 (2010) 014104.
[10] Y. Konishi, H. Tokoro, M. Nishino, S. Miyashita, Phys. Rev. Lett. 100 (2008)067206.
[11] W. Nicolazzi, S. Pillet, C. Lecomte, Phys. Rev. B 78 (2008) 174401.[12] C. Enachescu, L. Stoleriu, A. Stancu, A. Hauser, Phys. Rev. Lett. 102 (2009)
257204.[13] S. Cobo, G. Molnár, J.A. Real, A. Bousseksou, Angew. Chem. Int. Ed. 45 (2006)
5786.

S. Bedoui et al. / Chemical Physics Letters 499 (2010) 94–99 99
[14] E. Coronado, J.R. Galan-Mascaros, M. Monrabal-Capilla, J. Garcia-Martinez, P.Pardo-Ibanez, Adv. Mater. 19 (2007) 1359.
[15] T. Forestier et al., Chem. Eur. J. 15 (2009) 6122.[16] J. Larionova, L. Salmon, Y. Guari, A. Tokarev, K. Molvinger, G. Molnár, A.
Bousseksou, Angew. Chem. Int. Ed. 47 (2008) 8236.[17] F. Volatron, L. Catala, E. Rivière, A. Gloter, O. Stephan, T. Mallah, Inorg. Chem.
47 (2008) 6584.[18] E. Freysz, S. Montant, S. Létard, J.F. Létard, Chem. Phys. Lett. 394 (2004) 318.[19] S. Cobo et al., J. Am. Chem. Soc. 130 (2008) 9019.[20] M. Lorenc et al., Phys. Rev. Lett. 103 (2009) 028301.
[21] H. Spiering, K. Boukheddaden, J. Linares, F. Varret, Phys. Rev. B 70 (2004)184106.
[22] G. Molnár, A. Zwick, A. Bousseksou, J.J. McGarvey, Chem. Phys. Lett. 367 (2003)593.
[23] A. Goujon et al., Inorg. Chim. Acta 361 (2008) 4055.[24] C. Chong et al., J. Phys. Chem. B 114 (2010) 1975.[25] C. Chong, Ph.D. thesis, Université de Versailles Saint-Quentin-en-Yvelines,
Versailles, France, 2010.[26] S. Bonnet et al., Chem. Mater. 21 (2009) 1123.[27] S. Bonnet et al., Chem. Commun. (2008) 5619.