rainwater composition in northeast uruguay
TRANSCRIPT
Atmospheric Environment 37 (2003) 1601–1611
Rainwater composition in northeast Uruguay
M. Zunckela,*, C. Saizarb, J. Zarauzb
a CSIR Environmentek, P.O. Box 17001, Congella, 4051, South Africab Laboratorio Tecnol !ogico del Uruguay, Av Italia 6201, CP 11500, Montevideo, Uruguay
Received 21 July 2002; accepted 22 December 2002
Abstract
The chemical composition of rainfall in northeast Uruguay in 1999 and 2000 and the sources that contribute to the
rainwater chemistry are assessed in this study, contributing to a limited knowledge base of rainwater quality in South
America. Principal factor analysis and cluster analysis indicate that four main source groups influence the rainfall
chemistry over a range of spatial scales. Terrigenous sources (e.g. rock, soil and dust) and agricultural sources (e.g.
livestock and crop fertilization) contribute to rainwater chemistry on a local and sub-regional scale. Influx of marine air
from the Atlantic Ocean has a regional-scale influence while biomass burning contributes at both a local and sub-
regional scale (e.g. fuel wood, and agroindustries) and through long-range transport (forest fires and land clearing). As
may be expected in this area dominated by agriculture, the concentrations of ions that are indicative of industrial
emissions, NO3� and SO4
2�, are typical of background measurements. The current data are limited, but provide an
indication of rain quality and the sources that influence its chemistry in Uruguay. It may be inferred that large-scale
biomass burning in the central parts of the continent influence rainwater chemistry on a scale far larger than indicated
by the Uruguayan network. Similarly, but to lesser extent, the influx of marine air off the Atlantic Ocean has a greater
regional-scale influence than suggested by these data.
r 2003 Elsevier Science Ltd. All rights reserved.
Keywords: South America; Rainwater chemistry; Factor analysis; Trajectory analysis; Biomass burning
1. Introduction
Wet-only rainwater sampling and analysis have been
performed by a number of researchers (e.g. Galloway
et al., 1982, 1984; Ayres et al., 1995; Galpin and Turner,
1999; Alastuey et al., 2001). This type of work has
proved a useful technique for studying the chemical
composition of rainwater, provides an understanding of
the source types that contribute to rainwater chemistry,
and enhances the understanding of local and regional
dispersion of pollutants and their potential impacts to
ecosystems through deposition processes. For example,
the effect of power station emissions on rain quality
(Ayres et al., 1995; Marquardt et al., 2001) and the
influence of Sahara dust on rain acidity (L .oye-Pilot et al.,
1986) illustrate contributions from anthropogenic and
natural sources to rain chemistry. Galloway et al. (1984)
compared the contribution of natural and anthropo-
genic sources to rain quality and Galpin and Turner
(1999) found South African rainwater chemistry to be
influenced by a combination of industrial, terrestrial,
biomass and marine sources.
Statistical techniques have been used to interpret rain
chemistry data in various parts of the world (Crawley and
Sievering, 1986; Ezcurra et al., 1988; Bridgman, 1990;
Khawaja and Husain, 1990; Galpin and Turner, 1999).
Trajectory analysis and regional-scale transport modeling
have also been used in various parts of the world to relate
observed air pollutants and their deposition to likely
source areas over large spatial scales (e.g. Sturman et al.,
1997; Tyson and D’Abreton, 1998; Zunckel et al., 2000).
AE International – Central & South America
*Corresponding author.
E-mail address: [email protected] (M. Zunckel).
1352-2310/03/$ - see front matter r 2003 Elsevier Science Ltd. All rights reserved.
doi:10.1016/S1352-2310(03)00007-4
Andrea et al., (1988, 1990) have studied precipitation
chemistry over the central Amazon region in Brazil and
Sanhueza et al. (1992) have conducted similar studies
over the Savannah region of Venezuela. Little other
work however has been done on rainwater quality in
Uruguay or elsewhere in South America. An overview
study (Grupo de Estudios Ambientals, 1992) highlighted
the potential impacts of emissions from fossil fuel-fired
power stations in southern Brazil on air and rainwater
quality in Uruguay. This study was followed by the
initiation of the Uruguay Ambient Air Quality Mon-
itoring Network in 1997, a venture between the
Ministerio de Vivienda, Ordenamiento Territorial y
Medio Ambiente, (MVOTMA), Laboratorio Tecnol-!ogico del Uruguay (LATU) and their South African
partner, CSIR Environmentek. The network, monitor-
ing micro-meteorological and air quality parameters and
wet-only deposition sampling, was commissioned during
1999.
The aim in this paper is threefold: firstly to gain an
initial understanding of rainwater chemistry in the
northeast of Uruguay; secondly to identify possible
sources that contribute to its chemical composition; and
thirdly to establish a baseline record against which
possible changes in rainwater chemistry due to changing
emission characteristics may be observed. The statistical
techniques of factor- and cluster analysis are used to
apportion sources that contribute to the chemical
composition of rainwater collected in 1999 and 2000.
Trajectory analysis is used in a case study to identify the
source area associated with black soot observed in
rainfall in September 1999.
2. Study area
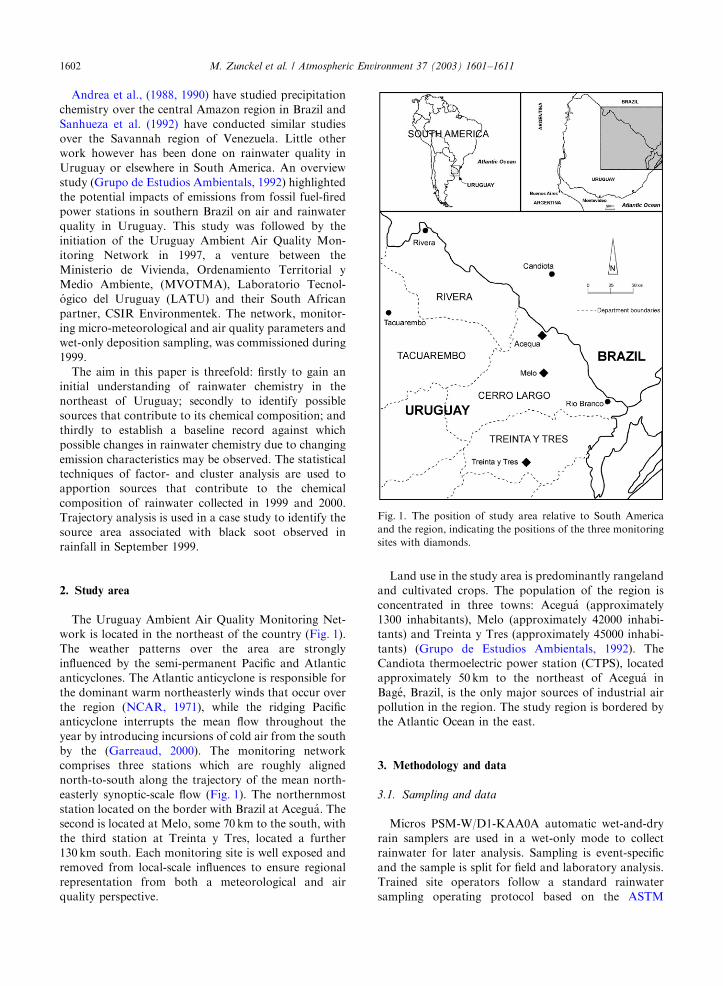
The Uruguay Ambient Air Quality Monitoring Net-
work is located in the northeast of the country (Fig. 1).
The weather patterns over the area are strongly
influenced by the semi-permanent Pacific and Atlantic
anticyclones. The Atlantic anticyclone is responsible for
the dominant warm northeasterly winds that occur over
the region (NCAR, 1971), while the ridging Pacific
anticyclone interrupts the mean flow throughout the
year by introducing incursions of cold air from the south
by the (Garreaud, 2000). The monitoring network
comprises three stations which are roughly aligned
north-to-south along the trajectory of the mean north-
easterly synoptic-scale flow (Fig. 1). The northernmost
station located on the border with Brazil at Acegu!a. The
second is located at Melo, some 70 km to the south, with
the third station at Treinta y Tres, located a further
130 km south. Each monitoring site is well exposed and
removed from local-scale influences to ensure regional
representation from both a meteorological and air
quality perspective.
Land use in the study area is predominantly rangeland
and cultivated crops. The population of the region is
concentrated in three towns: Acegu!a (approximately
1300 inhabitants), Melo (approximately 42000 inhabi-
tants) and Treinta y Tres (approximately 45000 inhabi-
tants) (Grupo de Estudios Ambientals, 1992). The
Candiota thermoelectric power station (CTPS), located
approximately 50 km to the northeast of Acegu!a in
Bag!e, Brazil, is the only major sources of industrial air
pollution in the region. The study region is bordered by
the Atlantic Ocean in the east.
3. Methodology and data
3.1. Sampling and data
Micros PSM-W/D1-KAA0A automatic wet-and-dry
rain samplers are used in a wet-only mode to collect
rainwater for later analysis. Sampling is event-specific
and the sample is split for field and laboratory analysis.
Trained site operators follow a standard rainwater
sampling operating protocol based on the ASTM
Fig. 1. The position of study area relative to South America
and the region, indicating the positions of the three monitoring
sites with diamonds.
M. Zunckel et al. / Atmospheric Environment 37 (2003) 1601–16111602
International (2002) guidelines for the Collection and
Preservation of Atmospheric Wet Deposition, covering
all aspects of sample handling and storage. Accordingly,
each sample is collected within 2 h of the end of a rain
event. Field analysis of pH and conductivity is done
when the sample is collected. The portion of each sample
that is separated for laboratory analysis is stored in
polyethylene bottles, pre-cleaned with deionized water,
in freezers at each site. Frozen samples were transported
in iceboxes to the analytical laboratories in Montevideo
with the routine monthly site-maintenance visits. The
samples are stored in a freezer in the laboratory until
they are prepared for analysis.
The field pH instruments (Micros PSM-LPHmS-
AAA0A) are calibrated by the site operators using two
traceable buffer solutions (pH 4.01 and pH 7.00, Mettler
Toledo) each time a sample is collected. Some technical
difficulties were experienced with the automatic rain
guages at all the stations in 1999. Reliability problems
were experienced with the rain sensors which sometimes
failed to open the wet sampler lids resulting in samples
not being collected. Field pH and conductivity could not
be recorded at times due to power supply problems to
the automatic pH meters. These problems continued at
Melo into 2000. Despite this, rainwater was successfully
sampled during 1999 and 2000 (70 samples at Acegu!a,
41 at Melo and 43 at Treinta y Tres) for ionic analysis.
3.2. Analytical methodology
Rainwater samples are analyzed at the Direcci !on
Nacional de Medio Ambiente (DINAMA) laboratory
and at LATU on a monthly basis. Each sample is filtered
through 0.45 mm membrane filter. Ion chromatography
is use to determine concentrations of F�, Cl�, NO3�,
SO4�and PO4
3�. Concentrations of acetate and formate
are determined using UV-chromatography. NH4+ is
determined with selective ion electrode. Flame atomic
adsorption spectrometry is used to determine Na+,
Ca2+, Mg2+ and K+. Conductivity and pH measure-
ments in the laboratory are accredited by UKAS
following ISO-GUIDE 17025. Acetate and formate will
not be preserved for longer than 3 days in samples
chilled at 4�C (ASTM International, 2002). Therefore,
all samples remained frozen until analysis. Prolonged
storage times are avoided through the implementation
of a monthly analysis programme.
The laboratories did not register for the 1999 World
Meteorological Organization/Global Atmospheric
Watch (WMO/GAW) Laboratory Intercomparison
Program. However, intercomparison samples were
provided and these were used for internal quality
control. In 2000, the laboratory participated successfully
in the the 23rd WMO/GAW Acid Rain Performance
Survey (WMO/GAW, 2000). Of the 33 determinations
reported (eleven parameters in three samples) 32 values
were acceptable, with a single value exceeding the Data
Quality Objectives by a factor of 2. Confidence in the
determination of all constituents is assured through
proper preparation and sample handling at all times,
participation in intercomparison programes, the use of
Standard Reference materials and Internal Control
Samples, and the application of WMO/GAW criteria
for ion balances.
4. Results
The pH of the rain in the northeast of Uruguay ranges
between 7.0 and 4.6 with medians of 5.6 at all three
stations in Table 1. The concentrations of the various
ions suggest that a range of sources contribute to rain
chemistry. These may include sources such as industry,
crustal or terrestrial, agricultural, biomass burning and
marine. There is a relatively small difference in the mean
ionic concentrations at the three sites. However, the
differences observed in the range suggest variations in
rain chemistry between rain events that are influenced by
the dominating source at the time of the event. Factor
and cluster analyses are used to assess the various source
types and their relative contribution to rain chemistry.
4.1. Factor analysis
Principle factor analysis was applied to the 1999 and
2000 data. The data was subjected to a varimax rotation
which maximizes the variance to obtain a pattern of
loadings on each factor that is diverse as posible, lending
itself to easier interpretation. Consecutive factors are
uncorrelated or orthogonal to each other. Factor
loadings are the correlations of each variable with the
factor. Therefore, as the absolute value approaches one,
the higher the correlation with the factor. A negative
variable loading indicates that it varies in opposite
direction to the variables with positive signs.
Three factors have been used in this analysis, giving
each variable a loading within each factor. Loadings
greater than 0.5 are considered to be significant
components of the factor, although in instances
variables with smaller loadings are used to assist with
the interpretation. The factor loadings and the variance
extracted by the factors (eigenvalues) are listed in Table 2.
The correlation values between ions and the three
principal factors at the 95% significance level represent
63.2% and 59.8% of the total variance of 1999 and 2000
data, respectively.
The first factor explains almost one-third of the total
variance of the data for each year (32.4% in 1999 and
32.3% in 2000). This factor suggests both marine and
agricultural/livestock sources. Marine sources can be
identified by the high negative correlations of Cl�, Na+
and Mg2+ for both seasons. Na+ (30.7%), Cl� (55.0%),
M. Zunckel et al. / Atmospheric Environment 37 (2003) 1601–1611 1603

SO42� (7.7%), magnesium (Mg2+) (3.6%), Ca2+ (1.2%)
and potassium (K+) (1.1%) are the major ionic species
by mass in seawater (Wilson, 1975). The maritime ions
are negatively correlated, while agricultural/livestock
ions (NO3� and NH4
+) are positively correlated. This
means that when the concentration of maritime ions
decrease in the sample, the concentration of nitrogen
ions increases, suggesting that ammonia and nitrate
sources are located inland.
Soils are the major global source of N2O accounting
for some 65% of total emissions as a result of microbial
processes, while nitrogen fertilizers can be both a direct
and indirect source of N2O emissions to the atmosphere
(Isherwood, 2000). Emissions of NH3 come from
anthropogenic sources (livestock, fertilizer applications,
sewage, and biomass burning) and natural sources (wild
animals, undisturbed soil, vegetation, and the oceans),
with manure being the largest single source. About 30%
Table 1
pH and the minimum, maximum and mean concentrations of the ions in the 1999 and 2000 rain water samplers collected at the three
monitoring sites in meq l�1, with the standard deviation for each ion
F� Cl� NO3� SO4
2� PO43� Formate Acetate Na+ NH4
+ K+ Mg2+ Ca2+
Acegu"a (N ¼ 70; pH median=5.6)
Min o5 o3 o3 o4 o6 o2 o2 o1 o1.3 o0.6 o0.4 o2.5
Max 219.5 228.1 82.6 1088.8 8.7 160.4 27.0 1378.4 104.8 42.7 337.3 435.1
Mean 10.8 27.4 13.9 63.5 6.1 7.6 3.4 72.4 16.1 8.4 16.1 26.7
s.d. 19.8 37.6 14.9 127.6 o6 20.1 4.3 162.1 22.9 11.0 35.6 48.0
Melo (N ¼ 41; pH median=5.6)
Min o5 22.0 17.1 15.0 o6 o2 o2 19.1 o1.3 1.3 4.1 4.5
Max 5.3 39.5 42.8 54.8 o6 7.6 o2 46.9 57.7 14.1 32.1 37.9
Mean 5.3 31.0 20.3 51.6 o6 7.1 o2 45.2 19.4 5.3 7.1 15.3
s.d. 8.7 38.8 17.6 164.0 o6 17.4 o2 134.2 26.3 6.5 10.5 22.1
Treinta y Tres (N ¼ 43; pH median=5.6)
Min o5 3.4 o3 o4 o6 o2 o2 o1 o1.3 o0.6 o0.4 o2.5
Max 7.2 67.1 43.6 39.8 o6 8.0 o2 50.6 91.9 58.7 12.2 13.5
Mean o5 28.1 10.4 15.4 o6 2.2 o2 22.8 16.1 7.1 5.1 6.8
s.d. o5 36.6 11.7 14.8 o6 2.2 o2 29.1 24.7 9.3 6.8 6.8
Minimum detection 5 3 3 4 6 2 2 1 1.3 0.6 0.4 2.5
Table 2
Factor loadings and the variance extracted by the factors in the 1999 and 2000 rainfall
1999 2000
Factor 1 Factor 2 Factor 3 Factor 1 Factor 2 Factor 3
H+ �0.03 �0.15 �0.79 0.26 0.07 �0.65
NH4+ 0.76 0.09 0.12 0.80 �0.10 0.38
Ca2+ �0.07 0.00 0.67 0.04 0.78 �0.07
Mg2+ �0.62 0.30 0.40 �0.64 0.51 0.20
Na+ �0.82 0.41 0.05 �0.90 0.14 0.16
K+ 0.39 �0.12 0.51 0.07 �0.81 0.07
F� 0.07 �0.83 �0.25 �0.09 �0.02 0.09
Cl� �0.76 0.47 0.04 �0.84 �0.02 0.19
NO3� 0.72 0.09 0.21 0.75 0.09 �0.26
SO42� 0.46 0.38 �0.20 0.21 0.06 �0.69
Org. acids 0.11 �0.89 0.07 0.39 0.08 0.62
Eigenvalue 3.6 2.0 1.4 3.6 1.7 1.3
% total var. 32.4 17.9 12.9 32.3 15.3 12.2
% cumul. var. 32.4 50.3 63.2 32.3 47.6 59.8
M. Zunckel et al. / Atmospheric Environment 37 (2003) 1601–16111604
of the nitrogen excreted by farm animals is released to
the atmosphere from animal houses, during storage,
grazing and application of animal wastes to the soil
(Isherwood, 2000). On average, there were about 3
million head of cattle and 5 million head of sheep in the
northeastern region of Uruguay, accounting for 28% of
total national stock herd. An estimation of total
nitrogen from manure in the region is 250 000 t a�1, of
which about 10% is readily available as ammonium.
Almost 90% of the region is used for grazing, of
which about 7.5% is fertilized. Winter fodder crops (oat
and ryegrass) are seeded in March–April with a binary
fertilizer (N–P), and refertilized with urea in July–
August. The seedtime for conventional pastures is from
late February to early May, along with fertilizer
application (P, N–P or NPK according to soil condi-
tions). Rice and forestry account for 2.3% and 0.5% of
the total region area, respectively. Recommended
practices for rice fertilization are N–P application in
October–November and urea refertilization in Novem-
ber–December. Approximately 4000 t a�1 of nitrogen is
applied on grasslands and rice crops in the northeastern
region of Uruguay.
The second factor explains 17.9% of the total variance
observed in 1999, and 15.3% of the total variance in
2000 (Table 2). In 1999, Factor 2 shows some correla-
tion with the marine ionic group (Na+ 0.41, Cl� 0.47,
Mg2+ 0.30), but the correlation is much stronger with
organic acids and fluoride (�0.89 and �0.83, respec-
tively). Similarly, the opposite sign of the two groups
suggest an inland source of organic acids and flouride
(e.g. regional forest fires). Potassium, which is a good
tracer for wood burning, varies in the same way as
organic acids, but has a low loading (�0.12). There is no
immediate explanation for this, other than to suggest it
is possibly related to the different characteristics of the
long-range atmospheric transport of the organic acids
(in gas phase) and potassium (mainly associated with
particles).
Biomass burning is regarded as the main source of
organic acids in rainwater (Glasius et al., 2000). Fuel
wood and biomass burning account for about 17%
(approximately 440 kTpe) of total energy consumption
in Uruguay. Recent data for the four northeastern
Departments shows that 69% of the 64 300 homes use
fuel wood for space heating, 22% use electricity and 6%
use butane (INE—Instituto Nacional de Estad!ısticas,
1996). Only 14% use wood for cooking. Biomass is also
burned to clear land for planting, and some agroindus-
trial wastes (i.e. sawmill residues, rice husks, logging and
slash debris) are burned. The northeastern region
generates about 180 000 tons of rice husks annually,
most of which are dumped in landfills where they are
burned and smoldered continuously.
The only possible industrial source of fluoride in the
region is the CTPS, located approximately 80 km north
of Acegu!a (Fig. 1). The fluoride content of coal burned
in CTPS is 16978 and 83.572.8 mg kg�1 in the fly ash
(Martins and Zanella, 1990). The estimated fly ash
emission from CTPS of 88 tons day�1 equates to 7.3 kg
F day�1. This explains the high levels of fluoride
found in pastures located in a radius of o10 km from
the CTPS (Martins and Zanella, 1990). However, the
fluoride content in rainwater samples collected at the
CTPS ranged between 0.05 and 0.20 mg l�1. By contrast,
F� concentrations from the Uruguay network all exceed
the upper range at CTPS, with the highest concentration
of 1.45 mg l�1. If the CTPS were the major source of
fluoride observed in the Uruguayan rainwater samples,
the highest concentrations would be expected at Acegu!a,
the closest station to the CTPS, with a clear association
with SO42�. Neither of these assumptions is true,
implying other sources contribute to fluoride observed
in the Uruguayan rainwater.
Fluoride-containing rocks are considered scarce in
Uruguay (Bossi, 1978). Phosphate rocks used in the
fertilizer industry contain 2–4% fluoride, part of which
remains in the phosphorous fertilizer. Fluoride in
fertilizers can leach into soil. Fertilizer runoff has been
considered a source of fluoride contamination in water-
sheds (ATSDR, 1993). About 290 000 tons of phosphate
fertilizers are applied annually in Uruguay, but the
fluoride content is unknown.
The fluoride correlation with the organic acids
appears to be significant only in the 1999 rainfall. This
correlation suggests that there may be a link between the
trans-national uncontrolled forest fire episodes and the
fluoride content of rainwater. The chemical composition
of particulate matter from wood combustion shows that
this is not a significant source of fluoride. However,
during times of drought, the convection generated by the
fire’s heat may carry dust aloft from the denuded and
broken soil surface. Fluoride that may have leached into
the soil from previously applied phosphate fertilizers will
be entrained in this way. It is hypothesized that long-
range transport of soil dust may be the source of fluoride
observed in Uruguayan rainfall.
The primary source of the observed Ca2+ and Mg2+
and K+ is likely to be of crustal origin from soil and
road dust. The opposition of Ca2+ and Mg2+ with K+
may be explained by assuming two different sources: soil
and unpaved road dust. Soil compositions have higher
mean bulk porcentages of K+ than Ca2+ and Mg2+
than K+ (Crawley and Sievering, 1986). In general, the
soil and crustal profiles are similar, except for the
depletion of soluble elements such as calcium, magne-
sium, and sodium (US EPA, 1999). There are more than
1925 km of public roadways in the northeastern region
(INE—Instituto Nacional de Estad!ısticas, 2000), includ-
ing gravel roads and unpaved private roads that are
continually disturbed. Agricultural activities such as
ploughing may also be considered as sources of crustal
M. Zunckel et al. / Atmospheric Environment 37 (2003) 1601–1611 1605
components. Potassium occurs in coarse particles in soil,
but fine particles of potassium result from the combus-
tion of wood. Relatively high levels of potassium may
result from agricultural activities (i.e. summer crops or
grassland preparation) or fuel wood combustion during
winter months.
The third factor accounts for 12.9% and 12.2% of the
total variance in 1999 and 2000, respectively (Table 2).
In 1999, the positive correlation of Ca2+ and K+ (and
Mg2+, if loadings of 0.4 are included) relate to the
crustal ionic group. The high negative correlation of H+
suggests that alkaline compounds containing these
cations contribute significantly to the neutralization of
precipitation acidity. However, NH3 may play a role in
the neutralization process, as it was seen in Factor 1 with
the correlation of ammonium with nitrate and also with
sulfate (factor loading in the borderline: 0.46).
In 2000, the correlation of H+ and SO42� suggest
acidity from fossil fuel combustion. If loadings of 0.4 are
included, organic acids associated with ammonium have
a negative correlation with H+ and SO42�, suggesting
that organic acids are neutralized by ammonia. This is
also present in Factor 1 (organic acids with loading
0.39).
4.2. Cluster analysis
The k-means method of cluster analysis is applied to
the 1999 and 2000 data to associate cluster groups to the
potential sources that account for the variations of the
chemical composition of the collected rain. The clusters
are based on the main sources identified in the Principal
Factor Analysis, i.e. Cluster 1: terrigenous (rock and soil
dust), Cluster 2: agricultural activity (animal/fertilizer);
Cluster 3: acidity (biomass and fossil fuel combustion);
and Cluster 4: marine. Cluster 1 is the most numerous
(39.4% of the samples), followed by Cluster 2 (25.8%),
Cluster 4 (23.5%) and Cluster 3 (11.4%).
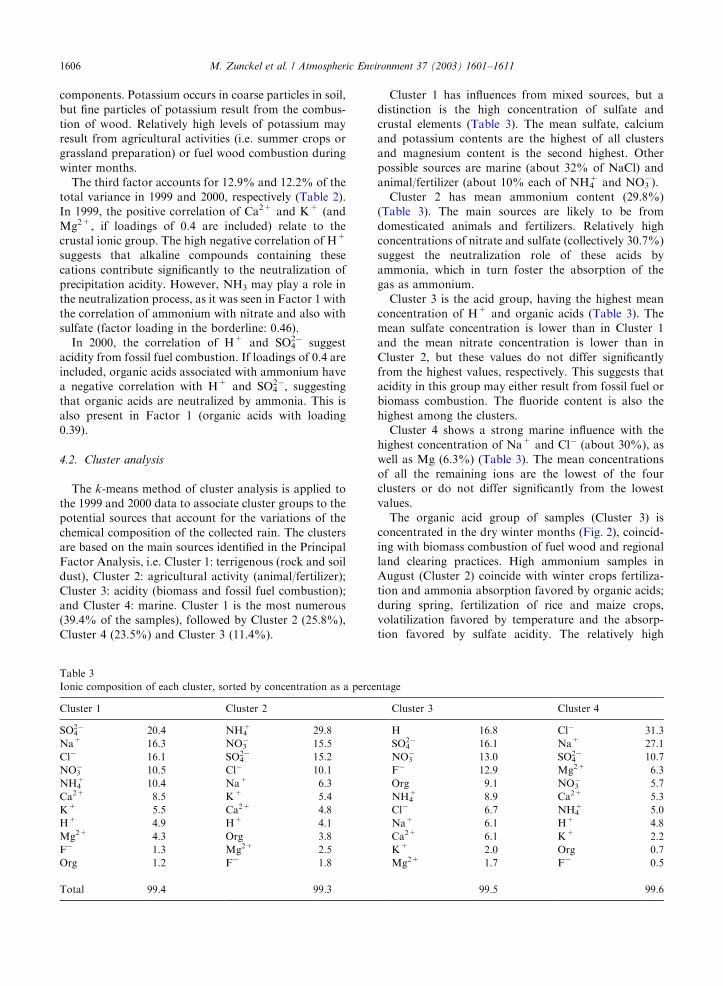
Cluster 1 has influences from mixed sources, but a
distinction is the high concentration of sulfate and
crustal elements (Table 3). The mean sulfate, calcium
and potassium contents are the highest of all clusters
and magnesium content is the second highest. Other
possible sources are marine (about 32% of NaCl) and
animal/fertilizer (about 10% each of NH4+ and NO3
�).
Cluster 2 has mean ammonium content (29.8%)
(Table 3). The main sources are likely to be from
domesticated animals and fertilizers. Relatively high
concentrations of nitrate and sulfate (collectively 30.7%)
suggest the neutralization role of these acids by
ammonia, which in turn foster the absorption of the
gas as ammonium.
Cluster 3 is the acid group, having the highest mean
concentration of H+ and organic acids (Table 3). The
mean sulfate concentration is lower than in Cluster 1
and the mean nitrate concentration is lower than in
Cluster 2, but these values do not differ significantly
from the highest values, respectively. This suggests that
acidity in this group may either result from fossil fuel or
biomass combustion. The fluoride content is also the
highest among the clusters.
Cluster 4 shows a strong marine influence with the
highest concentration of Na+ and Cl� (about 30%), as
well as Mg (6.3%) (Table 3). The mean concentrations
of all the remaining ions are the lowest of the four
clusters or do not differ significantly from the lowest
values.
The organic acid group of samples (Cluster 3) is
concentrated in the dry winter months (Fig. 2), coincid-
ing with biomass combustion of fuel wood and regional
land clearing practices. High ammonium samples in
August (Cluster 2) coincide with winter crops fertiliza-
tion and ammonia absorption favored by organic acids;
during spring, fertilization of rice and maize crops,
volatilization favored by temperature and the absorp-
tion favored by sulfate acidity. The relatively high
Table 3
Ionic composition of each cluster, sorted by concentration as a percentage
Cluster 1 Cluster 2 Cluster 3 Cluster 4
SO42� 20.4 NH4
+ 29.8 H 16.8 Cl� 31.3
Na+ 16.3 NO3� 15.5 SO4
2� 16.1 Na+ 27.1
Cl� 16.1 SO42� 15.2 NO3
� 13.0 SO42� 10.7
NO3� 10.5 Cl� 10.1 F� 12.9 Mg2+ 6.3
NH4+ 10.4 Na+ 6.3 Org 9.1 NO3
� 5.7
Ca2+ 8.5 K+ 5.4 NH4+ 8.9 Ca2+ 5.3
K+ 5.5 Ca2+ 4.8 Cl� 6.7 NH4+ 5.0
H+ 4.9 H+ 4.1 Na+ 6.1 H+ 4.8
Mg2+ 4.3 Org 3.8 Ca2+ 6.1 K+ 2.2
F� 1.3 Mg2+ 2.5 K+ 2.0 Org 0.7
Org 1.2 F� 1.8 Mg2+ 1.7 F� 0.5
Total 99.4 99.3 99.5 99.6
M. Zunckel et al. / Atmospheric Environment 37 (2003) 1601–16111606
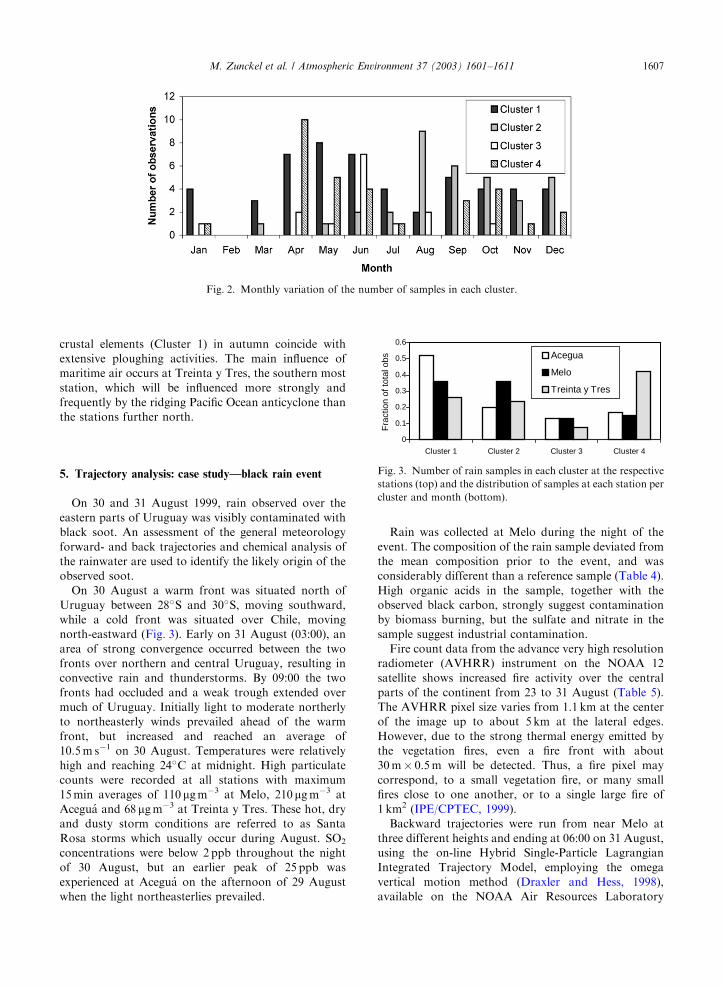
crustal elements (Cluster 1) in autumn coincide with
extensive ploughing activities. The main influence of
maritime air occurs at Treinta y Tres, the southern most
station, which will be influenced more strongly and
frequently by the ridging Pacific Ocean anticyclone than
the stations further north.
5. Trajectory analysis: case study—black rain event
On 30 and 31 August 1999, rain observed over the
eastern parts of Uruguay was visibly contaminated with
black soot. An assessment of the general meteorology
forward- and back trajectories and chemical analysis of
the rainwater are used to identify the likely origin of the
observed soot.
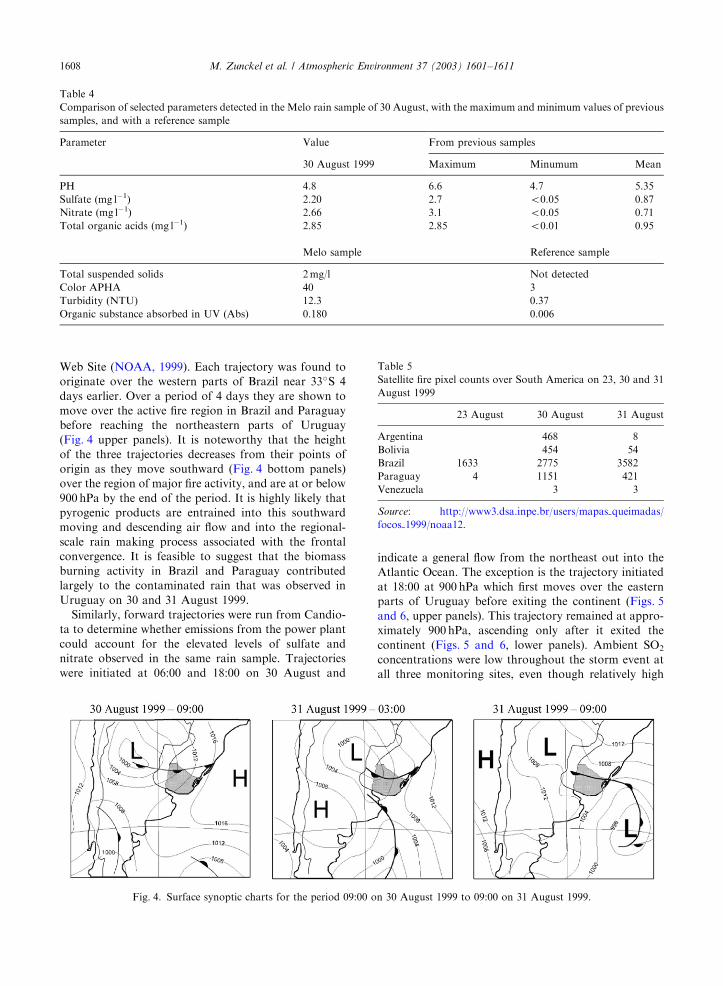
On 30 August a warm front was situated north of
Uruguay between 28�S and 30�S, moving southward,
while a cold front was situated over Chile, moving
north-eastward (Fig. 3). Early on 31 August (03:00), an
area of strong convergence occurred between the two
fronts over northern and central Uruguay, resulting in
convective rain and thunderstorms. By 09:00 the two
fronts had occluded and a weak trough extended over
much of Uruguay. Initially light to moderate northerly
to northeasterly winds prevailed ahead of the warm
front, but increased and reached an average of
10.5 m s�1 on 30 August. Temperatures were relatively
high and reaching 24�C at midnight. High particulate
counts were recorded at all stations with maximum
15 min averages of 110 mg m�3 at Melo, 210 mg m�3 at
Acegu!a and 68mg m�3 at Treinta y Tres. These hot, dry
and dusty storm conditions are referred to as Santa
Rosa storms which usually occur during August. SO2
concentrations were below 2 ppb throughout the night
of 30 August, but an earlier peak of 25 ppb was
experienced at Acegu!a on the afternoon of 29 August
when the light northeasterlies prevailed.
Rain was collected at Melo during the night of the
event. The composition of the rain sample deviated from
the mean composition prior to the event, and was
considerably different than a reference sample (Table 4).
High organic acids in the sample, together with the
observed black carbon, strongly suggest contamination
by biomass burning, but the sulfate and nitrate in the
sample suggest industrial contamination.
Fire count data from the advance very high resolution
radiometer (AVHRR) instrument on the NOAA 12
satellite shows increased fire activity over the central
parts of the continent from 23 to 31 August (Table 5).
The AVHRR pixel size varies from 1.1 km at the center
of the image up to about 5 km at the lateral edges.
However, due to the strong thermal energy emitted by
the vegetation fires, even a fire front with about
30 m� 0.5 m will be detected. Thus, a fire pixel may
correspond, to a small vegetation fire, or many small
fires close to one another, or to a single large fire of
1 km2 (IPE/CPTEC, 1999).
Backward trajectories were run from near Melo at
three different heights and ending at 06:00 on 31 August,
using the on-line Hybrid Single-Particle Lagrangian
Integrated Trajectory Model, employing the omega
vertical motion method (Draxler and Hess, 1998),
available on the NOAA Air Resources Laboratory
Fig. 2. Monthly variation of the number of samples in each cluster.
0
0.1
0.2
0.3
0.4
0.5
0.6
Cluster 1 Cluster 2 Cluster 3 Cluster 4
Fra
ctio
n of
tota
l obs Acegua
Melo
Treinta y Tres
Fig. 3. Number of rain samples in each cluster at the respective
stations (top) and the distribution of samples at each station per
cluster and month (bottom).
M. Zunckel et al. / Atmospheric Environment 37 (2003) 1601–1611 1607
Web Site (NOAA, 1999). Each trajectory was found to
originate over the western parts of Brazil near 33�S 4
days earlier. Over a period of 4 days they are shown to
move over the active fire region in Brazil and Paraguay
before reaching the northeastern parts of Uruguay
(Fig. 4 upper panels). It is noteworthy that the height
of the three trajectories decreases from their points of
origin as they move southward (Fig. 4 bottom panels)
over the region of major fire activity, and are at or below
900 hPa by the end of the period. It is highly likely that
pyrogenic products are entrained into this southward
moving and descending air flow and into the regional-
scale rain making process associated with the frontal
convergence. It is feasible to suggest that the biomass
burning activity in Brazil and Paraguay contributed
largely to the contaminated rain that was observed in
Uruguay on 30 and 31 August 1999.
Similarly, forward trajectories were run from Candio-
ta to determine whether emissions from the power plant
could account for the elevated levels of sulfate and
nitrate observed in the same rain sample. Trajectories
were initiated at 06:00 and 18:00 on 30 August and
indicate a general flow from the northeast out into the
Atlantic Ocean. The exception is the trajectory initiated
at 18:00 at 900 hPa which first moves over the eastern
parts of Uruguay before exiting the continent (Figs. 5
and 6, upper panels). This trajectory remained at appro-
ximately 900 hPa, ascending only after it exited the
continent (Figs. 5 and 6, lower panels). Ambient SO2
concentrations were low throughout the storm event at
all three monitoring sites, even though relatively high
Table 4
Comparison of selected parameters detected in the Melo rain sample of 30 August, with the maximum and minimum values of previous
samples, and with a reference sample
Parameter Value From previous samples
30 August 1999 Maximum Minumum Mean
PH 4.8 6.6 4.7 5.35
Sulfate (mg l�1) 2.20 2.7 o0.05 0.87
Nitrate (mg l�1) 2.66 3.1 o0.05 0.71
Total organic acids (mg l�1) 2.85 2.85 o0.01 0.95
Melo sample Reference sample
Total suspended solids 2 mg/l Not detected
Color APHA 40 3
Turbidity (NTU) 12.3 0.37
Organic substance absorbed in UV (Abs) 0.180 0.006
Table 5
Satellite fire pixel counts over South America on 23, 30 and 31
August 1999
23 August 30 August 31 August
Argentina 468 8
Bolivia 454 54
Brazil 1633 2775 3582
Paraguay 4 1151 421
Venezuela 3 3
Source: http://www3.dsa.inpe.br/users/mapas queimadas/
focos 1999/noaa12.
Fig. 4. Surface synoptic charts for the period 09:00 on 30 August 1999 to 09:00 on 31 August 1999.
M. Zunckel et al. / Atmospheric Environment 37 (2003) 1601–16111608
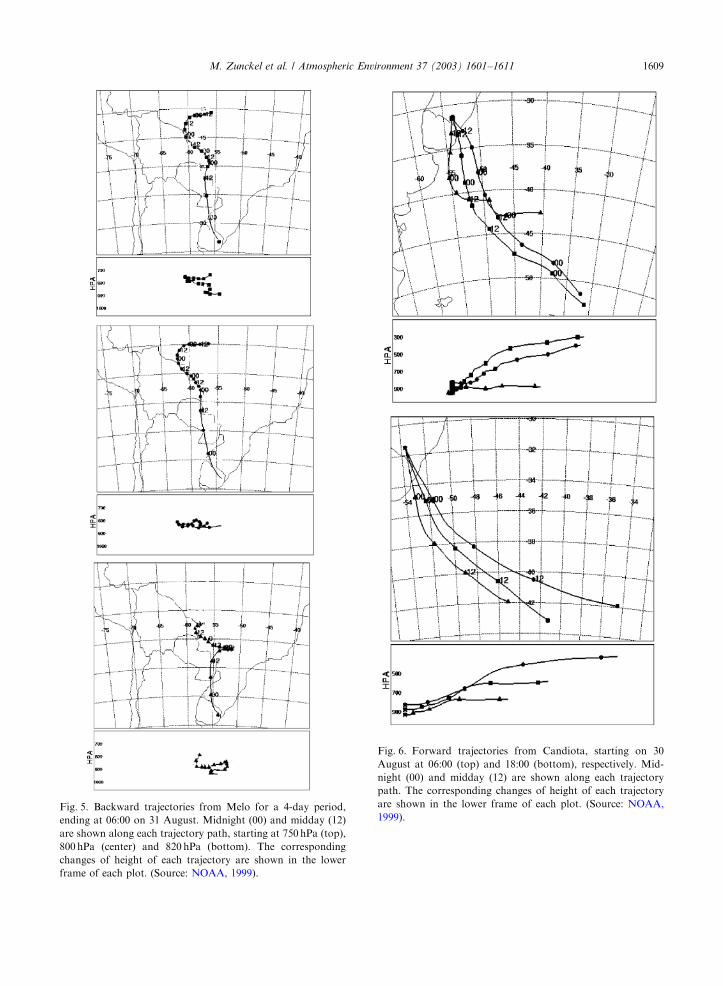
Fig. 6. Forward trajectories from Candiota, starting on 30
August at 06:00 (top) and 18:00 (bottom), respectively. Mid-
night (00) and midday (12) are shown along each trajectory
path. The corresponding changes of height of each trajectory
are shown in the lower frame of each plot. (Source: NOAA,
1999).Fig. 5. Backward trajectories from Melo for a 4-day period,
ending at 06:00 on 31 August. Midnight (00) and midday (12)
are shown along each trajectory path, starting at 750 hPa (top),
800 hPa (center) and 820 hPa (bottom). The corresponding
changes of height of each trajectory are shown in the lower
frame of each plot. (Source: NOAA, 1999).
M. Zunckel et al. / Atmospheric Environment 37 (2003) 1601–1611 1609
sulfate and nitrate concentrations were observed in the
Melo rain sample. Biomass emissions are generally low
in SO2, suggesting a source other than the biomass fires
for the observed sulfate and nitrate concentrations. It is
feasible that emissions from Candiota were entrained
into the regional-scale rain processes as the air passed
low over the region, and were responsible for some of
the observed sulfate and nitrate observed in the Melo
sample.
It appears that the black rain event observed in the
northeast of Uruguay on the night of 30 August 1999
is attributed to large-scale biomass burning in Brazil
and Paraguay. Pyrogenic products such as soot, ash,
aerosols and gases became entrained into the northerly
to northeasterly synoptic-scale flow and into the
regional-scale rain process associated with the merging
of southward moving warm front and the easterly
moving cold front.
6. Conclusion
Rainwater collected in Uruguay at Acegu!a, Treinta y
Tres and Melo 1999 and 2000 is analyzed for a full suite
of ions in accordance with WMO/GAW criteria and
standards. Principal factor analysis and cluster analysis
have been used to develop an understanding of rain-
water chemistry in northeast Uruguay and of the
contributing sources.
The pH of rainwater is typical of background sites.
Statistical analysis suggests the Uruguayan rain chem-
istry is influenced by a combination of sources. These
include terrigenous sources (rock, soil and dust),
agricultural sources (livestock and crop fertilizers),
marine sources and biomass burning (fuel wood and
forest fires).
A correlation between chloride, sodium and magne-
sium, suggests a contribution from a marine source to
the Uruguayan rainwater chemistry. In turn, a correla-
tion between nitrate and ammonium is attributed mainly
to livestock and fertilizer use. Correlations between
fluoride and organic acids suggest a contribution from
activities such as biomass burning, the use of fuel wood,
agroindustries and the use of crop fertilizer. A correla-
tion between calcium and magnesium implies a con-
tribution from crustal sources such as unpaved roads,
wind blown dust from bare soils and ploughing. These
two ions correlate negatively with potassium, which is a
good indicator of biomass burning. Trajectories from
active fires in the central parts of South America were
shown to pass over northeast Uruguay and to corre-
spond with peaks in pyrogenic indicators in the observed
rainfall.
A range of sources influences Uruguayan rainfall over
a range of spatial scales. Terrestrial sources, live-
stock and other agricultural activities and fuel wood
combustion contribute on a sub-regional scale, marine
products originating over the Atlantic Ocean influence
the chemistry on a regional scale. Rainfall chemistry is
also influenced by biomass burning in the Amazon
region through long-range transport.
This is an initial analysis, based on a limited data set.
The conclusions on sources of rainwater constituents are
by no means definitive. They do however provide the
first insight into the nature of Uruguayan rainwater
quality. In the light of proposed expansion of coal-based
power generation in the region, it is important that
rainwater monitoring is continued. These initial data
provide an ideal baseline against which changes in
rainwater quality as a result of local and regional land
use changes, may be monitored.
Acknowledgements
The Direccion Nacional de Medio Ambiente, MVOT-
MA, supported this study. We would like to express our
gratitude to MVOTMA for their role in making this
work possible. The analytical personnel at MVOTMA
and LATU are acknowledged for their contribution to
this work through the rainwater analysis. Arjoon Singh
at CSIR Environmentek is thanked for his work on the
figures.
References
Alastuey, A., Querol, X., Chaves, A., Lopez-Soler, A., Ruiz,
C.R., 2001. Wet-only sequential deposition in a rural area in
north-eastern Spain. Tellus 53B, 40–52.
Andrea, M.O., Talbot, R.W., Andrea, T.W., Harriss, R.C.,
1988. Formic and acetic acids over the central Amazon
region, Brazil 1 dry season. Journal of Geophysical
Research 93, 1616–1624.
Andrea, M.O., Talbot, R.W., Berresheim, K.M., Beecher,
K.M., Li, S.M., 1990. Precipitation chemistry over central
Amazonia. Journal of Geophysical Research 95D,
16987–16999.
ASTM International, 2002. D5012-01 standard guide for
preparation of material used for the collection and
preservation of atmospheric wet deposition, http://www.
astm.org/DATABASE.CART/PAGES/D5012.htm.
ATSDR, 1993. Agency for Toxic Substances and Disease
Registry, US Public Health Service, US Department of
Health and Human Services, Atlanta, GA, http://
www.atsdr.cdc.gov/tfacts11.pdf.
Ayres, G.P., Gillett, R.W., Selleck, P.W., Bentley, S.T., 1995.
Rainwater composition and acid deposition in the vicinity
of the fossil fuel-fired power plants in southern Australia.
Water, Air and Soil Pollution 85, 2313–2318.
Bossi, J., 1978. Recursos Minerales del Uruguay. In: Aljanati,
D. (Ed.), Montevideo.
Bridgman, H., 1990. Evaluating rainwater contamination and
sources in Southeast Australia using factor analysis. Atmo-
spheric Environment 26A (13), 2401–2412.
M. Zunckel et al. / Atmospheric Environment 37 (2003) 1601–16111610
Crawley, J., Sievering, H., 1986. Factor analysis of the MAP3S/
RAINE precipitation chemistry network: 1976–1980. Atmo-
spheric Environment 20 (5), 1001–1013.
Draxler, R.R., Hess, G.D., 1998. An overview of the
HYSPLIT-4 modelling system for trajectories, dispersion
and deposition. Australian Meteorological Magazine 47,
295–308.
Ezcurra, A., Casado, H., Lacaux, J.P., Garc!ıa, C., 1988.
Relationships between meteorological situations and acid
rain in Spanish Basque Country. Atmospheric Environment
22 (12), 2779–2786.
Galloway, J.N., Likens, G.E., Kneen, W.C., Miller, J.M., 1982.
The composition of precipitation in remote areas of
the world. Journal of Geophysical Research 87 (11),
8771–8786.
Galloway, J.N., Likens, G.E., Hawley, M.E., 1984. Acid
precipitation: natural versus anthropogenic components.
Science 226, 829–831.
Galpin, J.S., Turner, C.R., 1999. Trends in composition of rain
quality data from the South African interior. South African
Journal of Science 95, 225–228.
Garreaud, R.D., 2000. Cold air incursions over subtropical
South America: mean structure and dynamics. Monthly
Weather Review 128, 2544–2559.
Glasius, M., Wessel, S., Christensen, C.S., Jacobsen, J.K.,
J^rgensen, H.E., Klitgaard, K.C., Petersen, L., Rassmussen,
J.K., Hansen, T.S., Lohse, C., Boaretto, E., Heinemeier, J.,
2000. Sources of formic acid studies by carbon isotopic
analysis and air mass characterization. Atmospheric En-
vironment 34 (15), 2471–2479.
Grupo de Estudios Ambientals, 1992. Lluvia Acida—Candiota,
coordinator D. Tor, Ediciones, Montevideo.
INE—Instituto Nacional de Estad!ısticas, 1996. Serie Colec-
ciones—VII Censo de Poblaci !on, III de Hogares y V de
Viviendas—Ano 1996, http://www.ine.gub.uy/biblioteca/
publicaciones.htm.
INE—Instituto Nacional de Estad!ısticas, 2000. Anuario Estad-!ıstico 2000, http://www.ine.gub.uy/biblioteca/anuario2000/
marcos anuario 2000.htm.
IPE/CPTEC, 1999. Queimadas no Brasil-Vegetation fires in
Brazil, Grupo Queimadas, http://atiaia.cptec.inpe.br/pro-
ducts/queimadas/queimap.html.
Isherwood, K.F., 2000. Mineral Fertilizer Use and the
Environment, IFA/UNEP (Rev. version 03/2000).
Khawaja, H.A., Husain, L., 1990. Chemical characterization of
acid precipitation in Albany, New York. Atmospheric
Environment 24A, 1869–1882.
L .oye-Pilot, M.D., Martin, J.M., Davis, T.D., 1986. Influence of
Saharan dust on the rain acidity and atmospheric input on
the Mediterranean. Nature 321, 427–428.
Marquardt, W., Br.uggemann, E., Renate, A., Herrmann, H.,
M.oller, D., 2001. Trends of pollution in rain over East Germany
caused by changing emissions. Tellus B 53 (5), 529–545.
Martins, A.F., Zanella, R., 1990. Estudo anal!ıtico-ambiental na
regiao carbonerg!etica de Candiota, Bag!e (RS). Ci!encia e
Cultura 42 (3/4), 264–270 Marco/April.
NCAR, 1971. National Centre for Atmospheric Research,
Climate of the upper air: Southern Hemisphere, Vol. 3—
Vector mean geostrophic winds, NCAR Technical Notes,
NCAR-TN/STR-58.
NOAA, 1999. Air Resources Laboratory, Real-time Environ-
mental Application and Display System (READY), http:
//www.arl.noaa.gov/ready.html.
Sanhueza, E., Arias, M.C., Donoso, L., Graterol, N., Hermoso,
M., Mart!ı, I., Romero, J., Rond!on, A., Santana, M., 1992.
Chemical composition of acid rains in the Venezuelan
savannah region. Tellus 44B, 54–62.
Sturman, A.P., Tyson, P.D., D’Abreton, P.C., 1997. A
preliminary study of the transport of air from Africa to
Australia and New Zealand. Journal of the Royal Society of
New Zealand 27 (4), 485–498.
Tyson, P.D., D’Abreton, P.C., 1998. Transport and recircula-
tion of aerosols off Southern Africa—Macroscale plume
structure. Atmospheric Environment 32 (9), 1511–1998.
US EPA, 1999. Air quality data for particulate matter. Office of
Research and Development, External Review Draft, EPA-
821-R-99-002.
Wilson, T.R.S., 1975. Salinity and major elements in sea water.
In: Riley, J.P., Skirrrow, G. (Eds.), Chemical Oceano-
graphy, 2nd Edition. Academic Press, London. UK,
pp. 365–413.
WMO/GAW, 2000. Report on the 23rd WMO/GAW Labora-
tory Intercomparisons, Atmospheric Sciences Research
Centre, University of Albany, http://marble.asrc.cestm.al-
bany.edu/qasac/lab ic/anal00.
Zunckel, M., Robertson, L., Tyson, P.D., Rodhe, H., 2000.
Modelled transport and deposition of sulphur over South-
ern Africa. Atmospheric Environment 34 (2000), 2797–2808.
M. Zunckel et al. / Atmospheric Environment 37 (2003) 1601–1611 1611